| • | | Heinemann: A divisionOur supplemental solutions include award-winning solutions like Waggle (which won the CODiE award for “Best Learning Capacity-Building Solution”), as well as artificial intelligence and state-of-the-art speech recognition-driven Amira Assessment and writing-enhancing online tool Writable that we offer through strategic partnerships. We also offer HMH Classroom Libraries, which provide individually curated collections of HMH, Heinemann provides professional resources“just-right” books to strengthen literacy development and educational services for teachers, kindergarten through college. With 11 straight years of growth, Heinemann is the leading professional publisher for educators, and features well-known and respected authors such as Irene Fountas,Gay-Su Pinnell and Lucy Calkins, who support the practice of teachers through books, videos, workshops, online courses, and most recently through explicit teaching materials.foster independentreading. |
9By leveraging our leading position in the U.S. instructional materials market, we aim to engage our customers with solutions addressing the variety of instructional needs across the educational achievement spectrum. We believe that by integrating our solutions on a single platform, which uses a common student dataset, and by developing ongoing connections with the teachers who use our solutions, we will be well positioned to increase and sustain market share and grow our Education segment revenues.
Trade PublishingHMH Books & Media
Our Trade Publishing segment, foundedFounded in 1832, primarilyHMH Books & Media develops, markets and sells consumer books in print and digital formats and licenses book rights to other publishers and electronic businesses in the United States and abroad. The principleOur principal distribution channels for Trade Publishing productsthis segment are retail stores (both physical and online) and wholesalers. Reference materials are also sold to schools, colleges, libraries, office supply distributors and other businesses.
Our Trade Publishing segmentHMH Books & Media offers an extensive library of general interest, young readers and reference works that include well-known characters and brands. Our award-winning general interest titles include literary fiction, culinary, andnon-fiction in hardcover,e-book ebook and paperback formats, including the Mariner Books paperback line. Among the general interest properties are the popular J.R.R. Tolkien titles, the prolific The Best American Series and major cookbook brands such as Betty Crocker and Better Homes and Gardens in addition to recent best sellers including theHow to Cook Everything series andThe Whole30.
In young readers publishing, our list addresses a broad age group and includes recognized characters and titles such as Curious George and Martha Speaks, Five Little Monkeys, Gossie & Friends, Polar Express, Little Blue Truck, and many more. We also publish novels for young adults, a growing genre, including titles from Lois Lowry, author ofThe Giver, and Kwame Alexander. Our HMH Books & Media business collaborated on the launch of a new animated series Carmen Sandiego on Netflix as part of our strategy to expand our content across media platforms. In February 2019, we also launched HMH Audio with the goal of capitalizing on the growth of downloaded audiobooks; in Fall 2019, we released new audiobook editions of many of our adult and young reader frontlist books, as well as select titles from our substantial backlist. For the years ended December 31, 2019, 2018 and 2017, 2016 and 2015, Trade PublishingHMH Books & Media net sales and Adjusted EBITDA were approximately $184.5$180.0 million and $16.1$14.9 million, $165.6$199.7 million and $6.3$21.9 million, and $164.9$180.6 million and $7.7$12.1 million, respectively. Seasonality Approximately 87% of our net sales for the year ended December 31, 20172019 were derived from our Education segment, which is a markedly seasonal business. Schools conduct the majority of their purchases in the second and third quarters of the calendar year in preparation for the beginning of the school year. Thus, over ourthe latest three completed fiscal years, approximately 68%67% of our consolidated net sales were realized in the second and third quarters. Sales ofK-12 instructional materials and customized assessment products are also cyclical, with some years offering more sales opportunities than others.others based on the state adoptions calendar. The amount of funding available at the state level for educational materials also has a significant effect onyear-to-year net sales. Although the loss of a single customer would not have a material adverse effect on our business, schedules of school adoptions and market acceptance of our products can materially affectyear-to-year net sales performance. 10
Competition We sell our products in highly competitive markets. In these markets, product quality, innovation and customer service are major differentiating factors between companies. Other factors affecting competition include: (i) competitive pricing, sampling and gratis costs; (ii) digitization and innovative delivery; and (iii) educational effectiveness of the program. In addition to national curriculum publishers, we also compete with a variety of specialized or regional publishers that focus on select disciplines and/or geographic regions in theK-12 market. There are also multiple competitors in the Trade Publishing,HMH Books & Media, supplemental and assessment segmentsmarkets offering content that school districts increasingly are using as part of their core classroom instructional materials. In addition, school districts in many states are able to spend educational funds on “instructional materials” that include core and supplemental materials, computer software, digital media, digital courseware, and online services. Our larger competitors in the educational market include Savvas Learning Co. (formerly Pearson Education, Inc.), McGraw Hill Education, Cengage Learning, Inc., Scholastic Corporation, John Wiley & Sons, Inc., Curriculum Associates, LLC, Benchmark Education, LLC, Accelerate Learning, Inc., and Amplify Education, Inc. Also competing in our market as a substitute are open educational resources. These resources are free, digital solutions that range from supplemental resources to full Core Solutions programs. 10
Printing and binding; raw materials We outsource the printing and binding of our products, with approximately 50%44% of our printing requirements handled by one major supplier. We have procurement agreements that provide volume and scheduling flexibility and price predictability. We have a longstanding relationship with these parties. Approximately 18%25% of our printed materials (consisting primarily of teacher’s editions and other ancillary components) are printed outside of the United StatesU.S. and approximately 82%75% of our printed materials (including most student editions) are printed within the United States.U.S. Paper is one of our principal raw materials. We purchase our paper primarily through one paper merchant and also directly through suppliers for limited product types. We maintain various agreements that protect against supply availability and unbound price increases. We manage our paper supply concentration by having primary and secondary sources and staying ahead of dramatic market changes. Distribution We operate three distribution facilities from which we coordinate our own distribution process: one each in Indianapolis, Indiana; Geneva, Illinois; and Troy, Missouri. We also utilize select suppliers to assist us with coordinating the distribution process for a limited number of product types. Additionally, some adoption states require us to usein-state textbook depositories for educational materials sold in that particular state. We utilize various delivery firms, includingsuch as United Parcel Service Inc., FedEx Freight, CH Robinson Worldwide Inc.etc., YRC Freight, SAIA and USF Holland, Inc. to facilitate the principally ground transportation of products. Employees As of December 31, 2017,2019, we had approximately 3,8003,400 employees, none of which were covered by collective bargaining agreements. These employees are substantially located in the United States with 218235 employees located outside of the United States. We believe that relations with employees are generally good. Intellectual property Our principal intellectual property assets consist of our trademarks and copyrights in our content. Substantially all of our publications are protected by copyright, whether registered or unregistered, either in our name as the author of a work made for hire or the assignee of copyright, or in the name of an author who has licensed us to publish the work. Ownership of such copyrights secures the exclusive right to publish the work in the United States and in many countries abroad for specified periods: in the United States, in most cases, either 95 years from publication or for the author’s life plus 70 years, but in any event a minimum of 28 years for works published prior to 1978 and 35 years for works published thereafter. In most cases, the authors who retain ownership of their copyright have licensed to us exclusive rights for the full term of copyright. Under U.S. copyright law, for licenses granted by an author during or after 1978, such exclusive licenses are subject to termination by the author or certain of the author’s heirs for a five year period beginning at the end of 35 years after the date of publication of the work or 40 years after the date of the license grant, whichever term ends earlier. 11
We do not own any material patents, franchises or concessions, but we have registered certain trademarks and service marks in connection with our publishing businesses. We believe we have taken, and take in the ordinary course of business, appropriate available legal steps to reasonably protect our intellectual property in all material jurisdictions. Environmental matters We generally contract with independent printers and binders for their services, and our operations are generally not otherwise affected by environmental laws and regulations. However, as the owner and lessee of real property, we are subject to environmental laws and regulations, including those relating to the discharge of hazardous materials into the environment, the remediation of contaminated sites and the handling and disposal of 11
wastes. It is possible that we could face liability, regardless of fault, and can be held jointly or severally liable, if contamination were to be discovered on the properties that we own or lease or on properties that we have formerly owned or leased. We are currently unaware of any material environmental liabilities or other material environmental issues relating to our properties or operations and anticipate no material expenditures for compliance with environmental laws or regulations. Environmental, Social and Governance (ESG) As a corporate citizen, we accept and promote a community responsibility to minimize our impact on the environment to ensure that we will be able to serve teachers, students and all readers for years to come. As such, we seek to make environmentally responsible choices in our business practices. We set objectives for continual improvement of our environmental and sustainability management procedures. Looking ahead, we are working to expand our company-wide sustainability efforts, setting additional goals and measuring progress in other areas material to our business. Responsible Paper Usage One of our on-going sustainability focus areas is our approach to how we source, use and dispose of paper related to our products. In 2019, we strengthened and updated our Paper Sourcing and Usage Policy that reflects our continuing commitments to our environment and surroundings. Key 2019 progress highlights were: 99% of HMH purchased paper for education products was manufactured with no less than 10% recycled fiber; 81% of paper we procured domestically for HMH Books & Media segment products was Forest Stewardship Council (FSC)-certified; and 86% of the paper we procured internationally for HMH Books & Media segment products was FSC-certified. Transportation A major aspect of our business involves the transportation of our products, and we work to promote environmentally friendly modes of such transportation. In 2019, HMH estimates that it saved 964,000 pounds of CO2 by managing our carbon footprint by consolidating shipments, shipping directly from vendors to end recipients when possible and utilizing intermodal rail shipments. HMH participates in the Environmental Protection Agency’s (EPA) SmartWay program. The EPA’s SmartWay program helps companies advance supply chain sustainability by measuring, benchmarking, and improving freight transportation efficiency. Through this program, HMH partners with the EPA to improve our shipping operations to achieve a more sustainable transportation process that directly facilitates a reduction in our carbon footprint. In 2019, HMH estimates that it saved 208,000 pounds of CO2 by participating in the SmartWay program. Waste Management and Recycling Whenever possible, we aim to recycle our excess product and waste generated at our Distribution Centers to avoid sending recyclable products and other waste to landfills. 12
•Donation is HMH’s preferred method of disposal for excess books and materials (rather than destruction) •96% of the waste generated at HMH’s Distribution Centers is recycled In our corporate offices, each employee has a recycling and a garbage bin. We work to increase employee awareness regarding waste management and recycling with bins and signage. Energy Use We strive to reduce energy consumption at our HMH Warehouses and related offices through: •Conversion to high efficiency fluorescent bulbs •Conference rooms with motion sensor lighting •Energy-efficient HVAC and Heating Units •LED light fixtures in parking lots In addition, the building that houses HMH’s Boston Headquarters at 125 High Street has received the LEED® (Leadership in Energy and Environmental Design) Gold Certification for Existing Buildings™, which is the second highest LEED Certification level attainable. Further, HMH is listed in Forbes’ “Work from Home 2019: The Top 100 Companies for Remote Jobs” due to our remote location positions across the company that contribute to the reduction in facility energy use and employee transportation fuel consumption. Additional information Houghton Mifflin Harcourt Company was incorporated as a Delaware corporation on March 5, 2010, and was established as the holding company of the current operating group. Houghton Mifflin Harcourt was formed in December 2007 with the acquisition of Harcourt Education Group, then the second-largestK-12 U.S. publisher, by Houghton Mifflin Group. We are headquartered in Boston, Massachusetts. Our corporate website iswww.hmhco.com. We make available our annual reports on Form10-K, quarterly reports on Form10-Q, current reports on Form8-K and amendments to these reports, as well as other information, free of charge through our corporate website under the “Financial Information” link located at: ir.hmhco.com, as soon as reasonably practicable after being filed with or furnished to the Securities and Exchange Commission (the “SEC”). The information found on our website or any other website we refer to in this Annual Report on Form 10-K is not part of this Annual Report on Form 10-K or any other report we file with or furnish to the SEC.
13 12
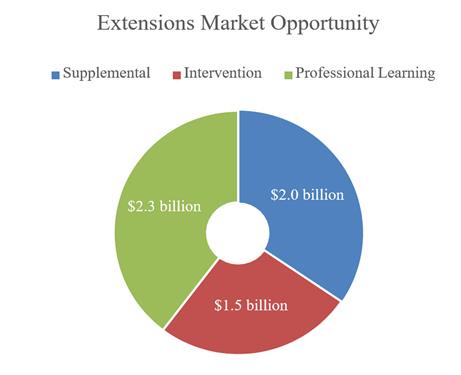
Item 1A. Risk Factors Our business and results of operations may be adversely affected by changes in federal, state and local education funding, and changes in legislation and public policy. A majority of our sales are to public school districts in the United States, most of which rely primarily on a combination of local tax revenues and state legislative appropriations for general operating funds and to pay for purchases of goods and services, including instructional materials. Funding for public schools at both the state and local levels can be affected by tax collections, which are typically sensitive to general economic conditions, and by political and policy choices made by state and local governments. A reduction in funding levels, whether due to an economic downturn or legislative action, or a failure of projected funding increases to materialize, can constrain resources available to school districts for making purchases of instructional materials and adversely affect our business and results of operations. Some states, including a majority of adoption states, provide dedicated state funding for the purchase of instructional content and/or classroom technology, and expenditures for instructional materials in those states tend to be highly dependent on appropriation of those funds. If dedicated funding is not appropriated, or if the amount is substantially less than anticipated or legislative action is taken to lift restrictions on the use of those funds, then purchases of instructional materials may to be significantly reduced and our net sales may be adversely impacted. In addition, many school districts, including most large urban districts, receive substantial federal funding through Title I of the Elementary and Secondary Education Act (“ESEA”), the Individuals with Disabilities Act (“IDEA”), and other federal education programs. These funds supplement state and local funding and are used primarily to serve specific populations, such aslow-income students and families, students with disabilities, and English language learners as well as to support programs to improve the quality of instruction, including educator professional learning. The funding of these programs is subject to Congressional appropriation. A significant reduction in appropriation levels could have an adverse effect on our sales, particularly sales of intervention and professional learning products and services. Federal and state legislative and policy changes can also affect our business. For example, recent changes to federal education law in the Every Student Succeeds Act (“ESSA”) give states greater latitude in how they approach assessment and accountability, support and improvement of low performing schools, as well as accounting for the expenditure of federal program funds. The recent changes in ESSA also provided for new requirements regarding evidence of effectiveness of educational products and services purchased with federal funds. The recent changes in ESSA and state legislation and administrative policy decisions on matters such as assessment and accountability, curriculum and intervention with respect thereto could affect demand for our products. State instructional materials adoptions, which account for a significant portion of our net sales ofK-12 instructional materials, are highly cyclical and pose significant inherent risks that could materially impact our results of operations. Due to the revolving and staggered nature of “predetermined” state adoption schedules, sales ofK-12 instructional materials have traditionally been cyclical, with some years offering more and/or larger sales opportunities than others. Since a large portion of our sales are derived from state adoptions, our overall results can be materially affected from year to year by the adoption schedule, particularly in large adoption states. For example, over the next few years adoptions are scheduled or have already begun in one or more of the primary subjects of reading, language arts and literature, social studies, science and mathematics in, among other states, California, Florida and Texas, which are the three largest adoption states. Our failure to secure approval for our programs or perform according to our expectations in larger new adoption opportunities could materially and adversely affect our net sales for the year of the adoption and in subsequent years. 13
In any state adoption, there is the inherent the risk that one or more of our programs will not be approved by a particular state board of education or other adopting authority. For example, ourK-8 social studies materials were not adopted in California in 2017. While school districts in most adoption states including California, are not precluded from purchasing materials that have not been approved by the state, in many cases, exclusion of a program on the state-adopted list can materially and adversely impact our ability to compete effectively at the school district level. Moreover, even if our program is approved by the state, we face significant competition and there is no guarantee that school districts will select our program or that we will be able to capture a meaningful share of the sales in such state. 14
State adoptions can be delayed, postponed or cancelled – cancelled—sometimes with little or no warning and after we have made significant investments in anticipation of the adoption – adoption—due to various reasons, such as funding shortfalls, delays in development and approval of state academic standards and specifications, competing priorities or school readiness. In addition, individual school districts may decline to purchase new programs in accordance with the state’s adoption schedule. A substantial delay, postponement or cancellation of a larger adoption opportunity can adversely affect the amount and timing of our net sales return on investment for the affected product, our business and our results of operations. Further, the timing of the legislative appropriations process in most states is such that it is often impossible to know with certainty whether implementation of an adoption will be funded until after products have been submitted for review. By that time, investments have been made for product development and substantial expenses incurred for sales, marketing and other costs. If the legislature in a state that provides dedicated funding for instructional materials decides not to appropriate those funds or appropriates substantially less than anticipated, due to a revenue shortfall or other reasons, or if the legislature lifts restrictions on use of those funds, then implementation of that adoption could be substantially compromised or delayed and our net sales and return on investment could be adversely affected. Changes in state academic standards could affect our market and require investment in development of new programs or modifications to our existing programs and any delays or controversies in the implementation of such standards could impact our results of operations. States may adopt new academic standards or revise existing standards, which may affect our market and require investment in the development of new programs or modifications to our existing programs offered for sale in states that adopt such changes. Delays or controversies in the implementation of the adoption of new or revised academic standards may result in insufficient lead time before the deadline to submit instructional materials for an adoption. As a result, we have in the past and may again have to invest more than planned in order to complete product development or make the modifications in the compressed timeframe to bring our program into alignment with the new or revised standards, which could adversely affectaffecting our return on investment. Alternatively, we may determine that completing product development or making the modifications within the available timeframe is not practicable, and elect not to participate in the adoption, forgoing what might have been a significant sales opportunity which could materially and adversely affect our net sales for the year of the adoption and subsequent years. We may not be able to execute on our long-term growth strategy or achieve expected benefits from actions taken in furtherance of our strategy, which could materially and adversely affect our business, financial condition and results of operations and/or our growth. If we are not able to execute on our long-term growth strategy or achieve expected benefits from our actions in furtherance of our strategy, it could materially and adversely affect our business, financial condition and results of operations and/or our growth. In any event, actions taken in furtherance of our strategy, such as transitioning to new business models or entering into new market segments could adversely impact our cash flow and our business in unforeseen ways. 14
Our investments in new products, service offerings, platforms and/or technologies could impact our profitability. We operate in highly competitive markets that continue to change to adapt to customer needs. These needs include an increasing demand for integrated learning solutions. In order to address these needs, we are investing in new products, new technology and infrastructure, and a new common platform to integrate our products, services and solutions. These investments may be less profitable than what we have experienced historically, may consume substantial financial resources and/or may divert management’s attention from existing operations, all of which could materially and adversely affect our business, results of operations and financial condition. 15
We rely on third-party software and technology development as part of our digital platform. We rely on third parties for some of our software and technology development. For example, some of the technologies and software that compose our instruction and assessment technologies are developed by third parties. We rely on those third parties for the development of future components and modules. Thus, we face risks associated with technology and software product development and the ability of those third parties to meet our needs and their obligations under our contracts with them. In addition, we rely on third parties for our internet-based product hosting. The loss of one or more of these third-party partners, a material disruption in their business or their failure to otherwise perform in the expected manner could cause disruptions in our business that may materially and adversely affect our results of operations and financial condition. Defects in our digital products and platforms could cause financial loss and reputational damage. In the fast-changing digital marketplace, demand for innovative technology has generally resulted in short lead times for producing products that meet customer needs. Growing demand for innovation and additional functionality in digital products increases the risk that our digital products and platforms may contain flaws or corrupted data that may only become apparent after product launch, particularly for new products and platforms and new features for existing products and platforms that are developed and brought to market under tight time constraints. Problems with the performance of our digital products and platforms could result in liability, loss of revenue or harm to our reputation. Some states and school districts require that newly purchased digital instructional materials conform to certain technical standards for accessibility by persons with disabilities, which could have an adverse effect on our net sales and/or lead us to incur additional costs.
Some states and school districts have adopted certain technical standards for accessibility by persons with disabilities that apply to school websites and electronically-delivered content. While we are committed to designing and developing our electronically-delivered products for theK-12 market in a manner accessible to persons with disabilities and strive to conform to relevant technical standards, it is possible that some of our digital products may be deemed to benon-conforming with those standards in all respects. This could limit our ability to compete for sales in states and districts that have adopted those standards, which could have an adverse effect on our net sales. To the extent that we decide to add accessibility features to existing products, we may incur costs that we would not otherwise have incurred.
Changes in product distribution channels and concentration of retailer power may restrict our ability to grow and affect our profitability in our Trade PublishingHMH Books & Media segment. Distribution channels such as online retailers and ecommerce sites, digital delivery platforms, expanding social media, digital discovery and marketing platforms, combined with the increased concentration of retailer power, pose threats and provide opportunities to traditional consumer publishing models of our Trade PublishingHMH Books & Media segment, potentially impacting both sales volume and profitability. The reduction in “brick and mortar” booksellers, the resulting concentration of power held by our largest retailers, and the increased concentration of consumer book spending on best-selling titles could negatively affect our business, financial condition and results of operations. 15
We operate in a highly competitive environment where the risks from competition are intensified due to rapid changes in our markets and industry; as a result, we must continue to adapt to remain competitive. We operate in highly competitive markets. The risks of competition are intensified in the current environment where investment in new technology is ongoing and there are rapid changes in the products and services our customers are seeking and our competitors are offering, as well as new technologies, sales and distribution channels. In addition to national curriculum publishers, we compete with a variety of specialized or regional publishers that focus on select disciplines and/or geographic regions in theK-12 market. There are multiple competitors in the Trade Publishing,HMH Books & Media segment and supplemental and assessment segmentsmarket offering content that school districts increasingly are using as part of their core classroom instructional materials. Our larger competitors in the educational market include Savvas Learning Co. (formerly Pearson Education, Inc.), McGraw Hill Education, Cengage Learning, Inc., Scholastic Corporation, John Wiley & Sons, Inc., Curriculum Associates, LLC, Benchmark Education, LLC, Accelerate Learning, Inc., and Amplify Education, Inc. Some of these established competitors may have greater resources and less debt than us and, therefore, may be able to adapt more quickly to new or emerging technologies and changes in customer requirements or devote greater resources to the development, promotion and sale of their products and services than we can. Also competing in our market as a substitute are open educational resources. In addition, the market shift toward digital education solutions has induced both established technology companies and newstart-up companies to enter certain segments of our market. These new competitors have the possible advantage of not needing to transition from a print business to a digital business. In addition, many established technology companies have substantial resources that they could devote to developing or acquiring digital educational products and/or content and, distributing their own and/or aggregated educational content to theK-12 market, which could negatively affect our business, financial condition and results of operations. There is also a risk of further disintermediation, which is the occurrence of state, district and other customers contracting directly with technology companies, enabling technology companies to develop direct relationships with our customers, and accordingly, have significant influence over access to and, pricing and distribution of digital and print education materials. We may not be able to adapt as needed to remain competitive in the market given the foregoing factors. 16
The availability of free andlow-cost open education resources could adversely affect our net sales and exert downward pressure on prices for our education products. In theK-12 market, we face growing competition from free, openly licensed content, often referred to as open education resources (“OER”). Free orlow-cost OER content is typically delivered via the internet, and in some cases print versions and related services are available for purchase. A number of states support the use of OER by providing curated resources and a few,others, including New York, Louisiana, Michigan and Texas, are funding development of OER or have done so in the past. Twenty states have signed on to the U.SU.S. Department of Education’s GoOpen campaign, which seeks to support users of OER and promote coordination and sharing of OER among states. In addition, in recent years there have been initiatives by not-for-profit organizations such as the Gates Foundation and the Hewlett Foundation to develop educational content that can be “open sourced” and made available to educational institutions for free or nominal costs. The increased availability of free andlow-cost OER could negatively affect our customers’ perception of the value of our content, reduce demand for our educational products, and/or exert downward pressure on prices for our products, and adversely impact our net sales. Our operating results fluctuate on a seasonal and quarterly basis and our business has historically been dependent on our results of operations for the third quarter. Our business is seasonal. Approximately 87% of our net sales for the year ended December 31, 20172019 were derived from our Education segment, which is a markedly seasonal business. Purchases ofK-12 products are typically made in the second and third quarters of the calendar year in preparation for the beginning of the school year, though assessment purchases have modest seasonality in the second and fourth quarters.year. We typically realize a significant portion of net sales during the third quarter, making third-quarter results material to full-year performance. This sales seasonality affects operating cash flow from quarter to quarter. We typically incur a net cash deficit from all of our activities through the middle of the third quarter of the year. We cannot be sure that our second and third quarter net sales will continue to be sufficient to fund our business and meet our obligations 16
or that they will be higher than our net sales for our other quarters or in the prior-year periods. In the event that we do not derive sufficient net sales for the second and third quarter, we may have a liquidity shortfall and be unable to fund our business and/or meet our debt service requirements and other obligations. Our net sales, operating profit or loss and net cash provided or used by operations are impacted by the inherent seasonality of the academic calendar. As purchases ofK-12 products are typically made in the second and third quarters of a given calendar year, changes in our customers’ ordering patterns may impact the comparison of results between a quarter and the same quarter of the prior year, between a quarter and the prior consecutive quarter or between a fiscal year and the prior fiscal year, which can make it difficult for us to forecast the timing of customer purchases and assess our financial performance until late in the year. Our history of operations includes periods of operating and net losses, and we may incur operating and net losses in the future. Such losses may impact our liquidity. For the years ended December 31, 2017, 20162019, 2018 and 2015,2017, we generated operating losses of $113.5$163.2 million, $310.8$90.5 million and $116.1$135.1 million, respectively, and net losses of $103.2$213.8 million, $284.6$94.2 million and $133.9$103.2 million, respectively. If we continue to suffer operating and net losses, our liquidity may suffer and we may not be able to fund our business and/or meet our debt service requirements and other obligations. Furthermore, the market price of our common stock may decline significantly. Our ability to enforce our intellectual property and proprietary rights may be limited, which may harm our competitive position and materially and adversely affect our business and results of operations. Our products are largely comprised of intellectual property content delivered through a variety of media, including print, digital andweb-based media. We rely on a combination of copyright, trademark and other intellectual property laws and rights as well as employee agreements and other contracts to establish and protect our proprietary rights in our products and technology. However, our efforts to protect our intellectual property and proprietary rights may not be sufficient and we cannot make assurances that our proprietary rights will not be challenged, invalidated or circumvented. Moreover, we conduct business in certain other countries where the extent of effective legal protection for intellectual property rights is uncertain. It is possible we could be involved in expensive and time-consuming litigation to maintain, defend or enforce our intellectual property. 17
Furthermore, despite the existence of copyright and trademark protection under applicable laws, third parties may nonetheless violate our intellectual property rights, and our ability to remedy such violations, including in certain foreign countries where we conduct or seek to conduct business, may be limited. In addition, the copying and distribution of content over the Internet creates additional challenges for us in protecting our proprietary rights. If we are unable to adequately protect and enforce our intellectual property and proprietary rights, our competitive position may be harmed, and our business and financial results could be materially and adversely affected. Failure to comply with privacy laws or adequately protect personal data could cause financial loss and reputational damage. Across our businesses we hold large volumes of personal data, including that of employees, customers and students. We are subject to a wide array of different privacy laws, rules, regulations and standards in the U.S. as well as in foreign jurisdictions where we conduct business, including, but not limited to (i) the Children’s Online Privacy Protection Act and state student data privacy laws in connection with personally identifiable information of students, (ii) the Health Insurance Portability and Accountability Act in connection with our self-insured health plan and certain of our products, (iii) the Payment Card Industry Data Security Standards in connection with collection of credit card information from customers, and (iv)(iii) various EU data protection and privacy laws.laws, including a comprehensive General Data Privacy Regulation that became effective in May 2018. There has been increased public attention regarding the use of personal information and data transfer, accompanied by legislation and regulations intended to strengthen data protection, information security and consumer and personal privacy. The law in these areas continues to develop and the changing nature of privacy laws in the U.S., the European Union and elsewhere could impact our processing of personal and sensitive information of our employees, vendors and customers. Continued privacy concerns may result in new or amended laws and regulations. Our brands and customer relationships are important assets. Our failureFuture laws and regulations with respect to comply with applicablethe collection, compilation, use, and publication of information and consumer privacy laws, rules, regulations and standardscould result in limitations on our operations, increased compliance or adequately prevent the improper use or disclosure of the personal data we hold 17
could lead to penalties, significant remediation costs,litigation expense, adverse publicity, reputational damage to our brands and customer relationships, potential cancellation of existing business and diminished ability to compete for future business. It is also possible that we could be prohibited from collecting or disseminating certain types of data, which could affect our ability to meet our customers’ needs.
We are subject to risks based on Information Technologyinformation technology systems. A major breach in security or information technology system failure could interrupt the availability of our internet-based products and services, result in corruption and/or loss of data, cause liability or reputational damage to our brands and business and/or result in financial loss. Our business is dependent on information technology systems to support our complex operational and logistical arrangements across our businesses. We provide software and/or internet-based products and services to our customers. We also use complex information technology systems and products to support our business activities, particularly in infrastructure and as we move our products and services to an increasingly digital delivery platform. We face several technological risks associated with software and/or internet-based product and service delivery in our educational businesses, including with respect to information technology capability, reliability and security, enterprise resource planning, system implementations and upgrades. Failures of our information technology systems and products (including because of operational failure, natural disaster, computer virus or hacker attacks) could interrupt the availability of our internet-based products and services, result in corruption or loss of data or breach in security and result in liability, reputational damage to our brands and/or adversely impact our operating results. While we have policies, processes, internal controls and cybersecurity mechanisms in place intended to ensuremaintain the stability of our information technology, provide security from unauthorized access to our systems and maintain business continuity, no mechanisms are entirely free from the risk of failure and we have no guarantee that our security mechanisms will be adequate to prevent all possible security threats. Our brand, reputation, especially in theK-12 market, and consequently our operating results may be adversely impacted by unanticipated system failures, corruption, loss of data and/or breaches in security. 18
Failure to prevent or detect a malicious cyber-attack on our information technology systems could result in liability, reputational damage, loss of revenue and/or financial loss. Cyber-attacks and hackers are becoming more sophisticated and pervasive. Our business is dependent on information technology systems to support our complex operational and logistical arrangements across our businesses. We provide software and/or internet-based products and services to our customers. We also use complex information technology systems and products to support our business activities, particularly in infrastructure and as we move our products and services to an increasingly digital delivery platform. Across our businesses we hold large volumes of personal data, including that of employees, customers and students. Efforts to prevent cyber-attacks and hackers from entering our systems are expensive to implement and may limit the functionality of our systems. Individuals may try to gain unauthorized access to our systems and data for malicious purposes, and our security measures may fail to prevent such unauthorized access. Cyber-attacks and/or intentional hacking of our systems could adversely affect the performance or availability of our products, result in loss of customer data, adversely affect our ability to conduct business, or result in theft of our funds or proprietary information, the occurrence of which could result in liability, reputational damage, loss of revenue and/or financial loss. We are dependent on a small number of third parties to print and bind our products and to supply paper, a principal material for our products. If we were to lose our relationship with our key print vendor and/or paper merchant, our business and results of operations may be materially and adversely affected. We outsource the printing and binding of our products and currently rely on one key third-party print vendor that handles approximately 50%44% of our printing requirements, and we expect a small number of print vendors 18
will continue to account for a substantial portion of our printing requirements for the foreseeable future. The loss of, or a significant adverse change in our relationship with our key print vendor could have a material adverse effect on our business and cost of sales. In addition, we purchase paper, a principal raw material for our print products, primarily through one paper merchant. Further, paper merchants, including our paper merchant, rely on paper mills to produce the paper that they broker. There can be no assurance that our relationships with our print vendor and/or paper merchant will continue or that their business or operations will not be affected by disruptions in the industries that they rely on, including a disruption in the paper mill industry, major disasters or other external factors. The loss of our key print vendor and/or paper merchant, a material change in our relationship with them, a material disruption in their business or their failure to otherwise perform in the expected manner could cause disruptions in our business that may materially and adversely affect our results of operations and financial condition. We may not be able to identify and complete any future acquisitions or achieve the expected benefits from any previous or future acquisitions, which could materially and adversely affect our business, financial condition and results of operations and/or our growth. We have at times used acquisitions as a means of expanding our business and technologies and expect that we will continue to do so in the future as part of our capital allocation strategy. We may be unable to identify suitable acquisition opportunities and, even if we were able to do so, we may not be able to finance or complete any such future acquisition on terms satisfactory to us. Further, we may not be able to successfully integrate previous or future acquisitions into our existing business, achieve anticipated operating advantages and/or realize anticipated cost savings or other synergies. The acquisition and integration of businesses involve a number of risks, including: use of available cash, issuance of equity or debt securities, incurrence of new indebtedness or borrowings under our revolving credit facility to consummate the acquisition and/or integrate the acquired business; diversion of management’s attention from operations of our existing businesses and those of the acquired business to the integration; integration of complex systems, technologies and networks into our existing systems; difficulties in the assimilation and retention of employees; unexpected costs, delays or other risks related to transition support services provided under any transition services agreement that may be executed as part of the acquisition. These transactions may create multiple and overlapping product lines that are offered, priced and supported differently, which could cause customer confusion and delays in service. The demands on our management related to the increase in our size after an acquisition also may have potential adverse effects on our operating results. 19
If we are unable to finance or complete any future acquisition on terms satisfactory to us (or at all) and/or we are unable to successfully integrate any previous or future acquisitions into our existing business, achieve anticipated operating advantages and/or realize anticipated cost savings or other synergies from any such acquired business, it could materially and adversely affect our business, financial condition and results of operations. If we are unable to attract, retain and focus a strong leadership team, a dynamic sales force, software engineers and other key personnel, it could have an adverse effect on our business and ability to remain competitive, financial condition and results from operations. Our success depends, in part, on our ability to continue to attract, focus and retain a strong leadership team, a dynamic sales force, software engineers and other key personnel at economically reasonable compensation levels. We operate in highly competitive industry segments that continue to change to adapt to customer needs and technological advances and in which there is intense competition for experienced and highly effective personnel. If we are unable to timely attract and retain key personnel with relevant skills for our evolving industry segments it could adversely affect our business and ability to remain competitive, financial condition and results of operations. 19
In late summer / early fall of 2017, we added, through new hires and promotion, seven new members to our executive leadership team to serve under our President and Chief Executive Officer, who assumed his role in April 2017. Additional changes to our leadership team in the future could slow implementation of key initiatives, lead to changes in or create uncertainty about our business strategies and/or impact management’s attention to operations. Any such inefficiencies and uncertainty, as well as any failure of our new leadership team to timely and successfully transition into their roles could have a material adverse effect on our business, financial condition and results from operations and/or increase volatility in our stock price.
In addition, our business results depend largely upon the experience and knowledge of local market dynamics and long-standing customer relationships of our sales personnel. Our inability to attract, retain and focus effective sales and other key personnel at economically reasonable compensation levels could materially and adversely affect our ability to operate profitably and grow our business. If we fail to maintain strong relationships with our authors, illustrators and other creative talent, as well as to develop relationships with new creative talent, our net sales and results of operations could be adversely affected. Our Trade publishingHMH Books & Media business and certain aspects of ourK-12 business are highly dependent on maintaining strong relationships with the authors, illustrators and other creative talent who produce books and other products sold to our customers. We operate in a number of highly visible industry segments where there is intense competition for successful authors, illustrators and other creative talent. Any overall weakening of these relationships, or the failure to develop successful new relationships, could have an adverse effect on our net sales and results of operations. Our major operating costs and expenses include employee compensation as well as paper, printing and binding costs and expenses for product-related manufacturing, and a significant increase in such costs and expenses could have a material adverse effect on our profitability. Our major operating costs and expenses include employee compensation as well as paper, printing and binding costs for product-related manufacturing. We offer competitive salary and benefit packages in order to attract and retain the employees required to grow and expand our businesses. Compensation costs are influenced by general economic and business factors, including those affecting the cost of health insurance, payout of commissions and incentive compensation and post-retirement benefits, as well as trends specific to the employee skillsets we require. Paper is one of our principal raw materials. Paper prices fluctuate based on the worldwide demand for and supply of paper in general and for the specific types of paper we use. The price of paper may fluctuate significantly in the future, and changes in the market supply of, or demand for paper, could affect delivery times and prices. Paper mills and other suppliers may consolidate or there may be disruptions in their industry and as a result, there may be future shortfalls in quality and quantity supplies necessary to meet the demands of the entire marketplace, including our demands. As a result, we may need to find alternative sources for paper from time to time. In addition, we have extensive printing and binding requirements. We outsource the printing and binding of our books, workbooks and other printed products to third parties, typically under multi-year contracts. Increases in any of these operating costs and expenses could materially and adversely affect our business, profitability, financial condition and results of operations. Further, higher energy costs and other factors affecting the cost of publishing, transporting and distributing our products could adversely affect our financial results. 20
We also have other significant operating costs, and unanticipated increases in these costs could adversely affect our operating margins. Our inability to absorb the impact of increases in paper, printing and binding costs and other costs of publishing, transporting and distributing our products or any strategic determination not to pass on all or a portion of these increases to our customers could adversely affect our business, financial condition and results of operations. 20
We may not realize expected benefits from our operational efficiency and cost-savings initiatives, including those under our 2017 Restructuring Plan, and such initiatives may lead to unintended consequences that could have a material effect on our results of operations.
On an ongoing basis, we assess opportunities for improved operational effectiveness and efficiency and better alignment of expenses with net sales, while preserving our ability to make the investments in content and our people that we believe are important to our long-term success. In March 2017, we committed to certain actions under the 2017 Restructuring Plan in order to improve our operational efficiency, better focus on the needs of our customers andright-size our cost structure to create long-term shareholder value. These actions include making organizational design changes across layers of the Company below the executive team and otherright-sizing initiatives expected to result in reductions in force, consolidating and/or subletting certain office space under real estate leases as well as other potential operational efficiency and cost-reduction initiatives. We have substantially completed the organizational design change actions and expect to complete the remaining actions by the end of 2018.
We estimate annualized cost savings of approximately $70.0 million to $80.0 million exiting 2018 as a result of these actions and estimate that implementation of these actions are expected to result in total charges of approximately $45.0 million to $49.0 million, of which approximately $35.0 million to $39.0 million of these charges are estimated to result in future cash outlays.
Expected costs, savings and operational efficiency benefits under such initiatives, including those under our 2017 Restructuring Plan, may differ materially from our estimates and expectations based on many factors, including timing of actions thereunder and higher than expected costs of implementation. In addition, such initiatives may lead to unintended consequences, such as management and employee distraction, inability to attract and retain key personnel, attrition beyond planned reductions, and reduced morale and productivity, which could have a material effect on our results of operations.
Exposure to litigation could have a material effect on our financial position and results of operations. In the ordinary course of business, we are involved in legal actions, claims, litigation, investigations and other matters arising from our business operations and face the risk that additional actions and claims will be filed in the future. Litigation alleging infringement of copyrights and other intellectual property rights, particularly with respect to proprietary photographs and images, is common in the educational publishing industry. While management does not expect any of the existing legal actions and claims arising from our business operations to have a material adverse effect on our results of operations, financial position or cash flows, due to the inherent uncertainty of the litigation process, the costs of pursuing or defending against any particular legal proceeding, or the resolution of any particular legal proceeding could have a material effect on our financial position and results of operations. We have insurance in such amounts and with such coverage and deductibles as management believes is reasonable. However, our coverage for certain businessproduct lines has been exhausted and there can be no assurance that our liability insurance for other businessproduct lines will cover all events or that the limits of such coverage will be sufficient to fully cover all potential liabilities thereunder. Operational disruption to our business caused by a major disaster or other external threats could restrict our ability to supply products and services to our customers. Across all our businesses, we manage complex operational and logistical arrangements including distribution centers, data centers and large office facilities. Failure to recover from a major disaster (such as fire, flood or other natural disaster) or other external threat (such as terrorist attacks, strikes, weather, outbreaks of pandemic or contagious diseases, such as the novel coronavirus, or political unrest or other external factors) at a key center or facility could affect our business and employees, disrupt our daily business activities and/or restrict our ability to supply products and services to our customers. 21
We are subject to contingent liabilities that may affect liquidity and our ability to meet our obligations. In the ordinary course of business, we issue performance-related surety bonds and letters of credit posted as security for our operating activities, some of which obligate us to make payments if we fail to perform under certain contracts in connection with the sale of instructional materials and assessment programs. The surety bonds are partially backstopped by letters of credit. As of December 31, 2017,2019, our contingent liability for all letters of credit was approximately $25.2$23.7 million, of which $0.1$0.7 million were issued to backstop $2.5 million of surety bonds. The letters of credit reduce the borrowing availability on our revolving credit facility, which could affect liquidity and, therefore, our ability to meet our obligations. We may increase the number and amount of contracts that require the use of letters of credit, which may further restrict liquidity and, therefore, our ability to meet our obligations in the future. Our substantial level of indebtedness could adversely affect our financial condition and results of operations. As of December 31, 2017,2019, we had approximately $780.0$686.0 million ($768.2657.2 million, net of discount and issuance costs) of total indebtedness outstanding, under ourcomprised of $380.0 million of term loan facilityloans and no amounts outstanding under our revolving credit facility.$306.0 million of senior secured notes. Our substantial outstanding indebtedness could have important consequences, including the following: | • | our high level of indebtedness could make it more difficult for us to satisfy our obligations; |
| • | our high level of indebtedness could adversely impact our credit rating; |
| • | the restrictions imposed on the operation of our business under the agreements governing such indebtedness may hinder our ability to take advantage of strategic opportunities to grow our business and to make attractive investments; |
21
our high level of indebtedness could adversely impact our credit rating; | • | our ability to obtain additional financing for working capital, capital expenditures, product development, debt service requirements, restructuring, acquisitions or general corporate purposes may be impaired, which could be exacerbated by volatility in the credit markets; |
the restrictions imposed on the operation of our business under the agreements governing such indebtedness may hinder our ability to take advantage of strategic opportunities to grow our business and to make attractive investments; | • | we must use a substantial portion of our cash flow from operations to pay principal and interest on our indebtedness, which will reduce the funds available to us for operations, working capital, capital expenditures and other purposes; |
our ability to obtain additional financing for working capital, capital expenditures, product development, debt service requirements, restructuring, acquisitions or general corporate purposes may be impaired, which could be exacerbated by volatility in the credit markets; | • | our high level of indebtedness could place us at a competitive disadvantage compared to our competitors that may have proportionately less debt; |
we must use a substantial portion of our cash flow from operations to pay principal and interest on our indebtedness, which will reduce the funds available to us for operations, working capital, capital expenditures and other purposes; | • | our flexibility in planning for, or reacting to, changes in our business and the industry in which we operate may be limited; |
our high level of indebtedness could place us at a competitive disadvantage compared to our competitors that may have proportionately less debt; | • | our failure to satisfy our obligations under the agreements governing our indebtedness could result in an event of default, which could result in all of our debt becoming immediately due and payable and could permit our secured lenders to foreclose on our assets securing such indebtedness; |
our flexibility in planning for, or reacting to, changes in our business and the industry in which we operate may be limited; | • | our high level of indebtedness makes us more vulnerable to economic downturns and adverse developments in our business and industry; and |
our failure to satisfy our obligations under the agreements governing our indebtedness could result in an event of default, which could result in all of our debt becoming immediately due and payable and could permit our secured lenders to foreclose on our assets securing such indebtedness;
our high level of indebtedness makes us more vulnerable to economic downturns and adverse developments in our business and industry; and
we may be vulnerable to interest rate increases, as certain of our borrowings bear interest at variable rates. A 1% increase or decrease in the interest rate will change our interest expense by approximately $7.8 | • | we may be vulnerable to interest rate increases, as certain of our borrowings bear interest at variable rates. A 1% increase or decrease in the interest rate will change our interest expense by approximately $3.8 million on an annual basis for our term loan facility and $2.5 million on an annual basis for our revolving credit facility, assuming it is fully drawn. |
Any of the foregoing could have a material adverse effect on our business, financial condition, results of operations, prospects and ability to satisfy our obligations. In addition, we may incur substantial additional indebtedness in the future. The terms of the agreements governing our existing indebtedness do not, and any future debt may not, fully prohibit us from doing so. If new indebtedness is added to our current indebtedness levels, the related risks that we now face could substantially intensify. 22
We may not be able to generate sufficient cash to service all of our indebtedness and may be forced to take other actions to satisfy our obligations under our indebtedness, which may not be successful. Our ability to make scheduled payments or to refinance our debt obligations and to fund planned capital expenditures and other growth initiatives depends on our financial and operating performance, which is subject to prevailing economic and competitive conditions and to certain financial, business and other factors beyond our control. We may not be able to maintain a level of cash flow from operating activities sufficient to permit us to pay the principal, premium, if any, and interest on our indebtedness, including our senior secured notes, or to fund our other liquidity needs. If our cash flows and capital resources are insufficient to fund our debt service obligations, we may be forced to reduce or delay capital expenditures, sell assets, seek additional capital or seek to restructure or refinance our indebtedness. These alternative measures may not be successful and may not permit us to meet our scheduled debt service obligations. In the absence of such operating results and resources, we could face substantial liquidity problems and might be required to sell material assets or operations to attempt to meet our debt service and other obligations. Our Senior Secured Credit Facilities restrictsenior secured term loan and revolving credit facilities have certain restrictions on our ability to use the proceeds from asset sales. We may not be able to consummate those asset sales to raise capital or sell assets at prices that we believe are fair and proceeds that we do receive may not be adequate to meet any debt service obligations then due. We may record future goodwill or additional indefinite-lived intangibles impairment charges related to our reporting units, which could have a material adverse impact on our results of operations. We test our goodwill and indefinite-lived intangibles asset balances for impairment during the fourth quarter of each year, or more frequently if indicators are present or changes in circumstances suggest that impairment may exist. We assess goodwill for impairment at the reporting unit level and, inIn evaluating the potential for impairment of goodwill and indefinite-lived intangible assets, we make assumptions regarding estimated net sales projections, growth rates, cash flows and discount rates. Although we use consistent methodologies in developing the assumptions and estimates underlying the fair value calculations used in our impairment tests, these estimates are uncertain by nature and can vary from actual results. Declines in the future performance and cash flows of the reporting unitbusiness or small changes in other key assumptions may result in future impairment charges, which could have a material adverse impact on our results of operations. 22
A change fromup-front payment by school districts for multi-year programs and actions taken in furtherance of our long-term growth strategy could adversely affect our cash flow. In keeping with the past practice of payments, school districts typically payup-front when buying multi-year programs. If school districts changed their payment practices to spread their payments to us over the term of a program, our cash flow could be adversely affected. Further, as we execute on our long-term growth strategy, actions taken in furtherance of our strategy, such as transitioning to new business models could adversely impact our cash flow and our business in unforeseen ways. The shift to sales of greater digital content or an increase in consumable print core programs may affect the comparability of our revenue to prior periods and cause increases or decreases in our sales to be reflected in our results of operations on a delayed basis. AsK-12 instructional materials transition from printed to digital products, an increasing percentage of our revenues are derived from time-based digital products. Our customers typically pay for purchased productsup-front; however, we recognize a significant portion of our time-based digital sales over their respective terms, as required by Generally Accepted Accounting Principles in the United States. As a result, an increase in the portion of our sales coming from digital sales may impact the comparison of our revenue results for a period with the same prior-year or consecutive period. Further, sales of consumable print core programs typically result in net sales being recognized over a longer periods similar to time-based digital products. As more product offerings move to a consumable print format, more revenue will be deferred and recognized over a longer period of time.
23
Another effect of recognizing revenue from digital and consumable print core program sales over their respective terms is that any increases or decreases in sales during a particular period may not translate into proportional increases or decreases in revenue during that period. Consequently, deteriorating sales activity may be less immediately observable in our results of operations. Changes in U.S. federal, state and local or foreign tax law, interpretations of existing tax law, or adverse determinations by tax authorities, could increase our tax burden or otherwise adversely affect our financial condition or results of operations.
As a global learning company, we are subject to taxation at the federal, state or provincial and local levels in the U.S. and various other countries and jurisdictions. As a result, our effective tax rate is derived from a combination of applicable tax rates in the various places that we operate. Our effective tax rate, however, may be different than experienced in the past due to numerous factors, including changes in the mix of our profitability from country to country, the results of examinations and audits of our tax filings, adjustments to the value of our uncertain tax positions, changes in accounting for income taxes and changes in tax laws, including the 2017 Tax Act. Any of these factors could cause us to experience an effective tax rate significantly different from previous periods or our current expectations.
We face risks of doing business abroad. We conduct business in a number of regions outside of the U.S., including emerging markets in South America, Asia, Africa and the Middle East. Accordingly, we face exposure to the risks of doing business abroad, including, but not limited to, longer customer payment terms in certain countries; increased credit risk; difficulties in protecting intellectual property, enforcing or terminating agreements and collecting receivables under certain foreign legal systems; compliance under local privacy laws, rules, regulations and standards; the need to comply with U.S. Foreign Corrupt Practices Act and local laws, rules and regulations; and in some countries, a higher risk of political instability, economic volatility, terrorism, corruption, and social and ethnic unrest. Although we are committed to conducting business in a legal and ethical manner in compliance with local and international statutory requirements and standards applicable to our business, there is a risk that our management, employees or representatives may take actions that violate applicable laws and regulations prohibiting the making of improper payments for the purposes of obtaining or keeping business, including laws such as the U.S. Foreign Corrupt Practices Act or the U.K. Bribery Act. Responding to investigations is costly and requires a significant amount of management’s time and attention. In addition, investigations may adversely impact our reputation, or lead to litigation and financial impacts. None. 23 24
Item 2. Properties Our principal executive office is located at 125 High Street, Boston, Massachusetts 02110. The following table describes the approximate building areas in square feet, principal uses and the years of expiration on leased premises of our significant operating properties as of December 31, 2017.2019. We believe that these properties are suitable and adequate for our present and anticipated business needs, satisfactory for the uses to which each is put, and, in general, fully utilized. | | | | | | | | | | Expiration | | Approximate | | | Principal use | | Segment | | Location | | Expiration
year | | Approximate area | | Principal use of space | | Segment used by | | | year | | area | | | of space | | used by | Owned Premises: | | | | | | | | | | | | | | | | | | | Indianapolis, Indiana | | Owned | | | 491,779 | | | Warehouse | | | All segments | | | Owned | | | 491,779 | | | Warehouse | | Both segments | Troy, Missouri | | Owned | | | 575,000 | | | Office and warehouse | | | Education | | | Owned | | | 575,000 | | | Office and warehouse | | Education | | Leased Premises: | | | | | | | | | | | | | | | | | | | Boston, Massachusetts (Corporate office) | | | 2033 | | | 194,946 | | | Office | | Both segments | Orlando, Florida (a) | | 2029 | | | 250,842 | | | Office | | | Education | | | 2029 | | | 111,073 | | | Office | | Education | Evanston, Illinois | | 2027 | | | 111,398 | | | Office | | | Education | | | 2027 | | | 60,522 | | | Office | | Education | Itasca, Illinois | | 2027 | | | 105,976 | | | Office | | | Education | | | Geneva, Illinois | | 2022 | | | 485,989 | | | Office and warehouse | | | Education | | | 2022 | | | 513,512 | | | Office and warehouse | | Education | Boston, Massachusetts (Corporate office) | | 2033 | | | 194,946 | | | Office | | | All segments | | | Portsmouth, New Hampshire | | 2019 | | | 25,145 | | | Office | | | Education | | | New York, New York | | 2025 | | | 31,815 | | | Office | | | Education | | | Portsmouth, New Hampshire (a) | | | 2020 | | | 25,352 | | | Office | | Education | New York, New York | | 2027 | | | 101,841 | | | Office | | | All segments | | | 2027 | | | 101,441 | | | Office | | Both segments | Austin, Texas | | 2028 | | | 87,570 | | | Office | | | Education | | | 2028 | | | 87,570 | | | Office | | Education | Dublin, Ireland | | 2025 | | | 39,108 | | | Office | | | Education | | | 2025 | | | 28,994 | | | Office | | Education | Orlando, Florida | | | 2021 | | | | 25,400 | | | | Warehouse | | |
| Corporate Records
Center |
| | 2021 | | | 25,400 | | | Warehouse | | Both segments | Itasca, Illinois | | 2019 | | | 46,823 | | | Warehouse | | | Education | | | St Charles, Illinois | | 2024 | | | 26,029 | | | Office | | | Education | | | 2024 | | | 26,029 | | | Office | | Education |
In addition, we lease several other offices that are not material to our operations and, in some instances, are partially or fully subleased. Portions of certain properties listed above are also subleased. (a) | Effective October 2019,HMH has entered into a new lease agreement to lease approximately 40,000 square footage will be reduced to approximately 111,000.feet with expected lease commencement in 2021 coinciding with the expiration of the current Portsmouth, New Hampshire lease. |
Item 3. Legal Proceedings We are involved in legal actions, claims, litigation and other matters incidental to our business. Litigation alleging infringement of copyrights and other intellectual property rights, particularly with respect to proprietary photographs and images, is common in the educational publishing industry. While management believes there is a reasonable possibility we may incur a loss associated with the existing legal actions, claims and litigation, we are not able to estimate such amount, but we do not expect any of these matters to have a material adverse effect on our results of operations, financial position or cash flows. We have insurance in such amounts and with such coverage and deductibles as management believes is reasonable. However, there can be no assurance that our liability insurance will cover all events or that the limits of such coverage will be sufficient to fully cover all potential liabilities thereunder. Item 4. Mine Safety Disclosures Not applicable. 24 25
Item 5. Market for Registrant’s Common Equity, Related Stockholder Matters and Issuer Purchases of Equity Securities Market information. Our common stock has beenis listed on the Nasdaq Global Select Market (“Nasdaq”) under the symbol “HMHC” since November 14, 2013. The following table sets forth, for the periods indicated, the high and low sales prices for our common stock as reported by Nasdaq.. | | | | | | | | | | 2016 | | High | | | Low | | First Quarter | | $ | 21.42 | | | $ | 16.00 | | Second Quarter | | | 21.08 | | | | 14.72 | | Third Quarter | | | 17.69 | | | | 12.80 | | Fourth Quarter | | | 13.74 | | | | 9.15 | | | | | | 2017 | | | | | | | | | First Quarter | | $ | 11.80 | | | $ | 9.25 | | Second Quarter | | | 13.95 | | | | 9.90 | | Third Quarter | | | 12.55 | | | | 9.80 | | Fourth Quarter | | | 12.25 | | | | 8.05 | |
The closing price of our common stock on Nasdaq on February 2, 2018, was $7.95 per share.
Holders. As of February 2, 2018,January 31, 2020, there were approximately 165 stockholders of record of our common stock, one of which was Cede & Co., a nominee for The Depository Trust Company. All of our common stock held by brokerage firms, banks and other financial institutions as nominees for beneficial owners are considered to be held of record by Cede & Co., who is considered to be one stockholder of record. A substantially greater number of holders of our common stock are “street name” or beneficial holders, whose shares of common stock are held of record by banks, brokers and other financial institutions. Because such shares of common stock are held on behalf of stockholders, and not by the stockholders directly, and because a stockholder can have multiple positions with different brokerage firms, banks and other financial institutions, we are unable to determine the total number of stockholders we have. Dividends.We have never paid or declared any cash dividends on our common stock. At present, we intend to retain our future earnings, if any, to fund operations and the growth of our business and, as appropriate, execute our share repurchase program.business. Our future decisions concerning the payment of dividends on our common stock will depend upon our results of operations, financial condition and capital expenditure plans, as well as other factors as our board of directors, in its discretion, may consider relevant, and the extent to which the declaration or payment of dividends may be limited by agreements we have entered into or cause us to lose the benefits of certain of our agreements. See “Management’s Discussion and Analysis of Financial Condition and Results of Operations—Liquidity and Capital Resources.” 25
Performance Graph. The graph below matches the cumulative return of holders of the Company’s common stock with the cumulative returns of the Dow Jones Publishing index, the S&P 500 index, the Nasdaq Composite index, the Russell 2000 index, and a Peer Group index of certain public companies in the educational space, comprised of Pearson PLC, Scholastic Corporation,K-12 Inc., and John Wiley & Sons, Inc. The Russell 2000 index was included as the Company was added to that index during 2014. The graph assumes that the value of the investment in the Company’s common stock, in each index (including reinvestment of dividends) was $100 on November 14, 2013December 31, 2014 and tracks it through February 2, 2018.January 31, 2020. All prices reflect closing prices on the last day of trading at the end of each period. Notwithstanding any general incorporation by reference of this Annual Report on Form 10-K into any other document, the information contained in the graph shall not be deemed to be “soliciting material” or to be “filed” with the SEC or subject to Regulation 14A or 14C under the Exchange Act of 1934, as amended (the “Exchange Act”) or to the liabilities of Section 18 of the Exchange Act, except: (i) as expressly required by applicable law or regulation; or (ii) to the extent that the Company specifically requests that such information be treated as soliciting material or specifically incorporates it by reference into a filing under the Securities Act of 1933, as amended, or the Exchange Act. 26
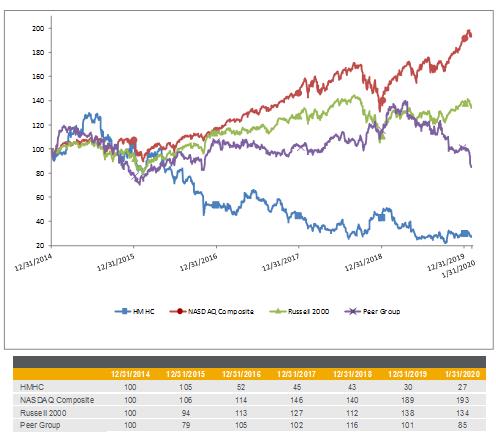 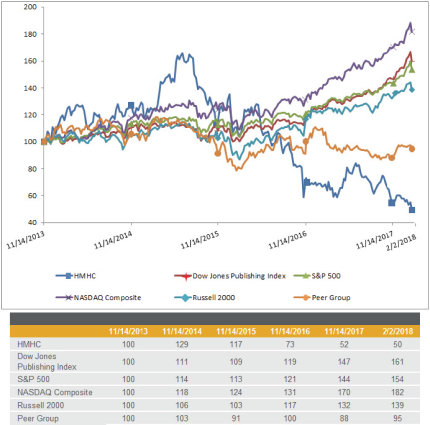
The stock price performance shown on the graph is not necessarily indicative of future price performance. Information used in the graph was obtained from a source we believe to be reliable, but we do not assume responsibility for any errors or omissions in such information. Recent sales of unregistered securities. There have been no sales of unregistered securities by the Company in the three year period ended December 31, 2017.2019. Issuer Purchases of Equity Securities There were no purchases of equity securities in the fourth quarter of 20172019 and for the year ended December 31, 2017. Our Board of Directors has authorized the repurchase of up to $1.0 billion in aggregate value of the Company’s common stock. As of December 31, 2017, there was approximately $482.0 million available for share repurchases under this authorization. The aggregate share repurchase program may be executed through December 31, 2018. Repurchases under the program may be made from time to time in the open market (including under a trading plan) or in privately negotiated transactions. The extent and timing of any such repurchases would generally be at our discretion and subject to market conditions, applicable legal requirements and other considerations. Any repurchased shares may be used for general corporate purposes. 2019.26 27
Item 6. Selected Financial Data The following table summarizes the consolidated historical financial data of Houghton Mifflin Harcourt Company. We derived the consolidated historical financial data as of December 31, 20172019 and 20162018 and for the years ended December 31, 2017, 2016,2019, 2018, and 20152017 from our audited consolidated financial statements included in this Annual Report.Report on Form 10-K. We derived the consolidated historical financial statement data as of December 31, 2015, 20142017, 2016 and 20132015 and for the years ended December 31, 20142016 and 20132015 from our audited consolidated financial statements for such years, which are not included in this Annual Report.Report on Form 10-K. The sale of the Riverside Business on October 1, 2018 is considered a Discontinued Operation and accordingly, all results of the Riverside Business have been removed from continuing operations for all periods presented. Historical results for any prior period are not necessarily indicative of results to be expected in any future period. The data set forth in the following table should be read together with the section entitled “Management’s Discussion and Analysis of Financial Condition and Results of Operations” and our consolidated financial statements and related notes thereto. | | | | | | | | | | | | | | | | | | | | | | | | Years Ended December 31, | | | | | 2017 (4) | | | 2016 (4) | | | 2015 (4) | | | 2014 | | | 2013 | | Operating Data: | | | | | | | | | | | | | | | | | | | | | Net sales | | $ | 1,407,511 | | | $ | 1,372,685 | | | $ | 1,416,059 | | | $ | 1,372,316 | | | $ | 1,378,612 | | Cost and expenses: | | | | | | | | | | | | | | | | | | | | | Cost of sales, excluding publishing rights andpre-publication amortization | | | 617,802 | | | | 610,715 | | | | 622,668 | | | | 588,726 | | | | 585,059 | | Publishing rights amortization | | | 46,238 | | | | 61,351 | | | | 81,007 | | | | 105,624 | | | | 139,588 | | Pre-publication amortization | | | 126,038 | | | | 130,243 | | | | 120,506 | | | | 129,693 | | | | 121,715 | | | | | | | | | | | | | | | | | | | | | | | Cost of sales | | | 790,078 | | | | 802,309 | | | | 824,181 | | | | 824,043 | | | | 846,362 | | Selling and administrative | | | 654,860 | | | | 699,544 | | | | 681,124 | | | | 612,535 | | | | 580,887 | | Other intangible asset amortization | | | 30,748 | | | | 26,750 | | | | 22,038 | | | | 12,170 | | | | 18,968 | | Impairment charge forpre-publication costs, intangible assets, investment in preferred stock, and fixed assets (1) | | | 3,980 | | | | 139,205 | | | | — | | | | 1,679 | | | | 9,000 | | Restructuring (2) | | | 40,653 | | | | — | | | | — | | | | — | | | | — | | Severance and other charges (3) | | | 713 | | | | 15,650 | | | | 4,767 | | | | 7,300 | | | | 10,040 | | | | | | | | | | | | | | | | | | | | | | | Operating loss | | | (113,521 | ) | | | (310,773 | ) | | | (116,051 | ) | | | (85,411 | ) | | | (86,645 | ) | | | | | | | | | | | | | | | | | | | | | | Other income (expense) | | | | | | | | | | | | | | | | | | | | | Interest expense | | | (42,805 | ) | | | (39,181 | ) | | | (32,254 | ) | | | (18,495 | ) | | | (21,573 | ) | Interest income | | | 1,338 | | | | 518 | | | | 209 | | | | 250 | | | | 229 | | Loss on extinguishment of debt | | | — | | | | — | | | | (3,051 | ) | | | — | | | | (598 | ) | Change in fair value of derivative instruments | | | 1,366 | | | | (614 | ) | | | (2,362 | ) | | | (1,593 | ) | | | (252 | ) | | | | | | | | | | | | | | | | | | | | | | Loss before taxes | | | (153,622 | ) | | | (350,050 | ) | | | (153,509 | ) | | | (105,249 | ) | | | (108,839 | ) | Income tax expense (benefit) | | | (50,435 | ) | | | (65,492 | ) | | | (19,640 | ) | | | 6,242 | | | | 2,347 | | | | | | | | | | | | | | | | | | | | | | | Net loss | | $ | (103,187 | ) | | $ | (284,558 | ) | | $ | (133,869 | ) | | $ | (111,491 | ) | | $ | (111,186 | ) | | | | | | | | | | | | | | | | | | | | | | Net loss per share attributable to common stockholders—basic | | $ | (0.84 | ) | | $ | (2.32 | ) | | $ | (0.98 | ) | | $ | (0.79 | ) | | $ | (0.79 | ) | | | | | | | | | | | | | | | | | | | | | | Net loss per share attributable to common stockholders—diluted | | $ | (0.84 | ) | | $ | (2.32 | ) | | $ | (0.98 | ) | | $ | (0.79 | ) | | $ | (0.79 | ) | | | | | | | | | | | | | | | | | | | | | | Weighted average number of common shares used in net loss per share attributable to common stockholders—basic and diluted | | | 122,949,064 | | | | 122,418,474 | | | | 136,760,107 | | | | 140,594,689 | | | | 139,928,650 | | | | | | | | | | | | | | | | | | | | | | | Balance Sheet Data (as of period end): | | | | | | | | | | | | | | | | | | | | | Cash, cash equivalents and short-term investments | | $ | 235,428 | | | $ | 306,943 | | | $ | 432,403 | | | $ | 743,345 | | | $ | 425,349 | | Working capital | | | 116,870 | | | | 200,570 | | | | 376,217 | | | | 751,009 | | | | 588,643 | | Total assets (5) | | | 2,563,591 | | | | 2,731,471 | | | | 3,121,950 | | | | 2,982,788 | | | | 2,870,364 | | Debt (short-term and long-term) (5) | | | 768,194 | | | | 772,738 | | | | 777,283 | | | | 235,265 | | | | 235,445 | | Stockholders’ equity | | | 795,193 | | | | 880,040 | | | | 1,198,321 | | | | 1,759,680 | | | | 1,850,276 | | Statement of Cash Flows Data: | | | | | | | | | | | | | | | | | | | | | Net cash provided by (used in): | | | | | | | | | | | | | | | | | | | | | Operating activities | | | 135,130 | | | | 143,751 | | | | 348,359 | | | | 491,043 | | | | 157,203 | | Investing activities | | | (204,923 | ) | | | (113,946 | ) | | | (676,787 | ) | | | (367,619 | ) | | | (168,578 | ) | Financing activities | | | (7,330 | ) | | | (37,960 | ) | | | 106,104 | | | | 19,529 | | | | (4,075 | ) |
| | Years Ended December 31, | | | | 2019 (1) | | | 2018 (1) | | | 2017 | | | 2016 | | | 2015 | | Operating Data: | | | | | | | | | | | | | | | | | | | | | Net sales | | $ | 1,390,674 | | | $ | 1,322,417 | | | $ | 1,327,029 | | | $ | 1,291,978 | | | $ | 1,319,416 | | Cost and expenses: | | | | | | | | | | | | | | | | | | | | | Cost of sales, excluding publishing rights and pre-publication amortization | | | 668,108 | | | | 581,467 | | | | 588,518 | | | | 578,317 | | | | 582,411 | | Publishing rights amortization | | | 26,557 | | | | 34,713 | | | | 46,238 | | | | 61,351 | | | | 81,007 | | Pre-publication amortization | | | 149,515 | | | | 109,257 | | | | 119,908 | | | | 121,866 | | | | 112,892 | | Cost of sales | | | 844,180 | | | | 725,437 | | | | 754,664 | | | | 761,534 | | | | 776,310 | | Selling and administrative | | | 662,606 | | | | 649,295 | | | | 636,326 | | | | 681,170 | | | | 655,887 | | Other intangible asset amortization | | | 25,310 | | | | 26,933 | | | | 29,248 | | | | 26,375 | | | | 22,038 | | Impairment charge for pre-publication costs and intangible assets | | | — | | | | — | | | | 3,980 | | | | 130,205 | | | | — | | Restructuring/severance and other charges | | | 21,742 | | | | 11,478 | | | | 37,952 | | | | 15,371 | | | | 4,146 | | Gain on sale of assets | | | — | | | | (201 | ) | | | — | | | | — | | | | — | | Operating loss | | | (163,164 | ) | | | (90,525 | ) | | | (135,141 | ) | | | (322,677 | ) | | | (138,965 | ) | Other income (expense) | | | | | | | | | | | | | | | | | | | | | Retirement benefits non-service income | | | 167 | | | | 1,280 | | | | 3,486 | | | | 4,253 | | | | 2,787 | | Interest expense | | | (48,778 | ) | | | (45,680 | ) | | | (42,805 | ) | | | (39,181 | ) | | | (32,254 | ) | Interest income | | | 3,157 | | | | 2,550 | | | | 1,338 | | | | 518 | | | | 209 | | Change in fair value of derivative instruments | | | (899 | ) | | | (1,374 | ) | | | 1,366 | | | | (614 | ) | | | (2,362 | ) | Income from transition services agreement | | | 4,248 | | | | 1,889 | | | | — | | | | — | | | | — | | Loss on extinguishment of debt | | | (4,363 | ) | | | — | | | | — | | | | — | | | | (3,051 | ) | Loss from continuing operations before taxes | | | (209,632 | ) | | | (131,860 | ) | | | (171,756 | ) | | | (357,701 | ) | | | (173,636 | ) | Income tax expense (benefit) for continuing operations | | | 4,201 | | | | 5,597 | | | | (51,419 | ) | | | (51,556 | ) | | | (20,411 | ) | Loss from continuing operations | | | (213,833 | ) | | | (137,457 | ) | | | (120,337 | ) | | | (306,145 | ) | | | (153,225 | ) | Earnings from discontinued operations, net of tax | | | — | | | | 12,833 | | | | 17,150 | | | | 21,587 | | | | 19,356 | | Gain on sale of discontinued operations, net of tax | | | — | | | | 30,469 | | | | — | | | | — | | | | — | | Income from discontinued operations, net of tax | | | — | | | | 43,302 | | | | 17,150 | | | | 21,587 | | | | 19,356 | | Net loss | | $ | (213,833 | ) | | $ | (94,155 | ) | | $ | (103,187 | ) | | $ | (284,558 | ) | | $ | (133,869 | ) | Net loss per share attributable to common stockholders | | | | | | | | | | | | | | | | | | | | | Basic and diluted: | | | | | | | | | | | | | | | | | | | | | Continuing operations | | $ | (1.72 | ) | | $ | (1.11 | ) | | $ | (0.98 | ) | | $ | (2.50 | ) | | $ | (1.12 | ) | Discontinued operations | | | — | | | | 0.35 | | | | 0.14 | | | | 0.18 | | | | 0.14 | | Net loss | | $ | (1.72 | ) | | $ | (0.76 | ) | | $ | (0.84 | ) | | $ | (2.32 | ) | | $ | (0.98 | ) | Weighted average shares outstanding: basic and diluted | | | 124,152,984 | | | | 123,444,943 | | | | 122,949,064 | | | | 122,418,474 | | | | 136,760,107 | | Balance Sheet Data (as of period end): | | | | | | | | | | | | | | | | | | | | | Cash, cash equivalents and short-term investments | | $ | 296,353 | | | $ | 303,198 | | | $ | 235,428 | | | $ | 306,943 | | | $ | 432,403 | | Working capital (2) | | | 157,944 | | | | 218,586 | | | | 126,567 | | | | 209,982 | | | | 384,912 | | Total assets (2) | | | 2,513,172 | | | | 2,495,124 | | | | 2,439,830 | | | | 2,604,307 | | | | 2,976,759 | | Debt (short-term and long-term) | | | 657,187 | | | | 763,649 | | | | 768,194 | | | | 772,738 | | | | 777,283 | | Stockholders’ equity | | | 566,360 | | | | 768,470 | | | | 795,193 | | | | 880,040 | | | | 1,198,321 | | Statement of Cash Flows Data: | | | | | | | | | | | | | | | | | | | | | Net cash provided by (used in): | | | | | | | | | | | | | | | | | | | | | Operating activities | | | 254,975 | | | | 104,084 | | | | 104,748 | | | | 111,785 | | | | 311,906 | | Investing activities | | | (96,320 | ) | | | 427 | | | | (193,895 | ) | | | (106,117 | ) | | | (667,739 | ) | Financing activities | | | (115,667 | ) | | | (4,124 | ) | | | (7,330 | ) | | | (37,960 | ) | | | 106,104 | | Other Data: | | | | | | | | | | | | | | | | | | | | | Capital expenditures: | | | | | | | | | | | | | | | | | | | | | Pre-publication capital expenditures | | | 102,562 | | | | 123,403 | | | | 131,282 | | | | 118,603 | | | | 100,465 | | Property, plant, and equipment capital expenditures | | | 37,561 | | | | 53,741 | | | | 55,092 | | | | 103,152 | | | | 77,183 | | Depreciation and intangible asset amortization | | | 123,177 | | | | 142,819 | | | | 146,535 | | | | 162,193 | | | | 168,787 | |
28
| | | | | | | | | | | | | | | | | | | | | | | | Years Ended December 31, | | | | | 2017 (4) | | | 2016 (4) | | | 2015 (4) | | | 2014 | | | 2013 | | Other Data: | | | | | | | | | | | | | | | | | | | | | Capital expenditures: | | | | | | | | | | | | | | | | | | | | | Pre-publication capital expenditures | | | 139,108 | | | | 124,031 | | | | 103,709 | | | | 115,509 | | | | 126,718 | | Property, plant, and equipment capital expenditures | | | 58,294 | | | | 105,553 | | | | 82,987 | | | | 67,145 | | | | 59,803 | | Depreciation and intangible asset amortization | | | 152,480 | | | | 167,926 | | | | 176,103 | | | | 190,084 | | | | 220,264 | |
(1) | Primarily represents tradenamesThe 2018 amounts and to a lesser extent software and program development costs, along with a preferred stock investment. |
(2) | Represents cash and noncash charges incurred as a result of our 2017 Restructuring Plan. |
(3) | Represents severance and real estate charges not part of our 2017 Restructuring Plan. |
(4) | Includesall following years have been impacted by the results of our acquisitionJanuary 1, 2018 adoption of the EdTech business from May 29, 2015 through December 31, 2017. For further information regardingnew revenue standard. |
(2) | The 2019 amounts have been impacted by the acquisitionJanuary 1, 2019 adoption of the EdTech business, seenew leases standard. Please refer to Note 3 to the financial statements.2 and Note 8 included in Item 8. for further details. |
(5) | 2013 through 2015 include the retrospective adoption of new guidance for the recognition and measurement of debt issuance costs effective for annual reporting periods beginning after December 15, 2015. |
27 29
Item 7. Management’s Discussion and Analysis of Financial Condition and Results of Operations The following discussion and analysis is intended to facilitate an understanding of our results of operations and financial condition and should be read in conjunction with our consolidated financial statements and the accompanyingrelated notes thereto included elsewhere in this Annual Report.Report on Form 10-K. The following discussion and analysis of our financial condition and results of operations contains forward-looking statements about our business, operations and industry that involve risks and uncertainties, such as statements regarding our plans, objectives, expectations and intentions. Actual results and the timing of events may differ materially from those expressed or implied in such forward-looking statements due to a number of factors, including those set forth under “Risk Factors” and elsewhere in this Annual Report.Report on Form 10-K. See “Risk Factors” and “Special Note Regarding Forward-Looking Statements.” Discussion and analysis of the year ended December 31, 2018 compared to the year ended December 31, 2017 is included under the heading “Item 7. Management’s Discussion and Analysis of Financial Condition and Results of Operations” in our Annual Report on Form 10-K for the year ended December 31, 2018 as filed with the SEC on February 28, 2019. Overview We are a global learning company specializing in educationcommitted to delivering connected solutions acrossthat engage learners, empower educators and improve student outcomes. As a varietyleading provider of media, delivering content,K–12 core curriculum, supplemental and intervention solutions, and professional learning services, we partner with educators and technologyschool districts to both educational institutionsuncover solutions that unlock students’ potential and consumers, reaching overextend teachers’ capabilities. We estimate that we serve more than 50 million students and three million educators in more than 150 countries, worldwide. Inwhile our award-winning children’s books, novels, non-fiction, and reference titles are enjoyed by readers throughout the United States,world. For nearly two centuries, our HMH Books & Media division has brought renowned and awarded children’s, fiction, non-fiction, culinary and reference titles to readers throughout the world. Our distinguished author list includes 10 Nobel Prize winners, 49 Pulitzer Prize winners, and 26 National Book Award winners. We are home to popular characters and titles such as Curious George, Carmen Sandiego, The Lord of the Rings, The Whole 30, The Best American Series, the Peterson Field Guides, CliffsNotes, and The Polar Express, and published distinguished authors such as Tim O’Brien, Temple Grandin, Tim Ferriss, Kwame Alexander, Lois Lowry, and Chris Van Allsburg. Recent Developments Strategic Transformation Plan On October 15, 2019, our Board of Directors approved changes connected with our ongoing strategic transformation to simplify our business model and accelerate growth. This includes new product development and go-to-market capabilities, as well as the streamlining of operations company-wide for greater efficiency. These actions, which we are a leading provider ofK-12 educational content by market share. We believerefer to as our long-standing reputation and trusted brand enable us to capitalize on consumer and digital trends2019 Restructuring Plan, resulted in the education market throughnet elimination of approximately 10% of our existingworkforce, after taking into account new strategy-aligned positions that are expected to be added, and developing channels. Furthermore,additional operating and capitalized cost reductions, including an approximately 20% reduction in previously planned content development expenditures over the next three years. These steps are intended to further simplify our tradebusiness model while delivering increased value to customers, teachers and reference materials, including adult and children’s fiction andnon-fiction books, have won industry awards such asstudents. The workforce reductions were completed during the Pulitzer Prize, Newbery and Caldecott medals and National Book Award.first quarter of 2020. Corporate History
Houghton Mifflin Harcourt Company was incorporated as a Delaware corporation on March 5, 2010, and was established as the holding companyAfter considering additional headcount actions, implementation of the current operating group. Houghton Mifflin Harcourtplanned actions resulted in total charges of $15.8 million which was formedrecorded in December 2007the fourth quarter of 2019. With respect to each major type of cost associated with the acquisition of Harcourt Education Group, then the second-largestK-12 U.S. publisher, by Houghton Mifflin Group. We are headquartered in Boston, Massachusetts.
Acquisition
On April 23, 2015, we entered into a stocksuch activities, substantially all costs were severance and asset purchase agreement with Scholastic Corporation (“Scholastic”) to acquire certain assets (including the stock of two of Scholastic’s subsidiaries) comprising its Educational Technologyother termination benefit costs and Services (“EdTech”) business. On May 29, 2015, we completed the acquisition and paid an aggregate purchase price of $574.8 millionwill result in cash to Scholastic, including adjustments for working capital. The EdTech acquisition provided us with a leading positionexpenditures.
Further, as part of such strategic transformation plan, we recorded an incremental $9.8 million inventory obsolescence charge in intervention curriculum and services and extended our product offeringsthe fourth quarter of 2019 which is recorded in other areas, including educational technology, early learning, and education services, creating a more comprehensive offering for students, teachers and schools.cost of sales in the statement of operations. 28
Key Aspects and Trends of Our Operations Business Segments We are organized along two business segments: Education and HMH Books & Media (formerly referred to as Trade Publishing.Publishing). Our Education segment is our largest segment and represented approximately 87%, 85% and 86% of our total net sales for the year ended December 31, 2017 and 88% of our total net sales for each of the years ended December 31, 20162019, 2018 and 2015.2017, respectively. Our Trade PublishingHMH Books & Media segment represented approximately 13%, 15% and 14% of our total net sales for the year ended December 31, 2017 and 12% of our total net sales for each of the years ended December 31, 20162019, 2018 and 2015.2017, respectively. The Corporate and Other category represents certain general overhead costs not fully allocated to the business segments, such as legal, accounting, treasury, human resources and executive functions. Net Sales We derive revenue primarily from the sale of print and digital content and instructional materials, trade books, reference materials, multimedia instructional programs, license fees for book rights, content, software and 30
services, test scoring, consulting and training. We primarily sell to customers in the United States. Our net sales are driven primarily as a function of volume and, to a certain extent, changes in price. Our net sales consist of our billings for products and services, less revenue that will be deferred until future recognition along with a provisionthe transaction price allocation adjusted to reflect the estimated returns for product returns.the arrangement. Deferred revenues primarily derive from online interactive digital content, digital and online learning components along with undelivered work-texts, workbooks and services. The work-texts, workbooks and services are deferred until delivered,control is transferred to the customer, which often extends over the life of the contract, and our hosted online and digital content is typically recognized ratably over the life of the contract. The digitalization of education content and delivery is driving a shift in the education market. As theK-12 educational market transitions to purchasing more digital, personalized education solutions, we believe our ability now or in the future to offer embedded assessments, adaptive learning, real-time interaction and student specific personalization of educational content in a platform- and device-agnostic manner will provide new opportunities for growth. An increasing number of schools are utilizing digital content in their classrooms and implementing online or blended learning environments, which is altering the historical mix of print and digital educational materials in the classroom. As a result, our business model has shifted to moreincludes integrated solutions comprised of both print and digital and online learning componentsofferings/products to address the needs of the education marketplace; thus, often resulting in an increase in our billings being deferred compared to historical levels.marketplace. The level of revenues being deferred can fluctuate depending upon the mix of product offering between digital andnon-digital products, the length of programs and the mix of product delivered immediately or over time. Core curriculum programs, which historically represent the most significant portion of our Education segment net sales, cover curriculum standards in a particularK-12 academic subject and include a comprehensive offering of teacher and student materials required to conduct the class throughout the school year. Products and services in these programs include print and digital offerings for students and a variety of supporting materials such as teacher’s editions, formative assessments, supplemental materials, whole group instruction materials, practice aids, educational games and professional services. The process through which materials and curricula are selected and procured for classroom use varies throughout the United States. Currently, nineteen19 states, known as adoption states, review and approve new programs usually every six to eight years on a state-wide basis. School districts in those states typically select and purchase materials from the state-approved list. The remaining states are known as open states or open territories.territory states. In those states, materials are not reviewed at the state level, and each individual school or school district is free to procure materials at any time, although most follow afive-to-ten year five to ten-year replacement cycle. The student population in adoption states represents over 50%approximately 51% of the U.S. elementary and secondaryschool-age population. Some adoption states provide “categorical funding” for instructional materials, which means that those state funds cannot be used for any other purpose. Our core curriculum programs primarily in adoption states, typically have higher deferred sales than other parts of the business. The higher deferred sales are primarily due to the length of time that our programs are being delivered, along with greater component and digital product offerings. A significant portion of our Education segment net sales is dependent upon our ability to maintain residual sales, which are subsequent sales after the year of the original adoption, and our ability to continue to generate new business by developing new programs that meet our customers’ evolving needs. In addition, our market is affected by changes in state curriculum standards, which drive instruction, assessment and accountability in each state. Changes in state curriculum standards require that instructional materials be revised or replaced to align to the new standards, which historically has driven demand for core curriculum programs. 29
We also derive our Education segment net sales from the sale of summative, cognitivesupplemental and formative orin-classroom assessments to districts and schools in all 50 states. Summative assessments are concluding or “final” exams that measure students’ proficiency in a particular academic subject or group of subjects on an aggregate level or against state standards. Formative assessments areon-going,in-classroom tests that occur throughout the school year and monitor progress in certain subjects or curriculum units. Additionally, our offerings include supplementalintervention products that target struggling learners through comprehensive intervention solutions aimed at raising student achievement by providing solutions that combine technology, content and other educational products, as well as consulting and professional development services. We also offer products targeted at assisting English language learners. 31
In international markets, we predominantly export and sellK-12 books to premium private schools that utilize the U.S. curriculum, which are located primarily in Asia, the Pacific, the Middle East, Latin America, the Caribbean and Africa. Our international sales team utilizes a global network of distributors in local markets around the world. Our Trade PublishingHMH Books & Media segment sells works of fiction andnon-fiction in the General Interest and Young Reader’s categories, dictionaries and other reference works. While print remains the primary format in which trade books are produced and distributed, the market for trade titles in digital format, primarilye-books, has developed over the past several years, and ebooks, generally represents approximately 8% to 10% of our annual Trade PublishingHMH Books & Media net sales. Further, HMH Books & Media licenses content to other publishers along with media companies. Factors affecting our net sales include: Education | • | state or district per student funding levels; |
| • | the cyclicality of the purchasing schedule for adoption states; |
| • | adoption of new education standards; |
| • | state acceptance of submitted programs and participation rates for accepted programs; |
| • | technological advancement and the introduction of new content and products that meet the needs of students, teachers and consumers, including through strategic agreements pertaining to content development and distribution; and |
| • | the amount of net sales subject to deferrals which is impacted by the mix of product offering between digital and non-digital products, the length of programs and the mix of product delivered immediately or over time. |
HMH Books & Media federal funding levels; | • | consumer spending levels as influenced by various factors, including the U.S. economy and consumer confidence; |
the cyclicality of the purchasing schedule for adoption states; | • | the publishing of bestsellers along with obtaining recognized authors; |
student enrollments; | • | film and series tie-ins to our titles that spur sales of current and backlist titles, which are titles that have been on sale for more than a year; and |
adoption of new education standards;
state acceptance of submitted programs and participation rates for accepted programs;
technological advancement and the introduction of new content and products that meet the needs of students, teachers and consumers, including through strategic agreements pertaining to content development and distribution; and
the amount of net sales subject to deferrals which is impacted by the mix of product offering between digital andnon-digital products, the length of programs and the mix of product delivered immediately or over time.
Trade Publishing
consumer spending levels as influenced by various factors, including the U.S. economy and consumer confidence;
the publishing of bestsellers along with obtaining recognized authors;
film and seriestie-ins to our titles that spur sales of current and backlist titles, which are titles that have been on sale for more than a year; and
| • | market growth or contraction. |
State or districtper-student funding levels, which closely correlate with state and local receipts from income, sales and property taxes, impact our sales as institutional customers are affected by funding cycles. Most public school districts, the primary customers forK-12 products and services, are largely dependent on state and local funding to purchase materials. We monitor the purchasing cycles for specific disciplines in the adoption states in order to manage our product development and to plan sales campaigns. Our sales may be materially impacted during the years that major adoption states, such as Florida, California and Texas, are or are not scheduled to make significant purchases. For example, Florida adopted social studiesScience materials in 2016, for purchase in 2017, and adopted science in 2017 for purchase in 2018. Texas school districts purchased social studies and high school math materials in 2015 and purchased materials for languages other than English and career and technical education in 32
2017. The next major adoption in Texas is expected to beadopted Reading/English Language Arts currently scheduled for adoptionmaterials in 2018 andfor purchase in 2019. California adopted English Language Arts materials in 2015, with purchases beginning in 2016history and continuing through 2018, and adopted history social science materials in 2017 for purchase in 2018 and continuing through 2020.2020 and adopted Science materials in 2018 for purchase in 2019 and
30
continuing through 2021. Both Florida and Texas, along with several other adoption states, provide dedicated state funding for instructional materials and classroom technology, with funding typically appropriated by the legislature in the first half of the year in which materials are to be purchased. Texas has atwo-year budget cycle, and in the 20172018 legislative session appropriated funds for purchases in 20172018 and 2018.2019. California funds instructional materials in part with a dedicated portion of state lottery proceeds and in part out of general formula funds, with the minimum overall level of school funding determined according to the Proposition 98 funding guarantee. We do not currently have contracts with these states for future instructional materials adoptions and there is no guarantee that our programs will be accepted by the state (for example, ourK-8 social science materials were not adopted in California in 2017).state. Long-term growth in the U.S.K-12 market is positively correlated with student enrollments, which is a driver of growth in the educational publishing industry. Although economic cycles may affect short-term buying patterns, school enrollments are highly predictable and are expected to trend upward over the longer term. From 2013-20142018 to 2025-2026,2028, total public school enrollment, a major long-term driver of growth in theK-12 Education market, is projected to increase by 3%1.4% to 51.457.4 million students, according to the National Center for Education Statistics. The digitalization of education content and delivery is also driving a shift inAs the education market. As theK-12 educational market transitions to purchasingpurchases more digital solutions, we believe our ability to offer embedded assessments, adaptive learning, real-time interaction and student specific personalized learning and educational content in a platform- and device-agnostic manner will provide new opportunities for growth.
Our Trade PublishingHMH Books & Media segment is heavily influenced by the U.S. and broader global economy, consumer confidence and consumer spending. As the economy continues to recover,grow, both consumer confidence and consumer spending have increased. While print remains the primary format in which trade books are produced and distributed, the market for trade titles in digital format, primarilye-books, ebooks, has developed overin the past several years,recent decade, as the industry evolved to embrace new technologies for developing, producing, marketing and distributing trade works. We continue to focus on the development of innovative new digital products which capitalize on our strong content, our digital expertise and the consumer demand for these products. In the Trade PublishingHMH Books & Media segment, annual results can be driven by bestselling trade titles. Furthermore, backlist titles can experience resurgence in sales when made into films or series. In the past years, a number of our backlist titles such asThe Hobbit,The Lord of the Rings,Life of Pi,The Handmaid’s Tale,The Polar Express, The Giver andThe Time Traveler’s Wife have benefited in popularity due to movie or series releases and have subsequently resulted in increased trade sales. We employ several pricing models to serve various customer segments, including institutions, consumers, government agencies, consumers and other third parties. In addition to traditional pricing models where a customer receives a product in return for a payment at the time of product receipt, we currently use the following pricing models: | • | Pay-up-front: Customer makes a fixed payment at time of purchase and we provide a specific product/service in return; |
| • | Pre-pay Subscription: Customer makes a one-time payment at time of purchase, but receives a stream of goods/services over a defined time horizon; for example, we currently provide customers the option to purchase a multi-year subscription to textbooks where for a one-time charge, a new copy of the work text is delivered to the customer each year for a defined time period. Pre-pay subscriptions to online textbooks are another example where the customer receives access to an online book for a specific period of time; and |
| • | Pay-as-you-go Subscription: Similar to the pre-pay subscription, except that the customer makes periodic payments in a pre-described manner. |
Pre-pay Subscription: Customer makes aone-time payment at time of purchase, but receives a stream of goods/services over a defined time horizon; for example, we currently provide customers the option to purchase a multi-year subscription to textbooks where for aone-time charge, a new copy of the work text is delivered to the customer each year for a defined time period.Pre-pay subscriptions to online textbooks are another example where the customer receives access to an online book for a specific period of time; and
33
Pay-as-you-go Subscription: Similar to thepre-pay subscription, except that the customer makes periodic payments in apre-described manner. With the exception of our professional services business, this pricing model is the least prevalent of the three models.
Cost of sales, excluding publishing rights andpre-publication amortization Cost of sales, excluding publishing rights andpre-publication amortization, include expenses directly attributable to the production of our products and services, including thenon-capitalizable costs associated with our content and platform development group. The expenses within cost of sales include variable costs such as paper, printing and binding costs of our print materials, royalty expenses paid to our authors, gratis costs or products provided at no charge as part of the sales transaction, and inventory obsolescence. Also included in cost of sales are labor costs related to professional services and thenon-capitalized costs associated with our content and platform 31
development group. We also include amortization expense associated with our customer-facing software platforms. Certain products such as trade books and products associated with our renowned authors carry higher royalty costs; conversely, digital offerings usually have a lower cost of sales due to lower costs associated with their production. Also, sales to adoption states usually contain higher cost of sales. A change in the sales mix of our products or services can impact consolidated profitability. Publishing rights andPre-publication amortization A publishing right is an acquired right that allows us to publish and republish existing and future works as well as create new works based on previously published materials. As part of our March 9, 2010 restructuring, we recorded an intangible asset for publishing rights and amortize such asset on an accelerated basis over the useful lives of the various copyrights involved. This amortization will continue to decrease approximately 25% annually through March of 2023. We capitalize the art, prepress, manuscript and other costs incurred in the creation of the master copy of our content, known as thepre-publication costs.Pre-publication costs are primarily amortized from the year of sale over five years using thesum-of-the-years-digits method, which is an accelerated method for calculating an asset’s amortization. Under this method, the amortization expense recorded for apre-publication cost asset is approximately 33% (year 1), 27% (year 2), 20% (year 3), 13% (year 4) and 7% (year 5). We utilize this policy for allpre-publication costs, except with respect to our Trade PublishingHMH Books & Media segment’s consumer books, for which we generally expense such costs as incurred, our assessment products, which we use the straight-line amortization method and the acquired content of ourcertain intervention products acquired in 2015, acquisition, which we amortize over 7 years using an accelerated amortization method. The amortization methods and periods chosen best reflect the pattern of expected sales generated from individual titles or programs. We periodically evaluate the remaining lives and recoverability of capitalizedpre-publication costs, which are often dependent upon program acceptance by state adoption authorities. Selling and administrative expenses Our selling and administrative expenses include the salaries, benefits and related costs of employees engaged in sales and marketing, fulfillment and administrative functions. Also included within selling and administrative costsexpenses are variable costs such as commission expense, outbound transportation costs (approximately $35.6 million for the year ended December 31, 2019) and depository fees, which are fees paid to state-mandated depositories that fulfill centralized ordering and warehousing functions for specific states. Additionally, significant fixed and discretionary costs include facilities, telecommunications, professional fees, promotions, sampling and advertising.advertising along with depreciation. Other intangible asset amortization Our other intangible asset amortization expense primarily includes the amortization of acquired intangible assets consisting of tradenames, customer relationships, content rights and licenses. The tradenames, customer 34
relationships, content rights and licenses are amortized over varying periods of 6 to 25 years. The expense for the year endingended December 31, 20172019 was $30.7 million, of which $9.4 million related to the tradenames that were changed from indefinite-lived intangible assets to definite-lived intangible assets on October 1, 2016 due to the strategic decision to gradually migrate away from specific imprints, primarily the Holt McDougal and various supplemental brands, and to market our products under the Houghton Mifflin Harcourt and HMH names.$25.3 million. Interest expense Our interest expense includes interest accrued on our $306.0 million in aggregate principal amount of 9.0% Senior Secured Notes due 2025 (“notes”), our $380.0 million term loan credit facility (“new term loan facility”) and our previous $800.0 million term loan credit facility (“previous term loan facility”) along with, to a lesser extent, our revolving credit facility, capitalfinance leases, the amortization of any deferred financing fees and loan discounts, and payments in connection with interest rate hedging agreements. Our interest expense for the year ended December 31, 20172019 was $42.8$48.8 million. However, we expect this amount to be approximately $69.0 million in 2020. 32
Results of Operations Consolidated Operating Results for the Years Ended December 31, 20172019 and 20162018 | | | Year Ended | | | Year Ended | | | | | | | | | | | | | | | | | | | | December 31, | | | December 31, | | | Dollar | | | Percent | | | (dollars in thousands) | | Year
Ended
December 31,
2017 | | Year
Ended
December 31,
2016 | | Dollar
change | | Percent
Change | | | 2019 | | | 2018 | | | change | | | Change | | Net sales | | $ | 1,407,511 | | | $ | 1,372,685 | | | $ | 34,826 | | | 2.5 | % | | $ | 1,390,674 | | | $ | 1,322,417 | | | $ | 68,257 | | | | 5.2 | % | | Costs and expenses: | | | | | | | | | | | | | | | | | | | | | | | | | Cost of sales, excluding publishing rights andpre-publication amortization | | 617,802 | | | 610,715 | | | 7,087 | | | 1.2 | % | | | 668,108 | | | | 581,467 | | | | 86,641 | | | | 14.9 | % | Publishing rights amortization | | 46,238 | | | 61,351 | | | (15,113 | ) | | (24.6 | )% | | | 26,557 | | | | 34,713 | | | | (8,156 | ) | | | (23.5 | )% | Pre-publication amortization | | 126,038 | | | 130,243 | | | (4,205 | ) | | (3.2 | )% | | | 149,515 | | | | 109,257 | | | | 40,258 | | | | 36.8 | % | | | | | | | | | | | | | | | Cost of sales | | 790,078 | | | 802,309 | | | (12,231 | ) | | (1.5 | )% | | | 844,180 | | | | 725,437 | | | | 118,743 | | | | 16.4 | % | Selling and administrative | | 654,860 | | | 699,544 | | | (44,684 | ) | | (6.4 | )% | | | 662,606 | | | | 649,295 | | | | 13,311 | | | | 2.1 | % | Other intangible asset amortization | | 30,748 | | | �� | 26,750 | | | 3,998 | | | 14.9 | % | | | 25,310 | | | | 26,933 | | | | (1,623 | ) | | | (6.0 | )% | Impairment charge forpre-publication costs and intangible assets | | 3,980 | | | 139,205 | | | (135,225 | ) | | NM | | | Restructuring | | 40,653 | | | | — | | | 40,653 | | | NM | | | Severance and other charges | | 713 | | | 15,650 | | | (14,937 | ) | | NM | | | | | | | | | | | | | | | | | Restructuring/severance and other charges | | | | 21,742 | | | | 11,478 | | | | 10,264 | | | | 89.4 | % | Gain on sale of assets | | | | — | | | | (201 | ) | | | 201 | | | NM | | Operating loss | | (113,521 | ) | | (310,773 | ) | | 197,252 | | | 63.5 | % | | | (163,164 | ) | | | (90,525 | ) | | | (72,639 | ) | | | (80.2 | )% | | | | | | | | | | | | | | | Other expense: | | | | | | | | | | Other income (expense): | | | | | | | | | | | | | | | | | | Retirement benefits non-service income | | | | 167 | | | | 1,280 | | | | (1,113 | ) | | | (87.0 | )% | Interest expense | | (42,805 | ) | | (39,181 | ) | | (3,624 | ) | | (9.2 | )% | | | (48,778 | ) | | | (45,680 | ) | | | (3,098 | ) | | | (6.8 | )% | Interest income | | 1,338 | | | 518 | | | 820 | | | NM | | | | 3,157 | | | | 2,550 | | | | 607 | | | | 23.8 | % | Change in fair value of derivative instruments | | 1,366 | | | (614 | ) | | 1,980 | | | NM | | | | (899 | ) | | | (1,374 | ) | | | 475 | | | | 34.6 | % | | | | | | | | | | | | | | | Loss before taxes | | (153,622 | ) | | (350,050 | ) | | 196,428 | | | 56.1 | % | | Income tax benefit | | (50,435 | ) | | (65,492 | ) | | 15,057 | | | 23.0 | % | | | | | | | | | | | | | | | | Income from transition services agreement | | | | 4,248 | | | | 1,889 | | | | 2,359 | | | NM | | Loss on extinguishment of debt | | | | (4,363 | ) | | | — | | | | (4,363 | ) | | NM | | Loss from continuing operations before taxes | | | | (209,632 | ) | | | (131,860 | ) | | | (77,772 | ) | | | (59.0 | )% | Income tax expense (benefit) | | | | 4,201 | | | | 5,597 | | | | (1,396 | ) | | | (24.9 | )% | Net loss from continuing operations | | | $ | (213,833 | ) | | $ | (137,457 | ) | | $ | (76,376 | ) | | | (55.6 | )% | Income from discontinued operations, net of tax | | | | — | | | | 12,833 | | | | (12,833 | ) | | NM | | Gain on sale of discontinued operations, net of tax | | | | — | | | | 30,469 | | | | (30,469 | ) | | NM | | Net loss | | $ | (103,187 | ) | | $ | (284,558 | ) | | $ | 181,371 | | | 63.7 | % | | $ | (213,833 | ) | | $ | (94,155 | ) | | $ | (119,678 | ) | | NM | | | | | | | | | | | | | | | |
NM = not meaningful Net sales for the year ended December 31, 20172019 increased $34.8$68.3 million, or 2.5%5.2%, from $1,372.7$1,322.4 million for the same period in 20162018 to $1,407.5$1,390.7 million. The net sales increase was driven by an $18.9 million increase in our Trade Publishing segment and a $15.9$88.0 million increase in our Education segment, during the current period. Withinoffset by a $19.7 million decrease in our Trade business, the increase was primarily due to sales of the Whole30series and Tim Ferriss’Tribe of Mentors and Tools of Titans, stronger eBook sales, such asThe Handmaid’s Taleand 1984, and backlist print title sales, such asThe Polar Express andThe Giver,along with a lower product return rate and higher 35
subrights income.HMH Books & Media segment. Within our Education segment, the increase was primarily due to greaterhigher net sales from our Extension businesses,in Extensions, which primarily consist of our Heinemann brand, intervention supplemental and assessmentsupplemental products as well as professional services. Extension businessesservices, which increased by $47.0 million from $585.0 million in 2018 to $632.0 million. Within Extensions, Heinemann net sales forcontinued to grow driven by sales of the current periodFountas & Pinnell Classroom and Calkins products. Such net sales were partially offset by lower intervention and supplemental product sales within Extensions. Further, net sales from Core Solutions increased $22.0by $41.0 million from $565.0$538.0 million in 20162018 to $587.0 million primarily driven by higher Heinemann and supplemental net sales in 2017.$579.0 million. The primary driversdriver of the increase in our HeinemannCore Solutions were net sales of the Texas and national versions of the Into Reading and Into Literature programs. Our billings associated with our Education segment increased approximately $298.0 million from 2018; however, due to the digital and print subscription nature of our offerings, a substantial portion of such billings were deferred and will be recognized in the future. Within our HMH Books & Media segment, the decrease in net sales was primarily due to 2018 licensing income of $16.0 million, pertaining to our classic backlist titles 1984 and Animal Farm, which did not repeat in 2019. Further, the prior year benefited from strong net sales of Classroom Libraries along with the introduction ofFountas & Pinnell Classroom product. The primary drivers of the increase in our supplemental net sales were sales of custom book bundles. Also within our Extension businesses, assessmentprint titles Instant Pot Miracle and intervention net sales declined year over year, offsetting a portion of the above increases.TheWhole 30 series. Partially offsetting the aforementioned was an increase in our Extension businesses net sales were lower Core Solutions sales, inclusive of international sales, which declined by $6.0 million from $642.0 million in the 2016 period to $636.0 million in the current period. The primary drivers of the decrease in our Core Solutions business were lower ReadingLittle Blue Truck series and Math programstrong net sales in open territory states, lower Math program sales in adoption states and lower sales from our international business, primarily dueof the frontlist title Maybe You Should Talk to a large Department of Defense order in 2016 not repeating in 2017. Partially offsetting the decrease in Core Solutions net sales was a $5.0 millionone-time fee we recognized in 2017 in connection with the expiration of a distribution agreement.Someone.
33
Operating loss for the year ended December 31, 2017 favorably2019 unfavorably changed by $197.3$72.6 million from a loss of $310.8$90.5 million for the same period in 20162018 to a loss of $113.5$163.2 million, due primarily to the following: A reduction in Impairment charge forpre-publication costs and intangible assets of $135.2 million. In 2016, we incurred an impairment charge pertaining to certain tradenames within the education business due to a strategic decision to gradually migrate away from specific imprints, primarily Holt McDougal, and our various supplemental brands, in favor of branding our products under the HMH and Houghton Mifflin Harcourt names. In 2017, we impaired $4.0 million ofpre-publication costs for products that will not have sales in future periods, | • | A $86.6 million increase in our cost of sales, excluding publishing rights and pre-publication amortization, from $581.5 million for the same period in 2018 to $668.1 million. Our cost of sales, excluding publishing rights and pre-publication amortization, as a percentage of sales, increased to 48.0% from 44.0% due to our mix of products, increased inventory obsolescence in connection with our strategic transformation plan and an increase in royalties due to higher billings, |
| • | A $30.5 million increase in net amortization expense related to publishing rights, pre-publication and other intangible assets, primarily due to an increase in pre-publication amortization attributed to the timing of 2019 major product releases, partially offset by our use of accelerated amortization methods for publishing rights amortization, |
| • | A $10.3 million increase in restructuring/severance and other charges due to our 2019 Restructuring Plan actions and other 2019 activity, |
| • | A $13.3 million increase in selling and administrative expenses, primarily due to higher labor costs of $14.6 million, mainly attributable to support the increased billings, which increased $277.0 million from 2018. Further, there was an increase of variable expenses such as an increase in transportation and commissions of $9.7 million due to product mix and higher billings. Partially offsetting the increase in selling and administrative expenses was lower depreciation expense of $11.0 million and lower fixed costs, and |
| • | Partially offset by a $68.3 million increase in net sales. |
An increase in net sales of $34.8 million,
A $44.7 million decrease in selling and administrative costs primarily due to lower professional fees of $18.9 million (of which $10.0 million relates to legal settlement costs for copyright litigation during the prior year period coupled with a net $3.6 million insurance reimbursement during the 2017 period), a reduction of internal and outside labor related costs of $18.9 million, and lower discretionary expense such as promotion and travel and entertainment expenses of $15.8 million, all largely due to actions taken under the 2017 Restructuring Plan. Additionally, variable expenses such as samples, transportation and depository fees were $7.6 million lower in the period, and fixed costs and depreciation were $6.8 million lower. The decrease in selling and administrative costs was partially offset by $18.6 million of higher commission expense and annual incentive plan compensation due to greater achievement of targeted levels than in the prior-year period, and $4.4 million of higher office lease cost due to the expiration of favorable office leases,
A $15.3 million net reduction in amortization expense related to publishing rights,pre-publication and other intangible assets, primarily due to our use of accelerated amortization methods for publishing rights amortization, partially offset by the amortization of certain previously unamortized tradenames, due to a change in estimate of their useful lives during the fourth quarter of 2016,
A $14.9 million reduction in severance and other charges as the majority of such expenses during the 2017 period were under our 2017 Restructuring Plan and have been included within the restructuring line item,
Partially offsetting the favorable change in operating loss was a $40.7 million charge associated with our 2017 Restructuring Plan, which includes severance and terminationRetirement benefits of $16.2 million, real estate consolidation costs of $7.9 million, implementation costs of $7.5 million and an impairment charge related to a certain long-lived asset included within property, plant, and equipment of $9.1 million, and
36
Our cost of sales, excluding publishing rights andpre-publication amortization, increased $7.1 million of which $15.5 million is attributed to higher sales volume offset by $8.4 million of improved profitability as our cost of sales, excluding publishing rights andpre-publication amortization, as a percentage of net sales decreased to 43.9% from 44.5% due to product mix, increased Trade eBook sales, and a $5.0 millionone-time fee we recognized associated with the expiration of distribution agreement that did not carry any cost of sales.
Interest expensenon-service income for the year ended December 31, 2017 increased $3.62019 changed unfavorably by $1.1 million or 9.2%, from $39.2 milliondue to the lowering of the expected return on plan assets assumption and greater interest costs in the calculation of net periodic benefit cost in 2019.
Interest expense for the same periodyear ended December 31, 2019 increased $3.1 million from $45.7 million in 20162018 to $42.8$48.8 million, primarily due to $4.1an increase in interest on the previous term loan facility of $4.2 million due to an increase in variable interest rates coupled with our debt refinancing during the fourth quarter of 2019 in which the previous term loan facility was replaced with the new term loan facility and the notes with higher interest rates (the “2019 Refinancing”). Partially offsetting the aforementioned was a reduction of $1.2 million of net settlement payments on our interest rate derivative instruments during the current period, offset by the lower outstanding balance on our term loan facility.2019. Interest income for the year ended December 31, 20172019 increased $0.8$0.6 million from $0.5$2.6 million for the same period in 20162018 to $1.3$3.2 million, primarily due to increaseshigher cash balances invested in interest rates on our investments.money market funds in 2019. Change in fair value of derivative instruments for the year ended December 31, 20172019 favorably changed by $2.0$0.5 million from a loss of $0.6 million for the same period in 2016 to a gain of $1.4 million in 2017.2018 to a loss of $0.9 million. The change in fair value of derivative instruments was related to foreign exchange forward contracts executed on the Euro that were favorably impacted by the weakerweakening of the U.S. dollar against the Euro.Euro compared to the prior year. Income tax benefitfrom transition services agreement for the year ended December 31, 2017 decreased $15.12019 increased by $2.4 million from 2018 as the prior year included one quarter of income and was related to transition service fees under the transition services agreement with the purchaser of the Riverside Business pursuant to which we performed certain support functions through September 30, 2019. Loss on extinguishmentof debt for the year ended December 31, 2019 consisted of a benefit$3.4 million write-off related to unamortized deferred financing fees associated with the portion of $65.5our previous term loan facility that was accounted for as an extinguishment. Further, there was a $1.0 million write off of the remaining balance of the debt discount associated with the previous term loan facility. 34
Income tax expense for the year ended December 31, 2019 decreased $1.4 million, from $5.6 million in 20162018, to a benefit of $50.4 million in 2017. $4.2 million. The 20172019 and 2018 income tax benefitexpense was primarily related to the following effects of U.S. tax reform: A $31.5 million benefit related to the remeasurement of U.S. net deferred tax liabilities associated with indefinite-lived intangible assets to reflect the change in U.S. corporate tax rate from 35% to 21%, and
A $40.4 million benefit related to the release of valuation allowance due to the Company’s ability to utilize indefinite-lived deferred tax liabilities as a source of future taxable income in its assessment of realization of deferred tax assets. This is a result of the U.S. tax law change that would extend net operating losses generated in taxable years beginning after December 31, 2017 to an unlimited carryforward period subject to an 80% utilization against future taxable earnings.
The 2017 income tax benefit was partially offset by movement in the deferred tax liability associated with tax amortization on indefinite-lived intangibles, and state and foreign taxes. The 2016 income tax benefit was primarily related to a change from indefinite-lived intangibles to definite-lived, partially offset by movement in the deferred tax liability associated with tax amortization on indefinite-lived intangibles, and state and foreign taxes. For both periods, the income tax benefit was impacted by certain discrete tax items including the accrual of potential interest and penalties on uncertain tax positions. Including the effects of these discrete items, the effective tax rate was 32.8%(2.0)% and 18.7% for years ended December 31, 2017 and 2016.
37
Consolidated Operating Results for the Years Ended December 31, 2016 and 2015
| | | | | | | | | | | | | | | | | | (dollars in thousands) | | Year
Ended
December 31,
2016 | | | Year
Ended
December 31,
2015 | | | Dollar
change | | | Percent
Change | | Net sales | | $ | 1,372,685 | | | $ | 1,416,059 | | | $ | (43,374 | ) | | | (3.1 | )% | | | | | | Costs and expenses: | | | | | | | | | | | | | | | | | Cost of sales, excluding publishing rights andpre-publication amortization | | | 610,715 | | | | 622,668 | | | | (11,953 | ) | | | (1.9 | )% | Publishing rights amortization | | | 61,351 | | | | 81,007 | | | | (19,656 | ) | | | (24.3 | )% | Pre-publication amortization | | | 130,243 | | | | 120,506 | | | | 9,737 | | | | 8.1 | % | | | | | | | | | | | | | | | | | | Cost of sales | | | 802,309 | | | | 824,181 | | | | (21,872 | ) | | | (2.7 | )% | Selling and administrative | | | 699,544 | | | | 681,124 | | | | 18,420 | | | | 2.7 | % | Other intangible asset amortization | | | 26,750 | | | | 22,038 | | | | 4,712 | | | | 21.4 | % | Impairment charge for intangible assets | | | 139,205 | | | | — | | | | 139,205 | | | | NM | | Severance and other charges | | | 15,650 | | | | 4,767 | | | | 10,883 | | | | NM | | | | | | | | | | | | | | | | | | | Operating loss | | | (310,773 | ) | | | (116,051 | ) | | | (194,722 | ) | | | NM | | | | | | | | | | | | | | | | | | | Other expense: | | | | | | | | | | | | | | | | | Interest expense | | | (39,181 | ) | | | (32,254 | ) | | | (6,927 | ) | | | (21.5 | )% | Interest income | | | 518 | | | | 209 | | | | 309 | | | | NM | | Change in fair value of derivative instruments | | | (614 | ) | | | (2,362 | ) | | | 1,748 | | | | 74.0 | % | Loss on debt extinguishment | | | — | | | | (3,051 | ) | | | 3,051 | | | | NM | | | | | | | | | | | | | | | | | | | Loss before taxes | | | (350,050 | ) | | | (153,509 | ) | | | (196,541 | ) | | | NM | | Income tax expense (benefit) | | | (65,492 | ) | | | (19,640 | ) | | | (45,852 | ) | | | NM | | | | | | | | | | | | | | | | | | | Net loss | | $ | (284,558 | ) | | $ | (133,869 | ) | | $ | (150,689 | ) | | | NM | | | | | | | | | | | | | | | | | | |
NM = not meaningful
Net sales for the year ended December 31, 2016 decreased $43.4 million, or 3.1%, from $1,416.1 million for the same period in 2015 to $1,372.7 million. The net sales decrease was driven by a decline in the Company’s Core Solutions and supplemental education business net sales of $108.0 million due to a smaller new adoption market in 2016 versus 2015 coupled with lower market share and $21.0 million of lower net sales from the assessment business, primarily clinical, due to natural attrition of sales over time following the initial release of a new product version. Partially offsetting this decrease was a $49.0 million incremental contribution from the EdTech business acquired in May 2015. Further, there was an $18.0 million increase in net sales of our Heinemann intervention and professional publishing products, an $11.0 million increase in net sales of the international business due primarily to Department of Defense sales, and to a lesser extent, greater sales in Asia Pacific.
Operating loss for the year ended December 31, 2016 unfavorably changed $194.7 million from a loss of $116.1 million for the same period in 2015 to a loss of $310.8 million, due primarily to the following:
A $139.2 million impairment charge for intangible assets pertaining to certain tradenames within the education business as the Company has made a strategic decision to gradually migrate away from specific imprints, primarily Holt McDougal and our various supplemental brands, in favor of branding our products under the HMH and Houghton Mifflin Harcourt names,
A $18.4 million increase in selling and administrative costs primarily due to higher fixed and discretionary expenses attributed to the full-year effect of the EdTech business, primarily with respect to internal and external labor and higher depreciation, coupled with higher office lease cost due to the expiration of favorable office leases. Partially offsetting the increase were $19.0 million
38
| of lower commission expenses in 2016 versus the prior period due to the sales performance shortfall. Further offsetting the increase was $4.7 million of lower transactional expenses relating to legal settlements and integration activity in 2016 as compared to 2015 where we incurred $30.1 million of transaction expenses relating to equity, acquisition and integration activity,
|
Additionally, there was a $10.9 million increase in severance and other charges attributed to changes in executive management as well as cost-reduction activities in 2016,
Partially offsetting the aforementioned was a $5.2 million net reduction in amortization expense related to publishing rights,pre-publication costs, and other intangible assets, due primarily to our use of accelerated amortization methods for publishing rights amortization, partially offset by the amortization of certain tradenames, previously unamortized, due to a change in estimate of the useful lives, and
Our cost of sales, excluding publishing rights andpre-publication amortization, decreased $12.0 million of which $19.1 million of the decrease is attributed to lower volume partially offset by $7.1 million as our cost of sales, excluding publishing rights andpre-publication amortization, as a percent of net sales increased to 44.5% from 44.0% due to product mix, as we sold more product carrying higher cost this year and had higher technology costs to support our digital products.
Interest expense for the year ended December 31, 2016 increased $6.9 million, or 21.5%, from $32.3 million for the same period in 2015 to $39.2 million, primarily as a result of the increase to our outstanding term loan facility from $243.1 million to $800.0 million, all of which was drawn at closing of the EdTech acquisition in May 2015. Further, interest expense increased $1.2 million in 2016 due to our interest rate derivative contracts.
Interest income for the year ended December 31, 2016 increased $0.3 million, from $0.2 million for the same period in 2015 to $0.5 million, primarily as a result of the increased investment in money market accounts and short term investments.
Change in fair value of derivative instruments for the year ended December 31, 2016 favorably changed by $1.7 million from an expense of $2.4 million in 2015 to an expense of $0.6 million in 2016. The current year loss on change in fair value of derivative instruments was related to unfavorable foreign exchange forward and option contracts executed on the Euro that were unfavorably impacted by the stronger U.S. dollar against the Euro. Although a similar instance existed in the prior year, the change of the U.S dollar against the Euro was greater than the current year based on the timing of the execution of the derivative instruments.
Loss on extinguishment of debt for the year ended December 31, 2015 consisted of a $2.2 millionwrite-off of the portion of the unamortized deferred financing fees associated with the portion of our previous term loan facility accounted for as an extinguishment. Further, there was a $0.9 millionwrite-off of the portion of the unamortized deferred financing fees associated with the portion of our previous revolving credit facility which was also accounted for as an extinguishment.
Income tax benefit for the year ended December 31, 2016 increased $45.9 million from a benefit of $19.6 million for the same period in 2015 to a benefit of $65.5 million in 2016. The 2016 income tax benefit was primarily related to a change from indefinite-lived intangibles to definite-lived, partially offset by movement in the deferred tax liability associated with tax amortization on indefinite-lived intangibles, and state and foreign taxes. The income tax benefit of $19.6 million for the year ended December 31, 2015 was primarily related to a $34.9 million release of an accrual for uncertain tax positions due to the lapsing of the statute, partially offset by movement in the deferred tax liability associated with tax amortization on indefinite-lived intangibles, and state and foreign taxes. For both periods, the income tax benefit was impacted by certain discrete tax items including the accrual of potential interest and penalties on uncertain tax positions. Including the tax effects of these discrete tax items, the effective tax rate was 18.7% and 12.8%(4.2)% for the years ended December 31, 20162019 and 2015,2018, respectively.
39
Adjusted EBITDA From Continuing Operations To supplement our financial statements presented in accordance with GAAP, we have presented Adjusted EBITDA from continuing operations, which is not prepared in accordance with GAAP. This information should be considered as supplemental in nature and should not be considered in isolation or as a substitute for the related financial information prepared in accordance with GAAP. Management believes that the presentation of Adjusted EBITDA provides useful information to investors regarding our results of operations because it assists both investors and management in analyzing and benchmarking the performance and value of our business. Adjusted EBITDA provides an indicator of general economic performance that is not affected by debt restructurings, fluctuations in interest rates or effective tax rates,non-cash charges, or levels of depreciation or amortization along with costs such as severance, separation and facility closure costs, acquisition-relatedinventory obsolescence related to our strategic transformation plan, acquisition/disposition-related activity costs, restructuring costs and integration costs. Accordingly, our management believes that this measurement is useful for comparing general operating performance from period to period. In addition, targets in Adjusted EBITDA (further adjusted to include changes in deferred revenue) are used as performance measures to determine certain compensation of management, and Adjusted EBITDA is used as the base for calculations relating to incurrence covenants in our debt agreements. Other companies may define Adjusted EBITDA differently and, as a result, our measure of Adjusted EBITDA may not be directly comparable to Adjusted EBITDA of other companies. Although we use Adjusted EBITDA as a financial measure to assess the performance of our business, the use of Adjusted EBITDA is limited because it does not include certain material costs, such as interest and taxes, necessary to operate our business. Adjusted EBITDA should be considered in addition to, and not as a substitute for, net loss/income in accordance with GAAP as a measure of performance. Adjusted EBITDA is not intended to be a measure of liquidity or free cash flow for discretionary use. You are cautioned not to place undue reliance on Adjusted EBITDA. Below is a reconciliation of our net loss from continuing operations to Adjusted EBITDA from continuing operations for the years ended December 31, 2017, 20162019 and 2015:2018: | | | | | | | | | | | | | | | | Years Ended December 31, | | | | | 2017 | | | 2016 | | | 2015 | | Net loss | | $ | (103,187 | ) | | $ | (284,558 | ) | | $ | (133,869 | ) | Interest expense | | | 42,805 | | | | 39,181 | | | | 32,254 | | Interest income | | | (1,338 | ) | | | (518 | ) | | | (209 | ) | Provision (benefit) for income taxes | | | (50,435 | ) | | | (65,492 | ) | | | (19,640 | ) | Depreciation expense | | | 75,494 | | | | 79,825 | | | | 72,639 | | Amortization expense | | | 203,024 | | | | 218,344 | | | | 223,551 | | Non-cash charges—stock-compensation | | | 10,828 | | | | 10,567 | | | | 12,452 | | Non-cash charges—(gain) loss on derivative instruments | | | (1,366 | ) | | | 614 | | | | 2,362 | | Non-cash charges—asset impairment charges | | | 3,980 | | | | 139,205 | | | | — | | Purchase accounting adjustments | | | — | | | | 5,116 | | | | 7,487 | | Fees, expenses or charges for equity offerings, debt or acquisitions | | | 1,464 | | | | 1,123 | | | | 25,562 | | 2017 Restructuring Plan | | | 40,653 | | | | — | | | | — | | Restructuring/Integration | | | — | | | | 14,364 | | | | 4,572 | | Severance, separation costs and facility closures | | | 713 | | | | 15,650 | | | | 4,767 | | Loss on extinguishment of debt | | | — | | | | — | | | | 3,051 | | Legal (reimbursement) settlement | | | (3,633 | ) | | | 10,000 | | | | — | | | | | | | | | | | | | | | Adjusted EBITDA | | $ | 219,002 | | | $ | 183,421 | | | $ | 234,979 | | | | | | | | | | | | | | |
| | Years Ended December 31, | | | | 2019 | | | 2018 | | Net loss from continuing operations | | $ | (213,833 | ) | | $ | (137,457 | ) | Interest expense | | | 48,778 | | | | 45,680 | | Interest income | | | (3,157 | ) | | | (2,550 | ) | Provision for income taxes | | | 4,201 | | | | 5,597 | | Depreciation expense | | | 61,475 | | | | 75,116 | | Amortization expense—film asset | | | 9,835 | | | | 6,057 | | Amortization expense | | | 201,382 | | | | 170,903 | | Non-cash charges—stock-compensation | | | 13,968 | | | | 13,248 | | Non-cash charges— loss on derivative instruments | | | 899 | | | | 1,374 | | Inventory obsolescence related to strategic transformation plan | | | 9,758 | | | | — | | Fees, expenses or charges for equity offerings, debt or acquisitions/dispositions | | | 6,327 | | | | 2,883 | | Restructuring/severance and other charges | | | 21,742 | | | | 11,478 | | Gain on sale of assets | | | — | | | | (201 | ) | Loss on extinguishment of debt | | | 4,363 | | | | — | | Adjusted EBITDA from continuing operations | | $ | 165,738 | | | $ | 192,128 | |
4035
Segment Operating Results Results of Operations—Comparing Years Ended December 31, 2017, 20162019 and 20152018 Education | | | | | | | | | | | | | | | | | | | | | | | | | | | | | | | | Years Ended December 31, | | | 2017 vs. 2016 | | | 2016 vs. 2015 | | | | | | Dollar
change | | | Percent
change | | | Dollar
change | | | Percent
change | | | | | 2017 | | | 2016 | | | 2015 | | | | | | Net sales | | $ | 1,222,971 | | | $ | 1,207,070 | | | $ | 1,251,122 | | | $ | 15,901 | | | | 1.3 | % | | $ | (44,052 | ) | | | (3.5 | )% | Costs and expenses: | | | | | | | | | | | | | | | | | | | | | | | | | | | | | Cost of sales, excluding publishing rights andpre-publication amortization | | | 502,209 | | | | 498,991 | | | | 511,706 | | | | 3,218 | | | | 0.6 | % | | | (12,715 | ) | | | (2.5 | )% | Publishing rights amortization | | | 38,721 | | | | 52,660 | | | | 71,109 | | | | (13,939 | ) | | | (26.5 | )% | | | (18,449 | ) | | | (25.9 | )% | Pre-publication amortization | | | 125,670 | | | | 129,836 | | | | 119,894 | | | | (4,166 | ) | | | (3.2 | )% | | | 9,942 | | | | 8.3 | % | | | | | | | | | | | | | | | | | | | | | | | | | | | | | | Cost of sales | | | 666,600 | | | | 681,487 | | | | 702,709 | | | | (14,887 | ) | | | (2.2 | )% | | | (21,222 | ) | | | (3.0 | )% | Selling and administrative | | | 520,354 | | | | 545,433 | | | | 534,477 | | | | (25,079 | ) | | | (4.6 | )% | | | 10,956 | | | | 2.0 | % | Other intangible asset amortization | | | 24,936 | | | | 23,250 | | | | 18,840 | | | | 1,686 | | | | 7.3 | % | | | 4,410 | | | | 23.4 | % | Impairment charge forpre-publication costs and intangible assets | | | 3,980 | | | | 139,205 | | | | — | | | | (135,225 | ) | | | (97.1 | )% | | | 139,205 | | | | NM | | | | | | | | | | | | | | | | | | | | | | | | | | | | | | | Operating income (loss) | | $ | 7,101 | | | $ | (182,305 | ) | | $ | (4,904 | ) | | $ | 189,406 | | | | NM | | | $ | (177,401 | ) | | | NM | | | | | | | | | | | | | | | | | | | | | | | | | | | | | | | Net income (loss) | | $ | 7,101 | | | $ | (182,305 | ) | | $ | (4,904 | ) | | $ | 189,406 | | | | NM | | | $ | (177,401 | ) | | | NM | | | | | | | | | | | | | | | | | | | | | | | | | | | | | | | Adjustments from net income (loss) to Education segment Adjusted EBITDA | | | | | | | | | | | | | | | | | | | | | | | | | | | | | Depreciation expense | | $ | 53,192 | | | $ | 57,910 | | | $ | 56,960 | | | $ | (4,718 | ) | | | (8.1 | )% | | $ | 950 | | | | 1.7 | % | Amortization expense | | | 189,327 | | | | 205,746 | | | | 209,843 | | | | (16,419 | ) | | | (8.0 | )% | | | (4,097 | ) | | | (2.0 | )% | Non-cash charges—asset impairment charges | | | 3,980 | | | | 139,205 | | | | — | | | | (135,225 | ) | | | (97.1 | )% | | | 139,205 | | | | NM | | Purchase accounting adjustments | | | — | | | | 5,116 | | | | 7,487 | | | | (5,116 | ) | | | NM | | | | (2,371 | ) | | | (31.7 | )% | | | | | | | | | | | | | | | | | | | | | | | | | | | | | | Education segment Adjusted EBITDA | | $ | 253,600 | | | $ | 225,672 | | | $ | 269,386 | | | $ | 27,928 | | | | 12.4 | % | | $ | (43,714 | ) | | | (16.2 | )% | | | | | | | | | | | | | | | | | | | | | | | | | | | | | | Education segment Adjusted EBITDA as a % of net
sales | | | 20.7 | % | | | 18.7 | % | | | 21.5 | % | | | | | | | | | | | | | | | | | | | | | | | | | | | | | | | | | | | | | | | | | | | | | |
| | | | | | | | | | 2019 vs. 2018 | | | | Years Ended December 31, | | | Dollar | | | Percent | | | | 2019 | | | 2018 | | | change | | | change | | Net sales | | $ | 1,210,646 | | | $ | 1,122,689 | | | $ | 87,957 | | | | 7.8 | % | Costs and expenses: | | | | | | | | | | | | | | | | | Cost of sales, excluding publishing rights and pre-publication amortization | | | 547,094 | | | | 451,195 | | | | 95,899 | | | | 21.3 | % | Publishing rights amortization | | | 20,611 | | | | 28,059 | | | | (7,448 | ) | | | (26.5 | )% | Pre-publication amortization | | | 148,850 | | | | 108,953 | | | | 39,897 | | | | 36.6 | % | Cost of sales | | | 716,555 | | | | 588,207 | | | | 128,348 | | | | 21.8 | % | Selling and administrative | | | 520,153 | | | | 518,014 | | | | 2,139 | | | | 0.4 | % | Other intangible asset amortization | | | 19,878 | | | | 20,989 | | | | (1,111 | ) | | | (5.3 | )% | Gain on sale of assets | | | — | | | | (201 | ) | | | 201 | | | NM | | Operating loss from continuing operations | | $ | (45,940 | ) | | $ | (4,320 | ) | | $ | (41,620 | ) | | NM | | Net loss from continuing operations | | $ | (45,940 | ) | | $ | (4,320 | ) | | $ | (41,620 | ) | | NM | | Adjustments from net loss from continuing operations to Education segment Adjusted EBITDA | | | | | | | | | | | | | | | | | Depreciation expense | | $ | 43,749 | | | $ | 57,124 | | | $ | (13,375 | ) | | | (23.4 | )% | Amortization expense | | | 189,340 | | | | 158,001 | | | | 31,339 | | | | 19.8 | % | Inventory obsolescence related to strategic transformation plan | | | 9,758 | | | | — | | | | 9,758 | | | NM | | Gain on sale of assets | | | — | | | | (201 | ) | | | 201 | | | NM | | Education segment Adjusted EBITDA | | $ | 196,907 | | | $ | 210,604 | | | $ | (13,697 | ) | | | (6.5 | )% |
NM = not meaningful Our Education segment net sales for the year ended December 31, 20172019 increased $15.9$88.0 million, or 1.3%7.8%, from $1,207.1$1,122.7 million for the same period in 20162018 to $1,223.0$1,210.6 million. The net sales increase was primarily due to greaterhigher net sales from our Extension businesses,in Extensions, which primarily consist of our Heinemann brand, intervention supplemental and assessmentsupplemental products as well as professional services. Extension businessesservices, which increased by $47.0 million from $585.0 million in 2018 to $632.0 million. Within Extensions, Heinemann net sales forcontinued to grow, driven by sales of the current periodFountas & Pinnell Classroom and Calkins products. Such net sales were partially offset by lower intervention and supplemental product sales within Extensions. Further, net sales from Core Solutions increased $22.0by $41.0 million from $565.0$538.0 million in the 2016 period2018 to $587.0$579.0 million primarily driven by higher Heinemann and supplemental net sales.in 2019. The primary driversdriver of the increase in our Heinemann net sales were sales of our Classroom Libraries offering along with the introduction of ourFountas & Pinnell Classroom 41
product. The primary drivers of the increase in our supplemental net sales for the year ended December 31, 2017, were sales of custom book bundles. Also within our Extension businesses, our assessment and intervention net sales declined year over year, offsetting a portion of the above increases. Partially offsetting the increase in our Extension businesses net sales were lower Core Solutions sales, inclusive of international sales, which declined by $6.0 million from $642.0 million in the 2016 period to $636.0 million. The primary drivers behind the decrease in our Core Solutions business were lower net sales of open territory programs, Core Solutions math programs across adoption states and lower sales from our international business, primarily due to a large Department of Defense order in the prior year not repeating in 2017. Partially offsetting the decrease in Core Solutions net sales was a $5.0 millionone-time fee we recognized in connection with the expiration of a distribution agreement.
Our Education segment net sales for the year ended December 31, 2016 decreased $44.1 million, or 3.5%, from $1,251.1 million for the same period in 2015 to $1,207.1 million. The net sales decrease was driven by a decline in the Company’s Core Solutions and supplemental education business net sales of $108.0 million due to a smaller new adoption market in 2016 versus 2015 coupled with lower market share, and $21.0 million of lower net sales from the assessment business, primarily clinical, due to natural attrition of sales over time following the initial release of a new product version. Partially offsetting this decrease was a $49.0 million incremental contribution from the EdTech business, which was acquired in May 2015. Further, there was an $18.0 million increase in net sales of our Heinemann intervention and professional publishing products, an $11.0 million increase in net sales of the international businessTexas and national versions of the Into Reading and Into Literature programs. Our billings associated with our Education segment increased $298.0 million from 2018; however, due primarily to Departmentthe digital and print subscription nature of Defense sales,our offerings, a substantial portion of such billings were deferred and to a lesser extent, greater saleswill be recognized in Asia Pacific.the future.
Our Education segment cost of sales for the year ended December 31, 2017, decreased $14.92019 increased $128.3 million, or 2.2%21.8%, from $681.5$588.2 million forin 2018 to $716.6 million. Our cost of sales, excluding publishing rights and pre-publication amortization, increased $95.9 million from $451.2 million in 2018 to $547.1 million. Our cost of sales, excluding publishing rights and pre-publication amortization, as a percentage of sales, increased to 45.2% from 36
40.2%, primarily due to our mix of products, increased inventory obsolescence in connection with our strategic transformation plan and an increase in royalties due to higher billings. Pre-publication amortization increased by $39.9 million from 2018 primarily due to the same period in 2016 to $666.6 million.timing of 2019 major product releases. Publishing rights andpre-publication amortization decreased by $18.1$7.4 million from the same period last year primarily due to our use of accelerated amortization methods for publishing rights amortization. Our cost of sales, excluding publishing rights andpre-publication amortization, increased $3.2 million of which $6.6 million is attributed to higher sales volume offset by $3.4 million of improved profitability as our cost of sales, excluding publishing rights andpre-publication amortization, as a percentage of net sales decreased to 41.1% from 41.3%, primarily due to product mix and a $5.0 millionone-time fee we recognized associated with a distribution agreement that did not carry any cost of sales. Our Education segment cost of sales for the year ended December 31, 2016, decreased $21.2 million, or 3.0%, from $702.7 million for the same period in 2015, to $681.5 million. The decrease was attributed to a reduction in our cost of sales, excluding publishing rights andpre-publication amortization of $12.7 million, of which $18.0 million is attributed to lower volume. Our cost of sales, excluding publishing rights andpre-publication amortization, as a percent of net sales increased to 41.3% from 40.9%, resulting in an approximate $5.3 million decrease in profitability primarily attributed to our product mix as we sold more product carrying higher cost this year. Further, there was an $8.5 million reduction in net amortization expense related to publishing rights andpre-publication costs, primarily due to our use of accelerated amortization methods for publishing rights.methods.
Our Education segment selling and administrative expense for the year ended December 31, 2017 decreased $25.12019 increased $2.1 million, or 4.6%0.4%, from $545.4$518.0 million for the same period in 20162018 to $520.4 million. The decrease was driven by a reduction in internal and outside labor related costs of $15.0 million, a reduction in marketing and advertising costs of $6.0 million along with lower travel and entertainment expenses of $3.0 million, primarily as a result of actions taken under the 2017 Restructuring Plan. Further, samples, transportation and depository fees were $9.0 million lower in 2017. The decrease was partially offset by higher incentive compensation, and higher commission expense due to greater achievement levels than in 2016 along with higher office lease cost due to the expiration of favorable office leases. 42
Our Education segment selling and administrative expense for the year ended December 31, 2016 increased $11.0 million, or 2.0%, from $534.5 million for the same period in 2015 to $545.4$520.2 million. The increase was primarily duedriven by higher labor costs and variable expenses such as samples, commissions and travel and entertainment attributed to higher fixed and discretionary expenses attributed to the full year effect of the EdTech business, primarily with respect to internal and external labor, coupled with higher office lease cost due to the expiration of favorable office leases. Partially offsetting the increase are $19.0 million of lower commission expenses in 2016 versusbillings from the prior period due to the sales performance shortfall.year.
Our Education segment other intangible asset amortization expense for the year ended December 31, 2017 increased $1.72019 decreased $1.1 million from the same period in 2016, which was related to the amortization of certain previously unamortized tradenames,2018, due to a change in estimate of their useful lives during the fourth quarter of 2016, partially offset by decline of other existing intangible assets. Our Education segment other intangible asset amortization expense for the year ended December 31, 2016 increased $4.4 million from the same period in 2015, which was related to the amortization of certain previously unamortized tradenames, due to a change in estimate of their useful lives during the fourth quarter of 2016, offset by our use of accelerated amortization methods.
Our Education segment impairment charge forpre-publication costs and intangible assets decreased $135.2 million in 2017 from the same period in 2016. In 2016, the impairment charge of $139.2 million was for intangible assets, as the Company made the strategic decision to gradually migrate away from specific imprints, primarily Holt McDougal and various supplemental brands, in favor of branding our products under the HMH and Houghton Mifflin Harcourt names. In 2017, the impairment charge of $4.0 million was related to a certain program included withinpre-publication costs.
Our Education segment impairment chargepre-publication costs and intangible assets increased $139.2 million in 2016 from no expense for the same period in 2015. The increase is due to an impairment charge for intangible assets, as the Company made the strategic decision to gradually migrate away from specific imprints, primarily the Holt McDougal and our various supplemental brands, in favor of branding our products under the HMH and Houghton Mifflin Harcourt names.
Our Education segment Adjusted EBITDA for the year ended December 31, 2017, improved $27.92019 decreased $13.7 million, or 12.4%6.5%, from $225.7 million for the same period in 2016 to $253.6$210.6 million in 2017.2018 to $196.9 million. Our Education segment Adjusted EBITDA excludes depreciation, amortization, asset impairment chargesinventory obsolescence related to our strategic transformation plan and purchase accounting adjustments.gain on sale of assets. The 2016 purchase accounting adjustments primarily relate to a 2015 acquisition. The increasedecrease is due to the identified factors impacting net sales, cost of sales and selling and administrative expenses after removing those items not included in Education segment Adjusted EBITDA. Education segment Adjusted EBITDA as a percentage of net sales was 20.7% and 18.7% for each of the years ended December 31, 2017 and 2016, respectively. Our Education segment Adjusted EBITDA for the year ended December 31, 2016, decreased $43.7 million, or 16.2%, from $269.4 million for the same period in 2015 to $225.7 million. The purchase accounting adjustments primarily relate to the acquisition of the EdTech business. Education segment Adjusted EBITDA as a percentage of net sales decreased from 21.5% of net sales for the year ended December 31, 2015 to 18.7% for the same period in 2016 due to the identified factors impacting net sales, cost of sales and selling and administrative expense after removing those items not included in Education segment Adjusted EBITDA.
HMH Books & Media 43
Trade Publishing
| | | | | | | | | | 2019 vs. 2018 | | | | Years Ended December 31, | | | Dollar | | | Percent | | | | 2019 | | | 2018 | | | change | | | change | | Net sales | | $ | 180,028 | | | $ | 199,728 | | | $ | (19,700 | ) | | | (9.9 | )% | Costs and expenses: | | | | | | | | | | | | | | | | | Cost of sales, excluding publishing rights and pre-publication amortization | | | 121,014 | | | | 130,272 | | | | (9,258 | ) | | | (7.1 | )% | Publishing rights amortization | | | 5,946 | | | | 6,654 | | | | (708 | ) | | | (10.6 | )% | Pre-publication amortization | | | 665 | | | | 304 | | | | 361 | | | NM | | Cost of sales | | | 127,625 | | | | 137,230 | | | | (9,605 | ) | | | (7.0 | )% | Selling and administrative | | | 55,071 | | | | 54,129 | | | | 942 | | | | 1.7 | % | Other intangible asset amortization | | | 5,432 | | | | 5,944 | | | | (512 | ) | | | (8.6 | )% | Operating (loss) income | | $ | (8,100 | ) | | $ | 2,425 | | | $ | (10,525 | ) | | NM | | Net (loss) income | | $ | (8,100 | ) | | $ | 2,425 | | | $ | (10,525 | ) | | NM | | Adjustments from net (loss) income to HMH Books & Media segment Adjusted EBITDA | | | | | | | | | | | | | | | | | Depreciation expense | | $ | 1,131 | | | $ | 558 | | | $ | 573 | | | NM | | Amortization expense film asset | | | 9,835 | | | | 6,057 | | | | 3,778 | | | | 62.4 | % | Amortization expense | | | 12,042 | | | | 12,902 | | | | (860 | ) | | | (6.7 | )% | HMH Books & Media segment Adjusted EBITDA | | $ | 14,908 | | | $ | 21,942 | | | $ | (7,034 | ) | | | (32.1 | )% |
| | | | | | | | | | | | | | | | | | | | | | | | | | | | | | | | Years Ended December 31, | | | 2017 vs. 2016 | | | 2016 vs. 2015 | | | | | Dollar
change | | | Percent
change | | | Dollar
change | | | Percent
change | | | | 2017 | | | 2016 | | | 2015 | | | | | | Net sales | | $ | 184,540 | | | $ | 165,615 | | | $ | 164,937 | | | $ | 18,925 | | | | 11.4 | % | | $ | 678 | | | | 0.4 | % | Costs and expenses: | | | | | | | | | | | | | | | | | | | | | | | | | | | | | Cost of sales, excluding publishing rights andpre-publication amortization | | | 115,593 | | | | 111,724 | | | | 110,962 | | | | 3,869 | | | | 3.5 | % | | | 762 | | | | 0.7 | % | Publishing rights amortization | | | 7,517 | | | | 8,691 | | | | 9,898 | | | | (1,174 | ) | | | (13.5 | )% | | | (1,207 | ) | | | (12.2 | )% | Pre-publication amortization | | | 368 | | | | 407 | | | | 612 | | | | (39 | ) | | | (9.6 | )% | | | (205 | ) | | | (33.5 | )% | | | | | | | | | | | | | | | | | | | | | | | | | | | | | | Cost of sales | | | 123,478 | | | | 120,822 | | | | 121,472 | | | | 2,656 | | | | 2.2 | % | | | (650 | ) | | | (0.5 | )% | Selling and administrative | | | 53,288 | | | | 48,227 | | | | 47,363 | | | | 5,061 | | | | 10.5 | % | | | 864 | | | | 1.8 | % | Other intangible asset amortization | | | 5,812 | | | | 3,500 | | | | 3,198 | | | | 2,312 | | | | 66.1 | % | | | 302 | | | | 9.4 | % | | | | | | | | | | | | | | | | | | | | | | | | | | | | | | Operating income (loss) | | $ | 1,962 | | | $ | (6,934 | ) | | $ | (7,096 | ) | | $ | 8,896 | | | | NM | | | $ | 162 | | | | 2.3 | % | | | | | | | | | | | | | | | | | | | | | | | | | | | | | | Net income (loss) | | $ | 1,962 | | | $ | (6,934 | ) | | $ | (7,096 | ) | | $ | 8,896 | | | | NM | | | $ | 162 | | | | 2.3 | % | | | | | | | | | | | | | | | | | | | | | | | | | | | | | | Adjustments from net income (loss) to Trade Publishing segment Adjusted EBITDA | | | | | | | | | | | | | | | | | | | | | | | | | | | | | Depreciation expense | | $ | 401 | | | $ | 591 | | | $ | 1,091 | | | $ | (190 | ) | | | (32.1 | )% | | $ | (500 | ) | | | (45.8 | )% | Amortization expense | | | 13,697 | | | | 12,598 | | | | 13,708 | | | | 1,099 | | | | 8.7 | % | | | (1,110 | ) | | | (8.1 | )% | | | | | | | | | | | | | | | | | | | | | | | | | | | | | | Trade Publishing segment Adjusted EBITDA | | $ | 16,060 | | | $ | 6,255 | | | $ | 7,703 | | | $ | 9,805 | | | | NM | | | $ | (1,448 | ) | | | (18.8 | )% | | | | | | | | | | | | | | | | | | | | | | | | | | | | | | Trade Publishing segment Adjusted EBITDA as a % of net sales | | | 8.7 | % | | | 3.8 | % | | | 4.7 | % | | | | | | | | | | | | | | | | | | | | | | | | | | | | | | | | | | | | | | | | | | | | | |
NM = not meaningful Our Trade PublishingHMH Books & Media segment net sales for the year ended December 31, 2017 increased $18.92019 decreased $19.7 million, or 11.4%9.9%, from $165.6$199.7 million for the same period in 20162018 to $184.5$180.0 million. The increasedecrease in net sales was driven by 2017primarily due to 2018 licensing income of $16.0 million, pertaining to our classic backlist titles 1984 and Animal Farm, which did not repeat in 2019. Further, the prior year benefited from strong net sales of the Whole30series andTim Ferriss’ Tribe of Mentors print titles Instant Pot Miracleand Tools of Titans, stronger eBook sales, such asThe Handmaid’s Tale and 1984, and backlist print title sales, such asThe Polar Express andThe Giver, along with favorable product return experience and higher subrights income. Our Trade Publishing segment net sales for the year ended December 31, 2016 increased $0.7 million, or 0.4%, from $164.9 million for the same period in 2015 to $165.6 million. The increase in net sales was driven by increased net sales of frontlist titlesThe Whole30, Tools for Titans, Property BrothersDream Home,and Food Freedom Forever.Whole 30 series. Partially offsetting the aforementioned was a declinean increase in ebook net sales dueof the Little Blue Truck series and strong net sales of the frontlist title Maybe You Should Talk to lower subscriptionsSomeone.
37
Our Trade PublishingHMH Books & Media segment cost of sales for the year ended December 31, 2017 increased $2.72019 decreased $9.6 million, or 2.2%7.0%, from $120.8$137.2 million for the same period in 20162018 to $123.5$127.6 million. Approximately $12.8 millionThe majority of the increasedecrease was driven by higher sales volume, partially offset by $8.9 million of lower costs as our cost of sales, excluding publishing rights andpre-publication amortization, which decreased $9.3 million due primarily to lower royalties as the prior year had higher royalties associated with the licensing income from 1984 and Animal Farm along with lower net sales volume,partially offset by higher film asset amortization from the Carmen Sandiego series. Our cost of sales, excluding publishing rights and pre-publication amortization, as a percentage of net sales, decreasedincreased to 62.6%67.2% from 67.5%65.2%. The decline in rate was due to a product mix partially driven by an increase in eBook sales. Further, the increase in our costs of sales was also slightly offset by $1.2 million of lower amortization expense of publishing rights andpre-publication amortization due to our use of accelerated amortization methods. 44
Our Trade Publishing segment cost of sales for the year ended December 31, 2016 decreased $0.7 million, or 0.5%, from $121.5 million for the same period in 2015 to $120.8 million. The decrease in cost of sales was driven by lower amortization expense of $1.1 million primarily related to publishing rights, which was lower due to our use of accelerated amortization methods. Partially offsetting the decrease was a $0.8 million increase in cost of sales, excluding publishing rights andpre-publication amortization, of which $0.5 million is due to increased sales and $0.3 million is due to our cost of sales, excluding publishing rights andpre-publication amortization, as a percent of sales increasing to 67.5% from 67.3% primarily due to increased royalty costs due to product mix.
Our Trade PublishingHMH Books & Media segment selling and administrative expense for the year ended December 31, 20172019 increased $5.1$0.9 million from $48.2$54.1 million in the same period in 2016,2018, to $53.3$55.1 million. The increase was primarily due to higher transportationmarketing and product management costs associated with increased sales volume along with higher costs to support consumer products, partially offset by a reduction of internal and outside labor related costs and lower discretionary costs, all largely due to actions taken under the 2017 Restructuring Plan. variable expenses. Our Trade PublishingHMH Books & Media segment other intangible asset amortization expense for the year ended December 31, 2017 increased $2.3 million2019 slightly decreased from the same period in 2016, which was related to the amortization of previously unamortized2018 as certain tradenames, due to a change in estimate of the useful livesintangible assets became fully amortized during the fourth quarter of 2016.2019. Our Trade Publishing segment selling and administrative expense for the year ended December 31, 2016 increased $0.9 million, or 1.8%, from $47.4 million for the same period in 2015 to $48.2 million. The increase was primarily related to higher rent expense associated with new office space along with higher bad debt expense, partially offset by lower advertising, promotion expense and development costs. Our Trade PublishingHMH Books & Media segment Adjusted EBITDA for the year ended December 31, 2017 improved $9.8 million,2019 changed unfavorably from $6.3 million for the same period in 2016 to $16.1$21.9 million in 2017. Our Trade Publishing segment Adjusted EBITDA excludes depreciation and amortization costs. Our Trade Publishing segment Adjusted EBITDA as a percentage of net sales was 8.7% for the year ended December 31, 2017, which was a favorable change from 3.8% for the same period in 20162018 to $14.9 million due to the identified factors impacting net sales, cost of sales and selling and administrative expenses after removing those items not included in Trade Publishingour HMH Books & Media segment Adjusted EBITDA.
Our Trade PublishingHMH Books & Media segment Adjusted EBITDA for the year ended December 31, 2016 decreased $1.4 million, from $7.7 million for the same period in 2015 to $6.3 million in 2016. Our Trade Publishing segment Adjusted EBITDA as a percentage of net sales was 3.8% for the year ended December 31, 2016, which decreased from 4.7% for the same period in 2015 due to the identified factors impacting net sales, cost of salesexcludes depreciation and selling and administrative expenses after removing those items not included in segment Adjusted EBITDA. amortization.38 45
Corporate and Other | | | | | | | | | | | | | | | | | | | | | | | | | | | | | | | | | | | 2017 vs. 2016 | | | 2016 vs. 2015 | | | | | Years Ended December 31, | | | Dollar
change | | | Percent
change | | | Dollar
change | | | Percent
change | | | | | 2017 | | | 2016 | | | 2015 | | | | | | Net sales | | $ | — | | | $ | — | | | $ | — | | | $ | — | | | | NM | | | $ | — | | | | NM | | Costs and expenses: | | | | | | | | | | | | | | | | | | | | | Cost of sales, excluding publishing rights andpre-publication amortization | | | — | | | | — | | | | — | | | | — | | | | NM | | | | — | | | | NM | | Publishing rights amortization | | | — | | | | — | | | | — | | | | — | | | | NM | | | | — | | | | NM | | Pre-publication amortization | | | — | | | | — | | | | — | | | | — | | | | NM | | | | — | | | | NM | | | | | | | | | | | | | | | | | | | | | | | | | | | | | | | Cost of sales | | | — | | | | — | | | | — | | | | — | | | | NM | | | | — | | | | NM | | Selling and administrative | | | 81,218 | | | | 105,884 | | | | 99,284 | | | | (24,666 | ) | | | (23.3 | )% | | | 6,600 | | | | 6.6 | % | Restructuring | | | 40,653 | | | | — | | | | — | | | | 40,653 | | | | NM | | | | — | | | | NM | | Severance and other charges | | | 713 | | | | 15,650 | | | | 4,767 | | | | (14,937 | ) | | | (95.4 | )% | | | 10,883 | | | | NM | | | | | | | | | | | | | | | | | | | | | | | | | | | | | | | Operating loss | | $ | (122,584 | ) | | $ | (121,534 | ) | | $ | (104,051 | ) | | $ | (1,050 | ) | | | (0.9 | )% | | $ | (17,483 | ) | | | (16.8 | )% | | | | | | | | | | | | | | | | | | | | | | | | | | | | | | Interest expense | | | (42,805 | ) | | | (39,181 | ) | | | (32,254 | ) | | | (3,624 | ) | | | (9.2 | )% | | | (6,927 | ) | | | (21.5 | )% | Interest income | | | 1,338 | | | | 518 | | | | 209 | | | | 820 | | | | NM | | | | 309 | | | | NM | | Change in fair value of derivative instruments | | | 1,366 | | | | (614 | ) | | | (2,362 | ) | | | 1,980 | | | | NM | | | | 1,748 | | | | 74.0 | % | Loss on extinguishment of debt | | | — | | | | — | | | | (3,051 | ) | | | — | | | | NM | | | | 3,051 | | | | NM | | | | | | | | | | | | | | | | | | | | | | | | | | | | | | | Loss before taxes | | | (162,685 | ) | | | (160,811 | ) | | | (141,509 | ) | | | (1,874 | ) | | | (1.2 | )% | | | (19,302 | ) | | | (13.6 | )% | Income tax (benefit) expense | | | (50,435 | ) | | | (65,492 | ) | | | (19,640 | ) | | | 15,057 | | | | NM | | | | (45,852 | ) | | | NM | | | | | | | | | | | | | | | | | | | | | | | | | | | | | | | Net loss | | $ | (112,250 | ) | | $ | (95,319 | ) | | $ | (121,869 | ) | | $ | (16,931 | ) | | | (17.8 | )% | | $ | 26,550 | | | | 21.8 | % | | | | | | | | | | | | | | | | | | | | | | | | | | | | | | Adjustments from net loss to Corporate and Other Adjusted EBITDA | | | | | | | | | | | | | | | | | | | | | Interest expense | | $ | 42,805 | | | $ | 39,181 | | | $ | 32,254 | | | $ | 3,624 | | | | 9.2 | % | | $ | 6,927 | | | | 21.5 | % | Interest income | | | (1,338 | ) | | | (518 | ) | | | (209 | ) | | | (820 | ) | | | NM | | | | (309 | ) | | | NM | | Provision (benefit) for income taxes | | | (50,435 | ) | | | (65,492 | ) | | | (19,640 | ) | | | 15,057 | | | | NM | | | | (45,852 | ) | | | NM | | Depreciation expense | | | 21,901 | | | | 21,324 | | | | 14,588 | | | | 577 | | | | 2.7 | % | | | 6,736 | | | | 46.2 | % | Non-cash charges—loss on derivative instruments | | | (1,366 | ) | | | 614 | | | | 2,362 | | | | (1,980 | ) | | | NM | | | | (1,748 | ) | | | (74.0 | )% | Non-cash charges—stock-compensation | | | 10,828 | | | | 10,567 | | | | 12,452 | | | | 261 | | | | 2.5 | % | | | (1,885 | ) | | | (15.1 | )% | Fees, expenses or charges for equity offerings, debt or acquisitions | | | 1,464 | | | | 1,123 | | | | 25,562 | | | | 341 | | | | 30.4 | % | | | (24,439 | ) | | | (95.6 | )% | 2017 Restructuring Plan | | | 40,653 | | | | — | | | | — | | | | 40,653 | | | | NM | | | | — | | | | NM | | Restructuring/integration | | | — | | | | 14,364 | | | | 4,572 | | | | (14,364 | ) | | | NM | | | | 9,792 | | | | NM | | Severance separation costs and facility closures | | | 713 | | | | 15,650 | | | | 4,767 | | | | (14,937 | ) | | | (95.4 | )% | | | 10,883 | | | | NM | | Loss on extinguishment of debt | | | — | | | | — | | | | 3,051 | | | | — | | | | NM | | | | (3,051 | ) | | | NM | | Legal (reimbursement) settlement | | | (3,633 | ) | | | 10,000 | | | | — | | | | (13,633 | ) | | | NM | | | | 10,000 | | | | NM | | | | | | | | | | | | | | | | | | | | | | | | | | | | | | | Corporate and Other Adjusted EBITDA | | $ | (50,658 | ) | | $ | (48,506 | ) | | $ | (42,110 | ) | | $ | (2,152 | ) | | | (4.4 | )% | | $ | (6,396 | ) | | | (15.2 | )% | | | | | | | | | | | | | | | | | | | | | | | | | | | | | |
| | | | | | | | | | 2019 vs. 2018 | | | | Years Ended December 31, | | | Dollar | | | Percent | | | | 2019 | | | 2018 | | | change | | | change | | Net sales | | $ | — | | | $ | — | | | $ | — | | | $ | — | | Costs and expenses: | | | | | | | | | | | | | | | | | Cost of sales, excluding publishing rights and pre-publication amortization | | | — | | | | — | | | | — | | | | — | | Publishing rights amortization | | | — | | | | — | | | | — | | | | — | | Pre-publication amortization | | | — | | | | — | | | | — | | | | — | | Cost of sales | | | — | | | | — | | | | — | | | | — | | Selling and administrative | | | 87,382 | | | | 77,152 | | | | 10,230 | | | | 13.3 | % | Restructuring/severance and other charges | | | 21,742 | | | | 11,478 | | | | 10,264 | | | | 89.4 | % | Operating loss | | $ | (109,124 | ) | | $ | (88,630 | ) | | $ | (20,494 | ) | | | (23.1 | )% | Retirement benefits non-service income | | | 167 | | | | 1,280 | | | | (1,113 | ) | | | (87.0 | )% | Interest expense | | | (48,778 | ) | | | (45,680 | ) | | | (3,098 | ) | | | (6.8 | )% | Interest income | | | 3,157 | | | | 2,550 | | | | 607 | | | | 23.8 | % | Change in fair value of derivative instruments | | | (899 | ) | | | (1,374 | ) | | | 475 | | | | 34.6 | % | Income from transition services agreement | | | 4,248 | | | | 1,889 | | | | 2,359 | | | NM | | Loss on extinguishment of debt | | | (4,363 | ) | | | — | | | | (4,363 | ) | | NM | | Loss before taxes | | | (155,592 | ) | | | (129,965 | ) | | | (25,627 | ) | | | (19.7 | )% | Income tax (benefit) expense | | | 4,201 | | | | 5,597 | | | | (1,396 | ) | | | (24.9 | )% | Net loss | | $ | (159,793 | ) | | $ | (135,562 | ) | | $ | (24,231 | ) | | | (17.9 | )% | Adjustments from net loss to Corporate and Other Adjusted EBITDA | | | | | | | | | | | | | | | | | Interest expense | | $ | 48,778 | | | $ | 45,680 | | | $ | 3,098 | | | | 6.8 | % | Interest income | | | (3,157 | ) | | | (2,550 | ) | | | (607 | ) | | | (23.8 | )% | Provision for income taxes | | | 4,201 | | | | 5,597 | | | | (1,396 | ) | | | (24.9 | )% | Depreciation expense | | | 16,595 | | | | 17,434 | | | | (839 | ) | | | (4.8 | )% | Non-cash charges—loss on derivative instruments | | | 899 | | | | 1,374 | | | | (475 | ) | | | (34.6 | )% | Non-cash charges—stock- compensation | | | 13,968 | | | | 13,248 | | | | 720 | | | | 5.4 | % | Fees, expenses or charges for equity offerings, debt or acquisitions/dispositions | | | 6,327 | | | | 2,883 | | | | 3,444 | | | NM | | Restructuring/severance and other charges | | | 21,742 | | | | 11,478 | | | | 10,264 | | | | 89.4 | % | Loss on extinguishment of debt | | | 4,363 | | | | — | | | | 4,363 | | | NM | | Corporate and Other Adjusted EBITDA | | $ | (46,077 | ) | | $ | (40,418 | ) | | $ | (5,659 | ) | | | (14.0 | )% |
46
NM= not meaningful The Corporate and Other category represents certain general overhead costs not fully allocated to the business segments such as but not limited to, legal, accounting, treasury, human resources, technology and executive functions.functions along with restructuring, severance and other non-operating costs. 39
Our selling and administrative expense for the Corporate and Other category for the year ended December 31, 2017 decreased $24.72019 increased $10.2 million, or 23.3%13.3%, from $105.9 million for the same period in 2016 to $81.2 million. The decrease was primarily due to legal settlement costs for permissions litigation of $10.0$77.2 million in 20162018 to $87.4 million, primarily attributed to professional and a subsequent insurance net reimbursement of $3.6 million which occurred in 2017, and lower travel and entertainment expenses. Further, there were lower restructuring/integration costs as 2016 had costsbank fees associated with integration of systemsthe 2019 Refinancing, and to support the 2015 acquisition,some extent planned merit increases and higher stock compensation, partially offsetting the decrease were higher annual incentive plan compensation costs in 2017offset by lower depreciation. Our restructuring/severance and costs under our 2017 Restructuring Plan. Our 2017 Restructuring Planother costs for the year ended December 31, 2017 were $40.72019 increased by $10.3 million which includes severance and terminationprimarily due to 2019 Restructuring Plan activity. Retirement benefits of $16.2 million, real estate consolidation costs of $7.9 million, implementation costs of $7.5 million and an impairment charge related to a certain long-lived asset included within property, plant, and equipment of $9.1 million. Our selling and administrative expense for the Corporate and Other categorynon-service income for the year ended December 31, 2016 increased $6.62019 changed unfavorably by $1.1 million or 6.6%, from $99.3 million for the same period in 2015 to $105.9 million. The increase was primarily due to an increasethe lowering of $6.7 million of higher depreciation as a result of our increased investment in our infrastructure in addition to higher laborthe expected return on plan assets assumption and greater interest costs and higher office lease cost due to the expiration of favorable office leases. The increase was partially offset by legal settlements and integration expenses amounting to $24.4 million in 2016, which were lower by $5.7 million from the $30.1 million of transaction expenses in the prior year related to equity, acquisition and integration activities.calculation of net periodic benefit cost in 2019.
Our interestInterest expense for the Corporate and Other category for the year ended December 31, 20172019 increased $3.6$3.1 million or 9.2%, from $39.2$45.7 million for the same period in 20162018 to $42.8$48.8 million, primarily due to $4.1an increase in interest on the term loan facility of $4.2 million due to an increase in variable interest rates coupled with our 2019 Refinancing. Partially offsetting the aforementioned was a reduction of $1.2 million of net settlement payments on our interest rate derivative instruments during the current period, partially offset by the lower outstanding balance on our term loan facility.
Our interest expense for the Corporate and Other category for the year ended December 31, 2016 increased $6.9 million, or 21.5%, to $39.2 million from $32.3 million for the same period in 2015, primarily as a result of the increase to our outstanding term loan credit facility from $243.1 million to $800.0 million, all of which was drawn at closing of the EdTech acquisition in May 2015. Further, interest expense increased $1.2 million in 2016 due to our interest rate derivative contracts.2019.
Interest income for the year ended December 31, 20172019 increased $0.8$0.6 million from $0.5$2.6 million for the same period in 20162018 to $1.3$3.2 million, primarily due to increases in interest rates on our investments. Interest income for the year ended December 31, 2016 increased $0.3 million, from $0.2 million for the same period in 2015 to $0.5 million, primarily as a result of the increased investmenthigher cash balances invested in money market accounts and short term investments.funds in 2019.
Change in fair value of derivative instruments for the year ended December 31, 20172019 favorably changed by $2.0$0.5 million from a loss of $0.6 million for the same period in 2016 to a gain of $1.4 million in 2017.2018 to a loss of $0.9 million. The change in fair value of derivative instruments was related to foreign exchange forward contracts executed on the Euro that were favorably impacted by the weakerweakening of the U.S. dollar against the Euro.Euro versus the prior year. Change in fair value of derivative instrumentsIncome from transition services agreement for the year ended December 31, 2016 favorably changed2019 increased by $1.7$2.4 million from an expense2018 as the prior year included one quarter of $2.4 million in 2015 to an expense of $0.6 million in 2016. The loss on change in fair value of derivative instrumentsincome and was related to unfavorable foreign exchange forward and option contracts
47
executed ontransition service fees under the Euro that were favorably impacted bytransition services agreement with the stronger U.S. dollar against the Euro. Although a similar instance existed in the prior year, the changepurchaser of the U.S dollar against the Euro was greater than the current year based on the timing of the execution of the derivative instruments.Riverside Business pursuant to which we performed certain support functions through September 30, 2019.
Our lossLoss on extinguishment of debt for the Corporate and Other category for the year ended December 31, 20152019 consisted of a $2.2$3.4 million write off of the portion of thewrite-off related to unamortized deferred financing fees associated with the portion of our previous term loan credit facility that was accounted for as an extinguishment. Further, there was a $0.9$1.0 million write off of the portionremaining balance of the unamortized deferred financing feesdebt discount associated with the portion of our previous revolving credit facility which was also accounted for as an extinguishment.term loan facility.
Income tax benefitexpense for the year ended December 31, 20172019 decreased $15.1$1.4 million from a benefitan expense of $65.5$5.6 million in 20162018 to a benefitan expense of $50.4$4.2 million in 2017. 2019. The 20172019 and 2018 income tax benefitexpense was primarily related to the effects of new tax legislation, commonly referred to as the Tax Cuts and Jobs Act that was enacted on December 22, 2017. As a result of the effects of new tax legislation, the Company recognized a $31.5 million benefit related to the remeasurement of U.S. deferred tax liabilities associated with indefinite-lived intangible assets to reflect the change in U.S. corporate tax rate from 35% to 21% and a $40.4 million benefit related to the release of valuation allowance due to the Company’s ability to utilize indefinite-lived deferred tax liabilities as a source of future taxable income in the Company’s assessment of its realization of deferred tax assets. This is a result of the U.S. tax law change that would extend net operating losses generated in taxable years beginning after December 31, 2017 to an unlimited carryforward period subject to an 80% utilization against future taxable earnings. The income tax benefit recognized from the effects of U.S. tax reform was partially offset by movement in the deferred tax liability associated with tax amortization on indefinite-lived intangibles, and state and foreign taxes. The income tax benefit of $65.5 million for the year ended December 31, 2016 was primarily related to a change from indefinite-lived intangibles to definite-lived, partially offset by movement in the deferred tax liability associated with tax amortization on indefinite-lived intangibles, and state and foreign taxes. For both periods, the income tax benefit was impacted by certain discrete tax items including the accrual of potential interest and penalties on uncertain tax positions. Including the tax effects of these discrete tax items, the effective tax rate was 32.8%(2.0)% and 18.7%(4.2)% for the years ended December 31, 20172019 and 2016,2018, respectively. Income tax benefit for the year ended December 31, 2016 increased $45.9 million from a benefit of $19.6 million for the same period in 2015 to a benefit of $65.5 million in 2016. The 2016 income tax benefit was primarily related to a change from indefinite-lived intangibles to definite-lived, partially offset by movement in the deferred tax liability associated with tax amortization on indefinite-lived intangibles, and state and foreign taxes. The income tax benefit of $19.6 million for the year ended December 31, 2015 was primarily related to a $34.9 million release of an accrual for uncertain tax positions due to the lapsing of the statute, partially offset by movement in the deferred tax liability associated with tax amortization on indefinite-lived intangibles, and state and foreign taxes. For both periods, the income tax benefit was impacted by certain discrete tax items including the accrual of potential interest and penalties on uncertain tax positions. Including the tax effects of these discrete tax items, the effective tax rate was 18.7% and 12.8% for the years ended December 31, 2016 and 2015, respectively.
Adjusted EBITDA for the Corporate and Other category for the year ended December 31, 20172019 unfavorably changed unfavorably by $2.2$5.7 million, or 4.4%14.0%, from a loss of $48.5$40.4 million for the same period in 20162018 to a loss of $50.7$46.1 million. Our Adjusted EBITDA for the Corporate and Other category excludes interest, taxes, depreciation, derivative instruments charges, equity compensation charges, acquisition-relatedacquisition/disposition-related activity, restructuring costs, integration costs, severance, and facility vacant space costs, and legal settlement charges/reimbursements. The unfavorable change in our Adjusted EBITDA for the Corporate and Other category was due to the factors described above after removing those items not included in Adjusted EBITDA for the Corporate and Other category. Adjusted EBITDA for the Corporate and Other category for the year ended December 31, 2016 changed unfavorably by $6.4 million, or 15.2%, from a loss on extinguishment of $42.1 million for the same period in 2015 to a loss of
48
$48.5 million.debt. The unfavorable change in our Adjusted EBITDA for the Corporate and Other category was due to the factors described above after removing those items not included in Adjusted EBITDA for the Corporate and Other category.
Seasonality and Comparability Our net sales, operating profit or loss and net cash provided by or used in operations are impacted by the inherent seasonality of the academic calendar.calendar, which typically results in a cash flow usage in the first half of the year and a cash flow generation in the second half of the year. Consequently, the performance of our businesses may not be comparable quarter to consecutive quarter and should be considered on the basis of results for the whole year or by comparing results in a quarter with results in the same quarter for the previous year. 40
Approximately 87% of our net sales for the year ended December 31, 20172019 were derived from our Education segment, which is a markedly seasonal business. Schools conduct the majority of their purchases in the second and third quarters of the calendar year in preparation for the beginning of the school year. Thus, over the past three completed fiscal years, approximately 67% of our consolidated net sales were realized in the second and third quarters. Sales ofK-12 instructional materials and customized testing products are also cyclical, with some years offering more sales opportunities than others in light ofbased on the state adoption calendar. The amount of funding available at the state level for educational materials also has a significant effect onyear-to-year net sales. Although the loss of a single customer would not have a material adverse effect on our business, schedules of school adoptions and market acceptance of our products can materially affectyear-to-year net sales performance. 49
The following table is indicative of the seasonality of our business and the related results: Quarterly Results of Operations | | | | | | | | | | | | | | | | | | | | | | | | | | | | | | | | | | (in thousands) | | First
Quarter
2016 | | | Second
Quarter
2016 | | | Third
Quarter
2016 | | | Fourth
Quarter
2016 | | | First
Quarter
2017 | | | Second
Quarter
2017 | | | Third
Quarter
2017 | | | Fourth
Quarter
2017 | | Education segment | | $ | 174,305 | | | $ | 353,384 | | | $ | 487,209 | | | $ | 192,172 | | | $ | 185,384 | | | $ | 350,607 | | | $ | 480,851 | | | $ | 206,129 | | Trade Publishing segment | | | 31,511 | | | | 38,658 | | | | 45,812 | | | | 49,634 | | | | 36,533 | | | | 42,444 | | | | 51,189 | | | | 54,374 | | | | | | | | | | | | | | | | | | | | | | | | | | | | | | | | | | | Net sales | | | 205,816 | | | | 392,042 | | | | 533,021 | | | | 241,806 | | | | 221,917 | | | | 393,051 | | | | 532,040 | | | | 260,503 | | Costs and expenses: | | | | | | | | | | | | | | | | | | | | | | | | | | | | | | | | | | | | | | | | | | Cost of sales, excluding publishing rights andpre-publication amortization | | | 105,518 | | | | 173,466 | | | | 206,177 | | | | 125,554 | | | | 107,536 | | | | 175,693 | | | | 209,694 | | | | 124,879 | | Publishing rights amortization | | | 17,793 | | | | 14,413 | | | | 14,573 | | | | 14,572 | | | | 13,398 | | | | 10,867 | | | | 10,987 | | | | 10,986 | | Pre-publication amortization | | | 28,281 | | | | 31,315 | | | | 33,903 | | | | 36,744 | | | | 27,577 | | | | 29,758 | | | | 33,757 | | | | 34,946 | | | | | | | | | | | | | | | | | | | | | | | | | | | | | | | | | | | Cost of sales | | | 151,592 | | | | 219,194 | | | | 254,653 | | | | 176,870 | | | | 148,511 | | | | 216,318 | | | | 254,438 | | | | 170,811 | | Selling and administrative | | | 168,675 | | | | 184,479 | | | | 185,252 | | | | 161,138 | | | | 156,352 | | | | 166,165 | | | | 178,104 | | | | 154,239 | | Other intangible asset amortization | | | 6,176 | | | | 5,968 | | | | 5,980 | | | | 8,626 | | | | 8,076 | | | | 8,128 | | | | 7,248 | | | | 7,296 | | Impairment charge for intangible assets | | | — | | | | — | | | | — | | | | 139,205 | | | | — | | | | — | | | | — | | | | 3,980 | | Restructuring | | | — | | | | — | | | | — | | | | — | | | | 3,875 | | | | 33,393 | | | | 1,768 | | | | 1,617 | | Severance and other charges | | | 1,577 | | | | 3,553 | | | | 3,765 | | | | 6,755 | | | | 1,206 | | | | 213 | | | | 272 | | | | (978 | ) | | | | | | | | | | | | | | | | | | | | | | | | | | | | | | | | | | Operating income (loss) | | | (122,204 | ) | | | (21,152 | ) | | | 83,371 | | | | (250,788 | ) | | | (96,103 | ) | | | (31,166 | ) | | | 90,210 | | | | (76,462 | ) | | | | | | | | | | | | | | | | | | | | | | | | | | | | | | | | | | Other income (expense) | | | | | | | | | | | | | | | | | | | | | | | | | | | | | | | | | Interest expense | | | (9,487 | ) | | | (9,466 | ) | | | (9,550 | ) | | | (10,678 | ) | | | (10,453 | ) | | | (10,547 | ) | | | (10,980 | ) | | | (10,825 | ) | Interest income | | | 154 | | | | 64 | | | | 57 | | | | 243 | | | | 245 | | | | 115 | | | | 281 | | | | 697 | | Change in fair value of derivative instruments | | | 784 | | | | (619 | ) | | | 257 | | | | (1,036 | ) | | | 45 | | | | 851 | | | | 377 | | | | 93 | | | | | | | | | | | | | | | | | | | | | | | | | | | | | | | | | | | Income (loss) before taxes | | | (130,753 | ) | | | (31,173 | ) | | | 74,135 | | | | (262,259 | ) | | | (106,266 | ) | | | (40,747 | ) | | | 79,888 | | | | (86,497 | ) | Income tax expense (benefit) | | | 34,395 | | | | (2,782 | ) | | | (15,887 | ) | | | (81,218 | ) | | | 14,392 | | | | 6,120 | | | | (10,618 | ) | | | (60,329 | ) | | | | | | | | | | | | | | | | | | | | | | | | | | | | | | | | | | Net income (loss) | | $ | (165,148 | ) | | $ | (28,391 | ) | | $ | 90,022 | | | $ | (181,041 | ) | | $ | (120,658 | ) | | $ | (46,867 | ) | | $ | 90,506 | | | $ | (26,168 | ) | | | | | | | | | | | | | | | | | | | | | | | | | | | | | | | | | |
| | First | | | Second | | | Third | | | Fourth | | | First | | | Second | | | Third | | | Fourth | | | | Quarter | | | Quarter | | | Quarter | | | Quarter | | | Quarter | | | Quarter | | | Quarter | | | Quarter | | (in thousands) | | 2018 | | | 2018 | | | 2018 | | | 2018 | | | 2019 | | | 2019 | | | 2019 | | | 2019 | | Education segment | | $ | 163,023 | | | $ | 321,276 | | | $ | 449,636 | | | $ | 188,754 | | | $ | 153,844 | | | $ | 349,801 | | | $ | 517,614 | | | $ | 189,387 | | HMH Books & Media segment | | | 36,736 | | | | 36,089 | | | | 66,619 | | | | 60,284 | | | | 40,791 | | | | 39,095 | | | | 48,054 | | | | 52,088 | | Net sales | | | 199,759 | | | | 357,365 | | | | 516,255 | | | | 249,038 | | | | 194,635 | | | | 388,896 | | | | 565,668 | | | | 241,475 | | Costs and expenses: | | | | | | | | | | | | | | | | | | | | | | | | | | | | | | | | | Cost of sales, excluding publishing rights and pre- publication amortization | | | 99,733 | | | | 160,058 | | | | 201,748 | | | | 119,928 | | | | 96,055 | | | | 190,831 | | | | 246,527 | | | | 134,695 | | Publishing rights amortization | | | 10,090 | | | | 8,148 | | | | 8,238 | | | | 8,237 | | | | 7,605 | | | | 6,271 | | | | 6,341 | | | | 6,340 | | Pre-publication amortization | | | 25,621 | | | | 26,332 | | | | 28,094 | | | | 29,210 | | | | 33,082 | | | | 35,739 | | | | 39,319 | | | | 41,375 | | Cost of sales | | | 135,444 | | | | 194,538 | | | | 238,080 | | | | 157,375 | | | | 136,742 | | | | 232,841 | | | | 292,187 | | | | 182,410 | | Selling and administrative | | | 145,527 | | | | 169,323 | | | | 176,202 | | | | 158,243 | | | | 151,983 | | | | 175,266 | | | | 188,957 | | | | 146,400 | | Other intangible asset amortization | | | 6,866 | | | | 6,676 | | | | 6,696 | | | | 6,695 | | | | 6,524 | | | | 6,612 | | | | 6,383 | | | | 5,791 | | Restructuring/severance and other charges | | | 3,943 | | | | 2,075 | | | | 3,439 | | | | 2,021 | | | | 1,221 | | | | 4,430 | | | | 270 | | | | 15,821 | | Gain on sale of assets | | | 884 | | | | (500 | ) | | | — | | | | (585 | ) | | | — | | | | — | | | | — | | | | — | | Operating (loss) income | | | (92,905 | ) | | | (14,747 | ) | | | 91,838 | | | | (74,711 | ) | | | (101,835 | ) | | | (30,253 | ) | | | 77,871 | | | | (108,947 | ) | Other income (expense) | | | | | | | | | | | | | | | | | | | | | | | | | | | | | | | | | Retirement benefits non-service income | | | 320 | | | | 320 | | | | 320 | | | | 320 | | | | 42 | | | | 42 | | | | 41 | | | | 42 | | Interest expense | | | (10,936 | ) | | | (11,472 | ) | | | (11,627 | ) | | | (11,645 | ) | | | (11,582 | ) | | | (11,963 | ) | | | (11,597 | ) | | | (13,636 | ) | Interest income | | | 506 | | | | 117 | | | | 277 | | | | 1,650 | | | | 1,092 | | | | 97 | | | | 509 | | | | 1,459 | | Change in fair value of derivative instruments | | | 372 | | | | (1,097 | ) | | | (249 | ) | | | (400 | ) | | | (450 | ) | | | 16 | | | | (737 | ) | | | 272 | | Income from transition services agreement | | | — | | | | — | | | | — | | | | 1,889 | | | | 1,826 | | | | 1,851 | | | | 571 | | | | — | | Loss on extinguishment of debt | | | — | | | | — | | | | — | | | | — | | | | — | | | | — | | | | — | | | | (4,363 | ) | (Loss) income from continuing operations before taxes | | | (102,643 | ) | | | (26,879 | ) | | | 80,559 | | | | (82,897 | ) | | | (110,907 | ) | | | (40,210 | ) | | | 66,658 | | | | (125,173 | ) | Income tax expense (benefit) | | | 3,243 | | | | 2,210 | | | | (3,349 | ) | | | 3,493 | | | | 6,455 | | | | 403 | | | | (2,602 | ) | | | (55 | ) | Net (loss) income from continuing operations | | $ | (105,886 | ) | | $ | (29,089 | ) | | $ | 83,908 | | | $ | (86,390 | ) | | $ | (117,362 | ) | | $ | (40,613 | ) | | $ | 69,260 | | | $ | (125,118 | ) | Earnings from discontinued operations, net tax | | | 4,575 | | | | 5,817 | | | | 2,441 | | | | — | | | | — | | | | — | | | | — | | | | — | | Gain on sale of discontinued operations, net of tax | | | — | | | | — | | | | — | | | | 30,469 | | | | — | | | | — | | | | — | | | | — | | Net (loss) income | | $ | (101,311 | ) | | $ | (23,272 | ) | | $ | 86,349 | | | $ | (55,921 | ) | | $ | (117,362 | ) | | $ | (40,613 | ) | | $ | 69,260 | | | $ | (125,118 | ) |
5041
Liquidity and Capital Resources | | | | December 31, | | | December 31, | | | (in thousands) | | 2017 | | | 2016 | | | 2015 | | | 2019 | | | 2018 | | | 2017 | | Cash and cash equivalents | | $ | 148,979 | | | $ | 226,102 | | | $ | 234,257 | | | $ | 296,353 | | | $ | 253,365 | | | $ | 148,979 | | Short-term investments | | | 86,449 | | | | 80,841 | | | | 198,146 | | | | — | | | | 49,833 | | | | 86,449 | | Current portion of long-term debt | | | 8,000 | | | | 8,000 | | | | 8,000 | | | | 19,000 | | | | 8,000 | | | | 8,000 | | Long-term debt, net of discount | | | 760,194 | | | | 764,738 | | | | 769,283 | | | | | | | | | | | Long-term debt, net of discount and issuance costs | | | | 638,187 | | | | 755,649 | | | | 760,194 | | Borrowing availability under revolving credit facility | | | | 161,961 | | | | 167,434 | | | | 135,267 | | | | | | | | | | | | | | | | | | | Years ended December 31, | | | Years ended December 31, | | | | | 2017 | | | 2016 | | | 2015 | | | 2019 | | | 2018 | | | 2017 | | Net cash provided by operating activities | | $ | 135,130 | | | $ | 143,751 | | | $ | 348,359 | | | $ | 254,975 | | | $ | 114,915 | | | $ | 135,130 | | Net cash used in investing activities | | | (204,923 | ) | | | (113,946 | ) | | | (676,787 | ) | | | (96,320 | ) | | | (6,405 | ) | | | (204,923 | ) | Net cash (used in) provided by financing activities | | | (7,330 | ) | | | (37,960 | ) | | | 106,104 | | | Net cash used in financing activities | | | | (115,667 | ) | | | (4,124 | ) | | | (7,330 | ) |
Operating activities Net cash provided by operating activities was $135.1$255.0 million for the year ended December 31, 2017,2019, a $8.6$140.1 million decreaseincrease from the $143.8$114.9 million of net cash provided by operating activities for the year ended December 31, 2016.2018. Net cash provided by operating activities included $10.8 million of cash flow provided by discontinued operations in 2018. Net cash provided by operating activities from continuing operations was $255.0 million for the year ended December 31, 2019 compared to $104.1 million for the year ended December 31, 2018. The decrease$150.9 million increase in cash provided by operating activities from 2016 to 2017continuing operations was primarily driven by unfavorable netfavorable changes in net operating assets and liabilities of $65.4$184.8 million offset by more profitable operations, net ofnon-cash items, of $56.8 million. The unfavorable net changes in operating assets and liabilities were primarily due to unfavorable changesan increase in deferred revenue of $52.9 due$208.2 million attributed to lowergreater billings of Core Solutions products, which typically carry a high deferral rate, unfavorable changesin 2019, favorability in accounts receivable of $25.2$30.2 million due to timing ofbetter collections, and fourth quarter net sales, and unfavorable changesan increase in pension and post-retirement benefits of $10.6 million, offset by favorable changes in accounts payable and royalties of $16.5$11.0 million, and $11.0an increase in restructuring/severance and other charges of $13.5 million respectively, due to timingour strategic transformation plan, favorability in inventories of payments. Net cash provided by operating activities was $143.8$4.7 million, for the year ended December 31, 2016, a $204.6and an increase in interest payable of $3.9 million decrease from the $348.4 million provided by operating activities for the year ended December 31, 2015. The decrease in cash provided by operating activities from 2015 to 2016 was primarily driven by less profitable operations, net ofnon-cash items, of $136.2 million, attributed largely to lower sales and higher selling and administrative expenses, along with unfavorable net changes in operating assets and liabilities of $68.4 million. The unfavorable net changes in operating assets and liabilities were primarily due to lower deferred revenue of $86.8 million attributed to greater recognition of revenue attributed to product mix when compared to the prior year period along with lower billings in 2016,our 2019 Refinancing, offset by unfavorable changes in accounts payable of $36.8 million and in royalties of $19.0$28.3 million due to timing of payments, and unfavorable changes in inventorydisbursements, operating lease liabilities of $17.2 million as the reduction in inventory was due to better inventory management and was not as large as the prior year. These unfavorable changes were partially offset by favorable changes primarily due to a reversal of a $74.3 million accrual related to uncertain tax positions as the statutory period expired in the prior period, favorable changes in accounts receivable of $9.3$17.3 million due to lower fourth quarter salesthe recognition of liabilities for leases on the balance sheet in accordance with the new leases accounting standard in 2019, pension and net favorable changes inpostretirement benefits of $3.9 million and other assets and liabilities of $7.8 million due to timing$37.2 million. Additionally, operating profit, net of disbursements.non-cash items, decreased by $33.9 million.
Investing activities Net cash used in investing activities was $204.9$96.3 million for the year ended December 31, 2017,2019, an increase of $91.0$89.9 million from the $113.9 million used in investing activities for the year ended December 31, 2016. The increase in investing activities was primarily due to lower net proceeds from short-term investments of $122.2 million compared to 2016 along with $15.1 million of higherpre-publication costs in advance of 2018 adoptions. Partially offsetting, capital investing expenditures related to property, plant, and equipment decreased by $47.3 million, primarily due to lower spend on leasehold improvements related to various office moves and technology infrastructure. 51
2018. Net cash used in investing activities included $6.8 million of expenditures from discontinued operations in 2018. Net cash used in investing activities from continuing operations was $113.9$96.3 million for the year ended December 31, 2016, a decrease2019 compared to net cash provided by investing activities from continuing operations of $562.8$0.4 million from the $676.8 million used in investing activities for the year ended December 31, 2015.2018. The decreaseincrease in cash used in investing activities from continuing operations of $96.7 million was primarily due to $140.0 million of non-recurring proceeds from the sale of the Riverside Business in 2018, the acquisition of the EdTecha business for $5.4 million during 2019 and an increase in May 2015,investment in preferred stock of $0.3 million in 2019, offset by lower capital investing expenditures related to pre-publication costs and property, plant, and equipment of $37.0 million and by higher net proceeds from sales and maturities of short-term investments of $28.5$13.0 million compared to 2015. Offsetting the decrease, capital investing expenditures related topre-publication costs and property, plant and equipment increased by $42.9 million, due to capital spend pertaining to the EdTech business, and increased spend on leasehold improvements related to various office moves, technology infrastructure and timing of spend.2018. Financing activities Net cash used in financing activities was $7.3$115.7 million for the year ended December 31, 2017, a decrease2019, an increase of $30.6$111.5 million from the $38.0$4.1 million of net cash used in financing activities for the year ended December 31, 2016. The decrease in cash used in financing activities was primarily due to there being no share repurchases in 2017 under our share repurchase program for our common stock, compared to $55.0 million of share repurchases in 2016, partially offset by $24.0 million less proceeds related to stock option exercises during 2017 compared to 2016. Net cash used in financing activities was $38.0 million for the year ended December 31, 2016, an increase of $144.1 million from the $106.1 million of net cash provided by financing activities for the year ended December 31, 2015.2018. The increase in cash used in financing activities was primarily due to the prior period benefiting from net proceeds of $796.0 million from our term loan facility partially offset by an increase in net debt principal payments on our previously existing term loanrepayments of $243.1$99.3 million in connection with the acquisition2019 Refinancing along with payments of the EdTech business in May 2015. Further, we incurred $15.3 million in the prior period for deferred financing fees of $8.5 million related to the closing of theour notes offering, new term loan facility and the amendment to the revolving credit facility. In 2016, we made $8.0facility amendments, an increase in tax withholding payments related to net share settlements of restricted stock units of $0.8 million and lower net collections under the transition services agreement of principal payments under our$2.7 million.
42
Debt Under the notes, new term loan facility compared with $4.0 million in 2015. Offsetting the aforementioned, our share repurchases under our share repurchase program for our common stock were $408.0 million less during 2016 compared to the prior period. Also, we received $11.6 million of less proceeds during 2016 related to stock option exercises partially offset by proceeds received of $2.2 million related to our employee stock purchase program. Debt
Under both ourand revolving credit facility and term loan facility, Houghton Mifflin Harcourt Publishers Inc., HMH Publishers LLC and Houghton Mifflin Harcourt Publishing Company and HMH Publishers LLC are the borrowers (collectively, the “Borrowers”), and Citibank, N.A. acts as both the administrative agent and the collateral agent.
The obligations under thesethe senior secured facilitiesnotes, new term loan facility and revolving credit facility are guaranteed by the Company and each of its direct and indirectfor-profit domestic subsidiaries (other than the Borrowers) (collectively, the “Guarantors”) and are secured by all capital stock and other equity interests of the Borrowers and the Guarantors and substantially all of the other tangible and intangible assets of the Borrowers and the Guarantors, including, without limitation, receivables, inventory, equipment, contract rights, securities, patents, trademarks, other intellectual property, cash, bank accounts and securities accounts and owned real estate. The revolving credit facility is secured by first priority liens on receivables, inventory, deposit accounts, securities accounts, instruments, chattel paper and other assets related to the foregoing (the “Revolving First Lien Collateral”), and second priority liens on the collateral which secures the term loan facility on a first priority basis. The term loan facility is secured by first priority liens on the capital stock and other equity interests of the Borrower and the Guarantors, equipment, owned real estate, trademarks and other intellectual property, general intangibles that are not Revolving First Lien Collateral and other assets related to the foregoing, and second priority liens on the Revolving First Lien Collateral. Term Loan FacilitySenior Secured Notes
In connection with our closingOn November 22, 2019, we completed the sale of $306.0 million in aggregate principal amount of 9.0% Senior Secured Notes due 2025 (the “notes”) in a private placement to qualified institutional buyers under Rule 144A under the EdTech acquisition, we entered into anSecurities Act of 1933, as amended (the “Securities Act”), and restated term loan credit facility (the “term loan facility”) dated asto persons outside the United States pursuant to Regulation S under the Securities Act. The notes mature on February 15, 2025 and bear interest at a rate of May 29, 2015 to, among other things, increase our
52
outstanding term loan credit facility to $800.0 million, all9.0% per annum. Interest is payable semi-annually in arrears on February 15 and August 15 of which was drawn at closing.each year, beginning on February 15, 2020. As of December 31, 2017,2019, we had approximately $780.0$306.0 million ($768.2295.9 million, net of discount and issuance costs) outstanding under the notes.
We may redeem all or a portion of the notes at redemption prices as described in the notes. The notes do not require us to comply with financial maintenance covenants. We are currently required to meet certain incurrence based financial covenants as defined under the notes. The notes are subject to customary events of default. If an event of default occurs and is continuing, the administrative agent may, or at the request of certain required lenders shall, accelerate the obligations outstanding under the notes. Term Loan Facility On November 22, 2019, we entered into a second amended and restated term loan credit agreement for an aggregate principal amount of $380.0 million (the “new term loan facility”). As of December 31, 2019, we had $380.0 million ($361.3 million, net of discount and issuance costs) outstanding under the new term loan facility. The new term loan facility has asix-year term and matures on May 29, 2021. TheNovember 22, 2024 and the interest rate applicableper annum is equal to, borrowings under the facility is based, at our election, on LIBOR plus 3.0% or an alternative base rate plus applicable margins. LIBOR is subject to a floor of 1.0%, with the length of the LIBOR contracts ranging up to six months at the option of the Company.Company, either (a) LIBOR plus a margin of 6.25% or (b) an alternate base rate plus a margin of 5.25%. As of December 31, 2017,2019, the interest rate ofon the new term loan facility was 4.6%8.0%. The term loan facility may be prepaid, in whole or in part, at any time, without premium. Thenew term loan facility is required to be repaid in quarterly installments of $2.0 million.approximately $4.8 million with the balance being payable on the maturity date. The new term loan facility does not require us to comply with financial maintenance covenants. We are currently required to meet certain incurrence based financial covenants as defined under our new term loan facility. 43
The new term loan facility contains customary mandatory prepayment requirements, including with respect to excess cash flow, proceeds from certain asset sales or dispositions of property, and proceeds from certain incurrences of indebtedness. The new term loan facility permits the Company to voluntarily prepay outstanding amounts at any time without premium or penalty, other than customary breakage costs with respect to LIBOR loans; provided, however, that any voluntary prepayment in connection with certain repricing transactions that occur before the date that is twelve months after the closing of the new term loan facility shall be subject to a prepayment premium of 1.00% of the principal amount of the amounts prepaid. The new term loan facility is subject to usual and customary conditions, representations, warranties and covenants, including restrictions on additional indebtedness, liens, investments, mergers, acquisitions, asset dispositions, dividends to stockholders, repurchase or redemption of our stock, transactions with affiliates and other matters. The new term loan facility is subject to customary events of default. If an event of default occurs and is continuing, the administrative agent may, or at the request of certain required lenders shall, accelerate the obligations outstanding under the term loan facility. We are subject to an excess cash flow provision under theour new term loan facility which is predicated upon our leverage ratio and cash flow. We were not required to make a payment under theThe excess cash flow provision did not apply in 2017 and 2016.2019. Revolving Credit Facility On JulyNovember 22, 2015,2019, we entered into ana second amended and restated revolving credit facility (the “revolving credit facility”) to, among other things, reduce the pricing, extend the maturity, conform certain terms to those of our term loan facility and to provide greater availability and operational flexibility. The revolving credit facilityagreement that provides borrowing availability in an amount equal to the lesser of either $250.0 million andor a borrowing base that is computed monthly or weekly as the case may be and comprised of the Borrowers’ and certainthe Guarantors’ eligible inventory and receivables.receivables (the “revolving credit facility”). The revolving credit facility includes a letter of credit subfacility of $50.0 million, a swingline subfacility of $20.0 million and the option to expand the facility by up to $100.0 million in the aggregate under certain specified conditions. The amount of any outstanding letters of credit reduces borrowing availability under the revolving credit facility on adollar-for-dollar basis. As of December 31, 2017,2019, no loans were drawn on the revolving credit facility. As of December 31, 2019, we had approximately $25.2$23.7 million of outstanding letters of credit and approximately $135.3$162.0 million of borrowing availability under the revolving credit facility. No loans have beenAs of February 27, 2020, there were no amounts drawn on the revolving credit facility as of February 22, 2018.facility. The revolving credit facility has a five yearfive-year term and matures on JulyNovember 22, 2020.2024. The interest rate applicable to borrowings under the facility is based, at our election, on LIBOR plus 1.75%a margin between 1.50% and 2.00% or an alternative base rate plus 0.75%; such applicablea margin between 0.50% and 1.00%, which margins may increase up to 2.25% and 1.25%, respectively,are based on average daily availability. The revolving credit facility may be prepaid, in whole or in part, at any time, without premium. The revolving credit facility requires us to maintain a minimum fixed charge coverage ratio of 1.0 to 1.0 on a trailing four-quarter basis for periods in which excess availability under the facility is less than the greater of $25.0 million and 12.5% of the lesser of the total commitment and the borrowing base then in effect, or less than $20.0 million if certain conditions are met. The minimum fixed charge coverage ratio was not applicable under the facility as of December 31, 2017,2019, due to our level of borrowing availability. 53
The revolving credit facility is subject to usual and customary conditions, representations, warranties and covenants, including restrictions on additional indebtedness, liens, investments, mergers, acquisitions, asset dispositions, dividends to stockholders, repurchase or redemption of our stock, transactions with affiliates and other matters. The revolving credit facility is subject to customary events of default. If an event of default occurs and is continuing, the administrative agent may, or at the request of certain required lenders shall, accelerate the obligations outstanding under the revolving credit facility. General We had $149.0$296.4 million of cash and cash equivalents and $86.4no short-term investments at December 31, 2019. We had $253.4 million of cash and cash equivalents and $49.8 million of short-term investments at December 31, 2017. We had $226.1 million2018. 44
Our business is impacted by the inherent seasonality of the academic calendar, which typically results in a cash flow usage in the first half of the year and a cash equivalents and $80.8 millionflow generation in the second half of short-term investments at December 31, 2016. the year. We expect our net cash provided by operations combined with our cash and cash equivalents and borrowingsborrowing availability under our revolving credit facility to provide sufficient liquidity to fund our current obligations, capital spending, debt service requirements and working capital requirements over at least the next twelve months. Our ability to fund planned operations is based on assumptions, which involve significant judgment and estimates of future revenues, capital spend and other operating costs. Critical Accounting Policies and Estimates The preparation of financial statements in conformity with U.S. GAAP requires the use of estimates, assumptions and judgments by management that affect the reported amounts of assets, liabilities, net sales, expenses and related disclosure of contingent assets and liabilities in the amounts reported in the financial statements and accompanying notes. On anon-going basis, we evaluate our estimates and assumptions, including, but not limited to, book returns and variable consideration, deferred revenue and related standalone selling price estimates, allowance for bad debts, recoverability of advances to authors, valuation of inventory, financial instruments valuation, income taxes, pensions and other postretirement benefits obligations, contingencies, litigation, depreciation and amortization periods, and the recoverability of long-term assets such as property, plant and equipment, capitalizedpre-publication costs, other identified intangibles, goodwill, deferred revenue, income taxes, pensions and other postretirement benefits, contingencies, litigation and purchase accounting.goodwill. We base our estimates on historical experience and on various other assumptions that we believe to be reasonable under the circumstances, the results of which form the basis for making judgments about the carrying value of assets and liabilities that are not readily apparent from other sources. Actual results may differ from those estimates. For a complete description of our significant accounting policies, see Note 2 of Notes to Consolidated Financial Statements included in Item 8, “Financial Statements and Supplementary Data.”the consolidated financial statements. The following policies and account descriptions include those identified as critical to our business operations and the understanding of our results of operations. Revenue Recognition Revenue is recognized when a customer obtains control of promised goods or services, in an amount that reflects the consideration which we expect to receive in exchange for those goods or services. To determine revenue recognition for arrangements that we determine are within the scope of the new revenue recognition accounting standard, we perform the following five steps: (i) identify the contract with a customer; (ii) identify the performance obligations in the contract; (iii) determine the transaction price; (iv) allocate the transaction price to the performance obligations in the contract; and (v) recognize revenue when (or as) we satisfy a performance obligation. We only once persuasive evidenceapply the five-step model to contracts when it is probable that we will collect the consideration we are entitled to in exchange for the goods or services we transfer to the customer. At contract inception, we assess the goods or services promised within each contract and determine those that are performance obligations and assess whether each promised good or service is distinct. We then recognize as revenue the amount of an arrangement with the customer exists,transaction price that is allocated to the sales pricerespective performance obligation when (or as) the performance obligation is fixed or determinable, deliverysatisfied. Revenue is measured as the amount of consideration we expect to receive in exchange for transferring products or services has occurred, titleto a customer. To the extent the transaction price includes variable consideration, which generally reflects estimated future product returns, we estimate the amount of variable consideration that should be included in the transaction price utilizing the expected value method to which we expect to be entitled. Variable consideration is included in the transaction price if, in our judgment, it is probable that a significant future reversal of cumulative revenue under the contract will not occur. Estimates of variable consideration and riskthe determination of losswhether to include estimated amounts in the transaction price are based largely on all information (historical, current and forecasted) that is reasonably available. Sales, value add, and other taxes collected on behalf of third parties are excluded from revenue. We estimate the collectability of contracts upon execution. For contracts with respectrights of return, the transaction price is adjusted to reflect the estimated returns for the arrangement on these sales and is made at the time of sale based on historical experience by product line or customer. The transaction prices allocated are adjusted to reflect expected returns and are based on historical return rates and sales patterns. Shipping and handling fees charged to customers are included in net sales. 45
When determining the transaction price of a contract, an adjustment is made if payment from a customer occurs either significantly before or significantly after performance, resulting in a significant financing component. We do not assess whether a significant financing component exists if the period between when we perform our obligations under the contract and when the customer pays is one year or less. Significant financing components’ income is included in interest income. Contracts are often modified to account for changes in contract specifications and requirements. Contract modifications exist when the modification either creates new, or changes the existing, enforceable rights and obligations. Generally, contract modifications are for products have transferredor services that are not distinct from the existing contract due to the inability to use, consume or sell the products or services on their own to generate economic benefits and are accounted for as if they were part of that existing contract. The effect of such a contract modification on the transaction price and measure of progress for the performance obligation to which it relates is recognized as an adjustment to revenue (either as an increase in or a reduction of revenue) on a cumulative catch-up basis. Physical product revenue is recognized when the customer obtains control of our product, which occurs at a point in time, and may be upon shipment or upon delivery based on the contractual shipping terms of a contract. Revenues from static digital content commence upon delivery to the customer all significant obligations, if any, have been performed,of the digital entitlement that is required to access and collectiondownload the content and is reasonably assured.typically recognized at a point in time. Revenues from subscription software licenses, related hosting services and product support are recognized evenly over the license term as we believe this best represents the pattern of transfer to the customer. The perpetual software licenses provide the customer with a functional license to our products and their related revenues are recognized when the customer receives entitlement to the software. For the technical services provided to customers in connection with the software license, including hosting services related to perpetual licenses, we recognize revenue upon delivery of the services. As the invoices are based on each day of service, this is directly linked to the transfer of benefit to the customer. If the contract contains a single performance obligation, the entire transaction price is allocated to the single performance obligation. We enter into certain contractual arrangementscontracts that have multiple elements,performance obligations, one or more of which may be delivered subsequent to the delivery of other elements.performance obligations. These multiple-deliverable arrangementsperformance obligations may include print and digital media, professional development services, training, software licenses, access to hosted content, and various services related to the software including but not limited to hosting, maintenance and support, and implementation. For these multiple-element arrangements, weWe allocate revenue to each deliverable of the arrangementtransaction price based on the estimated relative standalone selling prices of the deliverables. In such circumstances, we firstpromised products or services underlying each performance obligation. We determine thestandalone selling price of each deliverable based on (i) vendor-specific objective evidence of fair value (“VSOE”) if that exists, (ii) third-party evidence of selling price (“TPE”) when VSOE does not exist, or (iii) our best estimate of the selling price when neither VSOE nor TPE exists. Revenue is then allocated to thenon-software deliverables 54
as a group and to the software deliverables as a group using the relative selling prices of each of the deliverables in the arrangement, based on the price at which the performance obligation is sold separately. If the standalone selling price hierarchy.Non-software deliverablesis not observable through past transactions, we estimate the standalone selling price taking into account available information such as market conditions and internally approved standard pricing discounts related to the performance obligations. Generally, our performance obligations include print and digital textbooks and instructional materials, trade books, reference materials, formative assessment materials and multimedia instructional programs; licenses to book rights and content; access to hosted content; and services including test development, test delivery, test scoring, professional development, consulting and training when those services do not relate totraining. Our contracts may also contain software deliverables. Software deliverables include softwareperformance obligations including perpetual and subscription-based licenses and software maintenance and support services, professional servicesservices.
Accounts Receivable Accounts receivable include amounts billed and training when those services relatecurrently due from customers and are recorded net of allowances for doubtful accounts and reserves for returns. In the normal course of business, we extend credit to software deliverables.customers that satisfy predefined criteria. Allowances for doubtful accounts are established through the evaluation of accounts receivable aging and prior collection experience to estimate the ultimate collectability of these receivables. ForDeferred Commissions
Our incremental direct costs of obtaining a contract, which consist of sales commissions, are deferred and amortized over thenon-software deliverables, we determine period of contract performance. Applying the revenue for each deliverable based on its relative selling price in the arrangement andpractical expedient, we recognize revenue upon deliverysales commission expense when incurred if the amortization period of the productassets that we otherwise would have recognized is one year or service, assuming all other revenue recognition criteria have been met. Revenue for test delivery, test scoringless. At December 31, 2019 and training is recognized whenDecember 31, 2018, we had $29.3 million and $22.6 million of deferred commissions, respectively. We had $13.2 million of amortization expense related to deferred commissions during the service has been completed. Revenue for test development, professional development, consulting and training is recognized as the service is provided. Revenue for access to hosted interactive content is recognized ratably over the term of the arrangement. For the software deliverables as a group, we recognize revenue in accordance with the authoritative guidance for software revenue recognition. As our software licenses are typically sold with maintenance and support, professional services or training, we use the residual method to determine the amount of software license revenue to be recognized in instances where VSOE has not been established for an element sold in the arrangement.
Under the residual method, arrangement consideration of the software deliverables as a group is allocated to the undelivered elements based upon VSOE of those elements, with the residual amount of the arrangement fee allocated to and recognized as license revenue upon delivery, assuming all other revenue recognition criteria have been met. If VSOE of one or more of the undelivered services or other elements does not exist, all revenues of the software-deliverables arrangement are deferred until delivery of all of those services or other elements has occurred, or until VSOE of each of those services or other elements can be established.
As products are shipped with right of return, a provision for estimated returns on these sales is made at the time of sale based on historical experience by product line or customer.
Shipping and handling fees charged to customersyear ended December 31, 2019. These costs are included in selling and administrative expenses.
46
Deferred Revenue Our contract liabilities consist of advance payments and billings in excess of revenue recognized and are classified as deferred revenue on our consolidated balance sheets. Our contract assets and liabilities are accounted for and presented on a net sales.basis as either a contract asset or contract liability at the end of each reporting period. We classify deferred revenue as current or noncurrent based on the timing of when we expect to recognize revenue. In order to determine revenue recognized in the period from contract liabilities, we first allocate revenue to the individual contract liability balance outstanding at the beginning of the period until the revenue exceeds that balance. If additional advances are received on those contracts in subsequent periods, we assume all revenue recognized in the reporting period first applies to the beginning contract liability as opposed to a portion applying to the new advances for the period. As discussed in Note 2, effective January 1, 2018, we will be accounting for revenue under the FASB’s new revenue recognition standard.
Allowance for Doubtful Accounts and Reserves for Book Returns Accounts receivable are recorded net of allowances for doubtful accounts and reserves for book returns. In the normal course of business, we extend credit to customers that satisfy predefined criteria. We estimate the collectability of our receivables. Allowances for doubtful accounts are established through the evaluation of accounts receivable aging, prior collection experience and specific facts and circumstances. Reserves for book returns are based on historical return rates and sales patterns. We determine the required reserves by segregating our returns into the applicable product or sales channel pools. Returns in theK-12 market have been historically low. We have experienced higher returns with respect to sales to resellers, international sales and Trade PublishingHMH Books & Media sales, which all result in a greater degree of risk and subjectivity when establishing the appropriate level of reserves for this customer base. We estimate the amount of returns using the expected value method to reduce transaction price at the time of the sale. At the time we determine that a receivable balance, or any portion thereof, is deemed to be permanently uncollectible, the balance is written off. The allowance for doubtful accounts and reserve for returns are reported as reductions of the accounts receivable balance and amounted to $2.6$3.0 million and $21.0$16.7 million, and $3.6$2.2 million and $19.0$18.6 million as of December 31, 20172019 and 2016,2018, respectively. 55
Inventories Inventories are substantially stated at the lower of weighted average cost or net realizable value. The level of obsolete and excess inventory is estimated on a program or title-level basis by comparing the number of units in stock with the expected future demand. The expected future demand of a program or title is determined by the copyright year, the previous years’ sales history, the subsequent year’s sales forecast, known forward-looking trends including our development cycle to replace the title or program and competing titles or programs. A change in sales trends, or strategic direction of our product development, could affect the estimated reserve. The inventory obsolescence reserve is reported as a reduction of the inventories balance and amounted to $48.3$57.4 million and $53.6$46.5 million as of December 31, 20172019 and 2016,2018, respectively. Pre-publication Costs Pre-publication costs are capitalized and are primarily amortized from the year of sale over five years using thesum-of-the-years-digits method, which is an accelerated method for calculating an asset’s amortization. Under this method, the amortization expense recorded for apre-publication cost asset is approximately 33% (year 1), 27% (year 2), 20% (year 3), 13% (year 4) and 7% (year 5). We utilize this policy for allpre-publication costs, except with respect to our Trade PublishingHMH Books & Media young readers and general interest books, for which we expense such costs as incurred, and our assessment products, for which we use the straight-line amortization method.incurred. Additionally,pre-publication costs recorded in connection with the acquisition of the EdTech businessfor most intervention products are amortized over 7 years on a projected sales pattern. The amortization methods and periods chosen best reflectreflects the pattern of expected sales generated from individual titles or programs. On a quarterly basis, we evaluate the remaining lives and recoverability of capitalizedpre-publication costs, which are often dependent upon program acceptance by state adoption authorities. Amortization expense related topre-publication costs for the years ended December 31, 2019, 2018 and 2017 2016 and 2015 were $126.0$149.5 million, $130.2$109.3 million and $120.5$119.9 million, respectively. 47
For the year ended December 31, 2017, the Company recorded an impairment charge of $4.0 million related to assets that had no future value. For the years ended December 31, 20162019 and 2015,2018, nopre-publication costs were deemed to be impaired. Goodwill and Indefinite-Lived Intangible Assets Goodwill and indefinite-lived intangible assets (certain tradenames) are not amortized, but are reviewed at least annually for impairment or earlier, if an indication of impairment exists. Goodwill is allocated entirely to our Education reporting unit. Determining the fair value of a reporting unit is judgmental in nature and involves the use of significant estimates and assumptions. These estimates and assumptions may include net sales growth rates and operating margins used to calculate projected future cash flows, risk-adjusted discount rates, future economic and market conditions, the determination of appropriate market comparables as well as the fair value of individual assets and liabilities. We have the option of first assessing qualitative factors to determine whether it is necessary to perform the currenttwo-step impairment test for goodwill or we can perform thetwo-step impairment test without performing the qualitative assessment. In performing the qualitative (Step 0) assessment, we consider certain events and circumstances specific to the reporting unit and to the entity as a whole, such as macroeconomic conditions, industry and market considerations, overall financial performance and cost factors when evaluating whether it is more likely than not that the fair value of the reporting unit is less than its carrying amount. Recoverability of goodwill can also be evaluated using atwo-step process. In the first step, the fair value of a reporting unit is compared to its carrying value. If the fair value of a reporting unit exceeds the carrying value of the net assets assigned to a reporting unit, goodwill is considered not impaired and no further testing is 56
required. If the carrying value of the net assets assigned to a reporting unit exceeds the fair value of a reporting unit, the second step of the impairment test is performed in order to determine the implied fair value of a reporting unit’s goodwill. Determining the implied fair value of goodwill requires valuation of a reporting unit’s tangible and intangible assets and liabilities in a manner similar to the allocation of purchase price in a business combination. If the carrying value of a reporting unit’s goodwill exceeds its implied fair value, goodwill is deemed impaired and is written down to the extent of the difference. We estimate total fair value of the Education reporting unit by using various valuation techniques including an evaluation of our market capitalization and peer company multiples. With regard to indefinite-lived intangible assets, which includes the Houghton Mifflin Harcourt tradename at December 31, 2019 and 2018, the recoverability is evaluated using a one-step process whereby we determine the fair value by asset and then compare it to its carrying value to determine if the asset is impaired. We estimate the fair value by preparing a relief-from-royalty discounted cash flow analysis using forward looking projections of the Education reporting units’ future operating results and by comparing the value of the Education reporting unit to the implied market value of selected peers.revenue projections. The significant assumptions used in the discounted cash flow analysis include: future net sales, a long-term growth rate, a royalty rate and net sales growth, gross margins, other operating expenses, working capital levels, investments in new products, capital spending, tax, cash flows, the discounteda discount rate used to present value future cash flows and the terminal value of the Education reporting unit. The discount rate is based on the weighted-average cost of capital method at the date of the evaluation. With regard to indefinite-lived intangible assets, the recoverability is evaluated using aone-step process whereby we determine the fair value by asset, which is then compared to its carrying value to determine if the assets are impaired. We completed our annual goodwill impairment tests as of October 1, 20172019 and 2016. In 2017 and 2016, we used income and market valuation approaches to establish the fair value of the reporting unit and used the most recent five year strategic plan as the initial basis of our analysis. We performed an interim quantitative evaluation as of December 31, 2017 related to our decreased market capitalization.2018. The fair value of the Education reporting unit was in excess of its carrying value by approximately 18% as of October 1, 2019, and substantially exceeded its carrying value as of the evaluation dates.October 1, 2018. Adverse changes in our market capitalization or peer company multiples by an equivalent amount could give rise to an impairment. There was no goodwill impairment for the years ended December 31, 2017, 20162019, 2018 and 2015.2017. We will continue to monitor and evaluate the carrying value of goodwill. If market and economic conditions or business performance deteriorate, this could increase the likelihood of us recording an impairment charge. We completed our annual indefinite-lived assetsasset impairment tests as of October 1, 20172019 and 2016. We recorded anon-cash impairment charge of $139.2 million for the year ended December 31, 2016. The impairment charge related to four specific tradenames within the Education segment in 2016 and primarily resulted from the strategic decision to market our products under the Houghton Mifflin Harcourt and HMH name rather than legacy imprints and certain declining sales projections.2018. No indefinite-lived intangible assets were deemed to be impaired for the years ended December 31, 20172019, 2018 and 2015.2017. 48
Royalty Advances Royalty advances to authors are capitalized and represent amounts paid in advance of the sale of an author’s product and are recovered as earned. As advances are recorded, a partial reserve may be recorded immediately based primarily upon historical sales experience to estimate the likelihood of recovery. AdvancesAdditionally, advances are evaluated periodically to determine if they are expected to be recovered.recovered on a title-by-title basis, with consideration given to the other titles in the author’s portfolio also earning against the outstanding advance. Any portion of a royalty advance that is not expected to be recovered is fully reserved. The reserve for royalty advances is reported as a reduction of the royalty advances to authors balance and amounted to $103.6$119.7 million and $85.5$117.8 million as of December 31, 20172019 and 2016,2018, respectively. Stock-Based Compensation The fair value of each restricted stock and restricted stock unit was estimated at the date of the grant based upon the target value of the award and the current market price. The fair value of each market-based restricted stock unit was estimated at the date of grant using the Monte Carlo simulation, which requires management’s use of highly subjective estimates and assumptions. The fair value of each stock option grant was estimated on the date of grant using the Black-Scholes option pricing model, which also requires management’s use of highly subjective estimates and assumptions. The use of different estimates and assumptions in the option pricing model could have a material impact on the estimated fair value of option grants and the related expense. We estimate our expected volatility based on the historical volatility of our publicly traded peer companies (including our 57
own) and expect to continue to do so until such timecommon stock as we have adequate historical data regarding the volatility of our traded stock price. The expected life assumption is based on the simplified method for estimating the expected term for awards. This option has been elected as we do not have sufficient stock option exercise experience to support a reasonable estimate of the expected term. The risk-free interest rate is the yield currently available on U.S. Treasuryzero-coupon issues with a remaining term approximating the expected term of the option. The expected dividend yield is based on actual dividends paid or to be paid. We recognize stock-based compensation expense over the awards requisite service period on a straight-line basis for time basedtime-based stock options, restricted stock and restricted stock units and on a graded basis for restricted stock and restricted stock units that are contingent on the achievement of performance conditions. We recognize compensation expense for only the portion of stock basedstock-based awards that are expected to vest. Accordingly, we have estimated expected forfeitures of stock basedstock-based awards based on our historical forfeiture rates and used these rates in developing a future forfeiture rate. If our actual forfeiture rate varies from our historical rates and estimates, additional adjustments to compensation expense may be required in future periods.
Income Taxes
We have accounted for the tax effects of The Tax Cuts and Jobs Act, enacted on December 22, 2017, on a provisional basis. Our accounting for certain income tax effects is incomplete, but we have determined reasonable estimates for those effects. Our reasonable estimates are included in our financial statements as of December 31, 2017. We expect to complete our accounting during the one year measurement period from the enactment date. See Note 8 to the consolidated financial statements for further detail.
Impact of Inflation and Changing Prices AlthoughWe believe that inflation has not had a material impact on our results of operations during the years ended December 31, 2017, 20162019, 2018 and 2015 was well below levels2017. We cannot be sure that future inflation will not have an adverse impact on our operating results and financial condition in prior years and, therefore, benefited results, particularly in the area of manufacturing costs, there were offsetting costs.future periods. Our ability to adjust selling prices has always been limited by competitive factors and long-term contractual arrangements which either prohibit price increases or limit the amount by which prices may be increased. Further, a weak domestic economy at a time of low inflation could cause lower tax receipts at the state and local level, and the funding and buying patterns for textbooks and other educational materials could be adversely affected. Prices for paper moderated during the last three years.
The most significant assets affected by inflation includepre-publication, other property, plant and equipment and inventories. We use the weighted average cost method to value substantially all inventory. We have negotiated favorable pricing through contractual agreements with our two top print and sourcing vendors, and from our other major vendors, which has helped to stabilize our unit costs, and therefore our cost of inventories sold. Our publishing business requires a high level of investment inpre-publication for our educational works, and in other property, plant and equipment. We expect to continue to commit funds to the publishing areas through both internal growth and acquisitions. We believe that by continuing to emphasize cost controls, technological improvements and quality control, we can continue to moderate the impact of inflation on our operating results and financial position.
Covenant Compliance As of December 31, 2017,2019, we were in compliance with all of our debt covenants. We are currently required to meet certain incurrence based financial covenants as defined under our term loan facility, notes and revolving credit facility. We have incurrence based financial covenants primarily pertaining to a maximum leverage ratio and fixed charge coverage ratio, and liquidity.ratio. A breach of any of these covenants, ratios, tests or restrictions, as applicable, for which a waiver is not obtained could result in an event of default, in which case our lenders could elect to declare all amounts outstanding to be immediately due and payable and result in a cross-default under other arrangements containing such provisions. A default would permit lenders to accelerate 58
the maturity for the debt under these agreements and to foreclose upon any collateral securing the debt owed to these lenders and to terminate any commitments of these lenders to lend to us. If the lenders accelerate the payment of the 49
indebtedness, our assets may not be sufficient to repay in full the indebtedness and any other indebtedness that would become due as a result of any acceleration. Further, in such an event, the lenders would not be required to make further loans to us, and assuming similar facilities were not established and we are unable to obtain replacement financing, it would materially affect our liquidity and results of operations. Contractual Obligations The following table provides information with respect to our estimated commitments and obligations as of December 31, 2017:2019 (in thousands): | | | | | | | | | | | | | | | | Less than | | | | | | | | | | | More than | | Contractual Obligations | | Total | | | Less than
1 year | | | 1-3 years | | 3-5 years | | | More than
5 years | | | Total | | | 1 year | | | 1-3 years | | | 3-5 years | | | 5 years | | | | | (in thousands) | | | Term loan facility due May 29, 2021 (1) | | $ | 780,000 | | | $ | 8,000 | | | $ | 16,000 | | | $ | 756,000 | | | $ | — | | | Interest payable on term loan facility due May 29, 2021 (2) | | | 134,523 | | | | 37,567 | | | | 80,303 | | | 16,653 | | | | — | | | Payments on derivative instruments | | | 1,305 | | | | 1,483 | | | | (178 | ) | | | — | | | | — | | | Term loan due November 22, 2024 (1) | | | $ | 380,000 | | | $ | 19,000 | | | $ | 38,000 | | | $ | 323,000 | | | $ | — | | Interest payable on term loan due November 22, 2024 (2) | | | | 125,305 | | | | 29,660 | | | | 51,738 | | | | 43,907 | | | | — | | 9.0% senior secured notes due February 15, 2025 | | | | 306,000 | | | | — | | | | — | | | | — | | | | 306,000 | | Interest payable on 9.0% senior secured notes due February 15, 2025 | | | | 141,143 | | | | 27,540 | | | | 55,080 | | | | 55,080 | | | | 3,443 | | Operating leases (3) | | | 369,934 | | | | 38,854 | | | | 65,460 | | | 56,135 | | | | 209,485 | | | | 263,250 | | | | 27,026 | | | | 49,238 | | | | 51,528 | | | | 135,458 | | Purchase obligations (4) | | | 48,609 | | | | 30,854 | | | | 16,183 | | | 1,522 | | | | 50 | | | | 77,540 | | | | 47,102 | | | | 29,534 | | | | 904 | | | | — | | | | | | | | | | | | | | | | | | | Total cash contractual obligations | | $ | 1,334,371 | | | $ | 116,758 | | | $ | 177,768 | | | $ | 830,310 | | | $ | 209,535 | | | $ | 1,293,238 | | | $ | 150,328 | | | $ | 223,590 | | | $ | 474,419 | | | $ | 444,901 | | | | | | | | | | | | | | | | | | |
(1) | The term loan facility principal amortizes at a rate of 1.0%5.0% per annum of the original $800.0$380.0 million amount. |
(2) | As of December 31, 2017,2019, the interest rate was 4.6%8.0%. |
(3) | Represents minimum lease payments undernon-cancelable operating leases. |
(4) | Purchase obligations are agreements to purchase goods or services that are enforceable and legally binding. These goods and services consist primarily of author advances, subcontractor expenses, information technology licenses, and outsourcing arrangements. |
In addition to the payments described above, we have employee benefit obligations that require future payments. For example, we expect to make $1.6$4.0 million of contributions in 20182020 relating to our pension and postretirement benefit plans. We expect to periodically draw and repay borrowings under the revolving credit facility. We believe that we will be able to meet our cash interest obligations on our outstanding debt when they are due and payable. Off-Balance Sheet Arrangements We have nooff-balance sheet arrangements. 50 59
Item 7A. Quantitative and Qualitative Disclosures About Market Risk We are exposed to market risk from foreign currency exchange rates and interest rates, which could affect operating results, financial position and cash flows. We manage exposure to these market risks through our regular operating and financing activities and, when appropriate, through the use of derivative financial instruments. These derivative financial instruments are utilized to hedge economic exposures as well as reduce our earnings and cash flow volatility resulting from shifts in market rates. As permitted, we may designate certain of these derivative contracts for hedge accounting treatment in accordance with authoritative guidance regarding accounting for derivative instruments and hedging activities. However, certain of these instruments may not qualify for, or we may choose not to elect, hedge accounting treatment and, accordingly, the results of our operations may be exposed to some level of volatility. Volatility in our results of operations will vary with the type and amount of derivative hedges outstanding, as well as fluctuations in the currency and interest rate market during the period. Periodically, we may enter into derivative contracts, including interest rate swap agreements and interest rate caps and collars to manage interest rate exposures, and foreign currency spot, forward, swap and option contracts to manage foreign currency exposures. The fair market values of all of these derivative contracts change with fluctuations in interest rates and/or currency rates and are designed so that any changes in their values are offset by changes in the values of the underlying exposures. Derivative financial instruments are held solely as risk management tools and not for trading or speculative purposes. By their nature, all derivative instruments involve, to varying degrees, elements of market and credit risk not recognized in our financial statements. The market risk associated with these instruments resulting from currency exchange and interest rate movements is expected to offset the market risk of the underlying transactions, assets and liabilities being hedged. Our policy is to deal with counterparties having a single A or better credit rating at the time of the execution. We manage our exposure to counterparty risk of derivative instruments by entering into contracts with a diversified group of major financial institutions and by actively monitoring outstanding positions. We continue to review liquidity sufficiency by performing various stress test scenarios, such as cash flow forecasting, which considers hypothetical interest rate movements. Furthermore, we continue to closely monitor current events and the financial institutions that support our credit facility, including monitoring their credit ratings and outlooks, credit default swap levels, capital raising and merger activity. As of December 31, 2017,2019, we had $780.0$380.0 million ($768.2361.3 million, net of discount and issuance costs) of aggregate principal amount indebtedness outstanding under our term loan facility that bears interest at a variable rate. An increase or decrease of 1% in the interest rate will change our interest expense by approximately $7.8$3.8 million on an annual basis. We also have up to $250.0 million of borrowing availability, subject to borrowing base availability, under our revolving credit facility, and borrowings under the revolving credit facility bear interest at a variable rate. We hadAs of December 31, 2019, there were no borrowingsamounts outstanding underon the revolving credit facility at December 31, 2017.facility. Assuming that the revolving credit facility is fully drawn, an increase or decrease of 1% in the interest rate will change our interest expense associated with the revolving credit facility by $2.5 million on an annual basis. Our interest rate risk relates primarily to U.S. dollar borrowings partially offset by U.S. dollar cash investments. We have historically used interest rate derivative instruments to manage our earnings and cash flow exposure to changes in interest rates. On August 17, 2015, we entered into interest rate derivative contracts with various financial institutions having an aggregate notional amount of $400.0 million to convert floating rate debt into fixed rate debt, which we designated as cash flow hedges, and for which we had $400.0$370.5 million outstanding as of December 31, 2017.2019. These contracts were effective beginning September 30, 2016 and mature on July 22, 2020. We conduct various digital development activities in Ireland, and as such, our cash flows and costs are subject to fluctuations from changes in foreign currency exchange rates. We manage our exposures to this market risk through the use of short-term foreign exchange forward and option contracts, when deemed appropriate, which were not significant as of December 31, 20172019 and December 31, 2016.2018. We do not enter into derivative transactions or use other financial instruments for trading or speculative purposes. 51 60
Item 8. Financial Statements and Supplementary Data Report of Independent Registered Public Accounting Firm To the Board of Directors and Stockholders of Houghton Mifflin Harcourt Company:Company
Opinions on the Financial Statements and Internal Control over Financial Reporting We have audited the accompanying consolidated financial statements, including the related notes, as listed in the index appearing under Item 15(a)(1),balance sheets of Houghton Mifflin Harcourt Company and its subsidiaries(the “Company”) as of December 31, 2019and 2018,and the related consolidated statements of operations, comprehensive loss, stockholders’ equity, and cash flows for each of the three years in the period ended December 31, 2019, including the related notes (collectively referred to as the “consolidated financial statements”).We also have audited the Company’sCompany's internal control over financial reporting as of December 31, 2017,2019, based on criteria established inInternal Control—Control - Integrated Framework(2013)issued by the Committee of Sponsoring Organizations of the Treadway Commission (COSO). In our opinion, the consolidatedfinancial statements referred to above present fairly, in all material respects, the financial position of the Company as of December 31, 2017 2019and 2016,2018,and the results of their itsoperations and their itscash flows for each of the three years in the period ended December 31, 2017in2019in conformity with accounting principles generally accepted in the United States of America. Also in our opinion, the Company maintained, in all material respects, effective internal control over financial reporting as of December 31, 2017,2019, based on criteria established inInternal Control—Control - Integrated Framework(2013)issued by the COSO.
Changes in Accounting Principles As discussed in Note 2 to the consolidated financial statements, the Company changed the manner in which it accounts for leases in 2019 and the manner in which it accounts for revenues from contracts with customers in 2018. Basis for Opinions The Company’sCompany's management is responsible for these consolidated financial statements, for maintaining effective internal control over financial reporting, and for its assessment of the effectiveness of internal control over financial reporting, included in Management’s Report on Internal Control over Financial Reporting appearing under Item 9A.9A. Our responsibility is to express opinions on the Company’s consolidatedfinancial statements and on the Company’sCompany's internal control over financial reporting based on our audits. We are a public accounting firm registered with the Public Company Accounting Oversight Board (United States) (“PCAOB”)(PCAOB) and are required to be independent with respect to the Company in accordance with the U.S. federal securities laws and the applicable rules and regulations of the Securities and Exchange Commission and the PCAOB. We conducted our audits inin accordance with the standards of the PCAOB. Those standards require that we plan and perform the audits to obtain reasonable assurance about whether the consolidatedfinancialconsolidated financial statements are free of material misstatement, whether due to error or fraud, and whether effective internal control over financial reporting was maintained in all material respects. Our audits of the consolidatedfinancialconsolidated financial statements included performing procedures to assess the risks of material misstatement of the consolidatedfinancialconsolidated financial statements, whether due to error or fraud, and performing procedures that respond to those risks. Such procedures included examining, on a test basis, evidence regarding the amounts and disclosures in the consolidatedfinancialconsolidated financial statements. Our audits also included evaluating the accounting principles used and significant estimates made by management, as well as evaluating the overall presentation of the consolidatedfinancialconsolidated financial statements. Our audit of internal control over financial reporting included obtaining an understanding of internal control over financial reporting, assessing the risk that a material weakness exists, and testing and evaluating the design and operating effectiveness of internal control based on the assessed risk. Our audits also included performing such other procedures as we considered necessary in the circumstances. We believe that our audits provide a reasonable basis for our opinions. 6152
Definition and Limitations of Internal Control over Financial Reporting A company’s internal control over financial reporting is a process designed to provide reasonable assurance regarding the reliability of financial reporting and the preparation of financial statements for external purposes in accordance with generally accepted accounting principles. A company’s internal control over financial reporting includes those policies and procedures that (i) pertain to the maintenance of records that, in reasonable detail, accurately and fairly reflect the transactions and dispositions of the assets of the company; (ii) provide reasonable assurance that transactions are recorded as necessary to permit preparation of financial statements in accordance with generally accepted accounting principles, and that receipts and expenditures of the company are being made only in accordance with authorizations of management and directors of the company; and (iii) provide reasonable assurance regarding prevention or timely detection of unauthorized acquisition, use, or disposition of the company’s assets that could have a material effect on the financial statements. Because of its inherent limitations, internal control over financial reporting may not prevent or detect misstatements. Also, projections of any evaluation of effectiveness to future periods are subject to the risk that controls may become inadequate because of changes in conditions, or that the degree of compliance with the policies or procedures may deteriorate. Critical Audit Matters The critical audit matters communicated beloware mattersarising from the current period audit of the consolidated financial statements that were communicated or required to be communicated to the audit committee and that (i) relate to accounts or disclosures that are material to theconsolidated financial statements and (ii) involved our especially challenging, subjective, or complex judgments. The communication of critical audit matters does not alter in any way our opinion on the consolidatedfinancial statements, taken as a whole, and we are not, by communicating the critical audit matters below, providing separate opinions on the critical audit matters or on the accounts or disclosures to which they relate. Indefinite-Lived Intangible Asset Impairment Evaluation - Trademarks and Tradenames As described in Notes 2 and 6 to the consolidated financial statements, as of December 31, 2019, the Company’s indefinite-lived intangible asset balance was $161.0 million and relates to trademarks and tradenames. Management reviews its indefinite-lived intangible assets at least annually for impairment or earlier, if an indication of impairment exists. The recoverability is evaluated using a one-step process whereby management determines the fair value by asset and then compares it to its carrying value to determine if the asset is impaired. Management estimates the fair value by preparing a relief-from-royalty discounted cash flow analysis using forward looking revenue projections. The significant assumptions used in the discounted cash flow analysis include: future net sales, a long-term growth rate, a royalty rate, and a discount rate. The principal considerations for our determination that performing procedures relating to the indefinite-lived intangible asset impairment evaluation for trademarks and tradenames is a critical audit matter are there was significant judgment by management when developing the fair value measurement of the trademarks and tradenames. This in turn led to significant auditor judgment, subjectivity, and audit effort in performing procedures to evaluate management’s significant assumptions, including future net sales, the long-term growth rate, the royalty rate, and the discount rate. Also, the audit effort involved the use of professionals with specialized skill and knowledge to assist in performing these procedures and evaluating the audit evidence obtained. Addressing the matter involved performing procedures and evaluating audit evidence in connection with forming our overall opinion on the consolidated financial statements. These procedures included testing the effectiveness of controls relating to management’s trademarks and tradenames impairment evaluation, including controls over the valuation of the trademarks and tradenames. These procedures also included, among others (i) assessing the appropriateness of management’s relief-from-royalty discounted cash flow analysis for estimating fair value of the trademarks and tradenames, (ii) testing the completeness and accuracy of the underlying input data used in the analysis, and (iii) evaluating the significant assumptions used by management, including future net sales, the long-term growth rate, the royalty rate, and the discount rate. Evaluating management’s assumptions related to future net sales and the long-term growth rate involved evaluating whether the assumptions used by management were 53
reasonable considering the past performance of the business, relevant market data and industry trends, and whether these assumptions were consistent with evidence obtained in other areas of the audit. Professionals with specialized skill and knowledge were used to assist in evaluating the Company’s discounted cash flow analysis and certain significant assumptions, including the royalty rate and the discount rate. Reserve for Royalty Advances to Authors As described in Notes 2 and 19 to the consolidated financial statements, royalty advances to authors are capitalized and represent amounts paid in advance of the sale of an author’s product and are recovered as earned. As advances are recorded, a partial reserve may be recorded immediately based primarily upon historical sales experience. Additionally, advances are evaluated periodically to determine if they are expected to be recovered on a title-by-title basis, with consideration given to the other titles in the author’s portfolio also earning against the outstanding advance. Any portion of a royalty advance that is not expected to be recovered is fully reserved. The reserve for royalty advances is reported as a reduction of the royalty advances to authors balance and was $119.7 million as of December 31, 2019. The principal considerations for our determination that performing procedures relating to the reserve for royalty advances to authors is a critical audit matter are there was significant judgment by management to determine the reserve for royalty advances, which in turn led to significant auditor subjectivity, judgment, and audit effort in performing procedures and in evaluating audit evidence relating to management’s estimate of the reserve for royalty advances to authors. Addressing the matter involved performing procedures and evaluating audit evidence in connection with forming our overall opinion on the consolidated financial statements. These procedures included testing the effectiveness of controls relating to management’s estimate of the reserve for royalty advances to authors. These procedures also included, among others (i) evaluating the appropriateness of management’s process for estimating its reserve for royalty advances to authors, (ii) assessing the reasonableness of significant assumptions used by management in developing the estimate, particularly the ability of an author’s portfolio to generate future sales, which included evaluating comparable historical sales volumes and other relevant external data, and (iii) testing the completeness and accuracy of the underlying input data, primarily relating to historical sales used by management to develop their estimate. Evaluating the assumptions related to the estimate of the reserve for royalty advances to authors involved evaluating, on a sample basis, whether the assumptions used were reasonable considering the historical sales experience and the ability of an author’s portfolio to generate future sales. /s/PricewaterhouseCoopers LLP Boston, Massachusetts February 22, 201827, 2020 We have served as the Company’s auditor since 2003. 54 62
Houghton Mifflin Harcourt Company Consolidated Balance Sheets | | | | December 31, | | | December 31, | | | (in thousands of dollars, except share information) | | 2017 | | 2016 | | | 2019 | | | 2018 | | Assets | | | | | | | | | | | | | Current assets | | | | | | | | | | | | | Cash and cash equivalents | | $ | 148,979 | | | $ | 226,102 | | | $ | 296,353 | | | $ | 253,365 | | Short-term investments | | | 86,449 | | | 80,841 | | | | — | | | | 49,833 | | Accounts receivable, net of allowances for bad debts and book returns of $23.6 million and $22.5 million, respectively | | | 201,080 | | | 216,006 | | | Accounts receivable, net of allowances for bad debts and book returns of $19.7 million and $20.7 million, respectively | | | | 184,425 | | | | 203,574 | | Inventories | | | 154,644 | | | 162,415 | | | | 213,059 | | | | 184,209 | | Prepaid expenses and other assets | | | 29,947 | | | 20,356 | | | | 19,257 | | | | 15,297 | | | | | | | | | | Total current assets | | | 621,099 | | | 705,720 | | | | 713,094 | | | | 706,278 | | | | | | | | | | | | Property, plant, and equipment, net | | | 153,906 | | | 175,202 | | | | 100,388 | | | | 125,925 | | Pre-publication costs, net | | | 324,897 | | | 314,784 | | | | 268,197 | | | | 323,641 | | Royalty advances to authors, net | | | 46,469 | | | 43,977 | | | | 44,743 | | | | 47,993 | | Goodwill | | | 783,073 | | | 783,073 | | | | 716,977 | | | | 716,073 | | Other intangible assets, net | | | 610,663 | | | 685,649 | | | | 474,225 | | | | 520,892 | | Operating lease assets | | | | 132,247 | | | | — | | Deferred income taxes | | | 3,593 | | | 3,458 | | | | 2,520 | | | | 3,259 | | Deferred commissions | | | | 29,291 | | | | 22,635 | | Other assets | | | 19,891 | | | 19,608 | | | | 31,490 | | | | 28,428 | | | | | | | | | | Total assets | | $ | 2,563,591 | | | $ | 2,731,471 | | | $ | 2,513,172 | | | $ | 2,495,124 | | | | | | | | | | Liabilities and Stockholders’ Equity | | | | | | | | | | | | | Current liabilities | | | | | | | | | | | | | Current portion of long-term debt | | $ | 8,000 | | | $ | 8,000 | | | $ | 19,000 | | | $ | 8,000 | | Accounts payable | | | 61,502 | | | 76,181 | | | | 52,128 | | | | 76,313 | | Royalties payable | | | 72,992 | | | 72,233 | | | | 72,985 | | | | 66,893 | | Salaries, wages, and commissions payable | | | 54,970 | | | 41,289 | | | | 54,938 | | | | 50,225 | | Deferred revenue | | | 275,111 | | | 272,828 | | | | 305,285 | | | | 251,944 | | Interest payable | | | 322 | | | 193 | | | | 3,826 | | | | 136 | | Severance and other charges | | | 6,926 | | | 8,863 | | | | 12,407 | | | | 6,020 | | Accrued postretirement benefits | | | 1,618 | | | 1,928 | | | | 1,571 | | | | 1,512 | | Operating lease liabilities | | | | 8,685 | | | | — | | Other liabilities | | | 22,788 | | | 23,635 | | | | 24,325 | | | | 26,649 | | | | | | | | | | Total current liabilities | | | 504,229 | | | 505,150 | | | | 555,150 | | | | 487,692 | | | | | | | | | | | | Long-term debt, net of discount and issuance costs | | | 760,194 | | | 764,738 | | | | 638,187 | | | | 755,649 | | Operating lease liabilities | | | | 134,994 | | | | — | | Long-term deferred revenue | | | 419,096 | | | 436,627 | | | | 542,821 | | | | 395,500 | | Accrued pension benefits | | | 24,133 | | | 28,956 | | | | 23,648 | | | | 29,320 | | Accrued postretirement benefits | | | 20,285 | | | 22,084 | | | | 15,113 | | | | 14,300 | | Deferred income taxes | | | 22,269 | | | 71,381 | | | | 30,871 | | | | 27,075 | | Other liabilities | | | 18,192 | | | 22,495 | | | | 6,028 | | | | 17,118 | | | | | | | | | | Total liabilities | | | 1,768,398 | | | 1,851,431 | | | | 1,946,812 | | | | 1,726,654 | | | | | | | | | | Commitments and contingencies (Note 12) | | | | | | Commitments and contingencies (Note 14) | | | | | | | | | | Stockholders’ equity | | | | | | | | | | | | | Preferred stock, $0.01 par value: 20,000,000 shares authorized; no shares issued and outstanding at December 31, 2017 and 2016 | | | — | | | | — | | | Common stock, $0.01 par value: 380,000,000 shares authorized; 147,911,466 and 147,556,804 shares issued at December 31, 2017 and 2016, respectively; 123,334,432 and 122,979,770 shares outstanding at December 31, 2017 and 2016, respectively | | | 1,479 | | | 1,475 | | | Treasury stock, 24,577,034 shares as of December 31, 2017 and 2016, respectively, at cost (related parties of $193,493 at 2017 and 2016) | | | (518,030 | ) | | (518,030 | ) | | Preferred stock, $0.01 par value: 20,000,000 shares authorized; 0 shares issued and outstanding at December 31, 2019 and 2018 | | | | — | | | | — | | Common stock, $0.01 par value: 380,000,000 shares authorized; 148,928,328 and 148,164,854 shares issued at December 31, 2019 and 2018, respectively; 124,351,294 and 123,587,820 shares outstanding at December 31, 2019 and 2018, respectively | | | | 1,489 | | | | 1,481 | | Treasury stock, 24,577,034 shares as of December 31, 2019 and 2018, respectively, at cost | | | | (518,030 | ) | | | (518,030 | ) | Capital in excess of par value | | | 4,879,793 | | | 4,868,230 | | | | 4,906,165 | | | | 4,893,174 | | Accumulated deficit | | | (3,521,527 | ) | | (3,418,340 | ) | | | (3,775,992 | ) | | | (3,562,971 | ) | Accumulated other comprehensive loss | | | (46,522 | ) | | (53,295 | ) | | | (47,272 | ) | | | (45,184 | ) | | | | | | | | | Total stockholders’ equity | | | 795,193 | | | 880,040 | | | | 566,360 | | | | 768,470 | | | | | | | | | | Total liabilities and stockholders’ equity | | $ | 2,563,591 | | | $ | 2,731,471 | | | $ | 2,513,172 | | | $ | 2,495,124 | | | | | | | | | |
The accompanying notes are an integral part of these consolidated financial statements. 55 63
Houghton Mifflin Harcourt Company Consolidated Statements of Operations | | Years Ended December 31, | | (in thousands of dollars, except share and per share data) | | 2019 | | | 2018 | | | 2017 | | Net sales | | $ | 1,390,674 | | | $ | 1,322,417 | | | $ | 1,327,029 | | Costs and expenses | | | | | | | | | | | | | Cost of sales, excluding publishing rights and pre-publication amortization | | | 668,108 | | | | 581,467 | | | | 588,518 | | Publishing rights amortization | | | 26,557 | | | | 34,713 | | | | 46,238 | | Pre-publication amortization | | | 149,515 | | | | 109,257 | | | | 119,908 | | Cost of sales | | | 844,180 | | | | 725,437 | | | | 754,664 | | Selling and administrative | | | 662,606 | | | | 649,295 | | | | 636,326 | | Other intangible asset amortization | | | 25,310 | | | | 26,933 | | | | 29,248 | | Impairment charge for pre-publication costs | | | — | | | | — | | | | 3,980 | | Restructuring/severance and other charges | | | 21,742 | | | | 11,478 | | | | 37,952 | | Gain on sale of assets | | | — | | | | (201 | ) | | | — | | Operating loss | | | (163,164 | ) | | | (90,525 | ) | | | (135,141 | ) | Other income (expense) | | | | | | | | | | | | | Retirement benefits non-service income | | | 167 | | | | 1,280 | | | | 3,486 | | Interest expense | | | (48,778 | ) | | | (45,680 | ) | | | (42,805 | ) | Interest income | | | 3,157 | | | | 2,550 | | | | 1,338 | | Change in fair value of derivative instruments | | | (899 | ) | | | (1,374 | ) | | | 1,366 | | Income from transition services agreement | | | 4,248 | | | | 1,889 | | | | — | | Loss on extinguishment of debt | | | (4,363 | ) | | | — | | | | — | | Loss from continuing operations before taxes | | | (209,632 | ) | | | (131,860 | ) | | | (171,756 | ) | Income tax expense (benefit) for continuing operations | | | 4,201 | | | | 5,597 | | | | (51,419 | ) | Loss from continuing operations | | | (213,833 | ) | | | (137,457 | ) | | | (120,337 | ) | Earnings from discontinued operations, net of tax | | | — | | | | 12,833 | | | | 17,150 | | Gain on sale of discontinued operations, net of tax | | | — | | | | 30,469 | | | | — | | Income from discontinued operations, net of tax | | | — | | | | 43,302 | | | | 17,150 | | Net loss | | $ | (213,833 | ) | | $ | (94,155 | ) | | $ | (103,187 | ) | Net loss per share attributable to common stockholders | | | | | | | | | | | | | Basic and diluted: | | | | | | | | | | | | | Continuing operations | | $ | (1.72 | ) | | $ | (1.11 | ) | | $ | (0.98 | ) | Discontinued operations | | | — | | | | 0.35 | | | | 0.14 | | Net loss | | $ | (1.72 | ) | | $ | (0.76 | ) | | $ | (0.84 | ) | Weighted average shares outstanding | | | | | | | | | | | | | Basic and diluted | | | 124,152,984 | | | | 123,444,943 | | | | 122,949,064 | |
| | | | | | | | | | | | | | (in thousands of dollars, except share and per share data) | | Years Ended December 31, | | | | 2017 | | | 2016 | | | 2015 | | Net sales | | $ | 1,407,511 | | | $ | 1,372,685 | | | $ | 1,416,059 | | Costs and expenses | | | | | | | | | | | | | Cost of sales, excluding publishing rights andpre-publication amortization | | | 617,802 | | | | 610,715 | | | | 622,668 | | Publishing rights amortization | | | 46,238 | | | | 61,351 | | | | 81,007 | | Pre-publication amortization | | | 126,038 | | | | 130,243 | | | | 120,506 | | | | | | | | | | | | | | | Cost of sales | | | 790,078 | | | | 802,309 | | | | 824,181 | | Selling and administrative (related parties of $10,489 in 2015—Note 14) | | | 654,860 | | | | 699,544 | | | | 681,124 | | Other intangible asset amortization | | | 30,748 | | | | 26,750 | | | | 22,038 | | Impairment charge forpre-publication costs and intangible assets | | | 3,980 | | | | 139,205 | | | | — | | Restructuring | | | 40,653 | | | | — | | | | — | | Severance and other charges | | | 713 | | | | 15,650 | | | | 4,767 | | | | | | | | | | | | | | | Operating loss | | | (113,521 | ) | | | (310,773 | ) | | | (116,051 | ) | | | | | | | | | | | | | | Other income (expense) | | | | | | | | | | | | | Interest expense | | | (42,805 | ) | | | (39,181 | ) | | | (32,254 | ) | Interest income | | | 1,338 | | | | 518 | | | | 209 | | Change in fair value of derivative instruments | | | 1,366 | | | | (614 | ) | | | (2,362 | ) | Loss on extinguishment of debt | | | — | | | | — | | | | (3,051 | ) | | | | | | | | | | | | | | Loss before taxes | | | (153,622 | ) | | | (350,050 | ) | | | (153,509 | ) | Income tax (benefit) expense | | | (50,435 | ) | | | (65,492 | ) | | | (19,640 | ) | | | | | | | | | | | | | | Net loss | | $ | (103,187 | ) | | $ | (284,558 | ) | | $ | (133,869 | ) | | | | | | | | | | | | | | Net loss per share attributable to common stockholders | | | | | | | | | | | | | Basic | | $ | (0.84 | ) | | $ | (2.32 | ) | | $ | (0.98 | ) | | | | | | | | | | | | | | Diluted | | $ | (0.84 | ) | | $ | (2.32 | ) | | $ | (0.98 | ) | | | | | | | | | | | | | | Weighted average shares outstanding | | | | | | | | | | | | | Basic | | | 122,949,064 | | | | 122,418,474 | | | | 136,760,107 | | | | | | | | | | | | | | | Diluted | | | 122,949,064 | | | | 122,418,474 | | | | 136,760,107 | | | | | | | | | | | | | | |
The accompanying notes are an integral part of these consolidated financial statements. 56 64
Houghton Mifflin Harcourt Company Consolidated Statements of Comprehensive Loss | | | | Years Ended December 31, | | | Years Ended December 31, | | | (in thousands of dollars) | | 2017 | | 2016 | | 2015 | | | 2019 | | | 2018 | | | 2017 | | Net loss | | $ | (103,187 | ) | | $ | (284,558 | ) | | $ | (133,869 | ) | | $ | (213,833 | ) | | $ | (94,155 | ) | | $ | (103,187 | ) | | Other comprehensive income (loss), net of taxes: | | | | | | | | Other comprehensive (loss) income, net of taxes: | | | | | | | | | | | | | | Foreign currency translation adjustments, net of tax | | | 109 | | | (1,220 | ) | | (2,140 | ) | | | (511 | ) | | | (156 | ) | | | 109 | | Net change in pension and benefit plan liabilities, net of tax | | | 1,734 | | | (9,937 | ) | | (7,100 | ) | | | 1,800 | | | | (2,056 | ) | | | 1,734 | | Unrealized gain (loss) on short-term investments, net of tax | | | (18 | ) | | 57 | | | (58 | ) | | | 9 | | | | 9 | | | | (18 | ) | Net change in unrealized gain (loss) on derivative financial instruments, net of tax | | | 4,948 | | | (2,467 | ) | | (3,641 | ) | | | (3,386 | ) | | | 3,541 | | | | 4,948 | | | | | | | | | | | | | Other comprehensive income (loss), net of taxes | | | 6,773 | | | (13,567 | ) | | (12,939 | ) | | | | | | | | | | | | | Other comprehensive (loss) income, net of taxes | | | | (2,088 | ) | | | 1,338 | | | | 6,773 | | Comprehensive loss | | $ | (96,414 | ) | | $ | (298,125 | ) | | $ | (146,808 | ) | | $ | (215,921 | ) | | $ | (92,817 | ) | | $ | (96,414 | ) | | | | | | | | | | | |
The accompanying notes are an integral part of these consolidated financial statements. 57 65
Houghton Mifflin Harcourt Company Consolidated Statements of Cash Flows | | Years Ended December 31, | | (in thousands of dollars) | | 2019 | | | 2018 | | | 2017 | | Cash flows from operating activities | | | | | | | | | | | | | Net loss | | $ | (213,833 | ) | | $ | (94,155 | ) | | $ | (103,187 | ) | Adjustments to reconcile net loss to net cash provided by operating activities | | | | | | | | | | | | | Earnings from discontinued operations, net of tax | | | — | | | | (12,833 | ) | | | (17,150 | ) | Gain on sale of discontinued operations, net of tax | | | — | | | | (30,469 | ) | | | — | | Gain on sale of assets | | | — | | | | (201 | ) | | | — | | Depreciation and amortization expense | | | 272,692 | | | | 250,466 | | | | 266,443 | | Amortization and impairments of operating lease assets | | | 15,949 | | | | — | | | | — | | Amortization of debt discount and deferred financing costs | | | 4,286 | | | | 4,181 | | | | 4,181 | | Deferred income taxes | | | 4,535 | | | | 5,140 | | | | (49,247 | ) | Stock-based compensation expense | | | 13,968 | | | | 13,248 | | | | 10,728 | | Impairment charge for pre-publication costs | | | — | | | | — | | | | 3,980 | | Restructuring charges related to property, plant, and equipment | | | — | | | | — | | | | 9,841 | | Loss on extinguishment of debt | | | 4,363 | | | | — | | | | — | | Change in fair value of derivative instruments | | | 899 | | | | 1,374 | | | | (1,366 | ) | Changes in operating assets and liabilities, net of acquisitions | | | | | | | | | | | | | Accounts receivable | | | 19,182 | | | | (11,005 | ) | | | 12,564 | | Inventories | | | (28,850 | ) | | | (33,515 | ) | | | 8,122 | | Other assets | | | (20,155 | ) | | | 3,908 | | | | (10,548 | ) | Accounts payable and accrued expenses | | | (12,136 | ) | | | 16,144 | | | | (5,937 | ) | Royalties payable and author advances, net | | | 9,342 | | | | (1,650 | ) | | | (1,449 | ) | Deferred revenue | | | 200,473 | | | | (7,692 | ) | | | (13,500 | ) | Interest payable | | | 3,690 | | | | (186 | ) | | | 129 | | Severance and other charges | | | 10,631 | | | | (2,823 | ) | | | 221 | | Accrued pension and postretirement benefits | | | (4,800 | ) | | | (904 | ) | | | (6,932 | ) | Operating lease liabilities | | | (17,281 | ) | | | — | | | | — | | Other liabilities | | | (7,980 | ) | | | 5,056 | | | | (2,145 | ) | Net cash provided by operating activities—continuing operations | | | 254,975 | | | | 104,084 | | | | 104,748 | | Net cash provided by operating activities—discontinued operations | | | — | | | | 10,831 | | | | 30,382 | | Net cash provided by operating activities | | | 254,975 | | | | 114,915 | | | | 135,130 | | Cash flows from investing activities | | | | | | | | | | | | | Proceeds from sales and maturities of short-term investments | | | 50,000 | | | | 86,539 | | | | 80,690 | | Purchases of short-term investments | | | — | | | | (49,553 | ) | | | (86,211 | ) | Additions to pre-publication costs | | | (102,562 | ) | | | (123,403 | ) | | | (131,282 | ) | Additions to property, plant, and equipment | | | (37,561 | ) | | | (53,741 | ) | | | (55,092 | ) | Proceeds from sale of business | | | — | | | | 140,000 | | | | — | | Acquisition of intangible asset | | | — | | | | — | | | | (2,000 | ) | Acquisition of business, net of cash acquired | | | (5,447 | ) | | | — | | | | — | | Investment in preferred stock | | | (750 | ) | | | (500 | ) | | | — | | Proceeds from sale of assets | | | — | | | | 1,085 | | | | — | | Net cash (used in) provided by investing activities—continuing operations | | | (96,320 | ) | | | 427 | | | | (193,895 | ) | Net cash used in investing activities—discontinued operations | | | — | | | | (6,832 | ) | | | (11,028 | ) | Net cash used in investing activities | | | (96,320 | ) | | | (6,405 | ) | | | (204,923 | ) | Cash flows from financing activities | | | | | | | | | | | | | Proceeds from term loan, net of discount | | | 364,800 | | | | — | | | | — | | Proceeds from senior secured notes, net of discount | | | 299,880 | | | | — | | | | — | | Borrowings under revolving credit facility | | | 60,000 | | | | 50,000 | | | | — | | Payments of revolving credit facility | | | (60,000 | ) | | | (50,000 | ) | | | — | | Payments of long-term debt | | | (772,000 | ) | | | (8,000 | ) | | | (8,000 | ) | Payments of deferred financing fees | | | (8,493 | ) | | | — | | | | — | | Tax withholding payments related to net share settlements of restricted stock units and awards | | | (2,018 | ) | | | (1,190 | ) | | | (1,450 | ) | Proceeds from stock option exercises | | | — | | | | — | | | | 512 | | Issuance of common stock under employee stock purchase plan | | | 1,028 | | | | 1,263 | | | | 1,608 | | Net collections under transition service agreement | | | 1,136 | | | | 3,803 | | | | — | | Net cash used in financing activities—continuing operations | | | (115,667 | ) | | | (4,124 | ) | | | (7,330 | ) | Net increase (decrease) in cash and cash equivalents | | | 42,988 | | | | 104,386 | | | | (77,123 | ) | Cash and cash equivalents at the beginning of the period | | | 253,365 | | | | 148,979 | | | | 226,102 | | Cash and cash equivalents at the end of the period | | $ | 296,353 | | | $ | 253,365 | | | $ | 148,979 | | Supplemental disclosure of cash flow information | | | | | | | | | | | | | Interest paid | | $ | 41,059 | | | $ | 41,758 | | | $ | 38,295 | | Income taxes paid | | | 671 | | | | 430 | | | | 715 | | Non-cash investing activities | | | | | | | | | | | | | Pre-publication costs included in accounts payable and accruals | | $ | 5,480 | | | $ | 13,974 | | | $ | 16,681 | | Property, plant, and equipment included in accounts payable and accruals | | | 3,039 | | | | 1,908 | | | | 11,403 | | Property, plant, and equipment acquired under finance leases | | | 327 | | | | 480 | | | | — | |
| | | | | | | | | | | | | | | | Years Ended December 31, | | | (in thousands of dollars) | | 2017 | | | 2016 | | | 2015 | | Cash flows from operating activities | | | | | | | | | | | | | Net loss | | $ | (103,187 | ) | | $ | (284,558 | ) | | $ | (133,869 | ) | Adjustments to reconcile net loss to net cash provided by operating activities | | | | | | | | | | | | | Depreciation and amortization expense | | | 278,518 | | | | 298,169 | | | | 296,609 | | Amortization of debt discount and deferred financing costs | | | 4,181 | | | | 4,181 | | | | 7,216 | | Deferred income taxes | | | (49,247 | ) | | | (68,347 | ) | | | 48,214 | | Stock-based compensation expense | | | 10,828 | | | | 10,567 | | | | 12,452 | | Loss on extinguishment of debt | | | — | | | | — | | | | 3,051 | | Impairment charge forpre-publication costs and intangible assets | | | 3,980 | | | | 139,205 | | | | — | | Restructuring charges related to property, plant, and equipment | | | 10,167 | | | | — | | | | — | | Change in fair value of derivative instruments | | | 1,366 | | | | 614 | | | | 2,362 | | Changes in operating assets and liabilities, net of acquisitions | | | | | | | | | | | | | Accounts receivable | | | 14,926 | | | | 40,094 | | | | 30,808 | | Inventories | | | 7,771 | | | | 9,031 | | | | 26,228 | | Other assets | | | (10,548 | ) | | | 6,673 | | | | (2,562 | ) | Accounts payable and accrued expenses | | | (7,149 | ) | | | (23,685 | ) | | | 13,145 | | Royalties payable and author advances, net | | | (1,733 | ) | | | (12,774 | ) | | | 6,238 | | Deferred revenue | | | (15,248 | ) | | | 37,658 | | | | 124,489 | | Interest payable | | | 129 | | | | 87 | | | | 59 | | Severance and other charges | | | 221 | | | | 4,315 | | | | (3,615 | ) | Accrued pension and postretirement benefits | | | (6,932 | ) | | | 3,675 | | | | (4,869 | ) | Other liabilities | | | (2,913 | ) | | | (21,154 | ) | | | (77,597 | ) | | | | | | | | | | | | | | Net cash provided by operating activities | | | 135,130 | | | | 143,751 | | | | 348,359 | | | | | | | | | | | | | | | Cash flows from investing activities | | | | | | | | | | | | | Proceeds from sales and maturities of short-term investments | | | 80,690 | | | | 197,724 | | | | 286,732 | | Purchases of short-term investments | | | (86,211 | ) | | | (81,086 | ) | | | (198,633 | ) | Additions topre-publication costs | | | (139,108 | ) | | | (124,031 | ) | | | (103,709 | ) | Additions to property, plant, and equipment | | | (58,294 | ) | | | (105,553 | ) | | | (82,987 | ) | Acquisition of business, net of cash acquired | | | — | | | | — | | | | (578,190 | ) | Acquisition of intangible asset | | | (2,000 | ) | | | — | | | | — | | Investment in preferred stock | | | — | | | | (1,000 | ) | | | — | | | | | | | | | | | | | | | Net cash used in investing activities | | | (204,923 | ) | | | (113,946 | ) | | | (676,787 | ) | | | | | | | | | | | | | | Cash flows from financing activities | | | | | | | | | | | | | Proceeds from term loan, net of discount | | | — | | | | — | | | | 796,000 | | Payments of long-term debt | | | (8,000 | ) | | | (8,000 | ) | | | (247,125 | ) | Payments of deferred financing fees | | | — | | | | — | | | | (15,255 | ) | Repurchases of common stock (related parties of $193,493 in 2015) | | | — | | | | (55,017 | ) | | | (463,013 | ) | Tax withholding payments related to net share settlements of restricted stock units and awards | | | (1,450 | ) | | | (1,672 | ) | | | (658 | ) | Proceeds from stock option exercises | | | 512 | | | | 24,532 | | | | 36,155 | | Issuance of common stock under employee stock purchase plan | | | 1,608 | | | | 2,197 | | | | — | | | | | | | | | | | | | | | Net cash (used in) provided by financing activities | | | (7,330 | ) | | | (37,960 | ) | | | 106,104 | | | | | | | | | | | | | | | Net decrease in cash and cash equivalents | | | (77,123 | ) | | | (8,155 | ) | | | (222,324 | ) | Cash and cash equivalent at the beginning of the period | | | 226,102 | | | | 234,257 | | | | 456,581 | | | | | | | | | | | | | | | Cash and cash equivalent at the end of the period | | $ | 148,979 | | | $ | 226,102 | | | $ | 234,257 | | | | | | | | | | | | | | | Supplemental disclosure of cash flow information | | | | | | | | | | | | | Interest paid | | $ | 38,295 | | | $ | 34,884 | | | $ | 24,412 | | Income taxes paid | | | 715 | | | | 5,104 | | | | 2,987 | | Non-cash investing and financing activities | | | | | | | | | | | | | Pre-publication costs included in accounts payable | | $ | 16,681 | | | $ | 14,397 | | | $ | 14,642 | | Property, plant, and equipment included in accounts payable | | | 11,403 | | | | 5,707 | | | | 6,202 | | Property, plant, and equipment acquired under capital leases | | | — | | | | — | | | | 1,356 | | Amounts due from seller for acquisition | | | — | | | | — | | | | 2,884 | | Issuance of common stock upon exercise of warrants | | | — | | | | — | | | | 1,815 | |
The accompanying notes are an integral part of these consolidated financial statements. 58 66
Houghton Mifflin Harcourt Company Consolidated Statements of Stockholders’ Equity | | | | | | | | | | | | | | Capital | | | | | | | Accumulated | | | | | | | | Common Stock | | | | | | | in excess | | | | | | | Other | | | | | | (in thousands of dollars, except share | | Shares | | | | | | | | | | | of Par | | | Accumulated | | | Comprehensive | | | | | | information) | | Issued | | | Par Value | | | Treasury Stock | | | Value | | | Deficit | | | Loss | | | Total | | Balance at December 31, 2016 | | | 147,556,804 | | | $ | 1,475 | | | $ | (518,030 | ) | | $ | 4,868,230 | | | $ | (3,418,340 | ) | | $ | (53,295 | ) | | $ | 880,040 | | Net loss | | | — | | | | — | | | | — | | | | — | | | | (103,187 | ) | | | — | | | | (103,187 | ) | Other comprehensive income, net of tax | | | — | | | | — | | | | — | | | | — | | | | — | | | | 6,773 | | | | 6,773 | | Issuance of common stock for employee purchase plan | | | 176,749 | | | | 2 | | | | — | | | | 2,130 | | | | — | | | | — | | | | 2,132 | | Issuance of common stock for vesting of restricted stock units | | | 175,555 | | | | 2 | | | | — | | | | (2 | ) | | | — | | | | — | | | | — | | Issuance of common stock for exercise of stock options | | | 39,200 | | | | — | | | | — | | | | 512 | | | | — | | | | — | | | | 512 | | Stock withheld to cover tax withholdings requirements upon vesting of restricted stock units | | | — | | | | — | | | | — | | | | (1,450 | ) | | | — | | | | — | | | | (1,450 | ) | Restricted stock forfeitures and cancellations | | | (36,842 | ) | | | — | | | | — | | | | — | | | | — | | | | — | | | | — | | Stock-based compensation expense | | | — | | | | — | | | | — | | | | 10,373 | | | | — | | | | — | | | | 10,373 | | Balance at December 31, 2017 | | | 147,911,466 | | | | 1,479 | | | | (518,030 | ) | | | 4,879,793 | | | | (3,521,527 | ) | | | (46,522 | ) | | | 795,193 | | Net loss | | | — | | | | — | | | | — | | | | — | | | | (94,155 | ) | | | — | | | | (94,155 | ) | Other comprehensive income, net of tax | | | — | | | | — | | | | — | | | | — | | | | — | | | | 1,338 | | | | 1,338 | | Effects of adoption of new revenue accounting standard | | | — | | | | — | | | | — | | | | — | | | | 52,711 | | | | — | | | | 52,711 | | Issuance of common stock for employee purchase plan | | | 175,428 | | | | 2 | | | | — | | | | 1,611 | | | | — | | | | — | | | | 1,613 | | Issuance of common stock for vesting of restricted stock units | | | 346,255 | | | | 3 | | | | — | | | | (3 | ) | | | — | | | | — | | | | — | | Stock withheld to cover tax withholdings requirements upon vesting of restricted stock units | | | — | | | | — | | | | — | | | | (1,190 | ) | | | — | | | | — | | | | (1,190 | ) | Restricted stock forfeitures and cancellations | | | (268,295 | ) | | | (3 | ) | | | — | | | | 3 | | | | — | | | | — | | | | — | | Stock-based compensation expense | | | — | | | | — | | | | — | | | | 12,960 | | | | — | | | | — | | | | 12,960 | | Balance at December 31, 2018 | | | 148,164,854 | | | | 1,481 | | | | (518,030 | ) | | | 4,893,174 | | | | (3,562,971 | ) | | | (45,184 | ) | | | 768,470 | | Net loss | | | — | | | | — | | | | — | | | | — | | | | (213,833 | ) | | | — | | | | (213,833 | ) | Other comprehensive loss, net of tax | | | — | | | | — | | | | — | | | | — | | | | — | | | | (2,088 | ) | | | (2,088 | ) | Effects of adoption of new lease accounting standard | | | — | | | | — | | | | — | | | | — | | | | 812 | | | | — | | | | 812 | | Issuance of common stock for employee purchase plan | | | 186,114 | | | | 2 | | | | — | | | | 1,436 | | | | — | | | | — | | | | 1,438 | | Issuance of common stock for vesting of restricted stock units | | | 577,360 | | | | 6 | | | | — | | | | (6 | ) | | | — | | | | — | | | | — | | Stock withheld to cover tax withholdings requirements upon vesting of restricted stock units | | | — | | | | — | | | | — | | | | (2,018 | ) | | | — | | | | — | | | | (2,018 | ) | Stock-based compensation expense | | | — | | | | — | | | | — | | | | 13,579 | | | | — | | | | — | | | | 13,579 | | Balance at December 31, 2019 | | | 148,928,328 | | | $ | 1,489 | | | $ | (518,030 | ) | | $ | 4,906,165 | | | $ | (3,775,992 | ) | | $ | (47,272 | ) | | $ | 566,360 | |
| | | | | | | | | | | | | | | | | | | | | | | | | | | | | (in thousands of dollars, except share
information) | | Common Stock | | | Treasury Stock | | | Capital
in excess
of Par
Value | | | Accumulated
Deficit | | | Accumulated
Other
Comprehensive
Loss | | | Total | | | | Shares
Issued | | | Par Value | | | | | | | Balance at December 31, 2014 | | | 142,000,019 | | | $ | 1,420 | | | $ | — | | | $ | 4,784,962 | | | $ | (2,999,913 | ) | | $ | (26,789 | ) | | $ | 1,759,680 | | Net loss | | | — | | | | — | | | | — | | | | — | | | | (133,869 | ) | | | — | | | | (133,869 | ) | Other comprehensive loss, net of tax | | | — | | | | — | | | | — | | | | — | | | | — | | | | (12,939 | ) | | | (12,939 | ) | Issuance of common stock for exercise of warrants | | | 70,513 | | | | 1 | | | | — | | | | (1 | ) | | | — | | | | — | | | | — | | Issuance of common stock for vesting of restricted stock units | | | 67,725 | | | | 1 | | | | — | | | | (1 | ) | | | — | | | | — | | | | — | | Issuance of common stock for exercise of stock options | | | 2,932,839 | | | | 29 | | | | — | | | | 36,926 | | | | — | | | | — | | | | 36,955 | | Issuance of restricted stock | | | 542,882 | | | | 5 | | | | — | | | | (5 | ) | | | — | | | | — | | | | — | | Stock withheld to cover tax withholdings requirements upon vesting of restricted stock units | | | — | | | | — | | | | — | | | | (658 | ) | | | — | | | | — | | | | (658 | ) | Repurchases of common stock (related parties of $193,493) | | | — | | | | — | | | | (463,013 | ) | | | — | | | | — | | | | — | | | | (463,013 | ) | Stock-based compensation expense | | | — | | | | — | | | | — | | | | 12,165 | | | | — | | | | — | | | | 12,165 | | | | | | | | | | | | | | | | | | | | | | | | | | | | | | | Balance at December 31, 2015 | | | 145,613,978 | | | | 1,456 | | | | (463,013 | ) | | | 4,833,388 | | | | (3,133,782 | ) | | | (39,728 | ) | | | 1,198,321 | | Net loss | | | — | | | | — | | | | — | | | | — | | | | (284,558 | ) | | | — | | | | (284,558 | ) | Other comprehensive loss, net of tax | | | — | | | | — | | | | — | | | | — | | | | — | | | | (13,567 | ) | | | (13,567 | ) | Issuance of common stock for employee purchase plan | | | 140,579 | | | | 1 | | | | — | | | | 2,777 | | | | — | | | | — | | | | 2,778 | | Issuance of common stock for vesting of restricted stock units and awards | | | 102,151 | | | | 1 | | | | — | | | | (1 | ) | | | — | | | | — | | | | — | | Issuance of common stock for exercise of stock options | | | 1,879,924 | | | | 19 | | | | — | | | | 23,714 | | | | — | | | | — | | | | 23,733 | | Stock withheld to cover tax withholdings requirements upon vesting of restricted stock units and awards | | | — | | | | — | | | | — | | | | (1,672 | ) | | | — | | | | — | | | | (1,672 | ) | Restricted stock forfeitures and cancellations | | | (179,828 | ) | | | (2 | ) | | | — | | | | 2 | | | | — | | | | — | | | | — | | Repurchases of common stock | | | — | | | | — | | | | (55,017 | ) | | | — | | | | — | | | | — | | | | (55,017 | ) | Stock-based compensation expense | | | — | | | | — | | | | — | | | | 10,022 | | | | — | | | | — | | | | 10,022 | | | | | | | | | | | | | | | | | | | | | | | | | | | | | | | Balance at December 31, 2016 | | | 147,556,804 | | | | 1,475 | | | | (518,030 | ) | | | 4,868,230 | | | | (3,418,340 | ) | | | (53,295 | ) | | | 880,040 | | Net loss | | | — | | | | — | | | | — | | | | — | | | | (103,187 | ) | | | — | | | | (103,187 | ) | Other comprehensive loss, net of tax | | | — | | | | — | | | | — | | | | — | | | | — | | | | 6,773 | | | | 6,773 | | Issuance of common stock for employee purchase plan | | | 176,749 | | | | 2 | | | | — | | | | 2,130 | | | | — | | | | — | | | | 2,132 | | Issuance of common stock for vesting of restricted stock units and awards | | | 175,555 | | | | 2 | | | | — | | | | (2 | ) | | | — | | | | — | | | | — | | Issuance of common stock for exercise of stock options | | | 39,200 | | | | — | | | | — | | | | 512 | | | | — | | | | — | | | | 512 | | Stock withheld to cover tax withholdings requirements upon vesting of restricted stock units and awards | | | — | | | | — | | | | — | | | | (1,450 | ) | | | — | | | | — | | | | (1,450 | ) | Restricted stock forfeitures and cancellations | | | (36,842 | ) | | | — | | | | — | | | | — | | | | — | | | | — | | | | — | | Stock-based compensation expense | | | — | | | | — | | | | — | | | | 10,373 | | | | — | | | | — | | | | 10,373 | | | | | | | | | | | | | | | | | | | | | | | | | | | | | | | Balance at December 31, 2017 | | | 147,911,466 | | | $ | 1,479 | | | $ | (518,030 | ) | | $ | 4,879,793 | | | $ | (3,521,527 | ) | | $ | (46,522 | ) | | $ | 795,193 | | | | | | | | | | | | | | | | | | | | | | | | | | | | | | |
The accompanying notes are an integral part of these consolidated financial statements. 6759
Houghton Mifflin Harcourt Company Notes to Consolidated Financial Statements (in thousands of dollars, except share and per share information) Houghton Mifflin Harcourt Company (“HMH”,HMH,” “Houghton Mifflin Harcourt”, “we”, “us”, “our”,Harcourt,” “we,” “us,” “our,” or the “Company”) is a global learning company, specializing in world-class content, services and cutting edge technologycommitted to delivering connected solutions that enable learning inengage learners, empower educators and improve student outcomes. As a changing landscape. We provide dynamic, engaging, and effective solutions across a varietyleading provider of media and in three key focus areas: early learning, kindergartenKindergarten through 12th grade(“K-12”) core curriculum, supplemental and beyond the classroom, reaching overintervention solutions and professional learning services, HMH partners with educators and school districts to uncover solutions that unlock students’ potential and extend teachers’ capabilities. HMH estimates that it serves more than 50 million students and 3 million educators in more than 150 countries, worldwide.while its award-winning children’s books, novels, non-fiction, and reference titles are enjoyed by readers throughout the world. TheK-12 market isWe are organized along 2 business segments: Education and HMH Books & Media. Within our primaryEducation division, we focus on the K-12 market and, in the United States, we are a leading provider of educational content by market share. Someleader. We specialize in comprehensive core curriculum, supplemental and intervention solutions, and we provide ongoing support in professional learning and coaching for educators and administrators. Our offerings are rooted in learning science, and we work with research partners, universities and third-party organizations as we design, build, implement and iterate our offerings to maximize their effectiveness. We are purposeful about innovation, leveraging technology to create engaging and immersive experiences designed to deepen learning experiences for students and to extend teachers’ capabilities so that they can focus on making meaningful connections with their students.
Our diverse portfolio enables us to help ensure that every student and teacher has the tools needed for success. We are able to build deep partnerships with school districts and leverage the scope of our core educational offerings includeHMH Science Dimensions,Collections,GO! Math,Read 180 Universal,to provide holistic solutions at scale with the support of our far-reaching sales force andJourneys. talented field-based specialists and consultants. We believe our long-standing reputationprovide print, digital, and trusted brand enable usblended print/digital solutions that are tailored to capitalize on trends in the education market through our existinga district’s needs, goals and developing channels.technological readiness. Furthermore, for nearly two centuries, we have published renowned and awarded children’s, fiction, nonfiction,non-fiction, culinary and reference titles enjoyed by readers throughout the world. Our distinguished author list includes ten Nobel Prize winners, forty-eightforty-nine Pulitzer Prize winners, and fifteentwenty-six National Book Award winners. We are home to popular characters and titles such as Curious George, Carmen Sandiego,The Lord of the Rings, The Whole30,The Best American Series, the Peterson Field Guides, CliffsNotes, andThe Polar Express, and publisheddistinguishedpublished distinguished authors such as Philip Roth,Tim O’Brien, Temple Grandin, Tim O’Brien, Amos Oz,Ferriss, Kwame Alexander, Lois Lowry, and Chris Van Allsburg. We sell our products and services across multiple media and distribution channels. Leveraging our portfolio of content, including some of our best-known children’s brands and titles, such as Carmen Sandiego and Curious George, we have created interactive digital content, mobile applications and educational games that can be used by families at home or on the go.
Our digital products portfolio, combined with our content development or distribution agreements with recognized technology leaders such as Apple, Google, Intel and Microsoft, enable us to bring our next-generation educational solutions and content to learners across virtually all platforms and devices. Additionally, we believe our technology and development capabilities allow us to enhance content engagement and effectiveness with embedded assessment, interactivity and personalized adaptable content as well as increased accessibility.
The consolidated financial statements of HMH include the accounts of all of our wholly-owned subsidiaries as of December 31, 20172019 and 20162018 and for the periods ended December 31, 2017, 20162019, 2018 and 2015.2017. The accompanying consolidated financial statements have been prepared in accordance with accounting principles generally accepted in the United States of America (“GAAP”). Our accompanying consolidated financial statements include the results of operations of the Company and our wholly-owned subsidiaries. All material intercompany accounts and transactions are eliminated in consolidation. We expect our net cash provided by operations combined with our cash and cash equivalents and borrowing availability under our revolving credit facility to provide sufficient liquidity to fund our current obligations, capital spending, debt service requirements and working capital requirements over at least the next twelve months. The ability of the Company to fund planned operations is based on assumptions which involve significant judgment and estimates of future revenues, capital spend and other operating costs. 60
Houghton Mifflin Harcourt Company Notes to Consolidated Financial Statements (in thousands of dollars, except share and per share information) Seasonality and Comparability Our net sales, operating profit or loss and net cash provided by or used in operations are impacted by the inherent seasonality of the academic calendar.calendar, which results in a cash flow usage in the first half of the year and a cash flow generation in the second half of the year. Consequently, the performance of our businesses may not be comparable quarter to consecutive quarter and should be considered on the basis of results for the whole year or by comparing results in a quarter with results in the same quarter for the previous year. 68
Houghton Mifflin Harcourt Company
Notes to Consolidated Financial Statements
(in thousands of dollars, except share and per share information)
Approximately 87% of our net sales for the year ended December 31, 20172019 were derived from our Education segment, which is a markedly seasonal business. Schools conduct the majority of their purchases in the second and third quarters of the calendar year in preparation for the beginning of the school year. Thus, for the years ended December 31, 2017, 20162019, 2018 and 2015,2017, approximately 67% of our consolidated net sales were realized in the second and third quarters. Sales ofK-12 instructional materials and customized testing products are also cyclical with some years offering more sales opportunities than others in light of the state adoption calendar. The amount of funding available at the state level for educational materials also has a significant effect onyear-to-year net sales. Although the loss of a single customer would not have a material adverse effect on our business, schedules of school adoptions and market acceptance of our products can materially affectyear-to-year net sales performance. 2. | Significant Accounting Policies and Recent Accounting Standards |
Use of Estimates The preparation of financial statements in conformity with accounting principles generally accepted in the United States of America requires the use of estimates, assumptions and judgments by management that affect the reported amounts of assets, liabilities, revenues, expenses, and related disclosure of contingent assets and liabilities in the amounts reported in the financial statements and accompanying notes. On an ongoing basis, we evaluate our estimates and assumptions including, but not limited to, book returns, deferred revenue and related standalone selling price estimates, allowance for bad debts, recoverability of advances to authors, valuation of inventory, financial instruments valuation, income taxes, pensions and other postretirement benefits obligations, contingencies, litigation, depreciation and amortization periods, and the recoverability of long-term assets such as property, plant, and equipment, capitalizedpre-publication costs, other identified intangibles goodwill, deferred revenue, income taxes, pensions and other postretirement benefits, contingencies, and litigation.goodwill. We base our estimates on historical experience and on various other assumptions that we believe to be reasonable under the circumstances, the results of which form the basis for making judgments about the carrying value of assets and liabilities that are not readily apparent from other sources. Actual results may differ from those estimates. Revenue Recognition We derive revenue primarily from the sale of print and digital content and instructional materials, trade books, reference materials, assessment materials and multimedia instructional programs; license fees for book rights, content and software; and services that include test development, test delivery, test scoring, professional development, consulting and training as well as access to hosted interactive content. Revenue is recognized when a customer obtains control of promised goods or services, in an amount that reflects the consideration which we expect to receive in exchange for those goods or services. To determine revenue recognition for arrangements that we determine are within the scope of the new revenue recognition accounting standard, we perform the following five steps: (i) identify the contract with a customer; (ii) identify the performance obligations in the contract; (iii) determine the transaction price; (iv) allocate the transaction price to the performance obligations in the contract; and (v) recognize revenue when (or as) we satisfy a performance obligation. We only once persuasive evidenceapply the five-step model to contracts when it is probable that we will collect the consideration we are entitled to in exchange for the goods or services we transfer to the customer. At contract inception, we assess the goods or services promised within each contract and determine those that are performance obligations and assess whether each promised good or service is distinct. We then recognize as revenue the amount of an arrangement with the customer exists,transaction price that is allocated to the sales pricerespective performance obligation when (or as) the performance obligation is fixed or determinable, deliverysatisfied.
Revenue is measured as the amount of consideration we expect to receive in exchange for transferring products or services has occurred, titleto a customer. To the extent the transaction price includes variable consideration, which generally reflects estimated future product returns, we estimate the amount of variable consideration that should be included in the transaction price utilizing the expected value method to which we expect to be entitled. Variable consideration is included in the transaction price if, in our judgment, it is probable that a significant future reversal of cumulative revenue under the contract will not occur. Estimates of variable consideration and riskthe determination of losswhether to include estimated amounts in the transaction price are based largely on all information (historical, current and forecasted) that is reasonably available. Sales, value add, and other taxes collected on behalf of third parties are excluded from revenue. 61
Houghton Mifflin Harcourt Company Notes to Consolidated Financial Statements (in thousands of dollars, except share and per share information) We estimate the collectability of contracts upon execution. For contracts with respectrights of return, the transaction price is adjusted to reflect the estimated returns for the arrangement on these sales and is made at the time of sale based on historical experience by product line or customer. The transaction prices allocated are adjusted to reflect expected returns and are based on historical return rates and sales patterns. Shipping and handling fees charged to customers are included in net sales. When determining the transaction price of a contract, an adjustment is made if payment from a customer occurs either significantly before or significantly after performance, resulting in a significant financing component. We do not assess whether a significant financing component exists if the period between when we perform our obligations under the contract and when the customer pays is one year or less. Significant financing components’ income is included in interest income. Contracts are sometimes modified to account for changes in contract specifications and requirements. Contract modifications exist when the modification either creates new, or changes the existing, enforceable rights and obligations. Generally, contract modifications are for products have transferredor services that are not distinct from the existing contract due to the inability to use, consume or sell the products or services on their own to generate economic benefits and are accounted for as if they were part of that existing contract. The effect of such a contract modification on the transaction price and measure of progress for the performance obligation to which it relates is recognized as an adjustment to revenue (either as an increase in or a reduction of revenue) on a cumulative catch-up basis. Physical product revenue is recognized when the customer obtains control of our product, which occurs at a point in time, and may be upon shipment or upon delivery based on the contractual shipping terms of a contract. Revenues from static digital content commence upon delivery to the customer all significant obligations, if any, have been performed,of the digital entitlement that is required to access and collectiondownload the content and is reasonably assured.typically recognized at a point in time. Revenues from subscription software licenses, related hosting services and product support are recognized evenly over the license term as we believe this best represents the pattern of transfer to the customer. The perpetual software licenses provide the customer with a functional license to our products and their related revenues are recognized when the customer receives entitlement to the software. For the technical services provided to customers in connection with the software license, including hosting services related to perpetual licenses, we recognize revenue upon delivery of the services. As the invoices are based on each day of service, this is directly linked to the transfer of benefit to the customer. If the contract contains a single performance obligation, the entire transaction price is allocated to the single performance obligation. We enter into certain contractual arrangementscontracts that have multiple elements,performance obligations, one or more of which may be delivered subsequent to the delivery of other elements.performance obligations. These multiple-deliverable arrangementsperformance obligations may include print and digital media, professional development services, training, software licenses, access to hosted content, and various services related to the software including, but not limited to hosting, maintenance and support, and implementation. For these multiple-element arrangements, weWe allocate revenue to each deliverable of the arrangementtransaction price based on the estimated relative standalone selling prices of the deliverables. In such circumstances, we firstpromised products or services underlying each performance obligation. We determine thestandalone selling price of each deliverable based on (i) vendor-specific objective evidence of fair value (“VSOE”) if that exists, (ii) third-party evidence of selling price (“TPE”) when VSOE does not exist, or (iii) our best estimate of the selling price when neither VSOE nor TPE exists. 69
Houghton Mifflin Harcourt Company
Notes to Consolidated Financial Statements
(in thousands of dollars, except share and per share information)
Revenue is then allocated to thenon-software deliverables as a group and to the software deliverables as a group using the relative selling prices of each of the deliverables in the arrangement, based on the price at which the performance obligation is sold separately. If the standalone selling price hierarchy.Non-software deliverablesis not observable through past transactions, we estimate the standalone selling price taking into account available information such as market conditions and internally approved standard pricing discounts related to the performance obligations. Generally, our performance obligations include print and digital textbooks and instructional materials, trade books, reference materials, formative assessment materials and multimedia instructional programs; licenses to book rights and content; access to hosted content; and services including test development, test delivery, test scoring, professional development, consulting and training when those services do not relate totraining. Our contracts may also contain software deliverables. Software deliverables include softwareperformance obligations including perpetual and subscription-based licenses and software maintenance and support services.
Accounts Receivable Accounts receivable include amounts billed and currently due from customers and are recorded net of allowances for doubtful accounts and reserves for returns. In the normal course of business, we extend credit to customers that satisfy predefined criteria. Allowances for doubtful accounts are established through the evaluation of accounts receivable aging and prior collection experience to estimate the ultimate collectability of these receivables. 62
Houghton Mifflin Harcourt Company Notes to Consolidated Financial Statements (in thousands of dollars, except share and per share information) Contract Assets Contract assets include unbilled amounts where revenue is recognized over time as the services professional services and training when those services relateare delivered to software deliverables. For thenon-software deliverables, we determine the revenue for each deliverablecustomer based on its relative selling price in the arrangementextent of progress towards completion and we recognize revenue upon delivery of the product or service, assuming all other revenue recognition criteria have been met. Revenue for test delivery, test scoring and training is recognized when the service has been completed. Revenue for test development, professional development, consulting and training is recognized as the service is provided. Revenue for access to hosted interactive content is recognized ratably over the term of the arrangement.
For the software deliverables as a group, we recognize revenue in accordance with the authoritative guidance for software revenue recognition. As our software licenses are typically sold with maintenance and support, professional services or training, we use the residual method to determineexceeds the amount of software license revenue to be recognized if VSOE has not been established for all deliverables. Under the residual method, arrangement consideration of the software deliverables as a group is allocatedbilled to the undelivered elements based upon VSOE of those elements, with the residual amount of the arrangement fee allocated tocustomer, and recognized as license revenue upon delivery, assuming all other revenue recognition criteria have been met. If VSOE of one or more of the undelivered services or other elements does not exist, all revenues of the software-deliverables arrangement are deferred until delivery of all of those services or other elements has occurred, or until VSOE of each of those services or other elements can be established.
As products are shipped with right of return, a provision for estimated returns on these salespayment is made atnot subject to the timepassage of sale based on historical experience by product line or customer.
Shipping and handling fees charged to customerstime. Amounts may not exceed their net realizable value. Contract assets are included in prepaid expenses and other assets on our consolidated balance sheets.
Deferred Commissions Our incremental direct costs of obtaining a contract, which consist of sales commissions, are deferred and amortized over the period of contract performance. Applying the practical expedient, we recognize sales commission expense when incurred if the amortization period of the assets that we otherwise would have recognized is one year or less. At December 31, 2019 and 2018, we had $29.3 million and $22.6 million of deferred commissions, respectively. We had $13.2 million and $10.5 million of amortization expense related to deferred commissions during the years ended December 31, 2019 and 2018, respectively. These costs are included in selling and administrative expenses. Deferred Revenue Our contract liabilities consist of advance payments and billings in excess of revenue recognized and are classified as deferred revenue on our consolidated balance sheets. Our contract assets and liabilities are accounted for and presented on a net sales. Referbasis as either a contract asset or contract liability at the end of each reporting period. We classify deferred revenue as current or noncurrent based on the timing of when we expect to “Recent Accounting Standards”recognize revenue. In order to determine revenue recognized in the period from contract liabilities, we first allocate revenue to the individual contract liability balance outstanding at the beginning of the period until the revenue exceeds that balance. If additional advances are received on those contracts in subsequent periods, we assume all revenue recognized in the reporting period first applies to the beginning contract liability as opposed to a portion applying to the new advances for the expected impact of our adoption of the new revenue standard.period.
Advertising Costs and Sample Expenses Advertising costs are charged to selling and administrative expenses as incurred. Advertising costs were $12.6 million, $11.2$12.0 million and $9.1$12.4 million for the years ended December 31, 2017, 20162019, 2018 and 2015,2017, respectively. Sample expenses are charged to selling and administrative expenses when the samples are shipped. Cash and Cash Equivalents Cash and cash equivalents consist primarily of cash in banks and highly liquid investment securities that have maturities of three months or less when purchased. The carrying amount of cash equivalents approximates fair value because of the short-term maturity of these investments. 70
Houghton Mifflin Harcourt Company
Notes to Consolidated Financial Statements
(in thousands of dollars, except share and per share information)
Short-term Investments Short-term investments typically consist of marketable securities with maturities between three and twelve months at the balance sheet date. We have classified all of our short-term investments asavailable-for-sale at December 31, 2017 and 2016.2018. The investments are reported at fair value with any unrealized gains or losses excluded from earnings and reported as a separate component of stockholders’ equity as other comprehensive income (loss). Accounts Receivable Accounts receivable are recorded net of allowances for doubtful accounts and reserves for returns. In the normal course of business, we extend credit to customers that satisfy predefined criteria. We estimate the collectability of our receivables. Allowances for doubtful accounts are established through the evaluation of accounts receivable aging and prior collection experience to estimate the ultimate collectability of these receivables. Reserves for returns are based on historical return rates and sales patterns. 63
Houghton Mifflin Harcourt Company Notes to Consolidated Financial Statements (in thousands of dollars, except share and per share information) Inventories Inventories are stated at the lower of weighted-average cost or net realizable value. The level of obsolete and excess inventory is estimated on a program or title level-basis by comparing the number of units in stock with past usage and the expected future demand. The expected future demand of a program or title is determined by the copyright year, the previous year’s usage, the subsequent years’ sales forecast, and known forward-looking trends including our development cycle to replace the title or program and competing titles or programs. Property, Plant, and Equipment Property, plant, and equipment are stated at cost, or in the case of assets acquired in business combinations, at fair value as of the acquisition date, less accumulated depreciation. Equipment under capital lease is stated at fair value at inception of the lease, less accumulated depreciation. Maintenance and repair costs are charged to expense as incurred, and renewals and improvements that extend the useful life of the assets are capitalized. Costs associated with developing film and episodic series assets are deferred if such amounts are expected to be recovered through future revenues. Film and episodic series costs are amortized on a pro rata basis of revenue earned and total revenue expected to be earned from the film or episodic series. Depreciation on property, plant, and equipment is calculated using the straight-line method over the estimated useful lives of the assets or, in the case of assets acquired in business combinations, over their remaining lives. Equipment held under capital leases and leasehold improvements are amortized using the straight-line method over the shorter of the lease term or estimated useful life of the asset. Estimated useful lives of property, plant, and equipment are as follows: | | | | | | | Estimated
Useful Life | | Building and building equipment | | | 10 to 35 years | | Machinery and equipment | | | 2 to 15 years | | Capitalized software and internal-use software | | | 3 to 5 years | | Leasehold improvements | | | Lesser of useful life or lease term | Film and media | Revenue earned |
CapitalizedInternal-Use Software and Software Development Costs Capitalizedinternal-use andexternal-use software areand software is included in property, plant and equipment on the consolidated balance sheets. 71
Houghton Mifflin Harcourt Company
Notes to Consolidated Financial Statements
(in thousands of dollars, except share and per share information)
We capitalize certain costs related to obtaining or developing computer software for internal use including external customer-facing websites. Costs incurred during the application development stage, including external direct costs of materials and services, and payroll and payroll related costs for employees who are directly associated with theinternal-use software project, are capitalized and amortized on a straight-line basis over the expected useful life of the related software. The application development stage includes design of chosen path, software configuration and integration, coding, hardware installation and testing. Costs incurred during the preliminary project stage, as well as maintenance, training and upgrades that do not result in additional functionality subsequent to general release are expensed as incurred. Certain computer software development costs for software that is to be sold or marketed are capitalized in the consolidated balance sheets. Capitalization of computer software development costs begins upon the establishment of technological feasibility. We define the establishment of technological feasibility as a working model. Amortization of capitalized computer software development costs is provided on aproduct-by-product basis using the straight-line method, beginning upon commercial release of the product and continuing over the remaining estimated economic life of the product. The carrying amounts of computer software development costs are annually compared to net realizable value and impairment charges are recorded, as appropriate, when amounts expected to be realized are lower. 64
Houghton Mifflin Harcourt Company Notes to Consolidated Financial Statements (in thousands of dollars, except share and per share information) We reviewinternal-use software and software development costs for impairment. For the years ended December 31, 2017, 20162019, 2018 and 2015,2017, there was no0 impairment of software developments costs.costs and internal-use software. Pre-publication Costs We capitalize the art, prepress, manuscript and other costs incurred in the creation of the master copy of a book or other media (the“pre-publication “pre-publication costs”).Pre-publication costs are primarily amortized from the year of sale over five years using thesum-of-the-years-digits method, which is an accelerated method for calculating an asset’s amortization. Under this method, the amortization expense recorded for apre-publication cost asset is approximately 33% (year 1), 27% (year 2), 20% (year 3), 13% (year 4) and 7% (year 5). This policy is used throughout the Company, except for the Trade PublishingHMH Books & Media young readers and general interest books, which generally expenses such costs as incurred, and the assessment products, which uses the straight-line amortization method.incurred. Additionally,pre-publication costs recorded in connection with the acquisition of the EdTech business are amortized over 7 years on a projected sales pattern. The amortization methods and periods chosen best reflectreflects the pattern of expected sales generated from individual titles or programs. We periodically evaluate the remaining lives and recoverability of capitalizedpre-publication costs, which are often dependent upon program acceptance by state adoption authorities. Amortization expense related topre-publication costs for the years ended December 31, 2019, 2018 and 2017 2016 and 2015 were $126.0$149.5 million, $130.2$109.3 million and $120.5$119.9 million, respectively. For the year ended December 31, 2017, an impairment charge forpre-publication costs of $4.0 million was recorded as certain products will no longer be sold in the marketplace. For the years ended December 31, 20162019 and 2015,2018, there was no0 impairment ofpre-publication costs. Goodwill and Indefinite-lived Intangible Assets Goodwill is the excess of the purchase price paid over the fair value of the net assets of the business acquired. Other intangible assets principally consist of branded trademarks and trade names, acquired publishing rights and customer relationships. Goodwill and indefinite-lived intangible assets (certain tradenames) are not amortized, but are reviewed at least annually for impairment or earlier, if an indication 72
Houghton Mifflin Harcourt Company
Notes to Consolidated Financial Statements
(in thousands of dollars, except share and per share information)
of impairment exists. Goodwill is allocated entirely to our Education reporting unit. Determining the fair value of a reporting unit is judgmental in nature and involves the use of significant estimates and assumptions. These estimates and assumptions may include revenue growth ratesour market capitalization, selection of a control premium, and operating margins used to calculate projected future cash flows, risk-adjusted discount rates, future economic and market conditions, the determination of appropriate market comparables as well as the fair value of individual assets and liabilities. We have the option of first assessing qualitative factors to determine whether it is necessary to perform the currenttwo-step impairment test for goodwill or we can perform thetwo-step impairment test without performing the qualitative assessment. In performing the qualitative (Step 0) assessment, events and circumstances specific to the reporting unit and to the entity as a whole, such as macroeconomic conditions, industry and market considerations, overall financial performance and cost factors are considered when evaluating whether it is more likely than not that the fair value of the reporting unit is less than its carrying amount. Recoverability of goodwill can also be evaluated using atwo-step process. In the first step, the fair value of a reporting unit is compared to its carrying value. If the fair value of a reporting unit exceeds the carrying value of the net assets assigned to a reporting unit, goodwill is considered not impaired and no further testing is required. If the carrying value of the net assets assigned to a reporting unit exceeds the fair value of a reporting unit, the second step of the impairment test is performed in order to determine the implied fair value of a reporting unit’s goodwill. Determining the implied fair value of goodwill requires valuation of a reporting unit’s tangible and intangible assets and liabilities in a manner similar to the allocation of purchase price in a business combination. If the carrying value of a reporting unit’s goodwill exceeds its implied fair value, goodwill is deemed impaired and is written down to the extent of the difference. We estimate total fair value of the Education reporting unit by using various valuation techniques including an evaluation of our market capitalization and peer company multiples. With regard to indefinite-lived intangible assets, which includes the Houghton Mifflin Harcourt tradename at December 31, 2019 and 2018, the recoverability is evaluated using a one-step process whereby we determine the fair value by asset and 65
Houghton Mifflin Harcourt Company Notes to Consolidated Financial Statements (in thousands of dollars, except share and per share information) then compare it to its carrying value to determine if the asset is impaired. We estimate the fair value by preparing a relief-from-royalty discounted cash flow analysis using forward looking projections of the Education reporting units’ future operating results and by comparing the value of the Education reporting unit to the implied market value of selected peers.revenue projections. The significant assumptions used in the discounted cash flow analysis include: future net sales, a long-term growth rate, a royalty rate and net sales growth, gross margins, other operating expenses, working capital levels, investments in new products, capital spending, tax, cash flows, the discounteda discount rate used to present value future cash flows and the terminal value of the Education reporting unit. The discount rate is based on the weighted-average cost of capital method at the date of the evaluation. With regard to indefinite-lived intangible assets, the recoverability is evaluated using aone-step process whereby we determine the fair value by asset, which is then compared to its carrying value to determine if the assets are impaired. We completed our annual goodwill impairment tests as of October 1, 20172019 and 2016. In 2017 and 2016, we used income and market valuation approaches to determine the fair value of the Education reporting unit and used the most recent five year strategic plan as the initial basis of our analysis. We performed an interim quantitative evaluation as of December 31, 2017 related to our decreased market capitalization.2018. The fair value of the Education reporting unit was in excess of its carrying value by approximately 18% as of October 1, 2019, and substantially exceeded its carrying value as of the evaluation dates. NoOctober 1, 2018. Adverse changes in our market capitalization or peer company multiples by an equivalent amount could give rise to an impairment. There was 0 goodwill was deemed to be impairedimpairment for the years ended December 31, 2017, 20162019, 2018 and 2015, respectively.2017. We will continue to monitor and evaluate the carrying value of goodwill. If market and economic conditions or business performance deteriorate, this could increase the likelihood of us recording an impairment charge. We completed our annual indefinite-lived intangible assets impairment tests as of October 1, 20172019 and 2016. We recordednon-cash impairment charges of $139.2 million for the year ended December 31, 2016. The impairment charges related to four specific tradenames within the Education segment in 2016 and primarily resulted from the strategic decision to market our products under the Houghton Mifflin Harcourt and HMH name rather than legacy imprints along with certain declining sales projections. No2018. NaN indefinite-lived intangible assets were deemed to be impaired for the years ended December 31, 20172019, 2018 and 2015. 73
Houghton Mifflin Harcourt Company
Notes to Consolidated Financial Statements
(in thousands of dollars, except share and per share information)
2017. Publishing Rights A publishing right is an acquired right that allows us to publish and republish existing and future works as well as create new works based on previously published materials. We determinedetermined the fair market value of the publishing rights arising from business combinations by discounting theafter-tax cash flows projected to be derived from the publishing rights and titles to their net present value using a rate of return that accounts for the time value of money and the appropriate degree of risk. The useful life of the publishing rights is based on the lives of the various copyrights involved. We calculate amortization using the percentage of the projected operating income before taxes derived from the titles in the current year as a percentage of the total estimated operating income before taxes over the remaining useful life. Acquired publication rights, as well as customer-related intangibles with definitive lives, are primarily amortized on an accelerated basis over periods ranging from 3 to 20 years. We review our publishing rights for impairment whenever events or changes in circumstances indicate that the carrying amount of an asset may not be fully recoverable. NaN publishing rights were deemed to be impaired for the years ended December 31, 2019, 2018 and 2017. Impairment of Other Long-lived Assets We review our other long-lived assets for impairment whenever events or changes in circumstances indicate that the carrying amount of an asset may not be fully recoverable. If the future undiscounted cash flows are less than their book value, impairment exists. The impairment is measured as the difference between the book value and the fair value of the underlying asset. Fair value is normally determined using an undiscounted cash flow model. Severance We accrue postemployment benefits if the obligation is attributable to services already rendered, rights to those benefits accumulate, payment of benefits is probable, and amount of benefit is reasonably estimated. Postemployment benefits include severance benefits. Subsequent to recording such accrued severance liabilities, changes in market or other conditions may result in changes to assumptions upon which the original liabilities were recorded that could result in an adjustment to the liabilities. 66
Houghton Mifflin Harcourt Company Notes to Consolidated Financial Statements (in thousands of dollars, except share and per share information) Royalty Advances Royalty advances to authors are capitalized and represent amounts paid in advance of the sale of an author’s product and are recovered as earned. As advances are recorded, a partial reserve may be recorded immediately based primarily upon historical sales experience. AdvancesAdditionally, advances are evaluated periodically to determine if they are expected to be recovered.recovered on a title-by-title basis, with consideration given to the other titles in the author’s portfolio also earning against the outstanding advance. Any portion of a royalty advance that is not expected to be recovered is fully reserved. Cash payments for royalty advances are included within cash flows from operating activities, under the caption “Royalties payable and author advances, net,” in our consolidated statements of cash flows. Leases On January 1, 2019, we adopted the new lease accounting standard using the modified retrospective method. We applied the guidance to each lease as of January 1, 2019 with a cumulative effect adjustment to the opening balance of accumulated deficit as of that date. The standard requires lessees to recognize a lease liability and a right of use asset on the balance sheet for operating leases. Right of use assets represent our right to use an underlying asset for the lease term, and lease liabilities represent our obligation to make lease payments arising from the lease. Right of use assets and lease liabilities are recognized at the lease commencement date based on the estimated present value of lease payments over the lease term. Accounting for finance leases is substantially unchanged. Prior comparative periods were not adjusted. We elected the package of practical expedients permitted under the transition guidance within the new standard, which allowed us to not reassess whether any expired or existing contracts are or contain leases, carry forward the historical lease classification and to not reassess initial direct costs for any existing leases. We did not elect the hindsight practical expedient to determine the lease term for existing leases. Upon implementation of the new guidance, we have elected the practical expedients to combine lease and non-lease components, and to not recognize right of use assets and lease liabilities for short-term leases. The adoption of this guidance impacted our consolidated balance sheets due to the recognition of the lease rights and obligations related to our office space, automobile fleet and office equipment leases as assets and liabilities of approximately $148.0 million and $161.0 million, respectively. The adjustment to accumulated deficit of approximately $0.8 million related to a previously recorded deferred gain on the sale leaseback of a warehouse. The impact on our results of operations and cash flows was not material. Under the new lease accounting standard, we determine if an arrangement is a lease at inception. Right of use assets and lease liabilities are recognized at commencement date based on the present value of remaining lease payments over the lease term. For this purpose, we consider only payments that are fixed and determinable at the time of commencement. As most of our leases do not provide an implicit rate, we use our incremental borrowing rate based on the information available at commencement date in determining the present value of lease payments. Our incremental borrowing rate is a hypothetical rate based on our understanding of what our credit rating would be. The right of use asset also includes any lease payments made prior to commencement and is recorded net of any lease incentives received. Our lease terms may include options to extend or terminate the lease when it is reasonably certain that we will exercise such options. When determining the probability of exercising such options, we consider contract-based, asset-based, entity-based, and market-based factors. Our lease agreements may contain variable costs such as common area maintenance, insurance, real estate taxes or other costs. Variable lease costs are expensed as incurred on our consolidated statements of operations. Our lease agreements generally do not contain any residual value guarantees or restrictive covenants. Operating leases are included in operating lease assets and operating lease liabilities on our consolidated balance sheets. Finance leases are included in property, plant, and equipment, and other liabilities on our consolidated balance sheets. 67
Houghton Mifflin Harcourt Company Notes to Consolidated Financial Statements (in thousands of dollars, except share and per share information) Income Taxes We record income taxes using the asset and liability method. Deferred income tax assets and liabilities are recognized for future tax consequences attributable to differences between the financial statement carrying amounts of existing assets and liabilities and their respective income tax basis, and operating loss and tax credit carryforwards. Our consolidated financial statements contain certain deferred tax assets which have arisen primarily as a result of interest expense limitations, as well as other temporary differences between 74
Houghton Mifflin Harcourt Company
Notes to Consolidated Financial Statements
(in thousands of dollars, except share and per share information)
financial and tax accounting. We establish a valuation allowance if the likelihood of realization of the deferred tax assets is reduced based on an evaluation of objectiveobjectively verifiable evidence. Significant management judgment is required in determining our provision for income taxes, our deferred tax assets and liabilities and any valuation allowance recorded against those deferred tax assets. We evaluate the weight of all available evidence to determine whether it is more likely than not that some portion or all of the deferred income tax assets will not be realized. We also evaluate any uncertain tax positions and only recognize the tax benefit from an uncertain tax position if it is more likely than not that the tax position will be sustained on examination by the taxing authorities, based on the technical merits of the position. The tax benefits recognized in the financial statements from such positions are then measured based on the largest benefit that has a greater than 50 percent likelihood of being realized upon settlement. We record a liability for unrecognized tax benefits resulting from uncertain tax positions taken or expected to be taken in a tax return. Any change in judgment related to the expected ultimate resolution of uncertain tax positions is recognized in earnings in the period in which such change occurs. Interest and penalties, if any, related to unrecognized tax benefits are recorded in income tax expense. We have accounted for the tax effects of The Tax Cuts and Jobs Act, enacted on December 22, 2017, on a provisional basis. Our accounting for certain income tax effects is incomplete, but we have determined reasonable estimates for those effects. Our reasonable estimates are included in our financial statements as of December 31, 2017. We expect to complete our accounting during the one year measurement period from the enactment date. See Note 8 to the consolidated financial statements for further detail.
Stock-Based Compensation Certain employees and directors have been granted stock options, restricted stock and restricted stock units in our common stock. Stock-based compensation expense reflects the fair value of stock-based awards measured at the grant date and recognized over the relevant service period. We estimate the fair value of each stock-based award on the measurement date using the current market price based on the target value of the award for restricted stock and restricted stock units, the Monte Carlo simulation for market-based restricted stock units and the Black-Scholes valuation model for stock options. We recognize stock-based compensation expense over the awards requisite service period on a straight-line basis for time basedtime-based stock options, restricted stock and restricted stock units and on a graded basis for restricted stock and restricted stock units that are contingent on the achievement of performance conditions. Comprehensive Loss Comprehensive loss is defined as changes in the equity of an enterprise except those resulting from stockholder transactions. The amounts shown on the consolidated statements of stockholders’ equity and comprehensive loss relate to the cumulative effect of changes in pension and postretirement liabilities, foreign currency translation gain and loss adjustments, unrealized gains and losses on short-term investments and gains and losses on derivative instruments. Foreign Currency Translation The functional currency for each of our subsidiaries is the currency of the primary economic environment in which the subsidiary operates, generally defined as the currency in which the entity generates and expends 75
Houghton Mifflin Harcourt Company
Notes to Consolidated Financial Statements
(in thousands of dollars, except share and per share information)
cash. Foreign currency denominated assets and liabilities are translated into United States dollars at current rates as of the balance sheet date and the revenue, costs and expenses are translated at the average rates established during each reporting period. Cumulative translation gains or losses are recorded in equity as an element of accumulated other comprehensive income. 68
Houghton Mifflin Harcourt Company Notes to Consolidated Financial Statements (in thousands of dollars, except share and per share information) Financial Instruments Derivative financial instruments are employed to manage risks associated with interest rate exposures and are not used for trading or speculative purposes. We recognize all derivative instruments in our consolidated balance sheets at fair value. Changes in the fair value of derivatives are recognized periodically either in earnings or in stockholders’ equity as a component of accumulated other comprehensive loss, depending on whether the derivative financial instrument qualifies for hedge accounting and, if so, whether it qualifies as a fair value hedge or a cash flow hedge. Gains and losses on derivatives designated as hedges, to the extent they are effective, are recorded in other comprehensive loss, and subsequently reclassified to earnings to offset the impact of the hedged items when they occur. Changes in the fair value of derivatives not qualifying as hedges are reported in earnings. During 20172019, 2018 and 2016,2017, our interest rate swaps were designated as hedges and the majority qualify for hedge accounting. Accordingly, we recorded an unrealized gainloss of $4.9$3.4 million and an unrealized lossgains of $2.5$3.5 million and $4.9 million in our statements of comprehensive loss to account for the changes in fair value of these derivatives during the periods ended December 31, 20172019, 2018 and 2016,2017, respectively. The corresponding $1.2 million and $6.1$1.0 million hedge liability is included within long-termcurrent other liabilities in our consolidated balance sheet as of December 31, 2017 and 2016, respectively.2019. The corresponding $2.4 million hedge asset is included within long-term other assets in our consolidated balance sheet as of December 31, 2018. Our foreign exchange forward contracts did not qualify for hedge accounting because we did not contemporaneously document our hedging strategy upon entering into the hedging arrangements. Treasury Stock We account for treasury stock under the cost method. When shares are reissued or retired from treasury stock they are accounted for at an average price. Upon retirement the excess over par value is charged against capital in excess of par value. Net Loss per Share Basic net loss per share attributable to common stockholders is computed by dividing net loss attributable to common stockholders by the weighted-average common shares outstanding during the period. Except where the result would be anti-dilutive, net loss per share is computed using the treasury stock method for the exercise of stock options. For periods in which the Company has reported net losses, diluted net loss per share attributable to common stockholders is the same as basic net loss per share attributable to common stockholders, since dilutive common shares are not assumed to have been issued if their effect is anti-dilutive. Diluted net loss per share attributable to common stockholders is the same as basic net loss per share attributable to common stockholders for the years ended December 31, 2017, 20162019, 2018 and 2015.2017. Recent Accounting Standards Recent accounting pronouncements, not included below, are not expected to have a material impact on our consolidated financial position andor results of operations. 76
Houghton Mifflin Harcourt Company
Notes to Consolidated Financial Statements
(in thousands of dollars, except share and per share information)
Recently Issued Accounting Standards In March 2017,August 2018, the Financial Accounting Standards Board (“FASB”) issued new guidance on a customer's accounting for implementation, set-up, and other upfront costs incurred in a cloud computing arrangement that is hosted by the vendor (i.e., a service contract). Under the new guidance, customers will apply the same criteria for capitalizing implementation costs as they would for an arrangement to improve the presentation of net periodic pension cost and net periodic post-retirement benefit cost. The changes todevelop or obtain internal use software. Accordingly, the guidance require employersrequires a customer to reportdetermine the service cost component in the same line item as other compensation costs arising from services rendered by employees during the reporting period. The other components of net benefit costs will be presented in the income statement separately from the service cost and outsidestage of a subtotalproject that the implementation activity relates to and the nature of income from operations.the associated costs in order to determine whether those costs should be expensed as incurred or capitalized. The guidance also requires the customer to amortize the capitalized implementation costs as an expense over the term of the hosting arrangement. The new standard will be effective in 2018, and we believe it2020. We do not currently expect that the adoption of this standard will not have a material impact on our consolidated financial statements. In January 2017, the FASB issued updated guidance to simplify the test for goodwill impairment by the elimination of Step 2 in the determination on whether goodwill should be considered impaired. The annual assessments are still required to be completed. The guidance will be effective in 2020, with early adoption 69
Houghton Mifflin Harcourt Company Notes to Consolidated Financial Statements (in thousands of dollars, except share and per share information) permitted. We are currently indo not expect that the process of evaluating the impactadoption of this guidance will have a material impact on our consolidated financial statements. Recently Adopted Accounting Standards In February 2016, the FASB issued guidance that primarily requires lessees to recognize most leases on their balance sheets but we dorecord expenses on their income statements in a manner similar to current accounting. We adopted the guidance on January 1, 2019 using the modified retrospective method and did not expect itadjust comparative periods or modify disclosures in those comparative periods. See “Leases” above. In May 2014, the FASB issued new guidance related to revenue recognition. This new accounting standard replaced most current U.S. GAAP guidance on this topic and eliminated most industry-specific guidance. The new revenue recognition standard provides a unified model to determine when and how revenue is recognized. The core principle is that an entity should recognize revenue to depict the transfer of promised goods or services to customers in an amount that reflects the consideration to which the entity expects to be entitled in exchange for those goods or services. Entities had the choice of adopting the new standard either retrospectively to all periods presented in the financial statements (the full retrospective method) or as a cumulative-effect adjustment as of the date of adoption (modified retrospective method) in the year of adoption without applying to comparative periods financial statements. We adopted the guidance on January 1, 2018 applying the modified retrospective method. In March 2017, the FASB issued guidance to improve the presentation of net periodic pension cost and net periodic post-retirement benefit cost. The changes to the guidance required employers to report the service cost component in the same line item as other compensation costs arising from services rendered by employees during the reporting period. The other components of net benefit costs have been presented in the income statement separately from the service cost and outside of a subtotal of income from operations. The guidance became effective January 1, 2018 and the adoption of the guidance did not have a material impact on our consolidated financial statements. In November 2016, the FASB issued guidance on restricted cash, which requiresrequired amounts generally described as restricted cash and restricted cash equivalents be included with cash and cash equivalents when reconciling the total beginning and ending amounts for the periods shown on the statement of cash flows. The guidance will bebecame effective in 2019January 1, 2018 using a retrospective transition method to each period presented. We doThe adoption of the guidance did not expect it to have a material impact on our consolidated financial statements. In August 2016, the FASB issued a guidance update to classifications of certain cash receipts and cash payments on the Statement of Cash Flows with the objective of reducing the existing diversity in practice. This updated guidance addresses the following eight specific cash flow issues: debt prepayment or debt extinguishment costs; settlement ofzero-coupon debt instruments or other debt instruments with coupon interest rates that are insignificant in relation to the effective interest rate of the borrowing; contingent consideration payments made after a business combination; proceeds from the settlement of insurance claims; proceeds from the settlement of corporate-owned life insurance policies (including bank-owned life insurance policies); distributions received from equity method investees; beneficial interests in securitization transactions; and separately identifiable cash flows and application of the predominance principle. The guidance will bebecame effective inJanuary 1, 2018 and we dothe adoption of the guidance did not expect it to have a material impact on our consolidated financial statements. In February 2016,On January 14, 2019, we completed the FASB issued guidance that primarily requires lessees to recognize most leases on their balance sheets but record expenses on their income statementsacquisition of certain assets of PV Waggle LLC, which comprised a web-based adaptive learning solution providing Math and English Language Arts (“ELA”) instruction for students in grades 2-8 for a manner similar to currenttotal purchase price of approximately $5.4 million. The transaction was accounted for under the acquisition method of accounting. For lessors, the guidance modifies the classification criteriaGoodwill, other intangible assets and the accounting for sales-type and direct financing leases. The guidance is effective in 2019 with early adoption permitted. We are currently in the process of evaluating the impact of this guidance on our consolidated financial statements and footnote disclosures, but we believe the adoption of this guidance will have a material impact on our consolidated balance sheets due to the recognitionother liabilities recorded as part of the lease rightsacquisition totaled approximately $0.9 million, $5.2 million and obligations related to our office space leases as$0.7 million, respectively. The other intangible assets represent developed technology and liabilities.were valued using a replacement cost approach. Measurement period adjustments were not material.
In May 2014, the FASB issued new guidance related to revenue recognition. This new accounting standard will replace most current U.S. GAAP guidance on this topic and eliminate most industry-specific guidance. The new revenue recognition standard provides a unified model to determine when and how revenue is recognized. The core principle is that an entity should recognize revenue to depict the transfer of promised goods or services to customers in an amount that reflects the consideration for which the entity expects to be70
77
Houghton Mifflin Harcourt Company Notes to Consolidated Financial Statements (in thousands of dollars, except share and per share information) entitled in exchange for those goods or services. Entities may adopt the new standard either retrospectively to all periods presented in the financial statements (the full retrospective method) or as a cumulative-effect adjustment as of the date of adoption (modified retrospective method) in the year of adoption without applying to comparative periods financial statements. Further, in August 2015, the FASB issued guidance to defer the effective adoption date by one year to December 15, 2017 for annual reporting periods beginning after that date and permitted early adoption of the standard, but not before fiscal years beginning after the original effective date of December 15, 2016. We will adopt the guidance for the annual reporting period beginning on January 1, 2018 using the modified retrospective method.
As the new standard will supersede substantially all existing revenue recognition guidance, we believe it will impact the revenue recognition for a significant number of our contracts, in addition to our business processes and our information technology systems. As a result, we established a cross-functional coordinated team to implement the new revenue recognition standard. We have implemented changes to our systems, processes and internal controls to meet the standard’s reporting and disclosure requirements.
We have evaluated the impact of the adoption of the new revenue recognition standard and expect it will be significant to our consolidated financial statements and footnote disclosures, principally as it relates to the following areas:
Software licenses –4. | Discontinued Operations |
On October 1, 2018, we believe there will be an impactcompleted the sale of all the assets, including intellectual property, used primarily in our Riverside clinical and standardized testing business (“Riverside Business”) for cash consideration received of $140.0 million and the purchaser’s assumption of all liabilities relating to our accounting for software license revenue. Under the current guidance, our software licenses may be recognized ratably overRiverside Business subject to specified exceptions. Net proceeds from the lifesale after the payment of transaction costs were approximately $135.0 million with a post-tax book gain on sale of approximately $30.5 million. The gain was recorded in the fourth quarter of 2018 as the transaction closed on October 1, 2018. The tax gain on the sale was offset by 2018 losses. The results of the service period. This is due to vendor specific objective evidence (“VSOE”) not being established for the undelivered maintenance services as they are not sold separately from the software licenses. The requirement for establishing VSOE does not exist under the new standard and will require us to recognize the software license revenue at a pointRiverside Business were previously reported in time, which is predominately at the time of delivery. Incremental costs to acquire new contracts– in accordanceour Education segment. In connection with the new guidance, we plan to capitalize and amortize sales commission fees based on the transfer of goods or services to which the assets relate, whereas we currently expense those costs as incurred. Further, we expect to apply a practical expedient whereby we recognize the incremental costs of obtaining contracts as an expense when incurred if the amortization periodsale of the assets that we otherwise would have recognized is one year or less. These costs are included in selling, general, and administrative expenses.
Recently Adopted Accounting Standards
In March 2016, the FASB issued guidance that changes the accounting for certain aspects of share-based payments to employees. The guidance requires the recognition of the income tax effects of awards in the income statement when the awards vest or are settled, thus eliminating additionalpaid-in capital pools. The guidance also allows for the employer to repurchase more of an employee’s shares for tax withholding purposes without triggering liability accounting. In addition, the guidance allows for a policy election to account for forfeitures as they occur rather than on an estimated basis. The guidance became effective January 1, 2017. The adoption of the guidance resulted in the recognition of approximately $12.3 million (tax effected) of previously unrecorded additionalpaid-in capital net operating losses as of January 1, 2017. The additional net operating losses were offset by an increase to the valuation allowance, accordingly no income tax benefit was recognized as a result of the adoption.
78
Houghton Mifflin Harcourt Company
Notes to Consolidated Financial Statements
(in thousands of dollars, except share and per share information)
On April 23, 2015,Riverside Business, we entered into a stock andTransition Services Agreement with the purchaser whereby we performed certain support functions through September 30, 2019.
Upon the signing of the asset purchase agreement with Scholastic Corporation (“Scholastic”)on September 12, 2018, the Riverside Business qualified as a discontinued operation, and goodwill originally included in the Education reportable segment was transferred to acquire certain assets (including the stockRiverside Business. The amount of two of Scholastic’s subsidiaries) comprising its Educational Technologytransferred goodwill was $67.0 million and Services (“EdTech”) business. On May 29, 2015, we completedwas determined using the acquisition and paid an aggregaterelative fair value method. The relative fair value was determined based on the purchase price of $574.8 million in cashthe Riverside Business compared to Scholastic, including adjustments for working capital.the Education reportable segment fair value. The acquisition provided us with a leading position in intervention curriculum and services and extends our product offerings in key growth areas, including educational technology, early learning, and education services, creating a more comprehensive offering for students, teachers and schools. The transactionEducation reportable segment fair value was accounted for underbased primarily on the acquisition method of accounting. Accordingly, the results of operationsmarket value of the purchasedoverall Company at the date that the Riverside Business qualified as a discontinued operation. The allocation also required the assessment for impairment for each of the Riverside Business and Education reportable segment’s goodwill and indefinite-lived intangible assets carrying values. NaN impairment was deemed to exist. Selected financial information of EdTech arethe Riverside Business included in our consolidated financial statements from the date of acquisition. Transaction costs related to the acquisition were approximately $5.2 million during the year ended December 31, 2015 and are included in the selling and administrative line item in our consolidated statements of operations. The unaudited pro forma information presented in the following table summarizes the consolidated results ofdiscontinued operations for the periods presentedis as if the acquisition of EdTech had occurred on January 1, 2014. The pro forma financial information is presented for comparative purposes only and is not necessarily indicative of the results of operations that actually would have been achieved if the acquisition had occurred at the beginning of the period, nor is it intended to be a projection of future results. The pro forma results include estimates of the interest expense on debt used to finance the acquisition, the amortization of the other intangible assets recorded in connection with the acquisition, the impact of the write-down of acquired deferred revenue to fair value and the related tax effects of the adjustments.follows:
| | | | For the Year | | | | | Unaudited | | | Ended December 31, | | | | | Year Ended
December 31,
2015 | | | 2018 | | | 2017 | | Net sales | | $ | 1,486,810 | | | $ | 56,562 | | | $ | 80,482 | | Net loss | | | (144,830 | ) | | Costs | | | | 37,714 | | | | 54,718 | | Amortization | | | | 4,954 | | | | 7,630 | | Earnings from discontinued operations before taxes | | | | 13,894 | | | | 18,134 | | Income tax expense | | | | 1,061 | | | | 984 | | Earnings from discontinued operations, net of tax | | | $ | 12,833 | | | $ | 17,150 | |
For the 2015 fiscal year, we recorded approximately $142.2 million of net sales and $25.9 million of operating income attributable to EdTech within our consolidated statements of operations since the date of acquisition, May 29, 2015.
4.5. | Balance Sheet Information |
Short-term Investments The following table shows the gross unrealized losses and market value of ouravailable-for-sale securities with unrealized losses that are not deemed to be other-than-temporary, aggregated by investment category: | | | | | | | | | | | | | | | | | | | | December 31, 2017 | | | | | Amortized
Cost | | | Unrealized
Gains | | | Unrealized
Losses | | | Estimated
Fair Value | | Short-term investments: | | | | | | | | | | | | | | | | | U.S. Government and agency securities | | $ | 86,467 | | | $ | — | | | $ | (18 | ) | | $ | 86,449 | | | | | | | | | | | | | | | | | | |
79
Houghton Mifflin Harcourt Company
Notes to Consolidated Financial Statements
| | December 31, 2018 | | | | Amortized | | | Unrealized | | | Unrealized | | | Estimated | | | | Cost | | | Gains | | | Losses | | | Fair Value | | Short-term investments: | | | | | | | | | | | | | | | | | U.S. Government and agency securities | | $ | 49,824 | | | $ | 31 | | | $ | (22 | ) | | $ | 49,833 | |
(in thousands of dollars, except share and per share information)
| | | | | | | | | | | | | | | | | | | | December 31, 2016 | | | | | Amortized
Cost | | | Unrealized
Gains | | | Unrealized
Losses | | | Estimated
Fair Value | | Short-term investments: | | | | | | | | | | | | | | | | | U.S. Government and agency securities | | $ | 80,784 | | | $ | 91 | | | $ | (34 | ) | | $ | 80,841 | | | | | | | | | | | | | | | | | | |
The contractual maturities of our short-term investments are one year or less. 71
Houghton Mifflin Harcourt Company Notes to Consolidated Financial Statements (in thousands of dollars, except share and per share information) Account Receivable Accounts receivable at December 31, 20172019 and 20162018 consisted of the following: | | | | 2017 | | | 2016 | | | 2019 | | | 2018 | | Accounts receivable | | $ | 224,664 | | | $ | 238,553 | | | $ | 204,119 | | | $ | 224,306 | | Allowance for bad debt | | | (2,598 | ) | | | (3,576 | ) | | | (3,015 | ) | | | (2,173 | ) | Reserve for book returns | | | (20,986 | ) | | | (18,971 | ) | | | (16,679 | ) | | | (18,559 | ) | | | | | | | | | $ | 184,425 | | | $ | 203,574 | | | | | $201,080 | | | $216,006 | | | | | | | | | | |
As of December 31, 2017, there was2019, one individual customer that comprised approximatelymore than 10% of our accounts receivable, net balance. As of December 31, 2016,2018, no individual customer comprised more thanapproximately 10% of our accounts receivable, net balance. We believe that our accounts receivable credit risk exposure is limited and we have not experienced significant write-downs in our accounts receivable balances. Inventories Inventories at December 31, 20172019 and 20162018 consisted of the following: | | | | 2017 | | | 2016 | | | 2019 | | | 2018 | | Finished goods | | $ | 145,875 | | | $ | 157,925 | | | $ | 203,103 | | | $ | 162,890 | | Raw materials | | | 8,769 | | | | 4,490 | | | | 9,956 | | | | 21,319 | | | | | | | | | | Inventories | | $ | 154,644 | | | $ | 162,415 | | | $ | 213,059 | | | $ | 184,209 | | | | | | | | | |
Property, Plant, and Equipment Balances of major classes of assets and accumulated depreciation and amortization at December 31, 20172019 and 20162018 were as follows: | | | | | | | | | | | | 2017 | | | 2016 | | Land and land improvements | | $ | 4,923 | | | $ | 4,923 | | Building and building equipment | | | 9,867 | | | | 9,867 | | Machinery and equipment | | | 31,843 | | | | 23,339 | | Capitalized software | | | 539,517 | | | | 497,803 | | Leasehold improvements | | | 23,652 | | | | 27,196 | | | | | | | | | | | | | | 609,802 | | | 563,128 | | Less: Accumulated depreciation and amortization | | | (455,896 | ) | | | (387,926 | ) | | | | | | | | | | Property, plant, and equipment, net | | $ | 153,906 | | | $ | 175,202 | | | | | | | | | | |
80
Houghton Mifflin Harcourt Company
Notes to Consolidated Financial Statements
(in thousands of dollars, except share and per share information)
| | 2019 | | | 2018 | | Land and land improvements | | $ | 4,939 | | | $ | 4,923 | | Building and building equipment | | | 10,239 | | | | 9,415 | | Machinery and equipment | | | 12,970 | | | | 11,630 | | Capitalized software | | | 598,317 | | | | 563,314 | | Leasehold improvements | | | 22,974 | | | | 22,171 | | Film and media | | | 22,055 | | | | 14,920 | | | | | 671,494 | | | | 626,373 | | Less: Accumulated depreciation and amortization | | | (571,106 | ) | | | (500,448 | ) | Property, plant, and equipment, net | | $ | 100,388 | | | $ | 125,925 | |
For the yearyears ended December 31, 2017, 20162019, 2018 and 2015,2017, depreciation and amortization expense related to property, plant, and equipment were $75.5$71.3 million, $79.8$81.2 million and $72.6$71.0 million, respectively. Property, plant, and equipment at December 31, 20172019 and 20162018 included approximately $6.9$0.3 million and $0.7 million, respectively, acquired under capitalfinance lease agreements, of which the majority is included in machinery and equipment. There are noThe future minimum lease payments required undernon-cancelable capital leases as of December 31, 2017.2019 are $0.2 million in 2020 and $0.1 million in 2021. Included within property, plant, and equipment on our consolidated balance sheets are film and media assets. Our film and media assets are comprised of the cost to develop our animated series Carmen Sandiego. These assets will be amortized proportionally to the revenues recognized relative to the total estimated revenue consistent with the guidance over episodic television series development. We recorded amortization expense of $9.8 million and $6.1 million for the years ended December 31, 2019 and 2018, respectively, against this asset upon recognition of revenue, which is included within cost of sales, excluding publishing rights and pre-publication amortization, in the statement of operations. 72
Houghton Mifflin Harcourt Company Notes to Consolidated Financial Statements (in thousands of dollars, except share and per share information) Substantially all property, plant, and equipment are pledged as collateral under our Term Loanterm loan and Revolving Credit Facility.revolving credit facility. Contract Assets, Contract Liabilities and Deferred Commissions Contract assets consist of unbilled amounts at the reporting date and are transferred to accounts receivable when the rights become unconditional. Contract assets are included in prepaid expenses and other assets on our consolidated balance sheets. Contract liabilities consist of deferred revenue (current and long-term). The following table presents changes in contract assets and contract liabilities during the year ended December 31, 2019: | | December 31, | | | December 31, | | | | | | | | | | | | 2019 | | | 2018 | | | $ Change | | | % Change | | Contract assets | | $ | 109 | | | $ | 74 | | | $ | 35 | | | | 47.30 | % | Contract liabilities (deferred revenue) | | $ | 848,106 | | | $ | 647,444 | | | $ | 200,662 | | | | 30.99 | % |
The $200.7 million increase in our net contract liabilities from December 31, 2018 to December 31, 2019 was primarily due to higher billings in the period attributed to the seasonal and cyclical nature of our business exceeding the satisfaction of performance obligations related to physical and digital products, and services during the period. During the years ended December 31, 2019 and 2018, we recognized the following net sales as a result of changes in the contract assets and contract liabilities balances: | | Year Ended | | | Year Ended | | | | December 31, | | | December 31, | | | | 2019 | | | 2018 | | Net sales recognized in the period from: | | | | | | | | | Amounts included in contract liabilities at the beginning of the period | | $ | 229,557 | | | $ | 220,769 | |
As of December 31, 2019, the aggregate amount of the transaction price allocated to the remaining performance obligations, which includes deferred revenue and open orders, was $911.5 million, and we will recognize approximately 73% to net sales over the next 1 to 3 years. Prior to the adoption of the new revenue standard, we expensed incremental commissions paid to sales representatives for obtaining product sales as well as service contracts. We expect that the costs are recoverable, and under the new standard, we capitalize these incremental costs of obtaining customer contracts unless the capitalization and amortization of such costs are not expected to have a material impact on the financial statements. Applying the practical expedient, we recognize sales commission expense when incurred if the amortization period of the assets that we otherwise would have recognized is one year or less. We had deferred commissions in the amount of $29.3 million and $22.6 million at December 31, 2019 and 2018, respectively, and amortized $13.2 million and $10.5 million during the years ended December 31, 2019 and 2018, respectively. The amortization is included in selling and administrative expenses. 73
Houghton Mifflin Harcourt Company Notes to Consolidated Financial Statements (in thousands of dollars, except share and per share information) 5.6. | Goodwill and Other Intangible Assets |
Goodwill and other intangible assets consisted of the following: | | | | | | | | | | | | | | December 31, 2019 | | | December 31, 2018 | | | | | December 31, 2017 | | | December 31, 2016 | | | | | | | Accumulated | | | | | | | | | | | Accumulated | | | | | | | | | Cost | | | Accumulated
Amortization | | Total | | | Cost | | | Accumulated
Amortization | | Total | | | Cost | | | Amortization | | | Total | | | Cost | | | Amortization | | | Total | | Goodwill | | $ | 783,073 | | | $ | — | | | $ | 783,073 | | | $ | 783,073 | | | $ | — | | | $ | 783,073 | | | $ | 716,977 | | | $ | — | | | $ | 716,977 | | | $ | 716,073 | | | $ | — | | | $ | 716,073 | | | | | | | | | | | | | | | | | | | | | | Trademarks and tradenames: indefinite-lived | | $ | 161,000 | | | $ | — | | | $ | 161,000 | | | $ | 161,000 | | | $ | — | | | $ | 161,000 | | | Trademarks and tradenames: definite-lived | | | 194,130 | | | | (19,101 | ) | | 175,029 | | | | 194,130 | | | | (6,961 | ) | | 187,169 | | | Trademarks and tradenames: indefinite- lived | | | $ | 161,000 | | | $ | — | | | $ | 161,000 | | | $ | 161,000 | | | $ | — | | | $ | 161,000 | | Trademarks and tradenames: definite- lived | | | | 164,130 | | | | (38,948 | ) | | | 125,182 | | | | 164,130 | | | | (28,087 | ) | | | 136,043 | | Publishing rights | | | 1,180,000 | | | | (1,078,156 | ) | | 101,844 | | | | 1,180,000 | | | | (1,031,918 | ) | | 148,082 | | | | 1,180,000 | | | | (1,139,426 | ) | | | 40,574 | | | | 1,180,000 | | | | (1,112,869 | ) | | | 67,131 | | Customer related and other | | | 444,640 | | | | (271,850 | ) | | 172,790 | | | | 442,640 | | | | (253,242 | ) | | 189,398 | | | | 449,840 | | | | (302,371 | ) | | | 147,469 | | | | 444,640 | | | | (287,922 | ) | | | 156,718 | | | | | | | | | | | | | | | | | | | | | | Other intangible assets, net | | $ | 1,979,770 | | | $ | (1,369,107 | ) | | $ | 610,663 | | | $ | 1,977,770 | | | $ | (1,292,121 | ) | | $ | 685,649 | | | $ | 1,954,970 | | | $ | (1,480,745 | ) | | $ | 474,225 | | | $ | 1,949,770 | | | $ | (1,428,878 | ) | | $ | 520,892 | | | | | | | | | | | | | | | | | | | | | |
There were no changes
The change in the carrying amount of goodwill for the year ended December 31, 2017.2019 is as follows: Balance at December 31, 2018 | | $ | 716,073 | | Acquisitions | | | 904 | | Balance at December 31, 2019 | | $ | 716,977 | |
In accordance with the provisions of the accounting standard for goodwill and other intangible assets, goodwill and certain indefinite-lived tradenames are not amortized but rather are assessed for impairment on an annual basis. In connection with this assessment, we recorded an impairment charge of approximately $139.2 million for certain of our indefinite-lived intangible assets, which has been reflected as of the measurement date of October 1, 2016. There was no0 impairment charge recorded in the years ended December 31, 20172019, 2018 and 2015. There was no goodwill impairment for the years ended December 31, 2017, 2016 and 2015, respectively.2017. During 2016,2019, we acquired certain tradenames were deemedassets of PV Waggle LLC and recorded an intangible asset of $5.2 million. Refer to be definite-lived and accordingly, are being amortized over their estimated useful lives. This was due to our strategic decision to gradually migrate away from specific imprints, primarily the Holt McDougal and various supplemental brands, and in favor of marketing our products under the Houghton Mifflin Harcourt and HMH names. As a result of this change in estimate from indefinite-lived toNote 3. Amortization expense for definite-lived intangible assets, we recorded amortization expense of $9.6 million and $2.4 million during 2017 and 2016, respectively, related to these tradenames. During 2016, $139.4 million of previously indefinite-lived intangible assets were transferred to definite-lived intangible assets and $139.2 million of indefinite-lived intangible assets were impaired. Amortization expense for publishing rights and customer related and other intangibles were $77.0$51.9 million, $88.1$61.6 million and $103.0$75.5 million for the years ended December 31, 2019, 2018 and 2017, 2016 and 2015, respectively. During 2017, we acquired the remaining intellectual property rights to certain educational content and recorded an intangible asset of $2.0 million.
81
Houghton Mifflin Harcourt Company
Notes to Consolidated Financial Statements
(in thousands of dollars, except share and per share information)
Estimated aggregate amortization expense expected for each of the next five years related to intangibles subject to amortization is as follows: | | | | | | | | Trademarks | | | | | | | Other | | | | | Trademarks
and
Tradenames | | | Publishing
Rights | | | Other
Intangible
Assets | | | and | | | Publishing | | | Intangible | | 2018 | | $ | 12,362 | | | $ | 34,713 | | | $ | 16,059 | | | 2019 | | | 12,362 | | | | 26,557 | | | | 13,444 | | | | | | Tradenames | | | Rights | | | Assets | | 2020 | | | 12,362 | | | | 20,056 | | | | 9,594 | | | $ | 10,862 | | | $ | 20,056 | | | $ | 10,629 | | 2021 | | | 12,362 | | | | 11,642 | | | | 9,320 | | | | 10,862 | | | | 11,642 | | | | 10,357 | | 2022 | | | 12,362 | | | | 7,569 | | | | 9,119 | | | | 10,862 | | | | 7,569 | | | | 10,159 | | 2023 | | | | 10,862 | | | | 1,307 | | | | 9,979 | | 2024 | | | | 9,755 | | | | — | | | | 8,528 | | Thereafter | | | 113,219 | | | | 1,307 | | | | 115,254 | | | | 71,979 | | | | — | | | | 97,817 | | | | | | | | | | | | | $ | 125,182 | | | $ | 40,574 | | | $ | 147,469 | | | | | $175,029 | | | $101,844 | | | $172,790 | | | | | | | | | | | | | |
74
Houghton Mifflin Harcourt Company Notes to Consolidated Financial Statements (in thousands of dollars, except share and per share information) Our debt consisted of the following: | | | | | | | | | | | | December 31,
2017 | | | December 31,
2016 | | $800,000 term loan due May 29, 2021 interest payable quarterly (net of discount and issuance costs) | | $ | 768,194 | | | $ | 772,738 | | Less: Current portion of long-term debt | | | 8,000 | | | | 8,000 | | | | | | | | | | | Total long-term debt, net of discount and issuance costs | | $ | 760,194 | | | $ | 764,738 | | | | | | | | | | |
| | December 31, | | | December 31, | | | | 2019 | | | 2018 | | $380,000 term loan due November 22, 2024 interest payable quarterly (net of discount and issuance costs) | | $ | 361,294 | | | $ | — | | $306,000 senior secured notes due February 15, 2025 interest payable semi-annually (net of discount and issuance costs) | | | 295,893 | | | | — | | $800,000 term loan due May 29, 2021 interest payable quarterly (net of discount and issuance costs) | | | — | | | | 763,649 | | | | | 657,187 | | | | 763,649 | | Less: Current portion of long-term debt | | | (19,000 | ) | | | (8,000 | ) | Total long-term debt, net of discount and issuance costs | | $ | 638,187 | | | $ | 755,649 | | Revolving credit facility | | $ | — | | | $ | — | |
During 2016, we retrospectively adopted the new standard relating to simplifying the presentation of debt issuance costs and reclassified debt issuance costs from other assets to long-term debt, net of discount and issuance costs, as of December 31, 2015.
Long-term debt repayments due in each of the next five years and thereafter is as follows: | | Year | Year | | | | | | | 2018 | | $ | 8,000 | | | | 2019 | | | 8,000 | | | | 2020 | | | 8,000 | | | $ | 19,000 | | | 2021 | | | 756,000 | | | | 19,000 | | 2022 | | | | 19,000 | | 2023 | | | | 19,000 | | 2024 | | | | 304,000 | | Thereafter | | | | 306,000 | | | | | | | $ | 686,000 | | | | $ | 780,000 | | | | | | | |
Term Loan Facility
In connection with our closingSenior Secured Notes
On November 22, 2019, we completed the sale of $306.0 million in aggregate principal amount of 9.0% Senior Secured Notes due 2025 (the “notes”) in a private placement to qualified institutional buyers under Rule 144A under the Securities Act of 1933, as amended (the “Securities Act”), and to persons outside the United States pursuant to Regulation S under the Securities Act. The notes will mature on February 15, 2025 and will bear interest at a rate of 9.0% per annum. Interest is payable semi-annually in arrears on February 15 and August 15 of each year, beginning on February 15, 2020. The notes were issued at a discount equal to 2.0% of the EdTech acquisition referred to in Note 3, we entered into an amendedoutstanding borrowing commitment. The transaction was accounted for under the guidance for debt modifications and restated term loan credit facility (the “term loan facility”) dated as of May 29, 2015 to increase our outstanding term loan credit facility from $250.0extinguishments. We incurred approximately $5.4 million of third-party fees for the transaction, of which $178.9approximately $4.1 million were capitalized as deferred financing fees and approximately $1.3 million was outstanding,recorded to $800.0 million,expense and included in the selling and administrative line item in our consolidated statements of operations for the year ended December 31, 2019. We may redeem all of which was drawn at closing. The term loan facility matures on May 29, 2021 and the interest rate is based on LIBOR plus 3.0% or an alternative base rate plus applicable margins. LIBOR is subject to a floor of 1.0% with the lengthportion of the LIBOR contracts ranging up to six monthsnotes at redemption prices as described in the option of the Company. notes. 75 82
Houghton Mifflin Harcourt Company Notes to Consolidated Financial Statements (in thousands of dollars, except share and per share information) The notes do not require us to comply with financial maintenance covenants. We are currently required to meet certain incurrence based financial covenants as defined under our notes. The notes are subject to restrictions on additional indebtedness, issuance of certain preferred stock, redeem, purchase or retire subordinated debt, make certain investments, payment of dividends or other amounts, enter into certain transactions with affiliates, merge or consolidate with another person, or sell or otherwise dispose of all or substantially all of our assets, sell certain assets, including capital stock, designate our subsidiaries as unrestricted subsidiaries, pay dividends, redeem or repurchase capital stock or make other restricted payments, and incur certain liens. The notes are subject to customary events of default. If an event of default occurs and is continuing, the administrative agent may, or at the request of certain required lenders shall, accelerate the obligations outstanding under the notes. Term Loan Facility On November 22, 2019, we entered into a second amended and restated term loan facility may be prepaid, in whole or in part, at any time, without premium.credit agreement for an aggregate principal amount of $380.0 million (the “new term loan facility”). The new term loan facility is required to be repaid in quarterly installments of $2.0 million.approximately $4.8 million with the balance being payable on the maturity date. The new term loan facility matures on November 22, 2024 and the interest rate per annum is equal to, at the option of the Company, either (a) LIBOR plus a margin of 6.25% or (b) an alternate base rate plus a margin of 5.25%. As of December 31, 2019, the interest rate on the new term loan facility was 8.0%. On July 27, 2017, the U.K. Financial Conduct Authority (the “FCA”) announced that it will no longer require banks to submit rates for the calculation of LIBOR after 2021. Our new term loan facility provides that the administrative agent may determine that (i) adequate and reasonable means do not exist for ascertaining the LIBOR rate or (ii) the FCA or the government authority having jurisdiction over the administrative agent has made a public statement identifying a specific date after which the LIBOR rate shall no longer be used for determining interest rates for loans. If the administrative agent determines that (i) or (ii) above is unlikely to be temporary then the administrative agent and the Company will agree to transition to an alternate base rate or amend the new term loan facility to establish an alternate rate of interest to LIBOR that gives due consideration to the then-prevailing market convention for determining a rate of interest for syndicated loans in the United States at such time. The new term loan facility was issued at a discount equal to 0.5%4.0% of the outstanding borrowing commitment. As The transaction was accounted for under the guidance for debt modifications and extinguishments. We incurred approximately $7.2 million of third-party fees for the transaction, of which approximately $2.9 million were capitalized as deferred financing fees and approximately $4.3 million was recorded to expense and included in the selling and administrative line item in our consolidated statements of operations for the year ended December 31, 2017, the interest rate of the2019. The new term loan facility was 4.6%.contains customary mandatory prepayment requirements, including with respect to excess cash flow, proceeds from certain asset sales or dispositions of property, and proceeds from certain incurrences of indebtedness. The new term loan facility permits the Company to voluntarily prepay outstanding amounts at any time without premium or penalty, other than customary breakage costs with respect to LIBOR loans; provided, however, that any voluntary prepayment in connection with certain repricing transactions that occur before the date that is twelve months after the closing of the new term loan facility shall be subject to a prepayment premium of 1.00% of the principal amount of the amounts prepaid. The new term loan facility does not require us to comply with financial maintenance covenants. We are currently required to meet certain incurrence based financial covenants as defined under our new term loan facility. The new term loan facility is subject to usual and customary conditions, representations, warranties and covenants, including restrictions on additional indebtedness, liens, investments, mergers, acquisitions, asset dispositions, dividends to stockholders, repurchase or redemption of our stock, transactions with affiliates and other matters. The new term loan facility is subject to customary events of default. If an event of default occurs and is continuing, the administrative agent may, or at the request of certain required lenders shall, accelerate the obligations outstanding under the new term loan facility. We are subject to an excess cash flow provision under our new term loan facility which is predicated upon our leverage ratio and cash flow. There was no payment required under theThe excess cash flow provision did not apply in 20172019. 76
Houghton Mifflin Harcourt Company Notes to Consolidated Financial Statements (in thousands of dollars, except share and 2016. In accordance with the excess cash flow provision of the previous term loan facility, we made a $63.6 million principal payment on March 5, 2015. In connection with this principal payment, we accelerated the amortization of deferred financing costs of $2.0 million, which was recognized as interest expense in the consolidated statements of operations for the year ended December 31, 2015.per share information) On May 29, 2015,November 22, 2019, in connection with the notes and new term loan facility described above, we paid off the remaining outstanding balance of our previous $250.0$800.0 million term loan facility of approximately $178.9 million.facility. The transaction was accounted for under the guidance for debt modifications and extinguishments. We incurred a loss on extinguishment of debt of approximately $2.2$4.4 million related to thewrite-off write off of the portion of the unamortized deferred financing fees and discount associated with the portion of the previous term loan accounted for as extinguishment associated with thean extinguishment. We were subject to an excess cash flow provision under our previous term loan facility. We incurred approximately $15.6 million of third-party fees forfacility which was predicated upon our leverage ratio and cash flow. There was no payment required under the transaction, of which approximately $13.6 million were capitalized as deferred financing feesexcess cash flow provision in 2019 and approximately $2.0 million was recorded to expense and included in the selling and administrative line item in our consolidated statements of operations for the year ended December 31, 2015.2018.
Interest Rate Hedging On August 17, 2015, we entered into interest rate derivative contracts with various financial institutions having an aggregate notional amount of $400.0 million to convert floating rate debt into fixed rate debt and had $400.0 million outstanding as of December 31, 2017.debt. We assessed at inception, andre-assess on an ongoing basis, whether the interest rate derivative contracts are highly effective in offsetting changes in the fair value of the hedged variable rate debt. These interest rate swaps were designated as cash flow hedges and qualify for hedge accounting under the accounting guidance related to derivatives and hedging. Accordingly, we recorded an unrealized gainloss of $4.9$3.4 million and an unrealized lossgains of $2.5$3.5 million and $3.6$4.9 million in our statements of comprehensive loss to account for the changes in fair value of these derivatives during the periods ended December 31, 2017, 20162019, 2018 and 2015,2017, respectively. The corresponding $1.2 million and $6.1$1.0 million hedge liability is included within current other liabilities and $2.4 million hedge asset is included within long-term other liabilitiesassets in our consolidated balance sheet as of December 31, 20172019 and 2016,2018, respectively. In connection with the new term loan facility on November 22, 2019, we incurred a change in the mix of floating rate debt versus fixed rate debt. As a result, the aggregate notional of our active interest rate derivative contracts designated as cash flow hedges exceeded the outstanding floating rate debt notional by approximately $29.5 million. To accommodate for this notional shortfall, we partially de-designated one of our active interest rate derivative contracts. This involved splitting the notional amount with one portion remaining designated under cash flow hedge accounting, and the remaining portion, with a $29.5 million notional, left undesignated. There were no changes made to the interest rate derivative contracts from an economic perspective; the notional split is accounting in nature only. Beginning on November 22, 2019, the fair value changes on the undesignated portion of the swap flow through earnings, as opposed to being deferred as unrealized gains or losses in other comprehensive income (loss). The impact of this change on the financial statements as of December 31, 2019 was less than $0.1 million and was recorded in our consolidated statements of operations for the year ended December 31, 2019. We had $370.5 million of interest rate derivative contracts outstanding as of December 31, 2019. The interest rate derivative contracts mature on July 22, 2020. 83
Houghton Mifflin Harcourt Company
Notes to Consolidated Financial Statements
(in thousands of dollars, except share and per share information)
Revolving Credit Facility On JulyNovember 22, 2015,2019, we entered into ana second amended and restated revolving credit facility (the “revolving credit facility”). The revolving credit facilityagreement that provides borrowing availability in an amount equal to the lesser of either $250.0 million or a borrowing base that is computed monthly or weekly and comprised of the borrowers’Borrowers’ and the guarantors’Guarantors’ (as such terms are defined below) eligible inventory and receivables.receivables agreement (the “revolving credit facility”). The revolving credit facility includes a letter of credit subfacility of $50.0 million, a swingline subfacility of $20.0 million and the option to expand the facility by up to $100.0 million in the aggregate under certain specified conditions. The revolving credit facility may be prepaid, in whole or in part, at any time, without premium. The transaction was accounted for under the accounting guidance for modifications to or exchanges of revolving debt arrangements. We incurred a loss on extinguishmentapproximately $1.1 million of debt of approximately $0.9 million related to thewrite-off of the portion of the unamortized deferred financing fees associated with the portion of the revolving credit facility accounted for as an extinguishment. We incurred approximately $1.6 million ofcreditor and third-party fees which were capitalized as deferred financing fees. 77
Houghton Mifflin Harcourt Company Notes to Consolidated Financial Statements (in thousands of dollars, except share and per share information) The revolving credit facility requires the Company to maintain a minimum fixed charge coverage ratio of 1.0 to 1.0 on a trailing four-quarter basis only during certain periods commencing when excess availability under the revolving credit facility is less than certain limits prescribed by the terms of the revolving credit facility. The revolving credit facility is subject to usual and customary conditions, representations, warranties and covenants, including restrictions on additional indebtedness, liens, investments, mergers, acquisitions, asset dispositions, dividends to stockholders, repurchase or redemption of our stock, transactions with affiliates and other matters. The revolving credit facility is subject to customary events of default. NoAs of December 31, 2019, 0 amounts have been drawnare outstanding on the revolving credit facility as of December 31, 2017.facility. As of December 31, 2017,2019, the minimum fixed charge coverage ratio covenant under our revolving credit facility was not applicable, due to our level of borrowing availability. The minimum fixed charge coverage ratio, which is only tested in limited situations, is 1.0 to 1.0 through the end of the facility. Guarantees
Under bothOn June 28, 2019, we entered into an amendment to the revolving credit facility that extended the maturity date to July 22, 2021. The amendment became effective on July 1, 2019. The transaction was accounted for under the accounting guidance for modifications to or exchanges of revolving debt arrangements. We incurred approximately $0.3 million of creditor and third-party fees which were capitalized as deferred financing fees.
Guarantees Under the notes, new term loan facility and revolving credit facility, Houghton Mifflin Harcourt Publishers Inc., HMH Publishers LLC and Houghton Mifflin Harcourt Publishing Company and HMH Publishers LLC are the borrowers (collectively, the “Borrowers”), and Citibank, N.A. acts as both the administrative agent and the collateral agent. The obligations under our senior secured facilitiesthe notes, new term loan facility and revolving credit facility are guaranteed by the Company and each of its direct and indirectfor-profit domestic subsidiaries (other than the Borrowers) (collectively, the “Guarantors”) and are secured by all capital stock and other equity interests of the Borrowers and the Guarantors and substantially all of the other tangible and intangible assets of the Borrowers and the Guarantors, including, without limitation, receivables, inventory, equipment, contract rights, securities, patents, trademarks, other intellectual property, cash, bank accounts and securities accounts and owned real estate. The revolving credit facility is secured by first priority liens on receivables, inventory, deposit accounts, securities accounts, instruments, chattel paper and other assets related to the foregoing (the “Revolving First Lien Collateral”), and second priority liens on the collateral which secures the term loan facility on a first priority basis. The term loan facility is secured by first priority liens on the capital stock and other equity interests of the Borrowers and the Guarantors, equipment, owned real estate, trademarks and other intellectual property, general intangibles that are not Revolving First Lien Collateral and other assets related to the foregoing, and second priority liens on the Revolving First Lien Collateral. We lease property and equipment under finance and operating leases. We have operating leases for various office space and facilities, warehouse equipment, automobile fleet and office equipment that expire at various dates through 2023 and thereafter. For leases with terms greater than 12 months, we record the related asset and obligation at the present value of lease payments over the lease term. Many of our leases include rental escalation clauses, renewal options and/or termination options that are factored into our determination of lease payments when appropriate. For leases beginning in 2019 and later, we account for lease components (e.g., fixed payments including rent, real estate taxes and insurance costs) as combined with the non-lease components (e.g., common-area maintenance costs). Our lease agreements do not contain any material residual value guarantees or material restrictive covenants. We sublease certain real estate office space to third parties. Our sublease portfolio consists of operating leases. When available, we use the rate implicit in the lease to discount lease payments to present value; however, most of our leases do not provide a readily determinable implicit rate. Therefore, we must estimate our incremental borrowing rate to discount the lease payments based on information available at lease commencement. We give consideration to our recent debt issuances as well as publicly available data for instruments with similar characteristics when calculating our incremental borrowing rates. 8478
Houghton Mifflin Harcourt Company Notes to Consolidated Financial Statements (in thousands of dollars, except share and per share information) Lease Position as of December 31, 2019 The table below presents the lease assets and liabilities recorded on the balance sheet. Leases | | Classification | | December 31, 2019 | | Assets | | | | | | | Operating lease assets | | Operating lease assets | | $ | 132,247 | | Total leased assets | | | | $ | 132,247 | | Liabilities | | | | | | | Current | | | | | | | Operating | | Operating lease liabilities | | $ | 8,685 | | Noncurrent | | | | | | | Operating | | Operating lease liabilities | | | 134,994 | | Total lease liabilities | | | | $ | 143,679 | | Weighted average remaining lease term Operating leases | | | | 9.6 Years | | Weighted average discount rate Operating leases (1) | | | | | 12.46 | % |
7.(1) | Upon adoption of the new lease standard, discount rates used for existing leases were established at January 1, 2019. |
Lease costs Operating lease cost and sublease income totaled $39.9 million and $2.3 million for the year ended December 31, 2019, respectively. The net lease cost of $37.6 million for year ended December 31, 2019 is included in the selling and administrative line item in our consolidated statements of operations. Operating lease cost includes short term leases and variable lease costs, which are not material. Undiscounted Cash Flows The table below reconciles the undiscounted cash flows for each of the first five years and total of the remaining years to the operating lease liabilities recorded on the balance sheet. Maturity of Lease Liabilities | | Operating Leases | | 2019 | | | 25,189 | | 2020 | | | 25,825 | | 2021 | | | 23,413 | | 2022 | | | 25,216 | | 2023 | | | 26,312 | | Thereafter | | | 135,458 | | Total lease payments | | $ | 261,413 | | Less: interest | | | (117,734 | ) | Present value of lease liabilities | | $ | 143,679 | |
During the third quarter of 2019, we executed a lease agreement on new office space in Portsmouth, New Hampshire. We plan to relocate our employees from the existing location in Portsmouth, New Hampshire to this new office space upon the substantial completion of the building. The lease term specified in the agreement is 10 years with an option to renew for an additional five years. Our estimated fixed lease payments over the 10 year initial lease term is $9.8 million. We currently expect to relocate to the space in the first quarter of 2021, but this 79
Houghton Mifflin Harcourt Company Notes to Consolidated Financial Statements (in thousands of dollars, except share and per share information) timing as well as when we are required to begin making payments and recognize rental and other expenses under the new lease, is dependent on when the space is available for use. Other Information The table below presents supplemental cash flow information related to leases during the year ended December 31, 2019. Cash paid for amounts included in the measurement of lease liabilities | | | | | Operating cash flows for operating leases | | $ | 31,245 | |
Additional Lease Information Related to the Application of the Previous Lease Accounting Standard Future payments under operating lease agreements as of December 31, 2018 are as follows: | | Operating Leases | | 2019 | | $ | 32,694 | | 2020 | | | 26,889 | | 2021 | | | 26,118 | | 2022 | | | 24,549 | | 2023 | | | 27,469 | | Thereafter | | | 171,203 | | Total lease payments | | $ | 308,922 | |
9. | Restructuring, Severance and Other Charges |
2019 Restructuring Plan On October 15, 2019, our Board of Directors approved changes connected with our ongoing strategic transformation to simplify our business model and accelerate growth. This includes new product development and go-to-market capabilities, as well as the streamlining of operations company-wide for greater efficiency. These actions (the “2019 Restructuring Plan”) resulted in the net elimination of approximately 10% of HMH’s workforce, after taking into account new strategy-aligned positions that are expected to be added, and additional operating and capitalized cost reductions, including an approximately 20% reduction in previously planned content development expenditures over the next three years. These steps are intended to further simplify our business model while delivering increased value to customers, teachers and students. The workforce reductions were completed in the first quarter of 2020. After considering additional headcount actions, implementation of the planned actions resulted in total charges of $15.8 million which was recorded in the fourth quarter of 2019. With respect to each major type of cost associated with such activities, substantially all costs were severance and other termination benefit costs and will result in cash expenditures. Further, as part of such strategic transformation plan, we recorded an incremental $9.8 million inventory obsolescence charge which is recorded in cost of sales in the statement of operations. 80
Houghton Mifflin Harcourt Company Notes to Consolidated Financial Statements (in thousands of dollars, except share and per share information) The following tables provide a summary of our total costs associated with the 2019 Restructuring Plan, included in the restructuring line item within our consolidated statements of operations, for the year ended December 31, 2019, by major type of cost: | | Year Ended | | | Total Amount | | | | December 31, | | | Incurred | | Type of Cost | | 2019 | | | to Date | | Restructuring charges: (1) | | | | | | | | | Severance and termination benefits | | $ | 15,820 | | | $ | 15,820 | | | | $ | 15,820 | | | $ | 15,820 | |
(1) | All restructuring charges are included within Corporate and Other. |
Our restructuring liabilities are primarily comprised of accruals for severance and termination benefits. The following is a rollforward of our liabilities associated with the 2019 Restructuring Plan: | | 2019 | | | | Restructuring | | | | | | | | | | | Restructuring | | | | accruals at | | | | | | | | | | | accruals at | | | | December 31, | | | | | | | Cash | | | December 31, | | | | 2018 | | | Charges | | | payments | | | 2019 | | Severance and termination benefits | | $ | — | | | $ | 15,820 | | | $ | (4,171 | ) | | $ | 11,649 | | | | $ | — | | | $ | 15,820 | | | $ | (4,171 | ) | | $ | 11,649 | |
2017 Restructuring Plan On an ongoing basis, we assess opportunities for improved operational effectiveness and efficiency and better alignment of expenses with net sales, while preserving our ability to make the investments in content and our people that we believe are important to our long-term success. As a result of these assessments, we have undertakenundertook a restructuring initiative in order to enhance our growth potential and better position us for long-term success. This initiative is described below. Beginning at the end of 2016, we worked with a third partythird-party consultant to review our operating model and organizational design in order to improve our operational efficiency, better focus on the needs of our customers andright-size our cost structure to create long-term shareholder value. In March 2017, we committed to certain operational efficiency and cost-reduction actions we planned to take in order to accomplish these objectives (“2017 Restructuring Plan”). These actions includeincluded making organizational design changes across layers of the Company below the executive team and otherright-sizing initiatives expected to result in reductions in force, consolidating and/or subletting certain office space under real estate leases as well as other potential operational efficiency and cost-reduction initiatives. We have substantially completed the organizational design change actions in 2017 and expect to substantially complete the remaining actions by the end ofin 2018. Implementation of actions under the 2017 Restructuring Plan is expected to result in total charges of approximately $45.0 million to $49.0 million, of which approximately $35.0 million to $39.0 million of these charges are estimated to result in future cash outlays. Previously, the range of expected charges for the 2017 Restructuring Plan was $41.0 million to $45.0 million of which approximately $32.0 million to $36.0 million was estimated to result in future cash outlays. The increase is primarily due to a change in the estimate of office space that the Company will be able to vacate along with higher cost of implementation. We recorded cash-related costs of $30.5 million for the year ended December 31, 2017, of which a portion of these expenses totaling approximately $16.2 million were related to severance and termination benefits for the year ended December 31, 2017, with the remaining amount of approximately $14.3 million related to implementation of the plan and real estate consolidation costs. These costs are included in the restructuring line item within our consolidated statements of operations.
The following table providestables provide a summary of our total costs associated with the 2017 Restructuring Plan, included in the restructuring line item within our consolidated statements of operations, for the yearyears ended December 31, 2019, 2018 and 2017, respectively, by major type of cost: | | | Year Ended | | | Year Ended | | | Year Ended | | | Total Amount | | | | | | | | December 31, | | | December 31, | | | December 31, | | | Incurred | | Type of Cost | | Year Ended
December 31,
2017 | | | Total Amount
Incurred to Date | | | 2019 | | | 2018 | | | 2017 | | | to Date | | Restructuring charges:(1) | | | | | | | | | | | | | | | | | | | | | Severance and termination benefits | | $ | 16,206 | | | $ | 16,206 | | | $ | — | | | $ | — | | | $ | 16,206 | | | $ | 16,206 | | Office space consolidation (2) | | | 7,857 | | | | 7,857 | | | | — | | | | 4,657 | | | | 4,979 | | | | 9,636 | | Implementation and impairment (3) | | | 16,590 | | | | 16,990 | | | | — | | | | — | | | | 16,590 | | | | 16,990 | | | | | | | | | | $ | — | | | $ | 4,657 | | | $ | 37,775 | | | $ | 42,832 | | | | $ | 40,653 | | | $ | 41,053 | | | | | | | | | | |
81
Houghton Mifflin Harcourt Company Notes to Consolidated Financial Statements (in thousands of dollars, except share and per share information) (1) | All restructuring charges are included within Corporate and Other. |
(2) | During the year ended December 31, 2017, we recorded anon-cash charge for awrite-off of property, plant, and equipment of approximately $1.0$0.7 million and $6.8$4.2 million of accruals related to vacating certain office space in three2 of our locations. |
(3) | During the year ended December 31, 2017, we recorded anon-cash impairment charge of approximately $9.1 million related to a certain long-lived asset included within property, plant, and equipment. |
85
Houghton Mifflin Harcourt Company
Notes to Consolidated Financial Statements
(in thousands of dollars, except share and per share information)
Our restructuring liabilities are primarily comprised of accruals for severance and termination benefits and office space consolidation. The following is a rollforward of our liabilities associated with the 2017 Restructuring Plan: | | | | | | | | | | | | | | | | | | | | 2017 | | | | | Restructuring
accruals at
December 31, 2016 | | | Charges | | | Cash payments | | | Restructuring
accruals at
December 31, 2017 | | Severance and termination benefits | | $ | — | | | $ | 16,206 | | | $ | (11,900 | ) | | $ | 4,306 | | Office space consolidation | | | — | | | | 6,808 | | | | (1,512 | ) | | | 5,296 | | Implementation | | | — | | | | 7,472 | | | | (7,472 | ) | | | — | | | | | | | | | | | | | | | | | | | | | $ | — | | | $ | 30,486 | | | $ | (20,884 | ) | | $ | 9,602 | | | | | | | | | | | | | | | | | | |
The following table provides a summary of our updated estimates of costs associatedIn connection with the 2017 Restructuring Plan throughadoption of the endnew leasing standard on January 1, 2019, the restructuring liabilities related to office space consolidation were reclassed on the balance sheet as a reduction of 2018 by major type of cost:operating lease assets.
| | | | | | | | | | | | | Type of Cost | | Total Estimated Amount
Expected to be Incurred | | Restructuring charges: | | | | | | | | | | | | | Severance and termination benefits | | $ | 15,000 | | | | to | | | $ | 16,500 | | Office space consolidation | | | 13,000 | | | | to | | | | 15,000 | | Implementation and impairment | | | 17,000 | | | | to | | | | 17,500 | | | | | | | | | | | | | | | | | $ | 45,000 | | | | to | | | $ | 49,000 | | | | | | | | | | | | | | |
| | 2018 | | | | Restructuring | | | | | | | | | | | Restructuring | | | | accruals at | | | | | | | | | | | accruals at | | | | December 31, | | | | | | | Cash | | | December 31, | | | | 2017 | | | Charges | | | payments | | | 2018 | | Severance and termination benefits | | $ | 4,306 | | | $ | — | | | $ | (3,936 | ) | | $ | 370 | | Office space consolidation | | | 3,663 | | | | 4,657 | | | | (1,947 | ) | | | 6,373 | | | | $ | 7,969 | | | $ | 4,657 | | | $ | (5,883 | ) | | $ | 6,743 | |
Severance and Other Charges 2019 Exclusive of the 2019 Restructuring Plan and 2017 Restructuring Plan, during the year ended December 31, 2019, $3.2 million of severance payments were made to employees whose employment ended in 2019 and prior years, and we recorded an expense in the amount of $2.5 million to reflect costs for severance, which we expect to be paid over the next twelve months. We also recorded an expense in the amount of $3.4 million for real estate consolidation costs, which is reflected as a reduction in operating lease assets in our consolidated balance sheet as of December 31, 2019. 2018 Exclusive of the 2017 Restructuring Plan, during the year ended December 31, 2018, $5.7 million of severance payments were made to employees whose employment ended in 2018 and prior years and $1.0 million of net payments were made for office space no longer utilized by the Company as a result of prior savings initiatives. Further, we recorded an expense in the amount of $6.8 million to reflect costs for severance, which have been fully paid. 2017 Exclusive of the 2017 Restructuring Plan, during the year ended December 31, 2017, $7.0$6.4 million of severance payments were made to employees whose employment ended in 2017 and prior years and $3.1 million of net payments were made for office space no longer utilized by the Company as a result of prior savings initiatives. Further, we recorded an expense in the amount of $0.9$0.4 million to reflect costs for severance, which we expect to be paid over the next twelve months, along with a favorable $0.2 million adjustment for office space no longer occupied. 2016
During the year ended December 31, 2016, $7.4 million of severance payments were made to employees whose employment ended in 2016 and prior years and $3.9 million of net payments for office space no longer utilized by the Company. Further, we recorded an expense in the amount of $12.4 million to reflect additional costs for severance, which we expect to be paid over the next twelve months, along with a $3.3 million accrual for vacated space.
2015
During the year ended December 31, 2015, $4.2 million of severance payments were made to employees whose employment ended in 2015 and prior years and $4.2 million of net payments for office space no longer utilized by the Company. Further, we recorded an expense in the amount of $4.3 million to reflect additional costs for severance, which have been fully paid, along with a $0.4$0.2 million accrualadjustment for vacated space.
office space no longer occupied.82 86
Houghton Mifflin Harcourt Company Notes to Consolidated Financial Statements (in thousands of dollars, except share and per share information) A summary of the significant components of the severance/restructuring and other charges, which are not allocated to our segments and included in Corporate and Other, is as follows: | | | 2019 | | | | | Severance/ | | | | | | | | | | | Severance/ | | | | | other | | | | | | | | | | | other | | | | | | | | | | | | accruals at | | | Severance/ | | | | | | | accruals at | | | | | 2017 | | | December 31, | | | other | | | Cash | | | December 31, | | | | | Severance/
other
accruals at
December 31, 2016 | | | Severance/
other
expense | | Cash payments | | Severance/
other
accruals at
December 31, 2017 | | | 2018 | | | expense | | | payments | | | 2019 | | Severance costs | | $ | 6,417 | | | $ | 889 | | | $ | (6,965 | ) | | $ | 341 | | | $ | 1,420 | | | $ | 2,534 | | | $ | (3,196 | ) | | $ | 758 | | Other accruals | | | 4,604 | | | | (176 | ) | | (3,129 | ) | | 1,299 | | | | 270 | | | | — | | | | — | | | | — | | | | | | | | | | | | | | | | $ | 1,690 | | | $ | 2,534 | | | $ | (3,196 | ) | | $ | 758 | | | | $ | 11,021 | | | $ | 713 | | | $ | (10,094 | ) | | $ | 1,640 | | | | | | | | | | | | | | | | |
| | | 2018 | | | | | Severance/ | | | | | | | | | | | Severance/ | | | | | other | | | | | | | | | | | other | | | | | | | | | | | | accruals at | | | Severance/ | | | | | | | accruals at | | | | | 2016 | | | December 31, | | | other | | | Cash | | | December 31, | | | | | Severance/
other
accruals at
December 31, 2015 | | | Severance/
other
expense | | | Cash payments | | Severance/
other
accruals at
December 31, 2016 | | | 2017 | | | expense | | | payments | | | 2018 | | Severance costs | | $ | 1,455 | | | $ | 12,350 | | | $ | (7,388 | ) | | $ | 6,417 | | | $ | 341 | | | $ | 6,821 | | | $ | (5,742 | ) | | $ | 1,420 | | Other accruals | | | 5,251 | | | | 3,300 | | | | (3,947 | ) | | 4,604 | | | | 1,299 | | | | — | | | | (1,029 | ) | | | 270 | | | | | | | | | | | | | | | | $ | 1,640 | | | $ | 6,821 | | | $ | (6,771 | ) | | $ | 1,690 | | | | $ | 6,706 | | | $ | 15,650 | | | $ | (11,335 | ) | | $ | 11,021 | | | | | | | | | | | | | | | | |
| | | 2017 | | | | | Severance/ | | | | | | | | | | | Severance/ | | | | | other | | | | | | | | | | | other | | | | | | | | | | | | accruals at | | | Severance/ | | | | | | | accruals at | | | | | 2015 | | | December 31, | | | other | | | Cash | | | December 31, | | | | | Severance/
other
accruals at
December 31, 2014 | | | Severance/
other
expense | | | Cash payments | | Severance/
other
accruals at
December 31, 2015 | | | 2016 | | | expense | | | payments | | | 2017 | | Severance costs | | $ | 1,271 | | | $ | 4,338 | | | $ | (4,154 | ) | | $ | 1,455 | | | $ | 6,417 | | | $ | 353 | | | $ | (6,429 | ) | | $ | 341 | | Other accruals | | | 9,050 | | | | 429 | | | | (4,228 | ) | | 5,251 | | | | 4,604 | | | | (176 | ) | | | (3,129 | ) | | | 1,299 | | | | | | | | | | | | | | | | $ | 11,021 | | | $ | 177 | | | $ | (9,558 | ) | | $ | 1,640 | | | | $ | 10,321 | | | $ | 4,767 | | | $ | (8,382 | ) | | $ | 6,706 | | | | | | | | | | | | | | | | |
The current portion of the severance and other charges was $6.9$12.4 million and $6.0 million (inclusive of the 2017 Restructuring Plan)Plan and $8.9 million2019 Restructuring Plan) as of December 31, 20172019 and 2016,2018, respectively. Effects of the Tax Cuts and Jobs Act
New tax legislation, commonly referred to as the Tax Cuts and Jobs Act (the “2017 Tax Act”), was enacted on December 22, 2017. Accounting for income taxes requires companies to recognize the effect of tax law changes in the period of enactment even though the effective date for most provisions of the 2017 Tax Act is for tax years beginning after December 31, 2017.
Given the significance of the legislation, the SEC staff issued Staff Accounting Bulletin No. 118 (“SAB 118”), which allows registrants to record provisional amounts during a one year “measurement period” similar to that used when accounting for business combinations. However, the measurement period is deemed to have ended earlier when the registrant has obtained, prepared and analyzed the information necessary to finalize its accounting. During the measurement period, impacts of the law are expected to be recorded at the time a reasonable estimate for all or a portion of the effects can be made, and provisional amounts can be recognized and adjusted as information becomes available, prepared or analyzed.
87
Houghton Mifflin Harcourt Company
Notes to Consolidated Financial Statements
(in thousands of dollars, except share and per share information)
SAB 118 summarizes a three-step process to be applied at each reporting period to account for and qualitatively disclose: (1) the effects of the change in tax law for which accounting is complete; (2) provisional amounts (or adjustments to provisional amounts) for the effects of the tax law where accounting is not complete, but that a reasonable estimate has been determined; and (3) a reasonable estimate cannot yet be made and therefore taxes are reflected in accordance with law prior to the enactment of the Tax Cuts and Jobs Act.
The 2017 Tax Act reduces the U.S. federal corporate income tax rate from 35% to 21%, provides for an indefinite carryforward of net operating losses arising from tax years ending after December 31, 2017 limited to a deduction of 80% of taxable income, requires companies to pay aone-time transition tax on earnings of certain foreign subsidiaries that were previously tax deferred and creates new taxes on certain foreign earnings. We have not completed our accounting for the effects of the 2017 Tax Act; however, we have made a reasonable estimate of those effects. Accordingly, we have recognized a provisional income tax benefit of $71.9 million, which is included as a component of the income tax provision on our consolidated statement of operations.
Included in this provisional amount is (i) a $31.5 million benefit reflecting the revaluation of our net deferred tax liability resulting from indefinite-lived intangibles based on a U.S. federal tax rate of 21% and (ii) a $40.4 million benefit from a release of valuation allowance against net deferred tax assets. This is as a result of the provisions of the 2017 Tax Act that would extend net operating losses generated in taxable years beginning after December 31, 2017 to an unlimited carryforward period subject to an 80% utilization against future taxable earnings. The Company scheduled out the reversal of deferred tax assets and liabilities as of December 31, 2017 and determined that they would reverse into an indefinite-lived net operating loss. As a result, the Company’s indefinite-lived deferred tax liabilities could be used as a source of future taxable income in the Company’s assessment of its realization of the net indefinite-lived deferred tax asset. Our preliminary estimate is subject to the finalization of management’s analysis related to certain matters, such as developing interpretations of the provisions of the 2017 Tax Act and its effect on state income taxes. U.S. Treasury regulations, administrative interpretations or court decisions interpreting the 2017 Tax Act may require further adjustments and changes in our estimates. The final determination of the revaluation of our net deferred tax liability and release of the valuation allowance against net deferred tax assets will be completed as additional information becomes available, but no later than one year from the enactment of the 2017 Tax Act.
The new law also includes aone-time mandatory repatriation transition tax on the net accumulated earnings and profits of a U.S. taxpayer’s foreign subsidiaries. The Company has performed an earnings and profits analysis, and as a result of accumulated losses since inception of the Company, there will be no income tax effect in the current or any future period.
Effects of tax law changes where a reasonable estimate of the accounting effects has not yet been made include the inclusion of commissions and performance based compensation in determining the excessive compensation limitation. Other significant provisions that are not yet effective but may impact income taxes in future years include: an exemption from U.S. tax on dividends of future foreign earnings, limitation on the current deductibility of net interest expense in excess of 30 percent of adjusted taxable income, an incremental tax (base erosion anti-abuse tax, or “BEAT”) on excessive amounts paid to foreign related parties, and a minimum tax on certain foreign earnings in excess of 10% of the foreign subsidiaries tangible assets (i.e., global intangiblelow-taxed income, or “GILTI”).
For the GILTI provisions of the 2017 Tax Act, a provisional estimate could not be made as the Company has not completed its assessment or elected an accounting policy to either recognize deferred taxes for basis differences expected to reverse as GILTI or to record GILTI as period costs if and when incurred.
88
Houghton Mifflin Harcourt Company
Notes to Consolidated Financial Statements
(in thousands of dollars, except share and per share information)
The substantial 2017 impact of the enactment of the 2017 Tax Act is reflected in the tables below.
The components of loss before taxes by jurisdiction are as follows: | | | For | | | For | | | For | | | | | the Year | | | the Year | | | the Year | | | | | Ended | | | Ended | | | Ended | | | | | | | | | | December 31, | | | December 31, | | | December 31, | | | | | For the Year
Ended
December 31, 2017 | | | For the Year
Ended
December 31, 2016 | | | For the Year
Ended
December 31, 2015 | | | 2019 | | | 2018 | | | 2017 | | U.S. | | $ | (154,065 | ) | | $ | (353,038 | ) | | $ | (161,513 | ) | | $ | (213,541 | ) | | $ | (134,884 | ) | | $ | (172,199 | ) | Foreign | | | 443 | | | | 2,988 | | | | 8,004 | | | | 3,909 | | | | 3,024 | | | | 443 | | | | | | | | | | | | | Loss before taxes | | $ | (153,622 | ) | | $ | (350,050 | ) | | $ | (153,509 | ) | | $ | (209,632 | ) | | $ | (131,860 | ) | | $ | (171,756 | ) | | | | | | | | | | | |
83
Houghton Mifflin Harcourt Company Notes to Consolidated Financial Statements (in thousands of dollars, except share and per share information) Total income taxes by jurisdiction are as follows: | | | For | | | For | | | For | | | | | the Year | | | the Year | | | the Year | | | | | Ended | | | Ended | | | Ended | | | | | | | | | | December 31, | | | December 31, | | | December 31, | | | | | For the Year
Ended
December 31, 2017 | | | For the Year
Ended
December 31, 2016 | | | For the Year
Ended
December 31, 2015 | | | 2019 | | | 2018 | | | 2017 | | Income tax expense (benefit) | | | | | | | | | | | | | | | | | | | U.S. | | $ | (50,122 | ) | | $ | (66,677 | ) | | $ | (21,956 | ) | | $ | 4,273 | | | $ | 3,701 | | | $ | (51,106 | ) | Foreign | | | (313 | ) | | | 1,185 | | | | 2,316 | | | | (72 | ) | | | 1,896 | | | | (313 | ) | | | | | | | | | | | | $ | 4,201 | | | $ | 5,597 | | | $ | (51,419 | ) | | | | $(50,435) | | | $(65,492) | | | $(19,640) | | | | | | | | | | | | | |
Significant components of the (benefit) expense for income taxes attributable to loss from continuing operations consist of the following: | | | | | | | | | | | | | | | | For the Year
Ended
December 31, 2017 | | | For the Year
Ended
December 31, 2016 | | | For the Year
Ended
December 31, 2015 | | Current | | | | | | | | | | | | | Foreign | | $ | (259 | ) | | $ | 437 | | | $ | 1,413 | | U.S.—Federal | | | — | | | | 92 | | | | (9,917 | ) | U.S.—State and other | | | (930 | ) | | | 2,320 | | | | (59,296 | ) | | | | | | | | | | | | | | Total current | | | (1,189 | ) | | | 2,849 | | | | (67,800 | ) | Deferred | | | | | | | | | | | | | Foreign | | | (54 | ) | | | 748 | | | | 903 | | U.S.—Federal | | | (54,666 | ) | | | (63,422 | ) | | | 28,937 | | U.S.—State and other | | | 5,474 | | | | (5,667 | ) | | | 18,320 | | | | | | | | | | | | | | | Total deferred | | | (49,246 | ) | | | (68,341 | ) | | | 48,160 | | | | | | | | | | | | | | | Income tax (benefit) expense | | $ | (50,435 | ) | | $ | (65,492 | ) | | $ | (19,640 | ) | | | | | | | | | | | | | |
| | For the | | | For the | | | For the | | | | Year Ended | | | Year Ended | | | Year Ended | | | | December 31, | | | December 31, | | | December 31, | | | | 2019 | | | 2018 | | | 2017 | | Current | | | | | | | | | | | | | Foreign | | $ | (730 | ) | | $ | 1,562 | | | $ | (259 | ) | U.S.—Federal | | | — | | | | (63 | ) | | | 0 | | U.S.—State and other | | | 396 | | | | (1,042 | ) | | | (1,914 | ) | Total current | | | (334 | ) | | | 457 | | | | (2,173 | ) | Deferred | | | | | | | | | | | | | Foreign | | | 658 | | | | 334 | | | | (54 | ) | U.S.—Federal | | | 1,908 | | | | 2,329 | | | | (54,666 | ) | U.S.—State and other | | | 1,969 | | | | 2,477 | | | | 5,474 | | Total deferred | | | 4,535 | | | | 5,140 | | | | (49,246 | ) | Income tax (benefit) expense | | $ | 4,201 | | | $ | 5,597 | | | $ | (51,419 | ) |
8984
Houghton Mifflin Harcourt Company Notes to Consolidated Financial Statements (in thousands of dollars, except share and per share information) The reconciliation of the income tax rate computed at the statutory tax rate to the reported income tax expense (benefit) attributable to continuing operations is as follows: | | | For the | | | For the | | | For the | | | | | Year Ended | | | Year Ended | | | Year Ended | | | | | | | | | | December 31, | | | December 31, | | | December 31, | | | | | For the Year
Ended
December 31, 2017 | | For the Year
Ended
December 31, 2016 | | For the Year
Ended
December 31, 2015 | | | 2019 | | | 2018 | | | 2017 | | Statutory rate | | | (35.0 | )% | | (35.0 | )% | | (35.0 | )% | | | 21.0 | % | | | 21.0 | % | | | 35.0 | % | Permanent items | | | 4.0 | | | 0.8 | | | 1.8 | | | | (3.6 | ) | | | (2.6 | ) | | | (3.5 | ) | Release/(accrual) of uncertain tax positions | | | 0.2 | | | (0.3 | ) | | (33.6 | ) | | Release of uncertain tax positions | | | | — | | | | — | | | | (0.2 | ) | Foreign rate differential | | | 0.3 | | | (0.1 | ) | | (0.2 | ) | | | — | | | | (0.1 | ) | | | (0.2 | ) | State and local taxes | | | (18.3 | ) | | (5.9 | ) | | (10.9 | ) | | | (7.9 | ) | | | 6.8 | | | | 17.1 | | State and local net operating lossre-establishment | | | — | | | (3.3 | ) | | | — | | | Cancellation of debt income | | | | (1.3 | ) | | | — | | | | — | | Increase in valuation allowance | | | 72.2 | | | 25.9 | | | 71.6 | | | | (10.0 | ) | | | (26.6 | ) | | | (68.5 | ) | Change in valuation allowance due to 2017 Tax Act | | | 49.0 | | | | — | | | | — | | | | — | | | | — | | | | (43.9 | ) | Impact of federal rate change on deferred tax assets and liabilities due to 2017 Tax Act | | | (95.9 | ) | | | — | | | | — | | | | — | | | | — | | | | 85.7 | | Tax credits | | | (1.3 | ) | | (0.8 | ) | | (6.5 | ) | | | (0.2 | ) | | | (2.7 | ) | | | 1.2 | | Adoption of 2016 Accounting Standard related to accounting changes for certain aspects of share-based payments to employees (1) | | | (8.0 | ) | | | — | | | | — | | | | — | | | | — | | | | 7.2 | | | | | | | | | | | | | Effective tax rate | | | (32.8 | )% | | (18.7 | )% | | (12.8 | )% | | | (2.0 | )% | | | (4.2 | )% | | | 29.9 | % | | | | | | | | | | | |
The significant components of the net deferred tax assets and liabilities are shown in the following table: | | | | 2017 | | | 2016 | | | 2019 | | | 2018 | | Tax assets related to | | | | | | | | | | | | | Net operating loss and other carryforwards | | $ | 229,595 | | | $ | 199,008 | | | $ | 272,378 | | | $ | 228,364 | | Returns reserve/inventory expense | | | 40,687 | | | | 64,736 | | | | 41,824 | | | | 39,113 | | Pension benefits | | | 6,977 | | | | 12,184 | | | | 6,624 | | | | 8,294 | | Postretirement benefits | | | 6,285 | | | | 9,988 | | | | 4,475 | | | | 4,338 | | Deferred interest (2) | | | 280,246 | | | | 428,346 | | | | 259,375 | | | | 261,647 | | Deferred revenue | | | 122,192 | | | | 182,051 | | | | 113,029 | | | | 118,450 | | Stock-based compensation | | | 3,992 | | | | 7,808 | | | | 3,298 | | | | 5,415 | | Deferred compensation | | | 5,872 | | | | 4,557 | | | | 6,152 | | | | 5,830 | | Research and development | | | | 10,302 | | | | 6,038 | | Operating lease liabilities | | | | 35,890 | | | | — | | Other, net | | | 8,875 | | | | 12,127 | | | | 6,769 | | | | 9,064 | | Valuation allowance | | | (571,653 | ) | | | (759,887 | ) | | | (583,505 | ) | | | (562,392 | ) | | | | | | | | | $ | 176,611 | | | $ | 124,161 | | | | | 133,068 | | | 160,918 | | | | | | | 2017 | | | 2016 | | | Tax liabilities related to | | | | | | Indefinite-lived intangible assets | | | (62,593 | ) | | | (71,380 | ) | | Definite-lived intangible assets | | | (45,644 | ) | | | (82,225 | ) | | Depreciation and amortization expense | | | (43,426 | ) | | | (75,236 | ) | | Other, net | | | (81 | ) | | | — | | | | | | | | | | | | | | (151,744) | | | (228,841) | | | | | | | | | | | Net deferred tax liabilities | | $ | (18,676 | ) | | $ | (67,923 | ) | | | | | | | | | |
| | 2019 | | | 2018 | | Tax liabilities related to | | | | | | | | | Indefinite-lived intangible assets | | | (89,879 | ) | | | (76,715 | ) | Definite-lived intangible assets | | | (25,503 | ) | | | (30,882 | ) | Depreciation and amortization expense | | | (48,984 | ) | | | (34,210 | ) | Operating lease assets | | | (32,887 | ) | | | — | | Other, net | | | (7,709 | ) | | | (6,170 | ) | | | | (204,962 | ) | | | (147,977 | ) | Net deferred tax liabilities | | $ | (28,351 | ) | | $ | (23,816 | ) |
9085
Houghton Mifflin Harcourt Company Notes to Consolidated Financial Statements (in thousands of dollars, except share and per share information) (1) | In March 2016, the FASB issued guidance that changes the accounting for certain aspects of shared-based payments to employees. The guidance requires the recognition of the income tax effects of awards in the income statement when the awards vest or are settled, thus eliminating additionalpaid-in capital pools. The guidance became effective January 1, 2017 which resulted in the recognition of $12.3 million of previously unrecorded additionalpaid-in capital net operating losses at that time. The additional net operating losses were offset by an increase in the valuation allowance, accordingly no0 net income tax benefit was recognized as a result of the adoption. |
(2) | The deferred interest tax asset represents disallowed interest deductions under IRC Section 163(j) (Limitation on Deduction for interest on Certain Indebtedness) of the Internal Revenue Code of 1986, as amended (“IRC”) for the current and prior years. At December 31, 20172019 and 2016,2018, we had gross deferred interest deductions totaling $1,042.1$984.5 million and $1,079.0$975.2 million, respectively. The disallowed interest is able to be carried forward indefinitely and utilized in future years pursuant to IRC Section 163(j). A full valuation allowance has been provided against deferred tax assets, excluding $3.6$2.5 million of foreign deferred tax assets which are expected to be realized, net of deferred tax liabilities resulting from indefinite-lived intangibles. |
The net deferred tax liability balance is stated at prevailing statutory income tax rates. Deferred tax assets and liabilities are reflected on our consolidated balance sheets as follows: | | | | 2017 | | | 2016 | | | 2019 | | | 2018 | | Non-current deferred tax assets | | $ | 3,593 | | | $ | 3,458 | | | $ | 2,520 | | | $ | 3,259 | | Non-current deferred tax liabilities | | | (22,269 | ) | | | (71,381 | ) | | | (30,871 | ) | | | (27,075 | ) | | | | | | | | | $ | (28,351 | ) | | $ | (23,816 | ) | | | | $(18,676) | | | $(67,923) | | | | | | | | | | |
A reconciliation of the gross amount of unrecognized tax benefits, excluding accrued interest and penalties, is as follows: | | | | | Balance at December 31, 2014 | | $ | 78,634 | | Reductions based on tax positions related to the prior year | | | (62,323 | ) | Additions based on tax positions related to the current year | | | — | | | | | | | Balance at December 31, 2015 | | | 16,311 | | Reductions based on tax positions related to the prior year | | | (855 | ) | Additions based on tax positions related to the current year | | | 52 | | | | | | | Balance at December 31, 2016 | | | 15,508 | | Reductions based on tax positions related to the prior year | | | — | | Additions based on tax positions related to the prior year | | | 172 | | | | | | | Balance at December 31, 2017 | | $ | 15,680 | | | | | | |
Balance at December 31, 2016 | | | 15,508 | | Reductions based on tax positions related to the prior year | | | — | | Additions based on tax positions related to the current year | | | 172 | | Balance at December 31, 2017 | | | 15,680 | | Reductions based on tax positions related to the prior year | | | — | | Additions based on tax positions related to the prior year | | | — | | Balance at December 31, 2018 | | | 15,680 | | Reductions based on tax positions related to the prior year | | | — | | Additions based on tax positions related to the prior year | | | — | | Balance at December 31, 2019 | | $ | 15,680 | |
For the year ended December 31, 2017, the Company recorded $0.2 million of uncertain tax benefits due to its uncertainty around net operating losses that were generated in tax years ended December 31, 2014 and 2015. For the year ended December 31, 2016, the Company recognized $0.9 million of uncertain tax benefits (excluding interest and penalties) due to the expiration of the statute of limitations. We are currently open for audit under the statute of limitation for Federal, state and foreign jurisdictions for years 20112013 to 2016.2018. However, carryforward attributes from prior years may still be adjusted upon examination by tax authorities if they are used in a future period. 86
Houghton Mifflin Harcourt Company Notes to Consolidated Financial Statements (in thousands of dollars, except share and per share information) We report penalties andtax-related interest expense on unrecognized tax benefits as a component of the provision for income taxes in the accompanying consolidated statement of operations. At December 31, 91
Houghton Mifflin Harcourt Company
Notes to Consolidated Financial Statements
(in thousands of dollars, except share 2019 and per share information)
2017 and 2016, we had $0.02 million and $0.02 million, respectively, of2018, accrued interest and penalties in the accompanying consolidated balance sheet. Interestsheet and interest and penalties included in the provision for income taxes for the years ended December 31, 2019, 2018 and 2017 2016 and 2015 were $0.002 million, $0.02 million and $0.2 million, respectively.
On January 1, 2013, as part of the 2012 Chapter 11 Reorganization, we realized approximately $1.3 billion of cancellation of debt income. We excluded cancellation of debt income of $1.3 billion from taxable income since the Company was insolvent (liabilities greater than the fair value of its assets) by this amount at the time of the exchange. Although we did not need to pay current cash taxes from this transaction, we were required to reduce our tax attributes, such as net operating loss carryovers and tax credit carryovers and our tax basis of our assets to offset the $1.3 billion of taxable income that did not have to be recognized due to insolvency. As a result, our net operating losses and credit carryforwards were reduced on January 1, 2013, and a portion of our tax basis in our assets were reduced at that time. The Company completed an analysis of thestate-by-state attribute reduction as of December 31, 2016 and as a resultre-established $11.4 million of state net operating loss carryforwards (net of federal benefit) for states that decouple from IRC Sec. 1502.immaterial.
As of December 31, 2017,2019, we have approximately $602.3$858.7 million of Federal tax loss carryforwards, of which $609.7 million willexpire between 2034 and 2037. The Company has approximately $1,189.6$1,174.3 million of state tax loss carryforward,carryforwards, which will expire between 20192020 and 2037.2039. In addition, we have foreign tax credit carryforwards of $11.9$8.0 million and research and development credit carryforwards of $4.2 million, which will expire between 20182020 and 2027, and 2032 and 2036, respectively.2036. The Company’s Irish net operating losses of $26.1$17.7 million are not subject to expiration. The Canadian losses ($2.21.6 million federal and $1.2$0.3 million provincial) will expire between 2033 and 2037. The Puerto Rico alternative minimum tax credit carryforwards of $2.8 million are not subject to expiration. Under Section 382 of the Internal Revenue Code of 1986, as amended,IRC, substantial changes in the Company’s ownership may limit the amount of net operating loss and Section 163(j) carryforwards that could be utilized annually in the future to offset taxable income. Specifically, this limitation may arise in the event of a cumulative change in ownership of the Company of more than 50% within a three-year period. Any such annual limitation may significantly reduce the utilization of net operating loss carryforwards before they expire. The Company performed an analysis through December 31, 2016,2019, and determined any potential ownership change under Section 382 during the year would not have a material impact on the future utilization of U.S. net operating losses and tax credits. However, future transactions in the Company’s common stock could trigger an ownership change for purposes of Section 382, which could limit the amount of net operating loss carryforwards and other attributes that could be utilized annually in the future to offset taxable income, if any. Any such limitation, whether as the result of sales of common stock by our existing stockholders or sales of common stock by the Company, could have a material adverse effect on results of operations in future years. U.S. income taxes on the undistributed earnings of the Company’snon-U.S. subsidiaries have not been provided for as the Company currently plans to indefinitely reinvest these amounts and has the ability to do so. There are no cumulative undistributed and untaxed foreign earnings at December 31, 20172019 and 2016.2018. Based on our assessment of historicalpre-tax losses and the fact that we did not anticipate sufficient future taxable income in the near term to assure utilization of certain deferred tax assets, the Company recorded a valuation allowance at December 31, 20172019 and 20162018 of $571.7$583.5 million and $759.9$562.4 million, respectively. We have decreasedincreased our valuation allowance by $188.2$21.1 million in 20172019 with $186.7$21.0 million of benefit as a component of continuing operations and $1.5$0.1 million of benefit as a component of other comprehensive income. 92
Houghton Mifflin Harcourt Company
Notes to Consolidated Financial Statements
(in thousands of dollars, except share and per share information)
9.11. | Retirement and Postretirement Benefit Plans |
Retirement Plan We have a noncontributory, qualified defined benefit pension plan (the “Retirement Plan”), which covers certain employees. The Retirement Plan is a cash balance plan, which accrues benefits based on pay, length of service, and interest. The funding policy is to contribute amounts subject to minimum funding standards set forth by the Employee Retirement Income Security Act of 1974 and the Internal Revenue Code.IRC. The Retirement Plan’s assets consist principally of common stocks, fixed income securities, investments in registered investment companies, and cash and cash equivalents. We also have a nonqualified defined benefit plan, or nonqualified plan, that previously covered employees who earned over the qualified pay limit as determined by the Internal Revenue Service. The nonqualified plan accrues benefits for the participants based on the cash balance plan calculation. The nonqualified plan is not funded. We use a December 31 date to measure the pension and postretirement liabilities. In 2007, both the qualified and nonqualified pension plans eliminated participation in the plans for new employees hired after October 31, 2007. 87
Houghton Mifflin Harcourt Company Notes to Consolidated Financial Statements (in thousands of dollars, except share and per share information) We recognize the funded status of defined benefit pension and other postretirement plans as an asset or liability in the balance sheet and are required to recognize actuarial gains and losses and prior service costs and credits in other comprehensive income and subsequently amortize those items in the statement of operations. The following table summarizes the Accumulated Benefit Obligations (“ABO”), the change in Projected Benefit Obligation (“PBO”), and the funded status of our plans as of and for the financial statement period ended December 31, 20172019 and 2016:2018: | | | | 2017 | | | 2016 | | | 2019 | | | 2018 | | ABO at end of period | | $ | 176,444 | | | $ | 177,300 | | | $ | 169,364 | | | $ | 162,096 | | Change in PBO | | | | | | | | | | | | | PBO at beginning of period | | $ | 177,300 | | | $ | 174,110 | | | $ | 162,096 | | | $ | 176,444 | | Interest cost on PBO | | | 5,528 | | | | 5,224 | | | | 6,045 | | | | 5,300 | | Actuarial loss | | | 6,206 | | | | 7,521 | | | Actuarial loss (gain) | | | | 12,507 | | | | (9,061 | ) | Benefits paid | | | (12,590 | ) | | | (9,555 | ) | | | (11,284 | ) | | | (10,587 | ) | | | | | | | | | PBO at end of period | | $ | 176,444 | | | $ | 177,300 | | | $ | 169,364 | | | $ | 162,096 | | | | | | | | | | Change in plan assets | | | | | | | | | | | | | Fair market value at beginning of period | | $ | 148,344 | | | $ | 150,384 | | | $ | 132,776 | | | $ | 152,311 | | Actual return | | | 16,477 | | | | 7,408 | | | | 22,955 | | | | (9,052 | ) | Company contribution | | | 80 | | | | 107 | | | | 1,269 | | | | 104 | | Benefits paid | | | (12,590 | ) | | | (9,555 | ) | | | (11,284 | ) | | | (10,587 | ) | | | | | | | | | Fair market value at end of period | | $ | 152,311 | | | $ | 148,344 | | | $ | 145,716 | | | $ | 132,776 | | | | | | | | | | Unfunded status | | $ | (24,133 | ) | | $ | (28,956 | ) | | $ | (23,648 | ) | | $ | (29,320 | ) | | | | | | | | |
Amounts recognized in the consolidated balance sheets at December 31, 20172019 and 20162018 consist of: | | | | | | | | | | | | 2017 | | | 2016 | | Noncurrent liabilities | | $ | (24,133 | ) | | $ | (28,956 | ) |
93
Houghton Mifflin Harcourt Company
Notes to Consolidated Financial Statements
(in thousands of dollars, except share and per share information)
| | 2019 | | | 2018 | | Noncurrent liabilities | | $ | (23,648 | ) | | $ | (29,320 | ) |
Additionalyear-end information for pension plans with ABO in excess of plan assets at December 31, 20172019 and 20162018 consist of: | | | | 2017 | | | 2016 | | | 2019 | | | 2018 | | PBO | | $ | 176,444 | | | $ | 177,300 | | | $ | 169,364 | | | $ | 162,096 | | ABO | | | 176,444 | | | | 177,300 | | | | 169,364 | | | | 162,096 | | Fair value of plan assets | | | 152,311 | | | | 148,344 | | | | 145,716 | | | | 132,776 | |
Weighted average assumptions used to determine the benefit obligations (both PBO and ABO) at December 31, 20172019 and 20162018 are: | | | | 2017 | | 2016 | | | 2019 | | | 2018 | | Discount rate | | | 3.6 | % | | 4.0 | % | | | 3.1 | % | | | 4.2 | % | Increase in future compensation | | | N/A | | | N/A | | | N/A | | | N/A | |
88
Houghton Mifflin Harcourt Company Notes to Consolidated Financial Statements (in thousands of dollars, except share and per share information) Net periodic pension (income) cost includes the following components: | | | For the | | | For the | | | For the | | | | | Year Ended | | | Year Ended | | | Year Ended | | | | | | | | | | December 31, | | | December 31, | | | December 31, | | | | | For the Year
Ended
December 31,
2017 | | | For the Year
Ended
December 31,
2016 | | | For the Year
Ended
December 31,
2015 | | | 2019 | | | 2018 | | | 2017 | | Interest cost on projected benefit obligation | | $ | 5,528 | | | $ | 5,224 | | | $ | 6,719 | | | $ | 6,045 | | | $ | 5,300 | | | $ | 5,528 | | Expected return on plan assets | | | (9,263 | ) | | | (9,150 | ) | | | (9,756 | ) | | | (7,659 | ) | | | (7,985 | ) | | | (9,263 | ) | Amortization of net loss | | | 804 | | | | 50 | | | | 330 | | | | 1,028 | | | | 1,420 | | | | 804 | | | | | | | | | | | | | Net pension expense recognized for the period | | $ | (2,931 | ) | | $ | (3,876 | ) | | $ | (2,707 | ) | | | | | | | | | | | | | Net pension (income) expense recognized for the period | | | $ | (586 | ) | | $ | (1,265 | ) | | $ | (2,931 | ) |
Significant actuarial assumptions used to determine net periodic pension cost at December 31, 2017, 20162019, 2018 and 20152017 are: | | | | 2017 | | 2016 | | 2015 | | | 2019 | | | 2018 | | | 2017 | | Discount rate | | | 4.0 | % | | 4.3 | % | | 3.8 | % | | | 4.2 | % | | | 3.6 | % | | | 4.0 | % | Increase in future compensation | | | N/A | | | N/A | | | N/A | | | N/A | | | N/A | | | N/A | | Expected long-term rate of return on assets | | | 6.3 | % | | 6.3 | % | | 6.3 | % | | | 5.5 | % | | | 5.5 | % | | | 6.3 | % |
Assumptions on Expected Long-Term Rate of Return as Investment Strategies We employ a building block approach in determining the long-term rate of return for plan assets. Historical markets are studied and long-term relationships between equities and fixed income are preserved congruent with the widely accepted capital market principle that assets with higher volatility generate a greater return over the long run. Current market factors such as inflation and interest rates are evaluated before long-term capital market assumptions are determined. The long-term portfolio return is established via a building block approach and proper consideration of diversification and rebalancing. Peer data and historical returns are reviewed for reasonability and appropriateness. We regularly review the actual asset allocation and periodically rebalances investments to a targeted allocation when appropriate. The current targeted asset allocation is 34% with equity managers, 56% with fixed income managers, 6% with real-estate investment trust managers and 4% with hedge fund managers. For 2018,2020, we will use a 5.5%5.50% long-term rate of return for the Retirement Plan. We will continue to evaluate the expected rate of return assumption, at least annually, and will adjust as necessary. 94
Houghton Mifflin Harcourt Company
Notes to Consolidated Financial Statements
(in thousands of dollars, except share and per share information)
Plan Assets Plan assets for the U.S. tax qualified plans consist of a diversified portfolio of fixed income securities, equity securities, real estate, and cash equivalents. Plan assets do not include any of our securities. The U.S. pension plan assets are invested in a variety of funds within a Collective Trust (“Trust”). The Trust is a group trust designed to permit qualified trusts to comingle their assets for investment purposes on a tax-exempt basis. Investment Policy and Investment Targets The tax qualified plans consist of the U.S. pension plan and the U.K. pension scheme (prior to May 28, 2014). We fund amounts for our qualified pension plans at least sufficient to meet minimum requirements of local benefit and tax laws. The investment objectives of our pension plan asset investments isare to provide long-term total growth and return, which includes capital appreciation and current income. The nonqualified noncontributory defined benefit pension plan is generally not funded. Assets were invested among several asset classes. 89
Houghton Mifflin Harcourt Company Notes to Consolidated Financial Statements (in thousands of dollars, except share and per share information) The percentage of assets invested in each asset class at December 31, 20172019 and 20162018 is shown below. | | | 2019 | | | 2018 | | | | | Percentage | | | Percentage | | | | | | | | in Each | | | in Each | | | Asset Class | | 2017
Percentage
in Each
Asset Class | | 2016
Percentage
in Each
Asset Class | | | Asset Class | | | Asset Class | | Equity | | | 32.9 | % | | 32.9 | % | | | 32.6 | % | | | 30.2 | % | Fixed income | | | 55.3 | | | 53.6 | | | | 54.5 | | | | 57.6 | | Real estate investment trust | | | 6.5 | | | 6.4 | | | | 8.0 | | | | 7.1 | | Other | | | 5.3 | | | 7.1 | | | | 4.9 | | | | 5.1 | | | | | | | | | | | 100.0 | % | | | 100.0 | % | | | | 100.0 | % | | 100.0 | % | | | | | | | | | |
Fair Value Measurements The fair value of our pension plan assets by asset category at December 31 were as follows: | | | | | | | | | | | | December 31,
2017 | | | Not subject
to leveling(1) | | Cash and cash equivalents | | $ | 835 | | | $ | 835 | | Equity securities | | | | | | | | | U.S. equity | | | 29,749 | | | | 29,749 | | Non-US equity | | | 14,306 | | | | 14,306 | | Emerging markets equity | | | 6,004 | | | | 6,004 | | Fixed income | | | | | | | | | Government bonds | | | 24,203 | | | | 24,203 | | Corporate bonds | | | 42,909 | | | | 42,909 | | Mortgage-backed securities | | | 8,621 | | | | 8,621 | | Asset-backed securities | | | 1,782 | | | | 1,782 | | Commercial mortgage-backed securities | | | 2,070 | | | | 2,070 | | International fixed income | | | 4,738 | | | | 4,738 | | Alternatives | | | | | | | | | Real estate | | | 9,848 | | | | 9,848 | | Hedge funds | | | 7,246 | | | | 7,246 | | | | | | | | | | | | | $ | 152,311 | | | $ | 152,311 | | | | | | | | | | |
| | December 31, | | | Not subject | | | | 2019 | | | to leveling (1) | | Cash and cash equivalents | | $ | 1,413 | | | $ | 1,413 | | Equity securities | | | | | | | | | U.S. equity | | | 28,993 | | | | 28,993 | | Non-US equity | | | 12,474 | | | | 12,474 | | Emerging markets equity | | | 5,537 | | | | 5,537 | | Fixed income | | | | | | | | | Government bonds | | | 20,316 | | | | 20,316 | | Corporate bonds | | | 37,925 | | | | 37,925 | | Mortgage-backed securities | | | 7,943 | | | | 7,943 | | Asset-backed securities | | | 3,255 | | | | 3,255 | | Commercial mortgage-backed securities | | | 1,930 | | | | 1,930 | | International fixed income | | | 5,741 | | | | 5,741 | | Alternatives | | | | | | | | | Real estate | | | 11,609 | | | | 11,609 | | Hedge funds | | | 7,043 | | | | 7,043 | | Other | | | 1,537 | | | | 1,537 | | | | $ | 145,716 | | | $ | 145,716 | |
95
Houghton Mifflin Harcourt Company
Notes to Consolidated Financial Statements
(in thousands of dollars, except share and per share information)
| | | | | | | | | | | | December 31,
2016 | | | Not subject
to leveling(1) | | Cash and cash equivalents | | $ | 862 | | | $ | 862 | | Equity securities | | | | | | | | | U.S. equity | | | 30,727 | | | | 30,727 | | Non-U.S. equity | | | 12,797 | | | | 12,797 | | Emerging markets equity | | | 5,311 | | | | 5,311 | | Fixed income | | | | | | | | | Government bonds | | | 19,511 | | | | 19,511 | | Corporate bonds | | | 43,156 | | | | 43,156 | | Mortgage-backed securities | | | 7,987 | | | | 7,987 | | Asset-backed securities | | | 2,101 | | | | 2,101 | | Commercial mortgage-backed securities | | | 1,931 | | | | 1,931 | | International fixed income | | | 4,881 | | | | 4,881 | | Alternatives | | | | | | | | | Real estate | | | 9,472 | | | | 9,472 | | Hedge funds | | | 8,518 | | | | 8,518 | | Other | | | 1,090 | | | | 1,090 | | | | | | | | | | | | | | $148,344 | | | $148,344 | | | | | | | | | | |
(1) | (1) | Investments that are valued using the net asset value per share (or its equivalent) practical expedient have not been classified in the fair value hierarchy. |
90
Houghton Mifflin Harcourt Company Notes to Consolidated Financial Statements (in thousands of dollars, except share and per share information) | | December 31, | | | Not subject | | | | 2018 | | | to leveling (1) | | Cash and cash equivalents | | $ | 85 | | | $ | 85 | | Equity securities | | | | | | | | | U.S. equity | | | 23,909 | | | | 23,909 | | Non-US equity | | | 11,497 | | | | 11,497 | | Emerging markets equity | | | 4,666 | | | | 4,666 | | Fixed income | | | | | | | | | Government bonds | | | 19,903 | | | | 19,903 | | Corporate bonds | | | 40,524 | | | | 40,524 | | Mortgage-backed securities | | | 7,248 | | | | 7,248 | | Asset-backed securities | | | 2,773 | | | | 2,773 | | Commercial mortgage-backed securities | | | 1,900 | | | | 1,900 | | International fixed income | | | 4,161 | | | | 4,161 | | Alternatives | | | | | | | | | Real estate | | | 9,448 | | | | 9,448 | | Hedge funds | | | 6,662 | | | | 6,662 | | | | $ | 132,776 | | | $ | 132,776 | |
We recognize that risk and volatility are present to some degree with all types of investments. However, high levels of risk are minimized through diversification by asset class, and by style of each fund. Estimated Future Benefit Payments The following benefit payments are expected to be paid. | | Fiscal Year Ended | | Pension | | | Pension | | | 2018 | | $ | 14,473 | | | | 2019 | | | 12,774 | | | | 2020 | | | 12,660 | | | $ | 12,590 | | | 2021 | | | 14,912 | | | | 14,573 | | | 2022 | | | 13,171 | | | | 12,924 | | | 2023—2027 | | | 63,716 | | | 2023 | | | | 13,151 | | 2024 | | | | 13,125 | | 2025–2029 | | | | 63,291 | |
Expected Contributions We do not expect to contribute $2.4 million in 2018,2020, however, the actual funding decision will be made after the 20172019 valuation is completed. Postretirement Benefit Plan We also provide postretirement medical benefits to retired full-time, nonunion employees hired before April 1, 1992, who have provided a minimum of five years of service and attained age 55. 91 96
Houghton Mifflin Harcourt Company Notes to Consolidated Financial Statements (in thousands of dollars, except share and per share information) The following table summarizes the Accumulated Postretirement Benefit Obligation (“APBO”), the changes in plan assets, and the funded status of our plan as of and for the financial statement periods ended December 31, 20172019 and 2016.2018. | | | | 2017 | | | 2016 | | | 2019 | | | 2018 | | Change in APBO | | | | | | | | | | | | | APBO at beginning of period | | $ | 24,012 | | | $ | 25,567 | | | $ | 15,812 | | | $ | 21,903 | | Service cost (benefits earned during the period) | | | 134 | | | | 163 | | | | 58 | | | | 128 | | Interest cost on APBO | | | 771 | | | | 876 | | | | 582 | | | | 672 | | Employee contributions | | | 89 | | | | 253 | | | | 66 | | | | 139 | | Plan amendments | | | — | | | | 594 | | | Actuarial (gain) | | | (1,248 | ) | | | (1,131 | ) | | Actuarial loss (gain) | | | | 1,878 | | | | (5,184 | ) | Benefits paid | | | (1,855 | ) | | | (2,310 | ) | | | (1,712 | ) | | | (1,846 | ) | | | | | | | | | APBO at end of period | | $ | 21,903 | | | $ | 24,012 | | | $ | 16,684 | | | $ | 15,812 | | | | | | | | | | Change in plan assets | | | | | | | | | | | | | Fair market value at beginning of period | | $ | — | | | $ | — | | | $ | — | | | $ | — | | Company contributions | | | 1,766 | | | | 2,057 | | | | 1,646 | | | | 1,707 | | Employee contributions | | | 89 | | | | 253 | | | | 66 | | | | 139 | | Benefits paid | | | (1,855 | ) | | | (2,310 | ) | | | (1,712 | ) | | | (1,846 | ) | | | | | | | | | Fair market value at end of period | | $ | — | | | $ | — | | | $ | — | | | $ | — | | | | | | | | | | Unfunded status | | $ | (21,903 | ) | | $ | (24,012 | ) | | $ | (16,684 | ) | | $ | (15,812 | ) | | | | | | | | |
Amounts for postretirement benefits accrued in the consolidated balance sheets at December 31, 20172019 and 20162018 consist of: | | | | 2017 | | | 2016 | | | 2019 | | | 2018 | | Current liabilities | | $ | (1,618 | ) | | $ | (1,928 | ) | | $ | (1,571 | ) | | $ | (1,512 | ) | Noncurrent liabilities | | | (20,285 | ) | | | (22,084 | ) | | | (15,113 | ) | | | (14,300 | ) | | | | | | | | | Net amount recognized | | $ | (21,903 | ) | | $ | (24,012 | ) | | $ | (16,684 | ) | | $ | (15,812 | ) | | | | | | | | |
Amounts not yet reflected in net periodic benefit cost and recognized in accumulated other comprehensive income at December 31, 20172019 and 20162018 consist of: | | | | | | | | | | | | 2017 | | | 2016 | | Net (loss) | | $ | (1,328 | ) | | $ | (2,588 | ) | Prior service cost | | | 222 | | | | 1,561 | | | | | | | | | | | Accumulated other comprehensive income (loss) | | $ | (1,106 | ) | | $ | (1,027 | ) | | | | | | | | | |
| | 2019 | | | 2018 | | Net gain | | $ | 1,771 | | | $ | 3,856 | | Prior service cost | | | (426 | ) | | | (467 | ) | Accumulated other comprehensive income | | $ | 1,345 | | | $ | 3,389 | |
Weighted average actuarial assumptions used to determine APBO atyear-end December 31, 20172019 and 20162018 are: | | | | | | | | | | | | 2017 | | | 2016 | | Discount rate | | | 3.6 | % | | | 4.1 | % | Health care cost trend rate assumed for next year | | | 6.3 | % | | | 6.6 | % | Rate to which the cost trend rate is assumed to decline
(ultimate trend rate) | | | 4.5 | % | | | 4.5 | % | Year that the rate reaches the ultimate trend rate | | | 2038 | | | | 2038 | |
| | 2019 | | | 2018 | | Discount rate | | | 3.1 | % | | | 4.2 | % | Health care cost trend rate assumed for next year | | | 5.8 | % | | | 6.1 | % | Rate to which the cost trend rate is assumed to decline (ultimate trend rate) | | | 4.5 | % | | | 4.5 | % | Year that the rate reaches the ultimate trend rate | | 2038 | | | 2038 | |
9792
Houghton Mifflin Harcourt Company Notes to Consolidated Financial Statements (in thousands of dollars, except share and per share information) Net periodic postretirement benefit cost (income) included the following components: | | | | | | | | | | | | | | | | 2017 | | | 2016 | | | 2015 | | Service cost | | $ | 134 | | | $ | 163 | | | $ | 205 | | Interest cost on APBO | | | 771 | | | | 876 | | | | 1,081 | | Amortization of unrecognized prior service cost | | | (1,339 | ) | | | (1,339 | ) | | | (1,381 | ) | Amortization of net loss | | | 13 | | | | 86 | | | | 220 | | | | | | | | | | | | | | | Net periodic postretirement benefit (income) expense | | $ | (421 | ) | | $ | (214 | ) | | $ | 125 | | | | | | | | | | | | | | |
| | 2019 | | | 2018 | | | 2017 | | Service cost | | $ | 58 | | | $ | 128 | | | $ | 134 | | Interest cost on APBO | | | 582 | | | | 672 | | | | 771 | | Amortization of unrecognized prior service cost | | | 42 | | | | (690 | ) | | | (1,339 | ) | Amortization of net (gain) loss | | | (164 | ) | | | — | | | | 13 | | Net periodic postretirement benefit expense (income) | | $ | 518 | | | $ | 110 | | | $ | (421 | ) |
Significant actuarial assumptions used to determine postretirement benefit cost at December 31, 2017, 20162019, 2018 and 20152017 are: | | | | 2017 | | 2016 | | 2015 | | | 2019 | | | 2018 | | | 2017 | | Discount rate | | | 4.1 | % | | 4.4 | % | | 3.9 | % | | | 4.2 | % | | | 3.6 | % | | | 4.1 | % | Health care cost trend rate assumed for next year | | | 6.6 | % | | 6.9 | % | | 6.9 | % | | | 6.1 | % | | | 6.3 | % | | | 6.6 | % | Rate to which the cost trend rate is assumed to decline
(ultimate trend rate) | | | 4.5 | % | | 4.5 | % | | 4.5 | % | | | 4.5 | % | | | 4.5 | % | | | 4.5 | % | Year that the rate reaches the ultimate trend rate | | | 2038 | | | 2038 | | | 2027 | | | 2038 | | | 2038 | | | 2038 | |
Assumed health care trend rates have a significant effect on the amounts reported for the health care plans. Aone-percentage-point change in assumed health care cost trend rates would have the following effects on the expense recorded in 20172019 and 20162018 for the postretirement medical plan: | | | | 2017 | | | 2016 | | | 2019 | | | 2018 | | One-percentage-point increase | | | | | | | | | | | | | Effect on total of service and interest cost components | | $ | 7 | | | $ | 8 | | | $ | 8 | | | $ | 4 | | Effect on postretirement benefit obligation | | | 117 | | | | 182 | | | | 85 | | | | 238 | | One-percentage-point decrease | | | | | | | | | | | | | Effect on total of service and interest cost components | | | (6 | ) | | | (7 | ) | | | (7 | ) | | | (4 | ) | Effect on postretirement benefit obligation | | | (104 | ) | | | (160 | ) | | | (76 | ) | | | (208 | ) |
The following table presents the change in other comprehensive income for the year ended December 31, 20172019 related to our pension and postretirement obligations. | | | | | | | | | | | | | | | | Pension
Plans | | | Postretirement
Benefit
Plan | | | Total | | Sources of change in accumulated other comprehensive loss | | | | | | | | | | | | | Net gain arising during the period | | $ | (1,008 | ) | | $ | (1,248 | ) | | $ | (2,256 | ) | Amortization of prior service credit | | | — | | | | 1,339 | | | | 1,339 | | Amortization of net (gain) loss | | | (804 | ) | | | (13 | ) | | | (817 | ) | | | | | | | | | | | | | | Total accumulated other comprehensive income recognized during the period | | $ | (1,812 | ) | | $ | 78 | | | $ | (1,734 | ) | | | | | | | | | | | | | |
| | Pension | | | Postretirement | | | | | | | | Plans | | | Benefit Plan | | | Total | | Sources of change in accumulated other comprehensive loss | | | | | | | | | | | | | Net (gain) loss arising during the period | | $ | (2,820 | ) | | $ | 2,105 | | | $ | (715 | ) | Amortization of prior service credit | | | — | | | | (42 | ) | | | (42 | ) | Amortization of net (gain) loss | | | (1,207 | ) | | | 164 | | | | (1,043 | ) | Total accumulated other comprehensive income recognized during the period | | $ | (4,027 | ) | | $ | 2,227 | | | $ | (1,800 | ) |
9893
Houghton Mifflin Harcourt Company Notes to Consolidated Financial Statements (in thousands of dollars, except share and per share information) Estimated amounts that will be amortized from accumulated other comprehensive income (loss) over the next fiscal year. | | | | | | Pension | | | Postretirement | | | | | Total Pension Plans | | | Total Postretirement Plan | | | Plans | | | Benefit Plan | | Prior service credit (cost) | | $ | — | | | $ | 690 | | | $ | — | | | $ | (42 | ) | Net gain (loss) | | | (1,420 | ) | | | — | | | | (2,325 | ) | | | 7 | | | | | | | | | | $ | (2,325 | ) | | $ | (35 | ) | | | $ | (1,420 | ) | | $ | 690 | | | | | | | | | | |
Amounts not yet reflected in net periodic benefit cost for pension plans and postretirement plan and recognized in accumulated other comprehensive income at December 31, 20172019 and 20162018 consist of: | | | | | | 2019 | | | 2018 | | | | | 2017 | | | 2016 | | | Net loss | | $ | (33,456 | ) | | $ | (35,190 | ) | | | | | | | | | | Net actuarial loss | | | $ | (35,010 | ) | | $ | (36,779 | ) | Accumulated other comprehensive loss | | $ | (33,456 | ) | | $ | (35,190 | ) | | $ | (35,010 | ) | | $ | (36,779 | ) | | | | | | | | |
Estimated Future Benefit Payments The following benefit payments, which reflect expected future service, are expected to be paid: | | | | Postretirement | | | Fiscal Year Ended | | Postretirement Plan | | | Benefit Plan | | 2018 | | $ | 1,617 | | | 2019 | | | 1,605 | | | 2020 | | | 1,573 | | | $ | 1,571 | | 2021 | | | 1,546 | | | | 1,485 | | 2022 | | | 1,517 | | | | 1,409 | | 2023-2027 | | | 7,094 | | | 2023 | | | | 1,352 | | 2024 | | | | 1,298 | | 2025-2029 | | | | 5,620 | |
Expected Contribution We expect to contribute approximately $1.6 million in 2018.2020. Defined Contribution Retirement Plan We maintain a defined contribution retirement plan, the Houghton Mifflin 401(k) Savings Plan, which conforms to Section 401(k) of the Internal Revenue Code,IRC and covers substantially all of our eligible employees. Participants may elect to contribute up to 50.0% of their compensation subject to an annual limit. We provide a matching contribution in amounts up to 3.0% of employee contributions. The 401(k) contribution expense amounted to $8.0$7.4 million, $7.7$7.6 million and $6.9$8.0 million for the years ended December 31, 2017, 20162019, 2018 and 2015,2017, respectively. We did not0t make any additional discretionary contributions in 2017, 20162019, 2018 and 2015.2017. 10.12. | Stock-Based Compensation |
Total compensation expense related to grants of stock options, restricted stock, restricted stock units, and purchases under the employee stock purchase plan recorded in the years ended December 31, 2017, 20162019, 2018 and 20152017 was approximately $10.8$14.0 million, $10.6$13.3 million and $12.5$10.7 million, respectively, and is included in selling and administrative expense. 94 99
Houghton Mifflin Harcourt Company Notes to Consolidated Financial Statements (in thousands of dollars, except share and per share information) 2015 Omnibus Incentive Plan Our Board of Directors adopted the 2015 Omnibus Incentive Plan (“Plan”) in February 2015, which became effective on May 19, 2015 following stockholder approval. The Plan provides to grant up to an aggregate of 4,000,000 million shares of our common stock plus 2,615,476 million shares of our common stock that were reserved for issuance under the 2012 Management Incentive Plan (“2012 MIP”) as of May 19, 2015 but were not issuable pursuant to any outstanding awards. There were 10,604,071 million additional shares underlying outstanding awards under the 2012 MIP as of May 19, 2015 that could have otherwise become available again for grants under the 2012 MIP in the future (by potential forfeiture, withholding or otherwise) which will instead become reserved for issuance under the Plan in the event such shares become available for future grants. On December 13, 2019, our Board of Directors approved an amendment to the Plan to allow employees to have the share withholding increased from the minimum statutory rate to a higher rate, not to exceed the maximum statutory rate. Our Compensation Committee may grant awards of nonqualified stock options, incentive (qualified) stock options or cash, stock appreciation rights, restricted stock awards, restricted stock units, performance compensation awards, other stock-based awards or any combination of the foregoing. Certain employees, directors, officers, consultants or advisors who have been selected by the Compensation Committee and who enter into an award agreement with respect to an award granted to them under the Plan are eligible for awards under the 2015 Omnibus Incentive Plan. The stock option awards will be granted at a strike price equal to or greater than the fair value per share of common stock as of the date of grant. The stock related to award forfeitures and stock withheld to cover tax withholding requirements upon vesting of restricted stock units remains outstanding and may be reallocated to new recipients. The purpose of the Plan is to help us attract and retain key personnel by providing them the opportunity to acquire an equity interest in our Company. As of May 19, 2015, there were 6,615,476 shares authorized and available for issuance under the Plan plus any amount that could have otherwise become available again for grants under the 2012 MIP in the future by forfeiture, withholding or otherwise. As of December 31, 2017,2019, there were 7,166,6445,484,956 shares authorized and available for future issuance under the Plan. The vesting terms for equity awards generally range from 1 to 4 years over equal annual installments and generally expire seven years after the date of grant. Stock Options The following table summarizes option activity for certain employees in our stock options: | | | | | | | | | | | | Number of Shares | | | Weighted Average Exercise Price | | Balance at December 31, 2016 | | | 5,499,837 | | | $ | 14.13 | | Granted | | | 1,289,375 | | | | 11.17 | | Exercised | | | (39,200 | ) | | | 13.06 | | Forfeited | | | (2,978,664 | ) | | | 13.73 | | | | | | | | | | | Balance at December 31, 2017 | | | 3,771,348 | | | $ | 13.45 | | | | | | | | | | | Vested and expected to vest at December 31, 2017 | | | 3,387,771 | | | $ | 13.56 | | | | | | | | | | | Exercisable at December 31, 2017 | | | 2,048,934 | | | $ | 13.72 | | | | | | | | | | |
| | | | | | Weighted | | | | Number of | | | Average | | | | Shares | | | Exercise Price | | Balance at December 31, 2018 | | | 3,488,212 | | | $ | 12.98 | | Forfeited | | | (722,386 | ) | | | 12.54 | | Balance at December 31, 2019 | | | 2,765,826 | | | $ | 13.10 | | Vested and expected to vest at December 31, 2019 | | | 2,712,541 | | | $ | 13.13 | | Exercisable at December 31, 2019 | | | 1,930,833 | | | $ | 13.77 | |
As of December 31, 2017,2019, the range of exercise prices is $9.60$5.25 to $22.80 with a weighted average remaining contractual life of 4.03.0 years for options outstanding. The weighted average remaining contractual life for options vested and expected to vest and exercisable was 3.83.0 years and 2.22.4 years, respectively. The intrinsic 100
Houghton Mifflin Harcourt Company
Notes to Consolidated Financial Statements
(in thousands of dollars, except share and per share information)
value of a stock option is the amount by which the current market value of the underlying stock exceeds the exercise price of the option as of the balance sheet date. The intrinsic value of options outstanding, and vested and expected to vest, was $0.1 million and exercisable was zero$0.5 million at December 31, 20172019 and 2016.2018, respectively. The intrinsic value of options exercisable was 0 at December 31, 2019 and 2018. We estimate the fair value of stock options using the Black-Scholes valuation model. Key input assumptions used to estimate the fair value of stock options include the exercise price of the award, the expected volatility of our stock over the option’s expected term, the risk-free interest rate over the option’s expected term, and our expected annual dividend yield. 95
Houghton Mifflin Harcourt Company Notes to Consolidated Financial Statements (in thousands of dollars, except share and per share information) The fair value of each option granted was estimated on the grant date using the Black-Scholes valuation model with the following assumptions: | | | For the | | | For the | | | | | Year Ended | | | Year Ended | | | | | | | | | | December 31, | | | December 31, | | | | | For the
Year Ended
December 31,
2017 | | | For the
Year Ended
December 31,
2016 | | | For the
Year Ended
December 31,
2015 | | | 2018 | | | 2017 | | Expected term (years) (a) | | | 4.75 | | | | 4.75 | | | | 4.75 | | | | 4.75 | | | | 4.75 | | Expected dividend yield | | | 0.00% | | | | 0.00% | | | | 0.00% | | | 0.00% | | | 0.00% | | Expected volatility (b) | | | 25.22%-25.50% | | | | 23.86%-24.26% | | | | 20.52%-23.50% | | | 35.30% | | | 25.22%-25.50% | | Risk-free interest rate (c) | | | 1.94%-1.99% | | | | 1.20%-1.31% | | | | 1.53%-1.72% | | | 2.84% | | | 1.94%-1.99% | |
(a) | (a) | The expected term is the number of years that we estimate that options will be outstanding prior to exercise. We have used the simplified method for estimating the expected term as we do not have sufficient stock option exercise experience to support a reasonable estimate of the expected term. The simplified method represents the best estimate of the expected term. |
(b) | (b) | WeHistorically, we have estimated volatility for options granted based on the historical volatility for a group of companies (including our own) believed to be a representative peer group and were selected based on industry and market capitalization. During 2018, we estimated volatility based on our historical volatility. |
(c) | (c) | The risk-free interest rate is based on the U.S. Treasury yield for a period commensurate with the expected life of the option. |
We estimate forfeitures at the time of grant and periodically revise those estimates in subsequent periods if actual forfeitures differ from those estimates. Stock-based compensation expense is recorded only for those awards expected to vest using estimated forfeiture rates based on historical forfeiture data. As of December 31, 2017,2019, there remained approximately $3.6$1.6 million of unearned compensation expense related to unvested stock options to be recognized over a weighted average term of 3.31.6 years. The weighted average grant date fair value was $2.85, $4.25$1.82 and $4.82 $2.85for options granted in 2018 and 2017, 2016 and 2015, respectively. 101
Houghton Mifflin Harcourt Company
Notes to Consolidated Financial Statements
(in thousands of dollars, except share and per share information)
Restricted Stock and Restricted Stock Units
The following table summarizes restricted stock activity for grants to certain employees and independent members of the board of directors in our restricted stock and restricted stock units: | | | | | | | | | | Restricted Stock Units | | | | | Restricted Stock | | | Restricted Stock Units | | | | | | | Weighted | | | | | Numbers of Units | | | Weighted Average Grant Date Fair Value | | | Numbers of Units | | | Weighted Average Grant Date Fair Value | | | | | | | Average | | Balance at December 31, 2016 | | | 322,559 | | | $ | 20.10 | | | | 857,787 | | | $ | 18.26 | | | | | | Numbers of | | | Grant Date | | | | | Units | | | Fair Value | | Balance at December 31, 2018 | | | | 3,369,776 | | | $ | 9.16 | | Granted | | | — | | | | — | | | | 1,649,236 | | | | 11.65 | | | | 2,124,253 | | | | 7.71 | | Vested | | | (21,890 | ) | | | 20.10 | | | | (314,555 | ) | | | 16.08 | | | | (837,656 | ) | | | 9.84 | | Forfeited | | | (27,014 | ) | | | 20.10 | | | | (364,552 | ) | | | 13.56 | | | | (809,765 | ) | | | 10.02 | | | | | | | | | | | | | | | | Balance at December 31, 2017 | | | 273,655 | | | $ | 20.10 | | | | 1,827,916 | | | $ | 13.37 | | | | | | | | | | | | | | | | | Balance at December 31, 2019 | | | | 3,846,608 | | | $ | 8.03 | |
96
Houghton Mifflin Harcourt Company Notes to Consolidated Financial Statements (in thousands of dollars, except share and per share information) During 20172019 and 2016,2018, we granted market-based restricted stock units to certain members of our senior management team. The number of shares ultimately issued to the recipient is based on the total shareholder return (TSR)(“TSR”) of our common stock as compared to the TSR of the common stock of a peer group comprised of each member of the Russell 2000 Small Cap Market Index over a three-year performance measurement period. In addition, award recipients must remain employed by us throughout the three-year performance measurement period to attain the full amount of the market-based units that satisfy the market performance criteria. We determined the fair value of the 20172019 and 20162018 market-based restricted stock units to be approximately $2.7$3.1 million and $3.0 million, respectively. We determined the fair value based on a Monte Carlo simulation as of the date of grant, utilizing the following assumptions: the stock price on the date of grant of $11.05$7.75, $6.71 and $12.95$6.53 for 2017,2019, and $19.57$7.00 and $5.25 for 2016,2018, a three-year performance measurement period, and a risk-free rate of 1.45%2.51% and 0.96%2.39% for 20172019 and 2016,2018, respectively. We recognize the expense on these awards on a straight-line basis over the three-year performance measurement period. As of December 31, 2017,2019, there remained approximately $12.2$13.0 million of unearned compensation expense related to unvested restricted stock units to be recognized over a weighted average term of 1.91.5 years. There was approximately no unearned compensation expense related to unvested restricted stock. The restricted stock and restricted stock units include a combination of time-based and performance-based vesting. Employee Stock Purchase Plan Our Board of Directors adopted an Employee Stock Purchase Plan (“ESPP”) in February 2015, which became effective on May 19, 2015 following stockholder approval. The ESPP provides for up to an aggregate of 1.3 million shares of our common stock may be made available for sale under the plan to eligible employees. At the beginning of eachsix-month offering period under the ESPP each participant is deemed to have been granted an option to purchase shares of our common stock equal to the amount of their payroll deductions during the period, but in any event not more than five percent of the employee’s eligible compensation, subject to certain limitations. Such options may be exercised only to the extent of accumulated payroll deductions at the end of the offering period, at a purchase price per share equal to 85% of the fair market value of our common stock at the beginning or end of each offering period, whichever is less. As of December 31, 2017,2019, there were approximately 1.00.6 million shares available for future issuance under the ESPP. 102
Houghton Mifflin Harcourt Company
Notes to Consolidated Financial Statements
(in thousands of dollars, except share and per share information)
Information related to shares issued or to be issued in connection with the ESPP based on employee contributions and the range of purchase prices is as follows: | | | | | | December 31, | | | December 31, | | | | | December 31,
2017 | | | December 31,
2016 | | | 2019 | | | 2018 | | Shares issued or to be issued | | | 165,145 | | | | 178,112 | | | | 212,476 | | | | 167,991 | | Range of purchase prices | | $ | 7.91—$9.22 | | | $ | 9.22—$13.29 | | | $4.73 - $4.90 | | | $ | 6.50 | |
We record stock-based compensation expense related to the discount provided to participants. Also, we use the Black-Scholes option-pricing model to calculate the grant-date fair value of shares issued under the employee stock purchase plan. We recognize expense related to shares purchased through the employee stock purchase plan ratably over the offering period. We recognized $0.5$0.4 million and $0.3 million in expense associated with our ESPP for the years ended December 31, 20172019 and 2016,2018, respectively. Warrants Following our emergence from Chapter 11 on June 22, 2012 and in accordance with the plan of reorganization, after giving effect of the2-for-1 stock split, there were 7,368,422 shares of common stock reserved for issuance upon exercise of warrants under the 2012 MIP. Each existing common stockholder prior to bankruptcy received its pro rata share of warrants to purchase 5% of the common stock of the Company, subject to dilution for equity awards issued in connection with the 2012 MIP. The warrants havehad a term of seven years. Asyears and expired on June 22, 2019. 97
Houghton Mifflin Harcourt Company Notes to Consolidated Financial Statements (in thousands of December 31, 2017, there were warrants outstanding for the purchase of 7,297,909 shares of common stock at a strike price of $21.14.dollars, except share and per share information) 11.13. | Fair Value Measurements |
The accounting standard for fair value measurements, among other things, defines fair value, establishes a consistent framework for measuring fair value and expands disclosure for each major asset and liability category measured at fair value on either a recurring or nonrecurring basis. The accounting standard establishes a three-tier fair value hierarchy which prioritizes the inputs used in measuring fair value as follows: | | | Level 1 | | Observable input such as quoted prices in active markets for identical assets or liabilities; |
| Level 2 | | Observable inputs, other than the quoted prices in active markets, that are observable either directly or indirectly; and |
| Level 3 | | Unobservable inputs in which there is little or no market data, which require the reporting entity to develop its own assumptions. |
Assets and liabilities measured at fair value are based on one or more of three valuation techniques identified in the tables below. Where more than one technique is noted, individual assets or liabilities were valued using one or more of the noted techniques. The valuation techniques are as follows: | (a) | Market approach: Prices and other relevant information generated by market transactions involving identical or comparable assets or liabilities; |
| (b) | Cost approach: Amount that would be currently required to replace the service capacity of an asset (current replacement cost); and |
| (c) | Income approach: Valuation techniques to convert future amounts to a single present amount based on market expectations (including present value techniques). |
103
Houghton Mifflin Harcourt Company
Notes to Consolidated Financial Statements
(in thousands of dollars, except share and per share information)
On a recurring basis, we measure certain financial assets and liabilities at fair value, including our money market funds, short-term investments which consist of U.S. treasury securities and U.S. agency securities, foreign exchange forward contracts, and interest rate derivatives contracts. The accounting standard for fair value measurements defines fair value as the price that would be received to sell an asset or paid to transfer a liability in an orderly transaction between market participants at the measurement date. As such, fair value is a market-based measurement that should be determined based on assumptions that market participants would use in pricing an asset or liability. In determining fair value, we utilize valuation techniques that maximize the use of observable inputs and minimize the use of unobservable inputs to the extent possible as well as consider counterparty and its credit risk in its assessment of fair value. Financial Assets and Liabilities The following tables present our financial assets and liabilities measured at fair value on a recurring basis at December 31, 20172019 and 2016:2018: | | | | | | | Quoted Prices | | | Significant | | | | | | | | | | | in Active | | | Other | | | | | | | | | | | Markets for | | | Observable | | | | | | | | | | | | | | | | | | Identical Assets | | | Inputs | | | Valuation | | | | 2017 | | | Quoted Prices in Active Markets for Identical Assets (Level 1) | | | Significant Other Observable Inputs (Level 2) | | | Valuation Technique | | | 2019 | | | (Level 1) | | | (Level 2) | | | Technique | Financial assets | | | | | | | | | | | | | | | | | | | | | | | Money market funds | | $ | 115,464 | | | $ | 115,464 | | | $ | — | | | | (a) | | | $ | 276,654 | | | $ | 276,654 | | | $ | — | | | (a) | U.S. treasury securities | | | 16,065 | | | | 16,065 | | | | — | | | | (a) | | | U.S. agency securities | | | 70,384 | | | | — | | | | 70,384 | | | | (a) | | | Foreign exchange derivatives | | | 351 | | | | — | | | | 351 | | | | | | | | | | | | | | | | | | | | $ | 202,264 | | | $ | 131,529 | | | $ | 70,735 | | | | | | | | | | | | | | | | | | $ | 276,654 | | | $ | 276,654 | | | $ | — | | | | Financial liabilities | | | | | | | | | | | | | | | | | | | | | | | Interest rate derivatives | | $ | 1,159 | | | $ | — | | | $ | 1,159 | | | | (a) | | | $ | 986 | | | $ | — | | | $ | 986 | | | | Foreign exchange derivatives | | | | 127 | | | | — | | | | 127 | | | (a) | | | | | | | | | | | | | | $ | 1,113 | | | $ | — | | | $ | 1,113 | | | | | | $ | 1,159 | | | $ | — | | | $ | 1,159 | | | | | | | | | | | | | | | | | |
98
Houghton Mifflin Harcourt Company Notes to Consolidated Financial Statements (in thousands of dollars, except share and per share information) | | | | | | | | | | | | | | | | | | | | 2016 | | | Quoted Prices in Active Markets for Identical Assets (Level 1) | | | Significant Other Observable Inputs (Level 2) | | | Valuation Technique | | Financial assets | | | | | | | | | | | | | | | | | Money market funds | | $ | 184,968 | | | $ | 184,968 | | | $ | — | | | | (a) | | U.S. treasury securities | | | 14,457 | | | | 14,457 | | | | — | | | | (a) | | U.S. agency securities | | | 66,384 | | | | — | | | | 66,384 | | | | (a) | | | | | | | | | | | | | | | | | | | | | $ | 265,809 | | | $ | 199,425 | | | $ | 66,384 | | | | | | | | | | | | | | | | | | | | | | | Financial liabilities | | | | | | | | | | | | | | | | | Foreign exchange derivatives | | $ | 816 | | | $ | — | | | $ | 816 | | | | (a) | | Interest rate derivatives | | | 6,108 | | | | — | | | | 6,108 | | | | (a) | | | | | | | | | | | | | | | | | | | | | $ | 6,924 | | | $ | — | | | $ | 6,924 | | | | | | | | | | | | | | | | | | | | | | |
| | | | | | Quoted Prices | | | Significant | | | | | | | | | | in Active | | | Other | | | | | | | | | | Markets for | | | Observable | | | | | | | | | | Identical Assets | | | Inputs | | | Valuation | | | 2018 | | | (Level 1) | | | (Level 2) | | | Technique | Financial assets | | | | | | | | | | | | | | | Money market funds | | $ | 228,587 | | | $ | 228,587 | | | $ | — | | | (a) | U.S. treasury securities | | | 24,939 | | | | 24,939 | | | | — | | | (a) | U.S. agency securities | | | 24,894 | | | | — | | | | 24,894 | | | (a) | Interest rate derivatives | | | 2,382 | | | | — | | | | 2,382 | | | (a) | | | $ | 280,802 | | | $ | 253,526 | | | $ | 27,276 | | | | Financial liabilities | | | | | | | | | | | | | | | Foreign exchange derivatives | | $ | 534 | | | $ | — | | | $ | 534 | | | (a) | | | $ | 534 | | | $ | — | | | $ | 534 | | | |
Our money market funds and U.S. treasury securities are classified within Level 1 of the fair value hierarchy because they are valued using quoted prices in active markets for identical instruments. Our U.S. agency securities are classified within levelLevel 2 of the fair value hierarchy because they are valued using other than 104
Houghton Mifflin Harcourt Company
Notes to Consolidated Financial Statements
(in thousands of dollars, except share and per share information)
quoted prices in active markets. In addition to $115.5$276.7 million and $185.0$228.6 million invested in money market funds as of December 31, 20172019 and 2016,2018, respectively, we had $33.5$19.7 million and $41.1$24.8 million of cash invested in bank accounts as of December 31, 20172019 and 2016,2018, respectively. Our foreign exchange derivatives consist of forward contracts and are classified within Level 2 of the fair value hierarchy because they are valued based on observable inputs and are available for substantially the full term of our derivative instruments. We use foreign exchange forward contracts to fix the functional currency value of forecasted commitments, payments and receipts. The aggregate notional amount of the outstanding foreign exchange forward contracts was $15.8$15.2 million and $16.2$15.7 million at December 31, 20172019 and 2016,2018, respectively. Our foreign exchange forward contracts contain netting provisions to mitigate credit risk in the event of counterparty default, including payment default and cross default. At December 31, 20172019 and 2016,2018, the fair value of our counterparty default exposure was less than $1.0 million and spread across several highly rated counterparties. Our interest rate derivatives are classified within Level 2 of the fair value hierarchy because they are valued based on observable inputs and are available for substantially the full term of our derivative instruments. Our interest rate risk relates primarily to U.S. dollar borrowings, partially offset by U.S. dollar cash investments. We have historically used interest rate derivative instruments to manage our earnings and cash flow exposure to changes in interest rates by converting floating-rate debt into fixed-rate debt. The aggregate notional amount of the outstanding interest rate derivative instruments was $400.0$370.5 million as of December 31, 2017.2019. We designate these derivative instruments either as fair value or cash flow hedges under the accounting guidance related to derivatives and hedging. We record changes in the value of fair value hedges in interest expense, which is generally offset by changes in the fair value of the hedged debt obligation. Interest payments made or received related to our interest rate derivative instruments are included in interest expense. We record the effective portion of any change in the fair value of derivative instruments designated as cash flow hedges as unrealized gains or losses in other comprehensive income (loss), net of tax, until the hedged cash flow occurs, at which point the effective portion of any gain or loss is reclassified to earnings. In the event the hedged cash flow does not occur, or it becomes no longer probable that it will occur, we reclassify the amount of any gain or loss on the related cash flow hedge to interest expense at that time. We believe we do not have significant concentrations of credit risk arising from our interest rate derivative instruments, whether from an individual counterparty or a related group of counterparties. We manage the concentration of counterparty credit risk on our interest rate derivatives instruments by limiting acceptable counterparties to a diversified group of major financial institutions with investment grade credit ratings, limiting the amount of credit exposure to each counterparty, and actively monitoring their credit ratings and outstanding fair values on an ongoing basis. Furthermore, none of our derivative transactions contain provisions that are dependent on our credit ratings from any credit rating agency. 99
Houghton Mifflin Harcourt Company Notes to Consolidated Financial Statements (in thousands of dollars, except share and per share information) We also employ master netting arrangements that reduce our counterparty payment settlement risk on any given maturity date to the net amount of any receipts or payments due between us and the counterparty financial institution. Thus, the maximum loss due to counterparty credit risk is limited to the unrealized gains in such contracts net of any unrealized losses should any of these counterparties fail to perform as contracted. Although these protections do not eliminate concentrations of credit risk, as a result of the above considerations, we do not consider the risk of counterparty default to be significant. Non-Financial Assets and Liabilities Ournon-financial assets, which include goodwill, other intangible assets, property, plant, and equipment, andpre-publication costs, are not required to be measured at fair value on a recurring basis. However, if 105
Houghton Mifflin Harcourt Company
Notes to Consolidated Financial Statements
(in thousands of dollars, except share and per share information)
certain trigger events occur, or if an annual impairment test is required, we evaluate thenon-financial assets for impairment. If an impairment did occur, the asset is required to be recorded at the estimated fair value. There were no0 non-financial liabilities that were required to be measured at fair value on a nonrecurring basis during 20172019 and 2016.2018. The following table presents our nonfinancial assets and liabilities measured at fair value on a nonrecurring basis during 2017 and 2016:2017: | | | | | | | | | | | | | | | | | | | | 2017 | | | Significant
Unobservable
Inputs (Level 3) | | | Total
Impairment | | | Valuation
Technique | | Nonfinancial assets | | | | | | | | | | | | | | | | | Property, plant and equipment | | $ | — | | | $ | — | | | $ | 9,119 | | | | (c | ) | Pre-publication costs | | | — | | | | — | | | | 3,980 | | | | (c | ) | | | | | | | | | | | | | | | | | | | | $ | — | | | $ | — | | | $ | 13,099 | | | | | | | | | | | | | | | | | | | | | | |
| | | | | | 2017 | Significant
Unobservable
Inputs
(Level 3) | Total
Impairment | Valuation
Technique | Nonfinancial assets | | | | | Property, plant and equipment | $— | $— | $9,119 | (c) | Pre-publication costs | — | — | 3,980 | (c) | | | | | | | $— | $— | $13,099 | | | | | | |
| | | | | | | | | | | | | | | | | | | | 2016 | | | Significant
Unobservable
Inputs (Level 3) | | | Total
Impairment | | | Valuation
Technique | | Nonfinancial assets | | | | | | | | | | | | | | | | | Other intangible assets | | $ | 65,400 | | | $ | 65,400 | | | $ | 139,205 | | | | (a | )(c) | | | | | | | | | | | | | | | | | |
The carrying amounts of software development costs, included within property, plant, and equipment, are periodically compared to net realizable value and impairment charges are recorded, as appropriate, when amounts expected to be realized are lower. During the year ended December 31, 2017 in connection with our 2017 Restructuring Plan, we recorded an impairment charge of approximately $9.1 million related to a certain long-lived asset included within property, plant, and equipment as the carrying amount of the asset is no0 longer recoverable based on projected cash flows, which was classified as Level 3 due to significant unobservable inputs. The impairment charge is included in the Restructuring/severance and other charges line item in the consolidated statements of operations. There was no impairment of property, plant, and equipment for the yearyears ended December 31, 2016.2019 and 2018. Pre-publication costs recorded on the balance sheet are periodically reviewed for impairment by comparing the unamortized capitalized costs of the assets to the fair value of those assets. For the year ended December 31, 2017, we recorded an impairment charge of $4.0 million as the products will no longer be sold in the marketplace. There was no0 impairment ofpre-publication costs for the year ended December 31, 2016.2019 and 2018. In evaluating goodwill for impairment, we first compare our reporting unit’s fair value to its carrying value. We estimate the fair values of our reporting units by considering market multiple and recent transaction values of peer companies, where available, and projected discounted cash flows, if reasonably estimable. There was no0 impairment recorded for goodwill for the years ended December 31, 20172019, 2018 and 2016.2017. We perform an impairment test for our other intangible assets by comparing the assets fair value to its carrying value. Fair value is estimated based on recent market transactions, where available, and projected discounted cash flows, if reasonably estimable. There was no0 impairment of other intangible assets for the yearyears ended December 31, 2019, 2018 and 2017. There was a $139.2 million impairment recorded for the year ended December 31, 2016 for intangible assets due to the carrying value of four specific tradenames within the Education business segment exceeding the implied fair value, primarily due to the Company making the strategic decision to gradually migrate away from specific imprints, primarily the Holt McDougal and 100 106
Houghton Mifflin Harcourt Company Notes to Consolidated Financial Statements (in thousands of dollars, except share and per share information) various supplemental brands, and to market our products under the corporate Houghton Mifflin Harcourt and HMH names. In connection with the tradename impairment test, we performed a discounted cash flow analysis using a relief from royalty method on a specific tradename basis. We used a weighted average royalty rate of 4.1%, weighted average discount rate of 9.1% and maximum long-term growth rates of 2.0%. The $65.4 million presented in the table above represents the net book value of the other intangible assets that were subject to impairment immediately after the $139.2 million impairment was recorded. The fair value of goodwill and other intangible assets are estimates, which are inherently subject to significant uncertainties, and actual results could vary significantly from these estimates.
Fair Value of Debt The following table presents the carrying amounts and estimated fair market values of our debt at December 31, 20172019 and 2016.2018. The fair value of debt is deemed to be the amount at which the instrument could be exchanged in an orderly transaction between market participants at the measurement date. | | | | | | | | | | | | | | | | | | | | December 31, 2017 | | | December 31, 2016 | | | | | Carrying
Amount | | | Estimated
Fair Value | | | Carrying
Amount | | | Estimated
Fair Value | | Debt | | | | | | | | | | | | | | | | | Term Loan | | $ | 768,194 | | | $ | 710,579 | | | $ | 772,738 | | | $ | 732,169 | |
| | December 31, 2019 | | | December 31, 2018 | | | | Carrying | | | Estimated | | | Carrying | | | Estimated | | | | Amount | | | Fair Value | | | Amount | | | Fair Value | | | | | | | | | | | | | | | | | | | $380,000 Term loan | | $ | 361,294 | | | $ | 360,391 | | | $ | — | | | $ | — | | $306,000 Senior secured notes | | | 295,893 | | | | 301,441 | | | | — | | | | — | | $800,000 Term loan | | | — | | | | — | | | | 763,649 | | | | 691,102 | |
The fair market values of our debt were estimated based on quoted market prices on a private exchange for those instruments that are traded and are classified as levelLevel 2 within the fair value hierarchy at December 31, 20172019 and 2016.2018. The fair market values require varying degrees of management judgment. The factors used to estimate these values may not be valid on any subsequent date. Accordingly, the fair market values of the debt presented may not be indicative of their future values. 12.14. | Commitments and Contingencies |
Lease Obligations
We have operating leases for various real property, office facilities, and warehouse equipment that expire at various dates through 2022 and thereafter. Certain leases contain renewal and escalation clauses for a proportionate share of operating expenses.
The future minimum rental commitments under all noncancelable leases (with initial or remaining lease terms in excess of one year) for real estate and equipment are payable as follows:
| | | | | | | | Operating
Leases | | 2018 | | $ | 38,854 | | 2019 | | | 36,819 | | 2020 | | | 28,641 | | 2021 | | | 28,963 | | 2022 | | | 27,172 | | Thereafter | | | 209,485 | | | | | | | Total minimum lease payments | | $ | 369,934 | | | | | | | Total future minimal rentals under subleases | | $ | 11,803 | | | | | | |
107
Houghton Mifflin Harcourt Company
Notes to Consolidated Financial Statements
(in thousands of dollars, except share and per share information)
For the years ended December 31, 2017, 2016 and 2015 rent expense, net of sublease income, was $40.2 million, $32.1 million and $26.3 million, respectively. For the years ended December 31, 2017, 2016 and 2015, the rent expense included $6.6 million, $3.3 million and $0.4 million charge, as additional real estate was vacated.
Commitments and Contingencies |
We are involved in ordinary and routine litigation and matters incidental to our business.business, including claims alleging breach of contract and seeking royalty payments. Litigation alleging infringement of copyrights and other intellectual property rights is also common in the educational publishing industry. Specifically,For example, there have been various settled, pending and threatened litigation that allege we exceeded the print run limitation or other restrictions in licenses granted to us to reproduce photographs in our textbooks. During 2016, we settled all such pending or actively threatened litigations alleging infringement of copyrights and made total settlement payments of $10.0 million, collectively. We received approximately $4.5 million of insurance recovery proceeds during the first quarter of 2017. While management believes that there is a reasonable possibility we may incur a loss associated with othercertain pending andor threatened litigation, we are not able to estimate such amount, if any, but we do not expect any of these matters to have a material adverse effect on our results of operations, financial position or cash flows. We have insurance over such amounts and with coverage and deductibles as management believes is reasonable. There can be no assurance that our liability insurance will cover all events or that the limits of coverage will be sufficient to fully cover all liabilities. In April 2019, we were notified of an unasserted claim by the Commonwealth of Puerto Rico with regards to payments in the amount of approximately $33.0 million that we received in the normal course of business during the four year period prior to the May 3, 2017 bankruptcy petition of the Commonwealth public instrumentalities. Management believes, based on discussions with its legal counsel, that we have meritorious defenses against such unasserted claim. The Company will vigorously defend this matter if such claim is asserted. In September 2019, we were notified of an unasserted claim by Riverside Assessments LLC (“Riverside”) with regard to purported breaches of the Asset Purchase Agreement between the Company and Riverside dated September 12, 2018 (“APA”) and the Transition Services Agreement between the Company and Riverside dated October 1, 2018. Management believes, based on discussions with its legal counsel, that we have meritorious defenses against such unasserted claim. With regard to the alleged breaches of the APA, the APA provides that the Company may be liable only for that portion of Riverside’s damages that exceeds $1.4 million, and in an amount that shall not exceed $1.4 million, which we believe would be the maximum exposure. For damages above $2.8 million, Riverside obtained a representation and warranty insurance policy as required by the APA. The Company will vigorously defend this matter if such claim is asserted. 101
Houghton Mifflin Harcourt Company Notes to Consolidated Financial Statements (in thousands of dollars, except share and per share information) In January 2018, Vanderbilt University (“Vanderbilt”) filed a complaint against the Company and others in connection with a license agreement originally entered into between Vanderbilt and Scholastic Inc. in 1997 and subsequently assigned to the Company as part of our acquisition of Scholastic’s Educational Technology and Services business pursuant to the stock and asset purchase agreement dated April 23, 2015. Vanderbilt alleges entitlement to additional royalties in connection with READ 180 and other products acquired from Scholastic and alleges trademark infringement in the marketing of these products. The Company is vigorously defending this matter. In connection with an agreement with a development content provider, we agreed to act as guarantor to that party’s loan to finance such development. Such guarantee is expected to remain until 2020. Under the guarantee, we believe the maximum future payments to approximate $14.0$18.5 million. If inIn the unlikely event that we wereare required to make payments on behalf of the development content provider, we would have recourse against the development content provider. We were contingently liable for $2.5 million and $4.1$4.4 million of performance-related surety bonds for our operating activities as of December 31, 20172019 and 2016,2018, respectively. An aggregate of $25.2$23.7 millionand $31.7$24.3 million of letters of credit existed each year at December 31, 20172019 and 20162018, respectively, of which $0.1$0.7 million and $2.4$0.1 million backed the aforementioned performance-related surety bonds each year in 20172019 and 2016,2018, respectively. We routinely enter into standard indemnification provisions as part of license agreements involving use of our intellectual property. These provisions typically require us to indemnify and hold harmless licensees in connection with any infringement claim by a third partythird-party relating to the intellectual property covered by the license agreement. The assessment business routinely enters into contracts with customers that contain provisions requiring us to indemnify the customer against a broad array of potential liabilities resulting from any breach of the contract or the invalidity of the test. Although the term of these provisions and the maximum potential amounts of future payments we could be required to make is not limited, we have never incurred any costs to defend or settle claims related to these types of indemnification provisions. We therefore believe the estimated fair value of these provisions is inconsequential and have no0 liabilities recorded for them as of December 31, 20172019 and 2016.2018. 108
Houghton Mifflin Harcourt Company
Notes to Consolidated Financial Statements
(in thousands of dollars, except share and per share information)
15. | 13. | Stockholders’ Equity |
Accumulated Other Comprehensive Loss Accumulated other comprehensive loss consisted of the following at December 31, 2017, 20162019, 2018 and 2015:2017: | | | | 2017 | | | 2016 | | | 2015 | | | 2019 | | | 2018 | | | 2017 | | Net change in pension and benefit plan liabilities | | $ | (39,501 | ) | | $ | (41,235 | ) | | $ | (31,298 | ) | | $ | (39,757 | ) | | $ | (41,557 | ) | | $ | (39,501 | ) | Foreign currency translation adjustments | | | (5,753 | ) | | | (5,862 | ) | | | (4,642 | ) | | | (6,420 | ) | | | (5,909 | ) | | | (5,753 | ) | Unrealized loss on short-term investments | | | (108 | ) | | | (90 | ) | | | (147 | ) | | | (90 | ) | | | (99 | ) | | | (108 | ) | Net change in unrealized loss on derivative instruments | | | (1,160 | ) | | | (6,108 | ) | | | (3,641 | ) | | | (1,005 | ) | | | 2,381 | | | | (1,160 | ) | | | | | | | | | | | | $ | (47,272 | ) | | $ | (45,184 | ) | | $ | (46,522 | ) | | | $ | (46,522 | ) | | $ | (53,295 | ) | | $ | (39,728 | ) | | | | | | | | | | | | |
Amounts reclassified from accumulated other comprehensive loss for the years ended December 31, 2017, 20162019, 2018 and 20152017 relating to the amortization of defined benefit pension and postretirement benefit plans totaled approximately $(0.7)$(0.9) million, $0.5$(0.9) million and $1.2$(0.7) million, respectively, and affected the selling and administrative line item in the consolidated statement of operations. These accumulated other comprehensive loss components are included in the computation of net periodic benefit cost. Stock Repurchase Program
16. | Related Party Transactions |
Our BoardIn November 2019, Anchorage Capital Group, L.L.C. (“Anchorage”), a significant stockholder in the Company and a former partner of Directors has authorizedwhich serves on the repurchaseCompany’s board of up to $1.0 billiondirectors, participated as a lender in aggregate valuethe refinancing of the Company’s common stock. Asdebt, acquiring $20.0 million out of December 31, 2017, there was approximately $482.0the $306.0 million available for share repurchases under this authorization. Thein aggregate share repurchase program may be executed through December 31, 2018. Repurchasesprincipal amount of 9.000% Senior Secured Notes due 2025 (the “Notes”) issued by the Company and becoming a lender under the program may be made from time to timeCompany’s second amended and restated term loan credit agreement (the “Term Loan Credit Agreement”) with a commitment of $15.0 million out of the $380.0 million in initial principal amount of the term loan. Anchorage’s participation in the open market (including under a trading plan) or in privately negotiated transactions. The extentrefinancing was on the same terms as all the other lenders. Refer to note 7 for additional information about the Notes and timing of any such repurchases would generally be at our discretion and subject to market conditions, applicable legal requirements and other considerations. Any repurchased shares may be used for general corporate purposes. There was no share repurchase activity for the year ended December 31, 2017.Term Loan Credit Agreement.
The Company’s share repurchase activity was as follows:102
| | | | | | | | | | | | | | | | Year Ended
December 31, 2017 | | | Year Ended
December 31, 2016 | | | Year Ended
December 31, 2015 | | Cost of repurchases | | $ | — | | | $ | 55,017 | | | $ | 463,013 | | Shares repurchased | | | — | | | | 2,903,566 | | | | 21,591,446 | | Average cost per share | | $ | — | | | $ | 18.95 | | | $ | 21.44 | |
In connection with the Company’s stock repurchase program, during the year ended December 31, 2015, the Company repurchased shares of its common stock from certain of its stockholders who (through affiliates of such stockholders) each beneficially owned more than 5% of the Company’s common stock at certain points during 2015. On May 20, 2015, the Company repurchased an aggregate of 6,521,739 shares from affiliates of Paulson & Co. Inc. (“Paulson”), for an aggregate purchase price of approximately $150.0 million. On June 30, 2015, the Company repurchased an aggregate of 1,306,977 shares from affiliates of Anchorage Capital Group, L.L.C., for an aggregate purchase price of approximately $33.5 million. On September 11, 2015, the Company repurchased an aggregate of 439,560 shares from affiliates of Paulson, for an aggregate purchase price of approximately $10.0 million. The purchase prices for these shares were based on negotiated fair values which approximated either the closing prices of the shares or a modest discount to the closing price. The purchase prices from these share repurchases are included within repurchases of common
109
Houghton Mifflin Harcourt Company Notes to Consolidated Financial Statements (in thousands of dollars, except share and per share information) stock under cash flows from financing activities in the accompanying consolidated statements of cash flows for the year ended December 31, 2015 and within treasury stock under stockholders’ equity in the accompanying consolidated balance sheets.
14. | Related Party Transactions |
A company controlled by an immediate family member of our former Chief Executive Officer performedweb-design services for the Company in 2015. For the year ended December 31, 2015, we were billed $0.1 million for those services.
Pursuant to the terms of the Investor Rights Agreement, we paid approximately $10.5 million in underwriting fees and commissions and other offering expenses on behalf of Paulson for a secondary public offering of 12,161,595 shares of our common stock sold by affiliates of Paulson on May 20, 2015, which is included in the selling and administrative line item in our statement of operations for the year ended December 31, 2015. Prior to giving effect to the sale of the common stock in such offering, Paulson was the beneficial owner of more than 15% of our outstanding common stock.
For a description of the repurchases of common stock from certain stockholders, and the effects of these repurchases on our financial statements, refer to Note 13, “Stockholders’ Equity—Stock Repurchase Program.”
There were no related party transactions during 20172018 and 2016.2017. The following table sets forth the computation of basic and diluted earnings per share (“EPS”): | | | | | | | | | | | | | | | | For the Year
Ended
December 31,
2017 | | | For the Year
Ended
December 31,
2016 | | | For the Year
Ended
December 31,
2015 | | Numerator | | | | | | | | | | | | | Net loss attributable to common stockholders | | $ | (103,187 | ) | | $ | (284,558 | ) | | $ | (133,869 | ) | | | | | | | | | | | | | | Denominator | | | | | | | | | | | | | Weighted average shares outstanding | | | | | | | | | | | | | Basic | | | 122,949,064 | | | | 122,418,474 | | | | 136,760,107 | | Diluted | | | 122,949,064 | | | | 122,418,474 | | | | 136,760,107 | | Net loss per share attributable to common stockholders | | | | | | | | | | | | | Basic | | $ | (0.84 | ) | | $ | (2.32 | ) | | $ | (0.98 | ) | Diluted | | $ | (0.84 | ) | | $ | (2.32 | ) | | $ | (0.98 | ) |
| | For the Year | | | For the Year | | | For the Year | | | | Ended | | | Ended | | | Ended | | | | December 31, | | | December 31, | | | December 31, | | | | 2019 | | | 2018 | | | 2017 | | Numerator | | | | | | | | | | | | | Loss from continuing operations | | $ | (213,833 | ) | | $ | (137,457 | ) | | $ | (120,337 | ) | Earnings from discontinued operations, net of tax | | | — | | | | 12,833 | | | | 17,150 | | Gain on sale of discontinued operations, net of tax | | | — | | | | 30,469 | | | | — | | Income from discontinued operations, net of tax | | | — | | | | 43,302 | | | | 17,150 | | Net loss attributable to common stockholders | | $ | (213,833 | ) | | $ | (94,155 | ) | | $ | (103,187 | ) | Denominator | | | | | | | | | | | | | Weighted average shares outstanding | | | | | | | | | | | | | Basic and diluted | | | 124,152,984 | | | | 123,444,943 | | | | 122,949,064 | | Net loss per share attributable to common stockholders | | | | | | | | | | | | | Basic and diluted: | | | | | | | | | | | | | Continuing operations | | $ | (1.72 | ) | | $ | (1.11 | ) | | $ | (0.98 | ) | Discontinued operations | | | — | | | | 0.35 | | | | 0.14 | | Net loss | | $ | (1.72 | ) | | $ | (0.76 | ) | | $ | (0.84 | ) |
As we incurred a net loss in each of the periods presented above, all outstanding stock options restricted stock,and restricted stock units and warrants for those periods have an anti-dilutive effect and therefore are excluded from the computation of diluted weighted average shares outstanding. Accordingly, basic and diluted weighted average shares outstanding are equal for such periods. 110
Houghton Mifflin Harcourt Company
Notes to Consolidated Financial Statements
(in thousands of dollars, except share and per share information)
The following table summarizes our weighted average outstanding common stock equivalents that were anti-dilutive attributable to common stockholders during the periods, and therefore excluded from the computation of diluted EPS: | | | | | | | | | | | | | | | | For the Year
Ended
December 31,
2017 | | | For the Year
Ended
December 31,
2016 | | | For the Year
Ended
December 31,
2015 | | Stock options | | | 2,977,550 | | | | 5,322,266 | | | | 7,637,005 | | Restricted stock and restricted stock units | | | 1,429,816 | | | | 715,504 | | | | 537,266 | | Warrants | | | — | | | | — | | | | 7,326,884 | |
| | For the Year | | | For the Year | | | For the Year | | | | Ended | | | Ended | | | Ended | | | | December 31, | | | December 31, | | | December 31, | | | | 2019 | | | 2018 | | | 2017 | | Stock options | | | 2,765,826 | | | | 3,406,171 | | | | 2,977,550 | | Restricted stock units | | | 3,342,923 | | | | 2,793,680 | | | | 1,429,816 | |
As of December 31, 2017,2019, we had two2 reportable segments (Education and Trade Publishing)HMH Books & Media). Our Education segment provides educational products, technology platforms and services to meet the diverse needs of today’s classrooms. These products and services include print and digital content in the form of textbooks, digital courseware, instructional aids, educational assessment and intervention solutions, which are aimed at improving achievement and supporting learning for students thatwho are not keeping pace with peers, professional development and school reform services. Our Trade PublishingHMH Books & Media segment primarily develops, markets and sells consumer books in print and digital formats and licenses book rights to other publishers and electronic businesses in the United States and abroad. The principal distribution channels for Trade PublishingHMH Books & Media products are retail stores, both physical and online, and wholesalers. Reference materials are also sold 103
Houghton Mifflin Harcourt Company Notes to schools, colleges, libraries, office supply distributorsConsolidated Financial Statements (in thousands of dollars, except share and other businesses.per share information) We measure and evaluate our reportable segments based on net sales and segment Adjusted EBITDA.EBITDA from continuing operations. We exclude from our segments certain corporate-related expenses, as our corporate functions do not meet the definition of a segment, as defined in the accounting guidance relating to segment reporting. In addition, certain transactions or adjustments that our Chief Operating Decision Maker considers to benon-operational, such as amounts related to goodwill and other intangible asset impairment charges, derivative instruments charges, acquisition-relatedacquisition/disposition-related activity, restructuring/integration costs, severance, separation costs and facility closures, equity compensation charges, debt extinguishment losses, legal settlement charges, gains or losses from divestitures, amortization and depreciation expenses, as well as interest and taxes, are excluded from segment Adjusted EBITDA.EBITDA from continuing operations. Although we exclude these amounts from segment Adjusted EBITDA from continuing operations, they are included in reported consolidated net loss and are included in the reconciliation below. As a result of the sale of the Riverside Business, the results of the Riverside Business are no longer presented within continuing operations. Accordingly, the segment disclosures for the Education reportable segment has been recast for all periods to exclude the results of the Riverside Business. These changes had no impact on the previously reported financial results for the HMH Books & Media reportable segment. �� | | | Year Ended December 31, | | | | | | | | | | | | | | HMH | | | Corporate/ | | | (in thousands) | | Year Ended December 31, | | | Education | | | Books & Media | | | Other | | | | | Education | | | Trade
Publishing | | | Corporate/
Other | | | 2019 | | | | | | | | | | | | | | Net sales | | | $ | 1,210,646 | | | $ | 180,028 | | | $ | — | | Segment Adjusted EBITDA | | | | 196,907 | | | | 14,908 | | | | (46,077 | ) | 2018 | | | | | | | | | | | | | | Net sales | | | $ | 1,122,689 | | | $ | 199,728 | | | $ | — | | Segment Adjusted EBITDA | | | | 210,604 | | | | 21,942 | | | | (40,418 | ) | 2017 | | | | | | | | | | | | | | | | | | | Net sales | | $ | 1,222,971 | | | $ | 184,540 | | | $ | — | | | $ | 1,146,453 | | | $ | 180,576 | | | $ | — | | Segment Adjusted EBITDA | | | 253,600 | | | | 16,060 | | | | (50,658 | ) | | | 223,941 | | | | 12,096 | | | | (50,758 | ) | 2016 | | | | | | | | Net sales | | $ | 1,207,070 | | | $ | 165,615 | | | $ | — | | | Segment Adjusted EBITDA | | | 225,672 | | | | 6,255 | | | | (48,506 | ) | | 2015 | | | | | | | | Net sales | | $ | 1,251,122 | | | $ | 164,937 | | | $ | — | | | Segment Adjusted EBITDA | | | 269,386 | | | | 7,703 | | | | (42,110 | ) | |
The following table disaggregates our net sales by major source: | | Year Ended December 31, 2019 | | | | | | | | HMH | | | | | | (in thousands) | | Education | | | Books & Media | | | Consolidated | | Core solutions (1) | | $ | 578,675 | | | $ | — | | | $ | 578,675 | | Extensions businesses (2) | | | 631,971 | | | | — | | | | 631,971 | | Trade products | | | — | | | | 180,028 | | | | 180,028 | | Net sales | | $ | 1,210,646 | | | $ | 180,028 | | | $ | 1,390,674 | |
111
| | Year Ended December 31, 2018 | | | | | | | | HMH | | | | | | (in thousands) | | Education | | | Books & Media | | | Consolidated | | Core solutions (1) | | $ | 538,166 | | | $ | — | | | $ | 538,166 | | Extensions businesses (2) | | | 584,523 | | | | — | | | | 584,523 | | Trade products | | | — | | | | 199,728 | | | | 199,728 | | Net sales | | $ | 1,122,689 | | | $ | 199,728 | | | $ | 1,322,417 | |
104
Houghton Mifflin Harcourt Company Notes to Consolidated Financial Statements (in thousands of dollars, except share and per share information) | | Year Ended December 31, 2017 | | | | | | | | HMH | | | | | | (in thousands) | | Education | | | Books & Media | | | Consolidated | | Core solutions (1) | | $ | 595,097 | | | $ | — | | | $ | 595,097 | | Extensions businesses (2) | | | 551,356 | | | | — | | | | 551,356 | | Trade products | | | — | | | | 180,576 | | | | 180,576 | | Net sales | | $ | 1,146,453 | | | $ | 180,576 | | | $ | 1,327,029 | |
(1) | Comprehensive solutions primarily for reading, literature, math, science and social studies programs. |
(2) | Primarily consists of our Heinemann brand, intervention, supplemental and professional services. |
Reconciliation of Segment Adjusted EBITDA to the consolidated statements of operations is as follows: | | | | | | | | Years Ended December 31, | | | (in thousands) | | Years Ended December 31, | | | 2019 | | | 2018 | | | 2017 | | | | | 2017 | | | 2016 | | | 2015 | | | Total Segment Adjusted EBITDA | | $ | 219,002 | | | $ | 183,421 | | | $ | 234,979 | | | $ | 165,738 | | | $ | 192,128 | | | $ | 185,279 | | Interest expense | | | (42,805 | ) | | | (39,181 | ) | | | (32,254 | ) | | | (48,778 | ) | | | (45,680 | ) | | | (42,805 | ) | Interest income | | | 1,338 | | | | 518 | | | | 209 | | | | 3,157 | | | | 2,550 | | | | 1,338 | | Depreciation expense | | | (75,494 | ) | | | (79,825 | ) | | | (72,639 | ) | | | (61,475 | ) | | | (75,116 | ) | | | (71,049 | ) | Amortization expense—film asset | | | | (9,835 | ) | | | (6,057 | ) | | | — | | Amortization expense | | | (203,024 | ) | | | (218,344 | ) | | | (223,551 | ) | | | (201,382 | ) | | | (170,903 | ) | | | (195,394 | ) | Non-cash charges—stock compensation | | | (10,828 | ) | | | (10,567 | ) | | | (12,452 | ) | | | (13,968 | ) | | | (13,248 | ) | | | (10,728 | ) | Non-cash charges—loss on derivative instruments | | | 1,366 | | | | (614 | ) | | | (2,362 | ) | | | (899 | ) | | | (1,374 | ) | | | 1,366 | | Non-cash charges—asset impairment charges | | | (3,980 | ) | | | (139,205 | ) | | | — | | | | — | | | | — | | | | (3,980 | ) | Purchase accounting adjustments | | | — | | | | (5,116 | ) | | | (7,487 | ) | | Fees, expenses or charges for equity offerings, debt or acquisitions | | | (1,464 | ) | | | (1,123 | ) | | | (25,562 | ) | | 2017 Restructuring Plan | | | (40,653 | ) | | | — | | | | — | | | Restructuring/Integration | | | — | | | | (14,364 | ) | | | (4,572 | ) | | Severance, separation costs and facility closures | | | (713 | ) | | | (15,650 | ) | | | (4,767 | ) | | Inventory obsolescence related to strategic transformation plan | | | | (9,758 | ) | | | — | | | | — | | Fees, expenses or charges for equity offerings, debt or acquisitions/dispositions | | | | (6,327 | ) | | | (2,883 | ) | | | (1,464 | ) | Restructuring/severance and other charges | | | | (21,742 | ) | | | (11,478 | ) | | | (37,952 | ) | Legal reimbursement (settlement) | | | | — | | | | — | | | | 3,633 | | Gain on sale of assets | | | | — | | | | 201 | | | | — | | Loss on extinguishment of debt | | | — | | | | — | | | | (3,051 | ) | | | (4,363 | ) | | | — | | | | — | | Legal reimbursement (settlement) | | | 3,633 | | | | (10,000 | ) | | | — | | | | | | | | | | | | | | Loss from operations before taxes | | | (153,622 | ) | | | (350,050 | ) | | | (153,509 | ) | | Provision (benefit) for income taxes | | | (50,435 | ) | | | (65,492 | ) | | | (19,640 | ) | | | | | | | | | | | | | Net loss | | $ | (103,187 | ) | | $ | (284,558 | ) | | $ | (133,869 | ) | | | | | | | | | | | | | Loss before taxes | | | | (209,632 | ) | | | (131,860 | ) | | | (171,756 | ) | (Provision) benefit for income taxes | | | | (4,201 | ) | | | (5,597 | ) | | | 51,419 | | Net loss from continuing operations | | | $ | (213,833 | ) | | $ | (137,457 | ) | | $ | (120,337 | ) |
Segment information as of December 31, 20172019 and 20162018 is as follows: | | (in thousands) | | | | | | | | 2019 | | | 2018 | | | | | 2017 | | | 2016 | | | Total assets—Education segment | | $ | 2,121,647 | | | $ | 2,206,309 | | | $ | 1,971,553 | | | $ | 1,999,481 | | Total assets—Trade Publishing segment | | | 173,395 | | | | 183,356 | | | Total assets—HMH Books & Media segment | | | | 186,318 | | | | 167,510 | | Total assets—Corporate and Other | | | 268,549 | | | | 341,806 | | | | 355,301 | | | | 328,133 | | | | | | | | | | Total consolidated assets | | $ | 2,563,591 | | | $ | 2,731,471 | | | $ | 2,513,172 | | | $ | 2,495,124 | | | | | | | | | |
The following represents long-lived assets (property, plant, and equipment) outside of the United States, which are substantially in Ireland. All other long-lived assets are located in the United States. | | | | | | | | | | (in thousands) | | 2017 | | | 2016 | | Long-lived assets—International | | $ | 7,593 | | | $ | 498 | | | | | | | | | | |
(in thousands) | | 2019 | | | 2018 | | Long-lived assets—International | | $ | 113 | | | $ | 64 | |
112105
Houghton Mifflin Harcourt Company Notes to Consolidated Financial Statements (in thousands of dollars, except share and per share information) The following is a schedule of net sales by geographic region: | | (in thousands) | | | | | | | | Year Ended December 31, 2019 | | | | | | Net sales—U.S. | | | $ | 1,327,833 | | Net sales—International | | | | 62,841 | | Total net sales | | | $ | 1,390,674 | | Year Ended December 31, 2018 | | | | | | Net sales—U.S. | | | $ | 1,249,568 | | Net sales—International | | | | 72,849 | | Total net sales | | | $ | 1,322,417 | | Year Ended December 31, 2017 | | | | | | | Net sales—U.S. | | $ | 1,335,438 | | | $ | 1,254,956 | | Net sales—International | | | 72,073 | | | | 72,073 | | | | | | | Total net sales | | $ | 1,407,511 | | | $ | 1,327,029 | | | | | | | Year Ended December 31, 2016 | | | | Net sales—U.S. | | $ | 1,284,562 | | | Net sales—International | | | 88,123 | | | | | | | | Total net sales | | $ | 1,372,685 | | | | �� | | | | Year Ended December 31, 2015 | | | | Net sales—U.S. | | $ | 1,337,897 | | | Net sales—International | | | 78,162 | | | | | | | | Total net sales | | $ | 1,416,059 | | | | | | | |
17.19. | Valuation and Qualifying Accounts |
| | | | | | | | | | | | | | | | | | | | Balance at
Beginning
of Year | | | Net Charges | | | Utilization of
Allowances | | | Balance at
End of
Year | | 2017 | | | | | | | | | | | | | | | | | Allowance for doubtful accounts | | $ | 3,576 | | | $ | 400 | | | $ | (1,378 | ) | | $ | 2,598 | | Reserve for returns | | | 18,971 | | | | 43,688 | | | | (41,673 | ) | | | 20,986 | | Reserve for royalty advances | | | 85,562 | | | | 18,116 | | | | (36 | ) | | | 103,642 | | Deferred tax valuation allowance | | | 759,887 | | | | (187,480 | ) | | | (754 | ) | | | 571,653 | | 2016 | | | | | | | | | | | | | | | | | Allowance for doubtful accounts | | $ | 8,459 | | | $ | 734 | | | $ | (5,617 | ) | | $ | 3,576 | | Reserve for returns | | | 24,288 | | | | 54,059 | | | | (59,376 | ) | | | 18,971 | | Reserve for royalty advances | | | 70,014 | | | | 16,270 | | | | (722 | ) | | | 85,562 | | Deferred tax valuation allowance | | | 664,730 | | | | 98,949 | | | | (3,792 | ) | | | 759,887 | | 2015 | | | | | | | | | | | | | | | | | Allowance for doubtful accounts | | $ | 5,625 | | | $ | 4,109 | | | $ | (1,275 | ) | | $ | 8,459 | | Reserve for returns | | | 22,159 | | | | 67,764 | | | | (65,636 | ) | | | 24,288 | | Reserve for royalty advances | | | 55,000 | | | | 15,240 | | | | (226 | ) | | | 70,014 | | Deferred tax valuation allowance | | | 550,660 | | | | 116,935 | | | | (2,865 | ) | | | 664,730 | |
| | Balance at | | | | | | | | | | | Balance at | | | | Beginning | | | | | | | Utilization of | | | End | | | | of Year | | | Net Charges | | | Allowances | | | of Year | | 2019 | | | | | | | | | | | | | | | | | Allowance for doubtful accounts | | $ | 2,173 | | | $ | 1,909 | | | $ | (1,067 | ) | | $ | 3,015 | | Reserve for returns | | | 18,559 | | | | 41,654 | | | | (43,534 | ) | | | 16,679 | | Reserve for royalty advances | | | 117,797 | | | | 16,500 | | | | (14,602 | ) | | | 119,695 | | Deferred tax valuation allowance | | | 562,392 | | | | 23,707 | | | | (2,594 | ) | | | 583,505 | | 2018 | | | | | | | | | | | | | | | | | Allowance for doubtful accounts | | $ | 2,508 | | | $ | 128 | | | $ | (463 | ) | | $ | 2,173 | | Reserve for returns | | | 20,580 | | | | 36,395 | | | | (38,416 | ) | | | 18,559 | | Reserve for royalty advances | | | 103,606 | | | | 17,301 | | | | (3,110 | ) | | | 117,797 | | Deferred tax valuation allowance | | | 571,653 | | | | (7,667 | ) | | | (1,594 | ) | | | 562,392 | | 2017 | | | | | | | | | | | | | | | | | Allowance for doubtful accounts | | $ | 3,463 | | | $ | 400 | | | $ | (1,355 | ) | | $ | 2,508 | | Reserve for returns | | | 18,671 | | | | 43,682 | | | | (41,773 | ) | | | 20,580 | | Reserve for royalty advances | | | 85,526 | | | | 17,861 | | | | 219 | | | | 103,606 | | Deferred tax valuation allowance | | | 759,887 | | | | (187,480 | ) | | | (754 | ) | | | 571,653 | |
113106
Houghton Mifflin Harcourt Company Notes to Consolidated Financial Statements (in thousands of dollars, except share and per share information) 18.20. | Quarterly Results of Operations (Unaudited) |
| | | | | | | | | | Three Months Ended | | | | | Three Months Ended | | | March 31, | | | June 30, | | | September 30, | | | December 31, | | | | | March 31, | | | June 30, | | | September 30, | | | December 31, | | | 2017: | | | | | | | | | | 2019: | | | | | | | | | | | | | | | | | | Net sales | | $ | 221,917 | | | $ | 393,051 | | | $ | 532,040 | | | $ | 260,503 | | | $ | 194,635 | | | $ | 388,896 | | | $ | 565,668 | | | $ | 241,475 | | Gross profit | | | 73,406 | | | | 176,733 | | | | 277,602 | | | | 89,692 | | | | 57,893 | | | | 156,055 | | | | 273,481 | | | | 59,065 | | Operating income (loss) | | | (96,103 | ) | | | (31,166 | ) | | | 90,210 | | | | (76,462 | ) | | | (101,835 | ) | | | (30,253 | ) | | | 77,871 | | | | (108,947 | ) | Income (loss) from continuing operations, net of tax | | | | (117,362 | ) | | | (40,613 | ) | | | 69,260 | | | | (125,118 | ) | Net income (loss) | | | (120,658 | ) | | | (46,867 | ) | | | 90,506 | | | | (26,168 | ) | | | (117,362 | ) | | | (40,613 | ) | | | 69,260 | | | | (125,118 | ) | Net income (loss) per share attributable to common stockholders | | | | | | | | | | | (117,362 | ) | | | (40,613 | ) | | | 69,260 | | | | (125,118 | ) | Basic | | $ | (0.98 | ) | | $ | (0.38 | ) | | $ | 0.74 | | | $ | (0.21 | ) | | Diluted | | $ | (0.98 | ) | | $ | (0.38 | ) | | $ | 0.73 | | | $ | (0.21 | ) | | 2016: | | | | | | | | | | Basic: | | | | | | | | | | | | | | | | | | Net loss | | | $ | (0.95 | ) | | $ | (0.33 | ) | | $ | 0.56 | | | $ | (1.01 | ) | Diluted: | | | | | | | | | | | | | | | | | | Net loss | | | $ | (0.95 | ) | | $ | (0.33 | ) | | $ | 0.55 | | | $ | (1.01 | ) | 2018: | | | | | | | | | | | | | | | | | | Net sales | | $ | 205,816 | | | $ | 392,042 | | | $ | 533,021 | | | $ | 241,806 | | | $ | 199,759 | | | $ | 357,365 | | | $ | 516,255 | | | $ | 249,038 | | Gross profit | | | 54,224 | | | | 172,848 | | | | 278,368 | | | | 64,936 | | | | 64,315 | | | | 162,827 | | | | 278,175 | | | | 91,663 | | Operating income (loss) | | | (122,204 | ) | | | (21,152 | ) | | | 83,371 | | | | (250,788 | ) | | | (92,905 | ) | | | (14,747 | ) | | | 91,838 | | | | (74,711 | ) | Income (loss) from continuing operations, net of tax | | | | (105,886 | ) | | | (29,089 | ) | | | 83,908 | | | | (86,390 | ) | Income from discontinued operations, net of tax | | | | 4,575 | | | | 5,817 | | | | 2,441 | | | | 30,469 | | Net income (loss) | | | (165,148 | ) | | | (28,391 | ) | | | 90,022 | | | | (181,041 | ) | | | (101,311 | ) | | | (23,272 | ) | | | 86,349 | | | | (55,921 | ) | Net income (loss) per share attributable to common stockholders | | | | | | | | | | | | | | | | | | | | | | | | | Basic | | $ | (1.34 | ) | | $ | (0.23 | ) | | $ | 0.74 | | | $ | (1.48 | ) | | Diluted | | $ | (1.34 | ) | | $ | (0.23 | ) | | $ | 0.73 | | | $ | (1.48 | ) | | Basic: | | | | | | | | | | | | | | | | | | Continuing operations | | | $ | (0.86 | ) | | $ | (0.24 | ) | | $ | 0.68 | | | $ | (0.70 | ) | Discontinued operations | | | | 0.04 | | | | 0.05 | | | | 0.02 | | | | 0.25 | | Net loss | | | $ | (0.82 | ) | | $ | (0.19 | ) | | $ | 0.70 | | | $ | (0.45 | ) | Diluted: | | | | | | | | | | | | | | | | | | Continuing operations | | | $ | (0.86 | ) | | $ | (0.24 | ) | | $ | 0.68 | | | $ | (0.70 | ) | Discontinued operations | | | | 0.04 | | | | 0.05 | | | | 0.02 | | | | 0.25 | | Net loss | | | $ | (0.82 | ) | | $ | (0.19 | ) | | $ | 0.70 | | | $ | (0.45 | ) |
Our net sales, operating profit or loss and net cash provided by or used in operations are impacted by the inherent seasonality of the academic calendar. Consequently, the performance of our businesses may not be comparable quarter to consecutive quarter and should be considered on the basis of results for the whole year or by comparing results in a quarter with results in the same quarter for the previous year. During the sixthree months ended JuneSeptember 30, 2017,2018, we recordedout-of-period corrections of approximately $4.0$2.8 million increasing net sales and reducing deferred revenue that should have been recognized previously.during the three months ended March 31, 2018. Management believes theseout-of-period corrections are not material to the current period financial statements or any previously issued financial statements. During the six months ended June 30, 2016, we recordedout-of-period corrections of approximately $2.9 million increasing net sales and reducing deferred revenue that should have been recognized previously. Management believes theseout-of-period corrections are not material to the current period financial statements or any previously issued financial statements.
114107
Item 9. Changes in and Disagreements with Accountants on Accounting and Financial Disclosure None. Item 9A. Controls and Procedures Evaluation of Disclosure Controls and Procedures Our management, with the participation of our Chief Executive Officer (“CEO”) and our Executive Vice President and Chief Financial Officer (“CFO”), evaluated the effectiveness of our disclosure controls and procedures as of December 31, 20172019 pursuant to Rules13a-15(e) and15d-15(e) of the Securities Exchange Act of 1934 (as amended, the “Exchange Act”). Based on that evaluation, our CEO and CFO have concluded that our disclosure controls and procedures as of December 31, 20172019 were effective to provide reasonable assurance that information required to be disclosed by us in reports that we file or submit under the Exchange Act is recorded, processed, summarized and reported within the time periods specified in the SEC’s rules and forms and the information required to be disclosed by us is accumulated and communicated to our management, including our CEO and CFO, to allow timely decisions regarding required disclosure. In designing and evaluating the disclosure controls and procedures, management recognizes that any controls and procedures, no matter how well designed and operated, can provide only reasonable assurance of achieving the desired control objectives. In addition, the design of disclosure controls and procedures must reflect the fact that there are resource constraints and that management is required to apply judgment in evaluating the benefits of possible controls and procedures relative to their costs. Management’s Report on Internal Control over Financial Reporting Management of the Company is responsible for establishing and maintaining adequate internal control over financial reporting as defined in Rules13a-15(f) or15d-15(f) promulgated under the Securities Exchange Act of 1934. Internal control over financial reporting is a process designed to provide reasonable assurance regarding the reliability of financial reporting and the preparation of financial statements for external purposes in accordance with generally accepted accounting principles and includes those policies and procedures that: | • | Pertain to the maintenance of records that, in reasonable detail, accurately and fairly reflect the transactions and disposition of the assets of the Company; |
| • | Provide reasonable assurance that transactions are recorded as necessary to permit preparation of financial statements in accordance with generally accepted accounting principles, and that receipts and expenditures of the Company are being made only in accordance with authorizations of management and directors of the Company; and |
| • | Provide reasonable assurance regarding prevention or timely detection of unauthorized acquisition, use or dispositions of the Company’s assets that could have a material effect on the financial statements. |
Because of its inherent limitations, internal control over financial reporting may not prevent or detect misstatements. Also, projections of any evaluation of effectiveness to future periods are subject to the risk that controls may become inadequate because of changes in conditions, or that the degree of compliance with the policies or procedures may deteriorate. The Company’s management assessed the effectiveness of the Company’s internal control over financial reporting as of December 31, 2017.2019. In making this assessment, the Company’s management used the criteria established inInternal Control-Integrated Framework (2013) issued by the Committee of Sponsoring Organizations of the Treadway Commission (COSO). 115
Based on our assessment and the aforementioned criteria, (and subject to the aforementioned exclusion), management concluded that, as of December 31, 2017,2019, the Company’s internal control over financial reporting was effective. 108
The effectiveness of the Company’s internal control over financial reporting as of December 31, 20172019 has been audited by PricewaterhouseCoopers LLP, an independent registered public accounting firm, as stated in their report which appears herein in Item 8 of this Annual Report.Report on Form 10-K. Changes in Internal Control Over Financial Reporting There were no changes in our internal control over financial reporting in the quarter ended December 31, 20172019 that materially affected, or are reasonably likely to materially affect, our internal control over financial reporting. Item 9B. Other Information None. Item 10. Directors, Executive Officers and Corporate Governance Except to the extent provided below, the information required by this Item shall be set forth in the sections titled “Corporate Governance” and “Executive Officers” in our Proxy Statement for our 20172020 Annual Meeting of Stockholders, to be filed with the SEC within 120 days of December 31, 2017,2019, and is incorporated into this Annual Report on Form 10-K by reference. We have adopted a Code of Conduct that applies to our principal executive officer, principal financial officer and principal accounting officer or any person performing similar functions, which we post on our website in the “Corporate Governance” link located at: ir.hmhco.com. We intend to publish any amendment to, or waiver from, the Code of Conduct on our website. We will provide any person, without charge, a copy of such Code of Conduct upon written request, which may be mailed to 125 High Street, Boston, MA 02110, Attn: Corporate Secretary. Item 11. Executive Compensation The information required by this Item shall be set forth in the sections titled “Executive Compensation” and “Director Compensation” in our Proxy Statement for our 20182020 Annual Meeting of Stockholders to be filed with the SEC within 120 days of December 31, 2017,2019, and is incorporated into this Annual Report on Form 10-K by reference. Item 12. Security Ownership of Certain Beneficial Owners and Management and Related Stockholders Matters The information required by this Item shall be set forth in the section titled “Security Ownership and Other Matters” in our Proxy Statement for our 20182020 Annual Meeting of Stockholders to be filed with the SEC within 120 days of December 31, 2017,2019, and is incorporated into this Annual Report on Form 10-K by reference. Item 13. Certain Relationships and Related Transactions The information required by this Item shall be set forth in the section titled “Corporate Governance – Review and Approval of Transactions with Related Persons” in our Proxy Statement for our 20182020 Annual Meeting of Stockholders to be filed with the SEC within 120 days of December 31, 2017,2019, and is incorporated into this Annual Report on Form 10-K by reference. Item 14. Principal Accounting Fees and Services The information required by this Item shall be set forth in the section titled “Ratification of the Appointment of the Company’s Independent Registered Public Accounting Firm” in our Proxy Statement for our 20182020 Annual Meeting of Stockholders to be filed with the SEC within 120 days of December 31, 2017,2019, and is incorporated into this Annual Report on Form 10-K by reference. 116
109
Item 15. Exhibits, Financial Statement Schedules (a) Documents filed as part of the report. | | | | | (1) Consolidated Financial Statements | | | | | Report of Independent Registered Public Accounting Firm | | | 61 | 52 | Consolidated Balance Sheets as of December 31, 20172019 and 20162018 | | | 63 | 55 | Consolidated Statements of Operations for the years ended December 31, 2017, 20162019, 2018 and 20152017 | | | 64 | 56 | Consolidated Statements of Comprehensive Loss for the years ended December 31, 2017, 20162019, 2018 and 20152017 | | | 65 | 57 | Consolidated Statements of Cash Flows for the years ended December 31, 2017, 20162019, 2018 and 20152017 | | | 66 | 58 | Consolidated Statements of Stockholders’ Equity for the years ended December 31, 2017, 20162019, 2018 and 20152017 | | | 67 | 59 | Notes to Consolidated Financial Statements | | | 68 | 60 | (2) Financial Statement Schedules. | | | 113 | | Schedule II—“Valuation and Qualifying Accounts” is included herein as Note 1719 in the Notes to Consolidated Financial Statements. | | | | | (3) Exhibits. | | | 118 | 116 | See the Exhibit Index. | | | | |
115
EXHIBIT INDEX 117
EXHIBIT INDEX
Exhibit No. | | | Description | Exhibit
No.
| | Description
| 2.1 | | 2.1 | | Prepackaged Joint Plan of Reorganization of the Debtors Under Chapter 11 of the Bankruptcy Code by and among Houghton Mifflin Harcourt Publishing Company, Houghton Mifflin Harcourt Publishers Inc., HMH Publishers, LLC, Houghton Mifflin Holding Company, Inc., Houghton Mifflin, LLC, Houghton Mifflin Finance, Inc., Houghton Mifflin Holdings, Inc., HM Publishing Corp., Riverdeep Inc., A Limited Liability Company, Broderbund LLC, RVDP, Inc., HRW Distributors, Inc., Greenwood Publishing Group, Inc., Classroom Connect, Inc., Achieve! Data Solutions, LLC, Steck-Vaughn Publishing LLC, HMH Supplemental Publishers Inc., HMH Holdings (Delaware), Inc., Sentry Realty Corporation, Houghton Mifflin Company International, Inc., The Riverside Publishing Company, Classwell Learning Group Inc., Cognitive Concepts, Inc., Edusoft And Advanced Learning Centers, Inc. (incorporated herein by reference to Exhibit No. 2.1 to Amendment No. 1 to the Company’s Registration Statement on FormS-1, filed September 13, 2013 (File No. 333-190356)). | | | | 2.2 | | Stock and Asset Purchase Agreement dated as of April 23, 2015, by and among Houghton Mifflin Harcourt Publishing Company, as Purchaser, Scholastic Corporation, as Parent Seller, and Scholastic Inc., as Seller (incorporated herein by reference to Exhibit 2.1 to the Company’s Current Report on Form8-K, filed April 24, 2015 (File No. 001-36166)). Certain schedules | | | | 2.3 | | Asset Purchase Agreement, by and similar attachmentsamong Houghton Mifflin Harcourt Publishing Company, Houghton Mifflin Harcourt Company (solely for purposes of Section 8.2 and 8.3) and Riverside Assessment, LLC, dated as of September 12, 2018 (incorporated herein by reference to this Exhibit 2.1 have been omitted in accordance with RegulationS-K Item 601(b)(2). The Company agrees to furnish supplementally a copy of all omitted schedules and similar attachments to the SEC upon its request.Company’s Current Report on Form 8-K, filed September 12, 2018 (File No. 001-36166)). | | | | 2.4 | | Amendment No. 1 to Asset Purchase Agreement, by and among Houghton Mifflin Harcourt Publishing Company, Houghton Mifflin Harcourt Company (solely for purposes of Section 8.2 and 8.3) and Riverside Assessment, LLC, dated as of October 1, 2018 (incorporated herein by reference to Exhibit 2.1b to the Company’s Current Report on Form 8-K, filed October 5, 2018 (File No. 001-36166)). | | | | 3.1 | | Amended and Restated Certificate of Incorporation (incorporated herein by reference to Exhibit No. 3.1 to Amendment No. 4 to the Company’s Registration Statement on FormS-1, filed October 25, 2013 (File No. 333-190356)). | | | | 3.2 | | Certificate of Amendment to Amended and Restated Certificate of Incorporation (incorporated herein by reference to Exhibit No. 3.2 to Amendment No. 4 to the Company’s Registration Statement on FormS-1, filed October 25, 2013 (File No. 333-190356)). | | | | 3.3 | | Amended and RestatedBy-laws of the Registrant, as amended, effective September 24, 2019 (incorporated herein by reference to Exhibit No. 3.1 to the Company’s Current Report on Form8-K, filed November 19, 2013September 30, 2019 (File No. 001-36166)). | | | | 4.1 | | Investor Rights Agreement, dated as of June 22, 2012, by and among HMH Holdings (Delaware), Inc. and the stockholders party thereto (incorporated herein by reference to Exhibit No. 4.1 to Amendment No. 1 to the Company’s Registration Statement on FormS-1, filed September 13, 2013 (File No. 333-190356)). | | | | 4.2 | | Specimen Common Stock Certificate (incorporated herein by reference to Exhibit No. 4.3 to Amendment No. 4 to the Company’s Registration Statement on FormS-1, filed October 25, 2013 (File No. 333-190356)). |
116
Exhibit No. | | Description | | | | 4.3 | | Form of Warrant Certificate (incorporated herein by reference to Exhibit No. 4.4 to Amendment No. 2 to the Company’s Registration Statement on FormS-1, filed October 4, 2013 (File No. 333-190356)). | | | | 4.4 | | Warrant Agreement, dated as of June 22, 2012, among HMH Holdings (Delaware), Inc., Computershare Inc. and Computershare Trust Company, N.A. (incorporated herein by reference to Exhibit No. 4.5 to Amendment No. 2 to the Company’s Registration Statement on FormS-1, filed October 4, 2013 (File No. 333-190356)). |
118
| | | Exhibit
No.
| | Description
| 4.5 | | Indenture, dated as of November 22, 2019, among Houghton Mifflin Harcourt Company, Inc., Houghton Mifflin Harcourt Publishers Inc., Houghton Mifflin Harcourt Publishing Company and HMH Publishers LLC, the subsidiary guarantors party thereto, U.S. Bank National Association, as trustee, and Citibank N.A., as collateral agent (incorporated herein by reference to Exhibit 4.1 to the Company’s Current Report on Form 8-K, filed November 25, 2019 (File No. 001-36166)). | 10.1 | | | 4.6 | | Form of 9.000% Senior Secured Notes due 2025 (incorporated herein by reference to Exhibit A to Exhibit 4.1 to the Company’s Current Report on Form 8-K, filed November 25, 2019) (File No. 001-36166)). | | | | 4.7 | | Description of Registrant’s Common Stock. | | | | 10.1 | | Nomination Agreement, effective December 21, 2016, by and among Houghton Mifflin Harcourt Company and certain affiliates of Anchorage Capital Group, L.L.C. (incorporated herein by reference to Exhibit 10.1 to the Company’s Current Report on Form8-K, filed December 22, 2016 (File No. 001-36166)). | | | | 10.2† | | Form of Indemnification Agreement (incorporated herein by reference to Exhibit No. 10.12 to Amendment No. 1 to the Company’s Registration Statement on FormS-1, filed September 13, 2013 (File No. 333-190356)). | | | | 10.3 | | Amended and Restated Term Loan Credit Agreement, dated as of May 29, 2015, by and among Houghton Mifflin Harcourt Company, Houghton Mifflin Harcourt Publishers Inc., HMH Publishers LLC, Houghton Mifflin Harcourt Publishing Company, certain other subsidiaries of Houghton Mifflin Harcourt Company, as subsidiary guarantors, the lenders party thereto and Citibank, N.A., as administrative agent and collateral agent (incorporated herein by reference to Exhibit 10.1 to the Company’s Current Report on Form8-K, filed May 29, 2015 (File No. 001-36166)). | | | | 10.4 | | Amended and Restated Term Facility Guarantee and Collateral Agreement, dated as of May 29, 2015, by and among Houghton Mifflin Harcourt Company, Houghton Mifflin Harcourt Publishers Inc., HMH Publishers LLC, Houghton Mifflin Harcourt Publishing Company, the subsidiaries of Houghton Mifflin Harcourt Company from time to time party thereto and Citibank, N.A., as collateral agent (incorporated herein by reference to Exhibit 10.2 to the Company’s Current Report on Form8-K, filed May 29, 2015 (File No. 001-36166)). | | | | 10.5 | | Amended and Restated Revolving Credit Agreement, dated as of July 22, 2015, by and among Houghton Mifflin Harcourt Company, Houghton Mifflin Harcourt Publishers Inc., HMH Publishers LLC, Houghton Mifflin Harcourt Publishing Company, certain other subsidiaries of Houghton Mifflin Harcourt Company, as subsidiary guarantors, the lenders party thereto and Citibank, N.A., as administrative agent and collateral agent (incorporated herein by reference to Exhibit 10.1 to the Company’s Current Report on Form8-K, filed July 23, 2015 (File No. 001-36166)). | | | | 10.6 | | Amended and Restated Revolving Facility Guarantee and Collateral Agreement, dated as of July 23, 2015, by and among Houghton Mifflin Harcourt Company, Houghton Mifflin Harcourt Publishers Inc., HMH Publishers LLC, Houghton Mifflin Harcourt Publishing Company, the subsidiaries of Houghton Mifflin Harcourt Company from time to time party thereto and Citibank, N.A., as collateral agent (incorporated herein by reference to Exhibit 10.2 to the Company’s Current Report on Form8-K, filed July 22, 2015 (File No. 001-36166)). |
117
Exhibit No. | | Description | | | | 10.7†10.7 | | First Amendment to Credit Agreement, First Amendment to Guarantee and Collateral Agreement and Consent to Release of Mortgages, dated as of June 28, 2019 and effective as of July 1, 2019, by and among Houghton Mifflin Harcourt Company, Houghton Mifflin Harcourt Publishers Inc., HMH Publishers LLC, Houghton Mifflin Harcourt Publishing Company, certain other subsidiaries of Houghton Mifflin Harcourt Company, as subsidiary guarantors, the lenders party thereto and Citibank, N.A., as administrative agent and collateral agent (incorporated herein by reference to Exhibit 10.1 to the Company’s Current Report on Form 8-K, filed July 1, 2019 (File No. 001-36166)). | | | | 10.8 | | Second Amended and Restated Term Loan Credit Agreement, dated as of November 22, 2019, among Houghton Mifflin Harcourt Company, Inc., Houghton Mifflin Harcourt Publishers Inc., Houghton Mifflin Harcourt Publishing Company and HMH Publishers LLC, the subsidiary guarantors party thereto, Citibank N.A., as administrative agent and collateral agent, Citigroup Global Market Inc., Morgan Stanley Senior Funding, Inc., BofA Securities, Inc. and Wells Fargo Securities, LLC, as joint lead arrangers and joint bookrunners, and Citizens Bank, N.A., as co-manager (incorporated herein by reference to Exhibit 10.1 to the Company’s Current Report on Form 8-K, filed November 25, 2019 (File No. 001-36166)). | | | | 10.9 | | Second Amended and Restated Revolving Credit Agreement, dated as of November 22, 2019, among Houghton Mifflin Harcourt Company, Inc., Houghton Mifflin Harcourt Publishers Inc., Houghton Mifflin Harcourt Publishing Company and HMH Publishers LLC, the subsidiary guarantors party thereto, Citibank N.A., as administrative agent and collateral agent, Citigroup Global Market Inc., Morgan Stanley Senior Funding, Inc., BofA Securities, Inc. and Wells Fargo Securities, LLC, as joint lead arrangers and joint bookrunners, and Citizens Bank, N.A., as co-manager (incorporated herein by reference to Exhibit 10.2 to the Company’s Current Report on Form 8-K, filed November 25, 2019 (File No. 001-36166)). | | | | 10.10† | | HMH Holdings (Delaware), Inc. Change in Control Severance Plan (incorporated herein by reference to Exhibit No. 10.5 to Amendment No. 1 to the Company’s Registration Statement on FormS-1, filed September 13, 2013 (File No. 333-190356)). | | | | 10.8† 10.11† | | Houghton Mifflin Harcourt Publishing Company ELT Severance Plan (incorporated herein by reference to Exhibit 10.3 to the Company’s Quarterly Report on Form10-Q, filed November 5, 2015 (File No. 001-36166)). | | | | 10.9† 10.12† | | Houghton Mifflin Harcourt Severance Plan, amended and restated as of March 31, 2016 (incorporated herein by reference to Exhibit 10.4 to the Company’s Quarterly Report on Form10-Q, filed May 4, 2016 (File No. 001-36166)). | | | | 10.11† 10.13† | | Form of Director Compensation Letter (incorporated herein by reference to Exhibit No. 10.11 to Amendment No. 1 to the Company’s Registration Statement on FormS-1, filed September 13, 2013 (File No. 333-190356)). |
119
| | | Exhibit
No.
| | Description
| 10.14† | | 10.12† | | Houghton Mifflin Harcourt CompanyNon-Employee Director Deferred Compensation Plan (incorporated herein by reference to Exhibit No. 10.50 to the Company’s Annual Report on Form10-K, filed February 25, 2016 (File No. 001-36166)). | | | | 10.13† 10.15† | | Houghton Mifflin Harcourt Company Employee Stock Purchase Plan (incorporated herein by reference to Exhibit 10.1 to the Company’s Registration Statement on FormS-8, filed May 29, 2015 (File No. 333-204519)). | | | | 10.14† 10.16† | | HMH Holdings (Delaware), Inc. 2012 Management Incentive Plan (incorporated herein by reference to Exhibit No. 10.1 to Amendment No. 1 to the Company’s Registration Statement on FormS-1, filed September 13, 2013 (File No. 333-190356)). | | | | 10.15† 10.17† | | HMH Holdings (Delaware), Inc. 2012 Management Incentive Plan Form of Stock Option Award Notice (incorporated herein by reference to Exhibit No. 10.2 to Amendment No. 1 to the Company’s Registration Statement on FormS-1, filed September 13, 2013 (File No. 333-190356)). | | | |
118
Exhibit No. | | Description | 10.16† 10.18† | | HMH Holdings (Delaware), Inc. 2012 Management Incentive Plan Time-Based Restricted Stock Unit Award Notice (incorporated herein by reference to Exhibit No. 10.32 to the Company’s Annual Report on Form10-K, filed February 26, 2015 (File No. 001-36166)). | | | | 10.17† 10.19† | | HMH Holdings (Delaware), Inc. 2012 Management Incentive Plan Performance-Based Restricted Stock Award Notice (incorporated herein by reference to Exhibit No. 10.33 to the Company’s Annual Report on Form10-K, filed February 26, 2015 (File No. 001-36166)). | | | | 10.18† 10.20† | | HMH Holdings (Delaware), Inc. 2012 Management Incentive Plan Performance-Based Restricted Stock Unit Award Notice (incorporated herein by reference to Exhibit No. 10.34 to the Company’s Annual Report on Form10-K, filed February 26, 2015 (File No. 001-36166)). | | | | 10.19† 10.21† | | HMH Holdings (Delaware), Inc. 2012 Management Incentive Plan Time-Based Restricted Stock Award Notice (incorporated herein by reference to Exhibit No. 10.35 to the Company’s Annual Report on Form10-K, filed February 26, 2015 (File No. 001-36166)). | | | | 10.20† 10.22† | | Houghton Mifflin Harcourt Company 2015 Omnibus Incentive Plan (incorporated herein by reference to Exhibit 10.2 to the Company’s Registration Statement on FormS-8, filed May 29, 2015 (File No. 333-204519)). | | | | 10.21† 10.23† | | Houghton Mifflin Harcourt Company 2015 Omnibus Incentive Plan Form of Time-Based Restricted Stock Unit Award Notice (Employees) (incorporated herein by reference to Exhibit 10.3 to the Company’s Registration Statement on FormS-8, filed May 29, 2015 (File No. 333-204519)). | | | | 10.22† 10.24† | | Houghton Mifflin Harcourt Company 2015 Omnibus Incentive Plan Form of Performance-Based Restricted Stock Unit Award Notice (Employees) (incorporated herein by reference to Exhibit 10.4 to the Company’s Registration Statement on FormS-8, filed May 29, 2015 (File No. 333-204519)). | | | | 10.23† 10.25† | | Houghton Mifflin Harcourt Company 2015 Omnibus Incentive Plan Form of Time-Based Restricted Stock Unit Award Notice (Directors) (incorporated herein by reference to Exhibit 10.9 to the Company’s Quarterly Report on Form10-Q, filed August 6, 2015 (File No. 001-36166)). | | | | 10.24† 10.26† | | Houghton Mifflin Harcourt Company 2015 Omnibus Incentive Plan Form of Stock Option Award Notice (incorporated by reference to Exhibit 10.10 to the Company’s Quarterly Report on Form10-Q, filed August 6, 2015 (File No. 001-36166)). | | | | 10.25† 10.27† | | Houghton Mifflin Harcourt Company Form of Restricted Stock Unit Award Notice (with Deferral Feature—Directors) (incorporated herein by reference to Exhibit No. 10.51 to the Company’s Annual Report on Form10-K, filed February 25, 2016 (File No. 001-36166)). |
120
| | | Exhibit
No.
| | Description
| 10.28† | | 10.26† | | Houghton Mifflin Harcourt Company Form of Performance-Based Restricted Stock Unit Award Notice (TSR/Billings—Employees) (incorporated herein by reference to Exhibit No. 10.1 to the Company’s Current Report on Form8-K, filed May 4, 2016 (File No. 001-36166)). | | | | 10.27*† 10.29† | | Houghton Mifflin Harcourt Company 2015 Omnibus Incentive Plan New Hire Stock Option Award Notice dated May 9, 2017 by and between Houghton Mifflin Harcourt Company and John J. Lynch, Jr. (incorporated herein by reference to Exhibit No. 10.27 to the Company’s Annual Report on Form 10-K, filed February 22, 2018) (File No. 001-36166)). | | | | 10.28*† 10.30† | | Houghton Mifflin Harcourt Company 2015 Omnibus Incentive Plan New Hire Time-Based Restricted Stock Unit Award Notice dated May 9, 2017 by and between Houghton Mifflin Harcourt Company and John J. Lynch, Jr. (incorporated herein by reference to Exhibit No. 10.28 to the Company’s Annual Report on Form 10-K, filed February 22, 2018) (File No. 001-36166)). | | | | 10.29† 10.31† | | William Bayers Offer Letter dated April 10, 2007, as amended on May 14, 2009 (incorporated herein by reference to Exhibit No. 10.9 to Amendment No. 1 to the Company’s Registration Statement on FormS-1, filed September 13, 2013 (File No. 333-190356)). | | | | 10.30† 10.32† | | Lee R. Ramsayer Offer Letter dated January 25, 2012 (incorporated herein by reference to Exhibit No. 10.29 to the Company’s Annual Report on Form10-K, filed March 27, 2014 (File No. 001-36166)). | | | | 10.31† 10.33*† | | Lee R. Ramsayer Letter Agreement dated December 16, 2019. | | | |
119
Exhibit No. | | Description | 10.34† | | Joseph Abbott Offer Letter dated as of March 10, 2016 (incorporated herein by reference to Exhibit No. 201-5 10.3 to the Company’s Current Report on Form8-K, filed March 10, 2016 (File No. 001-36166)). | | | | 10.32† 10.35† | | Letter Agreement, effective September 22, 2016, by and between Houghton Mifflin Harcourt Company and L. Gordon Crovitz (incorporated herein by reference to Exhibit No. 10.1 to the Company’s Quarterly Report on Form10-Q, filed November 3, 2016 (File No. 001-36166)). | | | | 10.33† 10.36† | | John J. Lynch Offer Letter dated February 10, 2017 (incorporated herein by reference to Exhibit 10.1 to the Current Report on Form8-K filed on February 15, 2017 (File No. 001-36166)). | | | | 10.34*† 10.37† | | Rosamund Else-Mitchell Offer Letter dated April 22, 2015.2015 (incorporated herein by reference to Exhibit No. 10.34 to the Company’s Annual Report on Form 10-K, filed February 22, 2018) (File No. 001-36166)). | | | | 10.35*† 10.38† | | Rosamund Else-Mitchell Promotion Letter dated August 27, 2015 (incorporated herein by reference to Exhibit No. 10.35 to the Company’s Annual Report on Form 10-K, filed February 22, 2018) (File No. 001-36166)).. | | | | 10.36*† 10.39† | | Rosamund Else-Mitchell Promotion Letter dated August 3, 2017. | | | 10.37† | | Mary Cullinane Offer Letter dated October 21, 2011 (incorporated herein by reference to Exhibit No. 10.28 10.36 to the Company’s Annual Report on Form10-K, filed March 27, 2014February 22, 2018) (File No. 001-36166)). | | | | 10.38† 10.40† | | Mary Cullinane LetterSeparation Agreement and General Release dated as of May 24, 2017June 10, 2019, by and between Houghton Mifflin Harcourt Company and Rosamund Else-Mitchell (incorporated herein by reference to Exhibit 10.1No. 10.2 to the CurrentCompany’s Quarterly Report on Form8-K 10-Q, filed on May 25, 2017August 8, 2019 (File No. 001-36166)).
| | | | 10.39*† 10.41* | | Confidential Severance Agreement and General Release dated as of OctoberAmendment No. 1 2017, by and between Mary Cullinane andto the Houghton Mifflin Harcourt Company 2015 Omnibus Incentive Plan dated December 13, 2019.
| | | | 21.1* | | List of Subsidiaries of the Registrant. | | | | 23.1* | | Consent of PricewaterhouseCoopers LLP, independent registered public accounting firm. | | | | 31.1* | | Certification of CEO Pursuant to Rule13a-14(a) or15d-14(a) of the Securities Exchange Act of 1934, as Adopted Pursuant to Section 302 of the Sarbanes-Oxley Act of 2002. | | | | 31.2* | | Certification of CFO Pursuant to Rule13a-14(a) or15d-14(a) of the Securities Exchange Act of 1934, as Adopted Pursuant to Section 302 of the Sarbanes-Oxley Act of 2002. |
121
† | Identifies a management contract or compensatory plan or arrangement. |
** | This certification shall not be deemed “filed” for the purposes of Section 18 of the Securities Exchange Act of 1934 or otherwise subject to the liabilities under that section. Furthermore, this certification shall not be deemed to be incorporated by reference into the filings of the Company under the Securities Act of 1933 or the Securities Exchange Act of 1934, regardless of any general incorporation language in such filing. |
120
Item 16. Form10-K Summary None. 121
122
SIGNATURES Pursuant to the requirements of Section 13 or 15(d) of the Securities Exchange Act of 1934, the registrant has duly caused this report to be signed on its behalf by the undersigned, thereunto duly authorized. | | | Houghton Mifflin Harcourt Company (Registrant) | | | | | By: | By: | | /s/ John J. Lynch, Jr. | | | | John J. Lynch, Jr. | | | | President, Chief Executive Officer | | | | (On behalf of the registrant) |
February 22, 201827, 2020 Pursuant to the requirements of the Securities Exchange Act of 1934, this report has been signed below by the following persons on behalf of the registrant and in the capacities and on the dates indicated. Signature | | Title | | Date | Signature | | Title | | Date | | | | /s/ John J. Lynch, Jr. John J. Lynch, Jr. | | President, Chief Executive Officer (Principal Executive Officer) and Director | | February 22, 201827, 2020 | | | | | | /s/ Joseph P. Abbott, Jr. Joseph P. Abbott, Jr. | | Executive Vice President and Chief Financial Officer (Principal Financial Officer) | | February 22, 201827, 2020 | | | | | | /s/ Michael J. Dolan Michael J. Dolan | | Senior Vice President and Corporate Controller (Principal Accounting Officer) | | February 22, 201827, 2020 | | | | | | /s/ Lawrence K. Fish Lawrence K. Fish | | Chairman of the Board of Directors | | February 22, 201827, 2020 | | | | | | /s/ Daniel M. Allen Daniel M. Allen | | Director | | February 22, 201827, 2020 | | | | | | /s/ L. Gordon Crovitz L. Gordon Crovitz | | Director | | February 22, 201827, 2020 | | | | | | /s/ Jean S. Desravines Jean S. Desravines | | Director | | February 27, 2020 | | | | | | /s/ Jill A. Greenthal Jill A. Greenthal | | Director | | February 22, 201827, 2020 | | | | | | /s/ John F. Killian John F. Killian | | Director | | February 22, 201827, 2020 | | | | | | /s/ John R. McKernan, Jr. John R. McKernan, Jr. | | Director | | February 22, 201827, 2020 | | | | | | /s/ E. Rogers Novak, Jr. E. Rogers Novak, Jr. | | Director | | February 22, 201827, 2020 | | | | | | /s/ Tracey D. Weber Tracey D. Weber | | Director | | February 22, 201827, 2020 |
123122
|
|
|
|