The Gorman-Rupp Company and Subsidiaries Annual Report on Form10-K
For the Year Ended December 31, 2017
i
PART I Safe Harbor Statement
Cautionary Note Regarding Forward-Looking Statements In connection with the “safe harbor” provisions of the Private Securities Litigation Reform Act of 1995, The Gorman-Rupp Company provides the following cautionary statement: This Annual Report on Form10-K contains various forward-looking statements based on assumptions concerning The Gorman-Rupp Company’s operations, future results and prospects. These forward-looking statements are based on current expectations about important economic, political, and technological factors, among others, and are subject to risks and uncertainties, which could cause the actual results or events to differ materially from those set forth in or implied by the forward-looking statements and related assumptions. Such factors include, but are not limited to: company specific risk factors including (1) loss of key personnel; (2) intellectual property security; (3) acquisition performance and integration; (4) impairment in the value of intangible assets, including goodwill; (5) defined benefit pension plan settlement expense; and (6) family ownership of common equity; and general risk factors including; (7) continuation of the current and projected future business environment; (2)environment, including the duration and scope of the COVID-19 pandemic, the impact of the pandemic and actions taken in response to the pandemic; (8) highly competitive markets; (3)(9) availability and costs of raw materials; (4) loss of key management; (5)materials and labor; (10) cyber security threats; (6) acquisition performance and integration; (7)(11) compliance with, and costs related to, a variety of import and export laws and regulations; (8)(12) environmental compliance costs and liabilities; (9)(13) exposure to fluctuations in foreign currency exchange rates; (10)(14) conditions in foreign countries in which The Gorman-Rupp Company conducts business; (11)(15) changes in our tax rates and exposure to additional income tax liabilities; (12) impairment in the value of intangible assets, including goodwill; (13) defined benefit pension plan settlement expense; (14) family ownership of common equity; and (15)(16) risks described from time to time in our reports filed with the Securities and Exchange Commission. Except to the extent required by law, we do not undertake and specifically decline any obligation to review or update any forward-looking statements or to publicly announce the results of any revisions to any of such statements to reflect future events or developments or otherwise. The Gorman-Rupp Company (“Registrant”, “Gorman-Rupp”, the “Company”, “we” or the “Company”“our”) was incorporated in Ohio in 1934. The Company designs, manufactures and globally sells pumps and pump systems for use in water, wastewater, construction, dewatering, industrial, petroleum, original equipment, agriculture, fire protection, heating, ventilating and air conditioning (“HVAC”), military and other liquid-handling applications. PRODUCTS The Company operates in one business segment, the manufacture and sale of pumps and pump systems. The following table sets forth, for the years 20152019 through 2017,2021, the total net sales, income before income taxes andyear-end total assets of the Company. | | | | (in thousands) | | | (Dollars in thousands) | | | | | 2017 | | | 2016 | | | 2015 | | | 2021 | | | 2020 | | | 2019 | | Net sales | | $ | 379,389 | | | $ | 382,071 | | | $ | 406,150 | | | $ | 378,316 | | | $ | 348,967 | | | $ | 398,179 | | Income before taxes | | | 39,378 | | | | 36,482 | | | | 37,266 | | | 37,248 | | | 31,246 | | | 45,166 | | Total assets | | | 395,015 | | | | 382,818 | | | | 364,201 | | | 420,754 | | | 394,457 | | | 382,760 | |
The Company’s product line consists of pump models ranging in size from 1/4” to nearly 15 feet and ranging in rated capacity from less than one gallon per minute to nearly one million gallons per minute. The types of pumps which the Company produces include self-priming centrifugal, standard centrifugal, magnetic drive centrifugal, axial and mixed flow,mixed-flow, vertical turbine line shaft, submersible, high pressurehigh-pressure booster, rotary gear, diaphragm, bellows and oscillating. The pumps have drives that range from 1/35 horsepower electric motors up to much larger electric motors or internal combustion engines capable of producing several thousand horsepower. Many of the larger units comprise encased, fully integratedfully-integrated water and wastewater pumping stations. In certain cases, units are designed for the inclusion of customer-supplied drives. The Company’s larger pumps are sold principally for use in the construction, industrial, water and wastewater handling fields; for flood control; for boosting low residential water pressure; for pumping refined petroleum products, including the ground refueling of aircraft; for fluid control in HVAC applications; and for various agricultural purposes. The Company’s pumps are also utilized for dewatering purposes. Additionally, pumps manufactured for fire protection are used for sprinklerback-up systems, fire hydrants, stand pipes, fog systems and deluge systems at hotels, banks, factories, airports, schools, public buildings and hundreds of other types of facilities throughout the world. Many of the Company’s smallest pumps are sold to customers for incorporation into such products as food processing, chemical processing, photo processing, medical and otherapplications, waste treatment, HVAC equipment, appliances and solar heating. MARKETING The Company’s pumps are marketed in the United States and worldwide through a broad network of distributors, through manufacturers’ representatives (for sales to many original equipment manufacturers), through third-party distributor catalogs, direct sales, and by ecommerce.commerce. The Company regularly seeks alliances with distributors and other partners to further enhance marketing opportunities. Export sales are made primarily through foreign distributors and representatives. The Company has long-standing relationships with many of the leading independent distributors in the markets it serves and provides specialized training programs to distributors on a regular basis.basis with a focus on meeting the world’s water and wastewater pumping needs. During 2017, 20162021, 2020 and 2015,2019, there were no shipments to any single customer that exceeded 10% of total net sales. Gorman-Rupp continued to actively pursue international business opportunities and, in 2017,2021, shipped its pumps to approximately 150135 countries around the world. No sales made to customers in any one foreign country amounted to more than 5% of total net sales for 2017, 20162021, 2020 or 2015.2019. Approximately $137.6 million of 2017 sales were shipped outside the United States, as compared to $131.2 million in 2016 and $136.5 million in 2015. International sales represented 36% of total net sales in year 2017 and 34% of total net sales in each of the years 2016 and 2015. See Note 9 to the Consolidated Financial Statements, Business Segment Information. The Company continued its efforts to penetrate international markets principally by its increased global investments and its focus on meeting the world’s water and wastewater pumping needs.
COMPETITION The pump industry is highly fragmented and therefore Gorman-Rupp competes with a large number of businesses. Numerous pump competitors exist as subsidiaries, divisions or departments within significantly larger corporations. Foreign-sourcedThe Company also faces increased competition from foreign-sourced pumps have also increasingly penetrated intoin most of the Company’s domestic markets. Most commercial and industrial pumps are specifically designed and engineered for a particular customer’s application. The Company believes that proper application, product performance, and quality of delivery and service are its principal methods of competition, and attributes its success to its continued emphasis in these areas. In the sale of products and services, the Company benefits from its large base of previously installed base,products, which requiresperiodically require replacement parts due to the critical application and nature of the products and the conditions under which they operate. PURCHASING AND PRODUCTION Substantially all of the materials, supplies, components and accessories used by the Company in the fabrication of its products, including all castings (for which most patterns are made and owned by the Company), structural steel, bar stock, motors, solenoids, engines, seals, and plastic and elastomeric components are purchased by the Company from other suppliers and manufacturers. No purchases are madeThe Company does not purchase materials under long-term contracts and the Company is not dependent upon a single source for any materials, supplies, components or accessories which are of material importance to its business. The Company purchases motor components for its large submersible pumps, and motors and engines for its pump systems, from a limited number of suppliers, while motors for its polypropylene bellows pumps and magnetic drive pumps are purchased from several alternative vendors. Products requiring small motors are also sourced from alternative suppliers. The other production operations of the Company consist of the machining of castings, the cutting, shaping and welding of bar stock and structural members, the design and assembly of electrical control panels, the manufacture of some small motors and a few minor components, and the assembling, painting and testing of its products. Substantially all of the Company’s products are tested prior to shipment. OTHER ASPECTS
HUMAN CAPITAL As of December 31, 2017,2021, the Company employed approximately 1,1651,150 persons, of whom approximately 660650 were hourly employees. The majority of the Company’s manufacturing operations take place in the United States, as evidenced by 85% of its employees being in the Company’s U.S. locations and 15% of its employees being in its international locations. Our approach is to develop talent from within and supplement with external hires. We invest resources to develop the talent needed to remain a leading designer and manufacturer of pumps and pump systems. We provide our employees with training opportunities and educational benefits to assist in the expansion of their careers and skills. This approach has resulted in a deep understanding among our employee base of our business, products, and customers. We believe that our average tenure of 12 years, as of the end of 2021, reflects both the strong engagement of our employees and our positive workplace culture. The Company has no collective bargaining agreements and has never experienced a work stoppagestoppage. We provide competitive compensation and considers its labor relationsbenefits programs to help meet the needs of our employees. In addition to salaries, these programs (which vary by country and region) include profit sharing, a 401(k) plan, medical insurance and benefits, health savings accounts, domestic care and flexible savings accounts, paid time off, and tuition assistance, among others. Certain domestic employees hired prior to January 1, 2008 participate in a defined benefit plan. Employees hired after this date, in eligible locations, participate in an enhanced 401(k) plan instead of the defined benefit plan. To create performance incentives and to encourage share ownership by our employees, we have implemented an employee stock purchase plan, which enables eligible employees worldwide to purchase the Company’s common shares at a discount through payroll contributions. The health and safety of our workforce is fundamental to the success of our business. We provide our employees upfront and ongoing safety training to ensure that safety policies and procedures are effectively communicated and implemented. We also provide personal protective equipment to those employees who need it to perform their job functions safely. We have experienced personnel on-site at each of our manufacturing locations who are tasked with environmental, health and personal safety education and compliance, and in certain locations we have an on-site nurse available to our employees for medical needs. In response to the COVID-19 pandemic, we have enabled employees to work from home where possible. Because our business involves the manufacturing of essential products, many of our employees are unable to work from home. In an effort to keep our employees safe and to maintain operations during the pandemic, we have implemented a number of health-related measures, including social distancing, increased cleaning and sanitation measures, providing additional personal protective equipment, restricting visitor access to our facilities, and limiting in-person meetings and other gatherings. We are committed to upholding fundamental human rights and believe that all human beings should be satisfactory.treated with dignity, fairness and respect. This commitment is outlined in our Human Rights Policy which applies to all employees worldwide including part time and temporary workers. We communicated our expectation that suppliers also adhere to our Human Rights Policy through our Supplier Code of Conduct. We strive to promote inclusion and diversity in the workplace, engage with our communities, and encourage our suppliers to treat their employees in a manner that respects human rights. We utilize an on-line platform to provide training to all employees worldwide in key areas such as harassment and discrimination prevention, human rights, and our code of conduct. We also internally publicize the availability of an anonymous ethics hotline through which any employee may report any ethics, safety or other employment concerns. OTHER ASPECTS Although the Company owns a number of patents, and several of themwhich are important to its business, Gorman-Rupp believes that the business of the Company isdoes not consider its business to be materially dependent upon any one or more patents. The Company’s patents, trademarks and other intellectual property are adequate for its business purposes. The backlog of orders at December 31, 2017 was $114.0 million compared to $98.8 million at December 31, 2016, an increase of 15.4%. Approximately 95% of the Company’s backlog of unfilled orders is scheduled to be shipped during 2018, with the remainder principally during the first half of 2019. The increase in backlog from 2016 is due primarily to an improvement in overall business conditions with notable increases in the fire protection, municipal and construction markets.
AVAILABLE INFORMATION The Company maintains a website accessible through its internet address of www.gormanrupp.com. Gorman-Rupp makes available free of charge on or through www.gormanrupp.com its Annual Report to Shareholders, its annual reportsProxy Statement, its annual report on Form10-K, its quarterly reports on Form10-Q, and its current reports on Form8-K, and any amendments to those reports, as soon as reasonably practicable after those reports (and any amendments) are electronically filed with or furnished to the Securities and Exchange Commission (“Commission”). However, the information contained on the Company’s website is not a part of this Form10-K or any other report filed with or furnished to the Commission. A paper copy of the Company’s Form10-K is also available free of charge upon written request to the Company’s Corporate Secretary. | ITEM 1A. | RISK FACTORS | RISK FACTORS |
Gorman-Rupp’s business and financial performance are subject to various risks and uncertainties, some of which are beyond its control. In addition to the risks discussed elsewhere in this Form10-K, the following risks and uncertainties could materially adversely affect the Company’s business, prospects, financial condition, results of operations, liquidity and access to capital markets. These risks could cause the Company’s actual results to differ materially from its historical experience and from expected results discussed in forward-looking statements made by the Company related to conditions or events that it anticipates may occur in the future. Continuation of current and projected future business environmentCOMPANY SPECIFIC RISK FACTORS
The overall pump industry is cyclical in nature, and some of its business activity is related to general business conditions in the durable goods and capital equipment markets. Demand for most of the Company’s products and services is affected by the level of new capital investment and planned maintenance expenditures by its customers. The level of such investment and expenditures by our customers depends, in turn, on factors such as general economic conditions, availability of credit, economic conditions within their respective industries and expectations of future market behavior. Volatility in prices of commodities such as oil and agricultural products can negatively affect the levels of investment and expenditures of certain customers and result in postponement of capital spending decisions or the delay or cancellation of existing orders which may negatively impact the Company’s sales.
Highly competitive markets
Gorman-Rupp sells products in highly competitive markets. Maintaining and improving the Company’s competitive position requires periodic investment in manufacturing, engineering, quality standards, marketing, customer service and support, and distribution networks. Even with such investment, the Company may not be successful in maintaining its competitive position. The Company’s competitors may develop products that are superior to its products, or may develop methods of more efficiently and effectively providing products and services, or may adapt more quickly to new technologies or evolving customer requirements. Pricing pressures may require the Company to adjust the prices of its products downward to stay competitive. The Company may not be able to compete successfully with its existing competitors or with new competitors. Failure to compete successfully could reduce the Company’s sales, operating margins and overall financial performance.
Availability of raw materials
The Company could be adversely affected by raw material price volatility and any inability of suppliers to meet quality and delivery requirements. Additionally, raw material and energy expenses are substantive drivers of costs in the manufacture of pumps and changes in these costs are often unpredictable. The Company may not be able to pass along any increased material costs to customers for competitive or other reasons. While the Company manufactures certain parts and components used in its products, the Company’s business requires substantial amounts of raw materials, parts and components that are purchased from suppliers. The availability and prices of raw materials, parts and components may be subject to curtailment or change due to, among other things, suppliers’ allocations to other purchasers, interruptions in production by suppliers, changes in exchange rates and prevailing price levels. Any change in the availability of, or increases in the price for, these raw materials, parts and components could materially affect our business, financial condition, results of operations or cash flows.
Loss of key managementpersonnel The Company’s success depends to a significant extent on the continued service of its executive management team and the ability to recruit, hire and retain other key management personnel to support the Company’s growth and operational initiatives and replace executives who retire or resign. Failure to retain key management personnel and attract and retain other highly-skilled personnel could limit the Company’s global growth and ability to execute operational initiatives, or may result in inefficient and ineffective management and operations, which could harm the Company’s revenues, operations and product development efforts and could eventually result in a decrease in profitability. CyberIntellectual property security threats
Increased global information technology security threats
The Company possesses a wide array of intellectual property rights, including patents, trademarks, copyrights, and more sophisticated and targeted computer crime poseapplications for the above, as well as other proprietary information. There is a risk that third parties would attempt to copy, in full or in part, the Company’s products, technologies or industrial designs, or to obtain unauthorized access and use of Company technological know-how or other protected intellectual property rights. Also, other companies could successfully develop technologies, products or industrial designs similar to the security of Gorman-Rupp’s systemsCompany’s, and networks andthus potentially compete with the Company. From time to time, the confidentiality, availability, and integrityCompany has been faced with instances where competitors have infringed or unfairly used its intellectual property or taken advantage of its data. Whiledesign and development efforts. The ability to protect and enforce intellectual property rights varies across jurisdictions. Competitors who may attempt to copy the Company’s products, technologies or industrial designs are becoming more prevalent, particularly in Asia. If the Company attemptsis unable to mitigate these risks by employing a number of measures, including employee training, comprehensive monitoring ofadequately enforce and protect its networksintellectual property rights, it could adversely affect its revenues and systems,profits and hamper its ability to grow.
Competitors and others may also challenge the deployment of backup and protective systems, the Company’s systems, networks, proprietary information, products, solutions and services remain potentially vulnerable to advanced persistent threats. Depending on their nature and scope, such threats could potentially lead to damages or destruction including, but not limited to, the compromising of confidential information relating to customer, supplier, or employee data, improper usevalidity of the Company’s systemsintellectual property or allege that it has infringed their intellectual property, including through litigation. The Company may be required to pay substantial damages if it is determined its products infringe the intellectual property of others. The Company may also be required to develop an alternative, non-infringing product that could be costly and networks, manipulationtime-consuming, or acquire a license (if available) on terms that are not favorable to it. Regardless of whether infringement claims against the Company are successful, defending against such claims could significantly increase the Company’s costs, divert management’s time and destruction of data, defective products, production downtimesattention away from other business matters, and operational disruptions which, in turn, couldotherwise adversely affect Gorman-Rupp’s reputation, competitiveness, andthe Company’s results of operations.operations and financial condition. Acquisition performance and integration The Company’s historical growth has depended, and its future growth is likely to continue to depend, in part on its acquisition strategy and the successful integration of acquired businesses into existing operations. The Company intends to continue to seek additional domestic and international acquisition opportunities that have the potential to support and strengthen its operations. The Company cannot assure it will be able to successfully identify suitable acquisition opportunities, prevail against competing potential acquirers, negotiate appropriate acquisition terms, obtain financing that may be needed to consummate such acquisitions, complete proposed acquisitions, successfully integrate acquired businesses into existing operations or expand into new markets. In addition, the Company cannot assure that any acquisition, onceeven if successfully integrated, will perform as planned, be accretive to earnings, or prove to be beneficial to the Company’s operations and cash flows. Compliance with, and costs related to, a variety of import and export laws and regulations
The Company is subject to a variety of laws regarding international operations, including regulations issued by the U.S. Department of Commerce Bureau of Industry and Security and various foreign governmental agencies. Actual or alleged violations of import-export laws could result in enforcement actions and financial penalties. The Company cannot predict the nature, scope or effect of future regulatory requirements to which our international operations and trading practices might be subject or the manner in which existing laws might be administered or interpreted. Future regulations could limit the countries in which certain of our products may be manufactured or sold or could restrict our access to, and increase the cost of obtaining, products from foreign sources.
Environmental compliance costs and liabilities
The Company’s operations and properties are subject to various, and increasingly numerous, domestic and foreign environmental laws and regulations which can impose operating and financial sanctions for violations. Moreover, environmental and sustainability initiatives, practices, rules and regulations are under increasing scrutiny of both governmental andnon-governmental bodies and may require changes in operational practices, standards and expectations and, in turn, increase the Company’s compliance costs. Periodically, the Company has incurred, and expects to continue to incur, operating and capital costs to comply with environmental requirements. The Company monitors its environmental responsibilities, together with trends in the related laws, and believes it is in substantial compliance with current regulations. If the Company is required to incur increased compliance costs or violates environmental laws or regulations, future environmental compliance expenditures or liabilities could have a material adverse effect on our financial condition, results of operations or cash flows.
Exposure to fluctuations in foreign currency exchange rates
The Company is exposed to fluctuations in foreign currency exchange rates, particularly with respect to the Euro, Canadian Dollar, South African Rand and the British Pound. Any significant change in the value of these currencies could affect the Company’s ability to sell products competitively and control its cost structure, which could have a material effect on its financial condition, results of operations or cash flows.
Conditions in foreign countries in which the Company conducts business
In 2017, 36% of the Company’s sales were to customers outside the United States. The Company expects its international and export sales to continue to be a significant portion of its revenue and it has placed a particular emphasis on increasing its growth and presence internationally. The Company’s sales from international operations and export sales are subject, in varying degrees, to risks inherent to doing business outside the United States. These risks include the following, some of which are further addressed in our other Risk Factors:
Possibility of unfavorable circumstances arising from host country laws or regulations;
Currency exchange rate fluctuations and restrictions on currency repatriation;
Potential negative consequences from changes to taxation policies;
Disruption of operations from labor and political disturbances;
Changes in tariff and trade barriers and import and export licensing requirements;
Increased costs and risks of developing, staffing and simultaneously managing a number of global operations as a result of distance as well as language and cultural differences; and
Insurrections, armed conflicts, terrorism or war.
Any of these events could have an adverse impact on the Company’s business and operations.
Changes in our tax rates and exposure to additional income tax liabilities
Our future effective income tax rates could be unfavorably affected by various factors, including changes in the tax rates as well as rules and regulations in jurisdictions in which we generate income. During the fourth quarter of 2017 the Company recorded, on a provisional basis, the transitional impact of the U.S. Tax Cuts and Jobs Act (“Tax Act”) that was enacted on December 22, 2017. Given the significant complexity of the Tax Act, and potential future guidance from the U.S. Treasury, the Securities and Exchange Commission and the Financial Accounting Standards Board, these estimates may be adjusted in 2018. In addition, the amount of income taxes we pay is subject to ongoing audits by U.S. federal, state and local tax authorities and bynon-U.S. authorities. If these audits result in assessments different from amounts recorded, our future financial results may include unfavorable adjustments.
Impairment in the value of intangible assets, including goodwill The Company’s total assets reflect goodwill from acquisitions, representing the excess cost over the fair value of the identifiable net assets acquired, including other indefinite-lived and finite-lived intangible assets. Goodwill and other indefinite-lived intangible assets are not amortized but are reviewed annually for impairment as of October 1 or whenever events or changes in circumstances indicate there may be a possible permanent loss of value using either a quantitative or qualitative analysis. Finite-lived assets are reviewed for impairment whenever events or changes in circumstances indicate the carrying amount may not be recovered through future net cash flows generated by the assets. If future operating performance at one or more of the Company’s reporting units were to fall significantly below forecast levels or if market conditions for one or more of its acquired businesses were to decline, the Company could be required to incur anon-cash charge to operating income for impairment. Any impairment in the value of these assets could have an adversenon-cash impact on the Company’s reported results of operations. In 2017 and 2016, the Company recordedpre-taxnon-cash goodwill and other intangible impairment charges of $4.1 million and $1.8 million, respectively, related to the Company’s Bayou City Pump Company reporting unit. There was no goodwill or other intangible impairment charges recorded in 2015. See Note 8 to the Consolidated Financial Statements, Goodwill and Other Intangible Assets.
The Company’s annual impairment analysis concluded that the fair value of the Company’s National Pump Company reporting (“National”) unit exceeded its carrying value be approximately 7%. A sensitivity analysis was performed for the National reporting unit, assuming a hypothetical 50 basis point decrease in the expected long-term growth rate or a hypothetical 50 basis point increase in the weighted average cost of capital, and both scenarios independently yielded an estimated fair value for the National reporting unit slightly above carrying value. While the result of this test indicated that no impairment existed at National, if recently depressed U.S. agricultural conditions continue for an extended time, the agricultural market’s growth and profitability assumptions may reduce National’s indicated fair value in the future, which could result in an impairment charge. See Note 8 to the Consolidated Financial Statements, Goodwill and Other Intangible Assets.
Defined benefit pension plan settlement expense The Company sponsors a defined benefit pension plan covering certain domestic employees and accrues amounts for funding of its obligations under the plan. The defined benefit pension plan allows eligible retiring employees to receive alump-sum distribution for benefits earned in lieu of annual payments and most of the Company’s retirees historically have elected this option. Under applicable accounting rules, if thelump-sum distributions made for a plan year exceed an actuarially-determined threshold of the total of the service cost and interest cost for the plan year, the Company at such point would be required to recognize for that year’s results of operations settlement expense for the resulting unrecognized actuarial loss. The Company has been required to make such adjustments in some prior years, and, if suchnon-cash adjustments are necessary in future periods, they may negatively impact the Company’s operating results. In 20172021 and 2015,2020, the Company recordedpre-taxnon-cash pre-tax non-cash pension settlement charges of $4.0$2.3 million and $3.8$4.6 million, respectively, driven bylump-sum distributions discussed above. There was no pension settlement charge recorded in 2016.2019. See Note 79 to the Consolidated Financial Statements, Pensions and Other Postretirement Benefits. Family ownership of common equity A substantial percentage of the Company’s Common Sharescommon shares is held by various members of the Gorman and Rupp familiesfamily and their respective affiliates. Because of this concentrated ownership relative to many other publicly-traded companies, the market price of the Company’s common shares may be influenced by lower trading volume and therefore more susceptible to price fluctuations than many other companies’ shares. If any one or more of the Company’s significant shareholders were to sell all or a portion of their holdings of Company common shares at once or within short periods of time, or there was an expectation that such a sale was imminent, then the market price of the Company’s common shares could be negatively affected. GENERAL RISK FACTORS The COVID-19 Pandemic Our business has been, and may continue to be, materially and adversely affected by the present coronavirus (or COVID-19) pandemic. The pandemic has disrupted our operations and may continue to affect our business, including through government imposed mandatory closures, work-from-home orders, social distancing protocols, increased employee absenteeism due to illness and/or quarantine requirements, voluntary facility closures and other government restrictions that, to the extent required, could materially adversely affect our ability to adequately staff and maintain our operations. While we have largely avoided facility closures and production disruptions thus far, we may experience temporary facility closures in response to government mandates in certain jurisdictions in which we operate or in response to positive diagnoses for COVID-19 in certain facilities for the safety of our employees. Our supply chain has thus far remained largely intact, however, if the COVID-19 pandemic persists or worsens, it may increase disruption to our supply chain and the operations of our suppliers and materially adversely impact the availability and cost of supplies for our facilities and production, and to provide personal protective equipment for our employees, which could materially adversely affect our operations. There may also be long-term negative economic effects on our customers in, and the economies of, affected countries. Any of the foregoing within the countries in which we or our customers and suppliers operate may severely disrupt our operations and have a material adverse effect on our business, results of operations, cash flows and financial condition. In addition, future changes in the Company’s cost of capital, expected cash flows, or other factors as a result of the above may cause the Company’s goodwill to be impaired, resulting in a non-cash charge against results of operations to write down goodwill for the amount of the impairment. The negative financial impact to our future results cannot be reasonably estimated, but could be material. Our internal controls may also be impacted by the COVID-19 pandemic. A large portion of our financial and accounting personnel have been required to work from home for extended periods due to the pandemic, requiring them to adapt to new or modified processes, procedures, and controls. These family holdings historically havechanges could potentially negatively impact our internal controls over financial reporting. Continuation of current and projected future business environment The overall pump industry is cyclical in nature, and some of its business activity is related to general business conditions in the durable goods and capital equipment markets. Demand for most of the Company’s products and services is affected by the level of new capital investment and planned maintenance expenditures by its customers. The level of such investment and expenditures by our customers depends, in turn, on factors such as general economic conditions, availability of credit, economic conditions within their respective industries and expectations of future market behavior. Volatility or sustained increases in prices of commodities such as oil and agricultural products can negatively affect the levels of investment and expenditures of certain customers and result in postponement of capital investment decisions or the delay or cancellation of existing orders. Inflationary economic conditions may further increase prices and exacerbate these risks. Any of these developments may negatively impact the Company’s sales. Highly competitive markets Gorman-Rupp sells its products in highly competitive markets. Maintaining and improving the Company’s competitive position requires periodic investment in manufacturing, engineering, quality standards, marketing, customer service and support, and distribution networks. Even with such investment, the Company may not been frequently traded; therefore,be successful in maintaining its competitive position. The Company’s competitors may develop products that are superior to its products, or may develop methods of more efficiently and effectively providing products and services, or may adapt more quickly to new technologies or evolving customer requirements. Pricing pressures may require the Common Shares,Company to adjust the prices of its products downward to stay competitive. The Company may not be able to compete successfully with its existing competitors or with new competitors. Failure to compete successfully could negatively impact the Company’s sales, operating margins and overall financial performance. Availability and costs of raw materials and labor The Company could be adversely affected by raw material price volatility or an inability of its suppliers to meet quality and delivery requirements. We are required to maintain sufficient inventories to accommodate the needs of our customers, often with short lead times. Our business could be adversely affected if we fail to source and maintain adequate inventory levels. Raw material and energy expenses are substantial drivers of costs in the manufacture of pumps and changes in these costs are often unpredictable. While the Company manufactures certain parts and components used in its products, the Company’s business requires substantial amounts of raw materials, parts and components to be purchased from suppliers. The availability and prices of raw materials, parts and components purchased from the Company’s suppliers may be subject to curtailment or change due to, among other things, suppliers’ allocations to other purchasers, interruptions in production or deliveries by suppliers, changes in exchange rates, tariffs, changes in duty rates and changes in other trade barriers and import and export licensing requirements. The Company's business depends, in part, becauseupon the adequate recruitment and retention, and continued service of, key managerial, engineering, marketing, sales and technical and operational personnel. Economic conditions may cause an increasingly competitive labor market, which could lead to labor shortages or increased turnover rates within, or increased labor costs to maintain, the Company’s employee base. These considerations may also impact the operations of the Company’s suppliers, who may seek to pass along any increased costs to the Company. Inflationary economic conditions may further increase these various costs. The Company may not be able to pass along any increased material or labor costs to customers for competitive or other reasons. A change in the availability of, or increases in the costs associated with raw materials, parts and components or labor and workforce could materially affect our business, financial condition, results of operations or cash flows. Cyber security threats Increased global information technology security threats and more sophisticated and targeted computer crime pose a risk to the security of Gorman-Rupp’s systems and networks and to the confidentiality, availability, and integrity of its data. While the Company attempts to mitigate these risks by employing a number of measures, including employee training, comprehensive monitoring of its networks and systems, and the deployment of backup and protective systems, the Company’s systems, networks, proprietary information, products, solutions and services remain potentially vulnerable to advanced persistent threats. Depending on their nature and scope, such threats could potentially lead to liability for damages or the loss of confidential information including as a result of, but not limited to, the compromising of confidential information relating to customer, supplier, or employee data, improper use of the Company’s systems and networks, manipulation and destruction of data, defective products, production downtimes and operational disruptions which, in turn, could adversely affect Gorman-Rupp’s reputation, competitiveness and results of operations. Compliance with, and costs related to, a variety of import and export laws and regulations The Company is subject to a variety of laws and regulations regarding international operations, including regulations issued by the U.S. Department of Commerce Bureau of Industry and Security and various other domestic and foreign governmental agencies. Actual or alleged violations of import-export laws could result in enforcement actions and/or financial penalties. The Company cannot predict the nature, scope or effect of future regulatory requirements to which our international operations and trading practices might be subject or the manner in which existing laws or regulations might be administered or interpreted. Future legislation or regulations could limit the countries in which certain of our products may be manufactured or sold or could restrict our access to, and increase the cost of obtaining, products from foreign sources. Environmental compliance costs and liabilities The Company’s operations and properties are subject to numerous domestic and foreign environmental laws and regulations which can impose operating and/or financial sanctions for violations. Moreover, environmental and sustainability initiatives, practices, rules and regulations are under increasing scrutiny of both governmental and non-governmental bodies and may require changes to the Company’s operational practices, standards and expectations and, in turn, increase the Company’s compliance costs. Periodically, the Company has incurred, and it expects to continue to incur, operating and capital costs to comply with environmental requirements. The Company monitors its environmental responsibilities, together with trends in the related laws, and believes it is in substantial compliance with current regulations. If the Company is required to incur increased compliance costs or violates environmental laws or regulations, future environmental compliance expenditures or liabilities could have a material adverse effect on our financial condition, results of operations or cash flows. Exposure to fluctuations in foreign currency exchange rates The Company is exposed to fluctuations in foreign currency exchange rates, particularly with respect to the Euro, Canadian Dollar, South African Rand and British Pound. Any significant change in the value of these circumstances, generallycurrencies could affect the Company’s ability to sell products competitively and control its cost structure, which could have a historymaterial effect on its financial condition, results of relatively low volume trading experiencesoperations or cash flows. Conditions in foreign countries in which the Company conducts business In 2021, 31% of the Company’s net sales were to customers outside the United States. The Company expects its international and export sales to continue to be a significant portion of its revenue and it has placed a particular emphasis on increasing its growth and presence internationally. The Company’s sales from international operations and export sales are subject, in varying degrees, to risks inherent to doing business outside the United States. These risks include, but are not limited to, the following, some of which are further addressed in our other Risk Factors: | ● | Possibility of unfavorable circumstances arising from host country laws or regulations; |
| ● | Currency exchange rate fluctuations and restrictions on currency repatriation; |
| ● | Potential negative consequences from changes to taxation policies; |
| ● | Disruption of operations from labor or political disturbances, or public health crises; |
| ● | Changes in tariffs, duty rates, and other trade barriers and import and export licensing requirements; |
| ● | Increased costs and risks of developing, staffing and simultaneously managing a number of global operations as a result of distance as well as language and cultural differences; and |
| ● | Insurrections, armed conflicts, terrorism or war. |
Any of these events could have an adverse impact on the NYSE.Company’s business and operations. Changes in our tax rates and exposure to additional income tax liabilities Gorman-Rupp is subject to income and other taxes in the United States federal jurisdiction and various local, state and foreign jurisdictions. The Company’s future effective income tax rates could be unfavorably affected by various factors, including changes in the tax rates as well as rules and regulations in relevant jurisdictions. In addition, the amount of income taxes paid is subject to ongoing audits by U.S. federal, state and local tax authorities and by non-U.S. authorities. If these audits result in assessments different from amounts recorded, the Company’s future financial results may include unfavorable adjustments. | ITEM 1B. | UNRESOLVED STAFF COMMENTS | UNRESOLVED STAFF COMMENTS |
None. | ITEM 2. | PROPERTIES | PROPERTIES |
The Company’s corporate headquarters are located in Mansfield, Ohio. The production operations of the Company are conducted at several locations throughout the United States and other countries as set forth below. The Company is a lessee under a number of operating leases for certain real properties, none of which is material to its operations. The Company’s principal production operations are: | | | | | United States | | | | | Mansfield (two) and Bellville, Ohio | | Royersford, Pennsylvania (two) | | Olive Branch, Mississippi | Toccoa, Georgia | | Glendale, Arizona | | Lubbock, Texas | | | | Other Countries | | | | | St. Thomas, Ontario, Canada | | County Westmeath, Ireland | | Culemborg,Waardenburg, The Netherlands*Netherlands | Johannesburg, South Africa | | Namur, Belgium | | |
The Company owns a facility in Dallas, Texas comprising a training center and warehouse. In addition, the Company leases a warehouse facility in Jebal Ali, Dubai. Gorman-Rupp considers its plants, machinery and equipment to be well maintained, in good operating condition and adequate for the present uses and business requirements of the Company. | ITEM 3. | LEGAL PROCEEDINGS | LEGAL PROCEEDINGS |
For more than fifteenover twenty years, numerous business entities in the pump and fluid-handling industries, as well as a multitude of companies in many other industries, have been targeted in a series of lawsuits in several jurisdictions by various individuals seeking redress to claimed injury as a result of the entities’ alleged use of asbestos in their products. Since 2001, the Company and some of its subsidiaries have been involved in this mass-scaled litigation, typically as one of manyco-defendants in a particular proceeding. The allegations in the lawsuits involving the Company and/or its subsidiaries have been vague, general and speculative. Most of these lawsuits have been dismissed without advancing beyond the early stage of discovery, some as a result of nominal monetary settlements recommended for payment by the Company’sCompany's insurers. The claims and related legal expenses generally have been covered by the Company’sCompany's insurance, subject to applicable deductibles and limitations. Accordingly, this series of lawsuits has not, cumulatively or individually, had a material adverse impact on the Company’sCompany's consolidated results of operations, liquidity or financial condition, nor is it expected to have any such impact in the future, based on the current knowledge of the Company. In addition, the Company and/or its subsidiaries are parties in a small number of legal proceedings arising in the ordinary course of business. Management does not currently believe that these proceedings will materially impact the Company’s consolidated results of operations, liquidity or financial condition. | ITEM 4. | MINE SAFETY DISCLOSURE | MINE SAFETY DISCLOSURE |
Not applicable. INFORMATION ABOUT OUR EXECUTIVE OFFICERS OF THE REGISTRANT The following table sets forth certain information with respect to the executive officers of the Company as of January 31, 2018:2022: | Name | | Age | | Office | | Date Elected to Executive
Office Position | | Age | | Office | | Date Elected to Executive Office Position | James C. Gorman | | 93 | | | Chairman | | 1989 | | Jeffrey S. Gorman | | 65 | | | President and Chief Executive Officer | | 1998 | | 69 | | Executive Chairman | | 1998 | Scott A. King | | | 47 | | President and Chief Executive Officer | | 2019 | James C. Kerr | | 55 | | | Chief Financial Officer | | 2017 | | 59 | | Executive Vice President and Chief Financial Officer | | 2017 | Brigette A. Burnell | | 42 | | | General Counsel and Corporate Secretary | | 2014 | | 46 | | Senior Vice President, General Counsel and Corporate Secretary | | 2014 |
Mr. J. C. Gorman served aswas elected Chairman of the Company’s President from 1964 until 1989, andBoard on April 25, 2019. He served as Chief Executive Officer from 1964 until 1996. He has served as a Director of the Company continuously since 1946. Mr. J. S. Gorman was elected President and Chief Executive Officer effective May 1, 1998 to December 31, 2021 and as President from 1998 to 2020 after having served as Senior Vice President since 1996. Mr. J. S. Gorman also held the position of General Manager of the Mansfield DivisionGorman-Rupp Pumps USA division from 1989 through 2005. He served as Assistant General Manager from 1986 to 1988; and he held the office of Corporate Secretary from 1982 to 1990. He has served as a Director of the Company continuously since 1989.
Mr. King was elected Chief Executive Officer effective January 1, 2022 in addition to his role as President. Mr. King served as President and Chief Operating Officer since January 1, 2021 after previously serving as Vice President and Chief Operating Officer since April 25, 2019. Mr. King also previously served as Vice President of Operations effective March 1, 2018 and as Vice President from April 1, 2017 to February 28, 2018. Mr. King previously held positions with the Gorman-Rupp Pumps USA division of the Company as Vice President and General Manager from January 1, 2014 until March 31, 2017, Vice President of Operations from June 1, 2010 until December 31, 2013, Director of Manufacturing from July 1, 2007 until May 31, 2010 and Manufacturing Manager from November 1, 2004 until June 30, 2007. Mr. Kerr was elected Executive Vice President and Chief Financial Officer effective January 1, 2021 after previously serving as Vice President and Chief Financial Officer since March 1, 2018. Mr. Kerr previously served as Chief Financial Officer effective January 1, 2017 and previously served as Vice President of Finance from July 18, 2016 to December 31, 2016. Prior to 2016, Mr. Kerr previously served as both Executive Vice President and Chief Financial Officer of Jo-Ann Stores from 2006 to 2015 and as Vice President, Controller of Jo-Ann Stores from 1998 to 2006 forJo-Ann Stores.2006. Ms. Burnell was elected Senior Vice President, General Counsel and Corporate Secretary effective January 1, 2021 after previously serving as Vice President, General Counsel and Corporate Secretary since March 1, 2018. Ms. Burnell previously served as General Counsel effective May 1, 2015 and was electedas Corporate Secretary effective May 1, 2014. Ms. Burnell previously served as Corporate Counsel effective May 1, 2014. Ms. Burnell joined the Company as Corporate Attorney on January 2, 2014. Prior to 2014, Ms. Burnell previously served as Corporate Counsel of Red Capital Group from 2011 to 2013 advising the company on legal matters in all areas of business, after having servedand as an Associate at Jones Day from 2002 to 2011. Mr. J. S. Gorman is the son of Mr. J. C. Gorman. There are no other family relationships among any of the Executive Officers and Directors of the Company.
PART II | ITEM 5. | MARKET FOR REGISTRANT’SREGISTRANT’S COMMON EQUITY, RELATED STOCKHOLDER MATTERS AND ISSUER PURCHASES OF EQUITY SECURITIES |
MARKET INFORMATION
The following tables set forth the high and low sale prices and dividends per share for the Company’s Common Shares as reported by the New York Stock Exchange (“NYSE”) for the periods indicated:
| | | | | | | | | | | | | | | | | | | | | | | | | | | | Sales Price of Common Shares | | | Dividends
Per Share | | | | | | | | | | 2017 | | | 2016 | | | 2017 | | | 2016 | | | | | High | | | Low | | | High | | | Low | | | | | | | | | | | | | | | First quarter | | $ | 33.44 | | | $ | 29.25 | | | $ | 27.92 | | | $ | 21.09 | | | $ | 0.115 | | | $ | 0.105 | | | | | | | | | Second quarter | | | 31.66 | | | | 23.55 | | | | 31.73 | | | | 24.68 | | | | 0.115 | | | | 0.105 | | | | | | | | | Third quarter | | | 33.29 | | | | 25.06 | | | | 29.59 | | | | 25.14 | | | | 0.115 | | | | 0.105 | | | | | | | | | Fourth quarter | | | 33.50 | | | | 29.48 | | | | 34.45 | | | | 22.30 | | | | 0.125 | | | | 0.115 | |
The Company’s Common Stock is listed on the NYSENew York Stock Exchange under the ticker symbol “GRC”. On May 16, 2017, the Company moved its stock exchange listing to the NYSE from the NYSE MKT. On February 1, 2018,2022, there were approximately 7,600 shareholders, of which 1,600 were1,532 registered holders of Common Shares.the Company’s common shares. The Company currently expects to continue its exceptional history of paying regular quarterly dividends, and increased annual dividends. However, any future dividends will be reviewed individually and declared by our Board of Directors at its discretion, dependent on ouran assessment of the Company’s financial condition and business outlook at the applicable time. PERFORMANCE GRAPH Set forth below is a line
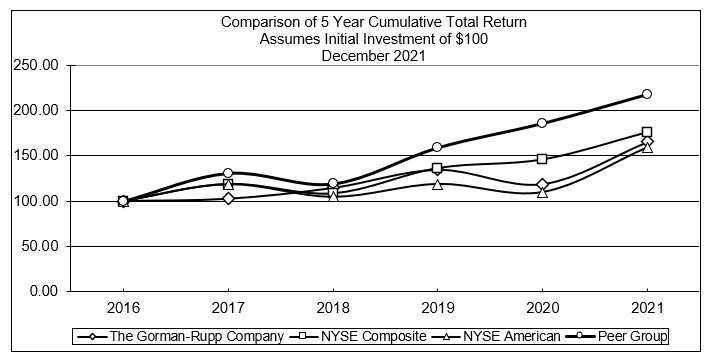
The following stock price performance graph comparing the yearly percentage change inand related table compares the cumulative total shareholder return, including reinvested cash dividends,returns (assuming reinvestment of dividends) on $100 invested on December 31, 2016 through December 31, 2021 in the Company’s common shares, against the cumulative total return of each of the NYSE Composite andIndex, the NYSE American as well asIndex and a peer group index for the period of five fiscal years commencing January 1, 2013 and ending December 31, 2017. The issuerscompanies in the peer group SIC Code 3561 Index were selected on aline-of-business basis by reference to SIC Code 3561—— Pumps and Pumping Equipment. The SIC Code Index is composed of the following issuers: Ampco-Pittsburgh Corp., Colfax Corp., Flowserve Corp., The Gorman-Rupp Company, Graco Inc., Idex Corp., ITT Corp., and Xylem Inc. The graph assumes that the value of the investment in the Company’s Common Stock, in each index, and in the peer group (including reinvestment of dividends) was $100 on 12/31/2012 and tracks it through 12/31/2017. Comparison of5-Year Cumulative Total Shareholder Return Among The Gorman-Rupp Company,
NYSE Composite Index, NYSE American Index and SIC Code 3561
COMPARISON OF 5 YEAR CUMULATIVE TOTAL RETURN*
Among The Gorman-Rupp Company, the NYSE American Index,
the NYSE Composite Index and SIC Code 3561

*$100 invested on 12/31/12 in stock or index, including reinvestment of dividends.
Fiscal year ending December 31.
| | | | | | | | | | | | | | | | | | | | | | | | | | | | 2012 | | | 2013 | | | 2014 | | | 2015 | | | 2016 | | | 2017 | | | | | | | | | | | | | | | | | | | | | | | | | | | The Gorman-Rupp Company | | | 100.00 | | | | 141.84 | | | | 137.89 | | | | 116.49 | | | | 137.07 | | | | 140.48 | | NYSE American | | | 100.00 | | | | 104.47 | | | | 105.23 | | | | 75.69 | | | | 89.97 | | | | 91.27 | | NYSE Composite | | | 100.00 | | | | 126.28 | | | | 134.81 | | | | 129.29 | | | | 144.73 | | | | 171.83 | | SIC Code 3561 | | | 100.00 | | | | 155.48 | | | | 144.87 | | | | 117.71 | | | | 147.01 | | | | 192.44 | |
The stock price performance included in this graph and related table is not necessarily indicative of future stock priceinvestment performance.
ITEM 6. | SELECTED FINANCIAL DATA |
 Five-Year Summary of Selected Financial Data
| | | 2016 | | | 2017 | | | 2018 | | | 2019 | | | 2020 | | | 2021 | | The Gorman-Rupp Company | | | 100.00 | | | | 102.49 | | | | 114.56 | | | | 134.79 | | | | 118.79 | | | | 165.95 | | NYSE Composite | | | 100.00 | | | | 118.90 | | | | 108.43 | | | | 136.34 | | | | 145.87 | | | | 176.03 | | NYSE American | | | 100.00 | | | | 118.56 | | | | 104.61 | | | | 118.96 | | | | 110.02 | | | | 159.72 | | SIC Code 3561 | | | 100.00 | | | | 130.90 | | | | 119.21 | | | | 159.08 | | | | 185.86 | | | | 217.88 | |
PURCHASES OF EQUITY SECURITIES (ThousandsAmounts in tables in thousands of dollars, except share and per share amounts)data) | | | | | | | | | | | | | | | | | | | | | | | | 2017 | | | 2016 | | | 2015 | | | 2014 | | | 2013 | | Operating Results | | | | | | | | | | | | | | | | | | | | | Net sales | | | $379,389 | | | | $382,071 | | | | $406,150 | | | | $434,925 | | | | $391,665 | | Gross profit | | | 98,745 | | | | 92,025 | | | | 92,580 | | | | 107,559 | | | | 93,655 | | Income taxes | | | 12,823 | | | | 11,599 | | | | 12,157 | | | | 17,593 | | | | 14,173 | | Net income | | | 26,555 | | | | 24,883 | | | | 25,109 | | | | 36,141 | | | | 30,104 | | Depreciation and amortization | | | 15,053 | | | | 15,529 | | | | 15,282 | | | | 14,615 | | | | 13,588 | | Interest expense | | | 17 | | | | 20 | | | | 122 | | | | 134 | | | | 146 | | Return on net sales (%) | | | 7.0 | | | | 6.5 | | | | 6.2 | | | | 8.3 | | | | 7.7 | | Sales dollars per employee | | | 327.9 | | | | 313.2 | | | | 318.5 | | | | 340.6 | | | | 315.6 | | Income dollars per employee | | | 23.0 | | | | 20.4 | | | | 19.7 | | | | 28.3 | | | | 24.3 | | Financial Position | | | | | | | | | | | | | | | | | | | | | Current assets | | | $227,934 | | | | $203,900 | | | | $189,391 | | | | $200,709 | | | | $189,289 | | Current liabilities | | | 45,696 | | | | 49,352 | | | | 43,460 | | | | 64,346 | | | | 60,760 | | Working capital | | | 182,238 | | | | 154,548 | | | | 145,931 | | | | 136,363 | | | | 128,529 | | Current ratio | | | 5.0 | | | | 4.1 | | | | 4.4 | | | | 3.1 | | | | 3.1 | | Property, plant and equipment, net | | | $117,071 | | | | $122,067 | | | | $129,887 | | | | $133,964 | | | | $131,189 | | Capital additions | | | 7,754 | | | | 6,877 | | | | 8,260 | | | | 13,278 | | | | 21,015 | | Total assets | | | 395,015 | | | | 382,818 | | | | 364,201 | | | | 380,904 | | | | 355,638 | | Equity | | | 325,495 | | | | 302,888 | | | | 287,021 | | | | 281,967 | | | | 264,140 | | Dividends paid | | | 12,268 | | | | 11,218 | | | | 10,599 | | | | 9,715 | | | | 8,662 | | Average number of employees | | | 1,157 | | | | 1,220 | | | | 1,275 | | | | 1,277 | | | | 1,241 | | Shareholder Information | | | | | | | | | | | | | | | | | | | | | Earnings per share | | | $ 1.02 | | | | $ 0.95 | | | | $ 0.96 | | | | $ 1.38 | | | | $ 1.15 | | Cash dividends per share | | | 0.470 | | | | 0.430 | | | | 0.405 | | | | 0.370 | | | | 0.330 | | Equity per share at December 31 | | | 12.47 | | | | 11.61 | | | | 11.00 | | | | 10.74 | | | | 10.06 | | Average number of shares outstanding | | | 26,100,865 | | | | 26,087,721 | | | | 26,192,072 | | | | 26,256,824 | | | | 26,249,324 | |
SummaryOn October 29, 2021, the Company announced a share repurchase program of Quarterly Resultsup to $50.0 million of Operations
(Thousandsthe Company’s common shares. Shares may be repurchased from time to time by the Company through a variety of dollars, except permethods, which may include open-market transactions, pre-set trading plans designed in accordance with Rule 10b5-1, privately negotiated transactions, accelerated share amounts)repurchase transactions, or any combination of such methods. The actual number of shares repurchased will depend on prevailing market conditions, alternative uses of capital and other factors, and will be determined at management’s discretion. The Company is not obligated to make any purchases under the program, and the program may be suspended or discontinued at any time. The program does not have an expiration date.
| | | | | | | | | | | | | | | | | | Quarter Ended 2017 | | Net Sales | | | Gross Profit | | | Net Income | | | Earnings
per Share | | First quarter | | | $ 92,603 | | | | $21,195 | | | | $ 5,065 | | | | $0.19 | | Second quarter | | | 97,872 | | | | 26,145 | | | | 7,848 | | | | 0.30 | | Third quarter | | | 93,976 | | | | 26,199 | | | | 5,702 | | | | 0.22 | | Fourth quarter | | | 94,938 | | | | 25,206 | | | | 7,940 | | | | 0.31 | | | | | | | | | | | | | | | | | | | Total | | | $379,389 | | | | $98,745 | | | | $26,555 | | | | $1.02 | | | | | | | | | | | | | | | | | | | | Quarter Ended 2016 | | Net Sales | | | Gross Profit | | | Net Income | | | Earnings
per Share | | First quarter | | | $100,257 | | | | $22,897 | | | | $ 6,282 | | | | $0.24 | | Second quarter | | | 96,265 | | | | 23,240 | | | | 6,620 | | | | 0.25 | | Third quarter | | | 91,346 | | | | 22,670 | | | | 6,927 | | | | 0.27 | | Fourth quarter | | | 94,203 | | | | 23,218 | | | | 5,054 | | | | 0.19 | | | | | | | | | | | | | | | | | | | Total | | | $382,071 | | | | $92,025 | | | | $24,883 | | | | $0.95 | | | | | | | | | | | | | | | | | | |
Period | | Total number of shares purchased | | | Average price paid per share | | | Total number of shares purchased as part of publicly announced program | | | Approximate dollar value of shares that may yet be purchased under the program | | October 1 to October 31, 2021 | | | - | | | $ | - | | | | - | | | $ | 50,000 | | November 1 to November 30, 2021 | | | - | | | | - | | | | - | | | | 50,000 | | December 1 to December 31, 2021 | | | 22,979 | | | | 44.14 | | | | 22,979 | | | | 48,985 | | Total | | | 22,979 | | | $ | 44.14 | | | | 22,979 | | | $ | 48,985 | |
| ITEM 7. | MANAGEMENT’SMANAGEMENT’S DISCUSSION AND ANALYSIS OF FINANCIAL CONDITION AND RESULTS OF OPERATIONS |
(Amounts in tables in thousands of dollars)dollars, except for per share data) Executive Overview The following discussion of Results of Operations includes certainnon-GAAP financial data and measures such as adjusted earnings before interest, taxes, depreciation and amortization and adjusted earnings per share amounts which excludenon-cash pension settlement charges in 20172021 and 2015 andnon-cash impairment charges in 2017 and 2016 relating to goodwill and other intangible assets.2020. Management utilizes these adjusted financial data and measures to assess comparative operations against those of prior periods without the distortion ofnon-comparable factors. The Gorman-Rupp Company believes that thesenon-GAAP financial data and measures also will be useful to investors as well as to assessin assessing the continuing strength of the Company’s underlying operations from period to period. Provided below is a reconciliation of adjusted earnings per share amounts and adjusted earnings before interest, taxes, depreciation and amortization. | | | | 2017 | | | 2016 | | | 2015 | | | 2021 | | | 2020 | | | 2019 | | Adjusted earnings per share: | | | | | | | | | | | | | | | | | | | Reported earnings per share – GAAP basis | | | $1.02 | | | | $0.95 | | | | $0.96 | | | $ | 1.14 | | | $ | 0.97 | | | $ | 1.37 | | Plus pension settlement charge | | | 0.10 | | | | - | | | | 0.10 | | | | 0.07 | | | | 0.14 | | | | - | | Plus goodwill impairment and other intangible asset charges | | | 0.10 | | | | 0.05 | | | | - | | | | | | | | | | | | | | Non-GAAP adjusted earnings per share | | | $1.22 | | | | $1.00 | | | | $1.06 | | | $ | 1.21 | | | $ | 1.11 | | | $ | 1.37 | | | | | | | | | | | | | | | | Adjusted earnings before interest, taxes, depreciation and amortization: | | | | | | | | | | | | | | | | | | | Reported net income – GAAP basis | | | $26,555 | | | | $24,883 | | | | $25,109 | | | $ | 29,851 | | | $ | 25,188 | | | $ | 35,815 | | Plus interest | | | 17 | | | | 20 | | | | 122 | | | 1 | | | 18 | | | 1 | | Plus income taxes | | | 12,823 | | | | 11,599 | | | | 12,157 | | | 7,397 | | | 6,058 | | | 9,351 | | Plus depreciation and amortization | | | 15,053 | | | | 15,529 | | | | 15,282 | | | | 11,914 | | | | 12,692 | | | | 13,749 | | | | | | | | | | | | | Non-GAAP earnings before interest, taxes, depreciation and amortization | | | 54,448 | | | | 52,031 | | | | 52,670 | | | Non-GAAP earnings before interest, taxes, depreciationand amortization | | | 49,163 | | | 43,956 | | | 58,916 | | Plus pension settlement charge | | | 4,031 | | | | - | | | | 3,783 | | | | 2,304 | | | | 4,583 | | | | - | | Plus goodwill impairment and other intangible asset charges | | | 4,098 | | | | 1,800 | | | | - | | | | | | | | | | | | | | Non-GAAP adjusted earnings before interest, taxes, depreciation and amortization | | | $62,577 | | | | $53,831 | | | | $56,453 | | | $ | 51,467 | | | $ | 48,539 | | | $ | 58,916 | | | | | | | | | | | | |
The Gorman-Rupp Company (“we”, “our”, “Gorman-Rupp” or the “Company”) is a leading designer, manufacturer and international marketer of pumps and pump systems for use in diverse water, wastewater, construction, dewatering, industrial, petroleum, original equipment, agriculture, fire protection, heating, ventilating and air conditioning (HVAC), military and other liquid-handling applications. The Company attributes its success to long-term product quality, applications and performance combined with timely delivery and service, and continually seeks to develop initiatives to improve performance in these key areas. Gorman-Rupp actively pursues growth opportunities through organic growth, international business expansion and acquisitions. We regularly invest in training for our employees, in new product development and in modern manufacturing equipment, technology and facilities all designed to increase production efficiency and capacity and drive growth by delivering innovative solutions to our customers. We believe that the diversity of our markets is a major contributor to the generally stable financial growth we have produced over the past 80 plusfor more than 85 years. The Company places a strong emphasis on cash flow generation and havingmaintaining excellent liquidity and financial flexibility. This focus has afforded us the ability to reinvest our cash resources and preserve a strong balance sheet to position us for future acquisition and product development opportunities. The Company had no bank debt as of December 31, 2017.2021. The $137.4$158.8 million of aggregate cash generated by operating activities over the past three years was utilized primarily to pay dividends fundand the Company’s defined benefit pension plan, purchase of productivity-enhancing capital equipment, entirely repay acquisitions-related short-term debt and fund growth-oriented acquisitions.equipment. The Company’s cash position increased $22.1$17.0 million during 20172021 to $79.7$125.2 million at December 31, 2017.2021. The Company generated $62.6$51.5 million in adjusted earnings before interest, taxes, depreciation and amortization during 2017.2021. From these earnings, the Company invested $7.8$9.8 million primarily in buildings, machinery and equipment and returned $12.3$16.6 million in dividends to shareholders. Capital additionsexpenditures for 20182022 are presently planned to be in the range of $15-$10-$1520 million primarily for building expansion and machinery and equipment purchases, and are expected to be financed through internally-generated funds and existing lines of credit.funds. Net sales for the year ended December 31, 20172021 were $379.4$378.3 million compared to $382.1$349.0 million for 2016, a decrease2020, an increase of 0.7%8.4% or $2.7 million. Excluding sales from the PCCP project of $0.7 million in 2017 and $9.9 million in 2016, net sales in 2017 increased 1.8% or $6.5$29.3 million. Domestic sales excluding PCCP,of $260.7 million increased $0.1 million5.6% while international sales of $117.6 million increased 4.9% or $6.4 million.15.3% compared to 2020. Gross profit was $98.7$95.9 million for 2017,2021, resulting in gross margin of 26.0%25.3%, compared to gross profit of $92.0$89.6 million and gross margin of 24.1%25.7% for 2016. Gross2020. The 40 basis point decrease in gross margin was driven by a 140 basis point increase in cost of material, which included anon-cash pension settlement chargean unfavorable LIFO impact of $2.6 million or 70180 basis points, in 2017 which did not occur in 2016. Excluding thenon-cash pension settlement charge, gross marginpartially offset by a 100 basis point improvement on labor and overhead resulting from increased by 260 basis points due principally to favorable sales mix.volume. SG&A was $56.8expenses were $56.5 million and 15.0%14.9% of net sales for 20172021 compared to $54.5$53.8 million and 14.3%15.4% of net sales for 2016.2020. SG&A includedexpenses increased 5.1% or $2.7 million as anon-cash pension settlement charge result of $1.4 million or 40compensation, travel and other expense items returning closer to pre-pandemic levels as operational activities return to normal but improved 50 basis points in 2017 which did not occur last year. SG&A included a gain on the sale of property, plant and equipment of $1.0 million or 30 basis points in 2016. Excluding these items, SG&A decreased slightly compared to last year and as a percentage of sales was flat.primarily as a result of leverage on fixed costs from increased sales volume. Operating income was $37.9$39.4 million for 2021, resulting in an operating margin of 10.0% for the 2017,10.4%, compared to operating income of $35.7$35.8 million and operating margin of 9.3%10.2% for 2016. In 2017, operating income includednon-cash impairment charges of $4.1 million or 1002020. Operating margin improved 20 basis points andprimarily as a result of improved leverage on fixed costs from increased sales volume partially offset by an unfavorable LIFO impact. Other income (expense), net was $2.1 million of expense for 2021 compared to expense of $4.5 million for the same period in 2020. The decrease in expense was due primarily to a non-cash pension settlement charge of $4.0$2.3 million or 110 basis points. In 2016, operating income includedin 2021 compared to anon-cash impairment charge of $1.8$4.6 million or 50 basis points and a gain on the sale of property, plant and equipment of $0.6 million or 20 basis points. Excluding these items, operating income improved $9.1 million or 250 basis points due principally to improved gross margin.in 2020. Net income was $26.6$29.9 million for 20172021 compared to $24.9$25.2 million in 2016,2020, and earnings per share were $1.02$1.14 for 2021 and $0.95$0.97 for the respective periods.2020. Earnings per share for 2017 includednon-cash impairment pension settlement charges of $0.10 per share$0.07 and anon-cash pension settlement charge of $0.10 per share. Earnings$0.14 per share for 20162021 and 2020, respectively. In 2021, earnings included anon-cash impairment chargean unfavorable LIFO impact of $0.05$0.20 per share.share compared to $0.03 per share in 2020. The Company’s backlog of orders was $114.0$186.0 million at December 31, 20172021 compared to $98.8$113.1 million at December 31, 2016,2020, an increase of 15.4%64.4%. The increaseApproximately 92.0% of the Company’s backlog of unfilled orders is scheduled to be shipped during 2022, with the remainder principally during the first half of 2023. Incoming orders increased 26.9% for the full year and increased 33.0% for the fourth quarter of 2021 compared to the same periods in backlog was primarily due to increases in2020. Incoming orders were up across most markets the fire protection, municipal and construction markets principally driven by improved economic conditions both domestically and internationally.Company serves. On January 25, 2018,27, 2022, the Board of Directors authorized the payment of a quarterly dividend of $0.125$0.17 per share, representing the 272nd288th consecutive quarterly dividend to be paid by the Company. During 2017,2021, the Company again paid increased dividends and thereby attained its 45th49th consecutive year of increased dividends. These consecutive years of increases continue to position Gorman-Rupp in the top 50 of all U.S. public companies with respect to number of years of increased dividend payments. The regular dividend yield at December 31, 20172021 was 1.5%. The Company currently expects to continue its exceptional history of paying regular quarterly dividends and increased annual dividends. However, any future dividends will be reviewed individually and declared by our Board of Directors at its discretion, dependent on our assessment of the Company’s financial condition and business outlook at the applicable time. Outlook
Overall businessOn October 29, 2021, the Company announced a share repurchase program of up to $50.0 million of the Company’s common shares. Shares may be repurchased from time to time by the Company through a variety of methods, which may include open-market transactions, pre-set trading plans designed in accordance with Rule 10b5-1, privately negotiated transactions, accelerated share repurchase transactions, or any combination of such methods. The actual number of shares repurchased will depend on prevailing market conditions, have continued to improve during 2017alternative uses of capital and we are optimistic about our incoming order rate as we enter 2018. However, we continue to experience some softness in the agricultureother factors, and certain oil and gas driven markets. Increased emphasis on infrastructure improvementswill be determined at both the federal and state levels coupled with the newly enacted U.S. tax legislation could be additional positive factors over the next several years.management’s discretion. The Company remains focused on operational efficienciesis not obligated to make any purchases under the program, and the program may be suspended or discontinued at any time. The program does not have an expiration date.
Effective January 1, 2022, the role of Chief Executive Officer transitioned from Jeffrey S. Gorman to Scott A. King, who served as the Company’s President and Chief Operating Officer. Mr. Gorman served as CEO since 1998 and following the CEO transition, will continue to manage expenses closely. Our underlying fundamentals remain strong and we remain well positionedserve as the Company’s Executive Chairman of the Board to drive long-term growth. Our strong balance sheet provides usassist with the flexibilityCompany’s overall strategy and acquisition efforts. Mr. King has been with the Company since 2004 and has held various operational leadership roles of increasing responsibility during this time. Outlook Our incoming order trend continues to continue to evaluate acquisition opportunities and new product development that we expect will help add value to our operations over the longer-term. On December 22, 2017, the U.S. Tax Cuts and Jobs Act (the “Tax Act”) was enacted. The Tax Act reduces the federal corporate tax rate on U.S. earnings to 21% and moves from a global taxation regime to a modified territorial regime. As part of the Tax Act, U.S. companies are required to pay a tax on historical earnings generated offshore that have not been repatriated to the U.S. Companies are required tore-measure their deferred tax assets and liabilities to reflect the lower federal base rate of 21%. These transitional impacts resulted in a provisional net tax expense of $0.4 million forbe very strong while sales during the fourth quarter of 2017, comprised2021 were somewhat impacted by customer-initiated shipment delays. Our team has continued to do a good job of managing the ongoing global supply chain challenges that the COVID-19 pandemic has caused and, as a result, we have seen minimal disruption. We have passed on price increases to offset inflationary pressures on material costs and wages and have leveraged our SG&A expenses as sales volumes have increased.
We enter 2022 with a very healthy backlog and are well positioned to continue to deliver top-line growth. We remain optimistic about the long-term outlook and believe our diverse markets, strong balance sheet, and highly-skilled workforce position us well to continue to deliver shareholder value. Results of Operations – 2021 Compared to 2020: Net Sales | | | Year Ended | | | | | | | | | | | | | December 31, | | | | | | | | | | | | | 2021 | | | 2020 | | | $ Change | | | % Change | | Net sales | | $ | 378,316 | | | $ | 348,967 | | | $ | 29,349 | | | | 8.4 | % |
Net sales for 2021 were $378.3 million compared to $349.0 million for 2020, an estimated repatriation tax expenseincrease of $2.08.4% or $29.3 million. Domestic sales of $260.7 million (which includes U.S. repatriation taxesincreased 5.6% while international sales of $117.6 million increased 15.3% compared to 2020. Sales in our water markets increased 7.7% or $19.2 million in 2021 compared to 2020. Sales increased $10.1 million in the fire market, $9.2 million in the construction market, $7.7 million in the repair market, and foreign withholding taxes)$2.2 million in the agriculture market. Partially offsetting these increases was a decrease of $10.0 million in the municipal market. The decrease in municipal market sales is primarily due to timing, as both incoming orders and a net deferred tax benefitbacklog have increased compared to the prior year. Sales in our non-water markets increased 10.2% or $10.1 million in 2021 compared to 2020. Sales in the OEM market increased $6.5 million, sales in the petroleum market increased $2.2 million, and sales in the industrial market increased $1.4 million. International sales were $117.6 million in 2021 compared to $102.1 million in 2020 and represented 31% and 29% of approximately $1.6 million. The provisional estimates are based ontotal sales for the Company’s initial analysis ofCompany, respectively. As the Tax Act. Given the significant complexity of the Tax Act, anticipated guidanceglobal economy continues to recover from the U. S. Treasury about implementing the Tax Act,COVID-19 pandemic, international sales have increased across nearly all of our markets. Cost of Products Sold and the potentialGross Profit | | | Year Ended | | | | | | | | | | | | | December 31, | | | | | | | | | | | | | 2021 | | | 2020 | | | $ Change | | | % Change | | Cost of products sold | | $ | 282,419 | | | $ | 259,412 | | | $ | 23,007 | | | | 8.9 | % | % of Net sales | | | 74.7 | % | | | 74.3 | % | | | | | | | | | Gross margin | | | 25.3 | % | | | 25.7 | % | | | | | | | | |
Gross profit was $95.9 million for additional guidance2021, resulting in gross margin of 25.3%, compared to gross profit of $89.6 million and gross margin of 25.7% for 2020. The 40 basis point decrease in gross margin was driven by a 140 basis point increase in cost of material, which included an unfavorable LIFO impact of 180 basis points, partially offset by a 100 basis point improvement on labor and overhead resulting from the Securitiesincreased sales volume. Selling, General and Exchange CommissionAdministrative (SG&A) Expenses | | | Year Ended | | | | | | | | | | | | | December 31, | | | | | | | | | | | | | 2021 | | | 2020 | | | $ Change | | | % Change | | Selling, general and administrative expenses | | $ | 56,541 | | | $ | 53,802 | | | $ | 2,739 | | | | 5.1 | % | % of Net sales | | | 14.9 | % | | | 15.4 | % | | | | | | | | |
SG&A expenses were $56.5 million and 14.9% of net sales for 2021 compared to $53.8 million and 15.4% of net sales for 2020. SG&A expenses increased 5.1% or the Financial Accounting Standards Board related$2.7 million as a result of compensation, travel and other expense items returning closer to the Tax Act, these estimates may be adjusted during 2018. pre-pandemic levels as operational activities return to normal but improved 50 basis points as a percentage of sales primarily as a result of leverage on fixed costs from increased sales volume. Operating Income | | | Year Ended | | | | | | | | | | | | | December 31, | | | | | | | | | | | | | 2021 | | | 2020 | | | $ Change | | | % Change | | Operating income | | $ | 39,356 | | | $ | 35,753 | | | $ | 3,603 | | | | 10.1 | % | % of Net sales | | | 10.4 | % | | | 10.2 | % | | | | | | | | |
Operating income was $39.4 million for 2021, resulting in an operating margin of 10.4%, compared to operating income of $35.8 million and operating margin of 10.2% for 2020. Operating margin improved 20 basis points primarily as a result of improved leverage on fixed costs from increased sales volume partially offset by an unfavorable LIFO impact. Net Income | | | Year Ended | | | | | | | | | | | | | December 31, | | | | | | | | | | | | | 2021 | | | 2020 | | | $ Change | | | % Change | | Income before income taxes | | $ | 37,248 | | | $ | 31,246 | | | $ | 6,002 | | | | 19.2 | % | % of Net sales | | | 9.8 | % | | | 8.9 | % | | | | | | | | | Income taxes | | $ | 7,397 | | | $ | 6,058 | | | $ | 1,339 | | | | 22.1 | % | Effective tax rate | | | 19.9 | % | | | 19.4 | % | | | | | | | | | Net income | | $ | 29,851 | | | $ | 25,188 | | | $ | 4,663 | | | | 18.5 | % | % of Net sales | | | 7.9 | % | | | 7.2 | % | | | | | | | | | Earnings per share | | $ | 1.14 | | | $ | 0.97 | | | $ | 0.17 | | | | 17.5 | % |
The Company’s preliminary estimate of its future effective tax rate attributablewas 19.9% for 2021 compared to the Tax Act is19.4% for 2020. The effective tax rate for 2021 was impacted by decreased benefits from credits and permanent items with higher pretax income. We expect our effective tax rate for 2022 to be between 23%20.0% and 26%22.0%. The Company continuesincrease of $4.7 million in net income in 2021 compared to evaluate the2020 was due primarily to increased sales. Earnings per share included non-cash pension settlement charges of $0.07 and $0.14 per share for 2021 and 2020, respectively. In 2021, earnings included an unfavorable LIFO impact of the Tax Act, and will update its estimates as appropriate.$0.20 per share compared to $0.03 per share in 2020. Results of Operations – 2017 2020 Compared to 2016:2019: In 2017, due
Net Sales | | | Year Ended | | | | | | | | | | | | | December 31, | | | | | | | | | | | | | 2020 | | | 2019 | | | $ Change | | | % Change | | Net sales | | $ | 348,967 | | | $ | 398,179 | | | $ | (49,212 | ) | | | (12.4 | )% |
Net sales for 2020 were $349.0 million compared to $398.2 million for 2019, a decrease of 12.4% or $49.2 million. Domestic sales decreased 10.3% or $28.4 million while international sales decreased 17.0% or $20.8 million compared to 2019. From 2019 to 2020 sales decreased across most of our markets primarily toas a result of the continued decreased demand for barge pumps for the marine transportation market driven by low oil prices and overcapacity of inland barges, the Bayou City Pump Company (“Bayou”) reporting unit recordedpre-taxnon-cash goodwill and intangible asset impairment charges of $4.1 million. In 2016, due primarily to the prolonged downturnCOVID-19 pandemic, along with a slowdown in the oil and gas industry, the Bayou reporting unit recorded apre-taxnon-cash goodwill impairment charge of $1.8 million. There were no impairment charges recorded in 2015. See Note 8, Goodwill and Other Intangible Assets. In 2017, due to increased employee retirements and related lump sum pension payments, the Company recorded a U.S. GAAP-required and actuarially-determined $4.0 millionnon-cash pension settlement charge. The value of lump sum pension payments was less in 2016 and anon-cash pension settlement charge was not required.
Net Salesindustry.
| | | | | | | | | | | | | | | | | | | | Year Ended December 31, | | | | | | | | | | | 2017 | | | 2016 | | | $ Change | | | % Change | | Net sales | | $ | 379,389 | | | $ | 382,071 | | | $ | (2,682) | | | | (0.7)% | |
Net sales for the year ended December 31, 2017 were $379.4 million compared to $382.1 million for 2016, a decrease of 0.7% or $2.7 million. Excluding sales from the PCCP project of $0.7 million in 2017 and $9.9 million in 2016, net sales in 2017 increased 1.8% or $6.5 million. Domestic sales, excluding PCCP, increased $0.1 million while international sales increased 4.9% or $6.4 million.
Sales in our larger water markets excluding PCCP, decreased 0.4%9.4% or $1.1$25.9 million in 20172020 compared to 2016.2019. Sales in the agriculture market increased $1.5 million. This increase was offset by decreases in the construction market increased $10.4of $11.3 million duedriven primarily to sales to rental market customers,by softness in oil and sales of repair parts increased $2.4 million. These increases were offset by decreased salesgas drilling activity. Decreases in the repair market of $5.6 million, municipal market decreased $7.3of $5.3 million, principally driven by decreased shipments attributable to flood control projects. In addition, sales in theand fire protection market decreased $4.2of $5.2 million principally due to market softness inwere a result of the Middle East, and sales in the agriculture market decreased $2.4 million principally due to low farm income and competitive pricing pressure.COVID-19 pandemic. Sales in ournon-water markets increased 6.9%decreased 18.9% or $7.6$23.3 million in 20172020 compared to 2016. Sales increased $7.7 million in2019 primarily as a result of the industrial market driven by an increaseCOVID-19 pandemic, along with reduced demand from midstream and downstream oil and gas customers and softness in oil and gas drilling activity. Sales in the OEM market increased $2.5decreased $8.3 million, primarily related to power generation equipmentsales in the industrial market decreased $7.8 million and new customers associated with transportation and alternative energy applications. These increases were partially offset by decreased shipments of $2.6 millionsales in the petroleum market driven by challenging market conditions.decreased $7.2 million. International sales were $137.6$102.1 million in 20172020 compared to $131.2$122.9 million in 2016. International sales2019 and represented 36%29% and 34%31% of total sales for the Company, in each of the years 2017 and 2016, respectively. InternationalIn 2020, international sales increased in the construction and industrial markets and continued to be softerdecreased most notably in the fire protection market due to sluggish economic conditions in the Middle East.and all non-water markets. Cost of Products Sold and Gross Profit | | | | | | | | | | Year Ended | | | | | | | | | | | | Year Ended December 31, | | | | | | | | | December 31, | | | | | | | | | | | | | 2017 | | | 2016 | | | $ Change | | | % Change | | | 2020 | | 2019 | | $ Change | | % Change | | Cost of products sold | | $ | 280,644 | | | $ | 290,046 | | | $ | (9,402) | | | | (3.2)% | | | $ | 259,412 | | | $ | 295,504 | | | $ | (36,092 | ) | | (12.2 | )% | % of Net sales | | | 74.0% | | | | 75.9% | | | | | | | | 74.3 | % | | | 74.2 | % | | | | | | | | | Gross margin | | | 26.0% | | | | 24.1% | | | | | | | | 25.7 | % | | | 25.8 | % | | | | | | | | |
Gross profit was $98.7$89.6 million for 2017,2020, resulting in gross margin of 26.0%25.7%, compared to gross profit of $92.0$102.7 million and gross margin of 24.1%25.8% for 2016.2019. Gross margin included anon-cash pension settlement charge of $2.6 million or 70in 2020 decreased 10 basis points in 2017 which did not occur in 2016. Excluding thenon-cash pension settlement charge, gross margin increased by 260largely due to an unfavorable LIFO impact of 60 basis points due principallycompared to favorable2019 and decreased 120 basis points from the loss of leverage on fixed labor and overhead attributable to lower sales mix.volume. Largely offsetting these items were lower material costs of 170 basis points compared to 2019. Selling, General and Administrative Expenses (SG&A) Expenses | | | | | | | | | | Year Ended | | | | | | | | | | | | Year Ended December��31, | | | | | | | | | December 31, | | | | | | | | | | | | | 2017 | | | 2016 | | | $ Change | | | % Change | | | 2020 | | 2019 | | $ Change | | % Change | | | Selling, general and administrative expenses | | $ | 56,789 | | | $ | 54,528 | | | $ | 2,261 | | | | 4.1% | | | $ | 53,802 | | | $ | 58,835 | | | $ | (5,033 | ) | | (8.6 | )% | % of Net sales | | | 15.0% | | | | 14.3% | | | | | | | | 15.4 | % | | | 14.8 | % | | | | | | | | |
SG&A was $56.8expenses were $53.8 million and 15.0%15.4% of net sales for 20172020 compared to $54.5$58.8 million and 14.3%14.8% of net sales for 2016.2019. SG&A included anon-cash pension settlement charge of $1.4expenses decreased 8.6% or $5.0 million or 40 basis points in 2017 which did not occur last year.due to reduced payroll related and travel expenses combined with overall expense management. SG&A included a gain on the sale of property, plant and equipment of $1.0 million or 30 basis points in 2016. Excluding these items, SG&A decreased slightly compared to last year andexpenses as a percentage of sales was flat. Operating Income | | | | | | | | | | Year Ended | | | | | | | | | | | | Year Ended December 31, | | | | | | | | | December 31, | | | | | | | | | | | | | 2017 | | | 2016 | | | $ Change | | | % Change | | | 2020 | | 2019 | | $ Change | | % Change | | Operating income | | $ | 37,858 | | | $ | 35,697 | | | $ | 2,161 | | | | 6.1% | | | $ | 35,753 | | | $ | 43,840 | | | $ | (8,087 | ) | | (18.4 | )% | % of Net sales | | | 10.0% | | | | 9.3% | | | | | | | | 10.2 | % | | | 11.0 | % | | | | | | | | |
Operating income was $37.9$35.8 million for 2020, resulting in an operating margin of 10.0% for 2017,10.2%, compared to operating income of $35.7$43.8 million and operating margin of 9.3%11.0% for 2016. In 2017, operating2019. Operating margin includednon-cash impairment charges of $4.1 million or 100decreased 80 basis points primarily as a result of loss of leverage from lower sales volume. Net Income | | | Year Ended | | | | | | | | | | | | | December 31, | | | | | | | | | | | | | 2020 | | | 2019 | | | $ Change | | | % Change | | Income before income taxes | | $ | 31,246 | | | $ | 45,166 | | | $ | (13,920 | ) | | | (30.8 | )% | % of Net sales | | | 8.9 | % | | | 11.3 | % | | | | | | | | | Income taxes | | $ | 6,058 | | | $ | 9,351 | | | $ | (3,293 | ) | | | (35.2 | )% | Effective tax rate | | | 19.4 | % | | | 20.7 | % | | | | | | | | | Net income | | $ | 25,188 | | | $ | 35,815 | | | $ | (10,627 | ) | | | (29.7 | )% | % of Net sales | | | 7.2 | % | | | 9.0 | % | | | | | | | | | Earnings per share | | $ | 0.97 | | | $ | 1.37 | | | $ | (0.40 | ) | | | (29.2 | )% |
The Company’s effective tax rate was 19.4% for 2020 compared to 20.7% for 2019. The effective tax rate for 2020 was impacted by an increased benefit from credits and permanent items over a lower pretax income as well as a favorable tax rate benefit on foreign operations. The decrease of $10.6 million in net income in 2020 compared to 2019 was due primarily to lower sales volume and anon-cash pension settlement charge of $4.0 million or 110 basis points. In 2016, operating margin included anon-cash impairment charge of $1.8 million or 50 basis points and a gain on the sale of property, plant and equipment of $0.6 million or 20 basis points. Excluding these items, operating income improved $9.1 million or 250 basis points due principally to improved gross margin. Net Income
| | | | | | | | | | | | | | | | | | | | Year Ended December 31, | | | | | | | | | | | 2017 | | | 2016 | | | $ Change | | | % Change | | Income before income taxes | | | $39,378 | | | | $36,482 | | | | $2,896 | | | | 7.9% | | % of Net sales | | | 10.4% | | | | 9.6% | | | | | | | | | | Income taxes | | | $12,823 | | | | $11,599 | | | | $1,224 | | | | 10.6% | | Effective tax rate | | | 32.6% | | | | 31.8% | | | | | | | | | | Net income | | | $26,555 | | | | $24,883 | | | | $1,672 | | | | 6.7% | | % of Net sales | | | 7.0% | | | | 6.5% | | | | | | | | | | Earnings per share | | | $ 1.02 | | | | $ 0.95 | | | | $ 0.07 | | | | 7.4% | |
The increase in net income in 2017 compared to 2016 was due primarily to improved gross margin partially offset by anon-cash pension settlement charge in 2017 of $2.7 million, net of income taxes, andnon-cash impairment charges of $2.7$3.7 million net of income taxes. Net income in 20162019 included anon-cash impairment charge of $1.2 million, net of income taxes. The effective tax rate in 2017 included $0.4 million net favorable LIFO impact of the Tax Act enacted on December 22, 2017.$0.9 million.
Earnings per share for 2017in 2020 included a non-cash impairment charges of $0.10 per share and anon-cash pension settlement charge of $0.10$0.14 per share. Earnings per share for 2016 includedIn 2019, earnings benefited from anon-cash impairment charge of $0.05 per share partially offset by a gain on the sale of property, plant and equipment of $0.02 per share. Results of Operations – 2016 Compared to 2015:
In 2016, due primarily to the decreased demand for barge pumps for the marine transportation market driven by low oil prices and overcapacity of inland barges, the Bayou reporting unit recorded apre-taxnon-cash goodwill impairment charge of $1.8 million. There was no goodwill impairment charge recorded in 2015. See Note 8, Goodwill and Other Intangible Assets.
In 2015, due to increased employee retirements and related lump sum pension payments, the Company recorded a U.S. GAAP-required and actuarially-determined $3.8 millionnon-cash pension settlement charge. The value of lump sum pension payments was less in 2016 and anon-cash pension settlement charge was not required.
Net Sales
| | | | | | | | | | | | | | | | | | | | Year Ended December 31, | | | | | | | | | | | 2016 | | | 2015 | | | $ Change | | | % Change | | Net sales | | $ | 382,071 | | | $ | 406,150 | | | $ | (24,079) | | | | (5.9)% | |
Net sales for the year ended December 31, 2016 were $382.1 million compared to $406.2 million for 2015, a decrease of 5.9% or $24.1 million. Excluding sales from the PCCP project of $9.9 million in 2016 and $37.7 million in 2015, net sales in 2016 increased 1.0% or $3.7 million. Domestic sales, excluding PCCP, increased 3.9% or $9.0 million and international sales decreased 3.9% or $5.3 million. Of the total decrease in net sales in 2016, approximately $0.9 million was due to unfavorable foreign currency translation.
Sales in our larger water markets, excluding PCCP, increased 3.6% or $9.1 million in 2016 compared to 2015. Sales in the municipal market, excluding PCCP, increased $15.1 million driven by increased shipments attributable to other flood control projects, clean water and wastewater applications. Sales in the construction market increased $2.7 million due primarily to sales to rental businesses and sales to new customers. However, sales decreased $3.7 million in the fire protection market largely due to market softness domestically and in the Middle East, and $2.3 million in the agriculture market principally due to wet weather conditions in many domestic locations and decreased farm income. In addition, sales of repair parts decreased $2.8 million.
Sales decreased 4.6% or $5.4 million innon-water markets for 2016 compared to 2015. Increased sales of $3.2 million in the OEM market related to power generation equipment and services were offset by a decrease of $7.7 million in the industrial market largely attributable to the slowdown in oil and gas production.
International sales were $131.2 million in 2016 compared to $136.5 million in 2015. International sales represented 34% of total sales for the Company in each of the years 2016 and 2015. Sales continued to be somewhat softer in Europe and in the Middle East due to sluggish economic conditions primarily affecting the fire protection and OEM markets.
Cost of Products Sold and Gross Profit
| | | | | | | | | | | | | | | | | | | | Year Ended December 31, | | | | | | | | | | | 2016 | | | 2015 | | | $ Change | | | % Change | | Cost of products sold | | $ | 290,046 | | | $ | 313,570 | | | $ | (23,524) | | | | (7.5)% | | % of Net sales | | | 75.9% | | | | 77.2% | | | | | | | | | | Gross margin | | | 24.1% | | | | 22.8% | | | | | | | | | |
The gross margin increase in 2016 compared to 2015 was due principally to favorable sales mix changes, most notably within the municipal market and lower LIFO inventory expense of 50 basis points. Also, anon-cash pension settlement charge of 60 basis points was recognized in 2015 which did not recur in 2016. Conversely, health care expenses increased 30 basis points in 2016 primarily due to higher claims.
Selling, General and Administrative Expenses (SG&A)
| | | | | | | | | | | | | | | | | | | | Year Ended December 31, | | | | | | | | | | | 2016 | | | 2015 | | | $ Change | | | % Change | | Selling, general and administrative expenses | | $ | 54,528 | | | $ | 56,189 | | | $ | (1,661) | | | | (3.0)% | | % of Net sales | | | 14.3% | | | | 13.8% | | | | | | | | | |
The increase in SG&A expenses as a percentage of net sales in 2016 compared to 2015 was due principally to loss of leverage due to lower sales volume and increased professional services fees of approximately 30 basis points related largely to costs incurred in connection with acquired businesses during the previous two years. Offsetting these variances were a gain on the sale of property, plant and equipment in 2016 of 30 basis points and anon-cash pension settlement charge of 30 basis points in 2015 which did not recur in 2016.
Operating Income
| | | | | | | | | | | | | | | | | | | | Year Ended December 31, | | | | | | | | | | | 2016 | | | 2015 | | | $ Change | | | % Change | | Operating income | | $ | 35,697 | | | $ | 36,391 | | | $ | (694) | | | | (1.9)% | | % of Net sales | | | 9.3% | | | | 9.0% | | | | | | | | | |
The change in operating margin was impacted by the variances mentioned above, including anon-cash goodwill impairment charge in 2016 of 50 basis points and anon-cash pension settlement charge totaling 90 basis points in 2015 which did not recur in 2016.
Net Income
| | | | | | | | | | | | | | | | | | | | Year Ended December 31, | | | | | | | | | | | 2016 | | | 2015 | | | $ Change | | | % Change | | Income before income taxes | | | $36,482 | | | | $37,266 | | | | $(784) | | | | (2.1)% | | % of Net sales | | | 9.6% | | | | 9.2% | | | | | | | | | | Income taxes | | | $11,599 | | | | $12,157 | | | | $(558) | | | | (4.6)% | | Effective tax rate | | | 31.8% | | | | 32.6% | | | | | | | | | | Net income | | | $24,883 | | | | $25,109 | | | | $(226) | | | | (0.9)% | | % of Net sales | | | 6.5% | | | | 6.2% | | | | | | | | | | Earnings per share | | | $ 0.95 | | | | $ 0.96 | | | | $(0.01) | | | | (1.0)% | |
The decreases in net income and earnings per share in 2016 compared to 2015 were due primarily to sales volume decreases and anon-cash goodwill impairment charge in 2016 of $1.2 million, net of income taxes. These unfavorable variances were offset by a gain on the sale of property, plant and equipment, lower LIFO inventory expense and lower pension expense due to a pension settlement charge of $2.5 million, net of income taxes, in 2015 which did not recur in 2016. The decrease in the effective tax rate between the two periods was due primarily to changes in the estimated domestic production activities deduction and the impact of more income in jurisdictions with lower tax rates.$0.04 per share.
Liquidity and Sources of Capital Cash and cash equivalents totaled $79.7$125.2 million and there was no outstanding bank debt at December 31, 2017.2021. In addition, at December 31, 2021, the Company had $21.8$23.2 million of borrowing capacity available in bank lines of credit after deducting $9.2$6.3 million in outstanding letters of credit primarily related to customer orders. The Company was in compliance with its debt covenants, including limits on additional borrowings and maintenance of certain operating and financial ratios, at all times in 20172021 and 2016.2020. Capital expenditures for 2018,2022, which are expected to consist principally of building expansion and machinery and equipment purchases, are estimated to be in the range of$10-$15 $15 - $20 million and are expected to be financed through internally generated fundsfunds. During 2021, 2020 and existing lines of credit. During 2017, 2016 and 2015,2019, the Company financed its capital improvements and working capital requirements principally through internally generated funds. We expect to continue to generate cash in excess of our operating needs. We believe we have adequate funds on hand and sufficient borrowing capacity to execute our financial and operating strategy. The Company expects to contribute up to $2.0 million to its defined benefit pension plan in 2022. Free cash flow, anon-GAAP measure for reporting cash flow, is defined by the Company as adjusted earnings before interest, income taxes and depreciation and amortization, less capital expenditures and dividends. The Company believes free cash flow provides investors with an important perspective on cash available for investments, acquisitions and working capital requirements. The following table reconciles adjusted earnings before interest, income taxes and depreciation and amortization as reconciled above to free cash flow: | | | | 2017 | | | 2016 | | | 2015 | | | 2021 | | | 2020 | | | 2019 | | | Non-GAAP adjusted earnings before interest, taxes, depreciation and amortization | | $ 62,577 | | | | $ 53,831 | | | | $ 56,453 | | | $ | 51,467 | | | $ | 48,539 | | | $ | 58,916 | | Less capital expenditures | | (7,754) | | | | (6,877) | | | | (8,260) | | | (9,751 | ) | | (7,999 | ) | | (10,912 | ) | Less cash dividends | | (12,268) | | | | (11,218) | | | | (10,599) | | | | (16,586 | ) | | | (15,394 | ) | | | (14,370 | ) | | | | | | | | | | | | Non-GAAP free cash flow | | $ 42,555 | | | | $ 35,736 | | | | $ 37,594 | | | $ | 25,130 | | | $ | 25,146 | | | $ | 33,634 | | | | | | | | | | | | |
Financial Cash Flow | | | | | | | | Year Ended | | | | | Year Ended December 31, | | | December 31, | | | | | 2017 | | 2016 | | 2015 | | | 2021 | | | 2020 | | | 2019 | | Beginning of period cash and cash equivalents | | $ 57,604 | | | $ 23,724 | | | $ 24,491 | | | $ | 108,203 | | | $ | 80,555 | | | $ | 46,458 | | | Net cash provided by operating activities | | 43,265 | | | 53,434 | | | 40,683 | | | 45,438 | | | 51,162 | | | 62,174 | | | Net cash used for investing activities | | (10,410) | | | (8,466) | | | (11,180) | | | (9,169 | ) | | (7,704 | ) | | (10,847 | ) | | Net cash used for financing activities | | (12,268) | | | (11,218) | | | (29,090) | | | (18,553 | ) | | (16,136 | ) | | (17,363 | ) | | Effect of exchange rate changes on cash | | 1,489 | | | 130 | | | (1,180) | | | | (725 | ) | | | 326 | | | | 133 | | | | | | | | | | | | | | Net increase (decrease) in cash and cash equivalents | | 22,076 | | | 33,880 | | | (767) | | | | 16,991 | | | | 27,648 | | | | 34,097 | | | | | | | | | | | | | End of period cash and cash equivalents | | $ 79,680 | | | $ 57,604 | | | $ 23,724 | | | $ | 125,194 | | | $ | 108,203 | | | $ | 80,555 | | | | | | | | | | | | |
The change in cash provided by operating activities in 20172021 compared to 20162020 was primarily due to increased accounts receivable compared to a decrease in the prior period. The change in accounts receivable more thanwas partially offset by increased inventories and decreased commissionsan increase in net income, an increase in accounts payable, and benefit obligations.an increase in prepaid assets. The change in cash provided by operating activities in 20162020 compared to 20152019 was primarily due to reductionslower income in inventories2020 compared to 2019 driven by decreased sales. Cash outflows increased in 2020 due to a reduction in accounts payable primarily from reduced SG&A spend, increased inventory to prepare for customer demand, and increased pension contributions. These cash outflows were offset by cash inflows from reduced accounts receivable driven by lowerdecreased sales volume, partially offset by contributions to the Company’s defined benefit pension plan.and a higher deferred tax provision. During 2017,2021, investing activities of $10.4$9.1 million primarily consisted of a $3.0 million increase in short-term investments and $7.8$9.8 million of capital expenditures for buildings, machinery and equipment offset by $0.3 million of proceeds from the sale of property, plant and equipment. During 2016,2020, investing activities of $8.5$7.7 million primarily consisted of $8.0 million of capital expenditures for buildings, machinery and equipment, a new operations facility in Africa, and other building improvements totaling $6.9 million as well as a payment for an acquisition, net of cash acquired, of $3.0 million, offset by proceeds from the sale of property, plant, and equipment of $1.4 million.equipment. During 2015,2019, investing activities of $11.2$10.8 million primarily consisted of $10.9 million of capital expenditures for building, building improvements andbuildings, machinery and equipment totaling $8.3 million as well as payments for acquisitions, net of cash acquired, of $3.4 million, offset by proceeds from the sale of property, plant, and equipment of $0.5 million.equipment. Net cash used for
During 2021, financing activities of $18.6 million consisted primarily of dividend payments of $12.3 million, $11.2$16.6 million and $10.6open market share repurchases of $1.2 million. During 2020, financing activities of $16.1 million during 2017, 2016consisted primarily of dividend payments of $15.4 million. During 2019, financing activities of $17.4 million consisted primarily of dividend payments of $14.4 million and 2015, respectively. During 2015, the Company also paid off its $12.0 million of short-term bank borrowings and $1.9 million of assumed acquisition debt and made a privately-arranged market value purchase of Company shares in the amount of $4.6$2.5 million from a Rupp family estate. The Company currently expects to continue its exceptional history of paying regular quarterly dividends and increased annual dividends. However, any future dividends will be reviewed individually and declared by our Board of Directors at its discretion, dependent on our assessment of the Company’s financial condition and business outlook at the applicable time. The Board of Directors has authorized a share repurchase program of up to $50.0 million of the Company’s common shares, of which approximately $49.0 million has yet to be repurchased. The actual number of shares repurchased will depend on prevailing market conditions, alternative uses of capital and other factors, and will be determined at management’s discretion. The Company is not obligated to make any purchases under the program, and the program may be suspended or discontinued at any time.Contractual Obligations Capital commitments in the table below include contractual commitments to purchase machinery and equipment that have been approved by the Board of Directors. The capital commitments do not represent the entire anticipated purchases in the future but represent only those substantive items for which the Company is contractually obligated as of December 31, 2017.2021. Also, the Company has some operating leases and two financing leases for certain offices, manufacturing facilities, land, office equipment and automobiles. Rental expenses relating to these leases were $0.9 million in 2017, $1.12021, $0.9 million in 20162020 and $1.0 million in 2015.2019. The following table summarizes the Company’s contractual obligations at December 31, 2017:2021: | | | | Payment Due By Period | | | Payment Due By Period | | | | | Total | | Less
than
1 Year | | 1-3
Years | | 3-5
Years | | More
than
5 Years | | | Total | | Less
than
1 Year | | 1-3
Years | | 3-5
Years | | More
than
5 Years | | Capital commitments | | $2,070 | | | $2,070 | | | | $ - | | | | $ - | | | | $ - | | | $ | 4,526 | | | $ | 4,526 | | | $ | - | | | $ | - | | | $ | - | | Operating leases | | 1,557 | | | 825 | | | 677 | | | 46 | | | 9 | | | | | | | | | | | | | | | | | | | | Leases | | | | 1,187 | | | | 607 | | | | 545 | | | | 26 | | | | 9 | | Total | | $3,627 | | | $2,895 | | | $677 | | | $46 | | | $ 9 | | | $ | 5,713 | | | $ | 5,133 | | | $ | 545 | | | $ | 26 | | | $ | 9 | | | | | | | | | | | | | | | | | | |
Critical Accounting Policies The accompanying consolidated financial statementsConsolidated Financial Statements have been prepared in conformity with accounting principles generally accepted in the United States. When more than one accounting principle, or the method of its application, is generally accepted, management selects the principle or method that is appropriate in the Company’s specific circumstances. Application of these accounting principles requires management to make estimates about the future resolution of existing uncertainties; as a result, actual results could differ from these estimates. In preparing these consolidated financial statements,Consolidated Financial Statements, management has made its best estimates and judgments of the amounts and disclosures included in the consolidated financial statements,Consolidated Financial Statements, giving due regard to materiality. The Company does not believe there is a great likelihood that materially different amounts would be reported under different conditions or using different assumptions pertaining to the accounting policies described below. Revenue Recognition The Company accounts for revenue in accordance with Accounting Standards Codification (“ASC”) 606, “Revenue from Contracts with Customers,” under which the unit of account is a performance obligation. Substantially all of our revenue is derived from fixed-price customer contracts and the majority of our customer contracts have a single performance obligation. A performance obligation is a promise in a contract to transfer a distinct good or service to a customer. For customer contracts with multiple performance obligations, the Company allocates revenue to each performance obligation based on its relative standalone selling price, which is generally determined based on standalone selling prices charged to customers or using expected cost plus margin. The transaction price for a customer contract is allocated to each distinct performance obligation and recognized as revenue when, or as, the Company’s revenues from product salesperformance obligation is satisfied. All of the Company's performance obligations, and associated revenue, are generally satisfied at a point in time, with the exception of certain highly customized pump products, which are satisfied over time as work progresses. Accounting for long-term contracts involves the use of various techniques to estimate total contract revenue and costs. For long-term contracts, the Company estimates the profit on a contract as the difference between the total estimated revenue and expected costs to complete a contract and recognizes that profit as performance obligations are satisfied. Contract estimates are based on various assumptions to project the outcome of future events that could span longer than one year. These assumptions include labor productivity and availability, the complexity of the work to be performed, the cost and availability of materials and the performance of subcontractors as applicable. As a significant change in one or more of these estimates could affect the profitability of our contracts, the Company reviews and updates its contract-related estimates regularly. Adjustments in estimated profit on contracts are accounted for under the cumulative catch-up method. Under this method, the impact of the adjustment on profit recorded to date on a contract is recognized in the period the adjustment is identified. Revenue and profit in future periods of contract performance are recognized when all ofusing the following criteria are met: persuasive evidence of a sale arrangement exists, the price is fixed or determinable, product delivery has occurred or services have been rendered, there are no further obligations to customers and collectability is probable. Product delivery occurs when the risks and rewards of ownership and title pass, which usually occurs upon shipment to the customer.adjusted estimate. The Company adopted, effective January 1, 2018, the new revenue guidance in ASU2014-09 pursuant to the modified retrospective method. Any adjustment to the opening balance of retained earnings is not expected to be material. See Note 1 to the Consolidated Financial Statements, Summary of Significant Accounting Policies.
Allowance for Doubtful Accounts The Company evaluates the collectability of its accounts receivable based on a combination of factors.factors including both current and historical information. In circumstances where the Company is aware of a specific customer’s inability to meet its financial obligations to the Company (e.g., bankruptcy filings, substantial downgrading of credit scores), the Company records a specific allowance for bad debts against amounts due to reduce the net recognized receivable to the amount the Company reasonably believes will be collected. For all other customers, the Company recognizes allowances for bad debts primarily based on the length of time the receivables are past due. If circumstances change (e.g., an unexpected material adverse change in a large customer’s ability to meet its financial obligations), the Company’s estimates of the recoverability of amounts due could be reduced by a material amount. Historically, the Company’s collection history has been good. Inventories and Related Allowance Inventories are valued at the lower of cost or market value and have been reduced by an allowance for excess and obsolete inventories. The estimated allowance is based on a variety of factors, including historical inventory usage and management evaluations. Historically, the Company has not experienced substantive write-offs due to obsolescence. The Company uses thelast-in,first-out (LIFO) method for the majority of its inventories. Product Warranties A liability is established for estimated future warranty and service claims based on historical claims experience and specific product failures. Pension Plan and Other Postretirement Benefit Plans The Company recognizes the obligations associated with its defined benefit pension plan and defined benefit health care plans in its consolidated financial statements.Consolidated Financial Statements. The measurement of liabilities related to its pension plan and other postretirement benefit plans is based on management’s assumptions related to future events including interest rates, return on pension plan assets, rate of compensation increases and health care cost trend rates. Actual pension plan asset performance will either reduce or increase pension losses included in accumulated other comprehensive loss, which ultimately affects net income. The discount rates used to determine the present value of future benefits are based on estimated yields of investment grade fixed income investments. The discount rates used to value pension plan obligations were 3.27%2.44% and 3.60%1.97% at December 31, 20172021 and 2016,2020, respectively. The discount rates used to value postretirement obligations were 3.39%2.70% and 3.77%2.25% at December 31, 20172021 and 2016,2020, respectively. The discount rates were determined by constructing azero-coupon spot yield curve derived from a universe of high-quality bonds as of the measurement date. The expected rate of return on pension assets is designed to be a long- termlong-term assumption that will be subject toyear-to-year variability. The rate for 20172021 was 5.10% and 20162020 was 6.00%5.36%. Actual pension plan asset performance will either reduce or increase unamortized losses included in accumulatedAccumulated other comprehensive loss, which will ultimately affect net income. The assumed rate of compensation increase was 3.50% in 2017both 2021 and 2016.2020. Substantially all retirees elect to take lump sum settlements of their pension plan benefits. When interest rates are low as they have been the last five years, this subjects the Company to the risk of exceeding an actuarial threshold computed on an annual basis and triggering a GAAP-requirednon-cash pension settlement loss, which occurred in 20172021 and 2015.2020. The assumption used for the rate of increase in medical costs over the next five years was unchanged5% in 2017 from 2016. A one percentage point increase in the assumed health care trend would increase postretirement expense by approximately $271,000, changing the benefit obligation by approximately $1.6 million; while a one percentage point decrease in the assumed health care trend would decrease postretirement expense by approximately $233,000, changing the benefit obligation by approximately $1.4 million.both 2021 and 2020. Income Taxes The basic principles related to accounting for income taxes are to recognize the amount of taxes payable or refundable for the current year and deferred tax liabilities and assets for the future tax consequences of events that have been recognized in an entity’s financial statements or tax returns. Realization of the Company’s deferred tax assets is principally dependent upon the Company’s achievement of projected future taxable income, which management believes will be sufficient to fully utilize the deferred tax assets recorded, with the exception of deferred tax associated with certain state tax credits for which a valuation allowance has been recognized. On December 22, 2017,
The Company is subject to income taxes in the U.S. Tax Cutsfederal and Jobs Act (the “Tax Act”) was enacted. The Tax Act reducesvarious state, local and foreign jurisdictions. Income tax regulations within each jurisdiction are subject to the federal corporate tax rate on U.S. earnings to 21% and moves from a global taxation regime to a modified territorial regime. As partinterpretation of the Tax Act,related tax laws and regulations and require significant judgment to apply. With few exceptions, the Company is no longer subject to U.S. companies are required to pay afederal, state and local, or non-U.S. income tax on historical earnings generated offshore that have not been repatriated toexaminations by tax authorities for the U.S. Companies are required tore-measure their deferred tax assets and liabilities to reflect the lower federal base rate of 21%. years before 2017. The Company recorded provisional estimates based on its initial analysis of the Tax Act. Given the significant complexity of the Tax Act, anticipated guidance from the U. S. Treasury about implementing the Tax Act,recognizes interest and the potential for additional guidance from the Securities and Exchange Commission or the Financial Accounting Standards Boardpenalties related to unrecognized tax benefits in income tax expense for all periods presented. The Company accrued approximately $0.2 million, $0.2 million and $0.3 million for the Tax Act, these estimates may be adjusted during 2018.payment of interest and penalties at December 31, 2021, 2020 and 2019, respectively. Goodwill and Other Intangibles The Company accounts for goodwill in a purchase business combination as the excess of the cost over the fair value of net assets acquired. Business combinations can also result in other intangible assets being recognized. Amortization of intangible assets, if applicable, occurs over their estimated useful lives. Goodwill is tested annually for impairment as of October 1, or whenever events or changes in circumstances indicate there may be a possible permanent loss of value in accordance with ASC 350, Intangibles“Intangibles - Goodwill and Other.” Goodwill is tested for impairment at the reporting unit level and is based on the net assets for each reporting unit, including goodwill and intangible assets. The Company has the option to first assess qualitative factors to determine whether the existence of events or circumstances leads to a determination that it is more likely than not that the fair value of a reporting unit is less than its carrying amount. If, after assessing the totality of events or circumstances, an entity determines it is not more likely than not that the fair value of a reporting unit is less than its carrying amount, then performing a quantitative impairment assessment is unnecessary. In assessing the qualitative factors to determine whether it is more likely than not that the fair value of a reporting unit is less than its carrying amount, we identify and assess relevant drivers of fair value and events and circumstances that may impact the fair value and the carrying amount of the reporting unit. The identification of relevant events and circumstances and how these may impact a reporting unit’s fair value or carrying amount involve significant judgments and assumptions. The judgments and assumptions include the identification of macroeconomic conditions, industry and market considerations, cost factors, overall financial performance, Company-specific events and share price trends and making the assessment on whether each relevant factor will impact the impairment test positively or negatively and the magnitude of any such impact. When performing a quantitative assessment of goodwill impairment if necessary, or in years where we elect to do so, a discounted cash flow model is used to estimate the fair value of each reporting unit, which considers forecasted cash flows discounted at an estimated weighted-average cost of capital. The forecasted cash flows are based on the Company’s long-term operating plan and the weighted-average cost of capital is an estimate of the overallafter-tax rate of return. Other valuation techniques including comparative market multiples are used when appropriate. Discount rate assumptions are based on an assessment of the risk inherent in the future cash flows of the respective reporting units. Based upon our fiscal 2017
The Company performed a qualitative analyses as of October 1, 2021 and 2016 quantitative and qualitative impairment analyses,2020 for all of its reporting units except for the Bayou reporting unit, the Companyone and concluded that it is more likely than not that the fair value of ourthe reporting units continues to exceed the respective carrying amounts. In 2017 and 2016, due primarily to the decreased demand for barge pumps for the marine transportation market driven by low oil prices and overcapacity of inland barges, the Bayou reporting unit recordedpre-taxnon-cash goodwill impairment charges of $0.9 million and $1.8 million, respectively.
The Company’s annualCompany performed a quantitative impairment analysis performed as of October 1, 20172021 for the National Pump Company (“National”) reporting unit and concluded that National Pump Company’s (“National”)National’s fair value exceeded its carrying value by approximately 7%.45% and therefore was not impaired. A sensitivity analysis was performed for the National reporting unit, assuming a hypothetical 50100 basis point decrease in the expected long-term growth rate or a hypothetical 50100 basis point increase in the weighted average cost of capital, and both scenarios independently yielded an estimated fair value for the National reporting unit slightly above carrying value. If recently depressed U.S. agricultural conditions continue for an extended time, this market’s relatedNational fails to experience growth and profitability assumptions may reduce National’s indicated fair valueor revises its long-term projections downward, it could be subject to require a potential future impairment charge.charges in the future. Goodwill relating to the National reporting unit represents 3%is $13.6 million, 3.2% of the Company’s December 31, 20172021 total assets. See Note 8,10 to the Consolidated Financial Statements, Goodwill and Other Intangible Assets. Other indefinite-lived intangible assets primarily consist of trademarks and trade names. The fair value of these assets is also tested annually for impairment as of October 1, or whenever events or changes in circumstances indicate there may be a possible permanent loss of value. The fair value of these assets is determined using a royalty relief methodology similar to that employed when the associated assets were acquired, but using updated estimates of future sales, cash flows and profitability. For 20172021 and 20162020, the fair value of all indefinite lived intangible assets exceeded the respective carrying values. Finite-lived assets are reviewed for impairment whenever events or changes in circumstances indicate the carrying amount may not be recovered through future net cash flows generated by the assets. Recoverability of assets to be held and used is measured by a comparison of the carrying amount of the assets to future net undiscounted cash flows estimated to be generated by such assets. Based upon our fiscal 2017 and 2016 quantitative and qualitative impairment analyses, except for an impairment of a customer relationship intangible asset in the Bayou reporting unit, theThe Company was not aware of any events or changes in circumstances that indicate the carrying value of its finite-lived assets may not be recoverable. In 2017, due primarily to the continued decreased demand for barge pumps for the marine transportation market driven by low oil prices and overcapacity of inland barges, Bayou recorded apre-taxnon-cash customer relationship impairment charge of $3.2 million. See Note 8,10 to the Consolidated Financial Statements, Goodwill and Other Intangible Assets. Other Matters Certain transactions with related parties areoccur in the ordinary course of business and are not considered to be material to the Company’s consolidated financial position, net income or cash flows. The Company does not have anyoff-balance sheet arrangements, financings or other relationships with unconsolidated “special purpose entities.” The Company is not a party to any long-term debt agreements, or any material capital leases or purchase obligations. | ITEM 7A. | QUANTITATIVE AND QUALITATIVE DISCLOSURES ABOUT MARKET RISK | QUANTITATIVE AND QUALITATIVE DISCLOSURES ABOUT MARKET RISK |
The Company is subject to market risk associated principally with changesfluctuations in foreign currency exchange rates. The Company’s foreign currency exchange rate risk is limited primarily to the Euro, Canadian Dollar, South African Rand and the British Pound. The Company manages its foreign exchange risk principally through invoicing customers in the same currency as is used in the market of the source of products. TheThere were no net foreign currency transaction gains (losses) for the period ending December 31, 2017, 20162021. The net foreign currency transaction gains (losses) for the periods ending December 31, 2020 and 20152019 were $850,000, $498,000,$0.3 million and $40,000,$0.1 million, respectively, and are reported within Other (expense) income, and Other expensenet on the Consolidated Statements of Income. | ITEM 8. | FINANCIAL STATEMENTS AND SUPPLEMENTARY DATA | FINANCIAL STATEMENTS AND SUPPLEMENTARY DATA |
Report of Independent Registered Public Accounting Firm To the Shareholders and the Board of Directors of The Gorman-Rupp Company Opinion on the Financial Statements We have audited the accompanying consolidated balance sheets of The Gorman-Rupp Company (the Company) as of December 31, 20172021 and 2016, and2020, the related consolidated statements of income, comprehensive income, equity and cash flows for each of the three years in the period ended December 31, 2017,2021, and the related notes (collectively referred to as the “consolidated financial statements”). In our opinion, the consolidated financial statements present fairly, in all material respects, the financial position of the Company at December 31, 20172021 and 2016,2020, and the results of its operations and its cash flows for each of the three years in the period ended December 31, 2017,2021, in conformity with U.S. generally accepted accounting principles. We also have audited, in accordance with the standards of the Public Company Accounting Oversight Board (United States) (PCAOB), the Company’sCompany's internal control over financial reporting as of December 31, 2017,2021, based on criteria established in Internal Control–Control – Integrated Framework issued by the Committee of Sponsoring Organizations of the Treadway Commission (2013 framework), and our report dated February 23, 201828, 2022 expressed an unqualified opinion thereon. Basis for Opinion These financial statements are the responsibility of the Company’sCompany's management. Our responsibility is to express an opinion on the Company’s financial statements based on our audits. We are a public accounting firm registered with the PCAOB and are required to be independent with respect to the Company in accordance with the U.S. federal securities laws and the applicable rules and regulations of the Securities and Exchange Commission and the PCAOB. We conducted our audits in accordance with the standards of the PCAOB. Those standards require that we plan and perform the audit to obtain reasonable assurance about whether the financial statements are free of material misstatement, whether due to error or fraud. Our audits included performing procedures to assess the risks of material misstatement of the financial statements, whether due to error or fraud, and performing procedures that respond to those risks. Such procedures included examining, on a test basis, evidence regarding the amounts and disclosures in the financial statements. Our audits also included evaluating the accounting principles used and significant estimates made by management, as well as evaluating the overall presentation of the financial statements. We believe that our audits provide a reasonable basis for our opinion. Critical Audit Matter The critical audit matter communicated below is a matter arising from the current period audit of the financial statements that was communicated or required to be communicated to the audit committee and that: (1) relates to accounts or disclosures that are material to the financial statements and (2) involved our especially challenging, subjective or complex judgments. The communication of the critical audit matter does not alter in any way our opinion on the consolidated financial statements, taken as a whole, and we are not, by communicating the critical audit matter below, providing a separate opinion on the critical audit matter or on the account or disclosures to which it relates.
National Pump Company Goodwill Impairment Evaluation | Description of the Matter | At December 31, 2021, the Company’s total goodwill was $27.2 million, of which, $13.6 million related to the National Pump Company reporting unit. Goodwill is assigned to the Company’s reporting units as of the acquisition date. As discussed in Note 1 and Note 10 of the consolidated financial statements, goodwill is tested for impairment at least annually on October 1 at the reporting unit level, or when events or circumstances occur that would more likely than not reduce the fair value of a reporting unit below its carrying amount. For 2021, the Company used a quantitative analysis for the annual goodwill impairment testing for its National Pump Company reporting unit. The Company uses an income and market approach in its quantitative impairment tests. National Pump Company goodwill is susceptible to impairment due to the narrow difference between its estimated fair value and carrying value. |
| Auditing the Company’s National Pump Company quantitative goodwill impairment evaluation was complex and highly judgmental due to the significant estimation required in determining the fair value of the reporting unit. In particular, the fair value estimate using the income approach was sensitive to significant assumptions such as the weighted average cost of capital, discrete revenue growth rates, terminal period revenue growth rate, and profitability assumptions. Elements of these significant assumptions are forward-looking and could be affected by future economic conditions and/or changes in consumer preferences. | | | How We Addressed the Matter in Our Audit | We obtained an understanding, evaluated the design and tested the operating effectiveness of controls over the Company’s National Pump Company reporting unit goodwill impairment review process, including controls over the significant assumptions mentioned above. | | | | To test the estimated fair value used in the Company’s National Pump Company reporting unit goodwill impairment analysis, we performed audit procedures that included, among others, assessing fair value methodologies and testing the significant assumptions discussed above and the underlying data used by the Company in its analysis. For example, we compared the significant assumptions used by management to current industry and economic trends, changes to the Company’s business model, and other relevant factors. We assessed the historical accuracy of management’s estimates. We also performed sensitivity analyses of significant assumptions, including the weighted average cost of capital and terminal period revenue growth rate, to evaluate the changes in fair value that would result from changes in the assumptions and the potential impact on the Company’s conclusion of whether or not the goodwill was impaired. In addition, we involved our valuation specialist to assist with our evaluation of the methodology used by the Company and significant assumptions, including, among others, the weighted average cost of capital. | | | | |
/s/ Ernst & Young LLP We have served as the Company’s auditor since at least 1967, but we are unable to determine the specific year. Cleveland, Ohio February 23, 2018 The Gorman-Rupp Company Consolidated Statements of Income | | | | | | | | Year Ended December 31, | | | | | Year ended December 31, | | | | (Thousands of dollars, except shares and per share amounts) | | 2017 | | | 2016 | | | 2015 | | | (Dollars in thousands, except share and per share amounts) | | | 2021 | | | 2020 | | | 2019 | | | | | Net sales | | | $379,389 | | | | $382,071 | | | | $406,150 | | | $ | 378,316 | | | $ | 348,967 | | | $ | 398,179 | | | | | Cost of products sold | | | 280,644 | | | | 290,046 | | | | 313,570 | | | | 282,419 | | | | 259,412 | | | | 295,504 | | | | | | | | | | | | | Gross profit | | | 98,745 | | | | 92,025 | | | | 92,580 | | | 95,897 | | | 89,555 | | | 102,675 | | | | | Selling, general and administrative expenses | | | 56,789 | | | | 54,528 | | | | 56,189 | | | | 56,541 | | | | 53,802 | | | | 58,835 | | | Impairment of goodwill and other intangible assets | | | 4,098 | | | | 1,800 | | | | - | | | | | | | | | | | | | | Operating income | | | 37,858 | | | | 35,697 | | | | 36,391 | | | 39,356 | | | 35,753 | | | 43,840 | | | | | Other income, net | | | 1,520 | | | | 785 | | | | 875 | | | | | | | | | | | | | | Other (expense) income, net | | | | (2,108 | ) | | | (4,507 | ) | | | 1,326 | | Income before income taxes | | | 39,378 | | | | 36,482 | | | | 37,266 | | | 37,248 | | | 31,246 | | | 45,166 | | | | | Income taxes | | | 12,823 | | | | 11,599 | | | | 12,157 | | | | 7,397 | | | | 6,058 | | | | 9,351 | | | | | | | | | | | | | Net income | | | $ 26,555 | | | | $ 24,883 | | | | $ 25,109 | | | $ | 29,851 | | | $ | 25,188 | | | $ | 35,815 | | | | | | | | | | | | | | | | Earnings per share | | | $ 1.02 | | | | $ 0.95 | | | | $ 0.96 | | | $ | 1.14 | | | $ | 0.97 | | | $ | 1.37 | | | | | | | | | | | | | | Average number of shares outstanding | | | 26,100,865 | | | | 26,087,721 | | | | 26,192,072 | | | 26,119,376 | | | 26,092,576 | | | 26,127,168 | |
See notes to consolidated financial statements. Consolidated Statements of Comprehensive Income | | | | | | | | | | | | | | | | Year Ended December 31, | | | (Thousands of dollars) | | 2017 | | | 2016 | | | 2015 | | | | | | Net income | | | $26,555 | | | | $24,883 | | | | $25,109 | | | | | | Cumulative translation adjustments | | | 3,521 | | | | 215 | | | | (4,719) | | | | | | Pension and postretirement medical liability adjustments, net of tax | | | 4,435 | | | | 1,735 | | | | (370) | | | | | | | | | | | | | | | Other comprehensive income (loss) | | | 7,956 | | | | 1,950 | | | | (5,089) | | | | | | | | | | | | | | | Comprehensive income | | | $34,511 | | | | $26,833 | | | | $20,020 | | | | | | | | | | | | | | |
See notes to consolidated financial statements.
| | | Year Ended December 31, | | (Dollars in thousands) | | 2021 | | | 2020 | | | 2019 | | | | | | | | | | | | | | | | Net income | | $ | 29,851 | | | $ | 25,188 | | | $ | 35,815 | | | | | | | | | | | | | | | | Cumulative translation adjustments | | | (2,807 | ) | | | 3,111 | | | | 88 | | | | | | | | | | | | | | | | Pension and postretirement medical liability adjustments, net of tax | | | 2,854 | | | | (4,951 | ) | | | (5,202 | ) | Other comprehensive income (loss) | | | 47 | | | | (1,840 | ) | | | (5,114 | ) | Comprehensive income | | $ | 29,898 | | | $ | 23,348 | | | $ | 30,701 | |
The Gorman-Rupp Company
Consolidated Balance Sheets
| | | | | | | | | | | | December 31, | | | (Thousands of dollars) | | 2017 | | | 2016 | | Assets | | | | | | | | | Current assets: | | | | | | | | | Cash and cash equivalents | | $ | 79,680 | | | $ | 57,604 | | Accounts receivable, net | | | 67,369 | | | | 71,424 | | Inventories, net | | | 74,967 | | | | 69,049 | | Prepaid and other | | | 5,918 | | | | 5,823 | | | | | | | | | | | Total current assets | | | 227,934 | | | | 203,900 | | Property, plant and equipment, net | | | 117,071 | | | | 122,067 | | Other assets | | | 7,779 | | | | 7,769 | | Prepaid pension assets | | | 4,313 | | | | 6,211 | | Goodwill and other intangible assets, net | | | 37,918 | | | | 42,871 | | | | | | | | | | | Total assets | | $ | 395,015 | | | $ | 382,818 | | | | | | | | | | | | | | Liabilities and equity | | | | | | | | | Current liabilities: | | | | | | | | | Accounts payable | | $ | 15,798 | | | $ | 16,306 | | Payroll and employee related liabilities | | | 12,027 | | | | 11,336 | | Commissions payable | | | 7,589 | | | | 11,163 | | Deferred revenue | | | 460 | | | | 1,361 | | Accrued expenses | | | 9,822 | | | | 9,186 | | | | | | | | | | | Total current liabilities | | | 45,696 | | | | 49,352 | | Postretirement benefits | | | 15,737 | | | | 20,709 | | Other long-term liabilities | | | 8,087 | | | | 9,869 | | | | | | | | | | | Total liabilities | | | 69,520 | | | | 79,930 | | Equity: | | | | | | | | | Common shares, without par value: | | | | | | | | | Authorized – 35,000,000 shares; | | | | | | | | | Outstanding – 26,106,623 shares at December 31, 2017 and 26,093,123 shares at December 31, 2016 (after deducting treasury shares of 942,173 and 955,673, respectively), at stated capital amounts | | | 5,100 | | | | 5,097 | | Additionalpaid-in capital | | | 526 | | | | 215 | | Retained earnings | | | 332,378 | | | | 318,041 | | Accumulated other comprehensive loss | | | (12,509) | | | | (20,465) | | | | | | | | | | | Total equity | | | 325,495 | | | | 302,888 | | | | | | | | | | | Total liabilities and equity | | $ | 395,015 | | | $ | 382,818 | | | | | | | | | | |
See notes to consolidated financial statements. The Gorman-Rupp Company Consolidated Balance Sheets | | | December 31, | | (Dollars in thousands) | | 2021 | | | 2020 | | Assets | | | | | | | | | Current assets: | | | | | | | | | Cash and cash equivalents | | $ | 125,194 | | | $ | 108,203 | | Accounts receivable, net | | | 58,545 | | | | 50,763 | | Inventories, net | | | 85,648 | | | | 82,686 | | Prepaid and other | | | 7,795 | | | | 5,169 | | Total current assets | | | 277,182 | | | | 246,821 | | Property, plant and equipment, net | | | 104,293 | | | | 108,666 | | Other assets | | | 6,193 | | | | 4,795 | | Goodwill and other intangible assets, net | | | 33,086 | | | | 34,175 | | Total assets | | $ | 420,754 | | | $ | 394,457 | | | | | | | | | | | | Liabilities and equity | | | | | | | | | Current liabilities: | | | | | | | | | Accounts payable | | $ | 17,633 | | | $ | 9,466 | | Payroll and employee related liabilities | | | 11,754 | | | | 10,825 | | Commissions payable | | | 8,164 | | | | 5,624 | | Deferred revenue and customer deposits | | | 9,200 | | | | 8,004 | | Accrued expenses | | | 5,689 | | | | 4,582 | | Total current liabilities | | | 52,440 | | | | 38,501 | | Pension benefits | | | 9,342 | | | | 9,232 | | Postretirement benefits | | | 27,359 | | | | 28,250 | | Other long-term liabilities | | | 1,637 | | | | 2,961 | | Total liabilities | | | 90,778 | | | | 78,944 | | Equity: | | | | | | | | | Common shares, without par value: | | | | | | | | | Authorized – 35,000,000 shares; | | | | | | | | | Outstanding – 26,103,661 shares at December 31, 2021 and 26,101,992 shares at December 31, 2020 (after deducting treasury shares of 945,135 and 946,804, respectively), at stated capital amounts | | | 5,099 | | | | 5,099 | | Additional paid-in capital | | | 1,838 | | | | 693 | | Retained earnings | | | 353,369 | | | | 340,098 | | Accumulated other comprehensive (loss) | | | (30,330 | ) | | | (30,377 | ) | Total equity | | | 329,976 | | | | 315,513 | | Total liabilities and equity | | $ | 420,754 | | | $ | 394,457 | |
See notes to consolidated financial statements. The Gorman-Rupp Company Consolidated Statements of Cash Flows | | | | | | | | Year Ended December 31, | | | | | Year Ended December 31, | | | | (thousands of dollars) | | 2017 | | 2016 | | 2015 | | | (Dollars in thousands) | | | 2021 | | | 2020 | | | 2019 | | Cash flows from operating activities: | | | | | | | | Net income | | $ | 26,555 | | | $ | 24,883 | | | $ | 25,109 | | | $ | 29,851 | | | $ | 25,188 | | | $ | 35,815 | | Adjustments to reconcile net income to net cash provided by operating activities: | | | | | | | | Depreciation and amortization | | 15,053 | | | 15,529 | | | 15,282 | | | 11,914 | | | 12,692 | | | 13,749 | | Pension expense | | 6,368 | | | 3,431 | | | 7,657 | | | 4,989 | | | 7,489 | | | 2,823 | | Contributions to pension plan | | (2,000) | | | (16,000) | | | (4,000) | | | (2,000 | ) | | (2,000 | ) | | 0 | | Deferred income tax (benefit) charge | | (6,140) | | | 3,511 | | | (563) | | | Gain on sale of property, plant and equipment | | 153 | | | (607) | | | (88) | | | Impairment of goodwill and other intangible assets | | 4,098 | | | 1,800 | | | | - | | | Deferred income tax charge (benefit) | | | 50 | | | 544 | | | (1,198 | ) | Stock based compensation | | | 2,396 | | | 42 | | | 1,025 | | Other | | | (103 | ) | | 11 | | | (53 | ) | Changes in operating assets and liabilities, net of effects of acquisitions: | | | | | | | | Accounts receivable, net | | 5,473 | | | 5,273 | | | (4,750) | | | (8,702 | ) | | 15,247 | | | 2,218 | | Inventories, net | | (4,305) | | | 13,904 | | | 12,576 | | | (4,290 | ) | | (5,310 | ) | | 11,452 | | Accounts payable | | (1,268) | | | 1,393 | | | (4,123) | | | 8,717 | | | (6,845 | ) | | (601 | ) | Commissions payable | | (3,849) | | | 3,300 | | | (1,498) | | | 2,718 | | | (1,565 | ) | | (2,140 | ) | Deferred revenue | | (902) | | | (380) | | | (2,425) | | | Deferred revenue and customer deposits | | | 1,351 | | | 2,953 | | | (321 | ) | Accrued expenses and other | | 3,958 | | | (7,996) | | | (2,436) | | | (1,631 | ) | | 5,162 | | | 102 | | Income taxes | | 7,950 | | | 64 | | | 815 | | | | 178 | | | | (2,446 | ) | | | (697 | ) | Benefit obligations | | (7,879) | | | 5,329 | | | (873) | | | | | | | | | | | | | | Net cash provided by operating activities | | 43,265 | | | 53,434 | | | 40,683 | | | 45,438 | | | 51,162 | | | 62,174 | | Cash flows from investing activities: | | | | | | | | Capital additions | | (7,754) | | | (6,877) | | | (8,260) | | | (9,751 | ) | | (7,999 | ) | | (10,912 | ) | Proceeds from sale of property, plant and equipment | | 320 | | | 1,379 | | | 466 | | | Purchase of short-term investments, net | | (2,976) | | | | - | | | | - | | | (4 | ) | | (4 | ) | | (4 | ) | Payments for acquisitions, net of cash acquired | | | - | | | (2,968) | | | (3,386) | | | | | | | | | | | | | | Other | | | | 586 | | | | 299 | | | | 69 | | Net cash used for investing activities | | (10,410) | | | (8,466) | | | (11,180) | | | (9,169 | ) | | (7,704 | ) | | (10,847 | ) | Cash flows from financing activities: | | | | | | | | Cash dividends | | (12,268) | | | (11,218) | | | (10,599) | | | Treasury shares repurchased | | | - | | | | - | | | (4,579) | | | Proceeds from bank borrowings | | | - | | | | - | | | | - | | | Payments to banks for borrowings | | | - | | | | - | | | (13,912) | | | | | | | | | | | | | | Regular cash dividends | | | (16,586 | ) | | (15,394 | ) | | (14,370 | ) | Treasury share repurchases | | | (1,245 | ) | | (361 | ) | | (2,610 | ) | Other | | | | (722 | ) | | | (381 | ) | | | (383 | ) | Net cash used for financing activities | | (12,268) | | | (11,218) | | | (29,090) | | | (18,553 | ) | | (16,136 | ) | | (17,363 | ) | Effect of exchange rate changes on cash | | 1,489 | | | 130 | | | (1,180) | | | | (725 | ) | | | 326 | | | | 133 | | | | | | | | | | | | | Net increase (decrease) in cash and cash equivalents | | 22,076 | | | 33,880 | | | (767) | | | 16,991 | | | 27,648 | | | 34,097 | | Cash and cash equivalents: | | | | | | | | Beginning of year | | 57,604 | | | 23,724 | | | 24,491 | | | | 108,203 | | | | 80,555 | | | | 46,458 | | | | | | | | | | | | | End of period | | $ | 79,680 | | | $ | 57,604 | | | $ | 23,724 | | | $ | 125,194 | | | $ | 108,203 | | | $ | 80,555 | | | | | | | | | | | | |
See notes to consolidated financial statements. The Gorman-Rupp Company Consolidated Statements of Equity | | | | | | | | | | | | | | | | | | | | | | | | | (Thousands of dollars, except
share and per share amounts) | | Common Shares | | | Additional
Paid-In
Capital | | | Retained
Earnings | | | Accumulated
Other
Comprehensive
(Loss) Income | | | Total | | | | Shares | | | Dollars | | | | | | | | | | | | | Balances December 31, 2014 | | | 26,260,543 | | | $ | 5,133 | | | $ | 3,059 | | | $ | 291,101 | | | $ | (17,326) | | | $ | 281,967 | | | | | | | | | Net income | | | | | | | | | | | | | | | 25,109 | | | | | | | | 25,109 | | | | | | | | | Other comprehensive loss | | | | | | | | | | | | | | | | | | | (5,089) | | | | (5,089) | | | | | | | | | Issuance of treasury shares | | | 7,500 | | | | 2 | | | | 184 | | | | 26 | | | | | | | | 212 | | | | | | | | | | Treasury shares repurchased | | | (184,420) | | | | (40) | | | | (3,243) | | | | (1,296) | | | | | | | | (4,579) | | | | | | | | | | Cash dividends – $0.405 per share | | | | | | | | | | | | | | | (10,599) | | | | | | | | (10,599) | | | | | | | | | | | | | | | | | | | | | | | | | | | | | | | | | | | Balances December 31, 2015 | | | 26,083,623 | | | | 5,095 | | | | - | | | | 304,341 | | | | (22,415) | | | | 287,021 | | | | | | | | | Net income | | | | | | | | | | | | | | | 24,883 | | | | | | | | 24,883 | | | | | | | | | Other comprehensive income | | | | | | | | | | | | | | | | | | | 1,950 | | | | 1,950 | | | | | | | | | Issuance of treasury shares | | | 9,500 | | | | 2 | | | | 215 | | | | 35 | | | | | | | | 252 | | | | | | | | | | Cash dividends – $0.430 per share | | | | | | | | | | | | | | | (11,218) | | | | | | | | (11,218) | | | | | | | | | | | | | | | | | | | | | | | | | | | | | | | | | | Balances December 31, 2016 | | | 26,093,123 | | | | 5,097 | | | | 215 | | | | 318,041 | | | | (20,465) | | | | 302,888 | | | | | | | | | Net income | | | | | | | | | | | | | | | 26,555 | | | | | | | | 26,555 | | | | | | | | | Other comprehensive income | | | | | | | | | | | | | | | | | | | 7,956 | | | | 7,956 | | | | | | | | | Issuance of treasury shares | | | 13,500 | | | | 3 | | | | 311 | | | | 50 | | | | | | | | 364 | | | | | | | | | | Cash dividends – $0.470 per share | | | | | | | | | | | | | | | (12,268) | | | | | | | | (12,268) | | | | | | | | | | | | | | | | | | | | | | | | | | | | | | | | | | Balances December 31, 2017 | | | 26,106,623 | | | $ | 5,100 | | | $ | 526 | | | $ | 332,378 | | | $ | (12,509) | | | $ | 325,495 | | | | | | | | | | | | | | | | | | | | | | | | | | |
| | | Common Shares | | | Additional Paid-In | | | Retained | | | Accumulated Other Comprehensive | | | | | (Dollars in thousands, except share and per share amounts) | | Shares | | | Dollars | | | Capital | | | Earnings | | | (Loss) Income | | | Total | | | | | | | | | | | | | | | | | | | | | | | | | | | | Balances December 31, 2018 | | | 26,117,045 | | | | 5,102 | | | | 2,539 | | | | 308,914 | | | | (23,423 | ) | | | 293,132 | | | | | | | | | | | | | | | | | | | | | | | | | | | | Net income | | | | | | | | | | | | | | | 35,815 | | | | | | | | 35,815 | | | | | | | | | | | | | | | | | | | | | | | | | | | | Other comprehensive loss | | | | | | | | | | | | | | | | | | | (5,114 | ) | | | (5,114 | ) | | | | | | | | | | | | | | | | | | | | | | | | | | | Stock based compensation, net | | | 19,836 | | | | 4 | | | | 948 | | | | 73 | | | | | | | | 1,025 | | | | | | | | | | | | | | | | | | | | | | | | | | | | Treasury share repurchases | | | (69,379 | ) | | | (15 | ) | | | (2,340 | ) | | | (255 | ) | | | | | | | (2,610 | ) | | | | | | | | | | | | | | | | | | | | | | | | | | | Cash dividends - $0.55 per share | | | | | | | | | | | | | | | (14,370 | ) | | | | | | | (14,370 | ) | | | | | | | | | | | | | | | | | | | | | | | | | | | Balances December 31, 2019 | | | 26,067,502 | | | | 5,091 | | | | 1,147 | | | | 330,177 | | | | (28,537 | ) | | | 307,878 | | | | | | | | | | | | | | | | | | | | | | | | | | | | Net income | | | | | | | | | | | | | | | 25,188 | | | | | | | | 25,188 | | | | | | | | | | | | | | | | | | | | | | | | | | | | Other comprehensive loss | | | | | | | | | | | | | | | | | | | (1,840 | ) | | | (1,840 | ) | | | | | | | | | | | | | | | | | | | | | | | | | | | Stock based compensation, net | | | 45,338 | | | | 10 | | | | (135 | ) | | | 167 | | | | | | | | 42 | | | | | | | | | | | | | | | | | | | | | | | | | | | | Treasury share repurchases | | | (10,848 | ) | | | (2 | ) | | | (319 | ) | | | (40 | ) | | | | | | | (361 | ) | | | | | | | | | | | | | | | | | | | | | | | | | | | Cash dividends - $0.59 per share | | | | | | | | | | | | | | | (15,394 | ) | | | | | | | (15,394 | ) | | | | | | | | | | | | | | | | | | | | | | | | | | | Balances December 31, 2020 | | | 26,101,992 | | | | 5,099 | | | | 693 | | | | 340,098 | | | | (30,377 | ) | | | 315,513 | | | | | | | | | | | | | | | | | | | | | | | | | | | | Net income | | | | | | | | | | | | | | | 29,851 | | | | | | | | 29,851 | | | | | | | | | | | | | | | | | | | | | | | | | | | | Other comprehensive income | | | | | | | | | | | | | | | | | | | 47 | | | | 47 | | | | | | | | | | | | | | | | | | | | | | | | | | | | Stock based compensation, net | | | 31,707 | | | | 7 | | | | 2,273 | | | | 116 | | | | | | | | 2,396 | | | | | | | | | | | | | | | | | | | | | | | | | | | | Treasury share repurchases | | | (30,038 | ) | | | (7 | ) | | | (1,128 | ) | | | (110 | ) | | | | | | | (1,245 | ) | | | | | | | | | | | | | | | | | | | | | | | | | | | Cash dividends - $0.64 per share | | | | | | | | | | | | | | | (16,586 | ) | | | | | | | (16,586 | ) | | | | | | | | | | | | | | | | | | | | | | | | | | | Balances December 31, 2021 | | | 26,103,661 | | | $ | 5,099 | | | $ | 1,838 | | | $ | 353,369 | | | $ | (30,330 | ) | | $ | 329,976 | |
See notes to consolidated financial statements. The Gorman-Rupp Company Notes to Consolidated Financial Statements (Amounts in tables in thousands of dollars) Note 1– Summary of Significant Accounting Policies General Information and Basis of Presentation The Gorman-Rupp Company is a leading designer, manufacturer and international marketer of pumps and pump systems for use in diverse water, wastewater, construction, dewatering, industrial, petroleum, original equipment, agriculture, fire protection, heating, ventilating and air conditioning (HVAC), military and other liquid-handling applications. The consolidated financial statementsConsolidated Financial Statements have been prepared in accordance with U.S. generally accepted accounting principles and include the accounts of the Company and its wholly-owned subsidiaries. All significant intercompany transactions and balances have been eliminated. Earnings per share are calculated based on the weighted-average number of Common Sharescommon shares outstanding. COVID-19Impact In March 2020, the World Health Organization categorized the coronavirus disease (“COVID-19”) as a pandemic. While the near-term effects of the pandemic have negatively impacted our financial results, uncertainty over the economic and operational impacts of COVID-19 means the ultimate related financial impact cannot be reasonably estimated at this time. The Company’s Consolidated Financial Statements presented herein reflect estimates and assumptions made by management that affect the reported amounts of assets and liabilities and reported amounts of revenue and expenses during the reporting periods presented. Such estimates and assumptions affect, among other things, the Company’s goodwill, long-lived asset and indefinite-lived intangible asset valuation; inventory valuation; the allowance for doubtful accounts; and pension plan assumptions. The Company is not aware of any specific event or circumstance that would require an update to its estimates or judgments or a revision of the carrying value of its assets or liabilities as of December 31, 2021, the date of issuance of this Annual Report on Form 10-K. These estimates may change as new events occur and additional information is obtained. Use of Estimates The preparation of financial statements in conformity with generally accepted accounting principles requires management to make estimates and assumptions that affect the amounts reported in the Consolidated Financial Statements and accompanying notes. Actual results could differ from those estimates. Cash Equivalents and Short-Term Investments The Company considers highly liquid instruments with maturities of 90 days or less to be cash equivalents. The Company periodically makes short-term investments for which cost approximates fair value. Short-term investments at December 31, 20172021 and 2016 consist2020 consisted primarily of certificatesa certificate of deposit and treasury bonds and areis classified as prepaidPrepaid and other on the Consolidated Balance Sheets. Accounts Receivable and Allowance for Doubtful Accounts Accounts receivable are stated at the historical carrying amount net of allowance for doubtful accounts. The Company maintains an allowance for doubtful accounts for estimatedexpected losses from the failure of its customers to make required payments for products delivered. The Company estimates this allowance based on knowledge of the financial condition of customers, review of historical receivables and reserve trends, current economic conditions in the company’s major markets and geographies, and other relevant information.
Inventories Inventories
LIFO inventories are stated at the lower of cost or market.market and all other inventories are stated at the lower of cost or net realizable value. The costs for approximately 72% and 71% of inventories at December 31, 20172021 and December 31, 20162020, respectively, were determined using thelast-in,first-outfirst-out (LIFO) method, with the remainder determined using thefirst-in,first-outfirst-in, first-out (FIFO) method. Cost components include materials, inbound freight costs, labor and allocations of fixed and variable overheads on an absorption costing basis. Property, plant and equipment Property, plant and equipment are stated on the basis of cost. Repairs and maintenance costs are expensed as incurred. Depreciation for property, plant and equipment assets is computed using the straight-line method over the estimated useful lives of the assets and is included in costCost of products sold and selling,Selling, general and administrative expenses based on the use of the assets. Depreciation expense was $13.5$11.2 million, $11.4 million, and $12.6 million for 20172021,2020, and $13.8 million for each of the years 2016 and 2015.2019, respectively. Depreciation of property, plant and equipment is determined based on the following lives: | | | | | Buildings| | years | Buildings | 20 | - | 50 | Machinery and equipment | 5 | - | 15 | Software | 3 | - | 5 |
| | | 20-50 years | | Machinery and equipment
| | | 5-15 years | | Software
| | | 3-5 years | |
Property, plant and equipment consist of the following: | | | | 2017 | | | 2016 | | | 2021 | | | 2020 | | Land | | $ | 4,187 | | | $ | 4,099 | | | $ | 5,813 | | | $ | 5,805 | | Buildings | | | 106,437 | | | | 104,952 | | | 112,760 | | | 111,876 | | Machinery and equipment | | | 170,615 | | | | 165,157 | | | | 188,123 | | | | 184,362 | | | | | | | | | | 306,696 | | | 302,043 | | | | | 281,239 | | | | 274,208 | | | Less accumulated depreciation | | | (164,168) | | | | (152,141) | | | | (202,403 | ) | | | (193,377 | ) | | | | | | | | | Property, plant and equipment, net | | $ | 117,071 | | | $ | 122,067 | | | $ | 104,293 | | | $ | 108,666 | | | | | | | | | |
Property, plant and equipment are evaluated for impairment whenever events or changes in circumstances indicate the carrying amount may not be recovered through future net cash flows generated by the assets. Impairment losses may be recorded when the undiscounted cash flows estimated to be generated by those assets are less than the assets’ carrying amounts based on the excess of the carrying amounts over the estimated fair value of the assets. The Company was not aware of any events or changes in circumstances that indicated the carrying value of its property, plant and equipment may not be recoverable. Goodwill and Identifiable Intangible Assets Goodwill Goodwill represents the excess of the cost of acquired businesses over the fair value of tangible assets and identifiable intangible assets purchased and liabilities assumed. Goodwill is reviewed annually for impairment as of October 1 or whenever events or changes in circumstances indicate there may be a possible permanent loss of value using either a quantitative or qualitative analysis. TheFor certain reporting units, the Company usesperforms a quantitative analysis using both a market-based approach and a discounted cash flow model to estimate the fair value of our reporting units and performs a quantitative analysis using a discounted cash flow model and other valuation techniques.units. This process requires significant judgements, including estimation of future cash flows, which is dependent on internal forecasts. The Company may otherwise elect to perform a qualitative analysis when deemed appropriate. A qualitative analysis may be performed by assessing certain trends and factors, including projected market outlook and growth rates, forecasted and actual sales and operating profit margins, discount rates, industry data and other relevant qualitative factors. These trends and factors are compared to, and based on, the assumptions used in the most recent quantitative assessment. In 2017 and 2016, due primarily to the decreased demand for barge pumps for the marine transportation market driven by low oil prices and overcapacity of inland barges, the Bayou City Pump Company reporting unit recordedpre-tax goodwill
NaN impairment charges of $0.9 million and $1.8 million, respectively. There were no goodwill impairment chargesrecognized in any of the Company’s other reporting units in 20172021,2020, or 2016 and no impairment charges were recognized across all reporting units in 2015.2019. See Note 8,10 to the Consolidated Financial Statements, Goodwill and Other Intangible Assets.
Identifiable intangible assets The Company’s primary identifiable intangible assets include customer relationships, technology and drawings, and trade names and trademarks. Identifiable intangible assets with finite lives are amortized and those identifiable intangible assets with indefinite lives are not amortized. Amortization for finite-lived intangible assets is computed using the straight-line method over the estimated useful lives of the assets and is included in costCost of products sold and selling,Selling, general and administrative expenses based on the use of the assets. Amortization of finite-lived intangible assets is determined based on the following lives: | | | | | Technology and drawings| | years | Technology and drawings | 13 | - | 20 | Customer relationships | 9 | - | 15 | Other intangibles | 2 | - | 18 |
| | | 13-20 years | | Customer relationships
| | | 9-15 years | | Other intangibles
| | | 2-18 years | |
Identifiable intangible assets that are subject to amortization are evaluated for impairment whenever events or changes in circumstances indicate the carrying amount may not be recovered through future net cash flows generated by the assets. Impairment losses may be recorded when the undiscounted cash flows estimated to be generated by those assets are less than the assets’ carrying amounts based on the excess of the carrying amounts over the estimated fair value of the assets. Based upon our fiscal 2017 and 2016 quantitative and qualitative impairment analyses, except for Bayou’s customer relationship intangible asset and the risk related to National’s indicated fair value, theThe Company was not aware of any events or changes in circumstances that indicateindicated the carrying value of its finite-lived intangible assets may not be recoverable. In 2017, due primarily to the continued decreased demand for barge pumps for the marine transportation market driven by low oil prices and overcapacity of inland barges, the Company performed a recoverability test related to Bayou’s customer relationship intangible asset pursuant to ASC 360. As a result of the recoverability test, Bayou recorded apre-taxnon-cash customer relationship impairment charge of $3.2 million. Identifiable intangible assets not subject to amortization are tested for impairment annually or more frequently if events warrant. The fair value of these assets is determined using a royalty relief methodology similar to that employed when the associated assets were acquired, but using updated estimates of future sales, cash flows and profitability. For 20172021,2020 and 2016,2019, the fair value of indefinite lived intangible assets exceeded their carrying value.values. For additional information about goodwill and other intangible assets, see Note 8,10 to the Consolidated Financial Statements, Goodwill and Other Intangible Assets, and Note 10, Acquisitions.Assets. Revenue Recognition The Company recognizes revenue when it transfers control of promised goods or services to its customers in an amount that reflects the consideration to which it expects to be entitled to in exchange for those goods or services. Performance Obligations A performance obligation is a promise in a contract to transfer a distinct product or service to a customer, and is the unit of account in ASC 606. The transaction price for a customer contract is allocated to each distinct performance obligation and recognized as revenue when, or as, the Company’s revenues fromperformance obligation is satisfied. For product sales, other than long-term construction-type contracts, the Company recognizes revenue once control has passed at a point in time, which is generally when products are shipped. Payments received for product sales typically occur following delivery and the satisfaction of the performance obligation based upon the terms outlined in the contracts. Substantially all of our customer contracts are fixed-price contracts and the majority of our customer contracts have a single performance obligation, as the promise to transfer the individual products or services is not separately identifiable from other promises in the contract. For customer contracts with multiple performance obligations, the Company allocates revenue to each performance obligation based on its relative standalone selling price, which is generally determined based on standalone selling prices charged to customers or using expected cost plus margin. All of the Company's performance obligations, and associated revenue, are generally transferred to customers at a point in time, with the exception of certain highly customized pump products, which are transferred to the customer over time.
The Company offers standard warranties for its products to ensure that its products comply with agreed-upon specifications in its contracts. For standard warranties, these do not give rise to performance obligations and represent assurance-type warranties. Shipping and handling activities related to products sold to customers, whether performed before or after the customer obtains control of the products, are generally accounted for as activities to fulfill the promise to transfer the products and not as a separate performance obligation. Contract Estimates Accounting for long-term contracts involves the use of various techniques to estimate total contract revenue and costs. For long-term contracts, the Company estimates the profit on a contract as the difference between the total estimated revenue and expected costs to complete a contract and recognizes that profit as performance obligations are satisfied. Contract estimates are based on various assumptions to project the outcome of future events that could span longer than one year. These assumptions include labor productivity and availability, the complexity of the work to be performed, the cost and availability of materials, and the performance of subcontractors as applicable. As a significant change in one or more of these estimates could affect the profitability of our contracts, the Company reviews and updates its contract-related estimates regularly. Adjustments in estimated profit on contracts are accounted for under the cumulative catch-up method. Under this method, the impact of the adjustment on profit recorded to date on a contract is recognized in the period the adjustment is identified. Revenue and profit in future periods of contract performance are recognized when allusing the adjusted estimate. Contract Balances The timing of revenue recognition, billings and cash collections results in billed accounts receivable, unbilled receivables (contract assets), and customer advances and deposits (contract liabilities) on the following criteriaConsolidated Balance Sheets. For certain highly customized pump products, revenue is recognized over time before the customer is invoiced, resulting in contract assets. Sometimes the Company receives advances or deposits from its customers before revenue is recognized, resulting in contract liabilities. These contract assets and liabilities are met: persuasive evidencereported on the Consolidated Balance Sheets as a component of Other assets and Deferred revenue and customer deposits, respectively, on a sale arrangement exists,contract-by-contract basis at the price is fixed or determinable, product delivery has occurred or services have been rendered, there are no further obligations to customers and collectability is probable. Product delivery occurs when the risks and rewardsend of ownership and title pass, which normally occurs upon shipment to the customer.each reporting period. Income Taxes Income tax expense includes United States federal, state, local and international income taxes. Deferred tax assets and liabilities are recognized for the tax consequences of temporary differences between the financial reporting and the tax basis of existing assets and liabilities and for loss carryforwards. The tax rate used to determine the deferred tax assets and liabilities is the enacted tax rate for the year and manner in which the differences are expected to reverse. Valuation allowances are recorded to reduce deferred tax assets to the amount that will more likely than not be realized. On December 22, 2017,
The Company accounts for the U.S. Tax Cuts and Jobs Act (the “Tax Act”global intangible low-taxed income (“GILTI”) was enacted. The Tax Act significantly revises U.S. corporate income tax regulations by, among other things, lowering corporate income tax rates, implementingin the territorial tax system and imposing a repatriation tax on deemed repatriated earnings of foreign subsidiaries. For further discussion of the currently estimated impact of the Tax Act on the Company, see the disclosure under the heading Outlook within Item 7 of Part II of this Form10-K and Note 6 to the Consolidated Financial Statements, Income Taxes.period in which it is incurred. Pension and Other Postretirement Benefits The Company sponsors a defined benefit pension plan covering certain domestic employees. Additionally, the Company sponsors defined contribution pension plans made available to all domestic and Canadian employees. The Company also sponsors anon-contributory defined benefit postretirement health care plan that provides health benefits to certain domestic and Canadian retirees and their spouses. The Company funds the cost of these benefits as incurred.
The determination of the Company’s obligation and expense for pension and other postretirement benefits is dependent on its selection of certain assumptions used by actuaries in calculating such amounts, which are described in Note 7,9, Pensions and Other Postretirement Benefits. The Company recognizes the funded status of its defined benefit pension plan as an asset or liability in the Consolidated Balance Sheets and recognizes the change in the funded status in the year in which the change occurs through accumulated other comprehensive loss in the Consolidated Balance Sheets. Concentration of Credit Risk The Company generally does not require collateral from its customers and has a very good collection history. There were no0 sales to a single customer that exceeded 10% of total net sales for the years ended December 31, 2017, 20162021,2020 or 2015.2019. Shipping and Handling Costs The Company classifies all amounts billed to customers for shipping and handling as revenue and reflects related shipping and handling costs in costCost of products sold. Advertising The Company expenses all advertising costs as incurred, which for the years ended December 31, 2017, 20162021,2020 and 20152019 totaled $3.1$1.9 million, $2.8$2.1 million, and $3.2$3.0 million, respectively. Product Warranties A liability is established for estimated future warranty and service claims based on historical claims experience and specific product failures. The Company expenses warranty costs directly to costCost of products sold. Changes in the Company’s product warranty liability are: | | | | 2017 | | | 2016 | | | 2015 | | | 2021 | | | 2020 | | | 2019 | | Balance at beginning of year | | $ | 1,435 | | | $ | 1,380 | | | $ | 1,166 | | | $ | 1,361 | | | $ | 1,438 | | | $ | 1,380 | | Provision | | | 1,377 | | | | 1,991 | | | | 1,732 | | | 1,813 | | | 1,350 | | | 1,747 | | Claims | | | (1,714) | | | | (1,936) | | | | (1,518) | | | | (1,537 | ) | | | (1,427 | ) | | | (1,689 | ) | | | | | | | | | | | | Balance at end of year | | $ | 1,098 | | | $ | 1,435 | | | $ | 1,380 | | | $ | 1,637 | | | $ | 1,361 | | | $ | 1,438 | | | | | | | | | | | | |
Stock-based compensation The Company grants performance-basedawards shares pursuant to The Gorman-Rupp Company 2015 Omnibus Incentive Plan. Performance-basedEquity awards are typically conditioned upon achievement of appropriate performance metrics, however the Company may grant other types of awards including service-based awards or unrestricted shares to certain employees. Any performance-based shares that have been granted will vest and arebe awarded at the end of a two or three year-year performance period, based on the levels of achievement of compound annual growth targets for operating income and shareholders’ equity. The Company recognizes compensation expense for performance-based share grants based on the stock price at the date of the grant using the straight-line amortization method, over the vesting period specified in the grants.grants, based on the probability of achieving the performance targets. The companyCompany recognized stock-based compensation expense of $0.4$2.0 million for the year ended December 31, 2017. No2021, a stock based compensation benefit of $0.3 million for the year ended December 31, 2020, and $0.7 million of stock-based compensation expense was recorded for the yearsyear ended December 31, 2016 or 2015.
Foreign Currency Translation Assets and liabilities of the Company’s operations outside the United States which are accounted for in a functional currency other than U.S. dollars are translated into U.S. dollars usingyear-end exchange rates. Revenues and expenses are translated at weighted-average exchange rates effective during the year. Foreign currency translation gains and losses are included as a component of accumulatedAccumulated other comprehensive loss within equity.Equity. Gains and losses resulting from foreign currency transactions, the amounts of which are not material, are included in otherOther (expense) income, and other expense.net. Fair Value The carrying value of cashCash and cash equivalents, accountsAccounts receivable accountsand Accounts payable and short-term debt approximates fair value based on the short-term nature of these instruments. The Company does not recognize anynon-financial assets at fair value. Use of Estimates
The preparation of financial statements in conformity with generally accepted accounting principles requires management to make estimates and assumptions that affect the amounts reported in the consolidated financial statements and accompanying notes. Actual results could differ from those estimates.
New Accounting Pronouncements The Company considers the applicability and impact of all ASUs.Accounting Standard Updates (“ASUs”). ASUs not listed below were assessed and determined either to be not applicable or are expected to have minimal impact on the Company’s consolidated financial statements.Consolidated Financial Statements. Recently Adopted Accounting Standards In March 2017, December 2019, the FASB issued ASUNo. 2017-07, “Compensation – Retirement Benefits (Topic 715) – Improving2019-12, “Simplifying the PresentationAccounting for Income Taxes”, which, as part of Net Periodic Pension Costits Simplification Initiative to reduce the cost and Net Periodic Postretirement Benefit Cost,” which provides additional guidance oncomplexity in accounting for income taxes, removes certain exceptions related to the presentationapproach for intra-period tax allocation, the methodology for calculating income taxes in an interim period and the recognition of net periodic pension and postretirement benefit costs in the income statement and on the components eligibledeferred tax liabilities for capitalization. The amendments in thisoutside basis differences. ASU require that an employer report the service cost component2019-12 also amends other aspects of the net periodic benefit costs in the same income statement line item as other compensation costs arising from services rendered by employees during the period. Thenon-service-cost componentsguidance to help simplify and promote consistent application of net periodic benefit costs are to be presented in the income statement separately from the service cost components and outside a subtotal of income from operations. The ASU also allows for the capitalization of the service cost components, when applicable (i.e., as a cost of internally manufactured inventory or a self-constructed asset). The ASU is effective for fiscal years, and interim periods within those years, beginning after December 15, 2017 and early adoption is permitted. The amendments in this ASU are to be applied retrospectively. The adoption of ASU2017-07 will result in a change within operating income with a corresponding change in other income (expense), net to reflect the impact of presenting all components of net benefit cost, except for service cost, outside of operating income. See Note 6 for the components of the Company’s net benefit costs. The Company will adopt ASU2017-07 in the first quarter of 2018 and does not expect the adoption to have a material impact on its consolidated financial statements. In January 2017, the FASB issued ASUNo. 2017-04, “Intangibles – Goodwill and Other (Topic 350) – Simplifying the Test for Goodwill Impairment,” which eliminates the requirement to calculate the implied fair value of goodwill to measure a goodwill impairment charge. Instead, entities will record an impairment charge based on the excess of a reporting unit’s carrying amount over its fair value. The ASU is effective for impairment tests performed in fiscal years, and interim periods within those years, beginning after December 15, 2019 and early adoption is permitted. The amendments in this ASU are to be applied on a prospective basis. The Company
early adopted this new guidance during the three months ended September 30, 2017. The Company concluded that ASU2017-04 is preferable to the current guidance due to efficiency, since ASU2017-04 eliminates the requirement to determine the fair value of individual assets and liabilities of a reporting unit to measure goodwill impairment. See Note 8 – Impairment Charges for additional information on our interim goodwill and other intangible asset impairment tests performed.
In February 2016, the FASB issued ASU2016-02, “Leases (Topic 842),” which requires lessees to recognize assets and liabilities on the balance sheet for the rights and obligations created by all leases with a term of more than one year. Accounting by lessors will remain similar to existing U.S. GAAP. The guidance is effective for fiscal years,interim and interimannual periods within those years, beginning after December 15, 2018 and2020, with early adoption is permitted. The Company currently does not expect the adoption ofadopted ASU2016-02 will have a2019-12 effective January 1, 2021 with no material impact on its consolidated financial statements as its future minimum lease commitments are not material.
In May 2014, the FASB issued ASU2014-09, “Revenue from Contracts with Customers (Topic 606),” which supersedes most current revenue recognition guidance, including industry-specific guidance, and requires entities to recognize revenue in a way that depicts the transfer of promised goods or services to customers in an amount that reflects the consideration to which the entity expects to be entitled to in exchange for those goods or services. Subsequent accounting standards updates have been issued, which amend and/or clarify the application of ASU2014-09. Based on the Company’s evaluation of its current revenue streams and contracts, it expects that most will be recorded consistently under both the current and new standard. The Company adopted the new revenue guidance effective January 1, 2018 pursuant to the modified retrospective method. Any adjustment to the opening balance of retained earnings is not expected to be material.Consolidated Financial Statements.
Note 2– Allowance for Doubtful Accounts The allowance for doubtful accounts was $0.7 million and $1.0$0.2 million at December 31,2021 and $0.4 million at December 31, 20172020. Note 3– Revenue Disaggregation of Revenue The following tables disaggregate total net sales by major product category and 2016, respectively.geographic location: Product Category | | | | | 2021 | | | 2020 | | | 2019 | | Pumps and pump systems | | $ | 321,263 | | | $ | 300,906 | | | $ | 341,304 | | Repair parts for pumps and pump systems and other | | | 57,053 | | | | 48,061 | | | | 56,875 | | Total net sales | | $ | 378,316 | | | $ | 348,967 | | | $ | 398,179 | | | | | | | | | | | | | | | | | | | | | | | | | | | | | | Geographic Location | | | | | 2021 | | | 2020 | | | 2019 | | United States | | $ | 260,683 | | | $ | 246,913 | | | $ | 275,290 | | Foreign countries | | | 117,633 | | | | 102,054 | | | | 122,889 | | Total net sales | | $ | 378,316 | | | $ | 348,967 | | | $ | 398,179 | |
International sales represented approximately 31% of total net sales for 2021, 29% for 2020 and 31% for 2019, and were made to customers in many different countries around the world.
On December 31, 2021, the Company had $186.0 million of remaining performance obligations, also referred to as backlog. The Company expects to recognize as revenue substantially all of its remaining performance obligations within one year. The Company’s contract assets and liabilities as of December 31, 2021 and 2020 were as follows: | | | December 31, 2021 | | | December 31, 2020 | | Contract assets | | $ | 0 | | | $ | 0 | | Contract liabilities | | | 9,200 | | | | 8,004 | |
Revenue recognized for the year ended December 31, 2021 that was included in the contract liability balance at December 31, 2020 was $7.4 million. Revenue recognized for the year ended December 31, 2020 that was included in the contract liability balance at December 31, 2019 was $4.5 million. Note 3 4– Inventories Inventories
LIFO inventories are stated at the lower of cost or market.market and all other inventories are stated at the lower of cost or net realizable value. Replacement cost approximates current cost and the excess over LIFO cost is approximately $59.7$70.1 million and $58.4$63.5 million at December 31, 20172021 and 2016,2020, respectively. Some inventory quantities were reduced during 2017, resulting in liquidation of some LIFO quantities carried at lower costs from earlier years versus current year costs. The related effect increased net income by approximately $0.5 million. Allowances for excess and obsolete inventory totaled $4.9 million and $4.5$6.0 million at December 31,2021 and $5.9 million at December 31, 2017 and 2016, respectively.2020. | | | | | | | | | | | | 2017 | | | 2016 | | | Inventories, net | | | | | | | | | Raw materials andin-process | | | $17,528 | | | | $17,986 | | Finished parts | | | 48,247 | | | | 43,423 | | Finished products | | | 9,192 | | | | 7,640 | | | | | | | | | | | Total net inventories | | | $74,967 | | | | $69,049 | | | | | | | | | | |
Inventories are comprised of the following: Inventories, net | | December 31, 2021 | | | December 31, 2020 | | Raw materials and in-process | | $ | 23,263 | | | $ | 18,152 | | Finished parts | | | 52,039 | | | | 51,701 | | Finished products | | | 10,346 | | | | 12,833 | | Total net inventories | | $ | 85,648 | | | $ | 82,686 | |
Note 4 5– Financing Arrangements Credit Facilities The Company may borrow up to $20.0 million with interest at LIBOR plus 0.75% or at alternative rates as selected by the CompanyAdjusted Term SOFR Rate under an unsecured bank line of credit which matures in February 2020. 2024. The Company pays anon-usage fee of 0.1% per annum on the average unused portion of the line of credit. At December 31, 20172021 and 2016, $18.32020, $19.9 million and $20.0 million, respectively, was available for borrowing after deducting $1.7$0.1 million and an immaterial amount in outstanding letters of credit, respectively. The Company also has an $8.0a $6.5 million unsecured bank line of credit with interest at LIBOR plus 0.75%1.50% payable monthly which matures in May 2018. 2024. At December 31, 20172021 and 2016, $2.72020, $2.0 million and $3.2 million,$3.1million, respectively, was available for borrowing after deducting $5.3$4.5 million and $4.8$4.9 million, respectively, in outstanding letters of credit, respectively.credit. The Company also has a $3.0 million bank guarantee with interest at 1.75% in an agreement dated June 2016. At December 31, 20172021 and 2016, $0.82020, $1.2 million and $0.6$1.5 million, respectively, was available for borrowing after deducting $2.2$1.8 million and $2.4$1.5 million in outstanding letters of credit, respectively. The financing arrangementscredit facilities described above contain standard restrictive covenants, including limits on additional borrowings and maintenance of certain operating and financial ratios. At December 31, 20172021 and 2016,2020, the Company was in compliance with all requirements. Interest expense, which approximates interest paid, was $17,000, $20,000 and $122,000less than $0.1 million in 2017, 2016 and 2015, respectively.each period presented. Note 6– Leases The Company hasis currently a lessee under a number of operating leases and two finance leases for certain offices, manufacturing facilities, land, office equipment and automobiles. Rental expense relatingautomobiles, none of which are material to operatingits operations. The Company’s leases was $0.9 million, $1.1 milliongenerally have remaining lease terms of 1 year to 5 years, some of which include options to extend the leases for up to 5 years, and $1.0 million in 2017, 2016 and 2015, respectively. The future minimum lease payments due under these operatingsome of which include options to terminate the leases as of December 31, 2017 are:within 1 year. These leases do not have significant rent escalation holidays, concessions, leasehold improvement incentives, or other build-out clauses. Further, the leases do not contain contingent rent provisions.
| | | | | | | | | | | | | | | | | | | | | | | | 2018 | | 2019 | | 2020 | | | 2021 | | | 2022 | | | Thereafter | | | Total | | | $825 | | $489 | | | $188 | | | | $33 | | | | $13 | | | | $9 | | | $ | 1,557 | | | | | | | | | | | | | | | | | | | | | | | | |
Supplemental information related to leases and the Company’s Consolidated Financial Statements is as follows: | | | 2021 | | | 2020 | | Components of lease costs: | | | | | | | | | Operating lease costs | | $ | 450 | | | $ | 431 | | Short-term lease costs | | | 322 | | | | 336 | | Finance lease costs | | | 140 | | | | 144 | | Total lease costs | | $ | 912 | | | $ | 911 | |
| | | December 31, 2021 | | | December 31, 2020 | | Weighted average remaining lease term (years): | | | | | | | | | Operating leases | | | 1.8 | | | | 2.1 | | Finance leases | | | 2.3 | | | | 3.3 | | Weighted average discount rate: | | | | | | | | | Operating leases | | | 3.25 | % | | | 3.25 | % | Finance leases | | | 3.25 | % | | | 3.25 | % |
| | | December 31, 2021 | | | | | Operating Leases | | | Financing Leases | | | Total Leases | | | | | | | | | | | | | | | | Other assets - right-of-use assets | | $ | 840 | | | $ | 300 | | | $ | 1,140 | | Lease liabilities included in: | | | | | | | | | | | | | Accrued expenses - current portion of lease liabilities | | $ | 450 | | | $ | 130 | | | $ | 580 | | Other long-term liabilities - non-current portion of lease liabilities | | | 380 | | | | 180 | | | | 560 | | Total lease liabilities | | $ | 830 | | | $ | 310 | | | $ | 1,140 | |
| | | December 31, 2020 | | | | | Operating Leases | | | Financing Leases | | | Total Leases | | | | | | | | | | | | | | | | Other assets - right-of-use assets | | $ | 1,250 | | | $ | 420 | | | $ | 1,670 | | Lease liabilities included in: | | | | | | | | | | | | | Accrued expenses - current portion of lease liabilities | | $ | 580 | | | $ | 130 | | | $ | 710 | | Other long-term liabilities - non-current portion of lease liabilities | | | 650 | | | | 310 | | | | 960 | | Total lease liabilities | | $ | 1,230 | | | $ | 440 | | | $ | 1,670 | |
Maturities of lease liabilities are as follows: | | | December 31, 2021 | | 2022 | | $ | 607 | | 2023 | | | 422 | | 2024 | | | 123 | | 2025 | | | 25 | | 2026 | | | 1 | | Thereafter | | | 9 | | Total lease payments | | $ | 1,187 | | Less: Interest | | | (47 | ) | Present value of lease liabilities | | $ | 1,140 | |
| | | December 31, 2020 | | 2021 | | $ | 752 | | 2022 | | | 547 | | 2023 | | | 348 | | 2024 | | | 86 | | 2025 | | | 11 | | Thereafter | | | 6 | | Total lease payments | | $ | 1,750 | | Less: Interest | | | (80 | ) | Present value of lease liabilities | | $ | 1,670 | |
Note 5 7– Accumulated Other Comprehensive Loss The reclassifications out of accumulatedAccumulated other comprehensive loss as reported in the Consolidated Statements of Income are: | | | | 2017 | | | | 2016 | | | | 2015 | | | Pension and other postretirement benefits: | | | | | | | | 2021 | | | 2020 | | | 2019 | | Recognized actuarial loss (a) | | $ | 1,093 | | | $ | 1,402 | | | $ | 1,581 | | | $ | 2,484 | | | $ | 2,466 | | | $ | 1,753 | | Settlement loss (b) | | | 2,628 | | | | - | | | | 2,584 | | | | 2,304 | | | | 4,583 | | | | 0 | | Settlement loss (c) | | | 1,403 | | | | - | | | | 1,199 | | | | | | | | | | | | | | Total before income tax | | | 5,124 | | | | 1,402 | | | | 5,364 | | | 4,788 | | | 7,049 | | | 1,753 | | Income tax | | | (1,670) | | | | (446) | | | | (1,749) | | | | (951 | ) | | | (1,368 | ) | | | (363 | ) | | | | | | | | | | | | Net of income tax | | $ | 3,454 | | | $ | 956 | | | $ | 3,615 | | | $ | 3,837 | | | $ | 5,681 | | | $ | 1,390 | | | | | | | | | | | | |
(a) | The recognized actuarial loss is included in the computation of net periodic benefit cost. See Note 7, Pensions and Other Postretirement Benefits. |
(b) | This portion of the settlement loss is included in cost of products sold in the Consolidated Statements of Income. |
(c) | This portion of the settlement loss is included in selling, general and administrative expenses in the Consolidated Statements of Income. |
(a) The recognized actuarial loss is included in the computation of net periodic benefit cost. See Note 9 to the Consolidated Financial Statements, Pensions and Other Postretirement Benefits (b) The settlement loss is included in Other (expense) income, net in the Consolidated Statements of Income
The components of accumulated other comprehensive loss as reported in the Consolidated Balance Sheets are: | | | | | | | | | | | | | | | | Currency
Translation
Adjustments | | | Pension and
OPEB
Adjustments | | | Accumulated
Other
Comprehensive
(Loss)
Income | | Balance at December 31, 2014 | | | $(4,338) | | | | $(12,988) | | | | $(17,326) | | Reclassification adjustments | | | - | | | | 5,364 | | | | 5,364 | | Current period charge | | | (4,719) | | | | (6,038) | | | | (10,757) | | Income tax benefit | | | - | | | | 304 | | | | 304 | | | | | | | | | | | | | | | Balance at December 31, 2015 | | | (9,057) | | | | (13,358) | | | | (22,415) | | Reclassification adjustments | | | - | | | | 1,402 | | | | 1,402 | | Current period benefit | | | 215 | | | | 1,357 | | | | 1,572 | | Income tax charge | | | - | | | | (1,024) | | | | (1,024) | | | | | | | | | | | | | | | Balance at December 31, 2016 | | | (8,842) | | | | (11,623) | | | | (20,465) | | Reclassification adjustments | | | | | | | 5,124 | | | | 5,124 | | Current period benefit | | | 3,521 | | | | 1,479 | | | | 5,000 | | Income tax charge | | | | | | | (2,168) | | | | (2,168) | | | | | | | | | | | | | | | Balance at December 31, 2017 | | | $(5,321) | | | | $ (7,188) | | | | $(12,509) | | | | | | | | | | | | | | |
| | | Currency Translation Adjustments | | | Pension and OPEB Adjustments | | | Accumulated Other Comprehensive (Loss)Income | | Balance at December 31, 2018 | | | (8,243 | ) | | | (15,180 | ) | | | (23,423 | ) | Reclassification adjustments | | | 0 | | | | 1,753 | | | | 1,753 | | Current period benefit (charge) | | | 88 | | | | (8,521 | ) | | | (8,433 | ) | Income tax benefit | | | 0 | | | | 1,566 | | | | 1,566 | | Balance at December 31, 2019 | | | (8,155 | ) | | | (20,382 | ) | | | (28,537 | ) | Reclassification adjustments | | | 0 | | | | 7,049 | | | | 7,049 | | Current period benefit (charge) | | | 3,111 | | | | (13,510 | ) | | | (10,399 | ) | Income tax benefit | | | 0 | | | | 1,510 | | | | 1,510 | | Balance at December 31, 2020 | | | (5,044 | ) | | | (25,333 | ) | | | (30,377 | ) | Reclassification adjustments | | | 0 | | | | 4,788 | | | | 4,788 | | Current period benefit (charge) | | | (2,807 | ) | | | (1,045 | ) | | | (3,852 | ) | Income tax charge | | | 0 | | | | (889 | ) | | | (889 | ) | Balance at December 31, 2021 | | $ | (7,851 | ) | | $ | (22,479 | ) | | $ | (30,330 | ) |
Note 6 8– Income Taxes The components of incomeIncome before income taxes are: | | | | 2017 | | | 2016 | | | 2015 | | | 2021 | | | 2020 | | | 2019 | | United States | | | $33,277 | | | | $33,101 | | | | $35,391 | | | $ | 30,973 | | | $ | 28,493 | | | $ | 41,234 | | Foreign countries | | | 6,101 | | | | 3,381 | | | | 1,875 | | | | 6,275 | | | | 2,753 | | | | 3,932 | | | | | | | | | | | | | Total | | | $39,378 | | | | $36,482 | | | | $37,266 | | | $ | 37,248 | | | $ | 31,246 | | | $ | 45,166 | | | | | | | | | | | | |
The components of income tax expense are: | | | | | | | | | | | | | | | | 2017 | | | 2016 | | | 2015 | | Current expense: | | | | | | | | | | | | | Federal | | | $16,489 | | | | $ 6,960 | | | | $11,465 | | Foreign | | | 1,243 | | | | 547 | | | | 292 | | State and local | | | 1,231 | | | | 581 | | | | 963 | | | | | | | | | | | | | | | | | | 18,963 | | | | 8,088 | | | | 12,720 | | | | | | | | | | | | | | | Deferred expense (benefit): | | | | | | | | | | | | | Federal | | | (5,968) | | | | 3,429 | | | | (443) | | Foreign | | | 51 | | | | (184) | | | | (112) | | State and local | | | (223) | | | | 266 | | | | (8) | | | | | | | | | | | | | | | | | | (6,140) | | | | 3,511 | | | | (563) | | | | | | | | | | | | | | | Income tax expense | | | $12,823 | | | | $11,599 | | | | $12,157 | | | | | | | | | | | | | | |
| | | 2021 | | | 2020 | | | 2019 | | Current expense: | | | | | | | | | | | | | Federal | | $ | 5,174 | | | $ | 4,058 | | | $ | 8,204 | | Foreign | | | 1,087 | | | | 353 | | | | 1,140 | | State and local | | | 1,086 | | | | 1,103 | | | | 1,205 | | | | | $ | 7,347 | | | $ | 5,514 | | | $ | 10,549 | | Deferred expense (benefit): | | | | | | | | | | | | | Federal | | $ | 60 | | | $ | 728 | | | $ | (720 | ) | Foreign | | | 48 | | | | (349 | ) | | | (379 | ) | State and local | | | (58 | ) | | | 165 | | | | (99 | ) | | | | | 50 | | | | 544 | | | | (1,198 | ) | Income tax expense | | $ | 7,397 | | | $ | 6,058 | | | $ | 9,351 | |
The reconciliation between income tax expense and the amount computed by applying the statutory federal income tax rate of 35% to income before income taxes is: | | | | 2017 | | | 2016 | | | 2015 | | | 2021 | | | 2020 | | | 2019 | | Income taxes at statutory rate | | | $13,782 | | | | $12,769 | | | | $13,043 | | | $ | 7,822 | | | $ | 6,562 | | | $ | 9,485 | | State and local income taxes, net of federal tax benefit | | | 555 | | | | 576 | | | | 680 | | | 898 | | | 711 | | | 803 | | Research and development tax credits | | | (295) | | | | (371) | | | | (380) | | | Domestic production activities deduction | | | (1,191) | | | | (822) | | | | (964) | | | Lower foreign taxes differential | | | (842) | | | | (820) | | | | (476) | | | Tax credits | | | (1,052 | ) | | (808 | ) | | (898 | ) | Uncertain tax positions | | | 346 | | | | (93) | | | | 26 | | | (26 | ) | | 42 | | | 164 | | Valuation allowance | | | 100 | | | | - | | | | (59) | | | (86 | ) | | 0 | | | 71 | | Federal tax reform – deferred rate change | | | (1,624) | | | | - | | | | - | | | Deemed mandatory repatriation | | | 1,370 | | | | - | | | | - | | | Foreign withholding tax | | | 600 | | | | - | | | | - | | | Other | | | 22 | | | | 360 | | | | 287 | | | | (159 | ) | | | (449 | ) | | | (274 | ) | | | | | | | | | | | | Income tax expense | | | $12,823 | | | | $11,599 | | | | $12,157 | | | $ | 7,397 | | | $ | 6,058 | | | $ | 9,351 | | | | | | | | | | | | |
The Company made income tax payments of $13.5$7.9 million, $7.8$6.2 million, and $13.5$9.1 million in 2017, 2016,2021,2020, and 2015,2019, respectively.
Deferred income tax assets and liabilities consist of: | | | | 2017 | | | 2016 | | | 2015 | | | 2021 | | | 2020 | | Deferred tax assets: | | | | | | | | Inventories | | | $ 1,131 | | | | $ 721 | | | | $ 1,664 | | | $ | 0 | | | $ | 646 | | Accrued liabilities | | | 1,872 | | | | 3,139 | | | | 2,450 | | | 1,900 | | | 1,484 | | Postretirement health benefits obligation | | | 3,844 | | | | 7,449 | | | | 7,547 | | | 6,724 | | | 6,815 | | Pension | | | - | | | | - | | | | 3,443 | | | 1,745 | | | 1,688 | | Lease liabilities | | | 272 | | | 390 | | Other | | | 583 | | | | 879 | | | | 292 | | | | 1,531 | | | | 1,434 | | | | | | | | | | | | | Total deferred tax assets | | | 7,430 | | | | 12,188 | | | | 15,396 | | | 12,172 | | | 12,457 | | Valuation allowance | | | (459) | | | | (277) | | | | (277) | | | | (481 | ) | | | (567 | ) | | | | | | | | | | | | Net deferred tax assets | | | 6,971 | | | | 11,911 | | | | 15,119 | | | 11,691 | | | 11,890 | | Deferred tax liabilities: | | | | | | | | Depreciation and amortization | | | (8,715) | | | | (16,119) | | | | (18,059) | | | (9,817 | ) | | (9,536 | ) | Pension | | | (997) | | | | (3,017) | | | | - | | | Leases – right of use assets | | | (269 | ) | | (388 | ) | Foreign withholding tax | | | (600) | | | | - | | | | - | | | 0 | | | (100 | ) | | | | | | | | | | | | Inventories | | | | (628 | ) | | | 0 | | Total deferred tax liabilities | | | (10,312) | | | | (19,136) | | | | (18,059) | | | | (10,714 | ) | | | (10,024 | ) | | | | | | | | | | | | Net deferred tax liabilities | | | $ (3,341) | | | | $ (7,225) | | | | $ (2,940) | | | | | | | | | | | | | | Net deferred tax assets | | | $ | 977 | | | $ | 1,866 | |
The Company hashad state tax credit carryforwards of $644,000$0.6 million and $518,000$0.7 million as of December 31, 20172021 and 2016,2020, respectively, thatwhich will expire incrementally between 20182022 and 2022.2035. The Company has ahad valuation allowanceallowances of $459,000$0.5 million and $0.6 million as of December 31, 2017 2021 and $277,000 as of December 31, 20162020, respectively, against certain of its deferred tax assets. ASC 740, “Income Taxes,” requires that a valuation allowance be recorded against deferred tax assets when it is more likely than not that some or all of a Company’s deferred tax assets will not be realized based on available positive and negative evidence. Total unrecognized tax benefits were $797,000$0.8 million and $492,000$0.9 million at December 31, 2017 2021 and 2016,2020, respectively. The total amount of unrecognized tax benefits that, if ultimately recognized, would reduce the Company’s annual effective tax rate were $674,000 and $397,000$0.7 million at both December 31, 2017 2021 and 2016, respectively. A reconciliation of the beginning and ending amount of unrecognized tax benefits is as follows: | | | | 2017 | | | 2016 | | | 2015 | | | 2021 | | | 2020 | | | 2019 | | Balance at beginning of year | | | $ 492 | | | | $ 567 | | | | $ 576 | | | $ | 878 | | | $ | 1,130 | | | $ | 951 | | Additions based on tax positions related to the current year | | | 239 | | | | 101 | | | | 113 | | | 153 | | | 177 | | | 372 | | Additions based on tax positions related to prior years | | | 165 | | | | - | | | | - | | | Reductions due to lapse of applicable statute of limitations | | | (99) | | | | (108) | | | | (101) | | | (96 | ) | | (139 | ) | | (193 | ) | Settlements | | | - | | | | (68) | | | | (21) | | | | (127 | ) | | | (290 | ) | | | 0 | | | | | | | | | | | | | Balance at end of year | | | $ 797 | | | | $ 492 | | | | $ 567 | | | $ | 808 | | | $ | 878 | | | $ | 1,130 | | | | | | | | | | | | |
The Company is subject to income taxes in the U.S. federal and various state, local and foreign jurisdictions. Income tax regulations within each jurisdiction are subject to the interpretation of the related tax laws and regulations and require significant judgment to apply. With few exceptions, the Company is no longer subject to U.S. federal, state and local, ornon-U.S. income tax examinations by tax authorities for the years before 2013. The Company has $56,000 of unrecognized tax benefits recorded for periods for which the relevant statutes of limitations expire in the next 12 months.2017. The Company recognizes interest and penalties related to unrecognized tax benefits in income tax expense for all periods presented. The Company accrued approximately $168,000, $98,000$0.2 million, $0.2 million and $116,000$0.3 million for the payment of interest and penalties at December 31, 2017, 20162021,2020 and 2015,2019, respectively. On December 22, 2017, the United States enacted tax reform legislation commonly known as the Tax Cuts and Jobs Act (the “Tax Act”), resulting in significant modifications to existing law. The Company follows the guidance in SEC Staff Accounting Bulletin 118 (“SAB 118”), which provides additional clarification regarding the application of ASC 740 in situations where the Company does not have the necessary information available, prepared, or analyzed in reasonable detail to complete the accounting for certain income tax effects of the Tax Act for the reporting period in which the Tax Act was enacted. SAB 118 provides for a measurement period beginning in the reporting period that includes the Tax Act’s enactment date and ending when the Company has obtained, prepared, and analyzed the information needed in order to complete the accounting requirements but in no circumstances should the measurement period extend beyond one year from the enactment date.
The Company recorded $0.4 million provisional net tax expense in the fourth quarter of 2017 to reflect the effects of the Tax Act. This net expense included a provisional noncurrent income tax payable in the amount of $1.4 million related to theone-time deemed repatriation transition tax on previously unrepatriated foreign earnings and aone-time provisional benefit of $1.6 million, which consisted primarily of there-measurement of U.S. deferred tax assets and liabilities reflecting the change in the U.S. federal rate from 35% to 21%. The Company has also recorded a $0.6 million foreign withholding tax. The provisional estimates are based on the Company’s initial analysis of the Tax Act. Given the significant complexity of the Tax Act, anticipated guidance from the U. S. Treasury about implementing the Tax Act, and the potential for additional guidance from the Securities and Exchange Commission or the Financial Accounting Standards Board related to the Tax Act, these estimates may be adjusted during 2018.
Note 7 9– Pensions and Other Postretirement Benefits The Company sponsors a defined benefit pension plan (“Plan”) covering certain domestic employees. Benefits are based on each covered employee’s years of service and compensation. The Plan is funded in conformity with the funding requirements of applicable U.S. regulations. The Plan was closed to new participants effective January 1,2008. Employees hired after this date, in eligible locations, participate in an enhanced 401(k)401(k) plan instead of the defined benefit pension plan. Employees hired prior to this date continue to accrue benefits. Additionally, the Company sponsors defined contribution pension plans made available to all domestic and Canadian employees. Total contributions to the plans were $1.9$2.3 million for 2017 and $1.6 million in each of the years 20162021,2020 and 2015. The Company also sponsors anon-contributory defined benefit postretirement health care plan that provides health benefits to certain domestic and Canadian retirees and their spouses.eligible spouses and dependent children. The Company funds the cost of these benefits as incurred. For measurement purposes, and based on maximum benefits as defined by the plan, a zero percent‐‐‐5% annual rate of increase in the per capita cost of covered health care benefits for domesticall retirees age 65 and over was assumed for 2017 andin estimating the projected postretirement benefit obligation at December 31, 2021, which is expected to remain constant going forward. A 5% percent annual rate of increase for all employees under age 65 was assumed in estimating the projected benefit obligation at December 31, 2020 and Canadian retirees over age 65 was assumed. Plan changes made during 2017 related to prescription drug coverage, spousal coverage and premiums being charged for retirees under age 65 resulted in a decrease in the Accumulated Postretirement Benefit Obligation atyear-end. The Company recognizes the obligations associated with its defined benefit pension plan and defined benefit postretirement health care plan in its consolidated financial statements.Consolidated Financial Statements. The following table presents the plans’ funded status as of the measurement date, December 31, reconciled with amounts recognized in the Company’s consolidated balance sheets:Consolidated Balance Sheets: | | | | Pension Plan | | | Postretirement Plan | | | Pension Plan | | | Postretirement Plan | | | | | 2017 | | | 2016 | | | 2017 | | | 2016 | | | 2021 | | | 2020 | | | 2021 | | | 2020 | | Accumulated benefit obligation at end of year | | | $63,173 | | | | $64,033 | | | | $17,367 | | | | $22,340 | | | $ | 67,400 | | | $ | 69,554 | | | $ | 28,934 | | | $ | 29,848 | | Change in projected benefit obligation: | Change in projected benefit obligation: | | | | | | Change in projected benefit obligation: | | | | | | | | | Benefit obligation at beginning of year | | | $77,107 | | | | $77,600 | | | | $22,340 | | | | $22,430 | | | $ | 86,299 | | | $ | 81,325 | | | $ | 29,848 | | | $ | 26,055 | | Service cost | | | 2,727 | | | | 2,837 | | | | 1,249 | | | | 1,192 | | | 2,662 | | | 2,709 | | | 1,462 | | | 1,372 | | Interest cost | | | 2,537 | | | | 2,643 | | | | 814 | | | | 842 | | | 1,729 | | | 1,937 | | | 654 | | | 778 | | Plan Changes | | | - | | | | - | | | | (6,646) | | | | - | | | Settlement | | | 1,398 | | | | - | | | | - | | | | - | | | 651 | | | 1,854 | | | 0 | | | 0 | | Benefits paid | | | (12,066) | | | | (5,510) | | | | (2,278) | | | | (1,637) | | | (7,719 | ) | | (12,872 | ) | | (1,618 | ) | | (1,305 | ) | Effect of foreign exchange | | | - | | | | - | | | | 24 | | | | 7 | | | 0 | | 0 | | | 1 | | | 9 | | Actuarial loss (gain) | | | 4,786 | | | | (463) | | | | 1,864 | | | | (494) | | | | | | | | | | | | | | | | | Actual expenses | | | (150 | ) | | (150 | ) | | 0 | | | 0 | | Actuarial (gain)/ loss | | | | (1,472 | ) | | | 11,496 | | | | (1,413 | ) | | | 2,939 | | Benefit obligation at end of year | | | $76,489 | | | | $77,107 | | | | $17,367 | | | | $22,340 | | | $ | 82,000 | | | $ | 86,299 | | | $ | 28,934 | | | $ | 29,848 | | | | | | | | | | | | | | | | | | | Change in plan assets: | | | | | | | | | | | | | | | | | Plan assets at beginning of year | | | $83,318 | | | | $68,291 | | | | $ - | | | | $ - | | | $ | 77,067 | | | $ | 80,285 | | | $ | 0 | | | $ | 0 | | Actual return on plan assets | | | 7,550 | | | | 4,537 | | | | - | | | | - | | | 1,460 | | | 7,804 | | | 0 | | | 0 | | Employer contributions | | | 2,000 | | | | 16,000 | | | | 2,278 | | | | 1,637 | | | 2,000 | | | 2,000 | | | 1,618 | | | 1,305 | | Benefits paid | | | (12,066) | | | | (5,510) | | | | (2,278) | | | | (1,637) | | | (7,719 | ) | | (12,872 | ) | | (1,618 | ) | | (1,305 | ) | | | | | | | | | | | | | | | Actual expenses | | | | (150 | ) | | | (150 | ) | | | 0 | | | | 0 | | Plan assets at end of year | | | 80,802 | | | | 83,318 | | | | - | | | | - | | | $ | 72,658 | | | $ | 77,067 | | | $ | 0 | | | $ | 0 | | | | | | | | | | | | | | | | Funded status at end of year | | | $ 4,313 | | | | $ 6,211 | | | | $(17,367) | | | | $(22,340) | | | $ | (9,342 | ) | | $ | (9,232 | ) | | $ | (28,934 | ) | | $ | (29,848 | ) | | | | | | | | | | | | | | | | | | | | | | Pension Plan | | | Postretirement Plan | | | Pension Plan | | | Postretirement Plan | | | | | 2017 | | | 2016 | | | 2017 | | | 2016 | | | 2021 | | | 2020 | | | 2021 | | | 2020 | | Amounts recognized in the Consolidated Balance Sheets consist of: | | | | | | | | | Amounts recognized in the Consolidated Balance Sheets consist of: | | | | | | | | | | | | | Noncurrent assets | | | $4,313 | | | | $6,211 | | | | $ - | | | | $ - | | | Current liabilities | | | - | | | | - | | | | (1,630) | | | | (1,631) | | | $ | 0 | | | $ | 0 | | | $ | (1,575 | ) | | $ | (1,598 | ) | Noncurrent liabilities | | | - | | | | - | | | | (15,737) | | | | (20,709) | | | | (9,342 | ) | | | (9,232 | ) | | | (27,359 | ) | | | (28,250 | ) | | | | | | | | | | | | | | | Total assets (liabilities) | | | $4,313 | | | | $6,211 | | | | $(17,367) | | | | $(22,340) | | | $ | (9,342 | ) | | $ | (9,232 | ) | | $ | (28,934 | ) | | $ | (29,848 | ) | | | | | | | | | | | | | | | | Amounts recognized in accumulated other comprehensive loss consist of: | | | | | | | Net actuarial loss (gain) | | | $24,571 | | | | $27,041 | | | | $(5,377) | | | | $(7,890) | | | Amounts recognized in Accumulated other comprehensive loss consist of: | | Amounts recognized in Accumulated other comprehensive loss consist of: | | | | | | | | | Net actuarial loss | | | $ | 26,016 | | | $ | 28,896 | | | $ | 5,841 | | | $ | 7,834 | | Prior Service Cost | | | - | | | | - | | | | (6,646) | | | | - | | | 0 | | | 0 | | | (2,125 | ) | | (3,255 | ) | Deferred tax (benefit) expense | | | (9,223) | | | | (10,506) | | | | 3,683 | | | | 2,978 | | | | (6,446 | ) | | | (7,130 | ) | | | (807 | ) | | | (1,012 | ) | | | | | | | | | | | | | | | After tax actuarial loss (gain) | | | $15,348 | | | | $16,535 | | | | $(8,340) | | | | $(4,912) | | | $ | 19,570 | | | $ | 21,766 | | | $ | 2,909 | | | $ | 3,567 | | | | | | | | | | | | | | | |
Components of net periodic benefit cost: | | | | | | | | | | | | | | | | 2021 | | | 2020 | | | 2019 | | Pension Plan | | | | | | | | | | | | | Service cost | | $ | 2,662 | | | $ | 2,709 | | | $ | 2,204 | | Interest cost | | | 1,729 | | | | 1,937 | | | | 2,454 | | Expected return on plan assets | | | (3,610 | ) | | | (3,900 | ) | | | (3,561 | ) | Recognized actuarial loss | | | 1,904 | | | | 2,160 | | | | 1,726 | | Settlement loss | | | 2,304 | | | | 4,583 | | | | 0 | | Net periodic benefit cost | | $ | 4,989 | | | $ | 7,489 | | | $ | 2,823 | | | | | | | | | | | | | | | | Other changes in pension plan assets and benefit obligations recognized in other comprehensive loss: | | Net (gain) loss | | | (2,879 | ) | | | 2,704 | | | $ | 3,034 | | Total expense recognized in net periodic benefit cost and other comprehensive income | | $ | 2,110 | | | $ | 10,193 | | | $ | 5,857 | | | | | | | | | | | | | | | | Postretirement Plan | | | | | | | | | | | | | Service cost | | $ | 1,462 | | | $ | 1,372 | | | $ | 1,083 | | Interest cost | | | 654 | | | | 778 | | | | 941 | | Prior service cost recognition | | | (1,130 | ) | | | (1,129 | ) | | | (1,129 | ) | Recognized actuarial loss (gain) | | | 580 | | | | 306 | | | | 27 | | Net periodic benefit cost (credit) | | $ | 1,566 | | | $ | 1,327 | | | $ | 922 | | | | | | | | | | | | | | | | Other changes in postretirement plan assets and benefit obligations recognized in other comprehensive loss: | | Net loss (gain) | | $ | (863 | ) | | $ | 3,762 | | | $ | 3,749 | | Total expense (benefit) recognized in net periodic benefit cost and other comprehensive income | | $ | 703 | | | $ | 5,089 | | | $ | 4,671 | |
| | | | | | | | | | | | | | | | | Components of net periodic benefit cost: | | | | | | | | | | | | | 2017 | | | 2016 | | | 2015 | | | | | Pension Plan | | | | | | | | | | | | | | | | | Service cost | | | $2,727 | | | | $2,837 | | | | $3,064 | | | | | | Interest cost | | | 2,537 | | | | 2,643 | | | | 2,640 | | | | | | Expected return on plan assets | | | (4,697) | | | | (4,150) | | | | (4,060) | | | | | | Recognized actuarial loss | | | 1,770 | | | | 2,101 | | | | 2,230 | | | | | | Settlement loss | | | 4,031 | | | | - | | | | 3,783 | | | | | | | | | | | | �� | | | | | | | | | | | Net periodic benefit cost | | | $6,368 | | | | $3,431 | | | | $7,657 | | | | | | | | | | | | | | | | | | | | | | | | | Other changes in pension plan assets and benefit obligations recognized in other comprehensive loss: | | | | | | Net (gain) loss | | | $(2,470) | | | | $(2,952) | | | | $1,156 | | | | | | | | | | | | | | | | | | | | | | | | Total expense (income) recognized in net periodic benefit cost and other comprehensive income | | | $ 3,898 | | | | $ 479 | | | | $8,813 | | | | | | | | | | | | | | | | | | | | | | | | | | | | Postretirement Plan | | | | | | | | | | | | | | | | | Service cost | | | $1,249 | | | | $1,192 | | | | $1,194 | | | | | | Interest cost | | | 814 | | | | 842 | | | | 790 | | | | | | Recognized actuarial gain | | | (677) | | | | (699) | | | | (649) | | | | | | | | | | | | | | | | | | | | | | | Net periodic benefit cost | | | $1,386 | | | | $1,335 | | | | $1,335 | | | | | | | | Other changes in postretirement plan assets and benefit obligations recognized in other comprehensive loss: | | | | | | Net (gain) loss | | | $(4,105) | | | | $ 205 | | | | $(529) | | | | | | | | | | | | | | | | | | | | | | | | Total (benefit) expense recognized in net periodic benefit cost and other comprehensive income | | | $(2,719) | | | | $1,540 | | | | $ 806 | | | | | | | | | | | | | | | | | | | | | | |
During 20172021 and 2015,2020 the Company recorded a settlement loss relating to retirees that receivedlump-sum distributions from the Company’s defined benefit pension plan totaling $4.0$2.3 million and $3.8$4.6 million respectively. NaN settlement loss was incurred in 2019. These charges were the result oflump-sum payments to retirees which exceeded the Plan’s actuarial service and interest cost thresholds. No settlement loss was incurred in 2016.
The prior service cost is amortized on a straight-line basis over the average estimated remaining service period of active participants. The unrecognized actuarial gain or loss in excess of the greater of 10% of the benefit obligation or the market value of plan assets is also amortized on a straight-line basis over the average estimated remaining service period of active participants. | | | | | | | | | | | | | | | | | | | | Pension Plan | | | Postretirement Plan | | | | | 2017 | | | 2016 | | | 2017 | | | 2016 | | Weighted-average assumptions used to determine benefit obligations at December 31: | | | | | | | | | | Discount rate | | | 3.27% | | | | 3.60% | | | | 3.39% | | | | 3.77% | | Rate of compensation increase | | | 3.50% | | | | 3.50% | | | | - | | | | - | | | | | Weighted-average assumptions used to determine net periodic benefit cost for years ended December 31: | | | | | | | | | | Discount rate | | | 3.27% | | | | 3.70% | | | | 3.77% | | | | 3.90% | | Expected long-term rate of return on plan assets | | | 6.00% | | | | 6.00% | | | | - | | | | - | | Rate of compensation Increase | | | 3.50% | | | | 3.50% | | | | - | | | | - | |
| | | Pension Plan | | | Postretirement Plan | | | | | 2021 | | | 2020 | | | 2021 | | | 2020 | | Weighted-average assumptions used to determine benefit obligations at December 31: | | | | | | | | | | Discount rate | | | 2.44 | % | | | 1.97 | % | | | 2.70 | % | | | 2.25 | % | Rate of compensation increase | | | 3.50 | % | | | 3.50 | % | | | 0 | | | | 0 | | Weighted-average assumptions used to determine net periodic benefit cost for years ended December 31: | | | | | | | | | | Discount rate | | | 2.07 | % | | | 2.40 | % | | | 2.25 | % | | | 3.08 | % | Expected long-term rate of return on plan assets | | | 5.10 | % | | | 5.36 | % | | | 0 | | | | 0 | | Rate of compensation increase | | | 3.50 | % | | | 3.50 | % | | | 0 | | | | 0 | |
To enhance the Company’s efforts to mitigate the impact of the defined benefit pension plan on its financial statements, in 2014 the Company moved towards a liability driven investing model to more closely align assets with liabilities based on when the liabilities are expected to come due. Currently, based on 20172021 funding levels, equities may comprise between 7%22% and 27%42% of the Plan’s market value. Fixed income investments may comprise between 70%50% and 90%70% of the Plan’s market value. Alternative investments may comprise between 0%3% and 6%13% of the Plan’s market value. Cash and cash equivalents (including all senior debt securities with less than one year to maturity) may comprise between 0% and 10% of the Plan’s market value. Financial instruments included in pension plan assets are categorized into a fair value hierarchy of three levels, based on the degree of subjectivity inherent in the valuation methodology. Level 1 assets are based on unadjusted quoted prices in active markets that are accessible to the reporting entity at the measurement date for identical assets. Level 2 assets are valued at inputs other than quoted prices in active markets for identical assets that are observable either directly or indirectly for substantially the full term of the assets. Level 3 assets are valued based on unobservable inputs for the asset (i.e., supported by little or no market activity). These inputs include management’s own assessments about the assumptions that market participants would use in pricing assets (including assumptions about risk). The level in the fair value hierarchy within which the fair value measurement is classified is determined based on the lowest level input that is significant to the fair value measuremeasurement in its entirety. All of the Plan’s assets in theThe following table setstables set forth by asset class the Plan’s fair value of assets.
Plan fair value asset allocation by category:assets for the years ended December 31, 2021 and 2020:
| | | | | | | | | | 2017 | | $ | | | % | | | | | | | | Level 1: | | | | | | | | | Equity | | | $14,637 | | | | 18% | | Fixed income | | | 12,573 | | | | 16% | | Mutual funds | | | 857 | | | | 1% | | Money funds and cash | | | 6,173 | | | | 8% | | | | | | | | | | | Total Level 1 | | | 34,240 | | | | 43% | | Level 2: | | | | | | | | | Fixed income | | | 46,556 | | | | 57% | | Money funds | | | | | | | | | | | | | | | | | | Total Level 2 | | | 46,556 | | | | 57% | | Level 3: | | | | | | | | | Equity | | | 6 | | | | - | | | | | | | | | | | Total Level 3 | | | 6 | | | | - | | | | | | | | | | | Total fair value of Plan assets | | | $80,802 | | | | 100% | | | | | | | | | | |
| | | Quoted Prices in Active Markets for Identical Assets (Level 1) | | | Significant Observable Inputs (Level 2) | | | Significant Unobservable Inputs (Level 3) | | | Plan Assets at December 31, 2021 | | Equity | | $ | 10,979 | | | $ | 0 | | | $ | 0 | | | $ | 10,979 | | Fixed income | | | 8,788 | | | | 42,154 | | | | 139 | | | | 51,081 | | Mutual funds | | | 3,045 | | | | 0 | | | | 0 | | | | 3,045 | | Money funds and cash | | | 2,220 | | | | 5,333 | | | | 0 | | | | 7,553 | | Total fair value of Plan assets | | $ | 25,032 | | | $ | 47,487 | | | $ | 139 | | | $ | 72,658 | |
| | | | | | | | | | 2016 | | $ | | | % | | | | | | | | Level 1: | | | | | | | | | Equity | | $ | 19,752 | | | | 24% | | Fixed income | | | 11,805 | | | | 14% | | Mutual funds | | | - | | | | - | | Money funds and cash | | | 11,134 | | | | 13% | | | | | | | | | | | Total Level 1 | | | 42,691 | | | | 51% | | Level 2: | | | | | | | | | Fixed income | | | 40,597 | | | | 49% | | Money funds | | | - | | | | - | | | | | | | | | | | Total Level 2 | | | 40,597 | | | | 49% | | Level 3: | | | | | | | | | Equity | | | 30 | | | | - | | | | | | | | | | | Total Level 3 | | | 30 | | | | - | | | | | | | | | | | Total fair value of Plan assets | | $ | 83,318 | | | | 100% | | | | | | | | | | |
| | | Quoted Prices in Active Markets for Identical Assets (Level 1) | | | Significant Observable Inputs (Level 2) | | | Significant Unobservable Inputs (Level 3) | | | Plan Assets at December 31, 2020 | | Equity | | $ | 12,619 | | | $ | 0 | | | $ | 20 | | | $ | 12,639 | | Fixed income | | | 9,582 | | | | 45,463 | | | | 0 | | | | 55,045 | | Mutual funds | | | 2,108 | | | | 0 | | | | 0 | | | | 2,108 | | Money funds and cash | | | 2,089 | | | | 5,186 | | | | 0 | | | | 7,275 | | Total fair value of Plan assets | | $ | 26,398 | | | $ | 50,649 | | | $ | 20 | | | $ | 77,067 | |
Contributions The Company expects to contribute $2up to $2.0 million to its defined benefit pension plan in 2018.2022. Expected future benefit payments The following benefit payments are expected to be paid as follows based on actuarial calculations: | | | | | | | | | | | | | | | | | | | | | | | | | | | | 2018 | | | 2019 | | | 2020 | | | 2021 | | | 2022 | | | Thereafter | | Pension | | $ | 4,274 | | | $ | 4,251 | | | $ | 5,427 | | | $ | 5,046 | | | $ | 5,964 | | | $ | 26,953 | | Postretirement | | | 1,657 | | | | 1,519 | | | | 1,373 | | | | 1,215 | | | | 1,157 | | | | 5,960 | |
| | | 2022 | | | 2023 | | | 2024 | | | 2025 | | | 2026 | | | Thereafter | | Pension | | $ | 14,089 | | | $ | 3,963 | | | $ | 4,867 | | | $ | 3,929 | | | $ | 4,950 | | | $ | 26,412 | | Postretirement | | | 1,596 | | | | 1446 | | | | 1,485 | | | | 1,488 | | | | 1,537 | | | | 9,151 | |
A one percentage pointFor measurement purposes, and based on maximum benefits as defined by the plan, a 5% annual rate of increase in the assumedper capita cost of covered health care trend rate would increase postretirement expense by approximately $271,000, changing the benefit obligation by approximately $1.6 million; while a one percentage point decrease in the assumed health care trend rate would decrease postretirement health care expense by approximately $233,000, changing the benefit obligation by approximately $1.4 million. The assumed trend rates for healthcare costs are a 5% increase per year for retirees prior to the age 65 and 0% for retirees post age 65. A 5% rate of increasebenefits for all employees under age 65 retirees was assumed as of December 31, 2021 and Canadian retirees over age 65 was assumed.2020 and is expected to remain constant going forward .
A one percentage point change in the assumed rate of return on the defined benefit pension plan assets is estimated to have an approximate $783,000$0.7 million effect on pension expense.net periodic benefit cost. Additionally, a one percentage point increase in the discount rate is estimated to have a $1.2$1.4 million decrease in pension expense,net periodic benefit cost, while a one percentage point decrease in the discount rate is estimated to have a $1.4$1.7 million increase in pension expense.net periodic benefit cost. Note 8 10– Goodwill and Other Intangible Assets The major components of goodwillGoodwill and other intangible assets are: | | | | 2017 | | | 2016 | | | 2021 | | | 2020 | | | | | Historical
Cost | | | Accumulated
Amortization | | | Historical
Cost | | | Accumulated
Amortization | | | Historical Cost | | | Accumulated Amortization | | | Historical Cost | | | Accumulated Amortization | | Finite-lived intangible assets: | | | | | | | | | | Customer relationships | | | $ 7,966 | | | | $4,791 | | | | $11,885 | | | | $4,650 | | | $ | 7,769 | | | $ | 7,255 | | | $ | 7,876 | | | $ | 6,991 | | Technology and drawings | | | 6,758 | | | | 3,121 | | | | 6,741 | | | | 2,804 | | | 6,750 | | | 4,305 | | | 6,761 | | | 4,015 | | Other intangibles | | | 1,866 | | | | 1,021 | | | | 1,723 | | | | 942 | | | | 2,307 | | | | 1,641 | | | | 2,307 | | | | 1,521 | | | | | | | | | | | | | | | | Total finite-lived intangible assets | | | 16,590 | | | | 8,933 | | | | 20,349 | | | | 8,396 | | | 16,826 | | | 13,201 | | | 16,944 | | | 12,527 | | Goodwill | | | 27,551 | | | | - | | | | 28,030 | | | | - | | | 27,243 | | | - | | | 27,537 | | | - | | Trade names and trademarks | | | 2,710 | | | | - | | | | 2,888 | | | | - | | | | 2,218 | | | | - | | | | 2,221 | | | | - | | | | | | | | | | | | | | | | Total | | | $46,851 | | | | $8,933 | | | | $51,267 | | | | $8,396 | | | $ | 46,287 | | | $ | 13,201 | | | $ | 46,702 | | | $ | 12,527 | | | | | | | | | | | | | | | |
Amortization of intangible assets was $1.6$0.8 million, $1.7$1.3 million and $1.5$1.2 million in 2017, 20162021,2020 and 2015,2019, respectively. Amortization of these intangible assets for 20182022 through 20222026 is expected to approximate $1.0$0.5 million per year.
Changes in the carrying value of goodwill during the years ended December 31, 20172021 and 20162020 are as follows: | | | | | | | Goodwill | | Balance at December 31, 2015
| | | $24,559 | | Acquisitions
| | | 5,187 | | Impairment
| | | (1,800) | | Foreign currency
| | | 84 | | | | | | | Goodwill | | Balance at December 31, 2019 | | $ | 27,215 | | Acquisitions | | | 0 | | Impairment | | | 0 | | Foreign currency | | | 322 | | Balance at December 31, 2020 | | $ | 27,537 | | Acquisitions | | | 0 | | Impairment | | | 0 | | Foreign currency | | | (294 | ) | Balances at December 31, 2021 | | $ | 27,243 | |
| | | Balance at December 31, 2016
| | | 28,030 | | Acquisitions
| | | - | | Impairment
| | | (925) | | Foreign currency
| | | 446 | | | | | | | Balance at December 31, 2017
| | | $27,551 | | | | | | |
The decreasing demand for barge pumps for the marine transportation market, driven by low oil prices and overcapacity of inland barges, has continued to negatively affect the Bayou City Pump Company (“Bayou”)
reporting unit, leading management to reconsider its estimates for future profitability of this reporting unit prior to the October 1 annual goodwill impairment testing date in 2017 and thereby increasing the likelihood that the associated goodwill and other intangible assets could be impaired. As such, the Company performed an interim discounted cash flow analysis to test for potential impairment of goodwill pursuant to ASC 350. As a result of this impairment test, the Company concluded that the goodwill was impaired and recorded anon-cash impairment charge of $0.9 million which represented the full remaining amount of Bayou’s goodwill. This impairment charge is included in Impairment of goodwill and other intangible assets on the Condensed Consolidated Statements of Income.
For 2017,2021, the Company used a quantitative analysis for the annual goodwill impairment testing as of October 1 for its National Pump Company (“National”) reporting unit. The fair value for this reporting unit was estimated using both a discounted cash flow model whichand a market-based approach. The discounted cash flow model considered forecasted cash flows discounted at an estimated weighted- averageweighted-average cost of capital. The forecasted cash flows were based on the Company’s long-term operating plan and a terminal value was used to estimate the cash flows beyond the period covered by the operating plan. The weighted-average cost of capital is an estimate of the overallafter-tax rate of return required by equity and debt market holders of a business enterprise. The market-based approach considers market prices of corporations engaged in the same or similar line of business. These analyses require the exercise of significant judgments, including judgments about appropriate discount rates, perpetual growth rates and the timing of expected future cash flows. Sensitivity analyses were performed around these assumptions in order to assess the reasonableness of the assumptions and the resulting estimated fair values. The result of this goodwill impairment test indicated that no0 impairment existed at National. The Company’s annual impairment analysis performed as of October 1, 2017 2021 concluded that National’s fair value exceeded its carrying value by approximately 7%‐‐‐45%. A sensitivity analysis was performed for the National reporting unit, assuming a hypothetical 50100 basis point decrease in the expected long-term growth rate or a hypothetical 50100 basis point increase in the weighted average cost of capital, and both scenarios independently yielded an estimated fair value for the National reporting unit slightly above carrying value. If recently depressed U.S. agricultural conditions continue for an extended time, this market’s relatedNational fails to experience growth and profitability assumptions may reduce National’s indicated fair valueor revises its long-term projections downward, it could be subject to require a potential future impairment charge.charges in the future. Goodwill relating to the National reporting unit represents 3%is $13.6 million, 3.2% of the Company’s December 31, 2017 2021 total assets. For 2017,2021, for all other reporting units, the Company used a qualitative analysis for goodwill impairment testing as of October 1. This qualitative assessment included consideration of current industry and market conditions and circumstances as well as any mitigating factors that would most affect the fair value of the Company and these reporting units. Based on the assessment and consideration of the totality of the facts and circumstances, including the business environment in the fourth quarter of 2017,2021, the Company determined that it was not more likely than not that the fair value of the Company or these reporting units is less than their respective carrying amounts. As such, no goodwill impairments for these reporting units were recorded for the year ended December 31, 2017.2021. Other indefinite-lived intangible assets primarily consist of trademarks and trade names. The fair value of these assets is also tested annually for impairment as of October 1, or whenever events or changes in circumstances indicate there may be a possible permanent loss of value. The fair value of these assets is determined using a royalty relief methodology similar to that employed when the associated assets were acquired, but using updated estimates of future sales, cash flows and profitability. For 20172021 and 20162020 the fair value of all indefinite lived intangible assets exceeded the respective carrying values. Finite-lived assets are reviewed for impairment whenever events or changes in circumstances indicate the carrying amount may not be recovered through future net cash flows generated by the assets. Recoverability of assets to be held and used is measured by a comparison of the carrying amount of the assets to future net undiscounted cash flows estimated to be generated by such assets. Based upon our fiscal 20172021 and 20162020 quantitative and qualitative impairment analyses except for Bayou’s customer relationship intangible asset and the risk related to National’s indicated fair value, the Company was not aware of any events or changes in circumstances that indicate the carrying value of its finite-lived intangible assets may not be recoverable. In 2017, due primarily to the continued decreased demand for barge pumps for the marine transportation market driven by low oil prices and overcapacity of inland barges, the Company performed a recoverability test related to Bayou’s customer relationship intangible asset pursuant to ASC 360. As a result of the recoverability test, Bayou recorded apre-taxnon-cash customer relationship impairment charge of $3.2 million, which represented the full amount of Bayou’s customer relationships. The impairment charge is included in Impairment of goodwill and other intangible assets on the Condensed Consolidated Statements of Income. Note 9 11– Business Segment Information The Company operates in one business segment comprising the design, manufacture and sale of pumps and pump systems. The Company’s products are used in water, wastewater, construction, industrial, petroleum, original equipment, agriculture, fire protection, heating, ventilation and air conditioning (HVAC), military and other liquid-handling applications. The pumps and pump systems are marketed in the United States and worldwide through a broad network of distributors, through manufacturers’ representatives (for sales to many original equipment manufacturers), through third-partythird-party distributor catalogs, and by direct sales. International sales are made primarily through foreign distributors and representatives. The Company sells to approximately 150135 countries around the world. The components of customerfollowing tables disaggregate total net sales determined based on the location of customers are:by major product category and geographic location: | | | | | | | | | | | | | | | | | | | | | | | | | | | | 2017 | | | % | | | 2016 | | | % | | | 2015 | | | % | | | | | | | | | United States | | $ | 241,746 | | | | 64 | | | $ | 250,872 | | | | 66 | | | $ | 269,628 | | | | 66 | | Foreign countries | | | 137,643 | | | | 36 | | | | 131,199 | | | | 34 | | | | 136,522 | | | | 34 | | | | | | | | | | | | | | | | | | | | | | | | | | | Total | | $ | 379,389 | | | | 100 | | | $ | 382,071 | | | | 100 | | | $ | 406,150 | | | | 100 | | | | | | | | | | | | | | | | | | | | | | | | | | |
Net sales from external customers by product category are:
| | | Product Category | | | | | 2021 | | | 2020 | | | 2019 | | Pumps and pump systems | | $ | 321,263 | | | $ | 300,906 | | | $ | 341,304 | | Repair parts for pumps and pump systems and other | | | 57,053 | | | | 48,061 | | | | 56,875 | | Total net sales | | $ | 378,316 | | | $ | 348,967 | | | $ | 398,179 | |
| | | | | | | | | | | | | | | | 2017 | | | 2016 | | | 2015 | | Pumps and pump systems | | $ | 322,201 | | | $ | 328,973 | | | $ | 352,652 | | Repairs of pumps and pump systems and other | | | 57,188 | | | | 53,098 | | | | 53,498 | | | | | | | | | | | | | | | Total | | $ | 379,389 | | | $ | 382,071 | | | $ | 406,150 | | | | | | | | | | | | | | |
| | | Geographic Location | | | | | 2021 | | | 2020 | | | 2019 | | United States | | $ | 260,683 | | | $ | 246,913 | | | $ | 275,290 | | Foreign countries | | | 117,633 | | | | 102,054 | | | | 122,889 | | Total net sales | | $ | 378,316 | | | $ | 348,967 | | | $ | 398,179 | |
As of both December 31, 20172021 and 2016, 89% and 92%2020, 86% of the Company’s long-lived assets were located in the United States, respectively.States. Note 10 12– Acquisitions Common Share Repurchases In
On October 2016,29, 2021, the Company announced a share repurchase program of up to $50.0 million of the Company’s common shares. Shares may be repurchased from time to time by the Company through its wholly-owned subsidiary Patterson Pump Company (“Patterson”), acquired substantially alla variety of the assetsauthorized methods. The actual number of shares repurchased will depend on prevailing market conditions, alternative uses of capital and certain liabilities of Morrison Pump Company (“Morrison”). The purchase price consisted of cashother factors, and deferred payments. The deferred payments represent the estimated fair value of the additional variable cash consideration payable in connection with the acquisition that is contingent upon the achievement of certain performance milestones.will be determined at management’s discretion. The Company estimatedis not obligated to make any purchases under the fair value using expected future cash flows overprogram, and the period in which the obligation is expected to program may be settled, which are considered to be level 3 inputs.suspended or discontinued at any time. The Company recognized goodwill of $5.2 million related to the asset acquisition of Morrison. The results of operations of Morrisonprogram does not have been included in Gorman-Rupp’s consolidated results since October 2016.
In August 2015, the Company’s subsidiary, Gorman-Rupp Europe B.V., acquired substantially all of the assets and certain liabilities of Hydro+ SA (“Hydro”) and Hydro+ Rental SPRL (“Hydro Rental”), subsequently renamed Gorman-Rupp Rental SPRL, based near Namur, Belgium. The Company assumed $1.9 million in bank debt, which was subsequently paid off in 2015. The Company recognized customer relationships of $748,000, technology and drawings of $130,000, tradenames and trademarks of $70,000 and goodwill of $2.4 million related to the asset acquisition of Hydro and Hydro Rental.
The results of operations of both Hydro companies have been included in Gorman-Rupp’s consolidated results since August 2015.an expiration date.
During the year ended December 31,2021 and December 31, 2020 the Company repurchased 30,038 and 10,848 shares for $1.2 million and $0.4 million respectively. As of December 31, 2021, the Company had $49.0 million available for repurchase under the share repurchase program. | ITEM 9. | CHANGES IN AND DISAGREEMENTS WITH ACCOUNTANTS ON ACCOUNTING AND DISAGREEMENTS WITH ACCOUNTANTS ON ACCOUNTING AND FINANCIAL DISCLOSURE |
None. | ITEM 9A. | CONTROLS AND PROCEDURES | CONTROLS AND PROCEDURES |
Evaluation of Disclosure Controls and Procedures The Company maintains a set of disclosure controls and procedures designed to ensure that information required to be disclosed by the Company in reports that it files or submits under the Securities Exchange Act of 1934 is recorded, processed, summarized and reported within the time periods specified in Securities and Exchange Commission rules and forms. The Company’s disclosure controls and procedures are also designed to ensure that information required to be disclosed in Company reports filed under the Securities Exchange Act of 1934 is accumulated and communicated to the Company’s management, including the principal executive officer and the principal financial officer, as appropriate, to allow timely decisions regarding required disclosure. An evaluation was carried out under the supervision and with the participation of the Company’s management, including the principal executive officer and the principal financial officer, of the effectiveness of the design and operation of the Company’s disclosure controls and procedures as of the end of the period covered by this report on Form10-K. Based on the evaluation, the principal executive officer and the principal financial officer have concluded that the Company’s disclosure controls and procedures were effective as of December 31, 2017. Report of Management on Internal Control Over Financial Reporting Management is responsible for establishing and maintaining adequate internal control over financial reporting for the Company (as defined in Exchange Act Rules13a-15(f) and15d-15(f). Internal control over financial reporting is a process designed by, or under the supervision of, the Company’s principal executive and principal financial officers, or persons performing similar functions, and affected by the Company’s Board of Directors, management and other personnel, to provide reasonable assurance regarding the reliability of financial reporting and the preparation of financial statements for external purposes in accordance with accounting principles generally accepted in the United States. The Company’s internal control over financial reporting includes those policies and procedures that (i) pertain to the maintenance of records that, in reasonable detail, accurately and fairly reflect the transactions and dispositions of the assets of the Company; (ii) provide reasonable assurance that transactions are recorded as necessary to permit preparation of financial statements in accordance with accounting principles generally accepted in the United States, and that receipts and expenditures of the Company are being made only in accordance with authorizations of management and Directors of the Company; and (iii) provide reasonable assurance regarding prevention or timely detection of unauthorized acquisition, use or disposition of the Company’s assets that could have a material effect on the financial statements. Because of its inherent limitations, internal control over financial reporting may not prevent or detect misstatements. In addition, projections of any evaluation of effectiveness to future periods are subject to the risk that controls may become inadequate because of changes in conditions, or that the degree of compliance with the policies or procedures may deteriorate. Management conducted an evaluation of the effectiveness of internal control over financial reporting based on the framework in Internal Control – Integrated Framework issued by the Committee of Sponsoring Organizations of the Treadway Commission (2013 framework) (the COSO Criteria). Based on this evaluation, management concluded that the Company’s internal control over financial reporting was effective as of December 31, 2017.2021. The independent registered public accounting firm of Ernst & Young LLP that has audited the consolidated financial statements included in this annual report on Form10-K, has also issued an attestation report on the Company’s internal control over financial reporting as of December 31, 2017.2021. This report is included on the following page. /s/ Jeffrey S. GormanScott A. King Jeffrey S. GormanScott A. King
President and Chief Executive Officer /s/ James C. Kerr James C. Kerr Executive Vice President and Chief Financial Officer February 23, 2018 Report of Independent Registered Public Accounting Firm To the Shareholders and the Board of Directors of The Gorman-Rupp Company Opinion on Internal Control overOver Financial Reporting We have audited The Gorman-Rupp Company’s internal control over financial reporting as of December 31, 2017,2021, based on criteria established in Internal Control—Integrated Framework issued by the Committee of Sponsoring Organizations of the Treadway Commission (2013 framework) (the COSO criteria). In our opinion, The Gorman-Rupp Company (the Company) maintained, in all material respects, effective internal control over financial reporting as of December 31, 2017,2021, based on the COSO criteria. We also have audited, in accordance with the standards of the Public Company Accounting Oversight Board (United States) (PCAOB), the 20172021 consolidated financial statements of the Company and our report dated February 23, 201828, 2022 expressed an unqualified opinion thereon. Basis for Opinion The Company’s management is responsible for maintaining effective internal control over financial reporting and for its assessment of the effectiveness of internal control over financial reporting included in the accompanying Report of Management on Internal Control Over Financial Reporting. Our responsibility is to express an opinion on the Company’s internal control over financial reporting based on our audit. We are a public accounting firm registered with the PCAOB and are required to be independent with respect to the Company in accordance with the U.S. federal securities laws and the applicable rules and regulations of the Securities and Exchange Commission and the PCAOB. We conducted our audit in accordance with the standards of the PCAOB. Those standards require that we plan and perform the audit to obtain reasonable assurance about whether effective internal control over financial reporting was maintained in all material respects. Our audit included obtaining an understanding of internal control over financial reporting, assessing the risk that a material weakness exists, testing and evaluating the design and operating effectiveness of internal control based on the assessed risk, and performing such other procedures as we considered necessary in the circumstances. We believe that our audit provides a reasonable basis for our opinion. Definition and Limitations of Internal Control Over Financial Reporting A company’s internal control over financial reporting is a process designed to provide reasonable assurance regarding the reliability of financial reporting and the preparation of financial statements for external purposes in accordance with generally accepted accounting principles. A company’s internal control over financial reporting includes those policies and procedures that (1) pertain to the maintenance of records that, in reasonable detail, accurately and fairly reflect the transactions and dispositions of the assets of the company; (2) provide reasonable assurance that transactions are recorded as necessary to permit preparation of financial statements in accordance with generally accepted accounting principles, and that receipts and expenditures of the company are being made only in accordance with authorizations of management and directors of the company; and (3) provide reasonable assurance regarding prevention or timely detection of unauthorized acquisition, use, or disposition of the company’s assets that could have a material effect on the financial statements. Because of its inherent limitations, internal control over financial reporting may not prevent or detect misstatements. Also, projections of any evaluation of effectiveness to future periods are subject to the risk that controls may become inadequate because of changes in conditions, or that the degree of compliance with the policies or procedures may deteriorate. /s/ Ernst & Young LLP Cleveland, Ohio February 23, 2018 Changes in Internal Control over Financial Reporting There were no changes in the Company’s internal control over financial reporting that occurred during the last fiscal quarter that have materially affected, or are reasonably likely to materially affect, the Company’s internal control over financial reporting. | ITEM 9B. | OTHER INFORMATION |
None. PART III | ITEM 10. | DIRECTORS, EXECUTIVE OFFICERS AND CORPORATE GOVERNANCE | DIRECTORS, EXECUTIVE OFFICERS AND CORPORATE GOVERNANCE |
Attention is directed to the sections captioned “Election of Directors,” “Board of Directors and Board Committees,” “Audit Committee Report,” “Beneficial Ownership of Shares” and “Section“Delinquent Section 16(a) Beneficial Ownership Reporting Compliance”Reports” in the Company’s definitive Notice of 20182022 Annual Meeting of Shareholders and related Proxy Statement (filed with the SEC pursuant to Regulation 14A not later than 120 days after the end of the fiscal year covered by this Form10-K), which are incorporated herein by this reference. With respect to Executive Officers, attention is directed to Part I of this Form10-K. The Company has adopted a Code of Ethics that applies to its Directors, officers and all employees. The Code of Ethics is set forth as an exhibit to this Form10-K. In addition, the Code of Ethics is posted on the Company’s website accessible through its Internet address of www.gormanrupp.com (under the heading “Investor Relations”“Governance & Leadership” and thesub-heading “Corporate Governance” “Governance Documents”), including any amendments. | ITEM 11. | EXECUTIVE COMPENSATION | EXECUTIVE COMPENSATION |
Attention is directed to the sections “Board of Directors and Board Committees,” “Executive Compensation,” “Compensation Discussion and Analysis,” “Pension Benefits,” “Summary Compensation Table,” “Grants of Plan Based Awards,” “Outstanding Equity Awards at December 31, 2017,2021,”“Non-Employee “Non-Employee Director Compensation,” “Risk Oversight,” “Compensation Committee Interlocks and Insider Participation,” “Compensation Committee Report,” and “CEO Pay Ratio” in the Company’s definitive Notice of 20182022 Annual Meeting of Shareholders and related Proxy Statement (filed pursuant to Regulation 14A not later than 120 days after the end of the fiscal year covered by this Form10-K), which are incorporated herein by this reference. | ITEM 12. | SECURITY OWNERSHIP OF CERTAIN BENEFICIAL OWNERS AND MANAGEMENT AND MANAGEMENT AND RELATED STOCKHOLDER MATTERS |
Attention is directed to the section “Beneficial Ownership of Shares” and “Election of Directors” in the Company’s definitive Notice of 20182022 Annual Meeting of Shareholders and related Proxy Statement (filed with the SEC pursuant to Regulation 14A not later than 120 days after the end of the fiscal year covered by this Form10-K), which are incorporated herein by this reference. Equity Compensation Plan Information The following table provides information as of December 31, 20172021 about the Company’s Common Sharescommon shares that may be issued upon exercise of options, warrants and rights granted, and shares remaining available for issuance, under all of the Company’s existing equity compensation plans, including the 2015 Omnibus Incentive Plan and the 2016Non-Employee Directors’ Compensation Plan. | Plan Category | | Number
of securities to be
issued upon
exercise of
outstanding options
warrants and
rights | | | Weighted average
exercise price of
outstanding options
warrants and rights | | | Number of securities
remaining available for
future issuance under
equity compensation
plans | | | Number
of securities to be
issued upon
exercise of
outstanding options
warrants and rights | | | Weighted average
exercise price of
outstanding options
warrants and rights | | | Number of securities
remaining available for
future issuance under
equity compensation
plans | | | | Equity compensation plans approved by shareholders | | | - | | | $ | -0- | | | | 814,203 | | | - | | | $ | -0- | | | 771,004 | (1) | | | Equity compensation plans not approved by shareholders | | | - | | | | n/a | | | | - | | | - | | | n/a | | | - | | | | | | | | | | | | | | | | | | | | | | | | | | | | | | | | | | | | Total | | | - | | | $ | -0- | | | | 814,203 | | | - | | | $ | -0- | | | 771,004 | | |
| (1) | This amount reflects that an aggregate of 725,004 shares were reserved for issuance under the 2015 Omnibus Incentive Plan pursuant to performance share awards outstanding at December 31, 2021, which amount, for purposes of this table, assumes the maximum amount of shares will be earned under such awards, even though the actual payout under such awards may be less than maximum. |
| ITEM 13. | CERTAIN RELATIONSHIPS AND RELATED TRANSACTIONS, AND RELATED TRANSACTIONS, AND DIRECTOR INDEPENDENCE |
Attention is directed to the section “Board of Directors and Board Committees” and “Related Party Transactions” in the Company’s definitive Notice of 20182022 Annual Meeting of Shareholders and related Proxy Statement (filed with the SEC pursuant to Regulation 14A not later than 120 days after the end of the fiscal year covered by this Form10-K), which is incorporated herein by this reference. The Company has no relationships or transactions required to be reported by Item 404 of RegulationS-K. | ITEM 14. | PRINCIPAL ACCOUNTING FEES AND SERVICES | PRINCIPAL ACCOUNTING FEES AND SERVICES |
Attention is directed to the section “Ratification of Appointment of Independent Registered Public Accounting Firm” in the Company’s definitive Notice of 20182022 Annual Meeting of Shareholders and related Proxy Statement (filed with the SEC pursuant to Regulation 14A not later than 120 days after the end of the fiscal year covered by this Form10-K), which is incorporated herein by this reference. Information about aggregate fees billed to the Company by its independent registered public accounting firm, Ernst & Young LLP (PCAOB ID No. 42) will be included in the above referenced section of the Company’s definitive Notice of 2022 Annual Meeting of Shareholders and related Proxy Statement under the caption “Fees paid to Auditors” and that information is incorporated herein by this reference. PART IV | ITEM 15. | EXHIBITS AND FINANCIAL STATEMENT SCHEDULES |
(a) | (1) | | | | | | (a) | | | (1) | | | The Index to Consolidated Financial Statements of the Registrant under Item 8 of this Report is incorporated herein by reference as the list of Financial Statements required as part of this Report. | | (2) | | (2) | | | All financial statement schedules for which provision is made in the applicable accounting regulation of the Securities and Exchange Commission are not required under the related instructions or are inapplicable, or the information required to be set forth therein is included in the consolidated financial statementsConsolidated Financial Statements or Notes thereto. | | | | (3) | | | (3) | Exhibits — The exhibit list in the Exhibit Index is incorporated by reference as the list in the Exhibit Index is incorporated by referenceof exhibits required as the listpart of exhibitsthis Report. |
required as part of this Report.
|