revenue bonds or certificates of participation secured by an annual lease payment that is subject to annual orbi-annual legislative appropriations.
We may also act as a source of financing or as a facilitator with respect to the financing of the construction of a facility. In these cases, the construction of such facilities may be financed through various methods including the following:
funds from equity offerings of our stock;
cash on hand and/or cash flows from our operations;
borrowings by us from banks or other institutions (which may or may not be subject to government guarantees in the event of contract termination);
funds from debt offerings of our notes; or
lease arrangements with third parties.
If the project is financed using direct governmental appropriations, with proceeds of the sale of bonds or other obligations issued prior to the award of the project, then financing is in place when the contract relating to the construction or renovation project is executed. If the project is financed using project-specifictax-exempt bonds or other obligations, the construction contract is generally subject to the sale of such bonds or obligations. Generally, substantial expenditures for construction will not be made on such a project until thetax-exempt bonds or other obligations are sold; and, if such bonds or obligations are not sold, construction and therefore, management of the facility, may either be delayed until alternative financing is procured or the development of the project will be suspended or entirely canceled. If the project is self-financed by us, then financing is generally in place prior to the commencement of construction.
Under our construction and design management contracts, we generally agree to be responsible for overall project development and completion. We typically act as the primary developer on construction contracts for facilities and subcontract with bonded National and/or Regional Design Build Contractors. Where possible, we subcontract with construction companies that we have worked with previously. We make use of anin-house staff of architects and operational experts from various correctional disciplines (e.g. security, medical service, food service, inmate programs and facility maintenance) as part of the team that participates from conceptual design through final construction of the project. This staff coordinates all aspects of the development with subcontractors and provides site-specific services.
When designing a facility, our architects use, with appropriate modifications, prototype designs we have used in developing prior projects. We believe that the use of these designs allows us to reduce the potential of cost overruns and construction delays and to reduce the number of correctional officers required to provide security at a facility, thus controlling costs both to construct and to manage the facility. Our facility designs also maintain security because they increase the area under direct surveillance by correctional officers and make use of additional electronic surveillance.
The following table sets forth our current expansion and development projectprojects and its stagetheir stages of completion for the Company’s facilities:
Facilities Under Construction | Number of Beds | Estimated Completion Date | Customer | Financing | ||||||||||||
| Q4 | New South Wales Corrective Services | New South Wales Corrective Services | |||||||||||||
Fulham Correctional Centre | 137 | State of Victoria, Australia | GEO | |||||||||||||
Competitive Strengths
Leading Corrections Provider Uniquely Positioned to Offer a Continuum of Care
We are the second largest provider of public-private partnership correctional and detention facilities worldwide and the largest provider of community-based reentry services, youth services and electronic monitoring services in the U.S. corrections industry. We believe these leading market positions and our diverse and complementary service offerings enable us to meet the growing demand from our clients for comprehensive services throughout the entire corrections lifecycle. Our continuum of care platform enables us to provide consistency and continuity in case management, which we believe results in a higher quality of care for offenders, reduces recidivism, lowers overall costs for our clients, improves public safety and facilitates successful reintegration of offenders back into society. We have continued to expand our GEO continuum of care platform by doubling our annual expenditure commitment from $5 million annually to $10 million beginning in 2017.
Attractive REIT Profile
We believe the key characteristics of our business make us a highly attractive REIT. We are in a real estate intensive industry. Since our inception, we have financed and developed dozens of facilities. We have a diversified set of investment grade customers in the form of government agencies which are required to pay us on time by law. We have historically experienced customer retention in excess of 90%. Our strong and predictable occupancy rates generate a stable and sustainable stream of revenue. We believe this stream of revenue combined with our low maintenance capital expenditure requirement translates into steady predictable cash flow. The REIT structure also allows us to pursue growth opportunities due to the capital intensive nature of the corrections/detention business.
Large Scale Operator with National Presence
We operate the seventh largest correctional system in the U.S. by number of beds, including the federal government and all 50 states. We currently have correctional operations in approximately 33 states and offer electronic monitoring services in every state. In addition, we have extensive experience in overall facility operations, including staff recruitment, administration, facility maintenance, food service, security, and in the supervision, treatment and education of inmates. We believe our size and breadth of service offerings enable us to generate economies of scale which maximize our efficiencies and allows us to pass along cost savings to our clients. Our national presence also positions us to bid on and develop new facilities across the U.S.
Long-Term Relationships with High-Quality Government Customers
We have developed long-term relationships with our federal, state and other governmental customers, which we believe enhance our ability to win new contracts and retain existing business. We have provided correctional and detention management services to the United States Federal Government for 3132 years, the State of California for 3031 years, the State of Texas for approximately 3031 years, various Australian state government entities for 2627 years and the State of Florida for approximately 2425 years. These customers accounted for approximately 69.6%69% of our consolidated revenues for the fiscal year ended December 31, 2017.2018.
Recurring Revenue with Strong Cash Flow
Our revenue base is derived from our long-term customer relationships, with contract renewal rates and facility occupancy rates both approximating 90% over the past five years. We have been able to expand our revenue base by continuing to reinvest our strong operating cash flow into expansionary projects and through strategic acquisitions that provide scale and further enhance our service offerings. Our consolidated revenues have grown from $877 million in 2007 to $2.3 billion in 2017.2018. We expect our operating cash flow to be well in
excess of our anticipated annual maintenance capital expenditure needs, which would provide us significant flexibility for growth in capital expenditures, future dividend payments in connection with operating as a REIT, acquisitions and/or the repayment of indebtedness.
Sizeable International Business
Our international infrastructure, which leverages our operational excellence in the U.S., allows us to aggressively target foreign opportunities that our U.S. based competitors without overseas operations may have difficulty pursuing. We currently have international operations in Australia, South Africa and the United Kingdom. Our international services business generated approximately $311$253.9 million of revenues, representing approximately 14%11% of our consolidated revenues for the year ended December 31, 2017.2018. Included in our international revenues in 2017 and 2016 are construction revenues related to our prison project in Ravenhall, Australia which are presented in our Facility Design & Construction segment. Construction of the facility was completed during the fourth quarter of 2017. We believe we are well positioned to continue benefiting from foreign governments’ initiatives to outsource correctional services.
Experienced, Proven Senior Management Team
Our Chief Executive Officer and founder, George C. Zoley, Ph.D., has led our Company for 3334 years and has established a track record of growth and profitability. Under his leadership, our annual consolidated revenues from operations have grown from $40.0 million in 1991 to $2.3 billion in 2017.2018. Dr. Zoley is one of the pioneers of the industry, having developed and opened what we believe to be one of the first public-private partnership detention facilities in the U.S. in 1986. Our Chief Financial Officer, Brian R. Evans, has been with our Company for over 1718 years and has led our conversion to a REIT as well as the integration of our recent acquisitions and financing activities. Our top seven senior executives have an average tenure with our Company of over 119 years.
Business Strategies
Provide High Quality, Comprehensive Services and Cost Savings Throughout the Corrections Lifecycle
Our objective is to provide federal, state and local governmental agencies with a comprehensive offering of high quality, essential services at a lower cost than they themselves could achieve. We believe government agencies facing budgetary constraints will increasingly seek to outsource a greater proportion of their correctional needs to reliable providers that can enhance quality of service at a reduced cost. We believe our expanded and diversified service offerings uniquely position us to bundle our high quality services and provide a comprehensive continuum of care for our clients, which we believe will lead to lower cost outcomes for our clients and larger scale business opportunities for us.
Maintain Disciplined Operating Approach
We refrain from pursuing contracts that we do not believe will yield attractive profit margins in relation to the associated operational risks. In addition, although we engage in facility development from time to time without having a corresponding management contract award in place, we endeavor to do so only where we have determined that there is medium to long-term client demand for a facility in that geographical area. We have also elected not to enter certain international markets with a history of economic and political instability. We believe that our strategy of emphasizing lower risk and higher profit opportunities helps us to consistently deliver strong operational performance, lower our costs and increase our overall profitability.
Pursue International Growth Opportunities
As a global provider of privatized correctional services, we are able to capitalize on opportunities to operate existing or new facilities on behalf of foreign governments. We have seen increased business development
opportunities including opportunities to cross sell our expanded service offerings in recent years in the international markets in which we operate and are currently exploring opportunities for several new projects. We will continue to actively bid on new international projects in our current markets and in new markets that fit our target profile for profitability and operational risk.
Selectively Pursue Acquisition Opportunities
We intend to continue to supplement our organic growth by selectively identifying, acquiring and integrating businesses that fit our strategic objectives and enhance our geographic platform and service offerings. Since 2005, and including the acquisitions of CEC,Community Education Centers (“CEC”), Protocol Criminal Justice, Inc. (“Protocol”), Soberlink, Inc. (“Soberlink”) and the correctional and detention facilities of LCS Corrections Services, Inc. (“LCS FacilitiesFacilities” or “LCS”), we have completed ten acquisitions for total consideration, including debt assumed, in excess of $2.0 billion. Our management team utilizes a disciplined approach to analyze and evaluate acquisition opportunities, which we believe has contributed to our success in completing and integrating our acquisitions.
Facilities and Day Reporting Centers
The following table summarizes certain information with respect to: (i) U.S. and international detention and corrections facilities; (ii) community-based services facilities; and (iii) residential andnon-residential youth services facilities. The information in the table includes the facilities that we (or a subsidiary or joint venture of GEO) owned, operated under a management contract, had an agreement to provide services, had an award to manage or was in the process of constructing or expanding during the year ended December 31, 2017:2018:
Facility Name & Location | Primary Customer | Facility Type | Security Level | Commencement of Current Contract (2) | Base Period | Renewal Options | Managed Leased/ Owned | |||||||||
Corrections & Detention — Western Region: | ||||||||||||||||
Adelanto Detention Facility, Adelanto, CA (3) | 1,940 | ICE - IGA | Federal Detention | Minimum/ Medium | May 2011 | 5 years | 5 years | Owned | ||||||||
Alhambra City Jail, Los Angeles, CA | 71 | Alhambra | City Jail | All Levels | July 2016 | 1 year | Five, One Year | Managed | ||||||||
Arizona State-Prison Florence West Florence, AZ | 750 | AZ DOC | State DUI/ RTC Correctional | Minimum | October 2002 | 10 years | Two, Five-year | Managed | ||||||||
Arizona State Prison Kingman, AZ | 3,400 | AZ DOC | State Correctional Facility | Minimum/ Medium | January 2008 | 10 years | Two, Five-year | Managed | ||||||||
Arizona State-Prison Phoenix West Phoenix, AZ | 500 | AZ DOC | State DWI Correctional | Minimum | July 2002 | 10 years | Two, Five-year | Managed | ||||||||
| Aurora/ICE Processing Center Aurora, CO | 1,532 | ICE / USMS | Federal Detention | All Levels | September 2011/ October 2012 | 2 years / 2 years | Four, Two-year /
| Owned | ||||||||
| Baldwin Park City Jail, Baldwin Park, CA | 32 | Los Angeles County | City Jail | All Levels | July 2003 | 3 years | Perpetual, Three- year | Managed | ||||||||
| Central Arizona Correctional Facility Florence, AZ | 1,280 | AZ DOC | State Sex Offender Correctional | Minimum/ Medium | December 2006 | 10 years | Two, Five-year | Managed | ||||||||
| Central Valley MCCF McFarland, CA | 700 | CDCR | State Correctional Facility | Medium | None | Owned | ||||||||||
| Desert View MCCF Adelanto, CA | 700 | CDCR | State Correctional Facility | Medium | None | Owned | ||||||||||
| Downey City Jail Los Angeles, CA | 33 | Los Angeles County | City Jail | All Levels | November 2014 | 3 years | Two, One-year | Managed | ||||||||
| Fontana City Jail Los Angeles, CA | 25 | Los Angeles County | City Jail | All Levels | February 2007 | 5 months | Five, One-year, Three One-year, plus One Three-year, Plus One One-year | Managed | ||||||||
| Garden Grove City Jail Los Angeles, CA | 16 | Los Angeles County | City Jail | All Levels | July 2015 | 3 years | Unlimited, Perpetual Three-Year | Managed | ||||||||
| Golden State MCCF McFarland, CA | 700 | CDCR | State Correctional | Medium | None | Owned | ||||||||||
Facility Name & Location | Primary Customer | Facility Type | Security Level | Commencement of Current Contract (2) | Base Period | Renewal Options | Managed Leased/ Owned | |||||||||
| Guadalupe County Correctional Facility Santa Rosa, NM (3) | 600 | NMCD - IGA | Local/State Correctional | Medium | January 1999 | Perpetual | None | Owned | ||||||||
| Hudson Correctional Facility Hudson, CO | 1,250 | Idle | Leased | |||||||||||||
| Lea County Correctional Facility Hobbs, NM (3) | 1,200 | NMCD - IGA | Local/State Correctional | Medium | None | Owned | ||||||||||
| McFarland Community Correctional Facility McFarland, CA | 300 | CDCR | State Correctional | Minimum | None | Owned | ||||||||||
| Mesa Verde Community Correctional Facility Bakersfield, CA (3) | 400 | ICE - IGA | State Correctional | Minimum | March 2015 | 5 Years | None | Owned | ||||||||
| Montebello City Jail Los Angeles, CA | 35 | Los Angeles County | City Jail | All Levels | July 2014 | 2 Years | One, Plus One, Two-year | Managed | ||||||||
| Northeast New Mexico Detention Facility Clayton, NM (3) | 625 | NMCD / IGA | Local/State Correctional | Medium | August 2008 | 21 Years, Eleven Months | Unlimited, One-Year | Managed | ||||||||
| Northwest Detention Center Tacoma, WA | 1,575 | ICE | Federal Detention | All Levels | September 2015 | 1 Year | Nine, One-Year | Owned | ||||||||
| Ontario City Jail Los Angeles, CA | 44 | Los Angeles County | City Jail | Any Level | July 2014 | 3 Years | Two, Three-year | Managed | ||||||||
| Western Region Detention Facility San Diego, CA | 770 | USMS | Federal Detention | Maximum |
| 10 Months | Leased | |||||||||
| Corrections & Detention — Central Region: | ||||||||||||||||
| Big Spring Correctional Center Big Spring, TX | 1,732 | BOP | Federal Correctional | Medium | December 2017 | 2 Years | Eight, One Year | Owned | ||||||||
| Flightline Correctional Center, TX | 1,800 | BOP | Federal Correctional | Medium | December 2017 | 2 Years | Eight, One Year | Owned | ||||||||
| Brooks County Detention Center, TX (3) | 652 | USMS - IGA | Local & Federal Detention | Medium | March 2013 | Perpetual | None | Owned | ||||||||
| Central Texas Detention Facility San Antonio, TX (3) | 688 | USMS - IGA | Local & Federal Detention | Minimum/ Medium | October 2016 | Perpetual | None | Managed | ||||||||
| Coastal Bend Detention Center,TX (3) | 1,176 | USMS - IGA | Local & Federal Detention | Medium | July 2012 | Perpetual | None | Owned | ||||||||
| Eagle Pass Correctional Facility, Eagle Pass, TX | 661 | ID DOC | Local & Federal Detention | Medium | October 2018 | 2 years | None | Owned | ||||||||
| East Hildago Detention Center (3) | 1,300 | USMS - IGA | Local & Federal Detention | Medium | July 2012 | Perpetual | None | Owned | ||||||||
Federal Correctional | Plus One Extension | |||||||||||||||
Facility Name & Location | Primary Customer | Facility Type | Security Level | Commencement of Current Contract (2) | Base Period | Renewal Options | Managed Leased/ Owned | |||||||||
| ||||||||||||||||
| Joe Corley Detention Facility Conroe, TX | 1,517 | USMS / ICE | Local Correctional | Medium | July 2008/
| 5 Years | None/ Five-year | Owned | ||||||||
| Karnes Correctional Center Karnes City, TX (3) | 679 | USMS - IGA | Local & Federal Detention | All Levels | February 1998 | Perpetual | None | Owned | ||||||||
| Karnes County Residential Center,TX (3) | 1,158 | ICE - IGA | Federal Detention | All Levels | December 2010 | 5 years | One, | Owned | ||||||||
| Kinney County Detention Center, TX (3) | 384 | USMS - IGA | Local & Federal Detention | Medium | September 2013 | Perpetual | None | Managed | ||||||||
| Lawton Correctional Facility Lawton, OK | 2,682 | OK DOC | State Correctional | Medium | Four, Automatic One-year | Owned | ||||||||||
| LIberty County Jail, TX (3) | 285 | USMA - IGA | Local & Federal Detention | Medium | May 1997 | Perpetual | None | Managed | ||||||||
| Local & Federal Detention | All levels | September 2018 | 10 months | Nine, One-year | Owned | |||||||||||
| Reeves County Detention Complex R3 Pecos, TX | 1,356 | BOP | Federal Correctional | Low |
| Managed | ||||||||||
| Rio Grande Detention Center Laredo, TX | 1,900 | USMS | Federal Detention | Medium | October 2008 | 5 years | Three, Five-year | Owned | ||||||||
| South Texas Detention Complex Pearsall, TX | 1,904 | ICE | Federal Detention | All Levels | December 2011 | 11 months | Four, One-year plus One, Six month extension, One Year extension, plus One extensions, plus One 5-day extension, Plus One 6-month extension | Owned | ||||||||
| Val Verde Correctional Facility Del Rio, TX (3) | 1,407 | USMS - IGA | Local & Federal Detention | All Levels | January 2001 | Perpetual | None | Owned | ||||||||
Corrections & Detention — Eastern Region: | ||||||||||||||||
| Alexandria Transfer Center Alexandria, LA (3) | 400 | ICE - IGA | Federal Detention | Minimum/ Medium | November 2013 | |||||||||||
|
| None | ||||||||||||||
| Bay Correctional Center Panama City, FL | 985 | FL DMS | State Correctional | Minimum/ Medium | February 2014 | 3 years | Unlimited, Two-year | Managed | ||||||||
Blackwater River Correctional Facility Milton, FL | 2,000 | FL DMS | State Correctional | Medium/ close | October 2010 | 3 years | Unlimited, Two-year | Managed | ||||||||
Facility Name & Location | Primary Customer | Facility Type | Security Level | Commencement of Current Contract (2) | Base Period | Renewal Options | Managed Leased/ Owned | |||||||||
| Broward Transition Center Deerfield Beach, FL | 700 | ICE | Federal Detention | Minimum | July 2015 | 1 year | Five, One-year plus One, Six-month extension | Owned | ||||||||
| Columbiana County Jail, OH | 200 | Columbiana County | State Correctional | All Levels | January 2014 | 2 years | Two, Two-year | Managed | ||||||||
| Crossroads Reception Center Indianapolis, IN | 300 | Idle | Owned | |||||||||||||
| D. Ray James Correctional Facility Folkston, GA | BOP | Federal Detention | All Levels | October 2010 | 4 years | Three, Two-year | Owned | |||||||||
| Folkston ICE Processing Center (3) Folkston, GA | ICE - IGA | Federal Detention | Minimum | December 2016 | 1 year | Four, One-year | Owned | |||||||||
| George W. Hill Correctional Facility, PA | 1,931 | Delaware County | State Correctional | Minimum | January | 5 years | Two-year options | Managed | ||||||||
| Graceville Correctional Facility Jackson, FL | 1,884 | FL DMS | State Correctional | All Levels | February 2014 | 3 years | Unlimited, Two year | Managed | ||||||||
| Heritage Trails (Plainfield STOP) Plainfield, IN | 1,066 | IN DOC | State Correctional | Minimum | March 2011 | 4 years | One, | Managed | ||||||||
| JB Evans Correctional Center, LA | 388 | Idle | Owned | |||||||||||||
| LaSalle Detention Facility Jena, LA (3) | 1,160 | ICE - IGA | Federal Detention | Minimum/ Medium | November 2013 | Owned | ||||||||||
| Lawrenceville Correctional Center Lawrenceville, VA | 1,536 | VA DOC | State Correctional | Medium |
| 5 years | Ten, One-year | Managed | ||||||||
| Moshannon Valley Correctional Center Philipsburg, PA | BOP | Federal Correctional | Medium | April 2016 | 5 years | Five, One-year | Owned | |||||||||
| Moore Haven Correctional Facility Moore Haven, FL | 985 | FL DMS | State Correctional | Minimum/ Medium | February 2014 | 3 years | Unlimited, Two-year | Managed | ||||||||
| New Castle Correctional Facility New Castle, IN | 3,196 | IN DOC | State Correctional | All Levels | January 2006 | 4 years | Two, Five-year | Managed | ||||||||
| North Lake Correctional Facility Baldwin, MI | 1,748 | Idle | Owned | |||||||||||||
| Perry County Correctional Facility, AL | 690 | Idle | Owned | |||||||||||||
| Pine Prairie Correctional Center, LA (3) | 1,094 | State Correctional | Medium | June 2015 | 5 years | None | Owned | |||||||||
| Queens Private Detention Facility Jamaica, NY | 222 | USMS | Federal Detention | Minimum/ Medium | January 2008 | 2 years | Four, Two-year, One Six-month extension, plus One Three-month extension, plus Three Two-month extensions | Owned | ||||||||
Facility Name & Location | Capacity (1) | Primary Customer | Facility Type | Security Level | Commencement of Current Contract (2) | Base Period | Renewal Options | Managed Leased/ Owned | ||||||||
| Riverbend Correctional Facility Milledgeville, GA | 1,500 | GA DOC | State Correctional | Medium | July 2010 | 1 year | Forty, One-year | Owned | ||||||||
| Rivers Correctional Institution Winton, NC | 1,450 | BOP | Federal Correctional | Low | April 2011 | 4 years | Three, Two-year | Owned | ||||||||
| Robert A. Deyton Detention Facility Lovejoy, GA | 768 | USMS | Federal Detention | Medium | February 2008 | 5 years | Three, Five | Leased | ||||||||
| ||||||||||||||||
| South Bay Correctional Facility South Bay, FL | 1,948 | FL DMS | State Correctional | Medium/ Close | July 2009 | 3 years | Unlimited, Two-year | Managed | ||||||||
| South Louisiana Correctional Center, LA(3) | 1,000 | Idle | Owned | |||||||||||||
| Corrections & Detention — Australia: | ||||||||||||||||
| Arthur Gorrie Correctional Centre Queensland, Australia | 890 | QLD DCS | State Remand Prison | High/ Maximum | January 2008 | 5 years | One, Five-year, | Managed | ||||||||
| Fulham Correctional Centre & Nalu Challenge Community Victoria, Australia | 785 | VIC DOJ | State Prison | Minimum/ Medium | July 2012 | 4 years | 19 years, Four months | Managed | ||||||||
| Junee Correctional Centre New South Wales, Australia | NSW | State Prison | Minimum/ Medium | March 2014 | 5 years | Two, Five | Managed | |||||||||
| Parklea Correctional Centre Sydney, Australia | 823 | NSW | State Remand Prison | All Levels | October 2009 | 5 years | One, Three year, | Managed | ||||||||
| Ravenhall Correctional Centre Melbourne, Australia | 1,300 | VIC DOJ | State Prison | Medium | November 2017 | 24 years plus 5 months | None | Managed | ||||||||
| Corrections & Detention — United Kingdom: | ||||||||||||||||
| Dungavel House Immigration Removal Centre, South Lanarkshire, UK | 249 | UKBA | Detention Centre | Minimum | September 2011 | 5 years | Three, One two-year | Managed | ||||||||
| Corrections & Detention — South Africa: | ||||||||||||||||
Kutama-Sinthumule Correctional Centre Limpopo Province, Republic of South Africa | 3,024 | RSA DCS | National Prison | Maximum | February 2002 | 25 years | None | Managed | ||||||||
| Corrections & Detention — Canada: | ||||||||||||||||
New Brunswick Youth Centre Mirimachi,
| N/A | PNB | Provincial Juvenile Facility | All Levels | October 1997 | 25 years | One, Ten-year | Managed | ||||||||
| GEO Care — Community Based Services: | ||||||||||||||||
| ADAPPT, PA | 186 | PA DOC | Community Corrections | Community | July 2013 | 3 years | Two, | |||||||||
Three | ||||||||||||||||
extension | Owned | |||||||||||||||
Facility Name & Location | Primary Customer | Facility Type | Security Level | Commencement of Current Contract (2) | Base Period | Renewal Options | Managed Leased/ Owned | |||||||||
| Alabama Therapeutic Education Facility, AL | 724 | AL DOC | Community Corrections | Community | August 2017 | 2 years / 2 years | None | Owned | ||||||||
| Albert “Bo” Robinson Assessment & Treatment Center, NJ | 900 | NJ DOC/NJ State Parole Board/ Gloucester | Community Corrections | Community | July 2016/ July 2014 | 2 years / 3 years | Two, One year / | Owned | ||||||||
| Alle Kiski Pavillion, PA | 104 | PA DOC | Community Corrections | Community | July 2013 | 3 years | Two, One year, Plus One Three month extension, Plus one Four month extension | Owned | ||||||||
| Arapahoe County Residential Center, CO | 240 | CO DOC | Community Corrections | Community | July 2018 | 1 year / 3 years | One, 2 month- extension | Owned | ||||||||
| Beaumont Transitional Treatment Center Beaumont, TX | 180 | TDCJ | Community Corrections | Community | September 2003 | 2 years | Five, plus Five, | Owned | ||||||||
| Broad Street, PA | 116 | Idle | Leased | |||||||||||||
| Bronx Community reentry Center Bronx, NY | BOP | Community Corrections | Community | August 2014 | 1 year | One-year, Plus One, One-year and three months, Plus Two, One year Options | Leased | |||||||||
| Casper Reentry Center, WY | 342 | BOP/ of Indian Affairs/ Natrona | Community Corrections | Community | January January April June 2018 | 1 months/ 1 2 years | Four, One year / One Year / One, Five month extension, Plus One, One month, Plus One, Three month extension, Plus one | Owned | ||||||||
| Chester County, PA | PA DOC | Community Corrections | Community | July July 2018 | 3 1 year | Two, Plus One Three month extension. Plus one None | Leased | |||||||||
| Cheyenne Mountain Recovery Center, CO | 750 | CO DOC | Community Corrections | Community | July | 1 year | Four, One-year | |||||||||
| ||||||||||||||||
| ||||||||||||||||
| Owned | |||||||||||||||
Facility Name & Location | Primary Customer | Facility Type | Security Level | Commencement of Current Contract (2) | Base Period | Renewal Options | Managed Leased/ Owned | |||||||||
| Coleman Hall, PA | 350 | Idle | Owned | |||||||||||||
| Community Alternatives of El Paso County, CO | 240 | CO DOC | Community Corrections | Community | July 2018 | 1 year | None | Owned | ||||||||
| Correctional Alternative Placement Services, CO | 45 | CO DOC | Community Corrections | Community | July 2018 | 4 years | None | Owned | ||||||||
| Community Alternatives of the Black Hills, SD | 68 | SD DOC / BOP | Community Corrections | Community | October 2016 | 1 year | Nine / Four, plus | Owned | ||||||||
| Cordova Center Anchorage, AK | 296 | BOP / AK DOC | Community Corrections | Community | January 2013/ March 2013 | 2 years / 4 months | Three, One-year plus One, Six month, plus one, one year renewal / Four, Five month, One month, Five Month, | Owned | ||||||||
| Delaney Hall, NJ | 1,200 | Union & Essex Counties | Community Corrections | Community | January 2017/ January | 1 year/5 year | One, Six month plus Two, One year options/ | Owned | ||||||||
| El Monte Center El Monte, CA | 70 | BOP | Community Corrections | Community | July 2013 | 1 year | Three, One year plus One, Four Option, Plus year option, | Leased | ||||||||
| Grossman Center Leavenworth, KS | 150 | BOP | Community Corrections | Community | November 2012 | 2 years | Three, One-year, One 6 month, plus One, One-year extension | Leased | ||||||||
| Hoffman Hall, PA | 400 | Idle | Owned | |||||||||||||
| Las Vegas Community Correctional Center Las Vegas, NV | 124 | BOP | Community Corrections | Community | February 2016 | 1 year | Four, One-year extensions | Owned | ||||||||
Facility Name & Location | Capacity (1) | Primary Customer | Facility Type | Security Level | Commencement of Current Contract (2) | Base Period | Renewal Options | Managed Leased/ Owned | ||||||||
| Leidel Comprehensive Sanction Center Houston, TX | 190 | BOP | Community Corrections | Community | January 2016 | 1 year | Four, One year | Owned | ||||||||
| Logan Hall, NJ | 442 | NJ State Parole Essex Counties | Community Corrections | Community | July 2014 | 3 years | Leased | |||||||||
| Long Beach Community Reentry Center, CA | 112 | CDCR | Community Corrections | Community | January 2017 | 2 years 5 months and 9 days | Two, One-year | Leased | ||||||||
| Marvin Gardens Center Los Angeles, CA | 60 | BOP | Community Corrections | Community | Leased | |||||||||||
| McCabe Center Austin, TX | 113 | Third Party Tenant | Community Corrections | Community | N/A | N/A | N/A | Owned | ||||||||
| Mid Valley House Edinburg, TX | 128 | BOP | Community Corrections | Community | July 2014 | 1 year | Plus One-year and three months, Plus Two, One year options | Owned | ||||||||
| Midtown Center Anchorage, AK | 32 | AK DOC | Community Corrections | Community Corrections | March 13 | 4 months | Four, plus One Five month plus Two One extensions, plus One, Five month, plus one month, plus three, one month extensions | Owned | ||||||||
| New Mexico Mens Recovery Academy, NM | 174 | NM DOC | Community Corrections | Community Corrections | July 2015 | 4 years | None | Managed | ||||||||
| New Mexico Womens Recovery Academy, NM | 60 | NM DOC | Community Corrections | Community Corrections | July 2015 | 4 years | None | Managed | ||||||||
| Northstar Center Fairbanks, AK | 143 | AK DOC | Community Corrections | Community | September 2016 | 10 months | Leased | |||||||||
| Oakland Center Oakland, CA | 69 | BOP | Community Corrections | Community | November 2008 | 3 years | Seven, | |||||||||
extension | Owned | |||||||||||||||
| Parkview Center Anchorage, AK | 112 | Owned | ||||||||||||||
Facility Name & Location | Customer | Level | of Current Contract (2) | Period | Managed Leased/ Owned | |||||||||||
| Reality House Brownsville, TX | 94 | BOP | Community Corrections | Community | 2011 | 2 year | Three, One-year, Two Six month, One, Eight month, One, Seven month extension, plus One extension | Owned | ||||||||
| Roth Hall, PA | 136 | Idle | Leased | |||||||||||||
| Salt Lake City Center Salt Lake City, UT | 115 | BOP | Community Corrections | Community | June 2016 | 1 year | Four One-year | Leased | ||||||||
| Scranton Facility, PA | PA DOC | Community Corrections | Community | July 2013 | 3 years | Two, Plus One Three month extension, Plus one Four month extension | ||||||||||
| Seaside Center Nome, AK | AK DOC | Community Corrections | Community | February 2014 | 5 months | Four, plus One-Five month extension | ||||||||||
| Owned | |||||||||||||||
| Southeast Texas Transitional Center Houston, TX | 500 | TDCJ | Community Corrections | Community | September 2003 | 2 years | Five, two-year plus Five one-year | Owned | ||||||||
| Talbot Hall, NJ | 536 | NJ DOC | Community Corrections | Community | July 2016 | 2 years | One, one-year | Leased | ||||||||
| The Harbor, NJ | 260 | NJ DOC | Community Corrections | Community | 2 years | One, one-year | Leased | |||||||||
| Toler | 113 | BOP | Community Corrections | Community | May 2012 | 2 years | Three, One-year, Plus Two 6 month extensions, plus extension, plus Two 6-month extensions | Leased | ||||||||
| Tooley Hall, CO | 70 | City & County of | Community Corrections | Community | July | 1 year | None | Owned | ||||||||
| Tully House, NJ | 344 | NJ DOC | Community Corrections | Community | July 2016 | 2 years | One, one-year | Owned | ||||||||
Facility Name & Location | Capacity (1) | Primary Customer | Facility Type | Security Level | Commencement of Current Contract (2) | Base Period | Renewal Options | Managed Leased/ Owned | ||||||||
| Taylor Street Center San Francisco, CA | BOP / CDCR | Community Corrections | Community | April 2016 / | 1 3 years | Four, Two, One year Options | Owned | |||||||||
| Tundra Center Bethel, AK | 85 | AK DOC | Community Corrections | Community | February 2012 | 5 months | Four, One-year plus Six-month, plus One extension, plus One, Three- month, plus One, One Month, plus Three, One month extensions, plus three, one-month extensions | Owned | ||||||||
| Walker Hall, PA | 100 | Leased | ||||||||||||||
| Williams Street Center, CO | 84 | City & County of Denver | Community Corrections | Community | July | 1 year | None | Owned | ||||||||
| GEO Care — Youth Services: | ||||||||||||||||
| Residential Facilities | ||||||||||||||||
| Abraxas Academy Morgantown, PA | 214 | Various | Youth Residential | Secure | June 2005 | Owned | ||||||||||
| Abraxas I Marienville, PA | 204 | Various | Youth Residential | Staff Secure | May 2005 | Owned | ||||||||||
| Abraxas Ohio Shelby, OH | 100 | Various | Youth Residential | Staff Secure | June 2005 | Owned | ||||||||||
| Abraxas Youth Center South Mountain, PA | 72 | PA Dept of Public Welfare | Youth Residential | Secure/ Staff Secure | June 2005 | Leased | ||||||||||
| Camp Aspen, SC | 36 | SC Dept. of Juvenile Justice | Youth Residential | Staff Secure | August 2014 | 1 year | Unlimited, One-year | Managed | ||||||||
| DuPage Interventions Hinsdale, IL | 36 | Idle | Owned | |||||||||||||
| Hector Garza Center San Antonio, TX | 139 | TYC | Youth Residential | Staff Secure | June 2005 | Owned | ||||||||||
| Leadership Development Program South Mountain, PA | 128 | Various | Youth Residential | Staff Secure | June 2005 | None | None | Leased | ||||||||
| Southern Peaks Regional Treatment Center Canon City, CO | 136 | Various | Youth Residential | Staff Secure | June 2005 | None | None | Owned | ||||||||
| Southwood Interventions Chicago, IL | 80 | IL DASA, City of Chicago, Medicaid | Youth Residential | Staff Secure | June 2005 | None | None | Owned | ||||||||
| Woodridge Interventions Woodridge, IL | 90 | IL DASA, Medicaid | Youth Residential | Staff Secure | June 2005 | None | None | Owned | ||||||||
Facility Name & Location | Capacity(1) | Primary Customer | Facility Type | Security Level | Commencement of Current Contract (2) | Base Period | Renewal Options | Managed Leased/ Owned | ||||||||
| Leadership Development Program South Mountain, PA | 128 | Various | Youth Residential | Staff Secure | June 2005 | N/A | N/A | Leased | ||||||||
| Southern Peaks Regional Treatment Center Canon City, CO | 136 | Various | Youth Residential | Staff Secure | June 2005 | N/A | N/A | Owned | ||||||||
| Southwood Interventions Chicago, IL | 80 | IL DASA, City of Chicago, Medicaid | Youth Residential | Staff Secure | June 2005 | N/A | N/A | Owned | ||||||||
| Woodridge Interventions Woodridge, IL | 90 | IL DASA, Medicaid | Youth Residential | Staff Secure | June 2005 | N/A | N/A | Owned | ||||||||
| GEO Care — Youth Services: | ||||||||||||||||
| Non-residential Facilities: | ||||||||||||||||
| Abraxas Counseling Center Columbus, OH | 175 | Various | Youth Non- residential | Open | 2008 | N/A | N/A | Lease | ||||||||
| Cleveland Counseling Center Cleveland, OH | 75 | Various | Youth Non-residential | Open | 2014 | N/A | N/A | Lease | ||||||||
| Cincinnati Counseling Center Cincinnati, OH | 125 | City of Cincinnati | Youth Non- residential | Open | 2012 | N/A | N/A | Lease | ||||||||
| Harrisburg Community-Based Programs Harrisburg, PA | 77 | Dauphin or Cumberland Counties | Youth Non- residential | Open | 1995 | N/A | N/A | Lease | ||||||||
| Lehigh Valley Community-Based Programs Lehigh Valley, PA | 30 | Lehigh and Northampton Counties | Youth Non- residential | Open | 1987 | N/A | N/A | Lease | ||||||||
| Mansfield Counseling Center, OH | 25 | Richland County, Ohio | Youth Non- residential | Open | 2015 | N/A | N/A | Lease | ||||||||
| WorkBridge Pittsburgh, PA | 690 | Allegheny County | Youth Non- residential | Open | 1987 | N/A | N/A | Lease | ||||||||
Facility Name & Location | Capacity (1) | Primary Customer | Facility Type | Security Level | Commencement of Current Contract (2) | Base Period | Renewal Options | Managed Leased/ Owned | ||||||||
| GEO Care — Youth Services: | ||||||||||||||||
| Non-residential Facilities: | ||||||||||||||||
| Cleveland Counseling Center Cleveland, OH | 115 | Various | Youth Non- residential | Open | 2014 | N/A | N/A | Lease | ||||||||
| Harrisburg Community-Based Programs Harrisburg, PA | 77 | Dauphin or Cumberland Counties | Youth Non- residential | Open | 1995 | N/A | N/A | Lease | ||||||||
| Lehigh Valley Community-Based Programs Lehigh Valley, PA | 30 | Lehigh and Northampton Counties | Youth Non- residential | Open | 1987 | N/A | N/A | Lease | ||||||||
| WorkBridge Pittsburgh, PA | 690 | Allegheny County | Youth Non- residential | Open | 1987 | N/A | N/A | Lease | ||||||||
The following table summarizes certain information with respect to our reentry Day Reporting Centers, which we refer to as DRCs. The information in the table includes the DRCs that we (or a subsidiary or joint venture of GEO) operated under a management contract or had an agreement to provide services as of December 31, 2017:2018:
DRC Location | Number of reporting centers | Type of Customers | Commencement of current contract(s) | Base period | Renewal options | Manage only/ lease | Number of reporting centers | Type of Customers | Commencement of current contract(s) | Base period | Renewal options | Manage only/ lease | ||||||||||||
| Colorado (5) | 7 | State, County | Various, 2004 – 2012 | Various, 1 year to 18 months | One to Four, One year | Lease | 6 | State, County | Various, 2015 – 2018 | 1 year | Varies | Lease | ||||||||||||
| California | 29 | State, County | Various, 2007 – 2012 | Various, 1 to 5 years | Varies | Lease or Manage only | 26 | State, County | 2017 | 3 years | One, One year | Lease or Manage only | ||||||||||||
| New Jersey | 5 | State, County | 2008 | 3 years | Two, One year | Lease | 5 | State, County | 2015 | 4 years | One, One year | Lease | ||||||||||||
| Pennsylvania | 10 | State, County | Various, 2006 – 2010 | Various, 1 to 3 years | Indefinite, One year | Lease | 9 | State, County | Various, 2006 – 2018 | 3 to 5 years | Varies | Lease | ||||||||||||
| Illinois | 7 | State, County | 2003 | 5 years | One, Five year | Lease or Manage only | 7 | State, County | 2018 | 5 years | One, Five year | Lease or Manage only | ||||||||||||
| Kansas | 1 | County | 2011 | 4 years | Four, One year | Lease | 1 | County | 2016 | 1 year | Four, One year | Lease | ||||||||||||
| Louisiana | 3 | State | 2010 | 1 year | Two, One year | Lease | 5 | State | 2018 | 3 years | None | Lease | ||||||||||||
| Kentucky | 1 | County | 2010 | 2 years | Three, One year | Lease | 1 | County | 2015 | 1 year | Four, One year | Lease | ||||||||||||
| Virginia | 1 | State | 2013 | 2 years | Three, One year | Lease | ||||||||||||||||||
Customer Legend:
Abbreviation | Customer | |
| AK DOC | Alaska Department of Corrections | |
| AZ DOC | Arizona Department of Corrections | |
| BOP | Federal Bureau of Prisons | |
| CDCR | California Department of Corrections & Rehabilitation | |
| CO DOC | Colorado Department of Corrections | |
| FL DOC | Florida Department of Corrections | |
| FL DMS | Florida Department of Management Services | |
| GA DOC | Georgia Department of Corrections | |
| ICE | U.S. Immigration & Customs Enforcement | |
| ID DOC | Idaho Department of Corrections | |
| IN DOC | Indiana Department of Correction | |
| IGA | Inter-governmental Agreement | |
| IL DASA | Illinois Department of Alcoholism and Substance Abuse | |
| LA DOC | Louisiana Department of Corrections | |
| NJ DOC | New Jersey Department of Corrections | |
| New Mexico Department of Corrections | ||
| NSW | Commissioner of Corrective Services for New South Wales, Australia | |
| OK DOC | Oklahoma Department of Corrections | |
| PA DOC | Pennsylvania Department of Corrections | |
| PNB | Province of New Brunswick | |
| QLD DCS | Department of Corrective Services of the State of Queensland, Australia | |
| RSA DCS | Republic of South Africa Department of Correctional Services | |
| SC Dept of Juvenile Justice | South Carolina Department of Juvenile Justice | |
| SD DOC | South Dakota Department of Corrections | |
| TDCJ | Texas Department of Criminal Justice | |
| TYC | Texas Youth Commission | |
| UKBA | United Kingdom Border Agency | |
| USMS | United States Marshals Service | |
| VA DOC | Virginia Department of Corrections | |
| VIC DOJ | Department of Justice of the State of Victoria, Australia | |
| VT DOC | Vermont Department of Corrections | |
| WA DOC | Washington Department of Corrections |
| (1) | Capacity as used in the table refers to operational capacity consisting of total beds for all facilities except for the sevenNon-residential service centers under Youth Services for which we have provided service capacity which represents the number of juveniles that can be serviced daily. |
| (2) | For Youth ServicesNon-Residential Service Centers, the contract commencement date represents either the program start date or the date that the facility operations were acquired by our subsidiary. The service agreements under these arrangements provide for services on anas-contracted basis and there are no guaranteed minimum populations or management contracts with specified renewal dates. These arrangements are more perpetual in nature. For acquired operations, the commencement date is the original date of contract. |
| (3) | GEO provides services at these facilities through various Inter-Governmental Agreements, or IGAs, through the various counties and other jurisdictions. |
| (4) | The contract for this facility only requires GEO to provide maintenance services. |
| (5) | The Colorado Day Reporting Centers provide many of the same services as the full service Day Reporting Centers, but rather than providing these services through comprehensive treatment plans dictated by the governing authority, these services are provided on a fee for service basis. Such services may be connected |
| to government agency contracts and would be reimbursed by those agencies. Other services are offered directly to offenders allowing them to meet court-ordered requirements and are paid by the offender as the service is provided. |
Government Contracts — Terminations, Renewals and CompetitiveRe-bids
Generally, we may lose our facility management contracts due to one of three reasons: the termination by a government customer with or without cause at any time; the failure by a customer to renew a contract with us upon the expiration of the then current term; or our failure to win the right to continue to operate under a contract that has been competitivelyre-bid in a procurement process upon its termination or expiration. Our facility management contracts typically allow a contracting governmental agency to terminate a contract with or without cause at any time by giving us written notice ranging from 30 to 180 days. If government agencies were to use these provisions to terminate, or renegotiate the terms of their agreements with us, our financial condition and results of operations could be materially adversely affected. See “Risk Factors —“We are subject to the loss of our facility management contracts, due to terminations,non-renewals or competitivere-bids, which could adversely affect our results of operations and liquidity, including our ability to secure new facility management contracts from other government customers”.
Aside from our customers’ unilateral right to terminate our facility management contracts with them at any time for any reason, there are two points during the typical lifecycle of a contract which may result in the loss by us of a facility management contract with our customers. We refer to these points as contract “renewals” and contract“re-bids.” Many of our facility management contracts with our government customers have an initial fixed term and subsequent renewal rights for one or more additional periods at the unilateral option of the customer. Because most of our contracts for youth services do not guarantee placement or revenue, we have not considered these contracts to ever be in the renewal orre-bid stage since they are more perpetual in nature. As such, the contracts for youth services are not considered as renewals orre-bids nor are they included in the table below. We count each government customer’s right to renew a particular facility management contract for an additional period as a separate “renewal.” For example, a five-year initial fixed term contract with customer options to renew for five separate additionalone-year periods would, if fully exercised, be counted as five separate renewals, with one renewal coming in each of the five years following the initial term. As of December 31, 2017, 692018, 70 of our facility management contracts representing approximately 36,00031,000 beds are scheduled to expire on or before December 31, 2018,2019, unless renewed by the customer at its sole option in certain cases, or unless renewed by mutual agreement in other cases. These contracts represented 30.5%33.0% of our consolidated revenues for the year ended December 31, 2017.2018. We undertake substantial efforts to renew our facility management contracts. Our average historical facility management contract renewal rate approximates 90%. However, given their unilateral nature, we cannot assure you that our customers will in fact exercise their renewal options under existing contracts. In addition, in connection with contract renewals, either we or the contracting government agency have typically requested changes or adjustments to contractual terms. As a result, contract renewals may be made on terms that are more or less favorable to us than those in existence prior to the renewals.
We define competitivere-bids as contracts currently under our management which we believe, based on our experience with the customer and the facility involved, will bere-bid to us and other potential service providers in a competitive procurement process upon the expiration or termination of our contract, assuming all renewal options are exercised. Our determination of which contracts we believe will be competitivelyre-bid may in some cases be subjective and judgmental, based largely on our knowledge of the dynamics involving a particular contract, the customer and the facility involved. Competitivere-bids may result from the expiration of the term of a contract, including the initial fixed term plus any renewal periods, or the early termination of a contract by a customer. Competitivere-bids are often required by applicable federal or state procurement laws periodically in order to encourage competitive pricing and other terms for the government customer. Potential bidders in competitivere-bid situations include us, other private operators and other government entities. While we are pleased with our historical win rate on competitivere-bids and are committed to continuing to bid competitively
on appropriate future competitivere-bid opportunities, we cannot in fact assure you that we will prevail in future competitivere-bid situations. Also, we cannot assure you that any competitivere-bids we win will be on terms more favorable to us than those in existence with respect to the expiring contract.
As of December 31, 2017,fifty-one2018, 47 of our facility management contracts representing 12.7% and $287.4 millionas well as certain of our 2017 consolidated revenuesother management contracts that are also subject to competitivere-bid, including our contract to provide services to U.S. Immigration and Customs Enforcement (“ICE”) under the Intensive Supervision Appearance Program (“ISAP”), may be subject to competitivere-bid in 2018.2019. These contracts in the aggregate represented 17.7% and $412.0 million of our 2018 consolidated revenues. The following table sets
forth the number of facility management contracts that we currently believe will be subject to competitivere-bid in each of the next five years and thereafter, and the total number of beds relating to those potential competitivere-bid situations during each period:
Year | Re-bid | Total Number of Beds up for Re-bid | Re-bid | Total Number of Beds up for Re-bid | ||||||||||||
2018 | 51 | 11,433 | ||||||||||||||
2019 | 25 | 3,687 | 47 | 10,233 | ||||||||||||
2020 | 20 | 6,673 | 19 | 7,228 | ||||||||||||
2021 | 12 | 6,335 | 15 | 9,346 | ||||||||||||
2022 | 14 | 2,932 | 10 | 2,200 | ||||||||||||
2023 | 16 | 6,952 | ||||||||||||||
Thereafter | 55 | 37,738 | 57 | 39,346 | ||||||||||||
|
|
|
| |||||||||||||
Total | 177 | 68,798 | 164 | 75,305 | ||||||||||||
|
|
|
| |||||||||||||
Competition
We compete primarily on the basis of the quality and range of services we offer; our experience domestically and internationally in the design, construction, and management of privatized correctional and detention facilities; our reputation; and our pricing. We compete directly with the public sector, where governmental agencies responsible for the operation of correctional, detention, youth services, community basedcommunity-based services and reentry facilities are often seeking to retain projects that might otherwise be privatized. In the private sector, our U.S. Corrections & Detention and International Services business segments compete with a number of companies, including, but not limited to: Core Civic; Management and Training Corporation; Emerald Companies; LaSalle Southwest Corrections; Group 4 Securicor; Sodexo Justice Services (formerly Kaylx); and Serco. Our GEO Care business segment competes with a number of differentsmall-to-medium sized companies, reflecting the highly fragmented nature of the youth services and community based services industry. BI’s electronic monitoring business competes with a number of companies, including, but not limited to: G4 Justice Services, LLC; Elmo-Tech, a 3M Company; andPro-Tech,Electronic Monitoring, a 3M Company. Some of our competitors are larger and have more resources than we do. We also compete in some markets with small local companies that may have a better knowledge of the local conditions and may be better able to gain political and public acceptance.
Employees and Employee Training
At December 31, 2017,2018, we had 18,512approximately 22,000 full-time employees. Of our full-time employees, 646approximately 650 were employed at our corporate headquarters and regional offices and 17,866approximately 21,000 were employed at facilities and international offices. We employ personnel in positions of management, administrative and clerical, security, educational services, human services, health services and general maintenance at our various locations. Approximately 4,8595,000 and 1,7832,000 employees are covered by collective bargaining agreements in the United States and at international offices, respectively. We believe that our relations with our employees are satisfactory.
Under the laws applicable to most of our operations, and internal company policies, our correctional officers are required to complete a minimum amount of training. We generally require at least 40 hours ofpre-service
training before an employee is allowed to assume their duties plus an additional 120 hours of training during their first year of employment in our domestic facilities, consistent with ACA standards and/or applicable state laws. In addition to the usual 160 hours of training in the first year, most states require 40 or 80 hours ofon-the-job training. Florida law requires that correctional officers receive 520 hours of training. We believe that our training programs meet or exceed all applicable requirements.
Our training program for domestic facilities typically begins with approximately 40 hours of instruction regarding our policies, operational procedures and management philosophy. Training continues with an additional 120 hours of instruction covering legal issues, rights of inmates, techniques of communication and supervision, interpersonal skills and job training relating to the particular position to be held. Each of our
employees who has contact with inmates receives a minimum of 40 hours of additional training each year, and each manager receives at least 24 hours of training each year.
At least 160 hours of training are required for our employees in Australia and South Africa before such employees are allowed to work in positions that will bring them into contact with inmates. Our employees in Australia and South Africa receive a minimum of 40 hours of refresher training each year. In the United Kingdom, our corrections employees also receive a minimum of 240 hours of training prior to coming in contact with inmates and receive additional training of approximately 25 hours annually.
With respect to BI and the Intensive Supervision and Appearance Program (“ISAP”)ISAP services contract, new employees are required to complete training requirements as outlined in the contract within 14 days of hire and prior to being assigned autonomous ISAP related duties. These employees receive 25 hours of refresher training annually thereafter. Program managers for our ISAP contract must receive 24 hours of additional initial training. BI’s monitoring services maintains its own comprehensive certification and training program for all monitoring service specialists. We require all new personnel hired for a position in monitoring operations to complete a seven-week training program. Successful completion of our training program and a final certification is required of all of our personnel performing monitoring operations. We require that certification is achieved prior to being permitted to work independently in the call center.
Business Regulations and Legal Considerations
Many governmental agencies are required to enter into a competitive bidding procedure before awarding contracts for products or services. The laws of certain jurisdictions may also require us to award subcontracts on a competitive basis or to subcontract or partner with businesses owned by women or members of minority groups.
Certain states, such as Florida, deem correctional officers to be peace officers and require our personnel to be licensed and subject to background investigation. State law also typically requires correctional officers to meet certain training standards.
The failure to comply with any applicable laws, rules or regulations or the loss of any required license could have a material adverse effect on our business, financial condition and results of operations. Furthermore, our current and future operations may be subject to additional regulations as a result of, among other factors, new statutes and regulations and changes in the manner in which existing statutes and regulations are or may be interpreted or applied. Any such additional regulations could have a material adverse effect on our business, financial condition and results of operations.
Insurance
The nature of our business exposes us to various types of third-party legal claims, including, but not limited to, civil rights claims relating to conditions of confinement and/or mistreatment, sexual misconduct claims brought by prisoners or detainees, medical malpractice claims, product liability claims, intellectual property
infringement claims, claims relating to employment matters (including, but not limited to, employment discrimination claims, union grievances and wage and hour claims), property loss claims, environmental claims, automobile liability claims, contractual claims and claims for personal injury or other damages resulting from contact with our facilities, programs, electronic monitoring products, personnel or prisoners, including damages arising from a prisoner’s escape or from a disturbance or riot at a facility. In addition, our management contracts generally require us to indemnify the governmental agency against any damages to which the governmental agency may be subject in connection with such claims or litigation. We maintain a broad program of insurance coverage for these general types of claims, except for claims relating to employment matters, for which we carry no insurance. There can be no assurance that our insurance coverage will be adequate to cover all claims to which we may be exposed. It is our general practice to bring merged or acquired companies into our corporate master policies in order to take advantage of certain economies of scale.
We currently maintain a general liability policy and excess liability policies with total limits of $80.0 million per occurrence and in the aggregate covering the operations of U.S. Corrections & Detention, GEO Care’s community basedcommunity-based services, GEO Care’s youth services and BI. We have a claims-made liability insurance program with a specific loss limit of $35.0 million per occurrence and in the aggregate related to medical professional liability claims arising out of correctional healthcare services. We are uninsured for any claims in excess of these limits. We also maintain insurance to cover property and other casualty risks including, workers’ compensation, environmental liability and automobile liability.
For most casualty insurance policies, we carry substantial deductibles or self-insured retentions of $3.0 million per occurrence for general liability and medical professional liability, $2.0 million per occurrence for workers’ compensation and $1.0 million per occurrence for automobile liability. In addition, certain of our facilities located in Florida and other high-risk hurricane areas carry substantial windstorm deductibles. Since hurricanes are considered unpredictable future events, no reserves have been established topre-fund for potential windstorm damage. Limited commercial availability of certain types of insurance relating to windstorm exposure in coastal areas and earthquake exposure mainly in California and the Pacific Northwest may prevent us from insuring some of our facilities to full replacement value.
With respect to our operations in South Africa, the United Kingdom and Australia, we utilize a combination of locally-procured insurance and global policies to meet contractual insurance requirements and to protect us. In addition to these policies, our Australian subsidiary carries tail insurance on a general liability policy related to a discontinued contract.
Of the reserves discussed above, our most significant insurance reserves relate to workers’ compensation, general liability and auto claims. These reserves are undiscounted and were $71.0$70.9 million and $51.6$71.0 million as of December 31, 20172018 and 2016,2017, respectively and are included in accrued expenses in the accompanying balance sheets. We use statistical and actuarial methods to estimate amounts for claims that have been reported but not paid and claims incurred but not reported. In applying these methods and assessing their results, we consider such factors as historical frequency and severity of claims at each of our facilities, claim development, payment patterns and changes in the nature of our business, among other factors. Such factors are analyzed for each of our business segments. Our estimates may be impacted by such factors as increases in the market price for medical services and unpredictability of the size of jury awards. We also may experience variability between our estimates and the actual settlement due to limitations inherent in the estimation process, including our ability to estimate costs of processing and settling claims in a timely manner as well as our ability to accurately estimate our exposure at the onset of a claim. Because we have high deductible insurance policies, the amount of our insurance expense is dependent on our ability to control our claims experience. If actual losses related to insurance claims significantly differ from our estimates, our financial condition, results of operations and cash flows could be materially adversely impacted.
International Operations
Our international operations for fiscal years 2018, 2017 2016 and 20152016 consisted of the operations of our wholly-owned Australian subsidiaries, our wholly owned subsidiary in the United Kingdom, and South African Custodial Management Pty. Limited, our consolidated joint venture in South Africa, which we refer to as SACM. In Australia, our wholly-owned subsidiary, GEO Australia, currently manages five facilities. We operate one facility in South Africa through SACM. Our wholly-owned subsidiary in the United Kingdom, The GEO Group UK Ltd., operates the217-bed Dungavel House Immigration Removal Centre located near Glasgow, Scotland. In September 2014, one of our Australian subsidiaries signed the Ravenhall Prison Project Agreement (“Ravenhall Contract”) with the State of Victoria for the development and operation of a new1,300-bed facility in Ravenhall, a locality near Melbourne, Australia under a Public-Private Partnership financing structure. The facility has the capacity to house 1,300 inmates should the State of Victoria have the need for additional beds in the future. The design and construction phase of the agreement began in September 2014 and was completed during the fourth quarter of 2017. See Item 7 for more discussion related to the results of our international operations. Financial
information about our operations in different geographic regions appears inNote-15 Business Segments and Geographic Information in the notes to our audited consolidated financial statements included in Part II, Item 8 of this annual report on Form10-K.
Business Concentration
Except for the major customers noted in the following table, no other single customer made up greater than 10% of our consolidated revenues excluding discontinued operations, for these years.
Customer | 2017 | 2016 | 2015 | 2018 | 2017 | 2016 | ||||||||||||||||||
Various agencies of the U.S. Federal Government: | 48 | % | 48 | % | 45 | % | 50 | % | 48 | % | 48 | % | ||||||||||||
Credit risk related to accounts receivable is reflective of the related revenues.
Available Information
Additional information about us can be found atwww.geogroup.com. We make available on our website, free of charge, access to our Annual Report onForm 10-K, Quarterly Reports onForm 10-Q, Current Reports onForm 8-K, our annual proxy statement on Schedule 14A and amendments to those materials filed or furnished pursuant to Section 13(a) or 15(d) of the Securities and Exchange Act of 1934 as soon as reasonably practicable after we electronically submit such materials to the Securities and Exchange Commission, or the SEC. In addition, the SEC makes available on its website, free of charge, reports, proxy and information statements, and other information regarding issuers that file electronically with the SEC, including GEO. The SEC’s website is located at http://www.sec.gov. Information provided on our website or on the SEC’s website is not part of this Annual Report onForm 10-K.
| Item 1A. | Risk Factors |
The following are certain risks to which our business operations are subject. Any of these risks could materially adversely affect our business, financial condition, or results of operations. These risks could also cause our actual results to differ materially from those indicated in the forward-looking statements contained herein and elsewhere.The risks described below are not the only risks we face. Additional risks not currently known to us or those we currently deem to be immaterial may also materially and adversely affect our business operations.
Risks Related to REIT Status
If we fail to remain qualified as a REIT, we will be subject to U.S. federal income tax as a regular corporation and could face a substantial tax liability, which would reduce the amount of cash available for distribution to our shareholders.
We began operating as a REIT on January 1, 2013. We received an opinion of our special REIT tax counsel (“Special Tax Counsel”) with respect to our qualification as a REIT. Investors should be aware, however, that opinions of counsel are not binding on the Internal Revenue Service (the “IRS”) or any court. The opinion of Special Tax Counsel represents only the view of Special Tax Counsel based on its review and analysis of existing law and on certain representations as to factual matters and covenants made by us, including representations relating to the values of our assets and the sources of our income. The opinion is expressed as of the date issued. Special Tax Counsel has no obligation to advise us or the holders of our common stock of any subsequent change in the matters stated, represented or assumed or of any subsequent change in applicable law. Furthermore, both the validity of the opinion of Special Tax Counsel and our qualification as a REIT will depend on our satisfaction of certain asset, income, organizational, distribution, shareholder ownership and other requirements on a continuing basis, the results of which will not be monitored by Special Tax Counsel. Our ability to satisfy the asset tests depends upon our analysis of the characterization and fair market values of our assets, some of which are not susceptible to a precise determination, and for which we will not obtain independent appraisals.
We have received a favorable private letter ruling from the IRS with respect to certain issues relevant to our qualification as a REIT. Although we may generally rely upon the ruling, no assurance can be given that the IRS will not challenge our qualification as a REIT on the basis of other issues or facts outside the scope of the ruling.
If we fail to qualify as a REIT in any taxable year, we would be subject to U.S. federal income tax including any applicable alternative minimum tax, on our taxable income at regular corporate rates, and dividends paid to our shareholders would not be deductible by us in computing our taxable income. Any resulting corporate tax liability could be substantial and would reduce the amount of cash available for distribution to our shareholders, which in turn could have an adverse impact on the value of our common stock. Unless we were entitled to relief under certain Internal Revenue Service Code of 1986, as amended (the “Code”) provisions, we also would be disqualified fromre-electing to be taxed as a REIT for the four taxable years following the year in which we failed to qualify as a REIT. If we fail to qualify for taxation as a REIT, we may need to borrow additional funds or liquidate some investments to pay any additional tax liability. Accordingly, funds available for investment and making payments on our indebtedness would be reduced.
Qualifying as a REIT involves highly technical and complex provisions of the Code.
Qualification as a REIT involves the application of highly technical and complex Code provisions for which only limited judicial and administrative authorities exist. Even a technical or inadvertent violation could jeopardize our REIT qualification. Our qualification as a REIT will depend on our satisfaction of certain asset, income, organizational, distribution, shareholder ownership and other requirements on a continuing basis. In addition, our ability to satisfy the requirements to qualify as a REIT depends in part on the actions of third parties over which we have no control or only limited influence.
Complying with the REIT requirements may cause us to liquidate or forgo otherwise attractive opportunities.
To qualifymaintain our qualification as a REIT, we must ensure that, at the end of each calendar quarter, at least 75% of the value of our assets consists of cash, cash items, government securities and “real estate assets” (as defined in the Code), including certain mortgage loans and securities. The remainder of our investments (other than government securities, qualified real estate assets and securities issued by a TRS) generally cannot include more than 10% of the outstanding voting securities of any one issuer or more than 10% of the total value of the outstanding securities of any one issuer. In addition, in general, no more than 5% of the value of our total assets (other than government securities, qualified real estate assets and securities issued by a TRS) can consist of the securities of any one issuer, and no more than 25%20% of the value of our total assets can be represented by securities of one or more TRSs (20% starting with calendar year 2018).TRSs. If we fail to comply with these requirements at the end of any calendar quarter, we must correct the failure within 30 days after the end of the calendar quarter or qualify for certain statutory relief provisions to avoid losing our REIT qualification and suffering adverse tax consequences. As a result, we may be required to liquidate or forgo otherwise attractive investments. These actions could have the effect of reducing our income, amounts available for distribution to our shareholders and amounts available for making payments on our indebtedness.
In addition to the asset tests set forth above, to qualifymaintain our qualification as a REIT, we must continually satisfy tests concerning, among other things, the sources of our income, the amounts we distribute to our shareholders and the ownership of our stock. We may be unable to pursue investments that would be otherwise advantageous to us in order to satisfy thesource-of-income or asset-diversification requirements for qualifying as a REIT. Thus, compliance with the REIT requirements may hinder our ability to make certain attractive investments and make payments on our indebtedness.
Dividends payable by REITs do not qualify for the reduced tax rates available for some dividends.
The maximum U.S. federal income tax rate applicable to income from “qualified dividends” payable to U.S. shareholders that are individuals, trusts and estates is currently 20%. exclusive of the 3.8% investment tax surcharge. Dividends payable by REITs, however, generally aremay only be eligible in part or not eligibleat all for the reduced rates.rates applicable to “qualified dividends”. Although these rules do not adversely affect the taxation of REITs, the more favorable rates applicable to regular corporate qualified dividends could cause investors who are individuals, trusts and estates to perceive investments in REITs to be relatively less attractive than investments in the stocks ofnon-REIT corporations that pay dividends, which could adversely affect the value of the stock of REITs, including our common stock. However, for taxable years that begin after December 31, 2017 and before January 1, 2026, shareholders that are individuals, trusts or estates are generally entitled to a deduction equal to 20% of the aggregate amount of ordinary income dividends received from a REIT, subject to certain limitations. This 20% deduction does not apply to “qualified dividends”.
REIT distribution requirements could adversely affect our ability to execute our business plan.
We generally must distribute annually at least 90% of our REIT taxable income, determined without regard to the dividends paid deduction and excluding any net capital gains, in order for us to qualifymaintain our qualification as a REIT (assuming that certain other requirements are also satisfied) so that U.S. federal corporate income tax does not apply to earnings that we distribute. To the extent that we satisfy this distribution requirement and qualifymaintain our qualification for taxation as a REIT but distribute less than 100% of our REIT taxable income, including any net capital gains, we will be subject to U.S. federal corporate income tax on our undistributed net taxable income. In addition, we will be subject to a 4% nondeductible excise tax if the actual amount that we distribute to our shareholders in a calendar year is less than a minimum amount specified under U.S. federal tax laws. We intend to make distributions to our shareholders to comply with the REIT requirements of the Code.Code and avoid corporate income tax and the 4% annual excise tax.
From time to time, we may generate taxable income greater than our cash flow as a result of differences in timing between the recognition of taxable income and the actual receipt of cash or the effect of nondeductible
capital expenditures, the creation of reserves or required debt or amortization payments. If we do not have other funds available in these situations, we could be required to borrow funds on unfavorable terms, sell assets at disadvantageous prices or distribute amounts that would otherwise be invested in future acquisitions to make
distributions sufficient to enable us to pay out enough of our taxable income to satisfy the REIT distribution requirement and to avoid corporate income tax and the 4% excise tax in a particular year. These alternatives could increase our costs, reduce our equity or adversely impact our ability to raise short and long-term debt. Furthermore, the REIT distribution requirements may increase the financing we need to fund capital expenditures, future growth and expansion initiatives. Thus, compliance with the REIT requirements may hinder our ability to grow, which could adversely affect the value of our common stock.
Our cash distributions are not guaranteed and may fluctuate.
A REIT generally is required to distribute at least 90% of its REIT taxable income to its shareholders. Our board of directors, in its sole discretion, will determine on a quarterly basis the amount of cash to be distributed to our shareholders based on a number of factors including, but not limited to, our results of operations, cash flow and capital requirements, economic conditions, tax considerations, borrowing capacity and other factors, including debt covenant restrictions that may impose limitations on cash payments and plans for future acquisitions and divestitures. Consequently, our distribution levels may fluctuate.
Certain of our business activities may be subject to corporate level income tax and foreign taxes, which would reduce our cash flows, and may have potential deferred and contingent tax liabilities.
We may be subject to certain federal, state, local and foreign taxes on our income and assets, including alternative minimum taxes, taxes on any undistributed income and state, local or foreign income, franchise, property and transfer taxes. In addition, we could, in certain circumstances, be required to pay an excise or penalty tax, which could be significant in amount, in order to utilize one or more relief provisions under the Code to maintain qualification for taxation as a REIT. In addition, we may incur a 100% excise tax on transactions with a TRS if they are not conducted on an arm’s length basis. Any of these taxes would decrease our earnings and our available cash.
Our TRS assets and operations will continue to be subject, as applicable, to federal and state corporate income taxes and to foreign taxes in the jurisdictions in which those assets and operations are located.
We will also be subject to a federal corporate level tax at the highest regular corporate rate (35% prior to 2018 and 21% after 2017) on the gain recognized from a sale of assets occurring during our first five years as a REIT, up to the amount of thebuilt-in gain that existed on January 1, 2013, which is based on the fair market value of those assets in excess of our tax basis as of January 1, 2013. Furthermore, we will be subject to a federal corporate level tax at the highest regular corporate rate on the gain recognized from a sale of assets we acquired in connection with the 2017 CEC acquisition if a sale of such assets occurs during the applicable five-year period following our acquisition of CEC. Gain from a sale of an asset occurring after the specified period ends will not be subject to this corporate level tax. We currently do not expect to sell any asset if the sale would result in the imposition of a material tax liability. We cannot, however, assure you that we will not change our plans in this regard.
REIT ownership limitations may restrict or prevent you from engaging in certain transfers of our common stock.
In order to satisfy the requirements for REIT qualification, no more than 50% in value of all classes or series of our outstanding shares of stock may be owned, actually or constructively, by five or fewer individuals (as defined in the Code to include certain entities) at any time during the last half of each taxable year beginning with our 2014 taxable year. In 2014, GEO merged into a newly formed entity, to facilitate GEO’s compliance with the REIT rules by implementing ownership limitations that generally restrict shareholders from owning more than 9.8% of our outstanding shares. The merger was approved by our shareholders. Under applicable constructive ownership rules, any shares of stock owned by certain affiliated owners generally would be added
together for purposes of the common stock ownership limits, and any shares of a given class or series of
preferred stock owned by certain affiliated owners generally would be added together for purposes of the ownership limit on such class or series.
Our use of TRSs may cause us to fail to qualify as a REIT.
The net income of our TRSs is not required to be distributed to us, and such undistributed TRS income is generally not subject to our REIT distribution requirements. However, if the accumulation of cash or reinvestment of significant earnings in our TRSs causes the fair market value of our securities in those entities, taken together with othernon-qualifying assets to exceed 25% of the fair market value of our assets, in each case as determined for REIT asset testing purposes, we would, absent timely responsive action, fail to qualifymaintain our qualification as a REIT. Additionally, beginning in 2018, if the accumulation of cash or reinvestment of significant earnings in our TRSs causes the fair market value of our securities in those entities to exceed 20% of the fair market value of our assets, in each case as determined for REIT asset testing purposes, we would, absent timely responsive action, similarly fail to qualifymaintain our qualification as a REIT.
ChangesNew legislation or administrative or judicial action, in each instance potentially with retroactive effect, could make it more difficult or impossible for us to maintain our qualification as a REIT.
The present U.S. federal income tax lawstreatment of REITs may be modified, possibly with retroactive effect, by legislative, judicial, or administrative action at any time, which could materially and adversely affect us and our shareholders.
the U.S. federal income tax treatment of an investment in us. The U.S. federal income tax rules dealing with U.S. federal income taxationREITs are constantly under review by persons involved in the legislative process and by the IRS and the U.S. Department of the Treasury (the “Treasury”)., which results in statutory changes as well as frequent revisions to regulations and interpretations. Additionally, legislative bills or proposals have been introduced from time to time with the aim of limiting or restricting the types of industries or companies that can qualify as a REIT. New legislation, Treasury regulations, administrative interpretations or court decisions implemented or adopted in the future could significantly and negatively affect our ability to qualifymaintain our qualification as a REIT or the U.S. federal income tax consequences to our investors and us of such qualification. The recently enacted Tax Cuts and Jobs Act made substantial changes to the Code. Among those changes are a significant permanent reduction in the generally applicable corporate tax rate,We cannot predict how changes in the taxation of individualstax laws might affect our investors or us. Revisions in U.S. federal tax laws and othernon-corporate taxpayers that generally but not universally reduce their taxes oninterpretations thereof could significantly and negatively affect our ability to maintain our qualification as a temporary basis subject to “sunset” provisions, the elimination or modification of various currently allowed deductions (including substantial limitations on the deductibility of interest and, in the case of individuals, the deduction for personal state and local taxes), certain additional limitations on the deduction of net operating losses, and preferential rates of taxation on most ordinary REIT dividends and certain business income derived bynon-corporate taxpayers in comparison to other ordinary income recognized by such taxpayers. The effect of these, and the many other, changes made in the Tax Cuts and Jobs Act is highly uncertain, both in terms of their direct effect on the taxation oftax considerations relevant to an investment in our common stock and their indirect effect on the value of our assets or market conditions generally. Furthermore, many of the provisions of the Tax Cuts and Jobs Act will require guidance through the issuance of Treasury regulations in order to assess their effect. There may be a substantial delay before such regulations are promulgated, increasing the uncertainty as to the ultimate effect of the statutory amendments on us. There may also be technical corrections legislation proposed with respect to the Tax Cuts and Jobs Act, the effect and timing of which cannot be predicted and may be adverse to us, or could cause us to change our shareholders. Additionally, the Treasury, the IRSinvestments and other standard-setting bodies could interpret or issue guidance on how provisions of the Tax Cuts and Jobs Act will be applied or otherwise administered that is different from our interpretation. As we complete our analysis of the Tax Cuts and Jobs Act, collect and prepare necessary data, and interpret any additional guidance, we may make adjustments to provisional amounts that we have recorded that may materially impact our provision for income taxes in the period in which the adjustments are made.commitments. You are urged to consult with your tax advisor with respect to the status of legislative, regulatory or administrative developments and proposals and their potential effect on an investment in our securities.
Risks Related to Our High Level of Indebtedness
Our level of indebtedness could adversely affect our financial condition and prevent us from fulfilling our debt service obligations.
We have a significant amount of indebtedness. Our total consolidated indebtedness as of December 31, 20172018 was approximately $2.2$2.4 billion, excludingnon-recourse debt of $394.0$341.1 million and capital lease obligations of
$7.4 $6.1 million. As of December 31, 2017,2018, we had $70.1$62.3 million outstanding in letters of credit and $270.6$490.8 million in borrowings outstanding under our revolver. Also as of December 31, 2017,2018, we had the ability to borrow $559.3$346.9 million under our revolver, after applying the limitations and restrictions in our debt covenants and subject to our satisfying the relevant borrowing conditions under our senior credit facility with respect to the incurrence of additional indebtedness. At December 31, 2017,2018, we also had approximately AUD 100 million in letters of credit outstanding under our Australian letter of credit facility in connection with certain performance guarantees related to the Ravenhall Prison Project. We also have the ability to increase our senior credit facility by an additional $450 million, subject to lender demand and prevailing market conditions and satisfying the relevant borrowing conditions.
Our substantial indebtedness could have important consequences. For example, it could:
make it more difficult for us to satisfy our obligations with respect to our senior notes and our other debt and liabilities;
require us to dedicate a substantial portion of our cash flow from operations to payments on our indebtedness, thereby reducing the availability of our cash flow to fund working capital, capital expenditures, and other general corporate purposes including to make distributions on our common stock as currently contemplated or necessary to maintain our qualification as a REIT;
limit our flexibility in planning for, or reacting to, changes in our business and the industry in which we operate;
increase our vulnerability to adverse economic and industry conditions;
place us at a competitive disadvantage compared to competitors that may be less leveraged;
restrict us from pursuing strategic acquisitions or exploiting certain business opportunities; and
limit our ability to borrow additional funds or refinance existing indebtedness on favorable terms.
If we are unable to meet our debt service obligations, we may need to reduce capital expenditures, restructure or refinance our indebtedness, obtain additional equity financing or sell assets. We may be unable to restructure or refinance our indebtedness, obtain additional equity financing or sell assets on satisfactory terms or at all. In addition, our ability to incur additional indebtedness will be restricted by the terms of our senior credit facility, the indenture governing the 6.00% Senior Notes due 2026 (“6.00% Senior Notes”), the indenture governing the 5.125% Senior Notes due 2023 (“5.125% Senior Notes”), the indenture governing the 5.875% Senior Notes due 2022 and the indenture governing the 5.875% Senior Notes due 2024.
We are incurring significant indebtedness in connection with substantial ongoing capital expenditures. Capital expenditures for existing and future projects may materially strain our liquidity.
As of December 31, 2017,2018, we were developing a number of projects that we estimate will cost approximately $251.3$255.3 million, of which $101.9$210.8 million was spent through December 31, 2017.2018. We estimate our remaining capital requirements to be approximately $149.4$44.5 million, which we anticipate will be spent through 2019.2020. Capital expenditures related to facility maintenance costs are expected to be approximately $23$28 million for 2018.2019. We intend to finance these and future projects using our own funds, including cash on hand, cash flow from operations and borrowings under the revolver. In addition to these current estimated capital requirements for 2018,2019, we are currently in the process of bidding on, or evaluating potential bids for the design, construction and management of a number of new projects. In the event that we win bids for these projects and decide to self-finance their construction, our capital requirements in 20182019 could materially increase. As of December 31, 2017,2018, we had the ability to borrow $559.3$346.9 million under the revolver after applying the limitations and restrictions in our debt covenants and subject to our satisfying the relevant borrowing conditions under the Seniorsenior credit facility. In addition, we have the ability to increase the senior credit facility by an additional $450 million, subject to lender demand and prevailing market conditions and satisfying the relevant borrowing conditions
thereunder. While we believe we currently have adequate borrowing capacity under our senior credit facility to fund our operations and all of our committed capital expenditure projects, we may need additional borrowings or financing from other sources in order to complete potential capital expenditures related to new projects in the future. We cannot assure you that such borrowings or financing will be made available to us on satisfactory terms, or at all. In addition, the large capital commitments that these projects will require over the next12-18 month period may materially strain our liquidity and our borrowing capacity for other purposes. Capital constraints caused by these projects may also cause us to have to entirely refinance our existing indebtedness or incur more indebtedness. Such financing may have terms less favorable than those we currently have in place, or not be available to us at all. In addition, the concurrent development of these and other large capital projects exposes us to material risks. For example, we may not complete some or all of the projects on time or on budget, which could cause us to absorb any losses associated with any delays.
Despite current indebtedness levels, we may still incur more indebtedness, which could further exacerbate the risks described above.
The terms of the indentures governing the 6.00% Senior Notes, the 5.125% Senior Notes, the 5.875% Senior Notes due 2022 and the 5.875% Senior Notes due 2024 and our senior credit facility restrict our ability to incur, but do not prohibit us from incurring, significant additional indebtedness in the future. As of December 31, 2017,2018, we had the ability to borrow an additional $559.3$346.9 million under the revolver portion of our senior credit facility after applying the limitations and restrictions in our debt covenants and subject to our satisfying the relevant borrowing conditions under the senior credit facility. We also would have the ability to increase the senior credit facility by an additional $450 million, subject to lender demand, prevailing market conditions and satisfying relevant borrowing conditions. Also, we may refinance all or a portion of our indebtedness, including borrowings under our senior credit facility, the 6.00% Senior Notes, the 5.125% Senior Notes, the 5.875% Senior Notes due 2022 and the 5.875% Senior Notes due 2024. The terms of such refinancing may be less restrictive and permit us to incur more indebtedness than we can now. If new indebtedness is added to our and our subsidiaries’ current debt levels, the related risks that we and they now face related to our significant level of indebtedness could intensify.
The covenants in the indentures governing the 6.00% Senior Notes, the 5.125% Senior Notes, the 5.875% Senior Notes due 2022 and the 5.875% Senior Notes due 2024 and the covenants in our Senior Credit Facility impose significant operating and financial restrictions which may adversely affect our ability to operate our business.
The indentures governing the 6.00% Senior Notes, the 5.125% Senior Notes, the 5.875% Senior Notes due 2022 and the 5.875% Senior Notes due 2024 and our Senior Credit Facility impose significant operating and financial restrictions on us and certain of our subsidiaries, which we refer to as restricted subsidiaries. These restrictions limit our ability to, among other things:
incur additional indebtedness;
pay dividends and or distributions on our capital stock, repurchase, redeem or retire our capital stock, prepay subordinated indebtedness, make investments;
issue preferred stock of subsidiaries;
guarantee other indebtedness;
create liens on our assets;
transfer and sell assets;
make capital expenditures above certain limits;
create or permit restrictions on the ability of our restricted subsidiaries to pay dividends or make other distributions to us;
enter into transactions with affiliates; and
merge or consolidate with another company or sell all or substantially all of our assets.
These restrictions could limit our ability to finance our future operations or capital needs, make acquisitions or pursue available business opportunities. In addition, our Senior Credit Facilitysenior credit facility requires us to maintain specified financial ratios and satisfy certain financial covenants, including maintaining a maximum senior secured leverage ratio and total leverage ratio, and a minimum interest coverage ratio. We may be required to take action to reduce our indebtedness or to act in a manner contrary to our business objectives to meet these ratios and satisfy these covenants. We could also incur additional indebtedness having even more restrictive covenants. Our failure to comply with any of the covenants under our Senior Credit Facility,senior credit facility, the indentures governing the 6.00% Senior
Notes, the 5.125% Senior Notes, the 5.875% Senior Notes due 2022, the 5.875% Senior Notes due 2024, or any other indebtedness could prevent us from being able to draw on the Revolver, cause an event of default under such documents and result in an acceleration of all of our outstanding indebtedness. If all of our outstanding indebtedness were to be accelerated, we likely would not be able to simultaneously satisfy all of our obligations under such indebtedness, which would materially adversely affect our financial condition and results of operations.
Servicing our indebtedness will require a significant amount of cash. Our ability to generate cash depends on many factors beyond our control and we may not be able to generate the cash required to service our indebtedness.
Our ability to make payments on our indebtedness and to fund planned capital expenditures will depend on our ability to generate cash in the future. This, to a certain extent, is subject to general economic, financial, competitive, legislative, regulatory and other factors that are beyond our control.
Our business may not be able to generate sufficient cash flow from operations or future borrowings may not be available to us under our Senior Credit Facilitysenior credit facility or otherwise in an amount sufficient to enable us to pay our indebtedness or debt securities, including the 6.00% Senior Notes, the 5.125% Senior Notes, the 5.875% Senior Notes due 2022, and the 5.875% Senior Notes due 2024, or to fund our other liquidity needs. As a result, we may need to refinance all or a portion of our indebtedness on or before maturity. However, we may not be able to complete such refinancing on commercially reasonable terms or at all. If for any reason we are unable to meet our debt service obligations, we would be in default under the terms of the agreements governing our outstanding debt. If such a default were to occur, the lenders under the senior credit facility, and holders of the 6.00% Senior Notes, the 5.125% Senior Notes, the 5.875% Senior Notes due 2022 and the 5.875% Senior Notes due 2024 could elect to declare all amounts outstanding immediately due and payable, and the lenders would not be obligated to continue to advance funds under the Senior Credit Facility.senior credit facility. If the amounts outstanding under the Senior Credit Facilitysenior credit facility or other agreements governing our outstanding debt, were accelerated, our assets may not be sufficient to repay in full the money owed to our lenders and holders of the 6.00% Senior Notes, the 5.125% Senior Notes, the 5.875% Senior Notes due 2022 and the 5.875% Senior Notes due 2024 and any other debt holders.
Because portions of our senior indebtedness have floating interest rates, a general increase in interest rates would adversely affect cash flows.
Borrowings under our Senior Credit Facilitysenior credit facility bear interest at a variable rate. As a result, to the extent our exposure to increases in interest rates is not eliminated through interest rate protection agreements, such increases will result in higher debt service costs which will adversely affect our cash flows. We currently do not have interest rate protection agreements in place to protect against interest rate fluctuations on borrowings under our Senior Credit Facility.senior credit facility. As of December 31, 2017,2018, we had $1,064.6$1,276.8 million of indebtedness outstanding under our Senior Credit Facility,senior credit facility, and a one percent increase in the interest rate applicable to the Senior Credit Facility would increase our annual interest expense by approximately $10.6$12.8 million. In addition, an increase in market interest rates may lead holders of our common stock to demand a higher yield on their shares from distributions by us, which could adversely affect the market price forof our common stock.
We depend on distributions from our subsidiaries to make payments on our indebtedness. These distributions may not be made.
A substantial portion of our business is conducted by our subsidiaries. Therefore, our ability to meet our payment obligations on our indebtedness is substantially dependent on the earnings of certain of our subsidiaries and the payment of funds to us by our subsidiaries as dividends, loans, advances or other payments. Our subsidiaries are separate and distinct legal entities and, unless they expressly guarantee any indebtedness of ours, they are not obligated to make funds available for payment of our indebtedness in the form of loans, distributions
or otherwise. Our subsidiaries’ ability to make any such loans, distributions or other payments to us will depend on their earnings, business results, the terms of their existing and any future indebtedness, tax considerations and legal or contractual restrictions to which they may be subject. If our subsidiaries do not make such payments to us, our ability to repay our indebtedness may be materially adversely affected. For the year ended December 31, 2017,2018, our subsidiaries accounted for 69.6%65.5% of our consolidated revenues, and as of December 31, 2017,2018, our subsidiaries accounted for 92.4%92.2% of our total assets.
We may not be able to satisfy our repurchase obligations in the event of a change of control because the terms of our indebtedness or lack of funds may prevent us from doing so.
Upon a change of control as specified in the indentures governing the terms of our senior notes, each holder of the 6.00% Senior Notes, the 5.125% Senior Notes, the 5.875% Senior Notes due 2022 and the 5.875% Senior Notes due 2024 will have the right to require us to repurchase their notes at 101% of their principal amount, plus accrued and unpaid interest, and, liquidated damages, if any, to the date of repurchase. The terms of the Senior Credit Facilitysenior credit facility limit our ability to repurchase the notes in the event of a change of control. Any future agreement governing any of our indebtedness may contain similar restrictions and provisions. Accordingly, it is possible that restrictions in the Senior Credit Facilitysenior credit facility or other indebtedness that may be incurred in the future will not allow the required repurchase of the 6.00% Senior Notes, the 5.125% Senior Notes, the 5.875% Senior Notes due 2022 and the 5.875% Senior Notes due 2024 upon a change of control. Even if such repurchase is permitted by the terms of our then existing indebtedness, we may not have sufficient funds available to satisfy our repurchase obligations. Our failure to purchase any of the senior notes would be a default under the indenture governing such notes, which in turn would trigger a default under the Senior Credit Facilitysenior credit facility and the indentures governing the other senior notes.
Risks Related to Our Business and Industry
From time to time, we may not have a management contract with a client to operate existing beds at a facility or new beds at a facility that we are expanding and we cannot assure you that such a contract will be obtained. Failure to obtain a management contract for these beds will subject us to carrying costs with no corresponding management revenue.
From time to time, we may not have a management contract with a customer to operate existing beds or new beds at facilities that we are currently in the process of renovating and expanding. While we will always strive to work diligently with a number of different customers for the use of these beds, we cannot assure you that a contract for the beds will be secured on a timely basis, or at all. While a facility or new beds at a facility are vacant, we incur carrying costs. We are currently marketing approximately 5,4004,700 vacant beds at four of our idle facilities in our U.S. Correction & Detention segment to potential customers. The annual carrying cost of these idle facilities in 20182019 is estimated to be $18.8$17.3 million, including depreciation expense of $4.6$3.9 million, if the facilities remain vacant during 2018.2019. At December 31, 2017,2018, these facilities had a net book value of $139.6$126.0 million. Failure to secure a management contract for a facility or expansion project could have a material adverse impact on our financial condition, results of operations and/or cash flows. We review our facilities for impairment whenever events or changes in circumstances indicate the net book value of the facility may not be recoverable. Impairment charges taken on our facilities could require material charges to our results of operations. In addition, in order to secure a management contract for these beds, we may need to incur significant capital expenditures to renovate or further expand the facility to meet potential clients’ needs.
Negative conditions in the capital markets could prevent us from obtaining financing, which could materially harm our business.
Our ability to obtain additional financing is highly dependent on the conditions of the capital markets, among other things. The capital and credit markets have experienced significant periods of volatility and disruption since 2008. During this time period, the economic impacts observed have included a downturn in the
equity and debt markets, the tightening of the credit markets, a general economic slowdown and other macroeconomic conditions, volatility in currency exchange rates and concerns over sovereign debt levels abroad and in the U.S. and concerns over the failure to adequately address the federal deficit and the debt ceiling. If those macroeconomic conditions continue or worsen in the future, we could be prevented from raising additional capital or obtaining additional financing on satisfactory terms, or at all. If we need, but cannot obtain, adequate capital as a result of negative conditions in the capital markets or otherwise, our business, results of operations and financial condition could be materially adversely affected. Additionally, such inability to obtain capital could prevent us from pursuing attractive business development opportunities, including new facility constructions or expansions of existing facilities, and business or asset acquisitions.
We are subject to the loss of our facility management contracts, due to terminations,non-renewals or competitivere-bids, which could adversely affect our results of operations and liquidity, including our ability to secure new facility management contracts from other government customers.
We are exposed to the risk that we may lose our facility management contracts primarily due to one of three reasons: (i) the termination by a government customer with or without cause at any time; (ii) the failure by a customer to exercise its unilateral option to renew a contract with us upon the expiration of the then current term; or (iii) our failure to win the right to continue to operate under a contract that has been competitivelyre-bid in a procurement process upon its termination or expiration. Our facility management contracts typically allow a contracting governmental agency to terminate a contract with or without cause at any time by giving us written notice ranging from 30 to 180 days. If government agencies were to use these provisions to terminate, or renegotiate the terms of their agreements with us, our financial condition and results of operations could be materially adversely affected.
As of December 31, 2017,fifty-one2018, 47 of our facility management contracts representing $287.4 million (or 12.7%)as well as certain of our consolidated revenues for the year ended December 31, 2017other management contracts that are also subject to competitivere-bid, including our contract to provide services to ICE under JSAP, may be subject to competitivere-bid in 2018.2019. These contracts in the aggregate represented 17.7% and $412.0 million of our 2018 consolidated revenues. While we are pleased with our historical win rate on competitivere-bids and are committed to continuing to bid competitively on appropriate future competitivere-bid opportunities, we cannot in fact assure you that we will prevail in futurere-bid situations. Also, we cannot assure you that any competitivere-bids we win will be on terms more favorable to us than those in existence with respect to the applicable expiring contract.
For additional information on facility management contracts that we currently believe will be competitivelyre-bid during each of the next five years and thereafter, please see “Business — Government Contracts —Terminations,— Terminations, Renewals and CompetitiveRe-bids”. The loss by us of facility management contracts due to terminations,non-renewals or competitivere-bids could materially adversely affect our financial condition, results of operations and liquidity, including our ability to secure new facility management contracts from other government customers.
We may not be able to successfully identify, consummate or integrate acquisitions.
We have an active acquisition program, the objective of which is to identify suitable acquisition targets that will enhance our growth. The pursuit of acquisitions may pose certain risks to us. We may not be able to identify acquisition candidates that fit our criteria for growth and profitability. Even if we are able to identify such candidates, we may not be able to acquire them on terms satisfactory to us. We will incur expenses and dedicate attention and resources associated with the review of acquisition opportunities, whether or not we consummate such acquisitions.
Additionally, even if we are able to acquire suitable targets on agreeable terms, we may not be able to successfully integrate their operations with ours. Achieving the anticipated benefits of any acquisition will depend in significant part upon whether we integrate such acquired businesses in an efficient and effective manner. We may not be able to achieve the anticipated operating and cost synergies or long-term strategic
benefits of our acquisitions within the anticipated timing or at all. For example, elimination of duplicative costs may not be fully achieved or may take longer than anticipated. For at least the first year after a substantial acquisition, and possibly longer, the benefits from the acquisition will be offset by the costs incurred in integrating the businesses and operations. We may also assume liabilities in connection with acquisitions that we would otherwise not be exposed to. An inability to realize the full extent of, or any of, the anticipated synergies or other benefits of an acquisition as well as any delays that may be encountered in the integration process, which may delay the timing of such synergies or other benefits, could have an adverse effect on our business and results of operations.
As a result of our acquisitions, we have recorded and will continue to record a significant amount of goodwill and other intangible assets. In the future, our goodwill or other intangible assets may become impaired, which could result in materialnon-cash charges to our results of operations.
We have a substantial amount of goodwill and other intangible assets resulting from business acquisitions. As of December 31, 2017,2018, we had $1,034.3$1,008.7 million of goodwill and other intangible assets. At least annually, or whenever events or changes in circumstances indicate a potential impairment in the carrying value as defined by Generally Accepted Accounting Principles in the United States of America, or U.S. GAAP, we will evaluate this goodwill for impairment by first assessing qualitative factors to determine whether the existence of events or circumstances leads to a determination that it is more likely than not that the fair value of the reporting unit is less than the carrying amount. Estimated fair values could change if there are changes in our capital structure, cost of debt, interest rates, capital expenditure levels, operating cash flows, or market capitalization. Impairments of goodwill or other intangible assets could require materialnon-cash charges to our results of operations.
Our growth depends on our ability to secure contracts to develop and manage new correctional, detention and community based facilities and to secure contracts to provide electronic monitoring services, community-based reentry services and monitoring and supervision services, the demand for which is outside our control.
Our growth is primarily dependent upon our ability to obtain new contracts to develop and/or manage correctional, detention, and community based facilities under public-private partnerships. Additionally, our growth is generally dependent upon our ability to obtain new contracts to offer electronic monitoring services, provide community-based reentry services and provide monitoring and supervision services. Demand for new public-private partnership facilities in our areas of operation may decrease and our potential for growth will depend on a number of factors we cannot control, including overall economic conditions, governmental and public acceptance of public-private partnerships, government budgetary constraints, and the number of facilities available for public-private partnerships.
In particular, the demand for our correctional and detention services, electronic monitoring services, community-based reentry services and monitoring and supervision services could be affected by changes in existing policies which adversely impact the need for and acceptance of public-private partnerships across the correctional, detention, and community reentry services spectrum. Various factors outside our control could adversely impact the growth of our GEO Care business, including government customer resistance to the public-private partnerships for residential community based facilities, and changes to Medicaid and similar reimbursement programs.
We may not be able to meet state requirements for capital investment or locate land for the development of new facilities, which could adversely affect our results of operations and future growth.
Certain jurisdictions have in the past required successful bidders to make a significant capital investment in connection with the financing of a particular project. If this trend were to continue in the future, we may not be able to obtain sufficient capital resources when needed to compete effectively for facility management contracts. Additionally, our success in obtaining new awards and contracts may depend, in part, upon our ability to locate
land that can be leased or acquired under favorable terms. Our inability to secure financing and desirable locations for new facilities could adversely affect our results of operations and future growth.
We partner with a limited number of governmental customers who account for a significant portion of our revenues. The loss of, or a significant decrease in revenues from, these customers could seriously harm our financial condition and results of operations.
We currently derive, and expect to continue to derive, a significant portion of our revenues from a limited number of governmental agencies. Of our governmental partners, four customers, through multiple individual contracts, accounted for 47.7%49.7% and 47.6% of our consolidated revenues for the years ended December 31, 20172018 and 2016,2017, respectively. In addition, three federal governmental agencies with correctional and detention responsibilities, the Bureau of Prisons (“BOP”), ICE, and the U.S. Marshals Service, accounted for 47.3%49.2% and 47.2%47.3% of our total consolidated revenues for the years ended December 31, 20172018 and 2016,2017, respectively, through multiple individual contracts, with the Bureau of Prisons accounting for 13.2%12.1% and 14.0%13.2% of our total consolidated revenues for such years, ICE accounting for 23.9%26.0% and 23.1%23.9% of our total consolidated revenues for such years, and the U.S. Marshals Service accounting for 10.2%11.1% and 10.1%10.2% of our total consolidated revenues for such years. However, no individual contract with these clients accounted for more than 5.0%10.0% of our total consolidated revenues for such years. Government agencies from the State of Florida accounted for 5.2%approximately 5% of our total consolidated revenues for each of the years ended December 31, 20172018 and 2016,2017 through multiple individual contracts.
Our revenues depend on our governmental customers receiving sufficient funding and providing us with timely payment under the terms of our contracts. If the applicable governmental customers do not receive sufficient appropriations to cover their contractual obligations, they may delay or reduce payment to us or terminate their contracts with us. With respect to our federal government customers, any future impasse or struggle impacting the federal government’s ability to reach agreement on the federal budget, debt ceiling or any future federal government shut downs could result in material payment delays, payment reductions or contract terminations. For example, the recent federal government shutdown that lasted thirty-five days resulted in our experiencing material payment delays from our federal governmental partners. Additionally, our governmental customers may request in the future that we reduce our per diem contract rates or forego increases to those rates as a way for those governmental customers to control their spending and address their budgetary shortfalls.
Our governmental customers may also from time to time adopt, implement or modify certain policies or directives that may adversely affect our business. Our federal, state or local governmental partners may in the future choose to undertake a review of their utilization of privately operated facilities, or may cancel or decide not to renew our existing contracts with them. The loss of, or a significant decrease in, our current contracts with the BOP, ICE, the U.S. Marshals Service, the State of Florida or any other significant customers could seriously harm our financial condition and results of operations. We expect these federal and state agencies and a relatively small group of other governmental customers to continue to account for a significant percentage of our revenues.
A decrease in occupancy levels could cause a decrease in revenues and profitability.
While a substantial portion of our cost structure is generally fixed, most of our revenues are generated under facility management contracts which provide for per diem payments based upon daily occupancy. Several of these contracts provide fixed-price payments that cover a portion or all of our fixed costs. However, many of our contracts have no fixed-price payments and simply provide for a per diem payment based on actual occupancy.
As a result, with respect to our contracts that have no fixed-price payments, we are highly dependent upon the governmental agencies with which we have contracts to utilize our facilities. Under a per diem rate structure, a decrease in our utilization rates could cause a decrease in revenues and profitability. When combined with relatively fixed costs for operating each facility, regardless of the occupancy level, a material decrease in occupancy levels at one or more of our facilities could have a material adverse effect on our revenues and profitability, and consequently, on our financial condition and results of operations.
State budgetary constraints may have a material adverse impact on us.
State budgets continue their slow to moderate recovery. According to the National Conference of State Legislatures, the outlook for state budgets is stable. Revenue performance is positive, and expenditure overruns are relatively modest. Overall, most state officials anticipate a slow and steady improvement in state finances. As of December 31, 2017,2018, GEO Corrections had 10 state clients and GEO Care had 16 state clients: Florida, Georgia, Arkansas, Louisiana, Colorado, Maryland, Missouri, Virginia, Iowa, Indiana, Kentucky, Illinois, Oklahoma, Nevada, Delaware, New Jersey, North Carolina, South Carolina, Montana, New Mexico, Arizona, Maine, Vermont, Pennsylvania, Texas and California. If state budgetary conditions deteriorate, our 26 state customers’ ability to pay us may be impaired and/or we may be forced to renegotiate our management contracts with those customers on less favorable terms and our financial condition, results of operations or cash flows could be materially adversely impacted. In addition, budgetary constraints in states that are not our current customers could prevent those states from using public-private partnerships for correctional, detention or community based service opportunities that we otherwise could have pursued.
Competition for contracts may adversely affect the profitability of our business.
We compete with government entities and other public-private partnership operators on the basis of cost, bed availability, location of facility, quality and range of services offered, experience in managing facilities, and reputation of management and personnel. Barriers to entering the market for the management of correctional and detention facilities and the provision of community reentry programs may not be sufficient to limit additional competition in our industry. In addition, some of our government customers may assume the management of a facility currently managed by us upon the termination of the corresponding management contract or, if such customers have capacity at the facilities which they operate, they may choose to use less capacity at our facilities. Since we are paid on a per diem basis based on actual occupancy under some of our contracts, a decrease in occupancy could cause a decrease in both our revenues and our profitability.
We are dependent on government appropriations, which may not be made on a timely basis or at all and may be adversely impacted by budgetary constraints at the federal, state, local and foreign government levels.
Our cash flow is subject to the receipt of sufficient funding of and timely payment by contracting governmental entities. If the contracting governmental agency does not receive sufficient appropriations to cover its contractual obligations, it may terminate our contract or delay or reduce payment to us. Any delays in payment, or the termination of a contract, could have a material adverse effect on our cash flow and financial condition, which may make it difficult to satisfy our payment obligations on our indebtedness, including the 6.00% Senior Notes, the 5.125% Senior Notes, the 5.875% Senior Notes due 2022, the 5.875% Senior Notes due 2024 and the Senior Credit Facility,senior credit facility, in a timely manner. In addition, as a result of, among other things, recent economic developments, domestically, at federal, state and local governments have encountered, and may continue to encounter, unusual budgetary constraints. As a result, a number of state and local governments may be under pressure to control additional spending or reduce current levels of spending which could limit or eliminate appropriations for the facilities that we operate. Additionally, as a result of these factors, we may be requested in the future to reduce our existing per diem contract rates or forego prospective increases to those rates. Budgetary limitations may also make it more difficult for us to renew our existing contracts on favorable terms or at all. Further, a number of states and foreign governments in which we operate may experience budget
constraints for fiscal year 2018.2019. We cannot assure you that these constraints would not result in reductions in per diems, delays in payment for services rendered or unilateral termination of contracts.
Public resistance to the use of public-private partnerships for correctional, detention and community based facilities could result in our inability to obtain new contracts or the loss of existing contracts, which could have a material adverse effect on our business, financial condition and results of operations.
The management and operation of correctional, detention and community based facilities under public-private partnerships has not achieved complete acceptance by either government agencies or the public. Some
governmental agencies have limitations on their ability to delegate their traditional management responsibilities for such facilities to private companies or they may be instructed by a governmental agency or authority overseeing them to reduce their utilization or scope of public-private partnerships or undertake additional reviews of their public-private partnerships. Additional legislative or policy changes or prohibitions could occur that further increase these limitations or instructions. In addition, the movement toward using public-private partnerships for such facilities has encountered resistance from groups which believe that correctional, detention and community based facilities should only be operated by governmental agencies. Increased public resistance to the use of public-private partnerships for correctional, detention and community based facilities in any of the markets in which we operate, as a result of these or other factors, could have a material adverse effect on our business, financial condition and results of operations.
Operating youth services facilities poses certain unique or increased risks and difficulties compared to operating other facilities.
As a result of the acquisition of Cornell Companies, Inc. (the “Cornell Acquisition”) in 2010, were-entered the market of operating youth services facilities. Operating youth services facilities may pose increased operational risks and difficulties that may result in increased litigation, higher personnel costs, higher levels of turnover of personnel and reduced profitability. Examples of the increased operational risks and difficulties involved in operating youth services facilities include, mandated client to staff ratios as high as 1:6, elevated reporting and audit requirements, a reduced number of management options to use with offenders and multiple funding sources as opposed to a single source payer. Additionally, youth services contracts related to educational services may provide for annual collection several months after a school year is completed. This may pose a risk that we will not be able to collect the full amount owed thereby reducing our profitability and/or cash flows, or it may adversely impact our annual budgeting process due to the lag time between us providing the educational services required under a contract and collecting the amount owed to us for such services.
Adverse publicity may negatively impact our ability to retain existing contracts and obtain new contracts.
Any negative publicity about an escape, riot or other disturbance or perceived conditions operated at a facility under a public-private partnership, any failures experienced by our electronic monitoring services and any negative publicity about a crime or disturbance occurring during a failure of service or the loss or unauthorized access to any of the data we maintain in the course of providing our services may result in publicity adverse to us and public-private partnerships in general. Any of these occurrences or continued trends may make it more difficult for us to renew existing contracts or to obtain new contracts or could result in the termination of an existing contract or the closure of one or more of our facilities, which could have a material adverse effect on our business. Such negative events may also result in a significant increase in our liability insurance costs.
We may incur significantstart-up and operating costs on new contracts before receiving related revenues, which may impact our cash flows and not be recouped.
When we are awarded a contract to manage a facility, we may incur significantstart-up and operating expenses, including the cost of constructing the facility, purchasing equipment and staffing the facility, before we
receive any payments under the contract. These expenditures could result in a significant reduction in our cash reserves and may make it more difficult for us to meet other cash obligations, including our payment obligations on the 6.00% Senior Notes, the 5.125% Senior Notes, the 5.875% Senior Notes due 2022, the 5.875% Senior Notes due 2024 and the Senior Credit Facility. In addition, a contract may be terminated prior to its scheduled expiration and as a result we may not recover these expenditures or realize any return on our investment.
Failure to comply with extensive government regulation and applicable contractual requirements could have a material adverse effect on our business, financial condition or results of operations.
The industry in which we operate is subject to extensive federal, state and local regulation, including educational, environmental, health care and safety laws, rules and regulations, which are administered by many
regulatory authorities. Some of the regulations are unique to the corrections industry, and the combination of regulations affects all areas of our operations. Corrections officers and juvenile care workers are customarily required to meet certain training standards and, in some instances, facility personnel are required to be licensed and are subject to background investigations. Certain jurisdictions also require us to award subcontracts on a competitive basis or to subcontract with businesses owned by members of minority groups. We may not always successfully comply with these and other regulations to which we are subject and failure to comply can result in material penalties or thenon-renewal or termination of facility management contracts. In addition, changes in existing regulations could require us to substantially modify the manner in which we conduct our business and, therefore, could have a material adverse effect on us.
In addition, public-private partnerships are increasingly subject to government legislation and regulation attempting to restrict the ability of private operators to house certain classifications of offenders, such as offenders from other jurisdictions or offenders at higher security levels. Legislation has been enacted in several states, and has previously been proposed in the United States House of Representatives, containing such restrictions. Although we do not believe that existing legislation will have a material adverse effect on us, future legislation may have such an effect on us.
Governmental agencies may investigate and audit our contracts and, if any improprieties are found, we may be required to refund amounts we have received, to forego anticipated revenues and we may be subject to penalties and sanctions, including prohibitions on our bidding in response to RFPs from governmental agencies to manage correctional facilities. Governmental agencies we contract with have the authority to audit and investigate our contracts with them. As part of that process, governmental agencies may review our performance of the contract, our pricing practices, our cost structure and our compliance with applicable laws, regulations and standards. For contracts that actually or effectively provide for certain reimbursement of expenses, if an agency determines that we have improperly allocated costs to a specific contract, we may not be reimbursed for those costs, and we could be required to refund the amount of any such costs that have been reimbursed. If we are found to have engaged in improper or illegal activities, including under the United States False Claims Act, we may be subject to civil and criminal penalties and administrative sanctions, including termination of contracts, forfeitures of profits, suspension of payments, fines and suspension or disqualification from doing business with certain governmental entities. An adverse determination in an action alleging improper or illegal activities by us could also adversely impact our ability to bid in response to RFPs in one or more jurisdictions.
In addition to compliance with applicable laws and regulations, our facility management contracts typically have numerous requirements addressing all aspects of our operations which we may not be able to satisfy. For example, our contracts require us to maintain certain levels of coverage for general liability, workers’ compensation, vehicle liability, and property loss or damage. If we do not maintain the required categories and levels of coverage, the contracting governmental agency may be permitted to terminate the contract. In addition, we are required under our contracts to indemnify the contracting governmental agency for all claims and costs arising out of our management of facilities and, in some instances, we are required to maintain performance bonds relating to the construction, development and operation of facilities. Facility management contracts also typically include reporting requirements, supervision andon-site monitoring by representatives of the contracting
governmental agencies. Failure to properly adhere to the various terms of our customer contracts could expose us to liability for damages relating to any breaches as well as the loss of such contracts, which could materially adversely impact us.
We may face community opposition to facility location, which may adversely affect our ability to obtain new contracts.
Our success in obtaining new awards and contracts sometimes depends, in part, upon our ability to locate land that can be leased or acquired, on economically favorable terms, by us or other entities working with us in conjunction with our proposal to construct and/or manage a facility. Some locations may be in or near populous areas and, therefore, may generate legal action or other forms of opposition from residents in areas surrounding a
proposed site. When we select the intended project site, we attempt to conduct business in communities where local leaders and residents generally support the establishment of a new project. Future efforts to find suitable host communities may not be successful. In many cases, the site selection is made by the contracting governmental entity. In such cases, site selection may be made for reasons related to economic development interests.
Our business operations expose us to various liabilities for which we may not have adequate insurance and may have a material adverse effect on our business, financial condition or results of operations.
The nature of our business exposes us to various types of third-party legal claims, including, but not limited to, civil rights claims relating to conditions of confinement and/or mistreatment, sexual misconduct claims brought by prisoners or detainees, medical malpractice claims, claims relating to the federal Trafficking and Victims Protection Act.Act, product liability claims, intellectual property infringement claims, claims relating to employment matters (including, but not limited to, employment discrimination claims, union grievances and wage and hour claims), property loss claims, environmental claims, automobile liability claims, contractual claims and claims for personal injury or other damages resulting from contact with our facilities, programs, electronic monitoring products, personnel or prisoners, including damages arising from a prisoner’s escape or from a disturbance or riot at a facility. In addition, our management contracts generally require us to indemnify the governmental agency against any damages to which the governmental agency may be subject in connection with such claims or litigation. We maintain insurance coverage for these general types of claims, except for claims relating to employment matters, for which we carry no insurance. However, we generally have high deductible payment requirements on our primary insurance policies, including our general liability insurance, and there are also varying limits on the maximum amount of our overall coverage. As a result, the insurance we maintain to cover the various liabilities to which we are exposed may not be adequate. Any losses relating to matters for which we are either uninsured or for which we do not have adequate insurance could have a material adverse effect on our business, financial condition or results of operations. In addition, any losses relating to employment matters could have a material adverse effect on our business, financial condition or results of operations. To the extent the events serving as a basis for any potential claims are alleged or determined to constitute illegal or criminal activity, we could also be subject to criminal liability. Such liability could result in significant monetary fines and could affect our ability to bid on future contracts and retain our existing contracts.
We may not be able to obtain or maintain the insurance levels required by our government contracts.
Our government contracts require us to obtain and maintain specified insurance levels. The occurrence of any events specific to our company or to our industry, or a general rise in insurance rates, could substantially increase our costs of obtaining or maintaining the levels of insurance required under our government contracts, or prevent us from obtaining or maintaining such insurance altogether. If we are unable to obtain or maintain the required insurance levels, our ability to win new government contracts, renew government contracts that have expired and retain existing government contracts could be significantly impaired, which could have a material adverse effect on our business, financial condition and results of operations.
Our international operations expose us to risks which could materially adversely affect our financial condition and results of operations.
For the year ended December 31, 2017,2018, our international operations accounted for approximately 14%11% of our consolidated revenues from operations. We face risks associated with our operations outside the United States. These risks include, among others, political and economic instability, exchange rate fluctuations, taxes, duties and the laws or regulations in those foreign jurisdictions in which we operate. In the event that we experience any difficulties arising from our operations in foreign markets, our business, financial condition and results of operations may be materially adversely affected.
We conduct certain of our operations through joint ventures or consortiums, which may lead to disagreements with our joint venture partners or business partners and adversely affect our interest in the joint ventures or consortiums.
We conduct our operations in South Africa through our consolidated joint venture, SACM, and through our 50% owned and unconsolidated joint venture South African Custodial Services Pty. Limited, referred to as SACS. We conduct our prisoner escort and related custody services in the United Kingdom through our 50% owned and unconsolidated joint venture in GEO Amey PECS Limited, which we refer to as GEOAmey. We may enter into additional joint ventures in the future. Although we have the majority vote in our consolidated joint venture, SACM, through our ownership of 62.5% of the voting shares, we share equal voting control on all significant matters to come before SACS. We also share equal voting control on all significant matters to come before GEOAmey. We are conducting certain operations in Victoria, Australia through a consortium comprised of our wholly owned subsidiary, GEO Australia, John Holland Construction Forensic Care and Honeywell. The consortium developed and is managing a new 1,300 bed prison in Ravenhall, a location near Melbourne, Australia.Australia which was completed in November 2017. These joint venture partners, as well as any future partners, may have interests that are different from ours which may result in conflicting views as to the conduct of the business of the joint venture or consortium. In the event that we have a disagreement with a joint venture partner or consortium business partner as to the resolution of a particular issue to come before the joint venture or consortium, or as to the management or conduct of the business of the joint venture or consortium in general, we may not be able to resolve such disagreement in our favor and such disagreement could have a material adverse effect on our interest in the joint venture or consortium or the business of the joint venture or consortium in general.
We are dependent upon our senior management and our ability to attract and retain sufficient qualified personnel.
We are dependent upon the continued service of each member of our senior management team, including George C. Zoley, Ph.D., our Chairman and Chief Executive Officer, Brian R. Evans, our Chief Financial Officer, J. David Donahue, our Senior Vice President, and President, U.S. Corrections & Detention, Ann Schlarb, our Senior Vice President and President, GEO Care, David Venturella, our Senior Vice President, Business Development and also our other executive officers at the Vice President level and above. The unexpected loss of Dr. Zoley, Mr. Evans or any other key member of our senior management team could materially adversely affect our business, financial condition or results of operations.
In addition, the services we provide are labor-intensive. When we are awarded a facility management contract or open a new facility, depending on the service we have been contracted to provide, we may need to hire operating, management, correctional officers, security staff, physicians, nurses and other qualified personnel. The success of our business requires that we attract, develop and retain these personnel. Our inability to hire sufficient qualified personnel on a timely basis or the loss of significant numbers of personnel at existing facilities could have a material effect on our business, financial condition or results of operations.
Our profitability may be materially adversely affected by inflation.
Many of our facility management contracts provide for fixed management fees or fees that increase by only small amounts during their terms. While a substantial portion of our cost structure is generally fixed, if, due to
inflation or other causes, our operating expenses, such as costs relating to personnel, utilities, insurance, medical and food, increase at rates faster than increases, if any, in our facility management fees, then our profitability could be materially adversely affected.
Various risks associated with the ownership of real estate may increase costs, expose us to uninsured losses and adversely affect our financial condition and results of operations.
Our ownership of correctional and detention facilities subjects us to risks typically associated with investments in real estate. Investments in real estate, and in particular, correctional and detention facilities, are
relatively illiquid and, therefore, our ability to divest ourselves of one or more of our facilities promptly in response to changed conditions is limited. Investments in correctional and detention facilities, in particular, subject us to risks involving potential exposure to environmental liability and uninsured loss. Our operating costs may be affected by the obligation to pay for the cost of complying with existing environmental laws, ordinances and regulations, as well as the cost of complying with future legislation. In addition, although we maintain insurance for many types of losses, there are certain types of losses, such as losses from hurricanes, earthquakes, riots and acts of terrorism, which may be either uninsurable or for which it may not be economically feasible to obtain insurance coverage, in light of the substantial costs associated with such insurance. As a result, we could lose both our capital invested in, and anticipated profits from, one or more of the facilities we own. Further, even if we have insurance for a particular loss, we may experience losses that may exceed the limits of our coverage.
Risks related to facility construction and development activities may increase our costs related to such activities.
When we are engaged to perform construction and design services for a facility, we typically act as the primary contractor and subcontract with other companies who act as the general contractors. As primary contractor, we are subject to the various risks associated with construction (including, without limitation, shortages of labor and materials, work stoppages, labor disputes and weather interference) which could cause construction delays. In addition, we are subject to the risk that the general contractor will be unable to complete construction within the level of budgeted costs or be unable to fund any excess construction costs, even though we typically require general contractors to post construction bonds and insurance. Under such contracts, we are ultimately liable for all late delivery penalties and cost overruns.
The rising cost and increasing difficulty of obtaining adequate levels of surety credit on favorable terms could adversely affect our operating results.
We are often required to post performance bonds issued by a surety company as a condition to bidding on or being awarded a facility development contract. Availability and pricing of these surety commitments is subject to general market and industry conditions, among other factors. Recent events in the economy have caused the surety market to become unsettled, causing many reinsurers and sureties to reevaluate their commitment levels and required returns. As a result, surety bond premiums generally are increasing. If we are unable to effectively pass along the higher surety costs to our customers, any increase in surety costs could adversely affect our operating results. In addition, we may not continue to have access to surety credit or be able to secure bonds economically, without additional collateral, or at the levels required for any potential facility development or contract bids. If we are unable to obtain adequate levels of surety credit on favorable terms, we would have to rely upon letters of credit under our senior credit facility, which would entail higher costs even if such borrowing capacity was available when desired, and our ability to bid for or obtain new contracts could be impaired.
Adverse developments in our relationship with our employees could adversely affect our business, financial condition or results of operations.
At December 31, 2017,2018, approximately 36%32% of our workforce was covered by collective bargaining agreements and, as of such date, collective bargaining agreements with approximately 13%9% of our employees
were set to expire in less than one year. While only approximately 36%32% of our workforce schedule is covered by collective bargaining agreements, increases in organizational activity or any future work stoppages could have a material adverse effect on our business, financial condition, or results of operations.
Technological changes could cause our electronic monitoring products and technology to become obsolete or require the redesign of our electronic monitoring products, which could have a material adverse effect on our business.
Technological changes within the electronic monitoring business in which we conduct business may require us to expend substantial resources in an effort to develop and/or utilize new electronic monitoring products and technology. We may not be able to anticipate or respond to technological changes in a timely manner, and our
response may not result in successful electronic monitoring product development and timely product introductions. If we are unable to anticipate or timely respond to technological changes, our business could be adversely affected and could compromise our competitive position, particularly if our competitors announce or introduce new electronic monitoring products and services in advance of us. Additionally, new electronic monitoring products and technology face the uncertainty of customer acceptance and reaction from competitors.
Any negative changes in the level of acceptance of or resistance to the use of electronic monitoring products and services by governmental customers could have a material adverse effect on our business, financial condition and results of operations.
Governmental customers use electronic monitoring products and services to monitor low risk offenders as a way to help reduce overcrowding in correctional facilities, as a monitoring and sanctioning tool, and to promote public safety by imposing restrictions on movement and serving as a deterrent for alcohol usage. If the level of acceptance of or resistance to the use of electronic monitoring products and services by governmental customers were to change over time in a negative manner so that governmental customers decide to decrease their usage levels and contracting for electronic monitoring products and services, this could have a material adverse effect on our business, financial condition and results of operations.
We depend on a limited number of third parties to manufacture and supply quality infrastructure components for our electronic monitoring products. If our suppliers cannot provide the components or services we require and with such quality as we expect, our ability to market and sell our electronic monitoring products and services could be harmed.
If our suppliers fail to supply components in a timely manner that meets our quantity, quality, cost requirements, or technical specifications, we may not be able to access alternative sources of these components within a reasonable period of time or at commercially reasonable rates. A reduction or interruption in the supply of components, or a significant increase in the price of components, could have a material adverse effect on our marketing and sales initiatives, which could adversely affect our financial condition and results of operations.
The interruption, delay or failure of the provision of our services or information systems could adversely affect our business.
Certain segments of our business depend significantly on effective information systems. As with all companies that utilize information technology, we are vulnerable to negative impacts if information is inadvertently interrupted, delayed, compromised or lost. We routinely process, store and transmit large amounts of data for our clients. We continually work to update and maintain effective information systems. Despite the security measures we have in place and any additional measures we may implement in the future, our facilities and systems, and those of our third-party service providers, could be vulnerable to security breaches, computer viruses, lost or misplaced data, programming errors, human errors, acts of vandalism, or other events. For example, several well-known companies have over the last several years disclosed high-profile security breaches, involving sophisticated and highly targeted attacks on their company’s infrastructure or their customers’ data, which were not recognized or detected until after such companies had been affected notwithstanding the preventative
measures they had in place. Any security breach or event resulting in the interruption, delay or failure of our services or information systems, or the misappropriation, loss, or other unauthorized disclosure of client data or confidential information, whether by us directly or our third-party service providers, could damage our reputation, expose us to the risks of litigation and liability, disrupt our business, result in lost business or otherwise adversely affect our results of operations.
An inability to acquire, protect or maintain our intellectual property and patents in the electronic monitoring space could harm our ability to compete or grow.
We have numerous United States and foreign patents issued as well as a number of United States patents pending in the electronic monitoring space. There can be no assurance that the protection afforded by these
patents will provide us with a competitive advantage, prevent our competitors from duplicating our products, or that we will be able to assert our intellectual property rights in infringement actions.
In addition, any of our patents may be challenged, invalidated, circumvented or rendered unenforceable. There can be no assurance that we will be successful should one or more of our patents be challenged for any reason. If our patent claims are rendered invalid or unenforceable, or narrowed in scope, the patent coverage afforded to our products could be impaired, which could significantly impede our ability to market our products, negatively affect our competitive position and harm our business and operating results.
There can be no assurance that any pending or future patent applications held by us will result in an issued patent, or that if patents are issued to us, that such patents will provide meaningful protection against competitors or against competitive technologies. The issuance of a patent is not conclusive as to its validity or its enforceability. The United States federal courts or equivalent national courts or patent offices elsewhere may invalidate our patents or find them unenforceable. Competitors may also be able to design around our patents. Our patents and patent applications cover particular aspects of our products. Other parties may develop and obtain patent protection for more effective technologies, designs or methods. If these developments were to occur, it could have an adverse effect on our sales. We may not be able to prevent the unauthorized disclosure or use of our technical knowledge or trade secrets by consultants, vendors, former employees and current employees, despite the existence of nondisclosure and confidentiality agreements and other contractual restrictions. Furthermore, the laws of foreign countries may not protect our intellectual property rights effectively or to the same extent as the laws of the United States. If our intellectual property rights are not adequately protected, we may not be able to commercialize our technologies, products or services and our competitors could commercialize our technologies, which could result in a decrease in our sales and market share that would harm our business and operating results.
Additionally, the expiration of any of our patents may reduce the barriers to entry into our electronic monitoring line of business and may result in loss of market share and a decrease in our competitive abilities, thus having a potential adverse effect on our financial condition, results of operations and cash flows.
Our electronic monitoring products could infringe on the intellectual property rights of others, which may lead to litigation that could itself be costly, could result in the payment of substantial damages or royalties, and/or prevent us from using technology that is essential to our products.
There can be no assurance that our current products or products under development will not infringe any patent or other intellectual property rights of third parties. If infringement claims are brought against us, whether successfully or not, these assertions could distract management from other tasks important to the success of our business, necessitate us expending potentially significant funds and resources to defend or settle such claims and harm our reputation. We cannot be certain that we will have the financial resources to defend ourselves against any patent or other intellectual property litigation.
In addition, intellectual property litigation or claims could force us to do one or more of the following:
cease selling or using any products that incorporate the asserted intellectual property, which would adversely affect our revenue;
pay substantial damages for past use of the asserted intellectual property;
obtain a license from the holder of the asserted intellectual property, which license may not be available on reasonable terms, if at all; or
redesign or rename, in the case of trademark claims, our products to avoid infringing the intellectual property rights of third parties, which may not be possible and could be costly and time-consuming if it is possible to do.
In the event of an adverse determination in an intellectual property suit or proceeding, or our failure to license essential technology, our sales could be harmed and/or our costs could increase, which would harm our financial condition.
We license intellectual property rights in the electronic monitoring space, including patents, from third party owners. If such owners do not properly maintain or enforce the intellectual property underlying such licenses, our competitive position and business prospects could be harmed. Our licensors may also seek to terminate our license.
We are a party to a number of licenses that give us rights to third-party intellectual property that is necessary or useful to our business. Our success will depend in part on the ability of our licensors to obtain, maintain and enforce our licensed intellectual property. Our licensors may not successfully prosecute any applications for or maintain intellectual property to which we have licenses, may determine not to pursue litigation against other companies that are infringing such intellectual property, or may pursue such litigation less aggressively than we would. Without protection for the intellectual property we license, other companies might be able to offer similar products for sale, which could adversely affect our competitive business position and harm our business prospects.
If we lose any of our rights to use third-party intellectual property, it could adversely affect our ability to commercialize our technologies, products or services, as well as harm our competitive business position and our business prospects.
We may be subject to costly product liability claims from the use of our electronic monitoring products, which could damage our reputation, impair the marketability of our products and services and force us to pay costs and damages that may not be covered by adequate insurance.
Manufacturing, marketing, selling, testing and the operation of our electronic monitoring products and services entail a risk of product liability. We could be subject to product liability claims to the extent our electronic monitoring products fail to perform as intended. Even unsuccessful claims against us could result in the expenditure of funds in litigation, the diversion of management time and resources, damage to our reputation and impairment in the marketability of our electronic monitoring products and services. While we maintain liability insurance, it is possible that a successful claim could be made against us, that the amount of our insurance coverage would not be adequate to cover the costs of defending against or paying such a claim, or that damages payable by us would harm our business.
Risks Related to Our Common Stock
The market price of our common stock may vary substantially.
The trading prices of equity securities issued by REITs have historically been affected by changes in market interest rates. One of the factors that may influence the market price of our common stock is the annual yield
from distributions on our common stock as compared to yields on other financial instruments. An increase in market interest rates, or a decrease in our distributions to shareholders, may lead prospective purchasers of our shares to demand a higher annual yield, which could reduce the market price of our common stock.
Other factors that could affect the market price of our common stock include the following:
actual or anticipated variations in our quarterly results of operations;
changes in market valuations of companies in our industry;
changes in expectations of future financial performance or changes in estimates of securities analysts;
fluctuations in stock market prices and volumes;
issuances of common stock or other securities in the future;
the addition or departure of key personnel;
announcements by us or our competitors of acquisitions, investments or strategic alliances; and
changes in the prospects of public-private partnerships in the corrections and detention industry.
Future sales of shares of our common stock could adversely affect the market price of our common stock and may be dilutive to current shareholders.
Sales of shares of our common stock, or the perception that such sales could occur, could adversely affect the price for our common stock. As of December 31, 2017,2018, there were 187,500,000 shares of common stock authorized under our Articles of Incorporation, of which 124,008,303120,584,732 shares were outstanding. Our Board of Directors may authorize the issuance of additional authorized but unissued shares of our common stock or other authorized but unissued securities of ours at any time, including pursuant to equity incentive plans and stock purchase plans.
In September 2014,On October 20, 2017, we filed with the Securities and Exchange Commission (“SEC”)SEC an automatic shelf registration statement on FormS-3. Under this shelf registration, we may, from time to time, sell any combination of securities described in the prospectus in one or more offerings. Each time that we may sell securities, we will provide a prospectus supplement that will contain specific information about the terms of that offering and the securities being offered. On November 10, 2014,9, 2017, in connection with the shelf registration, we filed with the SEC a prospectus supplement related to the offer and sale from time to time of our common stock at an aggregate offering price of up to $150 million through sales agents. Sales of shares of our common stock under the prospectus supplement and the equity distribution agreements entered into with the sales agents, if any, may be made in negotiated transactions or transactions that are deemed to be “at the market” offerings as defined in Rule 415 under the Securities Act of 1933. On September 12, 2017, the shelf registration expired. On October 20, 2017, we filed with the SEC a new automatic shelf registration on FormS-3. UnderThere were 0 shares of common stock sold under this new shelf registration, we may, from time to time, sell any combination of securities described in the prospectus in one or more offerings. Each time that we may sell securities, we will provide a prospectus supplement that will contain specific information aboutduring the terms of that offering and the securities being offered.years ended December 31, 2018 or 2017.
An offering of shares of our common stock may have a dilutive effect on our earnings per share and funds from operations per share after giving effect to the issuance of oursuch shares of common stock in this offering and the receipt of the expected net proceeds. The actual amount of dilution from any offering of our equity securities, cannot be determined at this time. The market price of our common stock could decline as a result of sales of a large number of shares of our common stock in the market pursuant to an offering, or otherwise, or as a result of the perception or expectation that such sales could occur.
Various anti-takeover protections applicable to us may make an acquisition of us more difficult and reduce the market value of our common stock.
We are a Florida corporation and the anti-takeover provisions of Florida law impose various impediments to the ability of a third party to acquire control of our company, even if a change of control would be beneficial to
our shareholders. In addition, provisions of our articles of incorporation may make an acquisition of us more difficult. Our articles of incorporation authorize the issuance by our Board of Directors of “blank check” preferred stock without shareholder approval. Such shares of preferred stock could be given voting rights, dividend rights, liquidation rights or other similar rights superior to those of our common stock, making a takeover of us more difficult and expensive. In addition to discouraging takeovers, the anti-takeover provisions of Florida law and our articles of incorporation may have the impact of reducing the market value of our common stock.
Failure to maintain effective internal controls in accordance with Section 404 of the Sarbanes-Oxley Act of 2002 could have an adverse effect on our business and the trading price of our common stock.
If we fail to maintain the adequacy of our internal controls, in accordance with the requirements of Section 404 of the Sarbanes-Oxley Act of 2002, as such standards are modified, supplemented or amended from
time to time, our exposure to fraud and errors in accounting and financial reporting could materially increase. Also, inadequate internal controls would likely prevent us from concluding on an ongoing basis that we have effective internal control over financial reporting in accordance with Section 404 of the Sarbanes-Oxley Act of 2002. Such failure to achieve and maintain effective internal controls could adversely impact our business and the price of our common stock.
We may issue additional debt securities that could limit our operating flexibility and negatively affect the value of our common stock.
In the future, we may issue additional debt securities which may be governed by an indenture or other instrument containing covenants that could place restrictions on the operation of our business and the execution of our business strategy in addition to the restrictions on our business already contained in the agreements governing our existing debt. In addition, we may choose to issue debt that is convertible or exchangeable for other securities, including our common stock, or that has rights, preferences and privileges senior to our common stock. Because any decision to issue debt securities will depend on market conditions and other factors beyond our control, we cannot predict or estimate the amount, timing or nature of any future debt financings and we may be required to accept unfavorable terms for any such financings. Accordingly, any future issuance of debt could dilute the interest of holders of our common stock and reduce the value of our common stock.
Our stockbuyback program could increase the volatility of the price of our common stock.
In February 2018, our Board of Directors approved a stock buyback program authorizing us to repurchase up to a maximum of $200.0 million of our shares of common stock through October 20, 2020. Repurchases may be made in the open market, in privately negotiated transactions or by other means, from time to time, subject to market conditions, applicable legal requirements and other factors, including the limitations set forth in our indentures and Senior Credit Facility. Under the terms of our Senior Credit Facility, we currently have approximately $120.0 million of immediate, available capacity for repurchases under the stock buyback program. Based on internal forecasts, we believe we will have adequate availability to complete the $200.0 million stock buyback program well in advance of the program’s expiration. There can be no assurance that we will buy shares of our common stock or the timeframe for repurchases under our stock buyback program or that any repurchases will have a positive impact on our stock price or earnings per share. Important factors that could cause us to discontinue or decrease our share repurchases include, among others, unfavorable market conditions, the market price of our common stock, the nature of other investment or strategic opportunities presented to us from time to time, the rate of dilution of our equity compensation programs, our ability to make appropriate, timely, and beneficial decisions as to when, how, and whether to purchase shares under the stock buyback program, and the availability of funds necessary to continue purchasing stock.
| Item 1B. | Unresolved Staff Comments |
None.
| Item 2. | Properties |
We lease ourThe Company leases its corporate offices, which are both located in Boca Raton, Florida, underFlorida. One of the leases expires in March 2019 and has two5-year renewal options, which if exercised would result in a lease agreement which was amendedmaximum term ending in November 2015.March 2029. The currentother lease expires in March 2019December 2028 and has two5-year renewal options which if exercised will result in a maximum term ending in December 2038. The Company elected not to renew the first lease expiring in March 2029. In 2016,2019 as the Company purchased land in Boca Raton, Florida to construct a new corporate office building which is expected to be completed in the fourthfirst quarter of 2018.2019. In addition, we lease office space for our eastern regional office in Charlotte, North Carolina; our central regional office in San Antonio, Texas; our western regional office in Los Angeles, California; and our youth services division in Pittsburgh, Pennsylvania. As a result of the BI acquisition in February 2011 and the Protocol acquisition in February 2014, we are also currently leasing office space in Boulder, Colorado and Aurora, Illinois, respectively. We also lease office space in Sydney and Melbourne, Australia, and in Sandton, South Africa, through our
overseas affiliates to support our Australian, and South African operations, respectively. We consider our office space adequate for our current operations.
See the Facilities and Day Reporting Centers listing under Item 1 for a list of the correctional, detention and reentry properties we own or lease in connection with our operations.
| Item 3. | Legal Proceedings |
The information required herein is incorporated by reference from Note 17 — Commitments and Contingencies in the Notes to the Consolidated Financial Statements included in Part II, Item 8 of this Annual Report on Form10-K.
| Item 4. | Mine Safety Disclosures |
Not applicable.
PART II
| Item 5. | Market for Registrant’s Common Equity, Related Stockholder Matters and Issuer Purchases of Equity Securities |
Our common stock trades on the New York Stock Exchange under the symbol “GEO.” The following table shows the high and low prices for our common stock, as reported by the New York Stock Exchange, for each of the four quarters of 2017 and 2016. The prices shown have been rounded to the nearest $1/100 and have been retroactively adjusted to reflect the effects of our3-for-2 stock split. As of February 21, 20182019 we had 634667 shareholders of record. Shareholders of record does not include shareholders ofwho own shares held in “Street name”.“street name.”
| 2017 | 2016 | |||||||||||||||
Quarter | High | Low | High | Low | ||||||||||||
First | $ | 32.95 | $ | 23.90 | $ | 23.11 | $ | 17.39 | ||||||||
Second | 34.32 | 28.88 | 23.08 | 20.77 | ||||||||||||
Third | 31.03 | 24.72 | 23.39 | 13.01 | ||||||||||||
Fourth | 27.44 | 23.06 | 23.95 | 15.25 | ||||||||||||
DistributionsDividends
As a REIT, the Company iswe are required to distribute annually at least 90% of itsour REIT taxable income (determined without regard to the dividends paid deduction and by excluding net capital gain). and began paying regular quarterly REIT dividends in 2013. The amount, timing and frequency of future distributionsdividends, however, will be at the sole discretion of the Company’sour Board of Directors and will be declared based upon various factors, many of which are beyond the Company’sour control, including, the Company’sour financial condition and operating cash flows, the amount required to maintain REIT status and reduce any income taxes that the Companywe otherwise would be required to pay, limitations on distributions in the Company’sour existing and future debt instruments, limitations on the Company’sour ability to fund distributions using cash generated through our TRSTRSs and other factors that the Company’sour Board of Directors may deem relevant.
During the years ended December 31, 2017 and 2016 we declared and paid the following regular cash distributions to our shareholders which were treated as qualified andnon-qualified ordinary income dividends and non dividend distributions for federal income tax purposes as stated below (retroactively adjusted to reflect the effects of our3-for-2 stock split):Stock Repurchases
| Ordinary Dividends | Capital Gains | |||||||||||||||||||||||||||||||||||||||||||
Declaration Date | Payment Date | Record Date | Distribution per share | Total | Qualified (1) | Non-Qualified | Total | Unrecaptured Section 1250 | Long Term | Non Dividend Distributions (2) | Aggregate Payment Amount (in millions) | |||||||||||||||||||||||||||||||||
February 3, 2016 | | February 26, 2016 | | | February 16, 2016 | | 0.43 | 0.3380015 | 0.0493613 | 0.2886402 | — | — | — | 0.0953319 | 48.5 | |||||||||||||||||||||||||||||
April 20, 2016 | May 12, 2016 | May 2, 2016 | 0.43 | 0.3380015 | 0.0493613 | 0.2886402 | — | — | — | 0.0953319 | 48.7 | |||||||||||||||||||||||||||||||||
July 20, 2016 | | August 12, 2016 | | | August 1, 2016 | | 0.43 | 0.3380015 | 0.0493613 | 0.2886402 | — | — | — | 0.0953319 | 48.7 | |||||||||||||||||||||||||||||
October 18, 2016 | | November 10, 2016 | | | October 31, 2016 | | 0.43 | 0.3380015 | 0.0493613 | 0.2886402 | — | — | — | 0.0953319 | 48.8 | |||||||||||||||||||||||||||||
|
|
|
|
|
|
|
|
|
|
|
|
|
|
|
|
|
| |||||||||||||||||||||||||||
Totals | $ | 1.73 | $ | 1.3520060 | $ | 0.1974452 | $ | 1.1545608 | $ | — | $ | — | $ | — | $ | 0.3813276 | $ | 194.7 | ||||||||||||||||||||||||||
|
|
|
|
|
|
|
|
|
|
|
|
|
|
|
|
|
| |||||||||||||||||||||||||||
Percentage | 100.0 | % | 78.0 | % | 14.6 | % | 85.4 | % | 0.0 | % | 0.0 | % | 0.0 | % | 22.0 | % | ||||||||||||||||||||||||||||
February 6, 2017 | | February 27, 2017 | | | February 17, 2017 | | 0.47 | 0.2644024 | 0.0175622 | 0.2468402 | — | — | — | 0.2025975 | 52.5 | |||||||||||||||||||||||||||||
April 25, 2017 | May 19, 2017 | May 9, 2017 | 0.47 | 0.2661010 | 0.0176751 | 0.2484259 | — | — | — | 0.2038990 | 58.4 | |||||||||||||||||||||||||||||||||
July 10, 2017 | | July 28, 2017 |
| | July 21, 2017 | | 0.47 | 0.2661010 | 0.0176751 | 0.2484259 | — | — | — | 0.2038990 | 58.3 | |||||||||||||||||||||||||||||
October 12, 2017 | | October 30, 2017 | | | October 23, 2017 | | 0.47 | 0.2661010 | 0.0176751 | 0.2484259 | — | — | — | 0.2038990 | 58.3 | |||||||||||||||||||||||||||||
|
|
|
|
|
|
|
|
|
|
|
|
|
|
|
|
|
| |||||||||||||||||||||||||||
Totals | $ | 1.88 | $ | 1.0627054 | $ | 0.0705875 | $ | 0.9921179 | $ | — | $ | — | $ | — | $ | 0.8142945 | $ | 227.5 | ||||||||||||||||||||||||||
|
|
|
|
|
|
|
|
|
|
|
|
|
|
|
|
|
| |||||||||||||||||||||||||||
Percentage | 100.0 | % | 56.6 | % | 6.6 | % | 93.4 | % | 0.0 | % | 0.0 | % | 0.0 | % | 43.4 | % | ||||||||||||||||||||||||||||
Period | Total Number of Shares Purchased (1) | Average Price Paid per Share | Total Number of Shares Purchased as Part of Publicly Announced Plans or Programs | Approximate Dollar Value of Shares that May Yet Be Purchased Under the Plans or Programs (in millions) (1) | ||||||||||||
October 1, 2018 — October 31, 2018 | — | $ | — | — | $ | 129.6 | ||||||||||
November 1, 2018 — November 30, 2018 | 734,190 | $ | 22.51 | 734,190 | $ | 113.0 | ||||||||||
December 1, 2018 — December 31, 2018 | 358,581 | $ | 22.55 | 358,581 | $ | 104.8 | ||||||||||
|
|
|
| |||||||||||||
Total | 1,092,771 | 1,092,771 | ||||||||||||||
|
|
|
| |||||||||||||
| (1) | On February 14, 2018, we announced that our Board of |
We intend to continue paying regular quarterly cash dividends consistent with our stated expectation to pay at least 75% of our adjusted funds from operations (“AFFO”) in dividends with a goal to increase our dividend payout ratio over time. The amount, timing and frequency of our future dividends will be at the sole discretion of the Board of Directors based upon the factors mentioned above.
In addition to these factors, the indentures governing our 6.00% Senior Notes, 5.125% Senior Notes, 5.875% Senior Notes due 2024, 5.875% Senior Notes due 2022 and our senior credit facility also place material restrictions on our ability to pay dividends. See the Liquidity and Capital Resources section in “Item 7. Management’s Discussion and Analysis of Financial Condition and Results of Operations” and Note 13 — Debt in “Item 8 — Financial Statements and Supplementary Data”, for further description of these restrictions. We believe we have the ability to continue to fund our working capital, our debt service requirements, and our maintenance and growth capital expenditure requirements, while maintaining sufficient liquidity for other corporate purposes.
Performance Graph
The following performance graph compares the performance of our common stock to the Russell 2000, the S&P 500 Commercial Services and Supplies Index, and the MSCI U.S. REIT Index and is provided in accordance with Item 201(e) ofRegulation S-K.
Comparison of Five-Year Cumulative Total Return*
The GEO Group, Inc., Russell 2000,
S&P 500 Commercial Services and Supplies Index
and MSCI U.S. REIT Index
(Performance through December 31, 2017)2018)
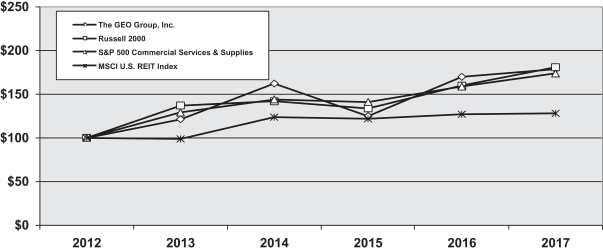
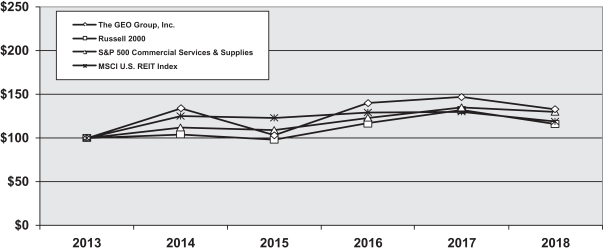
| Date | The GEO Group, Inc. | Russell 2000 | S&P 500 Commercial Services and Supplies | MSCI U.S. REIT Index | The GEO Group, Inc. | Russell 2000 | S&P 500 Commercial Services and Supplies | MSCI U.S. REIT Index | ||||||||||||||||||||||||
December 31, 2012 | $ | 100.00 | $ | 100.00 | $ | 100.00 | $ | 100.00 | ||||||||||||||||||||||||
December 31, 2013 | $ | 121.28 | $ | 137.00 | $ | 129.03 | $ | 98.61 | $ | 100.00 | $ | 100.00 | $ | 100.00 | $ | 100.00 | ||||||||||||||||
December 31, 2014 | $ | 162.14 | $ | 141.84 | $ | 143.99 | $ | 123.54 | $ | 133.69 | $ | 103.53 | $ | 111.60 | $ | 125.28 | ||||||||||||||||
December 31, 2015 | $ | 124.83 | $ | 133.74 | $ | 140.97 | $ | 121.68 | $ | 102.93 | $ | 97.62 | $ | 109.26 | $ | 123.39 | ||||||||||||||||
December 31, 2016 | $ | 169.84 | $ | 159.78 | $ | 158.69 | $ | 126.82 | $ | 140.05 | $ | 116.63 | $ | 122.99 | $ | 128.61 | ||||||||||||||||
December 31, 2017 | $ | 178.46 | $ | 180.79 | $ | 173.67 | $ | 127.90 | $ | 147.16 | $ | 131.96 | $ | 134.60 | $ | 129.71 | ||||||||||||||||
December 31, 2018 | $ | 133.40 | $ | 115.89 | $ | 130.43 | $ | 118.50 | ||||||||||||||||||||||||
Assumes $100 invested on December 31, 20122013 in our common stock and the respective Index.
| * | Total return assumes reinvestment of dividends. |
| Item 6. | Selected Financial Data |
The following table sets forth historical financial data as of and for each of the five years in the period ended December 31, 2017.2018. The selected consolidated financial data should be read in conjunction with our “Management Discussion and Analysis of Financial Condition and Results of Operations” and our consolidated financial statements and the notes to the consolidated financial statements (in thousands, except per share and operational data). Outstanding share andper-share amounts disclosed for all periods presented have been retroactively adjusted to reflect the effects of our3-for-2 stock split.
Year Ended: | 2017 | 2016 | 2015 | 2014 | 2013 | 2018 | 2017 | 2016 | 2015 | 2014 | ||||||||||||||||||||||||||||||
Results of Continuing Operations: | ||||||||||||||||||||||||||||||||||||||||
Revenues | $ | 2,263,420 | $ | 2,179,490 | $ | 1,843,307 | $ | 1,691,620 | $ | 1,522,074 | $ | 2,331,386 | $ | 2,263,420 | $ | 2,179,490 | $ | 1,843,307 | $ | 1,691,620 | ||||||||||||||||||||
Operating income from continuing operations | 248,285 | 265,584 | 235,729 | 234,731 | 185,484 | |||||||||||||||||||||||||||||||||||
Income from continuing operations | $ | 146,024 | $ | 148,498 | $ | 139,315 | $ | 143,840 | $ | 117,462 | ||||||||||||||||||||||||||||||
Operating income | 264,665 | 248,285 | 265,584 | 235,729 | 234,731 | |||||||||||||||||||||||||||||||||||
Net income | $ | 144,827 | $ | 146,024 | $ | 148,498 | $ | 139,315 | $ | 143,840 | ||||||||||||||||||||||||||||||
|
|
|
|
|
|
|
|
|
| |||||||||||||||||||||||||||||||
Income from continuing operations per common share attributable to The GEO Group, Inc.: | ||||||||||||||||||||||||||||||||||||||||
Income per common share attributable to The GEO Group, Inc.: | ||||||||||||||||||||||||||||||||||||||||
Basic: | $ | 1.22 | $ | 1.34 | $ | 1.26 | $ | 1.99 | $ | 1.65 | $ | 1.21 | $ | 1.22 | $ | 1.34 | $ | 1.26 | $ | 1.99 | ||||||||||||||||||||
|
|
|
|
|
|
|
|
|
| |||||||||||||||||||||||||||||||
Diluted: | $ | 1.21 | $ | 1.33 | $ | 1.25 | $ | 1.98 | $ | 1.64 | $ | 1.20 | $ | 1.21 | $ | 1.33 | $ | 1.25 | $ | 1.98 | ||||||||||||||||||||
|
|
|
|
|
|
|
|
|
| |||||||||||||||||||||||||||||||
Weighted Average Shares Outstanding: | ||||||||||||||||||||||||||||||||||||||||
Basic | 120,095 | 111,065 | 110,544 | 108,405 | 106,674 | 120,241 | 120,095 | 111,065 | 110,544 | 108,405 | ||||||||||||||||||||||||||||||
Diluted | 120,814 | 111,485 | 110,993 | 108,821 | 107,408 | 120,747 | 120,814 | 111,485 | 110,993 | 108,821 | ||||||||||||||||||||||||||||||
Cash Dividends per Common Share: | ||||||||||||||||||||||||||||||||||||||||
Cash Dividends | $ | 1.88 | $ | 1.73 | $ | 1.67 | $ | 1.55 | $ | 1.37 | $ | 1.88 | $ | 1.88 | $ | 1.73 | $ | 1.67 | $ | 1.55 | ||||||||||||||||||||
Financial Condition: | ||||||||||||||||||||||||||||||||||||||||
Current assets | $ | 579,709 | $ | 697,669 | $ | 438,346 | $ | 377,406 | $ | 384,345 | $ | 591,107 | $ | 579,709 | $ | 697,669 | $ | 438,346 | $ | 377,406 | ||||||||||||||||||||
Current liabilities | 369,563 | 504,058 | 278,624 | 254,075 | 223,125 | 694,583 | 369,563 | 504,058 | 278,624 | 254,075 | ||||||||||||||||||||||||||||||
Total assets | 4,226,908 | 3,749,409 | 3,462,227 | 3,002,208 | 2,889,364 | 4,247,463 | 4,226,908 | 3,749,409 | 3,462,227 | 3,002,208 | ||||||||||||||||||||||||||||||
Long-term debt, including current portion (excludingnon-recourse debt and capital leases and unamortized debt issuance costs) | 2,217,287 | 1,957,530 | 1,878,870 | 1,465,921 | 1,488,721 | 2,429,312 | 2,217,287 | 1,957,530 | 1,878,870 | 1,465,921 | ||||||||||||||||||||||||||||||
Total Shareholders’ equity | $ | 1,198,919 | $ | 974,957 | $ | 1,006,837 | $ | 1,045,993 | $ | 1,023,976 | $ | 1,039,904 | $ | 1,198,919 | $ | 974,957 | $ | 1,006,837 | $ | 1,045,993 | ||||||||||||||||||||
Operational Data: | ||||||||||||||||||||||||||||||||||||||||
Facilities in operation | 141 | 104 | 104 | 92 | 86 | 135 | 141 | 104 | 104 | 92 | ||||||||||||||||||||||||||||||
Operational capacity of contracts (1) | 88,272 | 83,599 | 83,878 | 75,302 | 66,130 | 88,567 | 88,272 | 83,599 | 83,878 | 75,302 | ||||||||||||||||||||||||||||||
Compensated mandays (2) | 27,321,685 | 24,843,516 | 23,841,256 | 22,390,904 | 20,867,016 | 28,350,591 | 27,321,685 | 24,843,516 | 23,841,256 | 22,390,904 | ||||||||||||||||||||||||||||||
| (1) | Represents the number of beds primarily from correction and detention facilities and excludes idle facilities and beds under |
| (2) | Compensated mandays are calculated as follows: (a) for per diem rate facilities — the number of beds occupied by residents on a daily basis during the fiscal year; and (b) for fixed rate facilities — the capacity of the facility multiplied by the number of days the facility was in operation during the fiscal year. |
| Item 7. | Management’s Discussion and Analysis of Financial Condition and Results of Operations |
Introduction
The following discussion and analysis provides information which management believes is relevant to an assessment and understanding of our consolidated results of operations and financial condition. This discussion contains forward-looking statements that involve risks and uncertainties. Our actual results may differ materially from those anticipated in these forward-looking statements as a result of numerous factors including, but not limited to, those described above under “Item 1A. Risk Factors,” and “Forward-Looking Statements —- Safe Harbor” below. The discussion should be read in conjunction with the consolidated financial statements and notes thereto.
We are a real estate investment trust specializing in the ownership, leasing and management of correctional, detention and reentry facilities and the provision of community-based services and youth services in the United States, Australia, South Africa, and the United Kingdom. We own, lease and operate a broad range of correctional and detention facilities including maximum, medium and minimum security prisons, immigration detention centers, minimum security detention centers, and community based reentry facilities. We offer counseling, education and/or treatment to inmates with alcohol and drug abuse problems at most of the domestic facilities we manage. We are also a provider of innovative compliance technologies, industry-leading monitoring services, and evidence-based supervision and treatment programs for community-based parolees, probationers and pretrial defendants. Additionally, we have an exclusive contract with ICE to provide supervision and reporting services designed to improve the participation ofnon-detained aliens in the immigration court system. We develop new facilities based on contract awards, using our project development expertise and experience to design, construct and finance what we believe arestate-of-the-art facilities that maximize security and efficiency. We also provide secure transportation services for offender and detainee populations as contracted domestically and in the United Kingdom through our joint venture GEOAmey.
As of December 31, 2017,2018, our worldwide operations included the management and/or ownership of approximately 96,000 beds at 141135 correctional, detention and reentry facilities, including idle facilities and projects under development and also included the provision of servicing of more than 185,000210,000 offenders in a community-based environment on behalf of approximately 900 federal, state and local correctional agencies located in all 50 states.
For the years ended December 31, 2018, 2017 2016 and 2015,2016, we had consolidated revenues of $2.3 billion, $2.2$2.3 billion and $1.8$2.2 billion, respectively, and we maintained an average company wide facility occupancy rate of 92.7% including 88,567 active beds and excluding 7,068 idle beds for the year ended December 31, 2018, and 91.2% including 88,272 active beds and excluding 7,846 idle beds and beds under development for the year ended December 31, 2017, and 93.4% including 83,599 active beds and excluding 3,538 idle beds and beds under development for the year ended December 31, 2016.2017.
REIT Conversion
We have been a leading owner, lessor and operator of correctional, detention and reentry facilities and provider of community-based services and youth services in the industry since 1984 and began operating as a REIT for federal income tax purposes effective January 1, 2013. As a result of the REIT conversion, we reorganized our operations and movednon-real estate components into TRSs. Through the TRS structure, the portion of our businesses which arenon-real estate related, such as our managed-only contracts, international operations, electronic monitoring services, and othernon-residential and community based facilities, are part of wholly-owned taxable subsidiaries of the REIT. Most of our business segments, which are real estate related and involve company-owned and company-leased facilities, are part of the REIT. The TRS structure allows us to maintain the strategic alignment of almost all of our diversified business segments under one entity. The TRS assets and operations will continue to be subject to federal and state corporate income taxes and to foreign taxes as applicable in the jurisdictions in which those assets and operations are located.
As a REIT, we are required to distribute annually at least 90% of our REIT taxable income (determined without regard to the dividends paid deduction and by excluding net capital gain) and we began paying regular distributions in 2013. We declared and paid the following regular REIT distributions to our shareholders for the years ended December 31, 2018, 2017 2016 and 20152016 which were treated for federal income taxes as follows (retroactively adjusted to reflect the effects of our3-for-2 stock split):
| Ordinary Dividends | Ordinary Dividends | |||||||||||||||||||||||||||||||||||||||||||||||
Declaration Date | Payment Date | Record Date | Distribution Per Share | Qualified(1) | Non-Qualified | Nondividend Distributions(2) | Aggregate Payment Amount (millions) | Payment Date | Record Date | Distribution Per Share | Qualified(1) | Non-Qualified | Nondividend Distributions(2) | Aggregate Payment Amount (millions) | ||||||||||||||||||||||||||||||||||
February 6, 2015 | February 27, 2015 | February 17, 2015 | $ | 0.41 | $ | 0.0353166 | $ | 0.2759814 | $ | 0.1020353 | $ | 46.0 | ||||||||||||||||||||||||||||||||||||
April 29, 2015 | May 21, 2015 | May 11, 2015 | $ | 0.41 | $ | 0.0353166 | $ | 0.2759814 | $ | 0.1020353 | $ | 46.3 | ||||||||||||||||||||||||||||||||||||
July 31, 2015 | August 24, 2015 | August 14, 2015 | $ | 0.41 | $ | 0.0353166 | $ | 0.2759814 | $ | 0.1020353 | $ | 46.3 | ||||||||||||||||||||||||||||||||||||
November 3, 2015 | November 25, 2015 | November 16, 2015 | $ | 0.43 | $ | 0.0370254 | $ | 0.2893354 | $ | 0.1069725 | $ | 48.5 | ||||||||||||||||||||||||||||||||||||
February 3, 2016 | February 26, 2016 | February 16, 2016 | $ | 0.43 | $ | 0.0493613 | $ | 0.2886402 | $ | 0.0953319 | $ | 48.5 | February 26, 2016 | February 16, 2016 | $ | 0.43 | $ | 0.0493613 | $ | 0.2886402 | $ | 0.0953319 | $ | 48.5 | ||||||||||||||||||||||||
April 20, 2016 | May 12, 2016 | May 2, 2016 | $ | 0.43 | $ | 0.0493613 | $ | 0.2886402 | $ | 0.0953319 | $ | 48.7 | May 12, 2016 | May 2, 2016 | $ | 0.43 | $ | 0.0493613 | $ | 0.2886402 | $ | 0.0953319 | $ | 48.7 | ||||||||||||||||||||||||
July 20, 2016 | August 12, 2016 | August 1, 2016 | $ | 0.43 | $ | 0.0493613 | $ | 0.2886402 | $ | 0.0953319 | $ | 48.7 | August 12, 2016 | August 1, 2016 | $ | 0.43 | $ | 0.0493613 | $ | 0.2886402 | $ | 0.0953319 | $ | 48.7 | ||||||||||||||||||||||||
October 18, 2016 | November 10, 2016 | October 31, 2016 | $ | 0.43 | $ | 0.0493613 | $ | 0.2886402 | $ | 0.0953319 | $ | 48.8 | November 10, 2016 | October 31, 2016 | $ | 0.43 | $ | 0.0493613 | $ | 0.2886402 | $ | 0.0953319 | $ | 48.8 | ||||||||||||||||||||||||
February 6, 2017 | February 27, 2017 | February 17, 2017 | $ | 0.47 | $ | 0.0175622 | $ | 0.2468402 | $ | 0.2025975 | $ | 52.5 | February 27, 2017 | February 17, 2017 | $ | 0.47 | $ | 0.0175622 | $ | 0.2468402 | $ | 0.2025975 | $ | 52.5 | ||||||||||||||||||||||||
April 25, 2017 | May 19, 2017 | May 9, 2017 | $ | 0.47 | $ | 0.0176751 | $ | 0.2484259 | $ | 0.2038990 | $ | 58.4 | May 19, 2017 | May 9, 2017 | $ | 0.47 | $ | 0.0176751 | $ | 0.2484259 | $ | 0.2038990 | $ | 58.4 | ||||||||||||||||||||||||
July 10, 2017 | July 28, 2017 | July 21, 2017 | $ | 0.47 | $ | 0.0176751 | $ | 0.2484259 | $ | 0.2038990 | $ | 58.3 | July 28, 2017 | July 21, 2017 | $ | 0.47 | $ | 0.0176751 | $ | 0.2484259 | $ | 0.2038990 | $ | 58.3 | ||||||||||||||||||||||||
October 12, 2017 | October 30, 2017 | October 23, 2017 | $ | 0.47 | $ | 0.0176751 | $ | 0.2484259 | $ | 0.2038990 | $ | 58.3 | October 30, 2017 | October 23, 2017 | $ | 0.47 | $ | 0.0176751 | $ | 0.2484259 | $ | 0.2038990 | $ | 58.3 | ||||||||||||||||||||||||
February 5, 2018 | February 27, 2018 | February 16, 2018 | $ | 0.47 | $ | 0.0461171 | $ | 0.2090220 | $ | 0.2148609 | $ | 58.3 | ||||||||||||||||||||||||||||||||||||
April 11, 2018 | May 3, 2018 | April 23, 2018 | $ | 0.47 | $ | 0.0461171 | $ | 0.2090220 | $ | 0.2148609 | $ | 57.4 | ||||||||||||||||||||||||||||||||||||
July 10, 2018 | July 27, 2018 | July 20, 2018 | $ | 0.47 | $ | 0.0461171 | $ | 0.2090220 | $ | 0.2148609 | $ | 57.2 | ||||||||||||||||||||||||||||||||||||
October 15, 2018 | November 2, 2018 | October 26, 2018 | $ | 0.47 | $ | 0.0461171 | $ | 0.2090220 | $ | 0.2148609 | $ | 57.2 | ||||||||||||||||||||||||||||||||||||
| (1) | The amount constitutes a “Qualified Dividend”, as defined by the Internal Revenue Service. |
| (2) | The amount constitutes a “Return of Capital”, as defined by the Internal Revenue Service. |
Critical Accounting Policies
We believe that the accounting policies described below are critical to understanding our business, results of operations and financial condition because they involve the more significant judgments and estimates used in the preparation of our consolidated financial statements. We have discussed the development, selection and application of our critical accounting policies with the audit committee of our Board of Directors, and our audit committee has reviewed our disclosure relating to our critical accounting policies in this “Management’s Discussion and Analysis of Financial Condition and Results of Operations.”
Our consolidated financial statements are prepared in conformity with accounting principles generally accepted in the United States. As such, we are required to make certain estimates, judgments and assumptions that we believe are reasonable based upon the information available. These estimates and assumptions affect the reported amounts of assets and liabilities at the date of the financial statements and the reported amounts of revenues and expenses during the reporting period. We routinely evaluate our estimates based on historical experience and on various other assumptions that our management believes are reasonable under the circumstances. Actual results may differ from these estimates under different assumptions or conditions. If actual results significantly differ from our estimates, our financial condition and results of operations could be materially impacted.
Other significant accounting policies, primarily those with lower levels of uncertainty than those discussed below, are also critical to understanding our consolidated financial statements. The notes to our consolidated financial statements contain additional information related to our accounting policies and should be read in conjunction with this discussion.
Revenue Recognition
Facility management revenues are recognizedOn January 1, 2018, we adopted Accounting Standards Codification (“ASC”) Topic 606, “Revenue from Contracts with Customers” using the modified retrospective method applied to those contracts that were not completed as services are provided under facility management contracts with approved government appropriations based onof January 1, 2018. The adoption of this standard did not result in a net rate per day per inmate or onsignificant change to our historical revenue recognition policies and there were no significant adjustments that required a fixed monthly rate, ascumulative adjustment to retained earnings upon transition.
applicable.Revenue is recognized when control of the promised goods or services is transferred to our customers, in an amount that reflects the consideration we expect to be entitled to in exchange for those goods or services. Sales, value added and other taxes that we collect concurrent with revenue producing activities and that are subsequently remitted to governmental authorities are excluded from revenues. The guidance distinguishes between goods and services. The definition of services under the guidance includes everything other than goods. As such, in our case, this guidance views the provision of housing as a service.
When a contract includes variable consideration, we determine an estimate of the variable consideration and evaluate whether the estimate needs to be constrained; therefore, we include the variable consideration in the transaction price only to the extent that it is probable that a significant reversal of the amount of cumulative revenue recognized will not occur when the uncertainty associated with the variable consideration is subsequently resolved. Variable consideration estimates are updated at each reporting date. A limited number of our domestic contracts have provisions upon which a small portion of the revenue for the contract is based on the performance of certain targets. RevenueDomestically, revenue based on the performance of certain targets is less than 1% of our consolidated annual revenues.domestic revenues and was not significant during the periods presented. One of our international contracts, related to our Ravenhall correctional facility project (discussed further below), contains a provision where a significant portion of the revenue for the contract is based on the performance of certain targets. These performance targets are based on specific criteria to be met over specific periods of time. Such criteria includes our ability to achieve certain contractual benchmarks relative to the quality of service we provide,non-occurrence of certain disruptive events, effectiveness of our quality control programs and our responsiveness to customer requirementsrequirements. The performance of these targets are measured quarterly and concerns. Forthere was no significant constraint on the limited numberestimate of such variable consideration for this contract during the year ended December 31, 2018.
We do not disclose the value of unsatisfied performance obligations for (i) contracts wherewith an expected length of one year or less and (ii) contracts for which revenue is recognized at the amount to which we have the right to invoice for services performed, which is generally the case for all of our contracts. Incidental items that are immaterial in the context of the contract are recognized as expense. We generally do not incur incremental costs related to obtaining a contract with our customers that would meet the requirement for capitalization. There were no assets recognized from costs to obtain a contract with a customer at December 31, 2018 or December 31, 2017.
The timing of revenue recognition may differ from the timing of invoicing to customers. We record a receivable when services are performed which are due from our customers based on the passage of time. We record a contract liability if consideration is received in advance of the performance of certain targets,services. Generally, our customers do not provide payment in advance of the performance of services. Therefore, any contract liability is not significant at December 31, 2018 or December 31, 2017 and revenue recognized during the year ended December 31, 2018 that was included in the opening balance of unearned revenue was not significant. There have been no significant amounts of revenue recorded in the periods presented from performance obligations either wholly or partially satisfied in prior periods.
The right to consideration under our contracts is either (i) recorded pro rata whenonly dependent on the passage of time and is therefore considered to be unconditional. Payment terms and conditions vary by contract type, although, with the exception of the contract receivable related to our Ravenhall correctional facility (further discussed below), terms generally include a requirement of payment within 30 days after performance obligations are satisfied and generally do not include a significant financing component. There have been no significant changes in receivable or unearned revenue balances during the period other than regular invoicing and collection activity.
Owned and Leased — Corrections & Detention
We recognize revenue for corrections & detention housing services where we own or lease the facility as services are performed. We provide for the safe and secure housing and care of incarcerated individuals under public-private partnerships with federal, state and local government agencies. This includes providing24-hour care and supervision, including but not limited to, such services as medical, transportation, food service, laundry services and various programming activities. These tasks are considered to be activities to fulfill the safe and secure housing performance obligation and are not considered to be individually separate promises in the contract. Each of these activities is highly interrelated and we perform a significant level of integration of these activities. We have identified these activities as a bundle of services and determined that each day of the promised service is distinct. The services provided are part of a series of distinct services that are substantially the same and are measured using the same measure of progress (time-based output method). We have determined that revenue for these services are recognized over time as our customers simultaneously receive and consume the benefits as the services are performed, which is on a continual daily basis, and we have a right to payment for performance completed to date. Time-based output methods of revenue recognition are considered to be a faithful depiction of our efforts to fulfill our obligations under our contracts and therefore reflect the transfer of services to our customers. Our customers generally pay for these services based on a net rate per day per individual or on a fixed monthly rate.
Owned and determinableLeased — Community-based
We recognize revenue for community-based reentry services where we own or (ii) recorded whenlease the specified time period lapses. In many instances,facility in a manner similar to our corrections and detention services discussed above. We provide individuals nearing the end of their sentence with the resources necessary to productively transition back into society. Through our residential reentry centers, we provide federal and state parolees and probationers with temporary housing, rehabilitation, substance abuse counseling and vocational and educational programs. These activities are considered to be a bundle of services which are a partypart of a series of distinct services recognized over time based on the same criteria as discussed above for corrections and detention revenues. Our customers also generally pay for these services based on a net rate per day per individual or on a fixed monthly rate.
Owned and Leased — Youth Services
We recognize revenues for youth services where we own or lease the facility in the same manner as discussed above for the housing, supervision, care and rehabilitation of troubled youth residents. The activities to more thanhouse and care for troubled youth residents are also considered to be a bundle of services which are part of a series of distinct services recognized over time based on the same criteria discussed for the previous two revenue streams. Our customers generally pay for these services based on a net rate per day per individual.
Managed Only
We recognize revenue for our managed only contracts in the same manner as our Owned and Leased Corrections & Detention and Owned and Leased Community-based contracts as discussed above. The primary exception is that we do not own or lease the facility. The facility is owned by the customer. In certain circumstances, our customers may request that we make certain capital improvements to the facility or make other payments related to the facility. These payments are amortized as a reduction of revenues over the life of the contract. Our customers generally pay for these services based on a net rate per day per individual or a fixed monthly rate.
Facility Construction and Design
Facility Construction and Design revenues during the year ended December 31, 2017 consisted of one contract with the Department of Justice in the State of Victoria (the “State”) for the development and operation of
a single entity. In these instances, each contract is accounted for separately.
Construction revenuesnew1,300-bed correctional facility (the “Facility”) in Ravenhall, a locality near Melbourne, Australia. The Facility was completed during the fourth quarter of 2017 and we are recognized from our contracts with certain customers to performcurrently managing the Facility under a25-year management contract. There were no facility construction and design revenues related to the Facility during the year ended December 31, 2018. Our promise to design and construct the Facility was considered to be a separate and distinct performance obligation from the management obligation which includes the safe and secure housing, care and programming activities for incarcerated individuals similar to the correction & detention services (“project development services”)discussed above. For the obligation to manage the Facility, we have determined that revenue should be recorded over time using a time-based output method based on the same criteria as discussed above for various facilities. In these instances,correction and detention services. Fees included and priced in the contract for managing the Facility are considered to be stated at their individual estimated stand-alone selling prices using the adjusted market assessment approach. These services are regularly provided by us on a stand-alone basis to similar customers within a similar range of amounts. We used the expected cost plus margin approach to allocate the transaction price to the construction obligation. We were entitled under the contract to receive consideration in the amount of our costs plus a margin.
During the design and construction phase, we actdetermined that revenue should be recorded over time and applied cost based input methods using the actual costs incurred relative to the total estimated costs (percentage of completion basis) to determine progress towards contract completion and to calculate the corresponding amount of revenue and gross profit to recognize. Cost based input methods of revenue recognition are considered to be a faithful depiction of our efforts to satisfy long-term construction contracts and therefore reflect the transfer of goods to the customer as the primary developercustomer controls the work in progress as the Facility is constructed. Cost based input methods of revenue recognition also require us to make estimates of net contract revenues and subcontract with bonded National and/or Regional Design Build Contractors. These construction revenues are recognized as earned on a percentage of completion basis measured bycosts to complete the percentage ofproject. Significant judgment was required to evaluate the costs incurred to date as compared tocomplete the project, including materials, labor, contingencies and other costs. If estimated total cost for each contract. Provisions forcosts on the contract are greater than the net contract revenues, the entire estimated lossesloss on uncompleted contracts and changesthe contract is recognized in the period the loss becomes known. The cumulative effect of revisions to cost estimates related to net contract revenues or costs to complete are maderecorded in the period in which we determine that such lossesthe revisions to estimates are identified and changes are probable.the amounts can be reasonably estimated. Typically, we enter into fixed price contracts and do not perform additional work unless approved change orders are in place. Costs attributable to unapproved change orders are expensed in the period in which the costs are incurred if we believe that it is not probable that the costs will be recovered through a change in the contract price. If we believe that it is probable that the costs will be recovered through a change in the contract price, costs related to unapproved change orders are expensed in the period in which they are incurred, and contract revenue is recognized to the extent of the costs incurred. Revenue in excess of the costs attributable to unapproved change orders is not recognized until the change order is approved. Changes in job performance, job conditions, and estimated profitability, including those arising from contract penalty provisions, and final contract settlements, may result in revisions to estimated costs and income, and are recognized in the period in which the revisions are determined. For the years ended December 31, 2017, 2016 and 2015,periods presented, there have beenwere no changes in job performance, job conditions and estimated profitability that would requirerequired a revision to the estimated costs and income relatedrecorded.
We were the primary developer of the project and subcontracted with a bonded international design and build contractor to project development services.design and construct the Facility. As the primary contractor for the project, we are exposeddetermined that we were primarily responsible for fulfilling the promise to develop and provide the Facility to the various risks associated withState, including overall responsibility for the acceptability of the project in meeting the State’s specifications. Therefore, we were considered to be a principal in the transaction and construction including the risk of cost overruns. Accordingly, we record ourrevenues and construction revenuecosts were recorded on a gross basis and include the relatedbasis.
The cost of the project during the design and construction activitiesphase was funded by debt financing along with a capital contribution by us which was made in Operating Expenses.January 2017. Our promise to provide the equity contribution was considered to be a separate and distinct performance obligation that is separate from the construction and facility management obligations. The contribution represents a significant financing element which provided a benefit to the State. Costs incurred and estimated earnings in excess of billings were classified as contract receivable in the accompanying consolidated balance sheets. The contract receivable was partially satisfied through a State
When evaluating multiple element arrangements
contribution, which was made in November 2017 upon commercial acceptance of the Facility, and by quarterly payments to be made over the25-year operating phase. The timing of these payments provide the State with a significant benefit of financing for certainthe Facility as the payments by the State occur significantly after performance (construction of the Facility). Therefore, the contract receivable has been recorded at net present value based on the timing of expected future settlement. Interest income is calculated using an effective interest rate of 8.97% and has been presented separately from facility design and construction revenue. Interest income also includes an equity return for our capital contribution.
During 2018, we had facility construction & design services related to an expansion project at our Fulham Correctional Centre in Australia which is expected to be completed in the third quarter of 2020. Revenues have been recorded under the same methodology as discussed above.
Non-residential Services and Other
Non-residential Services and Other revenue consists of our contracts where wewith federal and various state and local governments to provide project developmentlocation, alcohol and drug detecting electronic monitoring and case management services to individuals on an as needed or as requested basis. This category also includes our clients in addition to standardday reporting centers.
We recognize revenues for electronic monitoring and case management services we follow revenue recognition guidance for multiple element arrangements under ASC605-25 “Multiple Element Arrangements”. This revenue recognition guidance related to multiple deliverables in an arrangement provides guidance on determining if separate contracts should be evaluated as a single arrangement and if an arrangement involves a single unit of accounting or separate units of accounting and if the arrangement is determined to have separate units, how to allocate amounts received in the arrangement for revenue recognition purposes. In instances where we provide these project development services and subsequent management services, generally, the arrangement results in no delivered elements at the onset of the agreement. The elements are delivered, and revenue is recognized, over the contract period as the project development and management services are performed. Project developmentServices provided consist of community-based supervision (home visits),in-person reporting, telephonic reporting and GPS and other electonic monitoring as well as overall contract management services. The rates for the various services are generally not provided separatelyconsidered to a customer without a management contract.be stated at their individual stand-alone selling prices. We have determined that the significant deliverables in such an arrangement during the project development phase and services performed under the management contract qualify as separate units of accounting. With respect to the deliverables during the management services period, we regularly negotiate such contracts and provide management services to be provided are recognized over time based on the unit of occurrence of the various services as our customers outside of any arrangementcustomer simultaneously receives and consumes the benefits as the services are performed and we have a right to payment for construction. We establishperformance completed to date. Generally, these services are paid based on a net rate per diem ratesoccurrence and a monthly fee for allmanagement services.
Certain of our managementelectronic monitoring contracts basedinclude providing monitoring equipment and related monitoring services activities (using internal proprietary software platforms) to our customers. These tasks are considered to be activities to fulfill the promise to provide electronic monitoring services to individuals and are not considered to be individually separate promises in the contract. In the context of the contract, the equipment and monitoring service is not considered to be capable of being distinct as the customer typically cannot benefit from the equipment or monitoring service on amongstits own or with other factors, expectedreadily available resources. We have identified these activities as a bundle of services and guaranteed occupancy, costsdetermined that each day or unit of providingthe promised service is distinct. These services are part of a series of distinct services that are substantially the same and are measured using the same measure of progress (time-based output method) and are therefore accounted for as a single performance obligation. We have determined that services are recognized over time as the customer simultaneously receives and consumes the benefits as the services are performed and desired margins. As such,we have a right to payment for performance completed to date.
Services provided for our day reporting centers are similar to our Owned and Leased Community-based services discussed above with the fair valueexception of the consideration to each deliverable was determined using our estimated selling price for the project development deliverable and vendor specific objective evidence for the facility management services deliverable.temporary housing.
Reserves for Insurance Losses
The nature of our business exposes us to various types of third-party legal claims, including, but not limited to, civil rights claims relating to conditions of confinement and/or mistreatment, sexual misconduct claims brought by prisoners or detainees, product liability claims, intellectual property infringement claims, claims relating to employment matters (including, but not limited to, employment discrimination claims, union grievances and wage and hour claims), property loss claims, environmental claims, automobile liability claims, contractual claims and claims for personal injury or other damages resulting from contact with our facilities, programs, electronic monitoring products, personnel or prisoners, including damages arising from a prisoner’s
escape or from a disturbance or riot at a facility. In addition, our management contracts generally require us to indemnify the governmental agency against any damages to which the governmental agency may be subject in connection with such claims or litigation. We maintain a broad program of insurance coverage for these general types of claims, except for claims relating to employment matters, for which we carry no insurance. There can be no assurance that our insurance coverage will be adequate to cover all claims to which we may be exposed. It is our general practice to bring merged or acquired companies into our corporate master policies in order to take advantage of certain economies of scale.
We currently maintain a general liability policy and excess liability policies with total limits of $80.0 million per occurrence and $100 million in the aggregate covering the operations of U.S. Corrections & Detention, GEO Care’s community basedcommunity-based services, GEO Care’s youth services and BI. We have a claims-made liability insurance program with a specific loss limit of $35.0 million per occurrence and in the aggregate related to medical professional liability claims arising out of correctional healthcare services. We are uninsured for any claims in excess of these limits. We also maintain insurance to cover property and other casualty risks including, workers’ compensation, environmental liability, cybersecurity liabiity and automobile liability.
For most casualty insurance policies, we carry substantial deductibles or self-insured retentions of $3.0 million per occurrence for general liability and medical professional liability, $2.0 million per occurrence for workers’ compensation and $1.0 million per occurrence for automobile liability. In addition, certain of our facilities located in Florida and other high-risk hurricane areas carry substantial windstorm deductibles. Since hurricanes are considered unpredictable future events, no reserves have been established topre-fund for potential windstorm damage. Limited commercial availability of certain types of insurance relating to windstorm exposure in coastal areas and earthquake exposure mainly in California and the Pacific Northwest may prevent the Company from insuring some of its facilities to full replacement value.
With respect to operations in South Africa, the United Kingdom and Australia, we utilize a combination of locally-procured insurance and global policies to meet contractual insurance requirements and protect us. In addition to these policies, our Australian subsidiary carries tail insurance on a general liability policy related to a discontinued contract.
Of the insurance policies discussed above, our most significant insurance reserves relate to workers’ compensation, general liability and auto claims. These reserves are undiscounted and were $71.0$70.9 million and $51.6$71.0 million as of December 31, 20172018 and 2016,2017, respectively and are included in accrued expenses in the accompanying balance sheets. We use statistical and actuarial methods to estimate amounts for claims that have been reported but not paid and claims incurred but not reported. In applying these methods and assessing their results, we consider such factors as historical frequency and severity of claims at each of our facilities, claim development, payment patterns and changes in the nature of our business, among other factors. Such factors are analyzed for each of our business segments. Our estimates may be impacted by such factors as increases in the market price for medical services and unpredictability of the size of jury awards. We also may experience variability between our estimates and the actual settlement due to limitations inherent in the estimation process, including our ability to estimate costs of processing and settling claims in a timely manner as well as our ability to accurately estimate our exposure at the onset of a claim. Because we have high deductible insurance policies, the amount of our insurance expense is dependent on our ability to control our claims experience. If actual losses
related to insurance claims significantly differ from our estimates, our financial condition, results of operations and cash flows could be materially adversely impacted.
Income Taxes
The consolidated financial statements reflect provisions for federal, state, local and foreign income taxes. We recognize deferred tax assets and liabilities for the future tax consequences attributable to differences between the financial statement carrying amounts of existing assets and liabilities and their respective tax basis, as well as operating loss and tax credit carryforwards. We measure deferred tax assets and liabilities using
enacted tax rates expected to apply to taxable income in the years in which those temporary differences and carryforwards are expected to be recovered or settled. The effect on deferred tax assets and liabilities as a result of a change in tax rates is recognized as income in the period that includes the enactment date. Refer to Note16- Income Taxes in the notes to the consolidated financial statements included in Part II, Item 8 of this Annual Report on Form10-K. Effective January 1, 2013, as a REIT that is required to distribute at least 90% of its taxable income to shareholders, we do not expect to pay federal income taxes at the REIT level (including our qualified REIT subsidiaries), as the resulting dividends paid deduction will generally offset our taxable income. Since we do not expect to pay taxes on our REIT taxable income, we do not expect to be able to recognize such deferred tax assets and liabilities.
Deferred income taxes are determined based on the estimated future tax effects of differences between the financial statement and tax basis of assets and liabilities given the provisions of enacted tax laws. Significant judgments are required to determine the consolidated provision for income taxes. Deferred income tax provisions and benefits are based on changes to the assets or liabilities from year to year. Realization of our deferred tax assets is dependent upon many factors such as tax regulations applicable to the jurisdictions in which we operate, estimates of future taxable income and the character of such taxable income.
The U.S. Tax Cut and Jobs Act (“Tax Act”) was enacted on December 22, 2017 and introducesintroduced significant changes to U.S. income tax law. Effective in 2018, the Tax Act reducesreduced the U.S. statutory corporate tax rate of our Taxable REIT Subsidiariesdomestic TRSs from 35% to 21% and createscreated new items of taxable income and taxes on certain foreign sourced earnings and certain related-party payments, which are referred to as the global intangiblelow-taxed income tax and the base erosion and antiabuse tax, respectively. In addition, in 2017 the Tax Act providesprovided for aone-time transition tax on accumulated foreign subsidiary earnings not previously subject to U.S. income tax. While we havethe Company has foreign operations, we have provisionallyit has identified that there is no transition tax due. Accounting for the income tax effects of the Tax Act requires significant judgments and estimates in the interpretation and calculations of the provisions of the Tax Act.
Due to the timing of the enactment and the complexity involved in applying the provisions of the Tax Act, we have made reasonable estimates of the effects and recorded provisional amounts in ourits financial statements for the year ended December 31, 2017. As we collectcollected and prepareprepared necessary data, and interpretinterpreted any additional guidance issued by the U.S. Treasury Department, the IRS or other standard-setting bodies, we may makemade adjustments over the course of the year to the provisional amounts. Those adjustments may materially impact the provision for income taxes and the effective tax rate in the period in which the adjustments are made.amounts, including refinements to deferred taxes. The accounting for the tax effects of the enactment of the Tax Act will behas been completed inas of December 31, 2018.
Additionally, we must use significant judgment in addressing uncertainties in the application of complex tax laws and regulations. If actual circumstances differ from our assumptions, adjustments to the carrying value of deferred tax assets or liabilities may be required, which may result in an adverse impact on the results of our operations and our effective tax rate. Valuation allowances are recorded related to deferred tax assets based on the “more likely than not” criteria. We have not made any significant changes to the way we account for our deferred tax assets and liabilities in any year presented in the consolidated financial statements, except for the adoption of ASU2015-17, “Income Taxes,” which requires that all deferred income tax assets and liabilities be classified asnon-current in a classified statement of position. Based on our estimate of future earnings and our favorable earnings history, we currently expect full realization of the deferred tax assets net of any recorded
valuation allowances. Furthermore, tax positions taken by us may not be fully sustained upon examination by the taxing authorities. In determining the adequacy of our provision (benefit) for income taxes, potential settlement outcomes resulting from income tax examinations are regularly assessed. As such, the final outcome of tax examinations, including the total amount payable or the timing of any such payments upon resolution of these issues, cannot be estimated with certainty.
Property and Equipment
Property and equipment are stated at cost, less accumulated depreciation. Depreciation is computed using the straight-line method over the estimated useful lives of the related assets. Buildings and improvements are depreciated over 2 to 50 years. Equipment and furniture and fixtures are depreciated over 3 to 10 years. Accelerated methods of depreciation are generally used for income tax purposes. Leasehold improvements are amortized on a straight-line basis over the shorter of the useful life of the improvement or the term of the lease. We perform ongoing evaluations of the estimated useful lives of the property and equipment for depreciation purposes. The estimated useful lives are determined and continually evaluated based on the period over which services are expected to be rendered by the asset. If the assessment indicates that assets will be used for a longer or shorter period than previously anticipated, the useful lives of the assets are revised, resulting in a change in estimate. We have not made any changes in estimates during the years ended December 31, 2018, 2017 2016 and 2015.2016. Maintenance and repairs are expensed as incurred. Interest is capitalized in connection with the construction of company-owned correctional and detention facilities. Cost for self-constructed correctional and detention facilities includes direct materials and labor, capitalized interest and certain other indirect costs associated with construction of the facility, such as property taxes, other indirect labor and related benefits and payroll taxes. The Company begins the capitalization ofWe begin capitalizing costs during thepre-construction phase, which is the period during which costs are incurred to evaluate the site, and continues until the facility is substantially complete and ready for occupancy. Labor costs capitalized for the years ended December 31, 2018, 2017 2016 and 20152016 were not significant. Capitalized interest is recorded as part of the asset to which it relates and is amortized over the asset’s estimated useful life.
Asset Impairments
The CompanyWe had property and equipment of $2.1$2.2 billion as of December 31, 20172018 and 2016,2017, including approximately 5,4004,700 vacant beds at fivefour idle facilities in our U.S. Corrections & Detention segment with a carrying value of $139.6$126 million which are being marketed to potential customers as of December 31, 2017,2018, excluding equipment and other assets that can be easily transferred for use at other facilities. The Company is also marketing to potential customers 3 idle facilities in its GEO Care segment with a carrying value of $23.4 million.
We review long-lived assets to be held and used for impairment whenever events or changes in circumstances indicate that the carrying amount of such assets may not be fully recoverable. Events that would trigger an impairment assessment include deterioration of profits for a business segment that has long-lived assets, or when other changes occur that might impair recovery of long-lived assets such as the termination of a management contract or a significant decrease in inmate population. If impairment indicators are present, we perform a recoverability test to determine whether or not an impairment loss should be measured.
We test idle facilities for impairment upon notification that the facilities will no longer be utilized by the customer. If a long-lived asset is part of a group that includes other assets, the unit of accounting for the long-lived asset is its group. Generally, we group assets by facility for the purpose of considering whether any impairment exists. The estimates of recoverability are based on projected undiscounted cash flows associated with actual marketing efforts where available or, in other instances, projected undiscounted cash flows that are comparable to historical cash flows from management contracts at similar facilities and sensitivity analyses that consider reductions to such cash flows. Our sensitivity analyses include adjustments to projected cash flows compared to the historical cash flows due to current business conditions which impact per diem rates as well as labor and other operating costs, changes related to facility mission due to changes in prospective clients, and changes in projected capacity and occupancy rates. We also factor in prolonged periods of vacancies as well as
the time and costs required to ramp up facility population once a contract is obtained. We perform the impairment analyses on an annual basis for each of the idle facilities and update each quarter for market developments for the potential utilization of each of the facilities in order to identify events that may cause us to reconsider the most recent assumptions. Such events could include negotiations with a prospective customer for the utilization of an idle facility at terms significantly less favorable than used in our most recent impairment analysis, or changes in legislation surrounding a particular facility that could impact our ability to house certain
types of inmates at such facility. Further, a substantial increase in the number of available beds at other facilities that we own, or in the marketplace, could lead to deterioration in market conditions and projected cash flows. Although they are not frequently received, an unsolicited offer to purchase any of our idle facilities, at amounts that are less than their carrying value could also cause us to reconsider the assumptions used in the most recent impairment analysis. We have identified marketing prospects to utilize each of the remaining currently idled facilities and do not see any catalysts that would result in a current impairment. However, we can provide no assurance that we will be able to secure management contracts to utilize our idle facilities, or that we will not incur impairment charges in the future. In all cases, the projected undiscounted cash flows in our analysis as of December 31, 20172018 substantially exceeded the carrying amounts of each facility.
Our evaluations also take into consideration historical experience in securing new management contracts to utilize facilities that had been previously idled for periods comparable to or in excess of the periods our currently idle facilities have been idled.idle. Such previously idleidled facilities are currently being operated under contracts that generate cash flows resulting in the recoverability of the net book value of the previously idled facilities by substantial amounts. Due to a variety of factors, the lead time to negotiate contracts with federal and state agencies to utilize idle bed capacity is generally lengthy which has historically resulted in periods of idleness similar to the ones we are currently experiencing. As a result of our analyses, we determined each of these assets to have recoverable values substantially in excess of the corresponding carrying values.
By their nature, these estimates contain uncertainties with respect to the extent and timing of the respective cash flows due to potential delays or material changes to forecasted terms and conditions in contracts with prospective customers that could impact the estimate of projected cash flows. Notwithstanding the effects the current economy has had on our customers’ demand for prison beds in the short term which has led to our decision to idle certain facilities, we believe the long-term trends favor an increase in the utilization of our idle correctional facilities. This belief is also based on our experience in working with governmental agencies faced with significant budgetary challenges which is a primary contributing factor to the lack of appropriated funding to build new bed capacity by federal and state agencies.
Recent Accounting Pronouncements
Recent Accounting Pronouncements
The Company implemented the following accounting standards during the year ended December 31, 2017:2018:
In January 2017,May 2014, the Financial Accounting Standards Board (“FASB”), issued Accounting Standards Update (“ASU”)a new standard related to revenue recognition (ASUNo. 2017-04,2014-09, “Intangibles-Goodwill“Revenue from Contracts with Customers”. Under the new standard, revenue is recognized when a customer obtains control of promised goods or services and Other,”is recognized in an amount that reflects the consideration which is intendedthe entity expects to simplifyreceive in exchange for those goods or services. In addition, the teststandard requires disclosure of the nature, amount, timing, and uncertainty of revenue and cash flows arising from contracts with customers. The FASB has issued several amendments to the standard, including clarification on accounting for goodwill impairment. To simplifylicenses of intellectual property and identifying performance obligations. The guidance permits two methods of adoption: retrospectively to each prior reporting period presented (full retrospective method), or retrospectively with the subsequent measurementcumulative effect of goodwill, this update eliminates Step 2 frominitially applying the goodwill impairment test. In computing the implied fair value of goodwill under Step 2, an entity had to perform procedures to determine the fair valueguidance recognized at the impairment testing date of its assets and liabilities following the procedure that would be required in determining the fair value of assets acquired and liabilities assumed in a business combination. Instead, under the amendments in this update, an entity should perform its annual, or interim, goodwill impairment test by comparing the fair value of a reporting unit with its carrying amount. An entity should recognize an impairment charge for the amount by which the carrying amount exceeds the reporting unit’s fair value. An entity still has the option to perform the qualitative assessment for a reporting unit to determine if the quantitative impairment test is necessary.initial application (the modified retrospective transition method). The amendments in this update arenew standard became effective for public companies for fiscal yearsus beginning after December 15, 2019, including interim periods within those fiscal years. Early adoption is permitted for interim or annual goodwill tests performed on testing dates after January 1,
2017. We have elected 2018 and we used the modified retrospective transition method to early adoptimplement this standard during the fourth quarter of 2017.standard. The implementationadoption of this standard did not have a material impact on our financial position, results of operations or cash flows. Disclosures related to the nature, amount and timing of revenue and cash flows arising from contracts with customers are included in theRevenue Recognition section herein.
In MarchAugust 2016, the FASB issuedASUNo. 2016-09,2016-15, “Statement “Compensation — Stock Compensation (Topic 718),” as a part of its simplification initiative. The Company adopted this ASU during 2017. Key areas of the amendments in this standard are (i) all excess tax benefits (deficiencies) from stock plan transactions should be recognized in the income statement as opposed to being recognized in additionalpaid-in capital; (ii) the tax withholding threshold for triggering liability accounting on a net settlement transaction has been increased from the minimum statutory rate to the maximum statutory rate; and (iii) an entity can make an entity-wide accounting policy election to either estimate the number of awards that are expected to vest or account for forfeitures as they occur. The guidance also provides clarification ofCash Flows,” which clarified the presentation of certain components of share-based awardsand classification in the statement of cash flows. We have elected to continue estimating forfeitures expected to occur in order to determine the amount of compensation cost to be recognized each period and to apply theflows for eight specific cash flow classification guidance prospectively. Asissues with the objective of reducing diversity in practice. These cash flow issues include debt prepayment or debt extinguishment costs, settlementof zero-coupon debt instruments, contingent consideration payments made after a result, excess tax benefits are now classified as an operating activity rather than a financing activity and we have recorded $1.6 million of excess tax benefits from stock plan transactions as a component of income tax expense in the consolidated statement of operations for the year ended December 31, 2017. We have excluded the excess tax benefitsbusiness combination, proceeds from the assumedsettlement of insurance claims, proceeds available to repurchase sharesfrom the settlement of corporate-owned
life insurance policies (including bank-owned life insurance policies), distributions received from equity method investees, beneficial interests in securitization transactions and also addresses separately identified cash flows and the computationapplication of our diluted earnings per sharethe predominance principle. The amendments inASU No. 2016-15 became effective for the year ended ended December 31, 2017.
In March 2016, the FASB issued ASU2016-05, “Derivatives and Hedging,” which clarifies that a change in the counter party to a derivative instrument that has been designated as a hedging instrument does not, in and of itself, require dedesignation of that hedging relationship provided that all other hedge accounting criteria continue to be met.us on January 1, 2018. We adopted this ASU during the year ended December 31, 2017 and elected to apply the amendments in this standard on a prospective basis. The implementation of this standard did not have a material impact oncumulative earnings approach to classify distributions received from our financial position, results of operations or cash flows.
In March 2016, the FASB issued ASU2016-07, “Investments — Equity Method and Joint Ventures,” as a part of its simplification initiative. The amendments in this standard eliminate the requirement that when an investment qualifies for use of the equity method as a result of an increase in the level of ownership interest or degree of influence, an investor must adjust the investment, results of operations,investees and retained earnings retroactively on astep-by step basis as if the equity method had been in effect during all previous periodsdetermined that the distributions are a return on investment had been held. The amendments require that the equity method investor add the cost of acquiring the additional interest in the investee to the current basis of the investor’s previously held interest and adopt the equity method of accountingare therefore classified as of the date the investment becomes qualified for equity method accounting. Therefore, upon qualifying for the equity method of accounting, no retroactive adjustment of the investment is required. The amendments in ASU2016-07 also require that an entity that has anavailable-for-sale equity security that becomes qualified for the equity method of accounting recognize through earnings the unrealized holding gain or loss in accumulated other comprehensive income at the date the investment becomes qualified for use of the equity method. We adopted this ASU during the year ended December 31, 2017 and elected to apply the amendments in this standard on a prospective basis.cash inflows from operating activities. The implementation of this standard did not have a material impact on our financial position, results of operations or cash flows.
In October 2016, the FASB issued ASUNo. 2016-17,2016-16, “ConsolidationIncome Taxes — Interest Held through Related Parties that are Under Common Control Intra-Entity Transfers of Assets Other Than Inventory,” which amendsas a part of its simplification initiative. The amendments in this standard require entities to recognize the income tax consequences of an intra-entity transfer of an asset other than inventory when the transfer occurs. Under prior generally accepted accounting principles, the recognition of current consolidation guidanceand deferred income taxes for an intra-entity asset transfer was prohibited until the asset had been sold to an outside party. The new standard became effective for us on howJanuary 1, 2018. The amendments in this standard were applied on a reporting entity that ismodified retrospective basis through a cumulative-effect adjustment directly to retained earnings as of the single decision makerbeginning of a variable interest entity (“VIE”) should treat indirect interests in the entity held through related parties that are under common control with the reporting entity when determining whether it is the primary beneficiary of that VIE.adoption period. The primary beneficiary of a VIE is the reporting entity that has a controlling financial interest in a VIE, and therefore consolidates the VIE. A reporting entity has an indirect interest in a VIE if it has a direct interest in a related party that, in turn, has a direct interest in the VIE. We adopted this ASU during the year ended December 31, 2017. The implementationadoption of this standard did not have a material impact on our financial position, results of operations or cash flows.
The following accounting standards will be adopted in future periods:
In February 2018,November 2016, the FASB issuedASUNo. 2018-022016-18, “Statement “Income Statement-Reporting Comprehensive Income-Reclassification of Certain Tax Effects from Accumulated Other Comprehensive IncomeCash Flows — Restricted Cash,”. The amendments which requires that a statement of cash flows explain the change during the period in this update allow an entity to elect to reclassify the income tax effects resulting fromtotal of cash, cash equivalents and amounts generally described as restricted cash or restricted cash equivalents. Therefore, amounts generally described as restricted cash and restricted cash equivalents should be included with cash and cash equivalents when reconciling the Tax Cutsbeginning-of-period and Jobs Actend-of-period total amounts shown on items within accumulated other comprehensive income to retained earnings.the statement of cash flows. The new standard isbecame effective for all entities for fiscal years beginning after December 15,us on January 1, 2018 and interim periods within those fiscal years. Earlywas applied using a retrospective transition method to each period presented. The adoption is permitted. We are in the process of evaluating whether orthis standard did not we will make such an election and whether or not the new standard would have a material impact on our financial position, results of operations or cash flows.
In August 2017, the FASB issued ASUNo. 2017-12 “Derivatives and Hedging — Targeted Improvements to Accounting for Hedging Activities”. The objective of this guidance is to improve the financial reporting of hedging relationships to better portray the economic results of an entity’s risk management activities in its financial statements. Certain As a result of the amendments in this update as they relate to cash flow hedges, eliminate the requirement to separately record hedge ineffectiveness currently in earnings. Instead, the entire change in the fair value of the hedging instrument is recorded in other comprehensive income. Those amounts are reclassified to earnings in the same income statement line item that is used to present the earnings effect of the hedged item when the hedged item affects earnings. The new standard is effective for us beginning January 1, 2019. The adoption of this standard, is not expectedthe Consolidated Statement of Cash Flows for the years ended December 31, 2017 and 2016 have been retrospectively adjusted. Refer to have a material impact ontheRestricted Cash and Cash Equivalents section in Note 1 — Summary of Business Organization, Operations and Significant Accounting Policies in the notes to our audited consolidated financial position, results of operations or cash flows.
In May 2017, the FASB issued ASUNo. 2017-10 “Service Concession Arrangements — Determining the Customer of the Operation Services”. The objectivestatements included in Part II, Item 8 of this guidance is to reduce diversity in practice and provide clarificationAnnual Report on how an operating entity determines the customer of the operation services for transactions within the scope of Topic 853, Service Concessions Arrangements. The amendments in this update clarify that the grantor is the customer of the operation services in all cases for such arrangements. The new standard is effective for us beginning on January 1, 2018. The adoption of this standard is not expected to have a material impact on our financial position, results of operations or cash flows.
In May 2017, the FASB issued ASUFormNo. 2017-0910-K. “Compensation — Stock Compensation”. The objective of this guidance is to provide clarity and reduce both (1) diversity in practice and (2) cost and complexity when applying modification accounting for changes in the terms or conditions of share-based payment awards. An entity should account for the effects of a modification unless all of the following factors are met: (i) the fair value of the modified award is the same as the fair value of the original award immediately before the award is modified; (ii) the vesting conditions of the modified award are the same as the vesting conditions of the original award immediately before the original award is modified; and (iii) the classification of the modified award as an equity instrument or a liability instrument is the same as the classification of the original award immediately before the original award is modified. The new standard will be effective for all entities for fiscal years beginning after December 15, 2017 with early adoption permitted for public companies for reporting periods for which financial statements have not yet been issued. The amendments in this update should be applied prospectively to an award modified on or after the adoption date. The adoption of this standard is not expected to have a material impact on our financial position, results of operations or cash flows.
In March 2017, the FASB issued ASUNo. 2017-07 “Compensation — Retirement Benefits (Topic 715)-Improving the Presentation of Net Periodic Pension Cost and Net Periodic Postretirement Benefit Cost”. This guidance revises how employers that sponsor defined benefit pension and other postretirement plans present the net periodic benefit cost in their income statement and requires that the service cost component of net periodic benefit cost be presented in the same income statement line items as other employee compensation costs from services rendered during the period. Of the components of net periodic benefit cost, only the service cost component will be eligible for asset capitalization. The other components of the net periodic benefit cost must be presented separately from the line items that include the service cost and outside of any subtotal of operating
income on the income statement. The new standard will be effective for public companies for fiscal years beginning after December 15, 2017 on a retroactive basis. Early adoption is permitted. The adoption of this standard is not expected to have a material impact on our financial position, results of operations or cash flows.
In January 2017, the FASB issued ASUNo. 2017-01, “Business Combinations,” which clarifies the definition of a business with the objective of adding guidance to assist entities with evaluating whether transactions should be accounted for as acquisitions (or disposals) of assets or businesses. The update provides a screen to determine when an integrated set of assets and activities (collectively referred to as a “set”) is not a business. The screen requires that when substantially all of the fair value of the gross assets acquired (or disposed of) is concentrated in a single identifiable asset or a group of similar identifiable assets, the set is not a business. This screen reduces the number of transactions that need to be further evaluated. If the screen is not met, the amendments in this update (1) require that to be considered a business, a set must include, at a minimum, an input and a substantive process that together significantly contribute to the ability to create output and (2) remove the evaluation of whether a market participant could replace missing elements. The amendments provide a framework to assist entities in evaluating whether both an input and a substantive process are present. The amendments in this update arebecame effective for public companies for fiscal years beginning after December 15, 2017, including interim periods within those fiscal years.us on January 1, 2018. The implementation of this standard isdid not expected to have a material impact on our financial position, results of operations or cash flows.
In October 2016,March 2017, the FASB issued ASUNo. 2016-16,2017-07 “Income TaxesCompensation — Intra-Entity Transfers Retirement Benefits (Topic 715) — Improving the Presentation of Assets Other Than InventoryNet Periodic Pension Cost and Net Periodic Postretirement Benefit Cost,”. This guidance revises how employers that sponsor defined benefit pension and other postretirement plans present the net periodic benefit cost in their income statement and requires that the service cost component of net periodic benefit cost be presented in the same income statement line items as other employee compensation costs from services rendered during the period. Of the components of net periodic benefit cost, only the service cost component will be eligible for asset capitalization. The other components of the net periodic benefit cost must be
presented separately from the line items that include the service cost and outside of any subtotal of operating income on the income statement. The new standard became effective for us on January 1, 2018. The adoption of this standard did not have a partmaterial impact on our financial position, results of its simplification initiative.operations or cash flows.
In May 2017, the FASB issued ASUNo. 2017-10 “Service Concession Arrangements — Determining the Customer of the Operation Services”. The objective of this guidance is to reduce diversity in practice and provide clarification on how an operating entity determines the customer of the operation services for transactions within the scope of Topic 853, Service Concessions Arrangements. The amendments in this standard require entities to recognizeupdate clarify that the income tax consequencesgrantor is the customer of an intra-entity transfer of an asset other than inventory when the transfer occurs. Under prior generally accepted accounting principles, the recognition of current and deferred income taxesoperation services in all cases for an intra-entity asset transfer was prohibited until the asset has been sold to an outside party.such arrangements. The new standard will bewas effective for public companiesus beginning on January 1, 2018. The adoption of this standard did not have a material impact on our financial position, results of operations or cash flows.
In May 2017, the FASB issued ASUNo. 2017-09 “Compensation — Stock Compensation”. The objective of this guidance is to provide clarity and reduce both (1) diversity in practice and (2) cost and complexity when applying modification accounting for annual reporting periods beginning after December 15, 2017, including interim reporting periods within those annual reporting periods with early adoption permitted under certain circumstances.changes in the terms or conditions of share-based payment awards. An entity should account for the effects of a modification unless all of the following factors are met: (i) the fair value of the modified award is the same as the fair value of the original award immediately before the award is modified; (ii) the vesting conditions of the modified award are the same as the vesting conditions of the original award immediately before the original award is modified; and (iii) the classification of the modified award as an equity instrument or a liability instrument is the same as the classification of the original award immediately before the original award is modified. The new standard became effective for us on January 1, 2018. The amendments in this update should be applied prospectively to an award modified on a modified retrospective basis through a cumulative-effect adjustment directly to retained earnings as of the beginning ofor after the adoption period.date. The adoption of this standard did not have a material impact on our financial position, results of operations or cash flows.
The following accounting standards will be adopted in future periods:
In August 2018, the FASB issued ASUNo. 2018-14 “Compensation-Retirement Benefits-Defined Benefit Plans-General (Topic 715.20)”as a part of its disclosure framework project. The amendments in this update remove, modify and add certain disclosures primarily related to amounts in accumulated other comprehensive income expected to be recognized as components of net periodic benefit cost over the next fiscal year, explanations for reasons for significant gains and losses related to changes in the benefit obligation for the period, and projected and accumulated benefit obligations. The new standard is effective for us beginning January 1, 2021. The adoption of this standard is not expected to have a material impact on our financial position, results of operations or cash flows.
In August 2016,2018, the FASB issued ASUASU No. 2016-15, “Statement2018-13 “Fair Value Measurement (Topic 820)”as a part of Cash Flows,” which clarified the presentationits disclosure framework project. The amendments in this update remove, modify and classification in the statement of cash flows for eight specific cash flow issues with the objective of reducing diversity in practice. These cash flow issues include debt prepayment or debt extinguishment costs, settlementof zero-coupon debt instruments, contingent consideration payments made after a business combination, proceeds from the settlement of insurance claims, proceeds from the settlement of corporate-owned life insurance policies (including bank-owned life insurance policies), distributions received from equity method investees, beneficial interests in securitization transactionsadd certain disclosures primarily related to transfers between Level 1 and also addresses separately identified cash flows and the applicationLevel 2 of the predominance principle.fair value hierarchy, various disclosures related to Level 3 fair value measurements and investments in certain entities that calculate net asset value. The amendments inASU No. 2016-15 arenew standard is effective for public companies for fiscal yearsus beginning after December 15, 2017 and interim periods within those fiscal years.January 1, 2020. The implementationadoption of this standard is not expected to have a material impact on our financial position, results of operations or cash flows.
In June 2018, the FASB issued ASUNo. 2018-07 “Compensation — Stock Compensation (Topic 718), Improvements to Nonemployee Share-Based Payment Accounting”as a part of its Simplification Initiative. The amendments in this update expand the scope of Topic 718 to include share-based payment transactions for acquiring goods and services from nonemployees. An entity should apply the requirements of Topic 718 to nonemployee awards except for specific guidance on inputs to an option pricing model and the period of time over which share-based payment awards vest and the pattern of cost recognition over that period. The amendment specify that Topic 718 applies to all share-based payment transactions in which a grantor acquires goods or services to be used or consumed in a grantor’s own operations by issuing share-based payment awards. The amendments also clarify that Topic 718 does not apply to share-based payments used to effectively provide
(1) financing to the issuer or (2) awards granted in conjunction with selling goods or services to customers as part of a contract accounted for under Topic606-”Revenue from Contracts with Customers.” The new standard is effective for us beginning January 1, 2019. The adoption of this standard is not expected to have a material impact on our financial position, results of operations or cash flows.
In February 2018, the FASB issued ASUNo. 2018-02 “Income Statement-Reporting Comprehensive Income-Reclassification of Certain Tax Effects from Accumulated Other Comprehensive Income”. The amendments in this update allow an entity to elect to reclassify the income tax effects resulting from the Tax Cuts and Jobs Act on items within accumulated other comprehensive income to retained earnings. The new standard is effective for all entities for fiscal years beginning after December 15, 2018, and interim periods within those fiscal years. Early adoption is permitted. The adoption of this standard is not expected to have a material impact on our financial position, results of operations or cash flows.
In August 2017, the FASB issued ASUNo. 2017-12 “Derivatives and Hedging — Targeted Improvements to Accounting for Hedging Activities.” The objective of this guidance is to improve the financial reporting of hedging relationships to better portray the economic results of an entity’s risk management activities in its financial statements. Certain of the amendments in this update as they relate to cash flow hedges, eliminate the requirement to separately record hedge ineffectiveness currently in earnings. Instead, the entire change in the fair value of the hedging instrument is recorded in other comprehensive income. Those amounts are reclassified to earnings in the same income statement line item that is used to present the earnings effect of the hedged item when the hedged item affects earnings. The new standard is effective for us beginning January 1, 2019. The adoption of this standard is not expected to have a material impact on our financial position, results of operations or cash flows.
In June 2016, the FASB issued ASC No.2016-13,”Financial Instruments — Credit Losses (Topic 326): Measurement of Credit Losses on Financial Instruments”. The purpose of UpdateNo. 2016-13 is to replace the current incurred loss impairment methodology for financial assets measured at amortized cost with a methodology that reflects expected credit losses and requires consideration of a broader range of reasonable and supportable information, including forecasted information, to develop credit loss estimates. UpdateNo. 2016-13 is effective for annual periods beginning after December 15, 2019, including interim periods within those annual periods. Early adoption is permitted for annual periods beginning after December 15, 2018. We are in the process of determining the effect that the adoption will have on our financial position and results of operations.
In February 2016, FASB issued ASU2016-02, “Leases,” which requires entities to recognize lease assets and lease liabilities on the balance sheet and to disclose key information about leasing arrangements. For finance leases and operating leases, a lessee should recognize in the statement of financial position a liability to make lease payments (the lease liability) and aright-of-use asset representing its right to use the underlying asset for the lease term with each initially measured at the present value of the lease payments. The FASB has recently issued several amendments to the standard, including accounting for land easements. The amendments inASU2016-02 are effective for public companies for fiscal years beginning after December 15, 2018, including interim periods within those fiscal years. In July 2018, the FASB issued ASU2018-11 which provides for an optional transition method where an entity initially applies the new lease standard at the adoption date and recognizes a cumulative-effect adjustment to the opening balance of retained earnings. Consequently, an entity’s reporting for the comparative periods presented in the financial statements in which it adopts the new lease standard will continue to be in accordance with current generally accepted accounting principles (Topic 840, “Leases”). Alternatively, lessees and lessors are requiredcan elect to recognize and measure leases at the beginning of the earliest period presented using a modified retrospective approach. We have implemented aelected to apply the new lease standard at the adoption date on January 1, 2019 under the optional transition method as outlined inASU 2018-11. There are also several practical expedients that entities may elect upon transition relating to short-term leases (twelve-month terms or less),non-lease components, reassessing certain lease decision points for existing leases, using hindsight in determining the lease term and land easements. With regard to these practical expedients, we have elected not to apply the recognition requirements to lease arrangements that have terms of
twelve months or less. We have also elected to not reassess the major lease decision points for existing leases (whether a contract contains a lease, how a lease should be classified and whether previously capitalized initial direct costs meet the new standard definition). We have implemented a lease management software application tool and are currently assessingto assist with the assessment of the impact that the adoption of ASU2016-02 will have on our consolidated financial position or results of operations, but we expect that it will result in a significant increase in our long-term assets and liabilities given the significant number of leases as disclosed in Note 17 — Commitments and Contingencies.
In May 2014, the FASB issued a new standard related to revenue recognition (ASU2014-09, “Revenue from Contracts with Customers”.) Under the new standard, revenue is recognized when a customer obtains control of promised goods or services and is recognized in an amount that reflects the consideration which the entity expects to receive in exchange for those goods or services. In addition, the standard requires disclosure of the nature, amount, timing, and uncertainty of revenue and cash flows arising from contracts with customers. The FASB has recently issued several amendments to the standard, including clarification on accounting for licenses of intellectual property and identifying performance obligations. The guidance permits two methods of adoption: retrospectively to each prior reporting period presented (full retrospective method), or retrospectively with the cumulative effect of initially applying the guidance recognized at the date of initial application (the modified retrospective transition method). The new standard became effective for us on January 1, 2018 and we elected to use the modified retrospective transition method to implement this standard. We have completed our evaluation of the effects of the implementation of this standard and have determined that it will not have a material impact on our financial position, results of operations or cash flows. We did identify, asoperations. As a result of our analysis, certain reclassifications between revenuesassessment, we expect to record aright-of-use asset in the range of approximately $135 million to $140 million, a short-term lease liability in the range of $37 million to $42 million and operating expenses for payments madea long-term lease liability in the range of $100 million to certain$105 million at the time of adoption on January 1, 2019 with no adjustment to retained earnings. We are continuing to evaluate the effect that this guidance will have on our customers. However, these reclassifications were not considered to be significantconsolidated financial statements and are less than $2.0 million annually. Lastly, certain additional disclosures will be required under the new standard which will be implemented during the first quarter of 2018.related disclosures.
Other recent accounting pronouncements issued by the FASB (including its Emerging Issues Task Force), the American Institute of Certified Public Accountants and the SEC did not, or are not expected to, have a material effect on our results of operations or financial position.
Results of Operations
The following discussion should be read in conjunction with our consolidated financial statements and the notes to the consolidated financial statements accompanying this report. This discussion contains forward-looking statements that involve risks and uncertainties. Our actual results may differ materially from those anticipated in the forward-looking statements as a result of certain factors, including, but not limited to, those described under “Item 1A. Risk Factors” and those included in other portions of this report.
2018 versus 2017
Revenues
| 2018 | % of Revenue | 2017 | % of Revenue | $ Change | % Change | |||||||||||||||||||
| (Dollars in thousands) | ||||||||||||||||||||||||
U.S. Corrections & Detention | $ | 1,492,973 | 64.0 | % | $ | 1,438,044 | 63.5 | % | $ | 54,929 | 3.8 | % | ||||||||||||
GEO Care | 580,313 | 24.9 | % | 514,166 | 22.7 | % | 66,147 | 12.9 | % | |||||||||||||||
International Services | 253,874 | 10.9 | % | 195,806 | 8.7 | % | 58,068 | 29.7 | % | |||||||||||||||
Facility Construction & Design | 4,226 | 0.2 | % | 115,404 | 5.1 | % | (111,178 | ) | (96.3 | )% | ||||||||||||||
|
|
|
|
|
|
|
|
|
| |||||||||||||||
Total | $ | 2,331,386 | 100.0 | % | $ | 2,263,420 | 100.0 | % | $ | 67,966 | 3.0 | % | ||||||||||||
|
|
|
|
|
|
|
|
|
| |||||||||||||||
U.S. Corrections & Detention
Revenues increased in 2018 compared to 2017 by $54.9 million primarily due to aggregate net increases of $56.1 million due to our acquisition of CEC on April 5, 2017 and net increases in population with our federal clients, transportation services and/or rates. We also had increases of $13.7 million resulting from the activation of our contracts at our company-owned Eagle Pass Detention Facility in Eagle Pass, Texas and our company-owned Montgomery Processing Center in Conroe, Texas. These increases were partially offset by net decreases of $14.9 million at certain of our facilities primarily due to contract terminations.
The number of compensated mandays in U.S. Corrections & Detention facilities was approximately 22.9 million in 2018 and 22.3 million in 2017. We experienced an aggregate net increase of approximately 600,000 mandays primarily as a result of our acquisition of CEC, activation of new contracts and net increases in population with our federal clients discussed above. We look at the average occupancy in our facilities to determine how we are managing our available beds. The average occupancy is calculated by taking compensated mandays as a percentage of capacity. The average occupancy in our U.S. Corrections & Detention facilities was 95.4% and 93.1% of capacity in 2018 and 2017, respectively, excluding idle facilities.
GEO Care
Revenues increased in 2018 compared to 2017 primarily due to aggregate increases of $38.4 million from our acquisition of CEC on April 5, 2017. We also experienced increases of $33.2 million primarily due to increases in average client and participant counts under our ISAP and electronic monitoring services. These increases were partially offset by $5.5 million related to net decreases in census levels at certain of our community-based and reentry centers as well as contract terminations/closures of underutilized facilities.
International Services
Revenues for International Services in 2018 compared to 2017 increased by $58.1 million. We experienced a net increase of $63.8 million in performance which was primarily attributable to our Australian subsidiary’s Ravenhall correctional facility project which began operations during the fourth quarter of 2017. This net increase was partially offset by a decrease due to foreign exchange rate fluctuations of $5.7 million resulting from the strengthening of the U.S. dollar against certain international currencies.
Facility Construction & Design
Revenues for our Facility Construction & Design services during 2017 relate to the design and construction activity for our Ravenhall correctional facility contract with the Department of Justice in the State of Victoria, Australia which was completed during the fourth quarter of 2017. During 2018, the Company had facility construction & design services related to an expansion project at its Fulham Correctional Centre in Australia which is expected to be completed in the third quarter of 2020. There is no margin associated with the expansion.
Operating Expenses
| 2018 | % of Segment Revenues | 2017 | % of Segment Revenues | $ Change | % Change | |||||||||||||||||||
| (Dollars in thousands) | ||||||||||||||||||||||||
U.S. Corrections & Detention | $ | 1,118,719 | 74.9 | % | $ | 1,060,280 | 73.7 | % | $ | 58,439 | 5.5 | % | ||||||||||||
GEO Care | 393,856 | 67.9 | % | 343,538 | 66.8 | % | 50,318 | 14.6 | % | |||||||||||||||
International Services | 238,971 | 94.1 | % | 179,653 | 91.8 | % | 59,318 | 33.0 | % | |||||||||||||||
Facility Construction & Design | 4,226 | 100 | % | 117,024 | 101.4 | % | (112,798 | ) | (96.4 | )% | ||||||||||||||
|
|
|
|
|
|
|
| |||||||||||||||||
Total | $ | 1,755,772 | 75.3 | % | $ | 1,700,495 | 75.1 | % | $ | 55,277 | 3.3 | % | ||||||||||||
|
|
|
|
|
| |||||||||||||||||||
Operating expenses consist of those expenses incurred in the operation and management of our correctional, detention and GEO Care facilities and expenses incurred in our Facility Construction & Design segment.
U.S. Corrections & Detention
Operating expenses for U.S. Corrections & Detention increased by $58.4 million in 2018 compared to 2017. The increase was primarily due to our acquisition of CEC on April 5, 2017 and aggregate net increases in population, transportation services and the variable costs associated with those services of $57.1 million. We also experienced increases of $15.0 million resulting from the activation of our contracts at our company-owned Eagle Pass Detention Facility in Eagle Pass, Texas and our company-owned Montgomery Processing Center in Conroe, Texas. These increases were partially offset by decreases of $13.7 million at certain of our facilities due to contract terminations.
GEO Care
Operating expenses for GEO Care increased by $50.3 million during 2018 from 2017. The increase was primarily due to our acquisition of CEC on April 5, 2017 and program growth at our community-based and reentry centers of $46.0 million. We also experienced net increases of $13.6 million due to increases in average client and participant counts under our ISAP and electronic monitoring services. These increases were partially offset by $9.3 million of contract terminations/closures of underutilized facilities.
International Services
Operating expenses for International Services in 2018 compared to 2017 increased by $59.3 million. We experienced a net increase of $64.6 million primarily attributable to our Australian subsidiary’s Ravenhall correctional facility project which began operations during the fourth quarter of 2017. Additionally, we had a decrease due to foreign exchange rate fluctuations of $5.3 million resulting from the strengthening of the U.S. dollar against certain international currencies. Operating expenses as a percentage of revenue have increased in part due to aone-time charge at our Australian subsidiary’s Parklea facility. Upon transition of the facility in March 2019 to a new operator, due to the requirements under the labor and employment laws in Australia, we reserved approximately $3 million in certain transition costs related to employee compensation and benefits.
Facility Construction & Design
Operating expenses for our Facility Construction & Design services during 2017 relate to the design and construction activity for our Ravenhall correctional facility contract with the Department of Justice in the State of Victoria, Australia which was completed during the fourth quarter of 2017. During 2018, the Company had facility construction & design services related to an expansion project at its Fulham Correctional Centre in Australia which is expected to be completed in the third quarter of 2020. There is no margin associated with the expansion.
Depreciation and Amortization
| 2018 | % of Segment Revenue | 2017 | % of Segment Revenue | $ Change | % Change | |||||||||||||||||||
| (Dollars in thousands) | ||||||||||||||||||||||||
U.S. Corrections & Detention | $ | 76,801 | 5.1 | % | $ | 75,276 | 5.2 | % | $ | 1,525 | 2.0 | % | ||||||||||||
GEO Care | 47,546 | 8.2 | % | 47,103 | 9.2 | % | 443 | 0.9 | % | |||||||||||||||
International Services | 2,087 | 0.8 | % | 1,918 | 1.0 | % | 169 | 8.8 | % | |||||||||||||||
|
|
|
|
|
| |||||||||||||||||||
Total | $ | 126,434 | 5.4 | % | $ | 124,297 | 5.5 | % | $ | 2,137 | 1.7 | % | ||||||||||||
|
|
|
|
|
| |||||||||||||||||||
U.S. Corrections & Detention
U.S. Corrections & Detention depreciation and amortization expense increased in 2018 compared to 2017 primarily due to renovations made at several of our facilities and a full year of depreciation and amortization for new facilities and intangible assets acquired in our acquisition of CEC on April 5, 2017.
GEO Care
GEO Care depreciation and amortization expense increased slightly in 2018 compared to 2017 primarily due to new facilities and intangible assets acquired in our acquisition of CEC on April 5, 2017.
International Services
Depreciation and amortization expense increased slightly in 2018 compared to 2017 primarily as a result of additions in connection with the activation of our Ravenhall facility in fourth quarter 2017.
Other Unallocated Operating Expenses
| 2018 | % of Revenue | 2017 | % of Revenue | $ Change | % Change | |||||||||||||||||||
| (Dollars in thousands) | ||||||||||||||||||||||||
General and Administrative Expenses | $ | 184,515 | 7.9 | % | $ | 190,343 | 8.4 | % | $ | (5,828 | ) | (3.1 | )% | |||||||||||
General and administrative expenses comprise substantially all of our other unallocated operating expenses which primarily includes corporate management salaries and benefits, professional fees and other administrative expenses. General and administrative expenses decreased in 2018 compared to 2017. The decrease is primarily due to merger and acquisition expenses of $17.9 million incurred in 2017 related to our acquisition of CEC. This decrease was partially offset by increases in legal related expenses of $4.5 million incurred in 2018, highernon-cash stock-based compensation expense of $2.2 million and normal personnel and compensation adjustments, professional, consulting, business development and other administrative expenses in the aggregate of $5.4 million.
Non Operating Income and Expense
Interest Income and Interest Expense
| 2018 | % of Revenue | 2017 | % of Revenue | $ Change | % Change | |||||||||||||||||||
| (Dollars in thousands) | ||||||||||||||||||||||||
Interest Income | $ | 34,755 | 1.5 | % | $ | 51,676 | 2.3 | % | $ | (16,921 | ) | (32.7 | )% | |||||||||||
Interest Expense | $ | 150,103 | 6.4 | % | $ | 148,024 | 6.5 | % | $ | 2,079 | 1.4 | % | ||||||||||||
Interest income decreased in the 2018 compared to 2017 primarily due to a lower balance on our contract receivable related to our correctional facility project in Ravenhall, Australia. When the facility was completed during the fourth quarter 2017, the State of Victoria made a principal payment towards the balance of approximately $224 million.
Interest expense increased in 2018 compared to 2017 primarily due to additional interest incurred on higher debt balances resulting from our acquisition of CEC on April 5, 2017. Partially offsetting the increase was a decrease in construction loan interest related to our correctional project in Ravenhall, Australia due to a lower loan balance compared to the prior period. Upon completion of the facility in fourth quarter 2017, the State of Victoria made a payment towards the loan balance of approximately $224 million. Also partially offsetting the increase was the effect of Amendment No. 1 to Third Amended and Restated Credit Agreement executed on April 30, 2018 which reduced the interest rate on the term loans from LIBOR plus 2.5% to LIBOR plus 2.00%. Refer to Note 13 — Debt of the Notes to the audited consolidated financial statements included in Part II, Item 8 of this Annual Report on Form10-K.
Provision for Income Taxes
| 2018 | Effective Rate | 2017 | Effective Rate | $ Change | % Change | |||||||||||||||||||
| (Dollars in thousands) | ||||||||||||||||||||||||
Provision for Income Taxes | $ | 14,117 | 9.5 | % | $ | 17,958 | 11.8 | % | $ | (3,841 | ) | (21.4 | )% | |||||||||||
The provision for income taxes during 2018 decreased compared to 2017 along with the effective tax rate. Most significantly, the 2017 tax provision included a $9.6 million nonrecurring tax expense related to there-measurement of GEO’s net deferred tax assets as a result of the U.S. Tax Cuts and Jobs Act of 2017. While the corporate tax rate reduction as a result of the U.S. Tax Cuts and Jobs Act of 2017 favorably decreased the tax liability of our domestic taxable REIT subsidiaries by approximately $3.4 million, a change in the composition of our income resulted in more income being earned by these fully taxable subsidiaries. In 2018 there was a $0.9 million discrete tax expense, while in 2017 there was a $1.6 million discrete tax benefit providing for unfavorable swing of $2.5 million related to equity compensation, as provided under ASUNo. 2016-09, Compensation — Stock Compensation (Topic 718) starting in 2017. As a REIT, we are required to distribute at least 90% of our taxable income to shareholders and in turn are allowed a deduction for the distribution at the REIT level. Our wholly-owned taxable REIT subsidiaries continue to be fully subject to federal, state and foreign income taxes, as applicable. For 2019, we estimate our annual effective tax rate to be in the range of approximately 9% to 11% exclusive of any discrete items.
Equity in Earnings of Affiliates
| 2018 | % of Revenue | 2017 | % of Revenue | $ Change | % Change | |||||||||||||||||||
| (Dollars in thousands) | ||||||||||||||||||||||||
Equity in Earnings of Affiliates | $ | 9,627 | 0.4 | % | $ | 12,045 | 0.5 | % | $ | (2,418 | ) | (20.1 | )% | |||||||||||
Equity in earnings of affiliates, presented net of income taxes, represents the earnings of SACS and GEOAmey in the aggregate. Equity in earnings of affiliates during 2018 compared to 2017 decreased primarily due to interest income received related to favorable tax settlements at SACS in 2017.
2017 versus 2016
Revenues
| 2017 | % of Revenue | 2016 | % of Revenue | $ Change | % Change | 2017 | % of Revenue | 2016 | % of Revenue | $ Change | % Change | |||||||||||||||||||||||||||||||||||||
| (Dollars in thousands) | (Dollars in thousands) | |||||||||||||||||||||||||||||||||||||||||||||||
U.S. Corrections & Detention | $ | 1,438,044 | 63.5 | % | $ | 1,375,277 | 63.1 | % | $ | 62,767 | 4.6 | % | $ | 1,438,044 | 63.5 | % | $ | 1,375,277 | 63.1 | % | $ | 62,767 | 4.6 | % | ||||||||||||||||||||||||
GEO Care | 514,166 | 22.7 | % | 394,449 | 18.1 | % | 119,717 | 30.4 | % | 514,166 | 22.7 | % | 394,449 | 18.1 | % | 119,717 | 30.4 | % | ||||||||||||||||||||||||||||||
International Services | 195,806 | 8.7 | % | 157,363 | 7.2 | % | 38,443 | 24.4 | % | 195,806 | 8.7 | % | 157,363 | 7.2 | % | 38,443 | 24.4 | % | ||||||||||||||||||||||||||||||
Facility Construction & Design | 115,404 | 5.1 | % | 252,401 | 11.6 | % | (136,997 | ) | (54.3 | )% | 115,404 | 5.1 | % | 252,401 | 11.6 | % | (136,997 | ) | (54.3 | )% | ||||||||||||||||||||||||||||
|
|
|
|
|
|
|
|
|
| |||||||||||||||||||||||||||||||||||||||
Total | $ | 2,263,420 | 100.0 | % | $ | 2,179,490 | 100.0 | % | $ | 83,930 | 3.9 | % | $ | 2,263,420 | 100.0 | % | $ | 2,179,490 | 100.0 | % | $ | 83,930 | 3.9 | % | ||||||||||||||||||||||||
|
|
|
|
|
|
|
|
|
| |||||||||||||||||||||||||||||||||||||||
U.S. Corrections & Detention
Revenues increased in 2017 compared to 2016 primarily due to aggregate increases of $78.6 million as a result of our acquisition of CEC on April 5, 2017 as well as the activation and intake of detainees related to our
new contract at our company-owned Folkston ICE Processing Center in January 2017. These increases were partially offset by net decreases of $8.5 million at certain of our facilities due to aggregate net decreases in population, transportation services and/or rates and $7.3 million due to contract terminations.
The number of compensated mandays in U.S. Corrections & Detention facilities was approximately 22.3 million in 2017 and 21.3 million in 2016. We experienced an aggregate net increase of approximately 936,000 mandays as a result of our acquisition of CEC and contract activation discussed above. We look at the average occupancy in our facilities to determine how we are managing our available beds. The average occupancy is calculated by taking compensated mandays as a percentage of capacity. The average occupancy in our U.S. Corrections & Detention facilities was 93.1% and 93.9% of capacity in 2017 and 2016, respectively, excluding idle facilities.
GEO Care
Revenues increased in 2017 compared to 2016 primarily due to aggregate increases of $108.7 million from our acquisition of CEC on April 5, 2017. We also experienced increases of $19.8 million primarily due to increases in average client and participant counts under our ISAP and electronic monitoring services. These increases were partially offset by $8.8 million related to net decreases in census levels at certain of our community-based and reentry centers as well as terminated contracts.
International Services
Revenues for International Services in 2017 compared to 2016 increased by $38.4 million. This increase was primarily due to the activation of our Ravenhall Prison Contract during the fourth quarter of 2017. Also contributing to the increase was approximately $6.3 million in foreign exchange rate fluctuations resulting from the weakening of the U.S. dollar against certain international currencies.
Facility Construction & Design
The decrease in revenues for our Facility Construction & Design services is due to decreased construction activity for our Ravenhall Prison Contract, with the Department of Justice in the State of Victoria, Australia, as the facility was completed and became operational during the fourth quarter of 2017. Refer to Note 7 — Contract Receivable of the notes to our audited consolidated financial statements included in Part II, Item 8 of this Annual Report on Form10-K.
Operating Expenses
| 2017 | % of Segment Revenues | 2016 | % of Segment Revenues | $ Change | % Change | 2017 | % of Segment Revenues | 2016 | % of Segment Revenues | $ Change | % Change | |||||||||||||||||||||||||||||||||||||
| (Dollars in thousands) | (Dollars in thousands) | |||||||||||||||||||||||||||||||||||||||||||||||
U.S. Corrections & Detention | $ | 1,060,280 | 73.7 | % | $ | 1,005,045 | 73.1 | % | $ | 55,235 | 5.5 | % | $ | 1,060,280 | 73.7 | % | $ | 1,005,045 | 73.1 | % | $ | 55,235 | 5.5 | % | ||||||||||||||||||||||||
GEO Care | 343,538 | 66.8 | % | 243,982 | 61.9 | % | 99,556 | 40.8 | % | 343,538 | 66.8 | % | 243,982 | 61.9 | % | 99,556 | 40.8 | % | ||||||||||||||||||||||||||||||
International Services | 179,653 | 91.8 | % | 149,479 | 95.0 | % | 30,174 | 20.2 | % | 179,653 | 91.8 | % | 149,479 | 95.0 | % | 30,174 | 20.2 | % | ||||||||||||||||||||||||||||||
Facility Design & Construction | 117,024 | 101.4 | % | 251,775 | 99.8 | % | (134,751 | ) | (53.5 | )% | ||||||||||||||||||||||||||||||||||||||
Facility Construction & Design | 117,024 | 101.4 | % | 251,775 | 99.8 | % | (134,751 | ) | (53.5 | )% | ||||||||||||||||||||||||||||||||||||||
|
|
|
|
|
|
| ||||||||||||||||||||||||||||||||||||||||||
Total | $ | 1,700,495 | 75.1 | % | $ | 1,650,281 | 75.7 | % | $ | 50,214 | 3.0 | % | $ | 1,700,495 | 75.1 | % | $ | 1,650,281 | 75.7 | % | $ | 50,214 | 3.0 | % | ||||||||||||||||||||||||
|
|
|
|
|
| |||||||||||||||||||||||||||||||||||||||||||
Operating expenses consist of those expenses incurred in the operation and management of our correctional, detention and GEO Care facilities and expenses incurred in our Facility Construction & Design segment.
U.S. Corrections & Detention
The increase in operating expenses for U.S. Corrections & Detention reflects an increase of $61.1 million resulting from our acquisition of CEC on April 5, 2017 as well as the activation and intake of detainees related to
our new contract at our company-owned Folkston ICE Processing Center in January 2017. These increases were partially offset by aggregate decreases in operating expenses of $5.9 million at certain of our facilities primarily due to net decreases in population, transportation services and the variable costs associated with those decreases.
GEO Care
Operating expenses for GEO Care increased by $99.6 million during 2017 from 2016 primarily due to $86.2 million from our acquisition of CEC on April 5, 2017. We also experienced increases of $13.4 million primarily due to increases in average client and participant counts under our ISAP and electronic monitoring services and program growth at our community-based and reentry centers. Operating expenses as a percentage of revenues have increased during 2017 which is primarily related to our acquisition of CEC. Now that we operate the CEC community-based and reentry centers on a combined and integrated basis, we expect to realize cost savings and other synergies in line with our other community-based and reentry centers.
International Services
Operating expenses for International Services in 2017 compared to 2016 increased by $30.2 million. This increase was primarily due to the activation of our Ravenhall Prison Contract during the fourth quarter of 2017. Also contributing to the increase was approximately $6.1 million in foreign exchange rate fluctuations resulting from the weakening of the U.S. dollar against certain international currencies.
Facility Construction & Design
The decrease in operating expenses for our Facility Construction & Design services is due to decreased construction activity for our Ravenhall Prison Contract, with the Department of Justice in the State of Victoria, Australia, as the facility was completed and became operational during the fourth quarter of 2017. Refer to Note 7 ���— Contract Receivable of the notes to our audited consolidated financial statements included in Part II, Item 8 of this Annual Report on Form10-K.
Depreciation and Amortization
| 2017 | % of Segment Revenue | 2016 | % of Segment Revenue | $ Change | % Change | |||||||||||||||||||
| (Dollars in thousands) | ||||||||||||||||||||||||
U.S. Corrections & Detention | $ | 75,276 | 5.2 | % | $ | 74,154 | 5.4 | % | $ | 1,122 | 1.5 | % | ||||||||||||
GEO Care | 47,103 | 9.2 | % | 38,687 | 9.8 | % | 8,416 | 21.8 | % | |||||||||||||||
International Services | 1,918 | 1.0 | % | 2,075 | 1.3 | % | (157 | ) | (7.6 | )% | ||||||||||||||
|
|
|
|
|
| |||||||||||||||||||
Total | $ | 124,297 | 5.5 | % | $ | 114,916 | 5.3 | % | $ | 9,381 | 8.2 | % | ||||||||||||
|
|
|
|
|
| |||||||||||||||||||
U.S. Corrections & Detention
U.S. Corrections & Detention depreciation and amortization expense increased by $1.1 million in 2017 compared to 2016 primarily due to renovations made at several of our facilities as well as new facilities and intangible assets acquired in connection with our acquisition of CEC on April 5, 2017.
GEO Care
GEO Care depreciation and amortization increased in 2017 compared to 2016 primarily due to new facilities and intangible assets acquired in connection with our acquisition of CEC on April 5, 2017.
International Services
Depreciation and amortization expense decreased slightly in 2017 compared to 2016 as there were no significant additions or renovations during 2017 or 2016 at our international subsidiaries and certain assets became fully depreciated.
Other Unallocated Operating Expenses
| 2017 | % of Revenue | 2016 | % of Revenue | $ Change | % Change | |||||||||||||||||||
| (Dollars in thousands) | ||||||||||||||||||||||||
General and Administrative Expenses | $ | 190,343 | 8.4 | % | $ | 148,709 | 6.8 | % | $ | 41,634 | 28.0 | % | ||||||||||||
| 2017 | % of Revenue | 2016 | % of Revenue | $ Change | % Change | |||||||||||||||||||
| (Dollars in thousands) | ||||||||||||||||||||||||
General and Administrative Expenses | $ | 190,343 | 8.4 | % | $ | 148,709 | 6.8 | % | $ | 41,634 | 28.0 | % | ||||||||||||
General and administrative expenses comprise substantially all of our other unallocated operating expenses which primarily includes corporate management salaries and benefits, professional fees and other administrative expenses. The increase in general and administrative expenses in 2017 compared to 2016 was primarily attributable to (i) merger and acquisition expenses (which include certain transition expenses) of $19.1 million related to our acquisition of CEC; (ii) highernon-cash stock-based compensation expense of $7.1 million and (iii) increases related to normal personnel and compensation adjustments, professional, consulting, business development and other administrative fees in the aggregate of $15.4 million.
Non Operating Income and Expense
Interest Income and Interest Expense
| 2017 | % of Revenue | 2016 | % of Revenue | $ Change | % Change | |||||||||||||||||||
| (Dollars in thousands) | ||||||||||||||||||||||||
Interest Income | $ | 51,676 | 2.3 | % | $ | 28,496 | 1.3 | % | $ | 23,180 | 81.3 | % | ||||||||||||
Interest Expense | $ | 148,024 | 6.5 | % | $ | 128,718 | 5.9 | % | $ | 19,306 | 15.0 | % | ||||||||||||
Interest income increased in 2017 compared to 2016 primarily due to interest income earned on our contract receivable related to our prison project in Ravenhall, Australia. Refer to Note 7 — Contract Receivable included in the notes to our audited consolidated financial statements included in Part II, Item 8 of this annual report onForm10-K.
Interest expense increased in 2017 compared to 2016 primarily due to the construction loan interest related to our prison project in Ravenhall, Australia as well as additional revolver interest incurred in connection with our acquisition of CEC on April 5, 2017. These increases were partially offset by a reduction of debt as a result of the proceeds used from our common stock offering. Refer to Note 13 — Debt and Note 3 — Shareholders’ Equity included in the notes to our audited consolidated financial statements included in Part II, Item 8 of this Annual Report on Form10-K.
Loss on Extinguishment of Debt
| 2017 | % of Revenue | 2016 | % of Revenue | $ Change | % Change | |||||||||||||||||||
| (Dollars in thousands) | ||||||||||||||||||||||||
Loss on Extinguishment of Debt | $ | — | — | % | $ | 15,885 | 0.7 | % | $ | 15,885 | 100.0 | % | ||||||||||||
During 2016, we completed a tender offer and redemption of our 6.625% Senior Notes due 2021 (the “6.625 Senior Notes”) which resulted in a loss of $15.9 million related to the tender premium and deferred costs associated with the 6.625% Senior Notes. Refer to Note 13 — Debt of the notes to our audited consolidated financial statements included in Part II, Item 8 of this Annual Report on Form10-K.
Provision for Income Taxes
| 2017 | Effective Rate | 2016 | Effective Rate | $ Change | % Change | |||||||||||||||||||
| (Dollars in thousands) | ||||||||||||||||||||||||
Provision for Income Taxes | $ | 17,958 | 11.8 | % | $ | 7,904 | 5.3 | % | $ | 10,054 | 127.2 | % | ||||||||||||
The provision for income taxes during 2017 increased compared to 2016 along with the effective tax rate. The increase is primarily due to a $9.6 million net charge related to there-measurement of GEO’s net deferred tax assets as a result of the U.S. Tax Cuts and Jobs Act which was signed into law at the end of 2017. Partially offsetting the increase was a $1.6 million discrete tax benefit in 2017 as provided under ASUNo. 2016-09,Compensation —Stock Compensation (Topic 718).Refer to Note 1 — Summary of Business Organization, Operations and Significant Accounting Policies (Recent Accounting Pronouncements) of the Notes to the Consolidated Financial Statements included in Part II, Item 8 of this Annual Report on Form10-K. As a REIT, we are required to distribute at least 90% of our taxable income to shareholders and in turn are allowed a deduction for the distribution at the REIT level. Our wholly-owned taxable REIT subsidiaries continue to be fully subject to federal, state and foreign income taxes, as applicable. For 2018, we estimate our annual effective tax rate to be in the range of approximately 8% to 10% exclusive of any discrete items.
Equity in Earnings of Affiliates
| 2017 | % of Revenue | 2016 | % of Revenue | $ Change | % Change | |||||||||||||||||||
| (Dollars in thousands) | ||||||||||||||||||||||||
Equity in Earnings of Affiliates | $ | 12,045 | 0.5 | % | $ | 6,925 | 0.3 | % | $ | 5,120 | 73.9 | % | ||||||||||||
Equity in earnings of affiliates, presented net of income taxes, represents the earnings of SACS and GEOAmey in the aggregate. Equity in earnings of affiliates during 2017 increased compared to 2016 increased primarily as a result of SACS obtaining a favorable tax judgment in 2017 which resulted in an increase in earnings net of taxes.
2016 versus 2015
Revenues
| 2016 | % of Revenue | 2015 | % of Revenue | $ Change | % Change | |||||||||||||||||||
| (Dollars in thousands) | ||||||||||||||||||||||||
U.S. Corrections & Detention | $ | 1,375,277 | 63.1 | % | $ | 1,240,440 | 67.3 | % | $ | 134,837 | 10.9 | % | ||||||||||||
GEO Care | 394,449 | 18.1 | % | 340,918 | 18.5 | % | 53,531 | 15.7 | % | |||||||||||||||
International Services | 157,363 | 7.2 | % | 154,902 | 8.4 | % | 2,461 | 1.6 | % | |||||||||||||||
Facility Construction & Design | 252,401 | 11.6 | % | 107,047 | 5.8 | % | 145,354 | 135.8 | % | |||||||||||||||
|
|
|
|
|
|
|
|
|
| |||||||||||||||
Total | $ | 2,179,490 | 100.0 | % | $ | 1,843,307 | 100.0 | % | $ | 336,183 | 18.2 | % | ||||||||||||
|
|
|
|
|
|
|
|
|
| |||||||||||||||
U.S. Corrections & Detention
Revenues increased in 2016 compared to 2015 primarily due to aggregate increases of $123.7 million resulting from a full year of operations related to: (i) the activation, intake of detainees and subsequent ramp up at our company-owned Great Plains correctional facility in June 2015; (ii) the activation and intake of inmates at our company-owned North Lake correctional facility in May 2015; (iii) the activation and intake of inmates at our company-owned Mesa Verde facility in March 2015; (iv) the acquisition of the LCS Facilities in February 2015; (v) the activation of an expansion to our Karnes Residential Center in Texas in December 2015; and (vi) our assumption of the management of the3,400-bed Arizona State Prison facility in Kingman, Arizona in December 2015. We also experienced aggregate increases in revenues of $35.4 million at certain of our facilities primarily due to net increases in population, transportation services and/or rates. These increases were partially offset by a decrease of $24.3 million primarily due to contract terminations.
The number of compensated mandays in U.S. Corrections & Detention facilities was 22.0 million in 2016 as compared to 20.3 million in 2015. We experienced an aggregate net increase of approximately 1.7 million mandays as a result of our new contracts discussed above and also as a result of population increases at certain facilities. These increases were partially offset by decreases resulting from contract terminations. We look at the average occupancy in our facilities to determine how we are managing our available beds. The average occupancy is calculated by taking compensated mandays as a percentage of capacity. The average occupancy in our U.S. Detention & Corrections facilities was 93.9% and 91.5% of capacity in 2016 and 2015, respectively, excluding idle facilities.
GEO Care
Revenues increased for GEO Care by $53.5 million in 2016 compared to 2015 primarily due to increases in average client and participant counts under our electronic monitoring contracts and ISAP program. We also experienced increases from new contracts and program growth at our community based and reentry centers, including our new contract for community-based case management services under a new pilot program launched in September 2015 by the Department of Homeland Security.
International Services
Revenues for International Services in 2016 compared to 2015 increased by $2.5 million. Contributing to the increase was an aggregate increase of $6.9 million primarily related to population increases at our Australian subsidiary. This increase was partially offset by foreign exchange rate fluctuations of $(4.4) million resulting from the strengthening of the U.S. dollar against certain international currencies.
Facility Construction & Design
Theincrease in revenues for our Facility Construction & Design services is due to increased construction activity for our new Ravenhall Prison Contract, which was executed in September 2014, with the Department of Justice in the State of Victoria, Australia. Refer to Note 7 — Contract Receivable of the notes to our audited consolidated financial statements included in Part II, Item 8 of this Annual Report on Form10-K.
Operating Expenses
| 2016 | % of Segment Revenues | 2015 | % of Segment Revenues | $ Change | % Change | |||||||||||||||||||
| (Dollars in thousands) | ||||||||||||||||||||||||
U.S. Corrections & Detention | $ | 1,005,045 | 73.1 | % | $ | 888,009 | 71.6 | % | $ | 117,036 | 13.2 | % | ||||||||||||
GEO Care | 243,982 | 61.9 | % | 224,530 | 65.9 | % | 19,452 | 8.7 | % | |||||||||||||||
International Services | 149,479 | 95.0 | % | 144,548 | 93.3 | % | 4,931 | 3.4 | % | |||||||||||||||
Facility Construction & Design | 251,775 | 99.8 | % | 106,695 | 99.7 | % | 145,080 | 136.0 | % | |||||||||||||||
|
|
|
|
|
| |||||||||||||||||||
Total | $ | 1,650,281 | 75.7 | % | $ | 1,363,782 | 74.0 | % | $ | 286,499 | 21.0 | % | ||||||||||||
|
|
|
|
|
| |||||||||||||||||||
Operating expenses consist of those expenses incurred in the operation and management of our correctional, detention and GEO Care facilities and expenses incurred in our Facility Construction & Design segment.
U.S. Corrections & Detention
The increase in operating expenses for U.S. Corrections & Detention reflects an increase of $94.3 million primarily due to a full year of operations related to: (i) the activation and intake of detainees and subsequent ramp up at our company-owned Great Plains correctional facility in June 2015; (ii) the activation and intake of inmates at our company-owned North Lake correctional facility in May 2015; (iii) the activation and intake of
inmates at our company-owned Mesa Verde facility in March 2015; (iv) the acquisition of the LCS Facilities in February 2015; (v) the activation of an expansion to our Karnes Residential Center in Texas in December 2015; and (i) our assumption of the management of the3,400-bed Arizona State Prison facility in Kingman, Arizona in December 2015. The timing of these activations and the corresponding variable expenses resulted in an increase in our operating expenses as a percentage of segment revenue in 2016. We also experienced increases of $42.4 million at certain of our facilities primarily attributable to expenditures related to the expansion of the delivery of offender rehabilitation services under our GEO Continuum of Care platform, net population increases, increased transportation services and the variable costs associated with those increases. These increases were partially offset by a decrease of $19.7 million primarily related to contract terminations.
GEO Care
Operating expenses for GEO Care increased by $19.5 million during 2016 from 2015 primarily due to increases in average client and participant counts under our electronic monitoring contracts and ISAP program. We also experienced increases from new contracts and program growth at our community based and reentry centers, including our new contract for community-based case management services under a new pilot program launched in September 2015 by the Department of Homeland Security. Certain of our new contract and program growth did not experience a corresponding increase in variable costs which led to a decrease in operating expenses as a percentage of revenues.
International Services
Operating expenses for International Services in 2016 compared to 2015 increased by $4.9 million. Contributing to the increase was an aggregate increase of $9.9 million primarily attributable to population increases at our Australian and South African subsidiaries. This increase was partially offset by foreign exchange rate fluctuations of $(5.0) million resulting from the strengthening of the U.S. dollar against certain international currencies.
Facility Construction & Design
Theincrease in operating expense for our Facility Construction & Design services is due to increased construction activity for our new Ravenhall Prison Contract, which was executed in September 2014, with the Department of Justice in the State of Victoria, Australia. Refer to Note 7 — Contract Receivable of the notes to our audited consolidated financial statements included in Part II, Item 8 of this Annual Report on Form10-K.
Depreciation and Amortization
| 2016 | % of Segment Revenue | 2015 | % of Segment Revenue | $ Change | % Change | |||||||||||||||||||
| (Dollars in thousands) | ||||||||||||||||||||||||
U.S. Corrections & Detention | $ | 74,154 | 5.4 | % | $ | 70,486 | 5.7 | % | $ | 3,668 | 5.2 | % | ||||||||||||
GEO Care | 38,687 | 9.8 | % | 33,582 | 9.9 | % | 5,105 | 15.2 | % | |||||||||||||||
International Services | 2,075 | 1.3 | % | 2,688 | 1.7 | % | (613 | ) | (22.8 | )% | ||||||||||||||
|
|
|
|
|
| |||||||||||||||||||
Total | $ | 114,916 | 5.3 | % | $ | 106,756 | 5.8 | % | $ | 8,160 | 7.6 | % | ||||||||||||
|
|
|
|
|
| |||||||||||||||||||
U.S. Corrections & Detention
U.S. Corrections & Detention depreciation and amortization expense increased by $3.7 million in 2016 compared to 2015 primarily due to renovations made at several of our facilities.
GEO Care
GEO Care depreciation and amortization increased in 2016 compared to 2015 primarily due to renovations made at several of our locations.
International Services
Depreciation and amortization expense decreased in 2016 compared to 2015 as there were no significant additions or renovations during 2016 or 2015 at our international subsidiaries and certain assets became fully depreciated.
Other Unallocated Operating Expenses
| 2016 | % of Revenue | 2015 | % of Revenue | $ Change | % Change | |||||||||||||||||||
| (Dollars in thousands) | ||||||||||||||||||||||||
General and Administrative Expenses | $ | 148,709 | 6.8 | % | $ | 137,040 | 7.4 | % | $ | 11,669 | 8.5 | % | ||||||||||||
General and administrative expenses comprise substantially all of our other unallocated operating expenses which primarily includes corporate management salaries and benefits, professional fees and other administrative expenses. The increase in general and administrative expenses in 2016 compared to 2015 was primarily attributable to increases related to normal personnel and compensation and benefit adjustments of $8.1 million and professional, consulting, business development and other administrative fees of $3.5 million in the aggregate.
Non Operating Income and Expense
Interest Income and Interest Expense
| 2016 | % of Revenue | 2015 | % of Revenue | $ Change | % Change | |||||||||||||||||||
| (Dollars in thousands) | ||||||||||||||||||||||||
Interest Income | $ | 28,496 | 1.3 | % | $ | 11,578 | 0.6 | % | $ | 16,918 | 146.1 | % | ||||||||||||
Interest Expense | $ | 128,718 | 5.9 | % | $ | 106,136 | 5.8 | % | $ | 22,582 | 21.3 | % | ||||||||||||
Interest income increased in 2016 compared to 2015 primarily due to interest income earned on our contract receivable related to our prison project in Ravenhall, Australia. Refer to Note 7 — Contract Receivable included in the notes to our audited consolidated financial statements included in Part II, Item 8 of this annual report on Form10-K.
Interest expense increased in 2016 compared to 2015 primarily due to the construction loan interest related to our prison project in Ravenhall, Australia as well as additional revolver interest incurred in connection with our acquisition of the LCS Facilities. Refer to Note 13 — Debt included in the notes to our audited consolidated financial statements included in Part II, Item 8 of this Annual Report on Form10-K.
Loss on Extinguishment of Debt
| 2016 | % of Revenue | 2015 | % of Revenue | $ Change | % Change | |||||||||||||||||||
| (Dollars in thousands) | ||||||||||||||||||||||||
Loss on Extinguishment of Debt | $ | 15,885 | 0.7 | % | $ | — | — | % | $ | 15,885 | 100.0 | % | ||||||||||||
| 2017 | % of Revenue | 2016 | % of Revenue | $ Change | % Change | |||||||||||||||||||
| (Dollars in thousands) | ||||||||||||||||||||||||
Loss on Extinguishment of Debt | $ | — | — | % | $ | 15,885 | 0.7 | % | $ | 15,885 | 100.0 | % | ||||||||||||
During 2016, we completed a tender offer and redemption of our 6.625% senior notes due 2021 (the “6.625% Senior NotesNotes”) which resulted in a loss of $15.9 million related to the tender premium and deferred costs associated with the 6.625% Senior Notes.
Provision for Income Taxes
| 2017 | Effective Rate | 2016 | Effective Rate | $ Change | % Change | |||||||||||||||||||
| (Dollars in thousands) | ||||||||||||||||||||||||
Provision for Income Taxes | $ | 17,958 | 11.8 | % | $ | 7,904 | 5.3 | % | $ | 10,054 | 127.2 | % | ||||||||||||
The provision for income taxes during 2017 increased compared to 2016 along with the effective tax rate. The increase is primarily due to a $9.6 million net charge related to there-measurement of GEO’s net deferred tax assets as a result of the U.S. Tax Cuts and Jobs Act which was signed into law at the end of 2017. Partially offsetting the increase was a $1.6 million discrete tax benefit in 2017 as provided under ASUNo. 2016-09,Compensation — Stock Compensation (Topic 718).Refer to Note 131 — DebtSummary of Business Organization, Operations and Significant Accounting Policies (Recent Accounting Pronouncements) of the notesNotes to our audited consolidated financial statementsthe Consolidated Financial Statements included in Part II, Item 8 of this Annual Report on Form10-K.10-K
Provision for Income Taxes
| 2016 | Effective Rate | 2015 | Effective Rate | $ Change | % Change | |||||||||||||||||||
| (Dollars in thousands) | ||||||||||||||||||||||||
Provision for Income Taxes | $ | 7,904 | 5.3 | % | $ | 7,389 | 5.2 | % | $ | 515 | 7.0 | % | ||||||||||||
The provision for income taxes during 2016 increased slightly compared to 2015 along with the effective tax rate. In both 2015 and 2016 our actual effective tax rate was lower than our estimated tax rate due tonon-recurring items and the composition of income earned by our REIT and our taxable REIT subsidiaries. In 2016, we discovered certain immaterial errors in prior periods related to the calculation of deferred tax assets and liabilities. In accordance with ASC Topic250-10-S99-2, “Considering the Effects of Prior Year Misstatements when Quantifying Misstatements in Current Year Financial Statements,” we recorded an aggregate adjustment of approximately $2.7 million reducing the provision for income taxes in 2016. This adjustment to our financial statements is immaterial both as it relates to the current period as well as each of the prior periods affected. In evaluating materiality and determining the appropriateness of applying ASC Topic250-10-S99-2 to these errors, we considered materiality both qualitatively and quantitatively as prescribed by ASC Topic250-10-S99-1, “Assessing Materiality.“year ended 2017. As a REIT, we are required to distribute at least 90% of our taxable income to shareholders and in turn are allowed a deduction for the distribution at the REIT level. Our wholly-owned taxable REIT subsidiaries continue to be fully subject to federal, state and foreign income taxes, as applicable. We estimate our annual effective tax rate to be in the range of approximately 8% to 9% exclusive of anynon-recurring items.
Equity in Earnings of Affiliates
| 2016 | % of Revenue | 2015 | % of Revenue | $ Change | % Change | |||||||||||||||||||
| (Dollars in thousands) | ||||||||||||||||||||||||
Equity in Earnings of Affiliates | $ | 6,925 | 0.3 | % | $ | 5,533 | 0.3 | % | $ | 1,392 | 25.2 | % | ||||||||||||
| 2017 | % of Revenue | 2016 | % of Revenue | $ Change | % Change | |||||||||||||||||||
| (Dollars in thousands) | ||||||||||||||||||||||||
Equity in Earnings of Affiliates | $ | 12,045 | 0.5 | % | $ | 6,925 | 0.3 | % | $ | 5,120 | 73.9 | % | ||||||||||||
Equity in earnings of affiliates, presented net of income taxes, represents the earnings of SACS and GEOAmey in the aggregate. Equity in earnings of affiliates during 20162017 increased compared to 2015 increased2016 primarily as a result of SACS obtaining a favorable performance by GEOAmey during the periods.tax judgment in 2017 which resulted in an increase in earnings net of taxes.
Financial Condition
Capital Requirements
Our current cash requirements consist of amounts needed for working capital, distributions of our REIT taxable income in order to maintain our REIT qualification under the Code, debt service, supply purchases, investments in joint ventures, and capital expenditures related to either the development of new correctional, detention and reentry facilities, or the maintenance of existing facilities. In addition, some of our management contracts require us to make substantial initial expenditures of cash in connection with opening or renovating a
facility. Generally, these initial expenditures are subsequently fully or partially recoverable as pass-through costs or are billable as a component of the per diem rates or monthly fixed fees to the contracting agency over the original term of the contract. Additional capital needs may also arise in the future with respect to possible acquisitions, other corporate transactions or other corporate purposes.
In connection with GEOAmey, our joint venture in the United Kingdom, we and our joint venture partner have each provided a line of credit of £12 million, or $16.2 million, based on exchange rates as of December 31, 2017, for GEOAmey’s operations of which £1.3 million, or $1.7 million based on exchange rates as of December 31, 2017, was outstanding as of December 31, 2017.
As of December 31, 2017,2018, we were developing a number of projects that we estimate will cost approximately $251.3$255.3 million, of which $101.9$210.8 million was spent through December 31, 2017.2018. We estimate our remaining capital requirements to be approximately $149.4$44.5 million. These projects are expected to be completed through 2019.
Liquidity and Capital Resources
Amended and Restated Credit Agreement
On March��23, 2017,April 30, 2018, we executed a third amendedentered into Amendment No. 1 to Third Amended and restated credit agreementRestated Credit Agreement (the “Credit Agreement”) by and among Thethe Refinancing Lenders party thereto, the other lenders party thereto, GEO Group, Inc. and GEO Corrections Holdings, Inc., (“Corrections” and together with The GEO Group, Inc., the “Borrowers”), the Australian Borrowers named therein, BNP Paribas, as Administrative Agent, and the lenders who are, or may from time to time become, a party thereto (the “Credit Agreement”).Agent. The Credit Agreement refinances GEO’s prior $291 million term loan, reestablishes GEO’s ability to implement at a later date an Australian Dollar Letter of Credit Facility (the “Australian LC Facility”) providingamendment, among other things, provides for the issuancerefinancing of financial lettersall of creditour existing senior secured term loans with refinancing term loans in the aggregate principal amount of $792.0 million and performance letters of credit, in each case denominated in Australian Dollars up to AUD275 million, an increase from the prior AUD225 million Australian Dollar letter of credit facility, andmakes certain other modifications to the priorour senior secured credit agreement. LoanThe interest rate applicable to the refinancing term loans is equal to LIBOR plus 2.00% (with a LIBOR floor of 0.75%). The amendment was considered to be a modification and loan costs of approximately $7$1.0 million were incurred and capitalized in connection with the transaction.
The Credit Agreement evidences a senior credit facility (the “Senior Credit“Credit Facility”) consisting of an $800the $792.0 million term loan discussed above (the “Term Loan”) bearing interest at LIBOR plus 2.25%2.00% (with a LIBOR floor of 0.75%), and a $900$900.0 million revolving credit facility (the “Revolver”)Revolver initially bearing interest at LIBOR plus 2.25% (with no LIBOR floor) together with AUD275 million available solely for the issuance of financial letters of credit and performance letters of credit, in each case denominated in Australian Dollars under the Australian Dollar Letter of Credit Facility (the “Australian LC Facility.Facility”). As of December 31, 2017,2018, there were no letters of credit issued under the Australian LC Facility. Amounts to be borrowed by GEOus under the Credit Agreement are subject to the satisfaction of customary conditions to borrowing. The Term Loan component is scheduled to mature on March 23, 2024. The revolving credit commitment component is scheduled to mature on May 19, 2021. The Credit Agreement also has an accordion feature of $450$450.0 million, subject to lender demand and prevailing market conditions and satisfying the relevant borrowing conditions.
The Credit Agreement contains certain customary representations and warranties and certain customary covenants that restrict GEO’sour ability to, among other things, (i) create, incur or assume any indebtedness, (ii) create, incur, assume or permit liens, (iii) make loans and investments, (iv) engage in mergers, acquisitions and asset sales, (v) make certain restricted payments, (vi) issue, sell or otherwise dispose of capital stock, (vii) engage in transactions with affiliates, (viii) allow the total leverage ratio to exceed 6.25 to 1.00, allow the senior secured leverage ratio to exceed 3.50 to 1.00, or allow the interest coverage ratio to be less than 3.00 to 1.00, (ix) cancel, forgive, make any voluntary or optional payment or prepayment on, or redeem or acquire for value any senior notes, except as permitted, (x) alter the business GEO conducts,we conduct, and (xi) materially impair GEO’sour lenders’ security interests in the collateral for its loans.
Events of default under the Credit Agreement include, but are not limited to, (i) GEO’sour failure to pay principal or interest when due, (ii) GEO’sour material breach of any representation or warranty, (iii) covenant defaults, (iv) liquidation, reorganization or other relief relating to bankruptcy or insolvency, (v) cross default under certain other material indebtedness, (vi) unsatisfied final judgments over a specified threshold, (vii) certain material environmental liability claims asserted against GEO,us, and (viii) a change in control.
All of the obligations under the Credit Agreement are unconditionally guaranteed by certain domestic subsidiaries of GEOours and the Credit Agreement and the related guarantees are secured by a perfected first-priority
pledge of substantially all of GEO’sour present and future tangible and intangible domestic assets and all present and future tangible and intangible domestic assets of each guarantor, including but not limited to a first-priority pledge of all of the outstanding capital stock owned by GEOus and each guarantor in their domestic subsidiaries.
The Australian BorrowersGEO Australasia Holdings Pty Ltd, GEO Australasia Finance Holdings Pty Ltd as trustee for the GEO Australasia Finance Holding Trust, and together with GEO Australasia Holdings, collectively (the “Australian Borrowers”) are wholly owned foreign subsidiaries of GEO. GEO hasours. We have designated each of the Australian Borrowers as restricted subsidiaries under the Credit Agreement. However, the Australian Borrowers are not obligated to pay or perform any obligations under the Credit Agreement other than their own obligations
as Australian Borrowers under the Credit Agreement. The Australian Borrowers do not pledge any of their assets to secure any obligations under the Credit Agreement.
On August 18, 2016, we executed a Letter of Offer by and among GEO and HSBC Bank Australia Limited (the “Letter of Offer”) providing for a bank guarantee line and bank guarantee/standbysub-facility in an aggregate amount of AUD100 million, or $78.1$70.6 million, based on exchange rates in effect as of December 31, 20172018 (collectively, the “Bank Guarantee Facility”). The Bank Guarantee Facility allows GEO to provide letters of credit to assure performance of certain obligations of its wholly owned subsidiary relating to its prison project in Ravenhall, located near Melbourne, Australia. The Bank Guarantee Facility is unsecured. The issuance of letters of credit under the Bank Guarantee Facility is subject to the satisfaction of the conditions precedent specified in the Letter of Offer. Letters of credit issued under the bank guarantee lines are due on demand and letters of credit issued under the bank guarantee/standbysub-facility cannot have a duration exceeding twelve months. The Bank Guarantee Facility may be terminated by HSBC Bank Australia Limited on 90 days written notice. As of December 31, 2017,2018, there was AUD100 million in letters of credit issued under the Bank Guarantee Facility.
As of December 31, 2017,2018, we had $794.0$788.0 million in aggregate borrowings outstanding under the Term Loan and $270.6$490.8 million in borrowings under the Revolver, and approximately $70.1$62.3 million in letters of credit which left $559.3$346.9 million in additional borrowing capacity under the Revolver. In addition, we have the ability to increase the Senior Credit Facility by an additional $450.0 million, subject to lender demand and prevailing market conditions and satisfying the relevant borrowing conditions thereunder. Refer to Note 13 — Debt in the notes to our audited consolidated financial statements included in Part II, Item 8 of this Annual Report onForm10-K.
6.00% Senior Notes due 2026
On April 18, 2016, we completed an offering of $350.0 million aggregate principal amount of 6.00% senior notes due 2026. The 6.00% Senior Notes will mature on April 15, 20262016 and were issued at a coupon rate and yield to maturity of 6.00%. Interest on the 6.00% Senior Notes is payable semi-annually on April 15 and October 15 of each year, commencing on October 15, 2016. We used the net proceeds to fund the tender offer and the redemption of all of our 6.625% Senior Notes (see discussion below), to pay all related fees, costs and expenses and for general corporate purposes including repaying borrowings under our prior revolver. Loan costs of approximately $6 million were incurred and capitalized in connection with the offering. Refer to Note 13 —Debt— Debt in the notes to our audited consolidated financial statements included in Part II, Item 8 of this Annual Report on Form10-K.
6.625% Senior Notes due 2021
On February 10, 2011, we completed a private offering of $300.0 million in aggregate principal amount of itsour 6.625% Senior Notes. Interest on the 6.625% Senior Notes accrued at the stated rate. We paid interest semi-annually in arrears on February 15 and August 15 of each year.
On April 11, 2016, we announced that we had commenced a cash tender offer for any and all of our $300.0 million aggregate principal amount of our 6.625% Senior Notes due 2021. On April 18, 2016, we
completed the purchase of $231 million in aggregate principal amount of our 6.625% Senior Notes validly tendered in connection with our tender offer on or prior to the expiration time. On May 20, 2016, we completed
the redemption of the remaining 6.625% Senior Notes in connection with the terms of the notice of redemption delivered to the note holders on April 20, 2016 pursuant to the terms of the indenture governing the 6.625% Senior Notes. We financed the purchase of the 6.625% Senior Notes under the tender offer with part of the net cash proceeds from the 6.00% Senior Notes (see discussion above). As a result of the tender offer and redemption, we incurred a $15.9 million loss on extinguishment of debt during the year ended December 31, 2016 related to the tender premium and deferred costs associated with the 6.625% Senior Notes. Refer to Note 13 — Debt in the notes to our audited consolidated financial statements included in Part II, Item 8 of this Annual Report on Form10-K.
5.875% Senior Notes due 2024
On September 25, 2014, we completed an offering of $250.0 million aggregate principal amount of senior unsecured notes. The notes will mature on October 15, 2024 and have a coupon rate and yield to maturity of 5.875%. Interest is payable semi-annually in cash in arrears on April 15 and October 15, which commenced on April 15, 2015. The proceeds received from the 5.875% Senior Notes due 2024 were used to pay down a portion of the outstanding indebtedness underuder the revolverevolver portion of our prior Senior Credit Facility. Refer to Note 13 —Debt— Debt in the notes to our audited consolidated financial statements included in Part II, Item 8 of this Annual Report on Form10-K.
5.875% Senior Notes due 2022
On October 3, 2013, we completed an offering of $250.0 million aggregate principal amount of 5.875% Senior Notes due 2022. The 5.875% Senior Notes due 2022 will mature on January 15, 2022 and have a coupon rate and yield to maturity of 5.875%. Interest is payable semi-annually on January 15 and July 15 each year, which commenced on January 15, 2014. The proceeds received from the 5.875% Senior Notes due 2022 were used, together with cash on hand, to fund the repurchase, redemption or other discharge of our 7 3/4% Senior Notes due 2017 and to pay related transaction fees and expenses. Refer to Note 13 — Debt in the notes to our audited consolidated financial statements included in Part II, Item 8 of this Annual Report on Form10-K.
5.125% Senior Notes due 2023
On March 19, 2013, we completed an offering of $300.0 million aggregate principal amount of 5.125% Senior Notes. The 5.125% Senior Notes will mature on April 1, 2023 and have a coupon rate and yield to maturity of 5.125%. Interest is payable semi-annually on April 1 and October 1 each year, which commenced on October 1, 2013. A portion of the proceeds received from the 5.125% Senior Notes were used on the date of the financing to repay the prior revolver credit draws outstanding under the prior senior credit facility. Refer to Note 13 — Debt in the notes to our audited consolidated financial statements included in Part II, Item 8 of this Annual Report on Form10-K.
We are also considering opportunities for future business and/or asset acquisitions. If we are successful in our pursuit of these new projects, our cash on hand, cash flows from operations and borrowings under the existing Senior Credit Facility may not provide sufficient liquidity to meet our capital needs through 20182019 and we could be forced to seek additional financing or refinance our existing indebtedness. There can be no assurance
that any such financing or refinancing would be available to us on terms equal to or more favorable than our current financing terms, or at all. In the future, our access to capital and ability to compete for future capital-intensive projects will also be dependent upon, among other things, our ability to meet certain financial covenants in the indentures governing the 6.00% Senior Notes, the 5.125% Senior Notes, the 5.875% Senior Notes due 2022 and the 5.875% Senior Notes due 2024 and our Senior Credit Facility. A substantial decline in our financial performance could limit our access to capital pursuant to these covenants and have a material adverse affect on our liquidity and capital resources and, as a result, on our financial condition and results of
operations. In addition to these foregoing potential constraints on our capital, a number of state government agencies have been suffering from budget deficits and liquidity issues. While we expect to be in compliance with our debt covenants, if these constraints were to intensify, our liquidity could be materially adversely impacted as could our ability to remain in compliance with these debt covenants.
Stock Split
In March 2017, our Board of Directors declared a3-for-2 stock split of our common stock. The stock split was completed on April 24, 2017 with respect to shareholders of record on April 10, 2017. Outstanding share andper-share amounts disclosed for all periods presented have been retroactively adjusted to reflect the effects of the stock split. On April 24, 2017, we amended our articles of incorporation to increase the number of authorized shares of common stock to take into effect the stock split.
Common Stock Offering
On March 7, 2017, we entered into an underwriting agreement related to the issuance and sale of 9,000,000 shares of our common stock, par value $.01 per share. The offering price to the public was $27.80 per share and the underwriters agreed to purchase the shares from us pursuant to the underwriting agreement at a price of $26.70 per share. In addition, under the terms of the underwriting agreement, we granted the underwriters an option, exercisable for 30 days, to purchase up to an additional 1,350,000 shares of common stock. On March 8, 2017, the underwriters exercised in full their option to purchase the additional 1,350,000 shares of common stock. On March 13, 2017, we announced that we had completed the sale of 10,350,000 shares of common stock with our previously announced underwritten public offering. GEO received gross proceeds (before underwriting discounts and estimated offering expenses) of approximately $288.1 million from the offering, including approximately $37.6 million in connection with the sale of the additional shares. Fees paid in connection with the offering were not significant and have been netted against additionalpaid-in capital. The net proceeds of this offering were used to repay amounts outstanding under the revolver portion of our prior senior credit facility and for general corporate purposes. The 10,350,000 shares of common stock were issued under GEO’s previously effective shelf registration filed with the Securities and Exchange Commission. The previously effective registration statement on FormS-3 expired September 12, 2017. On October 20, 2017, GEO filed a new registration statement on FormS-3 that automatically became effective. Refer to the discussion below. The net proceeds of this offering were used to repay amounts outstanding under the revolver portion of our prior senior credit facility and for general corporate purposes. The number of shares andper-share amounts herein have been adjusted to reflect the effects of the stock split discussed above.
Stock Buyback Program
On February14, 2018, we announced that our Board of Directors authorized a stock buyback program authorizing us to repurchase up to a maximum of $200 million of our shares of common stock. The stock buyback program will be funded primarily with cash on hand, free cash flow and borrowings under our Revolver. The program is effective through October 20, 2020. The stock buyback program is intended to be implemented through purchases made from time to time in the open market or in privately negotiated transactions, in accordance with applicable Securities and Exchange Commission (“SEC”) requirements. The stock buyback program does not obligate us to purchase any specific amount of our common stock and may be suspended or extended at any time at the discretion of the Company’s Board of Directors. During the year ended December 31, 2018, we purchased 4,210,254 shares of our common stock at a cost of $95.2 million primarily purchased with proceeds from our Revolver. We believe that we have the ability to continue to fund the stock buyback program, our debt service requirements and our maintenance and growth capital expenditure requirements, while maintaining sufficient liquidity for other corporate purposes.
Prospectus Supplement
In September 2014,On October 20, 2017, we filed with the SEC an automatic shelf registration statement on FormS-3. On November 10, 2014, in connection with the shelf registration, we filed with the SEC a prospectus supplement related to the offer and sale from time to time of our common stock at an aggregate offering price of up to $150 million through sales agents. Sales of shares of our common stock under the prospectus supplement and the equity distribution agreements entered into with the sales agents, if any, may be made in negotiated transactions or transactions that are deemed to be “at the market” offerings as defined in Rule 415 under the Securities Act of 1933. There were no shares of common stock sold under this prospectus supplement during the years ended December 31, 2017, 2016 or 2015. On September 12, 2017, the shelf registration expired. On October 20, 2017, we filed with the SEC a new automatic shelf registration on FormS-3. Under this new shelf registration, we may, from time to time, sell any combination of securities described in the prospectus in one or
prospectus in one or more offerings. Each time that we may sell securities, we will provide a prospectus supplement that will contain specific information about the terms of that offering and the securities being offered. On November 9, 2017, in connection with the shelf registration, we filed with the SEC a prospectus supplement related to the offer and sale from time to time of our common stock at an aggregate offering price of up to $150 million through sales agents. Sales of shares of our common stock under the prospectus supplement and the equity distribution agreements entered into with the sales agents, if any, may be made in negotiated transactions or transactions that are deemed to be “at the market” offerings as defined in Rule 415 under the Securities Act of 1933. There were no shares of common stock sold under this prospectus supplement during the yearyears ended December 31, 2018 or 2017.
REIT Distributions
As a REIT, we are subject to a number of organizational and operational requirements, including a requirement that we annually distribute to our shareholders an amount equal to at least 90% of our REIT taxable income (determined before the deduction for dividends paid and by excluding any net capital gain). Generally, we expect to distribute all or substantially all of our REIT taxable income so as not to be subject to the income or excise tax on undistributed REIT taxable income. The amount, timing and frequency of distributions will be at the sole discretion of our Board of Directors and will be based upon various factors.
We plan to fund all of our capital needs, including distributions of our REIT taxable income in order to maintain our REIT qualification, and capital expenditures, from cash on hand, cash from operations, borrowings under our Senior Credit Facility and any other financings which our management and Board of Directors, in their discretion, may consummate. Currently, our primary source of liquidity to meet these requirements is cash flow from operations and borrowings under the $900.0 million Revolver. Our management believes that cash on hand, cash flows from operations and availability under our Senior Credit Facility will be adequate to support our capital requirements for 2018 and 2019 as disclosed under “Capital Requirements” above.
Non-Recourse Debt
Northwest Detention Center
On December 9, 2011, the Washington Economic Development Finance Authority issued $54.4 million of its Washington Economic Development Finance Authority Taxable Economic Development Revenue Bonds, series 2011 (“2011 Revenue Bonds”). The payment of principal and interest on the bonds isnon-recourse to us. None of the bonds nor Correctional Services Corporation’sCorporations’s obligations under the loan are our obligations nor are they guaranteed by us.
As of December 31, 2017,2018, the remaining balance of the debt service requirement related to the 2011 Revenue Bonds is $30.0$23.0 million, of which $7.0$7.3 million is classified as current in the accompanying balance sheet. As of December 31, 2017,2018, included in restricted cash and investments is $6.1$5.7 million (all current) of funds held in trust with respect to the Northwest Detention Center for debt service and other reserves which had not been released to us as of December 31, 2017.2018. Refer to Note13-Debt in the notes to our consolidated financial statements included in Part II, Item 8 of this Annual Report on Form10-K for further information.
Australia — Fulham
Our wholly-owned Australian subsidiary financed the development of a facility and subsequent expansion in 2003 with long-term debt obligations. These obligations werenon-recourse to us and totaled $2.6 million (AUD 3.6 million) at December 31, 2016 based on exchange rates in effect as of December 31, 2016. The term of thenon-recourse debt was through 2017 and it bore interest at a variable rate quoted by certain Australian banks plus 140 basis points. Any obligations or liabilities of the subsidiary were matched by a similar or corresponding commitment from the government of the State of Victoria. As a condition of the loan, we were required to maintain a restricted cash balance. The loan was paid in full during 2017.
Australia — Ravenhall
In connection with a new design and build prison project agreement with the State of Victoria, we entered into a Construction Facilitysyndicated facility agreement (the “Construction Facility”) with National Australia Bank Limited to provide debt financing for construction of the project. Refer to Note 7 — Contract Receivable in the notes to our audited consolidated financial statements included in Part II, Item 8 of this Annual Report on Form10-K. The Construction Facility provided fornon-recourse funding up to AUD 791 million, or $617.5$558.1 million, based on exchange rates as of December 31, 2017.2018. Construction draws were funded throughout the project according to a fixed utilization schedule as defined in the syndicated facility agreement. The term of the Construction Facility is through October 2019 and bears interest at a variable rate quoted by certain Australian banks plus 200 basis points. After October 2019,We intend to refinance the Construction Facility will be convertedprior to a term loan with payments due quarterly beginning in 2019 through 2041.September 2019. In accordance with the terms of the Construction Facility, upon completion and commercial acceptance of the prison, in accordance with the prison contract, in November 2017, in connection with completion of the prison, the State made a lump sum payment of AUD 310 million, or $242.0$218.7 million, based on exchange rates as of December 31, 2017,2018, which was used to pay a portion of the outstanding principal. The remaining outstanding principal balance once refinanced, will be repaid over the term of the operating agreement. As of December 31, 2017, $364.02018, $318.1 million was outstanding under the Construction Facility. We also entered into interest rate swap agreements related to ournon-recourse debt in connection with the project. Refer to Note 8 — Derivative Financial Instruments in the notes to our consolidated financial statements included in Part II, Item 8 of this Annual Report on Form10-K.
Guarantees
The Company has entered into certain guarantees in connection with the design, financing and construction of certain facilities as well as loan, working capital and other obligation guarantees for our subsidiaries in Australia, South Africa and our joint ventures. Refer to Note 13 — Debt in the notes to our consolidated financial statements included in Part II, Item 8 of this Annual Report on Form10-K.
Executive Retirement Agreements
We have anon-qualified deferred compensation agreement with our Chief Executive Officer, who we refer to as our CEO. The current agreement, as amended, provides for a lump sum payment upon retirement, no sooner than age 55. As of December 31, 2017,2018, our CEO had reached age 55 and was eligible to receive the payment upon retirement. If our CEO had retired as of December 31, 2017,2018, we would have had to pay him $8.0$8.3 million. Based on our current capitalization, we do not believe that making this payment would materially adversely impact our liquidity.
Off-Balance Sheet Arrangements
Except as discussed above, and in the notes to our consolidated financial statements included in Part II, Item 8 of this Annual Report on Form10-K, we do not have any off balance sheet arrangements.
We are also exposed to various commitments and contingencies which may have a material adverse effect on our liquidity. See Note 17 — Commitments and Contingencies in the notes to our consolidated financial statements included in Part II, Item 8 of this Annual Report on Form10-K.
Derivatives
One of our Australian subsidiaries was a party to an interest rate swap agreement to fix the interest rate on the variable ratenon-recourse debt to 9.7%.debt. We had determined the swap’s payment and expiration dates, and call provisions that coincided with the terms of thenon-recourse debt, to be an effective cash flow hedge. Accordingly, we recorded the change in the value of the interest rate swap in accumulated other comprehensive income, net of applicable income taxes. Total unrealized gains recorded in other comprehensive income, net of tax, related to this cash flow hedge were not significant for the years ended December 31, 2017 or 2016. During 2017, the associatednon-recourse debt was paid off and the interest rate swap is no longer in existence as of December 31, 2017.existence.
In September 2014, our Australian subsidiary entered into interest rate swap agreements to fix the interest rate on our variable ratenon-recourse debt related to a prison project in Ravenhall, a locality near Melbourne, Australia to 3.3% during the design and construction phase and 4.2% during the project’s operating phase. Refer to Note 7 — Contract Receivable in the notes to our audited consolidated financial statements included in Part II, Item 8 of this Annual Report on Form10-K for further information.
The swaps’ notional amounts during the design and construction phase coincided with scheduled construction draw commitments throughout the project. The design and construction phase of the project was completed during November 2017 and the related interest rate swap agreements expired. At December 31, 2017,2018, the swaps related to the operating phase had a notional value of approximately AUD 466.3450.8 million, or $364.0$318.0 million. At the onset, we had determined that the swaps have payment, expiration dates and provisions that coincide with the terms of thenon-recourse debt and the critical terms of the swap agreements and scheduled construction draw commitments were the same and were therefore considered to be effective cash flow hedges. During 2017 and 2016, certain of the critical terms of the swap agreements related to the design and construction phase no longer coincided with the scheduled construction draw commitments. However, the swaps were still considered to be highly effective and the measurement of any ineffectiveness was not significant during the year ended December 31, 2017 or 2016. Accordingly, we recorded the change in the fair value of the interest rate swaps in accumulated other comprehensive income, net of applicable income taxes. Total unrealized gains recorded in other comprehensive income, net of tax, related to this cash flow hedge were approximately $4.0$6.1 million during the year ended December 31, 2017.2018. The total fair value of the swap liability as of December 31, 20172018 was $14.0$6.8 million and is recorded as a component of OtherNon-Current liabilities within the accompanying consolidated balance sheet. There was no material ineffectiveness for the periods presented. We do not expect tomay enter into any transactionsa debt refinancing transaction during the next twelve months which wouldcould result in the reclassification into earnings or losses amounts associated with these swaps currently reported in accumulated other comprehensive income (loss).
Additionally, upon completion and commercial acceptance of the prison project in November 2017, the State, in accordance with the prison contract, made a lump sum payment of AUD 310 million, or $242.0 million, based on exchange rates at December 31, 2017, towards a portion of the outstanding balance which was used to pay down the principal of thenon-recourse debt. Our Australian subsidiary had also entered into interest rate cap agreements in September 2014 giving us the option to cap the interest rate on our variablenon-recourse debt related to the project in the event that the completion of the prison project was delayed which could have delayed the State’s payment. These instruments did not meet the requirements for hedge accounting, and therefore, changes in fair value of the interest rate caps were recorded in earnings which was not significant during 2017, 2016 or 2015. As the project was not delayed and the State’s payment was received according to schedule, these interest rate cap assets were not put into effect.
Refer to Note8-Derivative 8 — Derivative Financial Instruments in the notes to our audited consolidated financial statements included in Part II, Item 8 of this Annual Report on Form10-K for further information.
Contractual Obligations
The following is a table of certain of our contractual obligations, as of December 31, 2017,2018, which requires us to make payments over the periods presented.
| Payments Due by Period | Payments Due by Period | |||||||||||||||||||||||||||||||||||||||
Contractual Obligations | Total | Less Than 1 Year | 1-3 Years | 3-5 Years | More Than 5 Years | Total | Less Than 1 Year | 1-3 Years | 3-5 Years | More Than 5 Years | ||||||||||||||||||||||||||||||
| (In thousands) | (In thousands) | |||||||||||||||||||||||||||||||||||||||
Long-Term Debt | $ | 1,152,729 | $ | 498 | $ | 732 | $ | 250,275 | $ | 901,224 | $ | 1,152,469 | $ | 527 | $ | 455 | $ | 550,363 | $ | 601,124 | ||||||||||||||||||||
Term Loan | 794,000 | 8,000 | 16,000 | 16,000 | 754,000 | 786,000 | 8,000 | 16,000 | 16,000 | 746,000 | ||||||||||||||||||||||||||||||
Revolver | 270,559 | — | — | 270,559 | — | 490,843 | — | 490,843 | — | — | ||||||||||||||||||||||||||||||
Capital Lease Obligations (includes imputed interest) | 8,973 | 1,936 | 3,868 | 3,169 | — | 7,037 | 1,934 | 3,870 | 1,233 | — | ||||||||||||||||||||||||||||||
Operating Lease Obligations | 170,180 | 47,112 | 56,283 | 18,982 | 47,803 | 178,000 | 49,000 | 53,000 | 27,000 | 49,000 | ||||||||||||||||||||||||||||||
Non-Recourse Debt | 394,008 | 19,050 | 27,933 | 24,845 | 322,180 | 341,074 | 325,344 | 15,730 | — | — | ||||||||||||||||||||||||||||||
Estimated interest payments on debt (a) | 1,071,037 | 116,616 | 248,466 | 220,814 | 485,141 | 629,253 | 145,491 | 234,937 | 173,096 | 75,729 | ||||||||||||||||||||||||||||||
Estimated funding of pension and other post retirement benefits | 32,820 | 8,642 | 1,649 | 1,716 | 20,813 | 32,474 | 9,105 | 1,756 | 1,721 | 19,892 | ||||||||||||||||||||||||||||||
Estimated construction commitments | 149,400 | 142,400 | 7,000 | — | — | 44,500 | 39,500 | 5,000 | — | — | ||||||||||||||||||||||||||||||
|
|
|
|
|
|
|
|
|
| |||||||||||||||||||||||||||||||
Total | $ | 4,043,706 | $ | 344,254 | $ | 361,931 | $ | 806,360 | $ | 2,531,161 | $ | 3,661,650 | $ | 578,901 | $ | 821,591 | $ | 769,413 | $ | 1,491,745 | ||||||||||||||||||||
|
|
|
|
|
|
|
|
|
| |||||||||||||||||||||||||||||||
| (a) | Due to the uncertainties of future LIBOR rates, the variable interest payments on our Senior Credit Facility were calculated using an average LIBOR rate of |
Cash Flow
Cash, cash equivalents, restricted cash and cash equivalents as of December 31, 20172018 was $81.4$84.5 million, compared to $68.0$133.5 million as of December 31, 20162017 and was impacted by the following:
Cash provided by (used in) operating activities in 2018, 2017 and 2016 and 2015 was $274.5 million, $381.0 million, and $(28.0) million, respectively. Cash provided by operating activities in 2018 was positively impacted bynon-cash expenses such as depreciation and $142.2amortization, deferred tax provision, amortization of debt issuance costs, discount and/or premium and othernon-cash interest, stock-based compensation expense and dividends received from our unconsolidated joint venture. Equity in earnings of affiliates negatively impacted cash. Changes in accounts receivable, prepaid expenses and other assets increased in total by a net of $66.1 million, respectively. representing a negative impact on cash. The decrease was primarily driven by the timing of billings and collections. Changes in accounts payable, accrued expenses and other liabilities increased by $31.7 million which positively impacted cash. The increase was primarily due to the timing of payments. Additionally, cash provided by operating activities in 2018 was positively impacted by a decrease in contract receivable of $2.0 million. This decrease relates to payments received related to the Ravenhall Project. Refer to Note 7 — Contract Receivable included in the notes to our audited consolidated financial statements included in Part II, Item 8 of this Annual Report on Form10-K.
Cash provided by operating activities in 2017 was positively impacted bynon-cash expenses such as depreciation and amortization, deferred tax provision, amortization of debt issuance costs, discount and/or premium and othernon-cash interest, stock-based compensation expense and dividends received from our unconsolidated joint venture. Equity in earnings of affiliates negatively impacted cash. Changes in accounts receivable, prepaid expenses and other assets decreased in total by a net of $20.9 million, representing a positive impact on cash. The decrease was primarily driven by the timing of billings and collections. Changes in accounts payable, accrued expenses and other liabilities increased by $2.4 million which positively impacted cash. The increase was primarily due to the timing of payments. Additionally, cash provided by operating activities in 2017 was positively impacted by a decrease in contract receivable of $40.5 million. This decrease relates to payments received related to the Ravenhall Project. Refer to Note 7 — Contract Receivable included in the notes to our audited consolidated financial statements included in Part II, Item 8 of this Annual Report on Form10-K.
Cash used in operating activities in 2016 was positively impacted bynon-cash expenses such as depreciation and amortization, amortization of debt issuance costs, discount and/or premium and othernon-cash interest, stock-based compensation expense and dividends received from our unconsolidated joint venture. Equity in earnings of affiliates negatively impacted cash. Changes in accounts receivable, prepaid expenses and other assets increased in total by a net of $50.9 million, representing a negative impact on cash. The increase was primarily driven by new contract activations. The remaining change is due to the timing of billings and collections. Changes in accounts payable, accrued expenses and other liabilities increased by $5.6 million which positively impacted cash. The increase was primarily due to new contract activations as well as the timing of payments. Additionally, cash used in operating activities from continuing operations in 2016 was negatively impacted by an increase in contract receivable of $280.6 million. This increase relates to costs incurred and estimated earnings in excess of billings related to the Ravenhall Project. Refer to
Note 7 — Contract Receivable included in the notes to our audited consolidated financial statements included in Part II, Item 8 of this Annual Report on Form10-K. The Contract Receivable is expected to grow as construction services are performed and will continue to have a negative impact on cash from operating activities until the balance is ultimately settled with the State. In accordance with the contract, the project will not be billed out until completion and commercial acceptance of the facility.
Cash provided by operating activities in 2015 was positively impacted bynon-cash expenses such as depreciation and amortization, amortization of debt issuance costs, stock-based compensation expense, exit charges related tonon-core operating leases and dividends received from our unconsolidated joint venture. Equity in earnings of affiliates negatively impacted cash. Changes in accounts receivable, prepaid expenses and other assets increased in total by a net of $29.3 million, representing a negative impact on cash. The increase was primarily driven by our acquisition of LCS in 2015 as well as new contract activations. The remaining change is due to the timing of billings and collections. Changes in accounts payable, accrued expenses and other liabilities increased by $21.9 million which positively impacted cash. The increase was primarily due to our acquisition of LCS in 2015 as well as new contract activations. Additionally, cash provided by operating activities in 2015 was negatively impacted by an increase in contract receivable of $114.1 million. This increase relates to costs incurred and estimated earnings in excess of billings related to the Ravenhall Project. Refer to Note 7 — Contract Receivable included in the notes to our audited consolidated financial statements included in Part II, Item 8 of this Annual Report on Form10-K. The Contract Receivable is expected to grow as construction services are performed and will continue to have a negative impact on cash from operating activities until the balance is ultimately settled with the State. In accordance with the contract, the project will not be billed out until completion and commercial acceptance of the facility.
Cash used in investing activities of $529.4$188.5 million in 2018 was primarily the result of capital expenditures of $195.7 million, offset by insurance proceeds from damaged property primarily related to hurricanes of $1.4 million, proceeds from sale of assets held for sale of $3.8 million and proceeds from the sale of property and equipment of $2.1 million. Cash used in investing activities of $500.3 million in 2017 was primarily the result of
our acquisition of CEC of $353.6 million as well as capital expenditures of $148.4 million, offset by changes in restricted cash of $(33.7) million. Cash used in investing activities of $84.4$77.7 million in 2016 was primarily the result of capital expenditures of $81.6 million, offset by changes in restricted cashinsurance proceeds from damage property of $(9.6)$4.7 million.
Cash used in investingfinancing activities in 2018 reflects payments of $452.9$289.3 million in 2015 was primarily the result of capital expenditures of $117.6 million,on long term debt offset by changes in restricted$503.0 million of proceeds from long term debt and payments onnon-recourse debt of $11.6 million. We also paid cash dividends of $4.8 million. and our acquisitions of LCS and Soberlink of $307.4$229.5 million and $24.4 million, respectively.debt issuance costs of $1.0 million.
Cash provided by financing activities in 2017 reflects payments of $1,140.8 million on long term debt offset by $1,389.1 million of proceeds from long term debt, payments onnon-recourse debt of $307.4 million and $181.7 million of proceeds fromnon-recourse debt. We also received proceeds from our common stock offering of $275.9 million, paid cash dividends of $227.5 million and debt issuance costs of $9.5 million.
Cash provided by financing activities in 2016 reflects payments of $934.0 million on long term debt offset by $1,012.9 million of proceeds from long term debt and $266.8 million of proceeds fromnon-recourse debt. We also paid cash dividends of $194.7 million and debt issuance costs of $21.1 million.
Cash provided by financing activities in 2015 reflects payments of $323.9 million on long term debt andnon-recourse debt offset by $848.4 million of proceeds from long term debt andnon-recourse debt, including $631.0 million of borrowings under our prior revolver. We also paid cash dividends of $187.0 million and debt issuance costs of $7.1 million.
Inflation
We believe that inflation, in general, did not have a material effect on our results of operations during 2018, 2017 2016 and 2015.2016. While some of our contracts include provisions for inflationary indexing, inflation could have a substantial adverse effect on our results of operations in the future to the extent that wages and salaries, which represent our largest recurring/fixed expense, increase at a faster rate than the per diem or fixed rates received by us for our management services.
Funds from Operations
Funds from Operations (“FFO”) is a widely accepted supplementalnon-GAAP measure utilized to evaluate the operating performance of real estate companies. It is defined in accordance with the standards established by the National Association of Real Estate Investment Trusts, or NAREIT, which defines FFO as net income (loss) attributable to common shareholders (computed in accordance with United States Generally Accepted Accounting Principles), excluding real estate related depreciation and amortization, excluding gains and losses from the cumulative effects of accounting changes, extraordinary items and sales of properties, and including adjustments for unconsolidated partnerships and joint ventures.
We also present Normalized Funds From Operations, or Normalized FFO, and Adjusted Funds from Operations, or AFFO, as supplementalnon-GAAP financial measures of real estate companies’ operating performances.
Normalized FFO is defined as FFO adjusted for certain items which by their nature are not comparable from period to period or that tend to obscure the Company’s actual operating performance, including for the periods presented M&A related expenses,pre-tax,start-up expenses, net of tax,pre-tax, loss on extinguishment of debt, net of tax,legal related expenses,non-recurringpre-tax, tax benefits,escrow releases,pre-tax,close-out expenses,pre-tax, the net Tax Cuts and Jobs Act impact and tax effect of adjustments to funds from operations.
AFFO is defined as Normalized FFO adjusted by addingnon-cash expenses such asnon-real estate related depreciation and amortization, stock based compensation expense, the amortization of debt issuance costs, discount and/or premium and othernon-cash interest, and by subtracting recurring consolidated maintenance capital expenditures.
Because of the unique design, structure and use of our correctional facilities, we believe that assessing the performance of our correctional facilities without the impact of depreciation or amortization is useful and
meaningful to investors. Although NAREIT has published its definition of FFO, companies often modify this definition as they seek to provide financial measures that meaningfully reflect their distinctive operations. We have modified FFO to derive Normalized FFO and AFFO that meaningfully reflect our operations.
Our assessment of our operations is focused on long-term sustainability. The adjustments we make to derive thenon-GAAP measures of Normalized FFO and AFFO exclude items which may cause short-term fluctuations in net income attributable to GEO but have no impact on our cash flows, or we do not consider them to be fundamental attributes or the primary drivers of our business plan and they do not affect our overall long-term operating performance.
We may make adjustments to FFO from time to time for certain other income and expenses that do not reflect a necessary component of our operational performance on the basis discussed above, even though such items may require cash settlement. Because FFO, Normalized FFO and AFFO exclude depreciation and amortization unique to real estate as well asnon-operational items and certain other charges that are highly variable from year to year, they provide our investors with performance measures that reflect the impact to operations from trends in occupancy rates, per diem rates, operating costs and interest costs, providing a perspective not immediately apparent from income from continuing operations.
We believe the presentation of FFO, Normalized FFO and AFFO provide useful information to investors as they provide an indication of our ability to fund capital expenditures and expand our business. FFO, Normalized FFO and AFFO provide disclosure on the same basis as that used by our management and provide consistency in our financial reporting, facilitate internal and external comparisons of our historical operating performance and our business units and provide continuity to investors for comparability purposes. Additionally, FFO, Normalized FFO and AFFO are widely recognized measures in our industry as a real estate investment trust.
Our reconciliation of net income to FFO, Normalized FFO and AFFO for the years ended December 31, 20172018 and 2016,2017, respectively, is as follows (in thousands):
| December 31, 2017 | December 31, 2016 | December 31, 2018 | December 31, 2017 | |||||||||||||
Funds From Operations | ||||||||||||||||
Net income attributable to The GEO Group, Inc. | $ | 146,241 | $ | 148,715 | $ | 145,089 | $ | 146,241 | ||||||||
Depreciation-real estate assets | $ | 65,723 | 61,179 | 70,592 | 65,723 | |||||||||||
Gain on sale of real estate assets, net of tax | $ | (261 | ) | (952 | ) | 4,347 | (261 | ) | ||||||||
|
|
|
| |||||||||||||
NAREIT Defined FFO | 211,703 | 208,942 | $ | 220,028 | $ | 211,703 | ||||||||||
|
|
|
| |||||||||||||
Non-recurring tax benefits | — | (2,031 | ) | |||||||||||||
Net Tax Cuts and Jobs Act Impact | 9,584 | — | 304 | 9,584 | ||||||||||||
Start-up expenses, net of tax | — | 1,190 | ||||||||||||||
Loss on extinguishment of debt, net of tax | — | 15,885 | ||||||||||||||
M&A related expenses | 19,059 | — | ||||||||||||||
Start-up expenses,pre-tax | 6,299 | — | ||||||||||||||
Loss on extinguishment of debt | 574 | — | ||||||||||||||
Legal related expenses,pre-tax | 7,147 | — | ||||||||||||||
Escrow releases,pre-tax | (2,273 | ) | — | |||||||||||||
Close-out expenses,pre-tax | 4,245 | — | ||||||||||||||
M&A related expenses,pre-tax | — | 19,059 | ||||||||||||||
Tax effect of adjustments to funds from operations * | (4,274 | ) | — | (2,031 | ) | (4,274 | ) | |||||||||
|
|
|
| |||||||||||||
Normalized Funds from Operations | $ | 236,072 | $ | 223,986 | $ | 234,293 | $ | 236,072 | ||||||||
|
|
|
| |||||||||||||
Depreciation-non-real estate assets | 58,574 | 53,737 | ||||||||||||||
Depreciation andamortization-non-real estate assets | 55,842 | 58,574 | ||||||||||||||
Consolidated maintenance capital expenditures | (23,371 | ) | (23,419 | ) | (22,638 | ) | (23,371 | ) | ||||||||
Stock-based compensation expenses | 19,844 | 12,773 | 22,049 | 19,844 | ||||||||||||
Amortization of debt issuance costs, discount and/or premium and othernon-cash interest | 16,540 | 12,121 | 8,282 | 16,540 | ||||||||||||
|
|
|
| |||||||||||||
Adjusted Funds from Operations | $ | 307,659 | $ | 279,198 | $ | 297,828 | $ | 307,659 | ||||||||
|
|
|
| |||||||||||||
| * | Tax adjustments relate tostart-up expenses, M&A related expenses, legal related expenses, escrow releases, andclose-out expenses. |
Outlook
The following discussion of our future performance contains statements that are not historical statements and, therefore, constitute forward-looking statements within the meaning of the Private Securities Litigation Reform Act of 1995. Our forward-looking statements are subject to risks and uncertainties that could cause actual results to differ materially from those stated or implied in the forward-looking statement. Please refer to “Item 1A. Risk Factors” in this Annual Report onForm 10-K, the “Forward-Looking Statements — Safe Harbor,” as well as the other disclosures contained in this Annual Report onForm 10-K, for further discussion on forward-looking statements and the risks and other factors that could prevent us from achieving our goals and cause the assumptions underlying the forward-looking statements and the actual results to differ materially from those expressed in or implied by those forward-looking statements.
Revenue
Revenue
We continue to be encouraged by the current landscape of growth opportunities; however, any positive trends may, to some extent, be adversely impacted by government budgetary constraints or any changes to thea government’s willingness to maintain or grow public-private partnerships in the future. While state finances overall are stable, future budgetary pressures may cause state correctional agencies to pursue a number of cost savings initiatives which may include reductions in per diem rates and/or the scope of services provided by private operators. These potential cost savings initiatives could have a material adverse impact on our current operations and/or our ability to pursue new business opportunities. Additionally, if state finances worsen,budgetary constraints, as discussed above, persist or intensify, our state customers’ ability to pay us may be impaired and/or we may be forced to renegotiate our management contracts on less favorable terms and our financial condition, results of operations or cash flows could be materially adversely impacted. We plan to actively bid on any new projects that fit our target profile for profitability and operational risk. Although we are pleased with the overall industry outlook, positive trends in
the industry may be offset by several factors, including budgetary constraints, contract modifications, contract terminations, contractnon-renewals, and/or contractre-bids and the impact of any other potential changes to the willingness to maintain or grow public-private partnerships on the part of other government agencies. We believe we have a strong relationship with our government partners and we believe that we operate facilities that maximize security and efficiency while offering our suite of GEO Continuum of Care services and resources.
Although we have historically had a relatively high contract renewal rate, there can be no assurance that we will be able to renew our expiring management contracts on favorable terms, or at all. Also, while we are pleased with our track record inre-bid situations, we cannot assure that we will prevail in any such future situations.
Internationally, we are exploring a number of opportunities in our current markets and will continue to actively bid on any opportunities that fit our target profile for profitability and operational risk. In September 2014, we announced that a consortium led by us and comprised of The GEO Group Australia Pty. Ltd., John Holland Construction and Honeywell signed a contract with the Department of Justice in the State of Victoria for the development and operation of a1,300-bed capacity prisoncorrectional facility in Ravenhall, Australia. The Ravenhall facility was developed under a public-private partnership financing structure with a capital contribution from us, which was made in January 2017, of approximately AUD 115 million, or $89.8$81.1 million, based on exchange rates as of December 31, 2017,2018, and we anticipate returns on investment consistent with our company-owned facilities. The project achieved operational readiness and began operationswas completed during the fourth quarter of 2017.2017 and is now operational. On March 29, 2018, we announced that our transportation joint venture in the United Kingdom, GEO Amey, has signed a contract with Scottish Prison Service for the provision of court custody and prisoner escort services in Scotland. The contract will have a base term of eight years effective January 26, 2019 with a renewal option of four years and is expected to have an average annual revenue of approximately $39 million. With respect to the Parklea Center in Australia, we were unfortunately unsuccessful during the current competitive rebid process and will be transitioning the management contract in March of 2019.
With respect to our reentry services, electronic monitoring services, and youth services business conducted through our GEO Care business segment, we are currently pursuing a number of business development opportunities. Relative to opportunities for community-based reentry services, we are working with our existing federal, state, and local correctional clients to leverage new opportunities for both residential reentry facilities as well asnon-residential day reporting centers. We continue to expend resources on informing federal, state and local governments about the benefits of public-private partnerships, and we anticipate that there will be new opportunities in the future as those efforts continue to yield results. We believe we are well positioned to capitalize on any suitable opportunities that become available in this area.
Operating Expenses
Operating expenses consist of those expenses incurred in the operation and management of our contracts to provide services to our governmental clients. Labor and related cost represented approximately 51%54% of our operating expenses in 2017.2018. Additional significant operating expenses include food, utilities and inmate medical costs. In 2017,2018, operating expenses totaled approximately 75% of our consolidated revenues. Our operating expenses as a percentage of revenue in 20172019 will be impacted by the opening of any new or existing facilities as a result of the cost of transitioning and/orstart-up operations related to a facility opening. During 2018,2019, we will incur carrying costs for facilities that are currentlywere vacant in 2017.2018. As of December 31, 2017,2018, our worldwide operations include the management and/or ownership of approximately 96,000 beds at 141135 correctional, detention and community services facilities, including idle facilities and projects under development, and also included the provision of monitoring of approximately 192,000210,000 offenders in a community-based environment on behalf of approximately 900 federal, state and local correctional agencies located in all 50 states.
General and Administrative Expenses
General and administrative expenses consist primarily of corporate management salaries and benefits, professional fees and other administrative expenses. In 2017,2018, general and administrative expenses totaled approximately 8% of our consolidated revenues. We expect general and administrative expenses as a percentage of revenue in 20182019 to remain consistent or decrease as a result of cost savings initiatives. We expect business development costs to remain consistent as we pursue additional business development opportunities in all of our business lines. We also plan to continue expending resources from time to time on the evaluation of potential acquisition targets.
Idle Facilities
We are currently marketing approximately 5,4004,700 vacant beds at fivefour of our idle facilities in our U.S. Correction & Detention segment to potential customers. The annual carrying cost of these idle facilities in 20182019 is estimated to be $18.8$17.3 million, including depreciation expense of $4.6$3.9 million. As of December 31, 2017,2018, these facilities had a net book value of $139.6$126.0 million. We currently do not have any firm commitment or agreement in place to activate these facilities. Historically, some facilities have been idle for multiple years before they received a new contract award. These idle facilities are included in the U.S. Corrections & Detention segment. The per diem rates that we charge our clients often vary by contract across our portfolio. However, if all of these idle facilities were to be activated using our U.S. Corrections & Detention average per diem rate in 2017,2018, (calculated as the U.S. Corrections & Detention revenue divided by the number of U.S. Corrections & Detention mandays) and based on the average occupancy rate in our U.S. Corrections & Detention facilities for 2017,2018, we would expect to receive incremental revenue of approximately $118$106 million and an increase in earnings per share of approximately $.15 to $.20 per share based on our average U.S. Corrections and Detention operating margin.
Forward-Looking Statements — Safe Harbor
This Annual Report onForm 10-K and the documents incorporated by reference herein contain “forward-looking” statements within the meaning of Section 27A of the Securities Act of 1933, as amended, and
Section 21E of the Securities Exchange Act of 1934, as amended. “Forward-looking” statements are any statements that are not based on historical information. Statements other than statements of historical facts included in this report, including, without limitation, statements regarding our future financial position, business strategy, budgets, projected costs and plans and objectives of management for future operations, are “forward-looking” statements. Forward-looking statements generally can be identified by the use of forward-looking terminology such as “may,” “will,” “expect,” “anticipate,” “intend,” “plan,” “believe,” “seek,” “estimate” or “continue” or the negative of such words or variations of such words and similar expressions. These statements are not guarantees of future performance and involve certain risks, uncertainties and assumptions, which are difficult to predict. Therefore, actual outcomes and results may differ materially from what is expressed or forecasted in such forward-looking statements and we can give no assurance that such forward-looking statements will prove to be correct. Important factors that could cause actual results to differ materially from those expressed or implied by the forward-looking statements, or “cautionary statements,” include, but are not limited to:
our ability to timely build and/or open facilities as planned, profitably manage such facilities and successfully integrate such facilities into our operations without substantial additional costs;
our ability to remain qualified for taxation as a REIT;
our ability to fulfill our debt service obligations and its impact on our liquidity;
the instability of foreign exchange rates, exposing us to currency risks in Australia, the United Kingdom, and South Africa, or other countries in which we may choose to conduct our business;
our ability to activate the inactive beds at our idle facilities;
our ability to maintain or increase occupancy rates at our facilities;
an increase in unreimbursed labor rates;
our ability to expand, diversify and grow our correctional, detention, mental health, residential treatment, reentry, community-based services, youth services, monitoring services, evidence-based supervision and treatment programs and secure transportation services businesses;
our ability to win management contracts for which we have submitted proposals, retain existing management contracts and meet any performance standards required by such management contracts;
our ability to control operating costs associated with contractstart-ups;
our ability to estimate the government’s level of dependency on public-private partnership correctional services;
our ability to accurately project the size and growth of the U.S. and international public-private partnership corrections industry;
our ability to successfully respond to delays encountered by states utilizing public-privatepublic-priate partnership correctional services and cost savings initiatives implemented by a number of states;
our ability to develop long-term earnings visibility;
our ability to identify suitable acquisitions and to successfully complete and integrate such acquisitions on satisfactory terms, and estimate the synergies to be achieved as a result of such acquisitions;
our exposure to the impairment of goodwill and other intangible assets as a result of our acquisitions;
our ability to successfully conduct our operations through joint ventures and consortiums;
our ability to obtain future financing on satisfactory terms or at all, including our ability to secure the funding we need to complete ongoing capital projects;
our exposure to political and economic instability and other risks impacting our international operations;
our exposure to risks impacting our information systems, including those that may cause an interruption, delay or failure in the provision of our services;
our exposure to rising general insurance costs;
our exposure to state and federal income tax law changes internationally and domestically, including the recently enacted Tax Cuts and Jobs Act, and our exposure as a result of federal and international examinations of our tax returns or tax positions;
our exposure to claims for which we are uninsured;
our exposure to rising employee and inmate medical costs;
our ability to manage costs and expenses relating to ongoing litigation arising from our operations;
our ability to accurately estimate on an annual basis, loss reserves related to general liability, workers’ compensation and automobile liability claims;
the ability of our government customers to secure budgetary appropriations to fund their payment obligations to us and to continue to operate under our existing agreements and/or renew our existing agreements;
our ability to pay quarterly dividends consistent with our expectations;
our ability to comply with government regulations and applicable contractual requirements;
our ability to acquire, protect or maintain our intellectual property; and
other factors contained in our filings with the Securities and Exchange Commission, or the SEC, including, but not limited to, those detailed in this Annual Report onForm 10-K, our Quarterly Reports onForm 10-Q and our Current Reports onForm 8-K filed with the SEC.
We undertake no obligation to update publicly any forward-looking statements, whether as a result of new information, future events or otherwise.otherwise, except as required by law. All subsequent written and oral forward-looking statements attributable to us, or persons acting on our behalf, are expressly qualified in their entirety by the cautionary statements included in this report.
| Item 7A. | Quantitative and Qualitative DisclosuresAbout Market Risk |
Interest Rate Risk
We are exposed to market risks related to changes in interest rates with respect to our Senior Credit Facility.senior credit facility. Payments under the Senior Credit Facility are indexed to a variable interest rate. Based on borrowings outstanding as of December 31, 20172018 under the Senior Credit Facility of $1,064.6$1,276.8 million, for every one percent increase in the interest rate applicable to the Senior Credit Facility, our total annual interest expense would increase by approximately $10.6$12.8 million.
We have entered into certain interest rate swap arrangements for hedging purposes, fixing the interest rate on our Australiannon-recourse debt. The difference between the floating rate and the swap rate on these instruments is recognized in interest expense within the respective entity. Because the interest rates with respect to these instruments are fixed, a hypothetical 100 basis point change in the current interest rate would not have a material impact on our financial condition or results of operations.
Additionally, we invest our cash in a variety of short-term financial instruments to provide a return. These instruments generally consist of highly liquid investments with original maturities at the date of purchase of three
months or less. While these instruments are subject to interest rate risk, a hypothetical 100 basis point increase or decrease in market interest rates would not have a material impact on our financial condition or results of operations.
Foreign Currency Exchange Rate Risk
We are exposed to market risks related to fluctuations in foreign currency exchange rates between the U.S. Dollar, the Australian Dollar, the South African Rand and the British Pound currency exchange rates. Based upon our foreign currency exchange rate exposure as of December 31, 20172018 with respect to our international operations, every 10 percent change in historical currency rates would have a $4.1$4.5 million effect on our financial position and a $1.9$0.5 million impact on our results of operations over the next fiscal year.
| Item 8. | Financial Statements and Supplementary Data |
MANAGEMENT’S RESPONSIBILITY FOR FINANCIAL STATEMENTS
To the Shareholders of
The GEO Group, Inc.:
The accompanying consolidated financial statements have been prepared in conformity with accounting principles generally accepted in the United States. They include amounts based on judgments and estimates.
Representation in the consolidated financial statements and the fairness and integrity of such statements are the responsibility of management. In order to meet management’s responsibility, the Company maintains a system of internal controls and procedures and a program of internal audits designed to provide reasonable assurance that our assets are controlled and safeguarded, that transactions are executed in accordance with management’s authorization and properly recorded, and that accounting records may be relied upon in the preparation of financial statements.
The consolidated financial statements have been audited by Grant Thornton LLP, independent registered public accountants, whose appointment by our Audit Committee was ratified by our shareholders. Their report, which is included in this Form10-K, expresses an opinion as to whether management’s consolidated financial statements present fairly in all material respects, the Company’s financial position, results of operations and cash flows for each of the three years in the period ended December 31, 20172018 in conformity with accounting principles
generally accepted in the United States of America. The effectiveness of our internal control over financial reporting as of December 31, 20172018 has also been audited by Grant Thornton LLP, independent registered public accountants, as stated in their report which is included in thisForm 10-K. Their audits were conducted in accordance with the standards of the Public Company Accounting Oversight Board (United States).
The Audit Committee of the Board of Directors meets periodically with representatives of management, the independent registered public accountants and our internal auditors to review matters relating to financial reporting, internal accounting controls and auditing. Both the internal auditors and the independent registered certified public accountants have unrestricted access to the Audit Committee to discuss the results of their examinations.
George C. Zoley
Chairman and Chief Executive Officer
Brian R. Evans
Senior Vice President and Chief Financial Officer
MANAGEMENT’S ANNUAL REPORT ON INTERNAL CONTROL OVER FINANCIAL REPORTING
Our management is responsible for establishing and maintaining adequate internal control over financial reporting as defined inRules 13a-15(f) and15d-15(f) under the Securities Exchange Act of 1934. The Company’s internal control over financial reporting is a process designed under the supervision of the Company’s Chief Executive Officer and Chief Financial Officer that: (i) pertains to the maintenance of records that, in reasonable detail, accurately and fairly reflect the transactions and dispositions of the Company’s assets; (ii) provides reasonable assurance that transactions are recorded as necessary to permit preparation of financial statements for external reporting in accordance with accounting principles generally accepted in the United States, and that receipts and expenditures are being made only in accordance with authorization of the Company’s management and directors; and (iii) provides reasonable assurance regarding prevention or timely detection of unauthorized acquisition, use or disposition of the Company’s assets that could have a material effect on the financial statements.
Because of its inherent limitations, internal control over financial reporting may not prevent or detect misstatements. Also, projections of any evaluation of effectiveness to future periods are subject to the risk that controls may become inadequate because of changes in conditions, or that the degree of compliance with the policies or procedures may deteriorate. Management has assessed the effectiveness of the Company’s internal control over financial reporting as of December 31, 2017.2018. In making its assessment of internal control over financial reporting, management used the criteria set forth in the Internal Control — Integrated Framework issued by the 2013 Committee of Sponsoring Organizations of the Treadway Commission (“COSO”) (the “2013 Internal Control — Integrated Framework”).
The Company evaluated, with the participation of its Chief Executive Officer and Chief Financial Officer, its internal control over financial reporting as of December 31, 2017,2018, based on the 2013 Internal Control — Integrated Framework. Based on this evaluation, the Company’s management concluded that as of December 31, 2017,2018, its internal control over financial reporting is effective in providing reasonable assurance regarding the reliability of financial reporting and the preparation of financial statements for external purposes in accordance with generally accepted accounting principles.
Grant Thornton LLP, the independent registered public accounting firm that audited the financial statements included in this Annual Report onForm 10-K, has issued an attestation report on our internal control over financial reporting as of December 31, 2017.2018.
REPORT OF INDEPENDENT REGISTERED PUBLIC ACCOUNTING FIRM
Board of Directors and Shareholders
The GEO Group, Inc.
Opinion on internal control over financial reporting
We have audited the internal control over financial reporting of The GEO Group, Inc. (a Florida corporation) and subsidiaries (the “Company”) as of December 31, 2017, based on criteria established in the 2013 Internal Control-Integrated Framework issued by the Committee of Sponsoring Organizations of the Treadway Commission (COSO). In our opinion, the Company maintained, in all material respects, effective internal control over financial reporting as of December 31, 2017, based on criteria established in the 2013Internal Control-Integrated Framework issued by COSO.
We also have audited, in accordance with the standards of the Public Company Accounting Oversight Board (United States) (“PCAOB”), the consolidated financial statements of the Company as of and for the year ended December 31, 2017, and our report dated February 26, 2018 expressed an unqualified opinion on those financial statements.
Basis for opinion
The Company’s management is responsible for maintaining effective internal control over financial reporting and for its assessment of the effectiveness of internal control over financial reporting, included in the accompanying Management’s Annual Report on Internal Control Over Financial Reporting. Our responsibility is to express an opinion on the Company’s internal control over financial reporting based on our audit.
We are a public accounting firm registered with the PCAOB and are required to be independent with respect to the Company in accordance with the U.S. federal securities laws and the applicable rules and regulations of the Securities and Exchange Commission and the PCAOB.
We conducted our audit in accordance with the standards of the PCAOB. Those standards require that we plan and perform the audit to obtain reasonable assurance about whether effective internal control over financial reporting was maintained in all material respects. Our audit included obtaining an understanding of internal control over financial reporting, assessing the risk that a material weakness exists, testing and evaluating the design and operating effectiveness of internal control based on the assessed risk, and performing such other procedures as we considered necessary in the circumstances. We believe that our audit provides a reasonable basis for our opinion.
Definition and limitations of internal control over financial reporting
A company’s internal control over financial reporting is a process designed to provide reasonable assurance regarding the reliability of financial reporting and the preparation of financial statements for external purposes in accordance with generally accepted accounting principles. A company’s internal control over financial reporting includes those policies and procedures that (1) pertain to the maintenance of records that, in reasonable detail, accurately and fairly reflect the transactions and dispositions of the assets of the company; (2) provide reasonable assurance that transactions are recorded as necessary to permit preparation of financial statements in accordance with generally accepted accounting principles, and that receipts and expenditures of the company are being made only in accordance with authorizations of management and directors of the company; and (3) provide reasonable assurance regarding prevention or timely detection of unauthorized acquisition, use, or disposition of the company’s assets that could have a material effect on the financial statements.
Because of its inherent limitations, internal control over financial reporting may not prevent or detect misstatements. Also, projections of any evaluation of effectiveness to future periods are subject to the risk that controls may become inadequate because of changes in conditions, or that the degree of compliance with the policies or procedures may deteriorate.
/s/ GRANT THORNTON LLP
Miami, Florida
February 26, 2018
REPORT OF INDEPENDENT REGISTERED PUBLIC ACCOUNTING FIRM
Board of Directors and Shareholders
The GEO Group, Inc.
Opinion on internal control over financial reporting
We have audited the internal control over financial reporting of The GEO Group, Inc. (a Florida corporation) and subsidiaries (the “Company”) as of December 31, 2018, based on criteria established in the 2013 Internal Control-Integrated Framework issued by the Committee of Sponsoring Organizations of the Treadway Commission (COSO). In our opinion, the Company maintained, in all material respects, effective internal control over financial reporting as of December 31, 2018, based on criteria established in the 2013Internal Control-Integrated Framework issued by COSO.
We also have audited, in accordance with the standards of the Public Company Accounting Oversight Board (United States) (“PCAOB”), the consolidated financial statements of the Company as of and for the year ended December 31, 2018, and our report dated February 25, 2019 expressed an unqualified opinion on those financial statements.
Basis for opinion
The Company’s management is responsible for maintaining effective internal control over financial reporting and for its assessment of the effectiveness of internal control over financial reporting, included in the accompanying Management’s Annual Report on Internal Control Over Financial Reporting. Our responsibility is to express an opinion on the Company’s internal control over financial reporting based on our audit. We are a public accounting firm registered with the PCAOB and are required to be independent with respect to the Company in accordance with the U.S. federal securities laws and the applicable rules and regulations of the Securities and Exchange Commission and the PCAOB.
We conducted our audit in accordance with the standards of the PCAOB. Those standards require that we plan and perform the audit to obtain reasonable assurance about whether effective internal control over financial reporting was maintained in all material respects. Our audit included obtaining an understanding of internal control over financial reporting, assessing the risk that a material weakness exists, testing and evaluating the design and operating effectiveness of internal control based on the assessed risk, and performing such other procedures as we considered necessary in the circumstances. We believe that our audit provides a reasonable basis for our opinion.
Definition and limitations of internal control over financial reporting
A company’s internal control over financial reporting is a process designed to provide reasonable assurance regarding the reliability of financial reporting and the preparation of financial statements for external purposes in accordance with generally accepted accounting principles. A company’s internal control over financial reporting includes those policies and procedures that (1) pertain to the maintenance of records that, in reasonable detail, accurately and fairly reflect the transactions and dispositions of the assets of the company; (2) provide reasonable assurance that transactions are recorded as necessary to permit preparation of financial statements in accordance with generally accepted accounting principles, and that receipts and expenditures of the company are being made only in accordance with authorizations of management and directors of the company; and (3) provide reasonable assurance regarding prevention or timely detection of unauthorized acquisition, use, or disposition of the company’s assets that could have a material effect on the financial statements.
Because of its inherent limitations, internal control over financial reporting may not prevent or detect misstatements. Also, projections of any evaluation of effectiveness to future periods are subject to the risk that controls may become inadequate because of changes in conditions, or that the degree of compliance with the policies or procedures may deteriorate.
/s/ GRANT THORNTON LLP
Miami, Florida
February 25, 2019
REPORT OF INDEPENDENT REGISTERED PUBLIC ACCOUNTING FIRM
Board of Directors and Shareholders
The GEO Group, Inc.
Opinion on the financial statements
We have audited the accompanying consolidated balance sheets of The GEO Group Inc. (a Florida corporation) and subsidiaries (the “Company”) as of December 31, 20172018 and 2016,2017, the related consolidated statements of operations, comprehensive income (loss), shareholders’ equity, and cash flows for each of the three years in the period ended December 31, 2017,2018, and the related notes and financial statement schedules included under item 15(a) (collectively referred to as the “financial statements”). In our opinion, the financial statements present fairly, in all material respects, the financial position of the Company as of December 31, 20172018 and 2016,2017, and the results of its operations and its cash flows for each of the three years in the period ended December 31, 2017,2018, in conformity with accounting principles generally accepted in the United States of America.
We also have audited, in accordance with the standards of the Public Company Accounting Oversight Board (United States) (“PCAOB”), the Company’s internal control over financial reporting as of December 31, 2017,2018, based on criteria established in the 2013Internal Control-Integrated Framework issued by the Committee of Sponsoring Organizations of the Treadway Commission (“COSO”), and our report dated February 26, 201825, 2019 expressed an unqualified opinion.
Basis for opinion
These financial statements are the responsibility of the Company’s management. Our responsibility is to express an opinion on the Company’s financial statements based on our audits. We are a public accounting firm registered with the PCAOB and are required to be independent with respect to the Company in accordance with the U.S. federal securities laws and the applicable rules and regulations of the Securities and Exchange Commission and the PCAOB.
We conducted our audits in accordance with the standards of the PCAOB. Those standards require that we plan and perform the audit to obtain reasonable assurance about whether the financial statements are free of material misstatement, whether due to error or fraud. Our audits included performing procedures to assess the risks of material misstatement of the financial statements, whether due to error or fraud, and performing procedures that respond to those risks. Such procedures included examining, on a test basis, evidence supporting the amounts and disclosures in the financial statements. Our audits also included evaluating the accounting principles used and significant estimates made by management, as well as evaluating the overall presentation of the financial statements. We believe that our audits provide a reasonable basis for our opinion.
/s/ GRANT THORNTON LLP
We have served as the Company’s auditor since 2006.
Miami, Florida
February 26, 201825, 2019
THE GEO GROUP, INC.
CONSOLIDATED STATEMENTS OF OPERATIONS
Years Ended December 31, 2018, 2017 2016 and 20152016
| 2017 | 2016 | 2015 | 2018 | 2017 | 2016 | |||||||||||||||||||
| (In thousands, except per share data) | (In thousands, except per share data) | |||||||||||||||||||||||
Revenues | $ | 2,263,420 | $ | 2,179,490 | $ | 1,843,307 | $ | 2,331,386 | $ | 2,263,420 | $ | 2,179,490 | ||||||||||||
Operating Expenses (excluding depreciation and amortization) | 1,700,495 | 1,650,281 | 1,363,782 | 1,755,772 | 1,700,495 | 1,650,281 | ||||||||||||||||||
Depreciation and Amortization | 124,297 | 114,916 | 106,756 | 126,434 | 124,297 | 114,916 | ||||||||||||||||||
General and Administrative Expenses | 190,343 | 148,709 | 137,040 | 184,515 | 190,343 | 148,709 | ||||||||||||||||||
|
|
|
|
|
| |||||||||||||||||||
Operating Income | 248,285 | 265,584 | 235,729 | 264,665 | 248,285 | 265,584 | ||||||||||||||||||
Interest Income | 51,676 | 28,496 | 11,578 | 34,755 | 51,676 | 28,496 | ||||||||||||||||||
Interest Expense | (148,024 | ) | (128,718 | ) | (106,136 | ) | (150,103 | ) | (148,024 | ) | (128,718 | ) | ||||||||||||
Loss on Extinguishment of Debt | — | (15,885 | ) | — | — | — | (15,885 | ) | ||||||||||||||||
|
|
|
|
|
| |||||||||||||||||||
Income Before Income Taxes and Equity in Earnings of Affiliates | 151,937 | 149,477 | 141,171 | 149,317 | 151,937 | 149,477 | ||||||||||||||||||
Provision for Income Taxes | 17,958 | 7,904 | 7,389 | 14,117 | 17,958 | 7,904 | ||||||||||||||||||
Equity in Earnings of Affiliates, net of income tax (benefit) provision of $(3,699), $2,341 and $2,038 | 12,045 | 6,925 | 5,533 | |||||||||||||||||||||
Equity in Earnings of Affiliates, net of income tax (benefit) provision of $888, $(3,699) and $2,341 | 9,627 | 12,045 | 6,925 | |||||||||||||||||||||
|
|
|
|
|
| |||||||||||||||||||
Net Income | 146,024 | 148,498 | 139,315 | 144,827 | 146,024 | 148,498 | ||||||||||||||||||
Loss Attributable to Noncontrolling Interests | 217 | 217 | 123 | 262 | 217 | 217 | ||||||||||||||||||
|
|
|
|
|
| |||||||||||||||||||
Net Income Attributable to The GEO Group, Inc. | $ | 146,241 | $ | 148,715 | $ | 139,438 | $ | 145,089 | $ | 146,241 | $ | 148,715 | ||||||||||||
|
|
|
|
|
| |||||||||||||||||||
Weighted Average Common Shares Outstanding: | ||||||||||||||||||||||||
Basic | 120,095 | 111,065 | 110,544 | 120,241 | 120,095 | 111,065 | ||||||||||||||||||
|
|
|
|
|
| |||||||||||||||||||
Diluted | 120,814 | 111,485 | 110,993 | 120,747 | 120,814 | 111,485 | ||||||||||||||||||
|
|
|
|
|
| |||||||||||||||||||
Income per Common Share Attributable to The GEO Group, Inc.: | ||||||||||||||||||||||||
Basic: | ||||||||||||||||||||||||
Net income per share — basic | $ | 1.22 | $ | 1.34 | $ | 1.26 | $ | 1.21 | $ | 1.22 | $ | 1.34 | ||||||||||||
|
|
|
|
|
| |||||||||||||||||||
Diluted: | ||||||||||||||||||||||||
Net income per share — diluted | $ | 1.21 | $ | 1.33 | $ | 1.25 | $ | 1.20 | $ | 1.21 | $ | 1.33 | ||||||||||||
|
|
|
|
|
| |||||||||||||||||||
Dividends declared per share | $ | 1.88 | $ | 1.73 | $ | 1.67 | $ | 1.88 | $ | 1.88 | $ | 1.73 | ||||||||||||
|
|
|
|
|
| |||||||||||||||||||
The accompanying notes are an integral part of these consolidated financial statements.
THE GEO GROUP, INC.
CONSOLIDATED STATEMENTS OF COMPRENSIVE INCOME (LOSS)
Years Ended December 31, 2018, 2017 2016 and 20152016
| 2017 | 2016 | 2015 | 2018 | 2017 | 2016 | |||||||||||||||||||
| (In thousands) | (In thousands) | |||||||||||||||||||||||
Net Income | $ | 146,024 | $ | 148,498 | $ | 139,315 | $ | 144,827 | $ | 146,024 | $ | 148,498 | ||||||||||||
Foreign currency translation adjustments | 3,808 | 482 | (4,936 | ) | (7,118 | ) | 3,808 | 482 | ||||||||||||||||
Pension liability adjustment, net of income tax (provision) benefit of $764, $114 and $(867), respectively | (1,420 | ) | (704 | ) | 1,276 | |||||||||||||||||||
Change in fair value of derivative instrument classified as cash flow hedge, net of income tax (provision) benefit of $(703), $(337) and $213, respectively | 3,985 | 1,820 | (1,375 | ) | ||||||||||||||||||||
Pension liability adjustment, net of income tax provision (benefit) of $913, $(764) and $(114), respectively | 1,785 | (1,420 | ) | (704 | ) | |||||||||||||||||||
Change in fair value of derivative instrument classified as cash flow hedge, net of income tax provision of $1,085, $703 and $337, respectively | 6,146 | 3,985 | 1,820 | |||||||||||||||||||||
|
|
|
|
|
| |||||||||||||||||||
Total other comprehensive income (loss), net of tax | 6,373 | 1,598 | (5,035 | ) | ||||||||||||||||||||
Total other comprehensive income, net of tax | 813 | 6,373 | 1,598 | |||||||||||||||||||||
|
|
|
|
|
| |||||||||||||||||||
Total comprehensive income | 152,397 | 150,096 | 134,280 | 145,640 | 152,397 | 150,096 | ||||||||||||||||||
Comprehensive loss attributable to noncontrolling interests | 211 | 198 | 215 | 277 | 211 | 198 | ||||||||||||||||||
|
|
|
|
|
| |||||||||||||||||||
Comprehensive income attributable to The GEO Group, Inc. | $ | 152,608 | $ | 150,294 | $ | 134,495 | $ | 145,917 | $ | 152,608 | $ | 150,294 | ||||||||||||
|
|
|
|
|
| |||||||||||||||||||
THE GEO GROUP, INC.
CONSOLIDATED BALANCE SHEETS
December 31, 20172018 and December 31, 20162017
| 2017 | 2016 | 2018 | 2017 | |||||||||||||
(In thousands, except share data) | (In thousands, except share data) | |||||||||||||||
| ASSETS | ASSETS | ASSETS |
| |||||||||||||
Current Assets | ||||||||||||||||
Cash and cash equivalents | $ | 81,377 | $ | 68,038 | $ | 31,255 | $ | 81,377 | ||||||||
Restricted cash and investments | 44,932 | 17,133 | 51,678 | 44,932 | ||||||||||||
Accounts receivable, less allowance for doubtful accounts of $4,574 and $3,664, respectively | 389,916 | 356,255 | ||||||||||||||
Accounts receivable, less allowance for doubtful accounts of $4,183 and $4,574, respectively | 445,526 | 389,916 | ||||||||||||||
Contract receivable, current portion | 18,142 | 224,033 | 15,535 | 18,142 | ||||||||||||
Prepaid expenses and other current assets | 45,342 | 32,210 | 47,113 | 45,342 | ||||||||||||
|
|
|
| |||||||||||||
Total current assets | 579,709 | 697,669 | 591,107 | 579,709 | ||||||||||||
Restricted Cash and Investments | 27,999 | 20,848 | 22,431 | 27,999 | ||||||||||||
Property and Equipment, Net | 2,078,123 | 1,897,241 | 2,158,610 | 2,078,123 | ||||||||||||
Non-Current Contract Receivable | 404,309 | 219,783 | ||||||||||||||
Contract Receivable | 368,178 | 404,309 | ||||||||||||||
Assets Held for Sale | 3,915 | — | 2,634 | 3,915 | ||||||||||||
Deferred Income Tax Assets | 26,277 | 30,039 | 29,924 | 26,277 | ||||||||||||
Goodwill | 778,951 | 615,433 | 776,359 | 778,951 | ||||||||||||
Intangible Assets, Net | 255,339 | 203,884 | 232,360 | 255,339 | ||||||||||||
OtherNon-Current Assets | 72,286 | 64,512 | 65,860 | 72,286 | ||||||||||||
|
|
|
| |||||||||||||
Total Assets | $ | 4,226,908 | $ | 3,749,409 | $ | 4,247,463 | $ | 4,226,908 | ||||||||
|
|
|
| |||||||||||||
| LIABILITIES AND SHAREHOLDERS’ EQUITY | LIABILITIES AND SHAREHOLDERS’ EQUITY | LIABILITIES AND SHAREHOLDERS’ EQUITY |
| |||||||||||||
Current Liabilities | ||||||||||||||||
Accounts payable | $ | 92,587 | $ | 79,637 | $ | 93,032 | $ | 92,587 | ||||||||
Accrued payroll and related taxes | 71,732 | 55,260 | 76,009 | 71,732 | ||||||||||||
Accrued expenses and other current liabilities | 176,324 | 131,096 | 193,515 | 176,324 | ||||||||||||
Current portion of capital lease obligations, long-term debt andnon-recourse debt | 28,920 | 238,065 | 332,027 | 28,920 | ||||||||||||
|
|
|
| |||||||||||||
Total current liabilities | 369,563 | 504,058 | 694,583 | 369,563 | ||||||||||||
Non-Current Deferred Income Tax Liabilities | 8,757 | — | ||||||||||||||
Deferred Income Tax Liabilities | 13,681 | 8,757 | ||||||||||||||
OtherNon-Current Liabilities | 96,702 | 88,656 | 82,481 | 96,702 | ||||||||||||
Capital Lease Obligations | 6,059 | 7,431 | 4,570 | 6,059 | ||||||||||||
Long-Term Debt | 2,181,544 | 1,935,465 | 2,397,227 | 2,181,544 | ||||||||||||
Non-Recourse Debt | 365,364 | 238,842 | 15,017 | 365,364 | ||||||||||||
Commitments and Contingencies(Note 17) | ||||||||||||||||
Shareholders’ Equity | ||||||||||||||||
Preferred stock, $0.01 par value, 30,000,000 shares authorized, none issued or outstanding | — | — | — | — | ||||||||||||
Common stock, $0.01 par value, 187,500,000 shares authorized, 124,008,303 and 112,547,544 issued and outstanding, respectively | 1,240 | 1,125 | ||||||||||||||
Common stock, $0.01 par value, 187,500,000 shares authorized, 124,794,986 and 124,008,303 issued and 120,584,732 and 124,008,003 outstanding, respectively | 1,248 | 1,240 | ||||||||||||||
Additionalpaid-in capital | 1,190,906 | 891,993 | 1,210,916 | 1,190,906 | ||||||||||||
Earnings in excess of distributions | 31,541 | 112,763 | ||||||||||||||
(Distributions) in excess of earnings/earnings in excess of distributions | (52,868 | ) | 31,541 | |||||||||||||
Accumulated other comprehensive loss | (24,446 | ) | (30,825 | ) | (23,618 | ) | (24,446 | ) | ||||||||
Treasury stock, 4,210,254 and 0 shares, at cost, respectively | (95,175 | ) | — | |||||||||||||
|
|
|
| |||||||||||||
Total shareholders’ equity attributable to The GEO Group, Inc. | 1,199,241 | 975,056 | 1,040,503 | 1,199,241 | ||||||||||||
Noncontrolling interests | (322 | ) | (99 | ) | (599 | ) | (322 | ) | ||||||||
|
|
|
| |||||||||||||
Total shareholders’ equity | 1,198,919 | 974,957 | 1,039,904 | 1,198,919 | ||||||||||||
|
|
|
| |||||||||||||
Total Liabilities and Shareholders’ Equity | $ | 4,226,908 | $ | 3,749,409 | $ | 4,247,463 | $ | 4,226,908 | ||||||||
|
|
|
| |||||||||||||
The accompanying notes are an integral part of these consolidated financial statements.
THE GEO GROUP, INC.
CONSOLIDATED STATEMENTS OF CASH FLOWS
Year Ended December 31, 2018, 2017 2016 and 20152016
| 2017 | 2016 | 2015 | 2018 | 2017 | 2016 | |||||||||||||||||||
| (In thousands) | (In thousands) | |||||||||||||||||||||||
Cash Flow from Operating Activities: | ||||||||||||||||||||||||
Net Income | $ | 146,024 | $ | 148,498 | $ | 139,315 | $ | 144,827 | $ | 146,024 | $ | 148,498 | ||||||||||||
Net loss attributable to noncontrolling interests | 217 | 217 | 123 | 262 | 217 | 217 | ||||||||||||||||||
|
|
|
|
|
| |||||||||||||||||||
Net income attributable to The GEO Group, Inc. | 146,241 | 148,715 | 139,438 | 145,089 | 146,241 | 148,715 | ||||||||||||||||||
Adjustments to reconcile net income attributable to The GEO Group, Inc. to net cash provided by (used in) operating activities: | ||||||||||||||||||||||||
Depreciation and amortization expense | 124,297 | 114,916 | 106,756 | 126,434 | 124,297 | 114,916 | ||||||||||||||||||
Deferred tax provision (benefit) | 12,238 | (5,963 | ) | (2,374 | ) | 1,230 | 12,238 | (5,963 | ) | |||||||||||||||
Amortization of debt issuance costs, discount and/or premium | 16,540 | 12,121 | 6,963 | |||||||||||||||||||||
Amortization of debt issuance costs, discount and/or premium and othernon-cash interest | 8,856 | 16,540 | 12,121 | |||||||||||||||||||||
Stock-based compensation | 19,844 | 12,773 | 11,709 | 22,049 | 19,844 | 12,773 | ||||||||||||||||||
Loss on extinguishment of debt | — | 15,885 | — | — | — | 15,885 | ||||||||||||||||||
Provision for doubtful accounts | 2,456 | 2,682 | 764 | 823 | 2,456 | 2,682 | ||||||||||||||||||
Exit charges related tonon-core operating leases | — | — | 4,550 | |||||||||||||||||||||
Equity in earnings of affiliates, net of tax | (12,045 | ) | (6,925 | ) | (5,533 | ) | (9,627 | ) | (12,045 | ) | (6,925 | ) | ||||||||||||
Income tax deficiency (benefit) related to equity compensation | — | 1,626 | (1,409 | ) | — | — | 1,626 | |||||||||||||||||
Loss (gain) on sale/disposal of property and equipment | 1,520 | 394 | (466 | ) | 4,236 | 1,520 | 394 | |||||||||||||||||
Dividends received from unconsolidated joint venture | 6,132 | 1,611 | 3,244 | 11,846 | 6,132 | 1,611 | ||||||||||||||||||
Changes in assets and liabilities, net of acquisition: | ||||||||||||||||||||||||
Changes in accounts receivable, prepaid expenses and other assets | 20,938 | (50,946 | ) | (29,311 | ) | (66,101 | ) | 20,938 | (50,946 | ) | ||||||||||||||
Changes in contract receivable | 40,515 | (280,562 | ) | (114,086 | ) | (2,049 | ) | 40,515 | (280,562 | ) | ||||||||||||||
Changes in accounts payable, accrued expenses and other liabilities | 2,366 | 5,645 | 21,912 | 31,689 | 2,366 | 5,645 | ||||||||||||||||||
|
|
|
|
|
| |||||||||||||||||||
Net cash provided by (used in) operating activities | 381,042 | (28,028 | ) | 142,157 | 274,475 | 381,042 | (28,028 | ) | ||||||||||||||||
|
|
|
|
|
| |||||||||||||||||||
Cash Flow from Investing Activities: | ||||||||||||||||||||||||
Acquisition of LCS, cash consideration | — | — | (307,404 | ) | ||||||||||||||||||||
Acquisition of CEC, cash consideration, net of cash acquired | (353,556 | ) | — | — | — | (353,556 | ) | — | ||||||||||||||||
Acquisition of SoberLink, cash consideration | — | — | (24,402 | ) | ||||||||||||||||||||
Proceeds from sale of property and equipment | 3,460 | 2,030 | 42 | 2,077 | 3,460 | 2,030 | ||||||||||||||||||
Insurance proceeds — damaged property | 2,754 | 4,733 | 1,270 | 1,438 | 2,754 | 4,733 | ||||||||||||||||||
Proceeds from sale of assets held for sale | 3,797 | — | — | |||||||||||||||||||||
Change in restricted cash and investments | (33,661 | ) | (9,558 | ) | (4,805 | ) | (129 | ) | (4,507 | ) | (2,892 | ) | ||||||||||||
Capital expenditures | (148,406 | ) | (81,565 | ) | (117,581 | ) | (195,666 | ) | (148,406 | ) | (81,565 | ) | ||||||||||||
|
|
|
|
|
| |||||||||||||||||||
Net cash used in investing activities | (529,409 | ) | (84,360 | ) | (452,880 | ) | (188,483 | ) | (500,255 | ) | (77,694 | ) | ||||||||||||
|
|
|
|
|
| |||||||||||||||||||
Cash Flow from Financing Activities: | ||||||||||||||||||||||||
Payments on long-term debt | (1,140,788 | ) | (934,006 | ) | (311,985 | ) | (282,538 | ) | (1,140,788 | ) | (934,006 | ) | ||||||||||||
Proceeds from long term debt | 1,389,084 | 1,012,945 | 724,798 | 502,998 | 1,389,084 | 1,012,945 | ||||||||||||||||||
Payments onnon-recourse debt | (307,414 | ) | (10,064 | ) | (11,908 | ) | (18,544 | ) | (307,414 | ) | (10,064 | ) | ||||||||||||
Proceeds fromnon-recourse debt | 181,658 | 266,835 | 123,560 | — | 181,658 | 266,835 | ||||||||||||||||||
Taxes paid related to net share settlements of equity awards | (4,142 | ) | (2,336 | ) | (2,786 | ) | (3,820 | ) | (4,142 | ) | (2,336 | ) | ||||||||||||
Debt issuance costs | (9,542 | ) | (21,115 | ) | (7,069 | ) | (990 | ) | (9,542 | ) | (21,115 | ) | ||||||||||||
Payments for purchase of treasury shares | (95,175 | ) | — | — | ||||||||||||||||||||
Proceeds from stock options exercised | 6,962 | 3,347 | 2,774 | 1,887 | 6,962 | 3,347 | ||||||||||||||||||
Income tax (deficiency) benefit related to equity compensation | — | (1,626 | ) | 1,409 | — | — | (1,626 | ) | ||||||||||||||||
Proceeds from issuance of common stock in connection with ESPP | 497 | 436 | 441 | 534 | 497 | 436 | ||||||||||||||||||
Issuance of common stock in connection with public offering | 275,867 | — | — | — | 275,867 | — | ||||||||||||||||||
Dividends paid | (227,463 | ) | (194,748 | ) | (186,984 | ) | (229,498 | ) | (227,463 | ) | (194,748 | ) | ||||||||||||
|
|
|
|
|
| |||||||||||||||||||
Net cash provided by financing activities | 164,719 | 119,668 | 332,250 | |||||||||||||||||||||
Net cash (used in) provided by financing activities | (124,966 | ) | 164,719 | 119,668 | ||||||||||||||||||||
|
|
|
|
|
| |||||||||||||||||||
Effect of Exchange Rate Changes on Cash and Cash Equivalents | (3,013 | ) | 1,120 | (3,226 | ) | |||||||||||||||||||
Effect of Exchange Rate Changes on Cash, Cash Equivalents and Restricted Cash and Cash Equivalents | (10,099 | ) | (2,318 | ) | 1,119 | |||||||||||||||||||
|
|
|
|
|
| |||||||||||||||||||
Net Increase in Cash and Cash Equivalents | 13,339 | 8,400 | 18,301 | |||||||||||||||||||||
Cash and Cash Equivalents, beginning of period | 68,038 | 59,638 | 41,337 | |||||||||||||||||||||
Net (Decrease) Increase in Cash, Cash Equivalents and Restricted Cash and Cash Equivalents | (49,073 | ) | 43,188 | 15,065 | ||||||||||||||||||||
Cash, Cash Equivalents and Restricted Cash and Cash Equivalents, beginning of period | 133,545 | 90,357 | 75,292 | |||||||||||||||||||||
|
|
|
|
|
| |||||||||||||||||||
Cash and Cash Equivalents, end of period | $ | 81,377 | $ | 68,038 | $ | 59,638 | ||||||||||||||||||
Cash, Cash Equivalents and Restricted Cash and Cash Equivalents, end of period | $ | 84,472 | $ | 133,545 | $ | 90,357 | ||||||||||||||||||
|
|
|
|
|
| |||||||||||||||||||
Supplemental Disclosures | ||||||||||||||||||||||||
Cash paid during the year for: | ||||||||||||||||||||||||
Income taxes | $ | 13,809 | $ | 23,063 | $ | 11,522 | $ | 8,035 | $ | 13,809 | $ | 23,063 | ||||||||||||
|
|
|
|
|
| |||||||||||||||||||
Interest | $ | 115,354 | $ | 109,356 | $ | 97,652 | $ | 133,566 | $ | 115,354 | $ | 109,356 | ||||||||||||
|
|
|
|
|
| |||||||||||||||||||
Non-cash investing and financing activities: | ||||||||||||||||||||||||
Capital expenditures in accounts payable and accrued expenses | $ | 13,039 | $ | 894 | $ | 5,939 | $ | 15,253 | $ | 13,039 | $ | 894 | ||||||||||||
|
|
|
|
|
| |||||||||||||||||||
The accompanying notes are an integral part of these consolidated financial statements.
THE GEO GROUP, INC.
CONSOLIDATED STATEMENTS OF SHAREHOLDERS’ EQUITY
Years Ended December 31, 2018, 2017 2016 and 20152016
| GEO Group Inc. Shareholders | Noncontrolling Interest | Total Shareholders’ Equity | GEO Group Inc. Shareholders | Noncontrolling Interest | Total Shareholders’ Equity | |||||||||||||||||||||||||||||||||||||||||||||||||||||||||||
Common Stock | Additional Paid-In Capital | Earnings in Excess of Distributions |
Accumulated Other | Common Stock | Additional Paid-In Capital |
(Distributions | Accumulated Other Comprehensive Income (Loss) | Treasury Stock | ||||||||||||||||||||||||||||||||||||||||||||||||||||||||
| Number of Shares | Amount | Number of Shares | Amount | Number of Shares | Amount | |||||||||||||||||||||||||||||||||||||||||||||||||||||||||||
| (In thousands) | (In thousands) | |||||||||||||||||||||||||||||||||||||||||||||||||||||||||||||||
Balance, January 1, 2015 | 111,287 | $ | 1,113 | $ | 865,685 | $ | 206,342 | $ | (27,461 | ) | $ | 314 | $ | 1,045,993 | ||||||||||||||||||||||||||||||||||||||||||||||||||
Balance, January 1, 2016 | 111,966 | $ | 1,121 | $ | 879,225 | $ | 158,796 | $ | (32,404 | ) | — | $ | — | $ | 99 | $ | 1,006,837 | |||||||||||||||||||||||||||||||||||||||||||||||
|
|
|
|
|
|
|
|
|
|
|
|
|
|
|
| |||||||||||||||||||||||||||||||||||||||||||||||||
Proceeds from stock options exercised | 185 | 2 | 2,773 | — | — | — | 2,775 | 234 | 2 | 3,345 | — | — | — | — | — | 3,347 | ||||||||||||||||||||||||||||||||||||||||||||||||
Tax benefit related to equity compensation | — | — | 1,409 | — | — | — | 1,409 | — | — | (1,626 | ) | — | — | — | — | — | (1,626 | ) | ||||||||||||||||||||||||||||||||||||||||||||||
Stock based compensation expense | — | — | 11,709 | — | — | — | 11,709 | — | — | 12,773 | — | — | — | — | — | 12,773 | ||||||||||||||||||||||||||||||||||||||||||||||||
Shares withheld for net settlements of share-based awards | (108 | ) | (2,786 | ) | (2,786 | ) | (113 | ) | (2 | ) | (2,335 | ) | — | — | — | — | — | (2,337 | ) | |||||||||||||||||||||||||||||||||||||||||||||
Restricted stock granted | 635 | 6 | (6 | ) | — | — | — | — | 523 | 5 | (5 | ) | — | — | — | — | — | — | ||||||||||||||||||||||||||||||||||||||||||||||
Restricted stock canceled | (53 | ) | — | — | — | — | — | — | (84 | ) | (1 | ) | 1 | — | — | — | — | — | — | |||||||||||||||||||||||||||||||||||||||||||||
Dividends — Paid | — | — | — | (186,984 | ) | — | — | (186,984 | ) | |||||||||||||||||||||||||||||||||||||||||||||||||||||||
Re-issuance of treasury shares (ESPP) | 20 | — | 441 | — | — | — | 441 | |||||||||||||||||||||||||||||||||||||||||||||||||||||||||
Net income (loss) | — | — | — | 139,438 | — | (123 | ) | 139,315 | ||||||||||||||||||||||||||||||||||||||||||||||||||||||||
Other comprehensive loss | — | — | — | — | (4,943 | ) | (92 | ) | (5,035 | ) | ||||||||||||||||||||||||||||||||||||||||||||||||||||||
|
|
|
|
|
|
| ||||||||||||||||||||||||||||||||||||||||||||||||||||||||||
Balance, December 31, 2015 | 111,966 | $ | 1,121 | $ | 879,225 | $ | 158,796 | $ | (32,404 | ) | $ | 99 | $ | 1,006,837 | ||||||||||||||||||||||||||||||||||||||||||||||||||
|
|
|
|
|
|
| ||||||||||||||||||||||||||||||||||||||||||||||||||||||||||
Proceeds from stock options exercised | 234 | 2 | 3,345 | — | — | — | 3,347 | |||||||||||||||||||||||||||||||||||||||||||||||||||||||||
Tax benefit related to equity compensation | — | — | (1,626 | ) | — | — | — | (1,626 | ) | |||||||||||||||||||||||||||||||||||||||||||||||||||||||
Stock based compensation expense | — | — | 12,773 | — | — | — | 12,773 | |||||||||||||||||||||||||||||||||||||||||||||||||||||||||
Shares withheld for net settlements of share-based awards | (113 | ) | — | (2,335 | ) | — | — | — | (2,337 | ) | ||||||||||||||||||||||||||||||||||||||||||||||||||||||
Restricted stock granted | 523 | 5 | (5 | ) | — | — | — | — | ||||||||||||||||||||||||||||||||||||||||||||||||||||||||
Restricted stock canceled | (84 | ) | (1 | ) | 1 | — | — | — | — | |||||||||||||||||||||||||||||||||||||||||||||||||||||||
Dividends Paid | — | — | — | (194,748 | ) | — | — | (194,748 | ) | |||||||||||||||||||||||||||||||||||||||||||||||||||||||
Dividends — paid | — | — | — | (194,748 | ) | — | — | — | — | (194,748 | ) | |||||||||||||||||||||||||||||||||||||||||||||||||||||
Issuance of common stock (ESPP) | 22 | — | 436 | — | — | — | 436 | 22 | — | 436 | — | — | — | — | — | 436 | ||||||||||||||||||||||||||||||||||||||||||||||||
Net income (loss) | — | — | — | 148,715 | — | (217 | ) | 148,498 | — | — | — | 148,715 | — | — | — | (217 | ) | 148,498 | ||||||||||||||||||||||||||||||||||||||||||||||
Other comprehensive income | — | — | — | — | 1,579 | 19 | 1,598 | — | — | — | — | 1,579 | — | — | 19 | 1,598 | ||||||||||||||||||||||||||||||||||||||||||||||||
|
|
|
|
|
|
|
|
|
|
|
|
|
|
|
| |||||||||||||||||||||||||||||||||||||||||||||||||
Balance, December 31, 2016 | 112,548 | $ | 1,125 | $ | 891,993 | $ | 112,763 | $ | (30,825 | ) | $ | (99 | ) | $ | 974,957 | 112,548 | $ | 1,125 | $ | 891,993 | $ | 112,763 | $ | (30,825 | ) | — | $ | — | $ | (99 | ) | $ | 974,957 | |||||||||||||||||||||||||||||||
|
|
|
|
|
|
|
|
|
|
|
|
|
|
|
| |||||||||||||||||||||||||||||||||||||||||||||||||
Proceeds from stock options exercised | 358 | 4 | 6,958 | — | — | — | 6,962 | 358 | 4 | 6,958 | — | — | — | — | — | 6,962 | ||||||||||||||||||||||||||||||||||||||||||||||||
Stock based compensation expense | — | — | 19,844 | — | — | — | 19,844 | — | — | �� | 19,844 | — | — | — | — | — | 19,844 | |||||||||||||||||||||||||||||||||||||||||||||||
Shares withheld for net settlements of share-based awards | (136 | ) | (1 | ) | (4,141 | ) | — | — | — | (4,142 | ) | (136 | ) | — | (4,141 | ) | — | — | — | — | — | (4,142 | ) | |||||||||||||||||||||||||||||||||||||||||
Restricted stock granted | 933 | 9 | (9 | ) | — | — | — | — | 933 | 9 | (9 | ) | — | — | — | — | — | — | ||||||||||||||||||||||||||||||||||||||||||||||
Restricted stock canceled | (65 | ) | (1 | ) | 1 | — | — | — | — | (65 | ) | (1 | ) | 1 | — | — | — | — | — | — | ||||||||||||||||||||||||||||||||||||||||||||
Dividends Paid | — | — | — | (227,463 | ) | — | — | (227,463 | ) | |||||||||||||||||||||||||||||||||||||||||||||||||||||||
Dividends paid | — | — | — | (227,463 | ) | — | — | — | — | (227,463 | ) | |||||||||||||||||||||||||||||||||||||||||||||||||||||
Issuance of common stock — prospectus supplement | 10,350 | 104 | 275,763 | — | — | — | 275,867 | 10,350 | 104 | 275,763 | — | — | — | — | — | 275,867 | ||||||||||||||||||||||||||||||||||||||||||||||||
Issuance of common stock (ESPP) | 20 | — | 497 | — | — | — | 497 | 20 | — | 497 | — | — | — | — | — | 497 | ||||||||||||||||||||||||||||||||||||||||||||||||
Net income (loss) | — | — | — | 146,241 | — | (217 | ) | 146,024 | — | — | — | 146,241 | — | — | — | (217 | ) | 146,024 | ||||||||||||||||||||||||||||||||||||||||||||||
Other comprehensive income (loss) | — | — | — | — | 6,379 | (6 | ) | 6,373 | — | — | — | — | 6,379 | — | — | (6 | ) | 6,373 | ||||||||||||||||||||||||||||||||||||||||||||||
|
|
|
|
|
|
|
|
|
|
|
|
|
|
|
| |||||||||||||||||||||||||||||||||||||||||||||||||
Balance, December 31, 2017 | 124,008 | $ | 1,240 | $ | 1,190,906 | $ | 31,541 | $ | (24,446 | ) | $ | (322 | ) | $ | 1,198,919 | 124,008 | $ | 1,240 | $ | 1,190,906 | $ | 31,541 | $ | (24,446 | ) | — | $ | — | $ | (322 | ) | $ | 1,198,919 | |||||||||||||||||||||||||||||||
|
|
|
|
|
|
|
|
|
|
|
|
|
|
|
| |||||||||||||||||||||||||||||||||||||||||||||||||
Proceeds from stock options exercised | 103 | 1 | 1,886 | — | — | — | — | — | 1,887 | |||||||||||||||||||||||||||||||||||||||||||||||||||||||
Stock based compensation expense | — | — | 22,049 | — | — | — | — | — | 22,049 | |||||||||||||||||||||||||||||||||||||||||||||||||||||||
Shares withheld for net settlements of share-based awards | (173 | ) | (2 | ) | (3,818 | ) | — | — | — | — | — | (3,820 | ) | |||||||||||||||||||||||||||||||||||||||||||||||||||
Restricted stock granted | 906 | 9 | (9 | ) | — | — | — | — | — | |||||||||||||||||||||||||||||||||||||||||||||||||||||||
Restricted stock canceled | (73 | ) | — | — | — | — | — | — | — | — | ||||||||||||||||||||||||||||||||||||||||||||||||||||||
Dividends paid | — | — | — | (229,498 | ) | — | — | — | — | (229,498 | ) | |||||||||||||||||||||||||||||||||||||||||||||||||||||
Purchase of treasury shares | (4,210 | ) | — | — | — | — | 4,210 | (95,175 | ) | — | (95,175 | ) | ||||||||||||||||||||||||||||||||||||||||||||||||||||
Issuance of common stock (ESPP) | 24 | — | 534 | — | — | — | — | — | 534 | |||||||||||||||||||||||||||||||||||||||||||||||||||||||
Other adjustments to AdditionalPaid-In-Capital [1] | (632 | ) | (632 | ) | ||||||||||||||||||||||||||||||||||||||||||||||||||||||||||||
Net income (loss) | — | — | — | 145,089 | — | — | — | (262 | ) | 144,827 | ||||||||||||||||||||||||||||||||||||||||||||||||||||||
Other comprehensive income (loss) | — | — | — | — | 828 | — | — | (15 | ) | 813 | ||||||||||||||||||||||||||||||||||||||||||||||||||||||
|
|
|
|
|
|
|
|
| ||||||||||||||||||||||||||||||||||||||||||||||||||||||||
Balance, December 31, 2018 | 120,585 | $ | 1,248 | $ | 1,210,916 | $ | (52,868 | ) | $ | (23,618 | ) | 4,210 | $ | (95,175 | ) | $ | (599 | ) | $ | 1,039,904 | ||||||||||||||||||||||||||||||||||||||||||||
|
|
|
|
|
|
|
|
| ||||||||||||||||||||||||||||||||||||||||||||||||||||||||
| [1] | Represents a cumulative-effect adjustment upon adoption of ASUNo. 2016-16, “Income Taxes — Intra-Entity Transfers of Assets Other Than Inventory.”Refer to Note 1 — Summary of Business Organization, Operations and Significant Accounting Policies — Recent Accounting Pronouncements for further information. |
The accompanying notes are an integral part of these consolidated financial statements.
THE GEO GROUP, INC.
NOTES TO CONSOLIDATED FINANCIAL STATEMENTS
For the Years Ended December 31, 2018, 2017 2016 and 20152016
| 1. | Summary of Business Organization, Operations and Significant Accounting Policies |
The GEO Group, Inc., a Florida corporation, and subsidiaries (the “Company” or “GEO”) is a fully-integrated real estate investment trust (“REIT”) specializing in the ownership, leasing and management of correctional, detention and reentry facilities and the provision of community-based services and youth services in the United States, Australia, South Africa and the United Kingdom. The Company owns, leases and operates a broad range of correctional and detention facilities including maximum, medium and minimum security prisons, immigration detention centers, minimum security detention centers, as well as community based reentry facilities. The Company develops new facilities based on contract awards, using its project development expertise and experience to design, construct and finance what it believes arestate-of-the-art facilities that maximize security and efficiency. The Company provides innovative compliance technologies, industry-leading monitoring services, and evidence-based supervision and treatment programs for community-based parolees, probationers and pretrial defendants. The Company also provides secure transportation services for offender and detainee populations as contracted domestically and in the United Kingdom through its joint venture GEO Amey PECS Ltd. (“GEOAmey”). As of December 31, 2017,2018, GEO’s worldwide operations included the ownership and/or management of approximately 96,000 beds at 141135 correctional, detention and community services facilities, including idle facilities and projects under development, and also includeincludes the provision of community supervision services for more than 192,000210,000 offenders and pretrial defendants, including approximately 100,000 individuals through an array of technology products including radio frequency, GPS, and alcohol monitoring devices.
GEO, which has been in operation since 1984, began operating as a REIT for federal income tax purposes effective January 1, 2013. As a result of the REIT conversion, GEO reorganized its operations and movednon-real estate components into taxable REIT subsidiaries (“TRSs”). Through the TRS structure, the portion of GEO’s businesses which arenon-real estate related, such as its managed-only contracts, international operations, electronic monitoring services, and othernon-residential and community based facilities, are part of wholly-owned taxable subsidiaries of the REIT. Most of GEO’s business units, which are real estate related and involve company-owned and company-leased facilities, are part of the REIT. The TRS structure allows the Company to maintain the strategic alignment of all of its diversified business segments under one entity. The TRS assets and operations will continue to be subject to federal and state corporate income taxes and to foreign taxes as applicable in the jurisdictions in which those assets and operations are located.
In March 2017, the Company’s Board of Directors declared a3-for-2 stock split of its common stock. The stock split was completed on April 24, 2017 with respect to shareholders of record on April 10, 2017. Outstanding share andper-share amounts disclosed for all periods presented have been retroactively adjusted to reflect the effects of the stock split. On April 24, 2017, the Company amended its articles of incorporation to increase the number of authorized shares of common stock to take into effect the stock split.
The consolidated financial statements have been prepared in conformity with accounting principles generally accepted in the United States.States of America. The significant accounting policies of the Company are described below.
Consolidation
The accompanying consolidated financial statements include the accounts of the Company and its wholly-owned subsidiaries. The equity method of accounting is used for investments innon-controlled affiliates in which the Company’s ownership ranges from 20 to 50 percent, or in instances in which the Company is able to exercise
significant influence but not control. The Company reports South Africa Custodial Services (“SACS”) and its
50% owned joint venture in the United Kingdom, GEOAmey, under the equity method of accounting. Noncontrolling interests in consolidated entities represent equity that other investors have contributed to South Africa Custodial Management(“SACM”). Non-controlling interests are adjusted for income and losses allocable to the other shareholders in these entities. All significant intercompany balances and transactions have been eliminated.
Use of Estimates
The preparation of financial statements in conformity with accounting principles generally accepted in the United States of America requires management to make certain estimates, judgments and assumptions that affect the reported amounts of assets and liabilities and disclosure of contingent assets and liabilities at the date of the financial statements and the reported amounts of revenues and expenses during the reporting period. The Company’s significant estimates include reserves for self-insured retention related to general liability insurance, workers’ compensation insurance, auto liability insurance, medical malpractice insurance, employer group health insurance, projected undiscounted cash flows used to evaluate asset impairment, estimated fair values of business acquisitions, pension assumptions, percentage of completion and estimated cost to complete for construction projects, recoverability of notes receivable, estimated useful lives of property and equipment and intangible assets, stock based compensation and allowance for doubtful accounts. These estimates and assumptions affect the reported amounts of assets and liabilities at the date of the financial statements and the reported amounts of revenues and expenses during the reporting period. While the Company believes that such estimates are reasonable when considered in conjunction with the consolidated financial statements taken as a whole, the actual amounts of such estimates, when known, will vary from these estimates. If actual results significantly differ from the Company’s estimates, the Company’s financial condition and results of operations could be materially impacted.
Dividends
As a REIT, the Company is required to distribute annually at least 90% of its REIT taxable income (determined without regard to the dividends paid deduction and by excluding net capital gain). The amount, timing and frequency of future distributions, however, will be at the sole discretion of the Company’s Board of Directors and will be declared based upon various factors, many of which are beyond the Company’s control, including, the Company’s financial condition and operating cash flows, the amount required to maintain REIT status and reduce any income and excise taxes that the Company otherwise would be required to pay, limitations on distributions in the Company’s existing and future debt instruments, limitations on the Company’s ability to fund distributions using cash generated through our TRSs and other factors that the Company’s Board of Directors may deem relevant. The Company began paying regular REIT distributions in 2013. Refer to Note3- Shareholders’ Equity.
A REIT is not permitted to retain earnings and profits accumulated during the years it was taxed as a C corporation or earnings and profits accumulated by its subsidiaries that have been converted to qualified REIT subsidiaries, and must make one or more distributions to shareholders that equal or exceed these accumulated amounts by the end of the first REIT year. Earnings and profits, which determine the taxability of distributions to shareholders, will differ from net income reported for financial reporting purposes due to the differences in the treatment of gains and losses, revenue and expenses, and depreciation for financial reporting relative to federal income tax purposes.
Cash and Cash Equivalents
Cash and cash equivalents include all interest-bearing deposits or investments with original maturities of three months or less when purchased. The Company maintains cash and cash equivalents with various financial institutions. These financial institutions are located throughout the United States, Australia, South Africa and the
United Kingdom. As of December 31, 20172018 and December 31, 2016,2017, the Company had $28.2$18.9 million and $21.6$28.2 million in cash and cash equivalents held by its international subsidiaries, respectively.
Concentration of Credit Risk
The Company maintains deposits of cash in excess of federally insured limits with certain financial institutions and accordingly the Company is subject to credit risk. Other than cash, financial instruments that potentially subject the Company to concentrations of credit risk consist principally of trade accounts receivable, contract receivable, long-term debt and financial instruments used in hedging activities. The Company’s cash management and investment policies restrict investments tolow-risk, highly liquid securities, and the Company performs periodic evaluations of the credit standing of the financial institutions with which it deals.
Accounts Receivable
Accounts receivable consists primarily of trade accounts receivable due from federal, state, local and localinternational government agencies for operating and managing correctional facilities, providing youth and community basedcommunity-based services, providing electronic monitoring and supervision services, providing construction and design services and providing inmate residential and prisoner transportation services. The Company generates receivables with its governmental clients and with other parties in the normal course of business as a result of billing and receiving payment. The Company regularly reviews outstanding receivables, and provides for estimated losses through an allowance for doubtful accounts. In evaluating the level of established loss reserves, the Company makes judgments regarding its customers’ ability to make required payments, economic events and other factors. As the financial condition of these parties change, circumstances develop or additional information becomes available, adjustments to the allowance for doubtful accounts may be required. The Company also performs ongoing credit evaluations for some of its customers’ financial conditions and generally does not require collateral. Generally, the Company receives payment for these services thirty to sixty days in arrears. However, certain of the Company’s accounts receivable are paid by customers after the completion of their program year and therefore can be aged in excess of one year. The Company maintains reserves for potential credit losses, and such losses traditionally have been within its expectations. Actual write-offs are charged against the allowance when collection efforts have been unsuccessful. As of December 31, 2018 and 2017, and 2016, $4$2.3 million and $1.3$4.0 million, respectively, of the Company’s trade receivables were considered to be long-term and are classified as OtherNon-Current Assets in the accompanying Consolidated Balance Sheets.
Notes Receivable
The Company had notes receivable from its former joint venture partner in the United Kingdom related to a subordinated loan extended to the joint venture partner while an active member of the partnership. The notes bore interest at a rate of 13%, and had semi-annual payments due June 15 and December 15. The Company recognized interest income on its Notes Receivablenotes receivable as it was earned. The balances outstanding were fully paid off as of December 31,in 2017.
Note Receivable from Joint Venture
In May 2011, the GEO Group UK Limited, the Company’s subsidiary in the United Kingdom (“GEO UK”), extended anon-revolving line of credit facility to GEOAmey for the purpose of funding mobilization costs andon-going start up and operations in the principal amount of £12 million or $16.2$15.3 million, based on exchange rates atas of December 31, 2017.2018. Amounts under the line of credit were drawn down in multiple advances up to the principal amount and accrueaccrued interest at the base rate of the Bank of England plus 0.5% with the principal amount due on demand. The Company recognizesrecognized interest income on its notes receivable as it is earned.
As of December 31, 2017, the Company was owed £1.3 million, or $1.7 million, based on exchange rates as of December 31, 2017, under the line of credit. As of December 31, 2016,In October 2018, the Companynote receivable to each joint venture was owed £3.5 million, or $4.3 million, based on exchange rates as of December 31, 2016.
paid off in full. These balances arewere included within OtherNon-Current Assets in the accompanying Consolidated Balance Sheets. Refer to Note 15 — Business Segments and Geographic Information regarding the Company’s investment in GEOAmey.
Contract Receivable
The Company’s Australian subsidiary has recorded a contract receivable in connection with the construction of a1,300-bed detention facility in Ravenhall, Australia for the State of Victoria. The contract receivable represents costs incurred and estimated earnings in excess of billings and is recorded at net present value based on the timing of expected future settlement. Refer to Note 7 — Contract Receivable for further information.
Restricted Cash and InvestmentsCash Equivalents
The Company’sfollowing table provides a reconciliation of cash, cash equivalents and restricted cash and investments at December 31, 2017cash equivalents reported on the consolidated balance sheets that sum to the total of the same such amounts shown in the consolidated statements of cash flows:
| December 31, 2018 | December 31, 2017 | December 31, 2016 | ||||||||||
Cash and Cash Equivalents | $ | 31,255 | $ | 81,377 | $ | 68,038 | ||||||
Restricted cash and cash equivalents — current | 51,678 | 44,932 | 17,133 | |||||||||
Restricted cash and investments —non-current | 22,431 | 27,999 | 20,848 | |||||||||
Less Restricted investments —non-current | (20,892 | ) | (20,763 | ) | (15,662 | ) | ||||||
|
|
|
|
|
| |||||||
Total cash, cash equivalents and restricted cash and cash equivalents shown in the statement of cash flows | $ | 84,472 | $ | 133,545 | $ | 90,357 | ||||||
|
|
|
|
|
| |||||||
Amounts included in restricted cash and cash equivalents are attributable to certain contractual cash restriction requirements at the Company’s wholly owned Australian subsidiary related tonon-recourse debt and asset replacement funds contractually required to be maintained and other guaranteesguarantees. Restricted investments —non-current (included in Restricted Cash and restricted investments relatedInvestments in the accompanying consolidated balance sheets) consists of the Company’s rabbi trust established for employee and employer contributions to The GEO Group, Inc.Non-qualified Deferred Compensation Plan as well as dividends held for unvested restricted stock awards. The current portion ofand is not considered to be a restricted cash and investments primarily represents the amount expectedequivalent. Refer to be paid within the next twelve months for debt service related to the Company’snon-recourse debt.Note 10 — Financial Instruments.
Prepaid expenses and Other Current Assets
Prepaid expenses and other current assets include assets that are expected to be realized within the next fiscal year. Included in the balance at December 31, 20172018 is approximately $15.5$6.1 million of federal, state and stateinternational tax overpayments that will be applied against estimated tax payments due in 2018. Of this amount, approximately $13 million relates to tax overpayments in Australia.2019. Included in the balance at December 31, 20162017 is approximately $9.4$15.5 million of federal, state and stateforeign tax overpayments that were applied against tax payments in 2017.2018. Of this amount, approximately $13 million related to tax overpayments in Australia.
Property and Equipment
Property and equipment are stated at cost, less accumulated amortization and depreciation. Depreciation is computed using the straight-line method over the estimated useful lives of the related assets. Buildings and improvements are depreciated over 2 to 50 years. Equipment and furniture and fixtures are depreciated over 3 to 10 years. Straight-line and accelerated methods of depreciation are generally used for income tax purposes. Leasehold improvements are amortized on a straight-line basis over the shorter of the useful life of the improvement or the term of the lease. The Company performs ongoing evaluations of the estimated useful lives of the property and equipment for depreciation purposes. The estimated useful lives are determined and
continually evaluated based on the period over which services are expected to be rendered by the asset. If the assessment indicates that assets will be used for a longer or shorter period than previously anticipated, the useful lives of the assets are revised, resulting in a change in estimate. The Company has not made any such changes in estimates during the years ended December 31, 2018, 2017 2016 and 2015, respectively.2016. Maintenance and repairs are expensed as incurred. Interest is capitalized in connection with the construction of company-owned correctional and detention facilities. Cost for self-constructed correctional and detention facilities includes direct materials and labor, capitalized interest and certain other indirect costs associated with construction of the facility, such as property taxes, other indirect labor and related benefits and payroll taxes. The Company begins the capitalization of costs during thepre-construction phase, which is the period during which costs are incurred to evaluate the site, and continues until the facility is substantially complete and ready for occupancy. Labor costs capitalized for the years ended December 31, 2018, 2017 2016 and 20152016 were not significant. Capitalized interest is recorded as part of the asset to which it relates and is amortized over the asset’s estimated useful life. Refer to Note 6 — Property and Equipment.
Assets Held for Sale
As of December 31, 2017,2018, the Company has one propertyhad two properties classified as held for sale included in its GEO Care Segment in the accompanying consolidated balance sheet. The Company classifies a long-lived asset (disposal group) as held for sale in the period in which all of the following criteria are met (i) Management, having the authority to approve the action,
commits to a plan to sell the asset (disposal group), (ii) the asset (disposal group) is available for immediate sale in its present condition subject only to the terms that are usual and customary for sales of such assets (disposal groups), (iii) an active program to locate a buyer and other actions required to complete the plan to sell the asset (disposal group) have been initiated, (iv) the sale of the asset (disposal group) is probable, and transfer of the asset (disposal group) is expected to qualify for recognition as a completed sale, within one year, except as permitted, (v) the asset (disposal group) is being actively marketed for sale at a price that is reasonable in relation to its current fair value, and (vi) actions required to complete the plan indicate that it is unlikely that significant changes to the plan will be made or that the plan will be withdrawn. The Company records assets held for sale at the lower of cost or estimated fair value and estimates fair value by using third party appraisers or other valuation techniques. The Company does not record depreciation for assets held for sale. Any gain or loss on the sale of operating assets is included in the operating income of the reportable segment to which it relates.
The propertyproperties that isare classified as held for sale isat December 31, 2018 are a parcel of undeveloped land in Hobart, Indiana and an idle reentry facility acquired from Community Education Centers (“CEC”). At December 31, 2018, the carrying values of these properties were approximately $0.7 million and $1.9 million, respectively. At December 31, 2017, the Company had one property that was classified as held for sale which consisted of an office building previously used by a company GEO recently acquired, Community Education Centers,CEC for its corporate headquarters. Refer to Note 2 — Business Combinations. At December 31, 2017, the carrying value of the property was approximately $3.9 million. In January 2018, thethis property was sold for $4$4.0 million, net of selling costs.
Asset Impairments
The Company had property and equipment of $2.1$2.2 billion and $1.9 million$2.1 billion as of December 31, 2018 and 2017, and 2016,respectively, including approximately 5,4004,700 vacant beds at fivefour idle facilities in its U.S. Corrections & Detention segment with a carrying value of $139.6$126.0 million which are being marketed to potential customers as of December 31, 2017,2018, excluding equipment and other assets that can be easily transferred for use at other facilities. The Company is also marketing to potential customers 3 idle facilities in its GEO Care segment with a carrying value of $23.4 million.
The Company reviews long-lived assets to be held and used for impairment whenever events or changes in circumstances indicate that the carrying amount of such assets may not be fully recoverable. Events that would trigger an impairment assessment include deterioration of profits for a business segment that has long-lived assets, or when other changes occur that might impair recovery of long-lived assets such as the termination of a management contract or a prolonged decrease in inmate population. If impairment indicators are present, the Company performs a recoverability test to determine whether or not an impairment loss should be measured.
The Company tests idle facilities for impairment upon notification that the facilities will no longer be utilized by the customer. If a long-lived asset is part of a group that includes other assets, the unit of accounting for the long-lived asset is its group. Generally, the Company groups assets by facility for the purpose of considering whether any impairment exists. The estimates of recoverability are based on projected undiscounted cash flows associated with actual marketing efforts where available or, in other instances, projected undiscounted cash flows that are comparable to historical cash flows from management contracts at similar facilities and sensitivity analyses that consider reductions to such cash flows. The Company’s sensitivity analyses include adjustments to projected cash flows compared to the historical cash flows due to current business conditions which impact per diem rates as well as labor and other operating costs, changes related to facility mission due to changes in prospective clients, and changes in projected capacity and occupancy rates. The Company also factors in prolonged periods of vacancies as well as the time and costs required to ramp up facility population once a contract is obtained. The Company performs the impairment analysesanalysis on an annual basis for each of the idle facilities and takes into consideration updates each quarter for market developments affecting the potential utilization of each of the facilities in order to identify events that may cause the Company to reconsider the most recent assumptions. Such events could include negotiations with a prospective customer for the utilization of an idle facility at terms significantly less favorable than the terms used in the Company’s most recent impairment analysis, or changes in legislation surrounding a particular facility that could impact the Company’s ability to house certain types of inmates at such facility. Further, a substantial increase in the number of available beds at other facilities the Company owns, or in the marketplace, could lead to deterioration in market conditions and projected cash flows. Although they are not frequently received, an unsolicited offer to purchase any of the Company’s idle facilities, at amounts that are less than their carrying value could also cause the Company to
reconsider the assumptions used in the most recent impairment analysis. The Company has identified marketing prospects to utilize each of the remaining currently idled facilities and has determined that no current impairment exists. However, the Company can provide no assurance that it will be able to secure management contracts to utilize its idle facilities, or that it will not incur impairment charges in the future. In all cases, the projected undiscounted cash flows in our analysis as of December 31, 20172018 substantially exceeded the carrying amounts of each facility.
The Company’s evaluations also take into consideration historical experience in securing new facility management contracts to utilize facilities that had been previously idled for periods comparable to or in excess of the periods the Company’s currently idle facilities have been idle. Such previously idled facilities are currently being operated under contracts that generate cash flows resulting in the recoverability of the net book value of the previously idled facilities by substantial amounts. Due to a variety of factors, the lead time to negotiate contracts with federal and state agencies to utilize idle bed capacity is generally lengthy which has historically resulted in periods of idleness similar to the ones the Company is currently experiencing. As a result of its analyses, the Company determined each of these assets to have recoverable values substantially in excess of the corresponding carrying values.
By their nature, these estimates contain uncertainties with respect to the extent and timing of the respective cash flows due to potential delays or material changes to forecasted terms and conditions in contracts with prospective customers that could impact the estimate of projected cash flows. Notwithstanding the effects the current economy has had on the Company’s customers’ demand for prison beds in the short term which has led to its decision to idle certain facilities, the Company believes the long-term trends favor an increase in the utilization of its idle correctional facilities. This belief is also based on the Company’s experience in working with governmental agencies faced with significant budgetary challenges which is a primary contributing factor to the lack of appropriated funding to build new bed capacity by federal and state agencies.
Assets Held under Capital Leases
Assets held under capital leases are recorded at the lower of the net present value of the minimum lease payments or the fair value of the leased asset at the inception of the lease. Amortization expense is recognized using the straight-line method over the shorter of the estimated useful life of the asset or the term of the related lease and is included in depreciation expense.
Goodwill and Other Intangible Assets
Goodwill
The Company has recorded goodwill as a result of its business combinations. Goodwill is recorded as the difference, if any, between the aggregate consideration paid for an acquisition and the fair value of the net tangible assets and other intangible assets acquired. The Company’s goodwill is not amortized and is tested for impairment annually on the first day of the fourth quarter, and whenever events or circumstances arise that indicate impairment may have occurred. Impairment testing is performed for all reporting units that contain goodwill. The reporting units are the same as the reportable segment for U.S. Corrections & Detention and are at the operating segment level for GEO Care.
On the annual measurement date of October 1, 2017,2018, the Company’s management elected to qualitatively assess the Company’s goodwill for impairment for all of its reporting units, pursuant to the provisions of Financial Accounting Standards Board (“FASB”) Accounting Standards Update (“ASU”)2011-08.units. Under provisions of the qualitative analysis, when testing goodwill for impairment, the Company first assesses qualitative factors to determine whether the existence of events or circumstances leads to a determination that it is more likely than not that the fair value of a reporting unit is less than its carrying amount. If, after assessing the totality of events or circumstances, the Company determines it is more likely than not that the fair value of a
reporting unit is less than its carrying amount, the Company performs a quantitative impairment test to identify goodwill impairment and measures the amount of goodwill impairment loss to be recognized, if any. The qualitative factors used by the Company’s management to determine the likelihood that the fair value of the reporting unit is less than the carrying amount include, among other things, a review of overall economic conditions and their current and future impact on the Company’s existing business, the Company’s financial performance and stock price, industry outlook and market competition. With respect to the qualitative assessments, management determined that it was more likely than not that the fair values of the reporting units exceeded their carrying values.
Other Intangible Assets
The Company has also recorded other finite and indefinite lived intangible assets as a result of previously completed business combinations. Other acquired finite and indefinite lived intangible assets are recognized separately if the benefit of the intangible asset is obtained through contractual or other legal rights, or if the intangible asset can be sold, transferred, licensed, rented or exchanged, regardless of the Company’s intent to do so. The Company’s intangible assets include facility management contracts, trade names and technology. The facility management contracts represent customer relationships in the form of management contracts acquired at the time of each business combination; the value of BI’s and Protocol’s trade names represent, among other intangible benefits, name recognition to its customers and intellectual property rights; and the acquired technology represents BI’s innovation with respect to its GPS tracking monitoring, radio frequency monitoring, voice verification monitoring and alcohol compliance systems, Protocol’s innovation with respect to its customer relationship management software and Soberlink’s innovation with respect to its alcohol monitoring devices. When establishing useful lives, the Company considers the period and the pattern in which the economic benefits of the intangible asset are consumed or otherwise used up; or, if that pattern cannot be reliably determined, using a straight-line amortization method over a period that may be shorter than the ultimate life of such intangible asset. The Company also considers the impact of renewal terms when establishing useful lives. The Company currently amortizes its acquired facility management contracts over periods ranging from three totwenty-one years and its acquired technology over seven to eight years. There is no residual value associated with the Company’s finite-lived intangible assets. The Company reviews its trade name assets for impairment whenever events or changes in circumstances indicate that the carrying amount of such assets may not be fully recoverable. The Company does not amortize its indefinite lived intangible assets. The Company reviews its indefinite lived intangible assets annually or more frequently if events or changes in circumstances indicate that the asset might be impaired. These reviews resulted in no impairment to the carrying value of the indefinite lived intangible assets for all periods presented. The Company records the costs associated with renewal and extension of facility management contracts as expenses in the period they are incurred.
Internal-Use Software
Costs incurred to develop software for internal use are capitalized and amortized over the estimated useful lives of the software. Costs related to design or maintenance ofinternal-use software are expensed as incurred. As of December 31, 20172018 and 2016,2017, included in Property and Equipment, Net is approximately $30.1$29.6 million and $21.2$30.1 million of capitalizedinternal-use software costs, respectively.
Debt Issuance Costs
Debt issuance costs, net of accumulated amortization of $65.7 million and $49.8 million, and $40.2 million, totaling $42.3$31.1 million and $48.9$42.3 million at December 31, 20172018 and 2016,2017, respectively, are included in Long-Term Debt,Non-Recourse Debt and OtherNon-Current Assets in the accompanying Consolidated Balance Sheets and are amortized to interest expense using the effective interest method over the term of the related debt. When evaluating the accounting for debt transactions and the related costs, in instances when there is a significant decrease in a creditor’s individual principal balance, the Company expenses the associated unamortized debt issuance costs.
Variable Interest Entities
The Company evaluates its joint ventures and other entities in which it has a variable interest (a “VIE”), generally in the form of investments, loans, guarantees, or equity in order to determine if it has a controlling financial interest and is required to consolidate the entity as a result. The reporting entity with a variable interest that provides the entity with a controlling financial interest in the VIE will have both of the following characteristics: (i) the power to direct the activities of a VIE that most significantly impact the VIE’s economic performance and (ii) the obligation to absorb the losses of the VIE that could potentially be significant to the VIE or the right to receive benefits from the VIE that could potentially be significant to the VIE.
The Company does not consolidate its 50% owned South African joint venture interest in SACS, a VIE. SACS joint venture investors are GEO and Kensani Corrections, Pty. Ltd (an independent third party); each partner owns a 50% share. The Company has determined it is not the primary beneficiary of SACS since it does not have the power to direct the activities of SACS that most significantly impact its performance. As such, the Company’s investment in this entity is accounted for under the equity method of accounting. SACS was established and subsequently, in 2001, was awarded a25-year contract to design, finance and build the Kutama Sinthumule Correctional Centre in Louis Trichardt, South Africa. To fund the construction of the prison, SACS obtained long-term financing from its equity partners and lenders, the repayment of which is fully guaranteed by the South African government, except in the event of default, in which case the government guarantee is reduced to 80%. The Company’s maximum exposure for loss under this contract is limited to its investment in the joint venture of $18.1$13.4 million at December 31, 20172018 and its guarantees related to SACS are discussed in Note 13 —Debt.— Debt.
The Company does not consolidate its 50% owned joint venture in the United Kingdom. In February 2011, GEO UK, executed a Shareholders Agreement (the “Shareholders Agreement”) with Amey Community Limited (“Amey”) and Amey UK PLC (“Amey Guarantor”) to form GEOAmey, a private company limited by shares incorporated in England and Wales. GEOAmey was formed by GEO UK and Amey (an independent third party) for the purpose of performing prisoner escort and related custody services in England and Wales. In order to form this private company, GEOAmey issued share capital of £100 divided into 100 shares of £1 each and allocated the shares 50/50 to GEO UK and Amey. GEO UK and Amey each have three directors appointed to the Board of Directors and neither party has the power to direct the activities that most significantly impact the performance of GEOAmey. As such, the Company’s investment in this entity is accounted for under the equity method of accounting. Both parties provideprovided lines of credit of £12.0 million, or $16.2$15.3 million, based on exchange rates in effect as of December 31, 2017,2018, to ensure that GEOAmey can comply with future contractual commitments related to the performance of its operations. As of December 31, 2017, $1.7 millionIn October 2018, the note receivable to each joint venture partner was owed to the Company by GEOAmey under the line of credit.paid off in full.
Fair Value Measurements
The Company defines fair value as the price that would be received to sell an asset or paid to transfer a liability in an orderly transaction between market participants at the measurement date (“exit price”). The Company carries certain of its assets and liabilities at fair value, measured on a recurring basis, in the accompanying Consolidated Balance Sheets. The Company also has certain assets and liabilities which are not carried at fair value in its accompanying Consolidated Balance Sheets and discloses the fair value measurements compared to the carrying values as of each balance sheet date. The Company’s fair value measurements are disclosed in Note 10 — Financial Instruments and Note 11 — Fair Value of Assets and Liabilities. The Company establishes fair value of its assets and liabilities using a fair value hierarchy that prioritizes the inputs to valuation techniques used to measure fair value into three broad levels which distinguish between assumptions based on market data (observable inputs) and the Company’s assumptions (unobservable inputs). The level in the fair value hierarchy within which the respective fair value measurement falls is determined based on the lowest level input that is significant to the measurement in its entirety. Level 1 inputs are quoted market prices in active markets for identical assets or liabilities. Level 2 inputs are other than quotable market prices included in Level 1
that are observable for the asset or liability either directly or indirectly through corroboration with observable market data. Level 3 inputs are unobservable inputs for the assets or liabilities that reflect management’s own assumptions about the assumptions market participants would use in pricing the asset or liability. The Company recognizes transfers between Levels 1, 2 and 3 as of the actual date of the event or change in circumstances that cause the transfer.
Revenue Recognition
Facility management revenuesOn January 1, 2018, the Company adopted Accounting Standards Codification (“ASC”) Topic 606, “Revenue from Contracts with Customers” using the modified retrospective method applied to those contracts that were not completed as of January 1, 2018. The adoption of this standard did not result in a significant change to the Company’s historical revenue recognition policies and there were no significant adjustments that required a cumulative adjustment to retained earnings upon transition.
Revenue is recognized when control of the promised goods or services is transferred to GEO’s customers, in an amount that reflects the consideration GEO expects to be entitled to in exchange for those goods or services. Sales, value added and other taxes GEO collects concurrent with revenue producing activities and that are subsequently remitted to governmental authorities are excluded from revenues. The guidance distinguishes between goods and services. The definition of services under the guidance includes everything other than goods. As such, in the case of GEO, this guidance views the provision of housing as a service.
When a contract includes variable consideration, GEO determines an estimate of the variable consideration and evaluates whether the estimate needs to be constrained; therefore, GEO includes the variable consideration in the transaction price only to the extent that it is probable that a significant reversal of the amount of cumulative revenue recognized as serviceswill not occur when the uncertainty associated with the variable consideration is subsequently resolved. Variable consideration estimates are provided under facility management contracts with approved government appropriations based on a net rate per day per inmate or on a fixed monthly rate, as applicable.updated at each reporting date. A limited number of the Company’sGEO’s domestic contracts have provisions upon which a small portion of the revenue for the contract is based on the performance of certain targets. RevenueDomestically, revenue based on the performance of certain targets is less than 1% of the Company’s consolidated annual revenues.domestic revenues and was not significant during the periods presented. One of GEO’s international contracts, related to its Ravenhall correctional facility project (discussed further below), contains a provision where a significant portion of the revenue for the contract is based on the performance of certain targets. These performance targets are based on specific criteria to be met over specific periods of time. Such criteria includes the Company’s ability to achieve certain contractual benchmarks relative to the quality of service it provides,non-occurrence of certain disruptive events, effectiveness of its quality control programs and its responsiveness to customer requirementsrequirements. The performance of these targets are measured quarterly and concerns. Forthere was no significant constraint on the limited numberestimate of such variable consideration for this contract during the year ended December 31, 2018.
GEO does not disclose the value of unsatisfied performance obligations for (i) contracts wherewith an expected length of one year or less and (ii) contracts for which revenue is recognized at the amount to which GEO has the right to invoice for services performed, which is generally the case for all of GEO’s contracts. Incidental items that are immaterial in the context of the contract are recognized as expense. GEO generally does not incur incremental costs related to obtaining a contract with its customers that would meet the requirement for capitalization. There were no assets recognized from costs to obtain a contract with a customer at December 31, 2018.
The timing of revenue recognition may differ from the timing of invoicing to customers. GEO records a receivable when services are performed which are due from its customers based on the passage of time. GEO records a contract liability if consideration is received in advance of the performance of services. Generally, GEO’s customers do not provide payment in advance of the performance of services. Therefore, any contract liability is not significant at December 31, 2018. Revenue recognized during the year ended December 31, 2018 that was included in the opening balance of unearned revenue was not significant. There have been no significant amounts of revenue recorded in the periods presented from performance obligations either wholly or partially satisfied in prior periods.
The right to consideration under GEO’s contracts is only dependent on the passage of time and is therefore considered to be unconditional. Payment terms and conditions vary by contract type, although, with the exception of the contract receivable related to GEO’s Ravenhall correctional facility (further discussed below), terms generally include a requirement of payment within 30 days after performance obligations are satisfied and generally do not include a significant financing component. There have been no significant changes in receivables or unearned revenue balances during the period other than regular invoicing and collection activity.
The following table disaggregates GEO’s revenue by major source and also provides a reconciliation with revenue information disclosed for reportable segments in Note 15 — Business Segments and Geographic Information:
Year Ended December 31, 2018 (in thousands) | ||||||||||||||||||||
| U.S. Corrections & Detention | GEO Care | International | Facility Construction and Design | Total | ||||||||||||||||
Owned and Leased: Corrections & Detention | $ | 1,110,749 | $ | — | $ | — | $ | — | $ | 1,110,749 | ||||||||||
Owned and Leased: Community-based | — | 170,805 | — | — | 170,805 | |||||||||||||||
Owned and Leased: Youth Services | — | 91,824 | — | — | 91,824 | |||||||||||||||
Managed Only | 382,224 | 4,981 | 253,874 | — | 641,079 | |||||||||||||||
Facility Construction and Design | — | — | — | 4,226 | 4,226 | |||||||||||||||
Non-residential Services and Other | — | 312,703 | — | — | 312,703 | |||||||||||||||
|
|
|
|
|
|
|
|
|
| |||||||||||
Total Revenues | $ | 1,492,973 | $ | 580,313 | $ | 253,874 | $ | 4,226 | $ | 2,331,386 | ||||||||||
|
|
|
|
|
|
|
|
|
| |||||||||||
Year Ended December 31, 2017 (in thousands) | ||||||||||||||||||||
| U.S. Corrections & Detention | GEO Care | International | Facility Construction and Design | Total | ||||||||||||||||
Owned and Leased — Corrections & Detention | $ | 1,055,254 | $ | — | $ | — | $ | — | $ | 1,055,254 | ||||||||||
Owned and Leased — Community-based | — | 149,619 | — | — | 149,619 | |||||||||||||||
Owned and Leased — Youth Services | — | 88,184 | — | — | 88,184 | |||||||||||||||
Managed Only | 382,790 | 3,495 | 195,806 | — | 582,091 | |||||||||||||||
Facility Construction and Design | — | — | — | 115,404 | 115,404 | |||||||||||||||
Non-residential Services and Other | — | 272,868 | — | — | 272,868 | |||||||||||||||
|
|
|
|
|
|
|
|
|
| |||||||||||
Total Revenues | $ | 1,438,044 | $ | 514,166 | $ | 195,806 | $ | 115,404 | $ | 2,263,420 | ||||||||||
|
|
|
|
|
|
|
|
|
| |||||||||||
Year Ended December 31, 2016 (in thousands) | ||||||||||||||||||||
| U.S Corrections & Detention | GEO Care | International | Facility Construction and Design | Total | ||||||||||||||||
Owned and Leased — Corrections & Detention | $ | 1,042,613 | $ | — | $ | — | $ | — | $ | 1,042,613 | ||||||||||
Owned and Leased — Community-based | — | 72,953 | — | — | 72,953 | |||||||||||||||
Owned and Leased — Youth Services | — | 85,235 | — | — | 85,235 | |||||||||||||||
Managed Only | 332,664 | — | 157,363 | — | 490,027 | |||||||||||||||
Facility Construction and Design | — | — | — | 252,401 | 252,401 | |||||||||||||||
Non-residential services and Other | — | 236,261 | — | — | 236,261 | |||||||||||||||
|
|
|
|
|
|
|
|
|
| |||||||||||
Total Revenues | $ | 1,375,277 | $ | 394,449 | $ | 157,363 | $ | 252,401 | $ | 2,179,490 | ||||||||||
|
|
|
|
|
|
|
|
|
| |||||||||||
Owned and Leased — Corrections & Detention
GEO recognizes revenue for corrections & detention housing services where GEO owns or leases the facility as services are performed. GEO provides for the safe and secure housing and care of incarcerated individuals under public-private partnerships with federal, state and local government agencies. This includes providing24-hour care and supervision, including but not limited to, such services as medical, transportation, food service, laundry services and various programming activities. These tasks are considered to be activities to fulfill the safe and secure housing performance obligation and are not considered to be individually separate promises in the contract. Each of these activities is highly interrelated and GEO performs a significant level of integration of these activities. GEO has identified these activities as a bundle of services and determined that each day of the promised service is distinct. The services provided are part of a series of distinct services that are substantially the same and are measured using the same measure of progress (time-based output method). GEO has determined that revenue for these services are recognized over time as it’s customers simultaneously receive and consume the benefits as the services are performed, which is on a continual daily basis, and GEO has a right to payment for performance completed to date. Time-based output methods of revenue recognition are considered to be a faithful depiction of GEO’s efforts to fulfill its obligations under its contracts and therefore reflect the transfer of services to its customers. GEO’s customers generally pay for these services based on a net rate per day per individual or on a fixed monthly rate.
Owned and Leased — Community-based
GEO recognizes revenue for community-based reentry services where GEO owns or leases the facility in a manner similar to its corrections and detention services discussed above. GEO provides individuals nearing the end of their sentence with the resources necessary to productively transition back into society. Through its residential reentry centers, GEO provides federal and state parolees and probationers with temporary housing, rehabilitation, substance abuse counseling and vocational and educational programs. These activities are
considered to be a bundle of services which are a part of a series of distinct services recognized over time based on the same criteria as discussed above for corrections and detention revenues. GEO’s customers also generally pay for these services based on a net rate per day per individual or on a fixed monthly rate.
Owned and Leased — Youth Services
GEO recognizes revenues for youth services where GEO owns or leases the facility in the same manner as discussed above for the housing, supervision, care and rehabilitation of troubled youth residents. The activities to house and care for troubled youth residents are also considered to be a bundle of services which are part of a series of distinct services recognized over time based on the same criteria discussed for the previous two revenue streams. GEO’s customers generally pay for these services based on a net rate per day per individual.
Managed Only
GEO recognizes revenue for its managed only contracts in the same manner as its Owned and Leased Corrections & Detention and Owned and Leased Community-based contracts as discussed above. The primary exception is that GEO does not own or lease the facility. The facility is owned by the customer. In certain targets, revenue is either (i) recorded pro rata when revenue iscircumstances, GEO’s customers may request that GEO make certain capital improvements to the facility or make other payments related to the facility. These payments are amortized as a reduction of revenues over the life of the contract. GEO’s customers generally pay for these services based on a net rate per day per individual or a fixed monthly rate.
Facility Construction and determinable or (ii) recorded whenDesign
Facility Construction and Design revenues during the specified time period lapses. In many instances, the Company is a party to more thanyear ended December 31, 2017 consisted of one contract with the Department of Justice in the State of Victoria (the “State”) for the development and operation of a single entity. In these instances, each contractnew1,300-bed correctional facility (the “Facility”) in Ravenhall, a locality near Melbourne, Australia. The Facility was completed during the fourth quarter of 2017 and GEO is accounted for separately.
Construction revenues are recognized fromcurrently managing the Company’s contracts with certain customers to performFacility under a25-year management contract. There were no facility construction and design revenues related to the facility during the year ended December 31, 2018. GEO’s promise to design and construct the Facility was considered to be a separate and distinct performance obligation from the management obligation which includes the safe and secure housing, care and programming activities for incarcerated individuals similar to the correction & detention services (“project development services”)discussed above. For the obligation to manage the Facility, GEO determined revenue should be recorded over time using a time-based output method based on the same criteria as discussed above for various facilities. In these instances,correction and detention services. Fees included and priced in the Company actscontract for managing the Facility are considered to be stated at their individual estimated stand-alone selling prices using the adjusted market assessment approach. These services are regularly provided by GEO on a stand-alone basis to similar customers within a similar range of amounts. GEO used the expected cost plus margin approach to allocate the transaction price to the construction obligation. GEO was entitled under the contract to receive consideration in the amount of its costs plus a margin.
During the design and construction phase, GEO determined that revenue should be recorded over time and applied cost based input methods using the actual costs incurred relative to the total estimated costs (percentage of completion basis) to determine progress towards contract completion and to calculate the corresponding amount of revenue and gross profit to recognize. Cost based input methods of revenue recognition are considered to be a faithful depiction of GEO’s efforts to satisfy long-term construction contracts and therefore reflect the transfer of goods to the customer as the primary developercustomer controls the work in progress as the Facility is constructed. Cost based input methods of revenue recognition also require GEO to make estimates of net contract revenues and subcontracts with bonded National and/or Regional Design Build Contractors. These construction revenues are recognized as earned on a percentage of completion basis measured bycosts to complete the percentage ofproject. Significant judgment was required to evaluate the costs incurred to date as compared tocomplete the project, including materials, labor, contingencies and other costs. If estimated total cost for each contract. Provisions forcosts on the contract are greater than the net contract revenues, the entire estimated lossesloss on uncompleted contracts and changesthe contract is recognized in the period the loss becomes known. The cumulative effect of revisions to cost estimates related to net contract revenues or costs to complete are maderecorded in the period in which the Company determines that such lossesrevisions to estimates are identified and changes are probable.the amounts can be reasonably
estimated. Typically, the Company enters into fixed price contracts and does not perform additional work unless approved change orders are in place. Costs attributable to unapproved change orders are expensed in the period in which the costs are incurred if the Company believes that it is not probable that the costs will be recovered through a change in the contract price. If the Company believes that it is probable that the costs will be recovered through a change in the contract price, costs related to unapproved change orders are expensed in the period in which they are incurred, and contract revenue is recognized to the extent of the costs incurred. Revenue in excess of the costs attributable to unapproved change orders is not recognized until the change order is approved. Changes in job performance, job conditions, and estimated profitability, including those arising from contract penalty provisions, and final contract settlements, may result in revisions to estimated costs and income, and are recognized in the period in which the revisions are determined. For the years ended December 31, 2017, 2016 and 2015,periods presented, there have beenwere no changes in job performance, job conditions and estimated profitability that would requirerequired a revision to the estimated costs and income relatedrecorded.
GEO was the primary developer of the project and subcontracted with a bonded international design and build contractor to project development services.design and construct the Facility. As the primary contractor for the Company is exposedproject, GEO determined that it was primarily responsible for fulfilling the promise to develop and provide the Facility to the various risks associated withState, including overall responsibility for the acceptability of the project in meeting the State’s specifications. Therefore, GEO was considered to be a principal in the transaction and construction including the risk of cost overruns. Accordingly, the Company records itsrevenues and construction revenuecosts were recorded on a gross basisbasis.
The cost of the project during the design and construction phase was funded by debt financing along with a capital contribution by GEO which was made in January 2017. GEO’s promise to provide the equity contribution was considered to be a separate and distinct performance obligation that is separate from the construction and facility management obligations. The contribution represents a significant financing element which provided a benefit to the State. Costs incurred and estimated earnings in excess of billings were classified as contract receivable in the accompanying consolidated balance sheets. The contract receivable was partially satisfied through a State contribution, which was made in November 2017 upon commercial acceptance of the Facility, and by quarterly payments to be made over the25-year operating phase. The timing of these payments provide the State with a significant benefit of financing for the Facility as the payments by the State occur significantly after performance (construction of the Facility). Therefore, the contract receivable has been recorded at net present value based on the timing of expected future settlement. Interest income is calculated using an effective interest rate of 8.97% and has been presented separately from facility design and construction revenue. Interest income also includes an equity return for GEO’s capital contribution.
During 2018, the Company had facility construction & design services related to an expansion project at its Fulham Correctional Centre in Australia which is expected to be completed in the third quarter of 2020. Revenues have been recorded under the same methodology as discussed above.
Non-residential Services and Other
Non-residential Services and Other revenue consists of the Company’s contracts with federal and various state and local governments to provide location, alcohol and drug detecting electronic monitoring and case management services to individuals on an as needed or as requested basis. This category also includes the related costCompany’s day reporting centers.
GEO recognizes revenues for electronic monitoring and case management services as the services are performed. Services provided consist of construction activities in Operating Expenses.
When evaluating multiple element arrangementscommunity-based supervision (home visits),in-person reporting, telephonic reporting and GPS and other electonic monitoring as well as overall contract management services. The rates for certain contracts where the Company provides project developmentvarious services are considered to be stated at their individual stand-alone selling prices. GEO has determined that the services to its clients in addition to standard management services,be provided are recognized over time based on the Company follows revenue recognition guidance for multiple element arrangements under ASC605-25 “Multiple Element Arrangements”. This revenue recognition guidance related to multiple deliverables in an arrangement provides guidance on determining if separate contracts should be evaluated as a single arrangement and if an arrangement involves a single unit of accounting or separate unitsoccurrence of accountingthe various services as its customer simultaneously receives and ifconsumes the arrangement is determinedbenefits as the services are performed and GEO has a right to have separate units, howpayment for performance completed to allocate amounts received in the arrangementdate. Generally, these services are paid based on a net rate per occurrence and a monthly fee for revenue recognition purposes. In instances where the Company provides these project development services and subsequent management services, generally, theservices.
arrangement results in no delivered elements at the onsetCertain of the agreement. The elementsCompany’s electronic monitoring contracts include providing monitoring equipment and related monitoring services activities (using internal proprietary software platforms) to its customers. These tasks are delivered,considered to be activities to fulfill the promise to provide electronic monitoring services to individuals and revenue is recognized, overare not considered to be individually separate promises in the contract. In the context of the contract, periodthe equipment and monitoring service is not considered to be capable of being distinct as the project developmentcustomer typically cannot benefit from the equipment or monitoring service on its own or with other readily available resources. Management has identified these activities as a bundle of services and managementdetermined that each day or unit of the promised service is distinct. These services are performed. Project developmentpart of a series of distinct services that are generally not provided separately tosubstantially the same and are measured using the same measure of progress (time-based output method) and are therefore accounted for as a customer without a management contract. The Companysingle performance obligation. GEO has determined that services are recognized over time as the significant deliverables in such an arrangement duringcustomer simultaneously receives and consumes the project development phasebenefits as the services are performed and services performed under the management contract qualify as separate units of accounting. With respectGEO has a right to the deliverables during the management services period, the Company regularly negotiates such contracts and provides management servicespayment for performance completed to date.
Services provided for GEO’s day reporting centers are similar to its customers outsideOwned and Leased Community-based services discussed above with the exception of any arrangement for construction. The Company establishes per diem rates for all of its management contracts based on, amongst other factors, expected and guaranteed occupancy, costs of providing the services and desired margins. As such, the fair value of the consideration to each deliverable was determined using the Company’s estimated selling price for the project development deliverable and vendor specific objective evidence for the facility management services deliverable.temporary housing.
Income Taxes
The consolidated financial statements reflect provisions for federal, state, local and foreign income taxes. The Company recognizes deferred tax assets and liabilities for the future tax consequences attributable to differences between the financial statement carrying amounts of existing assets and liabilities and their respective tax basis, as well as operating loss and tax credit carryforwards. The Company measures deferred tax assets and liabilities using enacted tax rates expected to apply to taxable income in the years in which those temporary differences and carryforwards are expected to be recovered or settled. The effect on deferred tax assets and liabilities as a result of a change in tax rates is recognized as income in the period that includes the enactment date. Refer to Note16-Income Taxes. Effective January 1, 2013, as a REIT that is required to distribute at least 90% of its taxable income to shareholders, the Company does not expect to pay federal income taxes at the REIT level (including its qualified REIT subsidiaries), as the resulting dividends paid deduction will generally offset its taxable income. Since the Company does not expect to pay taxes on its REIT taxable income, it does not expect to be able to recognize such deferred tax assets and liabilities.
Deferred income taxes related to the TRS structure are determined based on the estimated future tax effects of differences between the financial statement and tax basis of assets and liabilities given the provisions of enacted tax laws. Significant judgments are required to determine the consolidated provision for income taxes. Deferred income tax provisions and benefits are based on changes to the assets or liabilities from year to year. Realization of the Company’s deferred tax assets is dependent upon many factors such as tax regulations applicable to the jurisdictions in which the Company operates, estimates of future taxable income and the character of such taxable income.
The U.S. Tax Cut and Jobs Act (“Tax Act”) was enacted on December 22, 2017 and introducesintroduced significant changes to U.S. income tax law. Effective in 2018, the Tax Act reducesreduced the U.S. statutory corporate tax rate of our Taxable REIT Subsidiariesdomestic TRSs from 35% to 21% and createscreated new items of taxable income and taxes on certain foreign sourced earnings and certain related-party payments, which are referred to as the global intangiblelow-taxed income tax and the base erosion and antiabuse tax, respectively. In addition, in 2017 the Tax Act providesprovided for aone-time transition tax on accumulated foreign subsidiary earnings not previously subject to U.S. income tax. While the Company has foreign operations, it has provisionally identified that there is no transition tax due. Accounting for the income tax effects of the Tax Act requires significant judgments and estimates in the interpretation and calculations of the provisions of the Tax Act.
Due to the timing of the enactment and the complexity involved in applying the provisions of the Tax Act, the Company has made reasonable estimates of the effects and recorded provisional amounts in its financial statements for the year ended December 31, 2017. As the Company collectscollected and preparesprepared necessary data, and interprets
interpreted any additional guidance issued by the U.S. Treasury Department, the IRS or other standard-setting bodies, it may makemade adjustments over the course of the year to the provisional amounts. Those adjustments may materially impact the provision for income taxes and the effective tax rate in the period in which the adjustments are made.amounts, including refinements to deferred taxes. The accounting for the tax effects of the enactment of the Tax Act will behas been completed inas of December 31, 2018.
Additionally, the Company must use significant judgment in addressing uncertainties in the application of complex tax laws and regulations. If actual circumstances differ from the Company’s assumptions, adjustments to the carrying value of deferred tax assets or liabilities may be required, which may result in an adverse impact on the results of its operations and its effective tax rate. Valuation allowances are recorded related to deferred tax assets based on the “more likely than not” criteria. The Company has not made any significant changes to the way it accounts for its deferred tax assets and liabilities in any year presented in the consolidated financial statements, except for the adoption of ASU2015-17, “Income Taxes,” which requires that all deferred income tax assets and liabilities be classified asnon-current in a classified statement of position. Based on its estimate of future earnings and its favorable earnings history, the Company currently expects full realization of the deferred tax assets net of any recorded valuation allowances. Furthermore, tax positions taken by the Company may not be fully sustained upon examination by the taxing authorities. In determining the adequacy of our provision (benefit) for income taxes, potential settlement outcomes resulting from income tax examinations are regularly assessed. As such, the final outcome of tax examinations, including the total amount payable or the timing of any such payments upon resolution of these issues, cannot be estimated with certainty.
Reserves for Insurance Losses
The nature of the Company’s business exposes it to various types of third-party legal claims, including, but not limited to, civil rights claims relating to conditions of confinement and/or mistreatment, sexual misconduct claims brought by prisoners or detainees, medical malpractice claims, product liability claims, intellectual property infringement claims, claims relating to employment matters (including, but not limited to, employment discrimination claims, union grievances and wage and hour claims), property loss claims, environmental claims, automobile liability claims, contractual claims and claims for personal injury or other damages resulting from contact with our facilities, programs, electronic monitoring products, personnel or prisoners, including damages arising from a prisoner’s escape or from a disturbance or riot at a facility. In addition, the Company’s management contracts generally require it to indemnify the governmental agency against any damages to which the governmental agency may be subject in connection with such claims or litigation. The Company maintains a broad program of insurance coverage for these general types of claims, except for claims relating to employment matters, for which the Company carries no insurance. There can be no assurance that the Company’s insurance coverage will be adequate to cover all claims to which it may be exposed. It is the Company’s general practice to bring merged or acquired companies into its corporate master policies in order to take advantage of certain economies of scale.
The Company currently maintains a general liability policy and excess liability policies with total limits of $80.0 million per occurrence and $100 million in the aggregate covering the operations of U.S. Corrections & Detention, GEO Care’s community based services, GEO Care’s youth services and BI. The Company has a claims-made liability insurance program with a specific loss limit of $35.0 million per occurrence and in the aggregate related to medical professional liability claims arising out of correctional healthcare services. The Company is uninsured for any claims in excess of these limits. We also maintain insurance to cover property and other casualty risks including, workers’ compensation, environmental liability, cybersecurity liability and automobile liability.
For most casualty insurance policies, the Company carries substantial deductibles or self-insured retentions of $3.0 million per occurrence for general liability and medical professional liability, $2.0 million per occurrence for workers’ compensation and $1.0 million per occurrence for automobile liability. In addition, certain of the Company’s facilities located in Florida and other high-risk hurricane areas carry substantial windstorm deductibles. Since hurricanes are considered unpredictable future events, no reserves have been
established topre-fund for potential windstorm damage. Limited commercial availability of certain types of insurance relating to windstorm exposure in coastal areas and earthquake exposure mainly in California and the Pacific Northwest may prevent the Company from insuring some of its facilities to full replacement value.
With respect to operations in South Africa, the United Kingdom and Australia, the Company utilizes a combination of locally-procured insurance and global policies to meet contractual insurance requirements and
protect the Company. In addition to these policies, the Company’s Australian subsidiary carries tail insurance on a general liability policy related to a discontinued contract.
Of the insurance policies discussed above, the Company’s most significant insurance reserves relate to workers’ compensation, general liability and auto claims. These reserves are undiscounted and were $71.0$70.9 million and $51.6$71.0 million as of December 31, 20172018 and 2016,2017, respectively, and are included in Accrued Expenses in the accompanying Consolidated Balance Sheets. The Company uses statistical and actuarial methods to estimate amounts for claims that have been reported but not paid and claims incurred but not reported. In applying these methods and assessing their results, the Company considers such factors as historical frequency and severity of claims at each of its facilities, claim development, payment patterns and changes in the nature of its business, among other factors. Such factors are analyzed for each of the Company’s business segments. The Company estimates may be impacted by such factors as increases in the market price for medical services and unpredictability of the size of jury awards. The Company also may experience variability between its estimates and the actual settlement due to limitations inherent in the estimation process, including its ability to estimate costs of processing and settling claims in a timely manner as well as its ability to accurately estimate the Company’s exposure at the onset of a claim. Because the Company has high deductible insurance policies, the amount of its insurance expense is dependent on its ability to control its claims experience. If actual losses related to insurance claims significantly differ from the Company’s estimates, its financial condition, results of operations and cash flows could be materially adversely impacted.
Comprehensive Income (Loss)
Comprehensive income (loss) represents the change in shareholders’ equity from transactions and other events and circumstances arising fromnon-shareholder sources. The Company’s total comprehensive income is comprised of net income attributable to GEO, net income attributable to noncontrolling interests, foreign currency translation adjustments that arise from consolidating foreign operations that do not impact cash flows, net unrealized gains and/or losses on derivative instruments, and pension liability adjustments in the consolidated statements of shareholders’ equity.
The components of accumulated other comprehensive loss attributable to GEO included in the consolidated statement of shareholders’ equity are as follows (in thousands):
| Foreign currency translation adjustments, net of tax attributable to The GEO Group, Inc. [1] | Unrealized loss on derivatives, net of tax | Pension adjustments, net of tax | Total | Foreign currency translation adjustments, net of tax attributable to The GEO Group, Inc. [1] | Unrealized loss on derivatives, net of tax | Pension adjustments, net of tax | Total | |||||||||||||||||||||||||
Balance, December 31, 2016 | $ | (11,284 | ) | $ | (15,877 | ) | $ | (3,664 | ) | $ | (30,825 | ) | ||||||||||||||||||||
Balance, December 31, 2017 | $ | (7,470 | ) | $ | (11,892 | ) | $ | (5,084 | ) | $ | (24,446 | ) | ||||||||||||||||||||
Current-period other comprehensive income (loss) | 3,814 | 3,985 | (1,420 | ) | 6,379 | (7,103 | ) | 6,146 | 1,785 | 828 | ||||||||||||||||||||||
|
|
|
|
|
|
|
| |||||||||||||||||||||||||
Balance, December 31, 2017 | $ | (7,470 | ) | $ | (11,892 | ) | $ | (5,084 | ) | $ | (24,446 | ) | ||||||||||||||||||||
Balance, December 31, 2018 | $ | (14,573 | ) | $ | (5,746 | ) | $ | (3,299 | ) | $ | (23,618 | ) | ||||||||||||||||||||
|
|
|
|
|
|
|
| |||||||||||||||||||||||||
| [1] | The foreign currency translation adjustment, net of tax, related to noncontrolling interests was not significant for the |
There were no reclassifications out of accumulated other comprehensive income (loss) during the year.
Foreign Currency Translation
The Company’s foreign operations use their local currencies as their functional currencies. Assets and liabilities of the operations are translated at the exchange rates in effect on the balance sheet date and shareholders’ equity is translated at historical rates. Income statement items are translated at the average exchange rates for the year. Any adjustment resulting from translating the financial statements of the foreign
subsidiary is reflected as other comprehensive income, net of related tax. Gains and losses on foreign currency transactions are included in the statement of operations.
Derivatives
The Company’s primary objective in holding derivatives is to reduce the volatility of earnings and cash flows associated with changes in interest rates. The Company measures its derivative financial instruments at fair value and records derivatives as either assets or liabilities on the balance sheet. For derivatives that are designed as and qualify as effective cash flow hedges, the portion of gain or loss on the derivative instrument effective at offsetting changes in the hedged item is reported as a component of accumulated other comprehensive income and reclassified into earnings when the hedged transaction affects earnings. For derivative instruments that are designated as and qualify as effective fair value hedges, the gain or loss on the derivative instruments as well as the offsetting gain or loss on the hedged items attributable to the hedged risk is recognized in current earnings as interest income (expense) during the period of the change in fair values. For derivative instruments that do not meet the requirements for hedge accounting, changes in fair value are recorded in earnings.
The Company formally documents all relationships between hedging instruments and hedge items, as well as its risk-management objective and strategy for undertaking various hedge transactions. This process includes attributing all derivatives that are designated as cash flow hedges to floating rate liabilities and attributing all derivatives that are designated as fair value hedges to fixed rate liabilities. The Company also assesses whether each derivative is highly effective in offsetting changes in the cash flows of the hedged item. Fluctuations in the value of the derivative instruments are generally offset by changes in the hedged item; however, if it is determined that a derivative is not highly effective as a hedge or if a derivative ceases to be a highly effective hedge, the Company will discontinue hedge accounting prospectively for the affected derivative.
Stock-Based Compensation Expense
The Company recognizes the cost of stock-based compensation awards based upon the grant date fair value of those awards. The Company uses a Black-Scholes option valuation model to estimate the fair value of options awarded. The impact of forfeitures that may occur prior to vesting is also estimated and considered in the amount recognized. Stock-based compensation expense is recognized ratably over the requisite service period, which is typically the vesting period.
The fair value of stock-based option awards was estimated using the Black-Scholes option-pricing model with the following weighted average assumptions for options awarded during years 2018, 2017 2016 and 2015:2016:
| 2017 | 2016 | 2015 | 2018 | 2017 | 2016 | |||||||||||||||||||
Risk free interest rates | 1.53 | % | 1.45 | % | 1.00 | % | 2.84 | % | 1.53 | % | 1.45 | % | ||||||||||||
Expected term | 4-5 years | 4-5 years | 4-5 years | 4-5 years | 4-5 years | 4-5 years | ||||||||||||||||||
Expected volatility | 36 | % | 25 | % | 24 | % | 40 | % | 36 | % | 25 | % | ||||||||||||
Expected dividend rate | 5.79 | % | 8.85 | % | 5.75 | % | 8.70 | % | 5.79 | % | 8.85 | % | ||||||||||||
The Company uses historical data to estimate award exercises and employee terminations within the valuation model. The expected term of the awards represents the period of time that awards granted are expected to be outstanding and is based on historical data and expected holding periods.
For restricted stock share-based awards that contain a performance condition, the achievement of the targets must be probable before any share-based compensation is recorded. If subsequent to initial measurement there is
a change in the estimate of the probability of meeting the performance condition, the effect of the change in the estimated quantity of awards expected to vest is recognized by cumulatively adjusting compensation expense. If ultimately the performance targets are not met, for any awards where vesting was previously deemed probable, previously recognized compensation expense will be reversed in the period in which vesting is no longer deemed probable.
For restricted stock share-based awards that contain a market condition, the probability of satisfying the market condition is considered in the estimate of grant-date fair value and previously recorded compensation expense is not reversed if the market condition is never met. The fair value of restricted stock awards granted in 2018, 2017 2016 and 20152016 with market-based performance conditions was determined based on a Monte Carlo simulation, which calculates a range of possible outcomes and the probabilities that they will occur, using the following average key assumptions:
| 2017 | 2016 | 2015 | 2018 | 2017 | 2016 | |||||||||||||||||||
Expected volatility | 42.2 | % | 23.5 | % | 21.4 | % | 44.5 | % | 42.2 | % | 23.5 | % | ||||||||||||
Beta | 1.11 | 1.04 | 0.78 | 1.05 | 1.11 | 1.04 | ||||||||||||||||||
Risk free interest rate | 1.46 | % | 1.08 | % | 0.93 | % | 2.58 | % | 1.46 | % | 1.08 | % | ||||||||||||
Earnings Per Share
Basic earnings per share is computed by dividing the income from continuing operations attributable to GEO, and income (loss) from discontinued operations and net income attributable to GEO, by the weighted average number of outstanding shares of common stock. The calculation of diluted earnings per share is similar to that of basic earnings per share, except that the denominator includes the dilutive effect, if any, of common stock equivalents such as stock options and shares of restricted stock.
Recent Accounting Pronouncements
The Company implemented the following accounting standards during the year ended December 31, 2017:2018:
In January 2017,May 2014, the Financial Accounting Standards Board (“FASB”), issued a new standard related to revenue recognition (ASU2014-09, “Revenue from Contracts with Customers”. Under the new standard, revenue is recognized when a customer obtains control of promised goods or services and is recognized in an amount that reflects the consideration which the entity expects to receive in exchange for those goods or services. In addition, the standard requires disclosure of the nature, amount, timing, and uncertainty of revenue and cash flows arising from contracts with customers. The FASB has issued ASUNo. 2017-04, “Intangibles-Goodwillseveral amendments to the standard, including clarification on accounting for licenses of intellectual property and Other,” which is intendedidentifying performance obligations. The guidance permits two methods of adoption: retrospectively to simplifyeach prior reporting period presented (full retrospective method), or retrospectively with the test for goodwill impairment. To simplifycumulative effect of initially applying the subsequent measurement of goodwill, this update eliminates Step 2 from the goodwill impairment test. In computing the implied fair value of goodwill under Step 2, an entity had to perform procedures to determine the fair valueguidance recognized at the impairment testing date of its assets and liabilities following the procedure that would be required in determining the fair value of assets acquired and liabilities assumed in a business combination. Instead, under the amendments in this update, an entity should perform its annual, or interim, goodwill impairment test by comparing the fair value of a reporting unit with its carrying amount. An entity should recognize an impairment chargeinitial application (the modified retrospective transition method). The new standard became effective for the amount by which the carrying amount exceeds the reporting unit’s fair value. An entity still has the option to perform the qualitative assessment for a reporting unit to determine if the quantitative impairment test is necessary. The amendments in this update are effective for public companies for fiscal yearsCompany beginning after December 15, 2019, including interim periods within those fiscal years. Early adoption is permitted for interim or annual goodwill tests performed on testing dates after January 1, 2017.2018 and the Company used the modified retrospective transition method to implement this standard. The Company elected to early adopt this standard during the fourth quarter of 2017. The implementationadoption of this standard did not have a material impact on the Company’s financial position, results of operations or cash flows. Disclosures related to the nature, amount and timing of revenue and cash flows arising from contracts with customers are included in theRevenue Recognition section herein.
In MarchAugust 2016, the FASB issuedASUNo. 2016-09,2016-15, “Statement “Compensation — Stock Compensation (Topic 718),” as a part of its simplification initiative. The Company adopted this ASU during 2017. Key areas of the amendments in this standard are (i) all excess tax benefits (deficiencies) from stock plan transactions should be recognized in the income statement as opposed to being recognized in additionalpaid-in capital; (ii) the tax withholding threshold for triggering liability accounting on a net settlement transaction has been increased from the minimum statutory rate to the maximum statutory rate; and (iii) an entity can make an entity-wide accounting policy election to either estimate the number of awards that are expected to vest or account for forfeitures as they occur. The guidance also provides clarification ofCash Flows,” which clarified the presentation of certain components of share-based awardsand classification in the statement of cash flows. The Company has elected to continue estimating forfeitures expected to occur in order to determine the amount of compensation cost to be recognized each period and to apply theflows for eight specific cash flow classification guidance prospectively. Asissues with the objective of reducing diversity in practice. These cash flow issues include debt prepayment or debt extinguishment costs, settlementof zero-coupon debt instruments, contingent consideration payments made after a result, excess tax benefits are now classified as an operating activity rather than a financing activitybusiness combination, proceeds from the settlement of insurance claims, proceeds from the settlement of corporate-owned life insurance policies (including bank-owned life insurance policies), distributions received from equity method investees, beneficial interests in securitization transactions and also addresses separately identified cash flows and the Company has recorded $1.6 millionapplication of excess tax benefits from stock plan transactions as a component of income tax expensethe predominance principle. The amendments in the consolidated statement of operationsASU No. 2016-15 became effective for the year ended
December 31, 2017.the Company on January 1, 2018. The Company has excluded the excess tax benefits from the assumed proceeds available to repurchase shares in the computation of its diluted earnings per share for the year ended December 31, 2017.
In March 2016, the FASB issued ASU2016-05, “Derivatives and Hedging,” which clarifies that a change in the counter party to a derivative instrument that has been designated as a hedging instrument does not, in and of itself, require dedesignation of that hedging relationship provided that all other hedge accounting criteria continue to be met. The Company adopted this ASU during the year ended December 31, 2017 and elected to apply the amendments in this standard on a prospective basis. The implementation of this standard did not have a material impact on the Company’s financial position, results of operations or cash flows.
In March 2016, the FASB issued ASU2016-07, “Investments — Equity Method and Joint Ventures,” as a part ofcumulative earnings approach to classify distributions received from its simplification initiative. The amendments in this standard eliminate the requirement that when an investment qualifies for use of the equity method as a result of an increase in the level of ownership interest or degree of influence, an investor must adjust the investment, results of operations,investees and retained earnings retroactively on astep-by step basis as if the equity method had been in effect during all previous periodsdetermined that the distributions are a return on investment had been held. The amendments require that the equity method investor add the cost of acquiring the additional interest in the investee to the current basis of the investor’s previously held interest and adopt the equity method of accountingare therefore classified as of the date the investment becomes qualified for equity method accounting. Therefore, upon qualifying for the equity method of accounting, no retroactive adjustment of the investment is required. The amendments in ASU2016-07 also require that an entity that has anavailable-for-sale equity security that becomes qualified for the equity method of accounting recognize through earnings the unrealized holding gain or loss in accumulated other comprehensive income at the date the investment becomes qualified for use of the equity method. The Company adopted this ASU during the year ended December 31, 2017 and elected to apply the amendments in this standard on a prospective basis.cash inflows from operating activities. The implementation of this standard did not have a material impact on the Company’s financial position, results of operations or cash flows.
In October 2016, the FASB issued ASUNo. 2016-17,2016-16, “ConsolidationIncome Taxes — Interest Held through Related Parties that are Under Common Control Intra-Entity Transfers of Assets Other Than Inventory,” which amendsas a part of its simplification initiative. The amendments in this standard require entities to recognize the income tax consequences of an intra-entity transfer of an asset other than inventory when the transfer occurs. Under prior generally accepted accounting principles, the recognition of current consolidation guidanceand deferred income taxes for an intra-entity asset transfer was prohibited until the asset had been sold to an outside party. The new standard became effective for the Company on howJanuary 1, 2018. The amendments in this standard were applied on a reporting entity that ismodified retrospective basis through a cumulative-effect adjustment directly to retained earnings or an other component of equity as of the single decision makerbeginning of a VIE should treat indirect interests in the entity held through related parties that are under common control with the reporting entity when determining whether it is the primary beneficiary of that VIE.adoption period. The primary beneficiary of a VIE is the reporting entity that has a controlling financial interest in a VIE, and therefore consolidates the VIE. A reporting entity has an indirect interest in a VIE if it has a direct interest in a related party that, in turn, has a direct interest in the VIE. The Company adopted this ASU during the year ended December 31, 2017. The implementationadoption of this standard did not have a material impact on the Company’s financial position, results of operations or cash flows.
The following accounting standards will be adopted in future periods:
In February 2018,November 2016, the FASB issuedASUNo. 2018-022016-18, “Statement “Income Statement-Reporting Comprehensive Income-Reclassification of Certain Tax Effects from Accumulated Other Comprehensive IncomeCash Flows — Restricted Cash,”. The amendments which requires that a statement of cash flows explain the change during the period in this update allow an entity to elect to reclassify the income tax effects resulting fromtotal of cash, cash equivalents and amounts generally described as restricted cash or restricted cash equivalents. Therefore, amounts generally described as restricted cash and restricted cash equivalents should be included with cash and cash equivalents when reconciling the Tax Cutsbeginning-of-period and Jobs Actend-of-period total amounts shown on items within accumulated other comprehensive income to retained earnings.the statement of cash flows. The new standard isbecame effective for all entities for fiscal years beginning after December 15,the Company on January 1, 2018 and interim periods within those fiscal years. Earlywas applied using a retrospective transition method to each period presented. The adoption is permitted. The Company is in the process of evaluating whether orthis standard did not the Company will make such an election and whether or not the new standard would have a material impact on the Company’s financial position, results of operations or cash flows.
In August 2017, the FASB issued ASUNo. 2017-12 “Derivatives and Hedging — Targeted Improvements to Accounting for Hedging Activities”. The objective of this guidance is to improve the financial reporting of hedging relationships to better portray the economic results of an entity’s risk management activities in its
financial statements. Certain As a result of the amendments in this update as they relate to cash flow hedges, eliminate the requirement to separately record hedge ineffectiveness currently in earnings. Instead, the entire change in the fair value of the hedging instrument is recorded in other comprehensive income. Those amounts are reclassified to earnings in the same income statement line item that is used to present the earnings effect of the hedged item when the hedged item affects earnings. The new standard is effective for the Company beginning January 1, 2019. The adoption of this standard, is not expected to have a material impact on the Company’s financial position, resultsConsolidated Statement of operations or cash flows.
In May 2017, the FASB issued ASUNo. 2017-10 “Service Concession Arrangements — Determining the Customer of the Operation Services”. The objective of this guidance is to reduce diversity in practice and provide clarification on how an operating entity determines the customer of the operation services for transactions within the scope of Topic 853, Service Concessions Arrangements. The amendments in this update clarify that the grantor is the customer of the operation services in all cases for such arrangements. The new standard was effectiveCash Flows for the Company beginning on January 1, 2018. The adoption of this standard is not expectedyears ended December 31, 2017 and 2016 have been retrospectively adjusted. Refer to have a material impact ontheRestricted Cash and Cash Equivalents section herein for additional disclosures required under the Company’s financial position, results of operations or cash flows.
In May 2017, the FASB issued ASUNo. 2017-09 “Compensation — Stock Compensation”. The objective of this guidance is to provide clarity and reduce both (1) diversity in practice and (2) cost and complexity when applying modification accounting for changes in the terms or conditions of share-based payment awards. An entity should account for the effects of a modification unless all of the following factors are met: (i) the fair value of the modified award is the same as the fair value of the original award immediately before the award is modified; (ii) the vesting conditions of the modified award are the same as the vesting conditions of the original award immediately before the original award is modified; and (iii) the classification of the modified award as an equity instrument or a liability instrument is the same as the classification of the original award immediately before the original award is modified. The new standard will be effective for all entities for fiscal years beginning after December 15, 2017 with early adoption permitted for public companies for reporting periods for which financial statements have not yet been issued. The amendments in this update should be applied prospectively to an award modified on or after the adoption date. The adoption of this standard is not expected to have a material impact on the Company’s financial position, results of operations or cash flows.
In March 2017, the FASB issued ASUNo. 2017-07 “Compensation — Retirement Benefits (Topic 715)-Improving the Presentation of Net Periodic Pension Cost and Net Periodic Postretirement Benefit Cost”. This guidance revises how employers that sponsor defined benefit pension and other postretirement plans present the net periodic benefit cost in their income statement and requires that the service cost component of net periodic benefit cost be presented in the same income statement line items as other employee compensation costs from services rendered during the period. Of the components of net periodic benefit cost, only the service cost component will be eligible for asset capitalization. The other components of the net periodic benefit cost must be presented separately from the line items that include the service cost and outside of any subtotal of operating income on the income statement. The new standard will be effective for public companies for fiscal years beginning after December 15, 2017 on a retroactive basis. Early adoption is permitted. The adoption of this standard is not expected to have a material impact on the Company’s financial position, results of operations or cash flows.standard.
In January 2017, the FASB issued ASUNo. 2017-01, “Business Combinations,” which clarifies the definition of a business with the objective of adding guidance to assist entities with evaluating whether transactions should be accounted for as acquisitions (or disposals) of assets or businesses. The update provides a screen to determine when an integrated set of assets and activities (collectively referred to as a “set”) is not a business. The screen requires that when substantially all of the fair value of the gross assets acquired (or disposed of) is concentrated in a single identifiable asset or a group of similar identifiable assets, the set is not a business. This screen reduces the number of transactions that need to be further evaluated. If the screen is not met, the amendments in this update (1) require that to be considered a business, a set must include, at a minimum, an input and a substantive process that together significantly contribute to the ability to create output and (2) remove
removes the evaluation of whether a market participant could replace missing elements. The amendments provide a framework to assist entities in evaluating whether both an input and a substantive process are present. The amendments in this update arebecame effective for public companies for fiscal years beginning after December 15, 2017, including interim periods within those fiscal years.the Company on January 1, 2018. The implementation of this standard isdid not expected to have a material impact on the Company’s financial position, results of operations or cash flows.
In October 2016,March 2017, the FASB issued ASUNo. 2016-16,2017-07 “Income TaxesCompensation — Intra-Entity Transfers Retirement Benefits (Topic 715)-Improving the Presentation of Assets Other Than InventoryNet Periodic Pension Cost and Net Periodic Postretirement Benefit Cost,”. This guidance revises how employers that sponsor defined benefit pension and other postretirement plans present the net periodic benefit cost in their income statement and requires that the service cost component of net periodic benefit cost be presented in the same income statement line items as other employee compensation costs from services rendered during the period. Of the components of net periodic benefit cost, only the service cost component will be eligible for asset capitalization. The other components of the net periodic benefit cost must be presented separately from the line items that include the service cost and outside of any subtotal of operating income on the income statement. The new standard became effective for the Company on January 1, 2018. The adoption of this standard did not have a partmaterial impact on the Company’s financial position, results of its simplification initiative.operations or cash flows.
In May 2017, the FASB issued ASUNo. 2017-10 “Service Concession Arrangements — Determining the Customer of the Operation Services”. The objective of this guidance is to reduce diversity in practice and provide clarification on how an operating entity determines the customer of the operation services for transactions within the scope of Topic 853, Service Concessions Arrangements. The amendments in this standard require entities to recognizeupdate clarify that the income tax consequencesgrantor is the customer of an intra-entity transfer of an asset other than inventory when the transfer occurs. Under prior generally accepted accounting principles, the recognition of current and deferred income taxesoperation services in all cases for an intra-entity asset transfer was prohibited until the asset has been sold to an outside party.such arrangements. The new standard will bewas effective for public companiesthe Company beginning on January 1, 2018. The adoption of this standard did not have a material impact on the Company’s financial position, results of operations or cash flows.
In May 2017, the FASB issued ASUNo. 2017-09 “Compensation — Stock Compensation”. The objective of this guidance is to provide clarity and reduce both (1) diversity in practice and (2) cost and complexity when applying modification accounting for annual reporting periods beginning after December 15, 2017, including interim reporting periods within those annual reporting periods with early adoption permitted under certain circumstances.changes in the terms or conditions of share-based payment awards. An entity should account for the effects of a modification unless all of the following factors are met: (i) the fair value of the modified award is the same as the fair value of the original award immediately before the award is modified; (ii) the vesting conditions of the modified award are the same as the vesting conditions of the original award immediately before the original award is modified; and (iii) the classification of the modified award as an equity instrument or a liability instrument is the same as the classification of the original award immediately before the original award is modified. The new standard became effective for the Company on January 1, 2018. The amendments in this update should be applied prospectively to an award modified on a modified retrospective basis through a cumulative-effect adjustment directly to retained earnings as of the beginning ofor after the adoption period.date. The adoption of this standard did not have a material impact on the Company’s financial position, results of operations or cash flows.
The following accounting standards will be adopted in future periods:
In August 2018, the FASB issued ASUNo. 2018-14 “Compensation-Retirement Benefits-Defined Benefit Plans-General (Topic 715.20)”as a part of its disclosure framework project. The amendments in this update remove, modify and add certain disclosures primarily related to amounts in accumulated other comprehensive income expected to be recognized as components of net periodic benefit cost over the next fiscal year, explanations for reasons for significant gains and losses related to changes in the benefit obligation for the period, and projected and accumulated benefit obligations. The new standard is effective for the Company beginning January 1, 2021. The adoption of this standard is not expected to have a material impact on the Company’s financial position, results of operations or cash flows.
In August 2016,2018, the FASB issued ASUASU No. 2016-15, “Statement2018-13 “Fair Value Measurement (Topic 820)”as a part of Cash Flows,” which clarified the presentationits disclosure framework project. The amendments in this update remove, modify and classification in the statement of cash flows for eight specific cash flow issues with the objective of reducing diversity in practice. These cash flow issues include debt prepayment or debt extinguishment costs, settlementof zero-coupon debt instruments, contingent consideration payments made after a business combination, proceeds from the settlement of insurance claims, proceeds from the settlement of corporate-owned life insurance policies (including bank-owned life insurance policies), distributions received from equity method investees, beneficial interests in securitization transactionsadd certain disclosures primarily related to transfers between Level 1 and also addresses separately identified cash flows and the applicationLevel 2 of the predominance principle.fair value hierarchy, various disclosures related to Level 3 fair value measurements and investments in certain entities that calculate net asset value. The amendments inASU No. 2016-15 arenew standard is effective for public companies for fiscal yearsthe Company beginning after December 15, 2017 and interim periods within those fiscal years.January 1, 2020. The implementationadoption of this standard is not expected to have a material impact on the Company’s financial position, results of operations or cash flows.
In June 2018, the FASB issued ASUNo. 2018-07 “Compensation — Stock Compensation (Topic 718), Improvements to Nonemployee Share-Based Payment Accounting”as a part of its Simplification Initiative. The amendments in this update expand the scope of Topic 718 to include share-based payment transactions for acquiring goods and services from nonemployees. An entity should apply the requirements of Topic 718 to nonemployee awards except for specific guidance on inputs to an option pricing model and the period of time over which share-based payment awards vest and the pattern of cost recognition over that period. The amendment specify that Topic 718 applies to all share-based payment transactions in which a grantor acquires goods or services to be used or consumed in a grantor’s own operations by issuing share-based payment awards. The amendments also clarify that Topic 718 does not apply to share-based payments used to effectively provide (1) financing to the issuer or (2) awards granted in conjunction with selling goods or services to customers as part of a contract accounted for under Topic606-”Revenue from Contracts with Customers.” The new standard is effective for the Company beginning January 1, 2019. The adoption of this standard is not expected to have a material impact on the Company’s financial position, results of operations or cash flows.
In February 2018, the FASB issued ASUNo. 2018-02 “Income Statement-Reporting Comprehensive Income-Reclassification of Certain Tax Effects from Accumulated Other Comprehensive Income”. The amendments in this update allow an entity to elect to reclassify the income tax effects resulting from the Tax Cuts and Jobs Act on items within accumulated other comprehensive income to retained earnings. The new standard is effective for all entities for fiscal years beginning after December 15, 2018, and interim periods within those fiscal years. Early adoption is permitted. The adoption of this standard is not expected to have a material impact on the Company’s financial position, results of operations or cash flows.
In August 2017, the FASB issued ASUNo. 2017-12, “Derivatives and Hedging — Targeted Improvements to Accounting for Hedging Activities.” The objective of this guidance is to improve the financial reporting of hedging relationships to better portray the economic results of an entity’s risk management activities in its financial statements. Certain of the amendments in this update as they relate to cash flow hedges, eliminate the requirement to separately record hedge ineffectiveness currently in earnings. Instead, the entire change in the fair value of the hedging instrument is recorded in other comprehensive income. Those amounts are reclassified to earnings in the same income statement line item that is used to present the earnings effect of the hedged item when the hedged item affects earnings. The new standard is effective for the Company beginning January 1, 2019. The adoption of this standard is not expected to have a material impact on the Company’s financial position, results of operations or cash flows.
In June 2016, the FASB issued ASC No.2016-13,”Financial Instruments — Credit Losses (Topic 326): Measurement of Credit Losses on Financial Instruments”. The purpose of UpdateNo. 2016-13 is to replace the current incurred loss impairment methodology for financial assets measured at amortized cost with a methodology that reflects expected credit losses and requires consideration of a broader range of reasonable and supportable information, including forecasted information, to develop credit loss estimates. UpdateNo. 2016-13 is effective for annual periods beginning after December 15, 2019, including interim periods within those annual periods. Early adoption is permitted for annual periods beginning after December 15, 2018. The Company is in the process of determining the effect that the adoption will have on its financial position and results of operations.
In February 2016, FASB issued ASU2016-02, “Leases,” which requires entities to recognize lease assets and lease liabilities on the balance sheet and to disclose key information about leasing arrangements. For finance leases and operating leases, a lessee should recognize in the statement of financial position a liability to make lease payments (the lease liability) and aright-of-use asset representing its right to use the underlying asset for the lease term with each initially measured at the present value of the lease payments. The FASB has recently issued several amendments to the standard, including accounting for land easements. The amendments inASU2016-02 are effective for public companies for fiscal years beginning after December 15, 2018, including interim periods within those fiscal years. In July 2018, the FASB issued ASU2018-11 which provides for an optional transition method where an entity initially applies the new lease standard at the adoption date and recognizes a cumulative-effect adjustment to the opening balance of retained earnings. Consequently, an entity’s reporting for the comparative periods presented in the financial statements in which it adopts the new lease standard will continue to be in accordance with current generally accepted accounting principles (Topic 840, “Leases”). Alternatively, lessees and lessors are requiredcan elect to recognize and measure leases at the beginning of the earliest period presented using a modified retrospective approach. The Company has elected to apply the new lease standard at the adoption date on January 1, 2019 under the optional transition method as outlined inASU 2018-11. There are also several practical expedients that entities may elect upon transition relating toshort-term leases (twelve-month terms or less),non-lease components, reassessing certain lease decision points for existing leases, using hindsight in determining the lease term and land easements. With regard to these practical expedients, the Company has elected not to apply the recognition requirements to lease arrangements that have terms of twelve months or less. The Company has also elected to not reassess the major lease decision points for existing leases (whether a contract contains a lease, how a lease should be classified and whether previously capitalized initial direct costs meet the new standard definition). The Company has implemented a lease management software application tool and is currently assessingto assist with the assessment of the impact that the adoption of
ASU2016-02 will have on its consolidated financial position or results of operations, but expects that it will result in a significant increase in its long-term assets and liabilities given the significant number of leases as disclosed in Note 17 — Commitments and Contingencies.
In May 2014, the FASB issued a new standard related to revenue recognition (ASU2014-09, “Revenue from Contracts with Customers”.) Under the new standard, revenue is recognized when a customer obtains control of promised goods or services and is recognized in an amount that reflects the consideration which the entity expects to receive in exchange for those goods or services. In addition, the standard requires disclosure of the nature, amount, timing, and uncertainty of revenue and cash flows arising from contracts with customers. The FASB has recently issued several amendments to the standard, including clarification on accounting for licenses of intellectual property and identifying performance obligations. The guidance permits two methods of adoption: retrospectively to each prior reporting period presented (full retrospective method), or retrospectively with the
cumulative effect of initially applying the guidance recognized at the date of initial application (the modified retrospective transition method). The new standard became effective for the Company beginning on January 1, 2018 and the Company used the modified retrospective transition method to implement this standard. The Company has completed its evaluation of the effects of the implementation of this standard and has determined that it will not have a material impact on the Company’s financial position, results of operations or cash flows. The Company did identify, asoperations. As a result of its analysis, certain reclassifications between revenuesassessment, the Company expects to record aright-of-use asset in the range of approximately $135 million to $140 million, a short-term lease liability in the range of $37 million to $42 million and operating expenses for payments madea long-term lease liability in the range of $100 million to certain$105 million at the time of adoption on January 1, 2019 with no adjustment to retained earnings. The Company is continuing to evaluate the effect that this guidance will have on its customers. However, these reclassifications were not considered to be significantconsolidated financial statements and are less than $2.0 million annually. Lastly, certain additional disclosures will be required under the new standard which will be implemented during the first quarter of 2018.related disclosures.
Other recent accounting pronouncements issued by the FASB (including its Emerging Issues Task Force), the American Institute of Certified Public Accountants and the SEC did not, or are not expected to, have a material effect on the Company’s results of operations or financial position.
| 2. | Business Combinations |
Community Education Centers Acquisition
On April 5, 2017, the Company completed its acquisition of CEC, pursuant to a definitive merger agreement entered into on February 12, 2017 between the Company, GEO/DE/MC/01 LLC, and CEC Parent Holdings LLC. CEC is a private provider of rehabilitation services for offenders in reentry andin-prison treatment facilities as well as management services for county, state and federal correctional and detention facilities. CEC’s operations encompass over 12,000 beds nationwide. Under the terms of the merger agreement, the Company acquired 100% of the voting interests in CEC for $353.6 million, net of cash acquired of $3.0 million, in an all cash transaction, excluding transaction related expenses paid at closing of $4.1 million. At the time of the acquisition, approximately $115.0 million of CEC indebtedness, including accrued interest, was outstanding. All indebtedness of CEC was repaid by the Company with a portion of the $353.6 million merger consideration. The purchase price was reduced by $2.6 million as a result of the final working capital target settlement received by the Company during the third quarter ended September 30, 2017. Additionally, for tax periods ending on or prior to December 31, 2018, the purchase price may be adjusted for any tax benefits realized by the Company attributable to certain transactional tax deductions if such deductions are able to be taken by the Company and will result in an incremental tax benefit. The Company has estimated a maximum potential adjustment of approximately $1.9 million but has preliminarily estimated the fair value of this contingency at zero at the acquisition date. The Company is still reviewing the various tax implications of the acquisition which may impact the ultimate fair value of this contingency.
Purchase price allocation
GEO is identified as the acquiring company for US GAAP accounting purposes. Under the acquisition method of accounting, the purchase price for CEC was allocated to CEC’s net tangible and intangible assets based on their estimated fair values as of April 5, 2017, the date of closing and the date that the Company obtained control of CEC. In order to determine the fair values of certain tangible and intangible assets acquired, the Company engaged a third party independent valuation specialist. For all other assets acquired and liabilities assumed, the recorded fair value was determined by the Company’s management and represents an estimate of the price that would be received to sell an asset or paid to transfer a liability in an orderly transaction between market participants.
The allocation of the purchase price for this transaction was complete as of April 5, 2017 has not been finalized. The primary areas of the preliminary purchase price allocations that are not finalized relate to the fair values of liabilities acquired and income taxes. The Company expects to continue to obtain information to assist in determining the fair value of the net assets acquired at the acquisition date duringMarch 31, 2018. During the measurement period. Measurement period, adjustments that the Company determines to be material will be recorded in the reporting
period in which the adjustment amounts are determined. During the year ended December 31, 2017, the Company made measurement period adjustments of approximately $6.7 million toadjusted provisional amounts with respect to the CEC acquisition that were recognized at the acquisition date to reflect new information obtained about facts and circumstances that existed as of the acquisition date that, if known, would have affected the measurement of the amounts recognized as of that date. These adjustments related toThose changes are reflected in the Company’s valuation of accounts receivable, prepaid expenses and other current assets, accounts payable, other noncurrent liabilities and deferred income tax assets. Of the total measurement period adjustments, other non-current liabilities decreased $4.6 million related to the valuation of an unfavorable contract liability and increased by $5.1 million related to a contingency for unclaimed property.table below. The remaining measurement period adjustments were not individually significant and related to finalizing certain analyses relating to accounts receivable, taxes accounts payable and accrued expenses. The preliminary purchase price allocation as of April 5,December 31, 2017 and as of DecemberMarch 31, 20172018 and adjustments made to the estimated acquisition date fair values during the measurement periodfiscal year ended December 31, 2018 are as follows (in ‘000’s)thousands):
| Acquisition Date Estimated Fair Value as of April 5, 2017 | Measurement Period Adjustments | Acquisition Date Estimated Fair Value as of December 31, 2017 | Acquisition Date Estimated Fair Value as of December 31, 2017 | Measurement Period Adjustments | Final Acquisition Date Fair Value as of March 31, 2018 | |||||||||||||||||||
Accounts Receivable | $ | 29,936 | $ | 2,933 | $ | 32,869 | $ | 32,869 | $ | — | $ | 32,869 | ||||||||||||
Prepaid and other current assets | 5,032 | (635 | ) | 4,397 | 4,397 | — | 4,397 | |||||||||||||||||
Property and equipment | 126,510 | — | 126,510 | 126,510 | — | 126,510 | ||||||||||||||||||
Intangible assets | 76,000 | — | 76,000 | 76,000 | — | 76,000 | ||||||||||||||||||
Favorable lease assets | 3,110 | — | 3,110 | 3,110 | — | 3,110 | ||||||||||||||||||
Deferred income tax assets | 2,223 | 1,893 | 4,116 | 4,116 | 44 | 4,160 | ||||||||||||||||||
Othernon-current assets | 4,327 | — | 4,327 | 4,327 | — | 4,327 | ||||||||||||||||||
|
|
|
|
|
| |||||||||||||||||||
Total assets acquired | $ | 247,138 | $ | 4,191 | $ | 251,329 | $ | 251,329 | $ | 44 | $ | 251,373 | ||||||||||||
|
|
|
|
|
| |||||||||||||||||||
Accounts payable and accrued expenses | 53,800 | (2,149 | ) | 51,651 | 51,651 | (1,339 | ) | 50,312 | ||||||||||||||||
Unfavorable lease liabilities | 1,299 | — | 1,299 | 1,299 | — | 1,299 | ||||||||||||||||||
Othernon-current liabilities | 9,917 | 562 | 10,479 | 10,479 | (1,166 | ) | 9,313 | |||||||||||||||||
|
|
|
|
|
| |||||||||||||||||||
Total liabilities assumed | $ | 65,016 | $ | (1,587 | ) | $ | 63,429 | $ | 63,429 | $ | (2,505 | ) | $ | 60,924 | ||||||||||
|
|
|
|
|
| |||||||||||||||||||
Total identifiable net assets | 182,122 | 5,778 | 187,900 | 187,900 | 2,549 | 190,449 | ||||||||||||||||||
Goodwill | 172,343 | (6,687 | ) | 165,656 | 165,656 | (2,549 | ) | 163,107 | ||||||||||||||||
|
|
|
|
|
| |||||||||||||||||||
Total consideration paid, net of cash acquired | $ | 354,465 | $ | (909 | ) | $ | 353,556 | $ | 353,556 | $ | — | $ | 353,556 | |||||||||||
|
|
|
|
|
| |||||||||||||||||||
The Company recognized a reduction of operating expenses of $2.3 million related to the CEC acquisition during the twelve months ended December 31, 2018 as a result of a recovery of funds held in escrow after the measurement period had ended.
As shown above, the Company recorded $165.7$163.1 million of goodwill related to the purchase of CEC. The strategic benefits of the merger include the Company’s ability to further position itself to meet the demand for increasingly diversified correctional, detention and community reentry facilities and services and the Company’s ability to expand the delivery of enhanced in-prison rehabilitation including evidence-based treatment, integrated with post-release support services through GEO’s Continuum of Care platform. These factors contributed to the goodwill that was recorded upon consummation of the transaction. The Company does not believe that any of the goodwill recorded as a result of the CEC acquisition will be deductible for federal income tax purposes. In November 2017, the Company sold substantially all of the assets of one of the acquired CEC entities for approximately $3.7 million which resulted in a reduction of goodwill of $2.2 million. The net gain on sale was not significant and the operations of this entity were not significant to the Company.
Refer to Note 9 —Goodwill— Goodwill and Other Intangible Assets, Net. Identifiable intangible assets purchased in the acquisition and their weighted average amortization periods in total and by major intangible asset class, as applicable, are included in the table below:below (in thousands):
| Weighted Average Useful Life (years) | Fair Value as of April 5, 2017 | |||||||
Facility management contracts | 18 | $ | 75,300 | |||||
Covenants not to compete | 1 | 700 | ||||||
|
| |||||||
Total acquired intangible assets | $ | 76,000 | ||||||
|
| |||||||
Pro forma financial information (Unaudited)
The results of operations of CEC are included in the Company’s results of operations from April 5, 2017. The following unaudited pro forma information combines the consolidated results of operations of the Company and CEC as if the acquisition had occurred at January 1, 2015,2016, which is the beginning of the earliest period presented. The pro forma amounts are included for comparative purposes and may not necessarily reflect the results of operations that would have resulted had the acquisition been completed at the beginning of the applicable period and may not be indicative of the results that will be attained in the future (in thousands):
| Year Ended (unaudited) | Year Ended (unaudited) | |||||||||||||||||||
| December 31, 2017 | December 31, 2016 | December 31, 2015 | December 31, 2017 | December 31, 2016 | ||||||||||||||||
Pro forma revenues | 2,300,000 | 2,400,000 | 2,100,000 | $ | 2,300,000 | $ | 2,400,000 | |||||||||||||
Pro forma net income attributable to the GEO Group, Inc. | 160,000 | 143,000 | 127,000 | $ | 160,000 | $ | 143,000 | |||||||||||||
The unaudited pro forma combined financial information presented above is compiled from the financial statements of the combined companies and includes pro forma adjustments for: (i) estimated changes in depreciation expense, interest expense and amortization expense; (ii) adjustments to eliminate intercompany transactions; (iii) adjustments to remove approximately $15 million, for the year ended December 31, 2017, respectively, ofnon-recurring transaction and merger related costs directly related to the CEC acquisition that are included in the combined companies’ financial results; and (iv) the income tax impact of the adjustments.Theadjustments. The unaudited pro forma financial information does not include any adjustments to reflect the impact of cost savings or other synergies that may result from this acquisition. As noted above, the unaudited pro forma financial information does not purport to be indicative of the actual results that would have been achieved by the combined companies for the periods presented or that may be achieved by the combined companies in the future.
The Company has included revenue and earnings of approximately $171 million and $22 million, respectively, in its consolidated statements of operations for the year ended December 31, 2017 for CEC activity since April 5, 2017, the date of acquisition.
| 3. | Shareholders’ Equity |
Common Stock
Each holder of the Company’s common stock is entitled to one vote per share on all matters to be voted upon by the Company’s shareholders. Upon any liquidation, dissolution or winding up of the Company, the holders of common stock are entitled to share equally in all assets available for distribution after payment of all liabilities, subject to the liquidation preference of shares of preferred stock, if any, then outstanding.
Distributions
As a REIT, GEO is required to distribute annually at least 90% of its REIT taxable income (determined without regard to the dividends paid deduction and by excluding net capital gain) and began paying regular quarterly REIT dividends in 2013. The amount, timing and frequency of future dividends, however, will be at the sole discretion of GEO’s Board of Directors (the “Board”) and will be declared based upon various factors, many of which are beyond GEO’s control, including, GEO’s financial condition and operating cash flows, the amount required to maintain REIT status and reduce any income taxes that GEO otherwise would be required to pay, limitations on distributions in GEO’s existing and future debt instruments, limitations on GEO’s ability to fund distributions using cash generated through GEO’s TRSs and other factors that GEO’s Board may deem relevant.
During the years ended December 31, 2018, 2017 2016 and 2015,2016, GEO declared and paid the following regular cash distributions to its stockholders which were treated for federal income taxes as follows (retroactively adjusted to reflect the effects of the Company’s3-for-2 stock split):
| Ordinary Dividends | Ordinary Dividends | |||||||||||||||||||||||||||||||||||||||||||||||
Declaration Date | Payment Date | Record Date | Distribution Per Share | Qualified(1) | Non-Qualified | Nondividend | Aggregate Payment Amount (millions) | Payment Date | Record Date | Distribution Per Share | Qualified(1) | Non-Qualified | Nondividend | Aggregate Payment Amount (millions) | ||||||||||||||||||||||||||||||||||
February 6, 2015 | February 27, 2015 | February 17, 2015 | $ | 0.41 | $ | 0.0353166 | $ | 0.2759814 | $0.1020353 | $ | 46.0 | |||||||||||||||||||||||||||||||||||||
April 29, 2015 | May 21, 2015 | May 11, 2015 | $ | 0.41 | $ | 0.0353166 | $ | 0.2759814 | $0.1020353 | $ | 46.3 | |||||||||||||||||||||||||||||||||||||
July 31, 2015 | August 24, 2015 | August 14, 2015 | $ | 0.41 | $ | 0.0353166 | $ | 0.2759814 | $0.1020353 | $ | 46.3 | |||||||||||||||||||||||||||||||||||||
November 3, 2015 | November 25, 2015 | November 16, 2015 | $ | 0.43 | $ | 0.0370254 | $ | 0.2893354 | $0.1069725 | $ | 48.5 | |||||||||||||||||||||||||||||||||||||
February 3, 2016 | February 26, 2016 | February 16, 2016 | $ | 0.43 | $ | 0.0493613 | $ | 0.2886402 | $0.0953319 | $ | 48.5 | February 26, 2016 | February 16, 2016 | $ | 0.43 | $ | 0.0493613 | $ | 0.2886402 | $0.0953319 | $ | 48.5 | ||||||||||||||||||||||||||
April 20, 2016 | May 12, 2016 | May 2, 2016 | $ | 0.43 | $ | 0.0493613 | $ | 0.2886402 | $0.0953319 | $ | 48.7 | May 12, 2016 | May 2, 2016 | $ | 0.43 | $ | 0.0493613 | $ | 0.2886402 | $0.0953319 | $ | 48.7 | ||||||||||||||||||||||||||
July 20, 2016 | August 12, 2016 | August 1, 2016 | $ | 0.43 | $ | 0.0493613 | $ | 0.2886402 | $0.0953319 | $ | 48.7 | August 12, 2016 | August 1, 2016 | $ | 0.43 | $ | 0.0493613 | $ | 0.2886402 | $0.0953319 | $ | 48.7 | ||||||||||||||||||||||||||
October 18, 2016 | November 10, 2016 | October 31, 2016 | $ | 0.43 | $ | 0.0493613 | $ | 0.2886402 | $0.0953319 | $ | 48.8 | November 10, 2016 | October 31, 2016 | $ | 0.43 | $ | 0.0493613 | $ | 0.0002886 | $0.0953319 | $ | 48.8 | ||||||||||||||||||||||||||
February 6, 2017 | February 27, 2017 | February 17, 2017 | $ | 0.47 | $ | 0.0175622 | $ | 0.2468402 | $0.2025975 | $ | 52.5 | February 27, 2017 | February 17, 2017 | 0.47 | $ | 0.0175622 | $ | 0.2468402 | $0.2025975 | $ | 52.5 | |||||||||||||||||||||||||||
April 25, 2017 | May 19, 2017 | May 9, 2017 | $ | 0.47 | $ | 0.0176751 | $ | 0.2484259 | $0.2038990 | $ | 58.4 | May 19, 2017 | May 9, 2017 | $ | 0.47 | $ | 0.0176751 | $ | 0.2484259 | $0.2038990 | $ | 58.4 | ||||||||||||||||||||||||||
July 10, 2017 | July 28, 2017 | July 21, 2017 | $ | 0.47 | $ | 0.0176751 | $ | 0.2484259 | $0.2038990 | $ | 58.3 | July 28, 2017 | July 21, 2017 | 0.47 | $ | 0.0176751 | $ | 0.2484259 | $0.2038990 | $ | 58.3 | |||||||||||||||||||||||||||
October 12, 2017 | October 30, 2017 | October 23, 2017 | $ | 0.47 | $ | 0.0176751 | $ | 0.2484259 | $0.2038990 | $ | 58.3 | October 30, 2017 | October 23, 2017 | $ | 0.47 | $ | 0.0176751 | $ | 0.2484259 | $0.2038990 | $ | 58.3 | ||||||||||||||||||||||||||
February 5, 2018 | February 27, 2018 | February 16, 2018 | $ | 0.47 | $ | 0.0461171 | $ | 0.2090220 | $0.2148609 | $ | 58.3 | |||||||||||||||||||||||||||||||||||||
April 11, 2018 | May 3, 2018 | April 23, 2018 | $ | 0.47 | $ | 0.0461171 | $ | 0.2090220 | $0.2148609 | $ | 57.4 | |||||||||||||||||||||||||||||||||||||
July 10, 2018 | July 27, 2018 | July 20, 2018 | $ | 0.47 | $ | 0.0461171 | $ | 0.2090220 | $0.2148609 | $ | 57.2 | |||||||||||||||||||||||||||||||||||||
October 15, 2018 | November 2, 2018 | October 26, 2018 | $ | 0.47 | $ | 0.0461171 | $ | 0.2090220 | $0.2148609 | $ | 57.2 | |||||||||||||||||||||||||||||||||||||
| (1) | The amount constitutes a “Qualified Dividend”, as defined by the Internal Revenue Service. |
| (2) | The amount constitutes a “Return of Capital”, as defined by the Internal Revenue Service. |
Common Stock OfferingBuyback Program
On March 7, 2017,February 14, 2018, the Company entered into an underwriting agreement related to the issuance and saleannounced that its Board of 9,000,000 shares of commonDirectors authorized a stock par value $.01 per share, of the Company. The offering price to the public was $27.80 per share and the underwriters agreed to purchase the shares frombuyback program authorizing the Company pursuant to the underwriting agreement at a price of $26.70 per share. In addition, under the terms of the underwriting agreement, the Company granted the underwriters an option, exercisable for 30 days, to purchaserepurchase up to an additional 1,350,000a maximum of $200 million of its shares of common stock. On March 8, 2017, the underwriters exercised in full their option to purchase the additional 1,350,000 shares of common stock. On March 13, 2017, the Company announced that it had completed the sale of 10,350,000 shares of commonThe stock buyback program will be funded primarily with its previously announced underwritten public offering. GEO received gross proceeds (before underwriting discountscash on hand, free cash flow and estimated offering expenses) of approximately $288.1 million from the offering, including approximately $37.6 million in connection with the
sale of the additional shares. Fees paid in connection with the offering were not significant and have been netted against additionalpaid-in capital. The net proceeds of this offering were used to repay amounts outstandingborrowings under the revolver portion of the Company’s senior$900 million revolving credit facility and for general corporate purposes.(the “Revolver”). The 10,350,000 shares of common stock were issued under GEO’s previouslyprogram is effective shelf registration filed with the Securities and Exchange Commission. The previously effective registration statement on FormS-3 expired September 12, 2017. Onthrough October 20, 2017, GEO filed a new registration statement on FormS-3 that automatically became effective. Refer2020. The stock buyback program is intended to discussion below. The number of shares andper-share amounts herein have been adjustedbe implemented through purchases made from time to reflecttime in the effects of the stock split. Refer to Note 1 — Summary of Business Organization, Operations and Significant Accounting Policies
Prospectus Supplement
In September 2014, the Company filedopen market or in privately negotiated transactions, in accordance with theapplicable Securities and Exchange Commission (“SEC”) an automatic shelf registration statement on FormS-3. On November 10, 2014, in connection with the shelf registration,requirements. The stock buyback program does not obligate the Company filed withto purchase any specific amount of its common stock and may be suspended or extended at any time at the Securities and Exchange Commission a prospectus supplement related to the offer and sale from time to timediscretion of the Company’s Board of Directors. During the year ended December 31, 2018, the Company purchased 4,210,254 shares of its common stock at an aggregate offering pricea cost of up to $150$95.2 million through sales agents. Sales of shares ofprimarily purchased with proceeds from the Company’s commonRevolver. The Company believes it has the ability to continue to fund the stock under the prospectus supplementbuyback program, its debt service requirements and the equity distribution agreements entered into with the sales agents, if any, may be made in negotiated transactions or transactions that are deemed to be “at the market” offerings as defined in Rule 415 under the Securities Act of 1933. There were no shares of common stock sold under this prospectus supplement during the years ended December 31, 2017, 2016 or 2015. On September 12, 2017, the shelf registration expired. its maintenance and growth capital expenditure requirements, while maintaining sufficient liquidity for other corporate purposes.
Prospectus Supplement
On October 20, 2017, the Company filed with the SEC a newan automatic shelf registration on FormS-3. Under this new shelf registration, the Company may, from time to time, sell any combination of securities described in the prospectus in one or more offerings. Each time that the Company may sell securities, the Company will provide a prospectus supplement that will contain specific information about the terms of that offering and the securities being offered. On November 9, 2017, in connection with the shelf registration, the Company filed with the SEC a prospectus supplement related to the offer and sale from time to time of the Company’s common stock at an aggregate offering price of up to $150 million through sales agents. Sales of shares of the Company’s common stock under the prospectus supplement and the equity distribution agreements entered into with the sales agents, if any, may be made in negotiated transactions or transactions that are deemed to be “at the market” offerings as defined in Rule 415 under the Securities Act of 1933. There were no shares of common stock sold under this prospectus supplement during the yearyears ended December 31, 2018 or 2017.
Preferred Stock
In April 1994, the Company’s Board authorized 30 million shares of “blank check” preferred stock. The Board is authorized to determine the rights and privileges of any future issuance of preferred stock such as voting and dividend rights, liquidation privileges, redemption rights and conversion privileges. As of December 31, 2017,2018, there were no shares of preferred stock outstanding.
Noncontrolling Interests
The Company includes the results of operations and financial position of SACM or the “joint venture”, its majority-owned subsidiary, in its consolidated financial statements. SACM was established in 2001 to operate correctional centers in South Africa. The joint venture currently provides security and other management services for the Kutama Sinthumule Correctional Centre in the Republic of South Africa under a25-year management contract which commenced in February 2002. The Company’s and the joint venture partner’s shares in the profits of the joint venture are 88.75% and 11.25%, respectively. There were no changes in the Company’s ownership percentage of the consolidated subsidiary during the years ended December 31, 2018, 2017 2016 and 2015.
| 4. | Equity Incentive Plans |
In 2014, theThe Board of Directorshas adopted The GEO Group, Inc. 20142018 Stock Incentive Plan (the “2014“2018 Plan”), which was approved by the Company’s shareholders on May 2, 2014.April 24, 2018. The 20142018 Plan replaced the former GEO Group, Inc. 20062014 Stock Incentive Plan. As of the date the 2018 Plan (the “2006 Plan”). The 2014 Plan provideswas adopted, it provided for a reserve of 4,625,030 shares, which consists of 3,000,000 new shares of common stock available for issuance and 1,625,0304,600,000 shares of common stock that were available for issuancemay be issued pursuant to awards granted under the 2006 Plan prior2018 Plan. The Company filed a FormS-8 registration statement related to the 20142018 Plan replacing it.on May 11, 2018.
Under the terms of the 20142018 Plan, the vesting period and, in the case of stock options, the exercise price per share, are determined by the terms of each grant agreement. All stock options that have been granted under the Company plans are exercisable at the fair market value of the common stock at the date of the grant. Generally, the stock options vest and become exercisable ratably over a four-year period, beginning immediately on the date of the grant. However, the Board of Directors has exercised its discretion to grant stock options that vest 100% immediately for the Chief Executive Officer.period. All stock options awarded under the 20142018 Plan expire no later than ten years after the date of the grant. When options are exercised, the Company issues shares of common stock related to the exercised options.
The Company recognized compensation expense related to the Company plans for the years ended December 31, 2018, 2017 2016 and 20152016 as follows (in thousands):
| 2017 | 2016 | 2015 | 2018 | 2017 | 2016 | |||||||||||||||||||
Stock option plan expense | $ | 1,305 | $ | 538 | $ | 727 | $ | 996 | $ | 1,305 | $ | 538 | ||||||||||||
Restricted stock expense | $ | 18,539 | $ | 12,235 | $ | 10,982 | $ | 21,053 | $ | 18,539 | $ | 12,235 | ||||||||||||
Stock Options
A summary of the activity of the Company’s stock options plans is presented below:
| Shares | Wtd. Avg. Exercise Price | Wtd. Avg. Remaining Contractual Term (years) | Aggregate Intrinsic Value | |||||||||||||
| (In thousands) | (In thousands) | |||||||||||||||
Options outstanding at December 31, 2016 | 1,211 | $ | 20.65 | 7.14 | $ | 5,466 | ||||||||||
Granted | 462 | 32.30 | ||||||||||||||
Exercised | (360 | ) | 19.11 | |||||||||||||
Forfeited/Canceled | (83 | ) | 27.41 | |||||||||||||
|
| |||||||||||||||
Options outstanding at December 31, 2017 | 1,230 | $ | 25.02 | 7.33 | $ | 3,117 | ||||||||||
|
| |||||||||||||||
Options vested and expected to vest at December 31, 2017 | 1,165 | $ | 24.84 | 7.25 | $ | 3,042 | ||||||||||
|
| |||||||||||||||
Options exercisable at December 31, 2017 | 523 | $ | 22.04 | 5.93 | $ | 2,174 | ||||||||||
|
| |||||||||||||||
| Shares | Wtd. Avg. Exercise Price | Wtd. Avg. Remaining Contractual Term (years) | Aggregate Intrinsic Value | |||||||||||||
| (In thousands) | (In thousands) | |||||||||||||||
Options outstanding at January 1, 2018 | 1,230 | $ | 25.02 | 7.33 | $ | 3,117 | ||||||||||
Granted | 475 | 21.60 | ||||||||||||||
Exercised | (103 | ) | 19.07 | |||||||||||||
Forfeited/Canceled | (140 | ) | 25.32 | |||||||||||||
|
| |||||||||||||||
Options outstanding at December 31, 2018 | 1,462 | $ | 24.30 | 7.20 | $ | 924 | ||||||||||
|
| |||||||||||||||
Options vested and expected to vest at December 31, 2018 | 1,386 | $ | 24.31 | 7.11 | $ | 923 | ||||||||||
|
| |||||||||||||||
Options exercisable at December 31, 2018 | 646 | $ | 23.81 | 5.59 | $ | 910 | ||||||||||
|
| |||||||||||||||
The aggregate intrinsic value in the table above represents the total pretax intrinsic value (i.e., the difference between the Company’s closing stock price on the last trading day of fiscal year 20172018 and the exercise price, times the number of shares that are “in the money”) that would have been received by the option holders had all option holders exercised their options on December 31, 2017.2018. This amount changes based on the fair value of the Company’s stock.
The following table summarizes information relative to stock option activity during the years ended December 31, 2018, 2017 2016 and 20152016 (in thousands):
| 2017 | 2016 | 2015 | ||||||||||
Intrinsic value of options exercised | $ | 4,126 | $ | 1,671 | $ | 2,000 | ||||||
Fair value of shares vested | $ | 373 | $ | 518 | $ | 1,314 | ||||||
| 2018 | 2017 | 2016 | ||||||||||
Intrinsic value of options exercised | $ | 519 | $ | 4,126 | $ | 1,671 | ||||||
Fair value of shares vested | $ | 794 | $ | 373 | $ | 518 | ||||||
The following table summarizes information about the exercise prices and related information of stock options outstanding under the Company plans at December 31, 2017:2018:
| Options Outstanding | Options Exercisable | Options Outstanding | Options Exercisable | |||||||||||||||||||||||||||||||||||||||||||||
Exercise Prices | Number Outstanding | Wtd. Avg. Remaining Contractual Life | Wtd. Avg. Exercise Price | Number Exercisable | Wtd. Avg. Remaining Contractual Life | Wtd. Avg. Exercise Price | Number Outstanding | Wtd. Avg. Remaining Contractual Life | Wtd. Avg. Exercise Price | Number Exercisable | Wtd. Avg. Remaining Contractual Life | Wtd. Avg. Exercise Price | ||||||||||||||||||||||||||||||||||||
| (In thousands) | (In thousands) | |||||||||||||||||||||||||||||||||||||||||||||||
0-18.23 | 185 | 3.22 | $ | 13.97 | 185 | 3.22 | $ | 13.97 | 161 | 2.32 | $ | 14.08 | 160 | 2.32 | $ | 14.08 | ||||||||||||||||||||||||||||||||
18.24-22.26 | 392 | 7.52 | $ | 20.18 | 133 | 6.92 | $ | 20.62 | 708 | 8.17 | $ | 20.98 | 169 | 6.09 | $ | 20.54 | ||||||||||||||||||||||||||||||||
22.27-29.39 | 233 | 7.02 | $ | 28.77 | 120 | 6.87 | $ | 28.77 | 218 | 6.11 | $ | 28.77 | 165 | 6.09 | $ | 28.77 | ||||||||||||||||||||||||||||||||
29.40-43.15 | 420 | 9.12 | $ | 32.27 | 85 | 8.94 | $ | 32.27 | 375 | 8.08 | $ | 32.27 | 152 | 7.94 | $ | 32.27 | ||||||||||||||||||||||||||||||||
|
|
|
| |||||||||||||||||||||||||||||||||||||||||||||
Total | 1,230 | 7.33 | $ | 25.02 | 523 | 5.93 | $ | 22.04 | 1,462 | 7.20 | $ | 24.30 | 646 | 5.59 | $ | 23.81 | ||||||||||||||||||||||||||||||||
|
|
|
| |||||||||||||||||||||||||||||||||||||||||||||
The weighted average grant date fair value of options granted during the year ended December 31, 2018, 2017 and 2016 was $3.64, $5.91 and 2015 was $5.91, $2.09 and $4.26 per share, respectively. There were 0.5 million, 0.30.5 million and 0.3 million options granted during the year ended December 31, 2018, 2017 and 2016, and 2015, respectively.
The following table summarizes the status ofnon-vested stock options as of December 31, 2017 and 2016,2018 and changes during the year endingended December 31, 2017:2018:
| Number of Shares | Wtd. Avg. Grant Date Fair Value | Number of Shares | Wtd. Avg. Grant Date Fair Value | |||||||||||||
| (In thousands) | (In thousands) | |||||||||||||||
Optionsnon-vested at December 31, 2016 | 590 | $ | 1.93 | |||||||||||||
Optionsnon-vested at January 1, 2018 | 707 | $ | 3.93 | |||||||||||||
Granted | 462 | 5.91 | 475 | 3.64 | ||||||||||||
Vested | (262 | ) | 2.01 | (226 | ) | 3.21 | ||||||||||
Forfeited | (83 | ) | 3.87 | (140 | ) | 4.13 | ||||||||||
|
| |||||||||||||||
Optionsnon-vested at December 31, 2017 | 707 | $ | 3.93 | |||||||||||||
Optionsnon-vested at December 31, 2018 | 816 | $ | 3.86 | |||||||||||||
|
| |||||||||||||||
As of December 31, 2017,2018, the Company had $2.0 million of unrecognized compensation costs related tonon-vested stock option awards that are expected to be recognized over a weighted average period of 2.92.7 years.
Restricted Stock
During the year ended December 31, 2017,2018, the Company granted approximately 933,000906,000 shares of restricted stock to certain employees and executive officers. Of these awards, 352,500 are market and performance-based awards which will be forfeited if the Company does not achieve certain annual metrics over a three year period from January 1, 2017 to December 31, 2019.
during 2018, 2019 and 2020. The fair value of restricted stock awards, which do not contain a market performance-based condition, is determined using the closing price of the Company’s common stock on the date of the grant and compensation expense is recognized over the vesting period. Generally, the restricted stock awards vest in equal increments over either a three or four year period.
The vesting of these performance-based restricted stock grants are subject to the achievement by GEO of two annual performance metrics as follows: (i) up to 50% of the shares of restricted stock (“TSR Target Award”) can vest at the end of a three-year performance period if GEO meets certain total shareholder return (“TSR”) performance targets, as compared to the total shareholder return of a peer group of companies, over a three year period from January 1, 20172018 to December 31, 20192020 and (ii) up to 50% of the shares of restricted stock (“ROCE Target Award”) can vest at the end of a three-year period if GEO meets certain return on capital employed
(“ROCE”) performance targets over a three year period from January 1, 20172018 to December 31, 2019.2020. These market and performance awards can vest at between 0% and 200% of the target awards for both metrics. The number of shares shown for the performance-based awards is based on the target awards for both metrics.
During the year ended December 31, 2017, the Company granted approximately 933,000 shares of restricted stock to certain employees and executive officers. Of these awards, 352,500 are performance-based awards which will be forfeited if the Company does not achieve certain annual metrics over a three year period from January 1, 2017 to December 31, 2019.
The vesting of the performance-based restricted stock grants awarded in 2017 are subject to the achievement by GEO of two annual performance metrics as follows: (i) up to 50% of the TSR Target Award can vest at the end of a three-year performance period if GEO meets certain TSR performance targets, as compared to the total shareholder return of a peer group of companies, over a three year period from January 1, 2017 to December 31, 2019; and (ii) up to 50% of the ROCE Target Award can vest at the end of a three-year performance period if GEO meets certain ROCE performance targets over a three year period from January 1, 2017 to December 31, 2019. These performance awards can vest at between 0% and 200% of the target awards for both metrics. The number of shares shown for the performance-based awards is based on the target awards for both metrics.
During the year ended December 31, 2016, the Company granted approximately 524,000 shares of restricted stock to its executive officers and to certain employees and executive officers.senior employees. Of these awards, 173,000 are performance-based awards which will be forfeited if the Company does not achieve certain annual metrics over a three year period from
January 1, 2016 to December 31, 2018.
The vesting of the performance-based restricted stock grants awarded in 20162015 are subject to the achievement by GEO of two annual performance metrics as follows: (i) up to 50% of the TSR Target Award can vest at the end of a three-year performance period if GEO meets certain TSR performance targets, as compared to the total shareholder return of a peer group of companies, over a three year period from January 1, 2016 to December 31, 2018; and (ii) up to 50% of the ROCE Target Award can vest at the end of a three-year performance period if GEO meets certain ROCE performance targets over a three year period from January 1, 2016 to December 31, 2018. These performance awards can vest at between 0% and 200% of the target awards for both metrics. The number of shares shown for the performance-based awards is based on the target awards for both metrics.
During the year ended December 31, 2015, the Company granted 635,000 shares of restricted stock to its executive officers and to certain senior employees. Of these awards, 223,000 are performance-based awards which will be forfeited if the Company does not achieve certain annual metrics over a three year period from January 1, 2015 to December 31, 2017. The vesting of the performance-based restricted stock grants awarded in 2015 are subject to the achievement by GEO of two annual performance metrics as follows: (i) up to 50% of the TSR Target Award can vest at the end of a three-year performance period if GEO meets certain TSR performance targets, as compared to the total shareholder return of a peer group of companies, over a three year period from January 1, 2014 to December 31, 2016; and (ii) up to 50% of the ROCE Target Award can vest at the end of a three-year period if GEO meets certain ROCE performance targets over a three year period from January 1, 2015 to December 31, 2017. These performance awards can vest at the end of the three year performance period at between 0% and 200% of the target awards for both metrics. The number of shares shown for the performance-based awards is based on the target awards for both metrics.
The metric related to TSR is considered to be a market condition. For share-based awards that contain a market condition, the probability of satisfying the market condition must be considered in the estimate of grant-date fair value. Compensation expense is recognized over the vesting period and previously recorded compensation expense is not reversed if the market condition is never met. Refer to Note 1 — Summary of Business Organization, Operations and Significant Accounting Policies—Policies-Stock-Based Compensation Expense,for the assumptions and method used to value these awards.
The metric related to ROCE is considered to be a performance condition. For share-based awards that contain a performance condition, the achievement of the targets must be probable before any share-based compensation expense is recorded. The Company reviews the likelihood of which target in the range will be achieved and if deemed probable, compensation expense is recorded at that time. If subsequent to initial measurement there is a change in the estimate of the probability of meeting the performance condition, the effect of the change in the estimated quantity of awards expected to vest is recognized by cumulatively adjusting compensation expense. If ultimately the performance targets are not met, for any awards where vesting was previously deemed probable, previously recognized compensation expense will be reversed in the period in which vesting is no longer deemed probable. During 2018, 2017 2016 and 2015,2016, the Company deemed the achievement of the target award to be probable and there were no changes in the estimated quantity of awards expected to vest. The fair value of these awards was determined based on the closing price of the Company’s common stock on the date of grant.
The following table summarizes the status of restricted stock awards as of December 31, 2017 and 2016,2018 and changes during the year ended December 31, 2017:2018:
| Shares | Wtd. Avg. Grant date Fair value | Shares | Wtd. Avg. Grant date Fair value | |||||||||||||
| (In thousands) | (In thousands) | |||||||||||||||
Restricted stock outstanding at December 31, 2016 | 1,345 | $ | 24.37 | |||||||||||||
Restricted stock outstanding at January 1, 2018 | 1,770 | $ | 30.47 | |||||||||||||
Granted | 933 | 35.31 | 906 | 22.83 | ||||||||||||
Vested | (442 | ) | 23.23 | (584 | ) | 28.50 | ||||||||||
Forfeited/Canceled | (66 | ) | 26.89 | (74 | ) | 25.04 | ||||||||||
|
| |||||||||||||||
Restricted stock outstanding at December 31, 2017 | 1,770 | $ | 30.47 | |||||||||||||
Restricted stock outstanding at December 31, 2018 | 2,018 | $ | 27.62 | |||||||||||||
|
| |||||||||||||||
As of December 31, 2017,2018, the Company had $33.4$31.4 million of unrecognized compensation cost that is expected to be recognized over a weighted average period of 2.52.2 years.
Employee Stock Purchase Plan
The Company previously adopted The GEO Group Inc. 2011 Employee Stock Purchase Plan (the “Plan”), which was approved by the Company’s shareholders. The purpose of the Plan, which is qualified under Section 423 of the Internal Revenue Service Code of 1986, as amended, is to encourage stock ownership through payroll deductions by the employees of GEO and designated subsidiaries of GEO in order to increase their
identification with the Company’s goals and secure a proprietary interest in the Company’s success. These deductions are used to purchase shares of the Company’s Common Stock at a 5% discount from the then current market price. The Company has made available up to 750,000 shares of its common stock, which were registered with the Securities and Exchange Commission on May 4, 2012, as amended on July 18, 2014, for sale to eligible employees.
The Plan is considered to benon-compensatory. As such, there is no compensation expense required to be recognized. Share purchases under the Plan are made on the last day of each month. During the years ended December 31, 2018, 2017 and 2016, 24,365, 20,009 and 2015, 20,009, 23,037 and 19,808 shares of common stock, respectively, were issued in connection with the Plan.
| 5. | Earnings Per Share |
Basic and diluted earnings per share (“EPS”) from continuing operations were calculated for the years ended December 31, 2018, 2017, 2016, and 20152016 respectively, as follows:
Fiscal Year | 2017 | 2016 | 2015 | |||||||||
| (In thousands, except per share data) | ||||||||||||
Net Income | $ | 146,024 | $ | 148,498 | $ | 139,315 | ||||||
Loss attributable to noncontrolling interests | 217 | 217 | 123 | |||||||||
|
|
|
|
|
| |||||||
Net income attributable to The GEO Group, Inc. | $ | 146,241 | $ | 148,715 | $ | 139,438 | ||||||
Basic earnings per share attributable to The GEO Group, Inc.: | ||||||||||||
Weighted average shares outstanding | 120,095 | 111,065 | 110,544 | |||||||||
|
|
|
|
|
| |||||||
Per share amount | $ | 1.22 | $ | 1.34 | $ | 1.26 | ||||||
|
|
|
|
|
| |||||||
Diluted earnings per share attributable to The GEO Group, Inc.: | ||||||||||||
Weighted average shares outstanding | 120,095 | 111,065 | 110,544 | |||||||||
Dilutive effect of equity incentive plans | 719 | 420 | 449 | |||||||||
|
|
|
|
|
| |||||||
Weighted average shares assuming dilution | 120,814 | 111,485 | 110,993 | |||||||||
|
|
|
|
|
| |||||||
Per share amount — diluted | $ | 1.21 | $ | 1.33 | $ | 1.25 | ||||||
|
|
|
|
|
| |||||||
Fiscal Year | 2018 | 2017 | 2016 | |||||||||
| (In thousands, except per share data) | ||||||||||||
Net Income | $ | 144,827 | $ | 146,024 | $ | 148,498 | ||||||
Loss attributable to noncontrolling interests | 262 | 217 | 217 | |||||||||
|
|
|
|
|
| |||||||
Net income attributable to The GEO Group, Inc. | $ | 145,089 | $ | 146,241 | $ | 148,715 | ||||||
Basic earnings per share attributable to The GEO Group, Inc.: | ||||||||||||
Weighted average shares outstanding | 120,241 | 120,095 | 111,065 | |||||||||
|
|
|
|
|
| |||||||
Per share amount | $ | 1.21 | $ | 1.22 | $ | 1.34 | ||||||
|
|
|
|
|
| |||||||
Diluted earnings per share attributable to The GEO Group, Inc.: | ||||||||||||
Weighted average shares outstanding | 120,241 | 120,095 | 111,065 | |||||||||
Dilutive effect of equity incentive plans | 506 | 719 | 420 | |||||||||
|
|
|
|
|
| |||||||
Weighted average shares assuming dilution | 120,747 | 120,814 | 111,485 | |||||||||
|
|
|
|
|
| |||||||
Per share amount — diluted | $ | 1.20 | $ | 1.21 | $ | 1.33 | ||||||
|
|
|
|
|
| |||||||
Outstanding share andper-share amounts disclosed for all periods presented have been retroactively adjusted to reflect the effects of the stock split.
For the year ended December 31, 2018, 931,476 weighted average shares of common stock underlying options were excluded from the computation of diluted EPS because the effect would be anti-dilutive. 680,062 common stock equivalents from restricted shares were anti-dilutive and excluded from the computation of diluted EPS.
For the year ended December 31, 2017, 617,025 weighted average shares of common stock underlying options were excluded from the computation of diluted EPS because the effect would be anti-dilutive. 719,204 common stock equivalents from restricted shares were anti-dilutive and excluded from the computation of diluted EPS.anti-dilutive.
For the year ended December 31, 2016, 862,964 weighted average shares of common stock underlying options were excluded from the computation of diluted EPS because the effect would be anti-dilutive. 267,045 common stock equivalents from restricted shares were anti-dilutive.
For the year ended December 31, 2015, 360,693 weighted average shares of common stock underlying options were excluded from the computation of diluted EPS because the effect would be anti-dilutive. 315,111 common stock equivalents from restricted shares were anti-dilutive.
| 6. | Property and Equipment |
Property and equipment consist of the following at fiscal year end:
| Useful Life | 2017 | 2016 | Useful Life | 2018 | 2017 | |||||||||||||||||||
| (Years) | (In thousands) | (Years) | (In thousands) | |||||||||||||||||||||
Land | — | $ | 129,421 | $ | 116,517 | — | $ | 131,377 | $ | 129,421 | ||||||||||||||
Buildings and improvements | 2 to 50 | 2,009,279 | 1,853,409 | 2 to 50 | 2,144,414 | 2,009,279 | ||||||||||||||||||
Leasehold improvements | 1 to 29 | 288,614 | 270,760 | 1 to 29 | 303,348 | 288,614 | ||||||||||||||||||
Equipment | 3 to 10 | 193,281 | 186,095 | 3 to 10 | 206,191 | 193,281 | ||||||||||||||||||
Furniture, fixtures and computer software | 1 to 7 | 57,204 | 52,225 | 1 to 7 | 60,159 | 57,204 | ||||||||||||||||||
Facility construction in progress | 74,312 | 14,574 | — | 65,282 | 74,312 | |||||||||||||||||||
|
|
|
| |||||||||||||||||||||
Total | $2,752,111 | $2,493,580 | $ | 2,910,771 | $ | 2,752,111 | ||||||||||||||||||
Less accumulated depreciation and amortization | (673,988 | ) | (596,339 | ) | (752,161 | ) | (673,988 | ) | ||||||||||||||||
|
|
|
| |||||||||||||||||||||
Property and equipment, net | $ | 2,078,123 | $ | 1,897,241 | $ | 2,158,610 | $ | 2,078,123 | ||||||||||||||||
|
|
|
| |||||||||||||||||||||
The Company depreciatesamortizes its leasehold improvements over the shorter of their estimated useful lives or the terms of the leases including renewal periods that are reasonably assured. The Company’s construction in progress primarily consists of expansionsnew construction and renovations to facilities that are owned by the Company. Interest capitalized in property and equipment for the years ended December 31, 2018 and 2017 was $3.7 million and December 31, 2016 was not significant.$1.1 million, respectively.
Depreciation expense was $103.5 million, $98.9 million and $92.8 million and $85.9 million, respectively, for the years ended December 31, 2018, 2017 2016 and 2015,2016, respectively.
At both December 31, 20172018 and 2016,2017, the Company had $17.1 million of assets recorded under capital leases related to land, buildings and improvements. Capital leases are recorded net of accumulated amortization of $12.2$13.2 million and $11.2$12.2 million, at December 31, 20172018 and 2016,2017, respectively. Depreciation expense related to assets recorded under capital leases for each of the years ended December 31, 2018, 2017 2016 and 20152016 was $1.0 million and is included in Depreciation and Amortization in the accompanying consolidated statements of operations.
| 7. | Contract Receivable |
On September 16, 2014, GEO’s wholly-owned subsidiary, GEO Ravenhall Pty. Ltd., in its capacity as trustee of another wholly-owned subsidiary, GEO Ravenhall Trust (“Project Co”), signed the Ravenhall Prison Project Agreement (“Ravenhall Contract”) with the State of Victoria (the “State”) for the development and
operation of a new1,000-bed1,300-bed facility in Ravenhall, a locality near Melbourne, Australia under a public-private partnership financing structure. The facility has the capacity to house 1,300 inmates should the State have the need for additional beds in the future. The design and construction phase (“D&C Phase”) of the agreement began in September 2014 and was completed in November 2017. Project Co was the primary developer during the D&C Phase and subcontracted with a bonded international design and build contractor to design and construct the facility. GEO’s wholly-owned subsidiary, the GEO Group Australasia Pty. Ltd. (“GEO Australia”) will operateis currently operating the facility under a25-year management contract (“Operating Phase”). During the D&C Phase, GEO Australia provided construction management and consultant services to the State.
The cost of the project during the D&C Phase was funded by debt financing along with a capital contribution by GEO in the amount of AUD 115 million, or $89.8$81.1 million based on exchange rates at December 31, 2017,2018, which was contributed in January 2017 (Refer to Note 13 — Debt). Another wholly-owned subsidiary of GEO, Ravenhall Finance Co Pty. Limited (“Finance Co”), entered into a syndicated facility agreement with National Australia Bank Limited to provide the debt financing for the project. In order to fix the interest rate on this variablenon-recourse debt, Finance Co entered into interest rate swap agreements. Refer to
Note 8 — Derivative Financial Instruments. Upon completion and commercial acceptance of the facility in November 2017, in accordance with the Ravenhall Contract, the State made a lump sum payment of AUD 310 million, or $242.0$218.7 million based on exchange rates as of December 31, 2017,2018, towards a portion of the outstanding balance. The remaining balance will be paid over the life of the25-year management contract.
During the D&C Phase, the Company recognized revenue as earned on a percentage of completion basis measured by the percentage of costs incurred to date as compared to the estimated total costs for the design and construction of the facility. Costs incurred and estimated earnings in excess of billings are classified as Contract Receivable in the accompanying consolidated balance sheets. The total balance of the Contract Receivable at December 31, 20172018 is $422.5$383.7 million which is recorded at net present value based on the timing of expected future settlement. Interest income is recorded as earned using an effective interest rate of 8.97%. As the primary contractor, Project Co was exposed to the various risks associated with the D&C Phase. Accordingly, the Company recorded construction revenue on a gross basis and included the related costs of construction activities in operating expenses within the Facility Design & Construction segment. Reimbursable pass through costs were excluded from revenues and expenses.
| 8. | Derivative Financial Instruments |
The Company’s primary objective in holding derivatives is to reduce the volatility of earnings and cash flows associated with changes in interest rates. The Company measures its derivative financial instruments at fair value.
Australia — Fullham
The Company’s Australian subsidiary was a party to an interest rate swap agreement to fix the interest rate on the variable ratenon-recourse debt to 9.7%. The Company has determined the swap’s payment and expiration dates, and call provisions that coincided with the terms of thenon-recourse debt, to be an effective cash flow hedge. Accordingly, the Company recorded the change in the value of the interest rate swap in accumulated other comprehensive income, net of applicable income taxes. Total unrealized gains recorded in other comprehensive income, net of tax, related to this cash flow hedge were not significant for the years ended December 31, 2017 or 2016. During 2017, the associatednon-recourse debt was paid off and the interest rate swap is no longer in existence as of December 31, 2017.
Australia — Ravenhall
In September 2014, the Company’s Australian subsidiary entered into interest rate swap agreements to fix the interest rate on its variable ratenon-recourse debt related to a prison project in Ravenhall, a locality near
Melbourne, Australia to 3.3% during the design and construction phase and 4.2% during the project’s operating phase. Refer to Note 7 — Contract Receivable. The swaps’ notional amounts during the design and construction phase coincided with scheduled construction draw commitments throughout the project. The design and construction phase of the project was completed during November 2017 and the related interest rate swap agreements expired. At December 31, 2017,2018, the swaps related to the operating phase had a notional value of approximately AUD 466.3450.8 million, or $364.0 million.$318.0 million, based on exchange rates as of December 31, 2018. At the onset, the Company had determined that the swaps havehad payment, expiration dates and provisions that coincidecoincided with the terms of thenon-recourse debt and the critical terms of the swap agreements and scheduled construction draw commitments were the same and were therefore considered to be effective cash flow hedges. During 2017 and 2016, certain of the critical terms of the swap agreements related to the design and construction phase no longer coincided with the scheduled construction draw commitments. However, the swaps were still considered to be highly effective and the measurement of any ineffectiveness was not significant during the year ended December 31, 2017 or 2016. Accordingly, the Company records the change in the fair value of the interest rate swaps in accumulated other comprehensive income, net of applicable income taxes. Total unrealized gains recorded in other comprehensive income, net of tax, related to this cash flow hedge were approximately $6.1 million, $4.0 million and $1.8 million during the yearyears ended December 31, 2017.2018, 2017 and 2016, respectively. The total fair value of the swap liability as of December 31, 2018 and 2017 was $6.8 million and $14.0 million, respectively, and is recorded as a component of OtherNon-Current liabilities within the accompanying consolidated balance sheet. There was no material ineffectiveness for the periods presented. TheIf the Company does not expect to enter into any transactions duringrefinances the next twelve months whichdebt before its maturity date, this would result in the reclassification into earnings or losses amounts associated with these swaps currently reported in accumulated other comprehensive income (loss).
Additionally, upon completion and commercial acceptance of the prison project in November 2017, the State, in accordance with the prison contract, made a lump sum payment of AUD 310 million, or $242.0 million, based on exchange rates at December 31, 2017, towards a portion of the outstanding balance which was used Refer to pay down the principal of thenon-recourse debt. The Company’s Australian subsidiary had also entered into interest rate cap agreements in September 2014 giving the Company the option to cap the interest rate on its variablenon-recourse debt related to the project in the event that the completion of the prison project was delayed which could have delayed the State’s payment. These instruments did not meet the requirements for hedge accounting, and therefore, changes in fair value of the interest rate caps were recorded in earnings which was not significant during 2017, 2016 or 2015. As the project was not delayed and the State’s payment was received according to schedule, these interest rate cap assets were not put into effect.Note 13 — Debt.
| 9. | Goodwill and Other Intangible Assets, Net |
The Company has recorded goodwill as a result of its various business combinations. On April 5, 2017, the Company completed its acquisition of CEC. Refer to Note 2 — Business Combinations. Goodwill is recorded as
the difference, if any, between the aggregate consideration paid for an acquisition and the fair value of the tangible assets and intangible assets acquired net of liabilities assumed, including noncontrolling interests. Changes in the Company’s goodwill balances recognized during the years ended December 31, 20172018 and 20162017 were as follows (in thousands):
| December 31, 2016 | Acquisitions (net of dispositions) | Foreign currency translation | December 31, 2017 | |||||||||||||
U.S. Corrections & Detention | $ | 277,774 | $ | 39,231 | $ | — | $ | 317,005 | ||||||||
GEO Care | 337,257 | 124,242 | — | 461,499 | ||||||||||||
International Services | 402 | — | 45 | 447 | ||||||||||||
|
|
|
|
|
|
|
| |||||||||
Total Goodwill | $ | 615,433 | $ | 163,473 | $ | 45 | $ | 778,951 | ||||||||
|
|
|
|
|
|
|
| |||||||||
| December 31, 2017 | Acquisitions (net of dispositions) | Foreign currency translation | December 31, 2018 | |||||||||||||
U.S. Corrections & Detention | $ | 317,005 | $ | (639 | ) | $ | — | $ | 316,366 | |||||||
GEO Care | 461,499 | (1,910 | ) | — | 459,589 | |||||||||||
International Services | 447 | — | (43 | ) | 404 | |||||||||||
|
|
|
|
|
|
|
| |||||||||
Total Goodwill | $ | 778,951 | $ | (2,549 | ) | $ | (43 | ) | $ | 776,359 | ||||||
|
|
|
|
|
|
|
| |||||||||
| December 31, 2015 | Acquisitions | Foreign currency translation | December 31, 2016 | |||||||||||||
U.S. Corrections & Detention | $ | 277,774 | $ | — | $ | — | $ | 277,774 | ||||||||
GEO Care | 337,257 | — | — | 337,257 | ||||||||||||
International Services | 407 | — | (5 | ) | 402 | |||||||||||
|
|
|
|
|
|
|
| |||||||||
Total Goodwill | $ | 615,438 | $ | — | $ | (5 | ) | $ | 615,433 | |||||||
|
|
|
|
|
|
|
| |||||||||
In November 2017, the Company sold substantially all of the assets of one of the acquired CEC entities for approximately $3.7 million which resulted in a reduction of goodwill of $2.2 million. The net gain on sale was not significant and the operations of this entity were not significant to the Company. Refer to Note 2 — Business Combinations.
| December 31, 2016 | Acquisitions | Foreign currency translation | December 31, 2017 | |||||||||||||
U.S. Corrections & Detention | $ | 277,774 | $ | 39,231 | $ | — | $ | 317,005 | ||||||||
GEO Care | 337,257 | 124,242 | — | 461,499 | ||||||||||||
International Services | 402 | — | 45 | 447 | ||||||||||||
|
|
|
|
|
|
|
| |||||||||
Total Goodwill | $ | 615,433 | $ | 163,473 | $ | 45 | $ | 778,951 | ||||||||
|
|
|
|
|
|
|
| |||||||||
Intangible assets consisted of the following as of December 31, 20172018 and December 31, 20162017 (in thousands):
| December 31, 2017 | December 31, 2016 | December 31, 2018 | December 31, 2017 | |||||||||||||||||||||||||||||||||||||||||||||||||||||
| Weighted Average Useful Life (years) | Gross Carrying Amount | Accumulated Amortization | Net Carrying Amount | Gross Carrying Amount | Accumulated Amortization | Net Carrying Amount | Weighted Average Useful Life (years) | Gross Carrying Amount | Accumulated Amortization | Net Carrying Amount | Gross Carrying Amount | Accumulated Amortization | Net Carrying Amount | |||||||||||||||||||||||||||||||||||||||||||
Facility management contracts | 16.3 | $ | 308,518 | $ | (106,724 | ) | $ | 201,794 | $ | 233,136 | $ | (87,256 | ) | $ | 145,880 | 16.3 | $ | 308,419 | $ | (127,481 | ) | $ | 180,938 | $ | 308,518 | $ | (106,724 | ) | $ | 201,794 | ||||||||||||||||||||||||||
Covenants not to compete | 1 | 700 | (517 | ) | 183 | — | — | — | 1 | 700 | (700 | ) | — | 700 | (517 | ) | 183 | |||||||||||||||||||||||||||||||||||||||
Technology | 7.3 | 33,700 | (25,538 | ) | 8,162 | 33,700 | (20,896 | ) | 12,804 | 7.3 | 33,700 | (27,478 | ) | 6,222 | 33,700 | (25,538 | ) | 8,162 | ||||||||||||||||||||||||||||||||||||||
Trade names | Indefinite | 45,200 | — | 45,200 | 45,200 | — | 45,200 | Indefinite | 45,200 | — | 45,200 | 45,200 | — | 45,200 | ||||||||||||||||||||||||||||||||||||||||||
|
|
|
|
|
|
|
|
|
|
|
| |||||||||||||||||||||||||||||||||||||||||||||
Total acquired intangible assets | $ | 388,118 | $ | (132,779 | ) | $ | 255,339 | $ | 312,036 | $ | (108,152 | ) | $ | 203,884 | $ | 388,019 | $ | (155,659 | ) | $ | 232,360 | $ | 388,118 | $ | (132,779 | ) | $ | 255,339 | ||||||||||||||||||||||||||||
|
|
|
|
|
|
|
|
|
|
|
| |||||||||||||||||||||||||||||||||||||||||||||
The accounting for recognized intangible assets is based on the useful lives to the reporting entity. Intangible assets with finite useful lives are amortized over their useful lives and intangible assets with indefinite useful lives are not amortized. The Company estimates the useful lives of its intangible assets taking into consideration (i) the expected use of the asset by the Company, (ii) the expected useful lives of other related assets or groups of assets, (iii) legal or contractual limitations, (iv) the Company’s historical experience in renewing or extending similar arrangements, (v) the effects of obsolescence, demand, competition and other economic factors and (vi) the level of maintenance expenditures required to obtain the expected cash flows from the asset.
Amortization expense was $22.9 million, $24.7 million $20.4 million and $19.3$20.4 million for the years ended December 31, 2018, 2017 2016 and 2015,2016, respectively, and primarily related to the U.S. Corrections & Detention and GEO Care segments’ amortization of intangible assets for acquired management contracts. The Company relies on its historical experience in determining the useful life of facility management contracts. The Company makes assumptions related to acquired facility management contracts based on the competitive environment for
individual contracts, our historical success rates in retaining contracts, the supply of available beds in the market, changes in legislation, the projected profitability of the facilities and other market conditions. As of December 31, 2017,2018, the weighted average period before the next contract renewal or extension for the facility management contracts was approximately 1.61.5 years. Although the facility management contracts acquired have renewal and extension terms in the near term, the Company has historically maintained these relationships beyond the contractual periods.
Estimated amortization expense related to the Company’s finite-lived intangible assets for 20182019 through 20222023 and thereafter is as follows (in thousands):
Fiscal Year | Total Amortization Expense | Total Amortization Expense | ||||||
2018 | $ | 22,764 | ||||||
2019 | 22,313 | $ | 22,287 | |||||
2020 | 22,313 | 22,306 | ||||||
2021 | 19,790 | 19,782 | ||||||
2022 | 18,146 | 18,204 | ||||||
2023 | 13,494 | |||||||
Thereafter | 104,813 | 91,087 | ||||||
|
| |||||||
| $ | 210,139 | $ | 187,160 | |||||
|
| |||||||
| 10. | Financial Instruments |
The following table provides a summary of the Company’s significant financial assets and liabilities carried at fair value and measured on a recurring basis (in thousands):
| Fair Value Measurements at December 31, 2017 | Fair Value Measurements at December 31, 2018 | |||||||||||||||||||||||||||||||
| Carrying Value at December 31, 2017 | Quoted Prices in Active Markets (Level 1) | Significant Other Observable Inputs (Level 2) | Significant Unobservable Inputs (Level 3) | Carrying Value at December 31, 2018 | Quoted Prices in Active Markets (Level 1) | Significant Other Observable Inputs (Level 2) | Significant Unobservable Inputs (Level 3) | |||||||||||||||||||||||||
Assets: | ||||||||||||||||||||||||||||||||
Restricted investments: | ||||||||||||||||||||||||||||||||
Rabbi Trust | $ | 20,763 | $ | — | $ | 20,763 | $ | — | $ | 20,892 | $ | — | $ | 20,892 | $ | — | ||||||||||||||||
Fixed income securities | 1,902 | — | 1,902 | — | 1,801 | — | 1,801 | — | ||||||||||||||||||||||||
Liabilities: | ||||||||||||||||||||||||||||||||
Interest rate swap derivatives | $ | 13,992 | $ | — | $ | 13,992 | $ | — | $ | 8,638 | $ | — | $ | 8,638 | $ | — | ||||||||||||||||
| Fair Value Measurements at December 31, 2016 | Fair Value Measurements at December 31, 2017 | |||||||||||||||||||||||||||||||
| Carrying Value at December 31, 2016 | Quoted Prices in Active Markets (Level 1) | Significant Other Observable Inputs (Level 2) | Significant Unobservable Inputs (Level 3) | Carrying Value at December 31, 2017 | Quoted Prices in Active Markets (Level 1) | Significant Other Observable Inputs (Level 2) | Significant Unobservable Inputs (Level 3) | |||||||||||||||||||||||||
Assets: | ||||||||||||||||||||||||||||||||
Restricted investments: | ||||||||||||||||||||||||||||||||
Rabbi Trust | $ | 15,662 | $ | — | $ | 15,662 | $ | — | $ | 20,763 | $ | — | $ | 20,763 | $ | — | ||||||||||||||||
Fixed income securities | 1,782 | — | 1,782 | — | 1,902 | — | 1,902 | — | ||||||||||||||||||||||||
Liabilities: | ||||||||||||||||||||||||||||||||
Interest rate swap derivatives | $ | 18,679 | $ | — | $ | 18,679 | $ | — | $ | 13,992 | $ | — | $ | 13,992 | $ | — | ||||||||||||||||
The Company’s level 2 financial instruments included in the tables above as of December 31, 20172018 and 20162017 consist of the Company’s rabbi trust established for GEO employee and employer contributions to The GEO Group, Inc.Non-qualified Deferred Compensation Plan, interest rate swaps held by our Australian subsidiaries and an investment in Canadian dollar denominated fixed income securities. The Company’s restricted investment in the Rabbi Trust is invested in Company owned life insurance policies which are recorded at their cash surrender values. These investments are valued based on the underlying investments held in the
policies’ separate account. The Australian subsidiaries’ interest rate swaps are valued using a discounted cash flow model based on projected Australian borrowing rates. The Canadian dollar denominated securities, not actively traded, are valued using quoted rates for these and similar securities.
During the year ended December 31, 2018, the Company transferred certain accounts receivable balances that had a carrying value of approximately $6.9 million to an unrelated third party. The transfer was accounted for as a sale and the Company has no continuing involvement with the transferred assets. The Company received cash proceeds in connection with the sale of approximately $6.9 million, and as such, there was no gain or loss in connection with the transaction. In February 2019, under the same terms, the Company transferred additional accounts receivable balances that had a carrying value of approximately $3.0 million.
| 11. | Fair Value of Assets and Liabilities |
The Company’s Consolidated Balance Sheets reflect certain financial instruments at carrying value. The following table presents the carrying values of those instruments and the corresponding estimated fair values (in thousands):
| Estimated Fair Value Measurements at December 31, 2017 | Estimated Fair Value Measurements at December 31, 2018 | |||||||||||||||||||||||||||||||||||||||
| Carrying Value as of December 31, 2017 | Total Fair Value | Level 1 | Level 2 | Level 3 | Carrying Value as of December 31, 2018 | Total Fair Value | Level 1 | Level 2 | Level 3 | |||||||||||||||||||||||||||||||
Assets: | ||||||||||||||||||||||||||||||||||||||||
Cash and cash equivalents | $ | 81,377 | $ | 81,377 | $ | 81,377 | $ | — | $ | — | $ | 31,255 | $ | 31,255 | $ | 31,255 | $ | — | $ | — | ||||||||||||||||||||
Restricted cash and investments | 52,168 | 52,168 | 49,884 | 2,284 | — | 53,217 | 53,217 | 50,499 | 2,718 | — | ||||||||||||||||||||||||||||||
Liabilities: | ||||||||||||||||||||||||||||||||||||||||
Borrowings under Senior Credit Facility | $ | 1,064,559 | $ | 1,070,514 | $ | — | $ | 1,070,514 | $ | — | $ | 1,273,965 | $ | 1,188,196 | $ | — | $ | 1,188,196 | $ | — | ||||||||||||||||||||
5.875% Senior Notes due 2024 | 250,000 | 262,095 | — | 262,095 | — | 250,000 | 224,590 | — | 224,590 | — | ||||||||||||||||||||||||||||||
5.125% Senior Notes | 300,000 | 303,918 | — | 303,918 | — | 300,000 | 271,992 | — | 271,992 | — | ||||||||||||||||||||||||||||||
5.875% Senior Notes due 2022 | 250,000 | 258,338 | — | 258,338 | — | 250,000 | 244,550 | — | 244,550 | — | ||||||||||||||||||||||||||||||
6.00% Senior Notes | 350,000 | 362,835 | — | 362,835 | — | 350,000 | 310,177 | — | 310,177 | — | ||||||||||||||||||||||||||||||
Non-recourse debt | 393,737 | 394,671 | — | 394,671 | — | 340,910 | 348,274 | — | 348,274 | — | ||||||||||||||||||||||||||||||
| Estimated Fair Value Measurements at December 31, 2016 | Estimated Fair Value Measurements at December 31, 2017 | |||||||||||||||||||||||||||||||||||||||
| Carrying Value as of December 31, 2016 | Total Fair Value | Level 1 | Level 2 | Level 3 | Carrying Value as of December 31, 2017 | Total Fair Value | Level 1 | Level 2 | Level 3 | |||||||||||||||||||||||||||||||
Assets: | ||||||||||||||||||||||||||||||||||||||||
Cash and cash equivalents | $ | 68,038 | $ | 68,038 | $ | 68,038 | $ | — | $ | — | $ | 81,377 | $ | 81,377 | $ | 81,377 | $ | — | $ | — | ||||||||||||||||||||
Restricted cash | 22,319 | 22,319 | 19,614 | 2,705 | — | 52,168 | 52,168 | 49,884 | 2,284 | — | ||||||||||||||||||||||||||||||
Liabilities: | ||||||||||||||||||||||||||||||||||||||||
Borrowings under Senior Credit Facility | $ | 804,500 | $ | 795,008 | $ | — | $ | 795,008 | $ | — | $ | 1,064,599 | $ | 1,070,514 | $ | — | $ | 1,070,514 | $ | — | ||||||||||||||||||||
5.875% Senior Notes due 2024 | 250,000 | 247,813 | — | 247,813 | — | 250,000 | 262,095 | — | 262,095 | — | ||||||||||||||||||||||||||||||
5.125% Senior Notes | 300,000 | 292,125 | — | 292,125 | — | 300,000 | 303,918 | — | 303,918 | — | ||||||||||||||||||||||||||||||
5.875% Senior Notes due 2022 | 250,000 | 254,688 | — | 254,688 | — | 250,000 | 258,338 | — | 258,338 | — | ||||||||||||||||||||||||||||||
6.00% Senior Notes | 350,000 | 346,938 | — | 346,938 | — | 350,000 | 362,835 | — | 362,835 | — | ||||||||||||||||||||||||||||||
Non-recourse debt | 490,502 | 491,735 | — | 491,735 | — | 393,737 | 394,671 | — | 394,671 | — | ||||||||||||||||||||||||||||||
The fair values of the Company’s cash and cash equivalents, and restricted cash approximates the carrying values of these assets at December 31, 20172018 and 2016.2017. Restricted cash consists of money market funds, commercial paper and time deposits used for payments on the Company’snon-recourse debt and asset replacement funds contractually required to be maintained at the Company’s Australian subsidiary. The fair value of the money market funds is based on quoted market prices (level 1) and the fair value of commercial paper and time deposits is based on market prices for similar instruments (level 2). The fair values of the
Company’s 6.00% senior unsecured notes due 2026 (the “6.00% Senior Notes”), 5.125% Senior Notes due 2023 (the “5.125% Senior Notes”), 5.875% Senior Notes due 2022 (the “5.875% Senior Notes due 2022”) and the 5.875% Senior Notes due 2024 (the “5.875% Senior Notes due 2024”), although not actively traded, are based on published financial data for these instruments. The fair value of the Company’snon-recourse debt is based on estimate of trading value considering the Company’s borrowing rate, the undrawn spread and similar instruments. The fair value of borrowings under the Senior Credit Facility is also based on an estimate of trading value considering the Company’s borrowing rate, the undrawn spread and similar instruments.
| 12. | Accrued Expenses and other current liabilities |
Accrued expenses and other current liabilities consisted of the following (in thousands):
| 2017 | 2016 | 2018 | 2017 | |||||||||||||
Accrued interest | $ | 19,604 | $ | 20,564 | $ | 19,554 | $ | 19,604 | ||||||||
Accrued bonus | 16,906 | 14,788 | 15,047 | 16,906 | ||||||||||||
Accrued insurance | 78,048 | 52,280 | 71,524 | 78,048 | ||||||||||||
Accrued repair obligations for damaged property | 19,067 | — | ||||||||||||||
Accrued property and other taxes | 18,675 | 17,379 | 16,173 | 18,675 | ||||||||||||
Construction retainage | 3,882 | 226 | 1,913 | 3,882 | ||||||||||||
Other | 39,209 | 25,859 | 50,237 | 39,209 | ||||||||||||
|
|
|
| |||||||||||||
Total | $ | 176,324 | $ | 131,096 | $ | 193,515 | $ | 176,324 | ||||||||
|
|
|
| |||||||||||||
| 13. | Debt |
Debt consisted of the following (in thousands):
| 12/31/2017 | 12/31/2016 | December 31, 2018 | December 31, 2017 | |||||||||||||
Senior Credit Facility: | ||||||||||||||||
Term loan | $ | 794,000 | $ | 289,500 | $ | 786,000 | $ | 794,000 | ||||||||
Discount on term loan | (3,499 | ) | — | (2,878 | ) | (3,499 | ) | |||||||||
Unamortized debt issuance costs on term loan | (7,612 | ) | (375 | ) | (6,826 | ) | (7,612 | ) | ||||||||
Revolver | 270,559 | 515,000 | 490,843 | 270,559 | ||||||||||||
|
|
|
| |||||||||||||
Total Senior Credit Facility | $ | 1,053,448 | $ | 804,125 | $ | 1,267,139 | $ | 1,053,448 | ||||||||
6.00% Senior Notes: | ||||||||||||||||
Notes Due in 2026 | $ | 350,000 | $ | 350,000 | $ | 350,000 | $ | 350,000 | ||||||||
Unamortized debt issuance costs | (5,325 | ) | (5,770 | ) | (4,820 | ) | (5,325 | ) | ||||||||
|
|
|
| |||||||||||||
Total 6.00% Senior Notes Due in 2026 | $ | 344,675 | $ | 344,230 | $ | 345,180 | $ | 344,675 | ||||||||
5.875% Senior Notes: | ||||||||||||||||
Notes Due in 2024 | $ | 250,000 | $ | 250,000 | $ | 250,000 | $ | 250,000 | ||||||||
Unamortized debt issuance costs | (3,385 | ) | (3,773 | ) | (2,971 | ) | (3,385 | ) | ||||||||
|
|
|
| |||||||||||||
Total 5.875% Senior Notes Due in 2024 | $ | 246,615 | $ | 246,227 | $ | 247,029 | $ | 246,615 | ||||||||
5.125% Senior Notes: | ||||||||||||||||
Notes Due in 2023 | $ | 300,000 | $ | 300,000 | $ | 300,000 | $ | 300,000 | ||||||||
Unamortized debt issuance costs | (4,184 | ) | (4,786 | ) | (3,548 | ) | (4,184 | ) | ||||||||
|
|
|
| |||||||||||||
Total 5.125% Senior Notes Due in 2023 | $ | 295,816 | $ | 295,214 | $ | 296,452 | $ | 295,816 | ||||||||
5.875%Senior Notes: | ||||||||||||||||
Notes Due in 2022 | $ | 250,000 | $ | 250,000 | $ | 250,000 | $ | 250,000 | ||||||||
Unamortized debt issuance costs | (3,241 | ) | (3,923 | ) | (2,514 | ) | (3,241 | ) | ||||||||
|
|
|
| |||||||||||||
Total 5.875%Senior Notes Due in 2022 | $ | 246,759 | $ | 246,077 | $ | 247,486 | $ | 246,759 | ||||||||
Non-Recourse Debt: | ||||||||||||||||
Non-Recourse Debt | $ | 394,008 | $ | 490,902 | $ | 341,074 | $ | 394,008 | ||||||||
Unamortized debt issuance costs onnon-recourse debt | (9,322 | ) | (18,295 | ) | (3,883 | ) | (9,322 | ) | ||||||||
Discount onNon-Recourse Debt | (271 | ) | (400 | ) | (164 | ) | (271 | ) | ||||||||
|
|
|
| |||||||||||||
TotalNon-Recourse Debt | $ | 384,415 | $ | 472,207 | $ | 337,027 | $ | 384,415 | ||||||||
Capital Lease Obligations | 7,431 | 8,693 | 6,059 | 7,431 | ||||||||||||
Other debt | 2,728 | 3,030 | 2,469 | 2,728 | ||||||||||||
|
|
|
| |||||||||||||
Total debt | $ | 2,581,887 | $ | 2,419,803 | $ | 2,748,841 | $ | 2,581,887 | ||||||||
|
|
|
| |||||||||||||
Current portion of capital lease obligations, long-term debt andnon-recourse debt [1] | (28,920 | ) | (238,065 | ) | (332,027 | ) | (28,920 | ) | ||||||||
Capital Lease Obligations, long-term portion | (6,059 | ) | (7,431 | ) | (4,570 | ) | (6,059 | ) | ||||||||
Non-Recourse Debt, long-term portion | (365,364 | ) | (238,842 | ) | (15,017 | ) | (365,364 | ) | ||||||||
|
|
|
| |||||||||||||
Long-Term Debt | $ | 2,181,544 | $ | 1,935,465 | $ | 2,397,227 | $ | 2,181,544 | ||||||||
|
|
|
| |||||||||||||
| [1] | Balance at December 31, |
Amended and Restated Credit Agreement
On March 23, 2017, the Company executed a third amendedApril 30, 2018, GEO entered into Amendment No. 1 to Third Amended and restated credit agreementRestated Credit Agreement (the “Credit Agreement”) by and among Thethe Refinancing Lenders party thereto, the other lenders party thereto, GEO Group, Inc. and GEO Corrections Holdings, Inc., (“Corrections” and together with The GEO Group,
Inc., the “Borrowers”), the Australian Borrowers named therein, BNP Paribas, as Administrative Agent, and the lenders who are, or may from time to time become, a party thereto (the “Credit Agreement”).Agent. The Credit Agreement refinances GEO’s prior $291 million term loan, reestablishes GEO’s ability to implement at a later date an Australian Dollar Letter of Credit Facility (the “Australian LC Facility”) providingamendment, among other things, provides for the issuancerefinancing of financial lettersall of creditGEO’s existing senior secured term loans with refinancing term loans in the aggregate principal amount of $792.0 million and performance letters of credit, in each case denominated in Australian Dollars up to AUD275 million, an increase from the prior AUD225 million Australian Dollar letter of credit facility, andmakes certain other modifications to the priorGEO’s senior secured credit agreement. LoanThe interest rate applicable to the refinancing term loans is equal to LIBOR plus 2.00% (with a LIBOR floor of 0.75%). The amendment was considered to be a modification and loan costs of approximately $7$1.0 million were incurred and capitalized in connection with the transaction.
The Credit Agreement evidences a credit facility (the “Credit Facility”) consisting of an $800the $792.0 million term loan discussed above (the “Term Loan”) bearing interest at LIBOR plus 2.25%2.00% (with a LIBOR floor of 0.75%), and a $900$900.0 million revolving credit facility (the “Revolver”)Revolver initially bearing interest at LIBOR plus 2.25% (with no LIBOR floor) together with AUD275 million available solely for the issuance of financial letters of credit and performance letters of credit, in each case denominated in Australian Dollars under the Australian Dollar Letter of Credit Facility (the “Australian LC Facility.Facility”). As of December 31, 2017,2018, there were no letters of credit issued under the Australian LC Facility. Amounts to be borrowed by GEO under the Credit Agreement are subject to the satisfaction of customary conditions to borrowing. The Term Loan component is scheduled to mature on March 23, 2024. The revolving credit commitment component is scheduled to mature on May 19, 2021. The Credit Agreement also has an accordion feature of $450$450.0 million, subject to lender demand and prevailing market conditions and satisfying the relevant borrowing conditions.
The Credit Agreement contains certain customary representations and warranties, and certain customary covenants that restrict GEO’s ability to, among other things (i) create, incur or assume any indebtedness, (ii) create, incur, assume or permit liens, (iii) make loans and investments, (iv) engage in mergers, acquisitions and asset sales, (v) make certain restricted payments, (vi) issue, sell or otherwise dispose of capital stock, (vii) engage in transactions with affiliates, (viii) allow the total leverage ratio to exceed 6.25 to 1.00, allow the senior secured leverage ratio to exceed 3.50 to 1.00, or allow the interest coverage ratio to be less than 3.00 to 1.00, (ix) cancel, forgive, make any voluntary or optional payment or prepayment on, or redeem or acquire for value any senior notes, except as permitted, (x) alter the business GEO conducts, and (xi) materially impair GEO’s lenders’ security interests in the collateral for its loans.
Events of default under the Credit Agreement include, but are not limited to, (i) GEO’s failure to pay principal or interest when due, (ii) GEO’s material breach of any representation or warranty, (iii) covenant defaults, (iv) liquidation, reorganization or other relief relating to bankruptcy or insolvency, (v) cross default under certain other material indebtedness, (vi) unsatisfied final judgments over a specified threshold, (vii) certain material environmental liability claims asserted against GEO, and (viii) a change in control.
All of the obligations under the Credit Agreement are unconditionally guaranteed by certain domestic subsidiaries of GEO and the Credit Agreement and the related guarantees are secured by a perfected first-priority pledge of substantially all of GEO’s present and future tangible and intangible domestic assets and all present and future tangible and intangible domestic assets of each guarantor, including but not limited to a first-priority pledge of all of the outstanding capital stock owned by GEO and each guarantor in their domestic subsidiaries.
The Australian Borrowers are wholly owned foreign subsidiaries of GEO. GEO has designated each of the Australian Borrowers as restricted subsidiaries under the Credit Agreement. However, the Australian Borrowers are not obligated to pay or perform any obligations under the Credit Agreement other than their own obligations as Australian Borrowers under the Credit Agreement. The Australian Borrowers do not pledge any of their assets to secure any obligations under the Credit Agreement.
On August 18, 2016, the Company executed a Letter of Offer by and among GEO and HSBC Bank Australia Limited (the “Letter of Offer”) providing for a bank guarantee line and bank guarantee/standbysub-facility in an
sub-facility in an aggregate amount of AUD100 million, or $78.1$70.6 million, based on exchange rates in effect as of December 31, 20172018 (collectively, the “Bank Guarantee Facility”). The Bank Guarantee Facility allows GEO to provide letters of credit to assure performance of certain obligations of its wholly owned subsidiary relating to its prison project in Ravenhall, located near Melbourne, Australia. The Bank Guarantee Facility is unsecured. The issuance of letters of credit under the Bank Guarantee Facility is subject to the satisfaction of the conditions precedent specified in the Letter of Offer. Letters of credit issued under the bank guarantee lines are due on demand and letters of credit issued under the bank guarantee/standbysub-facility cannot have a duration exceeding twelve months. The Bank Guarantee Facility may be terminated by HSBC Bank Australia Limited on 90 days written notice. As of December 31, 2017,2018, there was AUD100 million in letters of credit issued under the Bank Guarantee Facility.
As of December 31, 2017,2018, the Company had $794.0$788.0 million in aggregate borrowings outstanding under the Term Loan, $270.6$490.8 million in borrowings under the Revolver, and approximately $70.1$62.3 million in letters of credit which left $559.3$346.9 million in additional borrowing capacity under the Revolver. In addition, the Company has the ability to increase the Senior Credit Facility by an additional $450.0 million, subject to lender demand and prevailing market conditions and satisfying the relevant borrowing conditions thereunder. The weighted average interest rate on outstanding borrowings under the Credit Agreement as of December 31, 20172018 was 3.9%4.6%.
6.00% Senior Notes due 2026
On April 18, 2016, the Company completed an offering of $350$350.0 million aggregate principal amount of 6.00% senior notes due 2026. The 6.00% Senior Notes were offered and sold in a registered offering pursuant to an underwriting agreement, dated as of April 11, 2016 (the “Underwriting Agreement”) among the Company, certain of the Company’s domestic subsidiaries, as guarantors and Wells Fargo Securities, LLC, as representative for the underwriters named therein. The 6.00% Senior Notes were issued by the Company pursuant to the Indenture, dated as of September 25, 2014 (the “Base Indenture”), by and between the Company and Wells Fargo Bank, National Association, as trustee, as supplemented by a Second Supplemental Indenture, dated as of April 18, 2016 (the “Second Supplemental Indenture” and together with the Base Indenture, the “Indenture”), by and among the Company, the guarantors and the trustee which governs the terms of the 6.00% Senior Notes. The sale of the 6.00% Senior Notes was registered under GEO’s prior shelf registration statement on FormS-3 filed on September 12, 2014, as amended (FileNo. 333-198729). The 6.00% Senior Notes were issued at a coupon rate and yield to maturity of 6.00%. Interest on the 6.00% Senior Notes is payable semi-annually on April 15 and October 15 of each year, commencing on October 15, 2016. The 6.00% Senior Notes mature on April 15, 2026. The Company used the net proceeds to fund the tender offer and the redemption of all of its 6.625% Senior Notes (see discussion below), to pay all related fees, costs and expenses and for general corporate purposes including repaying borrowings under the Company’s Revolver. Loan costs of approximately $6 million were incurred and capitalized in connection with the offering.
Up to 35% of the aggregate principal amount of the 6.00% Senior Notes may be redeemed on or prior to April 15, 2019, with the net cash proceeds from certain equity offerings at a redemption price equal to 106.000% of their principal amount, plus accrued and unpaid interest, if any, to the redemption date. In addition, GEO may, at its option, redeem the 6.00% Senior Notes in whole or in part before April 15, 2021 at a redemption price equal to 100% of the principal amount of the 6.00% Senior Notes being redeemed plus a “make-whole” premium, together with accrued and unpaid interest, if any, to the redemption date.
On or after April 15, 2021, GEO may, at its option, redeem all or part of the 6.00% Senior Notes upon not less than 30 nor more than 60 days’ notice, at the redemption prices (expressed as percentages of principal amount) set forth below, plus accrued and unpaid interest, if any, on the 6.00% Senior Notes redeemed, to the applicable redemption date, if redeemed during the12-month period beginning on April 15 of the years indicated below:
Year | Percentage | Percentage | ||||||
2021 | 103.000 | % | ||||||
2022 | 103.000 | % | 102.000 | % | ||||
2023 | 102.000 | % | 101.000 | % | ||||
2024 | 101.000 | % | ||||||
2025 and thereafter | 100.000 | % | ||||||
2024 and thereafter | 100.000 | % | ||||||
If there is a “change of control” (as defined in the Indenture), holders of the 6.00% Senior Notes will have the right to cause GEO to repurchase their 6.00% Senior Notes at a price equal to 101% of the principal amount of the 6.00% Senior Notes repurchased plus accrued and unpaid interest, if any, to the purchase date.
The 6.00% Senior Notes are guaranteed on a senior unsecured basis by the Guarantors.guarantors. The 6.00% Senior Notes and the guarantees are unsecured, unsubordinated obligations of GEO and the Guarantors.guarantors. The 6.00% Senior Notes rank equally in right of payment with any unsecured, unsubordinated indebtedness of GEO and the Guarantors,guarantors, including GEO’s 5.875% Senior Notes due 2022, the 5.125% Senior Notes due 2023 and the 5.875% Senior Notes due 2024, and the guarantors’ guarantees thereof, senior in right of payment to any future indebtedness of GEO and the Guarantorsguarantors that is expressly subordinated to the 6.00% Senior Notes and the guarantees, effectively junior to any secured indebtedness of GEO and the Guarantors,guarantors, including indebtedness under GEO’s Senior Credit Facility, to the extent of the value of the assets securing such indebtedness, and structurally junior to all obligations of GEO’s subsidiaries that are not Guarantors,guarantors, including trade payables.
The Indenture contains covenants which, among other things, limit the ability of GEO and its “restricted subsidiaries” (as defined in the Indenture) to incur additional indebtedness or issue preferred stock, make dividend payments or other restricted payments (other than the payment of dividends or other distributions, or any other actions necessary to maintain GEO’s status as a real estate investment trust), create liens, sell assets, engage in sale and lease back transactions, create or permit restrictions on the ability of the restricted subsidiaries to pay dividends or make other distributions to GEO, enter into transactions with affiliates, and enter into mergers, consolidations or sales of all or substantially all of their assets. These covenants are subject to a number of limitations and exceptions as set forth in the Indenture.
The Indenture also contains events of default with respect to, among other things, the following: failure by GEO to pay interest on the 6.00% Senior Notes when due, which failure continues for 30 days; failure by GEO to pay the principal of, or premium, if any, on, the 6.00% Senior Notes when due; failure by GEO or any of its restricted subsidiaries to comply with their obligations to offer to repurchase the 6.00% Senior Notes at the option of the holders of the 6.00% Senior Notes upon a change of control, to offer to redeem the 6.00% Senior Notes under certain circumstances in connection with asset sales with “excess proceeds” (as defined in the Indenture) in excess of $50.0 million or to observe certain restrictions on mergers, consolidations and sales of substantially all of their assets; the failure by GEO or any Guarantorguarantor to comply with any of the other agreements in the Indenture, which failure continues for 60 days after notice; and certain events of bankruptcy or insolvency of GEO or a restricted subsidiary that is a significant subsidiary or any group of restricted subsidiaries that together would constitute a significant subsidiary.
6.625% Senior Notes due 2021
On February 10, 2011, the Company completed a private offering of $300.0 million in aggregate principal amount of its 6.625% Senior Notes. Interest on the 6.625% Senior Notes accrued at the stated rate. The Company paid interest semi-annually in arrears on February 15 and August 15 of each year.
On April 11, 2016, the Company announced that it had commenced a cash tender offer for any and all of its $300 million aggregate principal amount of its 6.625% Senior Notes due 2021. On April 18, 2016, the Company completed the purchase of $231 million in aggregate principal amount of its 6.625% Senior Notes validly tendered in connection with the Company’s tender offer on or prior to the expiration time. On May 20, 2016, the Company completed the redemption of the remaining 6.625% Senior Notes in connection with the terms of the notice of redemption delivered to the note holders on April 20, 2016 pursuant to the terms of the indenture governing the 6.625% Senior Notes. The Company financed the purchase of the 6.625% Senior Notes under the tender offer with part of the net cash proceeds from the 6.00% Senior Notes (see discussion above). As a result of the tender offer and redemption, the Company incurred a $15.9 million loss on extinguishment of debt related to the tender premium and deferred costs associated with the 6.625% Senior Notes.
5.875% Senior Notes due 2024
On September 25, 2014, the Company completed an offering of $250.0 million aggregate principal amount of senior unsecured notes (the “5.875% Senior Notes due 2024”). The notes will mature on October 15, 2024 and have a coupon rate and yield to maturity of 5.875%. Interest is payable semi-annually in cash in arrears on April 15 and October 15, beginning April 15, 2015. The 5.875% Senior Notes due 2024 are guaranteed on a senior unsecured basis by all the Company’s restricted subsidiaries that guarantee obligations. The 5.875% Senior Notes due 2024 rank equally in right of payment with any unsecured, unsubordinated indebtedness of the Company and the guarantors, including the Company’s 5.875% Senior Notes due 2022, the 5.125% Senior Notes due 2023, the 6.00% Senior Notes due 2026, and the guarantors’ guarantees thereof, senior in right of payment to any future indebtedness of the Company and the guarantors that is expressly subordinated to the 5.875% Senior Notes due 2024 and the guarantees, effectively junior to any secured indebtedness of the Company and the guarantors, including indebtedness under the Company’s Senior Credit Facility, to the extent of the value of the assets securing such indebtedness, and structurally junior to all obligations of the Company’s subsidiaries that are not guarantors. The sale of the 5.875% Senior Notes due 2024 was registered under the Company’s prior shelf registration statement on FormS-3 filed on September 12, 2014, as supplemented by the Preliminary Prospectus Supplement filed on September 22, 2014 and the Prospectus Supplement filed on September 24, 2014. The Company capitalized $4.6 million of deferred financing costs in connection with the offering.
The Company may, at its option, redeem the 5.875% Senior Notes due 2024 in whole or in part before October 15, 2019 at a redemption price equal to 100% of the principal amount of the 5.875% Senior Notes due 2024 being redeemed plus a “make-whole” premium, together with accrued and unpaid interest, if any, to the redemption date. In addition, the Company may, at its option, redeem the 5.875% Senior Notes due 2024 in whole or in part on or after October 15, 2019 through 2024 and thereafter as indicated below:
Year | Percentage | Percentage | ||||||
2019 | 102.938 | % | ||||||
2020 | 102.938 | % | 101.958 | % | ||||
2021 | 101.958 | % | 100.979 | % | ||||
2022 | 100.979 | % | ||||||
2023 and thereafter | 100.000 | % | ||||||
2022 and thereafter | 100.000 | % | ||||||
The indenture contains covenants which, among other things, limit the ability of the Company and its restricted subsidiaries to incur additional indebtedness or issue preferred stock, make dividend payments or other restricted payments (other than the payment of dividends or other distributions, or any other actions necessary to maintain the Company’s status as a real estate investment trust), create liens, sell assets, engage in sale and lease
back transactions, create or permit restrictions on the ability of the restricted subsidiaries to pay dividends or make other distributions to the Company, enter into transactions with affiliates, and enter into mergers, consolidations or sales of all or substantially all of their assets. These covenants are subject to a number of limitations and exceptions as set forth in the indenture.
The indenture also contains events of default with respect to, among other things, the following: failure by the Company to pay interest on the 5.875% Senior Notes due 2024 when due, which failure continues for 30 days; failure by the Company to pay the principal of, or premium, if any, on, the 5.875% Senior Notes due 2024 when due; failure by the Company or any of its restricted subsidiaries to comply with their obligations to offer to repurchase the 5.875% Senior Notes due 2024 at the option of the holders of the 5.875% Senior Notes due 2024 upon a change of control, to offer to redeem the 5.875% Senior Notes due 2024 under certain circumstances in connection with asset sales with excess proceeds in excess of $25.0 million or to observe certain restrictions on mergers, consolidations and sales of substantially all of their assets; the failure by the Company or any guarantor to comply with any of the other agreements in the indenture, which failure continues for 60 days after notice; and certain events of bankruptcy or insolvency of GEO or a restricted subsidiary that is a significant subsidiary or any group of restricted subsidiaries that together would constitute a significant subsidiary. The Company was in compliance with all of the financial covenants of the indenture governing the 5.875% Senior Notes due 2024 as of December 31, 2017.2018.
5.125% Senior Notes due 2023
On March 19, 2013, the Company completed an offering of $300.0 million aggregate principal amount of senior unsecured notes in a private offering under the Indenture dated as of March 19, 2013 among GEO, certain of its domestic subsidiaries, as guarantors, and Wells Fargo Bank, National Association, as trustee. The 5.125% Senior Notes were offered and sold to “qualified institutional buyers” in accordance with Rule 144A under the Securities Act of 1933, as amended (the “Securities Act”), and outside the United States tonon-U.S. persons in accordance with Regulation S under the Securities Act. The notes will mature on April 1, 2023 and have a coupon rate and yield to maturity of 5.125%. Interest is payable semi-annually on April 1 and October 1 each year, beginning October 1, 2013. The 5.125% Senior Notes are guaranteed on a senior unsecured basis by all of the Company’s restricted subsidiaries that guarantee obligations under the Senior Credit Facility, the Company’s 6.00% Senior Notes, the Company’s 5.875% Senior Notes due 2022 and the 5.875% Senior Notes due 2024. The 5.125% Senior Notes and the guarantees are the Company’s general unsecured senior obligations and rank equally in right of payment with all of the Company’s and the guarantors’ existing and future unsecured senior debt, including the Company’s 6.00% Senior Notes, the 5.875% Senior Notes due 2022 and the 5.875% Senior Notes due 2024. The 5.125% Senior Notes and the guarantees are effectively subordinated to any of the Company’s and the guarantors’ existing and future secured debt to the extent of the value of the assets securing such debt, including all anticipated borrowings under the Senior Credit Facility. The 5.125% Senior Notes are structurally subordinated to all existing and future liabilities (including trade payables) of the Company’s subsidiaries that do not guarantee the 5.125% Senior Notes.
At any time prior to April 1, 2018, the Company may, at its option, redeem all or a part of the 5.125% Senior Notes upon not less than 30 days nor more than 60 days prior notice at a redemption price equal to the sum of (i) 100% of the principal amount thereof, plus (ii) the Applicable Premium (as defined in the indenture) as of the date of redemption, plus (iii) accrued and unpaid interest and Liquidated Damages,liquidated damages, if any, to the date of redemption. On or after April 1, 2018, the Company may, at its option, redeem all or a part of the 5.125% Senior Notes upon not less than 30 days nor more than 60 days notice at the redemption prices (expressed as percentages of principal amount) set forth below, plus accrued and unpaid interest and Liquidated Damages,liquidated damages, if any, on the 5.125% Senior Notes redeemed, to the applicable redemption date, if redeemed during the period beginning on April 1 of the years indicated below:
Year | Percentage | Percentage | ||||||
2018 | 102.563 | % | ||||||
2019 | 102.563 | % | 101.708 | % | ||||
2020 | 101.708 | % | 100.854 | % | ||||
2021 | 100.854 | % | ||||||
2022 and thereafter | 100.000 | % | ||||||
2021 and thereafter | 100.000 | % | ||||||
If there is a “change of control” (as defined in the Indenture), holders of the 5.125% Senior Notes will have the right to cause GEO to repurchase their 5.125% Senior Notes at a price equal to 101% of the principal amount of the 5.125% Senior Notes repurchased plus accrued and unpaid interest and Liquidated Damages,liquidated damages, if any, to the purchase date.
The indenture governing the 5.125% Senior Notes contains certain covenants, including limitations and restrictions on the Company and its restricted subsidiaries’ ability to: incur additional indebtedness or issue preferred stock; make dividend payments or other restricted payments; create liens; sell assets; enter into transactions with affiliates; and enter into mergers, consolidations or sales of all or substantially all of the Company’s assets. As of the date of the indenture, all of the Company’s subsidiaries, other than certain dormant domestic and other subsidiaries and all foreign subsidiaries in existence on the date of the indenture, were restricted subsidiaries. The Company’s failure to comply with certain of the covenants under the indenture governing the 5.125% Senior Notes could cause an event of default of any indebtedness and result in an acceleration of such indebtedness. In addition, there is a cross-default provision which becomes enforceable upon failure of payment of indebtedness at final maturity. The Company’s unrestricted subsidiaries will not be subject to any of the restrictive covenants in the indenture. The Company was in compliance with all of the financial covenants of the indenture governing the 5.125% Senior Notes as of December 31, 2017.2018.
The indenture also contains events of default with respect to, among other things, the following: failure by the Company to pay interest and Liquidated Damages,liquidated damages, if any, on the 5.125% Senior Notes when due, which failure continues for 30 days; failure by the Company to pay the principal of, or premium, if any, on, the 5.125% Senior Notes when due; failure by the Company or any of its restricted subsidiaries to comply with their obligations to offer to repurchase the 5.125% Senior Notes at the option of the holders of the 5.125% Senior Notes upon a change of control, to offer to redeem notes under certain circumstances in connection with asset sales with “excess proceeds” (as defined in the indenture) in excess of $25.0 million or to observe certain restrictions on mergers, consolidations and sales of substantially all of their assets; the failure by the Company or any guarantor to comply with any of the other agreements in the indenture, which failure continues for 60 days after notice; and certain events of bankruptcy or insolvency of the Company or a restricted subsidiary that is a significant subsidiary or any group of restricted subsidiaries that together would constitute a significant subsidiary.
Under the terms of a registration rights agreement dated as of March 19, 2013, among GEO, the guarantors and Merrill Lynch, Pierce, Fenner & Smith Incorporated, as the representative of the initial purchasers of the 5.125% Senior Notes, GEO agreed to register under the Securities Act notes having terms identical in all material respects to the 5.125% Senior Notes (the “5.125% Exchange Notes”) and to make an offer to exchange the 5.125% Exchange Notes for the 5.125% Senior Notes. GEO filed the registration statement on May 30, 2013
which was declared effective on September 12, 2013. GEO launched the exchange offer on September 13, 2013 and the exchange offer expired on October 11, 2013.
5.875% Senior Notes due 2022
On October 3, 2013, the Company completed an offering of $250.0 million aggregate principal amount of senior notes due 2022 (the “5.875% Senior Notes due 2022”) in a private offering under the Indenture dated as of October 3, 2013 among GEO, certain of its domestic subsidiaries, as guarantors, and Wells Fargo Bank, National Association, as trustee. The 5.875% Senior Notes due 2022 were offered and sold to “qualified institutional buyers” in accordance with Rule 144A under the Securities Act, and outside the United States tonon-U.S. persons in accordance with Regulations S under the Securities Act. The 5.875% Senior Notes due 2022 were issued at a coupon rate and yield to maturity of 5.875%. Interest on the 5.875% Senior Notes due 2022 is payable semi-annually in cash in arrears on January 15 and July 15, commencing on January 15, 2014. The 5.875% Senior Notes due 2022 mature on January 15, 2022. The 5.875% Senior Notes due 2022 and the guarantees are the Company’s general unsecured senior obligations and rank equally in right of payment with all of the Company’s and the guarantors’ existing and future unsecured senior debt, including the Company’s 6.00% Senior Notes, the 5.125% Senior Notes and the 5.875% Senior Notes due 2024. The 5.875% Senior Notes due 2022 and the guarantees are effectively subordinated to any of the Company’s and the guarantors’ existing and future secured debt to the extent of the value of the assets securing such debt, including all anticipated borrowings under the Senior Credit Facility. The 5.875% Senior Notes due 2022 are structurally subordinated to all existing and future liabilities (including trade payables) of the Company’s subsidiaries that do not guarantee the 5.875% Senior Notes due 2022.
On or after January 15, 2017, GEO may, at its option, redeem all or part of the 5.875% Senior Notes 2022 upon not less than 30 days nor more than 60 days’ notice, at the redemption prices (expressed as percentages of principal amount) set forth below, plus accrued and unpaid interest and including Liquidated Damages,liquidated damages, if any, on the 5.875% Senior Notes due 2022 redeemed, to the applicable redemption date, if redeemed during the12-month period beginning on January 15 of the years indicated below:
Year | Percentage | Percentage | ||||||
2017 | 104.406 | % | ||||||
2018 | 104.406 | % | 102.938 | % | ||||
2019 | 102.938 | % | 101.469 | % | ||||
2020 | 101.469 | % | ||||||
2021 and thereafter | 100.000 | % | ||||||
2020 and thereafter | 100.000 | % | ||||||
If there is a “change of control” (as defined in the Indenture), holders of the 5.875% Senior Notes due 2022 will have the right to cause GEO to repurchase their 5.875% Senior Notes due 2022 at a price equal to 101% of the principal amount of the 5.875% Senior Notes due 2022 repurchased plus accrued and unpaid interest and Liquidated Damages,liquidated damages, if any, to the purchase date.
The indenture governing the notes contains certain covenants, including limitations and restrictions on the Company and its restricted subsidiaries’ ability to: incur additional indebtedness or issue preferred stock; make dividend payments or other restricted payments; create liens; sell assets; enter into transactions with affiliates; and enter into mergers, consolidations or sales of all or substantially all of the Company’s assets. As of the date of the indenture, all of the Company’s subsidiaries, other than certain dormant domestic and other subsidiaries and all foreign subsidiaries in existence on the date of the indenture, were restricted subsidiaries. The Company’s failure to comply with certain of the covenants under the indenture governing the 5.875% Senior Notes due 2022 could cause an event of default of any indebtedness and result in an acceleration of such indebtedness. In addition, there is a cross-default provision which becomes enforceable upon failure of payment of indebtedness at final maturity. The Company’s unrestricted subsidiaries will not be subject to any of the restrictive covenants in the indenture. The Company was in compliance with all of the financial covenants of the indenture governing the 5.875% Senior Notes due 2022 as of December 31, 2017.2018.
The Indenture also contains events of default with respect to, among other things, the following: failure by GEO to pay interest and Liquidated Damages,liquidated damages, if any, on the 5.875% Senior Notes due 2022 when due, which failure continues for 30 days; failure by GEO to pay the principal of, or premium, if any, on, the 5.875% Senior Notes due 2022 when due; failure by GEO or any of its restricted subsidiaries to comply with their obligations to offer to repurchase the 5.875% Senior Notes due 2022 at the option of the holders of the 5.875% Senior Notes due 2022 upon a change of control, to offer to redeem notes under certain circumstances in connection with asset sales with “excess proceeds” (as defined in the Indenture) in excess of $25.0 million or to observe certain restrictions on mergers, consolidations and sales of substantially all of their assets; the failure by GEO or any Guarantorguarantor to comply with any of the other agreements in the Indenture, which failure continues for 60 days after notice; and certain events of bankruptcy or insolvency of GEO or a restricted subsidiary that is a significant subsidiary or any group of restricted subsidiaries that together would constitute a significant subsidiary.
Under the terms of the Registration Rights Agreement, dated as of October 3, 2013, among GEO, the Guarantorsguarantors and Wells Fargo Securities, LLC, as the representative of the initial purchasers of the 5.875% Senior Notes due 2022 (the “Registration Rights Agreement”), GEO agreed to register under the Securities Act notes having terms identical in all material respects to the 5.875% Senior Notes due 2022 (the “5.875% Exchange Notes”) and to make an offer to exchange the 5.875% Exchange Notes for the 5.875% Senior Notes due 2022. GEO filed the registration statement on October 2, 2013 which was declared effective on January 6, 2014. GEO launched the exchange offer on January 6, 2014 and the exchange offer expired on February 4, 2014.
Non-Recourse Debt
Northwest Detention Center
On December 9, 2011, the Washington Economic Development Finance Authority issued $54.4 million of its Washington Economic Development Finance Authority Taxable Economic Development Revenue Bonds, series 2011 (“2011 Revenue Bonds”). The bonds were ratedAA- by Standard & Poor’s Ratings Services and the scheduled payment of principal and interest is guaranteed by municipal bond insurance issued by Assured Guaranty Municipal Corp. The 2011 Revenue Bonds have an averageall-in cost of approximately 6.4%, including debt issuance costs and the bond discount, and maturity dates ranging through October 1, 2021. The 2011 Revenue Bonds were issued to provide funds to make a loan to CSC of Tacoma, LLC for purposes of reimbursing GEO for costs incurred by GEO for the 2009 expansion of the Northwest Detention Facility and paying the costs of issuing the 2011 Revenue Bonds. The payment of principal and interest on the bonds isnon-recourse to GEO. None of the bonds nor CSC’s obligations under the loan are obligations of GEO nor are they guaranteed by GEO.
As of December 31, 2017,2018, the remaining balance of the debt service requirement related to the 2011 Revenue Bonds is $30.0$23.0 million, of which $7.0$7.3 million is classified as current in the accompanying balance sheet. As of December 31, 2017,2018, included in restricted cash and investments is $6.1$5.7 million (all current) of funds held in trust with respect to the Northwest Detention Center for debt service and other reserves which had not been released to the Company as of December 31, 2017.2018.
Australia — Fulham
The Company’s wholly-owned Australian subsidiary financed the development of a facility and subsequent expansion in 2003 with long-term debt obligations. These obligations werenon-recourse to the Company and totaled $2.6 million (AUD 3.6 million) at December 31, 2016 based on exchange rates in effect as of December 31, 2016. The term of thenon-recourse debt was through 2017 and it bore interest at a variable rate quoted by certain Australian banks plus 140 basis points. Any obligations or liabilities of the subsidiary were matched by a similar or corresponding commitment from the government of the State of Victoria. As a condition of the loan, the Company was required to maintain a restricted cash balance. The loan was paid in full during 2017.
Australia — Ravenhall
In connection with a new design and build prison project agreement with the State of Victoria, in September 2014 the Company entered into a syndicated facility agreement (the “Construction Facility”) with National Australia Bank Limited to provide debt financing for construction of the project. Refer to Note 7 — Contract Receivable. The Construction Facility provided fornon-recourse funding up to AUD 791 million, or $617.5$558.1 million, based on exchange rates as of December 31, 2017.2018. Construction draws were funded throughout the project according to a fixed utilization schedule as defined in the syndicated facility agreement. The term of the Construction Facility is through OctoberSeptember 2019 and bears interest at a variable rate quoted by certain Australian banks plus 200 basis points. After October 2019,The Company intends to refinance the Construction Facility will be convertedprior to a term loan with payments due quarterly beginning in 2019 through 2041.September 2019. The prison was completed and achieved commercial acceptance in November 2017. Upon completion of the prison and in accordance with the terms of the Construction Facility and prison contract, the State made a lump sum payment of AUD 310 million, or $242.0$218.7 million, based on exchange rates as of December 31, 2017,2018, which was used to pay down a portion of the outstanding principal balance. The remaining outstanding principal balance once refinanced, will be repaid over the term of the operating agreement. As of December 31, 2017, $364.02018, $318.1 million was outstanding under the Construction Facility. The Company also entered into interest rate swap and interest rate cap agreements related to itsnon-recourse debt in connection with the project. Refer to Note 8 — Derivative Financial Instruments.
Debt Repayment
Debt repayment schedules under Capital Lease Obligations, Long-Term Debt,Non-Recourse Debt and the Senior Credit Facility are as follows:
Fiscal Year | Capital Leases | Long-Term Debt | Non- Recourse Debt | Revolver | Term Loans | Total Annual Repayment | Capital Leases | Long-Term Debt | Non- Recourse Debt | Revolver | Term Loans | Total Annual Repayment | ||||||||||||||||||||||||||||||||||||
| (In thousands) | (In thousands) | |||||||||||||||||||||||||||||||||||||||||||||||
2018 | 1,936 | 498 | 19,050 | — | 8,000 | 29,484 | ||||||||||||||||||||||||||||||||||||||||||
2019 | 1,934 | 499 | 13,189 | — | 8,000 | 23,622 | $ | 1,934 | $ | 527 | $ | 325,344 | $ | — | $ | 8,000 | $ | 335,805 | ||||||||||||||||||||||||||||||
2020 | 1,934 | 233 | 14,744 | — | 8,000 | 24,911 | 1,934 | 272 | 7,665 | — | 8,000 | 17,871 | ||||||||||||||||||||||||||||||||||||
2021 | 1,936 | 142 | 15,855 | 270,559 | 8,000 | 296,492 | 1,936 | 183 | 8,065 | 490,843 | 8,000 | 509,027 | ||||||||||||||||||||||||||||||||||||
2022 | 1,233 | 250,133 | 8,990 | — | 8,000 | 268,356 | 1,233 | 250,178 | — | — | 8,000 | 259,411 | ||||||||||||||||||||||||||||||||||||
2023 | — | 300,185 | — | — | 8,000 | 308,185 | ||||||||||||||||||||||||||||||||||||||||||
Thereafter | — | 901,224 | 322,180 | — | 754,000 | 1,977,404 | — | 601,124 | — | — | 746,000 | 1,347,124 | ||||||||||||||||||||||||||||||||||||
|
|
|
|
|
|
|
|
|
|
|
| |||||||||||||||||||||||||||||||||||||
| 8,973 | 1,152,729 | 394,008 | 270,559 | 794,000 | 2,620,269 | 7,037 | 1,152,469 | 341,074 | 490,843 | 786,000 | 2,777,423 | |||||||||||||||||||||||||||||||||||||
Interest imputed on Capital Leases | (1,542 | ) | — | — | — | — | (1,542 | ) | (979 | ) | — | — | — | — | (979 | ) | ||||||||||||||||||||||||||||||||
Original issuer’s discount | — | — | (271 | ) | — | (3,499 | ) | (3,770 | ) | |||||||||||||||||||||||||||||||||||||||
Original issue discount | — | — | (164 | ) | — | (2,878 | ) | (3,042 | ) | |||||||||||||||||||||||||||||||||||||||
Current portion | (1,372 | ) | (498 | ) | (19,050 | ) | — | (8,000 | ) | (28,920 | ) | (1,488 | ) | (527 | ) | (325,344 | ) | — | (8,000 | ) | (335,359 | ) | ||||||||||||||||||||||||||
|
|
|
|
|
|
|
|
|
|
|
| |||||||||||||||||||||||||||||||||||||
Non-current portion | $ | 6,059 | $ | 1,152,231 | $ | 374,687 | $ | 270,559 | $ | 782,501 | $ | 2,586,037 | $ | 4,570 | $ | 1,151,942 | $ | 15,566 | $ | 490,843 | $ | 775,122 | $ | 2,438,043 | ||||||||||||||||||||||||
|
|
|
|
|
|
|
|
|
|
|
| |||||||||||||||||||||||||||||||||||||
Guarantees
The Company has entered into certain guarantees in connection with the performance of a facility in Australia (Refer to Note 7 — Contract Receivable). The obligations amounted to approximately AUD 100 million, or $78.1$70.6 million, based on exchange rates as of December 31, 2017.2018. These guarantees are secured by outstanding letters of credit under the Company’s Revolver as of December 31, 2017.2018.
At December 31, 2017,2018, the Company also had teneight letters of guarantee outstanding under separate international facilities relating to performance guarantees of its Australian subsidiary totaling $15.9$11.5 million.
In addition to the above, in connection with the creation of SACS,South African Custodial Services Pty. Limited (“SACS”), the Company had entered into certain guarantees related to the financing, construction and operation of the prison. The Company had guaranteed certain
obligations of SACS under its debt agreements to SACS’ senior lenders through the issuance of letters of credit under the Company’s Revolver. In July 2018, SACS settled all amounts due under the debt facilities and has therefore discharged the guaranteed obligations, therefore the guarantees related to these obligations were no longer necessary and the letters of credit were not renewed. Additionally, SACS is required to maintain funding in a rectification account maintained for 2.4the payment of certain costs in the event of contract termination. SACS has met the required funding obligation and there is no further requirement to maintain the required funding amount.
In addition to the above, the Company had also agreed to provide a loan, if required, of up to 20 million South African Rand, or $0.2$1.4 million based on exchange rates as of December 31, 2017. Additionally, SACS was required to fund a rectification account for the repayment of certain costs in the event of contract termination. In the event SACS is unable to maintain the required funding in the rectification account, the guarantee for the shortfall will need to bere-instated. This guarantee is included as part of the value of the Company’s outstanding letters of credit under its Revolver as of December 31, 2017. No amounts have been drawn against these letters of credit.
The Company has also agreed to provide a loan, of up to 20.0 million South African Rand, or $1.6 million based on exchange rates as of December 31, 2017,2018, referred to as the Shareholder’s Loan,shareholder’s standby facility, to SACS for the purpose of financing SACS’ obligations under its contract with the South African government. No amounts have been funded under the Shareholder’s Loan, and the Company does not currently anticipate that such funding will be required by SACS in the future.shareholder’s standby facility. The Company’s obligations under the Shareholder’s Loanshareholder’s standby facility expire upon the earlier of full funding or SACS’s release from its obligations under its debt agreements. The lenders’ ability to draw on the Shareholder’s Loan is limited to certain circumstances, including terminationcommon terms agreement. SACS’ obligations in terms of the contract.common terms agreements expired in February 2019 with the final payment of the facility management fees when the Company’s obligations under the shareholder’s standby facility expired.
The Company hashad also guaranteed certain obligations of SACS to the security trustee for SACS’ lenders. The Company secured its guarantee to the security trustee by ceding its rights to claims against SACS in respect
of any loans or other finance agreements, and by pledging the Company’s shares in SACS. The Company’s liability under the guarantee is limited to the cession and pledge of shares. The guarantee expires upon expirationexpired in February 2019 when all SACS obligations in terms of the cession and pledge agreements.finance agreements were settled.
In connection with a design, build, finance and maintenance contract for a facility in Canada, the Company guaranteed certain potential tax obligations of a trust. The potential estimated exposure of these obligations was $1.1 million. During 2017, the Company, with the assistance of Canadian tax counsel, completed an analysis and determined that any future tax exposure would be remote and therefore, the liability was derecognized as of December 31, 2017. The Company does not currently operate or manage this facility.
In connection with the creation of GEOAmey, the Company and its joint venture partner guarantee the availability of working capital in equal proportion to ensure that GEOAmey can comply with current and future contractual commitments related to the performance of its operations. The Company and the 50% joint venture partner have each extended a £12 million line of credit of which £1.3 million, or $1.7 million based on exchange rates as of December 31, 2017, was outstanding as of December 31, 2017. The Company’s maximum exposure relative to the joint venture iswas its note receivable of $1.7 million and future financial support necessary to guarantee performance under the contract. In October 2018, the note receivable to each joint venture partner were paid off in full.
Except as discussed above, the Company does not have any off balance sheet arrangements.
| 14. | Benefit Plans |
The Company’s employees participate in an Employee Retirement Savings Plan (the “Retirement Plan”) under Section 401(k) of the Internal Revenue Code that covers substantially all U.S. based salaried employees. Employees may contribute a percentage of eligible compensation to the plan, subject to certain limits under the Internal Revenue Code. For the years ended December 31, 2018, 2017 2016 and 2015,2016, the Company provided matching contributions of $5.9 million, $4.9 million $4.4 million and $3.8$4.4 million, respectively.
The Company has twonon-contributory defined benefit pension plans covering certain of the Company’s executives. Retirement benefits are based on years of service, employees’ average compensation for the last five years prior to retirement and social security benefits. Currently, the plans are not funded. The Company purchased and is the beneficiary of life insurance policies for certain participants enrolled in the plans. There were no significant transactions between the employer or related parties and the plans during 2018, 2017 2016 or 2015.2016.
As of December 31, 2017,2018, the Company had anon-qualified deferred compensation agreement with its Chief Executive Officer (“CEO”). In August 2012, the CEO’s agreement was amended to eliminate the taxgross-up provision which was previously applicable to his lump sum retirement payment and in exchange for the elimination of the taxgross-up provision, the amount of the lump sum retirement payment which Mr. Zoley is entitled to receive has been proportionately increased so that he would receive substantially the same net benefit as he would have otherwise received had the taxgross-up remained in the plan. The current agreement provides for a lump sum payment upon retirement, no sooner than age 55. As of December 31, 2017,2018, the CEO had reached age 55 and was eligible to receive the payment upon retirement. If the Company’s CEO had retired as of December 31, 2017,2018, the Company would have had to pay him $8.0$8.3 million. The long-term portion of the pension liability related to the defined benefit plans and the deferred compensation agreement with the CEO as of December 31, 2018 and 2017 and 2016 was $32.4$32.1 million and $28.3$33.9 million, respectively, and is included in OtherNon-Current liabilities in the accompanying consolidated balance sheets.
The following table summarizes key information related to the Company’s pension plans and retirement agreements. The table illustrates the reconciliation of the beginning and ending balances of the benefit obligation showing the effects during the periods presented attributable to service cost, interest cost, plan amendments, termination benefits, actuarial gains and losses. The assumptions used in the Company’s calculation of accrued pension costs are based on market information and the Company’s historical rates for employment compensation and discount rates.
| Year Ended December 31, 2017 | Year Ended December 31, 2016 | |||||||
Accumulated Benefit Obligation, End of Year | $ | 25,457 | $ | 22,515 | ||||
Change in Projected Benefit Obligation | ||||||||
Projected Benefit Obligation, Beginning of Year | $ | 28,624 | $ | 25,935 | ||||
Service Cost | 1,001 | 995 | ||||||
Interest Cost | 1,228 | 1,155 | ||||||
Actuarial (Gain) Loss | 2,474 | 1,031 | ||||||
Benefits Paid | (507 | ) | (492 | ) | ||||
|
|
|
| |||||
Projected Benefit Obligation, End of Year | $ | 32,820 | $ | 28,624 | ||||
|
|
|
| |||||
Change in Plan Assets | ||||||||
Plan Assets at Fair Value, Beginning of Year | $ | — | $ | — | ||||
Company Contributions | 507 | 492 | ||||||
Benefits Paid | (507 | ) | (492 | ) | ||||
|
|
|
| |||||
Plan Assets at Fair Value, End of Year | $ | — | $ | — | ||||
|
|
|
| |||||
Unfunded Status of the Plan | $ | (32,820 | ) | $ | (28,624 | ) | ||
|
|
|
| |||||
Amounts Recognized in Accumulated Other Comprehensive Income | ||||||||
Net Loss | 7,745 | 5,561 | ||||||
|
|
|
| |||||
Total Pension Cost | $ | 7,745 | $ | 5,561 | ||||
|
|
|
| |||||
| December 31, 2018 | December 31, 2017 | |||||||
Accumulated Benefit Obligation, End of Year | $ | 25,777 | $ | 25,457 | ||||
Change in Projected Benefit Obligation | ||||||||
Projected Benefit Obligation, Beginning of Year | $ | 32,820 | $ | 28,624 | ||||
Service Cost | 1,200 | 1,001 | ||||||
Interest Cost | 1,242 | 1,228 | ||||||
Actuarial (Gain) Loss | (2,166 | ) | 2,474 | |||||
Benefits Paid | (622 | ) | (507 | ) | ||||
|
|
|
| |||||
Projected Benefit Obligation, End of Year | $ | 32,474 | $ | 32,820 | ||||
|
|
|
| |||||
Change in Plan Assets | ||||||||
Plan Assets at Fair Value, Beginning of Year | $ | — | $ | — | ||||
Company Contributions | 622 | 507 | ||||||
Benefits Paid | (622 | ) | (507 | ) | ||||
|
|
|
| |||||
Plan Assets at Fair Value, End of Year | $ | — | $ | — | ||||
|
|
|
| |||||
Unfunded Status of the Plan | $ | (32,474 | ) | $ | (32,820 | ) | ||
|
|
|
| |||||
Amounts Recognized in Accumulated Other Comprehensive Income | ||||||||
Net Loss | 5,047 | 7,745 | ||||||
|
|
|
| |||||
Total Pension Cost | $ | 5,047 | $ | 7,745 | ||||
|
|
|
| |||||
| 2017 | 2016 | 2018 | 2017 | |||||||||||||
Components of Net Periodic Benefit Cost | ||||||||||||||||
Service Cost | $ | 1,001 | $ | 995 | $ | 1,200 | $ | 1,001 | ||||||||
Interest Cost | 1,228 | 1,155 | 1,242 | 1,228 | ||||||||||||
Amortization of: | ||||||||||||||||
Net Loss | 291 | 213 | 532 | 291 | ||||||||||||
|
|
|
| |||||||||||||
Net Periodic Pension Cost | $ | 2,520 | $ | 2,363 | $ | 2,974 | $ | 2,520 | ||||||||
|
|
|
| |||||||||||||
Weighted Average Assumptions for Expense | ||||||||||||||||
Discount Rate | 3.80 | % | 4.50 | % | 4.50 | % | 3.80 | % | ||||||||
Expected Return on Plan Assets | N/A | N/A | N/A | N/A | ||||||||||||
Rate of Compensation Increase | 4.40 | % | 4.40 | % | 4.40 | % | 4.40 | % | ||||||||
The amount included in accumulated other comprehensive income as of December 31, 20172018 that has not yet been recognized as a component of net periodic benefit cost is $5.1$5.0 million. The amount included in other accumulated comprehensive income as of December 31, 20172018 that is expected to be recognized as a component of net periodic benefit cost in fiscal year 20182019 is $0.5$0.2 million.
The benefit payments reflected in the table below represent the Company’s obligations to employees that are eligible for retirement or have already retired and are receiving deferred compensation benefits:
Fiscal Year | Pension Benefits | Pension Benefits | ||||||
| (In thousands) | (In thousands) | |||||||
2018 | $ | 8,642 | ||||||
2019 | 816 | $ | 9,105 | |||||
2020 | 833 | 882 | ||||||
2021 | 824 | 874 | ||||||
2022 | 892 | 865 | ||||||
2023 | 856 | |||||||
Thereafter | 20,813 | 19,892 | ||||||
|
| |||||||
| $ | 32,820 | $ | 32,474 | |||||
|
| |||||||
The Company also maintains The GEO Group Inc. Deferred Compensation Plan (“Deferred Compensation Plan”), anon-qualified deferred compensation plan for employees who are ineligible to participate in its qualified 401(k) plan. Eligible employees may defer a fixed percentage of their salary and the Company matches employee contributions up to a certain amount based on the employee’s years of service. Payments will be made at retirement age of 65, at termination of employment or earlier depending on the employees’ elections. The Company established a rabbi trust; the purpose of which is to segregate the assets of the Deferred Compensation Plan from the Company’s cash balances. The funds in the rabbi trust are included in Restricted Cash and Investments in the accompanying Consolidated Balance Sheets. These funds are not available to the Company for any purpose other than to fund the Deferred Compensation Plan; however, these funds may be available to the Company’s creditors in the event the Company becomes insolvent. The rabbi trust had a balance of approximately $21$20.9 million at December 31, 2017.2018. All employee and employer contributions relative to the Deferred Compensation Plan are made directly to the rabbi trust. The Company recognized expense related to its contributions of $0.1 million for each of the years ended December 31, 2018, 2017 2016 and 2015 respectively.2016. The total liability for this plan at December 31, 2018 and 2017 and 2016 was approximately$21approximately $21.2 million and $16$21.4 million, respectively, and is included in OtherNon-Current Liabilities in the accompanying Consolidated Balance Sheets. The current portion of the liability was $1.4$1.7 million and $0.8$1.4 million as of December 31, 20172018 and 2016,2017, respectively.
| 15. | Business Segments and Geographic Information |
Operating and Reporting Segments
The Company conducts its business through four reportable business segments: the U.S. Corrections & Detention segment; the International Services segment; the GEO Care segment; and Facility Construction & Design segment. The Company has identified these four reportable segments to reflect the current view that the Company operates four distinct business lines, each of which constitutes a material part of its overall business. The U.S. Corrections & Detention segment primarily encompasses U.S.-based privatized corrections and detention business. The International Services segment primarily consists of privatized corrections and detention operations in South Africa, Australia and the United Kingdom. The Company’s community-based services, youth services and BI are operating segments aggregated under the GEO Care reporting segment. The GEO Care segment, which conducts its services in the United States, represents services provided to adult offenders and juveniles fornon-residential treatment, educational and community based programs,pre-release andhalf-way house programs, compliance technologies, monitoring services and evidence-based supervision and treatment programs for community-based parolees, probationers, and pretrial defendants. The Facility Construction & Design segment primarily contracts with various state, local and federal agencies for the design and construction of facilities for which the Company has management contracts. Generally, the assets and revenues from the Facility Construction & Design segment are offset by a similar amount of liabilities and expenses. Segment disclosures below (in thousands) reflect the results of continuing operations. All transactions between segments are eliminated.
Fiscal Year | 2017 | 2016 | 2015 | |||||||||
Revenues: | ||||||||||||
U.S. Corrections & Detention | $ | 1,438,044 | $ | 1,375,277 | $ | 1,240,440 | ||||||
GEO Care | 514,166 | 394,449 | 340,918 | |||||||||
International Services | 195,806 | 157,363 | 154,902 | |||||||||
Facility Construction and Design [1] | 115,404 | 252,401 | 107,047 | |||||||||
|
|
|
|
|
| |||||||
Total revenues | $ | 2,263,420 | $ | 2,179,490 | $ | 1,843,307 | ||||||
|
|
|
|
|
| |||||||
Capital Expenditures: | ||||||||||||
U.S. Corrections & Detention | $ | 117,186 | $ | 40,764 | $ | 76,070 | ||||||
GEO Care | 24,263 | 35,001 | 39,523 | |||||||||
International Services | 6,957 | 5,800 | 1,988 | |||||||||
|
|
|
|
|
| |||||||
Total capital expenditures | $ | 148,406 | $ | 81,565 | $ | 117,581 | ||||||
|
|
|
|
|
| |||||||
Depreciation and amortization: | ||||||||||||
U.S. Corrections & Detention | $ | 75,276 | $ | 74,154 | $ | 70,486 | ||||||
GEO Care | 47,103 | 38,687 | 33,582 | |||||||||
International Services | 1,918 | 2,075 | 2,688 | |||||||||
|
|
|
|
|
| |||||||
Total depreciation and amortization | $ | 124,297 | $ | 114,916 | $ | 106,756 | ||||||
|
|
|
|
|
| |||||||
Operating Income: | ||||||||||||
U.S. Corrections & Detention | $ | 302,488 | $ | 296,078 | $ | 281,945 | ||||||
GEO Care | 123,525 | 111,780 | 82,806 | |||||||||
International Services | 14,235 | 5,809 | 7,666 | |||||||||
Facility Construction & Design [1] | (1,620 | ) | 626 | 352 | ||||||||
|
|
|
|
|
| |||||||
Operating income from segments | $ | 438,628 | $ | 414,293 | $ | 372,769 | ||||||
|
|
|
|
|
| |||||||
General and Administrative Expenses | (190,343 | ) | (148,709 | ) | (137,040 | ) | ||||||
|
|
|
|
|
| |||||||
Total operating income | $ | 248,285 | $ | 265,584 | $ | 235,729 | ||||||
|
|
|
|
|
| |||||||
Fiscal Year | 2018 | 2017 | 2016 | |||||||||
Revenues: | ||||||||||||
U.S. Corrections & Detention | $ | 1,492,973 | $ | 1,438,044 | $ | 1,375,277 | ||||||
GEO Care | 580,313 | 514,166 | 394,449 | |||||||||
International Services | 253,874 | 195,806 | 157,363 | |||||||||
Facility Construction and Design [1] [2] | 4,226 | 115,404 | 252,401 | |||||||||
|
|
|
|
|
| |||||||
Total revenues | $ | 2,331,386 | $ | 2,263,420 | $ | 2,179,490 | ||||||
|
|
|
|
|
| |||||||
Capital Expenditures: | ||||||||||||
U.S. Corrections & Detention | $ | 163,208 | $ | 117,186 | $ | 40,764 | ||||||
GEO Care | 30,136 | 24,263 | 35,001 | |||||||||
International Services | 2,322 | 6,957 | 5,800 | |||||||||
|
|
|
|
|
| |||||||
Total capital expenditures | $ | 195,666 | $ | 148,406 | $ | 81,565 | ||||||
|
|
|
|
|
| |||||||
Depreciation and amortization: | ||||||||||||
U.S. Corrections & Detention | $ | 76,801 | $ | 75,276 | $ | 74,154 | ||||||
GEO Care | 47,546 | 47,103 | 38,687 | |||||||||
International Services | 2,087 | 1,918 | 2,075 | |||||||||
|
|
|
|
|
| |||||||
Total depreciation and amortization | $ | 126,434 | $ | 124,297 | $ | 114,916 | ||||||
|
|
|
|
|
| |||||||
Operating Income: | ||||||||||||
U.S. Corrections & Detention | $ | 297,453 | $ | 302,488 | $ | 296,078 | ||||||
GEO Care | 138,911 | 123,525 | 111,780 | |||||||||
International Services | 12,816 | 14,235 | 5,809 | |||||||||
Facility Construction & Design [1] [2] | — | (1,620 | ) | 626 | ||||||||
|
|
|
|
|
| |||||||
Operating income from segments | $ | 449,180 | $ | 438,628 | $ | 414,293 | ||||||
|
|
|
|
|
| |||||||
General and Administrative Expenses | (184,515 | ) | (190,343 | ) | (148,709 | ) | ||||||
|
|
|
|
|
| |||||||
Total operating income | $ | 264,665 | $ | 248,285 | $ | 265,584 | ||||||
|
|
|
|
|
| |||||||
| [1] | The Company began the design and construction of a new prison located in Ravenhall, a locality near Melbourne, Australia in 2014. The facility was completed in November 2017. There were no capital |
| expenditures or depreciation or amortization associated with this segment in 2018, 2017 |
| [2] | During 2018, the Company had facility construction & design revenues related to an expansion project at its Fulham Correctional Centre in Australia which is expected to be completed in the third quarter of 2020. There is no margin associated with the expansion. |
Pre-Tax Income Reconciliation of Segments
The following is a reconciliation of the Company’s total operating income from its reportable segments to the Company’s income before income taxes and equity in earnings of affiliates, in each case, during the years ended December 31, 2018, 2017 2016 and 2015,2016, respectively.
Fiscal Year Ended | 2017 | 2016 | 2015 | 2018 | 2017 | 2016 | ||||||||||||||||||
| (In thousands) | (In thousands) | |||||||||||||||||||||||
Operating income from segments | $ | 438,628 | $ | 414,293 | $ | 372,769 | $ | 449,180 | $ | 438,628 | $ | 414,293 | ||||||||||||
Unallocated amounts: | ||||||||||||||||||||||||
General and administrative expense | (190,343 | ) | (148,709 | ) | (137,040 | ) | (184,515 | ) | (190,343 | ) | (148,709 | ) | ||||||||||||
Net interest expense | (96,348 | ) | (100,222 | ) | (94,558 | ) | (115,348 | ) | (96,348 | ) | (100,222 | ) | ||||||||||||
Loss on extinguishment of debt | — | (15,885 | ) | — | — | — | (15,885 | ) | ||||||||||||||||
|
|
|
|
|
| |||||||||||||||||||
Income before income taxes and equity in earnings of affiliates | $ | 151,937 | $ | 149,477 | $ | 141,171 | $ | 149,317 | $ | 151,937 | $ | 149,477 | ||||||||||||
|
|
|
|
|
| |||||||||||||||||||
| 2017 | 2016 | 2015 | ||||||||||||||||||||||
| (In thousands) | ||||||||||||||||||||||||
Segment assets: | ||||||||||||||||||||||||
U.S. Corrections & Detention | $ | 2,385,069 | $ | 2,390,705 | $ | 2,396,076 | ||||||||||||||||||
GEO Care | 1,121,792 | 711,795 | 722,248 | |||||||||||||||||||||
International Services | 40,056 | 64,417 | 43,589 | |||||||||||||||||||||
Facility Construction & Design | 499,406 | 446,434 | 176,638 | |||||||||||||||||||||
|
|
| ||||||||||||||||||||||
Total segment assets | $ | 4,046,323 | $ | 3,613,351 | $ | 3,338,551 | ||||||||||||||||||
|
|
| ||||||||||||||||||||||
| 2018 | 2017 | 2016 | ||||||||||
| (In thousands) | ||||||||||||
Segment assets: | ||||||||||||
U.S. Corrections & Detention | $ | 2,580,067 | $ | 2,385,069 | $ | 2,390,705 | ||||||
GEO Care | 1,063,484 | 1,121,792 | 711,795 | |||||||||
International Services | 84,911 | 40,056 | 64,417 | |||||||||
Facility Construction & Design | 383,713 | 499,406 | 446,434 | |||||||||
|
|
|
|
|
| |||||||
Total segment assets | $ | 4,112,175 | $ | 4,046,323 | $ | 3,613,351 | ||||||
|
|
|
|
|
| |||||||
Asset Reconciliation
The following is a reconciliation of the Company’s reportable segment assets to the Company’s total assets as of December 31, 20172018 and 2016,2017, respectively.
| 2017 | 2016 | 2018 | 2017 | |||||||||||||
| (In thousands) | (In thousands) | |||||||||||||||
Reportable segment assets | $ | 4,046,323 | $ | 3,613,351 | $ | 4,112,175 | $ | 4,046,323 | ||||||||
Cash | 81,377 | 68,038 | 31,255 | 81,377 | ||||||||||||
Deferred income tax assets | 26,277 | 30,039 | 29,924 | 26,277 | ||||||||||||
Restricted cash and investments, current andnon-current | 72,931 | 37,981 | 74,109 | 72,931 | ||||||||||||
|
|
|
| |||||||||||||
Total assets | $ | 4,226,908 | $ | 3,749,409 | $ | 4,247,463 | $ | 4,226,908 | ||||||||
|
|
|
| |||||||||||||
Geographic Information
During each of the years ended December 31, 2018, 2017 2016 and 2015,2016, the Company’s international operations were conducted through (i) the Company’s wholly owned Australian subsidiary, The GEO Group Australia Pty. Ltd., through which the Company has management contracts for four correctional facilities, (ii) the Company’s wholly owned subsidiaries, GEO Ravenhall Finance Holdings Pty. Ltd. and GEO Ravenhall Holdings Pty. Ltd.
which, together, had a design and construction contract for a new prison in Ravenhall, Australia which was
completed in November 2017, (iii) the Company’s wholly-owned subsidiary in South Africa, SACM, through which the Company manages one correctional facility, and (iv) the Company’s wholly-owned subsidiary in the United Kingdom, The GEO Group UK Ltd., through which the Company manages the Dungavel House Immigration Removal Centre.
Fiscal Year | 2017 | 2016 | 2015 | 2018 | 2017 | 2016 | ||||||||||||||||||
| (In thousands) | (In thousands) | |||||||||||||||||||||||
Revenues: | ||||||||||||||||||||||||
U.S. operations | $ | 1,952,210 | $ | 1,770,273 | $ | 1,581,811 | $ | 2,073,286 | $ | 1,952,210 | $ | 1,770,273 | ||||||||||||
Australia operations | 285,702 | 388,361 | 237,731 | 231,164 | 285,702 | 388,361 | ||||||||||||||||||
South African operations | 18,251 | 13,658 | 14,964 | 19,806 | 18,251 | 13,658 | ||||||||||||||||||
United Kingdom operations | 7,257 | 7,198 | 8,801 | 7,130 | 7,257 | 7,198 | ||||||||||||||||||
|
|
|
|
|
| |||||||||||||||||||
Total revenues | $ | 2,263,420 | $ | 2,179,490 | $ | 1,843,307 | $ | 2,331,386 | $ | 2,263,420 | $ | 2,179,490 | ||||||||||||
|
|
|
|
|
| |||||||||||||||||||
Property and Equipment, net: | ||||||||||||||||||||||||
U.S. operations | $ | 2,061,711 | $ | 1,887,043 | $ | 1,910,378 | $ | 2,145,197 | $ | 2,061,711 | $ | 1,887,043 | ||||||||||||
Australia operations | 16,281 | 10,053 | 5,871 | 13,006 | 16,281 | 10,053 | ||||||||||||||||||
South African operations | 131 | 145 | 90 | 88 | 131 | 145 | ||||||||||||||||||
United Kingdom operations | — | — | 47 | 319 | — | — | ||||||||||||||||||
|
|
|
|
|
| |||||||||||||||||||
Total Property and Equipment, net | $ | 2,078,123 | $ | 1,897,241 | $ | 1,916,386 | $ | 2,158,610 | $ | 2,078,123 | $ | 1,897,241 | ||||||||||||
|
|
|
|
|
| |||||||||||||||||||
Sources of Revenue
The Company derives most of its revenue from the management of correction and detention facilities through public-private partnerships. The Company also derives revenue from the provision of community based and youth services, monitoring and evidence-based supervision and treatment programs in the United States, and expansion of new and existing correction, detention facilities. All of the Company’s revenue is generated from external customers.
Fiscal Year | 2017 | 2016 | 2015 | 2018 | 2017 | 2016 | ||||||||||||||||||
| (In thousands) | (In thousands) | |||||||||||||||||||||||
Revenues: | ||||||||||||||||||||||||
Corrections & Detention | $ | 1,633,850 | $ | 1,532,640 | $ | 1,395,342 | $ | 1,746,847 | $ | 1,633,850 | $ | 1,532,640 | ||||||||||||
GEO Care | 514,166 | 394,449 | 340,918 | 580,313 | 514,166 | 394,449 | ||||||||||||||||||
Facility Construction and Design | 115,404 | 252,401 | 107,047 | 4,226 | 115,404 | 252,401 | ||||||||||||||||||
|
|
|
|
|
| |||||||||||||||||||
Total revenues | $ | 2,263,420 | $ | 2,179,490 | $ | 1,843,307 | $ | 2,331,386 | $ | 2,263,420 | $ | 2,179,490 | ||||||||||||
|
|
|
|
|
| |||||||||||||||||||
Equity in Earnings of Affiliates
Equity in earnings of affiliates for 2018, 2017 2016 and 20152016 includes the operating results of the Company’s joint ventures in SACS and GEOAmey. These joint ventures are accounted for under the equity method and the Company’s investments in SACS and GEOAmey are presented as a component of othernon-current assets in the accompanying Consolidated Balance Sheets.
The Company has recorded $7.4 million, $10.8 million $4.3 million and $4.7$4.3 million in earnings, net of tax impact, for SACS operations during the years ended December 31, 2018, 2017 2016 and 2015,2016, respectively, which are included in equity in earnings of affiliates, net of income tax provision in the accompanying Consolidated Statements of Operations. During 2017, SACS was successful in obtaining a favorable tax judgment which resulted in an increase in earnings net of taxes of $5.5 million.million As of December 31, 20172018 and 2016,2017, the Company’s investment in SACS was $18.1$13.4 million and $11.8$18.1 million, respectively. The investment is included in othernon-current
assets in the accompanying Consolidated Balance Sheets. The Company received dividend distributions of $11.8 million and $6.1 million, in 2018 and $1.6 million, in 2017, and 2016, respectively from this unconsolidated joint venture.
The Company has recorded $2.2 million, $1.2 million $2.6 million and $0.8$2.6 million in earnings, net of tax impact, for GEOAmey’s operations during the years ended December 31, 2018, 2017 2016 and 2015,2016, respectively, which are included in equity in earnings of affiliates, net of income tax provision, in the accompanying Consolidated Statements of Operations. As of December 31, 20172018 and 2016,2017, the Company’s investment in GEOAmey was $2.7$4.8 million and $1.3$2.7 million, respectively, and represents its share of cumulative reported earnings (losses).
Business Concentration
Except for the major customer noted in the following table, no other single customer made up greater than 10% of the Company’s consolidated revenues for the following fiscal years:
Customer | 2017 | 2016 | 2015 | 2018 | 2017 | 2016 | ||||||||||||||||||
Various agencies of the U.S Federal Government: | 48 | % | 48 | % | 45 | % | 50 | % | 48 | % | 48 | % | ||||||||||||
The concentrations above relate entirely to the Company’s U.S. Corrections & Detention segment.
Credit risk related to accounts receivable is reflective of the related revenues.
| 16. | Income Taxes |
The United States and foreign components of income before income taxes and equity in earnings in affiliates are as follows:
| 2017 | 2016 | 2015 | 2018 | 2017 | 2016 | |||||||||||||||||||
| (In thousands) | (In thousands) | |||||||||||||||||||||||
Income before income taxes and equity in earnings in affiliates | ||||||||||||||||||||||||
United States | $ | 130,205 | $ | 139,937 | $ | 130,752 | $ | 131,261 | $ | 130,205 | $ | 139,937 | ||||||||||||
Foreign | 21,732 | 9,540 | 10,419 | 18,056 | 21,732 | 9,540 | ||||||||||||||||||
|
|
|
|
|
| |||||||||||||||||||
Income before income taxes and equity in earnings in affiliates | $ | 151,937 | $ | 149,477 | $ | 141,171 | $ | 149,317 | $ | 151,937 | $ | 149,477 | ||||||||||||
|
|
|
|
|
| |||||||||||||||||||
The provision for income taxes consists of the following components:
| 2017 | 2016 | 2015 | ||||||||||
| (In thousands) | ||||||||||||
Federal income taxes: | ||||||||||||
Current | $ | 13,928 | $ | 5,801 | $ | 3,437 | ||||||
Deferred | (3,803 | ) | (3,541 | ) | (1,924 | ) | ||||||
|
|
|
|
|
| |||||||
| 10,125 | 2,260 | 1,513 | ||||||||||
|
|
|
|
|
| |||||||
State income taxes: | ||||||||||||
Current | 3,337 | 2,764 | 683 | |||||||||
Deferred | (2,269 | ) | (1,792 | ) | 684 | |||||||
|
|
|
|
|
| |||||||
| 1,068 | 972 | 1,367 | ||||||||||
|
|
|
|
|
| |||||||
Foreign income taxes: | ||||||||||||
Current | (11,545 | ) | 5,302 | 5,643 | ||||||||
Deferred | 18,310 | (630 | ) | (1,134 | ) | |||||||
|
|
|
|
|
| |||||||
| 6,765 | 4,672 | 4,509 | ||||||||||
|
|
|
|
|
| |||||||
Total U.S. and foreign provision for income taxes | $ | 17,958 | $ | 7,904 | $ | 7,389 | ||||||
|
|
|
|
|
| |||||||
| 2018 | 2017 | 2016 | ||||||||||
| (In thousands) | ||||||||||||
Federal income taxes: | ||||||||||||
Current | $ | 9,340 | $ | 13,928 | $ | 5,801 | ||||||
Deferred | (2,195 | ) | (3,803 | ) | (3,541 | ) | ||||||
|
|
|
|
|
| |||||||
| 7,145 | 10,125 | 2,260 | ||||||||||
|
|
|
|
|
| |||||||
State income taxes: | ||||||||||||
Current | 3,050 | 3,337 | 2,764 | |||||||||
Deferred | (1,889 | ) | (2,269 | ) | (1,792 | ) | ||||||
|
|
|
|
|
| |||||||
| 1,161 | 1,068 | 972 | ||||||||||
|
|
|
|
|
| |||||||
Foreign income taxes: | ||||||||||||
Current | 497 | (11,545 | ) | 5,302 | ||||||||
Deferred | 5,314 | 18,310 | (630 | ) | ||||||||
|
|
|
|
|
| |||||||
| 5,811 | 6,765 | 4,672 | ||||||||||
|
|
|
|
|
| |||||||
Total U.S. and foreign provision for income taxes | $ | 14,117 | $ | 17,958 | $ | 7,904 | ||||||
|
|
|
|
|
| |||||||
The U.S. Tax Cuts and Jobs Act (Tax Act) was enacted on December 22, 2017 and introducesintroduced significant changes to U.S. income tax law. Effective in 2018, the Tax Act reducesreduced the U.S. statutory corporate tax rate from 35% to 21%.
Due to the timing of the enactment and the complexity involved in applying the provisions of the Tax Act, the Company has made reasonable estimates of the effects and recorded provisional amounts in its financial statements as offor the year ended December 31, 2017. As the Company collectscollected and preparesprepared necessary data, and interprets the Tax Act andinterpreted any additional guidance issued by the U.S. Treasury Department, the IRS andor other standard-setting bodies, it may makemade adjustments over the course of the year to the provisional amounts. Those adjustments may materially impact the Company’s provision for income taxes and effective tax rate in the period in which the adjustments are made.amounts, including refinements to deferred taxes. The accounting for the tax effects of the Tax Act will be completed in 2018.
Provisional amounts for the following income tax effectsenactment of the Tax Act havehas been recordedcompleted as of December 31, 2017 and are subject to change during 2018.
One-time transition tax
As a REIT, the Tax Act requires the Company to include into taxable income accumulated foreign subsidiary earnings not previously subject to U.S. income tax, subjectDue to the REIT dividend paid deduction. Consequently, due to our status as a REIT, we will not be subject to tax on accumulated foreign subsidiary earnings.
Deferred tax effects
The Tax Act reduceschange in the U.S. statutory tax rate from 35% to 21% for years after 2017. Accordingly,the Tax Act, the Company has remeasured its deferred taxes as of December 31, 2017 to reflect the reduced rate that will apply in future periods when these deferred taxes are settled or realized. The Company recognized a deferred tax expense of $9.6 million to reflect the reduced U.S. tax rate. Although the tax rate reduction is known, the Company has not collected the necessary data to complete its analysis of the effect of the Tax Act on certain underlying deferred taxes, such as the deductibility of accrued executive compensation and deferred taxes related to the CEC acquisition. As such, the amounts recorded as of December 31, 2017 are provisional.
The net tax expense (benefit) recognized in 2017 related to the Tax Act was $(0.3) million and $9.6 million. As the Company completes its analysis of the Tax Actmillion for 2018 and incorporates additional guidance that may be issued by the U.S. Treasury Department, the IRS or other standard-setting bodies, it may identify additional effects not reflected as of December 31, 2017.2017, respectively.
A reconciliation of the statutory U.S. federal tax rate of 35.00%21% and the effective income tax rate is as follows:
| 2017 | 2016 | 2015 | 2018 | 2017 | 2016 | |||||||||||||||||||
| (In thousands) | (In thousands) | |||||||||||||||||||||||
Provisions using statutory federal income tax rate | $ | 53,175 | $ | 52,317 | $ | 49,410 | $ | 31,340 | $ | 53,175 | $ | 52,317 | ||||||||||||
State income taxes (benefit), net of federal tax benefit | (776 | ) | 1,161 | (322 | ) | 1,915 | (776 | ) | 1,161 | |||||||||||||||
REIT Benefit | (43,554 | ) | (41,479 | ) | (42,536 | ) | (19,992 | ) | (43,554 | ) | (41,479 | ) | ||||||||||||
Change in contingent tax liabilities | (510 | ) | (403 | ) | (395 | ) | ||||||||||||||||||
Change in valuation allowance | 2,055 | 243 | 3,702 | (1,245 | ) | 2,055 | 243 | |||||||||||||||||
Federal tax credits | (1,904 | ) | (2,016 | ) | (2,038 | ) | ||||||||||||||||||
Tax Cut and Jobs Act Impact | 9,584 | — | — | (301 | ) | 9,584 | — | |||||||||||||||||
Other, net | (2,016 | ) | (3,935 | ) | (2,470 | ) | 4,304 | (510 | ) | (2,300 | ) | |||||||||||||
|
|
|
|
|
| |||||||||||||||||||
Total provision for income taxes | $ | 17,958 | $ | 7,904 | $ | 7,389 | $ | 14,117 | $ | 17,958 | $ | 7,904 | ||||||||||||
|
|
|
|
|
| |||||||||||||||||||
The Company’s effective tax rate differs from the U.S. statutory rate of 35.0%21% primarily due to a zero tax rate on earnings generated by the Company’s REIT operations. State income taxes (benefit), net of federal tax
benefits of $1.9 million, $(0.8) million and $1.2 million for 2018, 2017 and $(0.3) million for 2017, 2016, and 2015, respectively, is presented exclusive of the related change in valuation allowance of state income tax deferred items. Net of the related change in valuation allowances the state income taxes, net of federal tax benefits is $1.3 million, $1.5 million and $1.2 million for 2018, 2017 and $0.9 million for 2017, 2016, and 2015, respectively.
The following table presents the breakdown betweennon-current net deferred tax assets as of December 31, 20172018 and 2016:2017:
| 2017 | 2016 | 2018 | 2017 | |||||||||||||
| (In thousands) | (In thousands) | |||||||||||||||
Deferred tax assets — non current | 26,277 | 30,039 | $ | 29,924 | $ | 26,277 | ||||||||||
Deferred tax liabilities — non current | (8,757 | ) | — | (13,681 | ) | (8,757 | ) | |||||||||
|
|
|
| |||||||||||||
Total net deferred tax assets | $ | 17,520 | $ | 30,039 | $ | 16,243 | $ | 17,520 | ||||||||
|
|
|
| |||||||||||||
The significant components of the Company’s deferred tax assets and liabilities consisted of the following as of December 31, 20172018 and 2016:2017:
| 2017 | 2016 | 2018 | 2017 | |||||||||||||
| (In thousands) | (In thousands) | |||||||||||||||
Deferred tax assets: | ||||||||||||||||
Net operating losses | $ | 45,041 | $ | 32,088 | $ | 35,924 | $ | 45,041 | ||||||||
Accrued liabilities | 25,384 | 26,355 | 23,719 | 25,384 | ||||||||||||
Deferred compensation | 11,675 | 14,273 | 12,031 | 11,675 | ||||||||||||
Accrued compensation | 6,854 | 6,527 | 6,881 | 6,854 | ||||||||||||
Deferred revenue | 2,780 | 4,564 | 8,458 | 2,780 | ||||||||||||
Deferred rent | 506 | 2,469 | ||||||||||||||
Tax credits | 6,629 | 4,524 | 6,850 | 6,629 | ||||||||||||
Equity awards | 4,076 | 4,296 | 4,419 | 4,076 | ||||||||||||
Other, net | 453 | 1,260 | — | 959 | ||||||||||||
Valuation allowance | (22,577 | ) | (17,312 | ) | (21,333 | ) | (22,577 | ) | ||||||||
|
|
|
| |||||||||||||
Total deferred tax assets | $ | 80,821 | $ | 79,044 | $ | 76,949 | $ | 80,821 | ||||||||
|
|
|
| |||||||||||||
Deferred tax liabilities: | ||||||||||||||||
Intangible assets | $ | (30,084 | ) | $ | (40,935 | ) | $ | (26,543 | ) | $ | (30,084 | ) | ||||
Capitalized transaction costs | (17,955 | ) | (5,945 | ) | (16,643 | ) | (17,955 | ) | ||||||||
Depreciation | (15,262 | ) | (2,125 | ) | (17,400 | ) | (15,262 | ) | ||||||||
Other, net | (120 | ) | — | |||||||||||||
|
|
|
| |||||||||||||
Total deferred tax liabilities | $ | (63,301 | ) | $ | (49,005 | ) | $ | (60,706 | ) | $ | (63,301 | ) | ||||
|
|
|
| |||||||||||||
Total net deferred tax assets | $ | 17,520 | $ | 30,039 | $ | 16,243 | $ | 17,520 | ||||||||
|
|
|
| |||||||||||||
Deferred income taxes should be reduced by a valuation allowance if it is not more likely than not that some portion or all of the deferred tax assets will be realized. On a periodic basis, management evaluates and determines the amount of the valuation allowance required and adjusts such valuation allowance accordingly. At year end 20172018 and 2016,2017, the Company has a valuation allowance of $22.6$21.3 million and $17.3$22.6 million, respectively related to deferred tax assets for foreign net operating losses, state net operating losses and state tax credits. The valuation allowance increaseddecreased by $5.3$1.3 million during the year ended December 31, 2017.2018.
The Company provides income taxes on the undistributed earnings ofnon-U.S. subsidiariessubsidiaries. except to the extent that such earnings are permanently invested outside the United States. At December 31, 2017, $2.6 million of2018, there were no accumulated undistributed earnings ofnon-U.S. subsidiaries that were permanently invested. Atinvested outside the existing U.S. federal income and applicable foreign withholding tax rates, additional taxes (net of foreign tax credits) of $0.1 million, consisting solely of withholding taxes, would have to be provided if such earnings were remitted currently.United States.
As of the year ended December 31, 2017,2018, the Company had $42.7$43.1 million of Federal net operating loss carryforwards which begin to expire in 2032 and $189.7$171.7 million of combined net operating loss carryforwards in various states which beginbegan to expire in 2018. The Federal net operating losses are at the Company’s REIT which is not subject to tax. The Company has recorded a partial valuation allowance against the deferred tax assets related to the state operating losses.
Also as of the year ended December 31, 2017,2018, the Company had $104.6$78.6 million of foreign operating losses which carry forward indefinitely and $5.8$6.5 million of state tax credits which begin to expire in 2019. The Company has recorded a partial valuation allowance against the deferred tax assets related to the foreign operating losses and state tax credits.
The Company recognizes the cost of employee services received in exchange for awards of equity instruments based upon the grant date fair value of those awards. The exercise ofnon-qualified stock options and vesting of restricted stock awards which have been granted under the Company’s equity award plans give rise to compensation income which is includable in the taxable income of the applicable employees and deductedthe majority of which is deductible by the Company for federal and state income tax purposes. In the case ofnon-qualified stock options, the compensation income results from increases in the fair market value of the Company’s common stock subsequent to the date of grant. At year end 2017,2018, the deferred tax asset net of a valuation allowance related to unexercised stock options and restricted stock grants for which the Company has recorded a book expense was $4.2$4.4 million.
The Company recognizes the financial statement benefit of a tax position only after determining that the relevant tax authority would more likely than not sustain the position following an audit. For tax positions meeting themore-likely-than-not threshold, the amount recognized in the financial statements is the largest benefit that has a greater than 50 percent likelihood of being realized upon ultimate settlement with the relevant tax authority.
A reconciliation of the beginning and ending amount of unrecognized tax benefits is as follows:
| 2017 | 2016 | 2015 | 2018 | 2017 | 2016 | |||||||||||||||||||
| (In thousands) | (In thousands) | |||||||||||||||||||||||
Balance at Beginning of Period | $ | 1,640 | $ | 1,571 | $ | 2,076 | $ | 4,461 | $ | 1,640 | $ | 1,571 | ||||||||||||
Additions based on tax positions related to the current year | — | 1,290 | — | — | — | 1,290 | ||||||||||||||||||
Additions for tax positions of prior years | — | 341 | — | 298 | — | 341 | ||||||||||||||||||
Additions from current year acquisitions | 4,121 | — | — | — | 4,121 | — | ||||||||||||||||||
Reductions for tax positions of prior years | (1,290 | ) | — | — | — | (1,290 | ) | — | ||||||||||||||||
Reductions as a result of a lapse of applicable statutes of limitations | (10 | ) | (1,562 | ) | (505 | ) | (175 | ) | (10 | ) | (1,562 | ) | ||||||||||||
|
|
|
|
|
| |||||||||||||||||||
Balance at End of Period | $ | 4,461 | $ | 1,640 | $ | 1,571 | $ | 4,584 | $ | 4,461 | $ | 1,640 | ||||||||||||
|
|
|
|
|
| |||||||||||||||||||
All amounts in the reconciliation are reported on a gross basis and do not reflect a federal tax benefit on state income taxes. The Company has accrued $4.3$4.4 million of accrued uncertain tax benefits as of December 31, 20172018 which is inclusive of the federal tax benefit on state income taxes. The Company believes that it is reasonably possible that a decrease may be necessary in the unrecognized tax benefits within twelve months of the reporting date of approximately $0.2$0.1 million, related to state tax exposures, due to a lapse of the statute of limitation. The accrued uncertain tax balance at December 31, 20172018 includes $4.3$4.4 million of unrecognized tax benefits which, if ultimately recognized, will reduce the Company’s annual effective tax rate.
The Company is subject to income taxes in the U.S. federal jurisdiction, and various states and foreign jurisdictions. Tax regulations within each jurisdiction are subject to the interpretation of the related tax laws and
regulations and require significant judgment to apply. With few exceptions, the Company is no longer subject to U.S. federal, state and local, ornon-U.S. income tax examinations by tax authorities for the years before 2014.
The Company was under audit by the IRS for the 2013 tax year, its first REIT year. In the fourth quarter of 2017, the Company received a no change letter from the IRS for the 2013 tax year.
The calculation of the Company’s provision (benefit) for income taxes requires the use of significant judgment and involves dealing with uncertainties in the application of complex tax laws and regulations. In determining the adequacy of the Company’s provision (benefit) for income taxes, potential settlement outcomes resulting from income tax examinations are regularly assessed. As such, the final outcome of tax examinations, including the total amount payable or the timing of any such payments upon resolution of these issues, cannot be estimated with certainty.
During the yearyears ended December 31, 2018 and 2017, the Company did not recognize any interest and penalties. There was $0.1 million in interest and penalties recognized during the year ended December 31, 2016. The Company had accrued $0.1 million for the payment of interest and penalties at December 31, 2016. The Company classifies interest and penalties as interest expense and other expense, respectively.
In 2016, the Company discovered certain immaterial errors in prior periods related to the calculation of deferred tax assets and liabilities. In accordance with ASC Topic250-10-S99-2, “Considering the Effects of Prior Year Misstatements when Quantifying Misstatements in Current Year Financial Statements,” the Company recorded an aggregate adjustment of approximately $2.7 million reducing the provision for income taxes in 2016. This adjustment to the Company’s financial statements is immaterial both as it relates to 2016 as well as each of the prior periods affected. In evaluating materiality and determining the appropriateness of applying ASC Topic250-10-S99-2 to these errors, the Company considered materiality both qualitatively and quantitatively as prescribed by ASC Topic250-10-S99-1, “Assessing Materiality.”
| 17. | Commitments and Contingencies |
Operating Leases
The Company leases facilities, office space, computers and transportation equipment undernon-cancelable operating leases expiring between 20182019 and 2096. The future minimum commitments under these leases are as follows:
Fiscal Year | Annual Rental | Annual Rental | ||||||
| (In thousands) | (In thousands) | |||||||
2018 | $ | 47,112 | ||||||
2019 | 39,669 | $ | 49,000 | |||||
2020 | 16,614 | 34,000 | ||||||
2021 | 10,322 | 19,000 | ||||||
2022 | 8,660 | 15,000 | ||||||
2023 | 12,000 | |||||||
Thereafter | 47,803 | 49,000 | ||||||
|
| |||||||
| $ | 170,180 | $ | 178,000 | |||||
|
| |||||||
The Company leases its corporate offices, which are both located in Boca Raton, Florida, underFlorida. One of the leases expires in March 2019 and has two5-year renewal options, which if exercised would result in a lease agreement which was amendedmaximum term ending in November 2015.March 2029. The currentother lease expires in March 2019December 2028 and has two5-year renewal options which if exercised will result in a maximum term ending in December 2038. The Company elected not to renew the first lease expiring in March 2029. In 2016,2019 as the Company purchased land in Boca Raton, Florida to construct a new corporate office building which is expected to be completed in the fourthfirst quarter of 2018.2019. In addition, the Company leases office space for its regional offices in Charlotte, North Carolina; San Antonio, Texas; and Los Angeles, California. The Company is also currently leasing office space in Pittsburgh, Pennsylvania, Philadelphia, Pennsylvania, Boulder, Colorado and Aurora, Illinois. The Company also leases office space in Sydney, and Melbourne Australia and in Sandton, South Africa through its overseas affiliates to support its Australian and South African operations, respectively. These rental
commitments are included in the table above. Certain of these leases contain leasehold improvement incentives, rent holidays, and scheduled rent increases which are included in the Company’s rent expense recognized on a straight-line basis.
Minimum rent expense associated with the Company’s leases having initial or remainingnon-cancelable lease terms in excess of one year was $49.9 million, $45.4 million $38.2 million and $36.9$38.2 million for fiscal years 2018, 2017 and 2016, and 2015, respectively.
Collective Bargaining Agreements
The Company had approximately 36%32% of its workforce covered by collective bargaining agreements at December 31, 2017.2018. Collective bargaining agreements with 13%9% of employees are set to expire in less than one year.
Employment Agreements
On February 1, 2016,December 4, 2018, GEO entered into a Senior Officer Employment Agreement with Mr. J. David DonahueJoe Negron to serve as Senior Vice President, The GEO Group, Inc.,General Counsel and President, GEO Corrections and Detention.Secretary of the Company. The term of the agreement will be for an initial period of two years, and terminating two years thereafter. The term will be automatically extended by one day every day such that it has a continuous “rolling”two-year term until the age of 67 years, unless otherwise terminated pursuant to the agreement. The agreement calls for an annual base salary of $0.5$0.4 million.
On February 12, 2018, GEO entered into a Senior Officer Employment Agreement with Mr. Richard K. Long to serve as Senior Vice President, Project Development of the Company. The term of the agreement will be for an initial period of two years, and terminating two years thereafter. The term will be automatically extended by one day every day such that it has a continuous “rolling”two-year term until the age of 67 years, unless otherwise terminated pursuant to the agreement. The agreement calls for an annual base salary of $0.4 million.
Contract AwardsAwards/Terminations
We were successful in a solicitation by the Delaware County Board of Prisons Inspectors for the continued management of the1,931-bed George W. Hill Correctional Facility located in Delaware County Pennsylvania effective January 1, 2019. The contract has a base term through December 31, 2023 with two additional two year period renewal options.
On April 13, 2017,December 3, 2018, the Company announced that it had been awardedsigned a five-year contract by ICE forextension in Australia with the development and operationState of a new company-owned1,000-bed detention facility to be located in Conroe, Texas. GEO expects to design, finance, build and operate the facility under aten-year contract with ICE, inclusive of renewal options. The facility is scheduled for completion during the fourth quarter of 2018.
On May 26, 2017, the Company announced that it was awarded twoten-year contracts, inclusive of renewal option periods, by the BOPNew South Wales, Corrective Services for the continued housing of criminal aliens under the custodymanagement and expansion of the BOPJunee Correctional Centre (the “Centre”). The Centre is currently undergoing a489-bed expansion project which will bring its total capacity to 1,279 beds during 2019. The five-year agreement will be effective from April 1, 2019 through March, 31, 2024.
On June 26, 2018, we announced that we had signed a contract with the Idaho Department of Corrections for the housing, management and supervision of approximately 670 medium-custody inmates at the company-owned1,800-bed Big Spring Eagle Pass Detention Facility in Eagle Pass, Texas and the company-owned1,732-bed Flight Line Facility, which on a combined basis were previously referred to as the Big Spring Karnes Correctional Center in Karnes City, Texas. The contract has a term of twoten-year contracts years effective October 1, 2018.
On March 29, 2018, we announced that our transportation joint venture in the United Kingdom, GEO Amey, had signed a contract with Scottish Prison Service for the provision of court custody and prisoner escort services in Scotland. The contract has a base term of eight years effective January 26, 2019 with a renewal option of four years.
With respect to the Parklea Centre in Australia, we were awardedunfortunately unsuccessful during the current competitive rebid process and will transition the management contract in March of 2019. Upon transition, due to GEOthe requirements under a long-standing procurement commonly referredthe labor and employment laws in Australia, we will incur approximately $3 million in certain transition costs related to employee compensation and benefits. These costs have been reserved for as Criminal Alien Requirement (CAR) 16, which was issued byof December 31, 2018.
Effective in April 2018, our contract for the BOP in 2015. Additionally, only onemanagement of the two contracts held by Reeves County, Texas was extended by1,576-bed Allen Correctional Facility in Kinder, Louisiana, terminated. Due to state budgetary reductions, GEO elected to terminate the BOP for one year.contract.
Commitments
The Company currently has contractual commitments for a number of projects using existing Company financing facilities. The Company’s management estimates that these existing capital projects will cost approximately $251.3$255.3 million, of which $101.9$210.8 million was spent through 2017.2018. The Company estimates the remaining capital requirements related to these capital projects to be approximately $149.4$44.5 million. These projects are expected to be completed through 2019.2020.
In addition to these current estimated capital requirements, the Company is currently in the process of bidding on, or evaluating potential bids for the design, construction and management of a number of new projects. In the event that the Company wins bids for these projects and decides to self-finance their construction, its capital requirements could materially increase.
Litigation, Claims and Assessments
OnAs previously reported and described in our prior periodic reports, including most recently in ourForm 10-Q for the quarter ended June 30, 2018, on February 8, 2017, the Attorney General of the State of Mississippi filed a lawsuit in the Circuit Court for the First Judicial District in Hinds County, Mississippi against the Company, Cornell Companies, Inc., a subsidiary of the Company, Christopher B. Epps, the former Commissioner of the Mississippi Department of Corrections, and Cecil McCrory, a former consultant for the Company. The complaint alleges several statutory and common law claims, including violations of various public servant statutes, racketeering activity, antitrust law, civil conspiracy, unjust enrichment and fraud. The complaint seeks compensatory damages, punitive damages, exemplary damages, forfeiture of all money received by the defendants, restitution, interest, attorneys’ fees, other costs, and such other expenses or damages as the court may deem proper. The complaint claims that between 2007 and 2014, the Company and Cornell Companies, Inc. received approximately $256 million in proceeds from public contracts paid for by the State of Mississippi. The Company intends to take all necessary steps to vigorously defend itself and Cornell Companies, Inc. The Company has not recorded an accrual relating to this matter at this time, as a loss is not considered probable or reasonably estimable at this preliminary stage of the lawsuit.
On October 22, 2014, former civil immigration detainees at the Aurora Immigration Detention Center filed a class action lawsuit on October 22, 2014, against the Company in the United States District Court for the District of Colorado (the “Court”). The complaint alleges that the Company was in violation of the Colorado Minimum Wages of Workers Act and the federal Trafficking Victims Protection Act (“TVPA”). The plaintiff class claims that the Company was unjustly enriched as a resultbecause of the level of payment the detainees received for work performed at the facility, even though the voluntary work program as well as the wage rates and standards associated with the program that are at issue in the case are authorized by the Federal government under guidelines approved by the United States Congress. On July 6, 2015, the Court found that detainees were not employees under the Colorado Minimum Wage Order and dismissed this claim. In February 2017, the Court granted the plaintiff-class’ motion for class certification which the Company appealed to the 10th Circuit Court of Appeals. On February 9, 2018, a three-judge panel of the appellate court affirmed the class-certification order. The Company is seeking a rehearing en banc of the panel decision.certification. The plaintiff class seeks actual damages, compensatory damages, exemplary damages, punitive damages, restitution, attorneys’ fees and costs, and such other relief as the Court may deem proper. SinceIn the time since the Colorado suit was initially filed, three similar lawsuits have been filed — two in Washington and one in California. In Washington, one of the two lawsuits was filed on September 9, 2017 by immigration detainees against the Company in the United StatesU.S. District Court for the Western District of Washington. The second of the two lawsuits was filed on September 20, 2017 by the State Attorney General against the Company in the Superior Court of the State of Washington for Pierce County. On October 9, 2017,County, which the Company removed the lawsuit to the United StatesU.S. District Court for the Western District of Washington.Washington on October 9, 2017. In California, a class-action lawsuit was filed on December 19, 2017 by immigration detainees against the Company in the United StatesU.S. District Court Eastern Division of the Central District of California. All three lawsuits allege violations of the respective state’s minimum wage laws. However, only the California lawsuit, similar tolike the Colorado class-action,suit, also includes claims based on violatingthat the federal TVPA.Company violated the TVPA and California’s equivalent state statute. The Company intends to take all necessary steps to vigorously defend itself and has consistently refuted the allegations and claims in these lawsuits. The Company has not recorded an accrual relating to these matters at this time, as a loss is not considered probable nor reasonably estimable at this stage of the lawsuit.
The nature of the Company’s business exposes it to various types of third-party legal claims or litigation against the Company, including, but not limited to, civil rights claims relating to conditions of confinement and/or mistreatment, sexual misconduct claims brought by prisoners or detainees, medical malpractice claims, product liability claims, intellectual property infringement claims, claims relating to employment matters (including, but not limited to, employment discrimination claims, union grievances and wage and hour claims),
property loss claims, environmental claims, automobile liability claims, indemnification claims by its customers and other third parties, contractual claims and claims for personal injury or other damages resulting from contact with the Company’s facilities, programs, electronic monitoring products, personnel or prisoners, including damages arising from a prisoner’s escape or from a disturbance or riot at a facility. The Company accrues for legal costs associated with loss contingencies when those costs are probable and reasonably estimable. The Company does not expect the outcome of any pending claims or legal proceedings to have a material adverse effect on its financial condition, results of operations or cash flows.
Other Assessment
A statenon-income tax audit completed in 2016 included tax periods for which the state tax authority had a number of years ago processed a substantial tax refund. At the completion of the audit fieldwork, the Company received a notice of audit findings disallowing deductions that were previously claimed by the Company, approved by the state tax authority and served as the basis for the approved refund claim. In early January 2017, the Company received a formal Notice of Assessment of Taxes and Demand for Payment from the taxing authority disallowing the deductions. The total tax, penalty and interest assessed is approximately $19.6 million. The Company has filed an administrative protest and disagrees with the assessment and intends to take all necessary steps to vigorously defend its position. The Company has established a reserve based on its estimate of the most probable loss based on the facts and circumstances known to date and the advice of outside counsel in connection with this matter.
| 18. | Selected Quarterly Financial Data (Unaudited) |
The Company’s selected quarterly financial data is as follows (in thousands, except per share data attributable to GEO):
| First Quarter | Second Quarter | Third Quarter | Fourth Quarter | First Quarter | Second Quarter | Third Quarter | Fourth Quarter | |||||||||||||||||||||||||
2017 | ||||||||||||||||||||||||||||||||
2018 | ||||||||||||||||||||||||||||||||
Revenues | $ | 550,614 | $ | 577,070 | $ | 566,759 | $ | 568,977 | $ | 564,917 | $ | 583,509 | $ | 583,530 | $ | 599,430 | ||||||||||||||||
Operating income ** | 64,372 | 54,553 | 62,902 | 66,458 | ||||||||||||||||||||||||||||
Net Income * ** | 40,366 | 30,942 | 38,453 | 36,263 | ||||||||||||||||||||||||||||
Net Income Attributable to The GEO Group, Inc. * | 40,403 | 30,992 | 38,489 | 36,357 | ||||||||||||||||||||||||||||
Operating income | 64,450 | 66,951 | 69,780 | 63,484 | ||||||||||||||||||||||||||||
Net Income | 34,920 | 37,325 | 39,229 | 33,353 | ||||||||||||||||||||||||||||
Net Income Attributable to The GEO Group, Inc. | 34,987 | 37,421 | 39,289 | 33,392 | ||||||||||||||||||||||||||||
Basic earnings per share: | ||||||||||||||||||||||||||||||||
Net income per share ** | $ | 0.36 | $ | 0.25 | $ | 0.31 | $ | 0.30 | ||||||||||||||||||||||||
Net income per share | $ | 0.29 | $ | 0.31 | $ | 0.33 | $ | 0.28 | ||||||||||||||||||||||||
Diluted earnings per share: | ||||||||||||||||||||||||||||||||
Net income per share ** | $ | 0.35 | $ | 0.25 | $ | 0.31 | $ | 0.30 | $ | 0.29 | $ | 0.31 | $ | 0.33 | $ | 0.28 | ||||||||||||||||
| First Quarter | Second Quarter | Third Quarter | Fourth Quarter | |||||||||||||||||||||||||||||
2016 | ||||||||||||||||||||||||||||||||
Revenues | $ | 510,185 | $ | 548,350 | $ | 554,376 | $ | 566,579 | ||||||||||||||||||||||||
Operating income | 59,167 | 65,957 | 72,452 | 68,008 | ||||||||||||||||||||||||||||
Net Income ** | 32,326 | 23,156 | 43,674 | 49,342 | ||||||||||||||||||||||||||||
Net Income Attributable to The GEO Group, Inc. ** | 32,350 | 23,209 | 43,720 | 49,436 | ||||||||||||||||||||||||||||
Basic earnings per share: | ||||||||||||||||||||||||||||||||
Net income per share ** | $ | 0.29 | $ | 0.21 | $ | 0.39 | $ | 0.44 | ||||||||||||||||||||||||
Diluted earnings per share: | ||||||||||||||||||||||||||||||||
Net income per share ** | $ | 0.29 | $ | 0.21 | $ | 0.39 | $ | 0.44 | ||||||||||||||||||||||||
| First Quarter | Second Quarter | Third Quarter | Fourth Quarter | |||||||||||||
2017 | ||||||||||||||||
Revenues | $ | 550,614 | $ | 577,070 | $ | 566,759 | $ | 568,977 | ||||||||
Operating income | 64,372 | 54,553 | 62,902 | 66,458 | ||||||||||||
Net Income * | 40,366 | 30,942 | 38,453 | 36,263 | ||||||||||||
Net Income Attributable to The GEO Group, Inc. | 40,403 | 30,992 | 38,489 | 36,357 | ||||||||||||
Basic earnings per share: | ||||||||||||||||
Net income per share * | $ | 0.36 | $ | 0.25 | $ | 0.31 | $ | 0.30 | ||||||||
Diluted earnings per share: | ||||||||||||||||
Net income per share * | $ | 0.35 | $ | 0.25 | $ | 0.31 | $ | 0.30 | ||||||||
| * | Second quarter 2017 net income includes nonrecurring merger and acquisition costs related to the Company’s acquisition of CEC. The acquisition also led to an increase in revenue for Second Quarter through Fourth Quarter 2017. Refer to Note 2 — Business Combinations. |
| ** | Earnings per share table contains slight summation differences due to |
| 19. | Condensed Consolidating Financial Information |
The following condensed consolidating financial information, which has been prepared in accordance with the requirements for presentation ofRule 3-10(d) ofRegulation S-X promulgated under the Securities Act, presents the condensed consolidating financial information separately for:
(i) The GEO Group, Inc., as the issuer of the 6.00% Senior Notes due, 5.875% Senior Notes due 2022, 5.875% Senior Notes due 224, 5.125% Senior Notes and 6.625% Senior Notes (collectively, the “Notes”);
(ii) The Subsidiary Guarantors, on a combined basis, which are 100% owned by The Geo Group, Inc., and which are guarantors of the Notes;
(iii) The Company’s other subsidiaries, on a combined basis, which are not guarantors of the Notes (the “SubsidiaryNon-Guarantors”);
(iv) Consolidating entries and eliminations representing adjustments to: (a) eliminate intercompany transactions between or among the Company, the Subsidiary Guarantors and the SubsidiaryNon-Guarantors and (b) eliminate the investments in the Company’s subsidiaries; and
(v) The Company and its subsidiaries on a consolidated basis.
Refer to Note 13 — Debt for a description of the notes that are fully and unconditionally guaranteed on a joint and several senior unsecured basis by the Company and certain of its wholly-owned domestic subsidiaries.
CONDENSED CONSOLIDATING STATEMENT OF COMPREHENSIVE INCOME
(in thousands)
| For the Year Ended December 31, 2017 | ||||||||||||||||||||
| The GEO Group, Inc. | Combined Subsidiary Guarantors | Combined Non-Guarantor Subsidiaries | Eliminations | Consolidated | ||||||||||||||||
Revenues | $ | 711,013 | $ | 1,810,262 | $ | 321,612 | $ | (579,467 | ) | $ | 2,263,420 | |||||||||
Operating expenses | 568,061 | 1,441,884 | 270,017 | (579,467 | ) | 1,700,495 | ||||||||||||||
Depreciation and amortization | 24,580 | 96,051 | 3,666 | — | 124,297 | |||||||||||||||
General and administrative expenses | 59,194 | 104,373 | 26,776 | — | 190,343 | |||||||||||||||
|
|
|
|
|
|
|
|
|
| |||||||||||
Operating income | 59,178 | 167,954 | 21,153 | — | 248,285 | |||||||||||||||
Interest income | 16,200 | 4,294 | 52,069 | (20,887 | ) | 51,676 | ||||||||||||||
Interest expense | (69,969 | ) | (55,080 | ) | (43,862 | ) | 20,887 | (148,024 | ) | |||||||||||
Income before income taxes and equity in earnings of affiliates | 5,409 | 117,168 | 29,360 | — | 151,937 | |||||||||||||||
Provision for income taxes | 1,103 | 9,608 | 7,247 | — | 17,958 | |||||||||||||||
Equity in earnings of affiliates, net of income tax benefit | — | — | 12,045 | — | 12,045 | |||||||||||||||
|
|
|
|
|
|
|
|
|
| |||||||||||
Income from operations before equity in income of consolidated subsidiaries | 4,306 | 107,560 | 34,158 | — | 146,024 | |||||||||||||||
Income from consolidated subsidiaries, net of income tax provision | 141,718 | — | — | (141,718 | ) | — | ||||||||||||||
|
|
|
|
|
|
|
|
|
| |||||||||||
Net income | 146,024 | 107,560 | 34,158 | (141,718 | ) | 146,024 | ||||||||||||||
Loss attributable to noncontrolling interests | — | — | 217 | $ | — | 217 | ||||||||||||||
|
|
|
|
|
|
|
|
|
| |||||||||||
Net income attributable to The GEO Group, Inc. | $ | 146,024 | $ | 107,560 | $ | 34,375 | $ | (141,718 | ) | $ | 146,241 | |||||||||
|
|
|
|
|
|
|
|
|
| |||||||||||
Net income | $ | 146,024 | $ | 107,560 | $ | 34,158 | $ | (141,718 | ) | $ | 146,024 | |||||||||
Other comprehensive income (loss), net of tax | — | (1,420 | ) | 7,793 | — | 6,373 | ||||||||||||||
|
|
|
|
|
|
|
|
|
| |||||||||||
Total comprehensive income | $ | 146,024 | $ | 106,140 | $ | 41,951 | $ | (141,718 | ) | $ | 152,397 | |||||||||
Comprehensive loss attributable to noncontrolling interests | — | — | 211 | — | 211 | |||||||||||||||
|
|
|
|
|
|
|
|
|
| |||||||||||
Comprehensive income attributable to The GEO Group, Inc. | $ | 146,024 | $ | 106,140 | $ | 42,162 | $ | (141,718 | ) | $ | 152,608 | |||||||||
|
|
|
|
|
|
|
|
|
| |||||||||||
| For the Year Ended December 31, 2018 | ||||||||||||||||||||
| The GEO Group, Inc. | Combined Subsidiary Guarantors | Combined Non-Guarantor Subsidiaries | Eliminations | Consolidated | ||||||||||||||||
Revenues | $ | 827,473 | $ | 1,905,243 | $ | 268,723 | $ | (670,053 | ) | $ | 2,331,386 | |||||||||
Operating expenses | 664,354 | 1,539,343 | 222,128 | (670,053 | ) | 1,755,772 | ||||||||||||||
Depreciation and amortization | 27,036 | 95,504 | 3,894 | — | 126,434 | |||||||||||||||
General and administrative expenses | 64,852 | 98,601 | 21,062 | — | 184,515 | |||||||||||||||
|
|
|
|
|
|
|
|
|
| |||||||||||
Operating income | 71,231 | 171,795 | 21,639 | — | 264,665 | |||||||||||||||
Interest income | 14,702 | 5,494 | 35,501 | (20,942 | ) | 34,755 | ||||||||||||||
Interest expense | (81,456 | ) | (56,194 | ) | (33,395 | ) | 20,942 | (150,103 | ) | |||||||||||
Income before income taxes and equity in earnings of affiliates | 4,477 | 121,095 | 23,745 | — | 149,317 | |||||||||||||||
Provision for income taxes | 972 | 7,424 | 5,721 | — | 14,117 | |||||||||||||||
Equity in earnings of affiliates, net of income tax provision | — | — | 9,627 | — | 9,627 | |||||||||||||||
|
|
|
|
|
|
|
|
|
| |||||||||||
Income from operations before equity in income of consolidated subsidiaries | 3,505 | 113,671 | 27,651 | — | 144,827 | |||||||||||||||
Income from consolidated subsidiaries, net of income tax provision | 141,322 | — | — | (141,322 | ) | — | ||||||||||||||
|
|
|
|
|
|
|
|
|
| |||||||||||
Net income | 144,827 | 113,671 | 27,651 | (141,322 | ) | 144,827 | ||||||||||||||
Loss attributable to noncontrolling interests | — | — | 262 | — | 262 | |||||||||||||||
|
|
|
|
|
|
|
|
|
| |||||||||||
Net income attributable to The GEO Group, Inc. | $ | 144,827 | $ | 113,671 | $ | 27,913 | $ | (141,322 | ) | $ | 145,089 | |||||||||
|
|
|
|
|
|
|
|
|
| |||||||||||
Net income | $ | 144,827 | $ | 113,671 | $ | 27,651 | $ | (141,322 | ) | $ | 144,827 | |||||||||
Other comprehensive income (loss), net of tax | — | 1,785 | (972 | ) | — | 813 | ||||||||||||||
|
|
|
|
|
|
|
|
|
| |||||||||||
Total comprehensive income | $ | 144,827 | $ | 115,456 | $ | 26,679 | $ | (141,322 | ) | $ | 145,640 | |||||||||
Comprehensive loss attributable to noncontrolling interests | — | — | 277 | — | 277 | |||||||||||||||
|
|
|
|
|
|
|
|
|
| |||||||||||
Comprehensive income attributable to The GEO Group, Inc. | $ | 144,827 | $ | 115,456 | $ | 26,956 | $ | (141,322 | ) | $ | 145,917 | |||||||||
|
|
|
|
|
|
|
|
|
| |||||||||||
CONDENSED CONSOLIDATING STATEMENTS OF COMPREHENSIVE INCOME
(in thousands)
| For the Year Ended December 31, 2016 | ||||||||||||||||||||
| The GEO Group, Inc. | Combined Subsidiary Guarantors | Combined Non-Guarantor Subsidiaries | Eliminations | Consolidated | ||||||||||||||||
Revenues | $ | 697,292 | $ | 1,626,690 | $ | 420,019 | $ | (564,511 | ) | $ | 2,179,490 | |||||||||
Operating expenses | 560,694 | 1,283,447 | 370,651 | (564,511 | ) | 1,650,281 | ||||||||||||||
Depreciation and amortization | 25,224 | 85,852 | 3,840 | — | 114,916 | |||||||||||||||
General and administrative expenses | 47,354 | 72,831 | 28,524 | — | 148,709 | |||||||||||||||
|
|
|
|
|
|
|
|
|
| |||||||||||
Operating income | 64,020 | 184,560 | 17,004 | — | 265,584 | |||||||||||||||
Interest income | 20,409 | 1,842 | 28,944 | (22,699 | ) | 28,496 | ||||||||||||||
Interest expense | (65,018 | ) | (55,295 | ) | (31,104 | ) | 22,699 | (128,718 | ) | |||||||||||
Loss on extinguishment of debt | (15,885 | ) | — | — | — | (15,885 | ) | |||||||||||||
|
|
|
|
|
|
|
|
|
| |||||||||||
Income before income taxes and equity in earnings of affiliates | 3,526 | 131,107 | 14,844 | — | 149,477 | |||||||||||||||
Provision for income taxes | 1,124 | 2,108 | 4,672 | — | 7,904 | |||||||||||||||
Equity in earnings of affiliates, net of income tax provision | — | — | 6,925 | — | 6,925 | |||||||||||||||
|
|
|
|
|
|
|
|
|
| |||||||||||
Income from operations before equity in income of consolidated subsidiaries | 2,402 | 128,999 | 17,097 | — | 148,498 | |||||||||||||||
Income from consolidated subsidiaries, net of income tax provision | 146,096 | — | — | (146,096 | ) | — | ||||||||||||||
|
|
|
|
|
|
|
|
|
| |||||||||||
Net income | 148,498 | 128,999 | 17,097 | (146,096 | ) | 148,498 | ||||||||||||||
Loss attributable to noncontrolling interests | $ | — | $ | — | $ | 217 | $ | — | $ | 217 | ||||||||||
|
|
|
|
|
|
|
|
|
| |||||||||||
Net income attributable to The GEO Group, Inc. | $ | 148,498 | $ | 128,999 | $ | 17,314 | $ | (146,096 | ) | $ | 148,715 | |||||||||
|
|
|
|
|
|
|
|
|
| |||||||||||
Net income | $ | 148,498 | $ | 128,999 | $ | 17,097 | $ | (146,096 | ) | $ | 148,498 | |||||||||
Other comprehensive income (loss), net of tax | — | (704 | ) | 2,302 | — | 1,598 | ||||||||||||||
|
|
|
|
|
|
|
|
|
| |||||||||||
Total comprehensive income | $ | 148,498 | $ | 128,295 | $ | 19,399 | $ | (146,096 | ) | $ | 150,096 | |||||||||
Comprehensive loss attributable to noncontrolling interests | — | — | 198 | — | 198 | |||||||||||||||
|
|
|
|
|
|
|
|
|
| |||||||||||
Comprehensive income attributable to The GEO Group, Inc. | $ | 148,498 | $ | 128,295 | $ | 19,597 | $ | (146,096 | ) | $ | 150,294 | |||||||||
|
|
|
|
|
|
|
|
|
| |||||||||||
| For the Year Ended December 31, 2017 | ||||||||||||||||||||
| The GEO Group, Inc. | Combined Subsidiary Guarantors | Combined Non-Guarantor Subsidiaries | Eliminations | Consolidated | ||||||||||||||||
Revenues | $ | 711,013 | $ | 1,810,262 | $ | 321,612 | $ | (579,467 | ) | $ | 2,263,420 | |||||||||
Operating expenses | 568,061 | 1,441,884 | 270,017 | (579,467 | ) | 1,700,495 | ||||||||||||||
Depreciation and amortization | 24,580 | 96,051 | 3,666 | — | 124,297 | |||||||||||||||
General and administrative expenses | 59,194 | 104,373 | 26,776 | — | 190,343 | |||||||||||||||
|
|
|
|
|
|
|
|
|
| |||||||||||
Operating income | 59,178 | 167,954 | 21,153 | — | 248,285 | |||||||||||||||
Interest income | 16,200 | 4,294 | 52,069 | (20,887 | ) | 51,676 | ||||||||||||||
Interest expense | (69,969 | ) | (55,080 | ) | (43,862 | ) | 20,887 | (148,024 | ) | |||||||||||
|
|
|
|
|
|
|
|
|
| |||||||||||
Income before income taxes and equity in earnings of affiliates | 5,409 | 117,168 | 29,360 | — | 151,937 | |||||||||||||||
Provision for income taxes | 1,103 | 9,608 | 7,247 | — | 17,958 | |||||||||||||||
Equity in earnings of affiliates, net of income tax benefit | — | — | 12,045 | — | 12,045 | |||||||||||||||
|
|
|
|
|
|
|
|
|
| |||||||||||
Income from operations before equity in income of consolidated subsidiaries | 4,306 | 107,560 | 34,158 | — | 146,024 | |||||||||||||||
Income from consolidated subsidiaries, net of income tax provision | 141,718 | — | — | (141,718 | ) | — | ||||||||||||||
|
|
|
|
|
|
|
|
|
| |||||||||||
Net income | 146,024 | 107,560 | 34,158 | (141,718 | ) | 146,024 | ||||||||||||||
Loss attributable to noncontrolling interests | $ | — | $ | — | $ | 217 | $ | — | $ | 217 | ||||||||||
|
|
|
|
|
|
|
|
|
| |||||||||||
Net income attributable to The GEO Group, Inc. | $ | 146,024 | $ | 107,560 | $ | 34,375 | $ | (141,718 | ) | $ | 146,241 | |||||||||
|
|
|
|
|
|
|
|
|
| |||||||||||
Net income | $ | 146,024 | $ | 107,560 | $ | 34,158 | $ | (141,718 | ) | $ | 146,024 | |||||||||
Other comprehensive income (loss), net of tax | — | (1,420 | ) | 7,793 | — | 6,373 | ||||||||||||||
|
|
|
|
|
|
|
|
|
| |||||||||||
Total comprehensive income | $ | 146,024 | $ | 106,140 | $ | 41,951 | $ | (141,718 | ) | $ | 152,397 | |||||||||
Comprehensive loss attributable to noncontrolling interests | — | — | 211 | — | 211 | |||||||||||||||
|
|
|
|
|
|
|
|
|
| |||||||||||
Comprehensive income attributable to The GEO Group, Inc. | $ | 146,024 | $ | 106,140 | $ | 42,162 | $ | (141,718 | ) | $ | 152,608 | |||||||||
|
|
|
|
|
|
|
|
|
| |||||||||||
CONDENSED CONSOLIDATING STATEMENTS OF COMPREHENSIVE INCOME
(in thousands)
| For the Year ended December 31, 2015 | ||||||||||||||||||||
| The GEO Group, Inc. | Combined Subsidiary Guarantors | Combined Non-Guarantor Subsidiaries | Eliminations | Consolidated | ||||||||||||||||
Revenues | $ | 664,741 | $ | 1,462,540 | $ | 272,204 | $ | (556,178 | ) | $ | 1,843,307 | |||||||||
Operating expenses | 546,100 | 1,143,679 | 230,181 | (556,178 | ) | 1,363,782 | ||||||||||||||
Depreciation and amortization | 24,711 | 77,582 | 4,463 | — | 106,756 | |||||||||||||||
General and administrative expenses | 47,553 | 70,015 | 19,472 | — | 137,040 | |||||||||||||||
|
|
|
|
|
|
|
|
|
| |||||||||||
Operating income | 46,377 | 171,264 | 18,088 | — | 235,729 | |||||||||||||||
Interest income | 23,771 | 3,059 | 11,329 | (26,581 | ) | 11,578 | ||||||||||||||
Interest expense | (61,293 | ) | (57,431 | ) | (13,993 | ) | 26,581 | (106,136 | ) | |||||||||||
Income before income taxes and equity in earnings of affiliates | 8,855 | 116,892 | 15,424 | — | 141,171 | |||||||||||||||
Provision for income taxes | 1,083 | 1,797 | 4,509 | — | 7,389 | |||||||||||||||
Equity in earnings of affiliates, net of income tax provision | — | — | 5,533 | — | 5,533 | |||||||||||||||
|
|
|
|
|
|
|
|
|
| |||||||||||
Income from operations before equity in income of consolidated subsidiaries | 7,772 | 115,095 | 16,448 | — | 139,315 | |||||||||||||||
Income from consolidated subsidiaries, net of income tax provision | 131,543 | — | — | (131,543 | ) | — | ||||||||||||||
|
|
|
|
|
|
|
|
|
| |||||||||||
Net income | 139,315 | 115,095 | 16,448 | (131,543 | ) | 139,315 | ||||||||||||||
Loss attributable to noncontrolling interests | $ | — | $ | — | $ | 123 | $ | — | $ | 123 | ||||||||||
|
|
|
|
|
|
|
|
|
| |||||||||||
Net income attributable to The GEO Group, Inc. | $ | 139,315 | $ | 115,095 | $ | 16,571 | $ | (131,543 | ) | $ | 139,438 | |||||||||
|
|
|
|
|
|
|
|
|
| |||||||||||
Net income | $ | 139,315 | $ | 115,095 | $ | 16,448 | $ | (131,543 | ) | $ | 139,315 | |||||||||
Other comprehensive income (loss), net of tax | — | 1,276 | (6,311 | ) | — | (5,035 | ) | |||||||||||||
|
|
|
|
|
|
|
|
|
| |||||||||||
Total comprehensive income | $ | 139,315 | $ | 116,371 | $ | 10,137 | $ | (131,543 | ) | $ | 134,280 | |||||||||
Comprehensive loss attributable to noncontrolling interests | — | — | 215 | — | 215 | |||||||||||||||
|
|
|
|
|
|
|
|
|
| |||||||||||
Comprehensive income attributable to The GEO Group, Inc. | $ | 139,315 | $ | 116,371 | $ | 10,352 | $ | (131,543 | ) | $ | 134,495 | |||||||||
|
|
|
|
|
|
|
|
|
| |||||||||||
| For the Year ended December 31, 2016 | ||||||||||||||||||||
| The GEO Group, Inc. | Combined Subsidiary Guarantors | Combined Non-Guarantor Subsidiaries | Eliminations | Consolidated | ||||||||||||||||
Revenues | $ | 697,292 | $ | 1,626,690 | $ | 420,019 | $ | (564,511 | ) | $ | 2,179,490 | |||||||||
Operating expenses | 560,694 | 1,283,447 | 370,651 | (564,511 | ) | 1,650,281 | ||||||||||||||
Depreciation and amortization | 25,224 | 85,852 | 3,840 | — | 114,916 | |||||||||||||||
General and administrative expenses | 47,354 | 72,831 | 28,524 | — | 148,709 | |||||||||||||||
|
|
|
|
|
|
|
|
|
| |||||||||||
Operating income | 64,020 | 184,560 | 17,004 | — | 265,584 | |||||||||||||||
Interest income | 20,409 | 1,842 | 28,944 | (22,699 | ) | 28,496 | ||||||||||||||
Interest expense | (65,018 | ) | (55,295 | ) | (31,104 | ) | 22,699 | (128,718 | ) | |||||||||||
Loss on early extinguishment of debt | (15,885 | ) | — | — | — | (15,885 | ) | |||||||||||||
|
|
|
|
|
|
|
|
|
| |||||||||||
Income before income taxes and equity in earnings of affiliates | 3,526 | 131,107 | 14,844 | — | 149,477 | |||||||||||||||
Provision for income taxes | 1,124 | 2,108 | 4,672 | — | 7,904 | |||||||||||||||
Equity in earnings of affiliates, net of income tax provision | — | — | 6,925 | — | 6,925 | |||||||||||||||
|
|
|
|
|
|
|
|
|
| |||||||||||
Income from operations before equity in income of consolidated subsidiaries | 2,402 | 128,999 | 17,097 | — | 148,498 | |||||||||||||||
Income from consolidated subsidiaries, net of income tax provision | 146,096 | — | — | (146,096 | ) | — | ||||||||||||||
|
|
|
|
|
|
|
|
|
| |||||||||||
Net income | 148,498 | 128,999 | 17,097 | (146,096 | ) | 148,498 | ||||||||||||||
Loss attributable to noncontrolling interests | $ | — | $ | — | $ | 217 | $ | — | $ | 217 | ||||||||||
|
|
|
|
|
|
|
|
|
| |||||||||||
Net income attributable to The GEO Group, Inc. | $ | 148,498 | $ | 128,999 | $ | 17,314 | $ | (146,096 | ) | $ | 148,715 | |||||||||
|
|
|
|
|
|
|
|
|
| |||||||||||
Net income | $ | 148,498 | $ | 128,999 | $ | 17,097 | $ | (146,096 | ) | $ | 148,498 | |||||||||
Other comprehensive income (loss), net of tax | — | (704 | ) | 2,302 | — | 1,598 | ||||||||||||||
|
|
|
|
|
|
|
|
|
| |||||||||||
Total comprehensive income | $ | 148,498 | $ | 128,295 | $ | 19,399 | $ | (146,096 | ) | $ | 150,096 | |||||||||
Comprehensive loss attributable to noncontrolling interests | — | — | 198 | — | 198 | |||||||||||||||
|
|
|
|
|
|
|
|
|
| |||||||||||
Comprehensive income attributable to The GEO Group, Inc. | $ | 148,498 | $ | 128,295 | $ | 19,597 | $ | (146,096 | ) | $ | 150,294 | |||||||||
|
|
|
|
|
|
|
|
|
| |||||||||||
CONDENSED CONSOLIDATING BALANCE SHEET
(in thousands)
| As of December 31, 2017 | ||||||||||||||||||||
| The GEO Group, Inc. | Combined Subsidiary Guarantors | Combined Non-Guarantor Subsidiaries | Eliminations | Consolidated | ||||||||||||||||
| (Dollars in thousands) | ||||||||||||||||||||
| ASSETS | ||||||||||||||||||||
Cash and cash equivalents | $ | 54,666 | $ | — | $ | 26,711 | $ | — | $ | 81,377 | ||||||||||
Restricted cash and investments | — | — | 44,932 | — | 44,932 | |||||||||||||||
Accounts receivable, less allowance for doubtful accounts | 130,354 | 225,029 | 34,533 | — | 389,916 | |||||||||||||||
Contract receivable, current portion | — | — | 18,142 | — | 18,142 | |||||||||||||||
Prepaid expenses and other current assets | 2,589 | 24,163 | 18,590 | — | 45,342 | |||||||||||||||
|
|
|
|
|
|
|
|
|
| |||||||||||
Total current assets | 187,609 | 249,192 | 142,908 | — | 579,709 | |||||||||||||||
|
|
|
|
|
|
|
|
|
| |||||||||||
Restricted Cash and Investments | — | 25,715 | 2,284 | — | 27,999 | |||||||||||||||
Property and Equipment, Net | 777,404 | 1,209,816 | 90,903 | — | 2,078,123 | |||||||||||||||
Assets Held for Sale | — | 3,915 | — | — | 3,915 | |||||||||||||||
Non-Current Contract Receivable | — | — | 404,309 | — | 404,309 | |||||||||||||||
Intercompany Receivable | 1,130,189 | 88,534 | 28,218 | (1,246,941 | ) | — | ||||||||||||||
Non-Current Deferred Income Tax Assets | 863 | 23,913 | 1,501 | — | 26,277 | |||||||||||||||
Goodwill | — | 778,504 | 447 | — | 778,951 | |||||||||||||||
Intangible Assets, Net | — | 254,531 | 808 | — | 255,339 | |||||||||||||||
Investment in Subsidiaries | 1,336,665 | 456,076 | 2,190 | (1,794,931 | ) | — | ||||||||||||||
OtherNon-Current Assets | 11,141 | 115,330 | 25,210 | (79,395 | ) | 72,286 | ||||||||||||||
|
|
|
|
|
|
|
|
|
| |||||||||||
Total Assets | $ | 3,443,871 | $ | 3,205,526 | $ | 698,778 | $ | (3,121,267 | ) | $ | 4,226,908 | |||||||||
|
|
|
|
|
|
|
|
|
| |||||||||||
| LIABILITIES AND SHAREHOLDERS’ EQUITY | ||||||||||||||||||||
Accounts payable | $ | 20,643 | $ | 65,475 | $ | 6,469 | $ | — | $ | 92,587 | ||||||||||
Accrued payroll and related taxes | — | 51,780 | 19,952 | — | 71,732 | |||||||||||||||
Accrued expenses and other current liabilities | 40,344 | 115,636 | 20,344 | — | 176,324 | |||||||||||||||
Current portion of capital lease obligations, long-term debt andnon-recourse debt | 8,000 | 1,870 | 19,050 | — | 28,920 | |||||||||||||||
|
|
|
|
|
|
|
|
|
| |||||||||||
Total current liabilities | 68,987 | 234,761 | 65,815 | — | 369,563 | |||||||||||||||
|
|
|
|
|
|
|
|
|
| |||||||||||
Non-Current Deferred Income Tax Liabilities | — | — | 8,757 | — | 8,757 | |||||||||||||||
Intercompany Payable | 79,984 | 1,129,590 | 37,367 | (1,246,941 | ) | — | ||||||||||||||
OtherNon-Current Liabilities | 4,674 | 157,200 | 14,223 | (79,395 | ) | 96,702 | ||||||||||||||
Capital Lease Obligations | — | 6,059 | — | — | 6,059 | |||||||||||||||
Long-Term Debt | 2,090,985 | — | 90,559 | — | 2,181,544 | |||||||||||||||
Non-Recourse Debt | — | — | 365,364 | — | 365,364 | |||||||||||||||
Commitments & Contingencies | ||||||||||||||||||||
Shareholders’ Equity: | ||||||||||||||||||||
Total shareholders’ equity attributable to The GEO Group, Inc. | 1,199,241 | 1,677,916 | 117,015 | (1,794,931 | ) | 1,199,241 | ||||||||||||||
Noncontrolling Interests | — | — | (322 | ) | — | (322 | ) | |||||||||||||
|
|
|
|
|
|
|
|
|
| |||||||||||
Total Shareholders’ Equity | 1,199,241 | 1,677,916 | 116,693 | (1,794,931 | ) | 1,198,919 | ||||||||||||||
|
|
|
|
|
|
|
|
|
| |||||||||||
Total Liabilities and Shareholders’ Equity | $ | 3,443,871 | $ | 3,205,526 | $ | 698,778 | $ | (3,121,267 | ) | $ | 4,226,908 | |||||||||
|
|
|
|
|
|
|
|
|
| |||||||||||
| As of December 31, 2018 | ||||||||||||||||||||
| The GEO Group, Inc. | Combined Subsidiary Guarantors | Combined Non-Guarantor Subsidiaries | Eliminations | Consolidated | ||||||||||||||||
| ASSETS |
| |||||||||||||||||||
Cash and cash equivalents | $ | 4,468 | $ | 7,873 | $ | 18,914 | $ | — | $ | 31,255 | ||||||||||
Restricted cash and investments | 2,854 | — | 48,824 | — | 51,678 | |||||||||||||||
Accounts receivable, less allowance for doubtful accounts | 190,594 | 221,957 | 44,377 | (11,402 | ) | 445,526 | ||||||||||||||
Contract receivable, current portion | — | — | 15,535 | — | 15,535 | |||||||||||||||
Prepaid expenses and other current assets | 2,011 | 39,827 | 7,114 | (1,839 | ) | 47,113 | ||||||||||||||
|
|
|
|
|
|
|
|
|
| |||||||||||
Total current assets | 199,927 | 269,657 | 134,764 | (13,241 | ) | 591,107 | ||||||||||||||
|
|
|
|
|
|
|
|
|
| |||||||||||
Restricted Cash and Investments | — | 21,009 | 1,422 | — | 22,431 | |||||||||||||||
Property and Equipment, Net | 845,291 | 1,227,223 | 86,096 | — | 2,158,610 | |||||||||||||||
Contract Receivable | — | — | 368,178 | — | 368,178 | |||||||||||||||
Assets Held for Sale | 705 | 1,929 | — | — | 2,634 | |||||||||||||||
Intercompany Receivable | 990,365 | 150,710 | 22,407 | (1,163,482 | ) | — | ||||||||||||||
Deferred Income Tax Assets | 798 | 27,928 | 1,198 | — | 29,924 | |||||||||||||||
Goodwill | — | 775,955 | 404 | — | 776,359 | |||||||||||||||
Intangible Assets, Net | — | 231,787 | 573 | — | 232,360 | |||||||||||||||
Investment in Subsidiaries | 1,503,841 | 458,229 | 2,190 | (1,964,260 | ) | — | ||||||||||||||
OtherNon-Current Assets | 9,541 | 115,695 | 19,334 | (78,710 | ) | 65,860 | ||||||||||||||
|
|
|
|
|
|
|
|
|
| |||||||||||
Total Assets | $ | 3,550,468 | $ | 3,280,122 | $ | 636,566 | $ | (3,219,693 | ) | $ | 4,247,463 | |||||||||
|
|
|
|
|
|
|
|
|
| |||||||||||
| LIABILITIES AND SHAREHOLDERS’ EQUITY |
| |||||||||||||||||||
Accounts payable | $ | 13,566 | $ | 72,128 | $ | 7,338 | $ | — | $ | 93,032 | ||||||||||
Accrued payroll and related taxes | — | 56,543 | 19,466 | — | 76,009 | |||||||||||||||
Accrued expenses and other current liabilities | 23,565 | 157,576 | 25,615 | (13,241 | ) | 193,515 | ||||||||||||||
Current portion of capital lease obligations, long-term debt andnon-recourse debt | 8,000 | 2,017 | 322,010 | — | 332,027 | |||||||||||||||
|
|
|
|
|
|
|
|
|
| |||||||||||
Total current liabilities | 45,131 | 288,264 | 374,429 | (13,241 | ) | 694,583 | ||||||||||||||
|
|
|
|
|
|
|
|
|
| |||||||||||
Deferred Income Tax Liabilities | — | — | 13,681 | — | 13,681 | |||||||||||||||
Intercompany Payable | 142,055 | 989,856 | 31,571 | (1,163,482 | ) | — | ||||||||||||||
OtherNon-Current Liabilities | 1,395 | 152,815 | 6,981 | (78,710 | ) | 82,481 | ||||||||||||||
Capital Lease Obligations | — | 4,570 | — | — | 4,570 | |||||||||||||||
Long-Term Debt | 2,321,384 | — | 75,843 | — | 2,397,227 | |||||||||||||||
Non-Recourse Debt | — | — | 15,017 | — | 15,017 | |||||||||||||||
Commitments & Contingencies | ||||||||||||||||||||
Shareholders’ Equity: | ||||||||||||||||||||
Total shareholders’ equity attributable to The GEO Group, Inc. | 1,040,503 | 1,844,617 | 119,643 | (1,964,260 | ) | 1,040,503 | ||||||||||||||
Noncontrolling Interests | — | — | (599 | ) | — | (599 | ) | |||||||||||||
|
|
|
|
|
|
|
|
|
| |||||||||||
Total Shareholders’ Equity | 1,040,503 | 1,844,617 | 119,044 | (1,964,260 | ) | 1,039,904 | ||||||||||||||
|
|
|
|
|
|
|
|
|
| |||||||||||
Total Liabilities and Shareholders’ Equity | $ | 3,550,468 | $ | 3,280,122 | $ | 636,566 | $ | (3,219,693 | ) | $ | 4,247,463 | |||||||||
|
|
|
|
|
|
|
|
|
| |||||||||||
CONDENSED CONSOLIDATING BALANCE SHEET
(in thousands)
| As of December 31, 2016 | ||||||||||||||||||||
| The GEO Group, Inc. | Combined Subsidiary Guarantors | Combined Non-Guarantor Subsidiaries | Eliminations | Consolidated | ||||||||||||||||
| (Dollars in thousands) | ||||||||||||||||||||
| ASSETS | ||||||||||||||||||||
Cash and cash equivalents | $ | 45,566 | $ | 842 | $ | 21,630 | $ | — | $ | 68,038 | ||||||||||
Restricted cash and investments | — | — | 17,133 | — | 17,133 | |||||||||||||||
Accounts receivable, less allowance for doubtful accounts | 139,571 | 200,239 | 16,445 | — | 356,255 | |||||||||||||||
Contract receivable, current portion | — | — | 224,033 | — | 224,033 | |||||||||||||||
Prepaid expenses and other current assets | 677 | 24,096 | 7,437 | — | 32,210 | |||||||||||||||
|
|
|
|
|
|
|
|
|
| |||||||||||
Total current assets | 185,814 | 225,177 | 286,678 | — | 697,669 | |||||||||||||||
|
|
|
|
|
|
|
|
|
| |||||||||||
Restricted Cash and Investments | 170 | 19,742 | 936 | — | 20,848 | |||||||||||||||
Property and Equipment, Net | 735,104 | 1,078,220 | 83,917 | — | 1,897,241 | |||||||||||||||
Contract Receivable | — | — | 219,783 | — | 219,783 | |||||||||||||||
Intercompany Receivable | 918,527 | 141,987 | 27,290 | (1,087,804 | ) | — | ||||||||||||||
Non-Current Deferred Income Tax Assets | 764 | 17,918 | 11,357 | — | 30,039 | |||||||||||||||
Goodwill | 79 | 614,941 | 413 | — | 615,433 | |||||||||||||||
Intangible Assets, Net | — | 203,138 | 746 | — | 203,884 | |||||||||||||||
Investment in Subsidiaries | 1,238,772 | 453,635 | 2,190 | (1,694,597 | ) | — | ||||||||||||||
OtherNon-Current Assets | 15,011 | 108,434 | 20,933 | (79,866 | ) | 64,512 | ||||||||||||||
|
|
|
|
|
|
|
|
|
| |||||||||||
Total Assets | $ | 3,094,241 | $ | 2,863,192 | $ | 654,243 | $ | (2,862,267 | ) | $ | 3,749,409 | |||||||||
|
|
|
|
|
|
|
|
|
| |||||||||||
| LIABILITIES AND SHAREHOLDERS’ EQUITY | ||||||||||||||||||||
Accounts payable | $ | 8,402 | $ | 50,200 | $ | 21,035 | $ | — | $ | 79,637 | ||||||||||
Accrued payroll and related taxes | — | 41,230 | 14,030 | — | 55,260 | |||||||||||||||
Accrued expenses and other current liabilities | 36,792 | 83,906 | 10,398 | — | 131,096 | |||||||||||||||
Current portion of capital lease obligations, long-term debt andnon-recourse debt | 3,000 | 1,700 | 233,365 | — | 238,065 | |||||||||||||||
|
|
|
|
|
|
|
|
|
| |||||||||||
Total current liabilities | 48,194 | 177,036 | 278,828 | — | 504,058 | |||||||||||||||
|
|
|
|
|
|
|
|
|
| |||||||||||
Non-Current Deferred Income Tax Liabilities | — | — | — | — | — | |||||||||||||||
Intercompany Payable | 133,039 | 920,825 | 33,940 | (1,087,804 | ) | — | ||||||||||||||
OtherNon-Current Liabilities | 2,487 | 144,383 | 21,652 | (79,866 | ) | 88,656 | ||||||||||||||
Capital Lease Obligations | — | 7,431 | — | — | 7,431 | |||||||||||||||
Long-Term Debt | 1,935,465 | — | — | — | 1,935,465 | |||||||||||||||
Non-Recourse Debt | — | — | 238,842 | — | 238,842 | |||||||||||||||
Commitments & Contingencies | ||||||||||||||||||||
Shareholders’ Equity: | ||||||||||||||||||||
Total shareholders’ equity attributable to The GEO Group, Inc. | 975,056 | 1,613,517 | 81,080 | (1,694,597 | ) | 975,056 | ||||||||||||||
Noncontrolling Interests | — | — | (99 | ) | — | (99 | ) | |||||||||||||
|
|
|
|
|
|
|
|
|
| |||||||||||
Total Shareholders’ Equity | 975,056 | 1,613,517 | 80,981 | (1,694,597 | ) | 974,957 | ||||||||||||||
|
|
|
|
|
|
|
|
|
| |||||||||||
Total Liabilities and Shareholders’ Equity | $ | 3,094,241 | $ | 2,863,192 | $ | 654,243 | $ | (2,862,267 | ) | $ | 3,749,409 | |||||||||
|
|
|
|
|
|
|
|
|
| |||||||||||
| As of December 31, 2017 | ||||||||||||||||||||
| The GEO Group, Inc. | Combined Subsidiary Guarantors | Combined Non-Guarantor Subsidiaries | Eliminations | Consolidated | ||||||||||||||||
| ASSETS |
| |||||||||||||||||||
Cash and cash equivalents | $ | 54,666 | $ | — | $ | 26,711 | $ | — | $ | 81,377 | ||||||||||
Restricted cash and investments | — | — | 44,932 | — | 44,932 | |||||||||||||||
Accounts receivable, less allowance for doubtful accounts | 130,354 | 225,029 | 34,533 | — | 389,916 | |||||||||||||||
Contract receivable, current portion | — | — | 18,142 | — | 18,142 | |||||||||||||||
Prepaid expenses and other current assets | 2,589 | 24,163 | 18,590 | — | 45,342 | |||||||||||||||
|
|
|
|
|
|
|
|
|
| |||||||||||
Total current assets | 187,609 | 249,192 | 142,908 | — | 579,709 | |||||||||||||||
|
|
|
|
|
|
|
|
|
| |||||||||||
Restricted Cash and Investments | — | 25,715 | 2,284 | — | 27,999 | |||||||||||||||
Property and Equipment, Net | 777,404 | 1,209,816 | 90,903 | — | 2,078,123 | |||||||||||||||
Contract Receivable | — | — | 404,309 | — | 404,309 | |||||||||||||||
Assets Held for Sale | — | 3,915 | — | — | 3,915 | |||||||||||||||
Intercompany Receivable | 1,130,189 | 88,534 | 28,218 | (1,246,941 | ) | — | ||||||||||||||
Deferred Income Tax Assets | 863 | 23,913 | 1,501 | — | 26,277 | |||||||||||||||
Goodwill | — | 778,504 | 447 | — | 778,951 | |||||||||||||||
Intangible Assets, Net | — | 254,531 | 808 | — | 255,339 | |||||||||||||||
Investment in Subsidiaries | 1,336,665 | 456,076 | 2,190 | (1,794,931 | ) | — | ||||||||||||||
OtherNon-Current Assets | 11,141 | 115,330 | 25,210 | (79,395 | ) | 72,286 | ||||||||||||||
|
|
|
|
|
|
|
|
|
| |||||||||||
Total Assets | $ | 3,443,871 | $ | 3,205,526 | $ | 698,778 | $ | (3,121,267 | ) | $ | 4,226,908 | |||||||||
|
|
|
|
|
|
|
|
|
| |||||||||||
| LIABILITIES AND SHAREHOLDERS’ EQUITY |
| |||||||||||||||||||
Accounts payable | $ | 20,643 | $ | 65,475 | $ | 6,469 | $ | — | $ | 92,587 | ||||||||||
Accrued payroll and related taxes | — | 51,780 | 19,952 | — | 71,732 | |||||||||||||||
Accrued expenses and other current liabilities | 40,344 | 115,636 | 20,344 | — | 176,324 | |||||||||||||||
Current portion of capital lease obligations, long-term debt andnon-recourse debt | 8,000 | 1,870 | 19,050 | — | 28,920 | |||||||||||||||
|
|
|
|
|
|
|
|
|
| |||||||||||
Total current liabilities | 68,987 | 234,761 | 65,815 | — | 369,563 | |||||||||||||||
|
|
|
|
|
|
|
|
|
| |||||||||||
Deferred Income Tax Liabilities | — | — | 8,757 | — | 8,757 | |||||||||||||||
Intercompany Payable | 79,984 | 1,129,590 | 37,367 | (1,246,941 | ) | — | ||||||||||||||
OtherNon-Current Liabilities | 4,674 | 157,200 | 14,223 | (79,395 | ) | 96,702 | ||||||||||||||
Capital Lease Obligations | — | 6,059 | — | — | 6,059 | |||||||||||||||
Long-Term Debt | 2,090,985 | — | 90,559 | — | 2,181,544 | |||||||||||||||
Non-Recourse Debt | — | — | 365,364 | — | 365,364 | |||||||||||||||
Commitments & Contingencies | ||||||||||||||||||||
Shareholders’ Equity: | ||||||||||||||||||||
Total shareholders’ equity attributable to The GEO Group, Inc. | 1,199,241 | 1,677,916 | 117,015 | (1,794,931 | ) | 1,199,241 | ||||||||||||||
Noncontrolling Interests | — | — | (322 | ) | — | (322 | ) | |||||||||||||
|
|
|
|
|
|
|
|
|
| |||||||||||
Total Shareholders’ Equity | 1,199,241 | 1,677,916 | 116,693 | (1,794,931 | ) | 1,198,919 | ||||||||||||||
|
|
|
|
|
|
|
|
|
| |||||||||||
Total Liabilities and Shareholders’ Equity | $ | 3,443,871 | $ | 3,205,526 | $ | 698,778 | $ | (3,121,267 | ) | $ | 4,226,908 | |||||||||
|
|
|
|
|
|
|
|
|
| |||||||||||
CONDENSED CONSOLIDATING STATEMENTS OF CASH FLOWS
(in thousands)
| For the Year Ended December 31, 2017 | ||||||||||||||||
| The GEO Group, Inc. | Combined Subsidiary Guarantors | Combined Non-Guarantor Subsidiaries | Consolidated | |||||||||||||
| (Dollars in thousands) | ||||||||||||||||
Cash Flow from Operating Activities: | ||||||||||||||||
Net cash provided by operating activities | $ | 118,180 | $ | 91,467 | $ | 171,395 | $ | 381,042 | ||||||||
|
|
|
|
|
|
|
| |||||||||
Cash Flow from Investing Activities: | ||||||||||||||||
Acquisition of CEC, cash consideration, net of cash acquired | (353,556 | ) | — | — | (353,556 | ) | ||||||||||
Proceeds from sale of property and equipment | 3,436 | — | 24 | 3,460 | ||||||||||||
Insurance proceeds — damaged property | 2,754 | — | — | 2,754 | ||||||||||||
Change in restricted cash and investments | — | (5,973 | ) | (27,688 | ) | (33,661 | ) | |||||||||
Capital expenditures | (53,030 | ) | (86,336 | ) | (9,040 | ) | (148,406 | ) | ||||||||
|
|
|
|
|
|
|
| |||||||||
Net cash used in investing activities | (400,396 | ) | (92,309 | ) | (36,704 | ) | (529,409 | ) | ||||||||
|
|
|
|
|
|
|
| |||||||||
Cash Flow from Financing Activities: | ||||||||||||||||
Payments on long-term debt | (1,140,788 | ) | — | — | (1,140,788 | ) | ||||||||||
Proceeds from long-term debt | 1,389,084 | — | — | 1,389,084 | ||||||||||||
Payments onnon-recourse debt | — | — | (307,414 | ) | (307,414 | ) | ||||||||||
Proceeds fromnon-recourse debt | — | — | 181,658 | 181,658 | ||||||||||||
Taxes paid related to net share settlements of equity awards | (4,142 | ) | — | — | (4,142 | ) | ||||||||||
Debt issuance costs | (8,701 | ) | — | (841 | ) | (9,542 | ) | |||||||||
Proceeds from stock options exercised | 6,962 | — | — | 6,962 | ||||||||||||
Dividends paid | (227,463 | ) | — | — | (227,463 | ) | ||||||||||
Proceeds from issuance of common stock in connection with ESPP | 497 | — | — | 497 | ||||||||||||
Proceeds from issuance of common stock in connection with public offering | 275,867 | — | — | 275,867 | ||||||||||||
|
|
|
|
|
|
|
| |||||||||
Net cash provided by (used in) financing activities | 291,316 | — | (126,597 | ) | 164,719 | |||||||||||
|
|
|
|
|
|
|
| |||||||||
Effect of Exchange Rate Changes on Cash and Cash Equivalents | — | — | (3,013 | ) | (3,013 | ) | ||||||||||
|
|
|
|
|
|
|
| |||||||||
Net Increase (Decrease) in Cash and Cash Equivalents | 9,100 | (842 | ) | 5,081 | 13,339 | |||||||||||
Cash and Cash Equivalents, beginning of period | 45,566 | 842 | 21,630 | 68,038 | ||||||||||||
|
|
|
|
|
|
|
| |||||||||
Cash and Cash Equivalents, end of period | $ | 54,666 | $ | — | $ | 26,711 | $ | 81,377 | ||||||||
|
|
|
|
|
|
|
| |||||||||
| For the Year Ended December 31, 2018 | ||||||||||||||||
| The GEO Group, Inc. | Combined Subsidiary Guarantors | Combined Non-Guarantor Subsidiaries | Consolidated | |||||||||||||
Cash Flow from Operating Activities: | ||||||||||||||||
Net cash provided by operating activities | $ | 156,754 | $ | 86,974 | $ | 30,747 | $ | 274,475 | ||||||||
|
|
|
|
|
|
|
| |||||||||
Cash Flow from Investing Activities: | ||||||||||||||||
Proceeds from sale of property and equipment | — | 268 | 1,809 | 2,077 | ||||||||||||
Insurance proceeds — damaged property | — | 1,438 | — | 1,438 | ||||||||||||
Proceeds from sale of assets held for sale | — | 3,797 | — | 3,797 | ||||||||||||
Change in restricted investments | — | (129 | ) | — | (129 | ) | ||||||||||
Capital expenditures | (104,034 | ) | (89,310 | ) | (2,322 | ) | (195,666 | ) | ||||||||
|
|
|
|
|
|
|
| |||||||||
Net cash used in investing activities | (104,034 | ) | (83,936 | ) | (513 | ) | (188,483 | ) | ||||||||
|
|
|
|
|
|
|
| |||||||||
Cash Flow from Financing Activities: | ||||||||||||||||
Payments on long-term debt | (276,000 | ) | — | (6,358 | ) | (282,358 | ) | |||||||||
Proceeds from long-term debt | 502,998 | — | — | 502,998 | ||||||||||||
Payments onnon-recourse debt | — | — | (18,544 | ) | (18,544 | ) | ||||||||||
Taxes paid related to net share settlements of equity awards | (3,820 | ) | — | — | (3,820 | ) | ||||||||||
Payment for repurchases of common stock | (95,175 | ) | — | — | (95,175 | ) | ||||||||||
Debt issuance costs | (990 | ) | — | — | (990 | ) | ||||||||||
Proceeds from stock options exercised | 1,887 | — | — | 1,887 | ||||||||||||
Dividends paid | (229,498 | ) | — | — | (229,498 | ) | ||||||||||
Proceeds from issuance of common stock in connection with ESPP | 534 | — | — | 534 | ||||||||||||
|
|
|
|
|
|
|
| |||||||||
Net cash used in financing activities | (100,064 | ) | — | (24,902 | ) | (124,966 | ) | |||||||||
|
|
|
|
|
|
|
| |||||||||
Effect of Exchange Rate Changes on Cash, Cash Equivalents and Restricted Cash and Cash Equivalents | — | — | (10,099 | ) | (10,099 | ) | ||||||||||
|
|
|
|
|
|
|
| |||||||||
Net (Decrease) Increase in Cash. Cash Equivalents and Restricted Cash and Cash Equivalents | (47,344 | ) | 3,038 | (4,767 | ) | (49,073 | ) | |||||||||
Cash, Cash Equivalents and Restricted Cash and Cash Equivalents, beginning of period | 54,666 | 4,952 | 73,927 | 133,545 | ||||||||||||
|
|
|
|
|
|
|
| |||||||||
Cash, Cash Equivalents and Restricted Cash and Cash Equivalents, end of period | $ | 7,322 | $ | 7,990 | $ | 69,160 | $ | 84,472 | ||||||||
|
|
|
|
|
|
|
| |||||||||
CONDENSED CONSOLIDATING STATEMENTS OF CASH FLOWS
(in thousands)
| For the Year Ended December 31, 2016 | ||||||||||||||||
| The GEO Group Inc. | Combined Subsidiary Guarantors | Combined Non-Guarantor Subsidiaries | Consolidated | |||||||||||||
| (Dollars in thousands) | ||||||||||||||||
Cash Flow from Operating Activities: | ||||||||||||||||
Net cash provided by (used in) operating activities | $ | 154,125 | $ | 66,009 | $ | (248,162 | ) | $ | (28,028 | ) | ||||||
|
|
|
|
|
|
|
| |||||||||
Cash Flow from Investing Activities: | ||||||||||||||||
Proceeds from sale of property and equipment | 2,030 | — | — | 2,030 | ||||||||||||
Insurance proceeds — damaged property | — | — | 4,733 | 4,733 | ||||||||||||
Change in restricted cash and investments | (24 | ) | (3,356 | ) | (6,178 | ) | (9,558 | ) | ||||||||
Capital expenditures | (14,040 | ) | (61,811 | ) | (5,714 | ) | (81,565 | ) | ||||||||
|
|
|
|
|
|
|
| |||||||||
Net cash used in investing activities | (12,034 | ) | (65,167 | ) | (7,159 | ) | (84,360 | ) | ||||||||
|
|
|
|
|
|
|
| |||||||||
Cash Flow from Financing Activities: | ||||||||||||||||
Payments on long-term debt | (934,006 | ) | — | — | (934,006 | ) | ||||||||||
Proceeds from long-term debt | 1,012,945 | — | — | 1,012,945 | ||||||||||||
Payments onnon-recourse debt | — | — | (10,064 | ) | (10,064 | ) | ||||||||||
Proceeds fromnon-recourse debt | — | — | 266,835 | 266,835 | ||||||||||||
Taxes paid related to net share settlements of equity awards | (2,336 | ) | — | — | (2,336 | ) | ||||||||||
Tax deficiency related to equity compensation | (844 | ) | — | (782 | ) | (1,626 | ) | |||||||||
Debt issuance costs | (16,980 | ) | — | (4,135 | ) | (21,115 | ) | |||||||||
Proceeds from stock options exercised | 2,367 | — | 980 | 3,347 | ||||||||||||
Dividends paid | (194,748 | ) | — | (194,748 | ) | |||||||||||
Proceeds from issuance of common stock in connection with ESPP | — | 436 | 436 | |||||||||||||
|
|
|
|
|
|
|
| |||||||||
Net cash (used in) provided by financing activities | (133,602 | ) | — | 253,270 | 119,668 | |||||||||||
|
|
|
|
|
|
|
| |||||||||
Effect of Exchange Rate Changes on Cash and Cash Equivalents | — | — | 1,120 | 1,120 | ||||||||||||
|
|
|
|
|
|
|
| |||||||||
Net Increase (decrease) in Cash and Cash Equivalents | 8,489 | 842 | (931 | ) | 8,400 | |||||||||||
Cash and Cash Equivalents, beginning of period | 37,077 | — | 22,561 | 59,638 | ||||||||||||
|
|
|
|
|
|
|
| |||||||||
Cash and Cash Equivalents, end of period | $ | 45,566 | $ | 842 | $ | 21,630 | $ | 68,038 | ||||||||
|
|
|
|
|
|
|
| |||||||||
| For the Year Ended December 31, 2017 | ||||||||||||||||
| The GEO Group Inc. | Combined Subsidiary Guarantors | Combined Non-Guarantor Subsidiaries | Consolidated | |||||||||||||
Cash Flow from Operating Activities: | ||||||||||||||||
Net cash provided by operating activities | $ | 118,018 | $ | 91,174 | $ | 171,850 | $ | 381,042 | ||||||||
|
|
|
|
|
|
|
| |||||||||
Cash Flow from Investing Activities: | ||||||||||||||||
Acquisition of CEC, cash consideration, net of cash acquired | (353,556 | ) | — | — | (353,556 | ) | ||||||||||
Proceeds from sale of property and equipment | 3,436 | — | 24 | 3,460 | ||||||||||||
Insurance proceeds — damaged property | 2,754 | — | — | 2,754 | ||||||||||||
Change in restricted cash and investments | — | (4,507 | ) | — | (4,507 | ) | ||||||||||
Capital expenditures | (53,030 | ) | (86,336 | ) | (9,040 | ) | (148,406 | ) | ||||||||
|
|
|
|
|
|
|
| |||||||||
Net cash used in investing activities | (400,396 | ) | (90,843 | ) | (9,016 | ) | (500,255 | ) | ||||||||
|
|
|
|
|
|
|
| |||||||||
Cash Flow from Financing Activities: | ||||||||||||||||
Payments on long-term debt | (1,140,788 | ) | — | — | (1,140,788 | ) | ||||||||||
Proceeds from long-term debt | 1,389,084 | — | — | 1,389,084 | ||||||||||||
Payments onnon-recourse debt | — | — | (307,414 | ) | (307,414 | ) | ||||||||||
Proceeds fromnon-recourse debt | — | — | 181,658 | 181,658 | ||||||||||||
Taxes paid related to net share settlements of equity awards | (4,142 | ) | — | — | (4,142 | ) | ||||||||||
Debt issuance costs | (8,701 | ) | — | (841 | ) | (9,542 | ) | |||||||||
Proceeds from stock options exercised | 6,962 | — | — | 6,962 | ||||||||||||
Dividends paid | (227,463 | ) | — | — | (227,463 | ) | ||||||||||
Proceeds from issuance of common stock in connection with ESPP | 497 | — | 497 | |||||||||||||
Proceeds from issuance of common stock in connection with public offering | 275,867 | — | — | 275,867 | ||||||||||||
|
|
|
|
|
|
|
| |||||||||
Net cash provided by (used in) financing activities | 291,316 | — | (126,597 | ) | 164,719 | |||||||||||
|
|
|
|
|
|
|
| |||||||||
Effect of Exchange Rate Changes on Cash, Cash Equivalents and Restricted Cash and Cash Equivalents | — | — | (2,318 | ) | (2,318 | ) | ||||||||||
|
|
|
|
|
|
|
| |||||||||
Net Increase in Cash, Cash Equivalents and Restricted Cash and Cash Equivalents | 8,938 | 331 | 33,919 | 43,188 | ||||||||||||
Cash, Cash Equivalents and Restricted Cash and Cash Equivalents, beginning of period | 45,728 | 4,621 | 40,008 | 90,357 | ||||||||||||
|
|
|
|
|
|
|
| |||||||||
Cash, Cash Equivalents and Restricted Cash and Cash Equivalents, end of period | $ | 54,666 | $ | 4,952 | $ | 73,927 | $ | 133,545 | ||||||||
|
|
|
|
|
|
|
| |||||||||
CONDENSED CONSOLIDATING STATEMENTS OF CASH FLOWS
(in thousands)
| For the Year Ended December 31, 2015 | ||||||||||||||||
| The GEO Group Inc. | Combined Subsidiary Guarantors | Combined Non-Guarantor Subsidiaries | Consolidated | |||||||||||||
| (Dollars in thousands) | ||||||||||||||||
Cash Flow from Operating Activities: | ||||||||||||||||
Net cash provided by (used in) operating activities | 153,861 | 84,795 | (96,499 | ) | 142,157 | |||||||||||
|
|
|
|
|
|
|
| |||||||||
Cash Flow from Investing Activities: | ||||||||||||||||
Acquisition of LCS, net of cash acquired | (307,404 | ) | — | — | (307,404 | ) | ||||||||||
Acquisition of Protocol, cash consideration | (24,402 | ) | (24,402 | ) | ||||||||||||
Proceeds from sale of property and equipment | — | 42 | — | 42 | ||||||||||||
Insurance proceeds — damaged property | — | 1,270 | — | 1,270 | ||||||||||||
Change in restricted cash and investments | 90 | (2,658 | ) | (2,237 | ) | (4,805 | ) | |||||||||
Capital expenditures | (55,629 | ) | (59,829 | ) | (2,123 | ) | (117,581 | ) | ||||||||
|
|
|
|
|
|
|
| |||||||||
Net cash used in investing activities | (362,943 | ) | (85,577 | ) | (4,360 | ) | (452,880 | ) | ||||||||
|
|
|
|
|
|
|
| |||||||||
Cash Flow from Financing Activities: | ||||||||||||||||
Proceeds from long-term debt | 724,798 | — | — | 724,798 | ||||||||||||
Payments on long-term debt | (311,985 | ) | — | (311,985 | ) | |||||||||||
Payments onnon-recourse debt | — | — | (11,908 | ) | (11,908 | ) | ||||||||||
Proceeds fromnon-recourse debt | — | — | 123,560 | 123,560 | ||||||||||||
Income tax benefit of equity compensation | 1,409 | — | — | 1,409 | ||||||||||||
Taxes paid related to net share settlements of equity awards | (2,786 | ) | — | — | (2,786 | ) | ||||||||||
Debt issuance costs | — | — | (7,069 | ) | (7,069 | ) | ||||||||||
Proceeds from stock options exercised | 2,774 | — | — | 2,774 | ||||||||||||
Dividends paid | (186,984 | ) | — | — | (186,984 | ) | ||||||||||
Proceeds from issuance of common stock in connection with ESPP | 441 | — | — | 441 | ||||||||||||
|
|
|
|
|
|
|
| |||||||||
Net cash provided by (used in) financing activities | 227,667 | — | 104,583 | 332,250 | ||||||||||||
|
|
|
|
|
|
|
| |||||||||
Effect of Exchange Rate Changes on Cash and Cash Equivalents | — | — | (3,226 | ) | (3,226 | ) | ||||||||||
|
|
|
|
|
|
|
| |||||||||
Net Increase (Decrease) in Cash and Cash Equivalents | 18,585 | (782 | ) | 498 | 18,301 | |||||||||||
Cash and Cash Equivalents, beginning of period | 18,492 | 782 | 22,063 | 41,337 | ||||||||||||
|
|
|
|
|
|
|
| |||||||||
Cash and Cash Equivalents, end of period | $ | 37,077 | $ | — | $ | 22,561 | $ | 59,638 | ||||||||
|
| �� |
|
|
|
|
|
| ||||||||
| For the Year Ended December 31, 2016 | ||||||||||||||||
| The GEO Group Inc. | Combined Subsidiary Guarantors | Combined Non-Guarantor Subsidiaries | Consolidated | |||||||||||||
Cash Flow from Operating Activities: | ||||||||||||||||
Net cash provided by (used in) operating activities | 154,125 | 66,009 | (248,162 | ) | (28,028 | ) | ||||||||||
|
|
|
|
|
|
|
| |||||||||
Cash Flow from Investing Activities: | ||||||||||||||||
Proceeds from sale of property and equipment | 2,030 | — | — | 2,030 | ||||||||||||
Insurance proceeds — damaged property | — | — | 4,733 | 4,733 | ||||||||||||
Change in restricted cash and investments | — | (2,892 | ) | — | (2,892 | ) | ||||||||||
Capital expenditures | (14,040 | ) | (61,811 | ) | (5,714 | ) | (81,565 | ) | ||||||||
|
|
|
|
|
|
|
| |||||||||
Net cash used in investing activities | (12,010 | ) | (64,703 | ) | (981 | ) | (77,694 | ) | ||||||||
|
|
|
|
|
|
|
| |||||||||
Cash Flow from Financing Activities: | ||||||||||||||||
Proceeds from long-term debt | 1,012,945 | — | — | 1,012,945 | ||||||||||||
Payments on long-term debt | (934,006 | ) | — | (934,006 | ) | |||||||||||
Payments onnon-recourse debt | — | — | (10,064 | ) | (10,064 | ) | ||||||||||
Proceeds fromnon-recourse debt | — | — | 266,835 | 266,835 | ||||||||||||
Income tax benefit of equity compensation | (844 | ) | — | (782 | ) | (1,626 | ) | |||||||||
Taxes paid related to net share settlements of equity awards | (2,336 | ) | — | — | (2,336 | ) | ||||||||||
Debt issuance costs | (16,980 | ) | — | (4,135 | ) | (21,115 | ) | |||||||||
Proceeds from stock options exercised | 2,367 | — | 980 | 3,347 | ||||||||||||
Dividends paid | (194,748 | ) | — | — | (194,748 | ) | ||||||||||
Proceeds from issuance of common stock in connection with ESPP | — | — | 436 | 436 | ||||||||||||
|
|
|
|
|
|
|
| |||||||||
Net cash provided by (used in) financing activities | (133,602 | ) | — | 253,270 | 119,668 | |||||||||||
|
|
|
|
|
|
|
| |||||||||
Effect of Exchange Rate Changes on Cash and Cash Equivalents | — | — | 1,119 | 1,119 | ||||||||||||
|
|
|
|
|
|
|
| |||||||||
Net Increase in Cash and Cash Equivalents | 8,513 | 1,306 | 5,246 | 15,065 | ||||||||||||
Cash and Cash Equivalents, beginning of period | 37,215 | 3,315 | 34,762 | 75,292 | ||||||||||||
|
|
|
|
|
|
|
| |||||||||
Cash and Cash Equivalents, end of period | $ | 45,728 | $ | 4,621 | $ | 40,008 | $ | 90,357 | ||||||||
|
|
|
|
|
|
|
| |||||||||
| 20. | Subsequent Events |
Dividend
On February 5, 2018,4, 2019, the Board of Directors declared a quarterly cash dividend of $0.47$0.48 per share of common stock, which is to bewas paid on February 27, 201822, 2019 to shareholders of record as of the close of business on February 16, 2018.
Stock Buyback Program
On February14, 2018, the Company announced that its Board of Directors authorized a stock buyback program authorizing the Company to repurchase up to a maximum of $200.0 million of its shares of common stock. The program shall be effective through October 20, 2020. The stock buyback program is intended to be implemented through purchases made from time to time in the open market or in privately negotiated transactions, in accordance with applicable Securities and Exchange Commission requirements. The stock buyback program does not obligate us to purchase any specific amount of our common stock and may be suspended or extended at any time at the discretion of our Board of Directors.15, 2019.
| Item 9. | Changes in and Disagreements with Accountants on Accounting and Financial Disclosure |
None.
| Item 9A. | Controls and Procedures |
Disclosure Controls and Procedures
Our management, with the participation of our Chief Executive Officer and our Chief Financial Officer, has evaluated the effectiveness of our disclosure controls and procedures (as such term is defined inRules 13a-15(e) and15d-15(e) under the Securities Exchange Act of 1934, as amended, referred to as the Exchange Act), as of the end of the period covered by this report. On the basis of this review, our management, including our Chief Executive Officer and our Chief Financial Officer, has concluded that as of the end of the period covered by this report, our disclosure controls and procedures were effective to give reasonable assurance that the information required to be disclosed in our reports filed with the Securities and Exchange Commission, or the SEC, under the Exchange Act is recorded, processed, summarized and reported within the time periods specified in the rules and forms of the SEC, and to ensure that the information required to be disclosed in the reports filed or submitted under the Exchange Act is accumulated and communicated to our management, including our Chief Executive Officer and our Chief Financial Officer, in a manner that allows timely decisions regarding required disclosure.
It should be noted that the effectiveness of our system of disclosure controls and procedures is subject to certain limitations inherent in any system of disclosure controls and procedures, including the exercise of judgment in designing, implementing and evaluating the controls and procedures, the assumptions used in identifying the likelihood of future events, and the inability to eliminate misconduct completely. Accordingly, there can be no assurance that our disclosure controls and procedures will detect all errors or fraud. As a result, by its nature, our system of disclosure controls and procedures can provide only reasonable assurance regarding management’s control objectives.
Internal Control Over Financial Reporting
(a) Management’s Annual Report on Internal Control Over Financial Reporting
See “Item 8. — Financial Statements and Supplementary Data — Management’s Annual Report on Internal Control Over Financial Reporting” for management’s report on the effectiveness of our internal control over financial reporting as of December 31, 2017.2018.
(b) Attestation Report of the Registered Public Accounting Firm
See “Item 8. — Financial Statements and Supplementary Data — Report of Independent Registered Public Accounting Firm” for the report of our independent registered public accounting firm on the effectiveness of our internal control over financial reporting as of December 31, 2017.2018.
(c) Changes in Internal Control over Financial Reporting
Our management is responsible for reporting any changes in our internal control over financial reporting (as such terms are defined inRules 13a-15(f) and15d-15(f) under the Exchange Act) during the period to which this report relates that have materially affected, or are reasonably likely to materially affect, our internal control over financial reporting. Management believes that there have not been any changes in our internal control over financial reporting (as such term is defined inRules 13a-15(f) and15d-15(f) under the Exchange Act) during the period to which this report relates that have materially affected, or are reasonably likely to materially affect, our internal control over financial reporting. We implemented certain internal controls to ensure we adequately evaluated our lease contracts and properly assessed the impact of the new accounting standard related to lease accounting on our financial statements, including relevant disclosures, to facilitate this adoption on January 1, 2019. There were no significant changes to our internal control over financial reporting during the quarter ended December 31, 2018 due to the adoption of this standard on January 1, 2019.
| Item 9B. | Other Information |
Not applicable.
PART III
| ITEM 10. | Directors, Executive Officers and Corporate Governance |
We have adopted a code of business conduct and ethics applicable to all of our directors, officers, employees, agents and representatives, including our consultants. The code strives to deter wrongdoing and promote honest and ethical conduct, the avoidance of conflicts of interest, full, fair, accurate, timely and transparent disclosure, compliance with the applicable government and self-regulatory organization laws, rules and regulations, prompt internal reporting of violations of the code, and accountability for compliance with the code. In addition, we have adopted a code of ethics for the CEO, our senior financial officers and all other employees. The codes can be found on our website at http://www.geogroup.com by clicking on the link “About Us” on our homepage and then clicking on the link “Corporate Governance.” In addition, the codes are available in print to any shareholder who request them by contacting our Vice President of Corporate Relations at561-999-7306. In the event that we amend or waive any of the provisions of the code of business conduct and ethics and the code of ethics for the CEO, our senior financial officers and employees that relate to any element of the code of ethics definition enumerated in Item 406(b) of RegulationS-K, we intend to disclose the same on our Investor Relations website. The other information required by this item will be contained in, and is incorporated by reference from, the proxy statement for our 20182019 annual meeting of shareholders, which will be filed with the SEC pursuant to Regulation 14A within 120 days after the end of the year covered by this report.
| ITEM 11. | Executive Compensation |
The information required by this item will be contained in, and is incorporated by reference from, the proxy statement for our 20182019 annual meeting of shareholders, which will be filed with the SEC pursuant to Regulation 14A within 120 days after the end of the fiscal year covered by this report.
| ITEM 12. | Security Ownership of Certain Beneficial Owners and Management and Related Stockholder Matters |
The information required by this item will be contained in, and is incorporated by reference from, the proxy statement for our 20182019 annual meeting of shareholders, which will be filed with the SEC pursuant to Regulation 14A within 120 days after the end of the fiscal year covered by this report.
| ITEM 13. | Certain Relationships and Related Transactions, and Director Independence |
The information required by this item will be contained in, and is incorporated by reference from, the proxy statement for our 20182019 annual meeting of shareholders, which will be filed with the SEC pursuant to Regulation 14A within 120 days after the end of the fiscal year covered by this report.
| ITEM 14. | Principal Accounting Fees and Services |
The information required by this item will be contained in, and is incorporated by reference from, the proxy statement for our 20182019 annual meeting of shareholders, which will be filed with the SEC pursuant to Regulation 14A within 120 days after the end of the fiscal year covered by this report.
PART IV
| Item 15. | Exhibits, Financial Statement Schedules |
(a)(1)Financial Statements.
The consolidated financial statements of GEO are filed under Item 8 of Part II of this report.
(2) Financial Statement Schedules.
Schedule II — Valuation and Qualifying Accounts — Page 172173
Schedule III — Real Estate and Accumulated Depreciation — Page 173174
All other schedules specified in the accounting regulations of the Securities and Exchange Commission have been omitted because they are either inapplicable or not required.
(3) Exhibits Required by Item 601 of Regulation S-K. The following exhibits are filed as part of this Annual Report:
| 10.26 | Consultant Agreement, effective January 1, 2019, by and between the Company and John Bulfin (incorporated by reference to Exhibit 10.1 to the Company’s report on Form8-K filed on December 12, 2018). | |
| 21.1 | Subsidiaries of the Company* | |
| 23.1 | Consent of Grant Thornton LLP, Independent Registered Public Accounting Firm* | |
| 31.1 | Rule13a-14(a) Certification in accordance with Section 302 of the Sarbanes-Oxley Act of 2002* | |
| 31.2 | Rule13a-14(a) Certification in accordance with Section 302 of the Sarbanes-Oxley Act of 2002* | |
| 32.1 | Certification pursuant to 18 U.S.C. Section 1350, as adopted pursuant to Section 906 of the Sarbanes-Oxley Act of 2002* | |
| 32.2 | Certification pursuant to 18 U.S.C. Section 1350, as adopted pursuant to Section 906 of the Sarbanes-Oxley Act of 2002* | |
| 101.INS | XBRL Instance Document | |
| 101.SCH | XBRL Taxonomy Extension Schema | |
| 101.CAL | XBRL Taxonomy Extension Calculation Linkbase | |
| 101.DEF | XBRL Taxonomy Extension Definition Linkbase | |
| 101.LAB | XBRL Taxonomy Extension Label Linkbase | |
| 101.PRE | XBRL Taxonomy Extension Presentation Linkbase | |
| * | Filed herewith. |
| † | Management contract or compensatory plan, contract or agreement as defined in Item 402 (a)(3) of Regulation |
| (P) | Paper filing |
None.
Pursuant to the requirements of Section 13 or 15(d) of the Securities Exchange Act of 1934, the registrant has duly caused this report to be signed on its behalf by the undersigned, thereunto duly authorized.
THE GEO GROUP, INC. |
/s/ BRIAN R. EVANS |
Brian R. Evans |
Senior Vice President and Chief Financial Officer |
Date: February 26, 201825, 2019
Pursuant to the requirements of the Securities Exchange Act of 1934, this report has been signed below by the following persons on behalf of the registrant and in the capacities and on the dates indicated.
Signature | Title | Date | ||
/s/ George C. Zoley George C. Zoley | Chairman of the Board and Chief
| February | ||
/s/ Brian R. Evans Brian R. Evans | Senior Vice President and Chief Financial Officer (principal financial officer) | February | ||
/s/ Ronald A. Brack Ronald A. Brack | Executive Vice President, Chief Accounting Officer and Controller
| February | ||
/s/
| Director | February | ||
/s/ Julie M. Wood Julie M. Wood | Director | February | ||
/s/ Anne N. Foreman Anne N. Foreman | Director | February | ||
/s/ Richard H. Glanton Richard H. Glanton | Director | February | ||
/s/ Christopher C. Wheeler Christopher C. Wheeler | Director | February | ||
/s/ Guido M. Van Hauwermeiren Guido M. Van Hauwermeiren | Director | February 25, 2019 | ||
THE GEO GROUP, INC.
SCHEDULE II
VALUATION AND QUALIFYING ACCOUNTS
For the Years Ended December 31, 2018, 2017 2016 and 20152016
| Description | Balance at Beginning of Period | Charged to Cost and Expenses | Charged to Other Accounts | Deductions, Actual Charge-Offs | Balance at End of Period | Balance at Beginning of Period | Charged to Cost and Expenses | Charged to Other Accounts | Deductions, Actual Charge-Offs | Balance at End of Period | ||||||||||||||||||||||||||||||
| (In thousands) | (In thousands) | |||||||||||||||||||||||||||||||||||||||
YEAR ENDED DECEMBER 31, 2018: | ||||||||||||||||||||||||||||||||||||||||
Allowance for doubtful accounts | $ | 4,574 | $ | 823 | $ | — | $ | (1,214 | ) | $ | 4,183 | |||||||||||||||||||||||||||||
YEAR ENDED DECEMBER 31, 2017: | ||||||||||||||||||||||||||||||||||||||||
Allowance for doubtful accounts | $ | 3,664 | $ | 2,138 | $ | — | $ | (1,228 | ) | $ | 4,574 | $ | 3,664 | $ | 2,456 | $ | — | $ | (1,546 | ) | $ | 4,574 | ||||||||||||||||||
YEAR ENDED DECEMBER 31, 2016: | ||||||||||||||||||||||||||||||||||||||||
Allowance for doubtful accounts | $ | 3,088 | $ | 2,682 | $ | — | $ | (2,106 | ) | $ | 3,664 | $ | 3,088 | $ | 2,682 | $ | — | $ | (2,106 | ) | $ | 3,664 | ||||||||||||||||||
YEAR ENDED DECEMBER 31, 2015: | ||||||||||||||||||||||||||||||||||||||||
Allowance for doubtful accounts | $ | 3,315 | $ | 764 | $ | — | $ | (991 | ) | $ | 3,088 | |||||||||||||||||||||||||||||
THE GEO GROUP, INC.
SCHEDULE III- REAL ESTATE AND ACCUMULATED DEPRECIATION
December 31, 20172018
(dollars in thousands)
| Original | Gross Cost at December 31, 2017 | |||||||||||||||||||||||||||||||||||||||||||||
Property Name (1) | Type | Location | Land | Building and Improvements | Costs Capitalized Subsequent to Acquisition (2) | Land and Improvements | Building and Improvements | Land Held for Development | Development and Construction in Progress | Total | Accumulated Depreciation | Year(s) Built/ Renovated | Book Value of Mortgaged Properties | |||||||||||||||||||||||||||||||||
Corrections and Detention —Owned and Leased |
| |||||||||||||||||||||||||||||||||||||||||||||
Broward Transition Center | Detention Facility | Deerfield Beach, FL | $ | 4,085 | $ | 15,441 | $ | 18,582 | $ | 4,096 | $ | 33,838 | $ | — | $ | 174 | $ | 38,108 | $ | 7,768 | 1998, 2004, 2010/2011, 2013/2014 | $ | 30,340 | |||||||||||||||||||||||
D. Ray James Correctional Facility | Correctional Facility | Folkston, GA | $ | 1,229 | $ | 55,961 | $ | 17,799 | $ | 1,720 | $ | 73,026 | $ | 243 | $ | — | $ | 74,989 | $ | 12,507 | 1998/1999, 2008/2009, 2011/2012 | $ | 62,482 | |||||||||||||||||||||||
Folkston ICE Processing Center | Detention Facility | Folkston, GA | $ | 291 | $ | 30,399 | $ | 3,201 | $ | 291 | $ | 33,600 | $ | — | $ | — | $ | 33,891 | $ | 4,747 | 2005, 2008, 2013, 2017 | $ | 29,144 | |||||||||||||||||||||||
LaSalle Detention Facility | Detention Facility | Jena, LA | $ | 856 | $ | 51,623 | $ | 6,242 | $ | 1,127 | $ | 57,080 | $ | 514 | $ | — | $ | 58,721 | $ | 13,652 | 1998, 2008, 2010/2011, 2017 | $ | 45,069 | |||||||||||||||||||||||
Alexandria Transfer Center (3) | Detention Facility | Alexandria, LA | $ | — | $ | 17,283 | $ | 23 | $ | — | $ | 17,306 | $ | — | $ | — | $ | 17,306 | $ | 1,172 | 2014 | $ | — | |||||||||||||||||||||||
Moshannon Valley Correctional Center | Correctional Facility | Philipsburg, PA | $ | 1,107 | $ | 65,160 | $ | 8,515 | $ | 1,700 | $ | 72,995 | $ | 87 | $ | — | $ | 74,782 | $ | 12,528 | 2005/2006, 2013 | $ | 62,254 | |||||||||||||||||||||||
North Lake Correctional Facility | Correctional Facility | Baldwin, MI | $ | 66 | $ | 36,727 | $ | 52,038 | $ | 66 | $ | 87,603 | $ | — | $ | 1,162 | $ | 88,831 | $ | 11,797 | 1998/1999, 2002, 2011, CIP | $ | 77,034 | |||||||||||||||||||||||
Queens Detention Facility | Detention Facility | Jamaica, NY | $ | 2,237 | $ | 19,847 | $ | 509 | $ | 2,237 | $ | 20,356 | $ | — | $ | — | $ | 22,593 | $ | 9,065 | 1971, 1996/1997, 2004 | $ | — | |||||||||||||||||||||||
Riverbend Correctional Facility (3) | Correctional Facility | Milledgeville, GA | $ | — | $ | 72,932 | $ | 399 | $ | 25 | $ | 73,147 | $ | — | $ | 159 | $ | 73,331 | $ | 11,969 | 2011 | $ | 61,362 | |||||||||||||||||||||||
Rivers Correctional Institution | Correctional Facility | Winton, NC | $ | 875 | $ | 60,328 | $ | 4,804 | $ | 1,235 | $ | 64,623 | $ | 149 | $ | — | $ | 66,007 | $ | 21,624 | 2000/2001, 2017 | $ | 44,383 | |||||||||||||||||||||||
Robert A. Deyton Detention Facility | Detention Facility | Lovejoy, GA | $ | — | $ | 8,163 | $ | 10,291 | $ | 15 | $ | 18,439 | $ | — | $ | — | $ | 18,454 | $ | 8,886 | 1984-1986, 2008/2009 | $ | — | |||||||||||||||||||||||
| Original | Gross Cost at December 31, 2018 | |||||||||||||||||||||||||||||||||||||||||||||
Property Name (1) | Type | Location | Land | Building and Improvements | Costs Capitalized Subsequent to Acquisition (2) | Land and Improvements | Building and Improvements | Land Held for Development | Development and Construction in Progress | Total | Accumulated Depreciation | Year(s) Built/ Renovated | Book Value of Mortgaged Properties | |||||||||||||||||||||||||||||||||
Corrections and Detention—Owned and Leased |
| |||||||||||||||||||||||||||||||||||||||||||||
| Broward Transition Center | Detention Facility | Deerfield Beach, FL | $ | 4,085 | $ | 15,441 | $ | 18,696 | $ | 4,096 | $ | 34,053 | $ | — | $ | 73 | $ | 38,222 | $ | 8,864 | 1998, 2004, 2010/2011, 2013/2014 | $ | 29,358 | |||||||||||||||||||||||
| D. Ray James Correctional Facility | Correctional Facility | Folkston, GA | $ | 1,229 | $ | 55,961 | $ | 13,648 | $ | 1,720 | $ | 68,875 | $ | 243 | $ | — | $ | 70,838 | $ | 13,828 | 1998/1999, 2008/2009, 2011/2012 | $ | 57,010 | |||||||||||||||||||||||
| Folkston ICE Processing Center | Detention Facility | Folkston, GA | $ | 291 | $ | 30,399 | $ | 7,541 | $ | 291 | $ | 37,865 | $ | — | $ | 75 | $ | 38,231 | $ | 6,235 | 2005, 2008, 2013, 2017 | $ | 31,996 | |||||||||||||||||||||||
| LaSalle Detention Facility | Detention Facility | Jena, LA | $ | 856 | $ | 51,623 | $ | 6,394 | $ | 1,127 | $ | 57,232 | $ | 514 | $ | — | $ | 58,873 | $ | 15,204 | 1998, 2008, 2010/2011, 2017 | $ | 43,669 | |||||||||||||||||||||||
| Alexandria Transfer Center (3) | Detention Facility | Alexandria, LA | $ | — | $ | 17,283 | $ | 45 | $ | — | $ | 17,328 | $ | — | $ | — | $ | 17,328 | $ | 1,537 | 2014 | $ | — | |||||||||||||||||||||||
| Moshannon Valley Correctional Center | Correctional Facility | Philipsburg, PA | $ | 1,107 | $ | 65,160 | $ | 8,733 | $ | 1,713 | $ | 73,200 | $ | 87 | $ | — | $ | 75,000 | $ | 14,530 | 2005/2006, 2013 | $ | 60,470 | |||||||||||||||||||||||
| North Lake Correctional Facility | Correctional Facility | Baldwin, MI | $ | 66 | $ | 36,727 | $ | 57,667 | $ | 66 | $ | 88,132 | $ | — | $ | 6,262 | $ | 94,460 | $ | 13,668 | 1998/1999, 2002, 2011, CIP | $ | 80,792 | |||||||||||||||||||||||
| Queens Detention Facility | Detention Facility | Jamaica, NY | $ | 2,237 | $ | 19,847 | $ | 1,953 | $ | 2,237 | $ | 21,800 | $ | — | $ | — | $ | 24,037 | $ | 9,700 | 1971, 1996/1997, 2004 | $ | — | |||||||||||||||||||||||
| Riverbend Correctional Facility (3) | Correctional Facility | Milledgeville, GA | $ | — | $ | 72,932 | $ | 414 | $ | 25 | $ | 73,321 | $ | — | $ | — | $ | 73,346 | $ | 13,941 | 2011 | $ | 59,405 | |||||||||||||||||||||||
| Rivers Correctional Institution | Correctional Facility | Winton, NC | $ | 875 | $ | 60,328 | $ | 5,505 | $ | 1,235 | $ | 65,324 | $ | 149 | $ | — | $ | 66,708 | $ | 23,242 | 2000/2001, 2017 | $ | 43,466 | |||||||||||||||||||||||
| Robert A. Deyton Detention Facility | Detention Facility | Lovejoy, GA | $ | — | $ | 8,163 | $ | 10,376 | $ | 15 | $ | 18,524 | $ | — | $ | — | $ | 18,539 | $ | 9,879 | 1984-1986, 2008/2009 | $ | — | |||||||||||||||||||||||
| Original | Gross Cost at December 31, 2017 | Original | Gross Cost at December 31, 2018 | |||||||||||||||||||||||||||||||||||||||||||||||||||||||||||||||||||||||||||||||||||||||||
Property Name (1) | Type | Location | Land | Building and Improvements | Costs Capitalized Subsequent to Acquisition (2) | Land and Improvements | Building and Improvements | Land Held for Development | Development and Construction in Progress | Total | Accumulated Depreciation | Year(s) Built/ Renovated | Book Value of Mortgaged Properties | Type | Location | Land | Building and Improvements | Costs Capitalized Subsequent to Acquisition (2) | Land and Improvements | Building and Improvements | Land Held for Development | Development and Construction in Progress | Total | Accumulated Depreciation | Year(s) Built/ Renovated | Book Value of Mortgaged Properties | ||||||||||||||||||||||||||||||||||||||||||||||||||||||||||||||||||
Big Spring Correctional Center (3) | Correctional Facility | Big Spring, TX | $ | 530 | $ | 83,160 | $ | 21,418 | $ | 2,310 | $ | 94,954 | $ | — | $ | 7,844 | $ | 105,108 | $ | 24,358 | 1940, 1960, 1982, 1991, 1994, 1996, 2001, 2009-2012, 2016, CIP | $ | — | Correctional Facility | Big Spring, TX | $ | 480 | $ | 82,180 | $ | 31,589 | $ | 2,235 | $ | 111,969 | $ | — | $ | 45 | $ | 114,249 | $ | 28,573 | 1940, 1960, 1982, 1991, 1994, 1996, 2001, 2009-2012, 2016, 2018 | $ | — | ||||||||||||||||||||||||||||||||||||||||||||||
| Great Plains Correctional Facility | Correctional Facility | Hinton, OK | $ | 463 | $ | 76,580 | $ | 13,915 | $ | 1,305 | $ | 88,272 | $ | — | $ | 1,381 | $ | 90,958 | $ | 14,686 | 1990-1992, 1995, 2008, 2011, 2013, 2015, CIP | $ | 76,272 | Correctional Facility | Hinton, OK | $ | 463 | $ | 76,580 | $ | 15,232 | $ | 2,220 | $ | 89,921 | $ | — | $ | 134 | $ | 92,275 | $ | 17,132 | 1990-1992, 1995, 2008, 2011, 2013, 2015, 2018 | $ | 75,143 | ||||||||||||||||||||||||||||||||||||||||||||||
| Joe Corley Detention Facility | Detention Facility | Conroe, TX | $ | 470 | $ | 64,813 | $ | 6,773 | $ | 598 | $ | 69,513 | $ | — | $ | 1,945 | $ | 72,056 | $ | 7,489 | 2008, 2017, CIP | $ | 64,567 | Detention Facility | Conroe, TX | $ | 470 | $ | 64,813 | $ | 7,391 | $ | 598 | $ | 72,052 | $ | — | $ | 24 | $ | 72,674 | $ | 9,385 | 2008, 2017, 2018 | $ | 63,289 | ||||||||||||||||||||||||||||||||||||||||||||||
| Karnes Correctional Center | Correctional Facility | Karnes City, TX | $ | 937 | $ | 24,825 | $ | 1,734 | $ | 912 | $ | 26,408 | $ | 176 | $ | — | $ | 27,496 | $ | 7,243 | 1995 | $ | 20,253 | Correctional Facility | Karnes City, TX | $ | 937 | $ | 24,825 | $ | 2,148 | $ | 912 | $ | 26,822 | $ | 176 | $ | — | $ | 27,910 | $ | 7,813 | 1995 | $ | 20,097 | ||||||||||||||||||||||||||||||||||||||||||||||
| Karnes County Residential Center | Detention Facility | Karnes City, TX | $ | — | $ | 29,052 | $ | 30,085 | $ | 47 | $ | 59,090 | $ | — | $ | — | $ | 59,137 | $ | 5,425 | 2011/2012, 2014, 2015 | $ | 53,712 | Detention Facility | Karnes City, TX | $ | — | $ | 29,052 | $ | 30,122 | $ | 47 | $ | 59,127 | $ | — | $ | — | $ | 59,174 | $ | 6,782 | 2011/2012, 2014, 2015 | $ | — | ||||||||||||||||||||||||||||||||||||||||||||||
| Lawton Correctional Facility | Correctional Facility | Lawton, OK | $ | 1,012 | $ | 96,637 | $ | 11,710 | $ | 1,073 | $ | 106,705 | $ | — | $ | 1,581 | $ | 109,359 | $ | 23,796 | 1998/1999, 2005/2006, 2015 | $ | 85,563 | Correctional Facility | Lawton, OK | $ | 1,012 | $ | 96,637 | $ | 13,078 | $ | 1,073 | $ | 107,084 | $ | — | $ | 2,570 | $ | 110,727 | $ | 25,974 | 1998/1999, 2005/2006, 2015 | $ | 84,753 | ||||||||||||||||||||||||||||||||||||||||||||||
| Rio Grande Detention Center | Detention Facility | Laredo, TX | $ | 8,365 | $ | 81,178 | $ | 1,301 | $ | 6,266 | $ | 82,428 | $ | 2,099 | $ | 51 | $ | 90,844 | $ | 15,754 | 2007, 2008 | $ | 75,090 | Detention Facility | Laredo, TX | $ | 8,365 | $ | 81,178 | $ | 1,410 | $ | 6,266 | $ | 82,536 | $ | 2,099 | $ | 52 | $ | 90,953 | $ | 17,434 | 2007, 2008 | $ | 73,519 | ||||||||||||||||||||||||||||||||||||||||||||||
| South Texas Detention Complex | Detention Facility | Pearsall, TX | $ | 437 | $ | 31,405 | $ | 6,052 | $ | 437 | $ | 37,081 | $ | — | $ | 376 | $ | 37,894 | $ | 9,668 | 2004/2005, 2012, CIP | $ | — | Detention Facility | Pearsall, TX | $ | 437 | $ | 31,405 | $ | 6,088 | $ | 437 | $ | 37,493 | $ | — | $ | — | $ | 37,930 | $ | 10,537 | 2004/2005, 2012 | $ | — | ||||||||||||||||||||||||||||||||||||||||||||||
| Val Verde Correctional Facility | Correctional Facility | Del Rio, TX | $ | 21 | $ | 56,009 | $ | 1,356 | $ | 16 | $ | 57,365 | $ | 5 | $ | — | $ | 57,386 | $ | 15,330 | 2000/2001, 2005, 2007 | $ | 42,056 | Correctional Facility | Del Rio, TX | $ | 21 | $ | 56,009 | $ | 1,396 | $ | 16 | $ | 57,405 | $ | 5 | $ | — | $ | 57,426 | $ | 16,575 | 2000/2001, 2005, 2007 | $ | 40,851 | ||||||||||||||||||||||||||||||||||||||||||||||
| Adelanto Detention Facility | Detention Facility | Adelanto, CA | $ | 8,005 | $ | 113,255 | $ | 43,007 | $ | 10,278 | $ | 153,989 | $ | — | $ | — | $ | 164,267 | $ | 16,529 | 1990/1991, 2011, 2012, 2015 | $ | 147,738 | Detention Facility | Adelanto, CA | $ | 8,005 | $ | 113,255 | $ | 43,057 | $ | 10,278 | $ | 153,989 | $ | — | $ | 50 | $ | 164,317 | $ | 19,985 | 1990/1991, 2011, 2012, 2015 | $ | 144,332 | ||||||||||||||||||||||||||||||||||||||||||||||
| Aurora/ICE Processing Center | Detention Facility | Aurora, CO | $ | 4,590 | $ | 15,200 | $ | 75,145 | $ | 4,271 | $ | 89,354 | $ | 1,310 | $ | — | $ | 94,935 | $ | 15,641 | 1987, 1993, 1998, 2009, 2010, 2011, 2017 | $ | 79,294 | Detention Facility | Aurora, CO | $ | 4,590 | $ | 15,200 | $ | 75,170 | $ | 4,278 | $ | 89,372 | $ | 1,310 | $ | — | $ | 94,960 | $ | 17,708 | 1987, 1993, 1998, 2009, 2010, 2011, 2017 | $ | 77,252 | ||||||||||||||||||||||||||||||||||||||||||||||
| Central Valley MCCF | Correctional Facility | Mc Farland, CA | $ | 1,055 | $ | 28,133 | $ | 2,829 | $ | 906 | $ | 30,900 | $ | 211 | $ | — | $ | 32,017 | $ | 8,301 | 1997, 2009/2010 | $ | 23,716 | Correctional Facility | Mc Farland, CA | $ | 1,055 | $ | 28,133 | $ | 2,879 | $ | 906 | $ | 30,950 | $ | 211 | $ | — | $ | 32,067 | $ | 9,105 | 1997, 2009/2010 | $ | 22,962 | ||||||||||||||||||||||||||||||||||||||||||||||
| Desert View MCCF | Correctional Facility | Adelanto, CA | $ | 1,245 | $ | 27,943 | $ | 4,459 | $ | 1,245 | $ | 32,400 | $ | — | $ | 2 | $ | 33,647 | $ | 9,417 | 1997, 2010, 2013 | $ | 24,230 | Correctional Facility | Adelanto, CA | $ | 1,245 | $ | 27,943 | $ | 4,472 | $ | 1,245 | $ | 32,415 | $ | — | $ | — | $ | 33,660 | $ | 10,445 | 1997, 2010, 2013 | $ | 23,215 | ||||||||||||||||||||||||||||||||||||||||||||||
| Golden State MCCF | Correctional Facility | Mc Farland, CA | $ | 1,264 | $ | 27,924 | $ | 2,481 | $ | 1,073 | $ | 30,343 | $ | 253 | $ | — | $ | 31,669 | $ | 8,043 | 1997, 2010 | $ | 23,626 | |||||||||||||||||||||||||||||||||||||||||||||||||||||||||||||||||||||
| Original | Gross Cost at December 31, 2017 | Original | Gross Cost at December 31, 2018 | |||||||||||||||||||||||||||||||||||||||||||||||||||||||||||||||||||||||||||||||||||||||||
Property Name (1) | Type | Location | Land | Building and Improvements | Costs Capitalized Subsequent to Acquisition (2) | Land and Improvements | Building and Improvements | Land Held for Development | Development and Construction in Progress | Total | Accumulated Depreciation | Year(s) Built/ Renovated | Book Value of Mortgaged Properties | Type | Location | Land | Building and Improvements | Costs Capitalized Subsequent to Acquisition (2) | Land and Improvements | Building and Improvements | Land Held for Development | Development and Construction in Progress | Total | Accumulated Depreciation | Year(s) Built/ Renovated | Book Value of Mortgaged Properties | ||||||||||||||||||||||||||||||||||||||||||||||||||||||||||||||||||
| Golden State MCCF | Correctional Facility | Mc Farland, CA | $ | 1,264 | $ | 27,924 | $ | 2,535 | $ | 1,072 | $ | 30,398 | $ | 253 | $ | — | $ | 31,723 | $ | 8,783 | 1997, 2010 | $ | 22,940 | |||||||||||||||||||||||||||||||||||||||||||||||||||||||||||||||||||||
| Guadalupe County Correctional Facility | Correctional Facility | Santa Rosa, NM | $ | 181 | $ | 29,732 | $ | 931 | $ | 27 | $ | 30,663 | $ | 154 | $ | — | $ | 30,844 | $ | 11,336 | 1998/1999, 2008 | $ | 19,508 | Correctional Facility | Santa Rosa, NM | $ | 181 | $ | 29,732 | $ | 1,073 | $ | 27 | $ | 30,712 | $ | 154 | $ | 93 | $ | 30,986 | $ | 11,999 | 1998/1999, 2008 | $ | 18,987 | ||||||||||||||||||||||||||||||||||||||||||||||
| Hudson Correctional Facility | Correctional Facility | Hudson, CO | $ | 11,140 | $ | — | $ | 4,599 | $ | 7,372 | $ | 4,447 | $ | 3,920 | $ | — | $ | 15,739 | $ | 4,705 | 2009, 2011 | $ | — | Correctional Facility | Hudson, CO | $ | 11,140 | $ | — | $ | 4,599 | $ | 7,372 | $ | 4,447 | $ | 3,920 | $ | — | $ | 15,739 | $ | 5,343 | 2009, 2011 | $ | — | ||||||||||||||||||||||||||||||||||||||||||||||
| Lea County Correctional Facility (3) | Correctional Facility | Hobbs, NM | $ | 347 | $ | 67,933 | $ | 2,631 | $ | — | $ | 70,564 | $ | 347 | $ | — | $ | 70,911 | $ | 17,595 | 1997/1998, 2017 | $ | — | Correctional Facility | Hobbs, NM | $ | 347 | $ | 67,933 | $ | 2,514 | $ | — | $ | 70,401 | $ | 347 | $ | 46 | $ | 70,794 | $ | 18,798 | 1997/1998, 2017 | $ | — | ||||||||||||||||||||||||||||||||||||||||||||||
| McFarland CCF | Correctional Facility | Mc Farland, CA | $ | 914 | $ | 9,019 | $ | 9,078 | $ | 2,036 | $ | 16,684 | $ | 183 | $ | 108 | $ | 19,011 | $ | 4,694 | 1988, 2011, 2014 | $ | — | Correctional Facility | Mc Farland, CA | $ | 914 | $ | 9,019 | $ | 8,996 | $ | 2,036 | $ | 16,710 | $ | 183 | $ | — | $ | 18,929 | $ | 5,411 | 1988, 2011, 2014 | $ | — | ||||||||||||||||||||||||||||||||||||||||||||||
| Mesa Verde CCF | Correctional Facility | Bakersfield, CA | $ | 2,237 | $ | 13,714 | $ | 12,091 | $ | 2,237 | $ | 25,720 | $ | — | $ | 85 | $ | 28,042 | $ | 4,105 | 1989, 2011, 2015 | $ | — | Correctional Facility | Bakersfield, CA | $ | 2,237 | $ | 13,714 | $ | 15,277 | $ | 2,237 | $ | 25,813 | $ | 2,881 | $ | 297 | $ | 31,228 | $ | 4,699 | 1989, 2011, 2015 | $ | — | ||||||||||||||||||||||||||||||||||||||||||||||
| Northwest Detention Center | Detention Facility | Tacoma, WA | $ | 3,916 | $ | 39,000 | $ | 50,014 | $ | 4,542 | $ | 86,334 | $ | 2,004 | $ | 50 | $ | 92,930 | $ | 19,300 | 2003/2004, 2009, 2010, 2012 | $ | — | Detention Facility | Tacoma, WA | $ | 3,916 | $ | 39,000 | $ | 50,599 | $ | 6,546 | $ | 86,969 | $ | — | $ | — | $ | 93,515 | $ | 21,287 | 2003/2004, 2009, 2010, 2012 | $ | — | ||||||||||||||||||||||||||||||||||||||||||||||
Western Region Detention Facility | Detention Facility | San Diego, CA | $ | — | $ | 28,071 | $ | 1,307 | $ | — | $ | 29,378 | $ | — | $ | — | $ | 29,378 | $ | 29,213 | 1959-1961, 2000 | $ | — | Detention Facility | San Diego, CA | $ | — | $ | 28,071 | $ | 1,324 | $ | — | $ | 29,395 | $ | — | $ | — | $ | 29,395 | $ | 29,353 | 1959-1961, 2000 | $ | — | ||||||||||||||||||||||||||||||||||||||||||||||
| Delaney Hall | Detention Facility | Newark, NJ | $ | 3,759 | $ | 22,502 | $ | 13,175 | $ | 3,779 | $ | 35,651 | $ | — | $ | 6 | $ | 39,436 | $ | 9,416 | 1999/2000, 2008 | $ | — | |||||||||||||||||||||||||||||||||||||||||||||||||||||||||||||||||||||
Brooks County Detention Center | Detention Facility | Falfurrias, TX | $ | 410 | $ | 18,940 | $ | 652 | $ | 414 | $ | 19,508 | $ | — | $ | 80 | $ | 20,002 | $ | 1,459 | 2001, 2011 | $ | — | Detention Facility | Falfurrias, TX | $ | 410 | $ | 18,940 | $ | 670 | $ | 414 | $ | 19,517 | $ | — | $ | 89 | $ | 20,020 | $ | 2,004 | 2001, 2011 | $ | — | ||||||||||||||||||||||||||||||||||||||||||||||
| East Hidalgo Detention Center | Detention Facility | LaVilla, TX | $ | 460 | $ | 28,010 | $ | 543 | $ | 502 | $ | 28,485 | $ | — | $ | 26 | $ | 29,013 | $ | 1,894 | 2001, 2002, 2004, 2005, 2007, 2011 | $ | — | Detention Facility | LaVilla, TX | $ | 460 | $ | 28,010 | $ | 3,922 | $ | 523 | $ | 28,616 | $ | — | $ | 3,253 | $ | 32,392 | $ | 2,599 | 2001, 2002, 2004, 2005, 2007, 2011, CIP | $ | — | ||||||||||||||||||||||||||||||||||||||||||||||
| Perry County Correctional Center | Correctional Facility | Uniontown, AL | $ | 400 | $ | 12,880 | $ | 392 | $ | 400 | $ | 13,272 | $ | — | $ | — | $ | 13,672 | $ | 971 | 2006 | $ | — | Correctional Facility | Uniontown, AL | $ | 400 | $ | 12,880 | $ | 393 | $ | 400 | $ | 13,273 | $ | — | $ | — | $ | 13,673 | $ | 1,362 | 2006 | $ | — | ||||||||||||||||||||||||||||||||||||||||||||||
| Pine Prairie Correctional Center | Correctional Facility | Pine Prairie, LA | $ | 260 | $ | 11,910 | $ | 4,675 | $ | 706 | $ | 13,003 | $ | 477 | $ | 2,659 | $ | 16,845 | $ | 1,161 | 1999, 2008, CIP | $ | — | Correctional Facility | Pine Prairie, LA | $ | 260 | $ | 11,910 | $ | 5,661 | $ | 713 | $ | 16,641 | $ | 477 | $ | — | $ | 17,831 | $ | 1,809 | 1999, 2008, 2018 | $ | — | ||||||||||||||||||||||||||||||||||||||||||||||
| South Louisiana Correctional Center | Correctional Facility | Basile, LA | $ | 290 | $ | 13,040 | $ | 15,174 | $ | 290 | $ | 28,214 | $ | — | $ | — | $ | 28,504 | $ | 1,197 | 1993, 1994, 1996, 1998-1999, 2000 -2001, 2010-2011, 2017 | $ | — | Correctional Facility | Basile, LA | $ | 290 | $ | 13,040 | $ | 15,213 | $ | 290 | $ | 28,253 | $ | — | $ | — | $ | 28,543 | $ | 2,077 | 1993, 1994, 1996, 1998-1999, 2000- 2001, 2010-2011, 2017 | $ | — | ||||||||||||||||||||||||||||||||||||||||||||||
| J. B. Evans Correctional Center | Correctional Facility | Newellton, LA | $ | 30 | $ | 720 | $ | — | $ | 30 | $ | 720 | $ | — | $ | — | $ | 750 | $ | 146 | 1994, 1996 | $ | — | Correctional Facility | Newellton, LA | $ | 30 | $ | 720 | $ | — | $ | 30 | $ | 720 | $ | — | $ | — | $ | 750 | $ | 194 | 1994, 1996 | $ | — | ||||||||||||||||||||||||||||||||||||||||||||||
| Coastal Bend Detention Center | Detention Facility | Robstown, TX | $ | 1,330 | $ | 26,820 | $ | 946 | $ | 1,349 | $ | 27,747 | $ | — | $ | — | $ | 29,096 | $ | 2,909 | 2008, 2009 | $ | — | |||||||||||||||||||||||||||||||||||||||||||||||||||||||||||||||||||||