0001059556mco:TwoThousandSeventeenFiveYearPrivatePlacementDueTwoThosandTwentyThreeMember2020-12-31
SECURITIES AND EXCHANGE COMMISSION
☑ANNUAL REPORT PURSUANT TO SECTION 13 OR 15(d) OF THE SECURITIES EXCHANGE ACT OF 1934 FOR THE FISCAL YEAR ENDED
DECEMBERDecember 31,
20172021
☐
TRANSITION REPORT PURSUANT TO SECTION 13 OR 15(d) OF THE SECURITIES EXCHANGE ACT OF 1934FOR THE TRANSITION PERIOD FROM TO .
COMMISSION FILE NUMBER
1-14037(EXACT NAME OF REGISTRANT AS SPECIFIED IN ITS CHARTER) | | | | | |
DELAWAREDelaware | | 13-3998945 |
| (STATE OF INCORPORATION) | | (I.R.S. EMPLOYER IDENTIFICATION NO.) |
7 World Trade Center at 250 Greenwich Street,
NEW YORK, NEW YORKNew York, New York 10007
(ADDRESS OF PRINCIPAL EXECUTIVE OFFICES)
REGISTRANT’S TELEPHONE NUMBER, INCLUDING AREA CODE:
(212) 553-0300.SECURITIES REGISTERED PURSUANT TO SECTION 12(b) OF THE ACT:
| | | | | | | | | | | | | | | | |
| TITLE OF EACH CLASS | | | | TRADING SYMBOL(S) | | NAME OF EACH EXCHANGE ON WHICH REGISTERED |
COMMON STOCK, PAR VALUE $.01 PER SHARECommon Stock, par value $0.01 per share | | NEW YORK STOCK EXCHANGE | | MCO | | New York Stock Exchange |
1.75% SENIOR NOTES DUESenior Notes Due 2027 | | NEW YORK STOCK EXCHANGE | | MCO 27 | | New York Stock Exchange |
| 0.950% Senior Notes Due 2030 | | | | MCO 30 | | New York Stock Exchange |
SECURITIES REGISTERED PURSUANT TO SECTION 12(g) OF THE ACT:
Indicate by check mark if the registrant is a well-known seasoned issuer, as defined in Rule 405 of the Securities Act. Yes
☑ No
☐Indicate by check mark if the registrant is not required to file reports pursuant to Section 13 or Section 15(d) of the Act. Yes
☐ No
☑Indicate by check mark whether the registrant (1) has filed all reports required to be filed by Section 13 or 15(d) of the Securities Exchange Act of 1934 during the preceding 12 months (or for such shorter period that the registrant was required to file such reports), and (2) has been subject to such filing requirements for the past 90 days. Yes
☑ No
☐Indicate by check mark whether the registrant has submitted electronically
and posted on its corporate Web site, if any, every Interactive Data File required to be submitted
and posted pursuant to Rule 405 of Regulation
S-T (§232.405 of this chapter) during the preceding 12 months (or for such shorter period that the registrant was required to submit
and post such files). Yes
☑ No
☐Indicate by check mark if disclosure of delinquent filers pursuant to Item 405 of Regulation S-K (§ 229.405 of this chapter) is not contained herein, and will not be contained, to the best of registrant’s knowledge, in definitive proxy or information statements incorporated by reference in Part III of this Form 10-K or any amendment to this Form 10-K. ☐
Indicate by check mark whether the registrant is a large accelerated filer, an accelerated filer, a non-accelerated filer, a smaller reporting company, or emerging growth company. See the definitions of “large accelerated filer,” “accelerated filer,” “smaller reporting company,” and “emerging growth company” in Rule 12b-2 of the Exchange Act.
Large Accelerated Filer ☑ Accelerated Filer ☐Non-accelerated Filer ☐ Smaller reporting company ☐ Emerging growth company☐
| | | | | | | | | | | | | | | | | | | | | | | |
| Large Accelerated Filer | ☑ | Accelerated Filer ☐ | Non-accelerated Filer ☐ | Smaller reporting company | ☐ | Emerging growth company | ☐ |
If an emerging growth company, indicate by check mark if the
Registrantregistrant has elected not to use the extended transition period for complying with any new or revised financial accounting standards
provided pursuant to Section 13(a) of the Exchange Act.
☐Indicate by check mark whether the registrant has filed a report on and attestation to its management’s assessment of the effectiveness of its internal control over financial reporting under Section 404(b) of the Sarbanes-Oxley Act (15 U.S.C.7262(b)) by the registered public accounting firm that prepared or issued its audit report. ☑
Indicate by check mark whether the registrant is a shell company (as defined in Rule
12b-2 of the Act). Yes
☐ No
☑The aggregate market value of Moody’s Corporation Common Stock held by nonaffiliates* on June 30,
20172021 (based upon its closing transaction price on the
Composite TapeNew York Stock Exchange on such date) was approximately
$23.0$68 billion.
As of January 31,
2018, 191.12022, 185.2 million shares of Common Stock of Moody’s Corporation were outstanding.
DOCUMENTS INCORPORATED BY REFERENCE
Portions of the Registrant’s definitive proxy statement for use in connection with its annual meeting of stockholders scheduled to be held on April
24, 2018,26, 2022, are incorporated by reference into Part III of this Form
10-K.The Index to Exhibits is included as Part IV, Item 15(3) of this Form
10-K.*Calculated by excluding all shares held by executive officers and directors of the Registrant without conceding that all such persons are “affiliates” of the Registrant for purposes of federal securities laws.
** | Calculated by excluding all shares held by executive officers and directors of the Registrant without conceding that all such persons are “affiliates” of the Registrant for purposes of federal securities laws. | | | | | | | | | | | | | | | | |
| Auditor Name: | KPMG LLP | Auditor Location: | New York, NY | Auditor Firm ID: | 185 |
MOODY’S CORPORATION
INDEX TO FORM 10-K | | | | | | | | | | | |
| | MOODY’S 2017 10-KPage(s) |
| | | |
|
| Item 1. | | | |
MOODY’S CORPORATION
INDEX TO FORM10-K
| | | | | | | | | | | |
2 | | MOODY’S 2017 10-K | | | Page(s) |
| Item 9A. | |
| | |
| Item 9B. | | | |
| Item 9C. | | | |
| | Page(s) | |
| | |
| | PART III.
| | | | |
| Item 10. | | | | | 118 | |
| Item 11. | | | | | 118 | |
| Item 12. | | | | | 118 | |
| Item 13. | | | | | 118 | |
| Item 14. | | | | | 118 | |
| | |
| | PART IV.
| | | | |
| Item 15. | | | | | 119 | |
| |
SIGNATURES | | | 120 | |
| |
INDEX TO EXHIBITS | | | 121-124 | |
| | | | |
| | |
Exhibits
filed Herewith
| | |
10.2.1 | | 1998 Moody’s CorporationNon-Employee Directors’ Stock Incentive Plan (Adopted September 8, 2000; Amended and Restated as of December 11, 2012, October 20, 2015, December 14, 2015 and December 18, 2017) |
10.2.3 | | Form of Non-Employee Director Restricted Stock Unit Grant Agreement (for awards after 2017) for the 1998 Moody’s Corporation Non-Employee Directors’ Stock Incentive Plan (Adopted September 8, 2000; Amended and Restated as of December 11, 2012, October 20, 2015, December 14, 2015 and December 18, 2017) |
10.4.1 | | Amended and Restated 2001 Moody’s Corporation Key Employees’ Stock Incentive Plan (as amended, December 18, 2017) |
10.4.6 | | Form of Performance Share Award Letter (for awards granted after 2017) for the Amended and Restated 2001 Moody’s Corporation Key Employees’ Stock Incentive Plan. |
10.10 | | Moody’s Corporation Change in Control Severance Plan (as amended December 18, 2017). |
12 | | Statement of Computation of Ratios of Earnings to Fixed Charges |
21 | | SUBSIDIARIES OF THE REGISTRANT |
23.1 | | CONSENT OF INDEPENDENT REGISTERED PUBLIC ACCOUNTING FIRM |
31.1 | | Chief Executive Officer Certification Pursuant to Section 302 of the Sarbanes-Oxley Act of 2002 |
31.2 | | Chief Financial Officer Certification Pursuant to Section 302 of the Sarbanes-Oxley Act of 2002 |
32.1 | | Chief Executive Officer Certification Pursuant to Section 906 of the Sarbanes-Oxley Act of 2002 |
32.2 | | Chief Financial Officer Certification Pursuant to Section 906 of the Sarbanes-Oxley Act of 2002 |
101.DEF | | XBRL Definitions Linkbase Document |
101.INS | | XBRL Instance Document |
101.SCH | | XBRL Taxonomy Extension Schema Document |
101. CAL | | XBRL Taxonomy Extension Calculation Linkbase Document |
101.LAB | | XBRL Taxonomy Extension Labels Linkbase Document |
101.PRE | | XBRL Taxonomy Extension Presentation Linkbase Document |
GLOSSARY OF TERMS AND ABBREVIATIONS
The following terms, abbreviations and acronyms are used to identify frequently used terms in this report: | | | | | | | | |
| TERM | | DEFINITION |
| | |
TERM
| | DEFINITION
|
| | |
Acquisition-Related AmortizationAcquire Media (AM) | | An aggregator and distributor of curated real-time news, multimedia, data, and alerts; acquired by the Company on October 21, 2020 |
| | |
| Acquisition-Related Amortization | | Amortization of acquired definite-lived intangible assets acquired by the Company from all business combination transactions |
| | |
| Acquisition-Related Expenses | | Consists of expenses incurred over a multi-year period to complete and integrate the acquisition of Bureau van Dijk for which the integration will be a multi-year effort |
| | |
| Adjusted Diluted EPS | | Diluted EPS excluding the impact of certain items as detailed in Item 7 in the section entitled“Non-GAAP “Non-GAAP Financial Measures” |
| | |
| Adjusted Net Income | | Net Income excluding the impact of certain items as detailed in Item 7 in the section entitled“Non-GAAP “Non-GAAP Financial Measures” |
| | |
| Adjusted Operating Income | | Operating income excluding the impact of certain items as detailed in Item 7 in the section entitled“Non-GAAP "Non-GAAP Financial Measures”Measures" |
| | |
| Adjusted Operating Margin | | Adjusted Operating Income divided by revenue |
| | |
| Americas | | Represents countries within North and South America, excluding the U.S. |
| | |
AOCIAML | | Anti-money laundering |
| | |
| AOCI(L) | | Accumulated other comprehensive income (loss); a separate component of shareholders’ (deficit) equity |
| | |
ASC | | |
| | |
| ASC | | The FASB Accounting Standards Codification; the sole source of authoritative GAAP as of July 1, 2009 except for rules and interpretive releases of the SEC, which are also sources of authoritative GAAP for SEC registrants |
| | |
| Asia-Pacific | | Represents Australia and countries in Asia including but not limited to: Australia, China, India, Indonesia, Japan, Korea, Malaysia, Singapore, Sri Lanka and Thailand |
| | |
ASUASR | | Accelerated Share Repurchase |
| | |
| ASU | | The FASB Accounting Standards Update to the ASC. It also provides background information for accounting guidance and the bases for conclusions on the changes in the ASC. ASUs are not considered authoritative until codified into the ASC |
| |
Basel II | | Capital adequacy framework published in June 2004 by the Basel Committee on Banking Supervision |
| |
Basel IIIB&H | | A new global regulatory standard on bank capital adequacy and liquidity agreed by the membersBarrie & Hibbert Limited, an acquisition completed in December 2011; part of the Basel Committee on Banking Supervision. Basel III was developed in a response to the deficiencies in financial regulation revealed by the global financial crisis. Basel III strengthens bank capital requirements and introduces new regulatory requirements on bank liquidity and bank leverage |
| |
BlackBox | | BlackBox Logic;MA segment, a leading provider of Residential Mortgage-Backed securities loan level data. The Company acquired the customer base and products of BlackBox Logic in December 2015risk management modeling tools for insurance companies worldwide |
| | |
| Board | | The board of directors of the Company |
| | |
| BPS | | Basis points |
| | |
| Brexit | | The withdrawal of the United Kingdom from the European Union |
| | |
| Bureau van Dijk | | Bureau van Dijk Electronic Publishing, B.V.,; a global provider of business intelligence and company information; acquired by the companyCompany on August 10, 2017 via the acquisition of yellowYellow Maple I B.V., an indirect parent of Bureau van DijkDijk; part of the RD&A LOB |
| | |
CCARBitSight | | Comprehensive Capital AnalysisA provider of cybersecurity ratings, analytics, and Review; annual review by the Federal Reserveperformance management tools; Moody's acquired a minority investment in the U.S. to ensure that financial institutions have sufficient capitalBitSight in times of economic and financial stress and that they have robust, forward-looking capital-planning processes that account for their unique risks.2021 |
| | |
CCXICatylist | | A provider of commercial real estate (CRE) solutions for brokers; acquired by the Company on December 30, 2020 |
| | |
| CCXI | | China ChenCheng Xin International Credit Rating Co. Ltd.; China’s first and largest domestic credit rating agency approved by the People’s Bank of China; the Company acquired a 49% interest in 2006; currently Moody’s owns 30% of CCXI |
| | |
CCXI Gain | | In |
| CDP | | A not-for-profit charity that runs the first quarter of 2017 CCXI, as a part of a strategic business realignment, issued additional capitalglobal disclosure system for investors, companies, cities, states and regions to its majority shareholder in exchange for a ratings business wholly-owned by the majority shareholder and which has the right to rate a different class of debt instruments in the Chinese market. The capital issuance by CCXI in exchange for the ratings business diluted Moody’s ownership interest in CCXI to 30% of a larger business and resulted in a $59.7 millionnon-cash,non-taxable gainmanage their environmental impacts |
| | |
| | | | | | | | |
4 | | MOODY’S 2017 10-K | TERM | | | DEFINITION |
| | |
TERM
CFG | | DEFINITION
|
CFG
| | Corporate finance group; an LOB of MIS |
| | |
| CLO | | Collateralized loan obligation |
| | |
| CMBS | | Commercial mortgage-backed securities; part of the CREFan asset class within SFG |
| | |
CommissionCOLI | | European CommissionCorporate-Owned Life Insurance |
| | |
| Commission | | European Commission |
| | |
| Common Stock | | The Company’s common stock |
| | |
| Company | | Moody’s Corporation and its subsidiaries; MCO; Moody’s |
| | |
CopalContent | | Copal Partners; an acquisition completed in November 2011; partPrior to the second quarter of 2021, was a reporting unit within the MA segment; leading provider of offshoresegment that offered subscription-based research, data and analytical products, including credit ratings produced by MIS, credit research, quantitative credit scores and other analytical tools, economic research and analytical services to institutional investorsforecasts |
| | |
CouncilCortera | | CouncilA provider of North American credit data and workflow solutions; acquired by the European UnionCompany in March 2021 |
| | |
CPCOVID-19 | | Commercial paperAn outbreak of a novel strain of coronavirus resulting in an international public health crisis and a global pandemic |
| | |
| CP | | Commercial Paper |
| | |
| CP Notes | | Unsecured commercial paper issued under the CP Program |
| | |
| CP Program | | A program entered into on August 3, 2016 allowing the Company to privately place CP up to a maximum of $1 billion for which the maturity may not exceed 397 days from the date of issue.issue, and which is backstopped by the 2021 Facility. |
| | |
| CRAs | | Credit rating agencies |
| | |
CREFCRE | | Commercial real estate finance, which includes REITs, commercial real estate CDOs and mortgage-backed securities; part of SFGReal Estate |
| | |
CSIDBPPs | | CSI Global Education, Inc.; an acquisition completed in November 2010; part of the PS LOB and FSTC reporting unit within the MA segment; a provider of financial learning, credentials, and certification services primarily in CanadaDefined benefit pension plans |
| | |
CSPPDodd-Frank Act | | Corporate Sector Purchase Programme; quantitative easing program implemented by the ECB. This program allows the central bank to purchase bonds issued by European companies, as well as provide access to the secondary bond market in which existing corporate bonds tradeDodd-Frank Wall Street Reform and Consumer Protection Act |
| |
D&A | | Depreciation and amortization |
| |
DBPPsEBITDA | | Defined benefit pension plans |
| |
DBRS | | Dominion Bond Rating Service |
| |
DCF | | Discounted cash flow; a fair value calculation methodology whereby future projected cash flows are discounted back to their present value |
| |
Debt/EBITDA | | Ratio of Total Debt to EBITDA |
| |
Directors’ Plan | | The 1998 Moody’s CorporationNon-Employee Directors’ Stock Incentive Plan |
| |
Distribution Date | | September 30, 2000; the date which Old D&B separated into two publicly traded companies—Moody’s Corporation and New D&B |
| |
DOJ | | U.S. Department of Justice |
| |
E&P | | Earnings and profits |
| |
EBITDA | | Earnings before interest, taxes, depreciation and amortization |
| |
ECB | | European Central Bank |
| |
ECCA | | Economics and Consumer Credit Analytics; a business within the RD&A LOB which provides economic and consumer credit trend analytics |
| | | | | | |
| | MOODY’S 2017 10-K |
| EEO-1 | | | 5 | Data filing required by the U.S. Equal Employment Opportunity Commission that requires all private sector employers with 100 or more employees, and federal contractors with 50 or more employees meeting certain criteria, to submit demographic workforce data, including data by race/ethnicity, sex and job categories |
| | |
TERM
EMEA | | DEFINITION
|
| |
EMEA
| | Represents countries within Europe, the Middle East and Africa |
| | |
| EPS | | Earnings per share |
| |
Equilibrium | | A leading provider of credit rating and research services in Peru and Panama; acquired by Moody’s in May 2015 |
| |
| ERS | | The enterprise risk solutionsEnterprise Risk Solutions; an LOB within MA, which offers risk management software productssolutions as well as software implementation services and related risk management advisory engagements services |
| | |
| ESA | | Economics and Structured Analytics; part of the RD&A line of business within MA |
| | |
| ESG | | Environmental, Social and Governance |
| | |
| ESMA | | European Securities and Markets Authority |
| | |
ESPESPP | | Estimated Selling Price; estimate of selling price, as defined in the ASC, at which the vendor would transact if the deliverable were sold by the vendor regularly on a stand-alone basisEmployee stock purchase plan |
| | |
ESPPETR | | The 1999 Moody’s Corporation Employee Stock Purchase PlanEffective tax rate |
| | |
ETREU | | Effective tax rateEuropean Union |
| | |
EUEUR | | European UnionEuros |
| | |
EUREURIBOR | | EurosThe Euro Interbank Offered Rate |
| | |
European Ratings PlatformEurozone | | Central credit ratings website administered by ESMAMonetary union of the EU member states which have adopted the euro as their common currency |
| | |
| | | | | | | | |
| TERM | | DEFINITION |
| | |
| Excess Tax Benefits | | The difference between the tax benefit realized at exercise of an option or delivery of a restricted share and the tax benefit recorded at the time the option or restricted share is expensed under GAAP |
| | |
| Exchange Act | | The Securities Exchange Act of 1934, as amended |
| | |
FASBExternal Revenue | | Revenue excluding any intersegment amounts |
| | |
| FASB | | Financial Accounting Standards Board |
| | |
FIGFermat | | Fermat International; an acquisition completed in October 2008; part of the MA segment; a provider of risk and performance management software to the global banking industry |
| | |
| FIG | | Financial institutions group; an LOB of MIS |
| |
Fitch | | Fitch Ratings, a part of the Fitch Group |
| |
Financial Reform Act | | Dodd-Frank Wall Street Reform and Consumer Protection Act |
| | |
| Four Twenty Seven | | A provider of data, intelligence, and analysis related to physical climate risks; acquired by the Company in July 2019 |
| | |
| Free Cash Flow | | Net cash provided by operating activities less cash paid for capital additions |
| | |
FSTCFTSE | | Financial Services Training and Certifications; part of the PS LOB and a reporting unit within the MA reportable segment; consists ofon-line and classroom-based training services and CSITimes Stock Exchange |
| | |
| FX | | Foreign exchange |
| | |
| GAAP | | U.S. Generally Accepted Accounting Principles |
| | |
| GBP | | British pounds |
| | |
| GDP | | Gross domestic product |
| | |
GGYGDPR | | Gilliland Gold Young; a leading provider of advanced actuarial software for the global insurance industry. The Company acquired GGY on March 1, 2016; Part of the ERS LOB and reporting unit within the MA reportable segmentEuropean Union’s General Data Protection Regulation |
| | |
| ICRA | | ICRA Limited; a leading provider of credit ratings and research in India. The Company previously held 28.5% equity ownership and in June 2014, increased that ownership stake to just over 50% through the acquisition of additional shares |
| |
ICRA Acquisition | | The June 2014 purchase of an additional interest in ICRA resulting in a majority ownership of ICRA; ICRAs results are consolidated into Moody’s financial statements on a three-month lag and accordingly the Company began including the results of operations for ICRA in its consolidated financial statements beginning in the fourth quarter of 2014 |
| | |
TERM
| | DEFINITION
|
| |
ICRA Gain
| | Gain relating to the ICRA Acquisition; U.S. GAAP requires the remeasurement to fair value of the previously heldnon-controlling shares upon obtaining a controlling interest in a step-acquisition. This remeasurement of the Company’s equity investment in ICRA to fair value resulted in apre-tax gain of $102.8 million ($78.5 million after tax) in the second quarter of 2014
|
| |
ICTEAS | | ICRA Techno Analytics; formerly a wholly-owned subsidiary of ICRA; divested by ICRA in the fourth quarter of 2016 |
| | |
Intellectual PropertyINR | | The Company’s intellectual property, including but not limited to proprietary information, trademarks, research, software tools and applications, models and methodologies, databases, domain names, and other proprietary materialsIndian National Rupee |
| | |
| IRS | | Internal Revenue Service |
| |
IT | | Information technology |
| | |
KIS | | |
| KIS | | Korea Investors Service, Inc;Inc.; a leading Korean rating agency and consolidated subsidiary of the Company |
| | |
| KIS Pricing | | Korea Investors Service Pricing, Inc;Inc.; a leading Korean provider of fixed income securities pricing and consolidated subsidiary of the Company |
| | |
| KIS Research | | Korea Investors Service Research; a Korean provider of financial research and consolidated subsidiary of the Company |
| | |
| Korea | | Republic of South Korea |
| | |
Legacy Tax Matter(s)KYC | | Exposures to certain potential tax liabilities assumed in connection with the Company’sspin-off from Dun & Bradstreet in 2000Know-your-customer |
| | |
LIBOR | | |
| | |
| LIBOR | | London Interbank Offered Rate |
| | |
| LOB | | Line of business |
| |
M&A | | Mergers and acquisitions |
| |
| MA | | Moody’s Analytics—a reportable segment of MCO formed in January 2008MCO; a global provider of: i) data and information; ii) research and insights; and iii) decision solutions, which provides a wide range of productshelp companies make better and services that support financial analysis and risk management activities of institutional participants in global financial markets;faster decisions; consists of threetwo LOBs—RD&A ERS and PSERS |
| | |
| Make Whole Amount | | The prepayment penalty amount relating to the Series 2007-1 Notes, 2010certain Senior Notes, 2012 Senior Notes, 2013 Senior Notes, 2014 Senior Notes (5-year), 2014 Senior Notes (30-year), 2015 Senior Notes, 2017 Senior Notes, 2017 Private Placement Notes Due 2023 and 2028 which is a premium based on the excess, if any, of the discounted value of the remaining scheduled payments over the prepaid principal |
| | |
| MAKS | | Moody’s Analytics Knowledge Services; formerly known as Copal Amba; providesprovided offshore research and analytic services to the global financial and corporate sectors; business was divested in the fourth quarter of 2019 and was formerly part of the PS LOB and a reporting unit within the MA reportable segmentsegment. |
| | |
MCOMALS | | Moody’s Analytics Learning Solutions; prior to the second quarter of 2021, was a reporting unit within the MA segment that offered on-line and classroom-based training services as well as credentialing and certification services |
| | |
| MCO | | Moody’s; Moody’s Corporation and its subsidiaries; the Company; Moody’sCompany |
| | |
| | | | | | | | |
| TERM | | DEFINITION |
| | |
| MD&A | | Management’s Discussion and Analysis of Financial Condition and Results of Operations |
| | |
MIS | | |
| | |
| MIS | | Moody’s Investors Service—a reportable segment of MCO; consists of five LOBs—SFG, CFG, FIG, PPIF and MIS Other |
| | |
| MIS Other | | Consists ofnon-ratings revenue from ICRA, KIS Pricing and KIS Research.Research revenue as well as revenue from providing ESG research, data and assessments. These businesses are components of MIS; MIS Other is an LOB of MIS |
| | |
| Moody’s | | Moody’s Corporation and its subsidiaries; MCO; the Company |
| | |
| Moody's Local | | A ratings platform focused on providing credit rating services in local capital markets |
| | |
| MSS | | Moody's Shared Services; primarily consists of information technology and support staff such as finance, human resources and legal that support both MIS and MA. |
| | |
| NAV | | Net asset value |
| | |
| Net Income | | Net income attributable to Moody’s Corporation, which excludes net income from consolidated noncontrolling interests belonging to the minority interest holder |
| |
New D&B | | The New D&B Corporation—which comprises the D&B business after September 30, 2000 |
| | |
TERM
New Credit Losses Accounting Standard | | DEFINITION
Updates to the ASC pursuant to ASU No. 2016-13, “Financial Instruments—Credit Losses (Topic 326): Measurement of Credit Losses on Financial Instruments”. This new accounting guidance requires the use of an “expected credit loss” impairment model for most financial assets reported at amortized cost, which requires entities to estimate expected credit losses over the lifetime of the instrument. |
| | |
NM
New Lease Accounting Standard | | Updates to the ASC pursuant to ASU No. 2016-02, “Leases (ASC Topic 842)”. This new accounting guidance requires lessees to recognize a right-of-use asset and lease liability on the balance sheet for all leases with terms of more than 12 months. Recognition, measurement and presentation of expenses and cash flows depend on classification as either a finance or operating lease |
| | |
| NM | | Percentage change is not meaningful |
| | |
| Non-GAAP | | A financial measure not in accordance with GAAP; these measures, when read in conjunction with the Company’s reported results, can provide useful supplemental information for investors analyzingperiod-to-period comparisons of the Company’s performance, facilitate comparisons to competitors’ operating results and to provide greater transparency to investors of supplemental information used by management in its financial and operational decision making |
| | |
| NRSRO | | Nationally Recognized Statistical Rating Organization, which is a credit rating agency registered with the SEC. |
| | |
| OCI | | Other comprehensive income (loss); includes gains and losses on cash flow and net investment hedges, unrealized gains and losses on available for sale securities, certain gains and losses relating to pension and other retirement benefit obligations and foreign currency translation adjustments |
| |
Old D&B | | The former Dun and Bradstreet Company which distributed New D&B shares on September 30, 2000, and was renamed Moody’s Corporation |
| | |
| | |
| Operating segment | | Term defined in the ASC relating to segment reporting; the ASC defines an operating segment as a component of a business entity that has each of the three following characteristics: i) the component engages in business activities from which it may recognize revenue and incur expenses; ii) the operating results of the component are regularly reviewed by the entity’s chief operating decision maker; and iii) discrete financial information about the component is available. |
| | |
Other Retirement PlanPlans | | The U.S. retirement healthcare and U.S. retirement life insurance plans |
| | |
PPIFPassFort | | A U.K. SaaS-based workflow platform for identity verification, customer onboarding, and risk analysis; acquired by the Company on November 30, 2021. |
| | |
| PCS | | Post-Contract Customer Support |
| | |
| PPIF | | Public, project and infrastructure finance; an LOB of MIS |
| | |
| Profit Participation Plan | | Defined contribution profit participation plan that covers substantially all U.S. employees of the Company |
| | |
| | | | | | | | |
PSTERM | | DEFINITION |
| | |
| PS | | Professional Services, ana former LOB within MA consistingwhich consisted of MAKS and FSTCMALS that providesprovided offshore researchanalytical and analyticalresearch services as well as financial traininglearning solutions and certification programsprograms. Subsequent to the divestiture of MAKS in 2019, revenue from the MALS reporting unit, which previous to 2020 was reported in the PS LOB, is now reported as part of the RD&A LOB. Prior periods have not been reclassified as the amounts were not material. |
| | |
Purchase Price HedgeRealXData | | Foreign currency collarA provider of CRE lease-level portfolio management with benchmarking and forward contracts enteredrent forecasting capabilities; acquired by the Company to economically hedge the Bureau van Dijk euro denominated purchase pricein September 2021 |
| |
Purchase Price Hedge Gain | | Gain on foreign currency collars to economically hedge the Bureau van Dijk euro denominated purchase price |
| |
| RD&A | | Research, Data and Analytics; an LOB within MA that produces, sells and distributesoffers: subscription based research, data and related content. Includesanalytical products, generatedincluding credit ratings produced by MIS, such as analyses on major debt issuers, industry studies, and commentary on topicalMIS; credit events. Also includes economic research, data,research; quantitative riskcredit scores and other analytical tools that are produced within MAtools; economic research and forecasts; business intelligence and company information productsproducts; commercial real estate data and analytical tools; and on-line and classroom-based training services as well as credentialing and certification services |
| |
Reform Act | | Credit Rating Agency Reform Act of 2006 |
| |
REITRecurring Revenue | | Real Estate Investment Trust |
| |
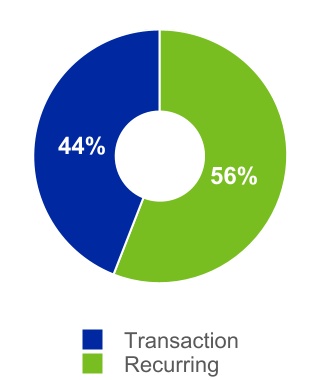
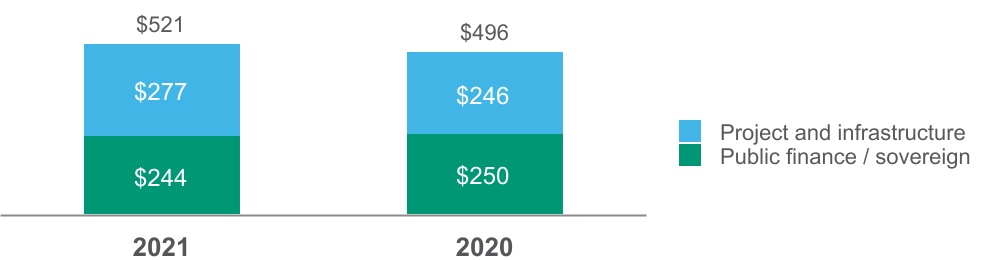
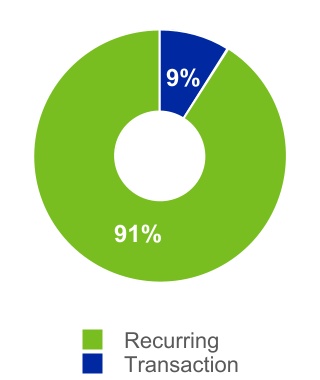
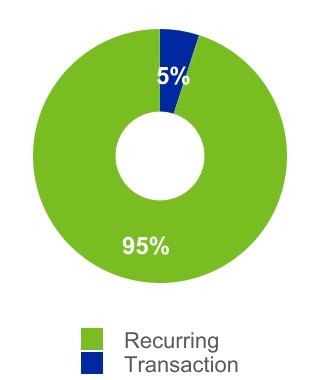
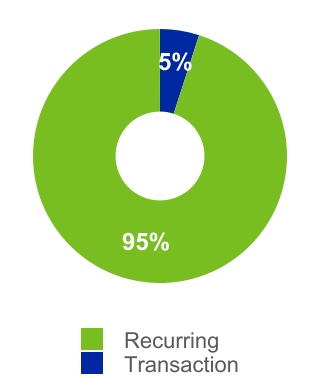
Relationship Revenue | | For MIS, represents recurring monitoring fees of a rated debt obligation and/or entities that issue such obligations, as well as revenue from programs such as commercial paper, medium-term notes and shelf registrations. For MIS Other represents subscription-based revenue. For MA, represents subscription-based licenserevenue and software maintenance revenue |
| | |
| Reform Act | | Credit Rating Agency Reform Act of 2006 |
| | |
| Regulatory Data Corporation (RDC) | | A provider of anti-money laundering (AML) and know-your-customer (KYC) data and due diligence services; the Company acquired RDC in February 2020 |
| | |
| REIT | | Real Estate Investment Trust |
| | |
| Reis, Inc. (Reis) | | A provider of U.S. commercial real estate (CRE) data; acquired by the Company in October 2018; part of the RD&A LOB and prior to the second quarter of 2021 a reporting unit within the MA reportable segment. |
| | |
| Reporting unit | | The level at which Moody’s evaluates its goodwill for impairment under U.S. GAAP; defined as an operating segment or one level below an operating segment |
| | |
| Retirement Plans | | Moody’s funded and unfunded pension plans, the healthcare plans and life insurance plans |
| | |
S&PRevenue Accounting Standard | | S&P Global Ratings,Updates to the ASC pursuant to ASU No. 2014-09, “Revenue from Contracts with Customers (ASC Topic 606)”. This accounting guidance significantly changed the accounting framework under U.S. GAAP relating to revenue recognition and to the accounting for the deferral of incremental costs of obtaining or fulfilling a division of S&P Global Inc.contract with a customer |
| |
SAV | | Structured Analytics and Valuation; a business within the RD&A LOB which provides data and analytics for securitized assets |
| |
SCDM | | SCDM Financial, a leading provider of analytical tools for participants in securitization markets. Moody’s acquired SCDM’s structured finance data and analytics business in February 2017 |
| | |
SECRMBS | | Residential mortgage-backed securities; an asset class within SFG |
| | |
| RMS | | A global provider of climate and natural disaster risk modeling and analytics; acquired by the Company in September 2021 |
| | |
| ROU Asset | | Assets recorded pursuant to the New Lease Accounting Standard which represent the Company’s right to use an underlying asset for the term of a lease |
| | |
| SaaS | | Software-as-a-Service |
| | |
| SEC | | U.S. Securities and Exchange Commission |
| | |
| Securities Act | | Securities Act of 1933, as amended |
| |
Series2007-1 Notes | | Principal amount of $300 million, 6.06% senior unsecured notes due in September 2017 pursuant to the 2007 Agreement; prepaid in March 2017 |
| | |
TERM
SFG | | DEFINITION
|
| |
Settlement Charge
| | Charge of $863.8 million recorded in the fourth quarter of 2016 related to an agreement entered into on January 13, 2017 with the U.S. Department of Justice and the attorneys general of 21 U.S. states and the District of Columbia to resolve pending and potential civil claims related to credit ratings that MIS assigned to certain structured finance instruments in the financial crisis era
|
| |
SFG | | Structured finance group; an LOB of MIS |
| | |
| SG&A | | Selling, general and administrative expenses |
| | |
Solvency IISOFR | | EU directive 2009/138/EC that codifies the amount of capital that EU insurance companies must hold to reduce insolvencySecured Overnight Financing Rate |
| |
Stock Plans | | The Old D&B’s 1998 Key Employees’ Stock Incentive Plan and the Restated 2001 Moody’s Corporation Key Employees’ Stock Incentive Plan |
| | |
| | |
| SSP | | Standalone selling price |
| | |
| T&M | | Time-and-Material |
| | |
| Tax Act | | The “Tax Cuts and Jobs Act” enacted into U.S. law on December 22, 2017, which significantly amends the tax code in the U.S. |
| | |
| TCFD | | Task Force on Climate-Related Financial Disclosures |
| | |
| | | | | | | | |
| TERM | | DEFINITION |
| | |
| Total Debt | | All indebtedness of the Company as reflected on the consolidated balance sheets |
| |
TPE | | Third party evidence, as defined in the ASC, used to determine selling price based on a vendor’s or any competitor’s largely interchangeable products or services in standalone sales transactions to similarly situated customers |
| |
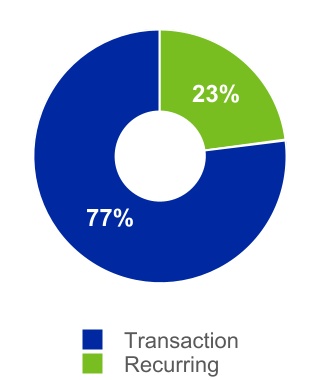
| Transaction Revenue | | For MIS, represents the initial rating of a new debt issuance as well as otherone-time fees. For MIS Other, represents revenue from professional services as well as data services, research and analytical engagements. For MA, represents perpetual software license fees and revenue from software implementation services, risk management advisory projects, training and certification services, and research and analytical engagements |
| | |
| U.K. | | United Kingdom |
| | |
| U.S. | | United States |
| | |
| USD | | U.S. dollar |
| | |
UTBsUTPs | | UnrecognizedUncertain tax benefitspositions |
| | |
UTPsVigeo Eiris (VE) | | Uncertain tax positionsA provider of ESG research, data and assessments; acquired by the Company in April 2019 |
| | |
VSOEVisibleRisk | | Vendor specific objective evidence; as defined in the ASC, evidence of selling price limited to either of the following: the price charged forA cyber risk ratings joint venture created by Moody’s and Team8, a deliverable when it is sold separately, or for a deliverable not yet being sold separately, the price established by management having the relevant authorityglobal venture group |
| | |
| WACC | | Weighted average costAverage Cost of capitalCapital |
| | |
1998 PlanZM Financial Systems (ZMFS) | | Old D&B’s 1998 Key Employees’ Stock Incentive PlanA provider of risk and financial management software for the U.S. banking sector; acquired by the Company in December 2020 |
| | |
2001 Plan2018 Restructuring Program | | The AmendedRestructuring program approved by the chief executive officer of Moody’s on October 26, 2018. This program included relocation of certain functions from high-cost to lower-cost jurisdictions, a reduction of staff, including from acquisitions and Restated 2001 Moody’s Corporation Key Employees’ Stock Incentive Planpursuant to a review of the business criticality of certain positions, and the rationalization and exit of certain real estate leases due to consolidation of various business activities. |
| | |
2007 Agreement2020 MA Strategic Reorganization Restructuring Program | | Note purchase agreement dated September 7, 2007,Restructuring program approved by the chief executive officer of Moody’s on December 22, 2020, relating to a strategic reorganization in the Series2007-1 NotesMA reportable segment. |
| | |
2010 Indenture2020 Real Estate Rationalization Restructuring Program | | Supplemental indenture and related agreements dated August 19, 2010, relatingRestructuring program approved by the chief executive officer of Moody’s on July 29, 2020, primarily in response to the 2010 Senior NotesCOVID-19 pandemic which revolves around the rationalization and exit of certain real estate leases. |
| |
2010 Senior Notes | | Principal amount of $500 million, 5.50% senior unsecured notes due in September 2020 pursuant to the 2010 Indenture |
| |
2012 Facility | | Revolving credit facility of $1 billion entered into on April 18, 2012; was replaced with the 2015 Facility |
| |
2012 Indenture | | Supplemental indenture and related agreements dated August 18, 2012, relating to the 2012 Senior Notes Due 2022 |
| |
2012 Senior Notes | | Principal amount of $500 million, 4.50% senior unsecured notes due in September 2022, pursuant tobut early repaid by the 2012 IndentureCompany in 2021 |
| |
2013 Indenture | | Supplemental indenture and related agreements dated August 12, 2013, relating to the 2013 Senior Notes |
| | |
TERM
| | DEFINITION
|
| |
| 2013 Senior Notes Due 2024 | | Principal amount of the $500 million, 4.875% senior unsecured notes due in February 2024 pursuant to the 2013 Indenture |
| | |
2014 Indenture | | Supplemental indenture and related agreements dated July 16, 2014, relating to the 2014 Senior Notes Due 2044 |
| |
2014 Senior Notes(5-Year) | | Principal amount of $450 million, 2.75% senior unsecured notes due in July 2019 |
| |
2014 Senior Notes(30-Year) | | Principal amount of $600 million, 5.25% senior unsecured notes due in July 2044 |
| | |
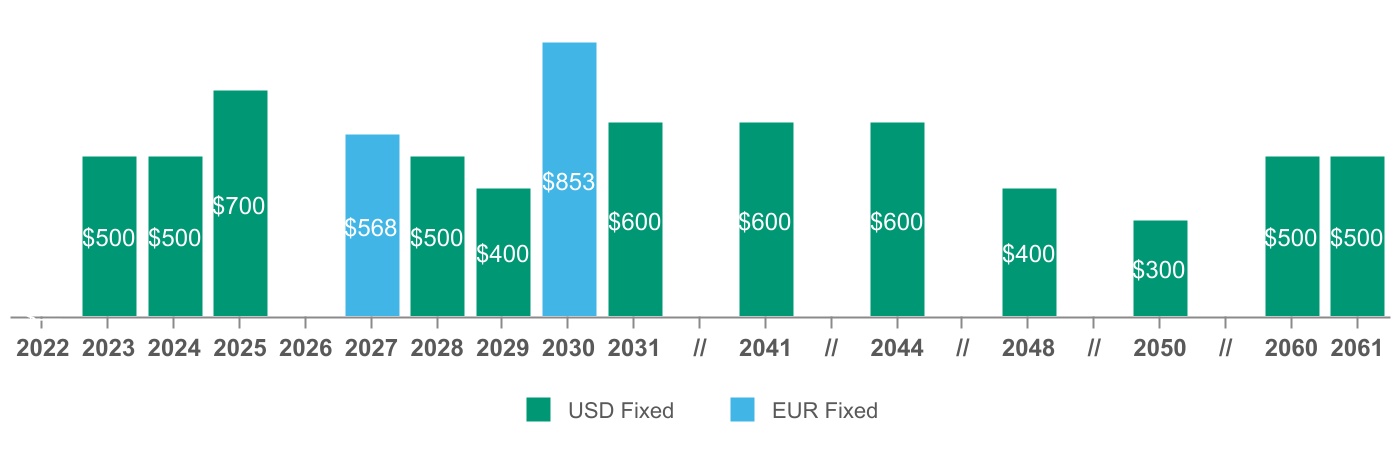
2015 FacilitySenior Notes Due 2027 | | Principal amount of €500 million, 1.75% senior unsecured notes due in March 2027 |
| | |
| 2017 Senior Notes Due 2023 | | Principal amount of $500 million, 2.625% senior unsecured notes due January 15, 2023 |
| | |
| 2017 Senior Notes Due 2028 | | Principal amount of $500 million, 3.25% senior unsecured notes due January 15, 2028 |
| | |
| | |
| | |
| 2018 Facility | | Five-year unsecured revolving credit facility, with capacity to borrow up to $1 billion; backstops CP issued under the CP Program. The 2021 Facility replaces the 2012 FacilityCompany's $1 billion 2018 Credit Facility. |
| |
2015 Indenture | | Supplemental indenture and related agreements dated March 9, 2015, relating to the 2015 Senior Notes |
| | |
2015 | | |
| 2018 Senior Notes Due 2029 | | Principal amount€500 of $400 million, 1.75%4.25% senior unsecured notes issued March 9, 2015 and due in March 2027February 1, 2029 |
| | |
2017 Bridge Credit Facility | | Bridge Credit Agreement entered into in May 2017 pursuant to the definitive agreement to acquire Bureau van Dijk; this facility was terminated in June 2017 upon issuance of the 2017 Private Placement2018 Senior Notes Due 2023 and 20282048 | | Principal amount of $400 million, 4.875% senior unsecured notes due December 17, 2048 |
| | |
2017 Floating Rate2019 Senior Notes Due 2030 | | Principal amount of €750 million, 0.950% senior unsecured notes due February 25, 2030 |
| | |
| | | | | | | | |
| TERM | | DEFINITION |
| | |
| 2020 Senior Notes Due 2025 | | Principal amount of $700 million, 3.75% senior unsecured notes due March 24, 2025 |
| | |
| 2020 Senior Notes Due 2050 | | Principal amount of $300 million, floating rate3.25% senior unsecured notes due in September 2018May 20, 2050 |
| | |
2017 Indenture | | Collectively the Supplemental indenture and related agreements dated March 2, 2017, relating to the 2017 Floating Rate2020 Senior Notes and 2017 Senior Notes and the Supplemental indenture and related agreements dated June 12, 2017, relating to the 2017 Private Placement Notes Due 2023 and 20282060 |
| |
2017 Private Placement Notes due 2023 | | Principal amount of $500 million, 2.625%2.55% senior unsecured notes due January 15, 2023August 18, 2060 |
| | |
2017 Private Placement2021 Facility | | Five-year unsecured revolving credit facility, with capacity to borrow up to $1.25 billion; backstops CP issued under the CP Program. |
| | |
2021 Senior Notes Due 20282031 | | Principal amount $500of $600 million, 3.250%2.00% senior unsecured notes due January 15, 2028August 19, 2031 |
| | |
20172021 Senior Notes Due 2041 | | Principal amount of $600 million, 2.75% senior unsecured notes due August 19, 2041 |
| | |
| 2021 Senior Notes Due 2061 | | Principal amount of $500 million, 2.75%3.10% senior unsecured notes due December 2021November 15, 2061 |
| |
2017 Term Loan | | $500 million, three-year term loan facility entered into on June 6, 2017 for which the Company drew down $500 million on August 8, 2017 to fund the acquisition of Bureau van Dijk |
| |
| 7WTC | | The Company’s corporate headquarters located at 7 World Trade Center in New York, NY |
ITEM 1. BUSINESS
As used in this report, except where the context indicates otherwise, the terms “Moody’s” or the “Company” refer to Moody’s Corporation, a Delaware corporation, and its subsidiaries. The Company’s executive offices are located at 7 World Trade Center at 250 Greenwich Street, New York, NY 10007 and its telephone number is
(212) 553-0300.
Company Overview
Moody’s is a
provider of (i) credit ratings; (ii) credit, capital marketsglobal integrated risk assessment firm that empowers organizations and
economic research, data and analytical tools; (iii) software solutions that support financial risk management activities; (iv) quantitatively derived credit scores; (v) financial services training and certification services; (vi) offshore financial research and analytical services; and (vii) company information and business intelligence products.investors to make better decisions. Moody’s reports in two
reportable segments: MIS and MA. Financial information and operating results of these segments, including revenue, expenses and
operating income,Adjusted Operating Income, are included in Part II, Item 8. Financial Statements of this annual report and are herein incorporated by reference.
MIS
| | | | | | | | | | | | | | | | | |
| | | | | |
|
| |
| Independent provider of credit rating opinions and related information for over 100 years | | Global integrated risk assessment firm providing credit rating opinions, analytical solutions and insights that empower organizations to make better, faster decisions | | Provider of financial intelligence and analytical tools supporting customers’ growth, efficiency and risk management objectives |
| | | | | |
| | | | | | | | | | | | | | |
| Moody's has evolved over the last 15 years as our customers' needs have changed and we expanded our capabilities |
| | | | |
| | | 2007 - 2016 | |
| | Expanded beyond ratings agency | |
| | •Established Moody’s Analytics •Built the ERSbusiness (e.g., Fermat, B&H) •Expanded ratings to China (i.e., CCXI) | |
| | | | |
| | | 2017 - 2021 | |
| | Built out substantial data and analytics capabilities | |
| | •Complemented ERS business with private company information(i.e., BvD) •Accelerated capability expansion (e.g., company database, CRE data, ESG data) •Invested in insurance data and analytics capabilities, including weather and disaster modeling (i.e., RMS) | |
| | | | |
| | | 2022 and Beyond | |
| | Positioned to serve a wide range of risk assessment markets | |
| | •Competitive differentiator: integration of data and analytics combined with expertise and technology enablement •Further investment in data and analytics capabilities such as private company, CRE and ESG to serve high growth risk assessment use cases (e.g., KYC and compliance) | |
Moody's Investors Service Overview
Moody's Investors Service (MIS) publishes credit ratings and provides assessment services on a wide range of debt obligations, programs and facilities, and the entities that issue such obligations in markets worldwide, including various corporate, financial institution and governmental obligations, and structured finance securitiessecurities. A rating from MIS enables issuers to create timely, go-to-market debt strategies with the ability to capture wider investor focus and commercial paper programs. deeper liquidity options.
| | | | | | | | | | | | | | | | | | | | |
| The Benefits of a Moody's Rating |
| Investors seek Moody's opinions and particularly value the knowledge of its analysts and the depth of Moody's research |
| | | | | | |
| Access to capital | | Transparency, credit comparison and market stability | | Planning and budgeting | | Analytical capabilities |
•Moody’s opinions on credit are used by institutional investors throughout the world, making an issuer’s debt potentially more attractive to a wide range of buyers. | | •Signals a willingness by issuers to be transparent and provides issuers with an independent assessment against which to compare creditworthiness. | | •May help issuers when formulating internal capital plans and funding strategies. | | •Among ratings advisors, Moody’s has a strong position and is well-recognized for the depth and breadth of its analytical capabilities. |
| | | | | | |
•A Moody’s rating may facilitate access to both domestic and international debt capital.
| | •Moody’s ratings and research reports may help to maintain investor confidence, especially during periods of market stress. | | | | |
Ratings revenue is derived from the originators and issuers of such transactions who use MIS ratings to support the distribution of their debt issues to investors. MIS provides ratings in more than 120 countries. Ratings are disseminated via press releases to the public primarily through a variety of print and electronic media, including the Internetinternet and real-time information systems widely used by securities traders and investors. As of December 31, 2017,
| | | | | | | | | | | | | | | | | | | | | | | | | | | | | |
| MIS by the Numbers |
| | | | | | | | | |
| 35,000+ | | | | | | | |
| Rated Organizations and Structured Deals | | | | |
| | | | | | | | | |
| | 5,300+ | | | 3,500+ | | | 15,500+ | |
| Rated Non-Financial Corporates | | Rated Financial Institutions | | Rated Public Finance Issuers | |
| | | | | | | | | |
| | 9,000+ | | | 1,000+ | | | 445 | |
| Rated Structured Finance Deals | | Rated Infrastructure & Project Finance Issuers | | Rated Sub-Sovereigns
| |
| | | | | | | | | |
| | 145 | | | 49 | | | $73 trillion | |
| Rated Sovereigns | | Rated Supranational Institutions | | Total rated debt outstanding | |
| | | | | | | | | |
| | 190 | | | | | | | |
| Rating Methodologies | | | | | | |
MIS
had the following ratings relationships:» | | Approximately 4,700 ratednon-financial corporate issuers; |
» | | Approximately 4,100 rated financial institutions issuers; |
» | | Approximately 18,000 rated public finance issuers (including sovereign,sub-sovereign and supranational issuers); |
» | | Approximately 11,000 rated structured finance transactions; and |
» | | Approximately 1,000 rated infrastructure and project finance issuers. |
Additionally, MISalso earns revenue from certainnon-ratings-related operations, which primarily consist of financial instruments pricing services in the Asia-Pacific region, as well as revenue from ICRAnon-ratingESG research, data and assessments and revenue from ICRA's non-ratings operations. The revenue from these operations is included in the MIS Other LOB and is not material to the results of the MIS segment.
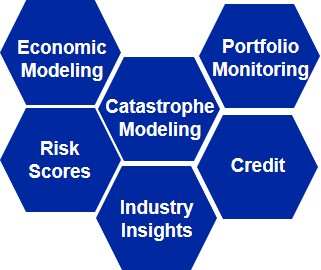
The MA segment develops
Moody's Analytics Overview
Moody's Analytics (MA) is a
wide range of productsglobal provider of: i) data and
services that support financial analysis and risk management activities of institutional participants in global financial markets. Within its Research, Data and Analytics business, MA distributesinformation; ii) research and
data developed by MISinsights; and iii) decision solutions, which help companies make better and faster decisions. MA leverages its industry expertise across multiple risks such as
partcredit, market, financial crime, supply chain, catastrophe and climate to deliver integrated risk assessment solutions that enable business leaders to identify, measure and manage the implications of
its ratings process, includingin-depth research on major debt issuers, industry studies, commentary on topical credit related events. The RD&A LOB also provides economicinterrelated risks and opportunities. MA’s proprietary data, research and
credit data and analyticalanalytics combined with cloud-based software tools
suchdeliver solutions to meet customer needs as
quantitative credit risk scores as well as business intelligence and company information products. Within its Enterprise Risk Solutions business, MA provides software solutions as well as related risk management services. Within its Professional Services business it provides offshore research and analytical services along with financial training and certification programs. MA customers represent more than 10,500 institutions worldwide operatingthey arise. MA’s subscription businesses provide a significant base of recurring revenue to mitigate cyclical changes in
over 155 countries. During 2017 Moody’s research website was accessed by over 252,000 individuals including 36,000 customer users.PROSPECTS FOR GROWTH
Over recent decades, global fixed-income markets have grown significantly bothdebt issuance volumes that may result in terms of the amount and types of securities or other obligations outstanding. Beginningvolatility inmid-2007, there was a severe market disruption and associated financial crisis both in the devel-
MIS’s revenues. | | | | | | | | | | | | | | | | | | | | | | | | | | | | | | | | | | | | | | | | | | | | | | | |
| Curated Data Combined with Analytics are the Foundation of MA's Integrated Risk Assessment Strategy |
| | | | | | | | | | | | | | | |
| | MOODY’S 2017 10-K | | | 11Domain Expertise | | | | | |
| | | | | | | | | |
| | | | | | | | | | | | | | | |
| Curated Data | | | | | Best in Class Analytics |
| | | |
| Proprietary data assets allow companies to inform and perform many critical business activities with trust and confidence | | | | | | | | | | | | | MA's approach to deepening available data sets and ability to combine with research, analytic tools and software is driving a more integrated understanding of risks and opportunities |
| | | | | | | |
| | | | | |
| | | | | |
| | | | | | | | | | | |
| Transparency | ç | | | | | | | è | Benchmarks | |
| Efficiency | Better Decisions | Analytics | |
| Convenience | | | | | | | Insights | |
| | | | | | | | | | | | | | | | | | | | | | | | | | | | | |
| MA Customers by the Numbers |
| | | | | | | | | |
| 14,900 + | | | | | | | |
| Total MA customers | | | | |
| | | | | | | | | |
| | 1,800+ | | | 2,300+ | | | 3,600+ | |
| Asset Managers | | Commercial Banks | | Corporations | |
| | | | | | | | | |
| | 200+ | | | 900+ | | | 5,300+ | |
| Securities Dealers and Investment Banks | | Insurance Companies | | Government & Other Entities | |
| | | | | | | | | |
| | 800+ | | | 165 | | | 29,000+ | |
| Real Estate Entities | | Countries where MA customers operate | | Customer users accessed the Moody's research website in 2021 | |
| | | | | | | | | |
| | 244,000+ | | | | | | | |
| Individuals accessed the Moody's research website | | | | | | | |
oped
Sustainability
Moody’s manages its business with the goal of delivering value to all of its stakeholders, including its customers, employees, business partners, local communities and emerging markets resultingstockholders. As part of this effort, Moody’s advances sustainability by considering environmental, social, and governance (“ESG”) factors throughout its operations and products and services. The Company uses its expertise and assets to make a positive difference through technology tools, research and analytical services that help other organizations and the investor community better understand the links between sustainability considerations and the global markets. Moody’s efforts to promote sustainability-related thought leadership, assessments and data to market participants include adhering to the policies of recognized sustainability organizations that develop standards or frameworks and/or evaluate and assess performance, including: the Global Reporting Initiative; Sustainability Accounting Standards Board; and the World Economic Forum’s Stakeholder Capitalism metrics. Moody's also issues an annual report on Stakeholder Sustainability and on how the Company has implemented the Task Force on Climate-related Financial Disclosures (“TCFD”) recommendations. Moody’s sustainability-related achievements in 2021 included the following:
–Established three goals to increase representation of women and employees of racial and ethnic underrepresented groups; published our EEO-1 data;
–Accelerated our net-zero commitment to 2040, a decade earlier than the Paris Agreement goal;
–Received an ‘A’ score from CDP on climate action for the second consecutive year; and
–Became a founding member of the Net Zero Financial Services Provider Alliance, part of the Glasgow Financial Alliance for Net Zero (GFANZ) and joined the Taskforce on Nature-related Financial Disclosures (TNFD).
The Board oversees sustainability matters, with assistance from the Audit, Governance & Nominating and Compensation & Human Resources Committees, as part of its oversight of management and the Company’s overall strategy. The Board also oversees Moody’s policies for assessing and managing our exposure to risk, including climate-related risks such as business continuity disruption or reputational and credibility concerns stemming from incorporation of climate-related risks into the credit methodologies and credit ratings of MIS.
| | | | | | | | | | | | | | | | | | | | | | | |
| Three Pillars of Moody's Sustainability Strategy |
| | | | | | | |
| | | | |
| Better Business | | Better Lives | | Better solutions |
| For Moody's operations and value chain | | For Moody's people and communities | | For market transformation |
| Strive to embed responsible, sustainable decision-making in everything Moody's does. | | Aim to create a forward-thinking, inclusive culture across Moody's people and communities. | | Build/develop products to help our customers identify risks and opportunities and provide meaningful performance measurements and insights |
HUMAN CAPITAL
Moody’s purpose is to bring clarity, knowledge and fairness to an interconnected world. The Company’s success in achieving its purpose is only possible through the collective contributions of its global employee population whose members possess the unique combination of skills, professional experience and diversity of backgrounds needed to advance the Company’s business and contribute to the communities in which it operates. Moody’s believes that it is essential to: i) create a workplace where its employees feel valued and inspired; ii) provide an environment that fosters a culture of independence, inclusion and intellectual leadership; and iii) support peer collaboration and professional growth.
As a global integrated risk assessment firm, attracting, supporting and retaining skilled talent is essential to the Company’s success. Moody’s addresses these goals by:
–championing diversity, equity and inclusion among employees;
–seeking to provide market-competitive compensation and benefits and rewarding employees for their contributions to the Company’s strategic and operational goals;
–offering wellness programs;
–supporting employee learning, development and skills enhancement; and
–advancing employee engagement.
Diversity, Equity and Inclusion
Moody's believes it is imperative to be visible champions of diversity, equity and inclusion because differing thoughts and perspectives help to enrich the Company’s offerings to its many stakeholders and improve performance. The key objectives for which the Company focuses with respect to these items include:
–incorporating diversity, equity and inclusion into Moody’s business strategy;
–establishing leadership accountability with respect to diversity, including through executive compensation programs;
–working to increase diverse representation (e.g., women and ethnic groups);
–continuing to advance women and ethnically diverse employees in leadership roles;
–enhancing employee training in diversity, equity and inclusion matters;
–promoting equal employment opportunities in all aspects of employment;
–designing the Company’s compensation practices to provide equal pay for equal work; and
–incorporating market standards, role, experience and performance into compensation decisions.
The executive leadership team’s focus on these items is vital to attract, support and retain its skilled talent.
Moody’s has numerous diversity programs and eight active business resource groups (“BRGs”) including:
–EnAble BRG: advocates for an inclusive, accessible and stigma-free workplace in which employees with disabilities are valued for their talents and have the opportunity to advance and thrive professionally
–Generational BRG: seeks to leverage the insights and experiences of our multi-generational workforce in order to cultivate an inclusive work environment that fosters greater connectedness, supports the development of all generational groups and delivers business value to the firm
–Inclusion BRG: supports all areas of diversity and inclusion combining Moody's BRG chapters. Inclusion creates opportunities for all employees regardless of office size to engage with a BRG
–Minds BRG: seeks to foster a culture at Moody’s where all employees are empowered to discuss and manage their mental health
–Multicultural BRG: seeks to leverage diverse talent by promoting recruitment, professional development and networking opportunities for all ethnically diverse employees at Moody's
–Pride BRG: advocates for a work environment that respects, welcomes and supports lesbian, gay, bisexual and transgender professionals, enabling them to perform to their fullest potential and contribute to the greater goals of the Company
–Veterans BRG: recognizes and supports veterans, active-duty military personnel and military families both at Moody's and in our communities
–Women's BRG: seeks to enhance the recruitment, retention, and professional development of female professionals by implementing programs that foster greater interaction among peers as well as the broader community, while acting as a collective voice for raising women's issues to senior management and enhancing the employment brand
The BRGs represent 44 chapters and more than 6,600 memberships globally as of December 31, 2021. An employee can hold membership in multiple BRGs in a single region.
The Company’s diversity programs include its TIDE program (Talent Aspirations & Alignment, Insights, Development & Career Planning and Exposure & Expansion), which is a high potential employee diversity initiative aimed at elevating women and ethnically diverse employees into leadership positions.
The Company provides and periodically updates information on its BRGs and other diversity, inclusion and equity programs in its various sustainability and stakeholder reports and on its Diversity & Inclusion microsite. See moodys.com/sustainability and moodys.com/diversity for these items. The content of those websites is not incorporated by reference herein.
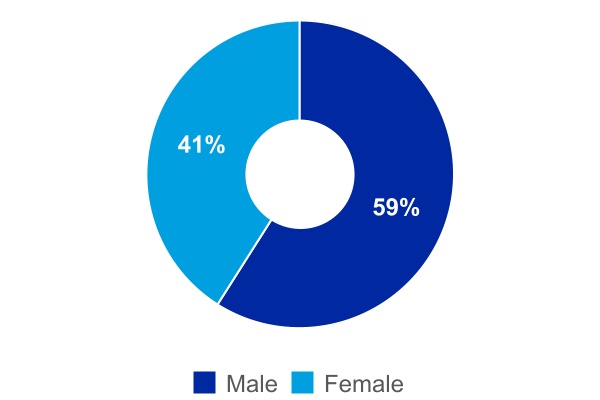
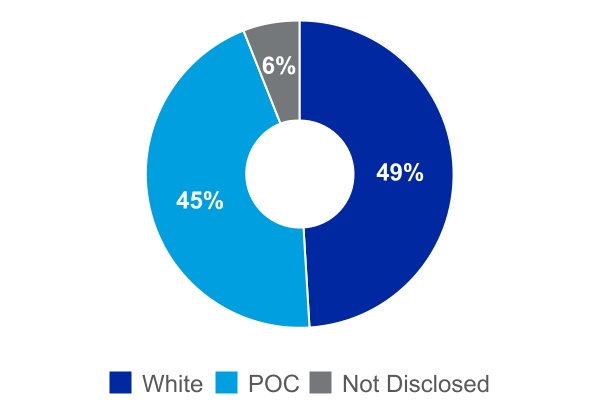
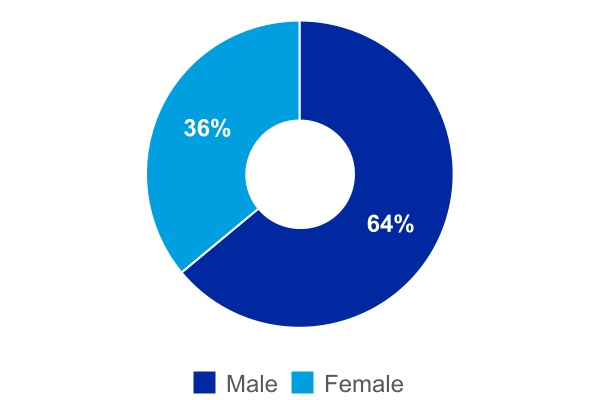
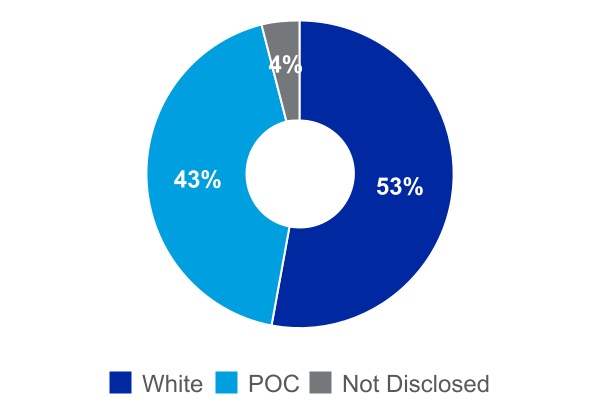
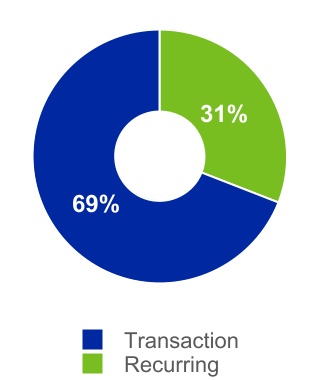
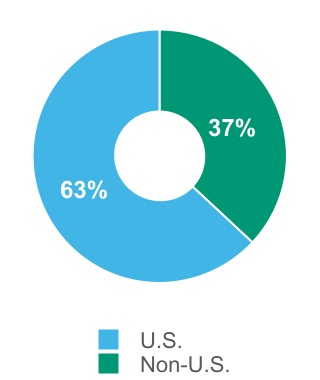
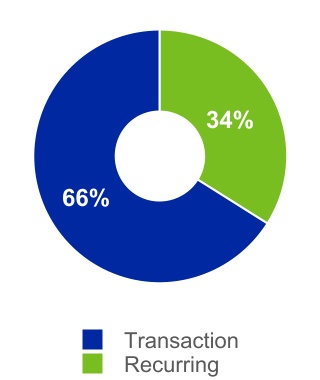
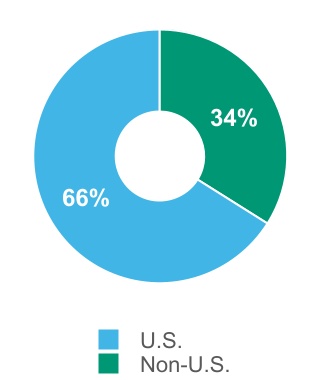
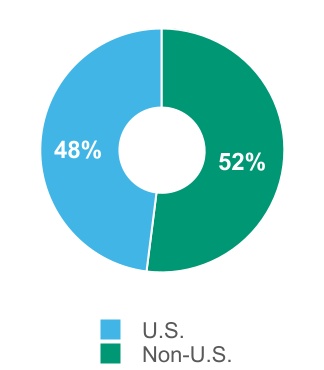
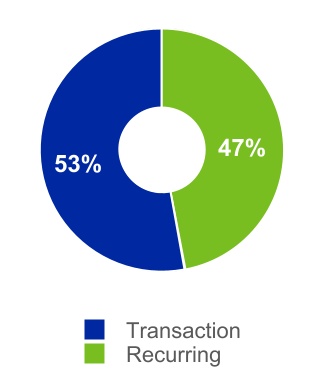
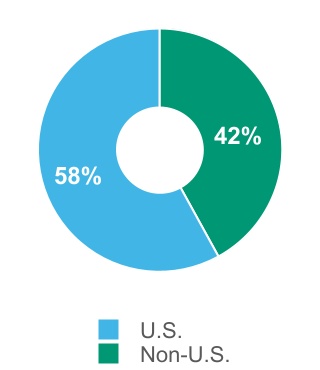
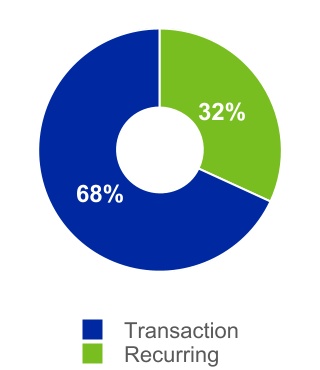
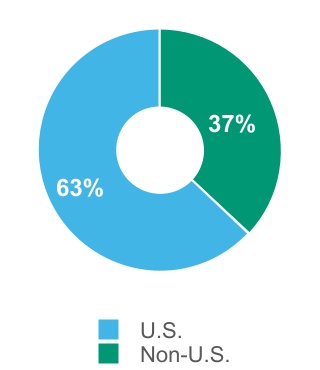
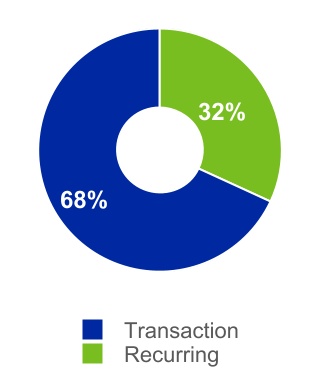
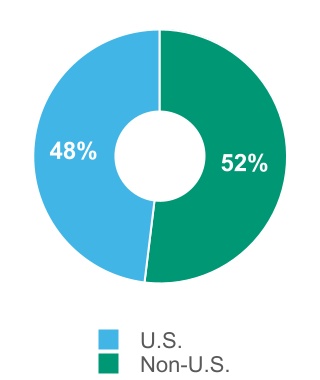
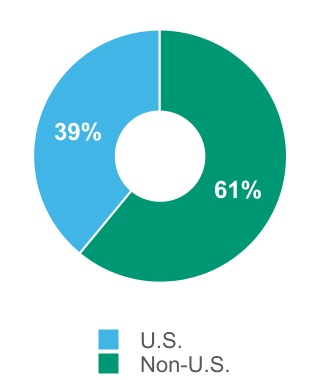
The charts below present additional information regarding the diversity of the Company's workforce as of December 31, 2021. The percentage for people of color ("POC") includes those who identified as Asian, Hispanic, Black, American Indian/Alaskan Native, Hawaiian/Other Pacific Island or two or more races. Officers and Managers are calculated using the job categories: executives, senior managers, mid-level managers, and first-level managers. The following data is based on Company records and may involve estimates or assumptions.
| | | | | | | | | | | | | | |
| Total Workforce: Gender | | U.S. Workforce: Ethnicity |
| | | | | | | | | | | | | | |
Total Officers and Managers: Gender (1) | | U.S. Officers and Managers: Ethnicity |
(1) Total officers and managers by gender represents approximately 90% of employees (excludes certain non-wholly-owned subsidiaries and newly acquired companies for which this data was not available)
Compensation
Moody’s compensation programs are designed to foster and maintain a strong, capable, experienced and motivated global declineworkforce. An important element of the Company’s compensation philosophy is aligning compensation to local market standards so that Moody's can attract and retain the highly-skilled talent needed to thrive. The Company’s compensation packages include market-competitive salaries, annual bonuses and equity grants for certain employees.
Benefits and Wellness Programs
With respect to benefits, the Company views investments in debt issuance activitybenefits as an investment in its people. Moody’s is committed to providing competitive benefits programs designed to care for some significant asset classesall employees and weak economictheir families. The Company’s comprehensive programs offer resources for physical and mental health that promote preventive care, awareness and support a healthy lifestyle. The Company also promotes financial wellness and provides for flexible work arrangements, which support the Company’s efforts to create a work atmosphere in which people feel valued and inspired to give their best. Beyond delivering health, welfare, retirement benefits, and paid vacation and sick days, Moody’s extends other benefits to support its employees and their families. To provide competitive benefits, the Company periodically adjusts the nature and extent of benefits, such as parental leave, workplace flexibility and educational support.
Employee Population
As of December 31, 2021 and 2020, the number of Moody’s employees was as follows:
| | | | | | | | | | | | | | | | | | | | | | | | | |
| | | December 31, | | | | Change |
| Global Headcount | | 2021 | | 2020 | | | | % |
| | | | | | | | | |
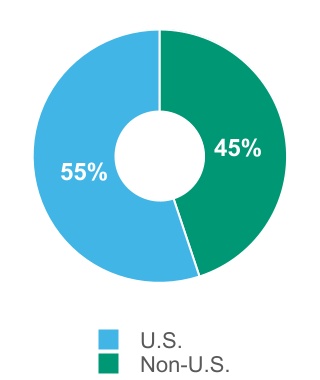
| MIS | | | | | | | | |
| U.S. | | 1,459 | | | 1,518 | | | | | (4) | % |
| Non-U.S. | | 3,836 | | | 3,533 | | | | | 9 | % |
| Total | | 5,295 | | | 5,051 | | | | | 5 | % |
| | | | | | | | | |
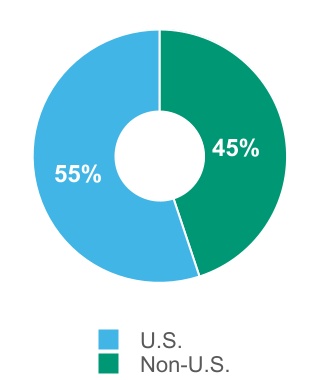
| MA | | | | | | | | |
| U.S. | | 2,647 | | | 2,012 | | | | | 32 | % |
| Non-U.S. | | 3,882 | | | 2,996 | | | | | 30 | % |
| Total | | 6,529 | | | 5,008 | | | | | 30 | % |
| | | | | | | | | |
| MSS |
| U.S. | | 728 | | | 704 | | | | | 3 | % |
| Non-U.S. | | 908 | | | 724 | | | | | 25 | % |
| Total | | 1,636 | | | 1,428 | | | | | 15 | % |
| | | | | | | | | |
| Total MCO | | | | | | | | |
| U.S. | | 4,834 | | | 4,234 | | | | | 14 | % |
| Non-U.S. | | 8,626 | | | 7,253 | | | | | 19 | % |
| Total | | 13,460 | | | 11,487 | | | | | 17 | % |
The MIS employee population primarily consists of credit analysts, data and operations analysts, credit strategy and methodology professionals, software engineers, sales and sales operations, and international strategy teams.
MA’s employee population primarily consists of software engineers, data and operation analysts, advisory and implementation teams and economists, as well as sales and sales support professionals.
The MSS employee population primarily consists of information technology professionals and other professional support staff such as finance, human resources and legal that support both MIS and MA.
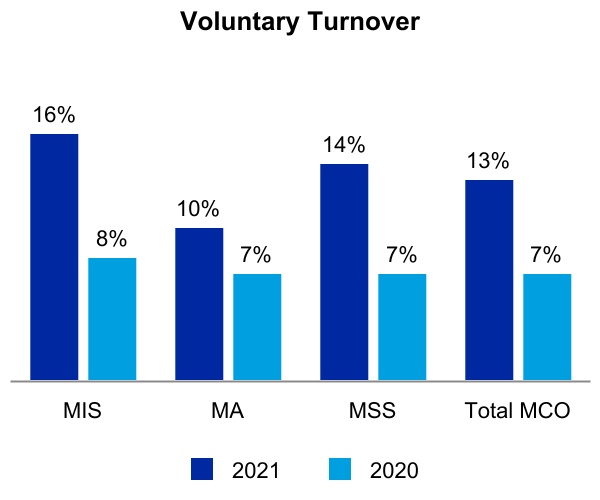
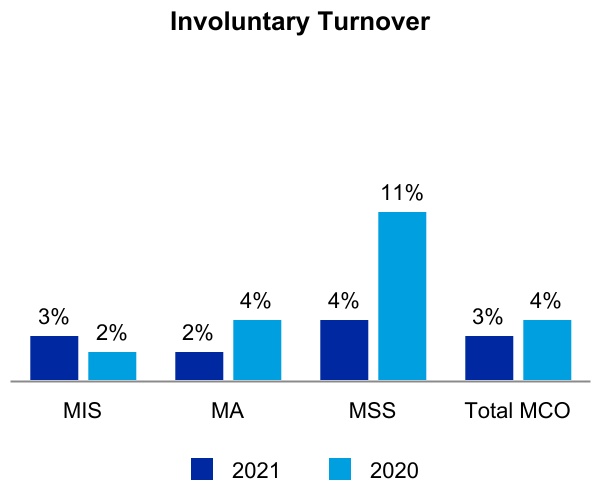
Management monitors employee turnover rates as presented in the chart below:
The increase in the Company's voluntary turnover rates in 2021 compared to 2020 are likely due to the effects of COVID-19 on the labor market. Additionally, MSS involuntary turnover figures in 2020 in the chart above includes employees who separated pursuant to a third-party outsourcing arrangement relating to certain back-office functions. A majority of these employees were hired by the third-party outsourcing provider.
Employee Engagement, Learning and Development
As a result of the COVID-19 pandemic, the Company enhanced its digital communications with its employees beginning in 2020. These enhanced communications have allowed senior management to continue to interact with employees regarding evolving priorities and its focus on the health, safety and well-being of Moody’s employees during this challenging time.
Learning & Development is one element of Moody’s talent management framework, which includes talent acquisition, performance in advanced economies. Since this financial crisis, many marketsmanagement, total rewards, succession planning and economies have recoveredleadership development. Each of these areas supports the Company’s business strategy and Moody’s culture as a diverse, equitable and inclusive place to work. Moody's views learning and education as an investment in its people that aligns their professional goals and interests with the success of the Company, and helps to retain talent over the longer-term. A number of training programs are available, including leadership development, professional skills development, technical skills, as well as compliance training.
CLIMATE CHANGE
Climate change is a defining issue of our time, and while Moody’s operations have a limited direct environmental impact and we are not considered a major emitter of greenhouse gas (GHG) emissions, we do nonetheless have an important role to play in demonstrating proactive corporate responsibility, setting industry standards and demonstrating best practices when it comes to climate change mitigation. As such, the Company is taking steps to advance climate action by publishing its TCFD report on an annual basis, issuing its decarbonization plan with science-based targets and a comprehensive roadmap and accelerating its commitment to achieve net-zero emissions across its operations and value chain by 2040.
Moody’s Decarbonization Plan outlines tangible strategies for realizing its climate ambitions, including the procurement of 100% of renewable electricity in the Company’s office spaces and optimizing efficiencies in its operations through a “Workplace of the Future” program. The Decarbonization Plan was subject to a vote at Moody’s 2021 Annual Meeting of Stockholders with 93% of votes in favor of the proposal, which underscored that climate considerations and action are now an integral part of the Company’s business strategy, governance, and corporate performance. The costs associated with the implementation of the Decarbonization Plan are not expected to be material.
Furthermore, Moody’s has invested in acquisitions that expand its climate capabilities further, including RMS, Four Twenty Seven and Vigeo Eiris. To integrate these capabilities into our existing offerings, Moody’s is enhancing its technology infrastructure to provide our analysts and researchers with streamlined access to consistent and high-quality ESG and climate insights. These enhancements will allow Moody’s to seamlessly integrate climate considerations into our products and solutions for the benefit of our customers and the capital markets at large.
MOODY’S STRATEGY
Moody’s corporate mission is to provide trusted insights and standards that help decision-makers act with confidence. Moody’s will continue to invest with intent to defend and enhance its core businesses and expand into strategic adjacencies and new geographies.
| | | | | | | | | | | | | | | | | | | | |
| Vision | To promote progress through better decisions |
| | | | | | |
| Objective | Deliver global integrated risk assessment platform and solutions |
| | | | | | |
| Growth Strategy | Invest with intent to grow and scale |
| | | | | |
| | | |
Invest with intent to grow and strengthen our core business with a foundation of credibility, transparency, technology, data and analytics | | Invest in integrated solutions to allow customers to manage multiple risks, bringing the best of Moody's capabilities | | Invest to successfully scale in priority growth markets with highly differentiated products and services |
| | | | | |
| Investment in high growth markets |
| | | | | | |
| Execution Priorities | How we will get it done |
| | | | | |
| | | | |
Sharpen focus on
customers | | Develop our people and culture | | Collaborate, modernize and innovate |
| | | | | | |
Moody’s invests in initiatives to implement the Company’s strategy, including internally led organic development and targeted acquisitions. Illustrative examples include:
| | | | | | | | | | | | | | |
| | | | |
| Enhancements to ratings quality and product extensions | Investments that extend ownership and participation in joint ventures and strategic alliances | Expansion in emerging markets | New products, services, content and technology capabilities to meet customer demands | Selective bolt-on acquisitions that accelerate the ability to scale and grow Moody’s businesses |
During 2021, Moody’s continued to invest in and acquire complementary businesses as further described below:
| | | | | | | | | | | | | | |
| Date | Business | Company | Stake | Strategic Commentary |
| | | | |
| November 2021 | KYC | PassFort | 100% | A U.K. SaaS-based workflow platform for identity verification, customer onboarding, and risk analysis. The integration of PassFort’s platform into Moody’s suite of KYC and compliance offerings will create a more holistic workflow solution, allowing customers to incorporate Moody’s data, including credit, cyber, ESG, and climate analytics, directly into their proprietary processes.
|
| | | | |
| November 2021 | KYC | Bogard AB | 100% | A provider of data and information on politically exposed persons (PEPs) in the Nordic region. The acquisition advances Moody’s ability to help customers perform KYC screening and research to address financial crime.
|
| | | | |
| October 2021 | Cyber | BitSight | Minority | A provider of cybersecurity ratings, analytics, and performance management tools. In 2021, BitSight acquired VisibleRisk, a cyber risk ratings joint venture created by Moody’s and Team8, a global venture group. The investment enhances BitSight’s offerings and capabilities, to create a comprehensive, integrated, industry-leading cybersecurity risk platform. Moody’s will leverage BitSight’s extensive cyber risk data and research across its growing suite of integrated risk assessment product offerings.
|
| | | | |
| September 2021 | Insurance | Risk Management Solutions (RMS) | 100% | A global provider of climate and natural disaster risk modeling and analytics. The acquisition expands Moody’s insurance data and analytics business and accelerates the development of the Company’s global integrated risk capabilities to address the next generation of risk assessment.
|
| | | | |
| September 2021 | Commercial Real Estate | RealXData | 100% | A provider of CRE lease-level portfolio management with benchmarking and rent forecasting capabilities. The acquisition advances Moody's ability to help customers manage their real estate portfolio, analyze performance, and define a strategy in one platform.
|
| | | | |
| March 2021 | KYC | Cortera | 100% | A provider of North American credit data and workflow solutions. The acquisition enhances Moody’s integrated risk assessment capabilities and significantly extends its coverage in the small and medium enterprise segment. Cortera augments Moody’s extensive Orbis database of private company information and enhances its know-your-customer, commercial lending, and supply chain solutions.
|
PROSPECTS FOR GROWTH
Moody’s believes
that the overall long-term outlook remains favorable for continued growth of the global fixed-income market and related financial information market, which includes information such as credit opinions, research, data, analytics, risk management tools and related services.
Moody’s growth is influenced by a number of trends that impact financial information markets including:
» | | | | | | | | | | | | | | | | | | | | | | | | | | | | | | | | |
| | | | | | | | | | |
Health of the world’s major economies; |
»economies | | Debt capital markets activity; |
»activity | | Disintermediation of credit markets; |
»markets | | Fiscal and monetary policy of governments;governments | | Expansion of market for integrated data and |
» analytics solutions | | Business investment spending, including mergers and acquisitions.acquisitions |
In an environment of increasing financial complexity and heightened attention to credit analysis and risk management, Moody’s is well positioned to benefit from continued growth in global fixed-income market activity and
a more widespread use of credit ratings, research and related analytical products. Moody’s expects that these developments will support continued long-term demand for high quality, independent credit opinions, research, data, analytics, risk management tools and related services.
Strong secular trends should continue to provide long-term growth opportunities. For MIS, key growth drivers include debt market issuance driven by global GDP growth, continued disintermediation of fixed-income markets in both developed and emerging economies driving issuance and demand for new ratings products and services. Growth in MA is likely to be driven by deeper and broader penetration of its customer base as regulatory compliance and other analytical requirements drive demand for MA’s products and expertise. Moreover, pricing opportunities aligned with customer value creation and advances in information technology present growth opportunities for Moody’s.
Moody’s operations are subject to various risks, as more fully described in Part I, Item 1A “Risk Factors,” inherent in conducting business on a global basis. Such risks include currency fluctuations and possible nationalization, expropriation, exchange and price controls, changes in the availability of data from public sector sources, limits on providing information across borders and other restrictive governmental actions.
Environmental, Social and Governance Data and Solutions
ESG data and solutions are expected to play an increasingly important role across both MIS and MA as market participants seek trusted insights and standards to make better decisions.
| | | | | | | | | | | | | | | | | | | | | | | | | | | | | | | | |
| ESG Integrated Across All Platforms |
| | |
| | | | | | | | | | |
| Credit Impact | | Risk Quantification | | ESG Domain | |
| | | | | | | | | | |
| | | | | | | | | | |
| ESG Classification | ESG Credit Impact Scores | | Real Estate Solutions | Risk Analytics & Reporting | | ESG Measures | | Climate Solutions | |
| | | | | | | | Index Solutions | | |
| Credit Ratings & Research | Heat Maps | | Lending Solutions and Tools | Catastrophe Models
| | SME Solutions | | Sustainable Finance | |
Impact of Technology
The pace of change in technology and communication over the past two decades makes information about investment alternatives and risk management solutions widely available. This increase in the availability of information and solutions promotes the ongoing integration and expansion of financial markets worldwide, giving market participants access to a wider range of both established and newer capital markets as well as data and solutions to manage risk. As technology provides broader access to worldwide markets, it also results in a greater need for credible, globally comparable opinions about credit risk, data, analytics and related services and solutions.
MIS Prospects for Growth
Strong secular trends should continue to provide long-term growth opportunities in MIS. Key growth drivers include:
•Debt market issuance driven by global GDP growth;
•Continued onboarding of first time rating mandates;
•Developing a comprehensive sustainable finance offering, including credit impact scores, second party opinions, assessment of net zero and sustainable growth, which is supported by data and research offerings to meet the market’s evolving needs;
•Growth in domestic capital markets through investments in Moody’s Local and affiliates in key markets; and
•Bank disintermediation and the expansion of private credit.
In addition to the factors noted above, growth in global fixed income markets in a given year is dependent on many macroeconomic and capital market factors including interest rates, business investment spending, corporate refinancing needs, merger and acquisition activity, issuer profits, consumer borrowing levels and securitization activity. including:
| | | | | | | | | | | | | | | | | | | | | | | | | | |
| | | | | | | | |
| Interest rates | Business investment spending | Corporate refinancing needs | Merger and acquisition activity | Issuer financial health | Consumer borrowing levels | Securitization activity | Expansion of ratings coverage | Expansion into emerging markets |
Rating fees paid by debt issuers account for most of the revenue of MIS. Therefore, a substantial portion of MIS’s revenue is dependent upon the dollar-equivalent volume and number of ratable debt securities issued in the global capital markets.
MIS’s results can also be affected by factors such as the performanceas:
•Performance and prospects for growth of the major world economies, the fiscaleconomies;
•Fiscal and monetary policies pursued by their governments,governments; and the decisions of
•Whether issuers to request MIS ratings to aid investors in making their investment decisions.
However, annual fee arrangements with frequent debt issuers, annual debt monitoring fees and annual fees from commercial paper and medium-term note programs, bank deposit ratings, insurance company financial strength ratings, mutual fund ratings, and other areas partially mitigate MIS’s dependence on the volume or number of new debt securities issued in the global fixed-income markets.
Furthermore,MIS’s global coverage positions it well to serve the
strong growth seen in the issuance of structured finance securities from themid-1990’s reversed dramatically in 2008 due to market turmoil, with continued declines seen in 2009 and 2010, before stabilizing in 2011 with Moody’s experiencing revenue growth in this market beginning in 2012. Despite significant declines from peak market issuance levels, Moody’s believes that structured finance securities will continue to play a role in global fixed-income markets and provide opportunities for long-term revenue growth.The pace of change in technology and communication over the past two decades makes information about investment alternatives widely available throughout the world and facilitates issuers’ ability to place securities outside their national markets and similarly investors’ ability to obtain information about securities issued outside their national markets. Technology also allows issuers and investors the ability to more readily obtain information about new financing techniques and new types of securities that they may wish to purchase or sell, which in the absenceneeds of the appropriate technology might not be readily or easily obtainable. This availability of information promotes the ongoing integrationglobal fixed income markets.
While already common in U.S. and
expansion of financialWestern European markets,
worldwide, giving issuers and investors access to a wider range of both established and newer capital markets. As technology provides broader access to worldwide markets, it also results in a greater need for credible, globally comparable opinions about credit risk, data, analytics and related services. Additionally, information technology also provides opportunities to further build a global platform to support Moody’s continued expansion in developing markets.Anan ongoing trend in the world’s capital markets is the disintermediation of financial systems. Issuers increasingly raise capital in the global public capital markets, in addition to, or in substitution for, traditional financial intermediaries. Moreover, financial intermediaries have sold assets in the global public capital markets, in addition to, or instead of, retaining those assets. Moody’s believes that issuer use of global debt capital markets offer advantages in capacity and efficiency compared to traditional banking systems and that the trend of increased disintermediation will continue. Further, disintermediation has continued because of the ongoinghistorically low interest rate environment and bank deleveraging, which has encouraged a number of corporations and other entities to seek alternative funding in the bond markets.
Moody’s also observes disintermediation in key emerging markets where economic growth may outpace internal banking system capacity. Thus, disintermediation is expected to continue over the longer-term, with Moody’s targeting investment and resources to those markets where disintermediation and bond issuance is expected to remain robust.
In
MA Prospects for Growth
As an integrated risk assessment business, MA helps customers build resilience by providing tools to measure the aftermathfinancial implications of the global financial crisis, banking, insurancerisk and capital markets authorities promulgatedcapitalize on related opportunities. Growth in MA is likely to be driven by expansion across customer sectors fostered by broadening MA's data and analytics solutions to meet an expanded set of customer use cases.
MA’s business growth is influenced by a wide rangenumber of new regulations to restore stability and confidence in financial institutions under their oversight. Programs such as Basel III, Solvency II, and CCAR — among many others — prompted banks, insurers, securities dealers, and asset managers to invest in more robust risk management practices and systems. Many of these investments drew on expertise and tools offered by MA, resulting in strong revenue growth in the post-crisis period. As banking and capital markets continue to stabilize, and with financial institutions better capitalized, regulatory-driven demand for MA products will moderate. Nonetheless, we expectfactors, including:
| | | | | | | | | | | | | | | | | | | | |
| | | | | | |
| Growth from data and analytics in adjacent markets, including KYC, CRE and ESG | Expansion of data sets and delivery options establishing a gateway that supports multiple stakeholders | Alignment of product strategy to develop and deliver integrated risk solutions | Enhancement of architecture for
engineering and data
strategies (e.g., SaaS, API, data
infrastructure, operational
resilience and IT controls) | Geographic expansion of actuarial and asset management solutions and continued investment in predictive analytics franchise | Expanded sales capacity to drive
new initiatives and continue to
deliver on targets | Enhancement of customer
engagement and innovation
through understanding the
customers' view on value |
Moody’s expects that MA products and services that
improve efficiencies, provide business insights, and enable compliance with financial regulation,
including AML, KYC, and accounting standards, will continue to be
adopted byin demand from institutions
worldwide, prompted by periodic revisions to regulatory frameworks such as the Basel capital adequacy protocols. Moreover, having responded to regulatory imperatives, financial institutions are increasingly seeking to leverage investments in regulatory compliance systems to gain business insights and front-office efficiencies; MA is well-positioned to realize revenue growth by assisting in these efforts to apply back-office analytics in support of front-line business decisions. Finally, in order toworldwide. To respond to other sources of demand and drive growth, MA is actively investing in new products,
including enhanced data sets and improved delivery
methodsservices (e.g., software-as-a-service). These efforts
willshould support broader distribution of MA’s capabilities, deepen relationships with existing customers and
facilitate moredrive new customer acquisition.
Legislative bodies and regulators in the U.S., Europe and other jurisdictions continue to conduct regulatory reviews of CRAs, which may result in, for example, an increased number of competitors, changes to the business model or restrictions on certain business activities of MIS, removal of references to ratings in certain regulations, or increased costs of doing business for MIS. Therefore, in order to broaden the potential for expansion ofnon-ratings services, Moody’s reorganized in January 2008 into two distinct businesses: MIS, consisting primarily of the ratings business, and MA, which conducts activities including the sale of credit research produced by MIS and the production and sale of other economic and credit-related products and services. The reorganization broadened the opportunities for expansion by MA into activities that may have otherwise been restricted for MIS, due to the potential for conflicts of interest with the ratings business. At present, Moody’s is unable to assess the nature and effect that any regulatory changes may have on future growth opportunities.
Moody’s operations are subject to various risks, as more fully described in Part I, Item 1A “Risk Factors,” inherent in conducting business on a global basis. Such risks include currency fluctuations and possible nationalization, expropriation, exchange and price controls, changes in the availability of data from public sector sources, limits on providing information across borders and other restrictive governmental actions.
MIS competes with other CRAs and with investment banks and brokerage firms that offer credit opinions and research. Many users of MIS’s ratings also have
in-house credit research capabilities.
MIS’s largest competitor in the global credit rating business is S&P Global Ratings (S&P), a division of S&P Global. There are
also some rating markets, based on industry, geography and/or instrument type, in which Moody’s has made investments and obtained market positions superior to
S&P,its competitors, while in other markets, the reverse is true.
In addition to S&P, MIS’s competitors include Fitch Ratings, Dominion Bond Rating Service (DBRS), A.M. Best Company, Japan Credit Rating Agency Ltd., Kroll Bond Rating Agency Inc., Morningstar Inc. and Egan-Jones Ratings Company. In Europe, there are approximately 30 companies currently registered with ESMA, which include both purely domestic European CRAs and International CRAs such as S&P, Fitch and DBRS. There are additional competitors in other regions and countries, for example, in China, where Moody’s participates through a joint venture. These competitors include China Lianhe Credit Rating Co Ltd., Shanghai Brilliance Credit Rating & Investors Service Co Ltd., Dagong Global Credit Rating Co Ltd. and Pengyuan Credit Rating Co Ltd.
MA competes broadly in the financial information industry against
various diversified
competitors such as Thomson Reuters, Bloomberg, S&P Global Market Intelligence, Fitch Solutions, Dun & Bradstreet, IBM, Wolters Kluwer, Fidelity National Information Services, SAS, Fiserv, MSCI and IHS Markit among others.competitors. MA’s main competitors within RD&A
include S&P Global Market Intelligence, CreditSights, Thomson Reuters, Intex, IHS Markit, BlackRock Solutions, FactSet and otherare providers of fixed income analytics, valuations, economic data and
research.research as well as a host of financial training and education firms. In ERS, MA faces competition from both large software providers
such as IBM Algorithmics, Fidelity National Information Services, SAS, Oracle, Misys, Oliver Wyman, Verisk Analytics and various other vendors
andin-house solutions. Within Professional Services, MA competes with a host of financial training and education firms such as Omega Performance and providers of offshore research and analytical services such as Evalueserve and CRISIL Global Research & Analytics.MOODY’S STRATEGY
Moody’s corporate strategy is to be the world’s most respected authority serving financial risk-sensitive markets. The key aspects to implement this strategy are to:
» | | Defend and enhance the core ratings and research business of MIS; |
» | | Build MA’s position as a leading provider of data, analytics and risk management solutions to financial institutions, corporations, and governmental authorities; and |
» | | Invest in strategic growth opportunities. |
Moody’s will make investments to defend and enhance its core businesses in an attempt to position the Company to fully capture market opportunities resulting from global debt capital market expansion and increased business investment spending. Moody’s will also make strategic investments to achieve scale in attractive financial information markets, move into attractive product and service adjacencies where the Company can leverage its brand, extend its thought leadership and expand its geographic presence in high growth emerging markets.
To broaden the Company’s potential, MA provides a wide range of products and services to enable financial institutions, corporations and governmental authorities to better manage risk. As such, MA adds to the Company’s value proposition in three ways. First, MA’s subscription businesses provide a significant base of recurring revenue to offset cyclicality in ratings issuance volumes that may result in volatility in MIS’s revenues. Second, MA products and services, such as financial training and professional services on research and risk management best practices, provide opportunities for entry into emerging markets before banking systems and debt capital markets fully develop and thus present long-term growth opportunities for the ratings business. Finally, MA’s integrated risk management software platform embeds Moody’s solutions deep into the technology infrastructure of banks and insurance companies worldwide.
Moody’s invests in initiatives to implement the Company’s strategy, including internally led organic development and targeted acquisitions. Example initiatives include:
» | | Enhancements to ratings quality and product extensions; |
» | | Investments that extend ownership and participation in joint ventures and strategic alliances; |
» | | New products, services, content (e.g., non-credit risk assessments such as ESG and cybersecurity risk), and technology capabilities to meet customer demands; |
» | | Selective bolt-on acquisitions that accelerate the ability to scale and grow Moody’s businesses; and |
» | | Expansion in emerging markets. |
During 2017, Moody’s continued to invest in and acquire complementary businesses in MIS and MA. In February 2017, Moody’s acquired the structured finance data and analytics business of SCDM, a leading provider of analytical tools for participants in securitization markets in Europe. The acquisition further extended the geographic footprint of MA’s structured finance analytics business, which includes extensive loan- and pool-level data for securitized assets, as well as cash flow analytics, risk monitoring andin-house solutions.
REGULATION
MIS, certain of the Company's credit
modelling tools that cover all major asset classes worldwide. In June 2017, Moody’s invested in CompStak, a provider of commercial real estate lease information. Leveraging lease data provided by CompStak will help MA expand its product offering and develop new products and technologies that serve the needs of commercial real estate finance and risk professionals. In August 2017, Moody’s completed the acquisition of Bureau van Dijk, a global provider of business intelligence and company information, for€3.0 billion. The acquisition of Bureau van Dijk extended MA’s offerings of small and medium size enterprise and private company information, strengthening Moody’s position as a leader in financial risk data and analytical insight. Also in August 2017, Moody’s invested in SecurityScorecard, a leading provider of cybersecurity ratings. SecurityScorecard’s innovative cyber risk ratings, data and analytics are used by information security, risk management, supply chain, and compliance practitioners to assess and monitor their security posture and secure their partner and vendor ecosystem. In November 2017, Moody’s invested in Rockport VAL, a provider of cloud-based commercial real estate valuation and cash flow modeling tools.Regulation
MISrating affiliates and many of the issuers and/or securities that it ratesMIS and the affiliates rate, are subject to extensive regulation in both the U.S., EU and in other countries (including by state and local authorities). Thus, existingIn addition, some of the services offered by MA and its affiliates are subject to regulation in a number of countries. MA also derives a significant amount of its sales from banks and other financial services providers who are subject to regulatory oversight and who are required to pass through certain regulatory requirements to key suppliers such as MA. Existing and proposed laws and regulations can impact the Company’s operations, products and the markets for securities that it rates.in which the Company operates. Additional laws and regulations have been adopted but not yet implemented or have been proposed or are being considered. Each of the existing, adopted, proposed and potential laws and regulations can increase the costs and legal risk associated with the Company’s operations, including the issuance of credit ratings, and may negatively impact Moody’s operations orthe Company’s profitability the Company’sand ability to compete, or result in changes in the demand for credit ratings,the Company's products and services, in the manner in which ratingsthe Company's products and services are utilized and in the manner in which Moody’sthe Company operates.
The regulatory landscape
has changed rapidly in recent years, and continues to evolve.
In the EU, the CRA industry is registered and supervised through apan-European regulatory framework. The European Securities and Markets Authority has direct supervisory responsibility for the registered CRA industry throughout the EU. MIS is a registered entity and is subject to formal regulation and periodic inspection. Applicable rules include procedural requirements with respect to ratings of sovereign issuers, liability for intentional or grossly negligent failure to abide by applicable regulations, mandatory rotation requirements of CRAs hired by issuers of securities for
ratings of resecuritizations, restrictions on CRAs or their shareholders if certain ownership thresholds are crossed, reporting requirements to ESMA regarding fees, and additional procedural and substantive requirements on the pricing of services. In 2016, the Commission published a report concluding that no new European legislation was needed for the industry at that time, but that it would continue to monitor the credit rating industry and analyze approaches that may strengthen existing regulation. In addition, from time to time, ESMA publishes interpretive guidance or thematic reports regarding various aspects of the regulation. Over the past quarter, two such reports have been published. The first report provides further guidance from ESMA regarding the endorsement mechanism that CRAs will need to employ for those ratings that are produced outside of the EU but are used inside the EU byEU-regulated entities. The second report discusses ESMA’s observations on CRAs fee practices.
Separately, on June 23, 2016, the U.K. voted through a referendum to exit the EU. The UK officially launched the exit process by submitting its Article 50 letter to the EU, informing it of the UK’s intention to exit. The submission of this letter “starts the clock” on the negotiation of the terms of exit which will take up to two years. The specifics regarding the “new relationship” or any transitional arrangements (bridging the UK’s exit from itsre-engagement with the EU) will only begin once the broad terms of exit have been agreed upon by all parties.
The longer-term impacts of the decision to leave the EU on the overall regulatory framework for the U.K. will depend, in part, on the relationship that the U.K. negotiates with the EU in the future. In the interim, however, the U.K.’s markets regulator (the Financial Conduct Authority) has said that all EU financial regulations will stay in place and that firms must continue to abide by their existing obligations. As a consequence, at this point in time, there is no change to the regulatory framework under which MIS operates and ESMA remains MIS’s regulator both in the EU and in the U.K.
In the U.S., CRAs are subject to extensive regulation primarily pursuant to the Reform Act and the Financial ReformDodd-Frank Act. The Reform Act added Section 15E to the Exchange Act and provided the SEC is required by these legislative actswith the authority to publish two annual reports to Congress onestablish a registration and oversight program for CRAs registered as NRSROs. The Financial ReformDodd-Frank Act requiresadded additional provisions to Section 15E. The transitions of the Presidential administration, Congress and SEC, in the U.S., as with any such government transition, could bring potential changes in the laws affecting CRAs and/or the enforcement of any new or existing legislation, regulation or directives by government authorities.
In the EU, the CRA industry is registered and supervised through a pan-EU regulatory framework. ESMA has direct supervisory responsibility for registered CRAs throughout the EU. MIS’s EU CRA subsidiaries are registered and are subject to examine each NRSRO once a yearformal regulation and issue an annual report summarizingperiodic inspection. From time to time, ESMA publishes interpretive guidance, or thematic reports regarding various aspects of the examination findings, among other requirements. The annual report requiredCRA regulation and, annually, sets out its work program for the forthcoming year. In July 2021, the Commission announced further measures in respect of its sustainable finance strategy. These include further assessments in respect of both CRAs and sustainability ratings and research, which might lead to legislative action.
On December 31, 2020, the MIS U.K. registered CRA ceased to be registered with and regulated by ESMA and became subject to regulation by the
Reform Act detailsU.K. Financial Conduct Authority (FCA). Regulatory arrangements also came into effect in both the
SEC’s views onU.K. and the
stateEU to allow credit ratings to be available for regulatory use in both the EU and the U.K. MIS has put arrangements in place to endorse its U.K. credit ratings into the EU and its EU credit ratings into the U.K. The U.K. Government is considering bringing ESG data and ratings firms within the scope of
competition, transparencyFCA authorization and
conflicts of interests among NRSROs, among other requirements. The SEC voted in August 2014 to adopt its final rules for NRSROs as required by the Financial Reform Act. The Company has made and continues to make substantial IT and other investments, and has implemented the relevant compliance obligations.regulation.
In light of the regulations that have gone into effect in both the EU and the U.S. (as well as many other countries), periodically and as a matter of course pursuant to their enabling legislation,
these regulatory authorities have, and will continue to, publish reports that describe their oversight
activities over the industry.activities. In addition, other legislation,
regulation and/or interpretation of existing regulation relating to
the Company’s operations, including credit rating,
ancillary and research services
has been or is being considered by local, national and multinational bodies and this type of activity is likely to continue in the future. Finally, in certain countries, governments may provide financial or other support to locally-based
rating agencies. For example, governments may from time to time establish official rating agencies or credit ratings criteria or procedures for evaluating local issuers.CRAs. If enacted, any such legislation and regulation could change the competitive landscape in which
MISthe Company operates. The legal status of
rating agenciesCRAs has been addressed by courts in various
decisionsjurisdictions and is likely to be considered and addressed in legal proceedings from time to time in the future. Management of the Company cannot predict whether these or any other proposals will be enacted, the outcome of any pending or possible future legal proceedings, or regulatory or legislative actions, or the ultimate impact of any such matters on the competitive position, financial position or results of operations of
Moody’s.the Company.
Moody’s and its affiliates own and control a variety of intellectual property, including but not limited to proprietary information, trademarks, research, software tools and applications, models and methodologies, databases, domain names, and other proprietary materials that, in the aggregate, are of material importance to Moody’s business. to:
| | | | | | | | | | | | | | | | | | | | | | | | | | | | | |
| | Proprietary information | | | Publications | | | Databases | |
| | | | | | | | | |
| | Trademarks | | | Software tools and applications | | | Domain names | |
| | | | | | | | | |
| | Research | | | Models and methodologies | | | Other proprietary materials that, in the aggregate, are of material importance to Moody’s business | |
Management of Moody’s believes that each of the trademarks and related corporate names, marks and logos
relating to its businesses, including those containing the term “Moody’s”
, are of material importance to the Company.
The Company, primarily through MA
(includingand its
Bureau van Dijk business),subsidiaries, licenses certain of its databases, software applications, credit risk models, training courses in credit risk and capital markets, research and other publications and services that contain intellectual property to its customers.
In addition, the Company licenses certain databases, software applications, assessments, research and other publications and services relating to ESG and climate risks that contain intellectual property to its customers. These licenses are provided pursuant to standard
fee-bearing agreements containing customary restrictions and intellectual property protections.
In addition, Moody’s licenses
from third parties certain technology, data and other intellectual property
rights owned and controlled by others.rights. Specifically, Moody’s
obtains licenses
from third parties to use financial information (such as market and index data, financial statement data,
third party research
data, default data, and security identifiers) as well as software development tools and libraries. In addition,
certain of the Company’s
Bureau van Dijk business obtainssubsidiaries obtain from third party information providers certain financial, credit risk, compliance, management, ownership,
andnews and/or other data
on companies worldwide, which
Bureau van Dijk distributesare distributed through
its companycertain of Moody's information products. The Company obtains such technology and intellectual property rights from generally available commercial sources. The Company also utilizes generally available open source software and libraries for internal use and
also, subject to appropriately permissive open source licenses, to carry out
rou-
tineroutine functions in certain of the Company’s software products. Most of such technology and intellectual property is available from a variety of sources. Although certain financial information (particularly security identifiers, certain pricing or index data, and certain company financial data in selected geographic markets sourced by Bureau van Dijk)markets) is available only from a limited number of sources, Moody’s does not believe it is dependent on any one data source for a material aspect of its business.
The Company considers its Intellectual Property to be proprietary, and Moody’s relies on a combination
The names of Moody’s products and services referred to herein are trademarks, service marks or registered trademarks or service marks owned by or licensed to Moody’s or one or more of its
subsidiaries.EMPLOYEES
Asaffiliates. The Company owns seventy-five patents (including granted, allowed and pending patents). None of December 31, 2017 the numberCompany's intellectual property is subject to a specific expiration date, except to the extent that the patents and the copyright in items that the Company creates (such as credit reports, research, software, and other written opinions) expire pursuant to relevant law.
The Company considers its intellectual property to be proprietary, and Moody’s relies on a combination of
full-time equivalent employeescopyright, trademark, trade secret, patent, non-disclosure and other contractual and technological safeguards for protection. Moody’s also pursues instances of
Moody’s was approximately 12,000.third-party infringement of its intellectual property in order to protect the Company’s rights.
Moody’s investor relations
Internetinternet website is
http:https://ir.moodys.com/. Under the “SEC Filings” tab at this website, the Company makes available free of charge its annual reports on Form
10-K, quarterly reports on Form
10-Q, current reports on Form
8-K and amendments to those reports as soon as reasonably practicable after they are filed with, or furnished to, the SEC.
The SEC maintains an internet site that contains annual, quarterly and current reports, proxy and other information statements that the Company files electronically with the SEC. The SEC’s internet site is
http:https://www.sec.gov/.
Executive Officers of the Registrant
INFORMATION ABOUT OUR EXECUTIVE OFFICERS
| | |
Name, Age and Position
| | Biographical Data
|
| |
Mark E. Almeida, 58
President, Moody’s Analytics
| | Mr. Almeida has served as President of Moody’s Analytics since January 2008. Prior to this position, Mr. Almeida was Senior Vice President of Moody’s Corporation from August 2007 to January 2008, Senior Managing Director of the Investor Services Group (ISG) at Moody’s Investors Service, Inc. from December 2004 to January 2008 and was Group Managing Director of ISG from June 2000 to December 2004. Mr. Almeida joined Moody’s Investors Service, Inc. in April 1988 and has held a variety of positions with the company in both the U.S. and overseas. |
| |
Richard Cantor, 60
Chief Risk Officer
| | Mr. Cantor has served as Chief Risk Officer of Moody’s Corporation since December 2008 and as Chief Credit Officer of Moody’s Investors Service, Inc. since November 2008. From July 2008 to November 2008, Mr. Cantor served as Acting Chief Credit Officer. Prior thereto, Mr. Cantor was Managing Director of Moody’s Credit Policy Research Group from June 2001 to July 2008, after serving as Senior Vice President in the Financial Guarantors Rating Group. Mr. Cantor joined Moody’s in 1997 from the Federal Reserve Bank of New York, where he served as Assistant Vice President in the Research Group and was Staff Director at the Discount Window. Prior to the Federal Reserve, Mr. Cantor taught Economics at UCLA and Ohio State and has taught on an adjunct basis at the business schools of Columbia University and New York University. |
| |
Michael S. Crimmins, 47
Senior Vice President and
Corporate Controller
| | Mr. Crimmins has served as the Company’s Senior-Vice President—Corporate Controller since August 2016. Mr. Crimmins joined Moody’s in November 2004 as Assistant Controller. Prior to joining the Company, Mr. Crimmins worked at Deloitte where his last position held was a Senior Manager in their Assurance and Advisory Practice. He also served at PricewaterhouseCoopers as a consultant. |
| | |
Name, Age, Position and Position | | Biographical Data |
| |
| | President Moody’s Investors Service | | and Chief Executive Officer Mr. Fauber has served as President—the Company’s President and Chief Executive Officer since January 2021. Mr. Fauber joined the Board of Directors in October 2020 and he currently serves on the Executive Committee of the Board of Directors. Prior to serving as CEO, Mr. Fauber served as Chief Operating Officer from November 2019 to December 2020, as President of Moody’s Investors Service, sinceInc. from June 1, 2016. He served2016 to October 2019, as Senior Vice President—Corporate & Commercial Development of Moody’s Corporation from April 2014 to May 31, 2016, and was Head of the MIS Commercial Group from January 2013 to May 31, 2016. From April 2009 through April 2014, he served as Senior Vice President –CorporatePresident—Corporate Development of Moody’s Corporation. Mr. Fauber served as Vice President-CorporatePresident—Corporate Development from September 2005 to April 2009. Prior to joining Moody’s, Mr. Fauber served in several roles at Citigroup and its investment banking subsidiary Salomon Smith Barney from 1999 to 2005. From 1992-1996, Mr. Fauber worked at NationsBank (now Bank of America) in the middle market commercial banking group.subsidiary. |
| | |
| | Executive Vice President and General Counsel | | Mr. Goggins has served as the Company’s Executive Vice President and General Counsel since April 2011 and the Company’s Senior Vice President and General Counsel from October 2000 until April 2011. Mr. Goggins joined Moody’s Investors Service, Inc. in February 1999 as Vice President and Associate General Counsel. |
| | |
Linda S. Huber, 59
| | Mark Kaye, 42 Executive Vice President and Chief Financial Officer | | Ms. HuberMr. Kaye has served as the Company’s Executive Vice President and President—Chief Financial Officer since May 2005. Prior to that, she served as Executive Vice PresidentApril 2021 and Chief Financial Officer at U.S. Trust Company, a subsidiary of Charles Schwab & Company, Inc., from 2003 to 2005. Prior to U.S. Trust, she was Managing Director at Freeman & Co. from 1998 through 2002. She served PepsiCo as Vice President of Corporate Strategy and Development from 1997 until 1998 and as Vice President and Assistant Treasurer from 1994 until 1997. She served as Vice President in the Energy Investment Banking Group at Bankers Trust Company from 1991 until 1994 and as an Associate in the Energy Group at First Boston Corporation from 1986 through 1990. She also held the rank of Captain in the U.S. Army where she served from 1980 to 1984. |
| |
Melanie Hughes, 55
Senior Vice President and
Chief Human Resources Officer | | Ms. Hughes has served as Senior Vice President—Chief Human Resources Officer since September 2017. Prior to joining the Company, Ms. Hughes was Chief Human Resource Officer & Executive Vice President Human Resources at American Eagle Outfitters from July 2016 to September 2017 and served as Executive Vice President, Human Resources at Tribune Media from May 2013 to June 2016. She has held several senior management roles for many different companies such as Coach, Gilt Group, DoubleClick and UBS Warburg. |
| |
Raymond W. McDaniel, Jr., 60
President and
Chief Executive Officer
| | Mr. McDaniel has served as the President and Chief Executive Officer of the Company since April 2012, and served as the Chairman and Chief ExecutiveFinancial Officer from April 2005 until April 2012. He currently serves on the Executive Committee of the Board of Directors. Mr. McDaniel served as the Company’s President from October 2004 until April 2005 and the Company’s Chief Operating Officer from January 2004 until April 2005. He has served as Chief Executive Officer of Moody’s Investors Service since October 2007. He held the additional titles of President from November 2001 to August 2007 and December 2008 to November 2010 and Chairman from October 2007 until June 2015. Mr. McDaniel served as the Company’s Executive Vice President from April 2003 to January 2004, and as Senior Vice President, Global Ratings and Research from November 2000 until April 2003. He served as Senior Managing Director, Global Ratings and Research of Moody’s Investors Service from November 2000 until November 2001 and as Managing Director, International from 1996 to November 2000. Mr. McDaniel currently is a Director of John Wiley & Sons, Inc. and is a member of the Board of Trustees of Muhlenberg College. |
| |
Blair L. Worrall, 61
Senior Vice President,
Ratings Delivery and Data
| | Mr. Worrall has served as Senior Vice President—Ratings Delivery and Data since February 2013 and Head of MIS Operations, Data & Controls since February 2016. He served as Head of MIS Ratings Transaction Services from January 2014 to February 2016. Mr. Worrall served as Senior Vice President—Internal Audit from April 2011 to February 2013 and as Vice President—Internal Audit from September 20072018 to April 2011. He served as the Controller for MIS from November 2004 until September 2007.2021. Prior to joining the Company, Mr. WorrallKaye was Senior Vice President Accounting for RCN Corporationand Head of Financial Planning and Analysis at Massachusetts Mutual Life Insurance Company (MassMutual) since February 2016, and Chief Financial Officer of MassMutual U.S. since July 2015. Prior to that, Mr. Kaye served as Chief Financial Officer and Senior Vice President, Retirement Solutions, at Voya Financial from 20022011 to 2004 and2015. Mr. Kaye previously held various financesenior financial and risk reporting positions at Dow Jones & Company, Inc. from 1979 to 2001.ING U.S. and ING Group, and was in the investment banking division of Credit Suisse First Boston. |
| | |
| | | | | | | | |
| | MOODY’S Name, Age, Position and Biographical Data |
| |
| | Caroline Sullivan, 53 Senior Vice President and Corporate Controller Ms. Sullivan has served as the Company’s Senior Vice President and Corporate Controller since December 2018. Prior to joining the Company, Ms. Sullivan served in several roles at Bank of America from 2011 to 2018, where her last position held was Managing Director and Global Banking Controller. Prior to that role, Ms. Sullivan supported the Global Wealth & Investment Management business from 2015 to 2017 10-Kin a variety of positions including Controller. Ms. Sullivan, a CPA, previously held various senior positions at several banks and a major accounting firm, and is a member of the Board of Directors of Financial Executives International. |
| | |
| 17 | Stephen Tulenko, 54 President, Moody’s Analytics Mr. Tulenko has served as President of Moody’s Analytics since November 2019. Mr. Tulenko served as Executive Director of Enterprise Risk Solutions from 2013 to October 2019 and as Executive Director of Global Sales, Customer Service and Marketing from 2008 to 2013. Prior to the formation of Moody’s Analytics, he held various sales, product development and product strategy roles at Moody’s Investors Service, Inc. Mr. Tulenko joined Moody’s in 1990. |
| | |
| | Michael West, 53 President, Moody’s Investors Service Mr. West has served as President of Moody’s Investors Service, Inc. since November 2019. Mr. West served as Managing Director—Head of MIS Ratings and Research from June 2016 to October 2019. Previously, Mr. West served as Managing Director—Head of Global Structured Finance from February 2014 to May 2016 and Managing Director—Head of Global Corporate Finance from January 2010 to January 2014. Earlier in his career, he was also responsible for the research strategy for the ratings businesses and before that led Corporate Finance for the EMEA Region, European Corporates and the EMEA leveraged finance business. Prior to joining Moody’s in 1998, Mr. West worked at Bank of America and HSBC in various credit roles. |
The
ITEM 1A. RISK FACTORS
Please carefully consider the following
riskdiscussion of significant factors,
and other information included in this annual report on Form10-K should be carefully considered. The risksevents and uncertainties
described below are not the only ones the Company faces. Additional risks and uncertainties not presently known to the Company or that
make an investment in the Company’s
management currently deems minor or insignificant also may impair its business operations. If anysecurities risky and provide important information for the understanding of the
following risks occur, Moody’s business, financial condition, operating results“forward-looking” statements discussed in Item 7 of this Form 10-K and
cash flows could be materially and adversely affected.elsewhere. These risk factors should be read in conjunction with the other information in this annual report on Form
10-K.
The events and consequences discussed in these risk factors could, in circumstances the Company may not be able to accurately predict, recognize, or control, have a material adverse effect on Moody’s business, financial condition, operating results (including components of the Company’s financial results such as sales and profits), cash flows and stock price. These risk factors do not identify all risks that Moody’s faces. The Company could also be affected by factors, events, or uncertainties that are not presently known to the Company or that the Company currently does not consider to present significant risks. In addition to the effects of the COVID-19 pandemic and resulting global disruptions on our business and operations discussed in Item 7 of this Form 10-K and in the risk factors below, additional or unforeseen effects from the COVID-19 pandemic and the global economic climate may give rise to or amplify many of these risks discussed below.
A. Legal and Regulatory Risks
Moody’s Faces Risks Related to U.S. Laws and Regulations Affecting the Credit Rating Industry
May Negatively Impact the Nature and
Economics of the Company’s Business.Moody’s Customers.
Moody’s operates in a highly regulated industry and is subject to extensive regulation by federal, state and local authorities in the U.S., including the Reform Act and the
Financial ReformDodd-Frank Act. These regulations are complex, continually evolving and have tended to become more stringent over time.
Additionally, potential changes in Congress may increase the uncertainty with regard to potential changes in these laws and regulations and the enforcement of any new or existing legislation or directives by government authorities. See “Regulation” in Part
1,I, Item 1 of this annual report on Form
10-K for more information.
TheseThe current laws and regulations:
» | | seek to encourage, and may result in, increased competition among rating agencies and in the credit rating business; |
» | | may result in alternatives to credit ratings or changes in the pricing of credit ratings; |
» | | restrict the use of information in the development or maintenance of credit ratings; |
» | | increase regulatory oversight of the credit markets and CRA operations; |
» | | provide for direct jurisdiction of the SEC over CRAs that seek NRSRO status, and grant authority to the SEC to inspect the operations of CRAs; and |
» | | authorize the adoption of enhanced oversight standards and new pleading standards, which may result in increases in the number of legal proceedings claiming liability for losses suffered by investors on rated securities and aggregate legal defense costs. |
These
–seek to encourage, and may result in, increased competition among CRAs and in the credit rating business;
–may result in alternatives to credit ratings or changes in the pricing of credit ratings;
–restrict the use of information in the development or maintenance of credit ratings;
–increase regulatory oversight of the credit markets and CRA operations;
–provide the SEC with direct jurisdiction over CRAs that seek NRSRO status, and grant authority to the SEC to inspect the operations of CRAs; and
–provide for enhanced oversight standards and specialized pleading standards, which may result in increases in the number of legal proceedings claiming liability for losses suffered by investors on rated securities and aggregate legal defense costs.
If these laws and regulations, and any future rulemaking or court rulings, could result in reducedreduce demand for credit ratings and increasedor increase costs, which Moody’s may be unable to pass such costs through to customers. In addition, there may be uncertainty over the scope, interpretation and administration of such laws and regulations. The Company may be required to incur significant expenses in order to ensureCompany’s compliance and efforts to mitigate the risk of fines, penalties or other sanctions.sanctions can result in significant expenses. Legal proceedings could becomethat are increasingly lengthy and there may becan result in uncertainty over and exposure to liability.
It is difficult to accurately assess the future impact of legislative and regulatory requirements on Moody’s business and its customers’ businesses. For example, new laws and regulations may affect MIS’s communications with issuers as part of the rating assignment process, alter the manner in which MIS’s
credit ratings are developed, assigned and communicated, affect the manner in which MIS or its customers or users of credit ratings operate, impact the demand for MIS’s
credit ratings and alter the economics of the credit ratings business, including by restricting or mandating business models for
rating agencies.CRAs. Further, speculation concerning the impact of legislative and regulatory initiatives and the increased uncertainty over potential liability and adverse legal or judicial determinations may negatively affect Moody’s stock price. Although these legislative and regulatory initiatives apply to
rating agenciesCRAs and credit markets generally, they may affect Moody’s in a disproportionate manner. Each of these developments
increaseincreases the costs and legal risk associated with the issuance of credit ratings and
maycan have a material adverse effect on Moody’s operations, profitability and competitiveness, the demand for credit ratings and the manner in which such ratings are utilized.
In addition, MA derives a significant amount of its sales from banks and other financial services providers who are subject to regulatory oversight. U.S. banking regulators, including the Office of the Comptroller of the Currency, the Federal Deposit Insurance Corporation, the Board of Governors of the Federal Reserve System and the Consumer Financial Protection Board, as well as many state agencies, have issued guidance to insured depository institutions and other providers of financial services on assessing and managing risks associated with third-party relationships, which include all business arrangements between a financial services provider and another entity, by contract or otherwise, and generally requires banks and financial services providers to exercise comprehensive oversight throughout each phase of a bank or financial service provider’s business arrangement with third-party service providers, and instructs banks and financial service providers to adopt risk management processes commensurate with the level of risk and complexity of their third-party relationships. In light of this, MA’s existing or potential bank and financial services customers subject to this guidance have sought to and may further revise their third-party risk management policies and processes and the terms on which they do business with MA. This can result in delayed or reduced sales to such customers, adversely affect MA’s relationship with such customers, increase the costs of doing business with such customers and/or result in MA assuming greater financial and legal risk under service agreements with such customers.
Moody’s Faces Risks Related to Financial Reforms Outside the U.S. Affecting the Credit Rating Industry
May Negatively Impact the Nature and
Economics of the Company’s Business.Moody’s Customers.
In addition to the extensive and evolving U.S. laws and regulations governing the industry, foreign jurisdictions have taken measures to increase regulation of rating agenciesregulate CRAs and the markets for credit ratings. In particular, the EU has adopted a common regulatory framework for rating agenciesCRAs operating in the EU. As a result, ESMA has direct supervisory authority for CRAs in the EU and continues to monitor the credit rating industry and analyze approaches that may strengthen existing regulation. Credit ratings emanating from outside the EU are subject to ESMA’s oversight if they are endorsed into the EU. Additionally, other foreign jurisdictions have recently taken measures to increase regulation of CRAs and markets for credit ratings. See “Regulation” in Part 1, Item 1 of this annual report on Form 10-K for more information.
The EU and other jurisdictions, as discussed further below, adopt legislation and engage in rulemaking on an ongoing basis that significantly impacts operations and the markets for the Company's products and services. Future laws and regulations could extend to products and services not currently regulated. These regulations could: (i) affect the need for debt securities to be rated, (ii) expand supervisory remits to include credit ratings issued outside the home jurisdiction and used for regulatory purposes, (iii) increase the level of competition in the market for credit ratings, (iv) establish criteria for credit ratings or limit the entities authorized to provide credit ratings, (v) restrict the collection, use, accuracy, correction and sharing of personal information by CRAs, or (vi) regulate pricing (for example to require that fees that are based on costs and are non-discriminatory) on products and services provided by MA such as those products that incorporate credit ratings and research originated by MIS. Future regulations could also affect products and services the Company offers in the ESG sector (including those offered by Moody’s ESG Solutions Group).
Additionally, as of the date of the filing of this annual report on Form 10-K, there remains uncertainty regarding the future impact that Brexit will have on the credit rating industry within the U.K., the EU and other jurisdictions. Following the Brexit implementation period that ended December 31, 2020 the MIS U.K. registered CRA ceased to be registered with and regulated by ESMA and became subject to regulation by the U.K. Financial Conduct Authority. Regulatory arrangements put in place in both the U.K. and the EU allow credit ratings to be available for regulatory use in both the EU and the U.K. after the end of the Brexit-implementation period. MIS has put arrangements in place to endorse its U.K. credit ratings into the powerEU and its EU credit ratings into the U.K. On December 31, 2020, the U.K. also onshored CRA Regulation, with certain necessary modifications, into U.K. domestic law (the “U.K. CRA Regulation”). The U.K. CRA Regulation contains requirements for the registration, regulation and supervision of CRAs based in the U.K. It also sets out the circumstances in which U.K. financial institutions can use credit ratings for regulatory purposes, as well as specific obligations for issuers, originators and sponsors relating to take enforcement action againstnon-compliant CRAs, including throughstructured finance instruments. It is unclear how the issuanceEU CRA Regulation and the U.K. CRA Regulation will differ over time.
Both of
public notices, withdrawal of registrationMoody’s segments face risks related to financial reforms outside the U.S. affecting the credit rating industry and
in some cases, the imposition of fines.Moody’s customers. MIS is a registered entity and is therefore subject to formal regulation and periodic inspectionor other inspections in the EU. ApplicableEU and other foreign jurisdictions, such as, but not limited to, Hong Kong and China, where it operates through registered subsidiaries. For example:
–In the EU and the U.K., applicable rules include procedural requirements with respect to credit ratings of sovereign issuers, liability for intentional or grossly negligent failure to abide by applicable regulations, mandatory rotation requirements of CRAs hired by issuers of securities for credit ratings of resecuritizations, and restrictions on CRAs or their shareholders if certain ownership thresholds are crossed. Additional procedural and substantive requirements include conditions for the issuance of credit ratings, rules regarding the organization of CRAs, restrictions on activities deemed to create a conflict of interest, including fees that are based on costs and arenon-discriminatory, and special requirements for the ratingcredit ratings of structured finance instruments. Compliance
–In Hong Kong, applicable rules include liability for the intentional or negligent dissemination of false and misleading information and procedural requirements for the notification of certain matters to regulators. In addition, MIS Hong Kong is subject to a code of conduct applicable to CRAs that imposes procedural and substantive requirements on the preparation and issuance of credit ratings, restrictions on activities deemed to create a conflict of interest including the disclosure of its compensation arrangements with rated entities and special requirements for credit ratings of structured finance instruments. A failure to comply with these procedural and substantive requirements also exposes MIS Hong Kong to the risk of regulatory enforcement action which could result in financial penalties or, in serious cases, affect its ability to conduct credit rating activities in Hong Kong.
–In China, while MIS is not a licensed CRA, it does issue global credit ratings from offices outside of China regarding Chinese issuers. In addition, the Company holds a 30% investment in a CRA licensed in China. China has laws applicable to domestic CRAs as well as foreign investment in such entities and entities in general (including national security review). Such laws are broadly crafted and the implementation and interpretation of such laws are subject to the broad discretion of Chinese regulators, which could affect our ability to conduct business in China.
–In addition, U.S. economic sanctions have increasingly targeted Chinese persons. In response, China issued a blocking statute that establishes a framework for limiting the effect of foreign sanctions on Chinese persons. Blocking statutes typically create conflicts of law. An entity that is subject to conflicting laws in multiple jurisdictions may need to determine a means to comply with such laws. Such conflicts could eventually affect the ability of entities to adhere to applicable laws.
With respect to MA, regulators in Europe and other foreign markets in which MA is active have issued guidance similar to that issued in the U.S. relating to financial institutions’ assessment and management of risks associated with third-party relationships. In light of this, MA’s existing or potential bank and financial services customers subject to this guidance have sought and may further revise their third-party risk management policies and processes and the terms on which they do business with MA. This can result in delayed or reduced sales to such customers, adversely affect MA’s relationship with such customers, increase the costs of doing business with such customers and/or result in MA assuming greater financial and legal risk under service agreements with such customers.
Although Moody’s will monitor developments related to financial reforms outside the U.S. affecting the credit rating industry and Moody’s customers, Moody’s cannot predict the extent of such future laws and regulations, and the effect that they will have on Moody’s business or the potential for increased exposure to liability could be significant. For example, compliance with the EU,
U.K. and other foreign regulations may increase costs of operations and could have a significant negative effect on Moody’s operations, profitability or ability to compete, or the markets for its products and services, including in ways that Moody’s presently is unable to predict. In addition, exposure to increased liability under the EU,
U.K. regulations
and regulations of other foreign jurisdictions may further increase costs and legal risks associated with the issuance of credit ratings and materially and adversely impact Moody’s results of operations.
The EU and other jurisdictions engage in rulemaking on an ongoing basis that could significantly impact operations or the markets for Moody’s products and services, including regulations extending to products and services not currently regulated and regulations affecting the need for debt securities to be rated, expansion of supervisory remit to includenon-EU ratings used for regulatory purposes, increasing the level of competition in the market for credit ratings, establishing criteria for credit ratings or limiting the entities authorized to provide credit ratings. Moody’s cannot predict the extent of such future laws and regulations, and the effect that they will have on Moody’s business or the potential for increased exposure to liability could be significant. Financial reforms in the EU, U.K. and other foreign jurisdictions may have a material adverse effect on Moody’s business, operating results and financial condition.
The Company Faces Exposure to Litigation and Government Regulatory Proceedings, Investigations and Inquiries Related to Rating Opinions and Other Business Practices.
Moody’s faces exposure to litigation and government and regulatory proceedings, investigations and inquiries related to MIS’s ratings actions, as well as other business practices and products.products within both MIS and MA. If the market value of credit-dependent instruments declines or defaults, whether as a result of difficult economic times, turbulent markets or otherwise, the number of investigations and legal proceedings that Moody’s faces could increase significantly. Parties who invest in securities rated by MIS may pursue claims against MIS or Moody’s for losses they face in their portfolios. For instance, Moody’s has faced numerous class action lawsuits and other litigation, government investigations and inquiries concerning events linked to the U.S. subprime residential mortgage sector and broader deterioration in the credit markets during the financial crisis of 2007-2008. Evolving expectations on ESG disclosures and reporting could also result in new regulatory actions at a corporate and business unit level. Legal proceedings impose additional expenses on the Company and require the attention of senior management to an extent that may significantly reduce their ability to devote time to addressing other business issues, and any of these proceedings, investigations or inquiries could ultimately result in adverse judgments, damages, fines, penalties or activity restrictions. Risks relating to legal proceedings may beare heightened in foreign jurisdictions that lack the legal protections or liability standards comparable to those that exist in the U.S. In addition, new laws and regulations have been and may continue to be enacted that establish lower liability standards, shift the burden of proof or relax pleading requirements, thereby increasing the risk of successful litigations in the U.S. and in foreign jurisdictions. These litigation risks are often difficult to assess or quantify. Moody’s may not have adequate insurance or reserves to cover these risks, and the existence and magnitude of these risks often remains unknown for substantial periods of time. Furthermore, to the extent thatwhen Moody’s is unable to achieve dismissals at an early stage and litigation matters proceed to trial, the aggregate legal defense costs incurred by Moody’s increase substantially, as does the risk of an adverse outcome.
Additionally, as litigation or the process to resolve pending matters progresses, Moody’s will continue to review the latest information available and may change its accounting estimates, which could require Moody’s to record or increase liabilities in the consolidated financial statements in future periods. See Note 1921 to the consolidated financial statements for more information regarding ongoing investigations and civil litigation that the Company currently faces. Due to the number of these proceedings and the significant amount of damages sought, there is a risk that Moody’s will be subject to judgments, settlements, fines, penalties or other adverse results that could have a material adverse effect on its business, operating results and financial condition.
The Company
is Exposed to Legal, Economic, Operational and Regulatory Risks of Operating in Multiple Jurisdictions.Moody’s conducts operations in various countries outside the U.S. and derives a significant portion of its revenue from foreign sources. Changes in the economic condition of the various foreign economies in which the Company operates may have an impact on the Company’s business. For example, economic uncertainty in the Eurozone or elsewhere could affect the number of securities offerings undertaken within those particular areas. In addition, operations abroad expose Moody’s to a number of legal, economic and regulatory risks such as:
» | | exposure to exchange rate movements between foreign currencies and USD; |
» | | restrictions on the ability to convert local currency into USD and the costs, including the tax impact, of repatriating cash held by entities outside the U.S.; |
» | | U.S. laws affecting overseas operations including domestic and foreign export and import restrictions, tariffs and other trade barriers; |
» | | differing and potentially conflicting legal or civil liability, compliance and regulatory standards, including as a result of the U.K.’s referendum vote to withdraw from the EU, Brexit; |
» | | current and future regulations relating to the imposition of mandatory rotation requirements on CRAs hired by issuers of securities; |
» | | uncertain and evolving laws and regulations, including those applicable to the financial services industries, such as the European Union’s implementation of the Markets in Financial Instruments Directive II, MiFID II, in January 2018, and to the protection of intellectual property; |
» | | economic, political and geopolitical market conditions; |
» | | the possibility of nationalization, expropriation, price controls and other restrictive governmental actions; |
» | | competition with local rating agencies that have greater familiarity, longer operating histories and/or support from local governments or other institutions; |
» | | uncertainties of obtaining data and creating products and services relevant to particular geographic markets; |
» | | reduced protection for intellectual property rights; |
» | | longer payment cycles and possible problems in collecting receivables; |
» | | differing accounting principles and standards; |
» | | difficulties in staffing and managing foreign operations; |
» | | difficulties and delays in translating documentation into foreign languages; and |
» | | potentially adverse tax consequences. |
Additionally, Moody’s is subject to complex U.S., foreign and other local laws and regulations that are applicable to its operations abroad, such as the Foreign Corrupt Practices Act of 1977, the U.K. Bribery Act of 2010 and other anti-bribery and anti-corruption laws. Although the Company has implemented internal controls, policies and procedures and employee training and compliance programs to deter prohibited practices, such measures may not be effective in preventing employees, contractors or agents from violating or circumventing such internal policies and violating applicable laws and regulations. Any determination that the Company has violated anti-bribery or anti-corruption laws could have a material adverse effect on Moody’s business, operating results and financial condition. Compliance with international and U.S. laws and regulations that apply to the Company’s international operations increases the cost of doing business in foreign jurisdictions. Violations of such laws and regulations may result in severe fines and penalties, criminal sanctions, administrative remedies, restrictions on business conduct and could have a material adverse effect on Moody’s reputation, its ability to attract and retain employees, its business, operating results and financial condition.
Moody’s Operations and Infrastructure May Malfunction or Fail.
Moody’s ability to conduct business may be materially and adversely impacted by a disruption in the infrastructure that supports its businesses and the communities in which Moody’s is located, including New York City, the location of Moody’s headquarters, major cities worldwide in which Moody’s has offices, and locations in China used for certain Moody’s back office work. This may include a disruption involving physical or technological infrastructure (whether or not controlled by the Company), including the Company’s electronic delivery systems, data center facilities, or the Internet, used by the Company or third parties with or through whom Moody’s conducts business. Many of the Company’s products and services are delivered electronically and the Company’s customers depend on the Company’s ability to receive, store, process, transmit and otherwise rapidly handle very substantial quantities of data and transactions on computer-based networks. The Company’s customers also depend on the continued capacity, reliability and security of the Company’s telecommunications, data centers, networks and other electronic delivery systems, including its websites and connections to the Internet. The Company’s employees also depend on these systems for internal use. Any significant failure, compromise, cyber-breach, interruption or a significant slowdown of operations of the Company’s infrastructure, whether due to human error, capacity constraints, hardware failure or defect, natural disasters, fire, power loss, telecommunication failures,break-ins, sabotage, intentional acts of vandalism, acts of terrorism, political unrest, war or otherwise, may impair the Company’s ability to deliver its products and services.
Moody’s efforts to secure and plan for potential disruptions of its major operating systems may not be successful. The Company relies on third-party providers to provide certain essential services. While the Company believes that such providers are reliable, the Company has limited control over the performance of such providers. To the extent any of the Company’s third-party providers ceases to provide these services in an efficient, cost-effective manner or fails to adequately expand its services to meet the Company’s needs and the needs of the Company’s customers, the Company could experience lower revenues and higher costs. Additionally, although the Company maintains processes to prevent, detect and recover from a disruption, the Company also does not have fully redundant systems for most of its smaller office locations andlow-risk systems, and its disaster recovery plan does not include restoration ofnon-essential services. If a disruption occurs in one of Moody’s locations or systems and its personnel in those locations or those who rely on such systems are unable to utilize other systems or communicate with or travel to other locations, such persons’ ability to service and interact with Moody’s customers may suffer. The Company cannot predict with certainty all of the adverse effects that could result from the Company’s failure, or the failure of a third party, to efficiently address and resolve these delays and interruptions. A disruption to Moody’s operations or infrastructure may have a material adverse effect on its reputation, business, operating results and financial condition.
The Company isIs Exposed to Risks Related to Cybersecurity and Protection of Confidential Information.
The Company’s operations rely on the secure processing, storage and transmission of confidential, sensitive, proprietary and other types of information relating to its business operations and confidential and sensitive information about its customers and employees in the
Company’s computer systems and networks, and in those of its third party vendors. The cyber risks the Company faces range from cyber-attacks common to most industries, to more advanced threats that target the Company because of its prominence in the global marketplace, or due to its ratings of sovereign debt. Breaches of Moody’s or Moody’s vendors’ technology and systems, whether from circumvention of security systems,denial-of-service attacks or other cyber-attacks, hacking, “phishing” attacks, computer viruses, ransomware, or malware, employee or insider error, malfeasance, social engineering, physical breaches or other actions, may result in manipulation or corruption of sensitive data, material interruptions or malfunctions in the Company’s or such vendors’ web sites, applications, data processing, or disruption of other business operations, or may compromise the confidentiality and integrity of material information held by the Company (including information about Moody’s business, employees or customers), as well as sensitive personally identifiable information (“PII”), the disclosure of which could lead to identity theft. Measures that Moody’s takes to avoid, detect, mitigate or recover from material incidents can be expensive, and may be insufficient, circumvented, or may become ineffective. To conduct its operations, the Company regularly moves data across national borders, and consequently is subject to a variety of continuously evolving and developing laws and regulations in the United States and abroad regarding privacy, data protection and data security. The scope of the laws that may be applicable to Moody’s is often uncertain and may be conflicting, particularly with respect to foreign laws. For example, the European Union’s General Data Protection Regulation (“GDPR”), which greatly increases the jurisdictional reach of European Union law and adds a broad array of requirements for handling personal data, including the public disclosure of significant data breaches, becomes effective in May 2018. Additionally, other countries have enacted or are enacting data localization laws that require data to stay within their borders. All of these evolving compliance and operational requirements impose significant costs that are likely to increase over time.
The Company has invested and continues to invest in risk management and information security measures in order to protect its systems and data, including employee training, disaster plans, and technical defenses, in order to protect its systems and data. The cost and operational consequences of implementing, maintaining and enhancing further data or system protection measures could increase significantly to overcome increasingly intense, complex, and sophisticated global cyber threats. Despite the Company’s best efforts, it is not fully insulated from data breaches and system disruptions. Recent well-publicized security breaches at other companies have led to enhanced government and regulatory scrutiny of the measures taken by companies to protect against cyber-attacks, and may in the future result in heightened cybersecurity requirements, including additional regulatory expectations for oversight of vendors and service providers. Any material breaches of cybersecurity or media reports of perceived security vulnerabilities to the Company’s systems or those of the Company’s third parties, even if no breach has been attempted or occurred, could cause the Company to experience reputational harm, loss of customers and revenue, regulatory actions and scrutiny, sanctions or other statutory penalties, litigation, liability for failure to safeguard the Company’s customers’ information, or financial losses that are either not insured against or not fully covered through any insurance maintained by the Company. Any of the foregoing may have a material adverse effect on Moody’s business, operating results and financial condition.
Changes in the Volume of Debt Securities Issued in Domestic and/or Global Capital Markets, Asset Levels and Flows into Investment Levels and Changes in Interest Rates and Other Volatility in the Financial Markets May Negatively Impact the Nature and Economics of the Company’s Business.
Moody’s business is impacted by general economic conditions and volatility in the U.S. and world financial markets. Furthermore, issuers of debt securities may elect to issue securities without ratings or securities which are rated or evaluated bynon-traditional parties such as financial advisors, rather than traditional CRAs, such as MIS. A majority of Moody’s credit-rating-based revenue is transaction-based, and therefore it is especially dependent on the number and dollar volume of debt securities issued in the capital markets. Market disruptions and economic slowdown and uncertainty have in the past negatively impacted the volume of debt securities issued in global capital markets and the demand for credit ratings. The Tax Act, in addition to other changes to U.S. tax laws and policy, could negatively affect the volume of debt securities issued in the U.S. For example, the Tax Act will limit deductibility on interest payments and significantly reduce the tax cost associated with the repatriation of cash held outside the U.S., both of which could negatively affect the volume of debt securities issued. Conditions that reduce issuers’ ability or willingness to issue debt securities, such as market volatility, declining growth, currency devaluations or other adverse economic trends, reduce the number and dollar-equivalent volume of debt issuances for which Moody’s provides ratings services and thereby adversely affect the fees Moody’s earns in its ratings business.
Economic and government factors such as a long-term continuation of difficult economic conditions or are-emergence of the sovereign debt crisis in Europe may have an adverse impact on the Company’s business. Future debt issuances also could be negatively affected by increases in interest rates, widening credit spreads, regulatory and political developments, growth in the use of alternative sources of credit, and defaults by significant issuers. Declines or other changes in the markets for debt securities may materially and adversely affect the Company’s business, operating results and financial condition.
Moody’s initiatives to reduce costs to counteract a decline in its business may not be sufficient and cost reductions may be difficult or impossible to obtain in the short term, due in part to rent, technology, compliance and other fixed costs associated with some of the Company’s operations as well as the need to monitor outstanding ratings. Further, cost-reduction initiatives, including those under-
taken to date, could make it difficult for the Company to rapidly expand operations in order to accommodate any unexpected increase in the demand for ratings. Volatility in the financial markets, including changes in the volumes of debt securities and changes in interest rates, may have a material adverse effect on the business, operating results and financial condition, which the Company may not be able to successfully offset with cost reductions.
The Company Faces Increased Pricing Pressure from Competitors and/or Customers.
There is price competition in the credit rating, research, credit risk management markets, research and analytical services and financial training and certification services. Moody’s faces competition globally from other CRAs and from investment banks and brokerage firms that offer credit opinions in research, as well as fromin-house research operations. Competition for customers and market share has spurred more aggressive tactics by some competitors in areas such as pricing and services, as well as increased competition fromnon-NRSROs that evaluate debt risk for issuers or investors. At the same time, a challenging business environment and consolidation among customers, particularly those involved in structured finance products, and other factors affecting demand may enhance the market power of competitors and reduce the Company’s customer base. Weak economic growth intensifies competitive pricing pressures and can result in customers’ use of free or lower-cost information that is available from alternative sources. While Moody’s seeks to compete primarily on the basis of the quality of its products and services, it may lose market share if its pricing is not sufficiently competitive. In addition, the Reform Act was designed to encourage competition among rating agencies. The formation of additional NRSROs may increase pricing and competitive pressures. Furthermore, in some of the countries in which Moody’s operates, governments may provide financial or other support to local rating agencies. Any inability of Moody’s to compete successfully with respect to the pricing of its products and services could have a material adverse impact on its business, operating results and financial condition.
The Company is Exposed to Reputation and Credibility Concerns.
Moody’s reputation and the strength of its brand are key competitive strengths. To the extent that the rating agency business as a whole or Moody’s, relative to its competitors, suffers a loss in credibility, Moody’s business could be significantly impacted. Factors that may have already affected credibility and could potentially continue to have an impact in this regard include the appearance of a conflict of interest, the performance of securities relative to the rating assigned to such securities, the timing and nature of changes in ratings, a major compliance failure, negative perceptions or publicity and increased criticism by users of ratings, regulators and legislative bodies, including as to the ratings process and its implementation with respect to one or more securities and intentional or unintentional misrepresentations of Moody’s products and services in advertising materials, public relations information, social media or other external communications. Operational errors, whether by Moody’s or a Moody’s competitor, could also harm the reputation of the Company or the credit rating industry. Damage to reputation and credibility could have a material adverse impact on Moody’s business, operating results and financial condition, as well as on the Company’s ability to find suitable candidates for acquisition.
The Introduction of Competing Products or Technologies by Other Companies May Negatively Impact the Nature and Economics of the Company’s Business.
The markets for credit ratings, research, credit risk management services, research and analytical services and financial training and certification services are highly competitive and characterized by rapid technological change, changes in customer demands, and evolving regulatory requirements, industry standards and market preferences. The ability to develop and successfully launch and maintain innovative products and technologies that anticipate customers’ changing requirements and utilize emerging technological trends is a key factor in maintaining market share. Moody’s competitors include both established companies with significant financial resources, brand recognition, market experience and technological expertise, and smaller companies which may be better poised to quickly adopt new or emerging technologies or respond to customer requirements. Competitors may develop quantitative methodologies or related services for assessing credit risk that customers and market participants may deem preferable, more cost-effective or more valuable than the credit risk assessment methods currently employed by Moody’s, or may position, price or market their products in manners that differ from those utilized by Moody’s. Moody’s also competes indirectly against consulting firms and technology and information providers; these indirect competitors could in the future choose to compete directly with Moody’s, cease doing business with Moody’s or change the terms under which it does business with Moody’s in a way that could negatively impact our business. In addition, customers or others may develop alternative, proprietary systems for assessing credit risk. Such developments could affect demand for Moody’s products and services and its growth prospects. Further, the increased availability in recent years of free or relatively inexpensive Internet information may reduce the demand for Moody’s products and services. For example, in December 2016, ESMA launched a database providing access to free, current information on certain credit ratings and rating outlooks. Moody’s growth prospects also could be adversely affected by Moody’s failure to make necessary or optimal capital infrastructure expenditures and improvements and the inability of its information technologies to provide adequate capacity and capabilities to meet increased demands of producing quality ratings and research products at levels achieved by competitors. Any inability of Moody to compete successfully may have a material adverse effect on its business, operating results and financial condition.
Possible Loss of Key Employees and Related Compensation Cost Pressures May Negatively Impact the Company.
Moody’s success depends upon its ability to recruit, retain and motivate highly skilled, experienced financial analysts and other professionals. Competition for skilled individuals in the financial services industry is intense, and Moody’s ability to attract high quality
employees could be impaired if it is unable to offer competitive compensation and other incentives or if the regulatory environment mandates restrictions on or disclosures about individual employees that would not be necessary in competing industries. As greater focus has been placed on executive compensation at public companies, in the future, Moody’s may be required to alter its compensation practices in ways that could adversely affect its ability to attract and retain talented employees. Investment banks, investors and competitors may seek to attract analyst talent by providing more favorable working conditions or offering significantly more attractive compensation packages than Moody’s. Moody’s also may not be able to identify and hire the appropriate qualified employees in some markets outside the U.S. with the required experience or skills to perform sophisticated credit analysis. There is a risk that even if the Company invests significant resources in attempting to attract, train and retain qualified personnel, it will not succeed in its efforts, and its business could be harmed.
Moody’s is highly dependent on the continued services of Raymond W. McDaniel, Jr., the President and Chief Executive Officer, and other senior officers and key employees. The loss of the services of skilled personnel for any reason and Moody’s inability to replace them with suitable candidates quickly or at all, as well as any negative market perception resulting from such loss, could have a material adverse effect on Moody’s business, operating results and financial condition.
Moody’s Acquisitions, Dispositions and Other Strategic Transactions or Internal Technology Investments May Not Produce Anticipated Results Exposing the Company to Future Significant Impairment Charges Relating to its Goodwill, Intangible Assets or Property and Equipment.
Moody’s has entered into and expects to continue to enter into acquisition, disposition or other strategic transactions and expects to make various investments to strengthen its business and grow the Company. Such transactions as well as internal technology investments present significant challenges and risks. The market for acquisition targets, dispositions and other strategic transactions is highly competitive, especially in light of industry consolidation, which may affect Moody’s ability to complete such transactions. If Moody’s is unsuccessful in completing such transactions or if opportunities for expansion do not arise, its business, operating results and financial condition could be materially adversely affected. Additionally, we make significant investments in technology including software developed forinternal-use which is time-intensive and complex to implement. Such investments may not be successful or may not result in the anticipated benefits resulting in asset write-offs.
In August 2017, Moody’s acquired Bureau van Dijk for $3,542.0 million. The anticipated growth, synergies and other strategic objectives of the Bureau van Dijk acquisition, as well as other completed transactions, may not be fully realized, and a variety of factors may adversely affect any anticipated benefits from such transactions. Any strategic transaction can involve a number of risks, including unanticipated challenges regarding integration of operations, technologies and new employees; the existence of liabilities or contingencies not disclosed to or otherwise known by the Company prior to closing a transaction; unexpected regulatory and operating difficulties and expenditures; scrutiny from competition and antitrust authorities; failure to retain key personnel of the acquired business; future developments may impair the value of purchased goodwill or intangible assets; diverting management’s focus from other business operations; failing to implement or remediate controls, procedures and policies appropriate for a larger public company at acquired companies that prior to the acquisition lacked such controls, procedures and policies; challenges retaining the customers of the acquired business; and for foreign transactions, additional risks related to the integration of operations across different cultures and languages, and the economic, political, and regulatory risks associated with specific countries. The anticipated benefits from an acquisition or other strategic transaction may not be realized fully, or may take longer to realize than expected. As a result, the failure of acquisitions, dispositions and other strategic transactions to perform as expected may have a material adverse effect on Moody’s business, operating results and financial condition.
At December 31, 2017, Moody’s had $3,753.2 million of goodwill and $1,631.6 million of intangible assets on its balance sheet, both of which increased significantly due to the acquisition of Bureau van Dijk. Approximately 92% of the goodwill and intangible assets reside in the MA business, including those related to Bureau van Dijk, and are allocated to the five reporting units within MA: RD&A; ERS; Financial Services Training and Certifications; Moody’s Analytics Knowledge Services; and Bureau van Dijk. The remaining 8% of goodwill and intangible assets reside in MIS and primarily relate to ICRA. Failure to achieve business objectives and financial projections in any of these reporting units could result in a significant asset impairment charge, which would result in anon-cash charge to operating expenses. Goodwill and intangible assets are tested for impairment on an annual basis and also when events or changes in circumstances indicate that impairment may have occurred. Determining whether an impairment of goodwill exists can be especially difficult in periods of market or economic uncertainty and turmoil, and requires significant management estimates and judgment. In addition, the potential for goodwill impairment is increased during periods of economic uncertainty. An asset impairment charge could have a material adverse effect on Moody’s business, operating results and financial condition.
The Company’sIts Compliance and Risk Management Programs May Not be Effective and May Result in Outcomes That Could Adversely Affect the Company’s Reputation, Financial Condition and Operating Results.
Programs.
Moody’s operates in a number of countries, and as a result the Company is required to comply
with and quickly adapt
withto numerous international and U.S. federal, state and local laws and regulations. The Company’s ability to comply with applicable laws and regulations,
including anti-corruption, antitrust and securities trading laws, is largely dependent on its establishment and maintenance of compliance, review and reporting systems, as well as its ability to attract and retain qualified compliance and risk management personnel. Moody’s policies and procedures to identify, evaluate and manage the Company’s risks, including risks resulting from acquisitions, may not be fully effective, and Moody’s employees or agents may engage in misconduct, fraud or other errors. It is not always possible to deter such errors, and the precautions the Company takes to prevent and detect this activity may not be effective in all cases. If Moody’s employees violate its policies or if the Company’s risk management methods are not effective, the Company couldmay be subject to criminal and civil liability, the suspension of the Company’s employees, fines, penalties, regulatory sanctions, injunctive relief, exclusion from certain markets or other penalties, and may suffer harm to its reputation, financial condition and operating results.
Legal Protections for the Company’s
Moody’s Faces Risks Related to Protecting Its Intellectual Property
Rights may not be Sufficient or Available to Protect the Company’s Competitive Advantages.Rights.
Moody’s considers many aspects of its products and services to be proprietary. Failure to protect the Company’s intellectual property adequately could harm its reputation and affect the Company’s ability to compete effectively. Businesses the Company acquires also involve intellectual property portfolios, which increase the challenges the Company faces in protecting its strategic advantage. In addition, the Company’s operating results
maycan be adversely affected by inadequate or changing legal and technological protections for intellectual property and proprietary rights in some jurisdictions and markets.
On January 6, 2015, a rule with direct relevance to the CRA industry was published in the Official JournalThe lack of
the European Union regarding the types of information that CRAs are to provide about certain ratings (those that were paid for by issuers) for publication on a central website administered by ESMA (the European Ratings Platform). This rule directly relates to the Company’sstrong legal and technological intellectual property
as it requiresprotections in foreign jurisdictions in which we operate may increase our vulnerability and may pose risks to our business. From time to time, laws are passed that
the Company provide proprietaryrequire publication of certain information,
in some cases at no cost, that the Company
considers to be its intellectual property and that it currently sells
or licenses for a fee, which could result in lost revenue.
ESMA launched the European Rating Platform for public use on December 1, 2016.Unauthorized third parties may also try to obtain and use technology or other information that the Company regards as proprietary. It is also possible that Moody’s competitors or other entities could obtain patents related to the types of products and services that Moody’s offers, and attempt to require Moody’s to stop developing or marketing the products or services, to modify or redesign the products or services to avoid infringing, or to obtain licenses from the holders of the patents in order to continue developing and marketing the products and services. Even if Moody’s attempts to assert or protect its intellectual property rights through litigation, it may require considerable cost, time and resources to do so, and there is no guarantee that the Company will be successful.
The Company’s ability to establish, maintain and protect its intellectual property and proprietary rights against theft, misappropriation or infringement could be materially and adversely affected by insufficient and/or changing proprietary rights and intellectual property legal protections in some jurisdictions and markets. These risks, and the cost, time and resources needed to address them, may increase as the Company’s business grows and its profile rises in countries with intellectual property regimes that are less protective than the rules and regulations applied in the United States.
The Company is Dependent on the Use of Third-Party Software, Data, Hosted Solutions, Data Centers, Cloud and Network Infrastructure (Together, “Third Party Technology”), and Any Reduction in Third-Party Product Quality or Service Offerings, Could Have a Material Adverse Effect on the Company’s Business, Financial Condition or Results of Operations.
Moody’s
relies on Third Party Technology in connection with its product development and offerings and operations. The Company depends on the ability of Third Party Technology providersFaces Risks Related to
deliver and support reliable products, enhance their current products, develop new products on a timely and cost-effective basis, and respond to emerging industry standards and other technological changes. The Third Party Technology Moody’s uses may become obsolete, incompatible with future versions of the Company’s products, unavailable or fail to operate effectively, and Moody’s business could be adversely affected if the Company is unable to timely or effectively replace such Third Party Technology. The Company also monitors its use of Third Party Technology to comply with applicable license and other contractual requirements. Despite the Company’s efforts, the Company cannot ensure that such third parties will permit Moody’s use in the future, resulting in increased Third Party Technology acquisition costs and loss of rights. In addition, the Company’s operating costs could increase if license or other usage fees for Third Party Technology increase or the efforts to incorporate enhancements to Third Party Technology are substantial. Some of these third-party suppliers are also Moody’s competitors, increasing the risks noted above. If any of these risks materialize, they could have a material adverse effect on the Company’s business, financial condition or results of operations.Tax Matters, Including Changes in Tax Rates or Tax Rules Could Affect Future Results.
Rules.
As a global company, Moody’s is subject to taxation in the United States and various other countries and jurisdictions. As a result, our effective tax rate is determined based on the pre-taxtaxable income and applicable tax rates in the various jurisdictions in which we operate.the Company operates. Moody’s future tax rates could be affected by changes in the composition of earnings in countries or states with differing tax rates or other factors, including by increased earnings in jurisdictions where Moody’s faces higher tax rates, losses incurred in jurisdictions for which Moody’s is not able to realize the related tax benefit, or changes in foreign currency exchange rates. Changes in the tax, accounting and other laws, treaties, regulations, policies and administrative practices, or changes to their interpretation or enforcement, including changes applicable to multinational corporations such as the Base Erosion Profit Shifting projectinitiative being conductedled by the Organization for EconomicCo-operation and Development, which requires companies to disclose more information to tax authorities on operations around the world, and the European Union’s state aid rulings, could have a material adverse effect on the Company’s effective tax rate, results of operations and financial condition. Thecondition and may lead to greater audit scrutiny of profits earned in various countries.
For example, the Tax Act made significant changes to the U.S. federal tax laws. Many aspects of the new legislation are currentlyremain uncertain or unclear and may not be clarified for some time.unclear. As
additional regulatory guidance is issued interpreting or clarifying the Tax Act or if the tax accounting rules are modified, there may be adjustments or changes to our estimatethe Company’s determination of theits mandatoryone-time deemed repatriation tax liability (“transition tax”) on previously untaxed accumulated earnings of foreign subsidiaries recorded in 2017. Additional regulatory guidance may also affect ourthe Company’s expected future effective tax rates and tax assets and liabilities, which could have a material adverse effect on Moody’s business, results of operations, cash flows and financial condition. Furthermore, the Tax Act may impact the volume of debt securities issued as discussed in the Risk Factor,
Changes in the Volume of Debt Securities Issued in Domestic and/or Global Capital Markets, Asset Levels and Flows into Investment Levels and Changes in Interest Rates and Other Volatility in the Financial Markets MayCan Negatively Impact the Nature and Economics of the Company’s Business.Business
. In addition, Moody’s is subject to regular examination of its income tax returns by the Internal Revenue Service and other tax authorities around the world, and the Company is experiencing increased scrutiny as its business grows.grows globally. Moody’s regularly assesses the likelihood of favorable or unfavorable outcomes resulting from these examinations to determine the adequacy of its provision for income taxes, including unrecognized tax benefits; however, developments in an audit or litigation could materially and adversely affect the Company. Although the Company believes its tax estimates and accruals are reasonable, there can be no assurance that any final determination will not be materially different than the treatment reflected in its historical income tax provisions, accruals and unrecognized tax benefits, which could materially and adversely affect the Company’s business, operating results, cash flows and financial condition.
B. Risks Relating to our Business
The Company is Exposed to Legal, Economic, Operational and Regulatory Risks of Operating in Multiple Jurisdictions.
Moody’s conducts operations in various countries outside the U.S. and derives a significant portion of its revenue from foreign sources. Changes in the economic condition of the various foreign economies in which the Company operates have an impact on the Company’s business. For example, economic uncertainty in the Eurozone or elsewhere, including, but not limited to, in Latin America or China, affects the number of securities offerings undertaken within those particular areas. In addition to the risks addressed elsewhere in this section, operations abroad expose Moody’s to a number of legal, economic and regulatory risks such as:
–exposure to exchange rate movements between foreign currencies and USD;
–restrictions on the ability to convert local currency into USD and the costs, including the tax impact, of repatriating cash held by entities outside the U.S.;
–U.S. laws affecting overseas operations, including domestic and foreign export and import restrictions, tariffs and other trade barriers and restrictions, such as those related to the U.S.’s relationship with China and embargoes and sanctions laws with respect to Russia and Venezuela;
–differing and potentially conflicting legal or civil liability, compliance and regulatory standards, including as a result of Brexit;
–uncertainty about the future relationship between the U.K. and the EU;
–current and future regulations relating to the imposition of mandatory rotation requirements on CRAs hired by issuers of securities;
–uncertain and evolving laws and regulations, including those applicable to the financial services industries, such as the European Union’s implementation of the Markets in Financial Instruments Directive II, MiFID II, in January 2018, and to the protection of intellectual property;
–the transition away from benchmark reference rates based on market participant judgments, such as LIBOR and EURIBOR, to rates based on observable transactions, such as the Secured Overnight Financing Rate (SOFR);
–uncertainty regarding the future relationship between the U.S. and China, which may result in further restrictions or actions by the U.S. government with respect to doing business in China and/or by the Chinese government with respect to business conducted by foreign entities in China;
–economic, political and geopolitical market conditions, including the effect of these conditions on customers and customer retention;
–the possibility of nationalization, expropriation, price controls and other restrictive governmental actions;
–competition with CRAs that have greater familiarity, longer operating histories and/or support from local governments or other institutions;
–uncertainties in obtaining data and creating products and services relevant to particular geographic markets;
–reduced protection for intellectual property rights;
–longer payment cycles and possible problems in collecting receivables;
–differing accounting principles and standards;
–difficulties in staffing and managing foreign operations, including potential relocation and/or restaffing of employees as a result of Brexit;
–difficulties and delays in translating documentation into foreign languages;
–potentially adverse tax consequences; and
–complexities of compliance with employment laws and new data and cybersecurity rules in numerous jurisdictions.
Additionally, Moody’s is subject to complex U.S., foreign and other local laws and regulations that are applicable to its operations abroad, such as laws and regulations governing economic and trade sanctions, tariffs, embargoes, and anticorruption laws including the Foreign Corrupt Practices Act of 1977, the U.K. Bribery Act of 2010 and other similar local laws. The internal controls, policies and procedures and employee training and compliance programs to deter prohibited practices the Company has implemented may not be effective in preventing employees, contractors or agents from violating or circumventing such internal policies or from material violations of applicable laws and regulations. Any determination or allegations, even if unfounded, that the Company has violated sanctions, anti-bribery or anti-corruption laws could have a material adverse effect on Moody’s business, operating results and financial condition. Compliance with international and U.S. laws and regulations that apply to the Company’s international operations increases the cost of doing business in foreign jurisdictions. Violations of such laws and regulations may result in severe fines and penalties, criminal sanctions, administrative remedies, and restrictions on business conduct and could have a material adverse effect on Moody’s reputation, its ability to attract and retain employees, its business, operating results and financial condition.
Moody’s Operations are Exposed to Risks from Infrastructure Malfunctions or Failures.
Moody’s ability to conduct business may be materially and adversely impacted by a disruption in the infrastructure that supports its businesses and the communities in which Moody’s is located, including New York City, the location of Moody’s headquarters, major cities worldwide in which Moody’s has offices, and locations in China used for certain Moody’s work. This may include a disruption involving physical or technological infrastructure (whether or not controlled by the Company), including the Company’s electronic delivery systems, data center facilities, or the Internet, used by the Company or third parties with or through whom Moody’s conducts business. Many of the Company’s products and services are delivered electronically and the Company’s customers depend on the Company’s ability to receive, store, process, transmit and otherwise rapidly handle very substantial quantities of data and transactions on computer-based networks. Some of Moody’s operations require complex processes and the Company’s extensive controls to reduce the risk of error inherent in our operations cannot eliminate such risk completely. The Company’s customers also depend on the continued capacity, reliability and security of the Company’s telecommunications, data centers, networks and other electronic delivery systems, including its websites and connections to the Internet. The Company’s employees also depend on these systems for internal use. Any significant failure, compromise, cyber-breach, interruption or a significant slowdown of operations of the Company’s infrastructure, whether due to human error, capacity constraints, hardware failure or defect, weather (including climate change), natural disasters, fire, power loss, telecommunication failures, break-ins, sabotage, intentional acts of vandalism, acts of terrorism, political unrest, pandemic (including the COVID-19 pandemic), war or otherwise, may impair the Company’s ability to deliver its products and services.
Moody’s efforts to secure and plan for potential disruptions of its major operating systems may not be successful. The Company relies on third-party providers, including, increasingly, cloud-based service providers, to provide certain essential services. While the Company believes that such providers are reliable, the Company has limited control over the performance of such providers. To the extent any of the Company’s third-party providers ceases to provide these services in an efficient, cost-effective manner or fails to adequately expand its services to meet the Company’s needs and the needs of the Company’s customers (including as a result of the COVID-19 pandemic), the Company could experience lower revenues and higher costs. Additionally, although the Company maintains processes to prevent, detect and recover from a disruption, the Company also does not have fully redundant systems for most of its smaller office locations and low-risk systems, and its disaster recovery plan does not include restoration of non-essential services. If a disruption occurs in one of Moody’s locations or systems and its personnel in those locations or those who rely on such systems are unable to utilize other systems or communicate with or travel to other locations, such persons’ ability to service and interact with Moody’s customers will suffer. The Company cannot predict with certainty all of the adverse effects that could result from the Company’s failure, or the failure of a third party, to efficiently address and resolve these delays and interruptions. A disruption to Moody’s operations or infrastructure may have a material adverse effect on its reputation, business, operating results and financial condition.
Changes in the Volume of Debt Securities Issued in Domestic and/or Global Capital Markets, Asset Levels and Flows into Investment Levels and Changes in Interest Rates and Other Volatility in the Financial Markets Can Negatively Impact the Nature and Economics of the Company’s Business.
Moody’s business is impacted by general economic conditions and volatility in the U.S. and world financial markets. Furthermore, issuers of debt securities may elect to issue securities without ratings or securities which are rated or evaluated by non-traditional parties such as financial advisors, rather than traditional CRAs, such as MIS. A majority of Moody’s credit-rating-based revenue is transaction-based, and therefore it is especially dependent on the number and dollar volume of debt securities issued in the capital markets. Market disruptions and economic slowdown and uncertainty have in the past, and may in the future, negatively impact the volume of debt securities issued in global capital markets and the demand for credit ratings. Changes to U.S. tax laws and policy can negatively affect the volume of debt securities issued in the U.S. For example, the Tax Act limits deductibility on interest payments and significantly reduces the tax cost associated with the repatriation of cash held outside the U.S., both of which could negatively affect the volume of debt securities issued. Conditions that reduce issuers’ ability or willingness to issue debt securities, such as market volatility, declining growth, currency devaluations or other adverse economic trends, reduce the number and dollar-equivalent volume of debt issuances for which Moody’s provides ratings services and thereby adversely affect the fees Moody’s earns in its ratings business.
Economic and government factors such as the scaling back, wind-down or termination of COVID-19 economic stimulus and support programs, a long-term continuation of difficult economic conditions, and current uncertainty in various other jurisdictions, may have an adverse impact on the Company’s business. Future debt issuances also could be negatively affected by increases in interest rates, the withdrawal of COVID-19 economic stimulus, inflationary pressures, widening credit spreads, regulatory and political developments, growth in the use of alternative sources of credit, and defaults by significant issuers. Declines or other changes in the markets for debt securities may materially and adversely affect the Company’s business, operating results and financial condition.
Moody’s initiatives to reduce costs to counteract a decline in its business may not be sufficient and cost reductions may be difficult or impossible to obtain in the short term, due in part to rent, technology, compliance and other fixed costs associated with some of the Company’s operations as well as the need to monitor outstanding ratings. Further, cost-reduction initiatives, including those under-taken to date, could make it difficult for the Company to rapidly expand operations in order to accommodate any unexpected increase in the demand for ratings. Volatility in the financial markets, including changes in the volumes of debt securities and changes in interest rates, may have a material adverse effect on the business, operating results and financial condition, which the Company may not be able to successfully offset with cost reductions.
The Company Faces Increased Pricing Pressure from Competitors and/or Customers.
There is price competition in the credit rating, research, and credit risk management markets, as well as in the market for research, business intelligence and analytical services offered by MA. Moody’s faces competition globally from other CRAs and from investment banks and brokerage firms that offer credit opinions in research, as well as from in-house research operations. Competition for customers and market share has spurred more aggressive tactics by some competitors in areas such as pricing and services, as well as increased competition from non-NRSROs that evaluate debt risk for issuers or investors. At the same time, a challenging business environment and consolidation among both competitors and customers, particularly those involved in structured finance products and commercial real estate, and other factors affecting demand may enhance the market power of competitors and reduce the Company’s customer base. Weak economic growth intensifies competitive pricing pressures and can result in customers’ use of free or lower-cost information that is available from alternative sources or their development of alternative, proprietary systems for assessing credit risk that replace the products currently purchased from Moody’s. While Moody’s seeks to compete primarily on the basis of the quality of its products and services, it can lose market share when its pricing is not sufficiently competitive. In addition, the Reform Act was designed to encourage competition among rating agencies. The formation of additional NRSROs may increase pricing and competitive pressures. Furthermore, in some of the countries in which Moody’s operates, governments may provide financial or other support to local rating agencies. Any inability of Moody’s to compete successfully with respect to the pricing of its products and services will have a material adverse impact on its business, operating results and financial condition.
The Company Is Exposed to Reputation and Credibility Concerns.
Moody’s reputation and the strength of its brand are key competitive strengths. To the extent that the rating agency business as a whole or Moody’s, relative to its competitors, suffers a loss in credibility, Moody’s business will be significantly impacted. Factors that may have already affected credibility and could potentially continue to have an impact in this regard include the appearance of a conflict of interest, the performance of securities relative to the rating assigned to such securities, the timing and nature of changes in ratings, a major compliance failure, negative perceptions or publicity and increased criticism by users of ratings, regulators and legislative bodies, including as to the ratings process, including as to the Company’s recent ESG initiatives, and its implementation with respect to one or more securities and intentional, poor representation of our products and services by our partners or agents, manipulation of our products and services by third parties, or unintentional misrepresentations of Moody’s products and services in advertising materials, public relations information, social media or other external communications. Operational errors, whether by Moody’s or a Moody’s competitor, could also harm the reputation of the Company or the credit rating industry. Damage to reputation and credibility could have a material adverse impact on Moody’s business, operating results and financial condition, as well as on the Company’s ability to find suitable candidates for acquisition.
The Introduction of Competing Products, Technologies or Services by Other Companies Can Negatively Impact the Nature and Economics of the Company’s Business.
The markets for credit ratings, research, credit risk management services, business intelligence and analytical services are highly competitive and characterized by rapid technological change, changes in customer and investor demands, and evolving regulatory requirements, industry standards and market preferences. The ability to develop and successfully launch and maintain innovative products, technologies and services that anticipate customers’ and investors’ changing requirements and utilize emerging technological trends in a timely and cost-effective manner is a key factor in maintaining market share. Moody’s competitors include both established companies with significant financial resources, brand recognition, market experience and technological expertise, and smaller companies which may be better poised to quickly adopt new or emerging technologies or respond to customer requirements. Competitors may develop quantitative methodologies or related services for assessing credit risk that customers and market participants may deem preferable, more cost-effective or more valuable than the credit risk assessment methods currently employed by Moody’s, or may position, price or market their products in manners that differ from those utilized by Moody’s. Moody’s also competes indirectly against consulting firms and technology and information providers, some of whom are also suppliers to Moody’s; these indirect competitors could in the future choose to compete directly with Moody’s, cease doing business with Moody’s or change the terms under which they do business with Moody’s in a way that could negatively impact our business. In addition, customers or others may develop alternative, proprietary systems for assessing credit risk. Such developments could affect demand for Moody’s products and services and its growth prospects. Further, the increased availability in recent years of free or relatively inexpensive internet information may reduce the demand for Moody’s products and services. Moody’s growth prospects also could be adversely affected by Moody’s failure to make necessary or optimal capital infrastructure expenditures and improvements and the inability of its information technologies to provide adequate capacity and capabilities to meet increased demands of producing quality ratings and research products at levels achieved by competitors. Any inability of Moody’s to compete successfully may have a material adverse effect on its business, operating results and financial condition.
Moody’s Is Exposed to Risks Related to Loss of Skilled Employees and Related Compensation Cost Pressures.
Moody’s success depends upon its ability to recruit, retain and motivate highly skilled, experienced financial analysts and other professionals. Competition for skilled individuals in the financial services industry is intense, and Moody’s ability to attract high quality employees could be impaired if it is unable to offer competitive compensation and other incentives or if the regulatory environment mandates restrictions on or disclosures about individual employees that would not be necessary in competing industries. Rising expenses including wage inflation could adversely affect Moody’s ability to attract and retain high-quality employees. As greater focus has been placed on executive compensation at public companies, in the future, Moody’s may be required to alter its compensation practices in ways that adversely affect its ability to attract and retain talented employees. Investment banks, investors and competitors may seek to attract analyst talent by providing more favorable working conditions or offering significantly more attractive compensation packages than Moody’s. Moody’s also may not be able to identify and hire the appropriate qualified employees in some markets outside the U.S. with the required experience or skills to perform sophisticated credit analysis. We could also fail to effectively respond to evolving perceptions and goals of those in our workforce or whom we might seek to hire, including in response to changes brought on by the COVID-19 pandemic, with respect to flexible working or other matters. Additionally, relocation and/or restaffing of employees due to Brexit could adversely affect our ability to attract and retain talent for our European operations. There is a risk that even when the Company invests significant resources in attempting to attract, train and retain qualified personnel, it will not succeed in its efforts, and its business could be harmed. Further, employee expectations in areas such as environmental, social matters and corporate governance (ESG) have been rapidly evolving and increasing. A failure to adequately meet employee expectations may result in an inability to attract and retain talented employees.
Moody’s is highly dependent on the continued services of Robert Fauber, the President and Chief Executive Officer, and other senior officers and key employees. The loss of the services of skilled personnel for any reason and Moody’s inability to replace them with suitable candidates quickly or at all, as well as any negative market perception resulting from such loss, could have a material adverse effect on Moody’s business, operating results and financial condition.
Moody’s Acquisitions, Dispositions and Other Strategic Transactions or Investments May Not Produce Anticipated Results Exposing the Company to Future Significant Impairment Charges Relating to Its Goodwill, Intangible Assets or Property and Equipment.
Moody’s regularly evaluates and enters into acquisitions, dispositions or other strategic transactions and investments to strengthen its business and grow the Company. For example, Moody’s acquired Bureau van Dijk in 2017, Reis in 2018, Regulatory DataCorp (RDC) in 2020, and RMS in September 2021. Such transactions and investments present significant challenges and risks. The Company faces intense competition for acquisition targets, especially in light of industry consolidation, which may affect Moody’s ability to complete such transactions on favorable terms or at all. Additionally, the Company makes significant investments in technology, including software for internal use, which can be expensive, time-intensive and complex to develop and implement.
The anticipated growth, synergies and other strategic objectives of the RMS acquisition, as well as other completed transactions, may not be fully realized, and a variety of factors may adversely affect any anticipated benefits from such transactions. Any strategic transaction involves a number of risks, including unanticipated challenges regarding integration of operations, technologies and new employees; the existence of liabilities or contingencies not disclosed to or otherwise known by the Company prior to closing a transaction; unexpected regulatory and operating difficulties and expenditures; scrutiny from competition and antitrust authorities; failure to retain key personnel of the acquired business; future developments that impair the value of purchased goodwill or intangible assets; diversion of management’s focus from other business operations; failure to implement or remediate controls, procedures and policies appropriate for a larger public company at acquired companies that prior to the acquisition lacked such controls, procedures and policies; disputes or litigation arising out of acquisitions or dispositions; challenges retaining the customers of the acquired business; coordination of product, sales, marketing and program and systems management functions; integration of employees from the acquired business into Moody’s organization; integration of the acquired business’s accounting, information technology, human resources, legal and other administrative systems with Moody’s; risks that acquired systems expose us to cybersecurity risks; and for foreign transactions, additional risks related to the integration of operations across different cultures and languages, and the economic, political, and regulatory risks associated with specific countries. The anticipated benefits from an acquisition or other strategic transaction or investment may not be realized fully, or may take longer to realize than expected. As a result, the failure of acquisitions, dispositions and other strategic transactions and investments to perform as expected may have a material adverse effect on Moody’s business, operating results and financial condition.
At December 31, 2021, Moody’s had $5,999 million of goodwill and $2,467 million of intangible assets on its balance sheet. Approximately 94% of the goodwill and intangible assets reside in the MA business, including those related to Bureau van Dijk and RMS, and are allocated to the two reporting units within MA. The remaining 6% of goodwill and intangible assets reside in MIS and primarily relate to ICRA. Failure to achieve business objectives and financial projections in any of these reporting units could result in a significant asset impairment charge, which would result in a non-cash charge to operating expenses. Goodwill and intangible assets are tested for impairment on an annual basis and also when events or changes in circumstances indicate that impairment may have occurred. Determining whether an impairment of goodwill exists can be especially difficult in periods of market or economic uncertainty and turmoil, and requires significant management estimates and judgment. In addition, the potential for goodwill impairment is increased during periods of economic uncertainty. An asset impairment charge could have a material adverse effect on Moody’s business, operating results and financial condition.
The global COVID-19 pandemic may have a material adverse impact on our operations and financial performance, and is having a material adverse impact on the operations and financial performance of many of our customers. It is difficult to predict the extent to which the pandemic and related impacts will adversely impact our business operations, financial performance, results of operations, financial position and the achievement of our strategic objectives.
Our operations and financial performance could be negatively impacted by the continued effects of the COVID-19 pandemic that has caused, and is expected to continue to cause, the global slowdown of economic activity and significant volatility and disruption in financial markets. Because the severity, magnitude and duration of the pandemic and its economic consequences continue to be uncertain and difficult to predict, the pandemic’s impact on our operations and financial performance, as well as its impact on our ability to successfully execute our business strategies and initiatives, remains uncertain and difficult to predict. Further, the ultimate impact of the pandemic on our operations and financial performance as well as the performance of our customers, depends on many factors that are not within our control, including, but not limited, to: governmental, business and individuals’ actions (including restrictions on travel and workforce pressures); actions taken in response on global and regional economies, travel, and economic activity; the availability of federal, state, local or non-U.S. funding programs; general economic uncertainty in key global markets and financial market volatility; global economic conditions and levels of economic growth; uncertainty presented by approved vaccines, corresponding rollout and unanticipated consequences of such vaccines; and the pace of recovery when the pandemic subsides.
The COVID-19 pandemic has subjected our operations and financial performance to a number of risks, including, but not limited to, those discussed below:
–The global credit market disruptions and economic stimulus measures led to robust U.S. investment grade and U.S. speculative grade issuance that may not continue as government programs are scaled back.
–We continue to publish research and issue credit ratings in accordance with our public credit rating methodologies in a highly uncertain, changing environment. Given these unprecedented events, and our prior experience during periods of volatility and economic uncertainty, it is likely that our ratings and research will be challenged and scrutinized around the globe and result in future government and regulatory proceedings, investigations, inquiries and litigation.
–Likewise, MA continues to offer quantitative analytics in a highly uncertain, rapidly changing environment where it is difficult to accurately capture the impact of the COVID-19 pandemic within its analytical models across different business sectors and geographies. Any failure of MA’s models to sufficiently account for COVID-19 impacts may impact MA's reputation, brand and credibility and could result in customer dissatisfaction and/or contract cancellations.
–Illness, travel restrictions or workforce disruptions could result in reduced sales opportunities for both MIS and MA. The COVID-19 pandemic may decrease demand for the financial intelligence and analytical tools MA provides.
–Our customers are being impacted and will be impacted by the COVID-19 pandemic to differing degrees. As a result, we may face pricing pressure on our products, delayed renewals for certain subscription based products, and challenges to new sales which would in turn reduce revenue, ultimately impacting our results of operations.
–The COVID-19 pandemic has increased volatility in the capital markets. The Company might not be able to continue to access preferred sources of liquidity when we would like, and our borrowing costs could increase.
–While we have transitioned to a hybrid work environment combining remote and in-office work, all employees globally, maintaining such a state for an extended period of time may have a material adverse effect on our productivity, our ability to meet the needs of our customers and may expose us to both operational and security risks. In addition, maintaining an infrastructure that supports a prolonged remote working environment may limit information technology resources available for other projects.
–As the COVID-19 pandemic continues to affect the global economy, it may have the effect of heightening many of the other risks, such as those surrounding cybersecurity, described in our risk factors in this Form 10-K. Further, the COVID-19 pandemic may also affect our operating and financial results in a manner that is not presently known to us or that we currently do not expect to present significant risks to our operations or financial results.
C. Technology Risks
The Company Is Exposed to Risks Related to Cybersecurity and Protection of Confidential Information.
The Company’s operations rely on the secure processing, storage and transmission of confidential, sensitive, proprietary and other types of information relating to its business operations and confidential and sensitive information about its customers and employees in the Company’s computer systems and networks, and in those of its third party vendors. Unauthorized disclosure of this information could cause our customers to lose faith in our ability to protect their confidential information and therefore cause customers to cease doing business with us. The risks the Company faces range from cyber-attacks common to most industries, to more advanced threats that target the Company because of its prominence in the global marketplace, or due to its ratings of sovereign debt. Breaches of Moody’s or Moody’s vendors’ technology and systems, whether from circumvention of security systems, denial-of-service attacks or other cyber-attacks [some of which may be carried out by state-sponsored actors], hacking, “phishing” attacks, computer viruses, ransomware, or malware, employee or insider error, malfeasance, social engineering, physical breaches or other actions, may result in manipulation or corruption of sensitive data, material interruptions or malfunctions in the Company’s or such vendors’ web sites or systems, applications, data processing, or disruption of other business operations, or may compromise the confidentiality and integrity of material information held by the Company (including information about Moody’s business, employees or customers), as well as sensitive personally identifiable information (PII), the disclosure of which could lead to identity theft. Measures that Moody’s takes to avoid, detect, mitigate or recover from material incidents can be expensive, and may be insufficient, circumvented, or may become ineffective. Additionally, the Company may be exposed to additional threats as the Company migrates its data from legacy systems to cloud-based solutions, and increased dependence on third parties to store cloud-based data subjects the Company to further cyber risks. Further, as a result of the COVID-19 pandemic, many of our employees are working remotely, which magnifies the importance of the integrity of our remote access security measures and may expose the Company to additional cyber risks.
The Company has invested and continues to invest in risk management and information security measures in order to protect its systems and data, including employee training, disaster plans, and technical defenses. The cost and operational consequences of implementing, maintaining and enhancing further data or system protection measures could increase significantly to overcome increasingly intense, complex, and sophisticated global cyber threats. Despite the Company’s best efforts, it is not fully insulated from, and has in the past experienced, security threats and system disruptions. Although past incidents have not had a material adverse effect on the Company's operating results, there can be no assurance of a similar result in the future. Because the methods used for these systems cyberattacks are rapidly changing, the Company, despite significant focus and investment, may be unable to anticipate/deploy sufficient protections against such incidents. Further, the extent of a particular security incident and the steps needed to investigate may not be immediately clear, and it may take a significant amount of time before such an investigation can be completed and full and reliable information about the incident, including the extent of the harm and how best to remediate it, is known. Recent well-publicized security breaches at other companies have led to enhanced government and regulatory scrutiny of the measures taken by companies to protect against cyber-attacks, and may in the future result in heightened cybersecurity compliance requirements, including additional regulatory expectations for oversight of vendors and service providers. Cybersecurity incidents, including the accidental loss, inadvertent disclosure or unapproved dissemination of proprietary information or sensitive or confidential data, could cause reputational harm, loss of customers and revenue, fines, regulatory actions and scrutiny, sanctions or other statutory penalties, litigation, liability for failure to safeguard the Company’s customers’ information, or financial losses that are either not insured against or not fully covered through any insurance maintained by the Company. In addition, disclosure or media reports of actual or perceived security vulnerabilities to the Company’s systems or those of the Company’s third parties, even if no breach has been attempted or occurred, could lead to reputational harm, loss of customers and revenue, or increased regulatory actions oversight and scrutiny.
Any of the foregoing may have a material adverse effect on Moody’s business, operating results and financial condition.
The Company Is Exposed to Risks Related to Protection of Confidential Information
To conduct its operations, the Company regularly moves data across national borders, and consequently is subject to a variety of continuously evolving and developing laws and regulations in the United States and abroad regarding privacy, data protection and data security [such as the Federal Trade Commission Act in the United States, the General Data Protection Regulation (“GDPR”) in the European Union, the Cyber Security Law in China and various other international, federal, state and local laws and regulations]. The scope of the laws that may be applicable to Moody’s is often uncertain and may be conflicting, particularly with respect to foreign laws. For example, GDPR, which became effective in May 2018, greatly increased the jurisdictional reach of European Union privacy law and added a broad array of requirements for processing personal data, including the public disclosure of significant data breaches. Failure to comply with GDPR requirements could result in penalties of up to 4% of annual worldwide revenue. Additionally, other countries have enacted or are enacting data localization laws that require data to stay within their borders. Further, laws such as the California Consumer Privacy Act, enacted in January 2020, require among other things, covered companies to provide new disclosures to consumers, and affords consumers new abilities to opt-out of certain sales of personal information. The effects of non-compliance with the CCPA and other similar data privacy laws in other jurisdictions are significant, however, and may require us to modify our data processing practices and policies and to incur additional costs and expenses. All of these evolving compliance and operational requirements have required changes to certain business practices, thereby increasing costs, requiring significant management time and attention, and subjecting the Company to negative publicity, as well as remedies that may harm its business, including fines, modified demands or orders, the cessation of existing business practices, and exposure to litigation, regulatory actions, sanctions or other statutory penalties.
The Company Is Dependent on the Use of Third-Party Software, Data, Hosted Solutions, Data Centers, Cloud and Network Infrastructure (Together, “Third Party Technology”), and Any Reduction in Third-Party Product Quality or Service Offerings, Could Have a Material Adverse Effect on the Company’s Business, Financial Condition or Results of Operations.
Moody’s relies on Third Party Technology in connection with its product development and offerings and operations. The Company depends on the ability of Third Party Technology providers to deliver and support reliable products, enhance their current products, develop new products on a timely and cost-effective basis, provide data necessary to develop and maintain its products and respond to emerging industry standards and other technological changes. The Third Party Technology Moody’s uses can become obsolete or restrictive, incompatible with future versions of the Company’s products, fail to be comprehensive or accurate, unavailable or fail to operate effectively (including as a result of the COVID-19 pandemic), and Moody’s business could be adversely affected when the Company is unable to timely or effectively replace such Third Party Technology.
The Company also monitors its use of Third Party Technology to comply with applicable license and other contractual requirements. Despite the Company’s efforts, the Company cannot ensure that such third parties will permit Moody’s use in the future, resulting in increased Third Party Technology acquisition costs and loss of rights. In addition, the Company’s operating costs could increase if license or other usage fees for Third Party Technology increase or the efforts to incorporate enhancements to Third Party Technology are substantial. In the ordinary course, our third-parties, including our vendors, are subject to various forms of cyber attacks. To date, such attacks have not resulted in a material adverse impact to our business operations, but there can be no guarantee we will not experience such an impact. Some of these third-party suppliers are also Moody’s competitors, increasing the risks noted above. When any of these risks materialize, they could have a material adverse effect on the Company’s business, financial condition or results of operations.
ITEM 1B. UNRESOLVED STAFF COMMENTS
ITEM 2. PROPERTIES
Moody’s corporate headquarters is located at 7 World Trade Center at 250 Greenwich Street, New York, New York 10007, with approximately 797,537 square feet of leased space. As of December 31,
2017,2021, Moody’s operations were conducted from
1735 U.S. offices and
114107 non-U.S. office locations, all of which are leased. These properties are geographically distributed to meet operating and sales requirements worldwide. These properties are generally considered to be both suitable and adequate to meet current operating requirements.
ITEM 3. LEGAL PROCEEDINGS
For information regarding legal proceedings, see Part II, Item 8 –“Financial Statements”, Note
1921 “Contingencies” in this Form
10-K.ITEM 4. | | MINE SAFETY DISCLOSURES |
ITEM 4. MINE SAFETY DISCLOSURES
PART II
ITEM 5. | | MARKET FOR THE REGISTRANT’S COMMON EQUITY, RELATED SHAREHOLDER MATTERS AND ISSUER PURCHASES OF EQUITY SECURITIES |
ITEM 5. MARKET FOR THE REGISTRANT’S COMMON EQUITY, RELATED SHAREHOLDER MATTERS AND ISSUER PURCHASES OF EQUITY SECURITIES
Information in response to this Item is set forth under the captions below.
MOODY’S PURCHASES OF EQUITY SECURITIES
For the three months ended December 31, 2017 | | | | | | | | | | | | | | | | |
Period | | Total Number
of Shares Purchased (1) | | | Average Price
Paid per Share | | | Total Number of
Shares Purchased as
Part of Publicly
Announced Program | | | Approximate Dollar
Value of Shares That May
yet be Purchased Under
the Program (2) | |
| October 1 – 31 | | | 69,062 | | | $ | 143.01 | | | | 68,249 | | | $ | 553.4 million | |
| November 1 – 30 | | | 78,562 | | | $ | 145.80 | | | | 78,186 | | | $ | 542.0 million | |
| December 1 – 31 | | | 101,898 | | | $ | 150.31 | | | | 99,769 | | | $ | 527.0 million | |
| | | | | | | | | | | | | | | | |
| Total | | | 249,522 | | | $ | 146.84 | | | | 246,204 | | | | | |
| | | | | | | | | | | | | | | | |
(1) | Includes surrender to the Company of 813, 376 and 2,129 shares of common stock in October, November and December, respectively, to satisfy tax withholding obligations in connection with the vesting of restricted stock issued to employees. |
(2) | As of the last day of each of the months. On December 15, 2015, the Board authorized a $1 billion share repurchase program. There is no established expiration date for the remaining authorization. |
2021:
| | | | | | | | | | | | | | | | | | | | | | | | | | |
| Period | | Total Number of Shares Purchased (1) | | Average Price Paid per Share | | Total Number of Shares Purchased as Part of Publicly Announced Program | | Approximate Dollar Value of Shares That May Yet Be Purchased Under The Program (2) |
| October 1- 31 | | 1,400 | | | $ | — | | | — | | | $1,203 million |
| November 1- 30 | | 236,692 | | | $ | 389.93 | | | 235,647 | | | $1,111 million |
| December 1- 31 | | 78,013 | | | $ | 389.35 | | | 77,330 | | | $1,081 million |
| Total | | 316,105 | | | $ | 389.78 | | | 312,977 | | | |
(1)Includes surrender to the Company of 1,400; 1,045 and 683 shares of common stock in October, November and December, respectively, to satisfy tax withholding obligations in connection with the vesting of restricted stock issued to employees.
(2)Amounts shown are as of the last day of each of the months. On December 16, 2019, the Board authorized $1 billion in share repurchase authority and on February 9, 2021, the Board approved an additional $1 billion in share repurchase authority. At December 31, 2021, there was approximately $1,081 million of remaining authority. Additionally, on February 7, 2022, the Board of Directors approved an additional $750 million of share repurchase authority. There is no established expiration date for the remaining authorizations.
During the fourth quarter of
2017,2021, Moody’s issued 0.1 million shares under employee stock-based compensation plans.
COMMON STOCK INFORMATION
AND DIVIDENDSThe Company’s common stock trades on the New York Stock Exchange under the symbol “MCO”. The
table below indicates the high and low sales price of the Company’s common stock and the dividends declared and paid for the periods shown. The number of registered shareholders of record at January 31,
20182022 was
2,020.1,628. A substantially greater number of the Company’s common stock is held by beneficial holders whose shares
of record are held
of record by banks, brokers and other financial institutions.
| | | | | | | | | | | | | | | | |
| | | Price Per Share | | | Dividends Per Share | |
| | | | |
| | | High | | | Low | | | Declared | | | Paid | |
| 2017: | | | | | | | | | | | | | | | | |
| First quarter | | $ | 114.03 | | | $ | 93.51 | | | $ | — | | | $ | 0.38 | |
| Second quarter | | $ | 122.99 | | | $ | 110.82 | | | | 0.38 | | | | 0.38 | |
| Third quarter | | $ | 139.94 | | | $ | 121.53 | | | | 0.38 | | | | 0.38 | |
| Fourth quarter | | $ | 153.86 | | | $ | 139.33 | | | | 0.38 | | | | 0.38 | |
| | | | | | | | | | | | | | | | |
| Year ended December 31, 2017 | | | | | | | | | | $ | 1.14 | | | $ | 1.52 | |
| | | | | | | | | | | | | | | | |
| 2016: | | | | | | | | | | | | | | | | |
| First quarter | | $ | 99.09 | | | $ | 77.76 | | | $ | — | | | $ | 0.37 | |
| Second quarter | | $ | 101.70 | | | $ | 87.30 | | | | 0.37 | | | | 0.37 | |
| Third quarter | | $ | 110.83 | | | $ | 90.98 | | | | 0.37 | | | | 0.37 | |
| Fourth quarter | | $ | 110.00 | | | $ | 93.85 | | | | 0.75 | | | | 0.37 | |
| | | | | | | | | | | | | | | | |
| Year Ended December 31, 2016 | | | | | | | | | | $ | 1.49 | | | $ | 1.48 | |
| | | | | | | | | | | | | | | | |
EQUITY COMPENSATION PLAN INFORMATION
The table below sets forth, as of December 31, 2017,2021, certain information regarding the Company’s equity compensation plans. | | | | | | | | | | | | |
| | | Number of Securities to
be Issued Upon Exercise
of Outstanding Options,
Warrants and Rights | | | Weighted-Average
Exercise Price of
Outstanding Options,
Warrants and Rights(2) | | | Number of Securities
Remaining Available for
Future Issuance Under
Equity Compensation
Plans (excluding
Securities Reflected in
Column (a)) | |
| | | |
Plan Category | | (a) | | | (b) | | | (c) | |
| Equity compensation plans approved by security holders | | | 6,499,733 | (1) | | $ | 57.48 | | | | 20,026,669 | (3) |
| Equity compensation plans not approved by security holders | | | — | | | $ | — | | | | — | |
| | | | | | | | | | | | |
Total | | | 6,499,733 | | | $ | 49.68 | | | | 20,026,669 | |
| | | | | | | | | | | | |
(1) | Includes 5,216,663 options and unvested restricted shares outstanding under the Company’s 2001 Key Employees’ Stock Incentive Plan, 12,100 options outstanding under the Company’s 1998 Key Employees’ Stock Incentive Plan, and 12,761 unvested restricted shares outstanding under the 1998Non-Employee Directors’ Stock Incentive Plan. This number also includes a maximum of 1,258,209 performance shares outstanding under the Company’s 2001 Key Employees’ Stock Incentive Plan, which is the maximum number of shares issuable pursuant to performance share awards assuming the maximum payout at 225% of the target award for performance shares granted in 2015, 2016 and 2017. Assuming payout at target, the number of shares to be issued upon the vesting of outstanding performance share awards is 559,204. |
(2) | Does not reflect unvested restricted shares or performance share awards included in column (a) because these awards have no exercise price. |
(3) | Includes 16,324,164 shares available for issuance as under the 2001 Stock Incentive Plan, of which all may be issued as options and 9,843,708 may be issued as restricted stock, performance shares or other stock-based awards under the 2001 Stock Incentive Plan and 914,711 shares available for issuance as options, shares of restricted stock or performance shares under the 1998 Directors Plan, and 2,787,794 shares available for issuance under the Company’s Employee Stock Purchase Plan. No new grants may be made under the 1998 Stock Incentive Plan, which expired by its terms in June 2008. |
| | | | | | | | | | | | | | | | | | | | | | | | | | |
| Plan Category | | Number of Securities to be Issued Upon Exercise of Outstanding Options, Warrants and Rights | | | Weighted-Average Exercise Price of Outstanding Options, Warrants and Rights (2) | | Number of Securities Remaining Available for Future Issuance Under Equity Compensation Plans (excluding Securities Reflected in Column (a)) | |
| (a) | | | (b) | | (c) | |
| Equity compensation plans approved by security holders | | 3,115,970 | | (1) | | $ | 166.16 | | | 17,171,937 | | (3) |
| Equity compensation plans not approved by security holders | | — | | | | $ | — | | | — | | |
| Total | | 3,115,970 | | | | $ | 166.16 | | | 17,171,937 | | |
(1)Includes 2,246,154 options and unvested restricted shares outstanding under the Company's 2001 Key Employees' Stock Incentive Plan, 140,906 options and unvested restricted shares outstanding under the Risk Management Solutions, Inc. 2015 Equity Incentive Plan and 5,904 unvested restricted shares outstanding under the 1998 Non-Employee Directors' Stock Incentive Plan. This number also includes a maximum of 723,006 performance shares outstanding under the Company's 2001 Key Employees' Stock Incentive Plan, which is the maximum number of shares issuable pursuant to performance share awards assuming the maximum payout of 200% of the target award for performance shares granted in 2019, 2020 and 2021. Assuming payout at target, the number of shares to be issued upon the vesting of outstanding performance share awards is 361,503.
(2)Does not reflect unvested restricted shares or performance share awards included in column (a) because these awards have no exercise price.
(3)Includes 13,283,557 shares available for issuance as under the 2001 Stock Incentive Plan, of which all may be issued as options and 7,320,392 may be issued as restricted stock, performance shares or other stock-based awards under the 2001 Stock Incentive Plan, 423,884 shares available for issuance as options, shares of restricted stock or performance shares under the Risk Management Solutions, Inc. 2015 Equity Incentive Plan; 880,119 shares available for issuance as options, shares of restricted stock or performance shares under the 1998 Directors Plan; and 2,584,377 shares available for issuance under the Company’s Employee Stock Purchase Plan. No new grants may be made under the 1998 Stock Incentive Plan, which expired by its terms in June 2008.
The following graph compares the total cumulative shareholder return of the Company to the performance of Standard & Poor’s
Stock 500 Composite Index and the Russell 3000 Financial Services Index. Both of the aforementioned indexes are easily accessible to the Company’s shareholders in newspapers, the internet and other readily available sources for purposes of the following graph.
The comparison assumes that $100.00 was invested in the Company’s common stock and in each of the foregoing indices on December 31,
2012.2016. The comparison also assumes the reinvestment of dividends, if any. The total return for the common stock was
214%335% during the performance period as compared with a total return during the same period of
196%133% and 110% for
the S&P 500 Composite Index and the Russell 3000 Financial Services Index,
and 108% for the S&P 500 Composite Index.Comparison of Cumulative Total Return
Moody’s Corporation, Russell 3000 Financial Services Index and S&P 500 Composite Index
respectively.
COMPARISON OF 5 YEAR CUMULATIVE TOTAL
RETURN*RETURN
Among Moody’s Corporation, the S&P 500 Index
and the Russell 3000 Financial Services Index
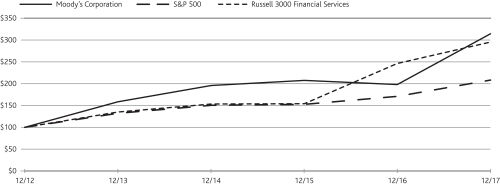
| | | | | | | | | | | | | | | | | | | | | | | | |
| | | Year Ended December 31, | |
| | | | | | |
| | | 2012 | | | 2013 | | | 2014 | | | 2015 | | | 2016 | | | 2017 | |
| Moody’s Corporation | | $ | 100.00 | | | $ | 158.22 | | | $ | 195.66 | | | $ | 207.57 | | | $ | 198.05 | | | $ | 313.93 | |
| S&P 500 Composite Index | | $ | 100.00 | | | $ | 132.39 | | | $ | 150.51 | | | $ | 152.59 | | | $ | 170.84 | | | $ | 208.14 | |
| Russell 3000—Financial Services Index | | $ | 100.00 | | | $ | 134.63 | | | $ | 153.55 | | | $ | 154.32 | | | $ | 246.42 | | | $ | 295.57 | |
| | | | | | | | | | | | | | | | | | | | | | | | | | | | | | | | | | | | |
| Year Ended December 31, | |
| 2016 | | 2017 | | 2018 | | 2019 | | 2020 | | 2021 | |
| Moody’s Corporation | $ | 100.00 | | | $ | 158.51 | | | $ | 152.01 | | | $ | 260.32 | | | $ | 320.91 | | | $ | 435.06 | | |
| S&P 500 Composite Index | $ | 100.00 | | | $ | 121.83 | | | $ | 116.49 | | | $ | 153.17 | | | $ | 181.35 | | | $ | 233.41 | | |
| Russell 3000—Financial Services Index | $ | 100.00 | | | $ | 119.95 | | | $ | 109.93 | | | $ | 146.12 | | | $ | 155.77 | | | $ | 209.63 | | |
The comparisons in the graph above are provided in response to disclosure requirements of the SEC and are not intended to forecast or be indicative of future performance of the Company’s common stock.
Table
The Company’s selected consolidated financial data should be read in conjunction with Item 7. “MD&A” and the Moody’s Corporation consolidated financial statements and notes thereto.
| | | | | | | | | | | | | | | | | | | | |
| |
| | | Year Ended December 31, | |
| | | | | |
amounts in millions, except per share data | | 2017 | | | 2016 | | | 2015 | | | 2014 | | | 2013 | |
| Results of operations | | | | | | | | | | | | | | | | | | | | |
| Revenue | | $ | 4,204.1 | | | $ | 3,604.2 | | | $ | 3,484.5 | | | $ | 3,334.3 | | | $ | 2,972.5 | |
| Expenses | | | | | | | | | | | | | | | | | | | | |
Operating and SG&A expenses | | | 2,214.2 | | | | 1,963.0 | | | | 1,897.6 | | | | 1,799.6 | | | | 1,644.5 | |
Depreciation and amortization | | | 158.3 | | | | 126.7 | | | | 113.5 | | | | 95.6 | | | | 93.4 | |
Acquisition-Related Expenses | | | 22.5 | | | | — | | | | — | | | | — | | | | — | |
Settlement Charge | | | — | | | | 863.8 | | | | — | | | | — | | | | — | |
Restructuring | | | — | | | | 12.0 | | | | — | | | | — | | | | — | |
| | | | | | | | | | | | | | | | | | | | |
| Total Expenses | | | 2,395.0 | | | | 2,965.5 | | | | 2,011.1 | | | | 1,895.2 | | | | 1,737.9 | |
| | | | | | | | | | | | | | | | | | | | |
| Operating income (1) | | | 1,809.1 | | | | 638.7 | | | | 1,473.4 | | | | 1,439.1 | | | | 1,234.6 | |
Non-operating (expense) income, net (4) | | | (22.3 | ) | | | (80.7 | ) | | | (93.8 | ) | | | 21.9 | | | | (65.3 | ) |
| | �� | | | | | | | | | | | | | | | | | | |
| Income before provision for income taxes (1) | | | 1,786.8 | | | | 558.0 | | | | 1,379.6 | | | | 1,461.0 | | | | 1,169.3 | |
Provision for income taxes (3) | | | 779.1 | | | | 282.2 | | | | 430.0 | | | | 455.0 | | | | 353.4 | |
| | | | | | | | | | | | | | | | | | | | |
| Net income (1) | | | 1,007.7 | | | | 275.8 | | | | 949.6 | | | | 1,006.0 | | | | 815.9 | |
Less: Net income attributable to noncontrolling interests | | | 7.1 | | | | 9.2 | | | | 8.3 | | | | 17.3 | | | | 11.4 | |
| | | | | | | | | | | | | | | | | | | | |
| Net income attributable to Moody’s (1)(5) | | $ | 1,000.6 | | | $ | 266.6 | | | $ | 941.3 | | | $ | 988.7 | | | $ | 804.5 | |
| | | | | | | | | | | | | | | | | | | | |
| Earnings per share | | | | | | | | | | | | | | | | | | | | |
Basic (1) | | $ | 5.24 | | | $ | 1.38 | | | $ | 4.70 | | | $ | 4.69 | | | $ | 3.67 | |
Diluted (1) | | $ | 5.15 | | | $ | 1.36 | | | $ | 4.63 | | | $ | 4.61 | | | $ | 3.60 | |
| Weighted average shares outstanding | | | | | | | | | | | | | | | | | | | | |
Basic | | | 191.1 | | | | 192.7 | | | | 200.1 | | | | 210.7 | | | | 219.4 | |
Diluted | | | 194.2 | | | | 195.4 | | | | 203.4 | | | | 214.7 | | | | 223.5 | |
| Dividends declared per share | | $ | 1.14 | | | $ | 1.49 | | | $ | 1.39 | | | $ | 1.18 | | | $ | 0.98 | |
| Operating margin (1) | | | 43.0 | % | | | 17.7 | % | | | 42.3 | % | | | 43.2 | % | | | 41.5 | % |
| Operating Cash Flow (2) | | $ | 747.5 | | | $ | 1,259.2 | | | $ | 1,198.1 | | | $ | 1,077.3 | | | $ | 965.6 | |
| |
| | | December 31, | |
| | | 2017 | | | 2016 | | | 2015 | | | 2014 | | | 2013 | |
| Balance sheet data | | | | | | | | | | | | | | | | | | | | |
| Total assets | | $ | 8,594.2 | | | $ | 5,327.3 | | | $ | 5,103.0 | | | $ | 4,653.8 | | | $ | 4,384.6 | |
| Long-term debt(6) | | $ | 5,111.1 | | | $ | 3,063.0 | | | $ | 3,380.6 | | | $ | 2,532.1 | | | $ | 2,091.3 | |
| Total shareholders’ (deficit) equity | | $ | (114.9 | ) | | $ | (1,027.3 | ) | | $ | (333.0 | ) | | $ | 42.9 | | | $ | 347.9 | |
(1) | The significant change in 2016 and 2017 is primarily driven by the $863.8 million Settlement Charge ($700.7 million, net of tax, or $3.59 per diluted share) in 2016. |
(2) | The decline in operating cash flow in 2017 is primarily due to payments made relating to the Settlement Charge. Additionally, in the first quarter of 2017, the Company adopted ASUNo. 2016-09 “Improvements to Employee Share-Based Payment Accounting”. As required by ASU2016-09, Excess Tax Benefits or shortfalls relating to employee stock-based compensation are reflected in operating cash flow and the Company has applied this provision on a retrospective basis. Under previous accounting guidance, Excess Tax Benefits or shortfalls were shown as a reduction to operating cash flow and an increase to financing cash flow. |
(3) | Provision for income taxes in the year ended December 31, 2017 includes a net charge of $245.6 million related to the impact of U.S. tax reform and a statutory tax rate reduction in Belgium as more fully discussed in Note 15 to the consolidated financial statements in Item 8 of this Form10-K. |
(4) | The 2017 amount includes a $111.1 million Purchase Price Hedge Gain as well as the $59.7 million CCXI Gain. The 2016 amount includes an approximate $35 million FX gain relating to the substantial liquidation of a subsidiary. The 2015, 2014 and 2013 amounts include benefits of $7.1 million, $7.1 million and $22.8 million, respectively, related to the favorable resolution of certain Legacy Tax Matters. The 2014 amount also includes the ICRA Gain of $102.8 million. |
(5) | The 2017 amount includes: i) a $245.6 million ($1.27 per share) net charge related to the impact of U.S. tax reform and a statutory tax rate reduction in Belgium; ii) a $72.3 million ($0.37 per share) Purchase Price Hedge Gain; and iii) the $59.7 million ($0.31 per share) CCXI Gain. The 2016 amount includes: i) a $700.7 million ($3.59 per share) Settlement Charge; ii) $8.1 million ($0.04 per share) restructuring charge; and iii) a $34.8 million ($0.18 per share) FX gain relating to the substantial liquidation of a subsidiary. The 2015, 2014 and 2013 amounts include benefits of $6.4 million ($0.03 per share), $6.4 million ($0.03 per share) and $21.3 million ($0.09 per share), respectively, related to the resolution of certain Legacy Tax Matters. Also, the 2014 amount includes the ICRA Gain of $78.5 million ($0.37 per share) and the 2013 amount includes a litigation settlement charge of $0.14 per share. |
(6) | The 2017 amount excludes $429.4 million relating to the current portion of long-term debt and commercial paper. The 2016 amount excludes $300.0 million of the Series2007-1 Notes which were due in 2017. |
ITEM 7. | | MANAGEMENT’S DISCUSSION AND ANALYSIS OF FINANCIAL CONDITION AND RESULTS OF OPERATIONS |
MANAGEMENT'S DISCUSSION AND ANALYSIS OF FINANCIAL CONDITION AND RESULTS OF OPERATIONS
This discussion and analysis of financial condition and results of operations should be read in conjunction with the Moody’s Corporation consolidated financial statements and notes thereto included elsewhere in this annual report on Form
10-K.This MD&AManagement’s Discussion and Analysis of Financial Condition and Results of Operations contains Forward-Looking Statements. See “Forward-Looking Statements” commencing on page 5866 and Item 1A. “Risk Factors” commencing on page 1827 for a discussion of uncertainties, risks and other factors associated with these statements.
Moody’s is a
provider of (i) credit ratings; (ii) credit, capital marketsglobal integrated risk assessment firm that empowers organizations and
economic research, data and analytical tools; (iii) software solutions that support financial risk management activities; (iv) quantitatively derived credit scores; (v) financial services training and certification services; (vi) offshore financial research and analytical services; and (vii) company information and business intelligence products.investors to make better decisions. Moody’s reports in two
reportable segments: MIS and MA.
MIS the credit rating agency, publishes credit ratings and provides assessment services on a wide range of debt obligations, programs and facilities, and the entities that issue such obligations in markets worldwide. Revenueworldwide, including various corporate, financial institution and governmental obligations, and structured finance securities.
MA is primarily derived froma global provider of: i) data and information; ii) research and insights; and iii) decision solutions, which help companies make better and faster decisions. MA leverages its industry expertise across multiple risks such as credit, market, financial crime, supply chain, catastrophe and climate to deliver integrated risk assessment solutions that enable business leaders to identify, measure and manage the originatorsimplications of interrelated risks and issuersopportunities.
COVID-19
The Company continues to closely monitor the impact of such transactions who use MIS ratings in the distributionCOVID-19 pandemic on all aspects of their debt issuesits business. The Company continues to investors. Additionally, MIS earns revenue from certainnon-ratings-related operations which consist primarilymonitor regional developments relating to the COVID-19 pandemic to inform decisions on the reopening of financial instruments pricing services inits offices and its business travel policies. As of the Asia-Pacific region as well as revenue from ICRA’snon-ratings operations. date of the filing of this annual report on Form 10-K, the Company has reopened most of its offices for employees to access on a voluntary basis.
The
revenue from these operations is included inCOVID-19 pandemic has not had a material adverse impact on the
MIS Other LOBCompany's reported results to date and is
currently not
expected to have a material
adverse impact on its near-term outlook. However, Moody's is unable to predict the longer-term impact that the pandemic may have on its business, future results of operations, financial position or cash flows due to numerous uncertainties. Refer to Item 1A. “Risk Factors” for further disclosure relating to the
resultsrisks of the
MIS segment.The MA segment develops a wide range of products and services that support financial analysis and risk management activities of institutional participants in global financial markets. Within its RD&A business, MA distributes research and data developed by MIS as part of its ratings process, includingin-depth researchCOVID-19 pandemic on major debt issuers, industry studies and commentary on topical credit-related events. The RD&A business also produces economic research and data and analytical tools such as quantitative credit risk scores as well as business intelligence and company information products. Within its ERS business, MA provides software solutions as well as related risk management services. The PS business provides offshore research and analytical services and financial training and certification programs.
the Company's business.
CRITICAL ACCOUNTING ESTIMATES
Moody’s discussion and analysis of its financial condition and results of operations are based on the Company’s consolidated financial statements, which have been prepared in accordance with
GAAP.accounting principles generally accepted in the United States. The preparation of these financial statements requires Moody’s to make estimates and judgments that affect reported amounts of assets and liabilities and related disclosures of contingent assets and liabilities at the dates of the financial statements and revenue and expenses during the reporting periods. These estimates are based on historical experience and on other assumptions that are believed to be reasonable under the circumstances. On an ongoing basis, Moody’s evaluates its
estimates, including those related to revenue recognition, accounts receivable allowances, contingencies, goodwill and intangible assets (including the estimated useful lives of amortizable intangible assets), pension and other retirement benefits and UTBs.critical accounting estimates. Actual results may differ from these estimates under different assumptions or conditions. The following accounting estimates are considered critical because they are particularly dependent on management’s judgment about matters that are uncertain at the time the accounting estimates are made and changes to those estimates could have a material impact on the Company’s consolidated results of operations or financial condition.
Revenue Recognition
Revenue is recognized when persuasive evidence
Goodwill and Other Acquired Intangible Assets
On July 31st of each year, Moody’s evaluates its goodwill for impairment at the reporting unit level, defined as an operating segment (i.e., MIS and MA), or one level below an operating segment (i.e., a component of an arrangement exists, deliveryoperating segment).
Prior to the second quarter of 2021, MA's reporting unit structure consisted of five reporting units (Content, ERS, MALS, Bureau van Dijk and Reis). Pursuant to a strategic reorganization in the MA segment which was completed in the second quarter of 2021, MA's reporting unit structure has occurred orbeen reorganized into two reporting units. MA’s two new reporting units generally consist of: i) businesses offering data and data-driven analytical solutions; and ii) risk-management software, workflow and CRE solutions. This reorganization did not result in a change to the services have been provided and acceptedCompany's reportable segments.
The Company performed qualitative assessments of the reporting units impacted by the
customer when applicable, fees are determinablereorganization immediately before and
after the
collection of resulting receivables is considered probable.Pursuant to ASC Topic 605, when a sales arrangement contains multiple deliverables,reorganization became effective. These qualitative assessments resulted in the Company allocates revenuedetermining that it was not more likely than not that the fair value of any reporting unit was less than its carrying amount.
Subsequent to each deliverable basedthe aforementioned reorganization of the MA reporting units, the Company now has four reporting units: two within the Company’s ratings business (one for the ICRA business and one that encompasses all of Moody’s other ratings operations) and two reporting units within MA consisting of businesses that offer: i) data and data-driven analytical solutions; and ii) risk-management software, workflow and CRE solutions.
The RMS business was acquired on
its relative selling price which is determined basedSeptember 15, 2021 and $1,266 million of goodwill was assigned to the MA reporting unit consisting of risk-management software, workflow and CRE solutions, $90 million was assigned to the MIS reporting unit, and $20 million was assigned to the MA reporting unit consisting of businesses offering data and data-driven analytical solutions. In addition, the Company acquired PassFort on
its vendor specific objective evidence if available, third party evidence if VSOE isNovember 30, 2021 and $138 million of goodwill was assigned to the reporting unit consisting of businesses offering data and data-driven analytical solutions. As the acquisitions of these businesses were completed after the Company's annual impairment assessment date of July 31, 2021, goodwill acquired in these transactions was not
available, or estimated selling price if neither VSOE nor TPE is available.The Company’s products and services will generally qualify as separate units of accounting under ASC Topic 605. subject to the Company's impairment assessment described below.
The Company evaluates
each deliverable in an arrangementthe recoverability of goodwill using a two-step impairment test approach at the reporting unit level. In the first step, the Company assesses various qualitative factors to determine whether
it representsthe fair value of a
separatereporting unit
of accounting. A deliverable constitutesmay be less than its carrying amount. If a
separate unit of accounting when it has stand-alone value todetermination is made based on the
customers and if the arrangement includes a customer refund or return right relative to the delivered item and the delivery and performance of the undelivered item is considered probable and substantially in the Company’s control. In instances where the aforementioned criteria arequalitative factors that an impairment does not
met, the deliverable is combined with the undelivered items and revenue recognition is determined as one single unit.
The Company determines whether its selling price in a multi-element transaction meets the VSOE criteria by using the price charged for a deliverable when sold separately or, if the deliverable is not yet being sold separately, the price established by management having the relevant authority to establish such a price. In instances whereexist, the Company is not ablerequired to establish VSOE for all deliverablesperform further testing. If the aforementioned qualitative assessment results in the Company concluding that it is more likely than not that the fair value of a multiple element arrangement, whichreporting unit may be dueless than its carrying amount, the fair value of the reporting unit will be quantitatively determined and compared to its carrying value including goodwill. If the Company infrequently selling each element separately,fair value of the reporting unit exceeds the carrying value of the net assets assigned to that unit, goodwill is not selling products within a reasonably narrow price range, or only having a limited sales history, the Company attempts to establish TPE for deliverables. The Company determines whether TPE exists by evaluating largely similarimpaired, and interchangeable competitor products or services in standalone sales to similarly situated customers. However, due to the difficulty in obtaining third party pricing, possible differences in its market strategy from that of its peers and the potential that products and services offered by the Company may contain a significant level of differentiation and/or customization such that the comparable pricing of products with similar functionality cannot be obtained, the Company generally is unable to reliably determine TPE. Based on the selling price hierarchy established by ASC Topic 605, when the Company is unablenot required to establish selling price using VSOE or TPE,perform further testing. If the fair value of the reporting unit is less than the carrying value, the Company will establish an ESP. ESP isrecord a goodwill impairment charge for the price atamount by which the Company would transact a sale ifcarrying value exceeds the product or service were sold on a stand-alone basis.reporting unit’s fair value. The Company establishesevaluates its best estimate of ESP considering internal factors relevant to is pricing practices such as costs and margin objectives, standalone sales prices of similar products, percentage of the fee charged for a primary product or service relative to a related product or service, and customer segment and geography. Additional consideration is also given to market conditions such as competitor pricing strategies and market trend. The Company reviews its determination of VSOE, TPE and ESPreporting units on an annual basis, or more frequently if there are changes in the reporting structure of the Company due to acquisitions, realignments or if there are indicators of potential impairment. For the reporting units where the Company is consistently able to conclude that no impairment exists using only a qualitative approach, the Company’s accounting policy is to perform the second step of the aforementioned goodwill impairment assessment at least once every three years.
Annual goodwill impairment assessment performed at July 31, 2021
At July 31, 2021, the Company performed quantitative assessments for each of the four reporting units. These quantitative assessments were performed to provide new baseline valuations under the aforementioned new reporting unit structure. These quantitative assessments resulted in fair values that significantly exceeded carrying value for all reporting units.
Determining the fair value of a reporting unit involves the use of significant estimates and assumptions, which are more fully described below. In addition, the Company also makes certain judgments and assumptions in allocating shared assets and liabilities to determine the carrying values for each of its reporting units.
Other assets and liabilities, including applicable corporate assets, are allocated to the extent they are related to the operation of respective reporting units.
Matters concerning the ICRA reporting unit
ICRA has reported various matters relating to: (i) an adjudication order and fine imposed (and subsequently enhanced) by the Securities and Exchange Board of India (SEBI) in connection with credit ratings assigned to one of ICRA’s customers and the customer’s subsidiaries, which are being appealed by ICRA; (ii) the completion of internal examinations regarding various anonymous complaints, and actions taken by ICRA’s board based on the examinations’ findings; and (iii) a separate internal examination of certain allegations against two former senior ICRA officials. An unfavorable resolution of the aforementioned matters may negatively impact ICRA’s future operating results, which could result in an impairment of goodwill and amortizable intangible assets in future quarters.
Methodologies and significant estimates utilized in determining the fair value of reporting units:
The following is a discussion regarding the Company’s methodology for determining the fair value of its reporting units, excluding ICRA, at July 31, 2021. As ICRA is a publicly traded company in India, the Company was able to observe its fair value based on its market capitalization.
The fair value of each reporting unit, excluding ICRA, was estimated using a discounted cash flow methodology and comparable public company and precedent transaction multiples. The discounted cash flow analysis requires significant estimates, including projections of future operating results and cash flows of each reporting unit that are based on internal budgets and strategic plans, expected long-term growth rates, terminal values, weighted average cost of capital and the effects of external factors and market conditions. Changes in these estimates and assumptions could materially affect the estimated fair value of each reporting unit that could result in an impairment charge to reduce the carrying value of goodwill, which could be material to the Company’s financial position and results of operations. Moody’s allocates newly acquired goodwill to reporting units based on the reporting unit expected to benefit from the acquisition.
The sensitivity analyses on the future cash flows and WACC assumptions are described below. These key assumptions utilized in the discounted cash flow valuation methodology require significant management judgment:
–Future cash flow assumptions - The projections for future cash flows utilized in the models are derived from historical experience and assumptions regarding future growth and profitability of each reporting unit. These projections are consistent with the Company’s operating budget and strategic plan. Cash flows for the five years subsequent to the date of the quantitative goodwill impairment test were utilized in the determination of the fair value of each reporting unit. The growth rates assumed a gradual increase in revenue based on new customer acquisition and new products. Beyond five years a terminal value was determined using a perpetuity growth rate based on inflation and real GDP growth rates. A sensitivity
analysis of the revenue growth rates was performed on all reporting units. For each reporting unit analyzed, a 10% reduction in the revenue growth rates used would not have resulted in its carrying value exceeding its estimated fair value.
–WACC - The WACC is the rate used to discount each reporting unit’s estimated future cash flows. The WACC is calculated based on the proportionate weighting of the cost of debt and equity. The cost of equity is based on a risk-free interest rate and an equity risk factor, which is derived from public companies similar to the reporting unit and which captures the perceived risks and uncertainties associated with the reporting unit’s cash flows. The cost of debt component is calculated as needed.the weighted average cost associated with all of the Company’s outstanding borrowings as of the date of the impairment test and was immaterial to the computation of the WACC. The cost of debt and equity is weighted based on the debt to market capitalization ratio of publicly traded companies with similarities to the reporting unit being tested. The WACC for all reporting units ranged from 8.0% to 8.5% as of July 31, 2021. Differences in the WACC used between reporting units is primarily due to distinct risks and uncertainties regarding the cash flows of the different reporting units. A sensitivity analysis of the WACC was performed on all reporting units as of July 31, 2021 for each reporting unit. For all reporting units, an increase in the WACC of one percentage point would not result in the carrying value of the reporting unit exceeding its fair value.
Long-lived assets
Long-lived assets, which consist primarily of amortizable intangible assets, operating lease ROU assets and property and equipment, are reviewed for recoverability whenever events or changes in circumstances indicate that the carrying amount may not be recoverable.
Under the first step of the recoverability assessment, Moody's compares the estimated undiscounted future cash flows attributable to the asset or asset group to its carrying value. If the undiscounted future cash flows are greater than the carrying value, no further assessment is required. If the undiscounted future cash flows are less than the carrying value, Moody's proceeds with step two of the assessment. Under step two of this assessment, Moody's is required to determine the fair value of the asset or asset group and recognize an impairment loss if the carrying amount exceeds its fair value. In performing this assessment, Moody's must include assumptions that market participants would use in their estimates of fair value, including the estimated future cash flows and discount rate. Moody's must apply judgment in developing estimated future cash flows and in the determination of market participant assumptions.
Income Taxes
The Company is subject to income taxes in the U.S. and various foreign jurisdictions. The Company’s tax assets and liabilities are affected by the amounts charged for services provided and expenses incurred as well as other tax matters such as intercompany transactions. The Company accounts for income taxes under the asset and liability method in accordance with ASC Topic 740. Therefore, income tax expense is based on reported income before income taxes, and deferred income taxes reflect the effect of temporary differences between the amounts of assets and liabilities that are recognized for financial reporting purposes and the amounts that are recognized for income tax purposes.
The Company is subject to tax audits in various jurisdictions. The Company regularly assesses the likely outcomes of such audits in order to determine the appropriateness of liabilities for UTPs. The Company classifies interest related to income taxes as a component of interest expense in the Company’s consolidated financial statements and associated penalties, if any, as part of other non-operating expenses.
For UTPs, ASC Topic 740 requires a company to first determine whether it is more-likely-than-not (defined as a likelihood of more than fifty percent) that a tax position will be sustained based on its technical merits as of the reporting date, assuming that taxing authorities will examine the position and have full knowledge of all relevant information. A tax position that meets this more-likely-than-not threshold is then measured and recognized at the largest amount of benefit that is greater than fifty percent likely to be realized upon effective settlement with a taxing authority. As the determination of liabilities related to UTPs and associated interest and penalties requires significant estimates to be made by the Company, there can be no assurance that the Company will accurately predict the outcomes of these audits, and thus the eventual outcomes could have a material impact on the Company’s operating results or financial condition.
Revenue Recognition and Costs to Obtain a Contract with a Customer
Revenue is recognized when control of promised goods or services is transferred to the customer, in an amount that reflects the consideration the Company expects to be entitled to in exchange for those goods or services.
The discussion below outlines areas of the Company’s revenue recognition process that require significant management judgment and estimates. Refer to Note 2 of the consolidated financial statements for a comprehensive discussion regarding the Company’s accounting policies relating to the recognition of revenue and costs to obtain a contract with a customer.
Allocating consideration to performance obligations:
Management judgment is required in the determination of the SSP, which is utilized to allocate the transaction price to each distinct performance obligation at contract inception when the contract includes multiple distinct performance obligations.
In the MIS segment, revenue attributed to initialthe SSP for both ratings of issued securitiesand monitoring services is recognized whengenerally based upon directly observable selling prices where the rating or monitoring service is delivered to the issuer. Revenue attributed to monitoringsold separately.
In the caseMA segment, for performance obligations where an observable price exists, such as PCS, the observable price is utilized. If an observable price does not currently exist, the Company will utilize management’s best estimate of commercial mortgage-backed securities, structured credit, international residential mortgage-backedSSP for that good or service using estimation methods that maximize the use of observable data points.
The SSP in both segments is usually apportioned along the lines of class of customer, nature of product/services, and
asset-backed securities, issuers can elect to pay the monitoring fees upfront. These fees are deferred and recognized over the future monitoring periods based on the expected lives of the rated securities, which was approximately 24 years on a weighted average basis at December 31, 2017. At December 31, 2017, 2016 and 2015, deferred revenueother attributes related to
these securities was approximately $140.1 million, $133.0 million,those products and
$121.0 million.Multiple element revenue arrangements inservices. Once SSP is determined for each performance obligation, the MIS segment are generally comprised of an initial rating and the related monitoring service. In instances where monitoring fees are not charged for the first year monitoring effort, fees aretransaction price, including any discount, is allocated to the initial rating and monitoring services based on the relative selling priceSSP of each servicethe separate performance obligations.
Costs to Obtain a Contract with a Customer:
Costs incurred to obtain customer contracts, such as sales commissions, are deferred and recorded within other current assets and other assets when such costs are determined to be incremental to obtaining a contract, would not have been incurred otherwise and the Company expects to recover those costs. These costs are amortized to expense on a systematic basis consistent with the transfer of products or services to the
total arrangement fees. The Company generally uses ESP in determining the selling price for its initial ratings as the Company rarely provides initial ratings separately without providing related monitoring services and thus is unable to establish VSOE or TPE for initial ratings.MIS estimates revenue for ratings of commercial papercustomer for which in addition to a fixed annual monitoring fee, issuers are billed quarterly based on amounts outstanding. Revenue is accrued each quarter based on estimated amounts outstanding and is billed when actual data is available. The estimate is determined basedthe asset relates. Depending on the issuers’ most recent reported quarterly data. At December 31, 2017, 2016 and 2015, accounts receivable included approximately $27.0 million, $25.0 million, and $24.0 million, respectively, relatedline of business to accrued commercial paper revenue. Historically, MIS has not had material differences betweenwhich the estimated revenue and the actual billings. Furthermore, for certain annual monitoring services, fees are not invoiced until the end of the annual monitoringcontract relates, this amortization period and revenue is accrued ratably over the monitoring period. At December 31, 2017, 2016 and 2015, accounts receivable included approximately $185.0 million, $159.1 million, and $146.4 million, respectively, relating to accrued annual monitoring service revenue.
In the MA segment, products and services offered by the Company include software licenses and related maintenance, subscriptions, and professional services. Revenue from subscription based products, such as research and data subscriptions and certain software-based credit risk management subscription products, is recognized ratably over the related subscription period, which is principally one year. Revenue from sale of perpetual licenses of credit processing software is generally recognized at the time the product master or first copy is delivered or transferred to and accepted by the customer. If uncertainty exists regarding customer acceptance of the product or service, revenue is not recognized until acceptance occurs. Software maintenance revenue is recognized ratably over the annual maintenance period. Revenue from professional services rendered is generally recognized as the services are performed. A large portion of annual research and data subscriptions and annual software maintenance are invoiced in the months of November, December and January.
Products and services offered within the MA segment are sold either stand-alone or together in various combinations. In instances where a multiple element arrangement includes software andnon-software deliverables, revenue is allocated to thenon-software deliverables and to the software deliverables, as a group, using the relative selling prices of each of the deliverables in the arrangement based on the aforementioned selling price hierarchy. Revenue is recognized for each elementmay be based upon the conditions for revenue recognition noted above.
If the arrangement contains more than one software deliverable, the arrangement consideration allocated to the software deliverables as a group is allocated to each software deliverable using VSOE. In the instances where the Company is not able to determine VSOE for allaverage economic life of the deliverables of an arrangement, the Company allocates the revenue to the undelivered elements equal to its VSOE and the
residual revenue to the delivered elements. If the Company is unable to determine VSOEproducts sold or average period for an undelivered element, the Company defers all revenue allocated to the software deliverables until the Company has delivered all of the elements or when VSOE has been determined for the undelivered elements. In cases where software implementationwhich services are considered essential and VSOEprovided, inclusive of fair value exists for post-contract customer support (“PCS”), once the delivery criteria has been met on the standard software, license and service revenue is recognized on apercentage-of-completion basis as implementation services are performed, while PCS is recognized over the coverage period. If VSOE of fair value does not exist for PCS, once the delivery criteria has been met on the standard software, service revenue is recognized on a zero profit margin basis until essential services are complete, at which point total remaining arrangement revenue is then spread ratably over the remaining PCS coverage period. If VSOE does not exist for PCS at the beginning of an arrangement but is established during implementation, revenue not recognized due to the absence of VSOE will be recognized on a cumulative basis.
Accounts Receivable Allowance
Moody’s records an allowance for estimated future adjustments to customer billings as a reduction of revenue, based on historical experience and current conditions. Such amounts are reflected as additions to the accounts receivable allowance. Additionally, estimates of uncollectible accounts are recorded as bad debt expense and are reflected as additions to the accounts receivable allowance. Actual billing adjustments and uncollectible account write-offs are charged against the allowance. Moody’s evaluates its accounts receivable allowance by reviewing and assessing historical collection and invoice adjustment experience as well as the current aging status of customer accounts. Moody’s also considers the economic environment of the customers, both from an industry and geographic perspective, in evaluating the need for allowances. Based on its analysis, Moody’s adjusts its allowance as considered appropriate in the circumstances. This process involves a high degree of judgment and estimation and could involve significant dollar amounts. Accordingly, Moody’s results of operations can be affected by adjustments to the allowance. Management believes that the allowance for uncollectible accounts receivable is adequate to cover anticipated adjustments and write-offs under current conditions. However, significant changes in any of the above factors, or actual write-offs or adjustments that differ from the estimated amounts could impact the Company’s consolidated results of operations.
contract renewals.
Accounting for contingencies, including those matters described in Note
1921 to the consolidated financial statements, is highly subjective and requires the use of judgments and estimates in assessing their magnitude and likely outcome. In many cases, the outcomes of such matters will be determined by third parties, including governmental or judicial bodies. The provisions made in the consolidated financial statements, as well as the related disclosures, represent management’s best estimates of the current status of such matters and their potential outcome based on a review of the facts and in consultation with outside legal counsel where deemed appropriate. The Company regularly reviews contingencies and as new information becomes available may, in the future, adjust its associated liabilities.
For claims, litigation and proceedings and governmental investigations and inquiries not related to income taxes, where it is both probable that a liability has been incurred and the amount of loss can be reasonably estimated, the Company records liabilities in the consolidated financial statements and periodically adjusts these as appropriate. When the reasonable estimate of the loss is within a range of amounts, the minimum amount of the range is accrued unless some higher amount within the range is a better estimate than another amount within the range. In other instances, where a loss is reasonably possible, management does not record a liability because of uncertainties related to the probable outcome and/or the amount or range of loss, but discloses the contingency if material. As additional information becomes available, the Company adjusts its assessments and estimates of such matters accordingly. In view of the inherent difficulty of predicting the outcome of litigation, regulatory, governmental investigations and inquiries, enforcement and similar matters and contingencies, particularly where the claimants seek large or indeterminate damages or where the parties assert novel legal theories or the matters involve a large number of parties, the Company cannot predict what the eventual outcome of the pending matters will be or the timing of any resolution of such matters. The Company also cannot predict the impact (if any) that any such matters may have on how its business is conducted, on its competitive position or on its financial position, results of operations or cash flows. As the process to resolve any pending matters progresses, management will continue to review the latest information available and assess its ability to predict the outcome of such matters and the effects, if any, on its operations and financial condition. However, in light of the large or indeterminate damages sought in some of them, the absence of similar court rulings on the theories of law asserted and uncertainties regarding apportionment of any potential damages, an estimate of the range of possible losses cannot be made at this time.
The Company’s wholly-owned insurance subsidiary insures the Company against certain risks including but not limited to deductibles for worker’s compensation, employment practices litigation, employee medical claims and terrorism, for which the claims are not material to the Company. In addition, for claim years 2008 and 2009, the insurance subsidiary insured the Company for defense costs
related to professional liability claims. For matters insured by the Company’s insurance subsidiary, Moody’s records liabilities based on the estimated total claims expected to be paid and total projected costs to defend a claim through its anticipated conclusion. The Company determines liabilities based on an assessment of management’s best estimate of claims to be paid and legal defense costs as well as actuarially determined estimates. Defense costs for matters not self-insured by the Company’s wholly-owned insurance subsidiary are expensed as services are provided.
For income tax matters, the Company employs the prescribed methodology of Topic 740 of the ASC which requires a company to first determine whether it ismore-likely-than-not (defined as a likelihood of more than fifty percent) that a tax position will be sustained based on its technical merits as of the reporting date, assuming that taxing authorities will examine the position and have full knowledge of all relevant information. A tax position that meets thismore-likely-than-not threshold is then measured and recognized at the largest amount of benefit that is greater than fifty percent likely to be realized upon effective settlement with a taxing authority.
Goodwill and Other Acquired Intangible Assets
As of July 31 of each year, Moody’s evaluates its goodwill for impairment at the reporting unit level, defined as an operating segment or one level below an operating segment.
The Company has seven primary reporting units: two within the Company’s ratings business (one for the ICRA business and one that encompasses all of Moody’s other ratings operations) and five reporting units within MA: RD&A, ERS, FSTC, MAKS and Bureau van Dijk. The RD&A reporting unit encompasses the distribution of investor-oriented research and data developed by MIS as part of its ratings process,in-depth research on major debt issuers, industry studies, economic research and commentary on topical events and credit analytic tools. The ERS reporting unit provides products and services that support the credit risk management and regulatory compliance activities of financial institutions and also provides advanced actuarial software for the life insurance industry. These products and services are primarily delivered via software that is licensed on a perpetual basis or sold on a subscription basis. The FSTC reporting unit consists of the portion of the MA business that offers both credit training as well as other professional development training and implementation services. The MAKS reporting unit provides offshore research and analytical services. The Bureau van Dijk reporting unit consists of the newly acquired Bureau van Dijk business, which was acquired on August 10, 2017, and primarily provides business intelligence and company information products.
The Company evaluates the recoverability of goodwill using atwo-step impairment test approach at the reporting unit level. In the first step, the Company assesses various qualitative factors to determine whether the fair value of a reporting unit may be less than its carrying amount. If a determination is made based on the qualitative factors that an impairment does not exist, the Company is not required to perform further testing. If the aforementioned qualitative assessment results in the Company concluding that it is more likely than not that the fair value of a reporting unit may be less than its carrying amount, the fair value of the reporting unit will be determined and compared to its carrying value including goodwill. If the fair value of the reporting unit exceeds the carrying value of the net assets assigned to that unit, goodwill is not impaired and the Company is not required to perform further testing. If the fair value of the reporting unit is less than the carrying value, the Company will record a goodwill impairment charge for the amount by which the carrying value exceeds the reporting unit’s fair value. The Company evaluates its reporting units on an annual basis, or more frequently if there are changes in the reporting structure of the Company due to acquisitions or realignments. For the reporting units where the Company is consistently able to conclude that no impairment exists using only a qualitative approach, the Company’s accounting policy is to perform the second step of the aforementioned goodwill impairment assessment at least once every three years. At July 31, 2017, the Company performed a qualitative assessment on all reporting units except for MAKS, which resulted in no indicators of impairment of goodwill.
In January 2017 there was a management change in the MAKS business. A quantitative impairment assessment for the MAKS reporting unit was performed as of July 31, 2017 to reflect the completion of a new strategic plan for this reporting unit under new management (the Company’s annual strategic plan is completed in the third quarter of each year). This quantitative assessment resulted in no impairment of goodwill for the MAKS reporting unit at July 31, 2017.
Determining the fair value of a reporting unit or an indefinite-lived acquired intangible asset involves the use of significant estimates and assumptions. These estimates and assumptions include revenue growth rates and operating margins used to calculate projected future cash flows, risk-adjusted discount rates, future economic and market conditions, and appropriate comparable market metrics. However, as these estimates and assumptions are unpredictable and inherently uncertain, actual future results may differ from these estimates. In addition, the Company also makes certain judgments and assumptions in allocating shared assets and liabilities to determine the carrying values for each of its reporting units.
Other assets and liabilities, including applicable corporate assets, are allocated to the extent they are related to the operation of respective reporting units.
Sensitivity Analyses and Key Assumptions for Deriving the Fair Value of a Reporting Unit
The following table identifies the amount of goodwill allocated to each reporting unit as of December 31, 2017 as well as the amount by which the net assets of each reporting unit would exceed the fair value under Step 2 of the goodwill impairment test as prescribed in ASC Topic 350, assuming hypothetical reductions in their fair values as of the date of the last quantitative goodwill impairment assessment for each reporting unit.
| | | | | | | | | | | | | | | | | | | | |
| | | | | | Sensitivity Analysis | |
| | |
| | | | | | Deficit Caused by a Hypothetical Reduction to Fair Value | |
| | | | | |
| | | Goodwill | | | 10% | | | 20% | | | 30% | | | 40% | |
| MIS | | $ | 50.1 | | | $ | — | | | $ | — | | | $ | — | | | $ | — | |
| RD&A | | | 187.3 | | | | — | | | | — | | | | — | | | | — | |
| ERS | | | 340.8 | | | | — | | | | — | | | | — | | | | — | |
| FSTC | | | 90.8 | | | | — | | | | — | | | | (14.4 | ) | | | (34.6 | ) |
| MAKS | | | 160.9 | | | | — | | | | — | | | | (2.9 | ) | | | (35.6 | ) |
| ICRA | | | 238.5 | | | | — | | | | — | | | | — | | | | — | |
| Bureau van Dijk* | | | 2,684.8 | | | | N/A | | | | N/A | | | | N/A | | | | N/A | |
| | | | | | | | | | | | | | | | | | | | |
Totals | | $ | 3,753.2 | | | $ | — | | | $ | — | | | $ | (17.3 | ) | | $ | (70.2 | ) |
| | | | | | | | | | | | | | | | | | | | |
* | Bureau van Dijk was acquired subsequent to the Company’s annual goodwill impairment assessment as of July 31, 2017. Due to the close proximity of the Bureau van Dijk acquisition to December 31, 2017, the purchase price approximates the fair value of the reporting unit. Additionally, the Company has not completed its allocation of certain of the goodwill acquired to other MA reporting units that are anticipated to benefit from synergies resulting from the Bureau van Dijk acquisition. |
Methodologies and significant estimates utilized in determining of the fair value of reporting units:
The following is a discussion regarding the Company’s methodology for determining the fair value of its reporting units, excluding ICRA, as of the date of each reporting unit’s last quantitative assessment (July 31, 2017 for MAKS; July 31, 2016 for the remaining reporting units). As ICRA is a publicly traded company in India, the Company was able to observe its fair value based on its market capitalization.
The fair value of each reporting unit, excluding ICRA, was estimated using a discounted cash flow methodology and comparable public company and precedent transaction multiples. The DCF analysis requires significant estimates, including projections of future operating results and cash flows of each reporting unit that is based on internal budgets and strategic plans, expected long-term growth rates, terminal values, weighted average cost of capital and the effects of external factors and market conditions. Changes in these estimates and assumptions could materially affect the estimated fair value of each reporting unit which could result in an impairment charge to reduce the carrying value of goodwill, which could be material to the Company’s financial position and results of operations. Moody’s allocates newly acquired goodwill to reporting units based on the reporting unit expected to benefit from the acquisition.
The sensitivity analyses on the future cash flows and WACC assumptions described below are as of the date of the last quantitative goodwill impairment assessment for each reporting unit. The following discusses the key assumptions utilized in the discounted cash flow valuation methodology that requires significant management judgment:
» | | Future cash flow assumptions—The projections for future cash flows utilized in the models are derived from historical experience and assumptions regarding future growth and profitability of each reporting unit. These projections are consistent with the Company’s operating and strategic plan. Cash flows for the five years subsequent to the date of the quantitative goodwill impairment analysis were utilized in the determination of the fair value of each reporting unit. The growth rates assumed a gradual increase in revenue based on a continued improvement in the global economy and capital markets, new customer acquisition and new products. Beyond five years, a terminal value was determined using a perpetuity growth rate based on expected inflation and real GDP growth rates. A sensitivity analysis of the revenue growth rates was performed on all reporting units. For all reporting units, a 10% decrease in the revenue growth rates used would not have resulted in the carrying value of the reporting unit exceeding its respective estimated fair value. |
» | | WACC—The WACC is the rate used to discount each reporting unit’s estimated future cash flows. The WACC is calculated based on the proportionate weighting of the cost of debt and equity. The cost of equity is based on a risk-free interest rate, an equity risk factor which is derived from public companies similar to the reporting unit and which captures the perceived risks and uncertainties associated with the reporting unit’s cash flows. The cost of debt component is calculated as the weighted average cost associated with all of the Company’s outstanding borrowings as of the date of the impairment test and was immaterial to the computation of the WACC. The cost of debt and equity is weighted based on the debt to market capitalization ratio of publicly traded companies with similarities to the reporting unit being tested. The WACC for all reporting units ranged from 8.5% to 10.5%. Differences in the WACC used between reporting units is primarily due to distinct risks and uncertainties regarding the cash flows of the different reporting units. A sensitivity analysis of the WACC was performed on all reporting units whereby an increase in the WACC of one percentage point would not result in the carrying value of the reporting unit exceeding its fair value. |
Amortizable intangible assets are reviewed for recoverability whenever events or changes in circumstances indicate that the carrying amount may not be recoverable. There were no such events or changes during 2017 that would indicate that the carrying amount of amortizable intangible assets in any of the Company’s reporting units may not be recoverable. This determination was made based on continued growth, consistent with operating and strategic plans for the reporting unit where the intangible asset resides.
Pension and Other Retirement Benefits
The expenses, assets and liabilities that Moody’s reports for its Retirement Plans are dependent on many assumptions concerning the outcome of future events and circumstances. These significant assumptions include the following:
» | | future compensation increases are based on the Company’s long-term actual experience and future outlook; |
» | | long-term expected return on pension plan assets is based on historical portfolio results and the expected future average annual return for each major asset class within the plan’s portfolio (which is principally comprised of equity and fixed-income investments); and |
» | | discount rates are based on current yields on high-grade corporate long-term bonds. |
The discount rates used to measure the present value of the Company’s benefit obligation for its Retirement Plans as of December 31, 2017 were derived using a cash flow matching method whereby the Company compares each plan’s projected payment obligations by year with the corresponding yield on the Citibank pension discount curve. The cash flows by plan are then discounted back to present value to determine the discount rate applicable to each plan.
Moody’s major assumptions vary by plan and assumptions used are set forth in Note 13 to the consolidated financial statements. In determining these assumptions, the Company consults with third-party actuaries and other advisors as deemed appropriate. While the Company believes that the assumptions used in its calculations are reasonable, differences in actual experience or changes in assumptions could have a significant effect on the expenses, assets and liabilities related to the Company’s Retirement Plans. Additionally, the Company has updated its mortality assumption by adopting the newly released mortality improvement scaleMP-2017 to accompany theRP-2014 mortality tables to reflect the latest information regarding future mortality expectations by the Society of Actuaries.
When actual plan experience differs from the assumptions used, actuarial gains or losses arise. Excluding differences between the expected long-term rate of return assumption and actual returns on plan assets, the Company amortizes, as a component of annual pension expense, total outstanding actuarial gains or losses over the estimated average future working lifetime of active plan participants to the extent that the gain/loss exceeds 10% of the greater of thebeginning-of-year projected benefit obligation or the market-related value of plan assets. For Moody’s Retirement Plans, the total actuarial losses as of December 31, 2017 that have not been recognized in annual expense are $123.2 million, and Moody’s expects to recognize a net periodic expense of $6.0 million in 2018 related to the amortization of actuarial losses.
For Moody’s funded U.S. pension plan, the differences between the expected long-term rate of return assumption and actual experience could also affect the net periodic pension expense. As permitted under ASC Topic 715, the Company spreads the impact of asset experience over a five-year period for purposes of calculating the market-related value of assets that is used in determining the expected return on assets’ component of annual expense and in calculating the total unrecognized gain or loss subject to amortization. As of December 31, 2017, the Company has an unrecognized asset loss of $16.1 million, of which $2.1 million will be recognized in the market-related value of assets that is used to calculate the expected return on assets’ component of 2019 expense.
The table below shows the estimated effect that a one percentage-point decrease in each of these assumptions will have on Moody’s 2018 income before provision for income taxes. These effects have been calculated using the Company’s current projections of 2018 expenses, assets and liabilities related to Moody’s Retirement Plans, which could change as updated data becomes available.
| | | | | | | | |
| (dollars in millions) | | Assumption Used for 2018 | | | Estimated Impact on
2018 income before provision
for income taxes
(Decrease)/Increase | |
| Weighted Average Discount Rates* | | | 3.46%/3.45% | | | $ | (11.4 | ) |
| Weighted Average Assumed Compensation Growth Rate | | | 3.71% | | | $ | 1.6 | |
| Assumed Long-Term Rate of Return on Pension Assets | | | 4.50% | | | $ | (3.4 | ) |
* | Weighted average discount rates of 3.46% and 3.45% for pension plans and Other Retirement Plans, respectively. |
A one percentage-point increase in assumed healthcare cost trend rates will not affect 2018 projected expenses. Based on current projections, the Company estimates that expenses related to Retirement Plans will be approximately $31 million in 2018, a decrease compared to the $32.6 million recognized in 2017.
Income Taxes
The Company is subject to income taxes in the U.S. and various foreign jurisdictions. The Company’s tax assets and liabilities are affected by the amounts charged for services provided and expenses incurred as well as other tax matters such as intercompany transactions. The Company accounts for income taxes under the asset and liability method in accordance with ASC Topic 740. Therefore, income tax expense is based on reported income before income taxes, and deferred income taxes reflect the effect of temporary differences between the amounts of assets and liabilities that are recognized for financial reporting purposes and the amounts that are recognized for income tax purposes.
The Company is subject to tax audits in various jurisdictions. The Company regularly assesses the likely outcomes of such audits in order to determine the appropriateness of liabilities for UTBs. The Company classifies interest related to income taxes as a component of interest expense in the Company’s consolidated financial statements and associated penalties, if any, as part of othernon-operating expenses.
For UTBs, ASC Topic 740 requires a company to first determine whether it ismore-likely-than-not (defined as a likelihood of more than fifty percent) that a tax position will be sustained based on its technical merits as of the reporting date, assuming that taxing authorities will examine the position and have full knowledge of all relevant information. A tax position that meets thismore-likely-than-not threshold is then measured and recognized at the largest amount of benefit that is greater than fifty percent likely to be realized upon effective settlement with a taxing authority. As the determination of liabilities related to UTBs and associated interest and penalties requires significant estimates to be made by the Company, there can be no assurance that the Company will accurately predict the outcomes of these audits, and thus the eventual outcomes could have a material impact on the Company’s operating results or financial condition.
On December 22, 2017, the Tax Act was signed into law which resulted in significant changes to U.S. corporate tax laws. The Tax Act includes a mandatoryone-time deemed repatriation tax (“transition tax”) on previously untaxed accumulated earnings of foreign subsidiaries and reduces the statutory federal corporate income tax rate from 35% to 21%. Due to the complexities involved in applying the provisions of the Tax Act, in 2017 the Company recorded a provisional estimate of $247.3 million related to the transition tax. A portion of this amount will be payable over eight years, starting in 2018, and will not accrue interest. Also in 2017, a provisional estimate of $56.2 million was recorded decreasing net deferred tax assets resulting from the reduction in the federal corporate income tax rate. The above provisional estimates may be impacted by a number of additional considerations, including but not limited to the issuance of regulations and our ongoing analysis of the new law.
Other Estimates
In addition, there are other accounting estimates within Moody’s consolidated financial statements, including recoverability of deferred tax assets, valuation of investments in affiliates and the estimated lives of amortizable intangible assets. Management believes the current assumptions and other considerations used to estimate amounts reflected in Moody’s consolidated financial statements are appropriate. However, if actual experience differs from the assumptions and other considerations used in estimating amounts reflected in Moody’s consolidated financial statements, the resulting changes could have a material adverse effect on Moody’s consolidated results of operations or financial condition.
See Note 2 to the consolidated financial statements for further information on significant accounting policies that impact Moody’s.
REPORTABLE SEGMENTS
The Company is organized into two reportable segments at December 31, 2017: MIS and MA.
The MIS segment is comprised primarily of all of the Company’s ratings operations consisting of five LOBs—CFG, SFG, FIG, PPIF and MIS Other. The ratings LOBs generate revenue principally from fees for the assignment and ongoing monitoring of credit ratings on debt obligations and the entities that issue such obligations in markets worldwide. The MIS Other LOB consists of certainnon-ratings operations managed by MIS which consists ofnon-rating revenue from ICRA and fixed income pricing service operations in the Asia-Pacific region.
The MA segment develops a wide range of products and services that support financial analysis and risk management activities of institutional participants in global financial markets as well as serving as provider of business intelligence and company information. The MA segment consists of three lines of business—RD&A, ERS and PS. The results of operations for MA and revenue for the RD&A LOB for the fourth quarter and year ended December 31, 2017 include the financial results from Bureau van Dijk which was acquired on August 10, 2017.
The following is a discussion of the results of operations of the Company and its reportable segments. Total MIS revenue and total MA expenses include the intersegment royalty revenue for MIS and expense charged to MA for the rights to use and distribute content, data and products developed by MIS. The royalty rate charged by MIS approximates the fair value of the aforementioned content, data and products developed by MIS. Total MA revenue and total MIS expenses include intersegment fees charged to MIS from MA for the
use of certain MA products and services in MIS’s ratings process. These fees charged by MA are generally equal to the costs incurred by MA to provide these products and services. Overhead charges and corporate expenses that exclusively benefit one segment are fully charged to that segment. Additionally, overhead costs and corporate expenses of the Company that benefit both segments are generally allocated to each segment based on a revenue-split methodology. Overhead expenses include costs such as rent and occupancy, information technology and support staff such as finance, human resources and information technology.
Beginning in the third quarter of 2017, in conjunction with the acquisition of Bureau van Dijk, the Company modified its definition of Adjusted Net Income and Adjusted Diluted EPS to exclude the impact of amortization of all acquisition-related intangible assets. Refer to the section entitled“Non-GAAP Financial Measures” of this Management Discussion and Analysis for further information regarding this measure.
RESULTS OF OPERATIONS
Year ended December 31, 2017 compared with year ended December 31, 2016
Executive Summary
» | | Moody’s completed the acquisition of Bureau van Dijk on August 10, 2017. Moody’s results of operations include Bureau van Dijk’s operating results beginning as of August 10, 2017. |
» | | Moody’s revenue in 2017 totaled $4,204.1 million, an increase of $599.9 million, or 17%, compared to 2016 reflecting strong growth in both segments. |
| » | | MIS revenue was 17% higher compared to the prior year with growth across all ratings LOBs. The most notable growth was in the CFG LOB mainly due to strong leveraged finance issuance across all regions reflecting favorable market conditions and increased investor demand for higher yielding securities. |
| » | | MA revenue grew 16% compared to the prior year reflecting growth across all LOBs. The most notable growth was in the RD&A LOB which reflected increases in credit research subscriptions and licensing of credit data as well as an approximate $92 million contribution from Bureau van Dijk (net of an approximate $36 million reduction relating to a deferred revenue adjustment required as part of acquisition accounting as further described in Note 7 to the financial statements), providing approximately seven percentage points to growth. |
» | | Total operating expenses excluding D&A decreased $602.1 million, or 21% compared to 2016 reflecting the $863.8 million Settlement Charge in 2016. This decrease is partially offset by higher compensation costs in 2017 which reflects growth in performance-based compensation resulting from strong financial performance in 2017 coupled with annual merit increases. Additionally, there was approximately $64 million in Bureau van Dijk operating expenses and $22.5 million in Acquisition-Related Expenses in 2017. |
» | | D&A increased $31.6 million primarily due to amortization of intangible assets acquired as part of the Bureau van Dijk acquisition. |
» | | Operating income of $1,809.1 million in 2017 increased $1,170.4 million compared to 2016 and resulted in an operating margin of 43.0%, compared to 17.7% in the prior year. Operating income and operating margin in 2016 were suppressed by the $863.8 million Settlement Charge. Adjusted Operating Income of $1,989.9 million in 2017 increased $348.7 million compared to 2016, resulting in an Adjusted Operating Margin of 47.3% compared to 45.5% in the prior year. |
» | | The decrease innon-operating expense, net, compared to the prior year is primarily due to: |
| » | | the $59.7 million CCXI Gain in 2017; |
| » | | the $111.1 million Purchase Price Hedge Gain in 2017; |
Partially offset by:
| » | | higher interest expense of $50.6 million primarily reflecting additional financing in 2017 utilized to fund the payment of the 2016 Settlement Charge, repay the Series2007-1 Notes and fund the Bureau van Dijk acquisition. |
| » | | FX losses of approximately $17 million in the 2017 compared to FX gains of approximately $50 million in the prior year. The FX gains in 2016 included approximately $35 million related to the liquidation of anon-U.S. subsidiary. |
» | | The ETR of 43.6% in 2017 includes a net charge of approximately $246 million in the fourth quarter related to the impacts of tax reform in the U.S. and Belgium partially offset by thenon-taxable CCXI Gain and an approximate $40 million benefit relating to Excess Tax Benefits on stock-based compensation. The 2016 ETR of 50.6% included thenon-deductible nature of the federal portion of the Settlement Charge. |
» | | Diluted EPS of $5.15 increased $3.79 compared to 2016. Diluted EPS in 2017 and 2016 included the following items, detailed in the table below, which impacted year-over-year comparability: |
| | | | | | | | |
| | | Year Ended December 31, | |
| | |
| Per share benefit (charge) to Diluted EPS | | 2017 | | | 2016 | |
| CCXI Gain | | $ | 0.31 | | | | — | |
| Purchase Price Hedge Gain | | $ | 0.37 | | | | — | |
| Restructuring | | | — | | | $ | (0.04 | ) |
| Settlement Charge | | | — | | | $ | (3.59 | ) |
| FX gain on liquidation of a subsidiary | | | — | | | $ | 0.18 | |
| Acquisition-Related Expenses | | $ | (0.10 | ) | | | — | |
| Amortization of acquired intangible assets | | $ | (0.23 | ) | | $ | (0.13 | ) |
| Impact of U.S. tax reform / Belgium statutory tax rate change | | $ | (1.27 | ) | | | — | |
Excluding all of the items in the table above, Adjusted Diluted EPS of $6.07, which included $0.20 relating to Excess Tax Benefits on stock-based compensation and $0.03 in financing costs incurred between the execution of the agreement to acquire Bureau van Dijk and the closing of the acquisition, increased $1.13 compared to 2016.
Moody’s Corporation
| | | | | | | | | | | | |
| | | Year ended December 31, | | | % Change Favorable
(Unfavorable) | |
| | | 2017 | | | 2016 | | |
| Revenue: | | | | | | | | | | | | |
United States | | $ | 2,348.4 | | | $ | 2,105.5 | | | | 12 | % |
| | | | | | | | | | | | |
International: | | | | | | | | | | | | |
EMEA | | | 1,131.7 | | | | 904.4 | | | | 25 | % |
Asia-Pacific | | | 471.4 | | | | 373.2 | | | | 26 | % |
Americas | | | 252.6 | | | | 221.1 | | | | 14 | % |
| | | | | | | | | | | | |
Total International | | | 1,855.7 | | | | 1,498.7 | | | | 24 | % |
| | | | | | | | | | | | |
Total | | | 4,204.1 | | | | 3,604.2 | | | | 17 | % |
| | | | | | | | | | | | |
| Expenses: | | | | | | | | | | | | |
Operating | | | 1,222.8 | | | | 1,026.6 | | | | (19 | %) |
SG&A | | | 991.4 | | | | 936.4 | | | | (6 | %) |
Restructuring | | | — | | | | 12.0 | | | | 100 | % |
Depreciation and amortization | | | 158.3 | | | | 126.7 | | | | (25 | %) |
Acquisition-Related Expenses | | | 22.5 | | | | — | | | | NM | |
Settlement Charge | | | — | | | | 863.8 | | | | 100 | % |
| | | | | | | | | | | | |
Total | | | 2,395.0 | | | | 2,965.5 | | | | 19 | % |
| | | | | | | | | | | | |
| Operating income | | $ | 1,809.1 | | | $ | 638.7 | | | | 183 | % |
| | | | | | | | | | | | |
| Adjusted Operating Income (1) | | $ | 1,989.9 | | | $ | 1,641.2 | | | | 21 | % |
| | | | | | | | | | | | |
| Interest expense, net | | $ | (188.4 | ) | | $ | (137.8 | ) | | | (37 | %) |
| Othernon-operating (expense) income, net | | $ | (4.7 | ) | | $ | 57.1 | | | | (108 | %) |
| Purchase Price Hedge Gain | | $ | 111.1 | | | $ | — | | | | NM | |
| CCXI Gain | | $ | 59.7 | | | $ | — | | | | NM | |
| | | | | | | | | | | | |
Non-operating expense, net | | $ | (22.3 | ) | | $ | (80.7 | ) | | | 72 | % |
| | | | | | | | | | | | |
| Net income attributable to Moody’s | | $ | 1,000.6 | | | $ | 266.6 | | | | 275 | % |
| Diluted weighted average shares outstanding | | $ | 194.2 | | | | 195.4 | | | | 1 | % |
| Diluted EPS attributable to Moody’s common shareholders | | $ | 5.15 | | | $ | 1.36 | | | | 279 | % |
| Adjusted Diluted EPS attributable to Moody’s common shareholders (1) | | $ | 6.07 | | | $ | 4.94 | | | | 23 | % |
| Operating margin | | | 43.0 | % | | | 17.7 | % | | | | |
| Adjusted Operating Margin (1) | | | 47.3 | % | | | 45.5 | % | | | | |
(1) | Adjusted Operating Income, Adjusted Operating Margin and Adjusted Diluted EPS attributable to Moody’s common shareholders arenon-GAAP financial measures. Refer to the section entitled“Non-GAAP Financial Measures” of this Management Discussion and Analysis for further information regarding these measures. |
The table below shows Moody’s global staffing by geographic area:
| | | | | | | | | | | | |
| | | December 31, | | | % Change | |
| | | 2017 | | | 2016 | | |
| United States | | | 3,591 | | | | 3,386 | | | | 6 | % |
| International | | | 8,305 | | | | 7,231 | | | | 15 | % |
| | | | | | | | | | | | |
| Total | | | 11,896 | * | | | 10,617 | | | | 12 | % |
| | | | | | | | | | | | |
* | Includes 874 employees from the acquisition of Bureau van Dijk |
Global revenue of $4,204.1 million in 2017 increased $599.9 million, or 17%, compared to 2016 and reflected strong growth in both MIS and MA.
The $403.0 million increase in MIS revenue primarily reflects strong global leveraged finance rated issuance volumes in CFG as issuers took advantage of favorable market conditions to refinance obligations in 2017 as well as growth in the banking sector within FIG and in CLO issuance in SFG. Additionally, the increase over prior year reflects benefits from changes in the mix of fee type, new fee initiatives and pricing increases. These increases were partially offset by lower U.S. public finance refunding volumes.
The $196.9 million increase in MA revenue primarily reflects higher RD&A revenue across all regions driven by growth in credit research subscriptions and licensing of ratings data as well as the contribution from the Bureau van Dijk acquisition of approximately $92 million (net of an approximate $36 million reduction relating to a deferred revenue adjustment required as part of acquisition accounting as further described in Note 7 to the financial statements).
Transaction revenue accounted for 50% of global MCO revenue in 2017, compared to 49% in 2016.
U.S. revenue of $2,348.4 million in 2017 increased $242.9 million over the prior year, reflecting growth in both reportable segments.
Non-U.S. revenue increased $357.0 million from 2016 reflecting growth in both reportable segments.
Operating expenses were $1,222.8 million in 2017, up $196.2 million from 2016, primarily due to an increase in performance-based compensation expenses (including annual bonuses, a profit sharing contribution and performance-based equity compensation), which is correlated with the strong financial performance of the Company in 2017. This increase also reflects higher salaries and employee benefit expenses resulting from the impact of annual compensation increases and increases in headcount coupled with Bureau van Dijk expenses.
SG&A expenses of $991.4 million in 2017 increased $55.0 million from the prior year period primarily due to higher performance-based compensation costs (including annual bonuses, a profit sharing contribution and performance-based equity compensation), which is correlated with the strong financial performance of the Company in 2017 coupled with Bureau van Dijk expenses. These increases were partially offset by the impact of cost management initiatives implemented in 2016 that have benefited 2017 as well as lower legal costs.
D&A increased $31.6 million primarily due to amortization of intangible assets acquired as part of the Bureau van Dijk acquisition.
Acquisition-Related Expenses represent expenses incurred to complete and integrate the acquisition of Bureau van Dijk.
Operating income of $1,809.1 million increased $1,170.4 million from 2016. Operating margin was 43.0% compared to 17.7% in 2016. Operating income and operating margin in 2016 were suppressed by the $863.8 million Settlement Charge. Adjusted Operating Income was $1,989.9 million in 2017, an increase of $348.7 million compared to 2016. Adjusted Operating Margin of 47.3% increased 180 BPS compared to the prior year.
Interest (expense) income, net in 2017 was $(188.4) million, a $50.6 million increase in expense compared to 2016 primarily due to: i) interest on the 2017 Senior Notes and 2017 Floating Rate Senior Notes which were issued in the first quarter of 2017 to fund the payment of the 2016 Settlement Charge and repayment of the Series2007-1 Notes; ii) interest on the 2017 Private Placement Notes Due 2023 and 2028 both issued in June 2017 coupled with interest on the 2017 Term Loan drawn down in August 2017, all of which were issued to fund the acquisition of Bureau van Dijk; and iii) fees on the undrawn 2017 Bridge Credit Facility also related to the acquisition of Bureau van Dijk.
Othernon-operating (expense) income, net was $(4.7) million in 2017, a $61.8 million change compared to 2016 primarily reflecting approximately $17 million in FX losses in 2017 compared to approximately $50 million in FX gains in the prior year. The FX gains in 2016 included an approximate $35 million gain related to the liquidation of anon-U.S. subsidiary.
Additionally, Moody’s recognized the $59.7 million CCXI Gain and the $111.1 million Purchase Price Hedge Gain in 2017.
The ETR of 43.6% in 2017 includes a net charge of approximately $246 million in the fourth quarter related to the impacts of corporate tax reform in the U.S. and Belgium partially offset by thenon-taxable CCXI Gain and an approximate $40 million benefit reflecting the adoption on a prospective basis of a new accounting standard relating to Excess Tax Benefits on stock-based compensation. In accordance with a new accounting standard, these Excess Tax Benefits are now recorded to the provision for income taxes, whereas in the prior year were recorded to capital surplus (refer to Note 1 to the consolidated financial statements for further discussion on this new accounting standard). The 2016 ETR of 50.6% included thenon-deductible nature of the federal portion of the Settlement Charge. The impact of the aforementioned tax reform in the U.S. is expected to reduce the Company’s ETR in years subsequent to 2017. For the full-year ended December 31, 2018, the Company expects the ETR to be between 22% and 23%.
Diluted EPS increased $3.79 compared to 2016. Diluted EPS in 2017 and 2016 included the following items detailed in the table below which impacted year-over-year comparability:
| | | | | | | | |
| | | Year Ended December 31, | |
| | |
| Per share benefit (charge) to Diluted EPS | | 2017 | | | 2016 | |
| CCXI Gain | | $ | 0.31 | | | | — | |
| Purchase Price Hedge Gain | | $ | 0.37 | | | | — | |
| Restructuring | | | — | | | | (0.04 | ) |
| Settlement Charge | | | — | | | $ | (3.59 | ) |
| FX gain on liquidation of a subsidiary | | | | | | $ | 0.18 | |
| Acquisition-Related Expenses | | $ | (0.10 | ) | | | — | |
| Amortization of acquired intangible assets | | $ | (0.23 | ) | | $ | (0.13 | ) |
| Impact of U.S. tax reform / Belgium statutory tax rate change | | $ | (1.27 | ) | | | — | |
Excluding all of the items in the table above, Adjusted Diluted EPS of $6.07, which included $0.20 relating to Excess Tax Benefits on stock-based compensation and $0.03 in financing costs incurred between the execution of the agreement to acquire Bureau van Dijk and the closing of the acquisition, increased $1.13 compared to 2016 reflecting higher Net Income and a 1% reduction in diluted weighted average shares outstanding. Refer to the section entitled“Non-GAAP Financial Measures” of this Management’s Discussion and Analysis for the impact to Net Income relating to the aforementionedper-share amounts.
Segment Results
Moody’s Investors Service
The table below provides a summary of revenue and operating results, followed by further insight and commentary:
| | | | | | | | | | | | |
| | |
| | | Year ended December 31, | | | % Change Favorable
(Unfavorable) | |
| | | 2017 | | | 2016 | | |
| Revenue: | | | | | | | | | | | | |
Corporate finance (CFG) | | $ | 1,392.7 | | | $ | 1,122.3 | | | | 24 | % |
Structured finance (SFG) | | | 495.5 | | | | 436.8 | | | | 13 | % |
Financial institutions (FIG) | | | 435.8 | | | | 368.9 | | | | 18 | % |
Public, project and infrastructure finance (PPIF) | | | 431.3 | | | | 412.2 | | | | 5 | % |
| | | | | | | | | | | | |
Total ratings revenue | | | 2,755.3 | | | | 2,340.2 | | | | 18 | % |
| | | | | | | | | | | | |
MIS Other | | | 18.5 | | | | 30.6 | | | | (40 | %) |
| | | | | | | | | | | | |
Total external revenue | | | 2,773.8 | | | | 2,370.8 | | | | 17 | % |
| | | | | | | | | | | | |
Intersegment royalty | | | 111.7 | | | | 100.2 | | | | 11 | % |
| | | | | | | | | | | | |
Total MIS Revenue | | | 2,885.5 | | | | 2,471.0 | | | | 17 | % |
| | | | | | | | | | | | |
| Expenses: | | | | | | | | | | | | |
Operating and SG&A (external) | | | 1,230.9 | | | | 1,102.1 | | | | (12 | %) |
Operating and SG&A (intersegment) | | | 16.0 | | | | 13.5 | | | | (19 | %) |
| | | | | | | | | | | | |
| Adjusted Operating Income | | | 1,638.6 | | | | 1,355.4 | | | | 21 | % |
| | | | | | | | | | | | |
Depreciation and amortization | | | 74.7 | | | | 73.8 | | | | (1 | %) |
Restructuring | | | — | | | | 10.2 | | | | 100 | % |
Settlement Charge | | | — | | | | 863.8 | | | | 100 | % |
| | | | | | | | | | | | |
| Operating income | | $ | 1,563.9 | | | $ | 407.6 | | | | 284 | % |
| | | | | | | | | | | | |
| Operating margin | | | 54.2 | % | | | 16.5 | % | | | | |
| Adjusted Operating Margin | | | 56.8 | % | | | 54.9 | % | | | | |
The following is a discussion of external MIS revenue and operating expenses:
Global MIS revenue of $2,773.8 million in 2017 was up 17% compared to 2016, most notably from strong leveraged finance rated issuance volumes within CFG coupled with strong growth in banking-related revenue in FIG and increases across most asset classes in SFG. Also contributing to the growth was the favorable impact of changes in the mix of fee type, new fee initiatives and pricing increases.
Transaction revenue for MIS was 65% in 2017 compared to 61% in 2016.
In the U.S., revenue was $1,702.8 million in 2017, an increase of $200.9 million or 13%, compared to 2016 primarily reflecting strong growth in CFG, SFG and FIG revenue being partially offset by declines in PPIF and MIS Other revenue.
Non-U.S. revenue was $1,071.0 million in 2017, an increase of $202.1 million or 23%, compared to 2016 reflecting growth across all LOBs excluding MIS Other.
Global CFG revenue of $1,392.7 million in 2017 was up 24% compared to 2016 primarily due to strength in leveraged finance issuance in the U.S., EMEA and Asia-Pacific as issuers took advantage of favorable market conditions to refinance obligations and fund M&A activity. The growth in leveraged finance revenue also reflects benefits from a favorable issuance mix in 2017 compared to the prior year where issuance volumes included a greater number of lower-yielding jumbo deals. The increase over the prior year also reflects higher investment-grade corporate debt revenue in the U.S. reflecting continued favorable market conditions and benefits from changes in the mix of fee type, new fee initiatives and pricing increases as well as growth in monitoring fees across all regions. Transaction revenue represented 73% of total CFG revenue in 2017, compared to 68% in the prior year period. In the U.S., revenue was $909.7 million, or 19% higher compared to the prior year. Internationally, revenue of $483.0 million increased 34% compared to the prior year.
Global SFG revenue of $495.5 million in 2017 increased $58.7 million, or 13%, compared to 2016. In the U.S., revenue of $340.1 million increased $46.8 million over 2016 primarily due to strong growth in CLO issuance reflecting an increase in bank loan supply and favorable market conditions which enabled both new securitizations and a surge in refinancing activity.Non-U.S. revenue in 2017 of $155.4 million increased $11.9 million compared to the prior year primarily reflecting growth across most asset classes in the EMEA region. Transaction revenue was 65% of total SFG revenue in 2017 compared to 62% in the prior year.
Global FIG revenue of $435.8 million in 2017 increased $66.9 million, or 18%, compared to 2016. In the U.S., revenue of $186.1 million increased $26.0 million compared to the prior year primarily reflecting higher issuance in the banking sector and benefits from changes in the mix of fee type, new fee initiatives and price increases. Internationally, revenue was $249.7 million in 2017, up $40.9 million compared to 2016 primarily due to higher banking revenue in EMEA from opportunistic issuance amidst current favorable market conditions as well as benefits from changes in the mix of fee type, new fee initiatives and pricing increases. Thenon-U.S. growth also reflects strength in banking revenue in the Asia-Pacific region reflecting higher cross-border issuance from Chinese banks and thenon-bank financial sector. Transaction revenue was 45% of total FIG revenue in 2017 compared to 37% in 2016.
Global PPIF revenue was $431.3 million in 2017 and increased $19.1 million, or 5%, compared to 2016. In the U.S., revenue in 2017 was $266.4 million and decreased $9.8 million compared to 2016 primarily due to strong PFG refunding volumes in 2016. These decreases were partially offset by growth in infrastructure finance revenue coupled with benefits from changes in the mix of fee type, new fee initiatives and pricing increases. Outside the U.S., PPIF revenue was $164.9 million and increased $28.9 million compared to 2016 reflecting strong growth in infrastructure finance revenue in the Asia-Pacific region and growth in public finance revenue in EMEA. Transaction revenue was 65% of total PPIF revenue in 2017 compared to 63% in the prior year.
Operating and SG&A expenses in 2017 increased $128.8 million compared to 2016 primarily due to growth in performance-based compensation resulting from strong financial performance in 2017 coupled with increased headcount and higher salaries and employee benefits costs reflecting annual compensation increases. These increases were partially offset by lower legal fees and continued cost control initiatives.
Adjusted Operating Income and operating income in 2017, which includes intersegment royalty revenue and intersegment expenses, were $1,638.6 million and $1,563.9 million, respectively, and increased $283.2 million and $1,156.3 million, respectively, compared to 2016. Adjusted Operating Margin was 56.8% or 190 BPS higher than the prior year. Operating margin was 54.2% in 2017 compared to 16.5% in the prior year. Operating income and operating margin in 2016 were suppressed due to the Settlement Charge.
Moody’s Analytics
The table below provides a summary of revenue and operating results, followed by further insight and commentary:
| | | | | | | | | | | | |
| | | Year ended December 31, | | | % Change Favorable
(Unfavorable) | |
| | | 2017 | | | 2016 | | |
| Revenue: | | | | | | | | | | | | |
Research, data and analytics (RD&A) | | $ | 832.7 | | | $ | 667.6 | | | | 25 | % |
Enterprise risk solutions (ERS) | | | 448.6 | | | | 418.8 | | | | 7 | % |
Professional services (PS) | | | 149.0 | | | | 147.0 | | | | 1 | % |
| | | | | | | | | | | | |
Total external revenue | | | 1,430.3 | | | | 1,233.4 | | | | 16 | % |
| | | | | | | | | | | | |
Intersegment revenue | | | 16.0 | | | | 13.5 | | | | 19 | % |
| | | | | | | | | | | | |
Total MA Revenue | | | 1,446.3 | | | | 1,246.9 | | | | 16 | % |
| | | | | | | | | | | | |
| Expenses: | | | | | | | | | | | | |
Operating and SG&A (external) | | | 983.3 | | | | 860.9 | | | | (14 | %) |
Operating and SG&A (intersegment) | | | 111.7 | | | | 100.2 | | | | (11 | %) |
| | | | | | | | | | | | |
| Adjusted Operating Income | | | 351.3 | | | | 285.8 | | | | 23 | % |
| | | | | | | | | | | | |
Depreciation and amortization | | | 83.6 | | | | 52.9 | | | | (58 | %) |
Restructuring | | | — | | | | 1.8 | | | | 100 | % |
Acquisition-Related Expenses | | | 22.5 | | | | — | | | | NM | |
| | | | | | | | | | | | |
| Operating income | | $ | 245.2 | | | $ | 231.1 | | | | 6 | % |
| | | | | | | | | | | | |
| Operating margin | | | 17.0 | % | | | 18.5 | % | | | | |
| Adjusted Operating Margin | | | 24.3 | % | | | 22.9 | % | | | | |
The following is a discussion of external MA revenue and operating expenses:
Global MA revenue increased $196.9 million, or 16%, compared to 2016 primarily due to growth in RD&A (which included approximately $92 million in revenue, or 7 percentage points of the growth, from the Bureau van Dijk acquisition) coupled with growth in ERS, which included revenue from the first quarter 2016 acquisition of GGY. Additionally, the growth over the prior year reflects benefits from higher fees within MA’s recurring revenue base due to enhanced content and continued alignment of usage and licensing parameters. Recurring revenue comprised 78% and 75% of total MA revenue in 2017 and 2016, respectively.
In the U.S., revenue of $645.6 million in 2017 increased $42.0 million, and reflected growth across all LOBs.
Non-U.S. revenue of $784.7 million in 2017 was $154.9 million higher than in 2016 reflecting growth in RD&A, which included approximately $82 million innon-U.S. Bureau van Dijk revenue, and higher ERS revenue.
Global RD&A revenue of $832.7 million, which comprised 58% and 54% of total external MA revenue in 2017 and 2016, respectively, increased $165.1 million, or 25%, over the prior year period. In the U.S., revenue of $424.4 million increased $35.1 million compared to 2016.Non-U.S. revenue of $408.3 million increased $130.0 million compared to the prior year. RD&A revenue in 2017 included approximately $92 million in revenue, or 14 percentage points of the growth, from the Bureau van Dijk acquisition (net of an approximate $36 million reduction relating to a deferred revenue adjustment required as part of acquisition accounting as further described in Note 7 to the financial statements). RD&A revenue growth also reflects strong results in the credit research and rating data feeds product lines, where enhanced content and continued alignment of usage and licensing parameters have generated higher fees.
Global ERS revenue of $448.6 million in 2017 increased $29.8 million, or 7%, over 2016. The growth is primarily due to higher revenue from risk and finance analytics products coupled with incremental revenue from GGY, which was acquired in March 2016. Additionally, the revenue growth reflects benefits from pricing increases within ERS’s recurring revenue base. Revenue in ERS is subject to quarterly volatility resulting from the variable nature of project timing and the concentration of software implementation and license revenue in a relatively small number of engagements. In the U.S., revenue of $166.6 million increased $3.7 million compared to the prior year.Non-U.S. revenue of $282.0 million increased $26.1 million compared to the prior year.
Global PS revenue of $149.0 million in 2017 increased 1% compared to 2016 reflecting higher revenue from analytical and research services in the U.S. mostly offset by lower revenue from these services internationally. In the U.S., revenue in 2017 was $54.6 million, up 6% compared to 2016. International revenue was $94.4 million, down 1% compared to 2016.
Operating and SG&A expenses in 2017 increased $122.4 million compared to 2016. The expense growth includes an approximate $74 million increase in compensation costs reflecting $32 million in Bureau van Dijk compensation costs coupled with annual salary
increases, higher performance-based compensation and higher severance costs partially offset by the impact of cost control initiatives.Non-compensation costs increased approximately $48 million primarily due to Bureau van Dijk expenses.
There were $22.5 million in Acquisition-Related Expenses incurred to complete and integrate the acquisition of Bureau van Dijk.
Depreciation and amortization increased $30.7 million primarily due to the amortization of Bureau van Dijk’s intangible assets.
Adjusted Operating Income was $351.3 million in 2017 and increased $65.5 million compared to the same period in 2016. Operating income of $245.2 million in 2017 increased $14.1 million compared to the same period in 2016. Adjusted Operating Margin in 2017 was 24.3%, up 140BPS from 2016. Operating margin was 17.0% in 2017, down 150BPS from the prior year reflecting the aforementioned $22.5 million in Bureau van Dijk Acquisition-Related Expenses coupled with approximately $31 million of higher D&A primarily relating to Bureau van Dijk’s intangible assets. Adjusted Operating Income and operating income both include intersegment revenue and expense.
RESULTS OF OPERATIONS
Year ended December 31, 2016 compared with year ended December 31, 2015
Executive Summary
» | | Moody’s revenue in 2016 totaled $3,604.2 million, an increase of $119.7 million, or 3%, compared to 2015 reflecting good growth in MA revenue coupled with modest growth in MIS revenue. |
| » | | MIS revenue was 2% higher compared to the prior year reflecting robust rated issuance volumes for high-yield corporate debt and bank loans as well as for public finance related activity in the second half of 2016. The growth also reflected benefits from changes in the mix of fee type, new fee initiatives and pricing increases. These increases were mostly offset by challenges in the first half of 2016 in the high-yield and investment-grade corporate debt sectors due to elevated credit spreads and market volatility. Additionally, there was lower securitization activity in the U.S. in the first half of 2016, most notably in the U.S. CLO and CMBS asset classes, which reflected the aforementioned elevated credit spreads and market volatility as well as uncertainty relating to the implementation of risk retention regulatory requirements for these asset classes. |
| » | | MA revenue grew 7% compared to the prior year reflecting growth in ERS and RD&A, most notably in the U.S. Revenue grew in most product areas of ERS and included revenue from the acquisition of GGY. In RD&A, revenue growth was primarily driven by credit research subscriptions and licensing of ratings data. Excluding unfavorable changes in FX translation rates, MA revenue grew 10%. |
» | | Total operating expenses increased $954.4 million or 47%, reflecting: |
| » | | an $863.8 million Settlement Charge relating to the MIS segment pursuant to an agreement with the DOJ and the attorneys general of 21 U.S. states and the District of Columbia; |
| » | | higher compensation costs of $88.1 million associated with headcount growth in MA (including costs from the acquisition of GGY) and annual compensation increases company-wide partially offset by cost reduction initiatives in response to the challenging business conditions in MIS during the first half of 2016; and |
| » | | a restructuring charge of $12.0 million associated with cost management initiatives in the MIS segment as well as in certain corporate overhead functions. |
» | | Operating income of $638.7 million in 2016, which included the aforementioned $863.8 million Settlement Charge, was down $834.7 million compared to 2015 and resulted in an operating margin of 17.7%, compared to 42.3% in the prior year. Adjusted Operating Income of $1,641.2 million in 2016 was up modestly compared to 2015, while Adjusted Operating Margin of 45.5% remained flat compared to 2015. |
» | | The change innon-operating income (expense) net, compared to the prior year is primarily due to higher FX gains which included an approximate $35 million gain related to the liquidation of anon-U.S. subsidiary and an approximate $15 million gain relating to the appreciation of the euro relative to the British pound during 2016. Partially offsetting these increases was higher interest expense reflecting the 2015 Senior Notes issued in March 2015 and the $300 million of additional borrowings under the 2014 Senior Notes(30-Year) in November 2015. |
» | | The ETR was 50.6% in 2016 compared to 31.2% in the prior year with the increase primarily reflecting thenon-deductible nature of the federal portion of the aforementioned Settlement Charge. |
» | | Diluted EPS of $1.36 in 2016, which included: i) a $3.59 Settlement Charge; ii) a $0.04 restructuring charge; iii) an $0.18 FX gain relating to the substantial liquidation of a subsidiary; and iv) $0.13 in Acquisition-Related Intangible Amortization, decreased $3.27 compared to 2015. Excluding all of the aforementioned items in 2016 and a $0.03 benefit from a Legacy Tax Matter and $0.11 in Acquisition-Related Intangible Amortization in the prior year, Adjusted Diluted EPS of $4.94 in 2016 increased $0.23. |
Moody’s Corporation
| | | | | | | | | | | | |
| | | Year ended December 31, | | | % Change Favorable
(Unfavorable) | |
| | | 2016 | | | 2015 | | |
| Revenue: | | | | | | | | | | | | |
United States | | $ | 2,105.5 | | | $ | 2,009.0 | | | | 5 | % |
| | | | | | | | | | | | |
International: | | | | | | | | | | | | |
EMEA | | | 904.4 | | | | 882.3 | | | | 3 | % |
Asia-Pacific | | | 373.2 | | | | 364.2 | | | | 2 | % |
Americas | | | 221.1 | | | | 229.0 | | | | (3 | %) |
| | | | | | | | | | | | |
Total International | | | 1,498.7 | | | | 1,475.5 | | | | 2 | % |
| | | | | | | | | | | | |
Total | | | 3,604.2 | | | | 3,484.5 | | | | 3 | % |
| | | | | | | | | | | | |
| Expenses: | | | | | | | | | | | | |
Operating | | | 1,026.6 | | | | 976.3 | | | | (5 | %) |
SG&A | | | 936.4 | | | | 921.3 | | | | (2 | %) |
Restructuring | | | 12.0 | | | | — | | | | NM | |
Depreciation and amortization | | | 126.7 | | | | 113.5 | | | | (12 | %) |
Settlement Charge | | | 863.8 | | | | — | | | | NM | |
| | | | | | | | | | | | |
Total | | | 2,965.5 | | | | 2,011.1 | | | | (47 | %) |
| | | | | | | | | | | | |
| Operating income | | $ | 638.7 | | | $ | 1,473.4 | | | | (57 | %) |
| | | | | | | | | | | | |
| Adjusted Operating Income (1) | | $ | 1,641.2 | | | $ | 1,586.9 | | | | 3 | % |
| | | | | | | | | | | | |
| Interest expense, net | | $ | (137.8 | ) | | $ | (115.1 | ) | | | (20 | %) |
| Othernon-operating income, net | | $ | 57.1 | | | $ | 21.3 | | | | 168 | % |
| | | | | | | | | | | | |
Non-operating expense, net | | $ | (80.7 | ) | | $ | (93.8 | ) | | | 14 | % |
| | | | | | | | | | | | |
| Net income attributable to Moody’s | | $ | 266.6 | | | $ | 941.3 | | | | (72 | %) |
| Diluted EPS attributable to Moody’s common shareholders | | $ | 1.36 | | | $ | 4.63 | | | | (71 | %) |
| Adjusted Diluted EPS attributable to Moody’s common shareholders(1) | | $ | 4.94 | | | $ | 4.71 | | | | 5 | % |
| Operating margin | | | 17.7 | % | | | 42.3 | % | | | | |
| Adjusted Operating Margin (1) | | | 45.5 | % | | | 45.5 | % | | | | |
(1) | Adjusted Operating Income, Adjusted Operating Margin and Adjusted Diluted EPS attributable to Moody’s common shareholders arenon-GAAP financial measures. Refer to the section entitled“Non-GAAP Financial Measures” of this Management Discussion and Analysis for further information regarding these measures. |
The table below shows Moody’s global staffing by geographic area:
| | | | | | | | | | | | |
| | | December 31, | | | % Change | |
| | | 2016 | | | 2015 | | |
| United States | | | 3,386 | | | | 3,364 | | | | 1 | % |
| International | | | 7,231 | | | | 7,006 | | | | 3 | % |
| | | | | | | | | | | | |
| Total | | | 10,617 | | | | 10,370 | | | | 2 | % |
| | | | | | | | | | | | |
Global revenue of $3,604.2 million in 2016 increased $119.7 million, or 3%, compared to 2015 and reflected good growth in MA revenue, which included revenue from the first quarter 2016 acquisition of GGY, coupled with modest growth in MIS revenue.
The $36.6 million increase in MIS revenue reflected robust rated issuance volumes for high-yield corporate debt and bank loans as well as for public finance related activity in the second half of 2016 reflecting both opportunistic refinancing and new issuance activity. The growth also reflected benefits from changes in the mix of fee type, new fee initiatives and pricing increases. These increases were mostly offset by challenges in the first half of 2016 in the high-yield and investment-grade corporate debt sectors due to elevated credit spreads and market volatility. Additionally, there was lower securitization activity in the U.S. in the first half of 2016, most nota-
bly in the U.S. CLO and CMBS asset classes, which reflected the aforementioned elevated credit spreads and market volatility as well as uncertainty earlier in the year relating to the implementation of certain risk retention regulatory requirements by the end of 2016 for these asset classes.
The $83.1 million increase in MA revenue reflects growth in ERS and RD&A, most notably in the U.S. Revenue grew in most product areas of ERS and included revenue from the 2016 acquisition of GGY. In RD&A, revenue growth was primarily driven by credit research, subscriptions and licensing of ratings data partially offset by the impact of unfavorable changes in FX rates. Excluding unfavorable changes in FX translation rates, MA revenue grew 10%.
Transaction revenue accounted for 49% of global MCO revenue in 2016 compared 50% of global MCO revenue in 2015.
U.S. revenue of $2,105.5 million in 2016 increased $96.5 million over the prior year, reflecting strong growth in MA coupled with modest growth in MIS.
Non-U.S. revenue increased $23.2 million from 2015 reflecting modest growth in both reportable segments.
Operating expenses were $1,026.6 million in 2016 up $50.3 million from 2015 and included an increase in compensation costs of approximately $71 million. This increase reflects higher salaries and employee benefit expenses resulting from the impact of annual compensation increases and headcount growth in MA which includes headcount from the acquisition of GGY. The increase in compensation expenses also reflects higher incentive compensation reflecting greater achievement relative to targeted results compared to the prior year. These increases were partially offset by an approximate $21 million decrease innon-compensation expenses reflecting cost reduction initiatives in response to challenging business conditions in MIS earlier in the year.
SG&A expenses of $936.4 million in 2016 increased $15.1 million from the prior year period reflecting increased compensation costs primarily due to annual compensation increases company-wide and headcount growth in MA which included headcount from the GGY acquisition. The increase in compensation expenses also reflects higher incentive compensation reflecting greater achievement relative to targeted results compared to the prior year. Additionally, there was an increase innon-compensation expenses reflecting higher rent and occupancy costs being mostly offset by the impact of cost reduction initiatives in response to challenging business conditions in MIS earlier in the year.
The restructuring charge of $12.0 million relates to cost management initiatives in 2016 in the MIS segment as well as in certain corporate overhead functions.
D&A increased $13.2 million reflecting amortization of intangible assets from acquisitions as well as higher depreciation reflecting an increase in capital expenditures to support IT infrastructure and business growth.
The $863.8 million Settlement Charge relates to an agreement with the U.S. DOJ and the attorneys general of 21 U.S. states and the District of Columbia to resolve pending and potential civil claims related to the MIS segment.
Operating income of $638.7 million in 2016, which included the aforementioned $863.8 million Settlement Charge, was down $834.7 million compared to 2015 and resulted in an operating margin of 17.7%, compared to 42.3% in the prior year. Adjusted Operating Income of $1,641.2 million in 2016 was up modestly compared to 2015, while Adjusted Operating Margin of 45.5% remained flat compared to 2015.
Interest expense, net in 2016 was ($137.8) million, a $22.7 million increase in expense compared to 2015 reflecting interest on the 2015 Senior Notes which were issued in March 2015 as well as interest on the $300 million of additional borrowings under the 2014 Senior Notes(30-Year) in November 2015.
Othernon-operating income, net was $57.1 million in 2016, a $35.8 million increase in income compared to 2015. This increase reflected FX gains of approximately $35 million related to the substantial liquidation of a subsidiary and approximately $15 million of gains relating to the appreciation of the euro relative to the British pound during 2016. FX gains in 2015 were immaterial. This increase in income was partially offset by a $6.4 million benefit from a Legacy Tax Matter in 2015 compared to a $1.6 million benefit in 2016.
The ETR was 50.6% in 2016 compared to 31.2% in the prior year with the increase primarily reflecting thenon-deductible nature of the federal portion of the aforementioned Settlement Charge.
Net Income in 2016, which included an approximate $701 million net Settlement Charge more fully described above, was $266.6 million, or $674.7 million lower than prior year. Diluted EPS of $1.36 in 2016, which included: i) a $3.59 Settlement Charge; ii) a $0.04 restructuring charge and iii) an $0.18 FX gain relating to the substantial liquidation of a subsidiary; and iv) $0.13 in Acquisition-Related Intangible Amortization, decreased $3.27 compared to 2015. Excluding all of the aforementioned items in 2016 and a $0.03 benefit from a Legacy Tax Matter and $0.11 in Acquisition-Related Intangible Amortization in the prior year, Adjusted Diluted EPS of $4.94 in 2016 increased $0.23 primarily reflecting lower diluted weighted average shares outstanding. The reduction in diluted weighted average shares outstanding reflects share repurchases under the Company’s Board authorized share repurchase program partially offset by shares issued under the employee stock-based compensation programs.
Segment Results
Moody’s Investors Service
The table below provides a summary of revenue and operating results, followed by further insight and commentary:
| | | | | | | | | | | | |
| | | Year ended December 31, | | | % Change Favorable
(Unfavorable) | |
| | | 2016 | | | 2015 | | |
| Revenue: | | | | | | | | | | | | |
Corporate finance (CFG) | | $ | 1,122.3 | | | $ | 1,112.7 | | | | 1 | % |
Structured finance (SFG) | | | 436.8 | | | | 449.1 | | | | (3 | %) |
Financial institutions (FIG) | | | 368.9 | | | | 365.6 | | | | 1 | % |
Public, project and infrastructure finance (PPIF) | | | 412.2 | | | | 376.4 | | | | 10 | % |
| | | | | | | | | | | | |
Total ratings revenue | | | 2,340.2 | | | | 2,303.8 | | | | 2 | % |
| | | | | | | | | | | | |
MIS Other | | | 30.6 | | | | 30.4 | | | | 1 | % |
| | | | | | | | | | | | |
Total external revenue | | | 2,370.8 | | | | 2,334.2 | | | | 2 | % |
| | | | | | | | | | | | |
Intersegment royalty | | | 100.2 | | | | 93.5 | | | | 7 | % |
| | | | | | | | | | | | |
Total MIS Revenue | | | 2,471.0 | | | | 2,427.7 | | | | 2 | % |
| | | | | | | | | | | | |
| Expenses: | | | | | | | | | | | | |
Operating and SG&A (external) | | | 1,102.1 | | | | 1,107.2 | | | | — | |
Operating and SG&A (intersegment) | | | 13.5 | | | | 13.1 | | | | (3 | %) |
| | | | | | | | | | | | |
| Adjusted Operating Income | | | 1,355.4 | | | | 1,307.4 | | | | 4 | % |
| | | | | | | | | | | | |
Depreciation and amortization | | | 73.8 | | | | 66.0 | | | | (12 | %) |
Restructuring | | | 10.2 | | | | — | | | | NM | |
Settlement Charge | | | 863.8 | | | | — | | | | NM | |
| | | | | | | | | | | | |
| Operating income | | $ | 407.6 | | | $ | 1,241.4 | | | | (67 | %) |
| | | | | | | | | | | | |
| Operating margin | | | 16.5 | % | | | 51.1 | % | | | | |
| Adjusted Operating Margin | | | 54.9 | % | | | 53.9 | % | | | | |
The following is a discussion of external MIS revenue and operating expenses:
Global MIS revenue of $2,370.8 million in 2016 was up 2% compared to 2015 reflecting robust rated issuance volumes for high-yield corporate debt, bank loans and public finance in the second half of 2016 as capital market volatility and elevated credit spreads that hindered issuance in the first half of 2016 subsided. Additionally, the growth reflects the favorable impact of changes in the mix of fee type, new fee initiatives and pricing increases. These increases were mostly offset by challenges in the first half of 2016 in both the speculative-grade and investment-grade corporate debt sectors due to elevated credit spreads and market volatility at the time coupled with an unfavorable shift in issuance mix for investment-grade corporate debt. Additionally, there was lower securitization activity in the U.S. in the first half of 2016, primarily in the U.S. CLO and CMBS asset classes, which reflected the aforementioned elevated credit spreads and market volatility as well as uncertainty earlier in the year relating to the December 2016 implementation deadline for certain risk retention regulatory requirements for these asset classes.
Transaction revenue for MIS was 61% in both 2016 and 2015.
In the U.S., revenue was $1,501.9 million in 2016, an increase of $27.6 million compared to 2015 and reflected benefits from changes in the mix of fee type, new fee initiatives and pricing increases coupled with second half of 2016 growth in rated issuance volumes for high-yield corporate debt and bank loans as well as strong public finance issuance. These increases were partially offset by lower rated issuance volumes for high-yield corporate debt in the first half of 2016 and a decline in investment-grade corporate debt rated issuance volumes which was most notable in the fourth quarter of 2016. Additionally, there were declines in securitization activity in the CLO and CMBS asset classes within SFG in the first half of 2016.
Non-U.S. revenue was $868.9 million in 2016, an increase of $9.0 million compared to 2015 primarily reflecting second half of 2016 growth in high-yield corporate debt and bank loans as well as investment-grade corporate debt. This growth in the second half reflected improved market sentiment following volatility in the first half of 2016 as well as the ECB sponsored CSPP providing a ballast to corporate debt issuance in the EMEA region. The growth over the prior year also reflects changes in the mix of fee type, new fee initiatives and pricing increases. These increases were partially offset by lower revenue in the first half of 2016 primarily reflecting declines in investment-grade and high-yield corporate debt across all regions.
Global CFG revenue of $1,122.3 million in 2016 was up 1% compared to 2015. The increase reflects benefits from changes in the mix of fee type, new fee initiatives and pricing increases coupled with robust rated issuance volumes for high-yield corporate debt and bank loans in the U.S. and EMEA in the second half of 2016 as capital market volatility and elevated credit spreads that hindered issuance in the first half of 2016 subsided. The increase also reflects higher investment-grade rated issuance volumes in EMEA in the second half of 2016 reflecting additional liquidity in the region resulting from the ECB sponsored CSPP. These increases were partially offset by lower rated issuance volumes in the first half of 2016 for investment-grade and speculative-grade corporate debt across all regions due to elevated credit spreads and capital market volatility at the time. Also, there were lower U.S. investment-grade rated issuance volumes in the fourth quarter of 2016 reflecting an increase in benchmark interest rates immediately following the U.S. presidential election in November. Transaction revenue represented 68% of total CFG revenue in 2016, compared to 69% in the prior year period. In the U.S., revenue in 2016 was $762.9 million, or $10.0 million higher than the prior year. Internationally, revenue of $359.4 million in the 2016 was flat compared to the prior year.
Global SFG revenue of $436.8 million in 2016 decreased $12.3 million, or 3%, compared to 2015. In the U.S., revenue of $293.3 million decreased $18.2 million compared to 2015. This decrease primarily reflected lower CLO formation in the first half of 2016 due to elevated credit spreads and declining availability of collateral for these instruments earlier in the year. Additionally, the decrease reflected lower securitization activity in the CMBS asset class reflecting higher average credit spreads over the course of 2016, particularly in the first quarter, as well as uncertainties relating to the implementation of certain risk retention regulatory requirements for this asset class. These declines were partially offset by benefits from changes in the mix of fee type, new fee initiatives and pricing increases.Non-U.S. revenue in 2016 of $143.5 million increased $5.9 million compared to the prior year primarily reflecting growth in RMBS and ABS in EMEA. Transaction revenue was 62% of total SFG revenue in 2016 compared to 64% in the prior year.
Global FIG revenue of $368.9 million in 2016 increased $3.3 million, or 1%, compared to 2015. In the U.S., revenue of $160.1 million increased $3.7 million compared to the prior year primarily reflecting benefits from changes in the mix of fee type, new fee initiatives and pricing increases as well as higher M&A related issuance volumes in the insurance sector. These increases were partially offset by reduced banking-related issuance volumes due to market volatility in the first half of 2016. Internationally, revenue was $208.8 million in 2016, or flat compared to 2015 with benefits from changes in the mix of fee type, new fee initiatives and pricing increases and growth in the Asia-Pacific region reflecting higher cross-border issuance from Chinese banks and asset managers being offset by declines in banking-related issuance in EMEA. Transaction revenue was 37% of total FIG revenue in both 2016 and 2015.
Global PPIF revenue was $412.2 million in 2016 and increased $35.8 million, or 10%, compared to 2015. In the U.S., revenue in 2016 was $276.2 million and increased $31.5 million compared to 2015 primarily due to benefits from changes in the mix of fee type, new fee initiatives and pricing increases as well as strong growth in public finance issuance in the second half of 2016. This growth in issuance reflects opportunistic refunding activity amidst favorable market conditions as well as higher new issuance volumes to fund municipal infrastructure investment needs. Additionally, the growth in the U.S. reflects higher infrastructure finance revenue. Outside the U.S., PPIF revenue was $136.0 million and increased $4.3 million compared to 2015 reflecting benefits from changes in the mix of fee type, new fee initiatives and pricing increases as well as higher infrastructure finance revenue in the Americas region. These increases were partially offset by lower project finance revenue across allnon-U.S. regions. Transaction revenue was 63% of total PPIF revenue in 2016 compared to 60% in the prior year.
Global MIS Other revenue of $30.6 million in 2016 was flat compared to 2015.
Operating and SG&A expenses in 2016 decreased $5.1 million compared to 2015 primarily reflecting lowernon-compensation costs of approximately $25.0 million reflecting overall cost control initiatives. This decrease was partially offset by higher compensation expenses of approximately $20 million compared to the prior year reflecting annual salary increases coupled with higher incentive compensation costs resulting from higher achievement against full-year targeted results compared to the prior year.
The increase in D&A compared to the prior year reflects capital expenditures related to investments in the Company’s IT and operational infrastructure.
The restructuring charge in 2016 relates to cost management initiatives in the MIS segment as well as in certain corporate overhead functions.
The Settlement Charge is pursuant to an agreement with the DOJ and the attorneys general of 21 U.S. states and the District of Columbia.
Adjusted Operating Income was $1,355.4 million and increased $48.0 million compared to the prior year. Operating income in 2016, which includes the aforementioned $863.8 million Settlement Charge, was $407.6 million and decreased $833.8 million compared to the prior year. Adjusted Operating Margin was 54.9% or 100 BPS higher than the prior year. Operating margin was 16.5% in 2016 compared to 51.1% in the prior year, with the decline primarily due to the aforementioned Settlement Charge. Adjusted Operating Income and operating income both include intersegment revenue and expense.
Moody’s Analytics
The table below provides a summary of revenue and operating results, followed by further insight and commentary:
| | | | | | | | | | | | |
| | | Year ended December 31, | | | % Change Favorable
(Unfavorable) | |
| | | 2016 | | | 2015 | | |
| Revenue: | | | | | | | | | | | | |
Research, data and analytics (RD&A) | | $ | 667.6 | | | $ | 626.4 | | | | 7 | % |
Enterprise risk solutions (ERS) | | | 418.8 | | | | 374.0 | | | | 12 | % |
Professional services (PS) | | | 147.0 | | | | 149.9 | | | | (2 | %) |
| | | | | | | | | | | | |
Total external revenue | | | 1,233.4 | | | | 1,150.3 | | | | 7 | % |
| | | | | | | | | | | | |
Intersegment revenue | | | 13.5 | | | | 13.1 | | | | 3 | % |
| | | | | | | | | | | | |
Total MA Revenue | | | 1,246.9 | | | | 1,163.4 | | | | 7 | % |
| | | | | | | | | | | | |
| Expenses: | | | | | | | | | | | | |
Operating and SG&A (external) | | | 860.9 | | | | 790.4 | | | | (9 | %) |
Operating and SG&A (intersegment) | | | 100.2 | | | | 93.5 | | | | (7 | %) |
| | | | | | | | | | | | |
| Adjusted Operating Income | | | 285.8 | | | | 279.5 | | | | 2 | % |
| | | | | | | | | | | | |
Depreciation and amortization | | | 52.9 | | | | 47.5 | | | | (11 | %) |
Restructuring | | | 1.8 | | | | — | | | | NM | |
| | | | | | | | | | | | |
| Operating income | | $ | 231.1 | | | $ | 232.0 | | | | — | |
| | | | | | | | | | | | |
| Operating margin | | | 18.5 | % | | | 19.9 | % | | | | |
| Adjusted Operating Margin | | | 22.9 | % | | | 24.0 | % | | | | |
The following is a discussion of external MA revenue and operating expenses:
Global MA revenue increased $83.1 million, or 7%, compared to 2015 and reflected growth in RD&A as well as ERS, which included revenue from the acquisition of GGY. Additionally, the growth over the prior year reflects benefits from pricing increases within MA’s recurring revenue base. Excluding unfavorable changes in FX rates, MA revenue grew 10% compared to the prior year. Recurring revenue comprised 75% and 74% of total MA revenue in 2016 and 2015, respectively.
In the U.S., revenue of $603.6 million in 2016 increased $68.9 million, and reflected growth in RD&A and ERS. The growth in RD&A reflected strength in credit research subscriptions and licensing of ratings data as well as higher revenue within SAV and ECCA. The increase in ERS revenue reflected growth across all product verticals and included revenue from the acquisition of GGY in March 2016.
Non-U.S. revenue of $629.8 million in 2016 was $14.2 million higher than in 2015 reflecting growth in RD&A and ERS partially offset by unfavorable changes in FX rates. The growth in RD&A primarily reflects strength in credit research subscriptions and licensing of ratings data in the Asia-Pacific region. The increase in ERS was primarily due to higher revenue from the Assets Liability & Capital and Credit Assessment & Origination product verticals in the EMEA region coupled with revenue from the acquisition of GGY. These increases were partially offset by declines in the Credit Assessment & Origination product vertical in the Americas region.
Global RD&A revenue of $667.6 million, which comprised 54% of total external MA revenue in both 2016 and 2015, increased $41.2 million, or 7%, over the prior year period. Excluding unfavorable changes in FX rates, RD&A revenue increased 9% over the prior year. The growth reflected strength in credit research subscriptions and licensing of ratings data as well as higher revenue within SAV and ECCA. The growth compared to 2015 also reflects the benefits of pricing increases. In the U.S., revenue of $389.3 million increased $37.4 million compared to 2015.Non-U.S. revenue of $278.3 million increased $3.8 million compared to the prior year.
Global ERS revenue of $418.8 million in 2016 increased $44.8 million, or 12%, over 2015. Excluding unfavorable changes in FX rates, ERS revenue grew 15% reflecting increases across most product offerings and included revenue from the acquisition of GGY in March of 2016. Additionally, the revenue growth reflects benefits from pricing increases within ERS’s recurring revenue base. Revenue in ERS is subject to quarterly volatility resulting from the variable nature of project timing and the concentration of software implementation and license revenue in a relatively small number of engagements. In the U.S., revenue of $162.9 million increased $31.7 million compared to the prior year.Non-U.S. revenue of $255.9 million increased $13.1 million compared to the prior year.
Global PS revenue of $147.0 million in 2016 decreased $2.9 million, or 2%, from 2015. Excluding the unfavorable impact from changes in FX translation rates, PS revenue was flat compared to the prior year. In the U.S. and internationally revenue was $51.4 million and $95.6 million, respectively, or flat and down 3%, respectively.
The increase in D&A compared to the prior year reflects capital expenditures related to investments in the Company’s IT and operational infrastructure as well as amortization of acquired intangible assets.
Operating and SG&A expenses in 2016 increased $70.5 million compared to 2015. The expense growth primarily reflects an approximate $68 million increase in compensation costs primarily due to higher headcount to support business growth as well as headcount from the acquisition of GGY coupled with annual merit increases.
Adjusted Operating Income was $285.8 million in 2016 and increased $6.3 million compared to the same period in 2015. Operating income of $231.1 million in 2016 decreased $0.9 million compared to the same period in 2015. Adjusted Operating Margin in 2016 was 22.9%, down 110bps from 2015. Operating margin was 18.5% in 2016, down 140bps from the prior year. Operating margin and Adjusted Operating Margin in 2016 were suppressed due to a larger proportion of overhead costs allocated to MA under the Company’s revenue-split methodology. Adjusted operating income and operating income both include intersegment revenue and expense.
MARKET RISK
Foreign exchange risk:
Moody’s maintains a presence in 40 countries outside the U.S. In 2017, approximately 40% and 39% of both the Company’s revenue and expenses, respectively were denominated in functional currencies other than the U.S. dollar, principally in the British pound and the euro. As such, the Company is exposed to market risk from changes in FX rates. As of December 31, 2017, approximately 81% of Moody’s assets were located outside the U.S. making the Company susceptible to fluctuations in FX rates. The effects of translating assets and liabilities ofnon-U.S. operations withnon-U.S. functional currencies to the U.S. dollar are charged or credited to OCI.
The effects of revaluing assets and liabilities that are denominated in currencies other than a subsidiary’s functional currency are charged to othernon-operating income (expense), net in the Company’s consolidated statements of operations. Accordingly, the Company enters into foreign exchange forwards to partially mitigate the change in fair value on certain assets and liabilities denominated in currencies other than a subsidiary’s functional currency. The following table shows the impact to the fair value of the forward contracts if foreign currencies strengthened against the U.S. dollar:
| | | | |
Foreign Currency Forwards *
| | Impact on fair value of contract if
foreign currency strengthened by 10%
|
Sell
| | Buy | |
U.S. dollar | | British pound | | $47 million unfavorable impact |
U.S. dollar | | Canadian dollar | | $6 million unfavorable impact |
U.S. dollar | | Euro | | $47 million unfavorable impact |
U.S. dollar | | Japanese yen | | $3 million unfavorable impact |
U.S. dollar | | Singapore dollar | | $4 million unfavorable impact |
* | Refer to Note 5 to the consolidated financial statements in Item 8 of this Form10-K for further detail on the forward contracts. |
The change in fair value of the foreign exchange forward contracts would be offset by FX revaluation gains or losses on underlying assets and liabilities denominated in currencies other than a subsidiary’s functional currency.
Also, the Company has designated€500 million of the 2015 Senior Notes as a net investment hedge to mitigate FX exposure relating to euro denominated net investments in subsidiaries. If the euro were to strengthen 10% relative to the U.S. dollar, there would be an approximate $56 million unfavorable adjustment to OCI related to this net investment hedge. This adjustment would be offset by favorable translation adjustments on the Company’s euro net investment in subsidiaries.
Moody’s aggregate cash and cash equivalents and short- term investments of $1.2 billion at December 31, 2017 included $1 billion located outside the U.S. Approximately 62% of the Company’s aggregate cash and cash equivalents and short term investments at December 31, 2017 were held in currencies other than USD. As such, a decrease in the value of foreign currencies against the U.S. dollar, particularly the euro and GBP, could reduce the reported amount of USD cash and cash equivalents and short-term investments.
Credit and Interest rate risk:
The Company’s interest rate risk management objectives are to reduce the funding cost and volatility to the Company and to alter the interest rate exposure to the desired risk profile. Moody’s uses interest rate swaps as deemed necessary to assist in accomplishing these objectives.
The Company is exposed to interest rate risk on its various outstanding fixed rate debt for which the fair value of the outstanding fixed rate debt fluctuates based on changes in interest rates. The Company has entered into interest rate swaps to convert the fixed rate of interest on certain of its borrowings to a floating rate based on the3-month LIBOR. These swaps are adjusted to fair market value
based on prevailing interest rates at the end of each reporting period and fluctuations are recorded as a reduction or addition to the carrying value of the borrowing, while net interest payments are recorded as interest expense/income in the Company’s consolidated statement of operations. A hypothetical change of 100bps in the LIBOR-based swap rate would result in an approximate $26 million change to the fair value of these interest rate swaps.
Additional information on these interest rate swaps is disclosed in Note 5 to the consolidated financial statements located in Item 8 of this Form10-K.
Moody’s cash equivalents consist of investments in high-quality investment-grade securities within and outside the U.S. with maturities of three months or less when purchased. The Company manages its credit risk exposure by allocating its cash equivalents among various money market mutual funds, money market deposit accounts, certificates of deposit and issuers of high-grade commercial paper and by limiting the amount it can invest with any single issuer. Short-term investments primarily consist of certificates of deposit.
LIQUIDITY AND CAPITAL RESOURCES
Cash Flow
The Company is currently financing its operations, capital expenditures, acquisitions and share repurchases from operating and financing cash flows.
The following is a summary of the changes in the Company’s cash flows followed by a brief discussion of these changes:
| | | | | | | | | | | | | | | | | | | | | | | | |
| | | Year Ended December 31, | | | | | | Year Ended December 31, | | | | |
| | | | | | |
| | | 2017 | | | 2016 | | | $ Change
Favorable
(unfavorable) | | | 2016 | | | 2015 | | | $ Change
Favorable
(unfavorable) | |
| Net cash provided by operating activities | | $ | 747.5 | | | $ | 1,259.2 | | | $ | (511.7 | ) | | $ | 1,259.2 | | | $ | 1,198.1 | | | $ | 61.1 | |
| Net cash (used in) provided by investing activities | | $ | (3,420.0 | ) | | $ | 102.0 | | | $ | (3,522.0 | ) | | $ | 102.0 | | | $ | (92.0 | ) | | $ | 194.0 | |
| Net cash provided by (used in) financing activities | | $ | 1,607.2 | | | $ | (1,042.9 | ) | | $ | 2,650.1 | | | $ | (1,042.9 | ) | | $ | (505.5 | ) | | $ | (537.4 | ) |
| Free Cash Flow * | | $ | 656.9 | | | $ | 1,144.0 | | | $ | (487.1 | ) | | $ | 1,144.0 | | | $ | 1,109.1 | | | $ | 34.9 | |
* | Free Cash Flow is anon-GAAP measure and is defined by the Company as net cash provided by operating activities minus cash paid for capital expenditures. Refer to“Non-GAAP Financial Measures” of this MD&A for further information on this financial measure. |
Net cash provided by operating activities
Year ended December 31, 2017 compared to the year ended December 31, 2016:
Net cash flows from operating activities decreased $511.7 million compared to the prior year primarily due to the approximate $701 million net payment for the Settlement Charge in 2017 (net of an approximate $163 million tax benefit relating to the charge). This was partially offset by an increase in cash flows primarily relating to the Company’s strong Adjusted Net Income growth in 2017.
Additionally, the Company made approximately $26 million and $22 million in contributions to its funded U.S. pension plan in 2017 and 2016, respectively.
Year ended December 31, 2016 compared to the year ended December 31, 2015:
Net cash flows from operating activities increased $61.1 million compared to the prior year primarily due to:
» | | an approximate $64 million increase due to the timing of income tax payments; |
» | | an approximate $43 million increase relating to higher deferred revenue reflecting overall business growth; |
» | | an approximate $43 million increase reflecting higher incentive compensation payouts in 2015 compared to 2016 as well as higher incentive compensation accruals reflecting greater achievement against full-year targeted results in 2016 compared to 2015 |
partiallyoffset by:
» | | approximate $79 million decrease in cash flow from changes in accounts receivable balances primarily reflecting greater growth in accounts receivable in 2016 compared to 2015. Approximately 30% and 33% of the Company’s accounts receivable at December 31, 2016 and 2015, respectively, represent unbilled receivables which primarily reflect certain annual fees in MIS which are billed in arrears. |
Additionally, the Company made approximately $22 million to its funded U.S. pension plan in both 2016 and 2015.
Net cash provided by (used in) investing activities
Year ended December 31, 2017 compared to the year ended December 31, 2016:
The $3,522.0 million increase in cash flows used in investing activities compared to 2016 primarily reflects:
» | | a $3.4 billion increase in cash paid for acquisitions compared to the prior year primarily reflecting the acquisition of Bureau van Dijk in the third quarter of 2017; |
» | | lower net maturities of short-term investments of $251.2 million; |
Partially offset by:
» | | cash received of $111.1 million relating to the Purchase Price Hedge. |
Year ended December 31, 2016 compared to the year ended December 31, 2015:
The $194.0 million increase in cash flows provided by investing activities compared to 2015 primarily reflects:
» | | higher net maturities of short-term investments of $354.7 million; |
Partially offset by:
» | | a $73.2 million increase in cash paid for acquisitions and equity investments primarily due to the acquisition of GGY in 2016; |
» | | net cash paid of $23.1 million for the settlement of forward contracts designated as net investment hedges in 2016 compared to cash received of $39.7 million in 2015; and |
» | | higher capital expenditures of approximately $26 million reflecting investment in the Company’s IT and operational infrastructure. |
Net cash provided by financing activities
Year ended December 31, 2017 compared to the year ended December 31, 2016:
The $2,650.1 million increase in cash provided by financing activities was primarily attributed to:
» | | proceeds of $1.5 billion from notes and a term loan issued as well as $0.1 billion in net proceeds from commercial paper to fund the acquisition of Bureau van Dijk. Additionally, reflects $0.8 billion of notes issued in the first quarter of 2017 to fund the payment of the 2016 Settlement Charge and the early repayment of the Series2007-1 Notes; |
» | | treasury shares repurchased of $199.7 million in 2017 compared to $738.8 million in 2016; |
partially offset by:
» | | repayment of the $300 million Series2007-1 Notes. |
Year ended December 31, 2016 compared to the year ended December 31, 2015:
The $537.4 million increase in cash used in financing activities was primarily attributed to:
» | | $852.8 million from the issuance of long-term debt in 2015, no long-term debt was issued in 2016; |
» | | $45.4 million paid to acquire thenon-controlling interest of KIS and additional shares of KIS Pricing; |
partially offset by:
» | | treasury shares repurchased of $738.8 million in 2016 compared to $1,098.1 million repurchased in 2015. |
Cash and short-term investments held innon-U.S. jurisdictions
The Company’s aggregate cash and cash equivalents and short-term investments of $1.2 billion at December 31, 2017 included approximately $1 billion located outside of the U.S. Approximately 27% of the Company’s aggregate cash and cash equivalents and short-term investments is denominated in euros and British pounds. The Company manages both its U.S. and international cash flow to maintain sufficient liquidity in all regions to effectively meet its operating needs.
Other Material Future Cash Requirements
The Company believes that it has the financial resources needed to meet its cash requirements and expects to have positive operating cash flow in 2018. Cash requirements for periods beyond the next twelve months will depend, among other things, on the Company’s profitability and its ability to manage working capital requirements. The Company may also borrow from various sources.
The Company remains committed to using its strong cash flow to create value for shareholders by investing in growing areas of the business, reinvesting in ratings quality initiatives, making selective acquisitions, repurchasing stock and paying a dividend, all in a manner consistent with maintaining sufficient liquidity after giving effect to any additional indebtedness that may be incurred.
In January 2018, the Board of Directors of the Company declared a quarterly dividend of $0.44 per share of Moody’s common stock, payable March 12, 2018 to shareholders of record at the close of business on February 20, 2018. The continued payment of dividends
at this rate, or at all, is subject to the discretion of the Board. In December 2015, the Board authorized $1.0 billion of share repurchase authority, which had a remaining repurchase authority of approximately $0.5 million at December 31, 2017. Full-year 2018 total share repurchases are expected to be approximately $200 million, subject to available cash, market conditions and other ongoing capital allocation decisions.
The Company has future cash requirements, including operating leases and debt service and principal payments, as noted in the tables that follow as well as future payments related to the transition tax under the Tax Act:
Indebtedness
At December 31, 2017, Moody’s had $5.5 billion of outstanding debt and approximately $0.9 billion of additional capacity available under the Company’s CP program which is backstopped by the 2015 Facility as more fully discussed in Note 16 to the consolidated financial statements. At December 31, 2017, the Company was in compliance with all covenants contained within all of the debt agreements. All of the Company’s long-term debt agreements contain cross default provisions which state that default under one of the aforementioned debt instruments could in turn permit lenders under other debt instruments to declare borrowings outstanding under those instruments to be immediately due and payable. At December 31, 2017, there were no such cross defaults.
The repayment schedule for the Company’s borrowings outstanding at December 31, 2017 is as follows:
| | | | | | | | | | | | | | | | | | | | | | | | | | | | | | | | | | | | | | | | | | | | | | | | | | | | |
Year Ended
December 31, | | 2010
Senior
Notes
due
2020 | | | 2012
Senior
Notes
due
2022 | | | 2013
Senior
Notes
due
2024 | | | 2014
Senior
Notes
(5-Year)
due
2019 | | | 2014
Senior
Notes
(30-Year)
due
2044 | | | 2015
Senior
Notes
due
2027 | | | Term
Loan
Facility
due
2020 | | | 2017
Floating
Rate
Senior
Notes
due
2018 | | | 2017
Senior
Notes
due
2021 | | | 2017
Private
Placement
Notes
due
2023 | | | 2017
Private
Placement
Notes
due
2028 | | | Commercial
Paper | | | Total | |
| 2018 | | $ | — | | | $ | — | | | $ | — | | | $ | — | | | $ | — | | | $ | — | | | $ | — | | | $ | 300.0 | | | $ | — | | | $ | — | | | $ | — | | | $ | 130.0 | | | $ | 430.0 | |
| 2019 | | | — | | | | — | | | | — | | | | 450.0 | | | | — | | | | — | | | | — | | | | — | | | | — | | | | — | | | | — | | | | — | | | | 450.0 | |
| 2020 | | | 500.0 | | | | — | | | | — | | | | — | | | | — | | | | — | | | | 500.0 | | | | — | | | | — | | | | — | | | | — | | | | — | | | | 1,000.0 | |
| 2021 | | | — | | | | — | | | | — | | | | — | | | | — | | | | — | | | | — | | | | — | | | | 500.0 | | | | — | | | | — | | | | — | | | | 500.0 | |
| 2022 | | | — | | | | 500.0 | | | | — | | | | — | | | | — | | | | — | | | | — | | | | — | | | | — | | | | — | | | | — | | | | — | | | | 500.0 | |
| Thereafter | | | — | | | | — | | | | 500.0 | | | | — | | | | 600.0 | | | | 600.4 | | | | — | | | | — | | | | — | | | | 500.0 | | | | 500.0 | | | | — | | | | 2,700.4 | |
| | | | | | | | | | | | | | | | | | | | | | | | | | | | | | | | | | | | | | | | | | | | | | | | | | | | |
| Total | | $ | 500.0 | | | $ | 500.0 | | | $ | 500.0 | | | $ | 450.0 | | | $ | 600.0 | | | $ | 600.4 | | | $ | 500.0 | | | $ | 300.0 | | | $ | 500.0 | | | $ | 500.0 | | | $ | 500.0 | | | $ | 130.0 | | | $ | 5,580.4 | |
| | | | | | | | | | | | | | | | | | | | | | | | | | | | | | | | | | | | | | | | | | | | | | | | | | | | |
Management may consider pursuing additional long-term financing when it is appropriate in light of cash requirements for operations, share repurchases and other strategic opportunities, which would result in higher financing costs.
Off-Balance Sheet Arrangements
At December 31, 2017, Moody’s did not have any relationships with unconsolidated entities or financial partnerships, such as entities often referred to as special purpose or variable interest entities where Moody’s is the primary beneficiary, which would have been established for the purpose of facilitatingoff-balance sheet arrangements or other contractually narrow or limited purposes. As such, Moody’s is not exposed to any financing, liquidity, market or credit risk that could arise if it had engaged in such relationships.
Contractual Obligations
The following table presents payments due under the Company’s contractual obligations as of December 31, 2017:
| | | | | | | | | | | | | | | | | | | | |
| | | | | | Payments Due by Period | |
| | | | | |
(in millions) | | Total | | | Less Than 1
Year | | | 1-3 Years | | | 3-5 Years | | | Over 5 Years | |
| Indebtedness (1) | | $ | 7,232.9 | | | $ | 615.0 | | | $ | 2,423.1 | | | $ | 1,205.3 | | | | 2,989.5 | |
| Operating lease obligations | | | 715.1 | | | | 108.3 | | | | 167.8 | | | | 148.4 | | | | 290.6 | |
| Purchase obligations | | | 152.8 | | | | 80.6 | | | | 58.7 | | | | 11.4 | | | | 2.1 | |
| Capital lease obligations | | | 0.2 | | | | 0.2 | | | | — | | | | — | | | | — | |
| Pension obligations (2) | | | 134.0 | | | | 8.0 | | | | 40.0 | | | | 18.0 | | | | 68.0 | |
| | | | | | | | | | | | | | | | | | | | |
| Total (3) | | $ | 8,235.0 | | | $ | 812.1 | | | $ | 2,689.6 | | | $ | 1,383.1 | | | $ | 3,350.2 | |
| | | | | | | | | | | | | | | | | | | | |
(1) | Reflects principal payments, related interest and applicable fees due on all indebtedness outstanding as described in Note 16 to the consolidated financial statements. |
(2) | Reflects projected benefit payments relating to the Company’s U.S. unfunded DBPPs and Retirement and Other Plans described in Note 13 to the consolidated financial statements |
(3) | The table above does not include the Company’s net long-term tax liabilities of $389.1 million relating to UTPs, since the expected cash outflow of such amounts by period cannot be reasonably estimated. Additionally, the table above does not include approximately $247 million relating to the deemed repatriation liability resulting from the Tax Act enacted into law in the U.S. in December 2017. |
Non-GAAP Financial Measures:
In addition to its reported results, Moody’s has included in this MD&A certain adjusted results that the SEC defines as“non-GAAP financial measures.” Management believes that suchnon-GAAP financial measures, when read in conjunction with the Company’s reported results, can provide useful supplemental information for investors analyzingperiod-to-period comparisons of the Company’s performance, facilitate comparisons to competitors’ operating results and can provide greater transparency to investors of supplemental information used by management in its financial and operational decision-making. Thesenon-GAAP measures, as defined by the Company, are not necessarily comparable to similarly defined measures of other companies. Furthermore, thesenon-GAAP measures should not be viewed in isolation or used as a substitute for other GAAP measures in assessing the operating performance or cash flows of the Company. Below are descriptions of the Company’snon-GAAP financial measures accompanied by a reconciliation of thenon-GAAP measure to its most directly comparable GAAP measure:
Adjusted Operating Income and Adjusted Operating Margin:
The Company presents Adjusted Operating Income because management deems this metric to be a useful measure of assessing the operating performance of Moody’s. Adjusted Operating Income excludes depreciation and amortization, Acquisition-Related Expenses, restructuring and the Settlement Charge. Depreciation and amortization are excluded because companies utilize productive assets of different ages and use different methods of acquiring and depreciating productive assets. Acquisition-Related Expenses consist of expenses incurred to complete and integrate the acquisition of Bureau van Dijk and are excluded due to the material nature of these expenses which are not expected to recur at this dollar magnitude subsequent to the completion of the multi-year integration effort. Acquisition related expenses from previous acquisitions were not material. Restructuring charges are excluded as the frequency and magnitude of these charges may vary widely across periods and companies. The Settlement Charge is a materialnon-recurring event that is not expected to recur in the future at this magnitude. Management believes that the exclusion of depreciation and amortization, Acquisition-Related Expenses, restructuring and the Settlement Charge, as detailed in the reconciliation below, allows for an additional perspective on the Company’s operating results from period to period and across companies. The Company defines Adjusted Operating Margin as Adjusted Operating Income divided by revenue.
| | | | | | | | | | | | |
| | | Year Ended December 31, | |
| | | |
| | | 2017 | | | 2016 | | | 2015 | |
| Operating income | | $ | 1,809.1 | | | $ | 638.7 | | | $ | 1,473.4 | |
| Adjustments: | | | | | | | | | | | | |
Restructuring | | | — | | | | 12.0 | | | | — | |
Depreciation and amortization | | | 158.3 | | | | 126.7 | | | | 113.5 | |
Acquisition-Related Expenses | | | 22.5 | | | | — | | | | — | |
Settlement Charge | | | — | | | | 863.8 | | | | — | |
| | | | | | | | | | | | |
| Adjusted Operating Income | | $ | 1,989.9 | | | $ | 1,641.2 | | | $ | 1,586.9 | |
| | | | | | | | | | | | |
| Operating margin | | | 43.0 | % | | | 17.7 | % | | | 42.3 | % |
| Adjusted Operating Margin | | | 47.3 | % | | | 45.5 | % | | | 45.5 | % |
Adjusted Net Income and Adjusted Diluted EPS attributable to Moody’s common shareholders:
Beginning in the third quarter of 2017, the Company modified this adjusted measure to exclude the impact of amortization of acquired intangible assets as companies utilize intangible assets with different ages and have different methods of acquiring and amortizing intangible assets. Furthermore, the timing and magnitude of business combination transactions are not predictable and the purchase price allocated to amortizable intangible assets and the related amortization period are unique to each acquisition and can vary significantly from period to period and across companies. Also, management believes that excluding acquisition-related amortization expense provides additional perspective when comparing operating results from period to period, and with both acquisitive and non-acquisitive peer companies. Furthermore, U.S. tax reform as well as changes in statutory tax rates in Belgium were both enacted in the fourth quarter of 2017, resulting in significant adjustments to the tax provision. The Company modified the adjusted measures to exclude these adjustments to provide additional perspective when comparing net income and diluted EPS from period to period and across companies. In addition to excluding acquisition-related amortization expense and the effects of U.S. tax reform as well as the statutory tax rate change in Belgium, current and prior-year adjusted net income and adjusted diluted earnings per share exclude the CCXI Gain, the Purchase Price Hedge Gain, Acquisition-Related Expenses, restructuring charges and the Settlement Charge. The Company excludes these items to provide additional perspective on the Company’s operating results from period to period and across companies as the frequency and magnitude of similar transactions may vary widely across periods. Additionally, the Acquisition-Related Expenses are excluded due to the material nature of these expenses which are not expected to recur at this dollar magnitude subsequent to the completion of the multi-year integration effort relating to Bureau van Dijk. Acquisition-Related Expenses from previous acquisitions were not material.
Below is a reconciliation of this measure to its most directly comparable U.S. GAAP amount.
| | | | | | | | | | | | | | | | | | | | | | | | |
| | | Year ended December 31, | |
| | | |
| | | 2017 | | | 2016 | | | 2015 | |
| Net income attributable to Moody’s common shareholders | | | | | | $ | 1,000.6 | | | | | | | $ | 266.6 | | | | | | | $ | 941.3 | |
Transition tax related to U.S. tax reform | | | | | | | 247.3 | | | | | | | | | | | | | | | | | |
Net Impact of U.S. tax reform/Belgium statutory tax rate change on deferred taxes | | | | | | | (1.7 | ) | | | | | | | | | | | | | | | | |
CCXI Gain | | | | | | | (59.7 | ) | | | | | | | — | | | | | | | | | |
Pre-Tax Purchase Price Hedge Gain | | $ | (111.1 | ) | | | | | | $ | — | | | | | | | $ | — | | | | | |
Tax on Purchase Price Hedge Gain | | | 38.8 | | | | | | | | — | | | | | | | | — | | | | | |
| | | | | | | | | | | | | | | | | | | | | | | | |
Net Purchase Price Hedge Gain | | | | | | | (72.3 | ) | | | | | | | — | | | | | | | | — | |
Pre-Tax Acquisition-Related Expenses | | $ | 22.5 | | | | | | | $ | — | | | | | | | $ | — | | | | | |
Tax on Acquisition-Related Expenses | | | (3.6 | ) | | | | | | | — | | | | | | | | — | | | | | |
| | | | | | | | | | | | | | | | | | | | | | | | |
Acquisition-Related Expenses (1) | | | | | | | 18.9 | | | | | | | | — | | | | | | | | — | |
Pre-Tax Acquisition-Related Intangible Amortization Expenses | | $ | 61.4 | | | | | | | $ | 34.2 | | | | | | | $ | 31.9 | | | | | |
Tax on Acquisition-Related Intangible Amortization Expenses | | | (16.2 | ) | | | | | | | (9.8 | ) | | | | | | | (9.1 | ) | | | | |
| | | | | | | | | | | | | | | | | | | | | | | | |
Net Acquisition-Related Intangible Amortization Expenses | | | | | | | 45.2 | | | | | | | | 24.4 | | | | | | | | 22.8 | |
Pre-Tax Restructuring | | $ | — | | | | | | | $ | 12.0 | | | | | | | $ | — | | | | | |
Tax on Restructuring | | | — | | | | | | | | (3.9 | ) | | | | | | | — | | | | | |
| | | | | | | | | | | | | | | | | | | | | | | | |
Net Restructuring | | | | | | | — | | | | | | | $ | 8.1 | | | | | | | $ | — | |
Pre-tax Settlement Charge | | | | | | | | | | $ | 863.8 | | | | | | | $ | — | | | | | |
Tax on Settlement Charge | | | | | | | | | | | (163.1 | ) | | | | | | | — | | | | | |
| | | | | | | | | | | | | | | | | | | | | | | | |
Net Settlement Charge | | | | | | | | | | | | | | | 700.7 | | | | | | | | — | |
FX gain on liquidation of a subsidiary | | | | | | | | | | | | | | | (34.8 | ) | | | | | | | — | |
Legacy Tax benefit | | | | | | | | | | | | | | | — | | | | | | | | (6.4 | ) |
| | | | | | | | | | | | | | | | | | | | | | | | |
| Adjusted Net Income | | | | | | $ | 1,178.3 | | | | | | | $ | 965.0 | | | | | | | $ | 957.7 | |
| | | | | | | | | | | | | | | | | | | | | | | | |
(1) | Certain of these Acquisition-Related Expenses are not deductible for tax |
| | | | | | | | | | | | | | | | | | | | | | | | |
| | | Year ended December 31, | |
| | | |
| | | 2017 | | | 2016 | | | 2015 | |
| Earnings per share attributable to Moody’s common shareholders | | | | | | $ | 5.15 | | | | | | | $ | 1.36 | | | | | | | $ | 4.63 | |
Transition tax related to U.S. tax reform | | | | | | | 1.28 | | | | | | | | | | | | | | | | | |
Net Impact of U.S. tax reform/Belgium statutory tax rate change on deferred taxes | | | | | | | (0.01 | ) | | | | | | | | | | | | | | | | |
CCXI Gain | | | | | | | (0.31 | ) | | | | | | | | | | | | | | | — | |
Pre-Tax Purchase Price Hedge Gain | | $ | (0.57 | ) | | | | | | $ | — | | | | | | | $ | — | | | | | |
Tax on Purchase Price Hedge Gain | | | 0.20 | | | | | | | | — | | | | | | | | — | | | | | |
| | | | | | | | | | | | | | | | | | | | | | | | |
Net Purchase Price Hedge Gain | | | | | | | (0.37 | ) | | | | | | | | | | | | | | | — | |
Pre-Tax Acquisition-Related Expenses | | $ | 0.12 | | | | | | | $ | — | | | | | | | $ | — | | | | | |
Tax on Acquisition-Related Expenses | | | (0.02 | ) | | | | | | | — | | | | | | | | — | | | | | |
| | | | | | | | | | | | | | | | | | | | | | | | |
Acquisition-Related Expenses(1) | | | | | | | 0.10 | | | | | | | | | | | | | | | | — | |
Pre-Tax Acquisition-Related Intangible Amortization Expenses | | $ | 0.32 | | | | | | | $ | 0.18 | | | | | | | $ | 0.16 | | | | | |
Tax on Acquisition-Related Intangible Amortization Expenses | | | (0.09 | ) | | | | | | | (0.05 | ) | | | | | | | (0.05 | ) | | | | |
| | | | | | | | | | | | | | | | | | | | | | | | |
Net Acquisition-Related Intangible Amortization Expenses | | | | | | | 0.23 | | | | | | | | 0.13 | | | | | | | | 0.11 | |
Pre-Tax Restructuring | | | — | | | | | | | $ | 0.06 | | | | | | | $ | — | | | | | |
Tax on Restructuring | | | — | | | | | | | | (0.02 | ) | | | | | | | — | | | | | |
| | | | | | | | | | | | | | | | | | | | | | | | |
Net Restructuring | | | | | | | — | | | | | | | | 0.04 | | | | | | | | — | |
Pre-tax Settlement Charge | | | — | | | | | | | $ | 4.42 | | | | | | | $ | — | | | | | |
Tax on Settlement Charge | | | — | | | | | | | | (0.83 | ) | | | | | | | — | | | | | |
| | | | | | | | | | | | | | | | | | | | | | | | |
Net Settlement Charge | | | | | | | — | | | | | | | | 3.59 | | | | | | | | — | |
FX gain on liquidation of a subsidiary | | | | | | | — | | | | | | | | (0.18 | ) | | | | | | | — | |
Legacy Tax benefit | | | | | | | | | | | | | | | — | | | | | | | | (0.03 | ) |
| | | | | | | | | | | | | | | | | | | | | | | | |
| Adjusted Diluted EPS | | | | | | $ | 6.07 | | | | | | | $ | 4.94 | | | | | | | $ | 4.71 | |
| | | | | | | | | | | | | | | | | | | | | | | | |
(1) | Certain of these Acquisition-Related Expenses are not deductible for tax |
Free Cash Flow:
The Company defines Free Cash Flow as net cash provided by operating activities minus payments for capital additions. Management believes that Free Cash Flow is a useful metric in assessing the Company’s cash flows to service debt, pay dividends and to fund acquisitions and share repurchases. Management deems capital expenditures essential to the Company’s product and service innovations and maintenance of Moody’s operational capabilities. Accordingly, capital expenditures are deemed to be a recurring use of Moody’s cash flow. Below is a reconciliation of the Company’s net cash flows from operating activities to Free Cash Flow:
| | | | | | | | | | | | |
| | | Year Ended December 31, | |
| | | |
| | | 2017 | | | 2016 | | | 2015 | |
| Net cash provided by operating activities | | $ | 747.5 | | | $ | 1,259.2 | | | $ | 1,198.1 | |
Capital additions | | | (90.6 | ) | | | (115.2 | ) | | | (89.0 | ) |
| | | | | | | | | | | | |
| Free Cash Flow | | $ | 656.9 | | | $ | 1,144.0 | | | $ | 1,109.1 | |
| | | | | | | | | | | | |
| Net cash (used in) provided by investing activities | | $ | (3,420.0 | ) | | $ | 102.0 | | | $ | (92.0 | ) |
| Net cash provided by (used in) financing activities | | $ | 1,607.2 | | | $ | (1,042.9 | ) | | $ | (505.5 | ) |
Recently Issued Accounting Pronouncements
Refer to Note 2 to the consolidated financial statements located in Item 8 on this Form10-K for a discussion on the impact to the Company relating to recently issued accounting pronouncements.
CONTINGENCIES
For information regarding legal proceedings, see Part II, Item 8 –“Financial Statements”, Note 19 “Contingencies” in this Form10-K.
Forward-Looking Statements
Certain statements contained in this annual report on Form10-K are forward-looking statements and are based on future expectations, plans and prospects for the Company’s business and operations that involve a number of risks and uncertainties. Such statements involve estimates, projections, goals, forecasts, assumptions and uncertainties that could cause actual results or outcomes to differ materially from those contemplated, expressed, projected, anticipated or implied in the forward-looking statements. Those statements appear at various places throughout this annual report on Form10-K, including in the sections entitled “Contingencies” under Item 7. “MD&A”, commencing on page 31 of this annual report on Form10-K, under “Legal Proceedings” in Part I, Item 3, of this Form10-K, and elsewhere in the context of statements containing the words “believe”, “expect”, “anticipate”, “intend”, “plan”, “will”, “predict”, “potential”, “continue”, “strategy”, “aspire”, “target”, “forecast”, “project”, “estimate”, “should”, “could”, “may” and similar expressions or words and variations thereof relating to the Company’s views on future events, trends and contingencies. Stockholders and investors are cautioned not to place undue reliance on these forward-looking statements. The forward-looking statements and other information are made as of the date of this annual report on Form10-K, and the Company undertakes no obligation (nor does it intend) to publicly supplement, update or revise such statements on a going-forward basis, whether as a result of subsequent developments, changed expectations or otherwise. In connection with the “safe harbor” provisions of the Private Securities Litigation Reform Act of 1995, the Company is identifying examples of factors, risks and uncertainties that could cause actual results to differ, perhaps materially, from those indicated by these forward-looking statements.
Those factors, risks and uncertainties include, but are not limited to, world-wide credit market disruptions or an economic slowdown, which could affect the volume of debt and other securities issued in domestic and/or global capital markets; other matters that could affect the volume of debt and other securities issued in domestic and/or global capital markets, including regulation, credit quality concerns, changes in interest rates and other volatility in the financial markets such as that due to the U.K.’s referendum vote whereby the U.K. citizens voted to withdraw from the EU; the level of merger and acquisition activity in the U.S. and abroad; the uncertain effectiveness and possible collateral consequences of U.S. and foreign government actions affecting world-wide credit markets, international trade and economic policy; concerns in the marketplace affecting our credibility or otherwise affecting market perceptions of the integrity or utility of independent credit agency ratings; the introduction of competing products or technologies by other companies; pricing pressure from competitors and/or customers; the level of success of new product development and global expansion; the impact of regulation as an NRSRO, the potential for new U.S., state and local legislation and regulations, including provisions in the Financial Reform Act and regulations resulting from that Act; the potential for increased competition and regulation in the EU and other foreign jurisdictions; exposure to litigation related to our rating opinions, as well as any other litigation, government and regulatory proceedings, investigations and inquires to which the Company may be subject from time to time; provisions in the Financial Reform Act legislation modifying the pleading standards, and EU regulations modifying the liability standards, applicable to credit rating agencies in a manner adverse to credit rating agencies; provisions of EU regulations imposing additional procedural and substantive requirements on
the pricing of services and the expansion of supervisory remit to includenon-EU ratings used for regulatory purposes; the possible loss of key employees; failures or malfunctions of our operations and infrastructure; any vulnerabilities to cyber threats or other cybersecurity concerns; the outcome of any review by controlling tax authorities of the Company’s global tax planning initiatives; exposure to potential criminal sanctions or civil remedies if the Company fails to comply with foreign and U.S. laws and regulations that are applicable in the jurisdictions in which the Company operates, including sanctions laws, anti-corruption laws, and local laws prohibiting corrupt payments to government officials; the impact of mergers, acquisitions or other business combinations and the ability of the Company to successfully integrate acquired businesses; currency and foreign exchange volatility; the level of future cash flows; the levels of capital investments; and a decline in the demand for credit risk management tools by financial institutions. Other factors, risks and uncertainties relating to our acquisition of Bureau van Dijk could cause our actual results to differ, perhaps materially, from those indicated by these forward-looking statements, including risks relating to the integration of Bureau van Dijk’s operations, products and employees into Moody’s and the possibility that anticipated synergies and other benefits of the acquisition will not be realized in the amounts anticipated or will not be realized within the expected timeframe; risks that the acquisition could have an adverse effect on the business of Bureau van Dijk or its prospects, including, without limitation, on relationships with vendors, suppliers or customers; claims made, from time to time, by vendors, suppliers or customers; changes in the European or global marketplaces that have an adverse effect on the business of Bureau van Dijk. These factors, risks and uncertainties as well as other risks and uncertainties that could cause Moody’s actual results to differ materially from those contemplated, expressed, projected, anticipated or implied in the forward-looking statements are described in greater detail under “Risk Factors” in Part I, Item 1A of the Company’s annual report onForm 10-K for the year ended December 31, 2017, and in other filings made by the Company from time to time with the SEC or in materials incorporated herein or therein. Stockholders and investors are cautioned that the occurrence of any of these factors, risks and uncertainties may cause the Company’s actual results to differ materially from those contemplated, expressed, projected, anticipated or implied in the forward-looking statements, which could have a material and adverse effect on the Company’s business, results of operations and financial condition. New factors may emerge from time to time, and it is not possible for the Company to predict new factors, nor can the Company assess the potential effect of any new factors on it.
ITEM 7A. | | QUANTITATIVE AND QUALITATIVE DISCLOSURES ABOUT MARKET RISK |
Information in response to this item is set forth under the caption “Market Risk” in Part II, Item 7 on page 51 of this annual report on Form 10-K.
ITEM 8. | | FINANCIAL STATEMENTS |
Index to Financial Statements
MANAGEMENT’S REPORT ON INTERNAL CONTROL OVER FINANCIAL REPORTING
Management of Moody’s Corporation is responsible for establishing and maintaining adequate internal control over financial reporting and for the assessment of the effectiveness of internal control over financial reporting. As defined by the SEC in Rules13a-15(f) and15d-15(f) under the Securities Exchange Act of 1934, internal control over financial reporting is a process designed by, or under the supervision of, the Company’s principal executive and principal financial officers, or persons performing similar functions, and effected by the Company’s Board, management and other personnel, to provide reasonable assurance regarding the reliability of financial reporting and the preparation of financial statements for external purposes in accordance with generally accepted accounting principles.
Moody’s internal control over financial reporting includes those policies and procedures that (1) pertain to the maintenance of records that, in reasonable detail, accurately and fairly reflect the transactions and dispositions of assets of the Company; (2) provide reasonable assurance that transactions are recorded as necessary to permit preparation of financial statements in accordance with generally accepted accounting principles, and that receipts and expenditures of the Company are being made only in accordance with authorizations of Moody’s management and directors; and (3) provide reasonable assurance regarding prevention or timely detection of unauthorized acquisition, use or disposition of the Company’s assets that could have a material effect on the financial statements.
Because of its inherent limitations, internal control over financial reporting may not prevent or detect misstatements. Also, projections of any evaluation of effectiveness to future periods are subject to the risk that controls may become inadequate because of changes in conditions, or that the degree of compliance with the policies or procedures may deteriorate.
Management of the Company has undertaken an assessment of the design and operational effectiveness of the Company’s internal control over financial reporting as of December 31, 2017 based on criteria established in the Internal Control—Integrated Framework (2013) issued by the Committee of Sponsoring Organizations of the Treadway Commission (COSO).
Our assessment of and conclusion on the effectiveness of our internal control over financial reporting as of December 31, 2017 did not include the internal controls of Bureau van Dijk, which was acquired during our fiscal year ended December 31, 2017 and will be included in our assessment of and conclusion on the effectiveness of our internal control over financial reporting for the fiscal year ending December 31, 2018. The total assets (excluding acquired goodwill and intangible assets which are included within the scope of this assessment) and revenues of Bureau van Dijk represents approximately $322 million and $92 million, respectively, of the corresponding amounts in our consolidated financial statements for the fiscal year ended December 31, 2017.
Based on the assessment performed, management has concluded that Moody’s maintained effective internal control over financial reporting as of December 31, 2017.
The effectiveness of our internal control over financial reporting as of December 31, 2017 has been audited by KPMG LLP, an independent registered public accounting firm, as stated in their report which appears herein.
/s/ RAYMOND W. MCDANIEL, JR.
Raymond W. McDaniel, Jr.
President and Chief Executive Officer
/s/ LINDA S. HUBER
Linda S. Huber
Executive Vice President and Chief Financial Officer
February 26, 2018
Report of Independent Registered Public Accounting Firm
The Shareholders and Board of Directors of Moody’s Corporation:
Opinions on the Consolidated Financial Statements and Internal Control over Financial Reporting
We have audited the accompanying consolidated balance sheets of Moody’s Corporation (the Company) as of December 31, 2017 and 2016, and the related consolidated statements of operations, comprehensive income, shareholders’ equity (deficit), and cash flows for each of the years in the three-year period ended December 31, 2017, and the related notes (collectively, the consolidated financial statements). We also have audited the Company’s internal control over financial reporting as of December 31, 2017, based on criteria established inInternal Control—Integrated Framework (2013) issued by the Committee of Sponsoring Organizations of the Treadway Commission.
In our opinion, the consolidated financial statements referred to above present fairly, in all material respects, the financial position of the Company as of December 31, 2017 and 2016, and the results of its operations and its cash flows for each of the years in the three-year period ended December 31, 2017, in conformity with U.S. generally accepted accounting principles. Also in our opinion, the Company maintained, in all material respects, effective internal control over financial reporting as of December 31, 2017, based on criteria established inInternal Control—Integrated Framework (2013) issued by the Committee of Sponsoring Organizations of the Treadway Commission.
The Company acquired Bureau Van Dijk in August 2017, and management excluded from its assessment of the effectiveness of the Company’s internal control over financial reporting as of December 31, 2017, Bureau Van Dijk’s internal control over financial reporting, which is associated with total assets (excluding goodwill and intangibles which are included within the scope of the assessment) of $322 million and total revenues of $92 million included in the consolidated financial statements of the Company as of and for the year ended December 31, 2017. Our audit of internal control over financial reporting of the Company also excluded an evaluation of the internal control over financial reporting of Bureau Van Dijk.
Basis for Opinions
The Company’s management is responsible for these consolidated financial statements, for maintaining effective internal control over financial reporting, and for its assessment of the effectiveness of internal control over financial reporting included in the accompanying Management’s Report on Internal Control over Financial Reporting. Our responsibility is to express an opinion on the Company’s consolidated financial statements and an opinion on the Company’s internal control over financial reporting based on our audits. We are a public accounting firm registered with the Public Company Accounting Oversight Board (United States) (“PCAOB”) and are required to be independent with respect to the Company in accordance with the U.S. federal securities laws and the applicable rules and regulations of the Securities and Exchange Commission and the PCAOB.
We conducted our audits in accordance with the standards of the PCAOB. Those standards require that we plan and perform the audit to obtain reasonable assurance about whether the consolidated financial statements are free of material misstatement, whether due to error or fraud, and whether effective internal control over financial reporting was maintained in all material respects.
Our audits of the consolidated financial statements included performing procedures to assess the risks of material misstatement of the consolidated financial statements, whether due to error or fraud, and performing procedures that respond to those risks. Such procedures included examining, on a test basis, evidence regarding the amounts and disclosures in the consolidated financial statements. Our audits also included evaluating the accounting principles used and significant estimates made by management, as well as evaluating the overall presentation of the consolidated financial statements. Our audit of internal control over financial reporting included obtaining an understanding of internal control over financial reporting, assessing the risk that a material weakness exists, and testing and evaluating the design and operating effectiveness of internal control based on the assessed risk. Our audits also included performing such other procedures as we considered necessary in the circumstances. We believe that our audits provide a reasonable basis for our opinions.
Definition and Limitations of Internal Control over Financial Reporting
A company’s internal control over financial reporting is a process designed to provide reasonable assurance regarding the reliability of financial reporting and the preparation of financial statements for external purposes in accordance with generally accepted accounting principles. A company’s internal control over financial reporting includes those policies and procedures that (1) pertain to the maintenance of records that, in reasonable detail, accurately and fairly reflect the transactions and dispositions of the assets of the company; (2) provide reasonable assurance that transactions are recorded as necessary to permit preparation of financial statements in accordance with generally accepted accounting principles, and that receipts and expenditures of the company are being made only in accordance with authorizations of management and directors of the company; and (3) provide reasonable assurance regarding prevention or timely detection of unauthorized acquisition, use, or disposition of the company’s assets that could have a material effect on the financial statements.
Because of its inherent limitations, internal control over financial reporting may not prevent or detect misstatements. Also, projections of any evaluation of effectiveness to future periods are subject to the risk that controls may become inadequate because of changes in conditions, or that the degree of compliance with the policies or procedures may deteriorate.
/s/ KPMG LLP
We have served as the Company’s auditor since 2008.
New York, New York
February 26, 2018
MOODY’S CORPORATION
CONSOLIDATED STATEMENTS OF OPERATIONS
(Amounts in millions, except per share data)
| | | | | | | | | | | | |
| | | Year Ended December 31, | |
| | | |
| | | 2017 | | | 2016 | | | 2015 | |
| Revenue | | $ | 4,204.1 | | | $ | 3,604.2 | | | $ | 3,484.5 | |
| | | | | | | | | | | | |
| Expenses | | | | | | | | | | | | |
Operating | | | 1,222.8 | | | | 1,026.6 | | | | 976.3 | |
Selling, general and administrative | | | 991.4 | | | | 936.4 | | | | 921.3 | |
Restructuring | | | — | | | | 12.0 | | | | — | |
Depreciation and amortization | | | 158.3 | | | | 126.7 | | | | 113.5 | |
Acquisition-Related Expenses | | | 22.5 | | | | — | | | | — | |
Settlement Charge | | | — | | | | 863.8 | | | | — | |
| | | | | | | | | | | | |
Total expenses | | | 2,395.0 | | | | 2,965.5 | | | | 2,011.1 | |
| | | | | | | | | | | | |
| Operating income | | | 1,809.1 | | | | 638.7 | | | | 1,473.4 | |
| | | | | | | | | | | | |
| Non-operating (expense) income, net | | | | | | | | | | | | |
Interest expense, net | | | (188.4 | ) | | | (137.8 | ) | | | (115.1 | ) |
Othernon-operating (expense) income , net | | | (4.7 | ) | | | 57.1 | | | | 21.3 | |
Purchase Price Hedge Gain | | | 111.1 | | | | — | | | | — | |
CCXI Gain | | | 59.7 | | | | — | | | | — | |
| | | | | | | | | | | | |
Non-operating (expense) income, net | | | (22.3 | ) | | | (80.7 | ) | | | (93.8 | ) |
| | | | | | | | | | | | |
| Income before provision for income taxes | | | 1,786.8 | | | | 558.0 | | | | 1,379.6 | |
Provision for income taxes | | | 779.1 | | | | 282.2 | | | | 430.0 | |
| | | | | | | | | | | | |
| Net income | | | 1,007.7 | | | | 275.8 | | | | 949.6 | |
Less: Net income attributable to noncontrolling interests | | | 7.1 | | | | 9.2 | | | | 8.3 | |
| | | | | | | | | | | | |
| Net income attributable to Moody’s | | $ | 1,000.6 | | | $ | 266.6 | | | $ | 941.3 | |
| | | | | | | | | | | | |
| Earnings per share | | | | | | | | | | | | |
Basic | | $ | 5.24 | | | $ | 1.38 | | | $ | 4.70 | |
| | | | | | | | | | | | |
Diluted | | $ | 5.15 | | | $ | 1.36 | | | $ | 4.63 | |
| | | | | | | | | | | | |
| Weighted average shares outstanding | | | | | | | | | | | | |
Basic | | | 191.1 | | | | 192.7 | | | | 200.1 | |
| | | | | | | | | | | | |
Diluted | | | 194.2 | | | | 195.4 | | | | 203.4 | |
| | | | | | | | | | | | |
The accompanying notes are an integral part of the consolidated financial statements.
MOODY’S CORPORATION
CONSOLIDATED STATEMENTS OF COMPREHENSIVE INCOME
(Amounts in millions)
| | | | | | | | | | | | | | | | | | | | | | | | | | | | | | | | | | | | |
| | | Year Ended December 31, 2017 | | | Year Ended December 31, 2016 | | | Year Ended December 31, 2015 | |
| | | | | | | | | |
| | | Pre-tax
amounts | | | Tax
amounts | | | After-tax
amounts | | | Pre-tax
amounts | | | Tax
amounts | | | After-tax
amounts | | | Pre-tax
amounts | | | Tax
amounts | | | After-tax
amounts | |
| Net Income | | | | | | | | | | $ | 1,007.7 | | | | | | | | | | | $ | 275.8 | | | | | | | | | | | $ | 949.6 | |
| | | | | | | | | | | | | | | | | | | | | | | | | | | | | | | | | | | | |
| Other Comprehensive Income (Loss): | | | | | | | | | | | | | | | | | | | | | | | | | | | | | | | | | | | | |
Foreign Currency Adjustments: | | | | | | | | | | | | | | | | | | | | | | | | | | | | | | | | | | | | |
Foreign currency translation adjustments, net | | $ | 166.2 | | | $ | 23.1 | | | | 189.3 | | | $ | (22.2 | ) | | $ | (5.4 | ) | | | (27.6 | ) | | $ | (110.5 | ) | | $ | (14.7 | ) | | | (125.2 | ) |
Foreign currency translation adjustments – reclassification of (gains) losses included in net income | | | — | | | | — | | | | — | | | | (36.6 | ) | | | — | | | | (36.6 | ) | | | (0.1 | ) | | | — | | | | (0.1 | ) |
Cash Flow Hedges: | | | | | | | | | | | | | | | | | | | | | | | | | | | | | | | | | | | | |
Net realized and unrealized gains on cash flow hedges | | | 9.6 | | | | (3.7 | ) | | | 5.9 | | | | (1.4 | ) | | | 0.5 | | | | (0.9 | ) | | | (1.1 | ) | | | — | | | | (1.1 | ) |
Reclassification of (gains) losses included in net income | | | (11.5 | ) | | | 4.8 | | | | (6.7 | ) | | | 6.0 | | | | (2.3 | ) | | | 3.7 | | | | — | | | | — | | | | — | |
Available for Sale Securities: | | | | | | | | | | | | | | | | | | | | | | | | | | | | | | | | | | | | |
Net unrealized gains on available for sale securities | | | 2.0 | | | | — | | | | 2.0 | | | | 2.6 | | | | — | | | | 2.6 | | | | 3.3 | | | | — | | | | 3.3 | |
Reclassification of gains included in net income | | | (3.5 | ) | | | — | | | | (3.5 | ) | | | — | | | | — | | | | — | | | | (0.9 | ) | | | — | | | | (0.9 | ) |
Pension and Other Retirement Benefits: | | | | | | | | | | | | | | | | | | | | | | | | | | | | | | | | | | | | |
Amortization of actuarial losses and prior service costs included in net income | | | 8.7 | | | | (3.3 | ) | | | 5.4 | | | | 9.7 | | | | (3.7 | ) | | | 6.0 | | | | 13.5 | | | | (5.2 | ) | | | 8.3 | |
Net actuarial gains and prior service costs | | | 20.9 | | | | (8.3 | ) | | | 12.6 | | | | 0.3 | | | | (0.1 | ) | | | 0.2 | | | | 18.5 | | | | (7.1 | ) | | | 11.4 | |
| | | | | | | | | | | | | | | | | | | | | | | | | | | | | | | | | | | | |
| Total Other Comprehensive Income (loss) | | $ | 192.4 | | | $ | 12.6 | | | $ | 205.0 | | | $ | (41.6 | ) | | $ | (11.0 | ) | | $ | (52.6 | ) | | $ | (77.3 | ) | | $ | (27.0 | ) | | $ | (104.3 | ) |
| | | | | | | | | | | | | | | | | | | | | | | | | | | | | | | | | | | | |
| Comprehensive Income | | | | 1,212.7 | | | | | | | | | | | | 223.2 | | | | | | | | | | | | 845.3 | |
Less: comprehensive income (loss) attributable to noncontrolling interests | | | | | | | | | | | 19.4 | | | | | | | | | | | | (18.0 | ) | | | | | | | | | | | 8.3 | |
| | | | | | | | | | | | | | | | | | | | | | | | | | | | | | | | | | | | |
| Comprehensive Income Attributable to Moody’s | | | | | | | | | | $ | 1,193.3 | | | | | | | | | | | $ | 241.2 | | | | | | | | | | | $ | 837.0 | |
| | | | | | | | | | | | | | | | | | | | | | | | | | | | | | | | | | | | |
The accompanying notes are an integral part of the consolidated financial statements.
MOODY’S CORPORATION
CONSOLIDATED BALANCE SHEETS
(Amounts in millions, except share and per share data)
| | | | | | | | |
| | | December 31, | |
| | |
| | | 2017 | | | 2016 | |
| ASSETS | | | | | | | | |
| Current assets: | | | | | | | | |
Cash and cash equivalents | | $ | 1,071.5 | | | $ | 2,051.5 | |
Short-term investments | | | 111.8 | | | | 173.4 | |
Accounts receivable, net of allowances of $36.6 in 2017 and $25.7 in 2016 | | | 1,147.2 | | | | 887.4 | |
Other current assets | | | 250.1 | | | | 140.8 | |
| | | | | | | | |
Total current assets | | | 2,580.6 | | | | 3,253.1 | |
| Property and equipment, net | | | 325.1 | | | | 325.9 | |
| Goodwill | | | 3,753.2 | | | | 1,023.6 | |
| Intangible assets, net | | | 1,631.6 | | | | 296.4 | |
| Deferred tax assets, net | | | 143.8 | | | | 316.1 | |
| Other assets | | | 159.9 | | | | 112.2 | |
| | | | | | | | |
Total assets | | $ | 8,594.2 | | | $ | 5,327.3 | |
| | | | | | | | |
| LIABILITIES, NONCONTROLLING INTERESTS AND SHAREHOLDERS’ DEFICIT | | | | | | | | |
| Current liabilities: | | | | | | | | |
Accounts payable and accrued liabilities | | $ | 750.3 | | | $ | 1,444.3 | |
Commercial paper | | | 129.9 | | | | — | |
Current portion of long-term debt | | | 299.5 | | | | 300.0 | |
Deferred revenue | | | 883.6 | | | | 683.9 | |
| | | | | | | | |
Total current liabilities | | | 2,063.3 | | | | 2,428.2 | |
| Non-current portion of deferred revenue | | | 140.0 | | | | 134.1 | |
| Long-term debt | | | 5,111.1 | | | | 3,063.0 | |
| Deferred tax liabilities, net | | | 341.6 | | | | 104.3 | |
| Unrecognized tax benefits | | | 389.1 | | | | 199.8 | |
| Other liabilities | | | 664.0 | | | | 425.2 | |
| | | | | | | | |
Total liabilities | | | 8,709.1 | | | | 6,354.6 | |
| | | | | | | | |
| Contingencies (Note 19) | | | — | | | | — | |
| Shareholders’ deficit: | | | | | | | | |
Preferred stock, par value $.01 per share; 10,000,000 shares authorized; no shares issued and outstanding | | | — | | | | — | |
Series common stock, par value $.01 per share; 10,000,000 shares authorized; no shares issued and outstanding | | | — | | | | — | |
Common stock, par value $.01 per share; 1,000,000,000 shares authorized; 342,902,272 shares issued At December 31, 2017 and December 31, 2016, respectively. | | | 3.4 | | | | 3.4 | |
Capital surplus | | | 528.6 | | | | 477.2 | |
Retained earnings | | | 7,465.4 | | | | 6,688.9 | |
Treasury stock, at cost; 151,932,157 and 152,208,231 shares of common stock at December 31, 2017 and December 31, 2016, respectively | | | (8,152.9 | ) | | | (8,029.6 | ) |
Accumulated other comprehensive loss | | | (172.2 | ) | | | (364.9 | ) |
| | | | | | | | |
Total Moody’s shareholders’ deficit | | | (327.7 | ) | | | (1,225.0 | ) |
Noncontrolling interests | | | 212.8 | | | | 197.7 | |
| | | | | | | | |
Total shareholders’ deficit | | | (114.9 | ) | | | (1,027.3 | ) |
| | | | | | | | |
Total liabilities, noncontrolling interests and shareholders’ deficit | | $ | 8,594.2 | | | $ | 5,327.3 | |
| | | | | | | | |
The accompanying notes are an integral part of the consolidated financial statements.
MOODY’S CORPORATION
CONSOLIDATED STATEMENTS OF CASH FLOWS
(Amounts in millions)
| | | | | | | | | | | | |
| | | Year Ended December 31, | |
| | | |
| | | 2017 | | | 2016 | | | 2015 | |
| Cash flows from operating activities | | | | | | | | | | | | |
Net income | | $ | 1,007.7 | | | $ | 275.8 | | | $ | 949.6 | |
Reconciliation of net income to net cash provided by operating activities: | | | | | | | | | | | | |
Depreciation and amortization | | | 158.3 | | | | 126.7 | | | | 113.5 | |
Stock-based compensation | | | 122.9 | | | | 98.1 | | | | 87.2 | |
CCXI Gain | | | (59.7 | ) | | | — | | | | — | |
Purchase Price Hedge Gain | | | (111.1 | ) | | | — | | | | — | |
FX gain relating to liquidation and sale of subsidiaries | | | — | | | | (36.6 | ) | | | — | |
Deferred income taxes | | | 88.3 | | | | (153.1 | ) | | | 18.1 | |
Legacy Tax Matters | | | — | | | | (1.6 | ) | | | (6.4 | ) |
Changes in assets and liabilities: | | | | | | | | | | | | |
Accounts receivable | | | (148.1 | ) | | | (104.8 | ) | | | (25.4 | ) |
Other current assets | | | (70.3 | ) | | | 37.0 | | | | (28.9 | ) |
Other assets | | | 12.1 | | | | 6.6 | | | | (13.1 | ) |
Accounts payable and accrued liabilities | | | (651.4 | ) | | | 908.7 | | | | 51.4 | |
Deferred revenue | | | 72.9 | | | | 74.9 | | | | 31.6 | |
Unrecognized tax benefits and othernon-current tax liabilities | | | 63.0 | | | | 2.2 | | | | (10.9 | ) |
Other liabilities | | | 262.9 | | | | 25.3 | | | | 31.4 | |
| | | | | | | | | | | | |
Net cash provided by operating activities | | | 747.5 | | | | 1,259.2 | | | | 1,198.1 | |
| | | | | | | | | | | | |
| Cash flows from investing activities | | | | | | | | | | | | |
Capital additions | | | (90.6 | ) | | | (115.2 | ) | | | (89.0 | ) |
Purchases of investments | | | (170.1 | ) | | | (379.9 | ) | | | (688.2 | ) |
Sales and maturities of investments | | | 238.5 | | | | 699.5 | | | | 653.1 | |
Receipts from Purchase Price Hedge | | | 111.1 | | | | — | | | | — | |
Cash paid for acquisitions, net of cash acquired and equity investments | | | (3,511.0 | ) | | | (80.8 | ) | | | (7.6 | ) |
Receipts from settlements of net investment hedges | | | 2.1 | | | | 3.8 | | | | 39.7 | |
Payments for settlements of net investment hedges | | | — | | | | (26.9 | ) | | | — | |
Cash received upon disposal of a subsidiary, net of cash transferred to purchaser | | | — | | | | 1.5 | | | | — | |
| | | | | | | | | | | | |
Net cash (used in) provided by investing activities | | | (3,420.0 | ) | | | 102.0 | | | | (92.0 | ) |
| | | | | | | | | | | | |
| Cash flows from financing activities | | | | | | | | | | | | |
Issuance of notes | | | 2,291.9 | | | | — | | | | 852.8 | |
Repayment of notes | | | (300.0 | ) | | | — | | | | — | |
Issuance of commercial paper | | | 1,837.1 | | | | — | | | | — | |
Repayment of commercial paper | | | (1,707.2 | ) | | | — | | | | — | |
Proceeds from stock-based compensation plans | | | 55.6 | | | | 77.8 | | | | 89.2 | |
Repurchase of shares related to stock-based compensation | | | (48.8 | ) | | | (44.4 | ) | | | (59.5 | ) |
Treasury shares | | | (199.7 | ) | | | (738.8 | ) | | | (1,098.1 | ) |
Dividends | | | (290.4 | ) | | | (285.1 | ) | | | (272.1 | ) |
Dividends to noncontrolling interests | | | (3.2 | ) | | | (6.7 | ) | | | (6.8 | ) |
Payment for noncontrolling interest | | | (8.5 | ) | | | (45.4 | ) | | | — | |
Contingent consideration | | | — | | | | (0.2 | ) | | | (1.5 | ) |
Debt issuance costs and related fees | | | (19.6 | ) | | | (0.1 | ) | | | (9.5 | ) |
| | | | | | | | | | | | |
Net cash provided by (used in) financing activities | | | 1,607.2 | | | | (1,042.9 | ) | | | (505.5 | ) |
| | | | | | | | | | | | |
Effect of exchange rate changes on cash and cash equivalents | | | 85.3 | | | | (24.2 | ) | | | (62.7 | ) |
| | | | | | | | | | | | |
(Decrease) Increase in cash and cash equivalents | | | (980.0 | ) | | | 294.1 | | | | 537.9 | |
Cash and cash equivalents, beginning of period | | | 2,051.5 | | | | 1,757.4 | | | | 1,219.5 | |
| | | | | | | | | | | | |
Cash and cash equivalents, end of period | | $ | 1,071.5 | | | $ | 2,051.5 | | | $ | 1,757.4 | |
| | | | | | | | | | | | |
The accompanying notes are an integral part of the consolidated financial statements
MOODY’S CORPORATION
CONSOLIDATED STATEMENTS OF SHAREHOLDERS’ EQUITY (DEFICIT)
(Amounts in millions)
| | | | | | | | | | | | | | | | | | | | | | | | | | | | | | | | | | | | | | | | |
| | | Shareholders’ of Moody’s Corporation | | | | | | | |
| | | Common Stock | | | | | | | | | Treasury Stock | | | Accumulated
Other
Comprehensive
Loss | | | Total Moody’s
Shareholders’
Deficit | | | Non-
Controlling
Interests | | | Total
Shareholders’
Equity
(Deficit) | |
| | | | | | | | | | |
| | | Shares | | | Amount | | | Capital
Surplus | | | Retained
Earnings | | | Shares | | | Amount | | | | | | | | | | | | | |
| Balance at December 31, 2014 | | | 342.9 | | | $ | 3.4 | | | $ | 383.9 | | | $ | 6,044.3 | | | | (138.5 | ) | | $ | (6,384.2 | ) | | $ | (235.2 | ) | | $ | (187.8 | ) | | $ | 230.7 | | | $ | 42.9 | |
| | | | | | | | | | | | | | | | | | | | | | | | | | | | | | | | | | | | | | | | |
Net income | | | | | | | | | | | | | | | 941.3 | | | | | | | | | | | | | | | | 941.3 | | | | 8.3 | | | | 949.6 | |
Dividends | | | | | | | | | | | | | | | (276.6 | ) | | | | | | | | | | | | | | | (276.6 | ) | | | (7.0 | ) | | | (283.6 | ) |
Stock-based compensation | | | | | | | | | | | 87.5 | | | | | | | | | | | | | | | | | | | | 87.5 | | | | | | | | 87.5 | |
Shares issued for stock-based compensation plans at average cost, net | | | | | | | | | | | (63.5 | ) | | | | | | | 2.6 | | | | 93.1 | | | | | | | | 29.6 | | | | | | | | 29.6 | |
Net excess tax benefits upon settlement of stock-based compensation awards | | | | | | | | | | | 43.4 | | | | | | | | | | | | | | | | | | | | 43.4 | | | | | | | | 43.4 | |
Treasury shares repurchased | | | | | | | | | | | | | | | | | | | (10.9 | ) | | | (1,098.1 | ) | | | | | | | (1,098.1 | ) | | | | | | | (1,098.1 | ) |
Currency translation adjustment (net of tax of $14.7 million) | | | | | | | | | | | | | | | | | | | | | | | | | | | (125.3 | ) | | | (125.3 | ) | | | | | | | (125.3 | ) |
Net actuarial losses and prior service cost (net of tax of $7.1 million) | | | | | | | | | | | | | | | | | | | | | | | | | | | 11.4 | | | | 11.4 | | | | | | | | 11.4 | |
Amortization of prior service costs and actuarial losses, (net of tax of $5.2 million) | | | | | | | | | | | | | | | | | | | | | | | | | | | 8.3 | | | | 8.3 | | | | | | | | 8.3 | |
Net unrealized gain on available for sale securities | | | | | | | | | | | | | | | | | | | | | | | | | | | 2.4 | | | | 2.4 | | | | | | | | 2.4 | |
Net realized loss on cash flow hedges | | | | | | | | | | | | | | | | | | | | | | | | | | | (1.1 | ) | | | (1.1 | ) | | | | | | | (1.1 | ) |
| | | | | | | | | | | | | | | | | | | | | | | | | | | | | | | | | | | | | | | | |
| | | | | | | | | | | | | | | | | | | | | | | | | | | | | | | | | | | | | | | | |
| Balance at December 31, 2015 | | | 342.9 | | | $ | 3.4 | | | $ | 451.3 | | | $ | 6,709.0 | | | | (146.8 | ) | | $ | (7,389.2 | ) | | $ | (339.5 | ) | | $ | (565.0 | ) | | $ | 232.0 | | | | (333.0 | ) |
| | | | | | | | | | | | | | | | | | | | | | | | | | | | | | | | | | | | | | | | |
The accompanying notes are an integral part of the consolidated financial statements.
(continued on next page)
MOODY’S CORPORATION
CONSOLIDATED STATEMENTS OF SHAREHOLDERS’ EQUITY (DEFICIT)continued
(Amounts in millions)
| | | | | | | | | | | | | | | | | | | | | | | | | | | | | | | | | | | | | | | | |
| | | Shareholders’ of Moody’s Corporation | | | | | | | |
| | | Common Stock | | | | | | | | | Treasury Stock | | | Accumulated
Other
Comprehensive
Loss | | | Total Moody’s
Shareholders’
Deficit | | | Non-
Controlling
Interests | | | Total
Shareholders’
Deficit | |
| | | | | | | | | | |
| | | Shares | | | Amount | | | Capital
Surplus | | | Retained
Earnings | | | Shares | | | Amount | | | | | | | | | | | | | |
| Balance at December 31, 2015 | | | 342.9 | | | $ | 3.4 | | | $ | 451.3 | | | $ | 6,709.0 | | | | (146.8 | ) | | $ | (7,389.2 | ) | | $ | (339.5 | ) | | $ | (565.0 | ) | | $ | 232.0 | | | $ | (333.0 | ) |
| | | | | | | | | | | | | | | | | | | | | | | | | | | | | | | | | | | | | | | | |
Net income | | | | | | | | | | | | | | | 266.6 | | | | | | | | | | | | | | | | 266.6 | | | | 9.2 | | | | 275.8 | |
Dividends | | | | | | | | | | | | | | | (286.7 | ) | | | | | | | | | | | | | | | (286.7 | ) | | | (6.7 | ) | | | (293.4 | ) |
Stock-based compensation | | | | | | | | | | | 98.4 | | | | | | | | | | | | | | | | | | | | 98.4 | | | | | | | | 98.4 | |
Shares issued for stock-based compensation plans at average cost, net | | | | | | | | | | | (65.0 | ) | | | | | | | 2.3 | | | | 98.4 | | | | | | | | 33.4 | | | | | | | | 33.4 | |
Net excess tax benefits upon settlement of stock-based compensation awards | | | | | | | | | | | 32.0 | | | | | | | | | | | | | | | | | | | | 32.0 | | | | | | | | 32.0 | |
Purchase of noncontrolling interest | | | | | | | | | | | (39.5 | ) | | | | | | | | | | | | | | | | | | | (39.5 | ) | | | (9.6 | ) | | | (49.1 | ) |
Treasury shares repurchased | | | | | | | | | | | | | | | | | | | (7.7 | ) | | | (738.8 | ) | | | | | | | (738.8 | ) | | | | | | | (738.8 | ) |
Currency translation adjustment (net of tax of $5.4 million) | | | | | | | | | | | | | | | | | | | | | | | | | | | (34.2 | ) | | | (34.2 | ) | | | (30.0 | ) | | | (64.2 | ) |
Net actuarial losses and prior service cost (net of tax of $0.1 million) | | | | | | | | | | | | | | | | | | | | | | | | | | | 0.2 | | | | 0.2 | | | | | | | | 0.2 | |
Amortization of prior service costs and actuarial losses, (net of tax of $3.7 million) | | | | | | | | | | | | | | | | | | | | | | | | | | | 6.0 | | | | 6.0 | | | | | | | | 6.0 | |
Net unrealized gain on available for sale securities | | | | | | | | | | | | | | | | | | | | | | | | | | | (0.2 | ) | | | (0.2 | ) | | | 2.8 | | | | 2.6 | |
Net realized and unrealized gain on cash flow hedges (net of tax of $1.8 million) | | | | | | | | | | | | | | | | | | | | | | | | | | | 2.8 | | | | 2.8 | | | | | | | | 2.8 | |
| | | | | | | | | | | | | | | | | | | | | | | | | | | | | | | | | | | | | | | | |
| Balance at December 31, 2016 | | | 342.9 | | | $ | 3.4 | | | $ | 477.2 | | | $ | 6,688.9 | | | | (152.2 | ) | | $ | (8,029.6 | ) | | $ | (364.9 | ) | | $ | (1,225.0 | ) | | $ | 197.7 | | | $ | (1,027.3 | ) |
| | | | | | | | | | | | | | | | | | | | | | | | | | | | | | | | | | | | | | | | |
The accompanying notes are an integral part of the consolidated financial statements.
(continued on next page)
MOODY’S CORPORATION
CONSOLIDATED STATEMENTS OF SHAREHOLDERS’ EQUITY (DEFICIT)continued
(Amounts in millions)
| | | | | | | | | | | | | | | | | | | | | | | | | | | | | | | | | | | | | | | | |
| | | Shareholders’ of Moody’s Corporation | | | | | | | |
| | | Common Stock | | | | | | | | | Treasury Stock | | | Accumulated
Other
Comprehensive
Loss | | | Total Moody’s
Shareholders’
Deficit | | | Non-
Controlling
Interests | | | Total
Shareholders’
Deficit | |
| | | | | | | | | | |
| | | Shares | | | Amount | | | Capital
Surplus | | | Retained
Earnings | | | Shares | | | Amount | | | | | | | | | | | | | |
| Balance at December 31, 2016 | | | 342.9 | | | $ | 3.4 | | | $ | 477.2 | | | $ | 6,688.9 | | | | (152.2 | ) | | $ | (8,029.6 | ) | | $ | (364.9 | ) | | $ | (1,225.0 | ) | | $ | 197.7 | | | $ | (1,027.3 | ) |
| | | | | | | | | | | | | | | | | | | | | | | | | | | | | | | | | | | | | | | | |
Net income | | | | | | | | | | | | | | | 1,000.6 | | | | | | | | | | | | | | | | 1,000.6 | | | | 7.1 | | | | 1,007.7 | |
Dividends | | | | | | | | | | | | | | | (219.5 | ) | | | | | | | | | | | | | | | (219.5 | ) | | | (3.3 | ) | | | (222.8 | ) |
Adoption of ASU2016-16 (See Note 15) | | | | | | | | | | | | | | | (4.6 | ) | | | | | | | | | | | | | | | (4.6 | ) | | | | | | | (4.6 | ) |
Stock-based compensation | | | | | | | | | | | 123.2 | | | | | | | | | | | | | | | | | | | | 123.2 | | | | | | | | 123.2 | |
Shares issued for stock-based compensation plans at average cost, net | | | | | | | | | | | (67.1 | ) | | | | | | | 1.9 | | | | 76.4 | | | | | | | | 9.3 | | | | | | | | 9.3 | |
Purchase of noncontrolling interest | �� | | | | | | | | | | (4.7 | ) | | | | | | | | | | | | | | | | | | | (4.7 | ) | | | (1.0 | ) | | | (5.7 | ) |
Treasury shares repurchased | | | | | | | | | | | | | | | | | | | (1.6 | ) | | | (199.7 | ) | | | | | | | (199.7 | ) | | | | | | | (199.7 | ) |
Currency translation adjustment (net of tax of $23.1 million) | | | | | | | | | | | | | | | | | | | | | | | | | | | 176.3 | | | | 176.3 | | | | 13.0 | | | | 189.3 | |
Net actuarial losses and prior service cost (net of tax of $8.3 million) | | | | | | | | | | | | | | | | | | | | | | | | | | | 12.6 | | | | 12.6 | | | | | | | | 12.6 | |
Amortization of prior service costs and actuarial losses, (net of tax of $3.3 million) | | | | | | | | | | | | | | | | | | | | | | | | | | | 5.4 | | | | 5.4 | | | | | | | | 5.4 | |
Net realized and unrealized gain on available for sale securities | | | | | | | | | | | | | | | | | | | | | | | | | | | (0.8 | ) | | | (0.8 | ) | | | (0.7 | ) | | | (1.5 | ) |
Net realized and unrealized gain on cash flow hedges (net of tax of $1.1 million) | | | | | | | | | | | | | | | | | | | | | | | | | | | (0.8 | ) | | | (0.8 | ) | | | | | | | (0.8 | ) |
| | | | | | | | | | | | | | | | | | | | | | | | | | | | | | | | | | | | | | | | |
| Balance at December 31, 2017 | | | 342.9 | | | $ | 3.4 | | | $ | 528.6 | | | $ | 7,465.4 | | | | (151.9 | ) | | $ | (8,152.9 | ) | | $ | (172.2 | ) | | $ | (327.7 | ) | | $ | 212.8 | | | $ | (114.9 | ) |
| | | | | | | | | | | | | | | | | | | | | | | | | | | | | | | | | | | | | | | | |
The accompanying notes are an integral part of the consolidated financial statements.
MOODY’S CORPORATION
NOTES TO CONSOLIDATED FINANCIAL STATEMENTS
(tabular dollar and share amounts in millions, except per share data)
NOTE 1 | DESCRIPTION OF BUSINESS AND BASIS OF PRESENTATION |
Moody’s is a provider of (i) credit ratings; (ii) credit, capital markets and economic research, data and analytical tools; (iii) software solutions that support financial risk management activities; (iv) quantitatively derived credit scores; (v) financial services training and certification services; (vi) offshore financial research and analytical services; and (vii) company information and business intelligence products. Moody’s reports in two reportable segments: MIS and MA.
MIS, the credit rating agency, publishes credit ratings on a wide range of debt obligations and the entities that issue such obligations in markets worldwide. Revenue is primarily derived from the originators and issuers of such transactions who use MIS ratings in the distribution of their debt issues to investors. Additionally, MIS earns revenue from certainnon-ratings-related operations which consist primarily of financial instrument pricing services in the Asia-Pacific region as well as revenue from ICRA’snon-ratings operations. The revenue from these operations is included in the MIS Other LOB and is not material to the results of the MIS segment.
The MA segment develops a wide range of products and services that support financial analysis and risk management activities of institutional participants in global financial markets. Within its RD&A business, MA distributes research and data developed by MIS as part of its ratings process, includingin-depth research on major debt issuers, industry studies and commentary on topical credit-related events. The RD&A business also produces economic research and data and analytical tools such as quantitative credit risk scores as well as business intelligence and company information products. Within its ERS business, MA provides software solutions as well as related risk management services. The PS business provides offshore analytical and research services along with financial training and certification programs.
Certain reclassifications have been made to prior period amounts to conform to the current presentation.
Adoption of New Accounting Standard
In the first quarter of 2017, the Company adopted ASUNo. 2016-09 “Improvements to Employee Share-Based Payment Accounting”. As required by ASU2016-09, Excess Tax Benefits or shortfalls recognized on stock-based compensation are reflected in the consolidated statement of operations as a component of the provision for income taxes on a prospective basis. Prior to the adoption of this ASU, Excess Tax Benefits and shortfalls were recorded to capital surplus within shareholders’ deficit. The impact of this adoption was a $39.5 million benefit to the provision for income taxes for the year end December 31, 2017.
Additionally, in accordance with this ASU, Excess Tax Benefits or shortfalls recognized on stock-based compensation are classified as operating cash flows in the consolidated statement of cash flows, and the Company has applied this provision on a retrospective basis. Under previous accounting guidance, the Excess Tax Benefits or shortfalls were shown as a reduction to operating activity and an increase to financing activity. Furthermore, the Company has elected to continue to estimate the number of stock-based awards expected to vest, rather than accounting for award forfeitures as they occur, to determine the amount of stock-based compensation cost recognized in each period. The impact to the Company’s statement of cash flows for prior year relating to the adoption of this provision of the ASU is set forth in the table below:
| | | | | | | | | | | | | | | | | | | | | | | | |
| | | As reported
December 31, 2016 | | | Reclassification | | | December 31, 2016
as adjusted | | | As reported
December 31,
2015 | | | Reclassification | | | December 31, 2015
as adjusted | |
| Net cash provided by operating activities | | $ | 1,226.1 | | | $ | 33.1 | | | $ | 1,259.2 | | | $ | 1,153.6 | | | $ | 44.5 | | | $ | 1,198.1 | |
| Net cash used in financing activities | | $ | (1,009.8 | ) | | $ | (33.1 | ) | | $ | (1,042.9 | ) | | $ | (461.0 | ) | | $ | (44.5 | ) | | $ | (505.5 | ) |
NOTE 2 | SUMMARY OF SIGNIFICANT ACCOUNTING POLICIES |
Basis of Consolidation
The consolidated financial statements include those of Moody’s Corporation and its majority- and wholly-owned subsidiaries. The effects of all intercompany transactions have been eliminated. Investments in companies for which the Company has significant influ-
ence over operating and financial policies but not a controlling interest are accounted for on an equity basis whereby the Company records its proportional share of the investment’s net income or loss as part of othernon-operating income (expense), net and any dividends received reduce the carrying amount of the investment. The Company applies the guidelines set forth in Topic 810 of the ASC in assessing its interests in variable interest entities to decide whether to consolidate that entity. The Company has reviewed the potential variable interest entities and determined that there are no consolidation requirements under Topic 810 of the ASC. The Company consolidates its ICRA subsidiaries on a three month lag.
Cash and Cash Equivalents
Cash equivalents principally consist of investments in money market mutual funds and money market deposit accounts as well as high-grade commercial paper and certificates of deposit with maturities of three months or less when purchased.
Short-term Investments
Short-term investments are securities with maturities greater than 90 days at the time of purchase that are available for operations in the next 12 months. The Company’s short-term investments primarily consist of certificates of deposit and their cost approximates fair value due to the short-term nature of the instruments. Interest and dividends on these investments are recorded into income when earned.
Property and Equipment
Property and equipment are stated at cost and are depreciated using the straight-line method over their estimated useful lives. Expenditures for maintenance and repairs that do not extend the economic useful life of the related assets are charged to expense as incurred.
Research and Development Costs
All research and development costs are expensed as incurred. These costs primarily reflect the development of credit processing software and quantitative credit risk assessment products sold by the MA segment.
Research and development costs were $42.0 million, $40.1 million, and $29.1 million for the years ended December 31, 2017, 2016 and 2015, respectively, and are included in operating expenses within the Company’s consolidated statements of operations. These costs generally consist of professional services provided by third parties and compensation costs of employees.
Costs for internally developed computer software that will be sold, leased or otherwise marketed are capitalized when technological feasibility has been established. These costs primarily relate to the development or enhancement of products in the ERS business and generally consist of professional services provided by third parties and compensation costs of employees that develop the software. Judgment is required in determining when technological feasibility of a product is established and the Company believes that technological feasibility for its software products is reached after all high-risk development issues have been resolved through coding and testing. Generally, this occurs shortly before the products are released to customers. Accordingly, costs for internally developed computer software that will be sold, leased or otherwise marketed that were eligible for capitalization under Topic 985 of the ASC were immaterial for the years ended December 31, 2017, 2016 and 2015.
Computer Software Developed or Obtained for Internal Use
The Company capitalizes costs related to software developed or obtained for internal use. These assets, included in property and equipment in the consolidated balance sheets, relate to the Company’s financial, website and other systems. Such costs generally consist of direct costs for third-party license fees, professional services provided by third parties and employee compensation, in each case incurred either during the application development stage or in connection with upgrades and enhancements that increase functionality. Such costs are depreciated over their estimated useful lives on a straight-line basis. Costs incurred during the preliminary project stage of development as well as maintenance costs are expensed as incurred.
Long-Lived Assets, Including Goodwill and Other Acquired Intangible Assets
Moody’s evaluates its goodwill for impairment at the reporting unit level, defined as an operating segment or one level below an operating segment, annually as of July 31 or more frequently if impairment indicators arise in accordance with ASC Topic 350.
The Company evaluates the recoverability of goodwill using atwo-step impairment test approach at the reporting unit level. In the first step, the Company assesses various qualitative factors to determine whether the fair value of a reporting unit may be less than its carrying amount. If a determination is made that, based on the qualitative factors, an impairment does not exist, the Company is not required to perform further testing. If the aforementioned qualitative assessment results in the Company concluding that it is more likely than not that the fair value of a reporting unit may be less than its carrying amount, the fair value of the reporting unit will be determined and compared to its carrying value including goodwill. If the fair value of the reporting unit exceeds the carrying value of the net assets assigned to that unit, goodwill is not impaired and the Company is not required to perform further testing. If the fair value of the reporting unit is less than the carrying value, the Company will recognize the difference as an impairment charge.
The Company evaluates its reporting units for impairment on an annual basis, or more frequently if there are changes in the reporting structure of the Company due to acquisitions or realignments or if there are indicators of potential impairment. For the reporting units
where the Company is consistently able to conclude that an impairment does not exist using only a qualitative approach, the Company’s accounting policy is to perform the second step of the aforementioned goodwill impairment assessment at least once every three years. Goodwill is assigned to a reporting unit at the date when an acquisition is integrated into one of the established reporting units, and is based on which reporting unit is expected to benefit from the synergies of the acquisition.
For purposes of assessing the recoverability of goodwill, the Company has seven primary reporting units at December 31, 2017: two within the Company’s ratings business (one for the ICRA business and one that encompasses all of Moody’s other ratings operations) and five reporting units within MA: RD&A, ERS, FSTC, MAKS and Bureau van Dijk. The RD&A reporting unit encompasses the distribution of investor-oriented research and data developed by MIS as part of its ratings process,in-depth research on major debt issuers, industry studies, economic research and commentary on topical events and credit analytic tools. The ERS reporting unit consists of credit risk management and compliance software that is sold on a license or subscription basis as well as related advisory services for implementation and maintenance. The FSTC reporting unit consists of the portion of the MA business that offers both credit training as well as other professional development training and certification services. The MAKS reporting unit consists of offshore research and analytical services. The Bureau van Dijk reporting unit consists of business intelligence and company information products.
Amortizable intangible assets are reviewed for recoverability whenever events or changes in circumstances indicate that the carrying amount may not be recoverable.
Rent Expense
The Company records rent expense on a straight-line basis over the life of the lease. In cases where there is a free rent period or future fixed rent escalations the Company will record a deferred rent liability. Additionally, the receipt of any lease incentives will be recorded as a deferred rent liability which will be amortized over the lease term as a reduction of rent expense.
Stock-Based Compensation
The Company records compensation expense for all share-based payment award transactions granted to employees based on the fair value of the equity instrument at the time of grant. This includes shares issued under stock option and restricted stock plans. The accounting for Excess Tax Benefits or shortfalls on stock-based compensation is more fully discussed in Note 1.
Derivative Instruments and Hedging Activities
Based on the Company’s risk management policy, from time to time the Company may use derivative financial instruments to reduce exposure to changes in foreign exchange rates and interest rates. The Company does not enter into derivative financial instruments for speculative purposes. All derivative financial instruments are recorded on the balance sheet at their respective fair values. The changes in the value of derivatives that qualify as fair value hedges are recorded with a corresponding adjustment to the carrying value of the item being hedged. Changes in the derivative’s fair value that qualify as cash flow hedges are recorded to other comprehensive income or loss, to the extent the hedge is effective, and such amounts are reclassified from accumulated other comprehensive income or loss to earnings in the same period or periods during which the hedged transaction affects income. Changes in the derivative’s fair value that qualify as net investment hedges are recorded to other comprehensive income or loss, to the extent the hedge is effective. Any changes in the fair value of derivatives that the Company does not designate as hedging instruments under Topic 815 of the ASC are recorded in the consolidated statements of operations in the period in which they occur.
Revenue Recognition
Revenue is recognized when persuasive evidence of an arrangement exists, delivery has occurred or the services have been provided and accepted by the customer when applicable, fees are determinable and the collection of resulting receivables is considered probable.
Pursuant to ASC Topic 605, when a sales arrangement contains multiple deliverables, the Company allocates revenue to each deliverable based on its relative selling price which is determined based on its vendor specific objective evidence if available, third party evidence if VSOE is not available, or estimated selling price if neither VSOE nor TPE is available.
The Company’s products and services will generally qualify as separate units of accounting under ASC Topic 605. The Company evaluates each deliverable in an arrangement to determine whether it represents a separate unit of accounting. A deliverable constitutes a separate unit of accounting when it has stand-alone value to the customers and if the arrangement includes a customer refund or return right relative to the delivered item and the delivery and performance of the undelivered item is considered probable and substantially in the Company’s control. In instances where the aforementioned criteria are not met, the deliverable is combined with the undelivered items and revenue recognition is determined as one single unit.
The Company determines whether its selling price in a multi-element transaction meets the VSOE criteria by using the price charged for a deliverable when sold separately or, if the deliverable is not yet being sold separately, the price established by management having the relevant authority to establish such a price. In instances where the Company is not able to establish VSOE for all deliverables in a multiple element arrangement, which may be due to the Company infrequently selling each element separately, not selling products
within a reasonably narrow price range, or only having a limited sales history, the Company attempts to establish TPE for deliverables. The Company determines whether TPE exists by evaluating largely similar and interchangeable competitor products or services in standalone sales to similarly situated customers. However, due to the difficulty in obtaining third party pricing, possible differences in its market strategy from that of its peers and the potential that products and services offered by the Company may contain a significant level of differentiation and/or customization such that the comparable pricing of products with similar functionality cannot be obtained, the Company generally is unable to reliably determine TPE. Based on the selling price hierarchy established by ASC Topic 605, when the Company is unable to establish selling price using VSOE or TPE, the Company will establish an ESP. ESP is the price at which the Company would transact a sale if the product or service were sold on a stand-alone basis. The Company establishes its best estimate of ESP considering internal factors relevant to is pricing practices such as costs and margin objectives, standalone sales prices of similar products, percentage of the fee charged for a primary product or service relative to a related product or service, and customer segment and geography. Additional consideration is also given to market conditions such as competitor pricing strategies and market trend. The Company reviews its determination of VSOE, TPE and ESP on an annual basis or more frequently as needed.
In the MIS segment, revenue attributed to initial ratings of issued securities is recognized when the rating is delivered to the issuer. Revenue attributed to monitoring of issuers or issued securities is recognized ratably over the period in which the monitoring is performed, generally one year. In the case of commercial mortgage-backed securities, structured credit, international residential mortgage-backed and asset-backed securities, issuers can elect to pay the monitoring fees upfront. These fees are deferred and recognized over the future monitoring periods based on the expected lives of the rated securities, which was approximately 24 years on a weighted average basis at December 31, 2017. At December 31, 2017, 2016 and 2015, deferred revenue related to these securities was approximately $140.1 million, $133.0 million, and $121.0 million, respectively.
Multiple element revenue arrangements in the MIS segment are generally comprised of an initial rating and the related monitoring service. In instances where monitoring fees are not charged for the first year monitoring effort, fees are allocated to the initial rating and monitoring services based on the relative selling price of each service to the total arrangement fees. The Company generally uses ESP in determining the selling price for its initial ratings as the Company rarely provides initial ratings separately without providing related monitoring services and thus is unable to establish VSOE or TPE for initial ratings.
MIS estimates revenue for ratings of commercial paper for which, in addition to a fixed annual monitoring fee, issuers are billed quarterly based on amounts outstanding. Revenue is accrued each quarter based on estimated amounts outstanding and is billed when actual data is available. The estimate is determined based on the issuers’ most recent reported quarterly data. At December 31, 2017, 2016 and 2015, accounts receivable included approximately $27.0 million, $25.0 million, and $24.0 million, respectively, related to accrued commercial paper revenue. Historically, MIS has not had material differences between the estimated revenue and the actual billings. Furthermore, for certain annual monitoring services, fees are not invoiced until the end of the annual monitoring period and revenue is accrued ratably over the monitoring period. At December 31, 2017, 2016, and 2015, accounts receivable included approximately $185.0 million, $159.1 million, and $146.4 million, respectively, relating to accrued annual monitoring service revenue.
In the MA segment, products and services offered by the Company include software licenses and related maintenance, subscriptions, and professional services. Revenue from subscription-based products, such as research and data subscriptions and certain software-based credit risk management subscription products, is recognized ratably over the related subscription period, which is principally one year. Revenue from sale of perpetual licenses of credit processing software is generally recognized at the time the product master or first copy is delivered or transferred to and accepted by the customer. If uncertainty exists regarding customer acceptance of the product or service, revenue is not recognized until acceptance occurs. Software maintenance revenue is recognized ratably over the annual maintenance period. Revenue from professional services rendered is generally recognized as the services are performed. A large portion of annual research and data subscriptions and annual software maintenance are invoiced in the months of November, December and January.
Products and services offered within the MA segment are sold either stand-alone or together in various combinations. In instances where a multiple element arrangement includes software andnon-software deliverables, revenue is allocated to thenon-software deliverables and to the software deliverables, as a group, using the relative selling prices of each of the deliverables in the arrangement based on the aforementioned selling price hierarchy. Revenue is recognized for each element based upon the conditions for revenue recognition noted above.
If the arrangement contains more than one software deliverable, the arrangement consideration allocated to the software deliverables as a group is allocated to each software deliverable using VSOE. In the instances where the Company is not able to determine VSOE for all of the deliverables of an arrangement, the Company allocates the revenue to the undelivered elements equal to its VSOE and the residual revenue to the delivered elements. If the Company is unable to determine VSOE for an undelivered element, the Company defers all revenue allocated to the software deliverables until the Company has delivered all of the elements or when VSOE has been determined for the undelivered elements. In cases where software implementation services are considered essential and VSOE of fair value exists for post-contract customer support (“PCS”), once the delivery criteria has been met on the standard software, license and service revenue is recognized on apercentage-of-completion basis as implementation services are performed, while PCS is recognized
over the coverage period. If VSOE of fair value does not exist for PCS, once the delivery criteria has been met on the standard software, service revenue is recognized on a zero profit margin basis until essential services are complete, at which point total remaining arrangement revenue is then spread ratably over the remaining PCS coverage period. If VSOE does not exist for PCS at the beginning of an arrangement but is established during implementation, revenue not recognized due to the absence of VSOE will be recognized on a cumulative basis.
Accounts Receivable Allowances
Moody’s records an allowance for estimated future adjustments to customer billings as a reduction of revenue, based on historical experience and current conditions. Such amounts are reflected as additions to the accounts receivable allowance. Additionally, estimates of uncollectible accounts are recorded as bad debt expense and are reflected as additions to the accounts receivable allowance. Actual billing adjustments and uncollectible account write-offs are recorded against the allowance. Moody’s evaluates its accounts receivable allowance by reviewing and assessing historical collection and adjustment experience and the current status of customer accounts. Moody’s also considers the economic environment of the customers, both from an industry and geographic perspective, in evaluating the need for allowances. Based on its analysis, Moody’s adjusts its allowance as considered appropriate in the circumstances.
Contingencies
Moody’s is involved in legal and tax proceedings, governmental, regulatory and legislative investigations and inquiries, claims and litigation that are incidental to the Company’s business, including claims based on ratings assigned by MIS. Moody’s is also subject to ongoing tax audits in the normal course of business. Management periodically assesses the Company’s liabilities and contingencies in connection with these matters based upon the latest information available. Moody’s discloses material pending legal proceedings pursuant to SEC rules and other pending matters as it may determine to be appropriate.
For claims, litigation and proceedings and governmental investigations and inquires not related to income taxes, where it is both probable that a liability has been incurred and the amount of loss can be reasonably estimated, the Company records liabilities in the consolidated financial statements and periodically adjusts these as appropriate. When the reasonable estimate of the loss is within a range of amounts, the minimum amount of the range is accrued unless some higher amount within the range is a better estimate than another amount within the range. In other instances, where a loss is reasonably possible, management may not record a liability because of uncertainties related to the probable outcome and/or the amount or range of loss, but discloses the contingency if significant. As additional information becomes available, the Company adjusts its assessments and estimates of such matters accordingly. In view of the inherent difficulty of predicting the outcome of litigation, regulatory, governmental investigations and inquiries, enforcement and similar matters, particularly where the claimants seek large or indeterminate damages or where the parties assert novel legal theories or the matters involve a large number of parties, the Company cannot predict what the eventual outcome of the pending matters will be or the timing of any resolution of such matters. The Company also cannot predict the impact (if any) that any such matters may have on how its business is conducted, on its competitive position or on its financial position, results of operations or cash flows. As the process to resolve any pending matters progresses, management will continue to review the latest information available and assess its ability to predict the outcome of such matters and the effects, if any, on its operations and financial condition. However, in light of the large or indeterminate damages sought in some of them, the absence of similar court rulings on the theories of law asserted and uncertainties regarding apportionment of any potential damages, an estimate of the range of possible losses cannot be made at this time.
The Company’s wholly-owned insurance subsidiary insures the Company against certain risks including but not limited to deductibles for worker’s compensation, employment practices litigation and employee medical claims and terrorism, for which the claims are not material to the Company. In addition, for claim years 2008 and 2009, the insurance subsidiary insured the Company for defense costs related to professional liability claims. For matters insured by the Company’s insurance subsidiary, Moody’s records liabilities based on the estimated total claims expected to be paid and total projected costs to defend a claim through its anticipated conclusion. The Company determines liabilities based on an assessment of management’s best estimate of claims to be paid and legal defense costs as well as actuarially determined estimates. Defense costs for matters not self-insured by the Company’s wholly-owned insurance subsidiary are expensed as services are provided.
For income tax matters, the Company employs the prescribed methodology of Topic 740 of the ASC which requires a company to first determine whether it ismore-likely-than-not (defined as a likelihood of more than fifty percent) that a tax position will be sustained based on its technical merits as of the reporting date, assuming that taxing authorities will examine the position and have full knowledge of all relevant information. A tax position that meets thismore-likely-than-not threshold is then measured and recognized at the largest amount of benefit that is greater than fifty percent likely to be realized upon effective settlement with a taxing authority.
Operating Expenses
Operating expenses include costs associated with the development and production of the Company’s products and services and their delivery to customers. These expenses principally include employee compensation and benefits and travel costs that are incurred in
connection with these activities. Operating expenses are charged to income as incurred, except for certain costs related to software implementation services which may be deferred until related revenue is recognized. Additionally, certain costs incurred to develop internal use software are capitalized and depreciated over their estimated useful life.
Selling, General and Administrative Expenses
SG&A expenses include such items as compensation and benefits for corporate officers and staff and compensation and other expenses related to sales. They also include items such as office rent, business insurance, professional fees and gains and losses from sales and disposals of assets. SG&A expenses are charged to income as incurred, except for certain expenses incurred to develop internal use software (which are capitalized and depreciated over their estimated useful life) and the deferral of sales commissions in the MA segment (which are recognized in the period in which the related revenue is recognized).
Foreign Currency Translation
For all operations outside the U.S. where the Company has designated the local currency as the functional currency, assets and liabilities are translated into U.S. dollars using end of year exchange rates, and revenue and expenses are translated using average exchange rates for the year. For these foreign operations, currency translation adjustments are recorded to other comprehensive income.
Comprehensive Income
Comprehensive income represents the change in net assets of a business enterprise during a period due to transactions and other events and circumstances fromnon-owner sources including foreign currency translation impacts, net actuarial losses and net prior service costs related to pension and other retirement plans, gains and losses on derivative instruments designated as net investment hedges or cash flow hedges and unrealized gains and losses on securities designated as‘available-for-sale’ under Topic 320 of the ASC. Comprehensive income items, including cumulative translation adjustments of entities that are less-than-wholly-owned subsidiaries, will be reclassified to noncontrolling interests and thereby, adjusting accumulated other comprehensive income proportionately in accordance with the percentage of ownership interest of the NCI shareholder.
Income Taxes
The Company accounts for income taxes under the asset and liability method in accordance with ASC Topic 740. Therefore, income tax expense is based on reported income before income taxes and deferred income taxes reflect the effect of temporary differences between the amounts of assets and liabilities that are recognized for financial reporting purposes and the amounts that are recognized for income tax purposes. On January 1, 2017, the Company adopted ASUNo. 2016-16, “ Accounting for Income Taxes, Intra-Entity Asset Transfers of Assets Other than Inventory. Under previous guidance, the tax effects of intra-entity asset transfers (intercompany sales) were deferred until the transferred asset was sold to a third party or otherwise recovered through use. The new guidance eliminates the exception for all intra-entity sales of assets other than inventory. Upon adoption, a $4.6 million cumulative-effect adjustment was recorded in retained earnings as of the beginning of the period of adoption.
The Company classifies interest related to unrecognized tax benefits as a component of interest expense in its consolidated statements of operations. Penalties are recognized in othernon-operating expenses. For uncertain tax positions (“UTPs”), the Company first determines whether it ismore-likely-than-not (defined as a likelihood of more than fifty percent) that a tax position will be sustained based on its technical merits as of the reporting date, assuming that taxing authorities will examine the position and have full knowledge of all relevant information. A tax position that meets thismore-likely-than-not threshold is then measured and recognized at the largest amount of benefit that is greater than fifty percent likely to be realized upon effective settlement with a taxing authority.
On December 22, 2017, the Tax Act was signed into law, resulting in all previously undistributed foreign earnings being subject to U.S. tax. However, the Company currently intends to continue to indefinitely reinvest these earnings outside the U.S. The Company has not provided non-U.S. deferred income taxes on these indefinitely reinvested earnings. It is not practicable to determine the amount of non-U.S. deferred taxes that might be required to be provided if such earnings were distributed in the future, due to complexities in the tax laws and in the hypothetical calculations that would have to be made.
Fair Value of Financial Instruments
The Company’s financial instruments include cash, cash equivalents, trade receivables and payables, all of which are short-term in nature and, accordingly, approximate fair value. Additionally, the Company invests in certain short-term investments consisting primarily of certificates of deposit that are carried at cost, which approximates fair value due to their short-term maturities.
The Company also has certain investments in closed-ended and open-ended mutual funds in India which are designated as ‘available for sale’ under Topic 320 of the ASC. Accordingly, unrealized gains and losses on these investments are recorded to other comprehensive income and are reclassified out of accumulated other comprehensive income to the statement of operations when the investment matures or is sold using a specific identification method.
Also, the Company uses derivative instruments, as further described in Note 5, to manage certain financial exposures that occur in the normal course of business. These derivative instruments are carried at fair value on the Company’s consolidated balance sheets.
Fair value is defined by the ASC as the price that would be received from selling an asset or paid to transfer a liability (i.e., an exit price) in an orderly transaction between market participants at the measurement date. The determination of this fair value is based on the principal or most advantageous market in which the Company could commence transactions and considers assumptions that market participants would use when pricing the asset or liability, such as inherent risk, transfer restrictions and risk of nonperformance. Also, determination of fair value assumes that market participants will consider the highest and best use of the asset.
The ASC establishes a fair value hierarchy whereby the inputs contained in valuation techniques used to measure fair value are categorized into three broad levels as follows:
Level 1: quoted market prices in active markets that the reporting entity has the ability to access at the date of the fair value measurement;
Level 2: inputs other than quoted market prices described in Level 1 that are observable for the asset or liability, either directly or indirectly, such as quoted prices in active markets for similar assets or liabilities, quoted prices for identical or similar assets or liabilities in markets that are not active or other inputs that are observable or can be corroborated by observable market data for substantially the full term of the assets or liabilities;
Level 3: unobservable inputs that are supported by little or no market activity and that are significant to the fair value measurement of the assets or liabilities.
Concentration of Credit Risk
Financial instruments that potentially subject the Company to concentration of credit risk principally consist of cash and cash equivalents, short-term investments, trade receivables and derivatives.
The Company manages its credit risk exposure by allocating its cash equivalents among various money market mutual funds, money market deposit accounts, certificates of deposits and high-grade commercial paper. Short-term investments primarily consist of certificates of deposit as of December 31, 2017 and 2016. The Company manages its credit risk exposure on cash equivalents and short-term investments by limiting the amount it can invest with any single entity. No customer accounted for 10% or more of accounts receivable at December 31, 2017 or 2016.
Earnings (Loss) per Share of Common Stock
Basic shares outstanding is calculated based on the weighted average number of shares of common stock outstanding during the reporting period. Diluted shares outstanding is calculated giving effect to all potentially dilutive common shares, assuming that such shares were outstanding and dilutive during the reporting period.
Pension and Other Retirement Benefits
Moody’s maintains various noncontributory DBPPs as well as other contributory and noncontributory retirement plans. The expense and assets/liabilities that the Company reports for its pension and other retirement benefits are dependent on many assumptions concerning the outcome of future events and circumstances. These assumptions represent the Company’s best estimates and may vary by plan. The differences between the assumptions for the expected long-term rate of return on plan assets and actual experience is spread over a five-year period to the market-related value of plan assets which is used in determining the expected return on assets component of annual pension expense. All other actuarial gains and losses are generally deferred and amortized over the estimated average future working life of active plan participants.
The Company recognizes as an asset or liability in its consolidated balance sheet the funded status of its defined benefit retirement plans, measured on aplan-by-plan basis. Changes in the funded status due to actuarial gains/losses are recorded as part of other comprehensive income during the period the changes occur.
Use of Estimates
The preparation of financial statements in conformity with GAAP requires management to make estimates and assumptions that affect the reported amounts of assets and liabilities, the disclosure of contingent assets and liabilities at the date of the financial statements, and the reported amounts of revenue and expenses during the period. Actual results could differ from those estimates. Estimates are used for, but not limited to, revenue recognition, accounts receivable allowances, income taxes, contingencies, valuation and useful lives of long-lived and intangible assets, goodwill, pension and other retirement benefits, stock-based compensation, and depreciable lives for property and equipment and computer software.
Recently Issued Accounting Pronouncements
In May 2014, the FASB issuedASU No. 2014-09, “Revenue from Contracts with Customers (Topic 606)”. This ASU outlines a comprehensive new revenue recognition model that requires a company to recognize revenue to depict the transfer of goods or services to a customer at an amount that reflects the consideration it expects to receive in exchange for those goods or services by performing a five-step process. In August 2015, the FASB issuedASU No. 2015-14 “Revenue from Contracts with Customers (Topic 606), Deferral of
the Effective Date” which defers the effective date of the ASU for annual and interim reporting periods beginning after December 15, 2017, with early adoption permitted up to the original effective date of December 15, 2016. In addition, during 2016, the FASB issued additional updates clarifying the implementation guidance for the new revenue recognition standard.
The Company will adopt the new revenue guidance as of January 1, 2018 using the modified retrospective transition method. Under this adoption method, the Company will record a cumulative adjustment to retained earnings at January 1, 2018 and apply the provisions of the ASU prospectively. As of the date of this filing, the Company has made a full assessment of the changes to its accounting policies relating to the adoption of the new revenue accounting standard. This ASU will have an impact on, which is not limited to: i) the accounting for certain software subscription revenue in MA whereby the license rights within the arrangement will be recognized at the inception of the contract based on estimated stand-alone selling price with the remainder recognized over the subscription period (compared to ASC 605 whereby all software subscription revenue is currently recognized over the subscription period); ii) the accounting for certain ERS and ESA revenue arrangements where VSOE is not currently available under ASC 605 will result in the acceleration of revenue recognition (compared to ASC 605 whereby revenue is currently deferred due to lack of VSOE until all elements without VSOE have been delivered); iii) the capitalization and related amortization period for sales commissions, which are incurred in the MA segment; iv) the expensing of software implementation project costs to fulfill a contract for its ERS and ESA businesses which under ASC 605 were capitalized and expensed when related project revenue was recognized; v) the capitalization of work-in-process costsfor in-progress MIS ratings at the end of each reporting period; and vi) the timing of when fees for certain MIS ratings products are recognized to match when the performance obligation to the customer is satisfied and the determination of the transaction price to account for variable consideration at contract inception. This ASU will also require new comprehensive disclosures about contracts with customers including the significant reasonable judgments the Company has made when applying the ASU.
The Company is in the process of finalizing the implementation of a software solution in order to support the accounting under the new standard for MA revenue arrangements with multiple performance obligations.
Under this adoption method, the Company will record a cumulativenon-cash adjustment to retained earnings at January 1, 2018 and apply the provisions of the ASU prospectively. The table below reflects an approximation of anticipated impacts to January 1, 2018 retained earnings for each type of adjustment required under the new revenue standard based on the Company’s assessment and best estimates to date.
| | |
Transition adjustment
| | Estimated benefit to / (reduction of) January 1, 2018 Retained Earnings
|
Recognition of MA deferred revenue(1) | | Approximately $105 million
|
Increase to capitalized MA sales commissions(2) | | Approximately $76 million
|
Capitalization ofwork-in-process forin-progress ratings | | Approximately $9 million
|
Net impact of all other adjustments | | Approximately $4 million
|
Net increase in tax liability on the above | | (Approximately $45 million)
|
Total anticipatedpost-tax adjustment | | Approximately $149 million
|
(1) | Represents anticipated deferred revenue as of December 31, 2017 that would have been recognized as revenue in 2017 or earlier if the new standard was then in effect. The transition adjustment will continue to be refined as the Company finalizes its implementation of the aforementioned software solution. |
(2) | Pending finalization of the final fourth quarter MA sales commission payout to be made during the first quarter. |
Note that the above range of expected impacts from adopting the new revenue standard pertains solely to the impact to retained earnings as of January 1, 2018 on the Company’s consolidated balance sheet, and is not indicative of the impact the new ASU is expected to have on the Company’s consolidated statement of operations post-adoption. The impact that the provisions of the new ASU will have on the consolidated statement of operations subsequent to adoption will depend heavily on the volume and impact of new sales contracts realized in future periods, particularly in the ERS and ESA businesses. The Company does not have any material software implementation arrangements in progress as of December 31, 2017 with terms longer than two years, and therefore the impact to the consolidated statement of operations under the provisions of the new standard will be dependent on each future period’s sales activity. Generally, however, the Company does not anticipate that applying the provisions of the new standard will have a material impact to its 2018 consolidated Net Income. However, there could be quarterly fluctuations in the financial results of both MIS and MA, or there could be increases or decreases in revenues and expenses which would largely offset and not be material at a total Company level for the full year. Furthermore, as part of the disclosure requirements in the first year of adoption, there will be disclosures of the Company’s consolidated statement of operations for 2018 as if the new revenue standard was not adopted and the Company continued to account for revenue and related transactions under the existing standards. Importantly, the application of this new guidance has no effect on the cash the Company expects to receive nor on the economics of the business, but rather affects the timing of revenue and expense recognition with the expectation that revenue recognition will more closely align with cash received.
In January 2016, the FASB issuedASU No. 2016-01 “Financial Instruments—Overall(Subtopic 825-10), Recognition and Measurement of Financial Assets and Financial Liabilities”. The amendments in this ASU update various aspects of recognition, measurement, presentation and disclosures relating to financial instruments. This ASU is effective for fiscal years beginning after December 15, 2017. The
Company has determined that the most pertinent impact to its financial statements upon the adoption of this ASU will relate to the discontinuance ofthe available-for-sale classification for investments in equity securities (unrealized gains and losses were recorded through OCI). Accordingly, subsequent to adoption of this ASU, changes in the fair value of equity securities held by the Company will be recorded through earnings. The Company does not expect the adoption of this ASU to have a material impact on its financial statements.
In February 2016, the FASB issuedASU No. 2016-02, “Leases (Topic 842)” requiring lessees to recognizea right-of-use asset and lease liability for all leases with terms of more than 12 months. Recognition, measurement and presentation of expenses and cash flows will depend on classification as either a finance or operating lease. This ASU is effective for fiscal years beginning after December 15, 2018, with early adoption permitted. This standard must be adopted using a modified retrospective approach whereby leases will be presented in accordance with the new standard as of the earliest period presented. The Company is currently evaluating the impact of this ASU on the Company’s financial statements. The Company believes that the most notable impact to its financial statements upon the adoption of this ASU will be the recognition of amaterial right-of-use asset and lease liability for its real estate leases.
In June 2016, the FASB issuedASU No. 2016-13, “Financial Instruments—Credit Losses (Topic 326), Measurement of Credit Losses on Financial Instruments”. The amendments in this ASU require the use of an “expected credit loss” impairment model for most financial assets reported at amortized cost which will require entities to estimate expected credit losses over the lifetime of the instrument. This may result in the earlier recognition of allowances for losses.For available-for-sale debt securities with unrealized losses, an allowance for credit losses will be recognized as a contra account to the amortized cost carrying value of the asset rather than a direct reduction to the carrying value, with changes in the allowance impacting earnings. This ASU is effective for annual and interim reporting periods beginning after December 15, 2019, with early adoption permitted in annual and interim reporting periods beginning after December 15, 2018. Entities will apply the standard’s provisions as a cumulative-effect adjustment to retained earnings as of the beginning of the first effective reporting period. The Company is currently evaluating the impact of this ASU on its financial statements. Currently, the Company believes that the most notable impact of this ASU will relate to its processes around the assessment of the adequacy of its allowance for doubtful accounts on accounts receivable.
In August 2016, the FASB issuedASU No. 2016-15, “Statement of Cash Flows (Topic 230), Classification of Certain Cash Receipts and Cash Payments”. This ASU adds or clarifies guidance on the classification of certain cash receipts and payments in the statement of cash flows with the intent to alleviate diversity in practice for classifying various types of cash flows. This ASU is effective for annual and interim reporting periods beginning after December 15, 2017. The Company will apply this clarification guidance in its statements of cash flows upon adoption.
In January 2017, the FASB issuedASU No. 2017-01, “Business Combinations (Topic 805), Clarifying the Definition of a Business”. This ASU clarifies the definition of a business with the objective of adding guidance to assist entities with evaluating whether transactions should be accounted for as acquisitions (or disposals) of assets or businesses. This ASU is effective for annual and interim reporting periods beginning after December 15, 2017 and should be applied prospectively. Upon adoption, the Company will apply the guidance in this ASU when evaluating whether acquired assets and activities constitute a business.
In March 2017, the FASB issuedASU No. 2017-07, “Compensation—Retirement Benefits (Topic 715), Improving the Presentation of Net Periodic Pension Cost and Net Periodic Postretirement Benefit Cost”. This ASU impacts the presentation of net periodic pension costs in the statement of operations. Entities will be required to report the service cost component in the same line item or items as other compensation costs (either Operating or SG&A in Moody’s statement of operations). The other components of net benefit cost are required to be presented in the statement of operations separately from the service cost component and outside of operating income. The ASU permits only the service cost component of net periodic pension cost to be eligible for capitalization, when applicable. This ASU is effective for annual and interim reporting periods beginning after December 15, 2017. Upon adoption, the Company will bifurcate its net periodic pension costs reported in its statements of operations in accordance with this ASU.
In May 2017, the FASB issuedASU No. 2017-09, “Compensation—Stock Compensation (Topic 718), Scope of Modification Accounting”. This ASU clarifies when changes to the terms or conditions of a share-based payment award must be accounted for as modifications. Under this ASU, an entity will not apply modification accounting to a share-based payment award if the award’s fair value, vesting conditions and classification as an equity or liability instrument are the same immediately before and after the change. The new guidance will reduce diversity in practice and result in fewer changes to the terms of an award being accounted for as modifications. This ASU is effective for annual and interim reporting periods beginning after December 15, 2017 and should be applied prospectively to awards modified on or after the adoption date. The Company does not expect the adoption of this ASU to have a material impact on its financial statements.
In July 2017, the FASB issuedASU No. 2017-12, “Derivatives and Hedging (Topic 815): Targeted Improvements to Accounting for Hedging Activities”. This ASU enables entities to enhance transparency relating to risk management activities and simplifies the application of hedge accounting in certain circumstances. This ASU is effective for fiscal years beginning after December 15, 2018, including interim
periods within those years with early adoption permitted. The Company is currently in the process of assessing the impact that this ASU will have on its financial statements.
In December 2017, the SEC issued Staff Accounting Bulletin No. 118 (“SAB 118”) to address the application of U.S. GAAP in situations when a registrant does not have the necessary information available, prepared, or analyzed (including computations) in reasonable detail to finalize the calculations for the 2017 income tax effects of the Tax Act. SAB 118 provides entities with a one year measurement period from the December 22, 2017 enactment date, in order to complete the accounting for the effects of the Tax Act. Further information pertaining to the provisional estimates recorded by the Company as of and for the year ended December 31, 2017 are detailed in Note 15 to the consolidated financial statements.
In February 2018, FASB issued ASU2018-02, “Reclassification of Certain Tax Effects from Accumulated Other Comprehensive Income”. Under current GAAP, adjustments to deferred tax assets and liabilities related to a change in tax laws or rates are included in income from continuing operations, even in situations where the related items were originally recognized in OCI (commonly referred to as a “stranded tax effect”). The provisions of this ASU permit the reclassification of the stranded tax effect related to the Tax Act from AOCI to retained earnings. This ASU is effective for all entities for fiscal years beginning after December 15, 2018, and interim periods within those fiscal years, with early adoption permitted. Adoption of this ASU is to be applied either in the period of adoption or retrospectively to each period in which the effect of the Tax Act were recognized. The Company is currently evaluating the impact of this ASU on its financial statements.
NOTE 3 | RECONCILIATION OF WEIGHTED AVERAGE SHARES OUTSTANDING |
Below is a reconciliation of basic to diluted shares outstanding:
| | | | | | | | | | | | |
| | | Year Ended December 31, | |
| | | |
| | | 2017 | | | 2016 | | | 2015 | |
| Basic | | | 191.1 | | | | 192.7 | | | | 200.1 | |
| Dilutive effect of shares issuable under stock-based compensation plans | | | 3.1 | | | | 2.7 | | | | 3.3 | |
| | | | | | | | | | | | |
| Diluted | | | 194.2 | | | | 195.4 | | | | 203.4 | |
| | | | | | | | | | | | |
Antidilutive options to purchase common shares and restricted stock as well as contingently issuable restricted stock which are excluded from the table above | | | 0.6 | | | | 0.6 | | | | 0.7 | |
| | | | | | | | | | | | |
The calculation of diluted EPS requires certain assumptions regarding the use of both cash proceeds and assumed proceeds that would be received upon the exercise of stock options and vesting of restricted stock outstanding as of December 31, 2017, 2016 and 2015. The assumed proceeds in 2017 do not include Excess Tax Benefits pursuant to the prospective adoption of ASU2016-09 in the first quarter of 2017. The assumed proceeds in 2016 and 2015 include Excess Tax Benefits.
The decrease in the diluted shares outstanding primarily reflects treasury share repurchases under the Company’s Board authorized share repurchase program.
NOTE 4 | CASH EQUIVALENTS AND INVESTMENTS |
The table below provides additional information on the Company’s cash equivalents and investments:
| | | | | | | | | | | | | | | | | | | | | | | | |
| | | As of December 31, 2017 | |
| | | Cost | | | Gross
Unrealized
Gains | | | Fair Value | | | Balance sheet location | |
| | | | | | Cash and cash
equivalents | | | Short-term
investments | | | Other
assets | |
| Money market mutual funds | | $ | 42.2 | | | $ | — | | | $ | 42.2 | | | $ | 42.2 | | | $ | — | | | $ | — | |
| Certificates of deposit and money market deposit accounts (1) | | $ | 351.4 | | | $ | — | | | $ | 351.4 | | | $ | 238.6 | | | $ | 111.8 | | | $ | 1.0 | |
| Fixed maturity and open ended mutual funds(2) | | $ | 16.8 | | | $ | 4.3 | | | $ | 21.1 | | | $ | — | | | $ | — | | | $ | 21.1 | |
| |
| | | As of December 31, 2016 | |
| | | Cost | | | Gross
Unrealized
Gains | | | Fair Value | | | Balance sheet location | |
| | | | | | Cash and cash
equivalents | | | Short-term
investments | | | Other
assets | |
| Money market mutual funds | | $ | 189.0 | | | $ | — | | | $ | 189.0 | | | $ | 189.0 | | | $ | — | | | $ | — | |
| Certificates of deposit and money market deposit accounts (1) | | $ | 1,190.5 | | | $ | — | | | $ | 1,190.5 | | | $ | 1,017.0 | | | $ | 173.4 | | | $ | 0.1 | |
| Fixed maturity and open ended mutual funds(2) | | $ | 27.0 | | | $ | 5.6 | | | $ | 32.6 | | | $ | — | | | $ | — | | | $ | 32.6 | |
(1) | Consists of time deposits and money market deposit accounts. The remaining contractual maturities for the certificates of deposits classified as short-term investments were one to 12 months at December 31, 2017 and at December 31, 2016. The remaining contractual maturities for the certificates of deposits classified in other assets are 15 to 48 months at December 31, 2017 and 13 months to 15 months at December 31, 2016. Time deposits with a maturity of less than 90 days at time of purchase are classified as cash and cash equivalents. |
(2) | Consists of investments in fixed maturity mutual funds and open-ended mutual funds. The remaining contractual maturities for the fixed maturity instruments range from six months to seven months and six months to 19 months at December 31, 2017 and December 31,2016 respectively. |
The money market mutual funds as well as the fixed maturity and open ended mutual funds in the table above are deemed to be ‘available for sale’ under ASC Topic 320 and the fair value of these instruments is determined using Level 1 inputs as defined in the ASC.
NOTE 5 | DERIVATIVE INSTRUMENTS AND HEDGING ACTIVITIES |
The Company is exposed to global market risks, including risks from changes in FX rates and changes in interest rates. Accordingly, the Company uses derivatives in certain instances to manage the aforementioned financial exposures that occur in the normal course of business. The Company does not hold or issue derivatives for speculative purposes.
Derivatives andnon-derivative instruments designated as accounting hedges:
Interest Rate Swaps
The Company has entered into interest rate swaps to convert the fixed interest rate on certain of its long-term debt to a floating interest rate based on the3-month LIBOR. The purpose of these hedges is to mitigate the risk associated with changes in the fair value of the long-term debt, thus the Company has designated these swaps as fair value hedges. The fair value of the swaps is adjusted quarterly with a corresponding adjustment to the carrying value of the debt. The changes in the fair value of the swaps and the underlying hedged item generally offset and the net cash settlements on the swaps are recorded each period within interest expense, net in the Company’s consolidated statement of operations.
The following table summarizes the Company’s interest rate swaps designated as fair value hedges:
| | | | | | | | | | | | |
| | | Nature of Swap | | Notional Amount
As of December 31, | | | Floating Interest Rate |
Hedged Item | | | 2017 | | | 2016 | | |
| 2010 Senior Notes due 2020 | | Pay Floating/Receive Fixed | | | $500.0 | | | | $500.0 | | | 3-month LIBOR |
| 2014 Senior Notes due 2019 | | Pay Floating/Receive Fixed | | | $450.0 | | | | $450.0 | | | 3-month LIBOR |
| 2012 Senior Notes due 2022 | | Pay Floating/Receive Fixed | | | $80.0 | | | | $80.0 | | | 3-month LIBOR |
The following table summarizes the impact to the statement of operations of the Company’s interest rate swaps designated as fair value hedges:
| | | | | | | | | | | | | | |
| | | | | Amount of Income
Recognized in the Consolidated
Statements of Operations | |
| | | | | Year Ended December 31, | |
| | | | | 2017 | | | 2016 | | | 2015 | |
Derivatives Designated as Fair Value Accounting Hedges | | Location on Consolidated Statement of
Operations | | | | | | | | | | | | |
| Interest rate swaps | | Interest expense, net | | $ | 6.7 | | | $ | 11.2 | | | $ | 15.2 | |
Cross-currency swaps
In conjunction with the issuance of the 2015 Senior Notes, the Company entered into a cross-currency swap to exchange€100 million for U.S. dollars on the date of the settlement of the notes. The purpose of this cross-currency swap was to mitigate FX risk on the remaining principal balance on the 2015 Senior Notes that initially was not designated as a net investment hedge. Under the terms of the swap, the Company paid the counterparty interest on the $110.5 million received at 3.945% per annum and the counterparty paid the Company interest on the€100 million paid at 1.75% per annum. These interest payments were settled in March of each year, beginning in 2016, until either the maturity of the cross-currency swap in 2027 or upon early termination at the discretion of the Company. The principal payments on this cross currency swap were to be settled in 2027, concurrent with the repayment of the 2015 Senior Notes at maturity or upon early termination at the discretion of the Company. In March 2016, the Company designated these cross-currency swaps as cash flow hedges. Accordingly, changes in fair value subsequent to the date the swaps were designated as cash flow hedges were recognized in OCI. Gains and losses on the swaps initially recognized in OCI were reclassified to the statement of operations in the period in which changes in the underlying hedged item affects net income. On December 18, 2017, the Company terminated the cross-currency swap and designated the full€500 million principal of the 2015 Senior Notes as a net investment hedge as discussed below.
Net Investment Hedges
The Company had entered into foreign currency forward contracts that were designated as net investment hedges which were discontinued during 2017. Additionally, the Company has designated€500 million of the 2015 Senior Notes Due 2027 as a net investment hedge. These hedges are intended to mitigate FX exposure related tonon-U.S. dollar net investments in certain foreign subsidiaries against changes in foreign exchange rates. These net investment hedges are designated as accounting hedges under the applicable sections of Topic 815 of the ASC. The net investment hedge relating to the 2015 Senior Notes will end upon the repayment of the notes in 2027 unless terminated earlier at the discretion of the Company.
Hedge effectiveness is assessed based on the overall changes in the fair value of the hedge. For hedges that meet the effectiveness requirements, any change in the fair value is recorded in OCI in the foreign currency translation account. Any change in the fair value of the Company’s outstanding net investment hedges that is the result of ineffectiveness would be recognized immediately in othernon-operating (expense) income, net in the Company’s consolidated statement of operations.
The following table summarizes the notional amounts of the Company’s outstanding forward contracts that were designated as net investment hedges:
| | | | | | | | | | | | | | | | |
| | | December 31, 2017 | | | December 31, 2016 | |
| | | Sell | | | Buy | | | Sell | | | Buy | |
| Notional amount of net investment hedges: | | | | | | | | | | | | | | | | |
| Contracts to sell GBP for euros | | £ | — | | | € | — | | | £ | 22.1 | | | € | 26.4 | |
The following table provides information on the gains/(losses) on the Company’s net investment and cash flow hedges:
| | | | | | | | | | | | | | | | | | | | | | | | |
| | | Amount of Gain/(Loss)
Recognized in AOCI on
Derivative (Effective
Portion), net of Tax | | | Amount of Gain/(Loss)
Reclassified from AOCI into
Income (Effective Portion),
net of tax | |
Derivatives andNon-Derivative Instruments in Net Investment Hedging Relationships | | Year Ended December 31, | | | Year Ended December 31, | |
| | 2017 | | | 2016 | | | 2015 | | | 2017 | | | 2016 | | | 2015 | |
FX forwards | | $ | 1.2 | | | $ | (12.0 | ) | | $ | 13.4 | | | $ | — | | | $ | — | | | $ | — | |
Long-term debt | | | (37.2 | ) | | | 7.8 | | | | 4.7 | | | | — | | | | — | | | | — | |
| | | | | | | | | | | | | | | | | | | | | | | | |
Total net investment hedges | | $ | (36.0 | ) | | $ | (4.2 | ) | | $ | 18.1 | | | $ | — | | | $ | — | | | $ | — | |
| | | | | | | | | | | | | | | | | | | | | | | | |
| | | | | | |
| Derivatives in Cash Flow Hedging Relationships | | | | | | | | | | | | | | | | | | |
Cross currency swap | | $ | 6.3 | | | $ | (0.9 | ) | | $ | — | | | $ | 7.8 | * | | $ | (3.7 | )* | | $ | — | |
Interest rate contracts | | | (0.4 | ) | | | — | | | | (1.1 | ) | | | (1.1 | ) | | | — | | | | — | |
| | | | | | | | | | | | | | | | | | | | | | | | |
Total cash flow hedges | | | 5.9 | | | | (0.9 | ) | | | (1.1 | ) | | | 6.7 | | | | (3.7 | ) | | | — | |
| | | | | | | | | | | | | | | | | | | | | | | | |
| Total | | $ | (30.1 | ) | | $ | (5.1 | ) | | $ | 17.0 | | | $ | 6.7 | | | $ | (3.7 | ) | | $ | — | |
| | | | | | | | | | | | | | | | | | | | | | | | |
* | Reflects $12.6 million in gains and $6 million in losses in 2017 and 2016, respectively, recorded in othernon-operating income (expense), net of $4.8 million and $2.3 million in 2017 and 2016, respectively, relating to the tax effect of the aforementioned items. |
The cumulative amount of realized and unrecognized net investment and cash flow hedge gains/(losses) recorded in AOCI is as follows:
| | | | | | | | |
| | | Cumulative Gains/(Losses), net of tax | |
| | |
| | | December 31, 2017 | | | December 31, 2016 | |
| Net investment hedges | | | | | | | | |
FX forwards | | $ | 23.5 | | | $ | 22.3 | |
Long-term debt | | | (24.7 | ) | | | 12.5 | |
| | | | | | | | |
Total net investment hedges | | $ | (1.2 | ) | | $ | 34.8 | |
| | | | | | | | |
| Cash flow hedges | | | | | | | | |
Interest rate contracts | | $ | (0.4 | ) | | $ | (1.1 | ) |
Cross currency swap | | | 1.3 | | | | 2.8 | |
| | | | | | | | |
Total losses on cash flow hedges | | | 0.9 | | | | 1.7 | |
| | | | | | | | |
| Total net (losses) gains in AOCI | | $ | (0.3 | ) | | $ | 36.5 | |
| | | | | | | | |
Derivatives not designated as accounting hedges:
Foreign exchange forwards
The Company also enters into foreign exchange forwards to mitigate the change in fair value on certain assets and liabilities denominated in currencies other than a subsidiary’s functional currency. These forward contracts are not designated as accounting hedges under the applicable sections of Topic 815 of the ASC. Accordingly, changes in the fair value of these contracts are recognized immediately in othernon-operating (expense), income net in the Company’s consolidated statements of operations along with the FX gain or loss recognized on the assets and liabilities denominated in a currency other than the subsidiary’s functional currency. These contracts have expiration dates at various times through May 2018.
The following table summarizes the notional amounts of the Company’s outstanding foreign exchange forwards:
| | | | | | | | | | | | | | | | |
| | | December 31, 2017 | | | December 31, 2016 | |
| Notional Amount of Currency Pair: | | Sell | | | Buy | | | Sell | | | Buy | |
| Contracts to sell USD for GBP | | $ | 484.7 | | | £ | 362.3 | | | $ | — | | | £ | — | |
| Contracts to sell USD for Japanese yen | | $ | 24.3 | | | ¥ | 2,700.0 | | | $ | — | | | ¥ | — | |
| Contracts to sell USD for Canadian dollars | | $ | 51.7 | | | C$ | 64.0 | | | $ | — | | | C$ | — | |
| Contracts to sell Singapore dollars for EUR | | S$ | — | | | € | — | | | S$ | 55.5 | | | € | 36.0 | |
| Contracts to sell euros for GBP | | € | — | | | £ | — | | | € | 31.0 | | | £ | 25.9 | |
| Contracts to sell USD for Singapore dollars | | $ | 39.2 | | | S$ | 53.0 | | | $ | — | | | S$ | — | |
| Contracts to sell USD for EUR | | $ | 465.2 | | | € | 390.0 | | | $ | — | | | € | — | |
| | | | | | | | |
NOTE:€ = Euro, £ = British pound, S$ = Singapore dollar, $ = U.S. dollar, ¥ = Japanese yen, C$ = Canadian dollar |
Foreign Exchange Options and forward contracts relating to the acquisition of Bureau van Dijk
The Company entered into a foreign currency collar consisting of option contracts to economically hedge the Bureau van Dijk euro denominated purchase price (as further discussed in Note 7). These option contracts were not designated as accounting hedges under the applicable sections of Topic 815 of the ASC. The foreign currency option contracts consisted of separate put and call options each in the aggregate notional amount of€2.7 billion. This collar was settled at the end of July 2017, in advance of the August 10, 2017 closing of the Bureau van Dijk acquisition.
The Company entered into foreign exchange forwards to hedge the Bureau van Dijk purchase price for the period from the settlement of the aforementioned foreign currency collar until the closing date on August 10, 2017. These forward contracts were not designated as accounting hedges under the applicable sections of Topic 815 of the ASC. The foreign exchange contracts were to sell $2.8 billion and buy€2.4 billion and sell $41 million and buy £31 million.
The following table summarizes the impact to the consolidated statements of operations relating to the net gain (loss) on the Company’s derivatives which are not designated as hedging instruments:
| | | | | | | | | | | | | | |
| | | | | Year Ended December 31, | |
Derivatives Not Designated as Accounting Hedges | | Location on Statement of Operations | | 2017 | | | 2016 | | | 2015 | |
| Foreign exchange forwards | | Othernon-operating income, net | | $ | 21.5 | | | $ | (7.2 | ) | | $ | (2.8 | ) |
| Foreign exchange forwards relating to Bureau van Dijk acquisition | | Purchase Price Hedge Gain | | | 10.3 | | | | — | | | | — | |
| FX collar relating to Bureau van Dijk acquisition | | Purchase Price Hedge Gain | | | 100.8 | | | | — | | | | — | |
| | | | | | | | | | | | | | |
| | | | $ | 132.6 | | | $ | (7.2 | ) | | $ | (2.8 | ) |
| | | | | | | | | | | | | | |
The table below shows the classification between assets and liabilities on the Company’s consolidated balance sheets for the fair value of the derivative instrument as well as the carrying value of itsnon-derivative debt instruments designated and qualifying as net investment hedges:
| | | | | | | | | | |
| | | Derivative andNon-derivative Instruments | |
| | | |
| | | Balance Sheet Location | | December 31,
2017 | | | December 31,
2016 | |
| Assets: | | | | | | | | | | |
| Derivatives designated as accounting hedges: | | | | | | | | | | |
FX forwards on net investment in certain foreign subsidiaries | | Other current assets | | $ | — | | | $ | 0.6 | |
Interest rate swaps | | Other assets | | | 0.5 | | | | 7.0 | |
| | | | | | | | | | |
Total derivatives designated as accounting hedges | | | | | 0.5 | | | | 7.6 | |
| | | | | | | | | | |
| Derivatives not designated as accounting hedges: | | | | | | | | | | |
FX forwards on certain assets and liabilities | | Other current assets | | | 12.5 | | | | — | |
| | | | | | | | | | |
| Total assets | | | | $ | 13.0 | | | $ | 7.6 | |
| | | | | | | | | | |
| Liabilities: | | | | | | | | | | |
| Derivatives designated as accounting hedges: | | | | | | | | | | |
Cross-currency swap | | Othernon-current liabilities | | $ | — | | | $ | 3.8 | |
Interest rate swaps | | Othernon-current liabilities | | | 3.5 | | | | 0.8 | |
| | | | | | | | | | |
Total derivatives designated as accounting hedges | | | | | 3.5 | | | | 4.6 | |
| | | | | | | | | | |
| Non-derivative instrument designated as accounting hedge: | | | | | | | | | | |
Long-term debt designated as net investment hedge | | Long-term debt | | | 600.4 | | | | 421.9 | |
| Derivatives not designated as accounting hedges: | | | | | | | | | | |
FX forwards on certain assets and liabilities | | Accounts payable and accrued liabilities | | | 2.0 | | | | 0.8 | |
| | | | | | | | | | |
| Total liabilities | | | | $ | 605.9 | | | $ | 427.3 | |
| | | | | | | | | | |
NOTE 6 | PROPERTY AND EQUIPMENT, NET |
Property and equipment, net consisted of:
| | | | | | | | |
| | | December 31, | |
| | |
| | | 2017 | | | 2016 | |
| Office and computer equipment (3 – 10 year estimated useful life) | | $ | 219.5 | | | $ | 189.1 | |
| Office furniture and fixtures (3 – 10 year estimated useful life) | | | 50.5 | | | | 47.1 | |
| Internal-use computer software (1 – 10 year estimated useful life) | | | 520.3 | | | | 452.1 | |
| Leasehold improvements and building (2 – 20 year estimated useful life) | | | 240.8 | | | | 233.1 | |
| | | | | | | | |
Total property and equipment, at cost | | | 1,031.1 | | | | 921.4 | |
| Less: accumulated depreciation and amortization | | | (706.0 | ) | | | (595.5 | ) |
| | | | | | | | |
| Total property and equipment, net | | $ | 325.1 | | | $ | 325.9 | |
| | | | | | | | |
Depreciation and amortization expense related to the above assets was $96.9 million, $92.5 million, and $81.6 million for the years ended December 31, 2017, 2016 and 2015, respectively.
The business combinations described below are accounted for using the acquisition method of accounting whereby assets acquired and liabilities assumed were recognized at fair value on the date of the transaction. Any excess of the purchase price over the fair value of the assets acquired and liabilities assumed was recorded to goodwill. For all acquisitions excluding Bureau van Dijk, the Company has not presented pro forma combined results for these acquisitions because the impact on previously reported statements of operations
would not have been material. Additionally, the near term impact to the Company’s operations and cash flows for these acquisitions (excluding Bureau van Dijk) is not material.
Bureau van Dijk
On August 10, 2017, a subsidiary of the Company acquired 100% of Yellow Maple I B.V., an indirect parent company of Bureau van Dijk Electronic Publishing B.V., a global provider of business intelligence and company information products. The cash payment of $3,542.0 million was funded with a combination of cash on hand, primarily offshore, and new debt financing. The acquisition extends Moody’s position as a leader in risk data and analytical insight.
Shown below is the purchase price allocation, which summarizes the fair value of the assets and liabilities assumed, at the date of acquisition:
| | | | | | | | |
| (Amounts in millions) | | | | | | | | |
| Current assets | | | | | | $ | 158.4 | |
| Property and equipment, net | | | | | | | 4.2 | |
| Intangible assets: | | | | | | | | |
Customer relationships (23 year weighted average life) | | $ | 998.7 | | | | | |
Product technology (12 year weighted average life) | | | 258.5 | | | | | |
Trade name (18 year weighted average life) | | | 82.3 | | | | | |
Database (10 year weighted average life) | | | 12.9 | | | | | |
| | | | | | | | |
Total intangible assets (21 year weighted average life) | | | | | | | 1,352.4 | |
| Goodwill | | | | | | | 2,619.0 | |
| Other assets | | | | | | | 5.9 | |
| Liabilities | | | | | | | | |
Deferred revenue | | $ | (101.1 | ) | | | | |
Accounts payable and accrued liabilities | | | (48.6 | ) | | | | |
Deferred tax liabilities, net | | | (329.8 | ) | | | | |
Other liabilities | | | (118.4 | ) | | | | |
| | | | | | | | |
Total liabilities | | | | | | | (597.9 | ) |
| | | | | | | | |
| Net assets acquired | | | | | | $ | 3,542.0 | |
| | | | | | | | |
The Company has performed a preliminary valuation analysis of the fair market value of assets and liabilities of the Bureau van Dijk business. The final purchase price allocation will be determined when the Company has completed and fully reviewed the detailed valuations. The final allocation could differ materially from the preliminary allocation. The final allocation may include changes in allocations to acquired intangible assets as well as goodwill and other changes to assets and liabilities including reserves for uncertain tax positions and deferred tax liabilities. The estimated useful lives of acquired intangibles assets are also preliminary. Additionally, at December 31, 2017, the Company has not completed its allocation of certain of the goodwill acquired to other MA reporting units that are anticipated to benefit from synergies resulting from the Bureau van Dijk acquisition.
Current assets in the table above include acquired cash of $36 million. Additionally, current assets include accounts receivable of approximately $88 million (net of an allowance for uncollectible accounts of $3.7 million).
The amount of Bureau van Dijk’s revenue and Net Income from August 10, 2017 through December 31, 2017 included in the Company’s statement of operations was $92.4 million and $63.7 million, respectively. The aforementioned net income includes a $57.9 million tax benefit, as further described in Note 15, relating to a statutory tax rate reduction in Belgium which resulted in a decrease in deferred tax liabilities relating to acquired intangible assets. The acquired deferred revenue balance of approximately $154 million was reduced by $53 million as part of acquisition accounting to establish the fair value of deferred revenue. This will reduce reported revenue by $53 million over the remaining contractual period of in-progress customer arrangements assumed as of the acquisition date. This resulted in approximately $36 million less in reported revenue for the period from August 10, 2017 to December 31, 2017 with the remaining $17 million to reduce revenue in 2018. Amortization of acquired intangible assets was approximately $28 million for the period from August 10, 2017 through December 31, 2017.
Goodwill
Under the acquisition method of accounting for business combinations, the excess of the purchase price over the fair value of the net assets acquired is allocated to goodwill. Goodwill typically results through expected synergies from combining operations of an
acquiree and an acquirer, anticipated new customer acquisition and products, as well as from intangible assets that do not qualify for separate recognition. The goodwill recognized as a result of this acquisition includes, among other things, the value of combining the complementary product portfolios of the Company and Bureau van Dijk which is expected to extend the Company’s reach to new and evolving market segments as well as cost savings synergies, expected new customer acquisitions and products.
Goodwill, which has been assigned to the MA segment, is not deductible for tax purposes.
Bureau van Dijk will be a separate reporting unit for purposes of the Company’s annual goodwill impairment assessment.
Other Liabilities Assumed
In connection with the acquisition, the Company assumed liabilities relating to UTBs as well as deferred tax liabilities which relate to acquired intangible assets. These items are included in other liabilities in the table above.
Transaction andNon-Recurring Integration Costs.
In connection with the acquisition, the Company incurred transaction andnon-recurring integration costs (Acquisition-Related Expenses) through December 2017. Acquisition-Related Expenses of $22.5 million were comprised of transaction costs (consisting primarily of legal and advisory costs) of $8.6 million andnon-recurring integration costs of $13.9 million for the year ended December 31, 2017.
Supplementary Unaudited Pro Forma Information
Supplemental information on an unaudited pro forma basis is presented below for the year ended December 31, 2017 and 2016 as if the acquisition of Bureau van Dijk occurred on January 1, 2016. The pro forma financial information is presented for comparative purposes only, based on certain estimates and assumptions, which the Company believes to be reasonable but not necessarily indicative of future results of operations or the results that would have been reported if the acquisition had been completed at January 1, 2016. The unaudited pro forma information includes amortization of acquired intangible assets, based on the preliminary purchase price allocation and an estimate of useful lives reflected above, and incremental financing costs resulting from the acquisition, net of income tax, which was estimated using the weighted average statutory tax rates in effect in the jurisdiction for which the pro forma adjustment relates.
| | | | | | | | |
| (Amounts in millions) | | For the year ended
December 31, 2017 | | | For the year ended
December 31, 2016 | |
| Pro forma Revenue | | $ | 4,414.8 | | | $ | 3,825.8 | |
| Pro forma Net Income attributable to Moody’s | | $ | 1,011.6 | | | $ | 240.6 | |
The unaudited pro forma results do not include any anticipated cost savings or other effects of the planned integration of Bureau van Dijk. Accordingly, the pro forma results above are not necessarily indicative of the results that would have been reported if the acquisition had occurred on the dates indicated, nor are the pro forma results indicative of results which may occur in the future. The Bureau van Dijk results included in the table above have been converted to U.S. GAAP from IFRS as issued by the IASB and have been translated to USD at rates in effect for the periods presented. As the unaudited pro forma results give effect to the acquisition of Bureau van Dijk as if it had occurred on January 1, 2016, the Bureau van Dijk amounts in the pro forma results include a reduction in revenue of approximately $58 million and $1 million relating to a fair value adjustment to deferred revenue required as part of acquisition accounting for the year ended December 31, 2016 and 2017, respectively. In addition, a corresponding pro forma adjustment was included to add back the approximate $36 million reduction to reported revenue for the period from August 10, 2017 to December 31, 2017 relating to the deferred revenue adjustment required as part of acquisition accounting as of the actual August 10, 2017 acquisition date.
SCDM Financial
On February 13, 2017, a subsidiary of the Company acquired the structured finance data and analytics business of SCDM Financial. The aggregate purchase price was not material and the near term impact to the Company’s operations and cash flow is not expected to be material. This business unit operates in the MA reportable segment and goodwill related to this acquisition has been allocated to the RD&A reporting unit.
Korea Investor Service (KIS)
In July 2016, a subsidiary of the Company acquired thenon-controlling interest of KIS and additional shares of KIS Pricing. The aggregate purchase price was not material and the near term impact to the Company’s operations and cash flow is not expected to be material. KIS and KIS Pricing are a part of the MIS segment.
Gilliland Gold Young (GGY)
On March 1, 2016, subsidiaries of the Company acquired 100% of GGY, a leading provider of advanced actuarial software for the life insurance industry. The cash payments noted in the table below were funded with cash on hand. The acquisition of GGY will allow MA to provide an industry-leading enterprise risk offering for global life insurers and reinsurers.
The table below details the total consideration relating to the acquisition:
| | | | |
| Cash paid at closing | | $ | 83.4 | |
| Additional consideration paid to sellers in the third quarter 2016(1) | | | 3.1 | |
| | | | |
| Total consideration | | $ | 86.5 | |
| | | | |
(1) | Represents additional consideration paid to the sellers for amounts withheld at closing pending the completion of certain administrative matters |
Shown below is the purchase price allocation, which summarizes the fair value of the assets and liabilities assumed, at the date of acquisition:
| | | | | | | | |
| Current assets | | | | | | $ | 11.7 | |
| Property and equipment, net | | | | | | | 2.0 | |
| Indemnification assets | | | | | | | 1.5 | |
| Intangible assets: | | | | | | | | |
Trade name (19 year weighted average life) | | $ | 3.7 | | | | | |
Customer relationships (21 year weighted average life) | | | 13.8 | | | | | |
Software (7 year weighted average life) | | | 16.6 | | | | | |
| | | | | | | | |
Total intangible assets (14 year weighted average life) | | | | | | | 34.1 | |
| Goodwill | | | | | | | 59.4 | |
| Liabilities | | | | | | | (22.2 | ) |
| | | | | | | | |
| Net assets acquired | | | | | | $ | 86.5 | |
| | | | | | | | |
Current assets in the table above include acquired cash of $7.5 million. Additionally, current assets include accounts receivable of $2.9 million. Goodwill, which has been assigned to the MA segment, is not deductible for tax.
In connection with the acquisition, the Company assumed liabilities relating to UTBs and certain other tax exposures which are included in the liabilities assumed in the table above. The sellers have contractually indemnified the Company against any potential payments that may have to be made regarding these amounts. Accordingly, the Company carries an indemnification asset on its consolidated balance sheet at December 31, 2017 and December 31, 2016.
The Company incurred $0.9 million of costs directly related to the GGY acquisition of which $0.6 million was incurred in 2015 and $0.3 million was incurred in the first quarter of 2016. These costs are recorded within selling, general and administrative expenses in the Company’s consolidated statements of operations.
GGY is part of the ERS reporting unit for purposes of the Company’s annual goodwill impairment assessment.
BlackBox Logic
On December 9, 2015, a subsidiary of the Company acquired the RMBS data and analytics business of BlackBox Logic. The aggregate purchase price was not material and the near term impact to the Company’s operations and cash flows is not expected to be material. This business operates in the MA reportable segment and goodwill related to this acquisition has been allocated to the RD&A reporting unit.
Equilibrium
On May 21, 2015, a subsidiary of the Company acquired 100% of Equilibrium, a provider of credit rating and research services in Peru and Panama. The aggregate purchase price was not material and the near term impact to the Company’s operations and cash flows is not expected to be material. Equilibrium operates in the MIS reportable segment and goodwill related to this acquisition has been allocated to the MIS reporting unit.
NOTE 8 | GOODWILL AND OTHER ACQUIRED INTANGIBLE ASSETS |
The following table summarizes the activity in goodwill:
| | | | | | | | | | | | | | | | | | | | | | | | | | | | | | | | | | | | |
| | | Year Ended December 31, 2017 | |
| | | MIS | | | MA | | | Consolidated | |
| | | | | | | | | |
| | | Gross
goodwill | | | Accumulated
impairment
charge | | | Net
goodwill | | | Gross
goodwill | | | Accumulated
impairment
charge | | | Net
goodwill | | | Gross
goodwill | | | Accumulated
impairment
charge | | | Net
goodwill | |
| Balance at beginning of year | | $ | 277.0 | | | $ | — | | | $ | 277.0 | | | $ | 758.8 | | | $ | (12.2 | ) | | $ | 746.6 | | | $ | 1,035.8 | | | $ | (12.2 | ) | | $ | 1,023.6 | |
| Additions/adjustments | | | — | | | | — | | | | — | | | | 2,622.6 | | | | — | | | | 2,622.6 | | | | 2,622.6 | | | | — | | | | 2,622.6 | |
| Foreign currency translation adjustments | | | 8.2 | | | | — | | | | 8.2 | | | | 98.8 | | | | — | | | | 98.8 | | | | 107.0 | | | | — | | | | 107.0 | |
| | | | | | | | | | | | | | | | | | | | | | | | | | | | | | | | | | | | |
| Ending balance | | $ | 285.2 | | | $ | — | | | $ | 285.2 | | | $ | 3,480.2 | | | $ | (12.2 | ) | | $ | 3,468.0 | | | $ | 3,765.4 | | | $ | (12.2 | ) | | $ | 3,753.2 | |
| | | | | | | | | | | | | | | | | | | | | | | | | | | | | | | | | | | | |
| | | | | | | | | | | | | | | | | | | | | | | | | | | | | | | | | | | | |
| | | Year Ended December 31, 2016 | |
| | | MIS | | | MA | | | Consolidated | |
| | | | | | | | | |
| | | Gross
goodwill | | | Accumulated
impairment
charge | | | Net
goodwill | | | Gross
goodwill | | | Accumulated
impairment
charge | | | Net
goodwill | | | Gross
goodwill | | | Accumulated
impairment
charge | | | Net
goodwill | |
| Balance at beginning of year | | $ | 284.4 | | | $ | — | | | $ | 284.4 | | | $ | 704.1 | | | $ | (12.2 | ) | | $ | 691.9 | | | $ | 988.5 | | | $ | (12.2 | ) | | $ | 976.3 | |
| Additions/adjustments | | | — | | | | — | | | | — | | | | 61.0 | | | | — | | | | 61.0 | | | | 61.0 | | | | — | | | | 61.0 | |
| Goodwill derecognized upon sale of subsidiary | | | (3.2 | ) | | | — | | | | (3.2 | ) | | | — | | | | — | | | | — | | | | (3.2 | ) | | | — | | | | (3.2 | ) |
| Foreign currency translation adjustments | | | (4.2 | ) | | | — | | | | (4.2 | ) | | | (6.3 | ) | | | — | | | | (6.3 | ) | | | (10.5 | ) | | | — | | | | (10.5 | ) |
| | | | | | | | | | | | | | | | | | | | | | | | | | | | | | | | | | | | |
| Ending balance | | $ | 277.0 | | | $ | — | | | $ | 277.0 | | | $ | 758.8 | | | $ | (12.2 | ) | | $ | 746.6 | | | $ | 1,035.8 | | | $ | (12.2 | ) | | $ | 1,023.6 | |
| | | | | | | | | | | | | | | | | | | | | | | | | | | | | | | | | | | | |
The 2017 additions/adjustments for the MA segment in the table above relate to the acquisition of Bureau van Dijk and the structured finance data and analytics business of SCDM. The 2016 additions/adjustments for the MA segment in the table above relate to the acquisition of GGY. The 2016 goodwill derecognized for the MIS segment in the table above relates to the divestiture of ICTEAS in the fourth quarter of 2016.
Acquired intangible assets and related amortization consisted of:
| | | | | | | | |
| | | December 31, | |
| | |
| | | 2017 | | | 2016 | |
| Customer relationships | | $ | 1,345.1 | | | $ | 310.1 | |
| Accumulated amortization | | | (159.9 | ) | | | (124.4 | ) |
| | | | | | | | |
Net customer relationships | | | 1,185.2 | | | | 185.7 | |
| | | | | | | | |
| Trade secrets | | | 30.2 | | | | 29.9 | |
| Accumulated amortization | | | (28.1 | ) | | | (25.6 | ) |
| | | | | | | | |
Net trade secrets | | | 2.1 | | | | 4.3 | |
| | | | | | | | |
| Software/product technology | | | 358.6 | | | | 87.7 | |
| Accumulated amortization | | | (78.0 | ) | | | (54.9 | ) |
| | | | | | | | |
Net software/product technology | | | 280.6 | | | | 32.8 | |
| | | | | | | | |
| Trade names | | | 161.6 | | | | 75.3 | |
| Accumulated amortization | | | (26.7 | ) | | | (19.9 | ) |
| | | | | | | | |
Net trade names | | | 134.9 | | | | 55.4 | |
| | | | | | | | |
| Other(1) | | | 57.4 | | | | 43.5 | |
| Accumulated amortization | | | (28.6 | ) | | | (25.3 | ) |
| | | | | | | | |
Net other | | | 28.8 | | | | 18.2 | |
| | | | | | | | |
Total | | $ | 1,631.6 | | | $ | 296.4 | |
| | | | | | | | |
(1) | Other intangible assets primarily consist of databases, covenants not to compete, and acquired ratings methodologies and models. |
Amortization expense relating to acquired intangible assets is as follows:
| | | | | | | | | | | | |
| | | Year Ended December 31, | |
| | | |
| | | 2017 | | | 2016 | | | 2015 | |
| Amortization expense | | $ | 61.4 | | | $ | 34.2 | | | $ | 31.9 | |
Estimated future annual amortization expense for intangible assets subject to amortization is as follows:
| | | | |
Year Ending December 31, | | | |
| 2018 | | $ | 101.0 | |
| 2019 | | | 97.0 | |
| 2020 | | | 94.7 | |
| 2021 | | | 94.6 | |
| 2022 | | | 94.1 | |
| Thereafter | | | 1,150.2 | |
| | | | |
| Total estimated future amortization | | $ | 1,631.6 | |
| | | | |
Amortizable intangible assets are reviewed for recoverability whenever events or changes in circumstances indicate that the carrying amount may not be recoverable. For all intangible assets, there were no such events or changes during 2017, 2016 or 2015 that would indicate that the carrying amount of amortizable intangible assets in any of the Company’s reporting units may not be recoverable.
In September 2016, the Company approved a restructuring plan relating to cost management initiatives in the MIS segment as well as in certain corporate overhead functions. This restructuring plan consisted solely of headcount reductions, which when combined with an immaterial restructuring in the first half of 2016, represented approximately 1% of the Company’s workforce. The cumulative amount of expense incurred from inception through December 31, 2016 for these actions was $12.0 million. Actions under these plans were substantially complete at September 30, 2016.
Total expenses included in the accompanying consolidated statements of operations are as follows:
| | | | | | | | | | | | |
| | | Year Ended December 31, | |
| | | |
| | | 2017 | | | 2016 | | | 2015 | |
| Restructuring | | $ | — | | | $ | 12.0 | | | $ | — | |
Changes to the restructuring liability were as follows:
| | | | | | | | |
| | | Employee Termination Costs | | | Employee Termination Costs | |
| | | 2017 | | | 2016 | |
| Balance as of January 1, | | $ | 6.3 | | | $ | — | |
| Cost incurred and adjustments | | | — | | | | 12.0 | |
| Cash payments and adjustments | | | (5.9 | ) | | | (5.7 | ) |
| | | | | | | | |
| Balance as of December 31, | | $ | 0.4 | | | $ | 6.3 | |
| | | | | | | | |
As of December 31, 2017 the remaining restructuring liability of $0.4 million relating to severance is expected to be fully paid out during the year ending December 31, 2018. The liabilities in the table above were recorded within accounts payable and accrued liabilities in the Company’s consolidated balance sheet at December 31, 2017 and 2016.
The table below presents information about items which are carried at fair value on a recurring basis at December 31, 2017 and December 31, 2016:
| | | | | | | | | | | | | | |
| | | | | Fair Value Measurement as of December 31, 2017 | |
| | | | |
| | | Description | | Balance | | | Level 1 | | | Level 2 | |
| Assets: | | | | | | | | | | | | | | |
| | Derivatives(a) | | $ | 13.0 | | | $ | — | | | $ | 13.0 | |
| | Money market mutual funds | | | 42.2 | | | | 42.2 | | | | — | |
| | Fixed maturity and open ended mutual funds | | | 21.1 | | | | 21.1 | | | | — | |
| | | | | | | | | | | | | | |
| | Total | | $ | 76.3 | | | $ | 63.3 | | | $ | 13.0 | |
| | | | | | | | | | | | | | |
| Liabilities: | | | | | | | | | | | | | | |
| | Derivatives(a) | | $ | 5.5 | | | $ | — | | | $ | 5.5 | |
| | | | | | | | | | | | | | |
| | Total | | $ | 5.5 | | | $ | — | | | $ | 5.5 | |
| | | | | | | | | | | | | | |
| | | | | | | | | | | | | | |
| | | | | Fair Value Measurement as of December 31, 2016 | |
| | | | |
| | | Description | | Balance | | | Level 1 | | | Level 2 | |
| Assets: | | | | | | | | | | | | | | |
| | Derivatives(a) | | $ | 7.6 | | | $ | — | | �� | $ | 7.6 | |
| | Money market mutual funds | | | 189.0 | | | | 189.0 | | | | — | |
| | Fixed maturity and open ended mutual funds | | | 32.6 | | | | 32.6 | | | | — | |
| | | | | | | | | | | | | | |
| | Total | | $ | 229.2 | | | $ | 221.6 | | | $ | 7.6 | |
| | | | | | | | | | | | | | |
| Liabilities: | | | | | | | | | | | | | | |
| | Derivatives(a) | | $ | 5.4 | | | $ | — | | | $ | 5.4 | |
| | | | | | | | | | | | | | |
| | Total | | $ | 5.4 | | | $ | — | | | $ | 5.4 | |
| | | | | | | | | | | | | | |
(a) | Information on the Company’s derivative instruments is more fully described in Note 5 to the consolidated financial statements. |
The following are descriptions of the methodologies utilized by the Company to estimate the fair value of its derivative contracts, fixed maturity plans, and money market mutual funds:
Derivatives:
In determining the fair value of the derivative contracts in the table above, the Company utilizes industry standard valuation models. Where applicable, these models project future cash flows and discount the future amounts to a present value using spot rates, forward points, currency volatilities, interest rates as well as the risk ofnon-performance of the Company and the counterparties with whom it has derivative contracts. The Company established strict counterparty credit guidelines and only enters into transactions with financial institutions that adhere to these guidelines. Accordingly, the risk of counterparty default is deemed to be minimal.
Fixed maturity and open ended mutual funds:
The fixed maturity mutual funds and open ended mutual funds primarily represent exchange traded funds in India and are classified as securitiesavailable-for-sale. Accordingly, any unrealized gains and losses are recognized through OCI until the instruments mature or are sold.
Money market mutual funds:
The money market mutual funds represent publicly traded funds with a stable $1 net asset value.
NOTE 11 | OTHER BALANCE SHEET AND STATEMENT OF OPERATIONS INFORMATION |
The following tables contain additional detail related to certain balance sheet captions:
| | | | | | | | |
| | | December 31, | |
| | |
| | | 2017 | | | 2016 | |
| Other current assets: | | | | | | | | |
Prepaid taxes | | $ | 94.9 | | | $ | 47.0 | |
Prepaid expenses | | | 107.6 | | | | 65.7 | |
Other | | | 47.6 | | | | 28.1 | |
| | | | | | | | |
Total other current assets | | $ | 250.1 | | | $ | 140.8 | |
| | | | | | | | |
| | | | | | | | |
| | | December 31, | |
| | |
| | | 2017 | | | 2016 | |
| Other assets: | | | | | | | | |
Investments in joint ventures | | $ | 99.1 | | | $ | 26.3 | |
Deposits for real-estate leases | | | 12.3 | | | | 10.8 | |
Indemnification assets related to acquisitions | | | 17.0 | | | | 16.5 | |
Mutual funds and fixed deposits | | | 22.1 | | | | 32.7 | |
Other | | | 9.4 | | | | 25.9 | |
| | | | | | | | |
Total other assets | | $ | 159.9 | | | $ | 112.2 | |
| | | | | | | | |
| | | | | | | | |
| | | December 31, | |
| | |
| | | 2017 | | | 2016 | |
| Accounts payable and accrued liabilities: | | | | | | | | |
Salaries and benefits | | $ | 129.6 | | | $ | 89.3 | |
Incentive compensation | | | 246.7 | | | | 151.1 | |
Accrued settlement charge | | | — | | | | 863.8 | |
Customer credits, advanced payments and advanced billings | | | 22.2 | | | | 28.4 | |
Self-insurance reserves | | | 8.1 | | | | 11.1 | |
Dividends | | | 6.2 | | | | 78.5 | |
Professional service fees | | | 47.1 | | | | 40.4 | |
Interest accrued on debt | | | 73.9 | | | | 59.2 | |
Accounts payable | | | 21.8 | | | | 28.4 | |
Income taxes (see Note 15) | | | 79.2 | | | | 16.8 | |
Restructuring (see Note 9) | | | 0.4 | | | | 6.3 | |
Pension and other retirement employee benefits (see Note 13) | | | 5.9 | | | | 6.1 | |
Accrued royalties (1) | | | 26.4 | | | | 1.8 | |
Other | | | 82.8 | | | | 63.1 | |
| | | | | | | | |
Total accounts payable and accrued liabilities | | $ | 750.3 | | | $ | 1,444.3 | |
| | | | | | | | |
(1) | Primarily relates to fees due to Bureau van Dijk’s data providers |
| | | | | | | | |
| | | December 31, | |
| | |
| | | 2017 | | | 2016 | |
| Other liabilities: | | | | | | | | |
Pension and other retirement employee benefits (see Note 13) | | $ | 244.5 | | | $ | 264.1 | |
Deferredrent-non-current portion | | | 103.1 | | | | 98.3 | |
Interest accrued on UTPs | | | 54.7 | | | | 34.1 | |
Legacy and other tax matters | | | 1.3 | | | | 1.2 | |
Income tax liability – non current* | | | 232.2 | | | | — | |
Other | | | 28.2 | | | | 27.5 | |
| | | | | | | | |
| Total other liabilities | | $ | 664.0 | | | $ | 425.2 | |
| | | | | | | | |
* | The 2017 amount primarily reflects the transition tax pursuant to the Tax Act, which was enacted into law in December 2017. See Note 15 for further information. |
Changes in the Company’s self-insurance reserves for claims insured by the Company’s wholly-owned insurance subsidiary, which primarily relate to legal defense costs for claims from prior years, are as follows:
| | | | | | | | | | | | |
| | | Year Ended December 31, | |
| | | |
| | 2017 | | | 2016 | | | 2015 | |
| Balance January 1, | | $ | 11.1 | | | $ | 19.7 | | | $ | 21.5 | |
Accruals (reversals), net | | | 9.6 | | | | 12.1 | | | | 22.2 | |
Payments | | | (12.6 | ) | | | (20.7 | ) | | | (24.0 | ) |
| | | | | | | | | | | | |
| Balance December 31, | | $ | 8.1 | | | $ | 11.1 | | | $ | 19.7 | |
| | | | | | | | | | | | |
Purchase Price Hedge Gain:
There was a $111.1 million realized gain reflecting gains on an FX collar and foreign exchange forwards to economically hedge the euro denominated purchase price for Bureau van Dijk as more fully discussed in Note 5 to the condensed consolidated financial statements.
Settlement Charge
There was a charge of $863.8 million recorded in the fourth quarter of 2016 related to an agreement entered into on January 13, 2017 with the U.S. Department of Justice and the attorneys general of 21 U.S. states and the District of Columbia to resolve pending and potential civil claims related to credit ratings that MIS assigned to certain structured finance instruments in the financial crisis era.
CCXI Gain:
CCXI is a Chinese credit rating agency in which Moody’s acquired a 49% stake in 2006. Moody’s accounts for this investment under the equity method of accounting. On March 21, 2017, CCXI, as part of a strategic business realignment, issued additional capital to its majority shareholder in exchange for a ratings business wholly-owned by the majority shareholder and which has the right to rate a different class of debt instrument in the Chinese market. The capital issuance by CCXI in exchange for this ratings business diluted Moody’s ownership interest in CCXI to 30% of a larger business and resulted in a $59.7 millionnon-cash,non-taxable gain. The issuance of additional capital by CCXI is treated as if Moody’s sold a 19% interest in CCXI at fair value. The fair value of the 19% interest in CCXI that Moody’s hypothetically sold was estimated using both a discounted cash flow methodology and comparable public company multiples. A DCF analysis requires significant estimates, including projections of future operating results and cash flows based on the budgets and forecasts of CCXI, expected long-term growth rates, terminal values, WACC and the effects of external factors and market conditions. Moody’s will continue to account for its 30% interest in CCXI under the equity method of accounting.
NOTE 12. | COMPREHENSIVE INCOME AND ACCUMULATED OTHER COMPREHENSIVE INCOME |
The following table provides details about the reclassifications out of AOCI:
| | | | | | | | | | | | | | |
| | | Year Ended December 31, | | | Affected line in the consolidated statement of
operations |
| | | 2017 | | | 2016 | | | 2015 | | |
| Gains on currency translation adjustments | | | | | | | | | | | | | | |
Liquidation/sale of foreign subsidiary | | $ | — | | | $ | 36.6 | | | $ | 0.1 | | | Othernon-operating income (expense), net |
| | | | | | | | | | | | | | |
| Total gains on currency translation adjustments | | | — | | | | 36.6 | | | | 0.1 | | | |
| | | | | | | | | | | | | | |
| Gains (losses) on cash flow hedges | | | | | | | | | | | | | | |
Cross-currency swap | | | 12.6 | | | | (6.0 | ) | | | — | | | Othernon-operating income (expense), net |
Interest rate contract | | | (1.1 | ) | | | — | | | | — | | | Interest expense, net |
| | | | | | | | | | | | | | |
Total before income taxes | | | 11.5 | | | | (6.0 | ) | | | — | | | |
Income tax effect of item above | | | (4.8 | ) | | | 2.3 | | | | — | | | Provision for income taxes |
| | | | | | | | | | | | | | |
| Total net gains (losses) on cash flow hedges | | | 6.7 | | | | (3.7 | ) | | | — | | | |
| | | | | | | | | | | | | | |
| Gains on available for sale securities: | | | | | | | | | | | | | | |
Gains on available for sale securities | | | 1.8 | | | | — | | | | 0.9 | | | Other income |
Income tax effect of item above | | | — | | | | — | | | | — | | | Provision for income taxes |
| | | | | | | | | | | | | | |
| Total gains on available for sale securities | | | 1.8 | | | | — | | | | 0.9 | | | |
| | | | | | | | | | | | | | |
| Pension and other retirement benefits | | | | | | | | | | | | | | |
Amortization of actuarial losses and prior service costs included in net income | | | (5.5 | ) | | | (5.8 | ) | | | (8.5 | ) | | Operating expense |
Amortization of actuarial losses and prior service costs included in net income | | | (3.2 | ) | | | (3.9 | ) | | | (5.0 | ) | | SG&A expense |
| | | | | | | | | | | | | | |
| Total before income taxes | | | (8.7 | ) | | | (9.7 | ) | | | (13.5 | ) | | |
Income tax effect of item above | | | 3.3 | | | | 3.7 | | | | 5.2 | | | Provision for income taxes |
| | | | | | | | | | | | | | |
| Total pension and other retirement benefits | | | (5.4 | ) | | | (6.0 | ) | | | (8.3 | ) | | |
| | | | | | | | | | | | | | |
| Total gains (losses) included in Net Income attributable to reclassifications out of AOCI | | $ | 3.1 | | | $ | 26.9 | | | $ | (7.3 | ) | | |
| | | | | | | | | | | | | | |
The following table shows changes in AOCI by component (net of tax):
| | | | | | | | | | | | | | | | | | | | |
| | | Year Ended December 31, 2017 | |
| | | | | |
| | | Pension and Other
Retirement
Benefits | | | Gains / (Losses)
on Cash Flow
Hedges | | | Foreign Currency
Translation
Adjustments | | | Gains on Available
for Sale Securities | | | Total | |
| Balance December 31, 2016 | | $ | (79.5 | ) | | $ | 1.7 | | | $ | (290.2 | ) | | $ | 3.1 | | | $ | (364.9 | ) |
Other comprehensive income before reclassifications | | | 12.6 | | | | 5.9 | | | | 176.3 | | | | 1.0 | | | | 195.8 | |
Amounts reclassified from AOCI | | | 5.4 | | | | (6.7 | ) | | | — | | | | (1.8 | ) | | | (3.1 | ) |
| | | | | | | | | | | | | | | | | | | | |
| Other comprehensive income/(loss) | | | 18.0 | | | | (0.8 | ) | | | 176.3 | | | | (0.8 | ) | | | 192.7 | |
| | | | | | | | | | | | | | | | | | | | |
| Balance December 31, 2017 | | $ | (61.5 | ) | | $ | 0.9 | | | $ | (113.9 | ) | | $ | 2.3 | | | $ | (172.2 | ) |
| | | | | | | | | | | | | | | | | | | | |
| | | | | | | | | | | | | | | | | | | | |
| | | Year Ended December 31, 2016 | |
| Balance December 31, 2015 | | $ | (85.7 | ) | | $ | (1.1 | ) | | $ | (256.0 | ) | | $ | 3.3 | | | $ | (339.5 | ) |
Other comprehensive income/(loss) before reclassifications | | | 0.2 | | | | (0.9 | ) | | | 2.4 | | | | (0.2 | ) | | | 1.5 | |
Amounts reclassified from AOCI | | | 6.0 | | | | 3.7 | | | | (36.6 | ) | | | — | | | | (26.9 | ) |
| | | | | | | | | | | | | | | | | | | | |
| Other comprehensive income/(loss) | | | 6.2 | | | | 2.8 | | | | (34.2 | ) | | | (0.2 | ) | | | (25.4 | ) |
| | | | | | | | | | | | | | | | | | | | |
| Balance December 31, 2016 | | $ | (79.5 | ) | | $ | 1.7 | | | $ | (290.2 | ) | | $ | 3.1 | | | $ | (364.9 | ) |
| | | | | | | | | | | | | | | | | | | | |
| | | | | | | | | | | | | | | | | | | | |
| | | Year Ended December 31, 2015 | |
| Balance December 31, 2014 | | $ | (105.4 | ) | | $ | — | | | $ | (130.7 | ) | | $ | 0.9 | | | $ | (235.2 | ) |
Other comprehensive income/(loss) before reclassifications | | | 11.4 | | | | (1.1 | ) | | | (125.2 | ) | | | 3.3 | | | | (111.6 | ) |
Amounts reclassified from AOCI | | | 8.3 | | | | — | | | | (0.1 | ) | | | (0.9 | ) | | | 7.3 | |
| | | | | | | | | | | | | | | | | | | | |
| Other comprehensive income/(loss) | | | 19.7 | | | | (1.1 | ) | | | (125.3 | ) | | | 2.4 | | | | (104.3 | ) |
| | | | | | | | | | | | | | | | | | | | |
| Balance December 31, 2015 | | $ | (85.7 | ) | | $ | (1.1 | ) | | $ | (256.0 | ) | | $ | 3.3 | | | $ | (339.5 | ) |
| | | | | | | | | | | | | | | | | | | | |
NOTE 13 | PENSION AND OTHER RETIREMENT BENEFITS |
U.S. Plans
Moody’s maintains funded and unfunded noncontributory Defined Benefit Pension Plans. The U.S. plans provide defined benefits using a cash balance formula based on years of service and career average salary or final average pay for selected executives. The Company also provides certain healthcare and life insurance benefits for retired U.S. employees. The retirement healthcare plans are contributory; the life insurance plans are noncontributory. Moody’s funded and unfunded U.S. pension plans, the U.S. retirement healthcare plans and the U.S. retirement life insurance plans are collectively referred to herein as the “Retirement Plans”. The U.S. retirement healthcare plans and the U.S. retirement life insurance plans are collectively referred to herein as the “Other Retirement Plans”. Effective at the Distribution Date, Moody’s assumed responsibility for the pension and other retirement benefits relating to its active employees. New D&B has assumed responsibility for the Company’s retirees and vested terminated employees as of the Distribution Date.
Through 2007, substantially all U.S. employees were eligible to participate in the Company’s DBPPs. Effective January 1, 2008, the Company no longer offers DBPPs to U.S. employees hired or rehired on or after January 1, 2008 and new hires in the U.S. instead will receive a retirement contribution in similar benefit value under the Company’s Profit Participation Plan. Current participants of the Company’s Retirement Plans and Other Retirement Plans continue to accrue benefits based on existing plan benefit formulas.
Following is a summary of changes in benefit obligations and fair value of plan assets for the Retirement Plans for the years ended December 31:
| | | | | | | | | | | | | | | | |
| | | Pension Plans | | | Other Retirement Plans | |
| | | | |
| | | 2017 | | | 2016 | | | 2017 | | | 2016 | |
| Change in benefit obligation: | | | | | | | | | | | | | | | | |
Benefit obligation, beginning of the period | | $ | (489.5 | ) | | $ | (459.2 | ) | | $ | (29.5 | ) | | $ | (27.0 | ) |
Service cost | | | (18.4 | ) | | | (20.1 | ) | | | (2.5 | ) | | | (2.2 | ) |
Interest cost | | | (18.5 | ) | | | (18.2 | ) | | | (1.1 | ) | | | (1.0 | ) |
Plan participants’ contributions | | | — | | | | — | | | | (0.4 | ) | | | (0.4 | ) |
Benefits paid | | | 15.0 | | | | 9.9 | | | | 1.4 | | | | 0.9 | |
Actuarial gain (loss) | | | 7.4 | | | | 4.2 | | | | (0.1 | ) | | | 0.7 | |
Assumption changes | | | (14.1 | ) | | | (6.1 | ) | | | 1.0 | | | | (0.5 | ) |
| | | | | | | | | | | | | | | | |
Benefit obligation, end of the period | | $ | (518.1 | ) | | $ | (489.5 | ) | | $ | (31.2 | ) | | $ | (29.5 | ) |
| | | | | | | | | | | | | | | | |
| Change in plan assets: | | | | | | | | | | | | | | | | |
Fair value of plan assets, beginning of the period | | $ | 297.1 | | | $ | 260.9 | | | $ | — | | | $ | — | |
Actual return on plan assets | | | 44.3 | | | | 19.7 | | | | — | | | | — | |
Benefits paid | | | (15.0 | ) | | | (9.9 | ) | | | (1.4 | ) | | | (0.9 | ) |
Employer contributions | | | 31.0 | | | | 26.4 | | | | 1.0 | | | | 0.5 | |
Plan participants’ contributions | | | — | | | | — | | | | 0.4 | | | | 0.4 | |
| | | | | | | | | | | | | | | | |
Fair value of plan assets, end of the period | | $ | 357.4 | | | $ | 297.1 | | | $ | — | | | $ | — | |
| | | | | | | | | | | | | | | | |
| Funded Status of the plans | | $ | (160.7 | ) | | $ | (192.4 | ) | | $ | (31.2 | ) | | $ | (29.5 | ) |
| | | | | | | | | | | | | | | | |
| Amounts recorded on the consolidated balance sheets: | | | | | | | | | | | | | | | | |
Pension and retirement benefits liability – current | | $ | (4.9 | ) | | $ | (5.1 | ) | | $ | (1.0 | ) | | $ | (1.0 | ) |
Pension and retirement benefits liability – non current | | | (155.8 | ) | | | (187.3 | ) | | | (30.2 | ) | | | (28.5 | ) |
| | | | | | | | | | | | | | | | |
| Net amount recognized | | $ | (160.7 | ) | | $ | (192.4 | ) | | $ | (31.2 | ) | | $ | (29.5 | ) |
| | | | | | | | | | | | | | | | |
| Accumulated benefit obligation, end of the period | | $ | (461.5 | ) | | $ | (433.1 | ) | | | | | | | | |
| | | | | | | | | | | | | | | | |
The following information is for those pension plans with an accumulated benefit obligation in excess of plan assets:
| | | | | | | | |
| | | December 31, | |
| | | 2017 | | | 2016 | |
| | |
| Aggregate projected benefit obligation | | $ | 518.1 | | | $ | 489.5 | |
| Aggregate accumulated benefit obligation | | $ | 461.5 | | | $ | 433.1 | |
| Aggregate fair value of plan assets | | $ | 357.4 | | | $ | 297.1 | |
The following table summarizes thepre-tax net actuarial losses and prior service cost recognized in AOCI for the Company’s Retirement Plans as of December 31:
| | | | | | | | | | | | | | | | |
| | | Pension Plans | | | Other Retirement Plans | |
| | | | |
| | | 2017 | | | 2016 | | | 2017 | | | 2016 | |
| Net actuarial losses | | $ | (104.0 | ) | | $ | (133.9 | ) | | $ | (3.0 | ) | | $ | (4.0 | ) |
| Net prior service costs | | | 4.5 | | | | 4.5 | | | | 0.6 | | | | 0.9 | |
| | | | | | | | | | | | | | | | |
| Total recognized in AOCI – pretax | | $ | (99.5 | ) | | $ | (129.4 | ) | | $ | (2.4 | ) | | $ | (3.1 | ) |
| | | | | | | | | | | | | | | | |
The following table summarizes the estimatedpre-tax net actuarial losses and prior service cost for the Company’s Retirement Plans that will be amortized from AOCI and recognized as components of net periodic expense during the next fiscal year:
| | | | | | | | |
| | |
| | | Pension Plans | | | Other Retirement Plans | |
| Net actuarial losses | | $ | 6.0 | | | $ | — | |
| Net prior service costs | | | (0.3 | ) | | | (0.3 | ) |
| | | | | | | | |
| Total to be recognized as components of net periodic expense | | $ | 5.7 | | | $ | (0.3 | ) |
| | | | | | | | |
Net periodic benefit expenses recognized for the Retirement Plans for years ended December 31:
| | | | | | | | | | | | | | | | | | | | | | | | |
| | | Pension Plans | | | Other Retirement Plans | |
| | | | | | |
| | | 2017 | | | 2016 | | | 2015 | | | 2017 | | | 2016 | | | 2015 | |
| Components of net periodic expense | | | | | | | | | | | | | | | | | | | | | | | | |
| Service cost | | $ | 18.4 | | | $ | 20.1 | | | $ | 21.6 | | | $ | 2.5 | | | $ | 2.2 | | | $ | 2.2 | |
| Interest cost | | | 18.5 | | | | 18.2 | | | | 16.9 | | | | 1.1 | | | | 1.0 | | | | 1.0 | |
| Expected return on plan assets | | | (16.5 | ) | | | (17.0 | ) | | | (14.4 | ) | | | — | | | | — | | | | — | |
| Amortization of net actuarial loss from earlier periods | | | 8.8 | | | | 9.8 | | | | 12.5 | | | | 0.1 | | | | 0.2 | | | | 0.3 | |
| Amortization of net prior service costs from earlier periods | | | — | | | | 0.1 | | | | 0.7 | | | | (0.3 | ) | | | (0.3 | ) | | | — | |
| | | | | | | | | | | | | | | | | | | | | | | | |
| Net periodic expense | | $ | 29.2 | | | $ | 31.2 | | | $ | 37.3 | | | $ | 3.4 | | | $ | 3.1 | | | $ | 3.5 | |
| | | | | | | | | | | | | | | | | | | | | | | | |
The following table summarizes thepre-tax amounts recorded in OCI related to the Company’s Retirement Plans for the years ended December 31:
| | | | | | | | | | | | | | | | | | | | | | | | |
| | | Pension Plans | | | Other Retirement Plans | |
| | | 2017 | | | 2016 | | | 2015 | | | 2017 | | | 2016 | | | 2015 | |
| Amortization of net actuarial losses | | $ | 8.8 | | | $ | 9.8 | | | $ | 12.5 | | | $ | 0.1 | | | $ | 0.2 | | | $ | 0.3 | |
| Amortization of prior service costs | | | — | | | | 0.1 | | | | 0.7 | | | | (0.3 | ) | | | (0.3 | ) | | | — | |
| Prior service costs | | | — | | | | — | | | | 6.5 | | | | — | | | | — | | | | 1.2 | |
| Net actuarial gain (loss) arising during the period | | | 21.1 | | | | 0.8 | | | | 8.4 | | | | 0.9 | | | | 0.2 | | | | 1.3 | |
| | | | | | | | | | | | | | | | | | | | | | | | |
| Total recognized inOCI – pre-tax | | $ | 29.9 | | | $ | 10.7 | | | $ | 28.1 | | | $ | 0.7 | | | $ | 0.1 | | | $ | 2.8 | |
| | | | | | | | | | | | | | | | | | | | | | | | |
ADDITIONAL INFORMATION:
Assumptions — Retirement Plans
Weighted-average assumptions used to determine benefit obligations at December 31:
| | | | | | | | | | | | | | | | |
| | | Pension Plans | | | Other Retirement Plans | |
| | | | |
| | | 2017 | | | 2016 | | | 2017 | | | 2016 | |
| Discount rate | | | 3.46 | % | | | 3.89 | % | | | 3.45 | % | | | 3.85 | % |
| Rate of compensation increase | | | 3.71 | % | | | 3.72 | % | | | — | | | | — | |
Weighted-average assumptions used to determine net periodic benefit expense for years ended December 31:
| | | | | | | | | | | | | | | | | | | | | | | | |
| | | Pension Plans | | | Other Retirement Plans | |
| | 2017 | | | 2016 | | | 2015 | | | 2017 | | | 2016 | | | 2015 | |
| Discount rate | | | 3.89 | % | | | 4.04 | % | | | 3.78 | % | | | 3.85 | % | | | 4.00 | % | | | 3.65 | % |
| Expected return on plan assets | | | 5.40 | % | | | 6.10 | % | | | 5.80 | % | | | — | | | | — | | | | — | |
| Rate of compensation increase | | | 3.72 | % | | | 3.74 | % | | | 3.76 | % | | | — | | | | — | | | | — | |
The expected rate of return on plan assets represents the Company’s best estimate of the long-term return on plan assets and is determined by using a building block approach, which generally weighs the underlying long-term expected rate of return for each major asset class based on their respective allocation target within the plan portfolio, net of plan paid expenses. As the assumption reflects a long-term time horizon, the plan performance in any one particular year does not, by itself, significantly influence the Company’s evaluation. For 2017, the expected rate of return used in calculating the net periodic benefit costs was 5.40%. For 2018, the Company’s expected rate of return assumption is 4.50% to reflect the Company’s current view of long-term capital market outlook. In addition, the Company has updated its mortality assumption by adopting the newly released mortality improvement scaleMP-2017 to accompany theRP-2014 mortality tables to reflect the latest information regarding future mortality expectations by the Society of Actuaries. Additionally, the assumed healthcare cost trend rate assumption is not material to the valuation of the other retirement plans.
Plan Assets
Moody’s investment objective for the assets in the funded pension plan is to earn total returns that will minimize future contribution requirements over the long-term within a prudent level of risk. The Company works with its independent investment consultants to determine asset allocation targets for its pension plan investment portfolio based on its assessment of business and financial conditions, demographic and actuarial data, funding characteristics, and related risk factors. Other relevant factors, including historical and forward looking views of inflation and capital market returns, are also considered. Risk management practices include monitoring plan asset performance, diversification across asset classes and investment styles, and periodic rebalancing toward asset allocation targets. The Company’s Asset Management Committee is responsible for overseeing the investment activities of the plan, which includes selecting acceptable asset classes, defining allowable ranges of holdings by asset class and by individual investment managers, defining acceptable securities within each asset class, and establishing investment performance expectations. Ongoing monitoring of the plan includes reviews of investment performance and managers on a regular basis, annual liability measurements, and periodic asset/liability studies.
In 2014, the Company implemented a revised investment policy, which uses risk-controlled investment strategies by increasing the plan’s asset allocation to fixed income securities and specifying ranges of acceptable target allocation by asset class based on different levels of the plan’s accounting funded status. In addition, the investment policy also requires the investment-grade fixed income assets be rebalanced between shorter and longer duration bonds as the interest rate environment changes. This revised investment policy is designed to help protect the plan’s funded status and to limit volatility of the Company’s contributions. Based on the revised policy, the Company’s current target asset allocation is approximately 53% (range of 48% to 58%) in equity securities, 40% (range of 35% to 45%) in fixed income securities and 7% (range of 4% to 10%) in other investments and the plan will use a combination of active and passive investment strategies and different investment styles for its investment portfolios within each asset class. The plan’s equity investments are diversified across U.S. andnon-U.S. stocks of small, medium and large capitalization. The plan’s fixed income investments are diversified principally across U.S. andnon-U.S. government and corporate bonds which are expected to help reduce plan exposure to interest rate variation and to better align assets with obligations. The plan also invests in other fixed income investments such as debts rated below investment grade, emerging market debt, and convertible securities. The plan’s other investment, which is made through a private real estate debt fund, is expected to provide additional diversification benefits and absolute return enhancement to the plan assets.
Fair value of the assets in the Company’s funded pension plan by asset category at December 31, 2017 and 2016 are as follows:
| | | | | | | | | | | | | | | | | | | | |
| | | Fair Value Measurement as of December 31, 2017 | |
| | | | | |
| Asset Category | | Balance | | | Level 1 | | | Level 2 | | | Measured
using NAV
practical
expedient(a) | | | % of total
assets | |
| Cash and cash equivalent | | $ | 16.5 | | | $ | — | | | $ | 16.5 | | | $ | — | | | | 4 | % |
| | | | | | | | | | | | | | | | | | | | |
| Common/collective trust funds—equity securities | | | | | | | | | | | | | | | | | | | | |
U.S.large-cap | | | 140.3 | | | | — | | | | 140.3 | | | | — | | | | 39 | % |
U.S. small andmid-cap | | | 23.3 | | | | — | | | | 23.3 | | | | — | | | | 7 | % |
Emerging markets | | | 28.1 | | | | — | | | | 28.1 | | | | — | | | | 8 | % |
| | | | | | | | | | | | | | | | | | | | |
| Total equity investments | | | 191.7 | | | | — | | | | 191.7 | | | | — | | | | 54 | % |
| | | | | | | | | | | | | | | | | | | | |
| Emerging markets bond fund | | | 12.1 | | | | 12.1 | | | | — | | | | — | | | | 3 | % |
| Common/collective trust funds—fixed income securities | | | | | | | | | | | | | | | | | | | | |
Intermediate-term investment grade U.S. government/ corporate bonds | | | 83.7 | | | | — | | | | 83.7 | | | | — | | | | 23 | % |
U.S. Treasury Inflation-Protected Securities (TIPs) | | | 13.4 | | | | — | | | | 13.4 | | | | — | | | | 4 | % |
| Private investment fund—convertible securities | | | 9.9 | | | | — | | | | — | | | | 9.9 | | | | 3 | % |
| Private investment fund—high yield securities | | | 9.7 | | | | — | | | | — | | | | 9.7 | | | | 3 | % |
| | | | | | | | | | | | | | | | | | | | |
| Total fixed-income investments | | | 128.8 | | | | 12.1 | | | | 97.1 | | | | 19.6 | | | | 36 | % |
| | | | | | | | | | | | | | | | | | | | |
| Other investment—private real estate debt fund | | | 20.4 | | | | — | | | | — | | | | 20.4 | | | | 6 | % |
| | | | | | | | | | | | | | | | | | | | |
| Total Assets | | $ | 357.4 | | | $ | 12.1 | | | $ | 305.3 | | | $ | 40.0 | | | | 100 | % |
| | | | | | | | | | | | | | | | | | | | |
| | | | | | | | | | | | | | | | | | | | |
| | | Fair Value Measurement as of December 31, 2016 | |
| | | | | |
| Asset Category | | Balance | | | Level 1 | | | Level 2 | | | Measured
using NAV
practical
expedient(a) | | | % of total
assets | |
| Cash and cash equivalent | | $ | 1.2 | | | $ | — | | | $ | 1.2 | | | $ | — | | | | — | |
| | | | | | | | | | | | | | | | | | | | |
| Common/collective trust funds—equity securities | | | | | | | | | | | | | | | | | | | | |
U.S.large-cap | | | 130.1 | | | | — | | | | 130.1 | | | | — | | | | 44 | % |
U.S. small andmid-cap | | | 19.7 | | | | — | | | | 19.7 | | | | — | | | | 7 | % |
Emerging markets | | | 20.8 | | | | — | | | | 20.8 | | | | — | | | | 7 | % |
| | | | | | | | | | | | | | | | | | | | |
| Total equity investments | | | 170.6 | | | | — | | | | 170.6 | | | | — | | | | 58 | % |
| | | | | | | | | | | | | | | | | | | | |
| Emerging markets bond fund | | | 11.4 | | | | 11.4 | | | | — | | | | — | | | | 4 | % |
| Common/collective trust funds—fixed income securities | | | | | | | | | | | | | | | | | | | | |
Intermediate-term investment grade U.S. government/ corporate bonds | | | 74.3 | | | | — | | | | 74.3 | | | | — | | | | 25 | % |
U.S. Treasury Inflation-Protected Securities (TIPs) | | | 13.1 | | | | — | | | | 13.1 | | | | — | | | | 4 | % |
| Private investment fund—convertible securities | | | 9.1 | | | | — | | | | — | | | | 9.1 | | | | 3 | % |
| Private investment fund—high yield securities | | | 9.0 | | | | — | | | | — | | | | 9.0 | | | | 3 | % |
| | | | | | | | | | | | | | | | | | | | |
| Total fixed-income investments | | | 116.9 | | | | 11.4 | | | | 87.4 | | | | 18.1 | | | | 39 | % |
| | | | | | | | | | | | | | | | | | | | |
| Other investment—private real estate fund | | | 8.4 | | | | — | | | | — | | | | 8.4 | | | | 3 | % |
| | | | | | | | | | | | | | | | | | | | |
| Total Assets | | $ | 297.1 | | | $ | 11.4 | | | $ | 259.2 | | | $ | 26.5 | | | | 100 | % |
| | | | | | | | | | | | | | | | | | | | |
(a) | Investments are measured using the net asset value per share (or its equivalent) practical expedient and have not been categorized in the fair value hierarchy. The fair value amounts presented in the table are intended to permit a reconciliation of the fair value hierarchy to the value of the total plan assets. |
Cash and cash equivalents are primarily comprised of investment in money market mutual funds. In determining fair value, Level 1 investments are valued based on quoted market prices in active markets. Investments in common/collective trust funds are valued
using the net asset value (NAV) per unit in each fund. The NAV is based on the value of the underlying investments owned by each trust, minus its liabilities, and then divided by the number of shares outstanding. Common/collective trust funds are categorized in Level 2 to the extent that they are considered to have a readily determinable fair value. Investments for which fair value is estimated by using the NAV per share (or its equivalent) as a practical expedient are not categorized in the fair value hierarchy.
Except for the Company’s U.S. funded pension plan, all of Moody’s Retirement Plans are unfunded and therefore have no plan assets.
Cash Flows
The Company contributed $25.9 million and $22.4 million to its U.S. funded pension plan during the years ended December 31, 2017 and 2016, respectively. The Company made payments of $5.1 million and $4.0 million related to its U.S. unfunded pension plan obligations during the years ended December 31, 2017 and 2016, respectively. The Company made payments of $1.0 million and $0.5 million to its Other Retirement Plans during the years ended December 31, 2017 and 2016, respectively. The Company is currently evaluating whether to make a contribution to its funded pension plan in 2018, and anticipates making payments of $4.9 million related to its unfunded U.S. pension plans and $1.0 million related to its Other Retirement Plans during the year ended December 31, 2018.
Estimated Future Benefits Payable
Estimated future benefits payments for the Retirement Plans are as follows as of year ended December 31, 2017:
| | | | | | | | |
Year Ending December 31, | | Pension Plans | | | Other Retirement
Plans | |
| 2018 | | $ | 12.2 | | | $ | 1.0 | |
| 2019 | | | 13.0 | | | | 1.1 | |
| 2020 | | | 41.4 | | | | 1.2 | |
| 2021 | | | 17.8 | | | | 1.3 | |
| 2022 | | | 19.5 | | | | 1.4 | |
| 2023 – 2027 | | $ | 135.7 | | | $ | 10.2 | |
Defined Contribution Plans
Moody’s has a Profit Participation Plan covering substantially all U.S. employees. The Profit Participation Plan provides for an employee salary deferral and the Company matches employee contributions, equal to 50% of employee contribution up to a maximum of 3% of the employee’s pay. Moody’s also makes additional contributions to the Profit Participation Plan based onyear-to-year growth in the Company’s EPS. Effective January 1, 2008, all new hires are automatically enrolled in the Profit Participation Plan when they meet eligibility requirements unless they decline participation. As the Company’s U.S. DBPPs are closed to new entrants effective January 1, 2008, all eligible new hires will instead receive a retirement contribution into the Profit Participation Plan in value similar to the pension benefits. Additionally, effective January 1, 2008, the Company implemented a deferred compensation plan in the U.S., which is unfunded and provides for employee deferral of compensation and Company matching contributions related to compensation in excess of the IRS limitations on benefits and contributions under qualified retirement plans. Total expenses associated with U.S. defined contribution plans were $43.3 million, $28.3 million and $21.1 million in 2017, 2016, and 2015, respectively. The full year 2017 expense includes an accrued profit sharing contribution.
Effective January 1, 2008, Moody’s has designated the Moody’s Stock Fund, an investment option under the Profit Participation Plan, as an Employee Stock Ownership Plan and, as a result, participants in the Moody’s Stock Fund may receive dividends in cash or may reinvest such dividends into the Moody’s Stock Fund. Moody’s paid approximately $0.7 million during each of the years ended December 31, 2017, 2016 and 2015, respectively, for the Company’s common shares held by the Moody’s Stock Fund. The Company records the dividends as a reduction of retained earnings in the Consolidated Statements of Shareholders’ Equity (Deficit). The Moody’s Stock Fund held approximately 457,000 and 471,000 shares of Moody’s common stock at December 31, 2017 and 2016, respectively.
International Plans
Certain of the Company’s international operations provide pension benefits to their employees. Thenon-U.S. defined benefit pension plans are immaterial. For defined contribution plans, company contributions are primarily determined as a percentage of employees’ eligible compensation. Moody’s also makes contributions tonon-U.S. employees under a profit sharing plan which is based onyear-to-year growth in the Company’s diluted EPS. Expenses related to these defined contribution plans for the years ended December 31, 2017, 2016 and 2015 were $23.9 million, $24.5 million and $26.7 million, respectively.
NOTE 14 | STOCK-BASED COMPENSATION PLANS |
Under the 1998 Plan, 33.0 million shares of the Company’s common stock have been reserved for issuance. The 2001 Plan, which is shareholder approved, permits the granting of up to 50.6 million shares, of which not more than 14.0 million shares are available for grants of awards other than stock options. The Stock Plans also provide for the granting of restricted stock. The Stock Plans provide that options are exercisable not later than ten years from the grant date. The vesting period for awards under the Stock Plans is generally
determined by the Board at the date of the grant and has been four years except for employees who are at or near retirement eligibility, as defined, for which vesting is between one and four years. Additionally, the vesting period is three years for certain performance-based restricted stock that contain a condition whereby the number of shares that ultimately vest are based on the achievement of certainnon-market based performance metrics of the Company. Options may not be granted at less than the fair market value of the Company’s common stock at the date of grant.
The Company maintains the Directors’ Plan for its Board, which permits the granting of awards in the form ofnon-qualified stock options, restricted stock or performance shares. The Directors’ Plan provides that options are exercisable not later than ten years from the grant date. The vesting period is determined by the Board at the date of the grant and is generally one year for both options and restricted stock. Under the Directors’ Plan, 1.7 million shares of common stock were reserved for issuance. Any director of the Company who is not an employee of the Company or any of its subsidiaries as of the date that an award is granted is eligible to participate in the Directors’ Plan.
Presented below is a summary of the stock-based compensation expense and associated tax benefit in the accompanying Consolidated Statements of Operations:
| | | | | | | | | | | | |
| | | Year Ended December 31, | |
| | | |
| | | 2017 | | | 2016 | | | 2015 | |
| Stock-based compensation expense | | $ | 122.9 | | | $ | 98.1 | | | $ | 87.2 | |
| Tax benefit | | $ | 13.3 | * | | $ | 31.9 | | | $ | 28.6 | |
* | Amount includes a decrease in deferred tax assets resulting from a future reduction in the U.S. federal corporate income tax rate in accordance with the Tax Act, more fully described in Note 15. |
The fair value of each employee stock option award is estimated on the date of grant using the Black-Scholes option-pricing model that uses the assumptions noted below. The expected dividend yield is derived from the annual dividend rate on the date of grant. The expected stock volatility is based on an assessment of historical weekly stock prices of the Company as well as implied volatility from Moody’s traded options. The risk-free interest rate is based on U.S. government zero coupon bonds with maturities similar to the expected holding period. The expected holding period was determined by examining historical and projected post-vesting exercise behavior activity.
The following weighted average assumptions were used for options granted:
| | | | | | | | | | | | |
| | | Year Ended December 31, | |
| | | |
| | | 2017 | | | 2016 | | | 2015 | |
| Expected dividend yield | | | 1.34 | % | | | 1.83 | % | | | 1.39 | % |
| Expected stock volatility | | | 27 | % | | | 32 | % | | | 39 | % |
| Risk-free interest rate | | | 2.19 | % | | | 1.60 | % | | | 1.88 | % |
| Expected holding period | | | 6.5 years | | | | 6.8 years | | | | 6.9 years | |
| Grant date fair value | | $ | 30.00 | | | $ | 22.98 | | | $ | 36.08 | |
A summary of option activity as of December 31, 2017 and changes during the year then ended is presented below:
| | | | | | | | | | | | | | | | |
Options | | Shares | | | Weighted
Average
Exercise Price
Per Share | | | Weighted
Average
Remaining
Contractual
Term | | | Aggregate
Intrinsic Value | |
| Outstanding, December 31, 2016 | | | 3.9 | | | $ | 49.68 | | | | | | | | | |
| Granted | | | 0.2 | | | $ | 113.80 | | | | | | | | | |
| Exercised | | | (1.2 | ) | | $ | 42.52 | | | | | | | | | |
| | | | | | | | | | | | | | | | |
| Outstanding, December 31, 2017 | | | 2.9 | | | $ | 57.48 | | | | 4.7 years | | | $ | 261.6 | |
| | | | | | | | | | | | | | | | |
| Vested and expected to vest, December 31, 2017 | | | 2.8 | | | $ | 56.50 | | | | 4.6 years | | | $ | 257.7 | |
| | | | | | | | | | | | | | | | |
| Exercisable, December 31, 2017 | | | 2.1 | | | $ | 43.30 | | | | 3.4 years | | | $ | 216.8 | |
| | | | | | | | | | | | | | | | |
The aggregate intrinsic value in the table above represents the totalpre-tax intrinsic value (the difference between Moody’s closing stock price on the last trading day of the year ended December 31, 2017 and the exercise prices, multiplied by the number ofin-the-money options) that would have been received by the option holders had all option holders exercised their options as of December 31, 2017. This amount varies based on the fair value of Moody’s stock. As of December 31, 2017 there was $6.6 million of total unrecognized compensation expense related to options. The expense is expected to be recognized over a weighted average period of 1.4 years.
The following table summarizes information relating to stock option exercises:
| | | | | | | | | | | | |
| | | Year Ended December 31, | |
| | | |
| | | 2017 | | | 2016 | | | 2015 | |
| Proceeds from stock option exercises | | $ | 48.8 | | | $ | 71.8 | | | $ | 83.9 | |
| Aggregate intrinsic value | | $ | 88.3 | | | $ | 71.3 | | | $ | 72.9 | |
| Tax benefit realized upon exercise | | $ | 31.2 | | | $ | 24.3 | | | $ | 26.0 | |
A summary of the status of the Company’s nonvested restricted stock as of December 31, 2017 and changes during the year then ended is presented below:
| | | | | | | | |
Nonvested Restricted Stock | | Shares | | | Weighted Average Grant
Date Fair Value Per Share | |
| Balance, December 31, 2016 | | | 2.4 | | | $ | 81.17 | |
Granted | | | 1.0 | | | $ | 113.48 | |
Vested | | | (1.0 | ) | | $ | 75.06 | |
Forfeited | | | (0.1 | ) | | $ | 97.06 | |
| | | | | | | | |
| Balance, December 31, 2017 | | | 2.3 | | | $ | 97.17 | |
| | | | | | | | |
As of December 31, 2017, there was $126.6 million of total unrecognized compensation expense related to nonvested restricted stock. The expense is expected to be recognized over a weighted average period of 1.6 years.
The following table summarizes information relating to the vesting of restricted stock awards:
| | | | | | | | | | | | |
| | | Year Ended December 31, | |
| | | |
| | | 2017 | | | 2016 | | | 2015 | |
| Fair value of shares vested | | $ | 110.5 | | | $ | 92.9 | | | $ | 111.9 | |
| Tax benefit realized upon vesting | | $ | 34.9 | | | $ | 29.4 | | | $ | 38.1 | |
A summary of the status of the Company’s performance-based restricted stock as of December 31, 2017 and changes during the year then ended is presented below:
| | | | | | | | |
Performance-based restricted stock | | Shares | | | Weighted Average Grant
Date Fair Value Per Share | |
| Balance, December 31, 2016 | | | 0.5 | | | $ | 80.70 | |
Granted | | | 0.2 | | | $ | 109.36 | |
Vested | | | (0.2 | ) | | $ | 76.36 | |
Adjustment to shares expected to vest* | | | 0.2 | | | $ | 98.88 | |
| | | | | | | | |
| Balance, December 31, 2017 | | | 0.7 | | | $ | 94.30 | |
| | | | | | | | |
* | Reflects an adjustment to shares expected to vest based on the Company’s projected achievement of certainnon-market based performance metrics as of December 31, 2017. |
The following table summarizes information relating to the vesting of the Company’s performance-based restricted stock awards:
| | | | | | | | | | | | |
| | | Year Ended December 31, | |
| | | |
| | | 2017 | | | 2016 | | | 2015 | |
| Fair value of shares vested | | $ | 19.5 | | | $ | 23.6 | | | $ | 43.1 | |
| Tax benefit realized upon vesting | | $ | 6.9 | | | $ | 8.4 | | | $ | 15.6 | |
As of December 31, 2017, there was $31.0 million of total unrecognized compensation expense related to this plan. The expense is expected to be recognized over a weighted average period of 1.0 years.
The Company has a policy of issuing treasury stock to satisfy shares issued under stock-based compensation plans.
In addition, the Company also sponsors the ESPP. Under the ESPP, 6.0 million shares of common stock were reserved for issuance. The ESPP allows eligible employees to purchase common stock of the Company on a monthly basis at a discount to the average of the high and the low trading prices on the New York Stock Exchange on the last trading day of each month. This discount was 5% in 2017, 2016 and 2015 resulting in the ESPP qualifying fornon-compensatory status under Topic 718 of the ASC. Accordingly, no compensation
expense was recognized for the ESPP in 2017, 2016, and 2015. The employee purchases are funded throughafter-tax payroll deductions, which plan participants can elect from one percent to ten percent of compensation, subject to the annual federal limit.
Components of the Company’s provision for income taxes are as follows:
| | | | | | | | | | | | |
| | | Year Ended December 31, | |
| | | |
| | | 2017 | | | 2016 | | | 2015 | |
| Current: | | | | | | | | | | | | |
Federal | | $ | 453.8 | | | $ | 292.9 | | | $ | 278.2 | |
State and Local | | | 30.0 | | | | 39.5 | | | | 40.1 | |
Non-U.S. | | | 207.0 | | | | 102.9 | | | | 93.6 | |
| | | | | | | | | | | | |
Total current | | | 690.8 | | | | 435.3 | | | | 411.9 | |
| | | | | | | | | | | | |
| Deferred: | | | | | | | | | | | | |
Federal | | | 155.5 | | | | (125.8 | ) | | | 14.7 | |
State and Local | | | 17.5 | | | | (20.3 | ) | | | 7.6 | |
Non-U.S. | | | (84.7 | ) | | | (7.0 | ) | | | (4.2 | ) |
| | | | | | | | | | | | |
Total deferred | | | 88.3 | | | | (153.1 | ) | | | 18.1 | |
| | | | | | | | | | | | |
| Total provision for income taxes | | $ | 779.1 | | | $ | 282.2 | | | $ | 430.0 | |
| | | | | | | | | | | | |
A reconciliation of the U.S. federal statutory tax rate to the Company’s effective tax rate on income before provision for income taxes is as follows:
| | | | | | | | | | | | |
| | | Year Ended December 31, | |
| | | |
| | | 2017 | | | 2016 | | | 2015 | |
| U.S. statutory tax rate | | | 35.0 | % | | | 35.0 | % | | | 35.0 | % |
| State and local taxes, net of federal tax benefit | | | 1.9 | | | | 2.2 | | | | 3.0 | |
| Benefit of foreign operations | | | (9.9 | ) | | | (13.3 | ) | | | (5.8 | ) |
| Settlement charge | | | — | | | | 27.4 | | | | — | |
| Legacy tax items | | | — | | | | (0.1 | ) | | | (0.2 | ) |
| U.S. Tax Act Impact | | | 17.0 | | | | — | | | | — | |
| Other | | | (0.4 | ) | | | (0.6 | ) | | | (0.8 | ) |
| | | | | | | | | | | | |
| Effective tax rate | | | 43.6 | % | | | 50.6 | % | | | 31.2 | % |
| | | | | | | | | | | | |
| Income tax paid | | $ | 366.4 | | | $ | 355.7 | | | $ | 397.4 | |
| | | | | | | | | | | | |
The source of income before provision for income taxes is as follows:
| | | | | | | | | | | | |
| | | Year Ended December 31, | |
| | | 2017 | | | 2016 | | | 2015 | |
| United States | | $ | 1,098.5 | | | $ | 37.2 | | | $ | 913.9 | |
| International | | | 688.3 | | | | 520.8 | | | | 465.7 | |
| | | | | | | | | | | | |
| Income before provision for income taxes | | $ | 1,786.8 | | | $ | 558.0 | | | $ | 1,379.6 | |
| | | | | | | | | | | | |
The components of deferred tax assets and liabilities are as follows:
| | | | | | | | |
| | | December 31, | |
| | |
| | | 2017 | | | 2016 | |
| Deferred tax assets: | | | | | | | | |
Account receivable allowances | | $ | 6.0 | | | $ | 6.0 | |
Accumulated depreciation and amortization | | | 1.2 | | | | 1.3 | |
Stock-based compensation | | | 39.6 | | | | 54.4 | |
Accrued compensation and benefits | | | 79.2 | | | | 119.3 | |
Deferred rent and construction allowance | | | 21.2 | | | | 30.1 | |
Deferred revenue | | | 41.9 | | | | 46.2 | |
Foreign net operating loss(1) | | | 13.3 | | | | 3.7 | |
Settlement Charge | | | — | | | | 163.2 | |
Legal and professional fees | | | 1.2 | | | | 4.2 | |
Restructuring | | | 0.2 | | | | 2.2 | |
Uncertain tax positions | | | 28.6 | | | | 37.3 | |
Self-insured related reserves | | | 7.5 | | | | 15.1 | |
Capitalized cost | | | 4.3 | | | | — | |
Other | | | 19.0 | | | | 4.5 | |
| | | | | | | | |
| Total deferred tax assets | | $ | 263.2 | | | $ | 487.5 | |
| | | | | | | | |
| Deferred tax liabilities: | | | | | | | | |
Accumulated depreciation and amortization of intangible assets and capitalized software | | $ | (408.8 | ) | | $ | (189.8 | ) |
Foreign earnings to be repatriated | | | — | | | | (7.5 | ) |
Capital gains | | | (25.6 | ) | | | (24.1 | ) |
Self-insured related income | | | (7.5 | ) | | | (15.1 | ) |
Stock based compensation | | | (3.3 | ) | | | (2.9 | ) |
Unrealized gain on net investment hedges - OCI | | | — | | | | (21.0 | ) |
Other liabilities | | | (3.0 | ) | | | (12.1 | ) |
| | | | | | | | |
| Total deferred tax liabilities | | | (448.2 | ) | | | (272.5 | ) |
| | | | | | | | |
| Net deferred tax (liabilities) asset | | | (185.0 | ) | | | 215.0 | |
| Valuation allowance | | | (12.8 | ) | | | (3.2 | ) |
| | | | | | | | |
| Total net deferred tax (liabilities) assets | | $ | (197.8 | ) | | $ | 211.8 | |
| | | | | | | | |
(1) | Amounts are primarily set to expire beginning in 2018, if unused. |
On December 22, 2017, the Tax Cut and Jobs Act was signed into law which resulted in significant changes to U.S. corporate tax laws. The Tax Act includes a mandatoryone-time deemed repatriation tax (“transition tax”) on previously untaxed accumulated earnings of foreign subsidiaries and beginning in 2018 reduces the statutory federal corporate income tax rate from 35% to 21%. Due to the complexities of the Tax Act, the SEC issued guidance requiring that companies provide a reasonable estimate of the impact of the Tax Act to the extent such reasonable estimate has been determined. Accordingly, the Company recorded a provisional estimate for the transition tax of $247.3 million, a portion of which will be payable over eight years, starting in 2018, and will not accrue interest. Additionally, the Company recorded a provisional estimate decreasing net deferred tax assets by $56.2 million resulting from the future reduction in the federal corporate income tax rate. Separately, a statutory tax rate reduction in Belgium resulted in a $57.9 million decrease of deferred tax liabilities pertaining to Bureau van Dijk’s acquired intangible assets.
The above provisional estimates may be impacted by a number of additional considerations, including but not limited to the issuance of regulations and our ongoing analysis of the new law.
As a result of the Tax Act, all previously undistributed foreign earnings have now been subject to U.S. tax. However, the Company intends to continue to indefinitely reinvest these earnings outside the U.S. and accordingly the Company has not provided non-U.S. deferred income taxes on these indefinitely reinvested earnings. It is not practicable to determine the amount of non-U.S. deferred taxes that might be required to be provided if such earnings were distributed in the future, due to complexities in the tax laws and in the hypothetical calculations that would have to be made.
On March 30, 2016, the FASB issued Accounting Standards Update (ASU)2016-09, Improvements to Employee Share Based Payment Accounting as more fully discussed in Note 1 to the condensed consolidated financial statements. The new guidance requires all tax effects related to share based payments to be recorded through the income statement. The Company has adopted the new guidance as
of the first quarter of 2017 and the adoption resulted in a reduction in its income tax provision of approximately $40 million, or 220BPS, for the full year of 2017.
In the first quarter of 2017, the Company adopted Accounting Standards Update2016-16, “Accounting for Income Taxes: Intra-Entity Asset Transfers of Assets Other than Inventory.” Under previous guidance, the tax effects of intra-entity asset transfers (intercompany sales) were deferred until the transferred asset was sold to a third party or otherwise recovered through use. The new guidance eliminates the exception for all intra-entity sales of assets other than inventory. Upon adoption, a cumulative-effect adjustment is recorded in retained earnings as of the beginning of the period of adoption. The net impact upon adoption is a reduction to retained earnings of $4.6 million. The Company does not expect any material impact on its future operations as a result of the adoption of this guidance.
The Company had valuation allowances of $12.8 million and $3.2 million at December 31, 2017 and 2016, respectively, related to foreign net operating losses for which realization is uncertain.
As of December 31, 2017 the Company had $389.1 million of UTPs of which $353.0 million represents the amount that, if recognized, would impact the effective tax rate in future periods. The increase in UTPs results primarily from the acquisition of Bureau van Dijk.
A reconciliation of the beginning and ending amount of UTPs is as follows:
| | | | | | | | | | | | |
| | | Year Ended December 31, | |
| | | |
| | | 2017 | | | 2016 | | | 2015 | |
| Balance as of January 1 | | $ | 199.8 | | | $ | 203.4 | | | $ | 220.3 | |
| Additions for tax positions related to the current year | | | 86.3 | | | | 21.9 | | | | 24.1 | |
| Additions for tax positions of prior years | | | 120.2 | | | | 12.4 | | | | 14.0 | |
| Reductions for tax positions of prior years | | | (4.1 | ) | | | (27.6 | ) | | | (41.6 | ) |
| Settlements with taxing authorities | | | (2.2 | ) | | | (8.3 | ) | | | (7.8 | ) |
| Lapse of statute of limitations | | | (10.9 | ) | | | (2.0 | ) | | | (5.6 | ) |
| | | | | | | | | | | | |
| Balance as of December 31 | | $ | 389.1 | | | $ | 199.8 | | | $ | 203.4 | |
| | | | | | | | | | | | |
The Company classifies interest related to UTPs in interest expense in its consolidated statements of operations. Penalties, if incurred, would be recognized in othernon-operating expenses. During the years ended December 31, 2017 and 2016, the Company incurred a net interest expense of $15.3 million and $7.8 million respectively, related to UTPs. An additional $5.6 million of accrued interest was recorded in connection with the Company’s acquisition of Bureau van Dijk. As of December 31, 2017 and 2016, the amount of accrued interest recorded in the Company’s consolidated balance sheets related to UTPs was $54.7 million and $34.1 million, respectively.
Moody’s Corporation and subsidiaries are subject to U.S. federal income tax as well as income tax in various state, local and foreign jurisdictions. The Company’s U.S. federal income tax returns for the years 2011 and 2012 are under examination and its 2013 to 2016 returns remain open to examination. The Company’s New York State income tax returns for 2011 to 2016 are under examination. The Company’s New York City tax return for 2014 is under examination and 2015 to 2016 remain open to examination. The Company’s U.K. tax return for 2012 is under examination. Tax filings in the U.K. remain open to examination for 2013 through 2016.
For current ongoing audits related to open tax years, the Company estimates that it is possible that the balance of UTPs could decrease in the next twelve months as a result of the effective settlement of these audits, which might involve the payment of additional taxes, the adjustment of certain deferred taxes and/or the recognition of tax benefits. It is also possible that new issues might be raised by tax authorities which might necessitate increases to the balance of UTPs. As the Company is unable to predict the timing of conclusion of these audits, the Company is unable to estimate the amount of changes to the balance of UTPs at this time.
The following table summarizes total indebtedness:
| | | | | | | | | | | | | | | | | | | | |
| | | December 31, 2017 | |
| | | | | |
| | | Principal
Amount | | | Fair Value of
Interest Rate
Swaps (1) | | | Unamortized
(Discount)
Premium | | | Unamortized
Debt Issuance
Costs | | | Carrying
Value | |
| Notes Payable: | | | | | | | | | | | | | | | | | | | | |
5.50% 2010 Senior Notes, due 2020 | | $ | 500.0 | | | $ | — | | | $ | (1.0 | ) | | $ | (1.2 | ) | | $ | 497.8 | |
4.50% 2012 Senior Notes, due 2022 | | | 500.0 | | | | (0.8 | ) | | | (2.0 | ) | | | (1.7 | ) | | | 495.5 | |
4.875% 2013 Senior Notes, due 2024 | | | 500.0 | | | | — | | | | (1.8 | ) | | | (2.4 | ) | | | 495.8 | |
2.75% 2014 Senior Notes(5-Year), due 2019 | | | 450.0 | | | | (2.2 | ) | | | (0.2 | ) | | | (1.1 | ) | | | 446.5 | |
5.25% 2014 Senior Notes(30-Year), due 2044 | | | 600.0 | | | | — | | | | 3.3 | | | | (5.7 | ) | | | 597.6 | |
1.75% 2015 Senior Notes, due 2027 | | | 600.4 | | | | — | | | | — | | | | (3.6 | ) | | | 596.8 | |
2.75% 2017 Senior Notes, due 2021 | | | 500.0 | | | | — | | | | (1.3 | ) | | | (3.2 | ) | | | 495.5 | |
2017 Floating Rate Senior Notes, due 2018 | | | 300.0 | | | | — | | | | — | | | | (0.5 | ) | | | 299.5 | |
2.625% 2017 Private Placement Notes, due 2023 | | | 500.0 | | | | — | | | | (1.1 | ) | | | (3.5 | ) | | | 495.4 | |
3.25% 2017 Private Placement Notes, due 2028 | | | 500.0 | | | | — | | | | (5.2 | ) | | | (3.9 | ) | | | 490.9 | |
2017 Term Loan Facility, due 2020 | | | 500.0 | | | | — | | | | — | | | | (0.7 | ) | | | 499.3 | |
Commercial Paper | | | 130.0 | | | | — | | | | (0.1 | ) | | | — | | | | 129.9 | |
| | | | | | | | | | | | | | | | | | | | |
| Total debt | | $ | 5,580.4 | | | $ | (3.0 | ) | | $ | (9.4 | ) | | $ | (27.5 | ) | | $ | 5,540.5 | |
| | | | | | | | | | | | | | | | | | | | |
| Current portion | | | | | | | | | | | | | | | | | | | (429.4 | ) |
| | | | | | | | | | | | | | | | | | | | |
| Total long-term debt | | | | | | | | | | | | | | | | | | $ | 5,111.1 | |
| | | | | | | | | | | | | | | | | | | | |
| | | December 31, 2016 | |
| | | | | |
| | | Principal
Amount | | | Fair Value of
Interest Rate
Swaps (1) | | | Unamortized
(Discount)
Premium | | | Unamortized
Debt Issuance
Costs | | | Carrying
Value | |
| Notes Payable: | | | | | | | | | | | | | | | | | | | | |
6.06% Series2007-1 Notes due 2017 | | $ | 300.0 | | | $ | — | | | $ | — | | | $ | — | | | $ | 300.0 | |
5.50% 2010 Senior Notes, due 2020 | | | 500.0 | | | | 5.5 | | | | (1.3 | ) | | | (1.6 | ) | | | 502.6 | |
4.50% 2012 Senior Notes, due 2022 | | | 500.0 | | | | (0.2 | ) | | | (2.4 | ) | | | (2.1 | ) | | | 495.3 | |
4.875% 2013 Senior Notes, due 2024 | | | 500.0 | | | | — | | | | (2.1 | ) | | | (2.7 | ) | | | 495.2 | |
2.75% 2014 Senior Notes(5-Year), due 2019 | | | 450.0 | | | | 0.9 | | | | (0.4 | ) | | | (1.7 | ) | | | 448.8 | |
5.25% 2014 Senior Notes(30-Year), due 2044 | | | 600.0 | | | | — | | | | 3.3 | | | | (5.9 | ) | | | 597.4 | |
1.75% 2015 Senior Notes, due 2027 | | | 527.4 | | | | — | | | | — | | | | (3.7 | ) | | | 523.7 | |
| | | | | | | | | | | | | | | | | | | | |
| Total long-term debt | | $ | 3,377.4 | | | $ | 6.2 | | | $ | (2.9 | ) | | $ | (17.7 | ) | | $ | 3,363.0 | |
| | | | | | | | | | | | | | | | | | | | |
| Current portion | | | | | | | | | | | | | | | | | | | (300.0 | ) |
| | | | | | | | | | | | | | | | | | | | |
| Total long-term debt | | | | | | | | | | | | | | | | | | $ | 3,063.0 | |
| | | | | | | | | | | | | | | | | | | | |
(1) | The Company has entered into interest rate swaps on the 2010 Senior Notes, the 2012 Senior Notes and the 2014 Senior Notes(5-Year) which are more fully discussed in Note 5 above. |
Term Loan Facility
On June 6, 2017, the Company entered into a three-year term loan facility with the capacity to borrow up to $500.0 million. On August 8, 2017, the Company borrowed $500 million under the 2017 Term Loan for which the proceeds were used to fund the acquisition of Bureau van Dijk and to pay acquisition-related fees and expenses. At the Company’s election, interest on borrowings under the 2017 Term Loan is payable at rates that are based on either (a) Alternate Base Rate (as defined in the 2017 Term Loan Facility agreement) plus an applicable rate (ranging from 0 BPS to 50 BPS per annum) or (b) the Adjusted LIBO Rate (as defined in the 2017 Term Loan Facility agreement) plus an applicable rate (ranging from 87.5 BPS to 150 BPS per annum), in each case, depending on the Company’s index debt rating, as set forth in the 2017 Term Loan agreement.
The 2017 Term Loan contains covenants that, among other things, restrict the ability of the Company to engage in mergers, consolidations, asset sales, transactions with affiliates, sale and leaseback transactions or to incur liens, with exceptions as set forth in the 2017 Term Loan Facility agreement. The 2017 Term Loan also contains a financial covenant that requires the Company to maintain a
debt to EBITDA ratio of not more than: (i) 4.5 to 1.0 as of the end of each fiscal quarter ending on September 30, 2017, December 31, 2017 and March 31, 2018 and (ii) 4.0 to 1.0 as of the end of the fiscal quarter ended on June 30, 2018. The 2017 Term Loan also contains customary events of default.
Credit Facility
On May 11, 2015, the Company entered into a five-year senior, unsecured revolving credit facility with the capacity to borrow up to $1 billion. This replaced the $1 billion five-year 2012 Facility that was scheduled to expire in April 2017. On June 6, 2017, the Company entered into an amendment to the 2015 Facility. Pursuant to the amendment, the applicable rate for borrowings under the 2015 Facility will range from 0 BPS to 32.5 BPS per annum for Alternate Base Rate loans (as defined in the 2015 Facility agreement) and 79.5 BPS to 132.5 BPS per annum for Eurocurrency loans (as defined in the 2015 Facility agreement) depending on the Company’s ratio of total debt to EBITDA. In addition, the Company also pays quarterly facility fees, regardless of borrowing activity under the 2015 Facility. Pursuant to the amendment, the facility fee paid by the Company ranges from 8 BPS to 17.5 BPS on the daily amount of commitments (whether used or unused), in each case, depending on the Company’s index debt rating. The amendment also modifies, among other things, the existing financial covenant, so that, the Company’s debt to EBITDA ratio shall not exceed 4.5 to 1.0 as of the end of each fiscal quarter ending on September 30, 2017, December 31, 2017 and March 31, 2018 and shall not exceed 4.0 to 1.0 as of the end of the fiscal quarter ended on June 30, 2018 and each fiscal quarter thereafter. Upon the occurrence of certain financial or economic events, significant corporate events or certain other events of default constituting a default under the 2015 Facility, all loans outstanding under the 2015 Facility (including accrued interest and fees payable thereunder) may be declared immediately due and payable and all lending commitments under the 2015 Facility may be terminated. In addition, certain other events of default under the 2015 Facility would automatically result in amounts outstanding becoming immediately due and payable and the termination of all lending commitments.
Commercial Paper
On August 3, 2016, the Company entered into a private placement commercial paper program under which the Company may issue CP notes up to a maximum amount of $1.0 billion. Borrowings under the CP Program are backstopped by the 2015 Facility. Amounts under the CP Program may bere-borrowed. The maturity of the CP Notes will vary, but may not exceed 397 days from the date of issue. The CP Notes are sold at a discount from par, or alternatively, sold at par and bear interest at rates that will vary based upon market conditions. The rates of interest will depend on whether the CP Notes will be a fixed or floating rate. The interest on a floating rate may be based on the following: (a) certificate of deposit rate; (b) commercial paper rate; (c) the federal funds rate; (d) the LIBOR; (e) prime rate; (f) Treasury rate; or (g) such other base rate as may be specified in a supplement to the private placement agreement. The CP Program contains certain events of default including, among other things:non-payment of principal, interest or fees; entrance into any form of moratorium; and bankruptcy and insolvency events, subject in certain instances to cure periods. As of December 31, 2017, the Company has CP borrowings outstanding of $130 million with a weighted average maturity date at the time of issuance of 30 days. At December 31, 2017, the weighted average remaining maturity and interest rate on CP outstanding was 15 days and 1.76% respectively.
Notes Payable
On September 7, 2007, the Company issued and sold through a private placement transaction, $300.0 million aggregate principal amount of its 6.06% Series2007-1 Senior Unsecured Notes due 2017 pursuant to the 2007 Agreement. The Series2007-1 Notes had aten-year term and bore interest at an annual rate of 6.06%, payable semi-annually on March 7 and September 7. The Company could prepay the Series2007-1 Notes, in whole or in part, at any time at a price equal to 100% of the principal amount being prepaid, plus accrued and unpaid interest and a Make Whole Amount. In the first quarter of 2017, the Company repaid the Series2007-1 Notes along with a Make-Whole Amount of approximately $7 million.
On August 19, 2010, the Company issued $500 million aggregate principal amount of senior unsecured notes in a public offering. The 2010 Senior Notes bear interest at a fixed rate of 5.50% and mature on September 1, 2020. Interest on the 2010 Senior Notes is due semi-annually on September 1 and March 1 of each year, commencing March 1, 2011. The Company may prepay the 2010 Senior Notes, in whole or in part, at any time at a price equal to 100% of the principal amount being prepaid, plus accrued and unpaid interest and a Make-Whole Amount. Additionally, at the option of the holders of the notes, the Company may be required to purchase all or a portion of the notes upon occurrence of a “Change of Control Triggering Event,” as defined in the 2010 Indenture, at a price equal to 101% of the principal amount thereof, plus accrued and unpaid interest to the date of purchase. The 2010 Indenture contains covenants that limit the ability of the Company and certain of its subsidiaries to, among other things, incur or create liens and enter into sale and leaseback transactions. In addition, the 2010 Indenture contains a covenant that limits the ability of the Company to consolidate or merge with another entity or to sell all or substantially all of its assets to another entity. The 2010 Indenture contains customary default provisions. In addition, an event of default will occur if the Company or certain of its subsidiaries fail to pay the principal of any indebtedness (as defined in the 2010 Indenture) when due at maturity in an aggregate amount of $50 million or more, or a
default occurs that results in the acceleration of the maturity of the Company’s or certain of its subsidiaries’ indebtedness in an aggregate amount of $50 million or more. Upon the occurrence and during the continuation of an event of default under the 2010 Indenture, the notes may become immediately due and payable either automatically or by the vote of the holders of more than 25% of the aggregate principal amount of all of the notes then outstanding.
On November 4, 2011, in connection with the acquisition of Copal, a subsidiary of the Company issued a $14.2 millionnon-interest bearing note to the sellers which represented a portion of the consideration transferred to acquire the Copal entities. If a seller subsequently transfers to the Company all of its shares, the Company must repay the seller its proportion of the principal on the later of (i) the fourth anniversary date of the note or (ii) within a time frame set forth in the acquisition agreement relating to the resolution of certain income tax uncertainties pertaining to the transaction. The Company has the right to offset payment of the note against certain indemnification assets associated with UTPs related to the acquisition. Accordingly, the Company has offset the liability for this note against the indemnification asset, thus no balance for this note is carried on the Company’s consolidated balance sheet at December 31, 2017 and 2016. In the event that the Company would not be required to settle amounts related to the UTPs, the Company would be required to pay the sellers the principal in accordance with the note agreement. The Company may prepay the note in accordance with certain terms set forth in the acquisition agreement.
On August 20, 2012, the Company issued $500 million aggregate principal amount of unsecured notes in a public offering. The 2012 Senior Notes bear interest at a fixed rate of 4.50% and mature on September 1, 2022. Interest on the 2012 Senior Notes is due semi-annually on September 1 and March 1 of each year, commencing March 1, 2013. The Company may prepay the 2012 Senior Notes, in whole or in part, at any time at a price equal to 100% of the principal amount being prepaid, plus accrued and unpaid interest and a Make-Whole Amount. Additionally, at the option of the holders of the notes, the Company may be required to purchase all or a portion of the notes upon occurrence of a “Change of Control Triggering Event,” as defined in the 2012 Indenture, at a price equal to 101% of the principal amount thereof, plus accrued and unpaid interest to the date of purchase. The 2012 Indenture contains covenants that limit the ability of the Company and certain of its subsidiaries to, among other things, incur or create liens and enter into sale and leaseback transactions. In addition, the 2012 Indenture contains a covenant that limits the ability of the Company to consolidate or merge with another entity or to sell all or substantially all of its assets to another entity. The 2012 Indenture contains customary default provisions. In addition, an event of default will occur if the Company or certain of its subsidiaries fail to pay the principal of any indebtedness (as defined in the 2012 Indenture) when due at maturity in an aggregate amount of $50 million or more, or a default occurs that results in the acceleration of the maturity of the Company’s or certain of its subsidiaries’ indebtedness in an aggregate amount of $50 million or more. Upon the occurrence and during the continuation of an event of default under the 2012 Indenture, the 2012 Senior notes may become immediately due and payable either automatically or by the vote of the holders of more than 25% of the aggregate principal amount of all of the notes then outstanding.
On August 12, 2013, the Company issued $500 million aggregate principal amount of senior unsecured notes in a public offering. The 2013 Senior Notes bear interest at a fixed rate of 4.875% and mature on February 15, 2024. Interest on the 2013 Senior Notes is due semi-annually on February 15 and August 15 of each year, commencing February 15, 2014. The Company may prepay the 2013 Senior Notes, in whole or in part, at any time at a price equal to 100% of the principal amount being prepaid, plus accrued and unpaid interest and a Make-Whole Amount. Notwithstanding the immediately preceding sentence, the Company may redeem the 2013 Senior Notes, in whole or in part, at any time or from time to time on or after November 15, 2023 (three months prior to their maturity), at a redemption price equal to 100% of the principal amount of the notes to be redeemed, plus accrued and unpaid interest, if any, to, but excluding the redemption date. Additionally, at the option of the holders of the notes, the Company may be required to purchase all or a portion of the notes upon occurrence of a “Change of Control Triggering Event,” as defined in the 2013 Indenture, at a price equal to 101% of the principal amount thereof, plus accrued and unpaid interest to the date of purchase. The 2013 Indenture contains covenants that limit the ability of the Company and certain of its subsidiaries to, among other things, incur or create liens and enter into sale and leaseback transactions. In addition, the 2013 Indenture contains a covenant that limits the ability of the Company to consolidate or merge with another entity or to sell all or substantially all of its assets to another entity. The 2013 Indenture contains customary default provisions. In addition, an event of default will occur if the Company or certain of its subsidiaries fail to pay the principal of any indebtedness (as defined in the 2013 Indenture) when due at maturity in an aggregate amount of $50 million or more, or a default occurs that results in the acceleration of the maturity of the Company’s or certain of its subsidiaries’ indebtedness in an aggregate amount of $50 million or more. Upon the occurrence and during the continuation of an event of default under the 2013 Indenture, the 2013 Senior Notes may become immediately due and payable either automatically or by the vote of the holders of more than 25% of the aggregate principal amount of all of the notes then outstanding.
On July 16, 2014, the Company issued $300 million aggregate principal amount of senior unsecured notes in a public offering. The 2014 Senior Notes(30-year) bear interest at a fixed rate of 5.25% and mature on July 15, 2044. Interest on the 2014 Senior Notes(30-year) is due semi-annually on January 15 and July 15 of each year, commencing January 15, 2015. The Company may prepay the 2014 Senior Notes(30-year), in whole or in part, at any time at a price equal to 100% of the principal amount being prepaid, plus
accrued and unpaid interest and a Make-Whole Amount. Additionally, at the option of the holders of the notes, the Company may be required to purchase all or a portion of the notes upon occurrence of a “Change of Control Triggering Event,” as defined in the 2014 Indenture, at a price equal to 101% of the principal amount thereof, plus accrued and unpaid interest to the date of purchase. The 2014 Indenture contains covenants that limit the ability of the Company and certain of its subsidiaries to, among other things, incur or create liens and enter into sale and leaseback transactions. In addition, the 2014 Indenture contains a covenant that limits the ability of the Company to consolidate or merge with another entity or to sell all or substantially all of its assets to another entity. The 2014 Indenture contains customary default provisions. In addition, an event of default will occur if the Company or certain of its subsidiaries fail to pay the principal of any indebtedness (as defined in the 2014 Indenture) when due at maturity in an aggregate amount of $50 million or more, or a default occurs that results in the acceleration of the maturity of the Company’s or certain of its subsidiaries’ indebtedness in an aggregate amount of $50 million or more. Upon the occurrence and during the continuation of an event of default under the 2014 Indenture, the 2014 Senior Notes(30-year) may become immediately due and payable either automatically or by the vote of the holders of more than 25% of the aggregate principal amount of all of the notes then outstanding. On November 13, 2015, the Company issued an additional $300 million aggregate principal amount of the 2014 Senior Notes(30-year) in a public offering. This issuance constitutes an additional issuance of, and a single series with, the $300 million 2014 Senior Notes(30-year) issued on July 16, 2014 and have the same terms as the 2014 Senior Notes(30-year).
On July 16, 2014, the Company issued $450 million aggregate principal amount of senior unsecured notes in a public offering. The 2014 Senior Notes(5-year) bear interest at a fixed rate of 2.75% and mature July 15, 2019. Interest on the 2014 Senior Notes(5-year) is due semi-annually on January 15 and July 15 of each year, commencing January 15, 2015. The Company may prepay the 2014 Senior Notes(5-year), in whole or in part, at any time at a price prior to June 15, 2019, equal to 100% of the principal amount being prepaid, plus accrued and unpaid interest and a Make-Whole Amount. Notwithstanding the immediately preceding sentence, the Company may redeem the 2014 Senior Notes(5-year), in whole or in part, at any time or from time to time on or after June 15, 2019 (one month prior to their maturity), at a redemption price equal to 100% of the principal amount of the notes to be redeemed, plus accrued and unpaid interest, if any, to, but excluding the redemption date. Additionally, at the option of the holders of the notes, the Company may be required to purchase all or a portion of the notes upon occurrence of a “Change of Control Triggering Event,” as defined in the 2014 Indenture, at a price equal to 101% of the principal amount thereof, plus accrued and unpaid interest to the date of purchase. The 2014 Indenture contains covenants that limit the ability of the Company and certain of its subsidiaries to, among other things, incur or create liens and enter into sale and leaseback transactions. In addition, the 2014 Indenture contains a covenant that limits the ability of the Company to consolidate or merge with another entity or to sell all or substantially all of its assets to another entity. The 2014 Indenture contains customary default provisions. In addition, an event of default will occur if the Company or certain of its subsidiaries fail to pay the principal of any indebtedness (as defined in the 2014 Indenture) when due at maturity in an aggregate amount of $50 million or more, or a default occurs that results in the acceleration of the maturity of the Company’s or certain of its subsidiaries’ indebtedness in an aggregate amount of $50 million or more. Upon the occurrence and during the continuation of an event of default under the 2014 Indenture, the 2014 Senior Notes(5-year) may become immediately due and payable either automatically or by the vote of the holders of more than 25% of the aggregate principal amount of all of the notes then outstanding.
On March 9, 2015, the Company issued€500 million aggregate principal amount of senior unsecured notes in a public offering. The 2015 Senior Notes bear interest at a fixed rate of 1.75% and mature on March 9, 2027. Interest on the 2015 Senior Notes is due annually on March 9 of each year, commencing March 9, 2016. The Company may prepay the 2015 Senior Notes, in whole or in part, at any time at a price equal to 100% of the principal amount being prepaid, plus accrued and unpaid interest and a Make-Whole Amount. Additionally, at the option of the holders of the notes, the Company may be required to purchase all or a portion of the notes upon occurrence of a “Change of Control Triggering Event,” as defined in the 2015 Indenture, at a price equal to 101% of the principal amount thereof, plus accrued and unpaid interest to the date of purchase. The 2015 Indenture contains covenants that limit the ability of the Company and certain of its subsidiaries to, among other things, incur or create liens and enter into sale and leaseback transactions. In addition, the 2015 Indenture contains a covenant that limits the ability of the Company to consolidate or merge with another entity or to sell all or substantially all of its assets to another entity. The 2015 Indenture contains customary default provisions. In addition, an event of default will occur if the Company or certain of its subsidiaries fail to pay the principal of any indebtedness (as defined in the 2015 Indenture) when due at maturity in an aggregate amount of $50 million or more, or a default occurs that results in the acceleration of the maturity of the Company’s or certain of its subsidiaries’ indebtedness in an aggregate amount of $50 million or more. Upon the occurrence and during the continuation of an event of default under the 2015 Indenture, the 2015 Senior Notes may become immediately due and payable either automatically or by the vote of the holders of more than 25% of the aggregate principal amount of all of the notes then outstanding. The Company has designated the entire balance of the 2015 Senior Notes as a net investment hedge as more fully discussed in Note 5.
On March 2, 2017, the Company issued $500 million aggregate principal amount of senior unsecured notes in a public offering. The 2017 Senior Notes bear interest at a fixed rate of 2.750% and mature on December 15, 2021. Interest on the 2017 Senior Notes is due semiannually on June 15 and December 15 of each year, commencing June 15, 2017. The Company may redeem the 2017 Senior
Notes, in whole or in part, at any time at a price equity to 100% of the principal amount being redeemed, plus accrued and unpaid interest and a Make-Whole Amount.
On March 2, 2017, the Company issued $300 million aggregate principal amount of senior unsecured floating rate notes in a public offering. The 2017 Floating Rate Senior Notes bear interest at a floating rate which is to be calculated by Wells Fargo Bank, National Association, equal to three-month LIBOR as determined on the interest determination date plus 0.35%. The interest determination date for an interest period is the second London business day preceding the first day of such interest period. The 2017 Floating Rate Senior Notes mature on September 4, 2018. Interest on the 2017 Floating Rate Senior Notes will accrue from March 2, 2017, and will be paid quarterly in arrears on June 4, 2017, September 4, 2017, December 4, 2017, March 4, 2018, June 4, 2018 and on the maturity date, to the record holders at the close of business on the business date preceding the interest payment date. The 2017 Floating Rate Senior Notes are not redeemable prior to their maturity.
On June 12, 2017, the Company issued and sold through a private placement transaction, $500 million aggregate principal amount of its 2017 Private Placement Notes Due 2023 and $500 million aggregate principal amount of its 2017 Private Placement Notes Due 2028. The 2017 Private Placement Notes Due 2023 bear interest at the fixed rate of 2.625% per year and mature on January 15, 2023. The 2017 Private Placement Notes Due 2028 bear interest at the fixed rate of 3.250% per year and mature on January 15, 2028. Interest on each tranche of notes will be due semiannually on January 15 and July 15 of each year, commencing January 15, 2018. The Company entered into a registration rights agreement, dated as of June 12, 2017, with the representatives of the initial purchasers of the notes, which sets forth, among other things, the Company’s obligations to register the notes under the Securities Act, within 365 days of issuance. The net proceeds of the note offering were used to finance, in part, the acquisition of Bureau van Dijk. In addition, the Company may redeem each of the notes in whole or in part, at any time at a price equity to 100% of the principal amount being redeemed, plus accrued interest and a Make-Whole Amount.
For the 2017 Floating Rate Notes, 2017 Senior Notes, 2017 Private Placement Notes Due 2023 and 2017 Private Placement Notes Due 2028, at the option of the holders of the notes, the Company may be required to purchase all or a portion of the notes upon occurrence of a “Change of Control Triggering Event,” as defined in the 2017 Indenture, at a price equal to 101% of the principal amount, thereof, plus accrued and unpaid interest to the date of purchase. The 2017 Indenture contains covenants that limit the ability of the Company and certain of its subsidiaries to, among other things, incur or create liens and enter into sale and leaseback transactions. In addition, the 2017 Indenture contains a covenant that limits the ability of the Company to consolidate or merge with another entity or to sell all or substantially all of its assets to another entity. The 2017 Indenture also contains customary default provisions. In addition, an event of default will occur if the Company or certain of its subsidiaries fail to pay the principal of any indebtedness (as defined in the 2017 Indenture) when due at maturity in an aggregate amount of $50 million or more, or a default occurs that results in the acceleration of the maturity of the Company’s or certain of its subsidiaries’ indebtedness in an aggregate amount of $50 million or more. Upon the occurrence and during the continuation of an event of default under the 2017 Indenture, all the aforementioned notes may become immediately due and payable either automatically or by the vote of the holders of more than 25% of the aggregate principal amount of all of the notes of the applicable series then outstanding.
2017 Bridge Credit Facility
On May 15, 2017, the Company entered into a364-Day Bridge Credit Agreement providing for a $1.5 billion bridge facility. On June 12, 2017, the commitments under this facility were terminated upon the issuance of the 2017 Private Placement Notes Due 2023, the 2017 Private Placement Notes Due 2028 and the 2017 Term Loan Facility.
At December 31, 2017, the Company was in compliance with all covenants contained within all of the debt agreements. All the debt agreements contain cross default provisions which state that default under one of the aforementioned debt instruments could in turn permit lenders under other debt instruments to declare borrowings outstanding under those instruments to be immediately due and payable. As of December 31, 2017, there were no such cross defaults.
The repayment schedule for the Company’s borrowings is as follows:
| | | | | | | | | | | | | | | | | | | | | | | | | | | | | | | | | | | | | | | | | | | | | | | | | | | | |
Year Ending December 31, | | 2010
Senior
Notes
due
2020 | | | 2012
Senior
Notes
due
2022 | | | 2013
Senior
Notes
due
2024 | | | 2014
Senior
Notes
(5-year)
due
2019 | | | 2014
Senior
Notes
(30-year)
due
2044 | | | 2015
Senior
Notes
due
2027 | | | Term
Loan
Facility
due
2020 | | | 2017
Floating
Rate
Senior
Notes
due
2018 | | | 2017
Senior
Notes
due
2021 | | | 2017
Private
Placement
Notes due
2023 | | | 2017
Private
Placement
Notes due
2028 | | | Commercial
Paper | | | Total | |
| 2018 | | $ | — | | | $ | — | | | $ | — | | | $ | — | | | $ | — | | | $ | — | | | $ | — | | | $ | 300.0 | | | $ | — | | | $ | — | | | $ | — | | | $ | 130.0 | | | $ | 430.0 | |
| 2019 | | | — | | | | — | | | | — | | | | 450.0 | | | | — | | | | — | | | | — | | | | | | | | — | | | | — | | | | — | | | | — | | | | 450.0 | |
| 2020 | | | 500.0 | | | | — | | | | — | | | | — | | | | — | | | | — | | | | 500.0 | | | | — | | | | — | | | | — | | | | — | | | | — | | | | 1,000.0 | |
| 2021 | | | — | | | | — | | | | — | | | | — | | | | — | | | | — | | | | — | | | | — | | | | 500.0 | | | | — | | | | — | | | | — | | | | 500.0 | |
| 2022 | | | — | | | | 500.0 | | | | — | | | | — | | | | — | | | | — | | | | — | | | | — | | | | — | | | | — | | | | — | | | | — | | | | 500.0 | |
| Thereafter | | | — | | | | — | | | | 500.0 | | | | — | | | | 600.0 | | | | 600.4 | | | | — | | | | — | | | | — | | | | 500.0 | | | | 500.0 | | | | — | | | | 2,700.4 | |
| | | | | | | | | | | | | | | | | | | | | | | | | | | | | | | | | | | | | | | | | | | | | | | | | | | | |
| Total | | $ | 500.0 | | | $ | 500.0 | | | $ | 500.0 | | | $ | 450.0 | | | $ | 600.0 | | | $ | 600.4 | | | $ | 500.0 | | | $ | 300.0 | | | $ | 500.0 | | | $ | 500.0 | | | $ | 500.0 | | | $ | 130.0 | | | $ | 5,580.4 | |
| | | | | | | | | | | | | | | | | | | | | | | | | | | | | | | | | | | | | | | | | | | | | | | | | | | | |
INTEREST EXPENSE, NET
The following table summarizes the components of interest as presented in the consolidated statements of operations:
| | | | | | | | | | | | |
| | | Year Ended December 31, | |
| | | 2017 | | | 2016 | | | 2015 | |
| Income | | $ | 16.0 | | | $ | 10.9 | | | $ | 9.7 | |
| Expense on borrowings | | | (190.1 | ) | | | (141.9 | ) | | | (120.6 | ) |
| Expense on UTPs and other tax related liabilities(a) | | | (15.3 | ) | | | (7.8 | ) | | | (5.3 | ) |
| Legacy Tax(b) | | | — | | | | 0.2 | | | | 0.7 | |
| Capitalized | | | 1.0 | | | | 0.8 | | | | 0.4 | |
| | | | | | | | | | | | |
| Total | | $ | (188.4 | ) | | $ | (137.8 | ) | | $ | (115.1 | ) |
| | | | | | | | | | | | |
| Interest paid(c) | | $ | 158.2 | | | $ | 136.7 | | | $ | 108.3 | |
| | | | | | | | | | | | |
(a) | The 2015 amount includes approximately $2 million in interest income on a tax refund and a $4 million interest reversal relating to the favorable resolution of a tax audits. |
(b) | Represents a reduction of accrued interest related to the favorable resolution of Legacy Tax Matters. |
(c) | Interest paid includes net settlements on interest rate swaps more fully discussed in Note 5. |
The Company’s debt is recorded at its carrying amount, which represents the issuance amount plus or minus any issuance premium or discount, except for the 2010 Senior Notes, the 2014 Senior Notes(5-Year) and the 2012 Senior Notes which are recorded at the carrying amount adjusted for the fair value of an interest rate swap used to hedge the fair value of the note.
The fair value and carrying value of the Company’s debt (excluding Commercial Paper) as of December 31, 2017 and 2016 are as follows:
| | | | | | | | | | | | | | | | |
| | | December 31, 2017 | | | December 31, 2016 | |
| | | | |
| | | Carrying Amount | | | Estimated Fair
Value | | | Carrying Amount | | | Estimated Fair
Value | |
| Series2007-1 Notes | | $ | — | | | $ | — | | | $ | 300.0 | | | $ | 308.9 | |
| 2010 Senior Notes | | | 497.8 | | | | 537.9 | | | | 502.6 | | | | 548.3 | |
| 2012 Senior Notes | | | 495.5 | | | | 535.6 | | | | 495.3 | | | | 535.3 | |
| 2013 Senior Notes | | | 495.8 | | | | 547.8 | | | | 495.2 | | | | 539.9 | |
| 2014 Senior Notes(5-Year) | | | 446.5 | | | | 452.8 | | | | 448.8 | | | | 456.2 | |
| 2014 Senior Notes(30-Year) | | | 597.6 | | | | 722.4 | | | | 597.4 | | | | 661.5 | |
| 2015 Senior Notes | | | 596.8 | | | | 617.7 | | | | 523.7 | | | | 534.8 | |
| 2017 Senior Notes(5-Year) | | | 495.5 | | | | 500.0 | | | | — | | | | — | |
| 2017 Floating Rate Senior Notes | | | 299.5 | | | | 300.2 | | | | — | | | | — | |
| 2.65% 2017 Private Placement Notes, due 2023 | | | 495.4 | | | | 494.8 | | | | — | | | | — | |
| 3.25% 2017 Private Placement Notes, due 2028 | | | 490.9 | | | | 493.6 | | | | — | | | | — | |
| 2017 Term Loan Facility, due 2020 | | | 499.3 | | | | 499.3 | | | | — | | | | — | |
| | | | | | | | | | | | | | | | |
| Total | | $ | 5,410.6 | | | $ | 5,702.1 | | | $ | 3,363.0 | | | $ | 3,584.9 | |
| | | | | | | | | | | | | | | | |
The fair value of the Company’s debt is estimated based on quoted market prices for similar instruments. Accordingly, the inputs used to estimate the fair value of the Company’s long-term debt are classified as Level 2 inputs within the fair value hierarchy.
Authorized Capital Stock
The total number of shares of all classes of stock that the Company has authority to issue under its Restated Certificate of Incorporation is 1.02 billion shares with a par value of $0.01, of which 1.0 billion are shares of common stock, 10.0 million are shares of preferred stock and 10.0 million are shares of series common stock. The preferred stock and series common stock can be issued with varying terms, as determined by the Board.
Share Repurchase Program
The Company implemented a systematic share repurchase program in the third quarter of 2005 through an SECRule 10b5-1 program. Moody’s may also purchase opportunistically when conditions warrant. As a result, Moody’s share repurchase activity will continue to vary from quarter to quarter. The table below summarizes the Company’s remaining authority under its share repurchase program as of December 31, 2017:
| | | | | | | | |
Date Authorized | | Amount Authorized | | | Remaining Authority | |
| December 15, 2015 | | $ | 1,000.0 | | | $ | 527.0 | |
During 2017, Moody’s repurchased 1.6 million shares of its common stock under its share repurchase program and issued 2.4 million shares under employee stock-based compensation plans.
Dividends
The Company’s cash dividends were:
| | | | | | | | | | | | | | | | | | | | | | | | |
| | | Dividends Per Share | |
| | | Year ended December 31, | |
| | | 2017 | | | 2016 | | | 2015 | |
| | | | | | |
| | | Declared | | | Paid | | | Declared | | | Paid | | | Declared | | | Paid | |
| First quarter | | $ | — | | | $ | 0.38 | | | $ | — | | | $ | 0.37 | | | $ | — | | | $ | 0.34 | |
| Second quarter | | | 0.38 | | | | 0.38 | | | | 0.37 | | | | 0.37 | | | | 0.34 | | | | 0.34 | |
| Third quarter | | | 0.38 | | | | 0.38 | | | | 0.37 | | | | 0.37 | | | | 0.34 | | | | 0.34 | |
| Fourth quarter | | | 0.38 | | | | 0.38 | | | | 0.75 | | | | 0.37 | | | | 0.71 | | | | 0.34 | |
| | | | | | | | | | | | | | | | | | | | | | | | |
| Total | | $ | 1.14 | | | $ | 1.52 | | | $ | 1.49 | | | $ | 1.48 | | | $ | 1.39 | | | $ | 1.36 | |
| | | | | | | | | | | | | | | | | | | | | | | | |
On January 24, 2018, the Board approved the declaration of a quarterly dividend of $0.44 per share of Moody’s common stock, payable on March 12, 2018 to shareholders of record at the close of business on February 20, 2018. The continued payment of dividends at the rate noted above, or at all, is subject to the discretion of the Board.
Moody’s operates its business from various leased facilities, which are under operating leases that expire over the next 10 years. Moody’s also leases certain computer and other equipment under operating leases that expire over the next five years. Rent expense, including lease incentives, is amortized on a straight-line basis over the related lease term. Rent expense under operating leases for the years ended December 31, 2017, 2016 and 2015 was $97.0 million, $95.4 million and $87.6 million, respectively.
The21-year operating lease for the Company’s headquarters at 7WTC which commenced on October 20, 2006 contains a total of 20 years of renewal options. These renewal options apply to both the original lease as well as additional floors leased by the Company beginning in 2014. Additionally, the 17.5 year operating lease for the Company’s London, England office which commenced on February 6, 2008 contains a total of 15 years of renewal options.
The minimum rent for operating leases at December 31, 2017 is as follows:
| | | | |
Year Ending December 31, | | Operating Leases | |
| 2018 | | $ | 108.3 | |
| 2019 | | | 87.1 | |
| 2020 | | | 80.8 | |
| 2021 | | | 75.7 | |
| 2022 | | | 72.6 | |
| Thereafter | | | 290.6 | |
| | | | |
| Total minimum lease payments | | $ | 715.1 | |
| | | | |
Given the nature of their activities, Moody’s and its subsidiaries are subject to legal and tax proceedings, governmental, regulatory and legislative investigations and inquiries, and claims and litigation that are based on ratings assigned by MIS or that are otherwise incidental to the Company’s business. The Company periodically receives and responds to subpoenas and other inquiries which may relate to Moody’s activities or to activities of others that may result in claims and litigation, proceedings or investigations by private litigants or governmental, regulatory or legislative authorities. Moody’s also is subject to ongoing tax audits as addressed in Note 15 to the financial statements.
Management periodically assesses the Company’s liabilities and contingencies in connection with these matters based upon the latest information available. For claims, litigation and proceedings and governmental investigations and inquiries not related to income taxes, the Company records liabilities in the consolidated financial statements when it is both probable that a liability has been incurred and the amount of loss can be reasonably estimated and periodically adjusts these as appropriate. When the reasonable estimate of the loss is within a range of amounts, the minimum amount of the range is accrued unless some higher amount within the range is a better estimate than another amount within the range. In instances when a loss is reasonably possible but uncertainties exist related to the probable outcome and/or the amount or range of loss, management does not record a liability but discloses the contingency if material. As additional information becomes available, the Company adjusts its assessments and estimates of such matters accordingly. Moody’s also discloses material pending legal proceedings pursuant to SEC rules and other pending matters as it may determine to be appropriate.
In view of the inherent difficulty of assessing the potential outcome of legal proceedings, governmental, regulatory and legislative investigations and inquiries, claims and litigation and similar matters and contingencies, particularly when the claimants seek large or indeterminate damages or assert novel legal theories or the matters involve a large number of parties, the Company often cannot predict what the eventual outcome of the pending matters will be or the timing of any resolution of such matters. The Company also may be unable to predict the impact (if any) that any such matters may have on how its business is conducted, on its competitive position or on its financial position, results of operations or cash flows. As the process to resolve any pending matters progresses, management will continue to review the latest information available and assess its ability to predict the outcome of such matters and the effects, if any, on its operations and financial condition and to accrue for and disclose such matters as and when required. However, because such matters are inherently unpredictable and unfavorable developments or resolutions can occur, the ultimate outcome of such matters, including the amount of any loss, may differ from those estimates.
Accounts Receivable Allowances
On January 1, 2020, the Company adopted ASU No. 2016-13, “Financial Instruments—Credit Losses (Topic 326): Measurement of Credit Losses on Financial Instruments” as more fully described in Note 1 to the consolidated financial statements. As the Company's accounts receivable are short-term in nature, the adoption of this ASU did not have a material impact to the Company's allowance for bad debts or its policies and procedures for determining the allowance.
In order to determine an estimate of expected credit losses, receivables are segmented based on similar risk characteristics including historical credit loss patterns and industry or class of customers to calculate reserve rates. The Company uses an aging method for developing its allowance for credit losses by which receivable balances are grouped based on aging category. A reserve rate is calculated for each aging category, which is generally based on historical information, and is adjusted, when necessary, for current conditions (e.g., macroeconomic or industry related) and reasonable and supportable forecasts about the future. The Company also considers customer specific information (e.g., bankruptcy or financial difficulty) when estimating its expected credit losses, as well as the economic environment of the customers, both from an industry and geographic perspective, in evaluating the need for allowances. Expected credit losses are reflected as additions to the accounts receivable allowance. Actual uncollectible account write-offs are recorded against the allowance.
The impact on operating income relating to a one percentage point change in the Company's reserve rates would be approximately $18 million.
Pension and Other Retirement Benefits
The expenses, assets and liabilities that Moody’s reports for its Retirement Plans are dependent on many assumptions concerning the outcome of future events and circumstances. These significant assumptions include the following:
–future compensation increases based on the Company’s long-term actual experience and future outlook;
–long-term expected return on pension plan assets based on historical portfolio results and the expected future average annual return for each major asset class within the plan’s portfolio (which is principally comprised of equity and fixed-income investments); and
–discount rates based on current yields on high-grade corporate long-term bonds.
The discount rates used to measure the present value of the Company’s benefit obligation for its Retirement Plans as of December 31, 2021 were derived using a cash flow matching method whereby the Company compares each plan’s projected payment obligations by year with the corresponding yield on the FTSE pension discount curve. The cash flows by plan are then discounted back to present value to determine the discount rate applicable to each plan.
Moody’s major assumptions vary by plan and assumptions used are set forth in Note 15 to the consolidated financial statements. In determining these assumptions, the Company consults with third-party actuaries and other advisors as deemed appropriate. While the Company believes that the assumptions used in its calculations are reasonable, differences in actual experience or changes in assumptions could have a significant effect on the expenses, assets and liabilities related to the Company’s Retirement Plans. Additionally, the Company has updated its mortality assumption by adopting the newly released mortality improvement scale MP-2021 to accompany the Pri2012 mortality tables to reflect the latest information regarding future mortality expectations by the Society of Actuaries.
When actual plan experience differs from the assumptions used, actuarial gains or losses arise. Excluding differences between the expected long-term rate of return assumption and actual returns on plan assets, the Company amortizes, as a component of annual pension expense, total outstanding actuarial gains or losses over the estimated average future working lifetime of active plan participants to the extent that the gain/loss exceeds 10% of the greater of the beginning-of-year projected benefit obligation or the market-related value of plan assets. For Moody’s Retirement Plans, the total actuarial losses as of December 31, 2021 that have not been recognized in annual expense are $65 million, and Moody’s expects to recognize a net periodic expense of $4 million in 2022 related to the amortization of actuarial losses.
For Moody’s funded U.S. pension plan, the differences between the expected long-term rate of return assumption and actual returns could also affect the net periodic pension expense. As permitted under ASC Topic 715, the Company amortizes the impact of asset returns over a five-year period for purposes of calculating the market-related value of assets that is used in determining the expected return on assets’ component of annual expense and in calculating the total unrecognized gain or loss subject to amortization. As of December 31, 2021, the Company has an unrecognized asset gain of $44 million, of which $13 million will be recognized in the market-related value of assets that is used to calculate the expected return on assets component of 2022 expense.
The table below shows the estimated effect that a one percentage-point decrease in each of these assumptions will have on Moody’s 2022 income before provision for income taxes. These effects have been calculated using the Company’s current projections of 2022 expenses, assets and liabilities related to Moody’s Retirement Plans, which could change as updated data becomes available. | | | | | | | | | | | |
| (dollars in millions) | Assumptions Used for 2022 | | Estimated Impact on 2022 Income before Provision for Income Taxes (Decrease)/Increase |
Weighted Average Discount Rates (1) | 2.60%/2.65% | | $ | (10) | |
| Weighted Average Assumed Compensation Growth Rate | 3.63 | % | | $ | 1 | |
| Assumed Long-Term Rate of Return on Pension Assets | 5.05 | % | | $ | (5) | |
(1)Weighted average discount rates of 2.60% and 2.65% for pension plans and Other Retirement Plans, respectively.
Based on current projections, the Company estimates that expenses related to Retirement Plans will be approximately $13 million in 2022, a decrease compared to the $31 million recognized in 2021.
Leases
The Company’s operating leases do not provide an implicit interest rate. Accordingly, the Company must estimate the secured incremental borrowing rate attributable to the currency in which the lease is denominated in the derivation of operating lease liabilities and related operating lease ROU Assets. This secured incremental borrowing rate is based on the information available at the lease commencement date and is utilized in the determination of the present value of lease payments.
In addition, certain of Moody’s leases have the option to extend the lease beyond the initial term or terminate the lease prior to the end of the term. For these leases, Moody’s may be required to exercise significant judgment to determine when that option is reasonably certain of being exercised, which will impact the lease term and determination of the lease liability and corresponding ROU Asset.
Investments in Non-consolidated Affiliates
Equity method investments are reviewed for indicators of other-than-temporary impairment on a quarterly basis. These investments are written down to fair value if there is evidence of a loss in value that is other-than-temporary.
For equity investments without a readily determinable fair value for which the Company does not have significant influence, Moody's generally elects to measure these investments at cost, less impairment, adjusted for subsequent observable price changes as of the date that an observable transaction takes place.
The Company performs an assessment on a quarterly basis to determine if there are indicators of impairment for its investments in non-consolidated affiliates. If there are indicators of impairment, the Company estimates the investment’s fair value and records an impairment if the carrying value of the investment exceeds its fair value.
In situations where estimation of fair value is required for investments in non-consolidated affiliates, the Company considers various factors, including: recent observable investee equity transactions, comparable public company/precedent transaction multiples and discounted cash flow models. The estimation of fair value for these investments may involve significant judgment.
Other Estimates
In addition to the critical accounting estimates described above, there are other accounting estimates within Moody’s consolidated financial statements. Management believes the current assumptions and other considerations used to estimate amounts reflected in Moody’s consolidated financial statements are appropriate. However, if actual experience differs from the assumptions and other considerations used in estimating amounts reflected in Moody’s consolidated financial statements, the resulting changes could have a material adverse effect on Moody’s consolidated results of operations or financial condition.
See Note 2 to the consolidated financial statements for further information on significant accounting policies that impact Moody’s.
REPORTABLE SEGMENTS
The Company is organized into two reportable segments at December 31, 2021: MIS and MA, which are more fully described in the section entitled “The Company” above and in Note 22 to the consolidated financial statements.
RESULTS OF OPERATIONS
This section of this Form 10-K generally discusses year ended December 31, 2021 and 2020 financial results and year-to-year comparisons between these years. Discussions related to the year ended December 31, 2019 financial results and year-to-year comparisons between the years ended December 31, 2020 and 2019 that are not included in this Form 10-K can be found in “Management’s Discussion and Analysis of Financial Condition and Results of Operations” in Part II, Item 7 of the Company’s Annual Report on Form 10-K for the fiscal year ended December 31, 2020.
Impact of acquisitions/divestitures on comparative results
–Moody’s completed the following acquisitions, which impact the Company's year-over-year comparative results:
–Regulatory DataCorp on February 13, 2020;
–Acquire Media on October 21, 2020;
–ZM Financial Systems on December 7, 2020;
–Catylist on December 30, 2020;
–Cortera on March 19, 2021;
–RMS on September 15, 2021; and
–RealXData on September 17, 2021.
–Refer to the section entitled "Non-GAAP Financial Measures" of this MD&A for the definitions of how the Company determines certain organic growth measures used in this MD&A that exclude the impact of acquisition activity.
Year ended December 31, 2021 compared with year ended December 31, 2020
Executive Summary
The following table provides an executive summary of key operating results for the year ended December 31, 2021. Following this executive summary is a more detailed discussion of the Company’s operating results as well as a discussion of the operating results of the Company’s reportable segments. | | | | | | | | | | | | | | |
| Year Ended December 31, | |
| Financial measure: | 2021 | 2020 | % Change Favorable / (Unfavorable) | Insight and Key Drivers of Change Compared to Prior Year |
| Moody's total revenue | $ | 6,218 | | $ | 5,371 | | 16 | % | — reflects strong growth in both segments |
| MIS External Revenue | $ | 3,812 | | $ | 3,292 | | 16 | % | — strong growth mainly driven by leveraged finance issuance as issuers refinanced existing debt and funded M&A activity; and — increased CLO and CMBS activity amid favorable market conditions |
| MA External Revenue | $ | 2,406 | | $ | 2,079 | | 16 | % | — strong growth in KYC and compliance solutions, as well as research and data feeds; — inorganic growth from acquisitions; — ongoing recurring revenue growth in ERS from subscription-based sales to banking, insurance and asset management customers; and — favorable changes in FX translation rates; partially offset by: — a decline in ERS transaction-based revenue reflecting MA's strategic shift to higher margin SaaS-based products, which produce recurring revenue |
| Total operating and SG&A expenses | $ | 3,117 | | $ | 2,704 | | (15 | %) | — Approximately seven percentage points of the growth reflects inorganic expenses from acquisitions, including $22 million in acquisition-related costs for RMS; and — Approximately five percentage points of the growth reflects higher incentive compensation, stock-based compensation, and commissions aligned with operating performance. |
| Total non-operating (expense) income, net | $ | (89) | | $ | (159) | | 44 | % | — a $45 million benefit related to the reversal of tax-related interest accruals pursuant to the resolution of uncertain tax positions; and — a $36 million non-cash gain relating to the exchange of the Company's minority investment in VisibleRisk for shares of BitSight |
| | | | |
| | | | |
| Operating Margin | 45.7 | % | 44.5 | % | 120BPS | — margin expansion reflects strong revenue growth outpacing operating expense growth |
| Adjusted Operating Margin | 49.9 | % | 49.7 | % | 20BPS |
| ETR | 19.6 | % | 20.3 | % | 70BPS | — higher benefits of approximately $36 million from the resolution of UTPs in 2021; partially offset by — lower Excess Tax Benefits in 2021 |
| Diluted EPS | $ | 11.78 | | $ | 9.39 | | 25 | % | — increase reflects strong operating income/Adjusted Operating Income growth as described above and includes $0.54/share and $0.20/share in benefits related to the resolution of uncertain tax positions (and related interest) in 2021 and 2020, respectively. |
| Adjusted Diluted EPS | $ | 12.29 | | $ | 10.15 | | 21 | % |
Moody’s Corporation | | | | | | | | | | | | | | | | | |
| Year Ended December 31, | | % Change Favorable
(Unfavorable) |
| 2021 | | 2020 | |
| Revenue: | | | | | |
| United States | $ | 3,416 | | | $ | 2,955 | | | 16 | % |
| Non-U.S.: | | | | | |
| EMEA | 1,866 | | | 1,545 | | | 21 | % |
| Asia-Pacific | 596 | | | 571 | | | 4 | % |
| Americas | 340 | | | 300 | | | 13 | % |
| Total Non-U.S. | 2,802 | | | 2,416 | | | 16 | % |
| Total | 6,218 | | | 5,371 | | | 16 | % |
| Expenses: | | | | | |
| Operating | 1,637 | | | 1,475 | | | (11 | %) |
| SG&A | 1,480 | | | 1,229 | | | (20 | %) |
| Restructuring | — | | | 50 | | | 100 | % |
| Depreciation and amortization | 257 | | | 220 | | | (17 | %) |
| | | | | |
| Loss pursuant to the divestiture of MAKS | — | | | 9 | | | 100 | % |
| Total | 3,374 | | | 2,983 | | | (13 | %) |
| Operating income | 2,844 | | | 2,388 | | | 19 | % |
Adjusted Operating Income (1) | 3,101 | | | 2,667 | | | 16 | % |
| Interest expense, net | (171) | | | (205) | | | 17 | % |
| Other non-operating income, net | 82 | | | 46 | | | 78 | % |
| Non-operating (expense) income, net | (89) | | | (159) | | | 44 | % |
| Net income attributable to Moody’s | $ | 2,214 | | | $ | 1,778 | | | 25 | % |
| Diluted weighted average shares outstanding | 187.9 | | | 189.3 | | | 1 | % |
| Diluted EPS attributable to Moody’s common shareholders | $ | 11.78 | | | $ | 9.39 | | | 25 | % |
Adjusted Diluted EPS (1) | $ | 12.29 | | | $ | 10.15 | | | 21 | % |
| Operating margin | 45.7 | % | | 44.5 | % | | |
Adjusted Operating Margin (1) | 49.9 | % | | 49.7 | % | | |
| Effective tax rate | 19.6 | % | | 20.3 | % | | |
(1)Adjusted Operating Income, Adjusted Operating Margin and Adjusted Diluted EPS attributable to Moody’s common shareholders are non-GAAP financial measures. Refer to the section entitled “Non-GAAP Financial Measures” of this Management Discussion and Analysis for further information regarding these measures.
GLOBAL REVENUE
2021----------------------------------------------------------------------------------------------------------------------2020
__________________________________________________________________________________________________________________________________________________________
| | | | | | | | | | | | | | | | | |
Global revenue ⇑ $847 million | U.S. Revenue ⇑ $461 million | Non-U.S. Revenue ⇑ $386 million |
The increase in global revenue reflected growth in both reportable segments. Refer to the section entitled “Segment Results” of this MD&A for a more fulsome discussion of the Company’s segment revenue. | | | | | | | | | |
| | Operating Expense ⇑ $162 million | | | SG&A Expense ⇑ $251 million |
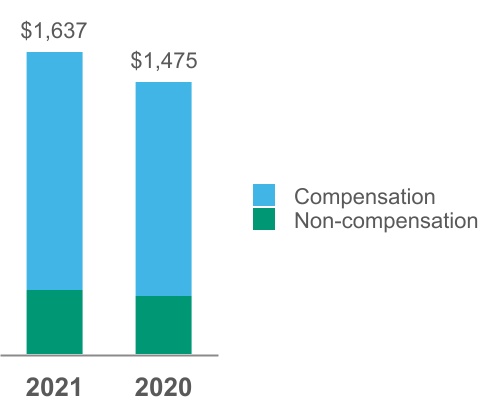 -------------------------------------
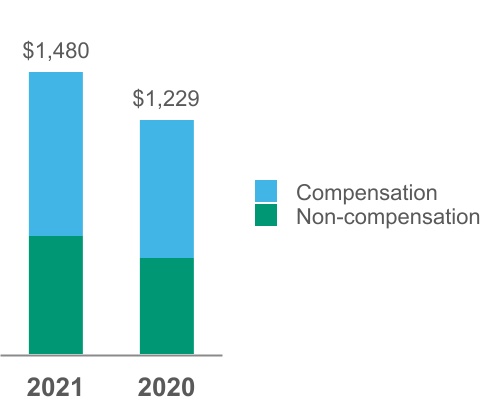 -----------
 | | | | | | | | |
| Compensation expenses increased $126 million reflecting: | Compensation expenses increased $133 million reflecting: |
| — higher incentive and stock-based compensation accruals aligned with financial and operating performance; | — higher incentive and stock-based compensation accruals aligned with financial and operating performance; |
| — inorganic growth from acquisitions; and | — inorganic growth from acquisitions; and |
| — hiring and salary increases | — hiring and salary increases |
| |
| |
| | |
| Non-compensation expenses increased $36 million reflecting: | Non-compensation expenses increased $118 million reflecting: |
| — higher costs relating to strategic initiatives to support business growth coupled with enhancements to technology infrastructure to enable automation, innovation and efficiency; and | — higher costs relating to strategic initiatives to support business growth coupled with enhancements to technology infrastructure to enable automation, innovation and efficiency; and |
| — operational costs associated with recent acquisitions | — costs associated with recent acquisitions, including $22 million in RMS acquisition-related costs |
| |
| |
| |
| | |
The restructuring charge of $50 million in 2020 primarily relates to:
–the non-cash impairment of certain leased real estate assets (ROU Assets and leasehold improvements) pursuant to the rationalization of certain real estate in response to the COVID-19 pandemic; and
–severance costs associated with a strategic realignment in the MA segment.
Further detail on the Company's restructuring programs are more fully discussed in Note 11 to the consolidated financial statements.
The 2020 amount includes a $9 million loss pursuant to the divestiture of MAKS relating to customary post-closing completion adjustments pursuant to the sale of the business in the fourth quarter of 2019.
| | | | | | | | | |
| | | | | |
| | Operating margin 45.7%, up 120 BPS | | | Adjusted Operating Margin 49.9%, up 20 BPS |
Operating margin and Adjusted Operating Margin expansion reflects strong revenue growth outpacing growth in total operating expenses.
| | | | | | | | | |
| | Interest Expense, net ⇓ $34 million | | | Other non-operating income ⇑ $36 million |
| | | | | | | | | | | | | | |
| The decrease in expense is primarily due to: | | The increase in income is primarily due to: |
| — approximately $40 million higher benefit in 2021 related to the reversal of tax-related interest accruals pursuant to the resolution of uncertain tax positions; | | — a $36 million non-cash gain relating to the exchange of the Company's minority investment in VisibleRisk for shares of BitSight; and |
| — a decrease of $11 million in prepayment penalties on the early repayment of long-term debt; | | — higher income of $18 million in 2021 on certain of the Company's investments in non-consolidated affiliates; |
| partially offset by | | partially offset by |
| — a $15 million lower benefit from cross currency swaps (more fully discussed in Note 7 to the consolidated financial statements). | | — a $13 million benefit in 2020 relating to statute of limitations lapses on certain indemnification obligations relating to the MAKS divestiture;and |
|
| — a $13 million loss on a forward contract used to hedge a portion of the GBP denominated RMS purchase price. |
The 2021 and 2020 ETR include $70 million and $34 million, respectively, in tax benefits relating to the resolution of uncertain tax positions. The aforementioned benefit to the 2021 ETR was diluted by higher income before provision for income taxes compared to the prior year. Additionally, there was a $29 million decrease in Excess Tax Benefits in 2021 compared to the prior year.
| | | | | | | | | |
| | Diluted EPS ⇑ $2.39 | | | Adjusted Diluted EPS ⇑ $2.14 |
| | | | | | | | |
| Diluted EPS in 2021 of $11.78 increased $2.39 compared to 2020, mainly due to higher operating income. Diluted EPS in 2021 and 2020 also include $0.54/share and $0.20/share, respectively, in benefits related to the aforementioned resolution of uncertain tax positions (and related interest). | | Adjusted Diluted EPS of $12.29 in 2021 increased $2.14 compared to 2020 (refer to the section entitled “Non-GAAP Financial Measures” of this MD&A for items excluded in the derivation of Adjusted Diluted EPS) mainly due to higher Adjusted Operating Income. Adjusted Diluted EPS in 2021 and 2020 includes $0.54/share and $0.20/share, respectively, in benefits related to the aforementioned resolution of uncertain tax positions (and related interest). Refer to the section entitled “Non-GAAP Financial Measures” of this MD&A for items excluded in the derivation of Adjusted Diluted EPS. |
Segment Results
Moody’s Investors Service
The table below provides a summary of revenue and operating results, followed by further insight and commentary: | | | | | | | | | | | | | | | | | |
| Year Ended December 31, | | % Change Favorable
(Unfavorable) |
| 2021 | | 2020 | |
| Revenue: | | | | | |
| Corporate finance (CFG) | $ | 2,087 | | | $ | 1,857 | | | 12 | % |
| Financial institutions (FIG) | 602 | | | 530 | | | 14 | % |
| Public, project and infrastructure finance (PPIF) | 521 | | | 496 | | | 5 | % |
| Structured finance (SFG) | 560 | | | 362 | | | 55 | % |
| Total ratings revenue | 3,770 | | | 3,245 | | | 16 | % |
| MIS Other | 42 | | | 47 | | | (11 | %) |
| Total external revenue | 3,812 | | | 3,292 | | | 16 | % |
| Intersegment royalty | 165 | | | 148 | | | 11 | % |
| Total | 3,977 | | | 3,440 | | | 16 | % |
| Expenses: | | | | | |
| Operating and SG&A (external) | 1,496 | | | 1,380 | | | (8 | %) |
| Operating and SG&A (intersegment) | 7 | | | 7 | | | — | % |
| Total operating and SG&A | 1,503 | | | 1,387 | | | (8 | %) |
| | | | | |
| | | | | |
| | | | | |
| | | | | |
| | | | | |
| | | | | |
| | | | | |
| Adjusted Operating Income | $ | 2,474 | | | $ | 2,053 | | | 21 | % |
| | | | | |
| Adjusted Operating Margin | 62.2 | % | | 59.7 | % | | |
| | | | | |
| Restructuring | (1) | | | 19 | | | 105 | % |
| Depreciation and amortization | 72 | | | 70 | | | (3 | %) |
The following chart presents changes in rated issuance volumes compared to 2020. To the extent that changes in rated issuance volumes had a material impact to MIS's revenue compared to the prior year, those impacts are discussed below.
MOODY'S INVESTORS SERVICE REVENUE
2021----------------------------------------------------------------------------------------------------------------------2020
__________________________________________________________________________________________________________________________________________________________
| | | | | | | | |
MIS: Global revenue ⇑ $520 million | U.S. Revenue ⇑ $276 million | Non-U.S. Revenue ⇑ $244 million |
–The increase in global MIS revenue reflected strong growth across all ratings LOBs.
–Transaction revenue grew $458 million compared to the same period in the prior year.
CFG REVENUE
2021----------------------------------------------------------------------------------------------------------------------2020
__________________________________________________________________________________________________________________________________________________________
| | | | | | | | |
CFG: Global revenue ⇑ $230 million | U.S. Revenue ⇑ $93 million | Non-U.S. Revenue ⇑ $137 million |
Global CFG revenue for the years ended December 31, 2021 and 2020 was comprised as follows:
(1) Other includes: recurring monitoring fees of a rated debt obligation and/or entities that issue such obligations as well as fees from programs such as commercial paper, medium term notes, and ICRA corporate finance revenue.
The increase in CFG revenue of 12% reflected growth both in the U.S. (7%) and internationally (24%), which resulted in a $199 million increase in transaction revenue.
The most notable drivers of this increase were:
– strong growth in bank loan and speculative-grade bond activity in the U.S. and EMEA as issuers refinanced existing debt in light of favorable market conditions and funded M&A activity;
partially offset by:
–lower investment grade rated issuance volumes following very strong issuance volumes in the prior year when issuers were bolstering their balance sheets in light of uncertainties relating to the COVID-19 crisis.
FIG REVENUE
2021----------------------------------------------------------------------------------------------------------------------2020
__________________________________________________________________________________________________________________________________________________________
| | | | | | | | |
FIG: Global revenue ⇑ $72 million | U.S. Revenue ⇑ $39 million | Non-U.S. Revenue ⇑ $33 million |
Global FIG revenue for the years ended December 31, 2021 and 2020 was comprised as follows:
The increase in FIG revenue of 14% reflected growth both in the U.S. (16%) and internationally (12%) which resulted in a $55 million increase in transaction revenue compared to the prior year.
The most notable driver of the increase was higher banking revenue in the U.S. and EMEA reflecting both the benefit of favorable changes in product mix and pricing increases coupled with opportunistic issuer activity in light of favorable market conditions.
PPIF REVENUE
2021----------------------------------------------------------------------------------------------------------------------2020
__________________________________________________________________________________________________________________________________________________________
| | | | | | | | |
PPIF: Global revenue ⇑ $25 million | U.S. Revenue ⇓ $7 million | Non-U.S. Revenue ⇑ $32 million |
Global PPIF revenue for the years ended December 31, 2021 and 2020 was comprised as follows:
Transaction revenue increased $17 million compared to the same period in the prior year.
The 5% increase in PPIF revenue reflected growth internationally (17%) partially offset be a slight decline in the U.S. (2%). The growth was driven by:
–higher project and infrastructure finance revenue which benefitted from favorable changes in product mix and pricing increases;
partially offset by:
–a decline in U.S. public finance revenue, as issuance volumes fell given higher issuer liquidity following strong issuance in the prior year and from the infusion of federal funding related to the COVID-19 crisis.
SFG REVENUE
2021----------------------------------------------------------------------------------------------------------------------2020
__________________________________________________________________________________________________________________________________________________________
| | | | | | | | |
SFG: Global revenue ⇑ $198 million | U.S. Revenue ⇑ $150 million | Non-U.S. Revenue ⇑ $48 million |
Global SFG revenue for the years ended December 31, 2021 and 2020 was comprised as follows:
The increase in SFG revenue of 55% reflected growth both in the U.S. (70%) and internationally (32%). Transaction revenue increased $187 million. The most notable drivers of the growth in SFG revenue were:
–an increase in CLO refinancing and securitization activity as a result of:
–favorable market conditions for this asset class in the U.S. and EMEA;
–higher issuance to complete deals prior to the expected market transition from LIBOR
–an increase in U.S. CMBS activity reflecting a narrowing of credit spreads for this asset class compared to a challenging prior year period when securitization activity for retail and hotel properties was adversely impacted by the COVID-19 crisis.
Foreign currency translation favorably impacted SFG revenue by two percentage points.
| | | | |
| | MIS: Operating and SG&A Expense ⇑ $116 million |
The growth reflects a $93 million and $23 million increase in compensation and non-compensation expenses, respectively. The most notable drivers of these increases are as follows:
| | | | | | | | |
| Compensation costs | | Non-compensation costs |
| The increase is primarily due to: | | The increase is primarily due to: |
| — higher incentive and stock-based compensation accruals aligned with financial and operating performance | | — higher costs to support the Company’s initiative to enhance technology infrastructure to enable automation, innovation and efficiency as well as to support business growth; |
|
| |
| | partially offset by: |
| | — lower estimates for credit losses primarily reflecting an increase in reserves in 2020 resulting from the anticipated impact of the COVID-19 crisis |
The restructuring charge in 2020 relates to the Company's restructuring programs as more fully discussed in Note 11 to the consolidated financial statements.
| | | | | | | |
| | | | | MIS: Adjusted Operating Margin 62.2% ⇑ 250BPS |
MIS Adjusted Operating Margin increased reflecting strong revenue growth partially offset by growth in operating and SG&A expenses.
Moody’s Analytics
The table below provides a summary of revenue and operating results, followed by further insight and commentary: | | | | | | | | | | | | | | | | | |
| Year Ended December 31, | | % Change Favorable
(Unfavorable) |
| 2021 | | 2020 | |
| Revenue: | | | | | |
| Research, data and analytics (RD&A) | $ | 1,745 | | | $ | 1,514 | | | 15 | % |
| Enterprise risk solutions (ERS) | 661 | | | 565 | | | 17 | % |
| Total external revenue | 2,406 | | | 2,079 | | | 16 | % |
| Intersegment revenue | 7 | | | 7 | | | — | % |
| Total MA Revenue | 2,413 | | | 2,086 | | | 16 | % |
| Expenses: | | | | | |
| Operating and SG&A (external) | 1,621 | | | 1,324 | | | (22 | %) |
| Operating and SG&A (intersegment) | 165 | | | 148 | | | (11 | %) |
| Total operating and SG&A | 1,786 | | | 1,472 | | | (21 | %) |
| | | | | |
| | | | | |
| | | | | |
| | | | | |
| | | | | |
| | | | | |
| | | | | |
| | | | | |
| | | | | |
| | | | | |
| | | | | |
| Adjusted Operating Income | $ | 627 | | | $ | 614 | | | 2 | % |
| | | | | |
| Adjusted Operating Margin | 26.0 | % | | 29.4 | % | | |
| | | | | |
| Restructuring | 1 | | | 31 | | | 97 | % |
| Depreciation and amortization | 185 | | | 150 | | | (23 | %) |
| Loss pursuant to the divestiture of MAKS | — | | | 9 | | | 100 | % |
MOODY'S ANALYTICS REVENUE
2021----------------------------------------------------------------------------------------------------------------------2020
__________________________________________________________________________________________________________________________________________________________
| | | | | | | | |
MA: Global revenue ⇑ $327 million | U.S. Revenue ⇑ $185 million | Non-U.S. Revenue ⇑ $142 million |
The 16% increase in global MA revenue reflects strong growth both in the U.S. (21%) and internationally (12%).
–Foreign currency translation favorably impacted MA revenue by two percentage points.
–Organic revenue growth was 9%.
RD&A REVENUE
2021----------------------------------------------------------------------------------------------------------------------2020
__________________________________________________________________________________________________________________________________________________________
| | | | | | | | |
RD&A: Global revenue ⇑ $231 million | U.S. Revenue ⇑ $90 million | Non-U.S. Revenue ⇑ $141 million |
Global RD&A revenue grew 15% compared to 2020 reflecting growth in the U.S. (13%) and internationally (17%). The most notable drivers of the growth include:
–strong demand for KYC and compliance solutions reflecting increased customer and supplier risk data usage;
–strong renewals and new sales related to credit research and data feeds; and
–inorganic revenue growth from acquisitions.
Foreign currency translation favorably impacted RD&A revenue by two percentage points.
Organic revenue growth for RD&A was 12%.
ERS REVENUE
2021----------------------------------------------------------------------------------------------------------------------2020
__________________________________________________________________________________________________________________________________________________________
| | | | | | | | |
ERS: Global revenue ⇑ $96 million | U.S. Revenue ⇑ $95 million | Non-U.S. Revenue ⇑ $1 million |
Global ERS revenue increased 17% compared to 2020, mainly from growth in the U.S. (43%). Recurring revenue grew 30% compared to 2020. Transaction revenue declined by 32% compared to 2020.
The most notable drivers of the growth reflected:
–inorganic revenue growth from the acquisitions of RMS and ZMFS;
–growth in subscription-based revenue, most notably for actuarial modeling tools in support of certain international accounting standards relating to insurance contracts and demand from asset managers for risk management solutions; and
–favorable foreign currency translation which impacted revenue by two percentage points.
partially offset by:
–lower non-recurring software and services revenue due to a de-emphasizing of these lower margin offerings.
Organic total revenue and organic recurring revenue for ERS grew 1% and 11%, respectively. Organic transaction revenue declined 38%.
| | | | |
| | MA: Operating and SG&A Expense ⇑ $297 million |
The increase in operating and SG&A expenses compared to 2020 reflected growth in both compensation and non-compensation costs of $167 million and $130 million, respectively. The most notable drivers of this growth were:
| | | | | | | | |
| Compensation costs | | Non-compensation costs |
— salary increases and inorganic expense growth from acquisitions; | | — accelerated spending relating to strategic initiatives to support business growth coupled with enhancements to technology infrastructure to enable automation, innovation and efficiency; and |
| — higher incentive compensation accruals aligned with financial and operating performance; and | |
| — unfavorable changes in FX translation rates | | — costs associated with recent acquisitions, including $22 million in RMS acquisition-related costs |
The restructuring charge in 2020 relates to the Company's restructuring programs as more fully discussed in Note 11 to the consolidated financial statements.
The $9 million loss pursuant to the divestiture of MAKS in 2020 is related to a customary post-closing completion adjustment pursuant to the sale of the business in the fourth quarter of 2019.
| | | | | | | |
| | | | | MA: Adjusted Operating Margin 26.0% ⇓ 340BPS |
The Adjusted Operating Margin contraction for MA reflects operating expense growth outpacing RD&A and ERS revenue growth.
MARKET RISK
Foreign exchange risk:
Moody’s maintains a presence in more than 40 countries. In 2021, approximately 42% of the Company’s revenue and approximately 38% of the Company expenses were denominated in functional currencies other than the U.S. dollar, principally in the British pound and the euro. As such, the Company is exposed to market risk from changes in FX rates. As of December 31, 2021, approximately 52% of Moody’s assets were located outside the U.S., making the Company susceptible to fluctuations in FX rates. The effects of translating assets and liabilities of non-U.S. operations with non-U.S. functional currencies to the U.S. dollar are charged or credited to OCI.
The effects of revaluing assets and liabilities that are denominated in currencies other than a subsidiary’s functional currency are charged to other non-operating income (expense), net in the Company’s consolidated statements of operations. Accordingly, the Company enters into foreign exchange forwards to partially mitigate the change in fair value on certain assets and liabilities denominated in currencies other than a subsidiary’s functional currency. The following table shows the impact to the fair value of the forward contracts if currencies being purchased were to weaken by 10%: | | | | | | | | | | | | | | |
Foreign Currency Forwards (1) | | Impact on fair value of contract |
| Sell | | Buy |
| U.S. dollar | | British pound | | $12 million unfavorable impact |
| U.S. dollar | | Canadian dollar | | $11 million unfavorable impact |
| U.S. dollar | | Euro | | $36 million unfavorable impact |
| U.S. dollar | | Japanese yen | | $2 million unfavorable impact |
| U.S. dollar | | Singapore dollar | | $6 million unfavorable impact |
| U.S. dollar | | Indian Rupee | | $1 million unfavorable impact |
| U.S. dollar | | Russian Ruble | | $1 million unfavorable impact |
| British pound | | U.S. dollar | | $21 million unfavorable impact |
| | | | |
| | | | |
| | | | $90 million unfavorable impact |
(1)Refer to Note 7 to the consolidated financial statements in Item 8 of this Form 10-K for further detail on the forward contracts.
The change in fair value of the foreign exchange forward contracts would be offset by FX revaluation gains or losses on underlying assets and liabilities denominated in currencies other than a subsidiary’s functional currency.
Derivatives and non-derivatives designated as net investment hedges:
The Company designates derivative instruments and foreign currency-denominated debt as hedges of foreign currency risk of net investments in certain foreign subsidiaries (net investment hedges) under ASC Topic 815, Derivatives and Hedging.
Cross-currency swaps
As of December 31, 2021, the Company had the following derivative instruments designated as hedges of euro denominated net investments in subsidiaries:
–Cross-currency swaps to exchange an aggregate amount of €909 million with corresponding euro fixed interest rates for an aggregate amount of $1,050 million with corresponding USD fixed interest rates.
–Cross-currency swaps to exchange an aggregate amount of €1,179 million with corresponding interest based on the floating 3-month EURIBOR for an aggregate amount of $1,350 million with corresponding interest based on the floating 3-month U.S. LIBOR.
If the euro were to strengthen 10% relative to the U.S. dollar, there would be an approximate $237 million unfavorable impact to the fair value of the cross-currency swaps recognized in OCI, which would be offset by favorable currency translation gains on the Company’s euro net investment in foreign subsidiaries.
Euro-denominated debt
As of December 31, 2021, the Company has designated €500 million of the 2015 Senior Notes and €750 million of the 2019 Senior Notes as a net investment hedge to mitigate FX exposure relating to euro denominated net investments in subsidiaries. If the euro were to strengthen 10% relative to the U.S. dollar, there would be an approximate $142 million unfavorable adjustment to OCI related to these net investment hedges. This adjustment would be offset by favorable translation adjustments on the Company’s euro net investment in subsidiaries.
Interest rate and credit risk:
Interest rate swaps designated as a fair value hedge:
The Company’s interest rate risk management objectives are to reduce the funding cost and volatility to the Company and to alter the interest rate exposure to a desired risk profile. Moody’s uses interest rate swaps as deemed necessary to assist in accomplishing these objectives. The Company is exposed to interest rate risk on its various outstanding fixed-rate debt for which the fair value of the outstanding fixed rate debt fluctuates based on changes in interest rates. The Company has entered into interest rate swaps to convert the fixed interest rate on certain of its long-term debt to a floating interest rate based on the 3-month and 6-month LIBOR. These swaps are adjusted to fair market value based on prevailing interest rates at the end of each reporting period and fluctuations are recorded as a reduction or addition to the carrying value of the borrowing, while net interest payments are recorded as interest expense/income in the Company’s consolidated statement of operations. A hypothetical change of 100 BPS in the LIBOR-based swap rate would result in an approximate $69 million change to the fair value of the swap, which would be offset by the change in fair value of the hedged item.
Additional information on these interest rate swaps is disclosed in Note 7 to the consolidated financial statements located in Item 8 of this Form 10-K.
Moody’s cash equivalents consist of investments in high-quality investment-grade securities within and outside the U.S. with maturities of three months or less when purchased. The Company manages its credit risk exposure by allocating its cash equivalents among various money market deposit accounts and certificates of deposit and by limiting the amount it can invest with any single issuer. Short-term investments primarily consist of certificates of deposit.
LIQUIDITY AND CAPITAL RESOURCES
Moody's remains committed to using its strong cash flow to create value for shareholders by both investing in the Company's employees and growing the business through targeted organic initiatives and inorganic acquisitions aligned with strategic priorities. Additional excess capital is returned to the Company’s shareholders via a combination of dividends and share repurchases.
Cash Flow
The Company is currently financing its operations, capital expenditures, acquisitions and share repurchases from operating and financing cash flows.
The following is a summary of the changes in the Company’s cash flows followed by a brief discussion of these changes: | | | | | | | | | | | | | | | | | | |
| Year Ended December 31, | | $ Change
Favorable
(unfavorable) | |
| 2021 | | 2020 | | |
| Net cash provided by operating activities | $ | 2,005 | | | $ | 2,146 | | | $ | (141) | | |
| Net cash used in investing activities | $ | (2,619) | | | $ | (1,077) | | | $ | (1,542) | | |
| Net cash used in financing activities | $ | (122) | | | $ | (351) | | | $ | 229 | | |
Free Cash Flow (1) | $ | 1,866 | | | $ | 2,043 | | | $ | (177) | | |
(1)Free Cash Flow is a non-GAAP measure and is defined by the Company as net cash provided by operating activities minus cash paid for capital expenditures. Refer to the section entitled “Non-GAAP Financial Measures” of this MD&A for further information on this financial measure.
Net cash provided by operating activities
Net cash flows from operating activities decreased $141 million compared to the prior year reflecting:
–higher cash paid for income taxes of $418 million, which includes amounts pursuant to the settlement of UTPs; and
–various changes in working capital, most notably from higher accounts receivable balances at December 31, 2021 resulting from the Company's strong performance in the fourth quarter of 2021;
partially offset by:
–an increase in net income compared to the same period in the prior year reflecting the Company's strong performance in 2021 (see section entitled “Results of Operations” for further discussion);
–a $99 million contribution to the Company's funded pension plan in 2020 that did not recur in 2021; and
–a $68 million payment made in conjunction with the settlement of a treasury lock interest rate forward contract in 2020 that did not recur in 2021.
Net cash used in investing activities
The $1,542 million increase in cash flows used in investing activities compared to 2020 primarily reflects:
–an increase in cash paid for acquisitions of $1,282 million (refer to Note 9 to the consolidated financial statements for further discussion on the Company's M&A activity); and
–$250 million of cash paid for a minority investment in BitSight (refer to Note 13 to the consolidated financial statements for further discussion on the Company's investments in non-consolidated affiliates).
Net cash used in financing activities
The $229 million decrease in cash used in financing activities was primarily attributed to:
–the net issuance of $1.2 billion in long-term debt during 2021 compared to a net issuance of $691 million during 2020;
partially offset by:
–an increase in cash paid for treasury share repurchases of $247 million compared to the prior year.
Cash and cash equivalents and short-term investments
The Company’s aggregate cash and cash equivalents and short-term investments of $1.9 billion at December 31, 2021 included approximately $1.5 billion located outside of the U.S. Approximately 26% of the Company’s aggregate cash and cash equivalents and short-term investments is denominated in euros and British pounds. The Company manages both its U.S. and non-U.S. cash flow to maintain sufficient liquidity in all regions to effectively meet its operating needs.
As a result of the Tax Act, all previously net undistributed foreign earnings have now been subject to U.S. tax. The Company continues to evaluate which entities it will indefinitely reinvest earnings outside the U.S. The Company has provided deferred taxes for those entities whose earnings are not considered indefinitely reinvested. Accordingly, the Company has commenced repatriating a portion of its non-U.S. cash in these subsidiaries and will continue to repatriate certain of its offshore cash in a manner that addresses compliance with local statutory requirements, sufficient offshore working capital and any other factors that may be relevant in certain jurisdictions. Notwithstanding the Tax Act, which generally eliminated federal income tax on future cash repatriation to the U.S., cash repatriation may be subject to state and local taxes or withholding or similar taxes.
Material Cash Requirements
The Company's material cash requirements consist of the following contractual and other obligations:
Financing Arrangements
Indebtedness
At December 31, 2021, Moody’s had $7.4 billion of outstanding debt and approximately $1 billion of additional capacity available under the Company’s CP program, which is backstopped by the $1.25 billion 2021 Facility.
The repayment schedule for the Company’s borrowings outstanding at December 31, 2021 is as follows:
Future interest payments and fees associated with the Company's debt and credit facility are expected to be $3.3 billion, of which approximately $212 million is expected to be paid over the next twelve months. For additional information on the Company's outstanding debt, CP program and 2021 Facility, refer to Note 18 to the consolidated financial statements.
Management may consider pursuing additional long-term financing when it is appropriate in light of cash requirements for operations, share repurchases and other strategic opportunities, which would result in higher financing costs.
Purchase Obligations
Purchase obligations generally include multi-year agreements with vendors to purchase goods or services and mainly include data center/cloud hosting fees and fees for information technology licensing and maintenance. As of December 31, 2021, these purchase obligations totaled $233 million, of which $133 million is expected to be paid in the next twelve months.
Leases
The Company has operating lease obligations of $560 million at December 31, 2021, primarily related to real estate leases, of which approximately $120 million in payments are expected over the next twelve months. For more information on the Company's operating leases, refer to Note 20 to the consolidated financial statements.
Pension and Other Retirement Plan Obligations
The Company does not anticipate making significant contributions to its funded pension plan in the next twelve months. This plan is overfunded at December 31, 2021, and accordingly holds sufficient investments to fund future benefit obligations. Payments for the Company's unfunded plans are not expected to be material in either the short or long-term. For further information on the Company's pension and other retirement plan obligations, refer to Note 15 to the consolidated financial statements.
Dividends and share repurchases
On February 7, 2022, the Board approved the declaration of a quarterly dividend of $0.70 per share for Moody’s common stock, payable March 18, 2022 to shareholders of record at the close of business on February 25, 2022. The continued payment of dividends at this rate, or at all, is subject to the discretion of the Board.
On December 16, 2019, the Board authorized $1 billion in share repurchase authority and on February 9, 2021, the Board approved an additional $1 billion in share repurchase authority. At December 31, 2021, the Company had approximately $1,081 million of remaining authority. Additionally, on February 7, 2022, the Board of Directors approved an additional $750 million of share repurchase authority. There is no established expiration date for the remaining authorizations.
Sources of Funding to Satisfy Material Cash Requirements
The Company believes that it has the financial resources needed to meet its cash requirements and expects to have positive operating cash flow in 2022. Cash requirements for periods beyond the next twelve months will depend, among other things, on the Company’s profitability and its ability to manage working capital requirements. The Company may also borrow from various sources as described above.
Non-GAAP Financial Measures:
In addition to its reported results, Moody’s has included in this MD&A certain adjusted results that the SEC defines as “non-GAAP financial measures.” Management believes that such adjusted financial measures, when read in conjunction with the Company’s reported results, can provide useful supplemental information for investors analyzing period-to-period comparisons of the Company’s performance, facilitate comparisons to competitors’ operating results and provide greater transparency to investors of supplemental information used by management in its financial and operational decision-making. These adjusted measures, as defined by the Company, are not necessarily comparable to similarly defined measures of other companies. Furthermore, these adjusted measures should not be viewed in isolation or used as a substitute for other GAAP measures in assessing the operating performance or cash flows of the Company. Below are brief descriptions of the Company’s adjusted financial measures accompanied by a reconciliation of the adjusted measure to its most directly comparable GAAP measure.
Adjusted Operating Income and Adjusted Operating Margin:
The Company presents Adjusted Operating Income and Adjusted Operating Margin because management deems these metrics to be useful measures to provide additional perspective on Moody's operating performance. Adjusted Operating Income excludes the impact of: i) depreciation and amortization; ii) restructuring charges/adjustments; and iii) a loss pursuant to the divestiture of MAKS. Depreciation and amortization are excluded because companies utilize productive assets of different ages and use different methods of acquiring and depreciating productive assets. Restructuring charges are excluded as the frequency and magnitude of these charges may vary widely across periods and companies. The loss pursuant to the divestiture of MAKS is excluded as the frequency and magnitude of divestiture activity may vary widely from period to period and across companies.
Management believes that the exclusion of the aforementioned items, as detailed in the reconciliation below, allows for an additional perspective on the Company’s operating results from period to period and across companies. The Company defines Adjusted Operating Margin as Adjusted Operating Income divided by revenue.
| | | | | | | | | | | | | |
| Year ended December 31, |
| 2021 | | 2020 | | |
| Operating income | $ | 2,844 | | | $ | 2,388 | | | |
| Adjustments: | | | | | |
| Restructuring | — | | | 50 | | | |
| Depreciation and amortization | 257 | | | 220 | | | |
| | | | | |
| Loss pursuant to the divestiture of MAKS | — | | | 9 | | | |
| | | | | |
| Adjusted Operating Income | $ | 3,101 | | | $ | 2,667 | | | |
| Operating margin | 45.7 | % | | 44.5 | % | | |
| Adjusted Operating Margin | 49.9 | % | | 49.7 | % | | |
Adjusted Net Income and Adjusted Diluted EPS attributable to Moody’s common shareholders:
The Company presents Adjusted Net Income and Adjusted Diluted EPS because management deems these metrics to be useful measures to provide additional perspective on Moody's operating performance. Adjusted Net Income and Adjusted Diluted EPS exclude the impact of: i) amortization of acquired intangible assets; ii) restructuring charges/adjustments; iii) a non-cash gain relating to the Company’s minority investment in BitSight; and iv) a loss pursuant to the divestiture of MAKS.
The Company excludes the impact of amortization of acquired intangible assets as companies utilize intangible assets with different ages and have different methods of acquiring and amortizing intangible assets. These intangible assets were recorded as part of acquisition accounting and contribute to revenue generation. The amortization of intangible assets related to acquisitions will recur in future periods until such intangible assets have been fully amortized. Furthermore, the timing and magnitude of business combination transactions are not predictable and the purchase price allocated to amortizable intangible assets and the related amortization period are unique to each acquisition and can vary significantly from period to period and across companies. Restructuring charges, the non-cash gain relating to the Company's minority interest in BitSight and the loss pursuant to the divestiture of MAKS are excluded as the frequency and magnitude of these items may vary widely across periods and companies.
The Company excludes the aforementioned items to provide additional perspective when comparing net income and diluted EPS from period to period and across companies as the frequency and magnitude of similar transactions may vary widely across periods. | | | | | | | | | | | | | | | | | | | | | | | |
| Year ended December 31, |
| Amounts in millions | 2021 | | 2020 |
| Net income attributable to Moody’s common shareholders | | | $ | 2,214 | | | | | $ | 1,778 | |
| | | | | | | |
| | | | | | | |
| | | | | | | |
| | | | | | | |
| | | | | | | |
| | | | | | | |
| | | | | | | |
| Pre-Tax Acquisition-Related Intangible Amortization Expenses | $ | 158 | | | | | $ | 124 | | | |
| Tax on Acquisition-Related Intangible Amortization Expenses | (36) | | | | | (28) | | | |
| Net Acquisition-Related Intangible Amortization Expenses | | | 122 | | | | | 96 | |
| Pre-Tax Restructuring | $ | — | | | | | $ | 50 | | | |
| Tax on Restructuring | — | | | | | (12) | | | |
| Net Restructuring | | | — | | | | | 38 | |
| Pre-Tax gain relating to minority investment in BitSight | $ | (36) | | | | | $ | — | | | |
| Tax on gain relating to minority investment in BitSight | 9 | | | | | — | | | |
| Net gain relating to minority investment in BitSight | | | (27) | | | | | — | |
| | | | | | | |
| | | | | | | |
| Loss pursuant to the divestiture of MAKS | | | — | | | | | 9 | |
| | | | | | | |
| | | | | | | |
| | | | | | | |
| Adjusted Net Income | | | $ | 2,309 | | | | | $ | 1,921 | |
Below is a reconciliation of this measure to its most directly comparable U.S. GAAP amount: | | | | | | | | | | | | | | | | | | | | | | | | | | | |
| |
| | | | | |
| | | | | | | | | | | |
| | | | | | | | | | | |
| | | | | | | | | | | |
| | | | | | | | | | | |
| | | | | | | | | | | |
| | | | | | | | | | | |
| | | | | | | | | | | |
| | | | | | | | | | | |
| | | | | | | | | | | |
| | | | | | | | | | | |
| | | | | | | | | | | |
| | | | | | | | | | | |
| | | | | | | | | | | |
| | | | | | | | | | | |
| | | | | | | | | | | |
| | | | | | | | | | | |
| | | | | | | | | | | |
| | | | | | | | | | | |
| | | | | | | | | | | |
| | | | | | | | | | | |
| | | | | | | | | | | |
| | | | | | | | | | | |
| | | | | | | | | | | |
| | | | | | | | | | | |
| Year ended December 31, |
| 2021 | | 2020 | | |
| Diluted earnings per share attributable to Moody’s common shareholders | | | $ | 11.78 | | | | | $ | 9.39 | | | | | |
| | | | | | | | | | | |
| | | | | | | | | | | |
| | | | | | | | | | | |
| Pre-Tax Acquisition-Related Intangible Amortization Expenses | $ | 0.84 | | | | | $ | 0.66 | | | | | | | |
| Tax on Acquisition-Related Intangible Amortization Expenses | (0.19) | | | | | (0.15) | | | | | | | |
| Net Acquisition-Related Intangible Amortization Expenses | | | 0.65 | | | | | 0.51 | | | | | |
| Pre-Tax Restructuring | $ | — | | | | | $ | 0.26 | | | | | | | |
| Tax on Restructuring | — | | | | | (0.06) | | | | | | | |
| Net Restructuring | | | — | | | | | 0.20 | | | | | |
| Pre-Tax gain relating to minority investment in BitSight | $ | (0.19) | | | | | $ | — | | | | | | | |
| Tax on gain relating to minority investment in BitSight | 0.05 | | | | | — | | | | | | | |
| Net gain relating to minority investment in BitSight | | | (0.14) | | | | | — | | | | | |
| | | | | | | | | | | |
| Loss pursuant to the divestiture of MAKS | | | — | | | | | 0.05 | | | | | |
| Adjusted Diluted EPS | | | $ | 12.29 | | | | | $ | 10.15 | | | | | |
Note: the tax impacts in the table above were calculated using tax rates in effect in the jurisdiction for which the item relates.
Free Cash Flow:
The Company defines Free Cash Flow as net cash provided by operating activities minus payments for capital additions. Management believes that Free Cash Flow is a useful metric in assessing the Company’s cash flows to service debt, pay dividends and to fund acquisitions and share repurchases. Management deems capital expenditures essential to the Company’s product and service innovations and maintenance of Moody’s operational capabilities. Accordingly, capital expenditures are deemed to be a recurring use of Moody’s cash flow. Below is a reconciliation of the Company’s net cash flows from operating activities to Free Cash Flow: | | | | | | | | | | | | | |
| Year ended December 31, |
| 2021 | | 2020 | | |
| Net cash provided by operating activities | $ | 2,005 | | | $ | 2,146 | | | |
| Capital additions | (139) | | | (103) | | | |
| Free Cash Flow | $ | 1,866 | | | $ | 2,043 | | | |
| Net cash used in investing activities | $ | (2,619) | | | $ | (1,077) | | | |
| Net cash used in financing activities | $ | (122) | | | $ | (351) | | | |
Organic Revenue:
The Company presents the organic revenue and organic revenue growth (including organic recurring revenue and organic recurring revenue growth for the MA segment) because management deems these metrics to be useful measures which provide additional perspective in assessing the revenue growth excluding the inorganic revenue impacts from certain acquisition activity. The following table details the periods excluded from each acquisition to determine organic revenue.
| | | | | | | | | | | | | | | | |
| | | | | |
| Acquisition | | Acquisition Date | | | | Period excluded to determine organic revenue growth |
| Regulatory DataCorp | | February 13, 2020 | | | | January 1, 2021 - February 12, 2021 |
| Acquire Media | | October 21, 2020 | | | | January 1, 2021 - October 20, 2021 |
| ZM Financial Systems | | December 7, 2020 | | | | January 1, 2021 - December 6, 2021 |
| Catylist | | December 30, 2020 | | | | January 1, 2021 - December 29, 2021 |
| Cortera | | March 19, 2021 | | | | March 19, 2021 - December 31, 2021 |
| RMS | | September 15, 2021 | | | | September 15, 2021 - December 31, 2021 |
| | | | | | |
112RealXData | | MOODY’S 2017 10-KSeptember 17, 2021 | | | | September 17, 2021 - December 31, 2021 |
| | | | | | |
| | | | | | |
| | | | | | |
Below is a reconciliation of MA's reported revenue and growth rates to its organic revenue and organic growth rates:
| | | | | | | | | | | | | | | | | | | | | | | | | | |
| | | Year Ended December 31, | |
| Amounts in millions | | | 2021 | | 2020 | | Change | | Growth | |
| MA revenue | | | $ | 2,406 | | | $ | 2,079 | | | $ | 327 | | | 16% | |
| | | | | | | | | | |
| | | | | | | | | | |
| | | | | | | | | | |
| | | | | | | | | | |
| | | | | | | | | | |
| | | | | | | | | | |
| Inorganic revenue from acquisitions | | | (136) | | | — | | | (136) | | | | |
| Organic MA revenue | | | $ | 2,270 | | | $ | 2,079 | | | $ | 191 | | | 9% | |
| | | | | | | | | | |
| RD&A revenue | | | $ | 1,745 | | | $ | 1,514 | | | $ | 231 | | | 15% | |
| | | | | | | | | | |
| | | | | | | | | | |
| | | | | | | | | | |
| | | | | | | | | | |
| Inorganic revenue from acquisitions | | | (46) | | | — | | | (46) | | | | |
| Organic RD&A revenue | | | $ | 1,699 | | | $ | 1,514 | | | $ | 185 | | | 12% | |
| | | | | | | | | | |
| ERS revenue | | | $ | 661 | | | $ | 565 | | | $ | 96 | | | 17% | |
| | | | | | | | | | |
| | | | | | | | | | |
| Inorganic revenue from acquisitions | | | (90) | | | — | | | (90) | | | | |
| Organic ERS revenue | | | $ | 571 | | | $ | 565 | | | $ | 6 | | | 1% | |
| | | | | | | | | | |
| ERS recurring revenue | | | $ | 582 | | | $ | 448 | | | $ | 134 | | | 30% | |
| Inorganic recurring revenue from acquisitions | | | (84) | | | — | | | (84) | | | | |
| Organic ERS recurring revenue | | | $ | 498 | | | $ | 448 | | | $ | 50 | | | 11% | |
| | | | | | | | | | |
| ERS transaction revenue | | | $ | 79 | | | $ | 117 | | | $ | (38) | | | (32%) | |
| Inorganic transaction revenue from acquisitions | | | (6) | | | — | | | (6) | | | | |
| Organic ERS transaction revenue | | | $ | 73 | | | $ | 117 | | | $ | (44) | | | (38%) | |
| | | | | | | | | | |
| | | | | | | | | | | | | | | | | | | | | | | | | | |
| | | Year Ended December 31, | |
| Amounts in millions | | | 2021 | | 2020 | | Change | | Growth | |
| MA recurring revenue | | | $ | 2,236 | | | $ | 1,882 | | | $ | 354 | | | 19% | |
| Inorganic recurring revenue from acquisitions | | | (130) | | | — | | | (130) | | | | |
| Organic MA recurring revenue | | | $ | 2,106 | | | $ | 1,882 | | | $ | 224 | | | 12% | |
| | | | | | | | | | |
| | | | | | | | | | |
Recently Issued Accounting Pronouncements
Refer to Note 2 to the consolidated financial statements located in Part II, Item 8 on this Form 10-K for a discussion on the impact to the Company relating to recently issued accounting pronouncements.
CONTINGENCIES
Legal proceedings in which the Company is involved also may impact Moody’s liquidity or operating results. No assurance can be provided as to the outcome of such proceedings. In addition, litigation inherently involves significant costs. For information regarding legal proceedings, see Part II, Item 8 – “Financial Statements”, Note 21 “Contingencies” in this Form 10-K.
Forward-Looking Statements
Certain statements contained in this annual report on Form 10-K are forward-looking statements and are based on future expectations, plans and prospects for the business and operations of the Company that involve a number of risks and uncertainties. Such statements involve estimates, projections, goals, forecasts, assumptions and uncertainties that could cause actual results or outcomes to differ materially from those contemplated, expressed, projected, anticipated or implied in the forward-looking statements. Those statements appear at various places throughout this annual report on Form 10-K, including in the sections entitled “Contingencies” under Item 7, “MD&A”, commencing on page 41 of this annual report on Form 10-K, under “Legal Proceedings” in Part I, Item 3, of this Form 10-K, and elsewhere in the context of statements containing the words “believe”, “expect”, “anticipate”, “intend”, “plan”, “will”, “predict”, “potential”, “continue”, “strategy”, “aspire”, “target”, “forecast”, “project”, “estimate”, “should”, “could”, “may” and similar expressions or words and variations thereof relating to the Company’s views on future events, trends and contingencies or otherwise convey the prospective nature of events or outcomes generally indicative of forward-looking statements. Stockholders and investors are cautioned not to place undue reliance on these forward-looking statements. The forward-looking statements and other information are made as of the date of this annual report on Form 10-K, and the Company undertakes no obligation (nor does it intend) to publicly supplement, update or revise such statements on a going-forward basis, whether as a result of subsequent developments, changed expectations or otherwise, except as required by applicable law or regulation. In connection with the “safe harbor” provisions of the Private Securities Litigation Reform Act of 1995, the Company is identifying examples of factors, risks and uncertainties that could cause actual results to differ, perhaps materially, from those indicated by these forward-looking statements. Those factors, risks and uncertainties include, but are not limited to the impact of COVID-19 on volatility in the U.S. and world financial markets, on general economic conditions and GDP in the U.S. and worldwide, and on Moody’s own operations and personnel; future worldwide credit market disruptions or economic slowdowns, which could affect the volume of debt and other securities issued in domestic and/or global capital markets; other matters that could affect the volume of debt and other securities issued in domestic and/or global capital markets, including regulation, credit quality concerns, changes in interest rates, inflation and other volatility in the financial markets such as that due to Brexit and uncertainty as companies transition away from LIBOR; the level of merger and acquisition activity in the U.S. and abroad; the uncertain effectiveness and possible collateral consequences of U.S. and foreign government actions affecting credit markets, international trade and economic policy, including those related to tariffs, tax agreements and trade barriers; concerns in the marketplace affecting our credibility or otherwise affecting market perceptions of the integrity or utility of independent credit agency ratings; the introduction of competing products or technologies by other companies; pricing pressure from competitors and/or customers; the level of success of new product development and global expansion; the impact of regulation as an NRSRO, the potential for new U.S., state and local legislation and regulations; the potential for increased competition and regulation in the EU and other foreign jurisdictions; exposure to litigation related to our rating opinions, as well as any other litigation, government and regulatory proceedings, investigations and inquiries to which Moody’s may be subject from time to time; provisions in U.S. legislation modifying the pleading standards and EU regulations modifying the liability standards, applicable to credit rating agencies in a manner adverse to credit rating agencies; provisions of EU regulations imposing additional procedural and substantive requirements on the pricing of services and the expansion of supervisory remit to include non-EU ratings used for regulatory purposes; the possible loss of key employees; failures or malfunctions of our operations and infrastructure; any vulnerabilities to cyber threats or other cybersecurity concerns; the outcome of any review by controlling tax authorities of Moody’s global tax planning initiatives; exposure to potential criminal sanctions or civil remedies if Moody’s fails to comply with foreign and U.S. laws and regulations that are applicable in the jurisdictions in which Moody’s operates, including data protection and privacy laws, sanctions laws, anti-corruption laws, and local laws prohibiting corrupt payments to government officials; the impact of mergers, acquisitions or other business combinations and the ability of Moody’s to successfully integrate acquired businesses; currency and foreign exchange volatility; the level of future cash flows; the levels of capital investments; and a decline in the demand for credit risk management tools by financial institutions. Other factors, risks and uncertainties relating to our acquisition of RMS could cause our actual results to differ, perhaps materially, from those indicated by these forward-looking statements, including risks relating to the integration of RMS’s operations, products and employees into Moody’s and the possibility that anticipated
synergies and other benefits of the acquisition will not be realized in the amounts anticipated or will not be realized within the expected timeframe; risks that the acquisition could have an adverse effect on the business of RMS or its prospects, including, without limitation, on relationships with vendors, suppliers or customers; claims made, from time to time, by vendors, suppliers or customers; changes in the U.S., Europe (primarily the U.K.), Japan, India or global marketplaces that have an adverse effect on the business of RMS. These factors, risks and uncertainties as well as other risks and uncertainties that could cause Moody’s actual results to differ materially from those contemplated, expressed, projected, anticipated or implied in the forward-looking statements are currently, or in the future could be, amplified by the COVID-19 outbreak, and are described in greater detail under “Risk Factors” in Part I, Item 1A of Moody’s annual report on Form 10-K for the year ended December 31, 2021, and in other filings made by Moody’s from time to time with the SEC or in materials incorporated herein or therein. Stockholders and investors are cautioned that the occurrence of any of these factors, risks and uncertainties may cause Moody’s actual results to differ materially from those contemplated, expressed, projected, anticipated or implied in the forward-looking statements, which could have a material and adverse effect on Moody’s business, results of operations and financial condition. New factors may emerge from time to time, and it is not possible for Moody’s to predict new factors, nor can Moody’s assess the potential effect of any new factors on it. Forward-looking and other statements in this document may also address our corporate responsibility progress, plans, and goals (including sustainability and environmental matters), and the inclusion of such statements is not an indication that these contents are necessarily material to investors or required to be disclosed in the Company’s filings with the Securities and Exchange Commission. In addition, historical, current, and forward-looking sustainability-related statements may be based on standards for measuring progress that are still developing, internal controls and processes that continue to evolve, and assumptions that are subject to change in the future.
ITEM 7A. QUANTITATIVE AND QUALITATIVE DISCLOSURES ABOUT MARKET RISK
Information in response to this item is set forth under the caption “Market Risk” in Part II, Item 7 on page 60 of this annual report on Form 10-K.
ITEM 8. FINANCIAL STATEMENTS
Index to Financial StatementsNOTE 20 | SEGMENT INFORMATION | | | | | | | |
| | Page(s) |
| | |
| | |
| Consolidated Financial Statements: | | |
| | |
| | |
| | |
| | |
| | |
| | |
Schedules are omitted as not required or inapplicable or because the required information is provided in the consolidated financial statements, including the notes thereto.
MANAGEMENT’S REPORT ON INTERNAL CONTROL OVER FINANCIAL REPORTING
Management of Moody’s Corporation is responsible for establishing and maintaining adequate internal control over financial reporting and for the assessment of the effectiveness of internal control over financial reporting. As defined by the SEC in Rules 13a-15(f) and 15d-15(f) under the Securities Exchange Act of 1934, internal control over financial reporting is a process designed by, or under the supervision of, the Company’s principal executive and principal financial officers, or persons performing similar functions, and effected by the Company’s Board, management and other personnel, to provide reasonable assurance regarding the reliability of financial reporting and the preparation of financial statements for external purposes in accordance with generally accepted accounting principles.
Moody’s internal control over financial reporting includes those policies and procedures that (1) pertain to the maintenance of records that, in reasonable detail, accurately and fairly reflect the transactions and dispositions of assets of the Company; (2) provide reasonable assurance that transactions are recorded as necessary to permit preparation of financial statements in accordance with generally accepted accounting principles, and that receipts and expenditures of the Company are being made only in accordance with authorizations of Moody’s management and directors; and (3) provide reasonable assurance regarding prevention or timely detection of unauthorized acquisition, use or disposition of the Company’s assets that could have a material effect on the financial statements.
Because of its inherent limitations, internal control over financial reporting may not prevent or detect misstatements. Also, projections of any evaluation of effectiveness to future periods are subject to the risk that controls may become inadequate because of changes in conditions, or that the degree of compliance with the policies or procedures may deteriorate.
Management of the Company evaluated and assessed the design and operational effectiveness of the Company’s internal control over financial reporting as of December 31, 2021 based on criteria established in the Internal Control—Integrated Framework (2013) issued by the Committee of Sponsoring Organizations of the Treadway Commission (COSO).
Our assessment of and conclusion on the effectiveness of our internal control over financial reporting as of December 31, 2021 did not include the internal controls of RMS, which was acquired during our fiscal year ended December 31, 2021 and will be included in our assessment of and conclusion on the effectiveness of our internal control over financial reporting for the fiscal year ending December 31, 2022. The total assets (excluding acquired goodwill and intangible assets which are included within the scope of this assessment) and revenues of RMS represent approximately $333 million and $81 million, respectively, of the corresponding amounts in our consolidated financial statements for the fiscal year ended December 31, 2021.
Based on the assessment performed, management has concluded that Moody’s maintained effective internal control over financial reporting as of December 31, 2021.
The effectiveness of our internal control over financial reporting as of December 31, 2021 has been audited by KPMG LLP, an independent registered public accounting firm, as stated in their accompanying report which expresses an unqualified opinion on the effectiveness of Moody's internal control over financial reporting as of December 31, 2021.
/s/ ROBERT FAUBER
Robert Fauber
President and Chief Executive Officer
/s/ MARK KAYE
Mark Kaye
Executive Vice President and Chief Financial Officer
February 18, 2022
Report of Independent Registered Public Accounting Firm
To the Shareholders and Board of Directors of Moody’s Corporation:
Opinions on the Consolidated Financial Statements and Internal Control over Financial Reporting
We have audited the accompanying consolidated balance sheets of Moody’s Corporation and subsidiaries (the Company) as of December 31, 2021 and 2020, the related consolidated statements of operations, comprehensive income, shareholders’ equity, and cash flows for each of the years in the three-year period ended December 31, 2021, and the related notes (collectively, the consolidated financial statements). We also have audited the Company’s internal control over financial reporting as of December 31, 2021, based on criteria established in Internal Control – Integrated Framework (2013) issued by the Committee of Sponsoring Organizations of the Treadway Commission.
In our opinion, the consolidated financial statements referred to above present fairly, in all material respects, the financial position of the Company as of December 31, 2021 and 2020 and the results of its operations and its cash flows for each of the years in the three-year period ended December 31, 2021 in conformity with U.S. generally accepted accounting principles. Also in our opinion, the Company maintained, in all material respects, effective internal control over financial reporting as of December 31, 2021 based on criteria established in Internal Control – Integrated Framework (2013) issued by the Committee of Sponsoring Organizations of the Treadway Commission.
The Company acquired RMS during 2021, and management excluded from its assessment of the effectiveness of the Company’s internal control over financial reporting as of December 31, 2021, RMS’s internal control over financial reporting associated with total assets of $333 million and total revenues of $81 million included in the consolidated financial statements of the Company as of and for the year ended December 31, 2021. Our audit of internal control over financial reporting of the Company also excluded an evaluation of the internal control over financial reporting of RMS.
Basis for Opinions
The Company’s management is responsible for these consolidated financial statements, for maintaining effective internal control over financial reporting, and for its assessment of the effectiveness of internal control over financial reporting, included in the accompanying Management’s Report on Internal Control over Financial Reporting. Our responsibility is to express an opinion on the Company’s consolidated financial statements and an opinion on the Company’s internal control over financial reporting based on our audits. We are a public accounting firm registered with the Public Company Accounting Oversight Board (United States) (PCAOB) and are required to be independent with respect to the Company in accordance with the U.S. federal securities laws and the applicable rules and regulations of the Securities and Exchange Commission and the PCAOB.
We conducted our audits in accordance with the standards of the PCAOB. Those standards require that we plan and perform the audits to obtain reasonable assurance about whether the consolidated financial statements are free of material misstatement, whether due to error or fraud, and whether effective internal control over financial reporting was maintained in all material respects.
Our audits of the consolidated financial statements included performing procedures to assess the risks of material misstatement of the consolidated financial statements, whether due to error or fraud, and performing procedures that respond to those risks. Such procedures included examining, on a test basis, evidence regarding the amounts and disclosures in the consolidated financial statements. Our audits also included evaluating the accounting principles used and significant estimates made by management, as well as evaluating the overall presentation of the consolidated financial statements. Our audit of internal control over financial reporting included obtaining an understanding of internal control over financial reporting, assessing the risk that a material weakness exists, and testing and evaluating the design and operating effectiveness of internal control based on the assessed risk. Our audits also included performing such other procedures as we considered necessary in the circumstances. We believe that our audits provide a reasonable basis for our opinions.
Definition and Limitations of Internal Control Over Financial Reporting
A company’s internal control over financial reporting is a process designed to provide reasonable assurance regarding the reliability of financial reporting and the preparation of financial statements for external purposes in accordance with generally accepted accounting principles. A company’s internal control over financial reporting includes those policies and procedures that (1) pertain to the maintenance of records that, in reasonable detail, accurately and fairly reflect the transactions and dispositions of the assets of the company; (2) provide reasonable assurance that transactions are recorded as necessary to permit preparation of financial statements in accordance with generally accepted accounting principles, and that receipts and expenditures of the company are being made only in accordance with authorizations of management and directors of the company; and (3) provide reasonable assurance regarding prevention or timely detection of unauthorized acquisition, use, or disposition of the company’s assets that could have a material effect on the financial statements.
Because of its inherent limitations, internal control over financial reporting may not prevent or detect misstatements. Also, projections of any evaluation of effectiveness to future periods are subject to the risk that controls may become inadequate because of changes in conditions, or that the degree of compliance with the policies or procedures may deteriorate.
Critical Audit Matters
The critical audit matters communicated below are matters arising from the current period audit of the consolidated financial statements that were communicated or required to be communicated to the audit committee and that: (1) relate to accounts or disclosures that are material to the consolidated financial statements and (2) involved our especially challenging, subjective, or complex judgments. The communication of critical audit matters does not alter in any way our opinion on the consolidated financial statements, taken as a whole, and we are not, by communicating the critical audit matters below, providing separate opinions on the critical audit matters or on the accounts or disclosures to which they relate.
Carrying value of goodwill
As discussed in Note 10 to the consolidated financial statements, the goodwill balance as of December 31, 2021 was $5,999 million. The Company evaluates its reporting units for impairment on an annual basis, or more frequently if there are changes in the reporting structure of the Company or indicators of potential impairment. The Company has four primary reporting units as of December 31, 2021: two within the Company’s Moody’s Investors Service segment and two within the Moody’s Analytics segment.
We identified the assessment of the carrying value of goodwill in the reporting units within the Moody’s Analytics segment as a critical audit matter due to the significant degree of judgment required in evaluating assumptions about revenue growth rates and the discount rates used to measure the reporting unit fair values.
The following are the primary procedures we performed to address this critical audit matter. We evaluated the design and tested the operating effectiveness of certain internal controls over the Company’s goodwill impairment process, including controls related to revenue growth rates and the discount rates used to measure the reporting unit fair values. We evaluated management’s judgments relating to the assumed revenue growth rates by comparing the Company’s revenue growth rates to the Company’s underlying business strategies and growth plans. We evaluated management’s judgments relating to the Company’s discount rates by comparing them to appropriate benchmark interest rates. We also performed sensitivity analyses to assess the impact of alternative assumptions on management’s impairment conclusion. We compared the Company’s historical revenue forecasts to actual results to assess the Company’s ability to accurately forecast. We involved valuation professionals with specialized skills and knowledge, who assisted in assessing the significant assumptions used to develop the discount rates, including the relevance and reliability of the information used.
Gross uncertain tax positions
As discussed in Note 17 to the consolidated financial statements, the Company has recorded uncertain tax positions (UTPs), excluding associated interest, of $388 million as of December 31, 2021. The Company determines whether it is more-likely-than-not that a tax position will be sustained based on its technical merits as of the reporting date. A tax position that meets this more-likely-than-not threshold is then measured and recognized at the largest amount of benefit that is greater than fifty percent likely to be realized upon effective settlement with a taxing authority.
We identified the assessment of the Company’s gross UTPs as a critical audit matter because complex judgment was required in evaluating the Company’s interpretation of tax law and its estimate of the ultimate resolution of the tax positions.
The following are the primary procedures we performed to address this critical audit matter. We evaluated the design and tested the operating effectiveness of internal controls over the Company’s tax process, including those related to the timely identification of UTPs, the assessment of new information related to previously identified UTPs, and the measurement of UTPs. We involved valuation professionals with specialized skills and knowledge, who assisted in assessing transfer pricing studies for compliance with applicable laws and regulations. Additionally, we involved tax professionals with specialized skills and knowledge, who assisted in:
•evaluating the Company’s interpretation of tax laws and judgments about the administrative practices of tax authorities
•inspecting settlement documents with applicable taxing authorities
•assessing the expiration of statutes of limitations
•performing an assessment of the Company’s tax positions and comparing the results to the Company’s assessment.
In addition, we evaluated the Company’s ability to accurately estimate its gross UTPs by comparing historical gross UTPs to actual results upon conclusion of tax audits or expiration of the statute of limitations.
/s/ KPMG LLP
We have served as the Company’s auditor since 2008.
New York, New York
February 18, 2022
MOODY’S CORPORATION
CONSOLIDATED STATEMENTS OF OPERATIONS
(Amounts in millions, except per share data)
| | | | | | | | | | | | | | | | | |
| Year Ended December 31, |
| 2021 | | 2020 | | 2019 |
| Revenue | $ | 6,218 | | | $ | 5,371 | | | $ | 4,829 | |
| Expenses | | | | | |
| Operating | 1,637 | | | 1,475 | | | 1,387 | |
| Selling, general and administrative | 1,480 | | | 1,229 | | | 1,167 | |
| Restructuring | — | | | 50 | | | 60 | |
| Depreciation and amortization | 257 | | | 220 | | | 200 | |
| Acquisition-Related Expenses | — | | | — | | | 3 | |
| Loss pursuant to the divestiture of MAKS | — | | | 9 | | | 14 | |
| Total expenses | 3,374 | | | 2,983 | | | 2,831 | |
| Operating income | 2,844 | | | 2,388 | | | 1,998 | |
| Non-operating (expense) income, net | | | | | |
| Interest expense, net | (171) | | | (205) | | | (208) | |
| Other non-operating income, net | 82 | | | 46 | | | 20 | |
| Non-operating (expense) income, net | (89) | | | (159) | | | (188) | |
| Income before provision for income taxes | 2,755 | | | 2,229 | | | 1,810 | |
| Provision for income taxes | 541 | | | 452 | | | 381 | |
| Net income | 2,214 | | | 1,777 | | | 1,429 | |
| Less: Net (loss) income attributable to noncontrolling interests | — | | | (1) | | | 7 | |
| Net income attributable to Moody’s | $ | 2,214 | | | $ | 1,778 | | | $ | 1,422 | |
| Earnings per share | | | | | |
| Basic | $ | 11.88 | | | $ | 9.48 | | | $ | 7.51 | |
| Diluted | $ | 11.78 | | | $ | 9.39 | | | $ | 7.42 | |
| Weighted average shares outstanding | | | | | |
| Basic | 186.4 | | | 187.6 | | | 189.3 | |
| Diluted | 187.9 | | | 189.3 | | | 191.6 | |
The accompanying notes are an integral part of the consolidated financial statements.
MOODY’S CORPORATION
CONSOLIDATED STATEMENTS OF COMPREHENSIVE INCOME
(Amounts in millions)
| | | | | | | | | | | | | | | | | | | | | | | | | | | | | | | | | | | | | | | | | | | | | | | | | | | | | |
| Year Ended December 31, 2021 | | Year Ended December 31, 2020 | | Year Ended December 31, 2019 |
| Pre-tax
amounts | | Tax
amounts | | After-tax
amounts | | Pre-tax
amounts | | Tax
amounts | | After-tax
amounts | | Pre-tax
amounts | | Tax
amounts | | After-tax
amounts |
| Net Income | | | | | $ | 2,214 | | | | | | | $ | 1,777 | | | | | | | $ | 1,429 | |
| Other Comprehensive Income (Loss): | | | | | | | | | | | | | | | | | |
| Foreign Currency Adjustments: | | | | | | | | | | | | | | | | | |
| Foreign currency translation adjustments, net | $ | (303) | | | $ | 11 | | | $ | (292) | | | $ | 361 | | | $ | (13) | | | $ | 348 | | | $ | (22) | | | $ | (1) | | | $ | (23) | |
| Foreign currency translation adjustments - reclassification of losses included in net income | — | | | — | | | — | | | — | | | — | | | — | | | 32 | | | — | | | 32 | |
| Net gains (losses) on net investment hedges | 319 | | | (77) | | | 242 | | | (364) | | | 91 | | | (273) | | | 35 | | | (9) | | | 26 | |
Net investment hedges - reclassification of gains
included in net income | (2) | | | 1 | | | (1) | | | (1) | | | — | | | (1) | | | (3) | | | 1 | | | (2) | |
| Cash Flow Hedges: | | | | | | | | | | | | | | | | | |
| Net losses on cash flow hedges | — | | | — | | | — | | | (68) | | | 17 | | | (51) | | | — | | | — | | | — | |
| Reclassification of losses included in net income | 2 | | | — | | | 2 | | | 3 | | | (1) | | | 2 | | | — | | | — | | | — | |
| | | | | | | | | | | | | | | | | |
| | | | | | | | | | | | | | | | | |
| | | | | | | | | | | | | | | | | |
| Pension and Other Retirement Benefits: | | | | | | | | | | | | | | | | | |
| Amortization of actuarial losses/prior service costs and settlement charge included in net income | 19 | | | (5) | | | 14 | | | 8 | | | (2) | | | 6 | | | 3 | | | (1) | | | 2 | |
| Net actuarial gains (losses) and prior service costs | 73 | | | (18) | | | 55 | | | (42) | | | 10 | | | (32) | | | (32) | | | 8 | | | (24) | |
| Total Other Comprehensive Income (Loss) | $ | 108 | | | $ | (88) | | | $ | 20 | | | $ | (103) | | | $ | 102 | | | $ | (1) | | | $ | 13 | | | $ | (2) | | | $ | 11 | |
| Comprehensive Income | | | | | 2,234 | | | | | | | 1,776 | | | | | | | 1,440 | |
| Less: comprehensive (loss) income attributable to noncontrolling interests | | | | | (2) | | | | | | | (8) | | | | | | | 11 | |
| Comprehensive Income Attributable to Moody’s | | | | | $ | 2,236 | | | | | | | $ | 1,784 | | | | | | | $ | 1,429 | |
The accompanying notes are an integral part of the consolidated financial statements.
MOODY’S CORPORATION
CONSOLIDATED BALANCE SHEETS
(Amounts in millions, except share and per share data)
| | | | | | | | | | | |
| December 31, |
| 2021 | | 2020 |
| ASSETS | | | |
| Current assets: | | | |
| Cash and cash equivalents | $ | 1,811 | | | $ | 2,597 | |
| Short-term investments | 91 | | | 99 | |
| Accounts receivable, net of allowances for credit losses of $32 in 2021 and $34 in 2020 | 1,720 | | | 1,430 | |
| Other current assets | 389 | | | 383 | |
| | | |
| Total current assets | 4,011 | | | 4,509 | |
| Property and equipment, net | 347 | | | 278 | |
| Operating lease right-of-use assets | 438 | | | 393 | |
| Goodwill | 5,999 | | | 4,556 | |
| Intangible assets, net | 2,467 | | | 1,824 | |
| Deferred tax assets, net | 384 | | | 334 | |
| Other assets | 1,034 | | | 515 | |
| Total assets | $ | 14,680 | | | $ | 12,409 | |
| LIABILITIES AND SHAREHOLDERS’ EQUITY | | |
| Current liabilities: | | | |
| Accounts payable and accrued liabilities | $ | 1,142 | | | $ | 1,039 | |
| Current portion of operating lease liabilities | 105 | | | 94 | |
| | | |
| Deferred revenue | 1,249 | | | 1,089 | |
| | | |
| Total current liabilities | 2,496 | | | 2,222 | |
| Non-current portion of deferred revenue | 86 | | | 98 | |
| Long-term debt | 7,413 | | | 6,422 | |
| Deferred tax liabilities, net | 488 | | | 404 | |
| Uncertain tax positions | 388 | | | 483 | |
| Operating lease liabilities | 455 | | | 427 | |
| Other liabilities | 438 | | | 590 | |
| Total liabilities | 11,764 | | | 10,646 | |
| Contingencies (Note 21) | 0 | | 0 |
| Shareholders’ equity: | | | |
| Preferred stock, par value $.01 per share; 10,000,000 shares authorized; no shares issued and outstanding | — | | | — | |
| Series common stock, par value $.01 per share; 10,000,000 shares authorized; no shares issued and outstanding | — | | | — | |
| Common stock, par value $.01 per share; 1,000,000,000 shares authorized; 342,902,272 shares issued at December 31, 2021 and December 31, 2020, respectively. | 3 | | | 3 | |
| Capital surplus | 885 | | | 735 | |
| Retained earnings | 12,762 | | | 11,011 | |
| Treasury stock, at cost; 157,262,484 and 155,808,563 shares of common stock at December 31, 2021 and December 31, 2020, respectively | (10,513) | | | (9,748) | |
| Accumulated other comprehensive loss | (410) | | | (432) | |
| Total Moody’s shareholders’ equity | 2,727 | | | 1,569 | |
| Noncontrolling interests | 189 | | | 194 | |
| Total shareholders’ equity | 2,916 | | | 1,763 | |
| Total liabilities and shareholders’ equity | $ | 14,680 | | | $ | 12,409 | |
The accompanying notes are an integral part of the consolidated financial statements.
MOODY’S CORPORATION
CONSOLIDATED STATEMENTS OF CASH FLOWS
(Amounts in millions)
| | | | | | | | | | | | | | | | | |
| Year Ended December 31, |
| 2021 | | 2020 | | 2019 |
| Cash flows from operating activities | | | | | |
| Net income | $ | 2,214 | | | $ | 1,777 | | | $ | 1,429 | |
| Reconciliation of net income to net cash provided by operating activities: | | | | | |
| Depreciation and amortization | 257 | | | 220 | | | 200 | |
| Stock-based compensation | 175 | | | 154 | | | 136 | |
| Deferred income taxes | (218) | | | (44) | | | (38) | |
| Prepayment penalty relating to early redemption of debt | 13 | | | 24 | | | 12 | |
| Non-cash gain related to minority interest in BitSight | (36) | | | — | | | — | |
| Settlement of treasury rate lock | — | | | (68) | | | — | |
| ROU asset impairment & other non-cash restructuring/impairment charges | — | | | 36 | | | 38 | |
| Loss pursuant to the divestiture of MAKS | — | | | 9 | | | 14 | |
| Changes in assets and liabilities: | | | | | |
| Accounts receivable | (257) | | | 31 | | | (134) | |
| Other current assets | (12) | | | (38) | | | (88) | |
| Other assets | (26) | | | (49) | | | (69) | |
| Lease obligations | (11) | | | (10) | | | (16) | |
| Accounts payable and accrued liabilities | 80 | | | 247 | | | 65 | |
| | | | | |
| Deferred revenue | 65 | | | (29) | | | 76 | |
| Unrecognized tax positions and other non-current tax liabilities | (184) | | | (12) | | | 8 | |
| Other liabilities | (55) | | | (102) | | | 42 | |
| Net cash provided by operating activities | 2,005 | | | 2,146 | | | 1,675 | |
| Cash flows from investing activities | | | | | |
| Capital additions | (139) | | | (103) | | | (69) | |
| Purchases of investments | (437) | | | (181) | | | (138) | |
| Sales and maturities of investments | 147 | | | 104 | | | 174 | |
| | | | | |
| Cash received upon disposal of a business, net of cash transferred to purchaser | — | | | — | | | 226 | |
| Cash paid for acquisitions, net of cash acquired | (2,179) | | | (897) | | | (162) | |
| Receipts from settlements of net investment hedges | 37 | | | 2 | | | 12 | |
| Payments for settlements of net investment hedges | (48) | | | (2) | | | (7) | |
| Net cash (used in) provided by investing activities | (2,619) | | | (1,077) | | | 36 | |
| Cash flows from financing activities | | | | | |
| Issuance of notes | 1,672 | | | 1,491 | | | 824 | |
| Repayment of notes | (500) | | | (800) | | | (950) | |
| Issuance of commercial paper | — | | | 789 | | | 1,317 | |
| Repayment of commercial paper | — | | | (792) | | | (1,320) | |
| Proceeds from stock-based compensation plans | 38 | | | 51 | | | 45 | |
| Repurchase of shares related to stock-based compensation | (83) | | | (104) | | | (77) | |
| Treasury shares | (750) | | | (503) | | | (991) | |
| Dividends | (463) | | | (420) | | | (378) | |
| Dividends to noncontrolling interests | (5) | | | (1) | | | (3) | |
| Payment for noncontrolling interest | — | | | (23) | | | (12) | |
| | | | | |
| Debt issuance costs, extinguishment costs and related fees | (31) | | | (39) | | | (18) | |
| Net cash used in financing activities | (122) | | | (351) | | | (1,563) | |
| Effect of exchange rate changes on cash and cash equivalents | (50) | | | 47 | | | (1) | |
| (Decrease) increase in cash and cash equivalents | (786) | | | 765 | | | 147 | |
| Cash and cash equivalents, beginning of period | 2,597 | | | 1,832 | | | 1,685 | |
| Cash and cash equivalents, end of period | $ | 1,811 | | | $ | 2,597 | | | $ | 1,832 | |
The accompanying notes are an integral part of the consolidated financial statements.
MOODY’S CORPORATION
CONSOLIDATED STATEMENTS OF SHAREHOLDERS’ EQUITY
(Amounts in millions, except per share data)
| | | | | | | | | | | | | | | | | | | | | | | | | | | | | | | | | | | | | | | | | | | | | | | | | | | | | | | | | | | |
| Shareholders of Moody’s Corporation | | | | |
| Common Stock | | | | | | Treasury Stock | | Accumulated
Other
Comprehensive
Loss | | Total Moody’s
Shareholders’
Equity | | Non-
Controlling
Interests | | Total
Shareholders’
Equity |
| Shares | | Amount | | Capital
Surplus | | Retained
Earnings | | Shares | | Amount | | | | |
| Balance at December 31, 2018 | 342.9 | | | $ | 3 | | | $ | 601 | | | $ | 8,594 | | | (151.6) | | | $ | (8,313) | | | $ | (426) | | | $ | 459 | | | $ | 197 | | | $ | 656 | |
| Net income | | | | | | | 1,422 | | | | | | | | | 1,422 | | | 7 | | | 1,429 | |
| Dividends ($2.00 per share) | | | | | | | (380) | | | | | | | | | (380) | | | (3) | | | (383) | |
| | | | | | | | | | | | | | | | | | | |
| Adoption of ASU 2018-02, relating to the Tax Act | | | | | | | 20 | | | | | | | (20) | | | — | | | | | — | |
| Stock-based compensation | | | | | 136 | | | | | | | | | | | 136 | | | | | 136 | |
| Shares issued for stock-based compensation plans at average cost, net | | | | | (70) | | | | | 1.6 | | | 38 | | | | | (32) | | | | | (32) | |
| Purchase of noncontrolling interest | | | | | (9) | | | | | | | | | | | (9) | | | (3) | | | (12) | |
| Non-controlling interest resulting from majority acquisition of Vigeo Eiris | | | | | | | | | | | | | | | — | | | 17 | | | 17 | |
| Treasury shares repurchased | | | | | (16) | | | | | (5.2) | | | (975) | | | | | (991) | | | | | (991) | |
| Currency translation adjustment, net of net investment hedge activity (net of tax of $9 million) | | | | | | | | | | | | | 29 | | | 29 | | | 4 | | | 33 | |
| Net actuarial losses and prior service cost (net of tax of $8 million) | | | | | | | | | | | | | (24) | | | (24) | | | | | (24) | |
| Amortization of prior service costs and actuarial losses (net of tax of $1 million) | | | | | | | | | | | | | 2 | | | 2 | | | | | 2 | |
| | | | | | | | | | | | | | | | | | | |
| | | | | | | | | | | | | | | | | | | |
| Balance at December 31, 2019 | 342.9 | | | $ | 3 | | | $ | 642 | | | $ | 9,656 | | | (155.2) | | | $ | (9,250) | | | $ | (439) | | | $ | 612 | | | $ | 219 | | | $ | 831 | |
The accompanying notes are an integral part of the consolidated financial statements.
(continued on next page)
MOODY’S CORPORATION
CONSOLIDATED STATEMENTS OF SHAREHOLDERS’ EQUITY continued
(Amounts in millions, except per share data)
| | | | | | | | | | | | | | | | | | | | | | | | | | | | | | | | | | | | | | | | | | | | | | | | | | | | | | | | | | | |
| Shareholders of Moody’s Corporation | | | | |
| Common Stock | | | | | | Treasury Stock | | Accumulated
Other
Comprehensive
Loss | | Total Moody’s
Shareholders’
Equity | | Non-
Controlling
Interests | | Total
Shareholders’
Equity |
| Shares | | Amount | | Capital
Surplus | | Retained
Earnings | | Shares | | Amount | | | | |
| Balance at December 31, 2019 | 342.9 | | | $ | 3 | | | $ | 642 | | | $ | 9,656 | | | (155.2) | | | $ | (9,250) | | | $ | (439) | | | $ | 612 | | | $ | 219 | | | $ | 831 | |
| Net income | | | | | | | 1,778 | | | | | | | | | 1,778 | | | — | | | 1,778 | |
| Dividends ($2.24 per share) | | | | | | | (421) | | | | | | | | | (421) | | | (3) | | | (424) | |
| Adoption of New Credit Losses Accounting Standard | | | | | | | (2) | | | | | | | | | (2) | | | | | (2) | |
| | | | | | | | | | | | | | | | | | | |
| Stock-based compensation | | | | | 154 | | | | | | | | | | | 154 | | | | | 154 | |
| Shares issued for stock-based compensation plans at average cost, net | | | | | (58) | | | | | 1.4 | | | 5 | | | | | (53) | | | | | (53) | |
| Purchase of noncontrolling interest | | | | | (3) | | | | | | | | | | | (3) | | | (14) | | | (17) | |
| | | | | | | | | | | | | | | | | | | |
| Treasury shares repurchased | | | | | — | | | | | (2.0) | | | (503) | | | | | (503) | | | | | (503) | |
| Currency translation adjustment, net of net investment hedge activity (net of tax of $78 million) | | | | | | | | | | | | | 82 | | | 82 | | | (8) | | | 74 | |
| Net actuarial losses and prior service cost (net of tax of $10 million) | | | | | | | | | | | | | (32) | | | (32) | | | | | (32) | |
| Amortization of prior service costs and actuarial losses (net of tax of $2 million) | | | | | | | | | | | | | 6 | | | 6 | | | | | 6 | |
| Net realized and unrealized loss on cash flow hedges (net of tax of $16 million) | | | | | | | | | | | | | (49) | | | (49) | | | | | (49) | |
| Balance at December 31, 2020 | 342.9 | | | $ | 3 | | | $ | 735 | | | $ | 11,011 | | | (155.8) | | | $ | (9,748) | | | $ | (432) | | | $ | 1,569 | | | $ | 194 | | | $ | 1,763 | |
The accompanying notes are an integral part of the consolidated financial statements.
(continued on next page)
MOODY’S CORPORATION
CONSOLIDATED STATEMENTS OF SHAREHOLDERS’ EQUITY continued
(Amounts in millions, except per share data)
| | | | | | | | | | | | | | | | | | | | | | | | | | | | | | | | | | | | | | | | | | | | | | | | | | | | | | | | | | | |
| Shareholders of Moody’s Corporation | | | | |
| Common Stock | | | | | | Treasury Stock | | Accumulated
Other
Comprehensive
Loss | | Total Moody’s
Shareholders’
Equity | | Non-
Controlling
Interests | | Total
Shareholders’
Equity |
| Shares | | Amount | | Capital
Surplus | | Retained
Earnings | | Shares | | Amount | | | | |
| Balance at December 31, 2020 | 342.9 | | | $ | 3 | | | $ | 735 | | | $ | 11,011 | | | (155.8) | | | $ | (9,748) | | | $ | (432) | | | $ | 1,569 | | | $ | 194 | | | $ | 1,763 | |
| Net income | | | | | | | 2,214 | | | | | | | | | 2,214 | | | — | | | 2,214 | |
| Dividends ($2.48 per share) | | | | | | | (463) | | | | | | | | | (463) | | | (3) | | | (466) | |
| | | | | | | | | | | | | | | | | | | |
| | | | | | | | | | | | | | | | | | | |
| Stock-based compensation | | | | | 175 | | | | | | | | | | | 175 | | | | | 175 | |
| Shares issued for stock-based compensation plans at average cost, net | | | | | (25) | | | | | 0.7 | | | (15) | | | | | (40) | | | | | (40) | |
| | | | | | | | | | | | | | | | | | | |
| | | | | | | | | | | | | | | | | | | |
| Treasury shares repurchased | | | | | — | | | | | (2.2) | | | (750) | | | | | (750) | | | | | (750) | |
| Currency translation adjustment, net of net investment hedge activity (net of tax of $65 million) | | | | | | | | | | | | | (49) | | | (49) | | | (2) | | | (51) | |
| Net actuarial gains and prior service cost (net of tax of $18 million) | | | | | | | | | | | | | 55 | | | 55 | | | | | 55 | |
| Amortization of prior service costs/ actuarial losses and settlement charge (net of tax of $5 million) | | | | | | | | | | | | | 14 | | | 14 | | | | | 14 | |
| Net realized and unrealized gain on cash flow hedges | | | | | | | | | | | | | 2 | | | 2 | | | | | 2 | |
| Balance at December 31, 2021 | 342.9 | | | $ | 3 | | | $ | 885 | | | $ | 12,762 | | | (157.3) | | | $ | (10,513) | | | $ | (410) | | | $ | 2,727 | | | $ | 189 | | | $ | 2,916 | |
The accompanying notes are an integral part of the consolidated financial statements.
MOODY’S CORPORATION
NOTES TO CONSOLIDATED FINANCIAL STATEMENTS
(tabular dollar and share amounts in millions, except per share data)
NOTE 1 DESCRIPTION OF BUSINESS AND BASIS OF PRESENTATION
Moody’s is a global integrated risk assessment firm that empowers organizations and investors to make better decisions. Moody’s reports in 2 reportable segments: MIS and MA.
MIS publishes credit ratings and provides assessment services on a wide range of debt obligations, programs and facilities, and the entities that issue such obligations in markets worldwide, including various corporate, financial institution and governmental obligations, and structured finance securities.
MA is a global provider of: i) data and information; ii) research and insights; and iii) decision solutions, which help companies make better and faster decisions. MA leverages its industry expertise across multiple risks such as credit, market, financial crime, supply chain, catastrophe and climate to deliver integrated risk assessment solutions that enable business leaders to identify, measure and manage the implications of interrelated risks and opportunities.
Adoption of New Accounting Standards
On January 1, 2020, the Company adopted ASU No. 2016-13, “Financial Instruments—Credit Losses (Topic 326): Measurement of Credit Losses on Financial Instruments.” The Company has implemented policies and procedures in compliance with the “expected credit loss” impairment model, which included: (1) refinement of the grouping of receivables with similar risk characteristics; and (2) processes to identify information that can be used to develop reasonable and supportable forecasts of factors that could affect the collectability of the reported amount of the receivable. As the Company's accounts receivable are short-term in nature, the adoption of this ASU did not have a material impact to the Company's allowance for bad debts or its policies and procedures for determining the allowance. Refer to Note 2 for further information on how the Company determines its reserves for expected credit losses. The Company recorded a $2 million cumulative-effect adjustment to retained earnings to increase its allowance for credit losses upon adoption.
On January 1, 2020, the Company adopted ASU No. 2018-15, “Intangibles—Goodwill and Other—Internal-Use Software (Subtopic 350-40): Customer’s Accounting for Implementation Costs Incurred in a Cloud Computing Arrangement that is a Service Contract.” This ASU requires implementation costs incurred by customers in cloud computing arrangements (i.e., hosting arrangements) to be capitalized under the same provisions of authoritative guidance for internal-use software, and amortized over the non-cancellable term of the cloud computing arrangements plus any option renewal periods that are reasonably certain to be exercised by the customer or for which the exercise is controlled by the service provider. The Company is now required to present the amortization of capitalized implementation costs in the same line item in the statement of operations as the fees associated with the hosting service (i.e. operating and SG&A expense) and classify the related payments in the statement of cash flows in the same manner as payments made for fees associated with the hosting service (i.e. cash flows from operating activities). This ASU also requires capitalization of implementation costs in the balance sheet to be consistent with the location of prepayment of fees for the hosting element (i.e. within other current assets or other assets). The Company adopted this ASU prospectively to all implementation costs incurred after the date of adoption and it did not have a material impact on the Company's current financial statements. The future impact to the Company's financial statements will relate to the aforementioned classification of these capitalized costs and related amortization.
In January 2021, the FASB issued ASU 2021-01, “Reference Rate Reform - Scope,” which clarified the scope and application of the original guidance, ASU No. 2020-04, "Facilitation of the Effects of Reference Rate Reform on Financial Reporting" ("ASU No. 2020-04"), issued in March 2020. ASU No. 2020-04 provides temporary optional expedients and exceptions to the U.S. GAAP guidance on contract modifications and hedge accounting to ease the financial reporting burdens related to the expected market transition from the London Interbank Offered Rate (LIBOR) and other interbank offered rates to alternative reference rates. Both ASU's were effective upon issuance, and the Company may elect to apply the amendments prospectively through December 31, 2022 as the transition from LIBOR is completed. Refer to Recently Issued Accounting Pronouncements in Note 2 for further information.
On December 31, 2020, the Company adopted ASU No. 2018-14, “Compensation—Retirement Benefits—Defined Benefit Plans—General (Subtopic 715-20): Disclosure Framework—Changes to the Disclosure Requirements for Defined Benefit Plans”. This ASU eliminates requirements for certain disclosures and requires additional disclosures under defined benefit pension plans and other postretirement plans. The Company is also now required to present a narrative description of significant gains or losses in the benefit obligation over the past year. The Company adopted this ASU retrospectively for all periods presented with the new required disclosures presented in Note 15.
On January 1, 2021, the Company adopted ASU No. 2019-04, “Codification Improvements to Topic 326, Financial Instruments—Credit Losses, Topic 815, Derivatives and Hedging, and Topic 825 Financial Instruments.” This ASU clarifies and improves guidance related to the recently issued standards updates on credit losses, hedging, and recognition and measurement of financial instruments. The Company adopted this ASU prospectively and it did not have a material impact on the Company's financial statements.
On January 1, 2021, the Company adopted ASU No. 2019-12, "Income Taxes (Topic 740): Simplifying the Accounting for Income Taxes." This ASU simplifies the accounting for income taxes by eliminating certain exceptions to the general principles in Topic 740, Income Taxes, and clarifies certain aspects of the existing guidance to promote consistency among reporting entities. Most amendments within this ASU are required to be applied on a prospective basis, while certain amendments must be applied on a retrospective or modified retrospective basis. The Company adopted this ASU prospectively and it did not have a material impact on the Company's current financial statements.
COVID-19
The COVID-19 pandemic has not had a material adverse impact on the Company's reported results to date and is currently not expected to have a material adverse impact on its near-term outlook. However, Moody's is unable to predict the longer-term impact that the pandemic may have on its business, future results of operations, financial position or cash flows due to numerous uncertainties.
NOTE 2 SUMMARY OF SIGNIFICANT ACCOUNTING POLICIES
Basis of Consolidation
The consolidated financial statements include those of Moody’s Corporation and its majority- and wholly-owned subsidiaries. The effects of all intercompany transactions have been eliminated. Investments in companies for which the Company has significant influence over operating and financial policies but not a controlling interest are accounted for on an equity basis whereby the Company records its proportional share of the investment’s net income or loss as part of other non-operating income (expense), net and any dividends received reduce the carrying amount of the investment. Equity investments without a readily determinable fair value for which the Company does not have significant influence are accounted for under the ASC 321 measurement alternative; these investments are recorded at initial cost, less impairment, adjusted upward or downward for any observable price changes in similar investments. The Company applies the guidelines set forth in Topic 810 of the ASC in assessing its interests in variable interest entities to decide whether to consolidate an entity. The Company has reviewed the potential variable interest entities and determined that there are no consolidation requirements under Topic 810 of the ASC. The Company consolidates its ICRA subsidiaries on a three month lag.
Cash and Cash Equivalents
Cash equivalents principally consist of investments in money market deposit accounts as well as certificates of deposit with maturities of three months or less when purchased.
Short-term Investments
Short-term investments are securities with maturities greater than 90 days at the time of purchase that are available for operations in the next 12 months. The Company’s short-term investments primarily consist of certificates of deposit and their cost approximates fair value due to the short-term nature of the instruments. Interest and dividends on these investments are recorded into income when earned.
Property and Equipment
Property and equipment are stated at cost and are depreciated using the straight-line method over their estimated useful lives. Expenditures for maintenance and repairs that do not extend the economic useful life of the related assets are charged to expense as incurred.
Computer Software Developed or Obtained for Internal Use
The Company capitalizes costs related to software developed or obtained for internal use. These assets, included in property and equipment in the consolidated balance sheets, relate to the Company’s financial, website and other systems. Such costs generally consist of direct costs for third-party license fees, professional services provided by third parties and employee compensation, in each case incurred either during the application development stage or in connection with upgrades and enhancements that increase functionality. Such costs are depreciated over their estimated useful lives on a straight-line basis. Costs incurred during the preliminary project stage of development as well as maintenance costs are expensed as incurred.
The Company also capitalizes implementation costs incurred in cloud computing arrangements (i.e., hosting arrangements) and depreciates the costs over the non-cancellable term of the cloud computing arrangements plus any option renewal periods that are reasonably certain to be exercised or for which the exercise is controlled by the service provider. The Company classifies the amortization of capitalized implementation costs in the same line item in the statement of operations as the fees associated with the hosting service (i.e., operating and SG&A expense) and classifies the related payments in the statement of cash flows in the same manner as payments made for fees associated with the hosting service (i.e. cash flows from operating activities). In addition, the capitalization of implementation costs is reflected in the balance sheet consistent with the location of prepayment of fees for the hosting element (i.e., within other current assets or other assets).
Goodwill and Other Acquired Intangible Assets
Moody’s evaluates its goodwill for impairment at the reporting unit level, defined as an operating segment (i.e., MIS and MA), or one level below an operating segment (i.e., a component of an operating segment), annually as of July 31 or more frequently if impairment indicators arise in accordance with ASC Topic 350.
The Company evaluates the recoverability of goodwill using a two-step impairment test approach at the reporting unit level. In the first step, the Company assesses various qualitative factors to determine whether the fair value of a reporting unit may be less than its carrying amount. If a determination is made based on the qualitative factors that an impairment does not exist, the Company is not required to perform further testing. If the aforementioned qualitative assessment results in the Company concluding that it is more likely than not that the fair value of a reporting unit may be less than its carrying amount, the fair value of the reporting unit will be quantitatively determined and compared to its carrying value including goodwill. If the fair value of the reporting unit exceeds the carrying value of the net assets assigned to that unit, goodwill is not impaired and the Company is not required to perform further testing. If the fair value of the reporting unit is less than the carrying value, the Company will record a goodwill impairment charge for the amount by which the carrying value exceeds the reporting unit’s fair value.
The Company evaluates its reporting units on an annual basis, or more frequently if there are changes in the reporting structure of the Company due to acquisitions, reporting unit realignments or if there are indicators of potential impairment. For the reporting units where the Company is consistently able to conclude that no impairment exists using only a qualitative approach, the Company’s accounting policy is to perform the second step of the aforementioned goodwill impairment assessment at least once every three years. Goodwill is assigned to a reporting unit at the date when an acquisition is integrated into one of the established reporting units, and is based on which reporting unit is expected to benefit from the synergies of the acquisition.
For purposes of assessing the recoverability of goodwill, the Company has 4 reporting units: 2 within the Company’s ratings business (one for the ICRA business and one that encompasses all of Moody’s other ratings operations) and 2 reporting units within MA consisting of businesses that offer: i) data and data-driven analytical solutions; and ii) risk-management software, workflow and CRE solutions.
Impairment of long-lived assets and definite-lived intangible assets
Long-lived assets (including ROU Assets) and amortizable intangible assets are reviewed for recoverability whenever events or changes in circumstances indicate that the carrying amount may not be recoverable.
Under the first step of the recoverability assessment, the Company compares the estimated undiscounted future cash flows attributable to the asset or asset group to their carrying value. If the undiscounted future cash flows are greater than the carrying value, no further assessment is required. If the undiscounted future cash flows are less than the carrying value, Moody's proceeds with step two of the assessment. Under step two of this assessment, Moody's is required to determine the fair value of the asset or asset group (reduced by the estimated cost to sell the asset for assets or disposal groups classified as held-for-sale) and recognize an impairment loss if the carrying amount exceeds its fair value.
Stock-Based Compensation
The Company records compensation expense over the requisite service period for all share-based payment award transactions granted to employees based on the fair value of the equity instrument at the time of grant. This includes shares issued under stock option and restricted stock plans.
Derivative Instruments and Hedging Activities
Based on the Company’s risk management policy, the Company may use derivative financial instruments to reduce exposure to changes in foreign exchange rates and interest rates. The Company does not enter into derivative financial instruments for speculative purposes. All derivative financial instruments are recorded on the balance sheet at their respective fair values on a gross basis. The changes in the value of derivatives that qualify as fair value hedges are recorded in the same income statement line item in earnings in which the corresponding adjustment to the carrying value of the hedged item is presented. The entire change in the fair value of derivatives that qualify as cash flow hedges is recorded to OCI and such amounts are reclassified from AOCI(L) to the same income statement line in earnings in the same period or periods during which the hedged transaction affects income. The Company assesses effectiveness for net investment hedges using the spot-method. The entire change in the fair value of derivatives that qualify as net investment hedges is initially recorded to OCI. Those changes in fair value attributable to components included in the assessment of hedge effectiveness in a net investment hedge are recorded in the currency translation adjustment component of OCI and remain in AOCI(L) until the period in which the hedged item affects earnings. Those changes in fair value attributable to components excluded from the assessment of hedge effectiveness in a net investment hedge are recorded to OCI and amortized to earnings using a systematic and rational method over the duration of the hedge. Any changes in the fair value of derivatives that the Company does not designate as hedging instruments under Topic 815 of the ASC are recorded in the consolidated statements of operations in the period in which they occur.
Revenue Recognition and Costs to Obtain or Fulfill a Contract with a Customer
Revenue recognition:
Revenue is recognized when control of promised goods or services is transferred to the customer, in an amount that reflects the consideration the Company expects to be entitled to in exchange for those goods or services.
When contracts with customers contain multiple performance obligations, the Company accounts for individual performance obligations separately if they are distinct. The transaction price is allocated to each distinct performance obligation on a relative SSP basis. The Company determines the SSP by using the price charged for a deliverable when sold separately or uses management’s best estimate of SSP for goods or services not sold separately using estimation techniques that maximize observable data points, including: internal factors relevant to its pricing practices such as costs and margin objectives; standalone sales prices of similar products; pricing policies; percentage of the fee charged for a primary product or service relative to a related product or service; and customer segment and geography. Additional consideration is also given to market conditions such as competitor pricing strategies and market trends.
Sales, usage-based, value added and other taxes are excluded from revenues.
MIS Revenue
In the MIS segment, revenue arrangements with multiple elements are generally comprised of two distinct performance obligations, a rating and the related monitoring service. Revenue attributed to ratings of issued securities is generally recognized when the rating is delivered to the issuer. Revenue attributed to monitoring of issuers or issued securities is recognized ratably over the period in which the monitoring is performed, generally one year. In the case of certain structured finance products, primarily CMBS, issuers can elect to pay all of the annual monitoring fees upfront. These fees are deferred and recognized over the future monitoring periods based on the expected lives of the rated securities.
MIS arrangements generally have standard contractual terms for which the stated payments are due at conclusion of the ratings process for ratings and either upfront or in arrears for monitoring services; and are signed by customers either on a per issue basis or at the beginning of the relationship with the customer. In situations when customer fees for an arrangement may be variable, the Company estimates the variable consideration at inception using the expected value method based on analysis of similar contracts in the same line of business, which is constrained based on the Company’s assessment of the realization of the adjustment amount.
The Company allocates the transaction price within arrangements that include multiple performance obligations based upon the relative SSP of each service. The SSP for both rating and monitoring services is generally based upon observable selling prices where the rating or monitoring service is sold separately to similar customers.
MA Revenue
In the MA segment, products and services offered by the Company include hosted research and data subscriptions, installed and hosted software subscriptions, perpetual installed software licenses and related maintenance, or PCS, and professional services. Subscription and PCS contracts are generally invoiced in advance of the contractual coverage period, which is principally one year, but can range from 3-5 years; while perpetual software licenses are generally invoiced upon delivery and professional services are invoiced as those services are provided. Payment terms and conditions vary by contract type, but primarily include a requirement of payment within 30 to 60 days.
Revenue from research, data and other hosted subscriptions is recognized ratably over the related subscription period as MA's performance obligation to provide access to these products is progressively fulfilled over the stated term of the contract. A large portion of these services are invoiced in the months of November, December and January.
Revenue from the sale of a software license, when considered distinct from the related software implementation services, is generally recognized at the time the product master or first copy is delivered or transferred to the customer. PCS is generally recognized ratably over the contractual period commencing when the software license is fully delivered. Revenue from installed software subscriptions, which includes PCS, is bifurcated into a software license performance obligation and a PCS performance obligation, which follow the patterns of recognition described above.
For implementation services and other service projects within the ERS and ESA businesses for which fees are fixed, the Company determined progress towards completion is most accurately measured on a percentage-of-completion basis (input method) as this approach utilizes the most directly observable data points and is therefore used to recognize the related revenue. For implementation services where price varies based on time expended, a time-based measure of progress towards completion of the performance obligation is utilized.
Revenue from professional services rendered is generally recognized as the services are performed over time.
Products and services offered within the MA segment are sold either stand-alone or together in various combinations. In instances where an arrangement contains multiple performance obligations, the Company accounts for the individual performance obligations separately if they are considered distinct. Revenue is generally allocated to all performance obligations based upon the relative SSP at contract inception. For certain performance obligations, judgment is required to determine the SSP. Revenue is recognized for each performance obligation based upon the conditions for revenue recognition noted above.
In the MA segment, customers usually pay a fixed fee for the products and services based on signed contracts. However, accounting for variable consideration is applied mainly for: i) estimates for cancellation rights and price concessions and ii) T&M based services.
The Company estimates the variable consideration associated with cancellation rights and price concessions based on the expected amount to be provided to customers and reduces the amount of revenue to be recognized. T&M based contracts represent about half of MA’s service projects within the ERS and ESA businesses. The Company provides agreed upon services at a contracted daily or hourly rate. The commitment represents a series of goods and services that are substantially the same and have the same pattern of transfer to the customer. As such, if T&M services are sold with other MA products, the Company allocates the variable consideration entirely to the T&M performance obligation if the services are sold at standard pricing or at a similar discount level compared to other performance obligations in the same revenue contract. If these criteria are not met, the Company estimates variable consideration for each performance obligation upfront. Each form of variable consideration is included in the transaction price only to the extent that it is probable that a significant reversal of any incremental revenue will not occur.
Costs to Obtain or Fulfill a Contract with a Customer:
Costs to obtain a contract with a customer
Costs incurred to obtain customer contracts, such as sales commissions, are deferred and recorded within other current assets and other assets when such costs are determined to be incremental to obtaining a contract, would not have been incurred otherwise and the Company expects to recover those costs. These costs are amortized to expense on a systematic basis consistent with the transfer of the products or services to the customer. Depending on the line of business to which the contract relates, this may be based upon the average economic life of the products sold or average period for which services are provided, inclusive of anticipated contract renewals. Determining the estimated economic life of the products sold requires judgment with respect to anticipated future technological changes. Costs to obtain customer contracts are only incurred in the MA segment.
Cost to fulfill a contract with a customer
Costs incurred to fulfill customer contracts, are deferred and recorded within other current assets and other assets when such costs relate directly to a contract, generate or enhance resources of the Company that will be used in satisfying performance obligations in the future and the Company expects to recover those costs.
The Company capitalizes work-in-process costs for in-progress MIS ratings, which is recognized consistent with the rendering of the related services to the customers, as ratings are issued.
In addition, within the MA segment, the Company capitalizes royalty costs related to third-party information data providers associated with hosted company information and business intelligence products. These costs are amortized to expense consistent with the recognition pattern of the related revenue over time.
Accounts Receivable Allowances
In order to determine an estimate of expected credit losses, receivables are segmented based on similar risk characteristics including historical credit loss patterns and industry or class of customers to calculate reserve rates. The Company uses an aging method for developing its allowance for credit losses by which receivable balances are stratified based on aging category. A reserve rate is calculated for each aging category which is generally based on historical information, and is adjusted, when necessary, for current conditions (e.g., macroeconomic or industry related) and reasonable and supportable forecasts about the future. The Company also considers customer specific information (e.g., bankruptcy or financial difficulty) when estimating its expected credit losses, as well as the economic environment of the customers, both from an industry and geographic perspective, in evaluating the need for allowances. Expected credit losses are reflected as additions to the accounts receivable allowance. Actual uncollectible account write-offs are recorded against the allowance.
Leases
The Company has operating leases, of which substantially all relate to the lease of office space. The Company’s leases which are classified as finance leases are not material to the consolidated financial statements.
The Company determines if an arrangement meets the definition of a lease at contract inception. The Company recognizes in its consolidated balance sheet a lease liability and an ROU Asset for all leases with a lease term greater than 12 months. In determining the length of the lease term, the Company utilizes judgment in assessing the likelihood of whether it is reasonably certain that it will exercise an option to extend or early-terminate a lease, if such options are provided in the lease agreement.
ROU Assets represent the Company’s right to use an underlying asset for the lease term and lease liabilities represent the Company’s obligation to make lease payments arising from the lease. ROU Assets and lease liabilities are recognized at the lease commencement date based on the present value of lease payments over the lease term. As substantially all of the Company’s leases do not provide an implicit interest rate, the Company uses its estimated secured incremental borrowing rates at the lease commencement date in determining the present value of lease payments. These secured incremental borrowing rates are attributable to the currency in which the lease is denominated.
At commencement, the Company’s initial measurement of the ROU Asset is calculated as the present value of the remaining lease payments (i.e., lease liability), with additive adjustments reflecting: initial direct costs (e.g., broker commissions) and prepaid lease payments (if any); and reduced by any lease incentives provided by the lessor if: (i) received before lease commencement or (ii) receipt of the lease incentive is contingent upon future events for which the occurrence is both probable and within the Company’s control.
Lease expense for minimum operating lease payments is recognized on a straight-line basis over the lease term. This straight-line lease expense represents a single lease cost which is comprised of both an interest accretion component relating to the lease liability and amortization of the ROU Assets. The Company records this single lease cost in operating and SG&A expenses. However, in situations where an operating lease ROU Asset has been impaired, the subsequent amortization of the ROU Asset is then recorded on a straight-line basis over the remaining lease term and is combined with accretion expense on the lease liability to result in single operating lease cost (which subsequent to impairment will no longer follow a straight-line recognition pattern).
The Company has lease agreements which include lease and non-lease components. For the Company’s office space leases, the lease components (e.g., fixed rent payments) and non-lease components (e.g., fixed common-area maintenance costs) are combined and accounted for as a single lease component.
Variable lease payments (e.g. variable common-area-maintenance costs) are only included in the initial measurement of the lease liability to the extent those payments depend on an index or a rate. Variable lease payments not included in the lease liability are recognized in net income in the period in which the obligation for those payments is incurred.
Contingencies
Moody’s is involved in legal and tax proceedings, governmental, regulatory and legislative investigations and inquiries, claims and litigation that are incidental to the Company’s business, including claims based on ratings assigned by MIS. Moody’s is also subject to ongoing tax audits in the normal course of business. Management periodically assesses the Company’s liabilities and contingencies in connection with these matters based upon the latest information available. Moody’s discloses material pending legal proceedings pursuant to SEC rules and other pending matters as it may determine to be appropriate.
For claims, litigation and proceedings and governmental investigations and inquiries not related to income taxes, the Company records liabilities in the consolidated financial statements when it is both probable that a liability has been incurred and the amount of loss can be reasonably estimated and periodically adjusts these as appropriate. When the reasonable estimate of the loss is within a range of amounts, the minimum amount of the range is accrued unless some higher amount within the range is a better estimate than another amount within the range. In instances when a loss is reasonably possible but uncertainties exist related to the probable outcome and/or the amount or range of loss, management does not record a liability but discloses the contingency if material. As additional information becomes available, the Company adjusts its assessments and estimates of such matters accordingly. Moody’s also discloses material pending legal proceedings pursuant to SEC rules and other pending matters as it may determine to be appropriate.
In view of the inherent difficulty of assessing the potential outcome of legal proceedings, governmental, regulatory and legislative investigations and inquiries, claims and litigation and similar matters and contingencies, particularly when the claimants seek large or indeterminate damages or assert novel legal theories or the matters involve a large number of parties, the Company often cannot predict what the eventual outcome of the pending matters will be or the timing of any resolution of such matters. The Company also may be unable to predict the impact (if any) that any such matters may have on how its business is conducted, on its competitive position or on its financial position, results of operations or cash flows. As the process to resolve any pending matters progresses, management will continue to review the latest information available and assess its ability to predict the outcome of such matters and the effects, if any, on its operations and financial condition and to accrue for and disclose such matters as and when required. However, because such matters are inherently unpredictable and unfavorable developments or resolutions can occur, the ultimate outcome of such matters, including the amount of any loss, may differ from those estimates.
Operating Expenses
Operating expenses include costs associated with the development and production of the Company’s products and services and their delivery to customers. These expenses principally include employee compensation and benefits and travel costs that are incurred in connection with these activities. Operating expenses are charged to income as incurred.
Selling, General and Administrative Expenses
SG&A expenses include such items as compensation and benefits for corporate officers and staff and compensation and other expenses related to sales. They also include items such as office rent, business insurance, professional fees and gains and losses from sales and disposals of assets. SG&A expenses are charged to income as incurred.
Foreign Currency Translation
For all operations outside the U.S. where the Company has designated the local currency as the functional currency, assets and liabilities are translated into U.S. dollars using end of year exchange rates, and revenue and expenses are translated using average exchange rates for the year. For these foreign operations, currency translation adjustments are recorded to other comprehensive income.
Comprehensive Income
Comprehensive income represents the change in net assets of a business enterprise during a period due to transactions and other events and circumstances from non-owner sources including: foreign currency translation impacts; net actuarial gains and losses and net prior service costs related to pension and other retirement plans; and gains and losses on derivative instruments designated as net investment hedges or cash flow hedges. Comprehensive income items, including cumulative translation adjustments of entities that are less-than-wholly-owned subsidiaries, will be reclassified to noncontrolling interests and thereby, adjusting accumulated other comprehensive income proportionately in accordance with the percentage of ownership interest of the non-controlling shareholder.
Income Taxes
The Company accounts for income taxes under the asset and liability method in accordance with ASC Topic 740. Therefore, income tax expense is based on reported income before income taxes and deferred income taxes reflect the effect of temporary differences between the amounts of assets and liabilities that are recognized for financial reporting purposes and the amounts that are recognized for income tax purposes.
The Company classifies interest related to unrecognized tax benefits as a component of interest expense in its consolidated statements of operations. Penalties are recognized in other non-operating expenses. For UTPs, the Company first determines whether it is more-likely-than-not (defined as a likelihood of more than fifty percent) that a tax position will be sustained based on its technical merits as of the reporting date, assuming that taxing authorities will examine the position and have full knowledge of all relevant information. A tax position that meets this more-likely-than-not threshold is then measured and recognized at the largest amount of benefit that is greater than fifty percent likely to be realized upon effective settlement with a taxing authority.
On December 22, 2017, the Tax Act was signed into law, resulting in all previously undistributed foreign earnings being subject to U.S. tax. The Company has provided deferred taxes for those entities whose earnings are not considered indefinitely reinvested.
Fair Value of Financial Instruments
The Company’s financial instruments include cash, cash equivalents, trade receivables and payables, and certain short-term investments consisting primarily of certificates of deposit and money market deposits, all of which are short-term in nature and, accordingly, approximate fair value.
The Company also invests in mutual funds, which are accounted for as equity securities with readily determinable fair values under ASC Topic 321. The Company measures these investments at fair value with both realized gains and losses and unrealized holding gains and losses for these investments included in net income.
Also, the Company uses derivative instruments to manage certain financial exposures that occur in the normal course of business. These derivative instruments are carried at fair value in the Company’s consolidated balance sheets.
Fair value is defined by the ASC 820 as the price that would be received from selling an asset or paid to transfer a liability (i.e., an exit price) in an orderly transaction between market participants at the measurement date. The determination of this fair value is based on the principal or most advantageous market in which the Company could commence transactions and considers assumptions that market participants would use when pricing the asset or liability, such as inherent risk, transfer restrictions and risk of nonperformance. Also, determination of fair value assumes that market participants will consider the highest and best use of the asset.
The ASC establishes a fair value hierarchy whereby the inputs contained in valuation techniques used to measure fair value are categorized into three broad levels as follows:
Level 1: quoted market prices in active markets that the reporting entity has the ability to access at the date of the fair value measurement;
Level 2: inputs other than quoted market prices described in Level 1 that are observable for the asset or liability, either directly or indirectly, such as quoted prices in active markets for similar assets or liabilities, quoted prices for identical or similar assets or liabilities in markets that are not active or other inputs that are observable or can be corroborated by observable market data for substantially the full term of the assets or liabilities;
Level 3: unobservable inputs that are supported by little or no market activity and that are significant to the fair value measurement of the assets or liabilities.
Concentration of Credit Risk
Financial instruments that potentially subject the Company to concentration of credit risk principally consist of cash and cash equivalents, short-term investments, trade receivables and derivatives.
The Company manages its credit risk exposure by allocating its cash equivalents among various money market deposit accounts and certificates of deposits. Short-term investments primarily consist of certificates of deposit as of December 31, 2021 and 2020. The Company manages its credit risk exposure on cash equivalents and short-term investments by limiting the amount it can invest with any single entity. No customer accounted for 10% or more of accounts receivable at December 31, 2021 or 2020.
Earnings per Share of Common Stock
Basic shares outstanding is calculated based on the weighted average number of shares of common stock outstanding during the reporting period. Diluted shares outstanding is calculated giving effect to all potentially dilutive common shares, assuming that such shares were outstanding and dilutive during the reporting period.
Pension and Other Retirement Benefits
Moody’s maintains various noncontributory DBPPs as well as other contributory and noncontributory retirement plans. The expense and assets/liabilities that the Company reports for its pension and other retirement benefits are dependent on many assumptions concerning the outcome of future events and circumstances. These assumptions represent the Company’s best estimates and may vary by plan. The differences between the assumptions for the expected long-term rate of return on plan assets and actual experience is spread over a five-year period to the market-related value of plan assets, which is used in determining the expected return on assets component of annual pension expense. All other actuarial gains and losses are generally deferred and amortized over the estimated average future working life of active plan participants.
The Company recognizes as an asset or liability in its consolidated balance sheet the funded status of its defined benefit retirement plans, measured on a plan-by-plan basis. Changes in the funded status due to actuarial gains/losses are recorded as part of other comprehensive income during the period the changes occur.
Use of Estimates
The preparation of financial statements in conformity with GAAP requires management to make estimates and assumptions that affect the reported amounts of assets and liabilities, the disclosure of contingent assets and liabilities at the date of the financial statements, and the reported amounts of revenue and expenses during the period. Actual results could differ from those estimates.
Recently Issued Accounting Pronouncements
In January 2021, the FASB issued ASU 2021-01, “Reference Rate Reform - Scope,” which clarified the scope and application of the original guidance, ASU No. 2020-04, "Facilitation of the Effects of Reference Rate Reform on Financial Reporting" ("ASU No. 2020-04"), issued in March 2020 (codified into ASC Topic 848 "Reference Rate Reform"). ASU No. 2020-04 provides temporary optional expedients and exceptions to the U.S. GAAP guidance on contract modifications and hedge accounting to ease the financial reporting burdens related to the expected market transition from the London Interbank Offered Rate (LIBOR) and other interbank offered rates to alternative reference rates. Both ASU's were effective upon issuance, and the Company may elect to apply the amendments prospectively through December 31, 2022 as the transition from LIBOR is completed.
As of December 31, 2021, the Company has interest rate swaps designated as fair value hedges and cross currency swaps designated as net investment hedges referencing three-month or six-month USD LIBOR with aggregate notional amounts as disclosed in Note 6. For derivative instruments that will be outstanding at the transition date, the Company intends to modify the contractual terms of the instruments to replace LIBOR with another reference rate, such as SOFR. Pursuant to the modification of the contractual terms of these instruments, the Company intends to utilize the various optional expedients set forth in ASC Topic 848 relating to derivative instruments used in hedging relationships.
In October 2021, the FASB issued ASU 2021-08, "Business Combinations (Topic 805): Accounting for Contract Assets and Contract Liabilities from Contracts with Customers" ("ASU No. 2021-08"). ASU No. 2021-08 will require companies to apply the definition of a performance obligation under ASC Topic 606 to recognize and measure contract assets and contract liabilities (i.e., deferred revenue) relating to contracts with customers that are acquired in a business combination. Under current GAAP, an acquirer generally recognizes assets acquired and liabilities assumed in a business combination, including contract assets and contract liabilities arising from revenue contracts with customers, at fair value on the acquisition date. ASU No. 2021-08 will result in the acquirer recording acquired contract assets and liabilities on the same basis that would have been recorded by the acquiree before the acquisition under ASC Topic 606. ASU No. 2021-08 is effective for fiscal years beginning after December 15, 2022, with early adoption permitted. The Company intends to early adopt this ASU effective January 1, 2022.
NOTE 3 REVENUES
Revenue by Category
The following table presents the Company’s revenues disaggregated by LOB: | | | | | | | | | | | | | | | | | |
| Year Ended December 31, |
| 2021 | | 2020 | | 2019 |
| MIS: | | | | | |
| Corporate finance (CFG) | | | | | |
| Investment-grade | $ | 439 | | | $ | 636 | | | $ | 379 | |
| High-yield | 411 | | | 352 | | | 258 | |
| Bank loans | 606 | | | 287 | | | 313 | |
Other accounts (CFG) (1) | 631 | | | 582 | | | 547 | |
| Total CFG | 2,087 | | | 1,857 | | | 1,497 | |
| Financial institutions (FIG) | | | | | |
| Banking | 411 | | | 355 | | | 320 | |
| Insurance | 145 | | | 137 | | | 119 | |
| Managed investments | 36 | | | 28 | | | 25 | |
| Other accounts (FIG) | 10 | | | 10 | | | 12 | |
| Total FIG | 602 | | | 530 | | | 476 | |
| Public, project and infrastructure finance (PPIF) | | | | | |
| Public finance / sovereign | 244 | | | 250 | | | 222 | |
| Project and infrastructure | 277 | | | 246 | | | 224 | |
| Total PPIF | 521 | | | 496 | | | 446 | |
| Structured finance (SFG) | | | | | |
| Asset-backed securities | 118 | | | 98 | | | 99 | |
| RMBS | 123 | | | 96 | | | 95 | |
| CMBS | 102 | | | 61 | | | 81 | |
| Structured credit | 215 | | | 105 | | | 148 | |
| Other accounts (SFG) | 2 | | | 2 | | | 4 | |
| Total SFG | 560 | | | 362 | | | 427 | |
| Total ratings revenue | 3,770 | | | 3,245 | | | 2,846 | |
| MIS Other | 42 | | | 47 | | | 29 | |
| Total external revenue | 3,812 | | | 3,292 | | | 2,875 | |
| Intersegment royalty | 165 | | | 148 | | | 134 | |
| Total MIS | 3,977 | | | 3,440 | | | 3,009 | |
| MA: | | | | | |
| Research, data and analytics (RD&A) | 1,745 | | | 1,514 | | | 1,273 | |
| Enterprise risk solutions (ERS) | 661 | | | 565 | | | 522 | |
Professional services (PS)(2) | — | | | — | | | 159 | |
| Total external revenue | 2,406 | | | 2,079 | | | 1,954 | |
| Intersegment revenue | 7 | | | 7 | | | 9 | |
| Total MA | 2,413 | | | 2,086 | | | 1,963 | |
| Eliminations | (172) | | | (155) | | | (143) | |
| Total MCO | $ | 6,218 | | | $ | 5,371 | | | $ | 4,829 | |
(1)Other includes: recurring monitoring fees of a rated debt obligation and/or entities that issue such obligations as well as fees from programs such as commercial paper, medium term notes, and ICRA corporate finance revenue.
(2)Subsequent to the divestiture of MAKS in 2019, revenue from the MALS reporting unit, which previous to 2020 was reported in the PS LOB, is now reported as part of the RD&A LOB. Prior periods have not been reclassified as the amounts were not material.
The following table presents the Company’s revenues disaggregated by LOB and geographic area: | | | | | | | | | | | | | | | | | | | | | | | | | | | | | | | | | | | | | | | | | | | | | | | | | | | | | |
| Year Ended December 31, 2021 | | Year Ended December 31, 2020 | | Year Ended December 31, 2019 |
| U.S. | | Non-U.S. | | Total | | U.S. | | Non-U.S. | | Total | | U.S. | | Non-U.S. | | Total |
| MIS: | | | | | | | | | | | | | | | | | |
| Corporate finance | $ | 1,384 | | | $ | 703 | | | $ | 2,087 | | | $ | 1,291 | | | $ | 566 | | | $ | 1,857 | | | $ | 968 | | | $ | 529 | | | $ | 1,497 | |
| Financial institutions | 289 | | | 313 | | | 602 | | | 250 | | | 280 | | | 530 | | | 200 | | | 276 | | | 476 | |
| Public, project and infrastructure finance | 304 | | | 217 | | | 521 | | | 311 | | | 185 | | | 496 | | | 282 | | | 164 | | | 446 | |
| Structured finance | 364 | | | 196 | | | 560 | | | 214 | | | 148 | | | 362 | | | 270 | | | 157 | | | 427 | |
| Total ratings revenue | 2,341 | | | 1,429 | | | 3,770 | | | 2,066 | | | 1,179 | | | 3,245 | | | 1,720 | | | 1,126 | | | 2,846 | |
| MIS Other | 3 | | | 39 | | | 42 | | | 2 | | | 45 | | | 47 | | | 1 | | | 28 | | | 29 | |
| Total MIS | 2,344 | | | 1,468 | | | 3,812 | | | 2,068 | | | 1,224 | | | 3,292 | | | 1,721 | | | 1,154 | | | 2,875 | |
| MA: | | | | | | | | | | | | | | | | | |
| Research, data and analytics | 758 | | | 987 | | | 1,745 | | | 668 | | | 846 | | | 1,514 | | | 558 | | | 715 | | | 1,273 | |
| Enterprise risk solutions | 314 | | | 347 | | | 661 | | | 219 | | | 346 | | | 565 | | | 201 | | | 321 | | | 522 | |
Professional services (PS)(1) | — | | | — | | | — | | | — | | | — | | | — | | | 64 | | | 95 | | | 159 | |
| Total MA | 1,072 | | | 1,334 | | | 2,406 | | | 887 | | | 1,192 | | | 2,079 | | | 823 | | | 1,131 | | | 1,954 | |
| Total MCO | $ | 3,416 | | | $ | 2,802 | | | $ | 6,218 | | | $ | 2,955 | | | $ | 2,416 | | | $ | 5,371 | | | $ | 2,544 | | | $ | 2,285 | | | $ | 4,829 | |
(1)Subsequent to the divestiture of MAKS in 2019, revenue from the MALS reporting unit, which previous to 2020 was reported in the PS LOB, is now reported as part of the RD&A LOB. Prior periods have not been reclassified as the amounts were not material.
The following table presents the Company's reportable segment revenues disaggregated by segment and geographic region: | | | | | | | | | | | | | | | | | | | | |
| | Year Ended December 31, |
| | 2021 | | 2020 | | 2019 |
| MIS: | | | | | | |
| U.S. | | $ | 2,344 | | | $ | 2,068 | | | $ | 1,721 | |
| Non-U.S.: | | | | | | |
| EMEA | | 930 | | | 727 | | | 686 | |
| Asia-Pacific | | 357 | | | 345 | | | 320 | |
| Americas | | 181 | | | 152 | | | 148 | |
| Total Non-U.S. | | 1,468 | | | 1,224 | | | 1,154 | |
| Total MIS | | 3,812 | | | 3,292 | | | 2,875 | |
| MA: | | | | | | |
| U.S. | | 1,072 | | | 887 | | | 823 | |
| Non-U.S.: | | | | | | |
| EMEA | | 936 | | | 818 | | | 760 | |
| Asia-Pacific | | 239 | | | 226 | | | 231 | |
| Americas | | 159 | | | 148 | | | 140 | |
| Total Non-U.S. | | 1,334 | | | 1,192 | | | 1,131 | |
| Total MA | | 2,406 | | | 2,079 | | | 1,954 | |
| Total MCO | | $ | 6,218 | | | $ | 5,371 | | | $ | 4,829 | |
The following tables summarize the split between transaction and recurring revenue. In the MIS segment, excluding MIS Other, transaction revenue represents the initial rating of a new debt issuance as well as other one-time fees while recurring revenue represents the recurring monitoring fees of a rated debt obligation and/or entities that issue such obligations, as well as revenue from programs such as commercial paper, medium-term notes and shelf registrations. In MIS Other, transaction revenue represents revenue from professional services and recurring revenue represents subscription-based revenues. In the MA segment, recurring revenue represents subscription-based revenues and software maintenance revenue. Transaction revenue in MA represents perpetual software license fees and revenue from software implementation services, risk management advisory projects, and training and certification services. | | | | | | | | | | | | | | | | | | | | | | | | | | | | | | | | | | | | | | | | | | | | | | | | | | | | | | |
| Year Ended December 31, | |
| 2021 | | 2020 | | 2019 | |
| Transaction | | Recurring | | Total | | Transaction | | Recurring | | Total | | Transaction | | Recurring | | Total | |
| Corporate Finance | $ | 1,600 | | | $ | 487 | | | $ | 2,087 | | | $ | 1,401 | | | $ | 456 | | | $ | 1,857 | | | $ | 1,057 | | | $ | 440 | | | $ | 1,497 | | |
| 77 | % | | 23 | % | | 100 | % | | 75 | % | | 25 | % | | 100 | % | | 71 | % | | 29 | % | | 100 | % | |
| Financial Institutions | $ | 320 | | | $ | 282 | | | $ | 602 | | | $ | 265 | | | $ | 265 | | | $ | 530 | | | $ | 212 | | | $ | 264 | | | $ | 476 | | |
| 53 | % | | 47 | % | | 100 | % | | 50 | % | | 50 | % | | 100 | % | | 45 | % | | 55 | % | | 100 | % | |
| Public, Project and Infrastructure Finance | $ | 354 | | | $ | 167 | | | $ | 521 | | | $ | 337 | | | $ | 159 | | | $ | 496 | | | $ | 292 | | | $ | 154 | | | $ | 446 | | |
| 68 | % | | 32 | % | | 100 | % | | 68 | % | | 32 | % | | 100 | % | | 65 | % | | 35 | % | | 100 | % | |
| Structured Finance | $ | 362 | | | $ | 198 | | | $ | 560 | | | $ | 175 | | | $ | 187 | | | $ | 362 | | | $ | 246 | | | $ | 181 | | | $ | 427 | | |
| 65 | % | | 35 | % | | 100 | % | | 48 | % | | 52 | % | | 100 | % | | 58 | % | | 42 | % | | 100 | % | |
| MIS Other | $ | 4 | | | $ | 38 | | | $ | 42 | | | $ | 4 | | | $ | 43 | | | $ | 47 | | | $ | 2 | | | $ | 27 | | | $ | 29 | | |
| 10 | % | | 90 | % | | 100 | % | | 9 | % | | 91 | % | | 100 | % | | 7 | % | | 93 | % | | 100 | % | |
| Total MIS | $ | 2,640 | | | $ | 1,172 | | | $ | 3,812 | | | $ | 2,182 | | | $ | 1,110 | | | $ | 3,292 | | | $ | 1,809 | | | $ | 1,066 | | | $ | 2,875 | | |
| 69 | % | | 31 | % | | 100 | % | | 66 | % | | 34 | % | | 100 | % | | 63 | % | | 37 | % | | 100 | % | |
| Research, data and analytics | $ | 91 | | | $ | 1,654 | | | $ | 1,745 | | | $ | 80 | | | $ | 1,434 | | | $ | 1,514 | | | $ | 16 | | | $ | 1,257 | | | $ | 1,273 | | |
| 5 | % | | 95 | % | | 100 | % | | 5 | % | | 95 | % | | 100 | % | | 1 | % | | 99 | % | | 100 | % | |
| Enterprise risk solutions | $ | 79 | | | $ | 582 | | | $ | 661 | | | $ | 117 | | | $ | 448 | | | $ | 565 | | | $ | 118 | | | $ | 404 | | | $ | 522 | | |
| 12 | % | | 88 | % | | 100 | % | | 21 | % | | 79 | % | | 100 | % | | 23 | % | | 77 | % | | 100 | % | |
Professional services(1) | $ | — | | | $ | — | | | $ | — | | | $ | — | | | $ | — | | | $ | — | | | $ | 159 | | | $ | — | | | $ | 159 | | |
| — | % | | — | % | | — | % | | — | % | | — | % | | — | % | | 100 | % | | — | % | | 100 | % | |
| Total MA | $ | 170 | | | $ | 2,236 | | | $ | 2,406 | | | $ | 197 | | | $ | 1,882 | | | $ | 2,079 | | | $ | 293 | | | $ | 1,661 | | | $ | 1,954 | | |
| 7 | % | | 93 | % | | 100 | % | | 9 | % | | 91 | % | | 100 | % | | 15 | % | | 85 | % | | 100 | % | |
| Total Moody’s Corporation | $ | 2,810 | | | $ | 3,408 | | | $ | 6,218 | | | $ | 2,379 | | | $ | 2,992 | | | $ | 5,371 | | | $ | 2,102 | | | $ | 2,727 | | | $ | 4,829 | | |
| 45 | % | | 55 | % | | 100 | % | | 44 | % | | 56 | % | | 100 | % | | 44 | % | | 56 | % | | 100 | % | |
(1)Subsequent to the divestiture of MAKS in 2019, the RD&A LOB now includes revenue from MALS beginning in the first quarter of 2020. MALS revenue was previously reported as part of the PS LOB and prior year revenue by LOB has not been reclassified as the amounts were not material.
The following table presents the timing of revenue recognition: | | | | | | | | | | | | | | | | | | | | | | | | | | | | | | | | | | | | | | | | | | | | | | | | | | | | | |
| Year Ended December 31, 2021 | | Year Ended December 31, 2020 | | Year Ended December 31, 2019 |
| MIS | | MA | | Total | | MIS | | MA | | Total | | MIS | | MA | | Total |
| Revenue recognized at a point in time | $ | 2,640 | | | $ | 101 | | | $ | 2,741 | | | $ | 2,182 | | | $ | 121 | | | $ | 2,303 | | | $ | 1,809 | | | $ | 132 | | | $ | 1,941 | |
| Revenue recognized over time | 1,172 | | | 2,305 | | | 3,477 | | | 1,110 | | | 1,958 | | | 3,068 | | | 1,066 | | | 1,822 | | | 2,888 | |
| Total | $ | 3,812 | | | $ | 2,406 | | | $ | 6,218 | | | $ | 3,292 | | | $ | 2,079 | | | $ | 5,371 | | | $ | 2,875 | | | $ | 1,954 | | | $ | 4,829 | |
Unbilled Receivables, Deferred Revenue and Remaining Performance Obligations
Unbilled receivables
At December 31, 2021 and December 31, 2020, accounts receivable included approximately $386 million and $361 million, respectively, of unbilled receivables related to the MIS segment. Certain MIS arrangements contain contractual terms whereby the customers are billed in arrears for annual monitoring services and rating fees, requiring revenue to be accrued as an unbilled receivable as such services are provided.
In addition, for certain MA arrangements, the timing of when the Company has the unconditional right to consideration and recognizes revenue occurs prior to invoicing the customer. Consequently, at December 31, 2021 and December 31, 2020, accounts receivable included approximately $152 million and $98 million, respectively, of unbilled receivables related to the MA segment. The increase in unbilled receivables is driven by organic growth and the integration of recent acquisitions.
Deferred revenue
The Company recognizes deferred revenue when a contract requires a customer to pay consideration to the Company in advance of when revenue is recognized. This deferred revenue is relieved when the Company satisfies the related performance obligation and revenue is recognized.
Significant changes in the deferred revenue balances during the year ended December 31, 2021 are as follows: | | | | | | | | | | | | | | | | | |
| Year Ended December 31, 2021 |
| MIS | | MA | | Total |
| Balance at December 31, 2020 | $ | 313 | | | $ | 874 | | | $ | 1,187 | |
| Changes in deferred revenue | | | | | |
| Revenue recognized that was included in the deferred revenue balance at the beginning of the period | (220) | | | (810) | | | (1,030) | |
| Increases due to amounts billable excluding amounts recognized as revenue during the period | 207 | | | 884 | | | 1,091 | |
| Increases due to acquisitions during the period | — | | | 94 | | | 94 | |
| Effect of exchange rate changes | (4) | | | (3) | | | (7) | |
| Total changes in deferred revenue | (17) | | | 165 | | | 148 | |
| Balance at December 31, 2021 | $ | 296 | | | $ | 1,039 | | | $ | 1,335 | |
| Deferred revenue - current | $ | 214 | | | $ | 1,035 | | | $ | 1,249 | |
| Deferred revenue - noncurrent | $ | 82 | | | $ | 4 | | | $ | 86 | |
For the MA segment, for the year ended December 31, 2021, the increase in the deferred revenue balance was primarily due to acquisitions (Cortera, RMS, and PassFort) and organic growth.
Significant changes in the deferred revenue balances during the year ended December 31, 2020 are as follows: | | | | | | | | | | | | | | | | | |
| Year Ended December 31, 2020 |
| MIS | | MA | | Total |
| Balance at December 31, 2019 | $ | 322 | | | $ | 840 | | | $ | 1,162 | |
| Changes in deferred revenue | | | | | |
| Revenue recognized that was included in the deferred revenue balance at the beginning of the period | (229) | | | (800) | | | (1,029) | |
| Increases due to amounts billable excluding amounts recognized as revenue during the period | 215 | | | 792 | | | 1,007 | |
| Increases due to acquisitions during the period | — | | | 24 | | | 24 | |
| Effect of exchange rate changes | 5 | | | 18 | | | 23 | |
| Total changes in deferred revenue | (9) | | | 34 | | | 25 | |
| Balance at December 31, 2020 | $ | 313 | | | $ | 874 | | | $ | 1,187 | |
| Deferred revenue—current | $ | 216 | | | $ | 873 | | | $ | 1,089 | |
| Deferred revenue—noncurrent | $ | 97 | | | $ | 1 | | | $ | 98 | |
For the MA segment, for the year ended December 31, 2020, the increase in the deferred revenue balance was primarily due to acquisitions (RDC, Acquire Media, ZMFS, and Catylist) and changes in FX translation rates.
Significant changes in the deferred revenue balances during the year ended December 31, 2019 are as follows: | | | | | | | | | | | | | | | | | |
| Year Ended December 31, 2019 |
| MIS | | MA | | Total |
| Balance at December 31, 2018 | $ | 325 | | | $ | 750 | | | $ | 1,075 | |
| Changes in deferred revenue | | | | | |
| Revenue recognized that was included in the deferred revenue balance at the beginning of the period | (209) | | | (714) | | | (923) | |
| Increases due to amounts billable excluding amounts recognized as revenue during the period | 202 | | | 789 | | | 991 | |
| Increases due to acquisitions during the period | 3 | | | 6 | | | 9 | |
| Effect of exchange rate changes | 1 | | | 9 | | | 10 | |
| Total changes in deferred revenue | (3) | | | 90 | | | 87 | |
| Balance at December 31, 2019 | $ | 322 | | | $ | 840 | | | $ | 1,162 | |
| Deferred revenue—current | $ | 214 | | | $ | 836 | | | $ | 1,050 | |
| Deferred revenue—noncurrent | $ | 108 | | | $ | 4 | | | $ | 112 | |
For the MA segment, for the year ended December 31, 2019, the increase in the deferred revenue balance was primarily due to organic growth.
Remaining performance obligations
Remaining performance obligations in the MIS segment largely reflect deferred revenue related to monitoring fees for certain structured finance products, primarily CMBS, where the issuers can elect to pay the monitoring fees for the life of the security in advance. As of December 31, 2021, the aggregate amount of the transaction price allocated to remaining performance obligations was approximately $112 million. The Company expects to recognize into revenue approximately 20% of this balance within one year, approximately 50% of this balance between one to five years and the remaining amount thereafter. With respect to the remaining performance obligations for the MIS segment, the Company has applied a practical expedient set forth in ASC Topic 606 permitting the omission of unsatisfied performance obligations relating to contracts with an original expected length of one year or less.
Remaining performance obligations in the MA segment include both amounts recorded as deferred revenue on the balance sheet as of December 31, 2021 as well as amounts not yet invoiced to customers as of December 31, 2021 largely reflecting future revenue related to signed multi-year arrangements for hosted and installed subscription-based products. As of December 31, 2021, the aggregate amount of the transaction price allocated to remaining performance obligations was approximately $3.0 billion. The Company expects to recognize into revenue approximately 65% of this balance within one year, approximately 25% of this balance between one to two years and the remaining amount thereafter.
Costs to Obtain or Fulfill a Contract with a Customer
MA Costs to Obtain a Contract with a Customer
| | | | | | | | | | | | | |
| As of December 31, | | |
| 2021 | | 2020 | | |
| | | | | |
| Capitalized costs to obtain sales contracts | $ | 183 | | | $ | 180 | | | |
| | | | | | | | | | | | | | | | | |
| Year ended December 31, |
| 2021 | | 2020 | | 2019 |
| Amortization of capitalized costs to obtain sales contracts | $ | 60 | | | $ | 59 | | | $ | 53 | |
Amortization of costs incurred to obtain customer contracts is included within SG&A expenses in the consolidated statements of operations. Costs incurred to obtain customer contracts are only in the MA segment.
MIS and MA Costs to Fulfill a Contract with a Customer
| | | | | | | | | | | | | | | | | | | | | | | | | | | | | | | | | | | | | | | | | |
| As of December 31, 2021 | | As of December 31, 2020 | | |
| MIS | | MA | | Total | | MIS | | MA | | Total | | | | | | |
| | | | | | | | | | | | | | | | | |
| Capitalized costs to fulfill sales contracts | $ | 14 | | | $ | 44 | | | $ | 58 | | | $ | 12 | | | $ | 35 | | | $ | 47 | | | | | | | |
| | | | | | | | | | | | | | | | | | | | | | | | | | | | | | | | | | | | | | | | | | | | | | | | | | | | | |
| Year Ended
December 31, 2021 | | Year Ended
December 31, 2020 | | Year Ended
December 31, 2019 |
| MIS | | MA | | Total | | MIS | | MA | | Total | | MIS | | MA | | Total |
| Amortization of capitalized costs to fulfill sales contracts | $ | 48 | | | $ | 76 | | | $ | 124 | | | $ | 47 | | | $ | 66 | | | $ | 113 | | | $ | 42 | | | $ | 56 | | | $ | 98 | |
Amortization of costs to fulfill customer contracts is included within operating expenses in the consolidated statements of operations.
NOTE 4 RECONCILIATION OF WEIGHTED AVERAGE SHARES OUTSTANDING
Below is a reconciliation of basic to diluted shares outstanding: | | | | | | | | | | | | | | | | | |
| Year Ended December 31, |
| 2021 | | 2020 | | 2019 |
| Basic | 186.4 | | | 187.6 | | | 189.3 | |
| Dilutive effect of shares issuable under stock-based compensation plans | 1.5 | | | 1.7 | | | 2.3 | |
| Diluted | 187.9 | | | 189.3 | | | 191.6 | |
| Antidilutive options to purchase common shares and restricted stock as well as contingently issuable restricted stock which are excluded from the table above | 0.2 | | | 0.2 | | | 0.2 | |
The calculation of diluted EPS requires certain assumptions regarding the use of both cash proceeds and assumed proceeds that would be received upon the exercise of stock options and vesting of restricted stock outstanding as of December 31, 2021, 2020 and 2019.
NOTE 5 ACCELERATED SHARE REPURCHASE PROGRAM
On February 20, 2019, the Company entered into an ASR agreement with a financial institution counterparty to repurchase $500 million of its outstanding common stock. The Company paid $500 million to the counterparty and received an initial delivery of 2.2 million shares of its common stock. Final settlement of the ASR agreement was completed on April 26, 2019 and the Company received delivery of an additional 0.6 million shares of the Company’s common stock.
In total, the Company repurchased 2.8 million shares of the Company’s common stock during the term of the ASR Agreement, based on the volume-weighted average price (net of discount) of $180.33/share over the duration of the program. The initial share repurchase and final share settlement were recorded as a reduction to shareholders’ equity.
NOTE 6 CASH EQUIVALENTS AND INVESTMENTS
The table below provides additional information on the Company’s cash equivalents and investments: | | | | | | | | | | | | | | | | | | | | | | | | | | | | | | | | | | | |
| As of December 31, 2021 |
| Cost | | Gross Unrealized Gains | | Fair Value | | Balance sheet location |
| Cash and cash equivalents | | Short-term investments | | Other assets |
Certificates of deposit and money market deposit accounts (1) | $ | 691 | | | $ | — | | | $ | 691 | | | $ | 584 | | | $ | 91 | | | $ | 16 | |
| Mutual funds | $ | 65 | | | $ | 8 | | | $ | 73 | | | $ | — | | | $ | — | | | $ | 73 | |
| | | | | | | | | | | | | | | | | | | | | | | | | | | | | | | | | | | |
| As of December 31, 2020 |
| Cost | | Gross Unrealized Gains | | Fair Value | | Balance sheet location |
| Cash and cash equivalents | | Short-term investments | | Other assets |
| | | | | | | | | | | |
Certificates of deposit and money market deposit accounts (1) | $ | 1,430 | | | $ | — | | | $ | 1,430 | | | $ | 1,325 | | | $ | 99 | | | $ | 6 | |
| Mutual funds | $ | 54 | | | $ | 6 | | | $ | 60 | | | $ | — | | | $ | — | | | $ | 60 | |
(1)Consists of time deposits and money market deposit accounts. The remaining contractual maturities for the certificates of deposits classified as short-term investments were one to 12 months at December 31, 2021 and at December 31, 2020. The remaining contractual maturities for the certificates of deposits classified in other assets are 13 to 29 months at December 31, 2021 and 13 to 23 months at December 31, 2020. Time deposits with a maturity of less than 90 days at time of purchase are classified as cash and cash equivalents.
In addition, the Company invested in Corporate-Owned Life Insurance (COLI) in the first quarter of 2020. As of December 31, 2021 and December 31, 2020, the contract value of the COLI was $37 million and $17 million, respectively.
NOTE 7 DERIVATIVE INSTRUMENTS AND HEDGING ACTIVITIES
The Company is exposed to global market risks, including risks from changes in FX rates and changes in interest rates. Accordingly, the Company uses derivatives in certain instances to manage the aforementioned financial exposures that occur in the normal course of business. The Company does not hold or issue derivatives for speculative purposes.
Derivatives and non-derivative instruments designated as accounting hedges:
Interest Rate Swaps Designated as Fair Value Hedges
The Company has entered into interest rate swaps to convert the fixed interest rate on certain of its long-term debt to a floating interest rate based on the 3-month and 6-month LIBOR. The purpose of these hedges is to mitigate the risk associated with changes in the fair value of the long-term debt, thus the Company has designated these swaps as fair value hedges. The fair value of the swaps is adjusted quarterly with a corresponding adjustment to the carrying value of the debt. The changes in the fair value of the swaps and the underlying hedged item generally offset and the net cash settlements on the swaps are recorded each period within interest expense, net in the Company’s consolidated statements of operations.
The following table summarizes the Company’s interest rate swaps designated as fair value hedges: | | | | | | | | | | | | | | | | | | | | | | | | | | |
| | Nature of Swap | | Notional Amount
As of December 31, | | Floating Interest Rate |
| Hedged Item | | 2021 | | 2020 | |
2012 Senior Notes due 2022(1) | | Pay Floating/Receive Fixed | | $ | — | | | $ | 330 | | | 3-month LIBOR |
| 2017 Senior Notes due 2023 | | Pay Floating/Receive Fixed | | $ | 250 | | | $ | 250 | | | 3-month LIBOR |
| 2017 Senior Notes due 2028 | | Pay Floating/Receive Fixed | | $ | 500 | | | $ | 500 | | | 3-month LIBOR |
| 2020 Senior Notes due 2025 | | Pay Floating/Receive Fixed | | $ | 300 | | | $ | 300 | | | 6-month LIBOR |
2014 Senior Notes due 2044(2) | | Pay Floating/Receive Fixed | | $ | 300 | | | $ | — | | | 3-month LIBOR |
2018 Senior Notes due 2048(2) | | Pay Floating/Receive Fixed | | $ | 300 | | | $ | — | | | 3-month LIBOR |
| Total | | | | $ | 1,650 | | | $ | 1,380 | | | |
(1) Terminated in conjunction with the repayment of the 2012 Senior Notes due 2022 in the fourth quarter of 2021.
(2) Executed in the third quarter of 2021.
Refer to Note 18 for information on the cumulative amount of fair value hedging adjustments included in the carrying amount of the above hedged items.
The following table summarizes the impact to the statements of operations of the Company’s interest rate swaps designated as fair value hedges: | | | | | | | | | | | | | | | | | | | | | | | | | | |
| Total amounts of financial statement line item presented in the statements of operations in which the effects of fair value hedges are recorded | | Amount of Income (Expense)
Recognized in the Consolidated
Statements of Operations |
| Year Ended December 31, |
| 2021 | | 2020 | | 2019 |
| Interest expense, net | | | | $ | (171) | | | $ | (205) | | | $ | (208) | |
Descriptions | | Location on Consolidated Statements of Operations | | | | | | |
| Net interest settlements and accruals on interest rate swaps | | Interest expense, net | | $ | 23 | | | $ | 19 | | | $ | 3 | |
| Fair value changes on interest rate swaps | | Interest expense, net | | $ | (60) | | | $ | 47 | | | $ | 25 | |
| Fair value changes on hedged debt | | Interest expense, net | | $ | 60 | | | $ | (47) | | | $ | (25) | |
Net Investment Hedges
Debt designated as net investment hedges
The Company has designated €500 million of the 2015 Senior Notes Due 2027 and €750 million of the 2019 Senior Notes due 2030 as net investment hedges to mitigate FX exposure related to a portion of the Company’s euro net investment in certain foreign subsidiaries against changes in euro/USD exchange rates. These hedges are designated as accounting hedges under the applicable sections of ASC Topic 815 and will end upon the repayment of the notes in 2027 and 2030, respectively, unless terminated early at the discretion of the Company.
Cross currency swaps designated as net investment hedges
The Company enters into cross-currency swaps to mitigate FX exposure related to a portion of the Company’s euro net investment in certain foreign subsidiaries against changes in euro/USD exchange rates. The following table provides information on the cross-currency swaps designated as net investment hedges under ASC Topic 815: | | | | | | | | | | | | | | | | | | | | | | | | | | |
| December 31, 2021 |
| | Pay | | Receive |
| Nature of Swap | | Notional Amount | | Weighted Average Interest Rate | | Notional Amount | | Weighted Average Interest Rate |
| Pay Fixed/Receive Fixed | | € | 909 | | | 2.16% | | $ | 1,050 | | | 4.45% |
| Pay Floating/Receive Floating | | 1,179 | | | Based on 3-month EURIBOR | | 1,350 | | | Based on 3-month USD LIBOR |
| Total | | € | 2,088 | | | | | $ | 2,400 | | | |
| | | | | | | | | | | | | | | | | | | | | | | | | | |
| December 31, 2020 |
| | Pay | | Receive |
| Nature of Swap | | Notional Amount | | Weighted Average Interest Rate | | Notional Amount | | Weighted Average Interest Rate |
| Pay Fixed/Receive Fixed | | € | 1,079 | | | 1.43% | | $ | 1,220 | | | 3.96% |
| Pay Floating/Receive Floating | | 959 | | | Based on 3-month EURIBOR | | 1,080 | | | Based on 3-month USD LIBOR |
| Total | | € | 2,038 | | | | | $ | 2,300 | | | |
As of December 31, 2021, these hedges will expire and the notional amounts will be settled as follows unless terminated early at the discretion of the Company: | | | | | | | | |
| Year Ending December 31, | | |
| 2023 | | € | 442 | |
| 2024 | | € | 443 | |
| 2026 | | € | 450 | |
| 2027 | | € | 246 | |
| 2028 | | € | 507 | |
| Total | | € | 2,088 | |
Forward contracts designated as net investment hedges
The Company also entered into forward contracts to mitigate FX exposure related to a portion of the Company’s euro and GBP net investment in certain foreign subsidiaries against changes in euro/USD and GBP/euro exchange rates. The following table summarizes the notional amounts of the Company's outstanding forward contracts that were designated as net investment hedges: | | | | | | | | | | | | | | | | | | | | | | | | | | | | |
| | December 31, 2021 | | December 31, 2020 | | |
| Notional amount of net investment hedges | | Sell | | Buy | | Sell | | Buy | | |
| Contract to sell EUR for USD | | € | — | | | $ | — | | | € | 524 | | | $ | 627 | | | |
| Contract to sell GBP for EUR | | £ | — | | | € | — | | | £ | 134 | | | € | 148 | | | |
These forward contracts expired in August 2021.
Cash Flow Hedges
Interest Rate Forward Contracts
In January 2020, the Company entered into $300 million notional amount treasury rate locks with an average locked-in U.S. 30-year Treasury rate of 2.0103%, which were designated as cash flow hedges and used to manage the Company’s interest rate risk during the period prior to an anticipated issuance of 30-year debt. The treasury lock interest rate forward contracts matured on April 30, 2020, resulting in a cumulative loss of $68 million, which was recognized in AOCL. The loss on the Treasury rate lock will be reclassified from AOCL to earnings in the same period that the hedged transaction (i.e. interest payments on the 3.25% 2020 Senior Notes, due 2050) impacts earnings.
The following table provides information on the gains/(losses) on the Company’s net investment and cash flow hedges: | | | | | | | | | | | | | | | | | | | | | | | | | | | | | | | | | | | | | | | | | | | | | | | | | | | | | | | | |
| Amount of Gain/(Loss)
Recognized in AOCL on
Derivative, net of Tax | | Amount of Gain/(Loss)
Reclassified from AOCL into
Income, net of tax | | Gain/(Loss) Recognized in
Income on Derivative
(Amount Excluded from
Effectiveness Testing) | |
| Derivative and Non-Derivative Instruments in Net Investment Hedging Relationships | Year Ended December 31, | | Year Ended December 31, | | Year Ended December 31, | |
| 2021 | | 2020 | | 2019 | | 2021 | | 2020 | | 2019 | | 2021 | | 2020 | | 2019 | |
| FX forward contracts | $ | 18 | | | $ | (14) | | | $ | 4 | | | $ | 1 | | | $ | — | | | $ | 2 | | | $ | — | | | $ | — | | | $ | — | | |
| Cross currency swaps | 143 | | | (165) | | | 29 | | | — | | | — | | | — | | | 35 | | | 50 | | | 52 | | |
| Long-term debt | 81 | | | (95) | | | (7) | | (1) | — | | | — | | | — | | | — | | | — | | | — | | |
| Total net investment hedges | $ | 242 | | | $ | (274) | | | $ | 26 | | | $ | 1 | | | $ | — | | | $ | 2 | | | $ | 35 | | | $ | 50 | | | $ | 52 | | |
| Derivatives in Cash Flow Hedging Relationships | | | | | | | | | | | | | | | | | | |
| Interest rate contracts | — | | | (51) | | | — | | | (2) | | | (2) | | | — | | | — | | | — | | | — | | |
| Total cash flow hedges | — | | | (51) | | | — | | | (2) | | | (2) | | | — | | | — | | | — | | | — | | |
| Total | $ | 242 | | | $ | (325) | | | $ | 26 | | | $ | (1) | | | $ | (2) | | | $ | 2 | | | $ | 35 | | | $ | 50 | | | $ | 52 | | |
(1)Due to the Company's adoption of ASU 2018-02 during 2019, $3 million related to the tax effect of this net investment hedge was reclassified to retained earnings.
The cumulative amount of net investment hedge and cash flow hedge gains (losses) remaining in AOCL is as follows: | | | | | | | | | | | |
| Cumulative Gains/(Losses), net of tax |
| December 31, 2021 | | December 31, 2020 |
| Net investment hedges | | | |
| FX forwards | $ | 29 | | | $ | 12 | |
| Cross currency swaps | 19 | | | (124) | |
| Long-term debt | (27) | | | (108) | |
| Total net investment hedges | 21 | | | (220) | |
| Cash flow hedges | | | |
| Interest rate contracts | (49) | | | (51) | |
| Cross-currency swap | 2 | | | 2 | |
| Total cash flow hedges | (47) | | | (49) | |
| Total net (loss) gain in AOCL | $ | (26) | | | $ | (269) | |
Derivatives not designated as accounting hedges:
Foreign exchange forwards
The Company also enters into foreign exchange forward contracts to mitigate the change in fair value on certain assets and liabilities denominated in currencies other than a subsidiary’s functional currency. These forward contracts are not designated as accounting hedges under the applicable sections of Topic 815 of the ASC. Accordingly, changes in the fair value of these contracts are recognized immediately in other non-operating (expense) income, net in the Company’s consolidated statements of operations along with the FX gain or loss recognized on the assets and liabilities denominated in a currency other than the subsidiary’s functional currency. These contracts have expiration dates at various times through April 2022.
The following table summarizes the notional amounts of the Company’s outstanding foreign exchange forwards: | | | | | | | | | | | | | | | | | | | | | | | | | | | | | |
| | December 31, 2021 | | December 31, 2020 |
| Notional Amount of Currency Pair: | Sell | | Buy | | Sell | | Buy |
| Contracts to sell USD for GBP | $ | 126 | | | £ | 92 | | | $ | 295 | | | £ | 222 | |
| Contracts to sell USD for Japanese Yen | $ | 22 | | | ¥ | 2,500 | | | $ | 15 | | | ¥ | 1,600 | |
| Contracts to sell USD for Canadian dollars | $ | 120 | | | C$ | 150 | | | $ | 107 | | | C$ | 140 | |
| Contracts to sell USD for Singapore dollars | $ | 67 | | | S$ | 90 | | | $ | 59 | | | S$ | 79 | |
| Contracts to sell USD for Euros | $ | 364 | | | € | 315 | | | $ | 447 | | | € | 376 | |
| Contracts to sell Euros for GBP | € | — | | | £ | — | | | € | 135 | | | £ | 121 | |
| Contracts to sell USD for Russian Ruble | $ | 16 | | | ₽ | 1,200 | | | $ | 13 | | | ₽ | 1,000 | |
| Contracts to sell USD for Indian Rupee | $ | 7 | | | ₹ | 500 | | | $ | 18 | | | ₹ | 1,350 | |
| Contracts to sell GBP for USD | £ | 172 | | | $ | 231 | | | £ | — | | | $ | — | |
NOTE: € = Euro, £ = British pound, S$ = Singapore dollar, $ = U.S. dollar, ¥ = Japanese yen, C$ = Canadian dollar, ₽= Russian Ruble, ₹= Indian Rupee
The following table summarizes the impact to the consolidated statements of operations relating to the net gain (loss) on the Company’s derivatives which are not designated as hedging instruments: | | | | | | | | | | | | | | | | | | | | |
| | Year Ended December 31, |
| Derivatives Not Designated as Accounting Hedges | Location on Statement of Operations | 2021 | | 2020 | | 2019 |
| FX forwards | Other non-operating expense, net | $ | (27) | | | $ | 41 | | | $ | (11) | |
Foreign exchange forwards relating to RMS acquisition(1) | Other non-operating income, net | $ | (13) | | | $ | — | | | $ | — | |
(1) The Company entered into forward contracts to sell $1,675 million for €1,200 to hedge a portion of the GBP denominated RMS purchase price. The contract was terminated on September 14, 2021 and resulted in a $13 million loss.
The table below shows the classification between assets and liabilities on the Company’s consolidated balance sheets for the fair value of derivative instruments as well as the carrying value of its non-derivative debt instruments designated and qualifying as net investment hedges:
| | | | | | | | | | | | | | | | | |
| Derivative and Non-derivative Instruments |
| Balance Sheet Location | | December 31, 2021 | | December 31, 2020 |
| Assets: | | | | | |
| Derivatives designated as accounting hedges: | | | | | |
| Cross-currency swaps designated as net investment hedges | Other assets | | $ | 53 | | | $ | — | |
| Interest rate swaps designated as fair value hedges | Other assets | | 13 | | | 57 | |
| Total derivatives designated as accounting hedges | | | 66 | | | 57 | |
| Derivatives not designated as accounting hedges: | | | | | |
| FX forwards on certain assets and liabilities | Other current assets | | 1 | | | 31 | |
| Total assets | | | $ | 67 | | | $ | 88 | |
| Liabilities: | | | | | |
| Derivatives designated as accounting hedges: | | | | | |
| FX forwards designated as net investment hedges | Accounts payable and accrued liabilities | | $ | — | | | $ | 16 | |
| Cross-currency swaps designated as net investment hedges | Accounts payable and accrued liabilities | | — | | | 23 | |
| Cross-currency swaps designated as net investment hedges | Other liabilities | | 17 | | | 144 | |
| Interest rate swaps designated as fair value hedges | Other liabilities | | 23 | | | 1 | |
| Total derivatives designated as accounting hedges | | | 40 | | | 184 | |
| Non-derivative instruments designated as accounting hedge: | | | | | |
| Long-term debt designated as net investment hedge | Long-term debt | | 1,421 | | | 1,530 | |
| Derivatives not designated as accounting hedges: | | | | | |
| FX forwards on certain assets and liabilities | Accounts payable and accrued liabilities | | 12 | | | 2 | |
| Total liabilities | | | $ | 1,473 | | | $ | 1,716 | |
NOTE 8 PROPERTY AND EQUIPMENT, NET
Property and equipment, net consisted of: | | | | | | | | | | | | | |
| | December 31, |
| | 2021 | | | 2020 |
| Office and computer equipment (3 - 10 year estimated useful life) | | $ | 300 | | | | $ | 260 | |
| Office furniture and fixtures (3 - 10 year estimated useful life) | | 52 | | | | 49 | |
| Internal-use computer software (1 - 10 year estimated useful life) | | 771 | | | | 666 | |
| Leasehold improvements and building (1 - 20 year estimated useful life) | | 234 | | | | 231 | |
| Total property and equipment, at cost | | 1,357 | | | | 1,206 | |
| Less: accumulated depreciation and amortization | | (1,010) | | | | (928) | |
| Total property and equipment, net | | $ | 347 | | | | $ | 278 | |
Depreciation and amortization expense related to the above assets was $99 million, $96 million, and $97 million for the years ended December 31, 2021, 2020 and 2019, respectively.
NOTE 9 ACQUISITIONS AND DIVESTITURE
The following is a discussion of material acquisitions completed by the Company. The business combinations described below are accounted for using the acquisition method of accounting whereby assets acquired and liabilities assumed were recognized at fair value on the date of the transaction. Any excess of the purchase price over the fair value of the assets acquired and liabilities assumed was recorded to goodwill. Goodwill typically results through expected synergies from combining operations of an acquiree and an acquirer, anticipated new customer acquisition and products, as well as from intangible assets that do not qualify for separate recognition.
With the exception of RMS, the Company has not presented pro forma combined results for these acquisitions because the impact on previously reported statements of operations would not have been material.
PassFort
On November 30, 2021, the Company acquired 100% of PassFort, a U.K. SaaS-based workflow platform for identity verification, customer onboarding, and risk analysis.
The table below details the total consideration relating to the acquisition:
| | | | | | | | |
| Cash paid at closing | | $ | 157 | |
Additional consideration to be paid to sellers in 2022 (1) | | 1 | |
| Total consideration | | $ | 158 | |
(1) Represents additional consideration to be paid to the sellers following finalization of customary post-closing completion adjustments.
Shown below is the preliminary purchase price allocation, which summarizes the fair value of the assets and liabilities assumed, at the date of acquisition:
| | | | | | | | | | | |
| Cash | | | $ | 10 | |
| Accounts receivable | | | 1 | |
| Intangible assets: | | | |
| Product technology (5 year useful life) | $ | 14 | | | |
| Customer relationships (16 year useful life) | 8 | | | |
| Trade name (4 year useful life) | 1 | | | |
| Total intangible assets (9 year weighted average useful life) | | | 23 | |
| Goodwill | | | 138 | |
| | | |
| | | |
| Liabilities: | | | |
| Accounts payable and accrued liabilities | $ | (7) | | | |
| Deferred revenue | (1) | | | |
| Deferred tax liabilities | (6) | | | |
| Total liabilities | | | (14) | |
| Net assets acquired | | | $ | 158 | |
The Company has performed a preliminary valuation analysis of the fair market value of the assets and liabilities of the PassFort business. The final purchase price allocation will be determined when the Company has completed and fully reviewed the detailed valuations. The final allocation could differ materially from the preliminary allocation. The final allocation may include changes in allocations to acquired intangible assets as well as goodwill and other changes to assets and liabilities including deferred tax liabilities. The estimated useful lives of acquired intangible assets are also preliminary.
Goodwill
The goodwill recognized as a result of this acquisition includes, among other things, value created by combining the complementary risk assessment products of the Company and PassFort. The integration of PassFort’s platform into Moody’s suite of KYC and compliance offerings is expected to create a holistic workflow solution to benefit both new and existing Moody's customers.
Goodwill, which has been assigned to the MA segment, is not deductible for tax purposes.
Transaction costs
Transaction costs directly related to the PassFort acquisition were not material.
RMS
On September 15, 2021, the Company acquired 100% of RMS, a global provider of climate and natural disaster risk modeling and analytics. The cash payment was funded with new debt financing and a combination of U.S. and offshore cash on hand. The acquisition will expand Moody’s insurance data and analytics business and accelerate the development of the Company’s global integrated risk capabilities to address the next generation of risk assessment.
The table below details the total consideration relating to the acquisition:
| | | | | |
| Cash paid at closing | $ | 1,922 | |
| |
| |
| |
| |
| Replacement equity compensation awards | 5 | |
| Total consideration | $ | 1,927 | |
Shown below is the preliminary purchase price allocation, which summarizes the fair value of the assets and liabilities assumed, at the date of acquisition:
| | | | | | | | | | | |
| Cash | | | $ | 60 | |
| Accounts receivable | | | 38 | |
| Other current assets | | | 11 | |
| Property and equipment | | | 13 | |
| Operating lease right-of-use assets | | | 64 | |
| Intangible assets: | | | |
| Customer relationships (23 year useful life) | $ | 518 | | | |
| Product technology (7 year useful life) | 212 | | | |
| Trade name (9 year useful life) | 49 | | | |
| Total intangible assets (18 year weighted average useful life) | | | 779 | |
| Goodwill | | | 1,376 | |
| Deferred tax assets, net | | | 48 | |
| Other assets | | | 99 | |
| Liabilities: | | | |
| Accounts payable and accrued liabilities | $ | (92) | | | |
| Deferred revenue | (89) | | | |
| Operating lease liabilities | (68) | | | |
| Deferred tax liabilities, net | (214) | | | |
| Uncertain tax positions | (96) | | | |
| Other liabilities | (2) | | | |
| Total liabilities | | | (561) | |
| Net assets acquired | | | $ | 1,927 | |
The Company has performed a preliminary valuation analysis of the fair market value of the assets and liabilities of the RMS business. The final purchase price allocation will be determined when the Company has completed and fully reviewed all information necessary to finalize the fair value of the acquired assets and liabilities, including deferred revenue. The final allocation could differ materially from the preliminary allocation and may include changes in allocations to acquired intangible assets (including estimated useful lives of these assets), as well as goodwill and other changes to assets and liabilities including reserves for UTPs and deferred tax liabilities.
Goodwill
The goodwill recognized as a result of this acquisition includes, among other things, the value of combining the complementary product portfolios of Moody's and RMS, which is expected to extend the Company's reach into new market segments. The goodwill also includes the combined company's ability to accelerate technology innovations into new product adjacencies (leveraging RMS's team of data scientists, modelers and software engineers) as well as combining RMS's products with Moody’s core data and analytics offerings to provide holistic integrated risk solutions.
Goodwill, of which $1,286 million and $90 million has been assigned to the MA and MIS segments, respectively, is not deductible for tax purposes. The amount of goodwill allocated to the MIS segment relates to the integration of certain of RMS's models/processes into the Company's ESG solutions offerings.
Other assets in the table above includes an indemnification asset of $95 million related to uncertain tax positions assumed in the transaction, for which the Company expects to be indemnified by the sellers in the event of an unfavorable outcome.
Transaction costs
Transaction costs directly related to the RMS acquisition were $22 million and were recorded in SG&A expenses in the statement of operations.
Supplementary Unaudited Pro Forma Information
Supplemental information on an unaudited pro forma basis is presented below for the twelve months ended December 31, 2021 and 2020 as if the acquisition of RMS occurred on January 1, 2020. The pro forma financial information is presented for comparative purposes only, based on certain estimates and assumptions, which the Company believes to be reasonable but not necessarily indicative of future results of operations or the results that would have been reported if the acquisition had been completed at January 1, 2020. The unaudited pro forma information includes amortization of acquired intangible assets, based on the preliminary purchase price allocation and an estimate of useful lives reflected above, and incremental financing costs resulting from the acquisition, net of income tax, which was estimated using the weighted average statutory tax rates in effect in the jurisdiction for which the pro forma adjustment relates.
| | | | | | | | | | | |
| Year Ended December 31, |
| Unaudited | 2021 | | 2020 |
| Pro forma Revenue | $ | 6,463 | | | $ | 5,667 | |
| Pro forma Net Income attributable to Moody's | $ | 2,244 | | | $ | 1,666 | |
The unaudited pro forma results do not include any anticipated cost savings or other effects of the planned integration of RMS. Accordingly, the pro forma results above are not necessarily indicative of the results that would have been reported if the acquisition had occurred on the dates indicated, nor are the pro forma results indicative of results which may occur in the future. The RMS results included in the above have been converted to U.S. GAAP from IFRS as issued by the IASB and have been translated to USD at rates in effect for the periods presented. The RMS amounts in the pro forma results include an addition to revenue of approximately $18 million and a reduction to revenue of approximately $22 million relating to a fair value adjustment to deferred revenue required as part of acquisition accounting for the years ended December 31, 2021 and 2020, respectively.
Cortera
On March 19, 2021, the Company acquired 100% of Cortera, a provider of North American credit data and workflow solutions.
The table below details the total consideration relating to the acquisition:
| | | | | | | | |
| Cash paid at closing | | $ | 138 | |
Additional consideration paid to sellers in 2021 (1) | | 1 | |
| Total consideration | | $ | 139 | |
(1) Represents additional consideration paid to the sellers following finalization of customary post-closing completion adjustments.
Shown below is the preliminary purchase price allocation, which summarizes the fair value of the assets and liabilities assumed, at the date of acquisition:
| | | | | | | | | | | |
| Current assets | | | $ | 7 | |
| Intangible assets: | | | |
| Database (10 year useful life) | $ | 38 | | | |
| Customer relationships (18 year useful life) | 9 | | | |
| Product technology (8 year useful life) | 9 | | | |
| Trade name (5 year useful life) | 1 | | | |
| Total intangible assets (11 year weighted average useful life) | | | 57 | |
Goodwill(1) | | | 79 | |
Deferred tax assets(1) | | | 16 | |
| Other assets | | | 2 | |
| Liabilities: | | | |
| Accounts payable and accrued liabilities | $ | (1) | | | |
| Deferred revenue | (4) | | | |
| Deferred tax liabilities | (15) | | | |
| Other liabilities | (2) | | | |
| Total liabilities | | | (22) | |
| Net assets acquired | | | $ | 139 | |
(1) During the third quarter of 2021, the Company received further information, that existed as of the acquisition date, with respect to Cortera’s deferred taxes. Accordingly, the Company recorded a measurement period adjustment of $16 million to its preliminary estimate for deferred tax assets.
Current assets in the table above include acquired cash of $4 million and accounts receivable of approximately $2 million.
Goodwill
The goodwill recognized as a result of this acquisition includes, among other things, the value of combining the complementary risk assessment products of the Company and Cortera, which is expected to extend the Company’s reach to new and evolving market segments as well as cost savings synergies, expected new customer acquisitions and products.
Goodwill, which has been assigned to the MA segment, is not deductible for tax purposes.
Transaction costs
Transaction costs directly related to the Cortera acquisition were not material.
RDC
On February 13, 2020, the Company acquired 100% of RDC, a provider of anti-money laundering and know-your-customer data and due diligence services.
The table below details the total consideration relating to the acquisition:
| | | | | | | | |
| Cash paid at closing | | $ | 700 | |
Additional consideration paid to sellers in 2020 (1) | | 2 | |
| Total consideration | | $ | 702 | |
(1) Represents additional consideration paid to the sellers following finalization of customary post-closing completion adjustments.
Shown below is the purchase price allocation, which summarizes the fair value of the assets and liabilities assumed, at the date of acquisition:
| | | | | | | | | | | |
| (Amounts in millions) | | | |
| Current assets | | | $ | 24 | |
| Intangible assets: | | | |
| Customer relationships (25 year useful life) | $ | 174 | | | |
| Database (10 year useful life) | 86 | | | |
| Product technology (4 year useful life) | 17 | | | |
| Trade name (3 year useful life) | 3 | | | |
| Total intangible assets (19 year weighted average life) | | | 280 | |
| Goodwill | | | 494 | |
| Other assets | | | 2 | |
| Liabilities: | | | |
| Accounts payable and accrued liabilities | $ | (5) | | | |
| Deferred revenue | (20) | | | |
| Deferred tax liabilities | (71) | | | |
| Other liabilities | (2) | | | |
| Total liabilities | | | (98) | |
| Net assets acquired | | | $ | 702 | |
Current assets in the table above include acquired cash of $6 million. Additionally, current assets include accounts receivable of approximately $14 million.
Goodwill
The goodwill recognized as a result of this acquisition includes, among other things, the value of combining the complementary product portfolios of the Company and RDC, which is expected to extend the Company’s reach to new and evolving market segments as well as cost savings synergies, expected new customer acquisitions and products.
Goodwill, which has been assigned to the MA segment, is not deductible for tax purposes.
Transaction costs
Transaction costs directly related to the RDC acquisition were not material.
Other Acquisitions
During the fourth quarter of 2020, the Company acquired three additional businesses within the MA reportable segment, which were not individually material, but are material in aggregate, to Moody's consolidated financial statements:
–In December 2020, the Company acquired 100% of Catylist, Inc., a provider of commercial real estate solutions for brokers. Catylist revenue is reported in the RD&A LOB.
–In December 2020, the Company acquired 100% of ZM Financial Systems, a provider of financial management software for the U.S. banking sector. ZMFS revenue is reported in the ERS LOB.
–In October 2020, the Company acquired 100% of Acquire Media, an aggregator and distributor of curated real-time news, multimedia, data, and alerts. AM revenue is reported in the RD&A LOB.
The aggregate consideration transferred for the aforementioned acquisitions of $205 million was funded by cash on hand.
The following table summarizes the aggregate fair value of the assets acquired and liabilities assumed as of the respective closing dates for each acquisition.
| | | | | | | | |
| (Amounts in millions) | | |
| Current assets | | $ | 5 | |
| Intangible assets: | | |
| Customer relationships (18 year useful life) | $ | 47 | | |
| Product technology (8 year useful life) | 23 | | |
| Database (10 year useful life) | 8 | | |
| Trade name (14 year useful life) | 4 | | |
| Total intangible assets (14 year weighted average life) | | 82 | |
| Goodwill | | 131 | |
| Other assets | | 3 | |
| | |
| Liabilities: | | |
| Current liabilities | $ | (8) | | |
| Long-term liabilities | (8) | | |
| Total liabilities | | (16) | |
| Net assets acquired | | $ | 205 | |
Divestiture
On November 8, 2019, the Company completed the sale of MAKS to Equistone Partners Europe Limited (Equistone), a European private equity firm for $227 million in net cash proceeds.
This divestiture resulted in a loss of $23 million ($9 million in 2020 and $14 million in 2019), which included $32 million of currency translation losses reclassified from AOCL to the statements of operations. Additionally, in connection with this divestiture, the Company has recorded certain indemnification provisions. These provisions totaled $33 million as of both December 31, 2021 and December 31, 2020. These amounts are included in other liabilities at December 31, 2021 and 2020 in the consolidated balance sheets of the Company.
NOTE 10 GOODWILL AND OTHER ACQUIRED INTANGIBLE ASSETS
The following table summarizes the activity in goodwill: | | | | | | | | | | | | | | | | | | | | | | | | | | | | | | | | | | | | | | | | | | | | | | | | | | | | | |
| Year Ended December 31, 2021 |
| MIS | | MA | | Consolidated |
| Gross
goodwill | | Accumulated
impairment
charge | | Net
goodwill | | Gross
goodwill | | Accumulated
impairment
charge | | Net
goodwill | | Gross
goodwill | | Accumulated
impairment
charge | | Net
goodwill |
| Balance at beginning of year | $ | 311 | | | $ | — | | | $ | 311 | | | $ | 4,257 | | | $ | (12) | | | $ | 4,245 | | | $ | 4,568 | | | $ | (12) | | | $ | 4,556 | |
Additions/ adjustments (1) | 90 | | | — | | | 90 | | | 1,525 | | | — | | | 1,525 | | | 1,615 | | | — | | | 1,615 | |
| Foreign currency translation adjustments | (5) | | | — | | | (5) | | | (167) | | | — | | | (167) | | | (172) | | | — | | | (172) | |
| | | | | | | | | | | | | | | | | |
| Ending Balance | $ | 396 | | | $ | — | | | $ | 396 | | | $ | 5,615 | | | $ | (12) | | | $ | 5,603 | | | $ | 6,011 | | | $ | (12) | | | $ | 5,999 | |
| | | | | | | | | | | | | | | | | | | | | | | | | | | | | | | | | | | | | | | | | | | | | | | | | | | | | |
| Year Ended December 31, 2020 |
| MIS | | MA | | Consolidated |
| Gross
goodwill | | Accumulated
impairment
charge | | Net
goodwill | | Gross
goodwill | | Accumulated
impairment
charge | | Net
goodwill | | Gross
goodwill | | Accumulated
impairment
charge | | Net
goodwill |
| Balance at beginning of year | $ | 315 | | | $ | — | | | $ | 315 | | | $ | 3,419 | | | $ | (12) | | | $ | 3,407 | | | $ | 3,734 | | | $ | (12) | | | $ | 3,722 | |
Additions/ adjustments (2) | (2) | | | — | | | (2) | | | 628 | | | — | | | 628 | | | 626 | | | — | | | 626 | |
| Foreign currency translation adjustments | (2) | | | — | | | (2) | | | 210 | | | — | | | 210 | | | 208 | | | — | | | 208 | |
| | | | | | | | | | | | | | | | | |
| Ending balance | $ | 311 | | | $ | — | | | $ | 311 | | | $ | 4,257 | | | $ | (12) | | | $ | 4,245 | | | $ | 4,568 | | | $ | (12) | | | $ | 4,556 | |
(1) The 2021 additions/adjustments for the MA segment in the table above relate to the acquisitions of Cortera, RMS, RealXData, Bogard, and PassFort. The 2021 additions/adjustments for the MIS segment relate to certain revenue synergies from the RMS acquisition that are expected to benefit the ESG solutions group within the MIS Other LOB.
(2) The 2020 additions/adjustments for the MA segment in the table above relate to the acquisitions of RDC, AM, ZMFS, and Catylist.
Acquired intangible assets and related accumulated amortization consisted of: | | | | | | | | | | | |
| December 31, |
| 2021 | | 2020 |
| Customer relationships | $ | 2,101 | | | $ | 1,623 | |
| Accumulated amortization | (381) | | | (313) | |
| Net customer relationships | 1,720 | | | 1,310 | |
| Software/product technology | 663 | | | 441 | |
| Accumulated amortization | (219) | | | (177) | |
| Net software/product technology | 444 | | | 264 | |
| Database | 179 | | | 144 | |
| Accumulated amortization | (46) | | | (29) | |
| Net database | 133 | | | 115 | |
| Trade names | 207 | | | 161 | |
| Accumulated amortization | (47) | | | (38) | |
| Net trade names | 160 | | | 123 | |
Other (1) | 54 | | | 55 | |
| Accumulated amortization | (44) | | | (43) | |
| Net other | 10 | | | 12 | |
| Total | $ | 2,467 | | | $ | 1,824 | |
(1)Other intangible assets primarily consist of trade secrets, covenants not to compete, and acquired ratings methodologies and models.
Amortization expense relating to acquired intangible assets is as follows: | | | | | | | | | | | | | | | | | |
| Year Ended December 31, |
| 2021 | | 2020 | | 2019 |
| Amortization expense | $ | 158 | | | $ | 124 | | | $ | 103 | |
Estimated future annual amortization expense for intangible assets subject to amortization is as follows: | | | | | | | | |
| Year Ending December 31, | | |
| 2022 | | $ | 191 | |
| 2023 | | 189 | |
| 2024 | | 185 | |
| 2025 | | 180 | |
| 2026 | | 177 | |
| Thereafter | | 1,545 | |
| Total estimated future amortization | | $ | 2,467 | |
Matters concerning the ICRA reporting unit
ICRA has reported various matters relating to: (i) an adjudication order and fine imposed (and subsequently enhanced) by the Securities and Exchange Board of India (SEBI) in connection with credit ratings assigned to one of ICRA’s customers and the customer’s subsidiaries, which are being appealed by ICRA; (ii) the completion of internal examinations regarding various anonymous complaints, and actions taken by ICRA’s board based on the examinations’ findings; and (iii) a separate internal examination of certain allegations against two former senior ICRA officials. An unfavorable resolution of the aforementioned matters may negatively impact ICRA’s future operating results, which could result in an impairment of goodwill and amortizable intangible assets in future quarters.
NOTE 11 RESTRUCTURING
On December 22, 2020, the chief executive officer of Moody’s approved a restructuring program (the “2020 MA Strategic Reorganization Restructuring Program”) that the Company estimates will result in annualized savings of $20 million per year. This program relates to a strategic reorganization in the MA reportable segment consisting of severance and related costs primarily determined under the Company’s existing severance plans. The 2020 MA Strategic Reorganization Restructuring Program resulted in a total of $20 million in pre-tax charges and was substantially completed in the first half of 2021. Cash outlays associated with this program are expected to be $20 million, which will be paid through 2022.
On July 29, 2020, the chief executive officer of Moody’s approved a restructuring program (the “2020 Real Estate Rationalization Restructuring Program”) primarily in response to the COVID-19 pandemic which revolved around the rationalization and exit of certain real estate leases. The exit from certain leased office space began in the third quarter of 2020 and was substantially completed at December 31, 2020. The 2020 Real Estate Rationalization Restructuring Program primarily reflected non-cash charges related to the impairment of operating lease right-of-use assets and leasehold improvements. The 2020 Restructuring Program is expected to result in an estimated annualized savings of approximately $5 to $6 million a year.
On October 26, 2018, the chief executive officer of Moody’s approved a restructuring program (the “2018 Restructuring Program”) that the Company estimates will result in annualized savings of approximately $60 million per year. The 2018 Restructuring Program, the scope of which was expanded in the second quarter of 2019, was substantially completed at December 31, 2020. The 2018 Restructuring Program included relocation of certain functions from high-cost to lower-cost jurisdictions, a reduction of staff, including from acquisitions and pursuant to a review of the business criticality of certain positions, and the rationalization and exit of certain real estate due to consolidation of various business activities. The exit from certain leased office space began in the fourth quarter of 2018 and resulted in approximately $50 million of the charges to either terminate or sublease the affected real estate leases. The 2018 Restructuring Program also included $55 million of personnel-related restructuring charges, an amount that includes severance and related costs primarily determined under the Company’s existing severance plans. Cash outlays associated with the employee termination cost component of the 2018 Restructuring Program were $55 million.
Total expenses included in the accompanying consolidated statements of operations relating to the Company's restructuring programs are as follows: | | | | | | | | | | | | | | | | | |
| | Year Ended December 31, |
| 2021 | | 2020 | | 2019 |
| 2018 Restructuring Program | $ | (2) | | | $ | (4) | | | $ | 60 | |
| 2020 Real Estate Rationalization Restructuring Program | — | | | 36 | | | — | |
| 2020 MA Strategic Reorganization Restructuring Program | 2 | | | 18 | | | — | |
| Total Restructuring | $ | — | | | $ | 50 | | | $ | 60 | |
| | | | | | | | | | | | | |
| | | | | |
| | | | | |
| | | | | |
| | | | | |
| | | | | |
| | | | | |
| | | | | |
| | | | | |
| | | | | |
| | | | | |
| | | | | |
| | | | | |
| | | | | |
| | | | | |
| | | | | |
| | | | | |
| | | | | |
| | | | | |
| | | | | |
| | | | | |
| Cumulative expense incurred through December 31, 2021 | Employee Termination Costs | | Contract Termination Costs | | |
| 2018 Restructuring Program | $ | 55 | | | $ | 48 | | | |
| 2020 Real Estate Rationalization Restructuring Program: | $ | — | | | $ | 36 | | | |
| 2020 MA Strategic Reorganization Restructuring Program: | $ | 20 | | | $ | — | | | |
The restructuring liability for the aforementioned plans was not material at December 31, 2021, December 31, 2020, and December 31, 2019.
NOTE 12 FAIR VALUE
The table below presents information about items which are carried at fair value on a recurring basis at December 31, 2021 and 2020: | | | | | | | | | | | | | | | | | | | | | | | |
| | | Fair value Measurement as of December 31, 2021 |
| Description | | Balance | | Level 1 | | Level 2 |
| Assets: | | | | | | |
| Derivatives (1) | | $ | 67 | | | $ | — | | | $ | 67 | |
| | | | | | | |
| Mutual funds | | 73 | | | 73 | | | — | |
| Total | | $ | 140 | | | $ | 73 | | | $ | 67 | |
| Liabilities: | | | | | | |
| Derivatives (1) | | $ | 52 | | | $ | — | | | $ | 52 | |
| Total | | $ | 52 | | | $ | — | | | $ | 52 | |
| | | | | | | | | | | | | | | | | | | | | | | |
| | | Fair Value Measurement as of December 31, 2020 |
| Description | | Balance | | Level 1 | | Level 2 |
| Assets: | | | | | | |
| Derivatives (1) | | $ | 88 | | | $ | — | | | $ | 88 | |
| | | | | | | |
| Mutual funds | | 60 | | | 60 | | | — | |
| Total | | $ | 148 | | | $ | 60 | | | $ | 88 | |
| Liabilities: | | | | | | |
| Derivatives (1) | | $ | 186 | | | $ | — | | | $ | 186 | |
| Total | | $ | 186 | | | $ | — | | | $ | 186 | |
(1)Represents FX forwards on certain assets and liabilities as well as interest rate swaps and cross-currency swaps as more fully described in Note 7 to the consolidated financial statements.
The following are descriptions of the methodologies utilized by the Company to estimate the fair value of its derivative contracts and mutual funds:
Derivatives:
In determining the fair value of the derivative contracts in the table above, the Company utilizes industry standard valuation models. Where applicable, these models project future cash flows and discount the future amounts to a present value using spot rates, forward points, currency volatilities, interest rates as well as the risk of non-performance of the Company and the counterparties with whom it has derivative contracts. The Company established strict counterparty credit guidelines and only enters into transactions with financial institutions that adhere to these guidelines. Accordingly, the risk of counterparty default is deemed to be minimal.
Mutual funds:
The mutual funds in the table above are deemed to be equity securities with readily determinable fair values with changes in the fair value recognized through net income under ASC Topic 321. The fair value of these instruments is determined using Level 1 inputs as defined in the ASC Topic 820.
NOTE 13. OTHER BALANCE SHEET INFORMATION
The following tables contain additional detail related to certain balance sheet captions: | | | | | | | | | | | |
| December 31, |
| 2021 | | 2020 |
| Other current assets: | | | |
| Prepaid taxes | $ | 112 | | | $ | 94 | |
| Prepaid expenses | 99 | | | 91 | |
| Capitalized costs to obtain and fulfill sales contracts | 103 | | | 93 | |
| Foreign exchange forwards on certain assets and liabilities | 1 | | | 31 | |
| Other | 74 | | | 74 | |
| Total other current assets | $ | 389 | | | $ | 383 | |
| | | | | | | | | | | |
| December 31, |
| 2021 | | 2020 |
| Other assets: | | | |
| Investments in non-consolidated affiliates | $ | 443 | | | $ | 135 | |
| Deposits for real-estate leases | 14 | | | 19 | |
| Indemnification assets related to acquisitions | 106 | | | 15 | |
| Mutual funds and fixed deposits | 89 | | | 66 | |
| Company owned life insurance (at contract value) | 37 | | | 17 | |
| Costs to obtain sales contracts | 138 | | | 134 | |
| Derivative instruments designated as accounting hedges | 66 | | | 57 | |
| Pension and other retirement employee benefits | 77 | | | 21 | |
| Other | 64 | | | 51 | |
| Total other assets | $ | 1,034 | | | $ | 515 | |
| | | | | | | | | | | |
| December 31, |
| 2021 | | 2020 |
| Accounts payable and accrued liabilities: | | | |
| Salaries and benefits | $ | 211 | | | $ | 197 | |
| Incentive compensation | 324 | | | 226 | |
| Customer credits, advanced payments and advanced billings | 100 | | | 42 | |
| Dividends | 6 | | | 11 | |
| Professional service fees | 75 | | | 53 | |
| Interest accrued on debt | 85 | | | 82 | |
| Accounts payable | 47 | | | 39 | |
| Income taxes | 115 | | | 128 | |
| Pension and other retirement employee benefits | 7 | | | 45 | |
| Accrued royalties | 36 | | | 19 | |
| Foreign exchange forwards on certain assets and liabilities | 12 | | | 2 | |
| Restructuring liability | 4 | | | 18 | |
| Derivative instruments designated as accounting hedges | — | | | 39 | |
| Other | 120 | | | 138 | |
| Total accounts payable and accrued liabilities | $ | 1,142 | | | $ | 1,039 | |
| | | | | | | | | | | |
| December 31, |
| 2021 | | 2020 |
| Other liabilities: | | | |
| Pension and other retirement employee benefits | $ | 235 | | | $ | 244 | |
| | | |
| Interest accrued on UTPs | 59 | | | 113 | |
| MAKS indemnification provisions | 33 | | | 33 | |
| Income tax liability – non-current portion | 23 | | | 18 | |
| Derivative instruments designated as accounting hedges | 40 | | | 145 | |
| | | |
| Other | 48 | | | 37 | |
| Total other liabilities | $ | 438 | | | $ | 590 | |
The following table provides additional detail regarding Moody's investments in non-consolidated affiliates, as included within other assets in the consolidated balance sheets:
| | | | | | | | | | | |
| December 31, |
| 2021 | | 2020 |
| Investments in non-consolidated affiliates: | | | |
Equity method investments (1) | $ | 121 | | | $ | 118 | |
Investments measured using the measurement alternative (2) | 318 | | | 16 | |
| Other | 4 | | | 1 | |
| Total investments in non-consolidated affiliates | $ | 443 | | | $ | 135 | |
(1)Equity securities in which the Company has significant influence over the investee but does not have a controlling financial interest in accordance with ASC Topic 323
(2)Equity securities without readily determinable fair value for which the Company has elected to apply the measurement alternative in accordance with ASC Topic 321, which is more fully discussed in Note 2.
Moody's holds various investments accounted for under the equity method, the most significant of which is the Company's minority investment in CCXI. Moody's also holds various investments measured using the measurement alternative, the most significant of which is the Company's minority interest in BitSight.
Refer to Note 24 for disclosure on earnings from non-consolidated affiliates, which is included within other non-operating income, net.
NOTE 14 COMPREHENSIVE INCOME AND ACCUMULATED OTHER COMPREHENSIVE INCOME
The following table provides details about the reclassifications out of AOCL: | | | | | | | | | | | | | | | | | | | | | | | |
| Year Ended December 31, | | Location in the consolidated
statements of operations |
| 2021 | | 2020 | | 2019 | |
| Currency translation adjustment losses | | | | | | | |
| Sale of foreign subsidiaries | $ | — | | | $ | — | | | $ | (32) | | | Loss pursuant to the divestiture of MAKS |
| Total currency translation adjustment losses | — | | | — | | | (32) | | | |
| Losses on cash flow hedges | | | | | | | |
| | | | | | | |
| Interest rate contract | (2) | | | (3) | | | — | | | Other non-operating income, net |
| | | | | | | |
| Income tax effect of item above | — | | | 1 | | | — | | | Provision for income taxes |
| Total net losses on cash flow hedges | (2) | | | (2) | | | — | | | |
| Gains on net investment hedges | | | | | | | |
| Cross currency swaps | — | | | 1 | | | — | | | Other non-operating income, net |
| FX forwards | 2 | | | — | | | 3 | | | Other non-operating income, net |
| Total before income taxes | 2 | | | 1 | | | 3 | | | |
| Income tax effect of item above | (1) | | | — | | | (1) | | | Provision for income taxes |
| Total net gains on net investment hedges | 1 | | | 1 | | | 2 | | | |
| | | | | | | |
| | | | | | | |
| | | | | | | |
| | | | | | | |
| Pension and other retirement benefits | | | | | | | |
| Amortization of actuarial losses and prior service costs included in net income | (11) | | | (6) | | | (3) | | | Other non-operating income, net |
| Accelerated recognition of loss due to settlement | (8) | | | (2) | | | — | | | Other non-operating income, net |
| Total before income taxes | (19) | | | (8) | | | (3) | | | |
| Income tax effect of item above | 5 | | | 2 | | | 1 | | | Provision for income taxes |
| Total pension and other retirement benefits | (14) | | | (6) | | | (2) | | | |
| Total net losses included in Net Income attributable to reclassifications out of AOCL | $ | (15) | | | $ | (7) | | | $ | (32) | | | |
The following table shows changes in AOCL by component (net of tax): | | | | | | | | | | | | | | | | | | | | | | | | | | | | | | | | |
| Year Ended December 31, 2021 |
| Pension and Other Retirement Benefits | | Gains / (Losses) on Cash Flow Hedges | | | Foreign Currency Translation Adjustments | | Net Investment Hedges | | | | Total |
| Balance December 31, 2020 | $ | (118) | | | $ | (49) | | | | $ | (45) | | | $ | (220) | | | | | $ | (432) | |
| Other comprehensive income/(loss) before reclassifications | 55 | | | — | | | | (290) | | | 242 | | | | | 7 | |
| Amounts reclassified from AOCL | 14 | | | 2 | | | | — | | | (1) | | | | | 15 | |
| Other comprehensive income/(loss) | 69 | | | 2 | | | | (290) | | | 241 | | | | | 22 | |
| Balance December 31, 2021 | $ | (49) | | | $ | (47) | | | | $ | (335) | | | $ | 21 | | | | | $ | (410) | |
| | | | | | | | | | | | | | | | | | | | | | | | | | | | | | | |
| Year Ended December 31, 2020 |
| Pension and Other Retirement Benefits | | Gains / (Losses) on Cash Flow Hedges | | Foreign Currency Translation Adjustments | | Net Investment Hedges | | | | Total |
| Balance December 31, 2019 | $ | (92) | | | $ | — | | | $ | (401) | | | $ | 54 | | | | | $ | (439) | |
| Other comprehensive income/(loss) before reclassifications | (32) | | | (51) | | | 356 | | | (273) | | | | | — | |
| Amounts reclassified from AOCL | 6 | | | 2 | | | — | | | (1) | | | | | 7 | |
| Other comprehensive income/(loss) | (26) | | | (49) | | | 356 | | | (274) | | | | | 7 | |
| Balance December 31, 2020 | $ | (118) | | | $ | (49) | | | $ | (45) | | | $ | (220) | | | | | $ | (432) | |
| | | | | | | | | | | | | | | | | | | | | | | | | | | | | | | |
| Year Ended December 31, 2019 |
| Pension and Other Retirement Benefits | | Gains / (Losses) on Cash Flow Hedges | | Foreign Currency Translation Adjustments | | Net Investment Hedges | | | | Total |
| Balance December 31, 2018 | $ | (53) | | | $ | — | | | $ | (406) | | | $ | 33 | | | | | $ | (426) | |
| Adoption of ASU 2018-02 | (17) | | | — | | | — | | | (3) | | | | | (20) | |
| Other comprehensive income/(loss) before reclassifications | (24) | | | — | | | (27) | | | 26 | | | | | (25) | |
| Amounts reclassified from AOCL | 2 | | | — | | | 32 | | | (2) | | | | | 32 | |
| Other comprehensive income/(loss) | (39) | | | — | | | 5 | | | 21 | | | | | (13) | |
| Balance December 31, 2019 | $ | (92) | | | $ | — | | | $ | (401) | | | $ | 54 | | | | | $ | (439) | |
NOTE 15 PENSION AND OTHER RETIREMENT BENEFITS
U.S. Plans
Moody’s maintains funded and unfunded noncontributory Defined Benefit Pension Plans ("DBPPs"). The DBPPs provide defined benefits using a cash balance formula based on years of service and career average salary or final average pay for selected executives. The Company also provides certain healthcare and life insurance benefits for retired U.S. employees. The retirement healthcare plans are contributory; the life insurance plans are noncontributory. Moody’s funded and unfunded U.S. pension plans, the U.S. retirement healthcare plans and the U.S. retirement life insurance plans are collectively referred to herein as the “Retirement Plans”. The U.S. retirement healthcare plans and the U.S. retirement life insurance plans are collectively referred to herein as the “Other Retirement Plans”.
Through 2007, substantially all U.S. employees were eligible to participate in the Company’s DBPPs. Effective January 1, 2008, the Company no longer offers DBPPs to U.S. employees hired or rehired on or after January 1, 2008 and new hires in the U.S. instead will receive a retirement contribution in similar benefit value under the Company’s Profit Participation Plan. Current participants of the Company’s Retirement Plans and Other Retirement Plans continue to accrue benefits based on existing plan benefit formulas.
Following is a summary of changes in benefit obligations and fair value of plan assets for the Retirement Plans for the years ended December 31: | | | | | | | | | | | | | | | | | | | | | | | |
| Pension Plans | | Other Retirement Plans |
| 2021 | | 2020 | | 2021 | | 2020 |
| Change in benefit obligation: | | | | | | | |
| Benefit obligation, beginning of the period | $ | (663) | | | $ | (589) | | | $ | (48) | | | $ | (42) | |
| Service cost | (19) | | | (17) | | | (4) | | | (3) | |
| Interest cost | (14) | | | (17) | | | (1) | | | (1) | |
| Plan participants’ contributions | — | | | — | | | (1) | | | (1) | |
| Benefits paid | 68 | | | 22 | | | 2 | | | 2 | |
| Actuarial (loss) gain | (6) | | | 6 | | | (3) | | | 2 | |
| Assumption changes | 64 | | | (68) | | | 7 | | | (5) | |
| Benefit obligation, end of the period | $ | (570) | | | $ | (663) | | | $ | (48) | | | $ | (48) | |
| Change in plan assets: | | | | | | | |
| Fair value of plan assets, beginning of the period | $ | 528 | | | $ | 395 | | | $ | — | | | $ | — | |
| Actual return on plan assets | 34 | | | 45 | | | — | | | — | |
| Benefits paid | (68) | | | (22) | | | (2) | | | (2) | |
| Employer contributions | 50 | | | 110 | | | 1 | | | 1 | |
| Plan participants’ contributions | — | | | — | | | 1 | | | 1 | |
| Fair value of plan assets, end of the period | $ | 544 | | | $ | 528 | | | $ | — | | | $ | — | |
| Funded Status of the plans | $ | (26) | | | $ | (135) | | | $ | (48) | | | $ | (48) | |
| Amounts recorded on the consolidated balance sheets: | | | | | | | |
| Pension and retirement benefits asset – non current | $ | 74 | | | $ | 21 | | | $ | — | | | $ | — | |
| Pension and retirement benefits liability – current | (5) | | | (44) | | | (1) | | | (1) | |
| Pension and retirement benefits liability – non current | (95) | | | (112) | | | (47) | | | (47) | |
| Net amount recognized | $ | (26) | | | $ | (135) | | | $ | (48) | | | $ | (48) | |
| Accumulated benefit obligation, end of the period | $ | (524) | | | $ | (601) | | | | | |
The net decrease in the pension benefit obligation from assumption changes and actuarial losses in 2021 primarily resulted from increases to the discount rates and changes to certain actuarial assumptions, including increased rates of retirement at younger ages. The net increase in the benefit obligation in 2020 primarily resulted from reductions in discount rates, partially offset by a decrease related to lower cash balance conversion interest rates.
The following information is for those pension plans with an accumulated benefit obligation in excess of plan assets: | | | | | | | | | | | |
| December 31, |
| 2021 | | 2020 |
| Aggregate projected benefit obligation | $ | 101 | | | $ | 156 | |
| Aggregate accumulated benefit obligation | $ | 86 | | | $ | 138 | |
| | | |
The following table summarizes the pre-tax net actuarial losses and prior service costs recognized in AOCL for the Company’s Retirement Plans as of December 31: | | | | | | | | | | | | | | | | | | | | | | | |
| Pension Plans | | Other Retirement Plans |
| 2021 | | 2020 | | 2021 | | 2020 |
| Net actuarial losses | $ | (61) | | | $ | (144) | | | $ | (4) | | | $ | (8) | |
| Net prior service credits | 3 | | | 3 | | | — | | | — | |
| Total recognized in AOCL – pretax | $ | (58) | | | $ | (141) | | | $ | (4) | | | $ | (8) | |
Net periodic benefit expenses recognized for the Retirement Plans for years ended December 31: | | | | | | | | | | | | | | | | | | | | | | | | | | | | | | | | | | | |
| Pension Plans | | Other Retirement Plans |
| 2021 | | 2020 | | 2019 | | 2021 | | 2020 | | 2019 |
| Components of net periodic expense | | | | | | | | | | | |
| Service cost | $ | 19 | | | $ | 17 | | | $ | 17 | | | $ | 4 | | | $ | 3 | | | $ | 3 | |
| Interest cost | 14 | | | 17 | | | 21 | | | 1 | | | 1 | | | 1 | |
| Expected return on plan assets | (27) | | | (20) | | | (20) | | | — | | | — | | | — | |
| Amortization of net actuarial loss and prior service credits from earlier periods | 11 | | | 7 | | | 4 | | | 1 | | | — | | | — | |
| Loss on settlement of pension obligations | 8 | | | 2 | | | — | | | — | | | — | | | — | |
| Net periodic expense | $ | 25 | | | $ | 23 | | | $ | 22 | | | $ | 6 | | | $ | 4 | | | $ | 4 | |
The following table summarizes the pre-tax amounts recorded in OCI related to the Company’s Retirement Plans for the years ended December 31: | | | | | | | | | | | | | | | | | | | | | | | | | | | | | | | | | | | |
| Pension Plans | | Other Retirement Plans |
| 2021 | | 2020 | | 2019 | | 2021 | | 2020 | | 2019 |
| Amortization of net actuarial losses and prior service credit | $ | 11 | | | $ | 7 | | | $ | 4 | | | $ | 1 | | | $ | — | | | $ | — | |
| Settlement loss | 8 | | | 2 | | | — | | | — | | | — | | | — | |
| Net actuarial (loss)/gain arising during the period | 65 | | | (37) | | | (24) | | | 4 | | | (3) | | | (6) | |
| Total recognized in OCI – pre-tax | $ | 84 | | | $ | (28) | | | $ | (20) | | | $ | 5 | | | $ | (3) | | | $ | (6) | |
ADDITIONAL INFORMATION:
Assumptions—Retirement Plans
Weighted-average assumptions used to determine benefit obligations at December 31: | | | | | | | | | | | | | | | | | | | | | | | |
| Pension Plans | | Other Retirement Plans |
| 2021 | | 2020 | | 2021 | | 2020 |
| Discount rate | 2.60 | % | | 2.24 | % | | 2.65 | % | | 2.30 | % |
| Rate of compensation increase | 3.63 | % | | 3.62 | % | | — | | | — | |
Weighted-average assumptions used to determine net periodic benefit expense for years ended December 31: | | | | | | | | | | | | | | | | | | | | | | | | | | | | | | | | | | | |
| Pension Plans | | Other Retirement Plans |
| 2021 | | 2020 | | 2019 | | 2021 | | 2020 | | 2019 |
| Discount rate | 2.24 | % | | 3.04 | % | | 4.07 | % | | 2.30 | % | | 3.05 | % | | 4.10 | % |
| Expected return on plan assets | 5.45 | % | | 4.45 | % | | 5.65 | % | | — | | | — | | | — | |
| Rate of compensation increase | 3.62 | % | | 3.64 | % | | 3.69 | % | | — | | | — | | | — | |
| Cash balance plan interest crediting rate | 4.50 | % | | 4.50 | % | | 4.50 | % | | — | | | — | | | — | |
The expected rate of return on plan assets represents the Company’s best estimate of the long-term return on plan assets and is determined by using a building block approach, which generally weighs the underlying long-term expected rate of return for each major asset class based on their respective allocation target within the plan portfolio, net of plan paid expenses. As the assumption reflects a long-term time horizon, the plan performance in any one particular year does not, by itself, significantly influence the Company’s evaluation. For 2021, the expected rate of return used in calculating the net periodic benefit costs was 5.45%. For 2022, the Company’s expected rate of return assumption is 5.05% to reflect the Company’s current view of long-term capital market outlook. In addition, the Company has updated its mortality assumption by adopting the newly released mortality improvement scale MP-2021 to accompany the Pri2012 mortality tables to reflect the latest information regarding future mortality expectations by the Society of Actuaries.
Plan Assets
Moody’s investment objective for the assets in the funded pension plan is to earn total returns that will minimize future contribution requirements over the long-term within a prudent level of risk. The Company works with its independent investment consultants to determine asset allocation targets for its pension plan investment portfolio based on its assessment of business and financial conditions, demographic and actuarial data, funding characteristics, and related risk factors. Other relevant factors, including historical and forward looking views of inflation and capital market returns, are also considered. Risk management practices include monitoring plan asset performance, diversification across asset classes and investment styles and periodic rebalancing toward asset allocation targets. The Company’s Asset Management Committee is responsible for overseeing the investment activities of the plan, which includes selecting acceptable asset classes, defining allowable ranges of holdings by asset class and by individual investment managers, defining acceptable securities within each asset class, and establishing investment performance expectations. Ongoing monitoring of the plan includes reviews of investment performance and managers on a regular basis, annual liability measurements, and periodic asset/liability studies.
The Company’s investment policy uses risk-controlled investment strategies by increasing the plan’s asset allocation to fixed income securities and specifying ranges of acceptable target allocation by asset class based on different levels of the plan’s accounting funded status. In addition, the investment policy also requires the investment-grade fixed income assets be rebalanced between shorter and longer duration bonds as the interest rate environment changes. This investment policy is designed to help protect the plan’s funded status and to limit volatility of the Company’s contributions. Based on the policy, the Company’s current target asset allocation is approximately 33% (range of 28% to 38%) in equity securities, 62% (range of 57% to 67%) in fixed income securities and 5% (range of 2% to 8%) in other investments and the plan will use a combination of active and passive investment strategies and different investment styles for its investment portfolios within each asset class. The plan’s equity investments are diversified across U.S. and non-U.S. stocks of small, medium and large capitalization. The plan’s fixed income investments are diversified principally across U.S. and non-U.S. government and corporate bonds, which are expected to help reduce plan exposure to interest rate variation and to better align assets with obligations. The plan also invests in other fixed income investments such as debts rated below investment grade, emerging market debt, and convertible securities. The plan’s other investment, which is made through a private real estate debt fund, is expected to provide additional diversification benefits and absolute return enhancement to the plan assets.
Fair value of the assets in the Company’s funded pension plan by asset category at December 31, 2021 and 2020 are as follows: | | | | | | | | | | | | | | | | | | | | | | | | | | | | | |
| Fair Value Measurement as of December 31, 2021 |
| Asset Category | Balance | | Level 1 | | Level 2 | | Measured using NAV practical expedient (1) | | % of total
assets |
| Cash and cash equivalent | $ | 4 | | | $ | — | | | $ | 4 | | | $ | — | | | 1 | % |
| Common/collective trust funds—equity securities | | | | | | | | | |
| U.S. large-cap | 135 | | | — | | | 135 | | | — | | | 25 | % |
| U.S. small and mid-cap | 23 | | | — | | | 23 | | | — | | | 4 | % |
| Emerging markets | 27 | | | — | | | 27 | | | — | | | 5 | % |
| Total equity investments | 185 | | | — | | | 185 | | | — | | | 34 | % |
| Emerging markets bond fund | 30 | | | — | | | — | | | 30 | | | 6 | % |
| Common/collective trust funds—fixed income securities | | | | | | | | | |
| Intermediate-term investment grade U.S. government/ corporate bonds | 245 | | | — | | | 245 | | | — | | | 45 | % |
| Mutual funds | | | | | | | | | |
| U.S. Treasury Inflation-Protected Securities (TIPs) | 24 | | | 24 | | | — | | | — | | | 4 | % |
| Convertible securities | 17 | | | 17 | | | — | | | — | | | 3 | % |
| Private investment fund—high yield securities | 14 | | | — | | | — | | | 14 | | | 3 | % |
| Total fixed-income investments | 330 | | | 41 | | | 245 | | | 44 | | | 61 | % |
| Other investment—private real estate fund | 25 | | | — | | | — | | | 25 | | | 4 | % |
| Total Assets | $ | 544 | | | $ | 41 | | | $ | 434 | | | $ | 69 | | | 100 | % |
| | | | | | | | | | | | | | | | | | | | | | | | | | | | | |
| Fair Value Measurement as of December 31, 2020 |
| Asset Category | Balance | | Level 1 | | Level 2 | | Measured using NAV practical expedient (1) | | % of total
assets |
| Cash and cash equivalent | $ | 4 | | | $ | — | | | $ | 4 | | | $ | — | | | 1 | % |
| Common/collective trust funds—equity securities | | | | | | | | | |
| U.S. large-cap | 143 | | | — | | | 143 | | | — | | | 27 | % |
| U.S. small and mid-cap | 28 | | | — | | | 28 | | | — | | | 5 | % |
| Emerging markets | 32 | | | — | | | 32 | | | — | | | 6 | % |
| Total equity investments | 203 | | | — | | | 203 | | | — | | | 38 | % |
| Emerging markets bond fund | 32 | | | — | | | — | | | 32 | | | 6 | % |
| Common/collective trust funds—fixed income securities | | | | | | | | | |
| Intermediate-term investment grade U.S. government/ corporate bonds | 214 | | | — | | | 214 | | | — | | | 41 | % |
| Mutual funds | | | | | | | | | |
| U.S. Treasury Inflation-Protected Securities (TIPs) | 23 | | | 23 | | | — | | | — | | | 4 | % |
| Convertible securities | 16 | | | 16 | | | — | | | — | | | 3 | % |
| Private investment fund—high yield securities | 12 | | | — | | | — | | | 12 | | | 2 | % |
| Total fixed-income investments | 297 | | | 39 | | | 214 | | | 44 | | | 56 | % |
| Other investment—private real estate debt fund | 24 | | | — | | | — | | | 24 | | | 5 | % |
| Total Assets | $ | 528 | | | $ | 39 | | | $ | 421 | | | $ | 68 | | | 100 | % |
(1)Investments are measured using the net asset value per share (or its equivalent) practical expedient and have not been categorized in the fair value hierarchy. The fair value amounts presented in the table are intended to permit a reconciliation of the fair value hierarchy to the value of the total plan assets.
Cash and cash equivalents are primarily comprised of investments in money market mutual funds. In determining fair value, Level 1 investments are valued based on quoted market prices in active markets. Investments in common/collective trust funds are valued using the NAV per unit in each fund. The NAV is based on the value of the underlying investments owned by each trust, minus its liabilities, and then divided by the number of shares outstanding. Common/collective trust funds are categorized in Level 2 to the extent that they are considered to have a readily determinable fair value. Investments for which fair value is estimated by using the NAV per share (or its equivalent) as a practical expedient are not categorized in the fair value hierarchy.
Except for the Company’s U.S. funded pension plan, all of Moody’s Retirement Plans are unfunded and therefore have no plan assets.
Cash Flows
The Company did not contribute to its U.S. funded pension plan during 2021, but contributed $99 million to this plan during the year ended December 31, 2020. The Company made payments of $50 million and $11 million related to its U.S. unfunded pension plan obligations during the years ended December 31, 2021 and 2020, respectively. The Company currently does not anticipate making a contribution to its funded pension plan in 2022, and does not anticipate making payments related to its unfunded U.S. pension plans and other Retirement Plans during the year ended December 31, 2022 that would be material to the Company's financial statements.
Estimated Future Benefits Payable
Estimated future benefits payments for the Retirement Plans are as follows as of year ended December 31, 2021: | | | | | | | | | | | | | | |
| Year Ending December 31, | | Pension Plans | | Other Retirement Plans |
| 2022 | | $ | 21 | | | $ | 1 | |
| 2023 | | 23 | | | 2 | |
| 2024 | | 32 | | | 2 | |
| 2025 | | 26 | | | 2 | |
| 2026 | | 30 | | | 2 | |
| 2027 - 2031 | | 157 | | | 15 | |
Defined Contribution Plans
Moody’s has a Profit Participation Plan covering substantially all U.S. employees. The Profit Participation Plan provides for an employee salary deferral and the Company matches employee contributions, equal to 50% of employee contribution up to a maximum of 3% of the employee’s pay. Effective January 1, 2008, all new hires are automatically enrolled in the Profit Participation Plan when they meet eligibility requirements unless they decline participation. As the Company’s U.S. DBPPs are closed to new entrants effective January 1, 2008, all eligible new hires will instead receive a retirement contribution into the Profit Participation Plan in value similar to the pension benefits. Additionally, effective January 1, 2008, the Company implemented a deferred compensation plan in the U.S., which is unfunded and provides for employee deferral of compensation and Company matching contributions related to compensation in excess of the IRS limitations on benefits and contributions under qualified retirement plans. Total expenses associated with U.S. defined contribution plans were $54 million, $44 million and $43 million in the years ended December 31, 2021, 2020, and 2019, respectively.
Effective January 1, 2008, Moody’s has designated the Moody’s Stock Fund, an investment option under the Profit Participation Plan, as an Employee Stock Ownership Plan and, as a result, participants in the Moody’s Stock Fund may receive dividends in cash or may reinvest such dividends into the Moody’s Stock Fund. Moody’s paid approximately $1 million during each of the years ended December 31, 2021, 2020 and 2019, respectively, for the Company’s common shares held by the Moody’s Stock Fund. The Company records the dividends as a reduction of retained earnings in the Consolidated Statements of Shareholders’ Equity (Deficit). The Moody’s Stock Fund held approximately 328,500 and 360,600 shares of Moody’s common stock at December 31, 2021 and 2020, respectively.
Non-U.S. Plans
Certain of the Company’s non-U.S. operations provide pension benefits to their employees. The non-U.S. defined benefit pension plans are immaterial. For defined contribution plans, company contributions are primarily determined as a percentage of employees’ eligible compensation. Expenses related to these defined contribution plans for the years ended December 31, 2021, 2020 and 2019 were $32 million, $29 million and $25 million, respectively.
NOTE 16 STOCK-BASED COMPENSATION PLANS
Under the 1998 Plan, 33.0 million shares of the Company’s common stock have been reserved for issuance. The 2001 Plan, which is shareholder approved, permits the granting of up to 50.6 million shares, of which not more than 14.0 million shares are available for grants of awards other than stock options. The Stock Plans also provide for the granting of restricted stock. The Stock Plans provide that options are exercisable not later than ten years from the grant date. The vesting period for awards under the Stock Plans is generally determined by the Board at the date of the grant and has been four years except for employees who are at or near retirement eligibility, as defined, for which vesting is between one and four years. Additionally, the vesting period is three years for certain performance-based restricted stock that contain a condition whereby the number of shares that ultimately vest are based on the achievement of certain non-market based performance metrics of the Company. Options may not be granted at less than the fair market value of the Company’s common stock at the date of grant.
The Company maintains the Directors’ Plan for its Board, which permits the granting of awards in the form of non-qualified stock options, restricted stock or performance shares. The vesting period is determined by the Board at the date of the grant and is generally one year for both options and restricted stock. Under the Directors’ Plan, 1.7 million shares of common stock were reserved for issuance. Any director of the Company who is not an employee of the Company or any of its subsidiaries as of the date that an award is granted is eligible to participate in the Directors’ Plan.
On September 15, 2021, the Company acquired RMS, which is discussed in more detail in Note 9. As part of the acquisition, the Company registered the RMS 2014 Equity Award Plan and the RMS 2015 Equity Incentive Plan (collectively, "RMS Plans") as part of the purchase agreement to acquire RMS. Under the RMS Plans, 1.2 million shares of the Company’s common stock have been reserved for issuance. The RMS Plans provide that options are exercisable not later than ten years from the grant date. The vesting period is generally determined by the Board at the date of the grant and is four years for both options and restricted stock granted during 2021.
As a result of the acquisition, certain RMS employees' unvested equity awards (employee stock options and restricted stock) with an acquisition-date fair value of $33 million were converted into equity awards of the Company based on an exchange ratio as defined in the purchase agreement. The portion of the fair value of the replacement awards related to services provided prior to the acquisition was $5 million and was accounted for as consideration transferred (See Note 9). The remaining portion of the replacement awards of $28 million, which is associated with a future service requirement, will be recognized as compensation expense over the remaining vesting period.
Presented below is a summary of the stock-based compensation expense and associated tax benefit in the accompanying Consolidated Statements of Operations: | | | | | | | | | | | | | | | | | | |
| Year Ended December 31, | |
| 2021 | | 2020 | | 2019 | |
| Stock-based compensation expense | $ | 175 | | | $ | 154 | | | $ | 136 | | |
| Tax benefit | $ | 42 | | | $ | 30 | | | $ | 29 | | |
The fair value of each employee stock option award is estimated on the date of grant using the Black-Scholes option-pricing model that uses the assumptions noted below. The expected dividend yield is derived from the annual dividend rate on the date of grant. The expected stock volatility is based on an assessment of historical weekly stock prices of the Company as well as implied volatility from Moody’s traded options. The risk-free interest rate is based on U.S. government zero coupon bonds with maturities similar to the expected holding period. The expected holding period was determined by examining historical and projected post-vesting exercise behavior activity.
The following weighted average assumptions were used for options granted (excluding the aforementioned RMS replacement awards): | | | | | | | | | | | | | | | | | |
| Year Ended December 31, |
| 2021 | | 2020 | | 2019 |
| Expected dividend yield | 0.89 | % | | 0.80 % | | 1.14 % |
| Expected stock volatility | 28 | % | | 23 | % | | 24 | % |
| Risk-free interest rate | 0.82 | % | | 1.43 % | | 2.56 % |
| Expected holding period -in years | 5.6 | | 5.7 | | 6.2 |
| | | | | |
Due to the RMS replacement option awards being heavily in-the-money at the acquisition date, the Company utilized a binomial valuation approach to determine the fair value of the options, which approximated the intrinsic value of the replaced awards at the acquisition date.
The following represents the fair value of the options at grant date, including RMS replacement option awards:
| | | | | | | | | | | | | | | | | |
| Year Ended December 31, |
| 2021 | | 2020 | | 2019 |
| | | | | |
| | | | | |
| | | | | |
| | | | | |
| Weighted average grant date fair value per share (including RMS replacement option awards) | $ | 121.14 | | | $ | 60.66 | | | $ | 43.29 | |
A summary of option activity as of December 31, 2021 and changes during the year then ended is presented below: | | | | | | | | | | | | | | | | | | | | | | | | | | |
| Options | | Shares | | Weighted Average Exercise Price Per Share | | Weighted Average Remaining Contractual Term | | Aggregate Intrinsic Value |
| Outstanding, December 31, 2020 | | 1.0 | | | $ | 132.80 | | | | | |
| Granted (including RMS replacement awards) | | 0.2 | | | $ | 249.99 | | | | | |
| Exercised | | (0.2) | | | $ | 101.03 | | | | | |
| Outstanding, December 31, 2021 | | 1.0 | | | $ | 166.16 | | | 5.8 years | | $ | 224 | |
| Vested and expected to vest, December 31, 2021 | | 1.0 | | | $ | 165.26 | | | 5.7 years | | $ | 221 | |
| Exercisable, December 31, 2021 | | 0.6 | | | $ | 119.88 | | | 4.4 years | | $ | 159 | |
The aggregate intrinsic value in the table above represents the total pre-tax intrinsic value (the difference between Moody’s closing stock price on the last trading day of the year ended December 31, 2021 and the exercise prices, multiplied by the number of in-the-money options) that would have been received by the option holders had all option holders exercised their options as of December 31, 2021. This amount varies based on the fair value of Moody’s stock. As of December 31, 2021, there was $22 million of total unrecognized compensation expense related to options. The expense is expected to be recognized over a weighted average period of 2.2 years.
The following table summarizes information relating to stock option exercises: | | | | | | | | | | | | | | | | | |
| Year Ended December 31, |
| 2021 | | 2020 | | 2019 |
| Proceeds from stock option exercises | $ | 24 | | | $ | 39 | | | $ | 36 | |
| Aggregate intrinsic value | $ | 55 | | | $ | 132 | | | $ | 114 | |
| Tax benefit realized upon exercise | $ | 13 | | | $ | 32 | | | $ | 27 | |
A summary of nonvested restricted stock activity for the year ended December 31, 2021 is presented below: | | | | | | | | | | | | | | |
| Nonvested Restricted Stock | | Shares | | Weighted Average Grant Date Fair Value Per Share |
| Balance, December 31, 2020 | | 1.5 | | | $ | 201.30 | |
| Granted (including RMS replacement awards) | | 0.7 | | | $ | 296.84 | |
| Vested | | (0.7) | | | $ | 177.96 | |
| Forfeited | | (0.1) | | | $ | 242.12 | |
| Balance, December 31, 2021 | | 1.4 | | | $ | 253.85 | |
As of December 31, 2021, there was $209 million of total unrecognized compensation expense related to nonvested restricted stock. The expense is expected to be recognized over a weighted average period of 2.6 years.
The following table summarizes information relating to the vesting of restricted stock awards: | | | | | | | | | | | | | | | | | |
| Year Ended December 31, |
| 2021 | | 2020 | | 2019 |
| Fair value of shares vested | $ | 194 | | | $ | 202 | | | $ | 156 | |
| Tax benefit realized upon vesting | $ | 46 | | | $ | 46 | | | $ | 36 | |
A summary of performance-based restricted stock activity for the year ended December 31, 2021 is presented below: | | | | | | | | | | | | | | |
| Performance-based restricted stock | | Shares | | Weighted Average Grant Date Fair Value Per Share |
| Balance, December 31, 2020 | | 0.3 | | | $ | 197.19 | |
| Granted | | 0.2 | | | $ | 329.71 | |
| Vested | | (0.1) | | | $ | 162.06 | |
| Balance, December 31, 2021 | | 0.4 | | | $ | 266.89 | |
The following table summarizes information relating to the vesting of the Company’s performance-based restricted stock awards: | | | | | | | | | | | | | | | | | |
| Year Ended December 31, |
| 2021 | | 2020 | | 2019 |
| Fair value of shares vested | $ | 28 | | | $ | 70 | | | $ | 47 | |
| Tax benefit realized upon vesting | $ | 7 | | | $ | 17 | | | $ | 11 | |
As of December 31, 2021, there was $63 million of total unrecognized compensation expense related to this plan. The expense is expected to be recognized over a weighted average period of 2.1 years.
The Company has a policy of issuing treasury stock to satisfy shares issued under stock-based compensation plans.
In addition, the Company also sponsors the ESPP. Under the ESPP, 6 million shares of common stock were reserved for issuance. The ESPP permits eligible employees to purchase common stock of the Company on a monthly basis at a discount to the average of the high and the low trading prices on the New York Stock Exchange on the last trading day of each month. This discount was 5% in 2021, 2020, and 2019 resulting in the ESPP qualifying for non-compensatory status under Topic 718 of the ASC. Accordingly, no compensation expense was recognized for the ESPP in 2021, 2020, and 2019. The employee purchases are funded through after-tax payroll deductions, which plan participants can elect from 1 percent to 10 percent of compensation, subject to the annual federal limit.
NOTE 17 INCOME TAXES
Components of the Company’s income tax provision are as follows: | | | | | | | | | | | | | | | | | |
| Year Ended December 31, |
| 2021 | | 2020 | | 2019 |
| Current: | | | | | |
| Federal | $ | 404 | | | $ | 213 | | | $ | 179 | |
| State and Local | 106 | | | 68 | | | 59 | |
| Non-U.S. | 249 | | | 215 | | | 181 | |
| Total current | 759 | | | 496 | | | 419 | |
| Deferred: | | | | | |
| Federal | (172) | | | 6 | | | (19) | |
| State and Local | (45) | | | — | | | (3) | |
| Non-U.S. | (1) | | | (50) | | | (16) | |
| Total deferred | (218) | | | (44) | | | (38) | |
| Total provision for income taxes | $ | 541 | | | $ | 452 | | | $ | 381 | |
A reconciliation of the U.S. federal statutory tax rate to the Company’s effective tax rate on income before provision for income taxes is as follows: | | | | | | | | | | | | | | | | | |
| Year Ended December 31, |
| 2021 | | 2020 | | 2019 |
| U.S. statutory tax rate | 21.0 | % | | 21.0 | % | | 21.0 | % |
| State and local taxes, net of federal tax benefit | 1.5 | % | | 2.3 | % | | 2.2 | % |
| Benefit of foreign operations | (1.5) | % | | (1.5) | % | | (0.1) | % |
| | | | | |
| | | | | |
| | | | | |
| Other | (1.4) | % | | (1.5) | % | | (2.1) | % |
| Effective tax rate | 19.6 | % | | 20.3 | % | | 21.0 | % |
| Income tax paid | $ | 932 | | | $ | 514 | | | $ | 458 | |
The source of income before provision for income taxes is as follows: | | | | | | | | | | | | | | | | | |
| Year Ended December 31, |
| 2021 | | 2020 | | 2019 |
| U.S. | $ | 1,563 | | | $ | 1,349 | | | $ | 1,039 | |
| Non-U.S. | 1,192 | | | 880 | | | 771 | |
| Income before provision for income taxes | $ | 2,755 | | | $ | 2,229 | | | $ | 1,810 | |
The components of deferred tax assets and liabilities are as follows: | | | | | | | | | | | |
| December 31, |
| 2021 | | 2020 |
| Deferred tax assets: | | | |
| Account receivable allowances | $ | 8 | | | $ | 9 | |
| Accumulated depreciation and amortization | 10 | | | 2 | |
| Stock-based compensation | 50 | | | 42 | |
| Accrued compensation and benefits | 101 | | | 99 | |
| Capitalized costs | 33 | | | 39 | |
| Operating lease liabilities | 134 | | | 122 | |
| Deferred revenue | 252 | | | 30 | |
| Net operating loss | 33 | | | 17 | |
| Restructuring | 1 | | | 3 | |
| Uncertain tax positions | 86 | | | 98 | |
| Self-insured related reserves | 10 | | | 10 | |
| Loss on net investment hedges - OCI | 11 | | | 93 | |
| Other | 16 | | | 10 | |
| Total deferred tax assets | 745 | | | 574 | |
| Deferred tax liabilities: | | | |
| Accumulated depreciation and amortization of intangible assets and capitalized software | (659) | | | (468) | |
| ROU Assets | (102) | | | (90) | |
| Capital Gains | (31) | | | (23) | |
| Self-insured related income | (10) | | | (10) | |
| | | |
| Revenue Accounting Standard - ASC 606 | (7) | | | (10) | |
| Deferred tax on unremitted foreign earnings | (12) | | | (16) | |
| Gain on net investment hedges - OCI | (4) | | | (8) | |
| Other | (6) | | | (4) | |
| Total deferred tax liabilities | (831) | | | (629) | |
| Net deferred tax liabilities | (86) | | | (55) | |
| Valuation allowance | (18) | | | (15) | |
| Total net deferred tax liabilities | $ | (104) | | | $ | (70) | |
On December 22, 2017, the Tax Act was signed into law, which resulted in significant changes to U.S. corporate tax laws. The Tax Act includes a mandatory one-time deemed repatriation tax (“transition tax”) on previously untaxed accumulated earnings of foreign subsidiaries and beginning in 2018 reduces the statutory federal corporate income tax rate from 35% to 21%. Due to the complexities of the Tax Act, the SEC issued guidance requiring that companies provide a reasonable estimate of the impact of the Tax Act to the extent such reasonable estimate has been determined. Accordingly, as of December 31, 2017, the Company recorded a provisional estimate for the transition tax of $247 million. In September, 2018, the Company filed its 2017 federal income tax return and revised its determination of the transition tax to $236 million, a reduction of $11 million from the estimate at December 31, 2017. The revised determination of transition tax may be impacted by a number of additional considerations, including but not limited to the issuance of additional regulations.
As a result of the Tax Act, all previously net undistributed foreign earnings have now been subject to U.S. tax. The Company regularly evaluates which entities it will indefinitely reinvest earnings. The Company has provided deferred taxes for those entities whose earnings are not considered indefinitely reinvested.
The Company’s annual tax expense for the year ended December 31, 2021 includes Excess Tax Benefits from stock compensation of $31 million, benefits from the resolution of certain UTPs of $70 million and other net decreases to tax positions of $25 million.
The Company had valuation allowances of $18 million and $15 million at December 31, 2021 and 2020, respectively, related to foreign net operating losses for which realization is uncertain.
As of December 31, 2021, the Company had $388 million of UTPs of which $353 million represents the amount that, if recognized, would impact the effective tax rate in future periods. The decrease in 2021 resulted primarily from the resolutions of uncertain tax positions. The increase in 2020 was primarily due to the additional reserves established for non-U.S. tax exposures.
A reconciliation of the beginning and ending amount of UTPs is as follows: | | | | | | | | | | | | | | | | | |
| Year Ended December 31, |
| 2021 | | 2020 | | 2019 |
| Balance as of January 1 | $ | 483 | | | $ | 477 | | | $ | 495 | |
| Additions for tax positions related to the current year | 102 | | | 37 | | | 35 | |
| Additions for tax positions of prior years | 18 | | | 17 | | | 22 | |
| Reductions for tax positions of prior years | — | | | (2) | | | (2) | |
| Settlements with taxing authorities | (134) | | | (5) | | | (1) | |
| Lapse of statute of limitations | (81) | | | (41) | | | (44) | |
| Reclassification to indemnification liability related to MAKS divestiture | — | | | — | | | (28) | |
| Balance as of December 31 | $ | 388 | | | $ | 483 | | | $ | 477 | |
The Company classifies interest related to UTPs in interest expense in its consolidated statements of operations. Penalties are recognized in other non-operating expenses. During the year ended December 31, 2021 the Company accrued net interest income of $21 million related to UTPs. During the years ended December 31, 2020 and 2019 the Company incurred net interest expense of $34 million and $28 million, respectively, related to UTPs. As of December 31, 2021, 2020 and 2019 the amount of accrued interest recorded in the Company’s consolidated balance sheets related to UTPs was $59 million, $113 million and $82 million, respectively.
Moody’s Corporation and subsidiaries are subject to U.S. federal income tax as well as income tax in various state, local and foreign jurisdictions. The Company’s U.S. federal income tax returns for 2017 through 2019 are currently under examination and 2020 remains open to examination. The Company’s New York State tax returns for 2017 through 2018 are currently under examination and New York City tax returns for 2014 through 2017 are currently under examination. After the resolution of a tax audit for 2012, certain of the Company’s U.K. subsidiaries’ returns from 2012 to 2020 remain open to examination.
For current ongoing audits related to open tax years, the Company estimates that it is possible that the balance of UTPs could decrease in the next twelve months as a result of the effective settlement of these audits, which might involve the payment of additional taxes, the adjustment of certain deferred taxes and/or the recognition of tax benefits. It is also possible that new issues might be raised by tax authorities which might necessitate increases to the balance of UTPs. As the Company is unable to predict the timing of conclusion of these audits, the Company is unable to estimate the amount of changes to the balance of UTPs at this time.
NOTE 18 INDEBTEDNESS
The Company’s debt is recorded at its carrying amount, which represents the issuance amount plus or minus any issuance premium or discount, except for certain debt as depicted in the table below, which are recorded at the carrying amount adjusted for the fair value of an interest rate swap used to hedge the fair value of the note.
The following table summarizes total indebtedness: | | | | | | | | | | | | | | | | | | | | | | | | | | | | | |
| December 31, 2021 |
| Principal Amount | | Fair Value of Interest Rate Swaps(1) | | Unamortized (Discount) Premium | | Unamortized Debt Issuance Costs | | Carrying Value |
| Notes Payable: | | | | | | | | | |
| | | | | | | | | |
| 4.875% 2013 Senior Notes, due 2024 | $ | 500 | | | $ | — | | | $ | (1) | | | $ | (1) | | | $ | 498 | |
| 5.25% 2014 Senior Notes, due 2044 | 600 | | | (7) | | | 3 | | | (5) | | | 591 | |
| 1.75% 2015 Senior Notes, due 2027 | 568 | | | — | | | — | | | (2) | | | 566 | |
| | | | | | | | | |
| 2.625% 2017 Senior Notes, due 2023 | 500 | | | 5 | | | — | | | (1) | | | 504 | |
| 3.25% 2017 Senior Notes, due 2028 | 500 | | | 8 | | | (3) | | | (2) | | | 503 | |
| | | | | | | | | |
| 4.25% 2018 Senior Notes, due 2029 | 400 | | | — | | | (2) | | | (2) | | | 396 | |
| 4.875% 2018 Senior Notes, due 2048 | 400 | | | (7) | | | (6) | | | (4) | | | 383 | |
| 0.950% 2019 Senior Notes, due 2030 | 853 | | | — | | | (2) | | | (5) | | | 846 | |
| 3.75% 2020 Senior Notes, due 2025 | 700 | | | (9) | | | (1) | | | (4) | | | 686 | |
| 3.25% 2020 Senior Notes, due 2050 | 300 | | | — | | | (4) | | | (3) | | | 293 | |
| 2.55% 2020 Senior Notes, due 2060 | 500 | | | — | | | (4) | | | (5) | | | 491 | |
| 2.00% 2021 Senior Notes, due 2031 | 600 | | | — | | | (8) | | | (5) | | | 587 | |
| 2.75% 2021 Senior Notes, due 2041 | 600 | | | — | | | (13) | | | (6) | | | 581 | |
| 3.10% 2021 Senior Notes, due 2061 | 500 | | | — | | | (7) | | | (5) | | | 488 | |
| Total long-term debt | $ | 7,521 | | | $ | (10) | | | $ | (48) | | | $ | (50) | | | $ | 7,413 | |
| | | | | | | | | | | | | | | | | | | | | | | | | | | | | |
| December 31, 2020 |
| Principal Amount | | Fair Value of Interest Rate Swaps (1) | | Unamortized (Discount) Premium | | Unamortized Debt Issuance Costs | | Carrying Value |
| Notes Payable: | | | | | | | | | |
| | | | | | | | | |
| 4.50% 2012 Senior Notes, due 2022 | $ | 500 | | | $ | 14 | | | $ | (1) | | | $ | (1) | | | $ | 512 | |
| 4.875% 2013 Senior Notes, due 2024 | 500 | | | — | | | (1) | | | (1) | | | 498 | |
| 5.25% 2014 Senior Notes, due 2044 | 600 | | | — | | | 3 | | | (5) | | | 598 | |
| 1.75% 2015 Senior Notes due 2027 | 612 | | | — | | | — | | | (2) | | | 610 | |
| | | | | | | | | |
| 2.625% 2017 Senior Notes, due 2023 | 500 | | | 12 | | | — | | | (2) | | | 510 | |
| 3.25% 2017 Senior Notes, due 2028 | 500 | | | 31 | | | (4) | | | (3) | | | 524 | |
| | | | | | | | | |
| 4.25% 2018 Senior Notes, due 2029 | 400 | | | — | | | (3) | | | (3) | | | 394 | |
| 4.875% 2018 Senior Notes, due 2048 | 400 | | | — | | | (6) | | | (4) | | | 390 | |
| 0.950% 2019 Senior Notes, due 2030 | 918 | | | — | | | (3) | | | (6) | | | 909 | |
| 3.75% 2020 Senior Notes, due 2025 | 700 | | | (1) | | | (1) | | | (5) | | | 693 | |
| 3.25% 2020 Senior Notes, due 2050 | 300 | | | — | | | (4) | | | (3) | | | 293 | |
| 2.55% 2020 Senior Notes, due 2060 | 500 | | | — | | | (4) | | | (5) | | | 491 | |
| Total long-term debt | $ | 6,430 | | | $ | 56 | | | $ | (24) | | | $ | (40) | | | $ | 6,422 | |
| | | | | | | | | |
| | | | | | | | | |
(1)The fair value of interest rate swaps in the table above represents the cumulative amount of fair value hedging adjustments included in the carrying amount of the hedged debt.
Credit Facility
On December 17, 2021, the Company entered into a five-year senior, unsecured revolving credit facility with the capacity to borrow up to $1.25 billion, which expires December 2026. The 2021 Facility replaces the Company’s $1 billion 2018 Credit Facility that was scheduled to mature in November 2023. Further information on the key terms of these credit facilities is below.
The following summarizes information relating to the Company's revolving credit facilities: | | | | | | | | | | | | | | | | | | | | | | | | | | | | | | | | | | | | | | | | | |
| | | | | | | December 31, 2021 | | December 31, 2020 |
| Issue Date | | Capacity | | Maturity | | Drawn | | Undrawn | | Drawn | | Undrawn |
| 2018 Credit Facility | November 14, 2018 | | $ | 1,000 | | | November 13, 2023 (Terminated in 2021) | | $ | — | | | $ | — | | | $ | — | | | $ | 1,000 | |
| 2021 Credit Facility | December 17, 2021 | | $ | 1,250 | | | December 17, 2026 | | $ | — | | | $ | 1,250 | | | $ | — | | | $ | — | |
2018 Credit Facility
Interest on borrowings under the 2018 Credit Facility ranged from 0 BPS to 22.5 BPS per annum for Alternate Base Rate loans (as defined in the 2018 Facility agreement) or payable at rates based on the London InterBank Offered Rate (“LIBOR”) plus a premium that ranged from 80.5 BPS to 122.5 BPS depending on the Company’s index debt ratings, as set forth in the 2018 Facility agreement. The Company also paid quarterly facility fees, regardless of borrowing activity under the facility. The quarterly fees for the 2018 Facility ranged from 7 BPS of the facility amount to 15 BPS, depending on the Company’s index debt ratings. The 2018 Facility contained certain customary covenants including a financial covenant that required the Company to maintain a total debt to EBITDA ratio of (i) not more than 4 to 1 at the end of any fiscal quarter or (ii) not more than 4.5 to 1 as of the end of the first three consecutive quarters immediately following any acquisition with consideration in excess of $500 million, subject to certain conditions as set forth in the 2018 Facility agreement.
2021 Credit Facility
Interest on borrowings under the 2021 Credit Facility is payable at rates that are based on an adjusted term SOFR Rate plus a premium that can range from 80.5 basis points to 122.5 basis points, depending on the Company’s index debt ratings, as set forth in the 2021 Facility Agreement. The Company also has the option to choose other rates, such as those based on adjusted Daily Simple SOFR or an alternate base rate as set forth in the 2021 Facility Agreement. The Company also pays quarterly facility fees, regardless of borrowing activity under the Facility. The quarterly fees for the 2021 Facility can range from 7 basis points of the 2021 Credit Facility amount to 15 basis points, depending on the Company’s index debt ratings. The facility fees for the 2021 Credit Facility are subject to sustainability-based pricing adjustments based on the Company’s annual performance with respect to certain spending with vendors who have committed to and publicly announced the setting of science-based targets to reduce greenhouse gas emissions. The 2021 Facility contains a financial covenant that requires the Company to maintain a total debt to EBITDA Ratio of (i) not more than 4 to 1 at the end of any fiscal quarter or (ii) not more than 4.5 to 1 as of the end of the first three consecutive quarters immediately following any acquisition with consideration in excess of $500 million, subject to certain conditions as set forth in the 2021 Facility.
Commercial Paper
On August 3, 2016, the Company entered into a private placement commercial paper program under which the Company may issue CP notes up to a maximum amount of $1.0 billion. Borrowings under the CP Program are backstopped by the 2021 Facility. Amounts under the CP Program may be re-borrowed. The maturity of the CP Notes will vary, but may not exceed 397 days from the date of issue. The CP Notes are sold at a discount from par, or alternatively, sold at par and bear interest at rates that will vary based upon market conditions. The rates of interest will depend on whether the CP Notes will be a fixed or floating rate. The interest on a floating rate may be based on the following: (a) certificate of deposit rate; (b) commercial paper rate; (c) the federal funds rate; (d) the LIBOR; (e) prime rate; (f) Treasury rate; or (g) such other base rate as may be specified in a supplement to the private placement agreement. The CP Program contains certain events of default including, among other things: non-payment of principal, interest or fees; entrance into any form of moratorium; and bankruptcy and insolvency events, subject in certain instances to cure periods. As of December 31, 2021, the Company has no CP borrowings outstanding.
Notes Payable
The Company may prepay certain of its senior notes, in whole or in part, but may incur a Make-Whole Amount penalty.
During 2021, the Company issued the 2021 Senior Notes due 2031, the 2021 Senior Notes due 2041, and the 2021 Senior Notes due 2061. The key terms of these debt issuances are set forth in the table above.
Additionally, in 2021, the Company fully repaid $500 million of the 2012 Senior Notes due 2022 (along with a Make-Whole Amount of approximately $13 million). The Company also recognized in interest expense, net, an $8 million benefit relating to carrying value adjustments pursuant to the early termination of interest rate swaps designated as fair value hedges that were associated with the 2012 Senior Notes due 2022.
At December 31, 2021, the Company was in compliance with all covenants contained within all of the debt agreements. All of the debt agreements contain cross default provisions which state that default under one of the aforementioned debt instruments could in turn permit lenders under other debt instruments to declare borrowings outstanding under those instruments to be immediately due and payable. As of December 31, 2021, there were no such cross defaults.
The repayment schedule for the Company’s borrowings is as follows: | | | | | | | | | | | | | | | | | | | | | | | | | | | | | | | | | | | | | | | | | | | | | | | | | | | | | | | | | | | | | | | | | | | | | | | | | | | | | | | | | | | | | | | | | | | | |
Year Ending
December 31, | | 2013 Senior Notes due 2024 | | 2014 Senior Notes due 2044 | | 2015 Senior Notes due 2027 | | 2017 Senior Notes due 2023 | | 2017 Senior Notes due 2028 | | 2018 Senior Notes due 2029 | | 2018 Senior Notes due 2048 | | 2019 Senior Notes due 2030 | | 2020 Senior Notes due 2025 | | 2020 Senior Notes due 2050 | | 2020 Senior Notes due 2060 | | 2021 Senior Notes due 2031 | | 2021 Senior Notes due 2041 | | 2021 Senior Notes due 2061 | | Total |
| 2022 | | $ | — | | | $ | — | | | $ | — | | | $ | — | | | $ | — | | | $ | — | | | $ | — | | | $ | — | | | $ | — | | | $ | — | | | $ | — | | | $ | — | | | $ | — | | | $ | — | | | $ | — | |
| 2023 | | — | | | — | | | — | | | 500 | | | — | | | — | | | — | | | — | | | — | | | — | | | — | | | — | | | — | | | — | | | $ | 500 | |
| 2024 | | 500 | | | — | | | — | | | — | | | — | | | — | | | — | | | — | | | — | | | — | | | — | | | — | | | — | | | — | | | $ | 500 | |
| 2025 | | — | | | — | | | — | | | — | | | — | | | — | | | — | | | — | | | 700 | | | — | | | — | | | — | | | — | | | — | | | $ | 700 | |
| 2026 | | — | | | — | | | — | | | — | | | — | | | — | | | — | | | — | | | — | | | — | | | — | | | — | | | — | | | — | | | $ | — | |
| Thereafter | | — | | | 600 | | | 568 | | | — | | | 500 | | | 400 | | | 400 | | | 853 | | | — | | | 300 | | | 500 | | | 600 | | | 600 | | | 500 | | | 5,821 | |
| Total | | $ | 500 | | | $ | 600 | | | $ | 568 | | | $ | 500 | | | $ | 500 | | | $ | 400 | | | $ | 400 | | | $ | 853 | | | $ | 700 | | | $ | 300 | | | $ | 500 | | | $ | 600 | | | $ | 600 | | | $ | 500 | | | $ | 7,521 | |
Interest expense, net
The following table summarizes the components of interest as presented in the consolidated statements of operations: | | | | | | | | | | | | | | | | | |
| Year Ended December 31, |
| 2021 | | 2020 | | 2019 |
| Expense on borrowings | $ | (185) | | | $ | (163) | | | $ | (176) | |
Expense on UTPs and other tax related liabilities(1) | 21 | | | (34) | | | (28) | |
| Net periodic pension costs—interest component | (16) | | | (19) | | | (22) | |
| Income | 9 | | | 11 | | | 17 | |
| Capitalized | — | | | — | | | 1 | |
| Total | $ | (171) | | | $ | (205) | | | $ | (208) | |
Interest paid (2) | $ | 162 | | | $ | 132 | | | $ | 167 | |
(1)The amount for the year ended December 31, 2021 includes a $45 million benefit relating to the reversal of tax-related interest accruals pursuant to the resolution of tax matters.
(2)Interest paid includes net settlements on interest rate swaps more fully discussed in Note 7.
The fair value and carrying value of the Company’s debt as of December 31, 2021 and 2020 are as follows: | | | | | | | | | | | | | | | | | | | | | | | |
| December 31, 2021 | | December 31, 2020 |
| Carrying Amount | | Estimated Fair
Value | | Carrying Amount | | Estimated Fair
Value |
| 4.50% 2012 Senior Notes, due 2022 | $ | — | | | $ | — | | | $ | 512 | | | $ | 530 | |
| 4.875% 2013 Senior Notes, due 2024 | 498 | | | 538 | | | 498 | | | 562 | |
| 5.25% 2014 Senior Notes, due 2044 | 591 | | | 805 | | | 598 | | | 828 | |
| 1.75% 2015 Senior Notes, due 2027 | 566 | | | 607 | | | 610 | | | 674 | |
| | | | | | | |
| 2.625% 2017 Senior Notes, due 2023 | 504 | | | 509 | | | 510 | | | 522 | |
| 3.25% 2017 Senior Notes, due 2028 | 503 | | | 539 | | | 524 | | | 561 | |
| | | | | | | |
| 4.25% 2018 Senior Notes, due 2029 | 396 | | | 451 | | | 394 | | | 480 | |
| 4.875% 2018 Senior Notes, due 2048 | 383 | | | 526 | | | 390 | | | 544 | |
| 0.950% 2019 Senior Notes, due 2030 | 846 | | | 866 | | | 909 | | | 974 | |
| 3.75% 2020 Senior Notes, due 2025 | 686 | | | 750 | | | 693 | | | 785 | |
| 3.25% 2020 Senior Notes, due 2050 | 293 | | | 311 | | | 293 | | | 329 | |
| 2.55% 2020 Senior Notes, due 2060 | 491 | | | 432 | | | 491 | | | 467 | |
| 2.00% 2021 Senior Notes, due 2031 | 587 | | | 581 | | | — | | | — | |
| 2.75% 2021 Senior Notes, due 2041 | 581 | | | 579 | | | — | | | — | |
| 3.10% 2021 Senior Notes, due 2061 | 488 | | | 488 | | | — | | | — | |
| Total | $ | 7,413 | | | $ | 7,982 | | | $ | 6,422 | | | $ | 7,256 | |
The fair value of the Company’s debt is estimated based on quoted market prices for similar instruments. Accordingly, the inputs used to estimate the fair value of the Company’s long-term debt are classified as Level 2 inputs within the fair value hierarchy.
NOTE 19 CAPITAL STOCK
Authorized Capital Stock
The total number of shares of all classes of stock that the Company has authority to issue under its Restated Certificate of Incorporation is 1.02 billion shares with a par value of $0.01, of which 1.0 billion are shares of common stock, 10.0 million are shares of preferred stock and 10.0 million are shares of series common stock. The preferred stock and series common stock can be issued with varying terms, as determined by the Board.
Share Repurchase Program
The Company implemented a systematic share repurchase program in the third quarter of 2005 through an SEC Rule 10b5-1 program. Moody’s may also purchase opportunistically when conditions warrant. As a result, Moody’s share repurchase activity will continue to vary from quarter to quarter. The table below summarizes the Company’s remaining authority under its share repurchase program as of December 31, 2021: | | | | | | | | | | | | | | |
| Date Authorized | | Amount Authorized | | Remaining Authority |
| February 9, 2021 | | $ | 1,000 | | | $ | 1,000 | |
| December 16, 2019 | | $ | 1,000 | | | $ | 81 | |
| Total Remaining Authority at December 31, 2021 | | | | $ | 1,081 | |
Additionally, on February 7, 2022, the Board of Directors approved an additional $750 million of share repurchase authority.
During 2021, Moody’s repurchased 2.2 million shares of its common stock under its share repurchase program and issued a net 0.8 million shares under employee stock-based compensation plans. The net amount includes shares withheld for employee payroll taxes.
Dividends
The Company’s cash dividends were: | | | | | | | | | | | | | | | | | | | | | | | | | | | | | | | | | | | |
| Dividends Per Share |
| Year ended December 31, |
| 2021 | | 2020 | | 2019 |
| Declared | | Paid | | Declared | | Paid | | Declared | | Paid |
| First quarter | $ | 0.62 | | | $ | 0.62 | | | $ | 0.56 | | | $ | 0.56 | | | $ | 0.50 | | | $ | 0.50 | |
| Second quarter | 0.62 | | | 0.62 | | | 0.56 | | | 0.56 | | | 0.50 | | | 0.50 | |
| Third quarter | 0.62 | | | 0.62 | | | 0.56 | | | 0.56 | | | 0.50 | | | 0.50 | |
| Fourth quarter | 0.62 | | | 0.62 | | | 0.56 | | | 0.56 | | | 0.50 | | | 0.50 | |
| Total | $ | 2.48 | | | $ | 2.48 | | | $ | 2.24 | | | $ | 2.24 | | | $ | 2.00 | | | $ | 2.00 | |
On February 7, 2022, the Board approved the declaration of a quarterly dividend of $0.70 per share of Moody’s common stock, payable on March 18, 2022 to shareholders of record at the close of business on February 25, 2022. The continued payment of dividends at the rate noted above, or at all, is subject to the discretion of the Board.
NOTE 20 LEASE COMMITMENTS
The Company has operating leases, substantially all of which relate to the lease of office space. The Company's leases classified as finance leases are not material to the consolidated financial statements. Certain of the Company's leases include options to renew, with renewal terms that can extend the lease from one to 20 years at the Company's discretion.
The following table presents the components of the Company’s lease cost: | | | | | | | | | | | | | | | | | |
| Year Ended December 31, |
| 2021 | | 2020 | | 2019 |
| | | | | |
| Operating lease cost | $ | 98 | | | $ | 96 | | | $ | 97 | |
| | | | | |
| Sublease income | (6) | | | (5) | | | (2) | |
| Variable lease cost | 19 | | | 19 | | | 17 | |
| Total lease cost | $ | 111 | | | $ | 110 | | | $ | 112 | |
The following tables present other information related to the Company’s operating leases: | | | | | | | | | | | | | | | | | |
| Year Ended December 31, |
| 2021 | | 2020 | | 2019 |
| Cash paid for amounts included in the measurement of operating lease liabilities | $ | 113 | | | $ | 108 | | | $ | 106 | |
| Right-of-use assets obtained in exchange for new operating lease liabilities | $ | 137 | | | $ | 36 | | | $ | 41 | |
| | | | | | | | | | | |
| Year Ended December 31, |
| 2021 | 2020 | 2019 |
| Weighted-average remaining lease term (in years) | 5.6 | 6.0 | 6.8 |
| Weighted-average discount rate applied to operating leases | 3.1 | % | 3.6 | % | 3.6 | % |
The following table presents a maturity analysis of the future minimum lease payments included within the Company’s operating lease liabilities at December 31, 2021: | | | | | | | | |
| Year Ending December 31, | | Operating Leases |
| 2022 | | $ | 121 | |
| 2023 | | 118 | |
| 2024 | | 109 | |
| 2025 | | 93 | |
| 2026 | | 74 | |
| Thereafter | | 95 | |
| Total lease payments (undiscounted) | | 610 | |
| Less: Interest | | 50 | |
| Present value of lease liabilities: | | $ | 560 | |
| Lease liabilities - current | | $ | 105 | |
| Lease liabilities - noncurrent | | $ | 455 | |
NOTE 21 CONTINGENCIES
Given the nature of the Company's activities, Moody’s and its subsidiaries are subject to legal and tax proceedings, governmental, regulatory and legislative investigations, subpoenas and other inquiries, and claims and litigation by governmental and private parties that are based on ratings assigned by MIS or that are otherwise incidental to the Company’s business. Moody’s and MIS also are subject to periodic reviews, inspections, examinations and investigations by regulators in the U.S. and other jurisdictions, any of which may result in claims, legal proceedings, assessments, fines, penalties or restrictions on business activities. Moody’s also is subject to ongoing tax audits as addressed in Note 17 to the consolidated financial statements.
Management periodically assesses the Company’s liabilities and contingencies in connection with these matters based upon the latest information available. For claims, litigation and proceedings and governmental investigations and inquiries not related to income taxes, the Company records liabilities in the consolidated financial statements when it is both probable that a liability has been incurred and the amount of loss can be reasonably estimated and periodically adjusts these as appropriate. When the reasonable estimate of the loss is within a range of amounts, the minimum amount of the range is accrued unless some higher amount within the range is a better estimate than another amount within the range. In instances when a loss is reasonably possible but uncertainties exist related to the probable outcome and/or the amount or range of loss, management does not record a liability but discloses the contingency if material. As additional information becomes available, the Company adjusts its assessments and estimates of such matters accordingly. Moody’s also discloses material pending legal proceedings pursuant to SEC rules and other pending matters as it may determine to be appropriate.
In view of the inherent difficulty of assessing the potential outcome of legal proceedings, governmental, regulatory and legislative investigations and inquiries, claims and litigation and similar matters and contingencies, particularly when the claimants seek large or indeterminate damages or assert novel legal theories or the matters involve a large number of parties, the Company often cannot predict what the eventual outcome of the pending matters will be or the timing of any resolution of such matters. The Company also may be unable to predict the impact (if any) that any such matters may have on how its business is conducted, on its competitive position or on its financial position, results of operations or cash flows. As the process to resolve any pending matters progresses, management will continue to review the latest information available and assess its ability to predict the outcome of such matters and the effects, if any, on its operations and financial condition and to accrue for and disclose such matters as and when required. However, because such matters are inherently unpredictable and unfavorable developments or resolutions can occur, the ultimate outcome of such matters, including the amount of any loss, may differ from those estimates.
NOTE 22 SEGMENTINFORMATION
The Company is organized into
two2 operating segments: MIS and MA and accordingly, the Company reports in
two2 reportable segments: MIS and MA.
The MIS segment consists of
five5 LOBs. The CFG, SFG, FIG and PPIF LOBs generate revenue principally from fees for the assignment and ongoing monitoring of credit ratings on debt obligations and the entities that issue such obligations in markets worldwide. The MIS Other LOB primarily consists of financial instruments pricing services in the Asia-Pacific region,
as well as ICRA
non-ratings revenue. revenue and revenue from providing ESG research, data and assessments.
The MA segment develops a wide range of products and services that support the risk management activities of institutional participants in global financial markets. The MA segment consists of
three LOBs—2 LOBs - RD&A
ERS and
PS.On August 10, 2017, a subsidiary of the Company acquired Yellow Maple I B.V., an indirect parent of Bureau van Dijk, a global provider of business intelligence and company information products. Bureau van Dijk is part of the MA reportable segment and its revenue is included in the RD&A LOB. Refer to Note 7 for further discussion on the acquisition.
ERS.
Revenue for MIS and expenses for MA include an intersegment royaltyfees charged to MA for the rights to use and distribute content, data and products developed by MIS. The royalty rate charged by MIS approximates the fair value of the aforementioned content, data and products and is generally based on comparable market transactions. Also,Additionally, revenue for MA and expenses for MIS include an intersegment fee charged to MIS from MA for certain MA products and services utilized in MIS’s ratings process. These intersegment fees charged by MA are generally equal tobased on the costs incurred by MA to produce thesemarket value of the products and services. Additionally, overhead costs and corporate expenses ofservices being transferred between the Company that exclusively benefit only one segment are fully charged to that segment. Overhead costs and corporate expenses of the Company that benefit both segments are allocated to each segment based on a revenue-split methodology. Accordingly, a reportable segment’s share of these costs will increase as its proportion of revenue relative to Moody’s total revenue increases. segments.
Overhead expenses include costs such as rent and occupancy, information technology and support staff such as finance, human resources and information technology. “Eliminations”legal. Such costs and corporate expenses that exclusively benefit one segment are fully charged to that segment.
For overhead costs and corporate expenses that benefit both segments, costs are allocated to each segment based on the segment’s share of full-year 2019 actual revenue which comprises a “Baseline Pool” that will remain fixed over time. In subsequent periods, incremental overhead costs (or reductions thereof) will be allocated to each segment based on the prevailing shares of total revenue represented by each segment.
“Eliminations” in the
following table
below represent intersegment revenue/expense. Moody’s does not report the Company’s assets by reportable segment, as this metric is not used by the chief operating decision maker to allocate resources to the segments. Consequently, it is not practical to show assets by reportable segment.
Financial Information by Segment
The table below shows revenue and Adjusted Operating Income and operating income by reportable segment. Adjusted Operating Income is a financial metric utilized by the Company’s chief operating decision maker to assess the profitability of each reportable segment. | | | | | | | | | | | | | | | | | | | | | | | | | | | | | | | | |
| | | Year Ended December 31, | |
| | | 2017 | | | 2016 | |
| | | | | | | | |
| | | MIS | | | MA | | | Eliminations | | | Consolidated | | | MIS | | | MA | | | Eliminations | | | Consolidated | |
| Revenue | | $ | 2,885.5 | | | $ | 1,446.3 | | | $ | (127.7 | ) | | $ | 4,204.1 | | | $ | 2,471.0 | | | $ | 1,246.9 | | | $ | (113.7 | ) | | $ | 3,604.2 | |
| Operating, SG&A | | | 1,246.9 | | | | 1,095.0 | | | | (127.7 | ) | | | 2,214.2 | | | | 1,115.6 | | | | 961.1 | | | | (113.7 | ) | | | 1,963.0 | |
| | | | | | | | | | | | | | | | | | | | | | | | | | | | | | | | |
Adjusted Operating Income | | | 1,638.6 | | | | 351.3 | | | | — | | | | 1,989.9 | | | | 1,355.4 | | | | 285.8 | | | | — | | | | 1,641.2 | |
Less:
Depreciation and amortization | | | 74.7 | | | | 83.6 | | | | — | | | | 158.3 | | | | 73.8 | | | | 52.9 | | | | — | | | | 126.7 | |
Restructuring | | | — | | | | — | | | | — | | | | — | | | | 10.2 | | | | 1.8 | | | | — | | | | 12.0 | |
Acquisition-Related Expenses | | | — | | | | 22.5 | | | | — | | | | 22.5 | | | | — | | | | — | | | | — | | | | — | |
Settlement Charge | | | — | | | | — | | | | — | | | | — | | | | 863.8 | | | | — | | | | — | | | | 863.8 | |
| | | | | | | | | | | | | | | | | | | | | | | | | | | | | | | | |
| Operating income | | $ | 1,563.9 | | | $ | 245.2 | | | $ | — | | | $ | 1,809.1 | | | $ | 407.6 | | | $ | 231.1 | | | $ | — | | | $ | 638.7 | |
| | | | | | | | | | | | | | | | | | | | | | | | | | | | | | | | |
| | | | | | | | | | | | | | | | | | | | | | | | | | | | | | | | |
| | | | | | | | | | | | | | | Year Ended December 31, | |
| | | | | | 2015 | |
| | | | | | | | |
| | | | | | | | | | | | | | | MIS | | | MA | | | Eliminations | | | Consolidated | |
| Revenue | | | | | | | | | | | | | | | | | | $ | 2,427.7 | | | $ | 1,163.4 | | | $ | (106.6 | ) | | $ | 3,484.5 | |
| Operating, SG&A | | | | | | | | | | | | | | | | | | | 1,120.3 | | | | 883.9 | | | | (106.6 | ) | | | 1,897.6 | |
| | | | | | | | | | | | | | | | | | | | | | | | | | | | | | | | |
Adjusted Operating Income | | | | | | | | | | | | | | | | | | | 1,307.4 | | | | 279.5 | | | | — | | | | 1,586.9 | |
Less:
Depreciation and amortization | | | | | | | | | | | | | | | | | | | 66.0 | | | | 47.5 | | | | — | | | | 113.5 | |
| | | | | | | | | | | | | | | | | | | | | | | | | | | | | | | | |
| Operating income | | | | | | | | | | | | | | | | | | $ | 1,241.4 | | | $ | 232.0 | | | $ | — | | | $ | 1,473.4 | |
| | | | | | | | | | | | | | | | | | | | | | | | | | | | | | | | |
Refer to Note 3 for further details on the components of the Company’s revenue.
| | | | | | | | | | | | | | | | | | | | | | | | | | | | | | | | | | | | | | | | | | | | | | | |
| Year Ended December 31, |
| 2021 | | 2020 |
| MIS | | MA | | Eliminations | | Consolidated | | MIS | | MA | | Eliminations | | Consolidated |
| Revenue | $ | 3,977 | | | $ | 2,413 | | | $ | (172) | | | $ | 6,218 | | | $ | 3,440 | | | $ | 2,086 | | | $ | (155) | | | $ | 5,371 | |
| Operating, SG&A | 1,503 | | | 1,786 | | | (172) | | | 3,117 | | | 1,387 | | | 1,472 | | | (155) | | | 2,704 | |
| Adjusted Operating Income | 2,474 | | | 627 | | | — | | | 3,101 | | | 2,053 | | | 614 | | | — | | | 2,667 | |
| | | | | | | | | | | | | | | |
| Depreciation and amortization | 72 | | | 185 | | | — | | | 257 | | | 70 | | | 150 | | | — | | | 220 | |
| Restructuring | (1) | | | 1 | | | — | | | — | | | 19 | | | 31 | | | — | | | 50 | |
| | | | | | | | | | | | | | | |
| Loss pursuant to the divestiture of MAKS | — | | | — | | | — | | | — | | | — | | | 9 | | | — | | | 9 | |
| | | | | | | | | | | | | | | |
| Operating Income | | | | | | | $ | 2,844 | | | | | | | | | $ | 2,388 | |
| | | | | | | | | | | | | | | | | | | | | | | |
| Year Ended December 31, 2019 |
| MIS | | MA | | Eliminations | | Consolidated |
| Revenue | $ | 3,009 | | | $ | 1,963 | | | $ | (143) | | | $ | 4,829 | |
| Operating, SG&A | 1,264 | | | 1,417 | | | (143) | | | 2,538 | |
| Adjusted Operating Income | 1,745 | | | 546 | | | — | | | 2,291 | |
| | | | | | | |
| Depreciation and amortization | 71 | | | 129 | | | — | | | 200 | |
| Restructuring | 31 | | | 29 | | | — | | | 60 | |
| Acquisition-Related Expenses | — | | | 3 | | | — | | | 3 | |
| Loss pursuant to the divestiture of MAKS | — | | | 14 | | | — | | | 14 | |
| Captive insurance company settlement | 10 | | | 6 | | | — | | | 16 | |
| Operating income | | | | | | | $ | 1,998 | |
The cumulative restructuring charges related to actions taken in 2016 as more fully discussed in Note 9the 2018 Restructuring Program for the MIS and MA reportable segments are $10.2$60 million and $1.8$43 million, respectively. The cumulative restructuring charges related to the 2020 Restructuring Program for the MIS and MA reportable segments were $21 million and $15 million, respectively. The cumulative restructuring charge for the MA reportable segment related to the 2020 MA Strategic Reorganization Restructuring Program is $20 million. The restructuring programs are more fully discussed in MA reflects cost management initiatives in certain corporate overhead functionsNote 11.
Table of which portion is allocated to MA based on a revenue-split methodology.MIS AND MA REVENUE BY LINE OF BUSINESS
The tables below present revenue by LOB:
| | | | | | | | | | | | |
| | | Year Ended December 31, | |
| | | |
| | | 2017 | | | 2016 | | | 2015 | |
| MIS: | | | | | | | | | | | | |
| Corporate finance (CFG) | | $ | 1,392.7 | | | $ | 1,122.3 | | | $ | 1,112.7 | |
| Structured finance (SFG) | | | 495.5 | | | | 436.8 | | | | 449.1 | |
| Financial institutions (FIG) | | | 435.8 | | | | 368.9 | | | | 365.6 | |
| Public, project and infrastructure finance (PPIF) | | | 431.3 | | | | 412.2 | | | | 376.4 | |
| | | | | | | | | | | | |
Total ratings revenue | | | 2,755.3 | | | | 2,340.2 | | | | 2,303.8 | |
| MIS Other | | | 18.5 | | | | 30.6 | | | | 30.4 | |
| | | | | | | | | | | | |
Total external revenue | | | 2,773.8 | | | | 2,370.8 | | | | 2,334.2 | |
| Intersegment royalty | | | 111.7 | | | | 100.2 | | | | 93.5 | |
| | | | | | | | | | | | |
Total | | | 2,885.5 | | | | 2,471.0 | | | | 2,427.7 | |
| | | | | | | | | | | | |
| MA: | | | | | | | | | | | | |
| Research, data and analytics (RD&A) | | | 832.7 | | | | 667.6 | | | | 626.4 | |
| Enterprise risk solutions (ERS) | | | 448.6 | | | | 418.8 | | | | 374.0 | |
| Professional services (PS) | | | 149.0 | | | | 147.0 | | | | 149.9 | |
| | | | | | | | | | | | |
Total external revenue | | | 1,430.3 | | | | 1,233.4 | | | | 1,150.3 | |
| Intersegment revenue | | | 16.0 | | | | 13.5 | | | | 13.1 | |
| | | | | | | | | | | | |
Total | | | 1,446.3 | | | | 1,246.9 | | | | 1,163.4 | |
| | | | | | | | | | | | |
| Eliminations | | | (127.7 | ) | | | (113.7 | ) | | | (106.6 | ) |
| | | | | | | | | | | | |
Total MCO | | $ | 4,204.1 | | | $ | 3,604.2 | | | $ | 3,484.5 | |
| | | | | | | | | | | | |
Contents
CONSOLIDATED REVENUE AND LONG-LIVED ASSETS INFORMATION BY GEOGRAPHIC AREA | | | | | | | | | | | | |
| | | Year Ended December 31, | |
| | | |
| | | 2017 | | | 2016 | | | 2015 | |
| Revenue: | | | | | | | | | | | | |
| U.S. | | $ | 2,348.4 | | | $ | 2,105.5 | | | $ | 2,009.0 | |
| International: | | | | | | | | | | | | |
EMEA | | | 1,131.7 | | | | 904.4 | | | | 882.3 | |
Asia-Pacific | | | 471.4 | | | | 373.2 | | | | 364.2 | |
Americas | | | 252.6 | | | | 221.1 | | | | 229.0 | |
| | | | | | | | | | | | |
Total International | | | 1,855.7 | | | | 1,498.7 | | | | 1,475.5 | |
| | | | | | | | | | | | |
| Total | | $ | 4,204.1 | | | $ | 3,604.2 | | | $ | 3,484.5 | |
| | | | | | | | | | | | |
| Long-lived assets at December 31: | | | | | | | | | | | | |
| United States | | $ | 672.5 | | | $ | 681.9 | | | $ | 657.5 | |
| International | | | 5,037.4 | | | | 964.0 | | | | 924.3 | |
| | | | | | | | | | | | |
| Total | | $ | 5,709.9 | | | $ | 1,645.9 | | | $ | 1,581.8 | |
| | | | | | | | | | | | |
NOTE 21 | VALUATION AND QUALIFYING ACCOUNTS |
| | | | | | | | | | | | | | | | | |
| Year Ended December 31, |
| 2021 | | 2020 | | 2019 |
| Revenue: | | | | | |
| U.S. | $ | 3,416 | | | $ | 2,955 | | | $ | 2,544 | |
| Non-U.S.: | | | | | |
| EMEA | 1,866 | | | 1,545 | | | 1,446 | |
| Asia-Pacific | 596 | | | 571 | | | 551 | |
| Americas | 340 | | | 300 | | | 288 | |
| Total Non-U.S. | 2,802 | | | 2,416 | | | 2,285 | |
| Total | $ | 6,218 | | | $ | 5,371 | | | $ | 4,829 | |
| | | | | |
| Long-lived assets at December 31: | | | | | |
| U.S. | $ | 4,449 | | | $ | 2,162 | | | $ | 1,290 | |
| Non-U.S. | 4,802 | | | 4,889 | | | 4,678 | |
| Total | $ | 9,251 | | | $ | 7,051 | | | $ | 5,968 | |
NOTE 23 VALUATION AND QUALIFYING ACCOUNTS
Accounts receivable allowances primarily represent adjustments to customer billings that are estimated when the related revenue is recognized and also represents an estimateestimates for uncollectible accounts. The valuation allowance on deferred tax assets relates to foreignnet operating tax losses for which realization is uncertain. Below is a summary of activity:
| | | | | | | | | | | | | | | | |
Year Ended December 31, | | Balance at Beginning
of the Year | | | Charged to costs
and expenses | | | Deductions(1) | | | Balance at End
of the Year | |
| 2017 | | | | | | | | | | | | | | | | |
Accounts receivable allowance | | $ | (25.7 | ) | | $ | (19.6 | ) | | $ | 8.7 | | | $ | (36.6 | ) |
Deferred tax assets—valuation allowance | | $ | (3.2 | ) | | $ | (9.9 | ) | | $ | 0.3 | | | $ | (12.8 | ) |
| 2016 | | | | | | | | | | | | | | | | |
Accounts receivable allowance | | $ | (27.5 | ) | | $ | (6.2 | ) | | $ | 8.0 | | | $ | (25.7 | ) |
Deferred tax assets—valuation allowance | | $ | (4.3 | ) | | $ | (0.9 | ) | | $ | 2.0 | | | $ | (3.2 | ) |
| 2015 | | | | | | | | | | | | | | | | |
Accounts receivable allowance | | $ | (29.4 | ) | | $ | (9.0 | ) | | $ | 10.9 | | | $ | (27.5 | ) |
Deferred tax assets—valuation allowance | | $ | (6.9 | ) | | $ | 2.4 | | | $ | 0.2 | | | $ | (4.3 | ) |
(1) | Reflects write off of uncollectible accounts receivable or expiration of foreign net operating tax losses. |
NOTE 22 | OTHERNON-OPERATING (EXPENSE) INCOME, NET |
| | | | | | | | | | | | | | | | | | | | | | | | | | | | | | | | |
| Year Ended December 31, | | Balance at Beginning of the Year | | Adoption of New Expected Credit Losses Accounting Standard | | Charged to costs and expenses | | Deductions (1) | | Balance at End of the Year |
| 2021 | | | | | | | | | | |
| Allowances for credit losses | | $ | (34) | | | $ | — | | | $ | (13) | | | $ | 15 | | | $ | (32) | |
| Deferred tax assets—valuation allowance | | $ | (15) | | | $ | — | | | $ | (4) | | | $ | 1 | | | $ | (18) | |
| 2020 | | | | | | | | | | |
| Allowances for credit losses | | $ | (20) | | | $ | (2) | | | $ | (26) | | | $ | 14 | | | $ | (34) | |
| Deferred tax assets—valuation allowance | | $ | (9) | | | $ | — | | | $ | (6) | | | $ | — | | | $ | (15) | |
| 2019 | | | | | | | | | | |
| Allowances for credit losses | | $ | (20) | | | $ | — | | | $ | (10) | | | $ | 10 | | | $ | (20) | |
| Deferred tax assets—valuation allowance | | $ | (5) | | | $ | — | | | $ | (4) | | | $ | — | | | $ | (9) | |
(1)Reflects write-off of uncollectible accounts receivable or expiration of foreign net operating tax losses.
NOTE 24 OTHER NON-OPERATING INCOME, NET
The following table summarizes the components of othernon-operating (expense) income, net as presented in the consolidated statements of operations: | | | | | | | | | | | | |
| | | Year Ended December 31, | |
| | | 2017 | | | 2016 | | | 2015 | |
| FX (loss)/gain(a) | | $ | (16.8 | ) | | $ | 50.1 | | | $ | 1.1 | |
| Legacy Tax(b) | | | — | | | | 1.6 | | | | 6.4 | |
| Joint venture income | | | 13.3 | | | | 11.4 | | | | 11.8 | |
| Other | | | (1.2 | ) | | | (6.0 | ) | | | 2.0 | |
| | | | | | | | | | | | |
Total | | $ | (4.7 | ) | | $ | 57.1 | | | $ | 21.3 | |
| | | | | | | | | | | | |
(a) | The FX gain in 2016 includes an approximate $35 million net gain relating to the substantial liquidation/sale of certainnon-U.S. subsidiaries. Pursuant to ASC 830, cumulative translation gains relating to these subsidiaries were reclassified to other non operating income, net in the consolidated statement of operations. |
(b) | The 2016 and 2015 amount relate to the expiration of a statute of limitations for Legacy Tax Matters. |
NOTE 23 | RELATED PARTY TRANSACTIONS |
Moody’s Corporation made grants
| | | | | | | | | | | | | | | | | | | |
| Year Ended December 31, |
| 2021 | | | 2020 | | | 2019 |
| FX (loss) gain | $ | (1) | | | | $ | 2 | | | | $ | (18) | |
Purchase price hedge loss(1) | (13) | | | | — | | | | — | |
Net periodic pension costs—other components(2) | 9 | | | | 13 | | | | 18 | |
Income from investments in non-consolidated affiliates(3) | 60 | | | | 6 | | | | 13 | |
| Other | 27 | | | | 25 | | | | 7 | |
| Total | $ | 82 | | | | $ | 46 | | | | $ | 20 | |
(1)Reflects a loss on a forward contract to hedge a portion of $12 million, $4 million and $0 to the RMS British pound-denominated purchase price.
(2)The Moody’s Foundation during yearsamount for the year ended December 31, 2017, 2016 and 2015, respectively. 2021 includes an $8 million loss related to a settlement of pension obligations.
(3)The Foundation carries out philanthropic activities primarily in the areas of education and health and human services. Certain members of Moody’s senior management are on the board of the Foundation.NOTE 24 | QUARTERLY FINANCIAL DATA (UNAUDITED) |
| | | | | | | | | | | | | | | | |
| | | Three Months Ended | |
| | | | |
(amounts in millions, except EPS) | | March 31 | | | June 30 | | | September 30 | | | December 31 | |
| 2017 | | | | | | | | | | | | | | | | |
| Revenue | | $ | 975.2 | | | $ | 1,000.5 | | | $ | 1,062.9 | | | $ | 1,165.5 | |
| Operating income | | $ | 443.4 | | | $ | 457.5 | | | $ | 445.4 | | | $ | 462.8 | |
| Net income attributable to Moody’s | | $ | 345.6 | | | $ | 312.2 | | | $ | 317.3 | | | $ | 25.5 | |
| EPS: | | | | | | | | | | | | | | | | |
Basic | | $ | 1.81 | | | $ | 1.63 | | | $ | 1.66 | | | $ | 0.13 | |
Diluted | | $ | 1.78 | | | $ | 1.61 | | | $ | 1.63 | | | $ | 0.13 | |
| 2016 | | | | | | | | | | | | | | | | |
| Revenue | | $ | 816.1 | | | $ | 928.9 | | | $ | 917.1 | | | $ | 942.1 | |
| Operating income (loss) | | $ | 304.1 | | | $ | 410.2 | | | $ | 397.5 | | | $ | (473.1 | ) |
| Net income (loss) attributable to Moody’s | | $ | 184.4 | | | $ | 255.5 | | | $ | 255.3 | | | $ | (428.6 | ) |
| EPS: | | | | | | | | | | | | | | | | |
Basic | | $ | 0.95 | | | $ | 1.32 | | | $ | 1.33 | | | $ | (2.25 | ) |
Diluted | | $ | 0.93 | | | $ | 1.30 | | | $ | 1.31 | | | $ | (2.25 | ) |
Basic and diluted EPS are computed for each of the periods presented. The number of weighted average shares outstanding changes as common shares are issued pursuant to employee stock-based compensation plans and for other purposes or as shares are repurchased. Therefore, the sum of basic and diluted EPS for each of the four quarters may not equal the full year basic and diluted EPS.
Net Income attributable to Moody’samount for the three months ended March 31, 2017 includes the $59.7 million CCXI Gain. Net Income attributable to Moody’s for the three months ended June 30, 2017 and September 30, 2017 include $41.2 million ($25.3 million net of tax) and $69.9 million ($44.4 million net of tax), respectively, related to gains from FX collars and forward contracts executed to hedge against variability in the euro-denominated purchase price for Bureau van Dijk. Net Income attributable to Moody’s in the three monthsyear ended December 31, 20172021 includes a net charge of $245.6$36 million non-cash gain relating to the U.S. corporate tax reform and changesexchange of Moody’s minority investment in statutory tax rates in Belgium as more fully discussed in Note 15. BothVisibleRisk (accounted for under the operating loss and the net loss attributable to Moody’s in the three months ended December 31, 2016 primarily reflect the Settlement Chargeequity method) for shares of $863.8 million ($700.7 million,net-of-tax). In addition, the net loss attributable to Moody’s for the three months ended December 31, 2016 includes an approximate $35 million FX gain related to the liquidationBitSight, a cybersecurity ratings company.
NOTE 25 SUBSEQUENT EVENT
On January 24, 2018,February 7, 2022, the Board approved the declaration of a quarterly dividend of $0.44$0.70 per share for Moody’s common stock, payable March 12, 201818, 2022 to shareholders of record at the close of business on February 20, 2018.25, 2022.
Table of
ITEM 9. | | CHANGES IN AND DISAGREEMENTS WITH ACCOUNTANTS ON ACCOUNTING AND FINANCIAL DISCLOSURE |
Contents
ITEM 9. CHANGES IN AND DISAGREEMENTS WITH ACCOUNTANTS ON ACCOUNTING AND FINANCIAL DISCLOSURE
Not
applicableITEM 9A. | | CONTROLS AND PROCEDURES |
applicable.
ITEM 9A. CONTROLS AND PROCEDURES
Evaluation of Disclosure Controls and Procedures
The Company carried out an evaluation, as required by Rule
13a-15(b) under the Exchange Act, under the supervision and with the participation of the Company’s management, including the Company’s Chief Executive Officer and Chief Financial Officer, of the effectiveness of the design and operation of the Company’s disclosure controls and procedures, as defined in Rule
13a-15(e) of the Exchange Act, as of the end of the period covered by this report (the “Evaluation Date”). Based on such evaluation, such officers have concluded that, as of the Evaluation Date, the Company’s disclosure controls and procedures were effective to provide reasonable assurance that information required to be disclosed by the Company in reports that it files or submits under the Exchange Act is recorded, processed, summarized and reported within the time periods specified in the communication to the Company’s management, including the Company’s Chief Executive Officer and Chief Financial Officer, as appropriate to allow timely decisions regarding required disclosure. During the fiscal year ended December 31,
2017,2021, the Company acquired
Bureau van DijkRMS and management has excluded this acquired business from its assessment of the effectiveness of disclosure controls and procedures as of the Evaluation Date. The total assets (excluding acquired goodwill and intangible assets which are included within the scope of this assessment) and revenues of
Bureau van Dijk represents approximately $322RMS represent $333 million and
$92$81 million, respectively, of the corresponding amounts in
ourthe Company's consolidated financial statements for the fiscal year ended December 31,
2017.2021.
Changes In Internal Control Over Financial Reporting
Information in response to this Item is set forth under the caption “Management’s Report on Internal Control Over Financial Reporting”, in Part II, Item 8 of this annual report on Form
10-K.Except as described below, the Company’s management, including the Company’s Chief Executive Officer and Chief Financial Officer, has determined that there were no changes in the Company’s internal control over financial reporting that have materially affected, or are reasonably likely to materially affect, these internal controls over financial reporting during the
period covered by this report.three months ended December 31, 2021. Although a significant portion of the Company's workforce has been working remotely due to the COVID-19 pandemic, Moody's has not experienced any material impact to its internal controls over financial reporting.
During the fiscal year ended December 31, 2017,2021, the Company acquired Bureau van Dijk,RMS and we areis in the process of integrating the acquired entity into the Company’s financial reporting processes and procedures and internal controls over financial reporting. Additionally, during the fiscal year ended December 31, 2017, the Company implemented internal controls relating to the adoption and assessment
ITEM 9B. OTHER INFORMATION
Not applicable.
ITEM 9C. DISCLOSURE REGARDING FOREIGN JURISDICTIONS THAT PREVENT INSPECTIONS
Not applicable.
Except for the information relating to the executive officers of the Company set forth in Part I of this annual report on Form
10-K, the information called for by Items
10-14 is contained in the Company’s definitive proxy statement for use in connection with its annual meeting of stockholders scheduled to be held on April
24, 2018,26, 2022, and is incorporated herein by reference.
ITEM 10 DIRECTORS, EXECUTIVE OFFICERS AND CORPORATE GOVERNANCE
Information required by this Item 10 is included under the heading “Information about our Executive Officers” in Part I, Item 1 of this Form 10‑K, as well as under the headings “Item 1–Election of Directors,” “Corporate Governance–Codes of Business Conduct and Ethics,” and “The Audit Committee,” in the 2022 Proxy Statement and is incorporated by reference.
ITEM 11 EXECUTIVE COMPENSATION
Information required by this Item 11 is included under the headings “Compensation Discussion and Analysis,” “Summary Compensation Table,” “Grants of Plan-Based Awards Table for 2021,” “Outstanding Equity Awards at Fiscal Year-End Table for 2021,” “Option Exercises and Stock Vested Table for 2021,” “Pension Benefits Table for 2021,” “Non-Qualified Deferred Compensation Table,” “Potential Payments Upon Termination or Change in Control,” “Compensation of Directors,” “Relationship of Compensation Practices to Risk Management” “CEO Pay Ratio,” and “Report of the Compensation & Human Resources Committee” in the 2022 Proxy Statement and is incorporated by reference.
ITEM 12 SECURITY OWNERSHIP OF CERTAIN BENEFICIAL OWNERS AND MANAGEMENT AND RELATED STOCKHOLDER MATTERS
Information required by this Item 12 is included under the heading “Equity Compensation Plan Information” in Part II, Item 5 of this Form 10-K, as well as under the heading “Security Ownership of Certain Beneficial Owners and Management” in the 2022 Proxy Statement and is incorporated by reference.
ITEM 13 CERTAIN RELATIONSHIPS AND RELATED TRANSACTIONS, AND DIRECTOR INDEPENDENCE
Information required by this Item 13 is included under the headings “Corporate Governance –Director Independence” and “Certain Relationships and Related Transactions” in the 2022 Proxy Statement and is incorporated by reference.
ITEM 14 PRINCIPAL ACCOUNTING FEES AND SERVICES
Information required by this Item 14 is included under the headings “Item 2–Ratification of Appointment of Independent Registered Public Accountants–Principal Accounting Fees and Services” and “The Audit Committee” in the 2022 Proxy Statement and is incorporated by reference.
PART IV
ITEM 15. EXHIBITS AND FINANCIAL STATEMENT SCHEDULES
LIST OF DOCUMENTS FILED AS PART OF THIS REPORT.
(1) Financial Statements.
See Index to Financial Statements on page 68, in Part II. Item 8 of this Form 10-K. (2) Financial Statement Schedules.
None.
(3) Exhibits.
INDEX TO EXHIBITS
ITEM 10. | | DIRECTORS, EXECUTIVE OFFICERS AND CORPORATE GOVERNANCE |
ITEM 11. | | EXECUTIVE COMPENSATION |
ITEM 12. | | SECURITY OWNERSHIP OF CERTAIN BENEFICIAL OWNERS AND MANAGEMENT AND RELATED STOCKHOLDER MATTERS |
ITEM 13. | | CERTAIN RELATIONSHIPS AND RELATED TRANSACTIONS, AND DIRECTOR INDEPENDENCE |
ITEM 14. | | PRINCIPAL ACCOUNTING FEES AND SERVICES |
PART IV
ITEM 15. | | EXHIBITS AND FINANCIAL STATEMENT SCHEDULES |
LIST OF DOCUMENTS FILED AS PART OF THIS REPORT.
(1) Financial Statements.
See Index to Financial Statements on page 60, in Part II. Item 8 of this Form10-K.
(2) Financial Statement Schedules.
None.
(3) Exhibits.
See Index to Exhibits on pages121-124 of this Form10-K.
| | | | S-K EXHIBIT NUMBER | | |
| | MOODY’S 2017 10-K | | | 119 | |
Pursuant to the requirements of Section 13 or 15(d) of the Securities Exchange Act of 1934, the Registrant has duly caused this report to be signed on its behalf by the undersigned, thereunto duly authorized.
MOODY’S CORPORATION
(Registrant)
By: /s/ RAYMOND W. MCDANIEL, JR.
Raymond W. McDaniel, Jr.
President and Chief Executive Officer
Date: February 26, 2018
Pursuant to the requirements of the Securities Exchange Act of 1934, this report has been signed below by the following persons on behalf of the Registrant and in the capacities and on the date indicated.
/s/ RAYMOND W. MCDANIEL, JR.
Raymond W. McDaniel, Jr.,
President and Chief Executive Officer
(principal executive officer)
/s/ LINDA S. HUBER
Linda S. Huber,
Executive Vice President and Chief Financial Officer
(principal financial officer)
/s/ MICHAEL S. CRIMMINS
Michael S. Crimmins,
Senior Vice President and Corporate
Controller (principal accounting officer)
/s/ BASIL L. ANDERSON
Basil L. Anderson,
Director
/s/ JORGE A. BERMUDEZ
Jorge A. Bermudez,
Director
/s/ DARRELL DUFFIE
Darrell Duffie,
Director
/s/ KATHRYN M. HILL
Kathryn M. Hill,
Director
/s/ EWALD KIST
Ewald Kist,
Director
/s/ HENRY A. MCKINNELL, JR. PH.D.
Henry A. McKinnell, Jr. Ph.D.,
Chairman
/s/ LESLIE F. SEIDMAN
Leslie F. Seidman,
Director
/s/ BRUCE VAN SAUN
Bruce Van Saun,
Director
Date: February 26, 2018
INDEX TO EXHIBITS
| | | | |
S-K EXHIBIT NUMBER | | |
| |
2 | | Plan Ofof Acquisition, Reorganization, Arrangement, Liquidation or Succession |
| | |
| .1.1# | | .1 | | Securities Purchase Agreement, dated as of May 15, 2017,August 5, 2021, among Moody’s Corporation, Moody’s Holdings NL B.V.Analytics, Inc., Yellow Maple I B.V., Yellow Maple Syrup I B.V., Yellow Maple Syrup II B.V.Daily Mail and the Sellers identified thereinGeneral Trust plc, DMG Atlantic Ltd, and DMG US Investments, Inc. (incorporated by reference to Exhibit 2.1 to the Report on Form 8-K of the Registrant, file number 1-14037, filed May 15, 2017)August 6, 2021) |
| | |
| .1.2 | | .2 | | WarrantyAmendment No.1 to Purchase Agreement, dated as of MaySeptember 15, 2017, between2021, among Moody’s Holdings NL B.V.Analytics, Inc., Daily Mail and the Warrantors identified thereinGeneral Trust plc, DMG Atlantic Ltd, and DMG US Investments, Inc. (incorporated by reference to Exhibit 2.2 to the Report on Form 8-K of the Registrant, file number 1-14037, filed MaySeptember 15, 2017)2021) |
| 3 | |
3 | | Articles Ofof Incorporation Andand By-laws |
| | |
| .1 | | .1 | | |
| | |
| .2 | | .2 | | |
| 4 | |
4 | | Instruments Defining Thethe Rights Ofof Security Holders, Including Indentures |
| | .1 | |
| | .1.2 | | |
| | |
| .3.1 | | .2 | | Note Purchase Agreement, dated as of September 7, 2007, by and among Moody’s Corporation and the note purchasers party thereto, including the form of the 6.06% Series 2007-1 Senior Unsecured Note due 2017 (incorporated by reference to Exhibit 4.1 to the Report on Form 8-K of the Registrant, file number 1-14037, filed September 13, 2007) |
| | |
| | .3.1 | | |
| | |
| .3.2 | | .3.2 | | Supplemental Indenture, dated as of August 19, 2010, between Moody’s Corporation and Wells Fargo, National Association, as trustee, including the form of the 5.50% Senior Notes due 2020 (incorporated by reference to Exhibit 4.2 to the Report on Form 8-K of the Registrant, file number 1-14037, filed August 19, 2010) |
| | |
| | .3.3 | | |
| | |
| .3.3 | | .3.4 | | |
| | |
| .3.4 | | .3.5 | | |
| | |
| .3.5.1 | | .3.6 | | Fifth Supplemental Indenture, dated March 9, 2015, between the Company, Wells Fargo Bank, National Association, as trustee and Elavon Financial Services Limited, UK Branch as paying agent and transfer agent and Elavon Financial Services Limited as registrar, including the form or 1.75% Senior Notes due 2027 (incorporated by reference to Exhibit 4.1 to the Report on Form 8-K of the Registrant, file number 1-14037, filed March 10, 2015) |
| | |
| .3.5.2 | | .3.7 | | Sixth Supplemental Indenture,Agency Agreement, dated as of March 2, 2017,9, 2015, between the Company, and Wells Fargo Bank, National Association, as trustee including the form of 2.750% Senior Notes due 2021 and form of Floating Rate Senior Notes due 2018 (incorporatedElavon Financial Services Limited, UK Branch as paying agent and transfer agent and Elavon Financial Services Limited as registrar ((incorporated by reference to Exhibit 4.14.3 to the Report on Form 8-K of the Registrant, file number 1-14037, filed March 3, 2017)10, 2015) |
| | | | |
S-K EXHIBIT NUMBER | | |
| | |
| .3.6 | | .3.8 | | |
| | | | | | | | | | | |
| | .4.1.3.7 | |
| | .3.8.1 | Five-Year CreditTenth Supplemental Indenture, dated as of November 25, 2019, between the Company, Wells Fargo Bank, National Association, as trustee, Elavon Financial Services Limited, UK Branch as paying agent and U.S. Bank National Association as registrar and transfer agent, including the form of 0.950% Senior Note due 2030 (incorporated by reference to Exhibit 4.1 to the Report on Form 8-K of the Registrant, file number 1-14037, filed November 25, 2019) |
| | .3.8.2 | Agency Agreement, dated November 25, 2019, between the Company, Wells Fargo Bank, National Association, as trustee, Elavon Financial Services Limited, UK Branch as paying agent and U.S. Bank National Association as registrar and transfer agent. (incorporated by reference to Exhibit 4.3 to the Report on Form 8-K of the Registrant, file number 1-14037, filed November 25, 2019) |
| | .3.9 | |
| | .3.10 | Twelfth Supplemental Indenture, dated as of May 11, 2015, among Moody’s Corporation,20, 2020, between the Borrowing Subsidiaries Party Thereto,Company and Wells Fargo Bank, National Association, as trustee, including the Lenders Party Thereto, JPMorgan Chase Bank, N.A., as Administrative Agent, Bankform of America, N.A. and Citibank, N.A. as Co-Syndication Agents, and TD Bank, N.A., The Bank of Tokyo-Mitsubishi UFJ, Ltd. and Barclays Bank as Co-Documentation Agents3.250% Senior Note due 2050 (incorporated by reference to Exhibit 4.1 to the Report on Form 8-K of the Registrant, file number 1-14037, filed May 14, 2015)20, 2020) |
| | |
| .3.11 | | .4.2 | | Amendment No. 1,Thirteenth Supplemental Indenture, dated as of June 6, 2017, among Moody’s Corporation,August 18, 2020, between the financial institutions party theretoCompany and JPMorgan ChaseWells Fargo Bank, N.A.,National Association, as Administrative Agent under that certain Credit Agreement, dated astrustee, including the form of May 11, 2015, among Moody’s Corporation, the Borrowing Subsidiaries party thereto, the Lenders party thereto and JPMorgan Chase Bank, N.A., as Administrative Agent (incorporated by reference to Exhibit 4.2 to the Report on Form 8-K of the Registrant, file number 1-14037, filed June 12, 2017) |
| | |
| | .5 | | 364-Day Bridge Credit Agreement dated as of May 15, 2017, among Moody’s Corporation, the Lenders Party thereto and JPMorgan Chase Bank, N.A., as Administrative Agent2.550% Senior Note due 2060 (incorporated by reference to Exhibit 4.1 to the Report on Form 8-K of the Registrant, file number 1-14037, filed May 15, 2017)August 18, 2020) |
| | |
| .3.12 | | .6 | | Loan Agreement,Fourteenth Supplemental Indenture, dated as of June 6, 2017, among Moody’s Corporation,August 19, 2021, between the Lenders party theretoCompany and JPMorgan ChaseWells Fargo Bank, N.A.,National Association, as Administrative Agenttrustee, including the form of 2.000% Senior Note due 2031 and the form of 2.750% Senior Notes due 2041 (incorporated by reference to Exhibit 4.1 to the Report on Form 8-K of the Registrant, file number 1-14037, filed June 12, 2017)August 19, 2021) |
| | |
| .3.13 | | .7 | | Registration Rights Agreement,Fifteenth Supplemental Indenture, dated as of June 12, 2017,November 29, 2021, between Moody’s Corporationthe Company and Computershare Trust Company, N.A. as successor to Wells Fargo Bank, National Association, as trustee, including the representativesform of the initial purchasers of the notes3.100% Senior Note due 2061 (incorporated by reference to Exhibit 4.64.1 to the Report on Form 8-K of the Registrant, file number 1-14037, filed June 12, 2017)November 29, 2021 |
| 10 | |
10 | | Material Contracts |
| | |
| .1.1† | | .1† | | 1998 Moody’s Corporation Key Employees’ Stock Incentive Plan (incorporated by reference to Exhibit 10.16 to the Registrant’s Quarterly Report on Form 10-Q, file number 1-14037, filed November 14, 2000) |
| | |
| | .2.1†* | | |
| | |
| | .2.2† | | Form of Non-Employee Director Restricted Stock Grant Agreement (for awards granted prior to 2018) for the 1998 Moody’s Corporation Non-Employee Directors’ Stock Incentive Plan (as amended on April 23, 2001) (incorporated by reference to Exhibit 10.310.2.1 to the Registrant’s QuarterlyAnnual Report on Form 10-Q,10-K, file number 1-14037, filed November 3, 2004)February 27, 2018) |
| | |
| .1.2† | | .2.3†* | | Form of Non-Employee Director Restricted Stock Unit Grant Agreement (for awards after 2017) for the 1998 Moody���sMoody’s Corporation Non-Employee Directors’ Stock Incentive Plan (Adopted September 8, 2000; Amended and Restated as of December 11, 2012, October 20, 2015, December 14, 2015 and December 18, 2017). (incorporated by reference to Exhibit 10.2.3 to the Registrant’s Annual Report on Form 10-K, file number 1-14037, filed February 27, 2018) |
| | |
| .2† | | .3† | | |
| | |
| .3.1† | | .4.1†* | | |
| | |
| | .4.2† | | Formand restated as of Employee Non-Qualified Stock Option and Restricted Stock Grant Agreement (for awards granted prior to 2017) for the Amended and Restated 2001 Moody’s Corporation Key Employees’ Stock Incentive PlanJanuary 1, 2021) (incorporated by reference to Exhibit 10.210.5 to the Registrant’s Quarterly Report on Form 10-Q, file number 1-14037, filed November 3, 2004)October 29, 2021) |
| | |
| .3.2.1† | | .4.3† | | |
| | |
| .3.2.2† | | .4.4† | | |
| | | | |
S-K EXHIBIT NUMBER | | |
| | |
| .3.3.1† | | .4.5† | | |
| | .3.3.2† | |
| | | | | | | | | | | |
| | .4.6†*.3.4.1† | | Form of Performance Share Award Letter (for awards granted after 2017) for the Amended and Restated 2001 Moody’s Corporation Key Employees’ Stock Incentive Plan |
| | |
| | .4.7† | | |
| | .3.4.2† | |
| | .5.1†.4† | | |
| | |
| .5† | | .6† | | |
| | |
| .6† | | .7† | | |
| | |
| .7† | | .8† | | |
| | |
| .8.1† | | .9.1† | | |
| | |
| .8.2† | | .9.2† | | |
| | |
| .8.3† | | .9.3† | | |
| | |
| .9† | | .10†* | | |
| | |
| | .11.1† | | Moody’s Corporation Retirement Account, amended and restated as of December 18,2013 (incorporated by reference to Exhibit 10.2510.10 to the Registrant’s Annual Report on Form 10-K, file number 1-14037, filed February 27, 2014)2018) |
| | .10.1† | |
| | .11.2†.10.2†* | | |
| | |
| .11.1† | | .12.1† | | |
| | |
| .11.2†* | | .12.2† | | |
| | |
| .12†* | | .12.3† | | Second Amendment to the Profit Participation Plan of Moody’s Corporation (incorporated by reference to Exhibit 10.1 to the Registrant’s Quarterly Report on Form 10-Q, file number 1-14037, filed May 4, 2016) |
| | |
| | .13† | | |
| | .13.1†* | |
| | .14† | |
| | |
| .15† | | .14.1† | | |
| | |
| | .14.2† | | Form of Separation Agreement and General Release used by the Registrant with its Career TransitionRisk Management Solutions, Inc. 2014 Equity Award Plan (incorporated by reference to Exhibit 99.1 to the ReportRegistration Statement on Form 8-KS-8 of the Registrant, file number 1-14037,333-259539, filed November 20, 2007)September 15, 2021) |
| | | | |
S-K EXHIBIT NUMBER | | |
| | |
| .16† | | .15† | | |
| | |
| .17 | | .16 | | |
| | |
| | .17.1 | | Indemnification Agreement for Lease, dated February 6, 2008, among CWCB Properties (DS7) Limited, CWCB Properties (DS7) Limited and CW Leasing DS7F Limited, Canary Wharf Holdings Limited, Moody’s Investors Service Limited, and Moody’s Corporation (incorporated by reference to Exhibit 10.1 to the Report on Form 8-K of the Registrant, file number 1-14037, filed February 12, 2008)December 22, 2017) |
| | |
| .18† | | .17.2 | | |
| | |
| | .18 | | Form Commercial Paper Dealer AgreementEmployment Offer Letter between Moody’s Corporation as Issuer, and the Dealer party theretoMark Kaye, dated July 18, 2018 (incorporated by reference to Exhibit 10.1 to the Quarterly Report on Form 8-K10-Q of the Registrant, file number 1-14037, filed August 3, 2016)on October 31, 2018) |
| | |
| .19 | | .19 | | Settlement Agreement dated January 13, 2017 between (1) Moody’s Corporation, Moody’s Investors Service, Inc. and Moody’s Analytics, Inc., and (2) the United States, acting through the United States Department of Justice and the United States Attorney’s Office for the District of New Jersey, along with various States and the District of Columbia, acting through their respective Attorneys General (incorporated by reference to the Report on Form 8-K of the Registrant, file number 1-14037, filed January 17, 2017) |
| | |
| .20 | | .20 | | |
| | .21.1 | |
| | | | | | | | | | | |
12* | | | .21.2 | |
| | .22 | Credit Agreement, dated as of December 17, 2021, among Moody’s Corporation, the borrowing subsidiaries party thereto, the lenders and issuing banks party thereto, JPMorgan Chase Bank, N.A., as administrative agent, and the other agents party thereto (incorporated by reference to Exhibit 4.1 to the Report on Form 8-K of the Registrant, file number 1-14037, filed December 20, 2021). |
| 21* | | | | |
| 23 | |
23 | | Consent of Independent Registered Public Accounting Firm |
| | |
| .1* | | .1* | | |
| 31 | |
31 | | Certifications Pursuant to Section 302 of the Sarbanes-Oxley Act of 2002 |
| | |
| .1* | | .1* | | |
| | |
| .2* | | .2* | | |
| 32 | |
32 | | Certifications Pursuant to Section 906 of the Sarbanes-Oxley Act of 2002 |
| | |
| .1* | | .1* | | |
| | |
| .2* | | .2* | | |
| 101 | | Inline XBRL |
| | |
101.INS* | | Inline XBRL | | Instance Document |
| | |
| .SCH* | | .DEF* | | XBRL Definitions Linkbase Document |
| | |
| | .INS* | | XBRL Instance Document |
| | |
| | .SCH* | | Inline XBRL Taxonomy Extension Schema Document |
| | |
| .CAL* | | .CAL* | | Inline XBRL Taxonomy Extension Calculation Linkbase Document |
| | .DEF* | Inline XBRL Definitions Linkbase Document |
| | .LAB* | | Inline XBRL Taxonomy Extension Labels Linkbase Document |
| | |
| .PRE* | | .PRE* | | Inline XBRL Taxonomy Extension Presentation Linkbase Document |
| 104 | | | The cover page from this Annual Report on Form 10-K (formatted in Inline XBRL and contained in Exhibit 101) |
† | Management contract of compensatory plan or arrangement |
_____________
*Filed herewith
†Management contract of compensatory plan or arrangement
#Certain exhibits and schedules have been omitted pursuant to Item 601(b)(2) of Regulation S-K. Moody’s hereby undertakes to furnish supplemental copies of any of the omitted exhibits and schedules upon request by the Securities and Exchange Commission.
ITEM 16 FORM 10-K SUMMARY
None.
SIGNATURES
Pursuant to the requirements of Section 13 or 15(d) of the Securities Exchange Act of 1934, the Registrant has duly caused this report to be signed on its behalf by the undersigned, thereunto duly authorized. | | |
| MOODY’S CORPORATION |
| (Registrant) |
|
| By: /s/ ROBERT FAUBER |
|
| Robert Fauber |
| President and Chief Executive Officer |
Date: February 18, 2022
Pursuant to the requirements of the Securities Exchange Act of 1934, this report has been signed below by the following persons on behalf of the Registrant and in the capacities and on the date indicated.
| | | | | |
124/s/ ROBERT FAUBER | /s/ KATHRYN M. HILL |
| Robert Fauber, | MOODY’S 2017 10-KKathryn M. Hill, |
| President and Chief Executive Officer | Director |
| (principal executive officer) | |
| |
| |
| /s/ MARK KAYE | /s/ LLOYD W. HOWELL, JR. |
| Mark Kaye, | Lloyd W. Howell, Jr., |
| Executive Vice President and Chief Financial Officer | Director |
| (principal financial officer) | |
| |
| |
| /s/ CAROLINE SULLIVAN | /s/ RAYMOND W. MCDANIEL, JR. |
| Caroline Sullivan, | Raymond W. McDaniel, Jr., |
| Senior Vice President and Corporate Controller | Chairman |
| (principal accounting officer) | |
| |
| |
| /s/ JORGE A. BERMUDEZ | /s/ LESLIE F. SEIDMAN |
| Jorge A. Bermudez, | Leslie F. Seidman, |
| Director | Director |
| |
| |
| /s/ THÉRÈSE ESPERDY | /s/ ZIG SERAFIN |
| Thérèse Esperdy, | Zig Serafin, |
| Director | Director |
| |
| |
| /s/ VINCENT A. FORLENZA | /s/ BRUCE VAN SAUN |
| Vincent A. Forlenza, | Bruce Van Saun, |
| Lead Independent Director | Director |
| |
| |
| Date: February 18, 2022 |