|
For the fiscal year ended December 31, 2018
OR
|
For the transition period fromto
Commission File Number:0-26486
Auburn National Bancorporation, Inc.
(Exact name of registrant as specified in charter)
Registrant’s telephone number, including area code: (334)821-9200
Securities registered pursuant to Section 12 (b) of the Act:
|
| |
Securities registered to Section 12(g) of the Act:None
Indicate by check mark if the registrant is a well-known seasoned issuer, as defined in Rule 405 of the Securities Act. Yes ☐ No ☑
Indicate by check mark if the registrant is not required to file reports
Indicate by check mark whetherSecurities Exchange
Indicate by check mark whether the registrant has submitted electronically every Interactive Data File required to be submitted pursuant to Rule 405 of Regulation S-T (§ 232.405 of this chapter) during the preceding 12 months (or for such shorter period that the registrant
Indicate by check mark if disclosure of delinquent filers pursuant to Item 405 ofRegulation S-K (Section 229.405 of this chapter) is not contained herein, and will not be contained, to the best of registrant’s knowledge, in definitive proxy or information statements incorporated by reference in Part III of this Form10-K or any amendment to this Form10-K. ☑
(Check one):
2020.
8, 2021.
portfolio reviews;
the effects of war or other conflicts, acts of terrorism or other catastrophic events that may affect general economic conditions;
cyber-attacks and data breaches that may compromise our
systems, our vendor systemsor customers’the failure of assumptions and estimates, as well as differences in, and changes to, economic, market and credit conditions, including changes in borrowers’ credit risks and payment behaviors from those used in our loan portfolio stress tests and other evaluations;
●
The Company directly owned all the common equity in Auburn National Bancorporation Capital Trust I (the “Trust”), a Delaware statutory trust, which was formed in 2003 for the purpose
”
In
On January 30, 2020, the Federal Reserve adopted
new rules, effective September 30, 2020 simplifyingPublic Law113-250 was enacted on December 18, 2014. This law directed
The Economic Growth, Regulatory Relief and Consumer Protection Act (P.L.115-174) (the “2018 Growth Act”) became law on May 24, 2018. The Growth Act directed the Federal Reserve to further raise the Small BHC Policy’s consolidated asset threshold from $1 billion to $3 billion. The Federal Reserve issued an interim final rule implementing this change effective August 30, 2018.
The Federal Reserve has confirmed in 2018 that the Company is
The CRA performance of a banking organization’s depository institution subsidiaries is considered by the Federal Reserve and other applicable Federal bank regulators in connection with bank holding company and bank mergers and acquisition and branch applications. A less than satisfactory CRA rating will slow, if not preclude, acquisitions, and new banking centers and other expansion activities and will prevent a bank holding company from becoming a financial holding company.
As a result of the GLB Act,
rules.
Other Laws
Economic Security Act (“CARES
Act”) was enacted on March 27, 2020. Section 4013 ofNew federal
Under
The USA PATRIOT Act requiresreasonably designed” AML/BSA program
the development of internal policies, procedures,which require additional customer screening and controls;
the designation of a compliance officer;
an ongoing employee training program;
an independent audit function to test the programs; and
ongoing customer due diligenceOther Laws and monitoring.
and Repurchases of
Capital InstrumentsUnder
or “HVCRE” changes in Section 214
of the 2018 Growth Act.The new rules defineRule
The federal bank regulators have authority to require additional capital.
The Dodd–Frank Act significantly modified the capital rules applicable to the Company and required increased capital, generally.
The generally applicable prompt corrective action leverage and risk-based capital standards (the “generally applicable standards”), including the types of instruments that may be counted as Tier 1 capital, will be applicable on a consolidated basis to depository institution holding companies (except for companies subject to the Small BHC Policy), as well as their bank and thrift subsidiaries.
The generally applicable standards in effect prior to the Dodd-Frank Act will be “floors” for the regulators’ capital standards.
Bank holding companies with assets of less than $15 billion as of December 31, 2009, will be permitted to include trust preferred securities that were issued before May 19, 2010, as Tier 1 capital, but trust preferred securities issued by a bank holding company (other than those with assets of less than $1 billion that meet the Federal Reserve’s “qualitative standards” under the Small BHC Policy) after May 19, 2010, will no longer count as Tier 1 capital.
Information concerning the Company’s and the Bank’s regulatory capital ratios at December 31, 2018 is included in Note 18 of the consolidated financial statements that accompany this report.
Depository institutions that are “adequately capitalized” for bank regulatory
purposes must receive a waiver from the FDICBasel III Capital Rules
The Federal Reserve and the other bank regulators adopted in June 2013 final capital rules for bank holding companies and banks implementing the Basel Committee on Banking Supervision’s “Basel III: A Global Regulatory Framework for more Resilient Banks and Banking Systems.” These new U.S. capital rules are called the “Basel III Capital Rules,” and generally werefully phased-in on January 1, 2019.
The Basel III Capital Rules limit Tier 1 capital to common stock and noncumulative perpetual preferred stock, as well as certain qualifying trust preferred securities and cumulative perpetual preferred stock issued before May 19, 2010, each of which were grandfathered in Tier 1 capital for bank holding companies with less than $15 billion in assets. The Basel III Capital Rules also introduced a new capital measure, “Common Equity Tier I Capital” or “CET1.” CET1 includes common stock and related surplus, retained earnings and, subject to certain adjustments, minority common equity interests in subsidiaries. CET1 is reduced by deductions for:
Goodwill and other intangibles, other than mortgage servicing assets (“MSRs”), which are treated separately, net of associated deferred tax liabilities (“DTLs”);
Deferred tax assets (“DTAs”) arising from operating losses and tax credit carryforwards net of allowances and DTLs;
Gains on sale from any securitization exposure; and
Defined benefit pension fund net assets (i.e., excess plan assets), net of associated DTLs.
The Company made aone-time election in 2015 and, as a result, CET1 will not be adjusted for certain accumulated other comprehensive income (“AOCI”).
Additional “threshold deductions” of the following that are individually greater than 10% of CET1 or collectively greater than 15% of CET1 (after the above deductions are also made):
MSAs, net of associated DTLs;
DTAs arising from temporary differences that could not be realized through net operating loss carrybacks, net of any valuation allowances and DTLs; and
Significant common stock investments in unconsolidated financial institutions, net of associated DTLs.
Noncumulative perpetual preferred stock, Tier 1 minority interest not included in CET1, subject to limits, and current Tier 1 capital instruments issued to the U.S. Treasury, including shares issued pursuant to the TARP or SBLF programs, will qualify as additional Tier I capital. All other qualifying preferred stock, subordinated debt and qualifying minority interests will be included in Tier 2 capital.
In addition to the minimum risk-based capital requirements, a new “capital conservation buffer” of CET1 capital of at least 2.5% of total risk weighted assets, will be required. The capital conservation buffer will be calculated as thelowest of:
the banking organization’s CET1 capital ratio minus 4.5%;
the banking organization’s tier 1 risk-based capital ratio minus 6.0%; and
the banking organization’s total risk-based capital ratio minus 8.0%.
In 2018, the capital conservation trigger was 1.875% or less.
Full compliance with the capital conservation buffer is required by January 1, 2019. At such time, permissible dividends, stock repurchases and discretionary bonuses will be limited to the following percentages based on the capital conservation buffer as calculated above, subject to any further regulatory limitations, including those based on risk assessments and enforcement actions:
| ||||
| ||||
| ||||
| ||||
| ||||
| ||||
The various capital elements and total capital under the Basel III Capital Rules, at January 1, 2018 were and as fully phased in on January 1, 2019 are:
| January 1, 2018 | Fully Phased In January 1, 2019 | |||
Minimum CET1 | 4.50% | 4.50% | ||
CET1 Conservation Buffer | 1.875% | 2.50% | ||
Total CET1 | 6.375% | 7.0% | ||
Deductions from CET1 | 100% | 100% | ||
Minimum Tier 1 Capital | 6.0% | 6.0% | ||
Minimum Tier 1 Capitalplus conservation buffer | 7.875% | 8.5% | ||
Minimum Total Capital | 8.0% | 8.0% | ||
Minimum Total Capitalplus conservation buffer | 9.875% | 10.5% | ||
Changes in Risk-Weightings
The Basel III Capital Rules significantly change the risk weightings used to determine risk weighted capital adequacy. Among various other changes, the Basel III Capital Rules apply a 250% risk-weighting to MSRs, DTAs that cannot be realized through net operating loss carry-backs and significant (greater than 10%) investments in other financial institutions. A 150% risk-weighted category applies to “high volatility commercial real estate loans,” or “HVCRE,” which are credit facilities for the acquisition, construction or development of real property, excludingone-to-four family residential properties or commercial real estate projects where: (i) theloan-to-value ratio is not in excess of interagency real estate lending standards; and (ii) the borrower has contributed capital equal to not less than 15% of the real estate’s “as completed” value before the loan was made.
The Basel III Capital Rules also changed some of the risk weightings used to determine risk-weighted capital adequacy. Among other things, the Basel III Capital Rules:
Assigned a 250% risk weight to MSRs;
Assigned up to a 1,250% risk weight to structured securities, including private label mortgage securities, trust preferred CDOs and asset backed securities;
Retained existing risk weights for residential mortgages, but assign a 100% risk weight to most commercial real estate loans and a 150% risk-weight for HVCRE;
Assigned a 150% risk weight to past due exposures (other than sovereign exposures and residential mortgages);
Assigned a 250% risk weight to DTAs, to the extent not deducted from capital (subject to certain maximums);
Retained the existing 100% risk weight for corporate and retail loans; and
Increased the risk weight for exposures to qualifying securities firms from 20% to 100%.
HVCRE loans currently have a risk weight of 150%. Section 214 of the 2018 Growth Act, restricts the federal bank regulators from applying this risk weight except to certain ADC loans. The federal bank regulators issued a notice of a proposed rule on September 18, 2018 to implement Section 214 of the 2018 Growth Act, by revising the definition HVCRE. If this proposal is adopted, it is expected that this proposal could reduce the Company’s risk weighted assets and thereby may increase the Company’s risk-weighted capital.
Illustrations of Current Prompt Corrective Action Rules
Under the Basel III Capital Rules, the prompt corrective action rules and categories changed as of January 1, 2015. The following illustrates the current range of well capitalized, to undercapitalized, to critically undercapitalized categories. The adequately capitalized and significantly undercapitalized categories are not included in the following illustration.
| ||||
| ||||
| ||||
| ||||
| ||||
| ||||
| ||||
| ||||
| ||||
| ||||
| ||||
Section 201 of the 2018 Growth Act provides that banks and
bank holding companies with consolidated assets of less thanThe Financial Accounting Standards Board (“FASB”) has adopted ASU2016-13 “Financial Instruments – Credit Losses” which applies a current expected credit losses (“CECL”) model to financial instruments. It is effectiveremain well-capitalized for fiscal years after December 31, 2019 for the Company and other public companies. The CECL may affect the amount, timing and variability of the Company’s credit charges, and therefore its net income and regulatory capital. The Federal Reserve and other federal bank regulators adopted a three-yearphase-in of CECL’s effects on regulatory capital on December 21, 2018 (the “CECL CapitalPhase-In”).
purposes.
The
enhances other Small
| ||||||||
|
|
|
| |||||
|
|
|
| |||||
|
|
|
| |||||
PPP
andIn addition, all FDIC-insured institutions are required to pay a pro rata portion of the interest due on FICO bonds, which mature during 2017 through 2019. FICO assessments are set by the FDIC quarterly on each institution’s FDIC Assessment Base. The FICO Assessment rate was 0.560 basis points in the first quarter of 2017, and 0.540 basis points through December 31, 2017. FICO assessments have been set at 0.460 basis points in the first quarter of 2018, 0.440 basis points in the second quarter of 2018 and 0.320 basis points for the third and fourth quarters of 2018. FICO assessments of approximately $40 thousand and $20 thousand were paid to the FDIC in 2017 and 2018, respectively. The FICO assessments should continue to decline through 2019 when the last FICO bonds mature and such assessments end.
The federal bank regulators continue to look at the risks of various assets and asset categories and risk management. In December 2015, the Federal Reserve and other bank regulators issued an interagency statement to highlight prudent risk management practices from existing guidance that regulated financial institutions should implement along with maintaining capital levels commensurate with the level and nature of their CRE concentration risk.
Financial Stability Oversight Council
The Dodd-Frank Act created the Financial Stability Oversight Council or “FSOC”, which is chaired by the Secretary of the Treasury and composed of representatives from various financial services regulators. The FSOC has responsibility for identifying risks and responding to emerging threats to financial stability.
Other
The Dodd-Frank Act requires an estimated240-300 rulemakings and an estimated 130 studies. Many of these rules and studies have been completed. Generally, the Dodd-Frank Act and the related rules are complex, have increased our compliance costs, as well as costs imposed on the markets and on others with whom we do business. Many of the rules lack authoritative interpretative guidance from the applicable government agencies.
Credit Ratings
The Dodd-Frank Act includes a number of provisions that are targeted at improving the reliability of credit ratings. The federal bank regulators and the SEC have adopted rules to implement the Securities Act’s requirement to delete references to rating agency ratings for various purposes, including “investment securities,” which are permissible bank investments.
Derivatives
The Dodd-Frank Act requires a new regulatory system for the U.S. market for swaps and otherover-the counter derivatives, which includes strict capital and margin requirements, central clearing of standardizedover-the-counter derivatives, and heightened supervision ofover-the-counter derivatives dealers and major market participants. These rules likely have increased the costs and collateral required to utilize derivatives, that we may determine are useful to reduce our interest rate and other risks.
The
regulation.
•
•
On July 6, 2018,
We are evaluating the 2018 Growth Act and its likely effects on us. We believe it will facilitatehas positively affected our business, subject to its interpretation and implementation by our regulators. business.
On December 21, 2018, the federal banking agencies issued for public comment a proposal that would amend the Volcker rule consistent with the
In addition,
funding and customer needs.
|
We are exposed to the U.S. economy and market conditions generally. Local employment and local economic conditions may be affected increasingly because of the growth of automobile manufacturing and related suppliers located in our markets and nearby. These businesses are adversely affected by higher interest rates and experience cyclicality of sales.
We expect
The Federal Reserve adopted in September 2014 a normalization of monetary policy (the “Federal Reserve Normalization Policy”), which includes gradually raising the Federal Reserve’s target range for the Federal Funds rate to more normal levels and gradually reducing the Federal Reserve’s holdings of U.S. government and agency securities. The Federal Reserve’s target Federal Funds rate has increased nine times since December 2015 in 25 basis point increments from 0.25% to 2.50% on December 20, 2018. Although the Federal Reserve considers the target Federal Funds rate its primary means of monetary policy normalization, in September 2017, it also began reducing its securities holdings by not reinvesting the principal of maturing securities, subject to certain monthly caps on amounts not reinvested. Such reduction may also push interest rates higher and reduce liquidity in the financial system. Since its December 2018 increase in the target Federal Funds rate of 25 basis points, the Federal Reserve has expressed that it will remain patient in raising rates in 2019 and has indicated that it is evaluating its securities sales and the target size of the Federal Reserve’s securities portfolio in light of its inflation and employment goals, subject to domestic or global events. The nature and timing of anyfuture changes in monetary and fiscal policies and
Our ability to borrow from and engage in other business with other financial institutions on favorable terms or at all could be adversely affected by disruptions in the capital markets or other events, including, among other things, investor expectations and changes in regulations.
Failures of other financial institutions in our markets and increasing consolidation of financial services companies as a result of market conditions could increase our deposits and assets and necessitate additional capital, and could have unexpected adverse effects upon us and our business.
The “Volcker Rule,” including final regulations adopted in December 2013, may affect us adversely by reducing market liquidity and securities inventories at those institutions where we buy and sell securities for our portfolio and increasing thebid-ask spreads on securities we purchase or sell. These rules have decreased the range of permissible investments, such as certain collateralized loan obligation (“CLO”) interests, which we could otherwise use to diversify our assets and for asset/liability management. The 2018 Growth Act removed Volcker Rule restrictions generally on banks under $10 billion in assets, and the federal banking agencies have asked for public comment on a proposal that is intended to simplify and tailor compliance requirements relating to the Volcker Rule.
The soundness of other financial institutions could adversely affect us.
We have exposure to many different industries and counterparties, and routinely execute transactions with counterparties in the financial services industry, including brokers and dealers, central clearinghouses, commercial banks, and investment funds, our correspondent banks and other financial institutions. Our ability to engage in routine investment and banking transactions, as well as the quality and values of our investments in equity securities and obligations of other financial institutions, could be adversely affected by the actions, financial condition, and profitability of such other financial institutions with which we deal, including, without limitation, the FHLB and our correspondent banks. At December 31, 2018, the amortized cost of the Bank’s investments in FHLB and our correspondent bank’s common stock was approximately $1.1 million. Financial services institutions are interrelated as a result of shared credits, trading, clearing, counterparty and other relationships. As a result, defaults by, or even rumors or questions about, one or more financial institutions, or the financial services industry generally, have led to market-wide liquidity problems, losses of depositor, creditor or counterparty confidence in certain institutions and could lead to losses or defaults by other institutions, and in some cases, failure of such institutions. Any losses, defaults by, or failures of, the institutions we do business with could adversely affect our holdings of the debt of and equity in, such other institutions, our participation interests in loans originated by other institutions, and our business, including our liquidity, financial condition and earnings.
Nonperforming and similar assets take significant time to resolveand may adversely affect our results ofoperations and
At December 31, 2018, our nonaccrual
been determined.
Notwithstanding changes made by the 2018 Growth Act, the effects of the CFPB changes to
Increasing interest rates
The Federal National Mortgage Association (“
Significant ongoing disruptions in the secondary market for residential mortgage loans have limited the market for and liquidity of most mortgage loans other than conforming Fannie Mae, Freddie Mac, and FHA loans. Declines in real estate values, low home sales volumes, financial stress on borrowers as a result of job losses or reduced incomes, interest rate increases, generally, including resets on adjustable rate mortgage loans, maturities of second lien mortgages or other factors have adversely affected borrowers during recent years. Higher interest rate and changes in mortgage loan rules, could result in fewer mortgage originations, higher delinquencies and greater charge-offs in future periods, as well as increased regulation capital requirement which would adversely affect our financial condition, including capital and liquidity, andbusinesses, our results of operations. In operations and
Fannie Mae and Freddie Mac restructuring may
Fannie Mae and Freddie Mac remain in conservatorship, and although legislation has been introduced at various times to restructure Fannie Mae and Freddie Mac to take them out of conservatorship and substantially change the way they conduct business
In February 2018, Fannie Mae reported that the 2017 Tax Act had reduced its DTAs, and that it had a net worth deficit of $3.7 billion as of December 31, 2017. To eliminate its net worth deficit, the Treasury Department provided Fannie Mae with $3.7 billion of capital in the first quarter of 2018. Fannie Mae reported that it had a net worth of $6.2 billion as of December 31, 2018. Freddie Mac had a net worth deficit of $312 million at December 31, 2017, and the Treasury Department provided Freddie Mac with $312 million of capital in the first quarter of 2018. Freddie Mac reported that it had a net worth of $4.5 billion as of December 31, 2018.
Since Fannie Mae and Freddie Mac dominate the residential mortgage markets, any changes in their structure and operations,banking transactions, as well as their respective capital,the quality and
earnings.
Our ability to realize our deferred tax assets may be reduced in the future if our estimates of future taxable income from our operations and tax planning strategies do not support this amount, and the amount of net operating loss carry-forwards realizable for income tax purposes may be reduced under Section 382 of the Internal Revenue Code by sales
We are allowedtotal loans were CRE
COVID-19.
conditions.
Our cost
Although the Federal Reserve has raised the target Federal Funds rate nine times between December 2015 and January 2018 and has been selling securities in accordance with efforts to normalize monetary policy, the Federal Reserve has kept interest rates low over recent years, and the federal government continues large deficit spending. Our costs of funds may increase as a result of general economic conditions, interest rates and competitive pressures, andprices for potential inflation resulting from government deficit spending, the effects of the 2017 Tax Act and monetary policies. Traditionally, we have obtained funds principally through local deposits and borrowings from other institutional lenders. Generally, acquisitions that
Our profitability and liquidity may be affected by changes in interest rates and interest rate levels, the shape of the yield curve and economic conditions.
Our profitability depends upon net interest income, which is the difference between interest earned on interest-earning assets, such as loans and investments, and interest expense on interest-bearing liabilities, such as deposits and borrowings. Net interest income will be adversely affected if market interest rates change where the interest we pay on deposits and borrowings increases faster than the interest earned on loans and investments. Interest rates, and consequently our results of operations, are affected by general economic conditions (domestic and institutional) and fiscal and monetary policies, as well as expectations of these rates and policies and the shape of the yield curve. Our income is primarily driven by the spread between these rates. As a result, a steeper yield curve, meaning long-term interest rates are significantly higher than short-term interest rates, would provide the Bank with a better opportunity to increase net interest income. Conversely, a flattening yield curve could pressure our net interest margin as our cost of funds increases relative to the spread we can earn on our assets. In addition, net interest income could be affected by asymmetrical changes in the different interest rate indexes, given that not all of our assets or liabilities are priced with the same index. The normalization of the Federal Reserve’s monetary policy, which is gradually increasing the Federal Reserve’s target Federal Funds rates and decreasing the Federal Reserve’s holdings of securities, may have unpredictable effects on the shape of the yield curve and longer term interest rates.
The production of mortgages and other loans and the value of collateral securing our loans, are dependent on demand within the markets we serve, as well as interest rates.
Increases in interest rates generally decrease the market values of fixed-rate, interest-bearing investments and loans held, the value of mortgage and other loans produced and the value of loans sold, mortgage loan activities and the collateral securing our loans, and therefore may adversely affect our liquidity and earnings, to the extent not offset by potential increases in our net interest margin and the value of our mortgage servicing rights.
The 2017 Tax Act, including its limitations on the deductibility of residential mortgage interest, state and local taxes and business interest expenses and other changes, could have mixed effects on economic activity and reduce the demand for loans and increase competition among lenders for loans. This Act could promote inflation and higher interest rates, including as a result of increased fiscal deficits.
The Company is an entity separate and distinct from the Bank.
The Company is an entity separate and distinct from the Bank. Company transactions with the Bank are limited by Sections 23A and 23B of the Federal Reserve Act and Federal Reserve Regulation W. We depend upon the Bank’s earnings and dividends, which are limited by law and regulatory policies and actions, for cash to pay the Company’s debt and corporate obligations, and to pay dividends to our shareholders. If the Bank’s ability to pay dividends to the Company was terminated or limited, the Company’s liquidity and financial condition could be materially and adversely affected.
Liquidity risks could affect operations and jeopardize our financial condition.
Liquidity is essential to our business. An inability to raise funds through deposits, borrowings, proceeds from loan repayments or sales proceeds from, maturing loans and securities, and other sources could have a substantial negative effect on our liquidity. Our funding sources include federal funds purchased, securities sold under repurchase agreements, core andnon-core deposits, and short- and long-term debt. We maintain a portfolio of securities that can be used as a source of liquidity. We are also members of the FHLB and the Federal Reserve Bank of Atlanta, where we can obtain advances collateralized with eligible assets. There are other sources of liquidity available to the Company or the Bank should they be needed, including our ability to acquire additionalnon-core deposits. We may be able, depending upon market conditions, to otherwise borrow money or issue and sell debt and preferred or common securities in public or private transactions. Our access to funding sources in amounts adequate to finance or capitalize our activities on terms which are acceptable to us could be impaired by factors that affect us specifically or the financial services industry or the economy in general. Our ability to borrow or obtain funding, if General conditions that are not specific to us, such as disruptions in the financial markets or negative views and expectations about the prospects for the financial services industry could adversely affect us.
Weattractive.Also, acquisitions are subject to extensive regulation that could limit or restrict our activities and adversely affect our earnings.
We and our subsidiaries are regulated by several regulators, including the Federal Reserve, the Alabama Superintendent, the SEC and the FDIC. Our success is affected by state and federal regulations affecting banks and bank holding companies, and the securities markets, and our costs of compliance could adversely affect our earnings. Banking regulations are primarily intended to protect depositors, and the FDIC Deposit Insurance Fund (“DIF”), not shareholders. The financial services industry also is subject to frequent legislative andvarious regulatory changes and proposed changes. In addition, the interpretations of regulations by regulators may change and statutes may be enacted with retroactive impact. From time to time, regulators raise issues during examinations of us which, if not determined satisfactorily, could have a material adverse effect on us. Compliance with applicable laws and regulations is time consuming and costly and may affect our profitability.
The current President and members of his political party in Congress have promoted and supported regulatory relief for the banking industry. The nature, effects and timing of administrative and legislative change, including the 2018 Growth Act, and possible changes in regulations or regulatory approach, as a result of a Democrat-controlled House of Representatives elected in 2018, cannot be predicted. The federal bank regulators and the Treasury Department, as well as the Congress and the President, are evaluating the regulation of banks, other financial services providers and the financial markets and such changes, if any, could require us to maintain more capital and liquidity, and restrict our activities, which could adversely affect our growth, profitability and financial condition. Our consumer finance products, including residential mortgage loans, are subject to CFPB regulations and evolving standards reflecting CFPB releases, rule-making and enforcement actions.
Changes in accounting and tax rules applicable to banks could adversely affect our financial conditions and results of operations.
From time to time, the FASB and the SEC change the financial accounting and reporting standards that govern the preparation of our financial statements. These changes can be difficult to predict and can materially impact how we record and report our financial condition and results of operations. In some cases, we could be required to apply a new or revised standard retroactively, resulting in us restating prior period financial statements.TheFASB’s new guidance under ASUNo. 2016-13 includes significant changes to the manner in which banks’ allowance for loan losses will be calculated beginning January 1, 2020. Instead of using historical losses, the CECL model will be forward-looking with respect to expected losses over the life of loans and other instruments, and could materially affect our results of operations and financial condition, including the variability of our results of operations and our regulatory capital, notwithstanding a three-yearphase-in of CECL for regulatory capital purposes.
The 2017 Tax Act may have adverse effects on certain of our customers and our businesses.
The 2017 Tax Act will benefit the Bank by reducing the maximum U.S. corporate income tax rate on its taxable income from 35% to 21%. This benefit may be diminished by the complexity, uncertainty and possible adverse effects of this legislation on certain of our borrowers, including limitations on the deductibility of:
residential mortgage interest;
state and local taxes, including property taxes; and
business interest expenses.
These changes may adversely affect borrowers’ cash flows and the values and liquidity of collateral we hold to secure our loans. Fewer borrowers may be able to meet the CFPB’s “ability to repay” standards under the Truth in Lending Act and CFPB regulations, which include the borrower’s ability to pay taxes and assessments. Demand for loans by qualified borrowers could be reduced, and therefore competition among lenders could increase. Customer behaviors toward incurring and repaying debt could also change as a result of the 2017 Tax Act. As a result, the 2017 Tax Act could materially and adversely affect our business and results of operations, at least before taking into account our lower U.S. corporate income tax rate.
We are required to maintain capital to meet regulatory requirements, and if we fail to maintain sufficient capital, our financial condition, liquidity and results of operations would be adversely affected.
We and the Bank must meet regulatory capital requirements and maintain sufficient liquidity, including liquidity at the Company, as well as the Bank. If we fail to meet these capital and otherreceive the appropriate regulatory requirements, including more rigorous requirements arising from our regulators’ implementation of Basel III, our financial condition, liquidity and results of operations would be materially and adversely affected. Our failure to remain “well capitalized” and “well managed”, including meeting the Basel III capital conservation buffers, for bank regulatory purposes could affect customer confidence, our ability to grow, our costs of funds and FDIC insurance, our ability to raise brokered deposits, our ability to pay dividends on our common stock and our ability to make acquisitions, and
losses and/or increases in the Bank’s credit risk assets and expected losses resulting from the deterioration in the creditworthiness of borrowers and the issuers of equity and debt securities;
difficulty in refinancing or issuing instruments upon redemption or at maturity of such instruments to raise capital under acceptable terms and conditions;
declines in the value of our securities portfolios;
revisions to the regulations or their application by our regulators that increase our capital requirements;
reductions in the value of our DTAs; and other adverse developments; and
unexpected growth and an inability to increase capital timely.
A failure to remain “well capitalized,” for bank regulatory purposes, including meeting the Basel III Capital Rule’s conservation buffer, could adversely affect customer confidence, and our:
ability to grow;
the costs of and availability of funds;
FDIC deposit insurance premiums;
ability to raise or replace brokered deposits;
ability to make acquisitions or engage in new activities;
flexibility if we become subject to prompt corrective action restrictions;
ability to make discretionary bonuses to attract and retain quality personnel;
ability to make payments of principal and interest on our capital instruments; and
ability to pay dividends on our capital stock.
The Dodd-Frank Act restricts our future issuance of trust preferred securities and cumulative preferred securities as eligible Tier 1 risk-based capital for purposes of the regulatory capital guidelines for bank holding companies.
We repurchased and retired all our outstanding trust preferred securities in 2018, and the Dodd-Frank Act does not permit us to issue new trust preferred securities as Tier 1 capital. Accordingly, should we determine it is advisable, or should our regulators require us, based upon new capital or liquidity regulations or otherwise, to raise additional Tier 1 risk-based capital, we wouldwill not be able to issue additional trust preferred securities. Underconsummate an acquisition that
We may need to raise additional capital in the future, but that capital may not be available when it is needed or on favorable terms.
We anticipate that our current capital resources will satisfy our capital requirements for the foreseeable future under currently effective rules. We may, however, need to raise additional capital to support our growth or currently unanticipated losses, or to meet the needsearnings and shareholders’
common stock.
exposure to potential asset quality issues with acquired institutions;
●
Attractive acquisition opportunities may not be available to us in the future.
While we seek continued organic growth, we also may consider the acquisition
that
As a banking enterprise, we
We mayoperations could be unable to attractmaterially and retain key people to support our business.
Our success depends, in large part, on our ability to attract and retain key people. We compete with other financial services companies for people primarily on the basis of compensation, support services and financial position. Intense competition exists for key employees with demonstrated ability, and we may be unable to hire or retain such employees. Effective succession planning is also important to our long-term success. The unexpected loss of services of one or more of our key personnel and failure to ensure effective transfer of knowledge and smooth transitions involving key personnel could have a material adverse effect on our business due to loss of their skills, knowledge of our business, their years of industry experience and the potential difficulty of promptly finding qualified replacement employees.
Proposed rules implementing the executive compensation provisions of the Dodd-Frank Act may limit the type and structure of compensation arrangements into which we may enter with certain of our employees and officers. In addition, proposed rules under the Dodd-Frank Act would prohibit the payment of “excessive compensation” to our executives. These restrictions could negatively affect our ability to compete with other companies in recruiting and retaining key personnel.
adversely
or limit future
dividends.A substantial legal liability or a significant federal, state or other regulatory action against us, as well as regulatory inquiries or investigations, could harm our reputation, result in material fines or penalties, result in significant legal costs, divert management resources away from our business, and otherwise have a material adverse effect on our ability to expand on our existing business, financial condition and results of operations. Even if we ultimately prevail in the litigation, regulatory action or investigation, our ability to attract new customers, retain our current customers and recruit and retain employees could be materially and adversely affected. Regulatory inquiries and litigation may also adversely affect the prices or volatility of our securities specifically, or the securities of our industry, generally.
The Federal Reserve may require us to commit capital resources to support the Bank.
As a matter of policy, the Federal Reserve, which examines us, expects a bank holding company to act as a source of financial and managerial strength to a subsidiary bank and to commit resources to support such subsidiary bank. The Federal Reserve may require a bank holding company to make capital injections into a troubled subsidiary bank. In addition, the Dodd-Frank Act amended the Federal Deposit Insurance Corporation Act to require that all companies that control a FDIC-insured depository institution serve as a source of financial strength to their depository institution subsidiaries. Under this requirement, we could be required to provide financial assistance to the Bank should it experience financial distress, even if further investment was not otherwise warranted. See “Supervision and Regulation.”
|
The
lease to third
|
|
|
| Closing Price Per Share (1) | Cash Dividends Declared | |||||||||||
High | Low | |||||||||||
2018 | ||||||||||||
First Quarter | $ 39.25 | $ 35.50 | $ 0.24 | |||||||||
Second Quarter | 50.99 | 37.40 | 0.24 | |||||||||
Third Quarter | 53.50 | 38.31 | 0.24 | |||||||||
Fourth Quarter | 41.50 | 28.88 | 0.24 | |||||||||
2017 | ||||||||||||
First Quarter | $ 33.69 | $ 30.75 | $ 0.23 | |||||||||
Second Quarter | 37.79 | 32.65 | 0.23 | |||||||||
Third Quarter | 37.71 | 34.82 | 0.23 | |||||||||
Fourth Quarter | 40.25 | 33.25 | 0.23 | |||||||||
(1) The price information represents actual transactions. |
| |||||||||||
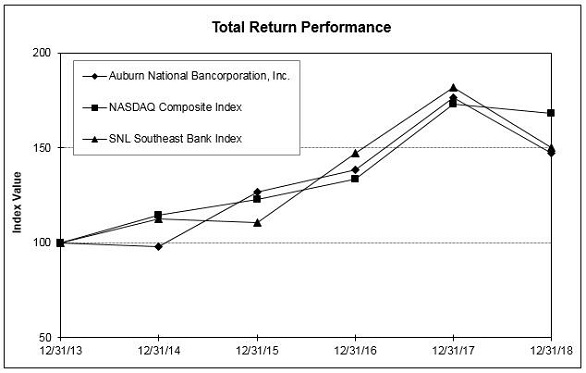
| Period Ending | ||||||||||||||||||||||||
| Index | 12/31/13 | 12/31/14 | 12/31/15 | 12/31/16 | 12/31/17 | 12/31/18 | ||||||||||||||||||
Auburn National Bancorporation, Inc. | 100.00 | 97.93 | 126.92 | 138.44 | 176.60 | 147.15 | ||||||||||||||||||
NASDAQ Composite | 100.00 | 114.75 | 122.74 | 133.62 | 173.22 | 168.30 | ||||||||||||||||||
SNL Southeast Bank | 100.00 | 112.63 | 110.87 | 147.18 | 182.06 | 150.42 | ||||||||||||||||||
Not applicable.
| Year ended December 31 | ||||||||||
| (Dollars in thousands, except per share data) | 2018 | 2017 | ||||||||
Net interest income (a) | $ | 26,183 | $ | 25,731 | ||||||
Less:tax-equivalent adjustment | 613 | 1,205 | ||||||||
Net interest income (GAAP) | 25,570 | 24,526 | ||||||||
Noninterest income | 3,325 | 3,441 | ||||||||
Total revenue | 28,895 | 27,967 | ||||||||
Provision for loan losses | — | (300 | ) | |||||||
Noninterest expense | 17,874 | 16,784 | ||||||||
Income tax expense | 2,187 | 3,637 | ||||||||
Net earnings | $ | 8,834 | $ | 7,846 | ||||||
Basic and diluted net earnings per share | $ | 2.42 | $ | 2.15 | ||||||
2019, in addition to a lower interest rate
0.03% in 2019.
Noninterest expense was $17.9 million compared to $16.8 million in 2017. This increase in noninterest expense was primarily due to increases in salaries and benefits expense which was offset
Company’s
headquarters in downtown Auburn.2020.
charged
-off.| Year ended December 31 | ||||||||||||||||||||
| 2018 | 2017 | |||||||||||||||||||
| (Dollars in thousands) | Average Balance | Yield/ Rate | Average Balance | Yield/ Rate | ||||||||||||||||
|
|
|
|
| ||||||||||||||||
Loans and loans held for sale | $ | 457,610 | 4.76% | $ | 442,101 | 4.70% | ||||||||||||||
Securities - taxable | 181,485 | 2.23% | 197,108 | 2.15% | ||||||||||||||||
Securities -tax-exempt (a) | 71,065 | 4.11% | 69,881 | 5.07% | ||||||||||||||||
|
|
|
|
| ||||||||||||||||
Total securities | 252,550 | 2.76% | 266,989 | 2.91% | ||||||||||||||||
Federal funds sold | 28,689 | 1.93% | 32,342 | 1.05% | ||||||||||||||||
Interest bearing bank deposits | 31,339 | 1.81% | 41,317 | 1.04% | ||||||||||||||||
|
|
|
|
| ||||||||||||||||
Total interest-earning assets | 770,188 | 3.88% | 782,749 | 3.75% | ||||||||||||||||
|
|
|
|
| ||||||||||||||||
Deposits: | ||||||||||||||||||||
NOW | 125,533 | 0.34% | 125,935 | 0.20% | ||||||||||||||||
Savings and money market | 220,810 | 0.39% | 230,121 | 0.37% | ||||||||||||||||
Certificates of deposits | 184,010 | 1.27% | 198,457 | 1.18% | ||||||||||||||||
|
|
|
|
| ||||||||||||||||
Total interest-bearing deposits | 530,353 | 0.68% | 554,513 | 0.62% | ||||||||||||||||
Short-term borrowings | 2,634 | 0.68% | 3,476 | 0.52% | ||||||||||||||||
Long-term debt | 1,022 | 4.50% | 3,217 | 3.89% | ||||||||||||||||
|
|
|
|
| ||||||||||||||||
Total interest-bearing liabilities | 534,009 | 0.69% | 561,206 | 0.64% | ||||||||||||||||
|
|
|
|
| ||||||||||||||||
Net interest income and margin (a) | $ | 26,183 | 3.40% | $ | 25,731 | 3.29% | ||||||||||||||
|
|
|
|
| ||||||||||||||||
a decline in the Company’s net interest
margin (tax-equivalent).the
significant short-term liquidity increase in customerearning assets.
Net recoveries were $33 thousand,impact of COVID-19 pandemic, including
| Year ended December 31 | ||||||||
| (Dollars in thousands) | 2018 | 2017 | ||||||
| ||||||||
Service charges on deposit accounts | $ | 749 | $ | 746 | ||||
Mortgage lending | 655 | 777 | ||||||
Bank-owned life insurance | 435 | 442 | ||||||
Securities gains, net | — | 51 | ||||||
Other | 1,486 | 1,425 | ||||||
| ||||||||
Total noninterest income | $ | 3,325 | $ | 3,441 | ||||
| ||||||||
| Year ended December 31 | ||||||||
| (Dollars in thousands) | 2018 | 2017 | ||||||
| ||||||||
Origination income | $ | 311 | $ | 504 | ||||
Servicing fees, net | 344 | 272 | ||||||
Decrease in MSR valuation allowance | — | 1 | ||||||
| ||||||||
Total mortgage lending income | $ | 655 | $ | 777 | ||||
| ||||||||
2019.
amortization expense.
| Year ended December 31 | ||||||||
| (Dollars in thousands) | 2018 | 2017 | ||||||
Salaries and benefits | $ | 10,653 | $ | 10,011 | ||||
Net occupancy and equipment | 1,465 | 1,471 | ||||||
Professional fees | 902 | 966 | ||||||
FDIC and other regulatory assessments | 310 | 346 | ||||||
Other | 4,544 | 3,990 | ||||||
| ||||||||
Total noninterest expense | $ | 17,874 | $ | 16,784 | ||||
| ||||||||
The increase in other noninterest expense was primarily due to a $0.4 million loss related to a misappropriation of assets for which the Company filed a claim with its insurance provider. In March 2019, the Company received a settlement of $0.3 million from its insurance provider related to this claim.
Income Tax Expense
Income tax expense was $2.2 million in 2018 compared to $3.6 million in 2017. The Company’s effective income tax rate was 19.84% in 2018, compared to 31.67% in 2017. The decrease was mainly due to decrease in effect tax rate related to the 2017 Tax Cuts and Jobs Act which lowered the Company’s statutory federal tax rate from 34% to 21% and required the Company to remeasure the value of its net deferred tax assets by $0.4 million as of December 31, 2017.
BALANCE SHEET ANALYSIS
Securities
Securitiesavailable-for-sale were $239.8 million at December 31, 2018, a decrease of $17.9 million, or 7%, compared to $257.7 million as of December 31, 2017. This decline reflects a decrease in the amortized cost basis
2019.
| December 31, 2018 | ||||||||||||||||||||||
| (Dollars in thousands) | 1 year
or less | 1 to 5
years | 5 to 10
years | After 10
years | Total
Fair Value | |||||||||||||||||
| ||||||||||||||||||||||
Agency obligations | $ | 14,437 | 19,865 | 16,869 | — | 51,171 | ||||||||||||||||
Agency RMBS | — | — | 8,368 | 110,230 | 118,598 | |||||||||||||||||
State and political subdivisions | — | 3,682 | 7,726 | 58,624 | 70,032 | |||||||||||||||||
| ||||||||||||||||||||||
Totalavailable-for-sale | $ | 14,437 | 23,547 | 32,963 | 168,854 | 239,801 | ||||||||||||||||
| ||||||||||||||||||||||
Weighted average yield: | ||||||||||||||||||||||
Agency obligations | 1.96% | 1.71% | 2.11% | — | 1.91% | |||||||||||||||||
Agency RMBS | — | — | 2.49% | 2.50% | 2.50% | |||||||||||||||||
State and political subdivisions | — | 3.87% | 3.02% | 3.22% | 3.23% | |||||||||||||||||
| ||||||||||||||||||||||
Totalavailable-for-sale | 1.96% | 2.05% | 2.42% | 2.75% | 2.59% | |||||||||||||||||
| ||||||||||||||||||||||
| December 31 | ||||||||||||||||||||||
|
| |||||||||||||||||||||
| (In thousands) | 2018 | 2017 | 2016 | 2015 | 2014 | |||||||||||||||||
| ||||||||||||||||||||||
Commercial and industrial | $ | 63,467 | 59,086 | 49,850 | 52,479 | 54,329 | ||||||||||||||||
Construction and land development | 40,222 | 39,607 | 41,650 | 43,694 | 37,298 | |||||||||||||||||
Commercial real estate | 261,896 | 239,033 | 220,439 | 203,853 | 192,006 | |||||||||||||||||
Residential real estate | 102,597 | 106,863 | 110,855 | 116,673 | 107,641 | |||||||||||||||||
Consumer installment | 9,295 | 9,588 | 8,712 | 10,220 | 12,335 | |||||||||||||||||
| ||||||||||||||||||||||
Total loans | 477,477 | 454,177 | 431,506 | 426,919 | 403,609 | |||||||||||||||||
Less: unearned income | (569) | (526) | (560) | (509) | (655) | |||||||||||||||||
| ||||||||||||||||||||||
Loans, net of unearned income | $ | 476,908 | 453,651 | 430,946 | 426,410 | 402,954 | ||||||||||||||||
| ||||||||||||||||||||||
2020.
Purchased loan participations included in the Company’s loan portfolio were approximately $5.4 million and $1.4 million as of December 31, 2018 and 2017, respectively. All purchased loan participations are underwritten by the Company independent of the selling bank. In addition, all loans, including purchased participations, are evaluated for collectability during the course of the Company’s normal loan review procedures. If the Company deems a participation loan impaired, it applies the same accounting policies and procedures described under “Critical Accounting Policies – Allowance for Loan Losses”.
2019.
| December 31 | ||||||||||||
|
| |||||||||||
| (In thousands) | 2018 | 2017 | ||||||||||
| ||||||||||||
Hotel/motel | $ | 47,936 | $ | 22,384 | ||||||||
Lessors of1-4 family residential properties | 46,374 | 47,323 | ||||||||||
Multi-family residential properties | 40,455 | 52,167 | ||||||||||
Shopping centers | 35,789 | 39,966 | ||||||||||
Office buildings |
| 25,421
|
|
| 24,483
|
| ||||||
| ||||||||||||
Policies.”
| Year ended December 31 | ||||||||||||||||||||||
| (Dollars in thousands) | 2018 | 2017 | 2016 | 2015 | 2014 | |||||||||||||||||
| ||||||||||||||||||||||
Allowance for loan losses: | ||||||||||||||||||||||
Balance at beginning of period | $ | 4,757 | 4,643 | 4,289 | 4,836 | 5,268 | ||||||||||||||||
Charge-offs: | ||||||||||||||||||||||
Commercial and industrial | (52 | ) | (449 | ) | (97 | ) | (100 | ) | (46 | ) | ||||||||||||
Construction and land development | — | — | — | — | (235 | ) | ||||||||||||||||
Commercial real estate | (38 | ) | — | (194 | ) | (866 | ) | — | ||||||||||||||
Residential real estate | (26 | ) | (107 | ) | (182 | ) | (89 | ) | (438 | ) | ||||||||||||
Consumer installment | (52 | ) | (40 | ) | (67 | ) | (59 | ) | (89 | ) | ||||||||||||
| ||||||||||||||||||||||
Total charge-offs | (168 | ) | (596 | ) | (540 | ) | (1,114 | ) | (808 | ) | ||||||||||||
Recoveries: | ||||||||||||||||||||||
Commercial and industrial | 70 | 461 | 29 | 22 | 71 | |||||||||||||||||
Construction and land development | — | 347 | 1,212 | 17 | 8 | |||||||||||||||||
Commercial real estate | 19 | — | — | — | 119 | |||||||||||||||||
Residential real estate | 79 | 115 | 127 | 313 | 112 | |||||||||||||||||
Consumer installment | 33 | 87 | 11 | 15 | 16 | |||||||||||||||||
| ||||||||||||||||||||||
Total recoveries | 201 | 1,010 | 1,379 | 367 | 326 | |||||||||||||||||
| ||||||||||||||||||||||
Net recoveries (charge-offs) | 33 | 414 | 839 | (747 | ) | (482 | ) | |||||||||||||||
Provision for loan losses | — | (300 | ) | (485 | ) | 200 | 50 | |||||||||||||||
| ||||||||||||||||||||||
Ending balance | $ | 4,790 | 4,757 | 4,643 | 4,289 | 4,836 | ||||||||||||||||
| ||||||||||||||||||||||
as a % of loans | 1.00 | % | 1.05 | 1.08 | 1.01 | 1.20 | ||||||||||||||||
as a % of nonperforming loans | 2,691 | % | 160 | 196 | 158 | 433 | ||||||||||||||||
Net (recoveries) charge-offs as a % of average loans | (0.01 | ) % | (0.09 | ) | (0.19 | ) | 0.18 | 0.12 | ||||||||||||||
| ||||||||||||||||||||||
Net recoveries were $33 thousand, or 0.01%, of average loans in 2018, compared to recoveries of $0.4 million, or 0.09%, in 2017.
Ouraddition our regulators, as an integral part of their examination process,
| December 31 | ||||||||||||||||||||||||
| (Dollars in thousands) | 2018 | 2017 | 2016 | 2015 | 2014 | |||||||||||||||||||
| ||||||||||||||||||||||||
Nonperforming assets: | ||||||||||||||||||||||||
Nonperforming (nonaccrual) loans | $ | 178 | 2,972 | 2,370 | 2,714 | 1,117 | ||||||||||||||||||
Other real estate owned | 172 | — | 152 | 252 | 534 | |||||||||||||||||||
| ||||||||||||||||||||||||
Total nonperforming assets | $ | 350 | 2,972 | 2,522 | 2,966 | 1,651 | ||||||||||||||||||
| ||||||||||||||||||||||||
as a % of loans and other real estate owned | 0.07 | % | 0.66 | 0.59 | 0.70 | 0.41 | ||||||||||||||||||
as a % of total assets | 0.04 | % | 0.35 | 0.30 | 0.36 | 0.21 | ||||||||||||||||||
Nonperforming loans as a % of total loans | 0.04 | % | 0.66 | 0.55 | 0.64 | 0.28 | ||||||||||||||||||
Accruing loans 90 days or more past due | $ | — | — | — | — | — | ||||||||||||||||||
| ||||||||||||||||||||||||
| December 31 | ||||||||||
| (In thousands) | 2018 | 2017 | ||||||||
| ||||||||||
Nonaccrual loans: | ||||||||||
Commercial and industrial | $ | — | 31 | |||||||
Commercial real estate | — | 2,188 | ||||||||
Residential real estate | 178 | 739 | ||||||||
Consumer installment | — | 14 | ||||||||
| ||||||||||
Total nonaccrual loans / nonperforming loans | $ | 178 | 2,972 | |||||||
| ||||||||||
Due to the weakening credit status of a borrower, the Company may elect to formally restructure certain loans to facilitate a repayment plan that minimizes the potential losses that we might incur. Restructured loans, or troubled debt restructurings (“TDRs”), are classified as impaired loans, and if the loans are on nonaccrual status as of the date of restructuring, the loans are included in the nonaccrual loan balances noted above. Nonaccrual loan balances do not include loans that have been restructured that were performing as of the restructure date.
At December 31, 2018 and 2017,2020 there were no$0.1 million in loans 90 days
The table below provides information concerning the composition of OREOinterest, compared to none at
| December 31 | ||||||||||
| (In thousands) | 2018 | 2017 | ||||||||
| ||||||||||
Other real estate owned: | ||||||||||
Residential | $ | 172 | — | |||||||
| ||||||||||
Total other real estate owned | $ | 172 | — | |||||||
| ||||||||||
2019, respectively,
the Company held no OREO properties acquired from borrowers.| December 31 | ||||||||||
| (In thousands) | 2018 | 2017 | ||||||||
| ||||||||||
Potential problem loans: | ||||||||||
Commercial and industrial | $ | 522 | 119 | |||||||
Construction and land development | 741 | 468 | ||||||||
Commercial real estate | 688 | 733 | ||||||||
Residential real estate | 4,506 | 4,253 | ||||||||
Consumer installment | 71 | 78 | ||||||||
| ||||||||||
Total potential problem loans | $ | 6,528 | 5,651 | |||||||
| ||||||||||
industrial
| December 31 | ||||||||||
| (In thousands) | 2018 | 2017 | ||||||||
| ||||||||||
Performing loans past due 30 to 89 days: | ||||||||||
Commercial and industrial | $ | 100 | 8 | |||||||
Construction and land development | 225 | — | ||||||||
Commercial real estate | — | — | ||||||||
Residential real estate | 1,740 | 1,058 | ||||||||
Consumer installment | 41 | 57 | ||||||||
| ||||||||||
Total performing loans past due 30 to 89 days | $ | 2,106 | 1,123 | |||||||
| ||||||||||
| December 31 | ||||||||||
| (In thousands) | 2018 | 2017 | ||||||||
| ||||||||||
Noninterest bearing demand | $ | 201,648 | 193,917 | |||||||
NOW | 120,769 | 146,999 | ||||||||
Money market | 161,464 | 173,251 | ||||||||
Savings | 59,075 | 55,421 | ||||||||
Certificates of deposit under $100,000 | 62,207 | 69,960 | ||||||||
Certificates of deposit and other time deposits of $100,000 or more | 108,620 | 107,711 | ||||||||
Brokered certificates of deposit | 10,410 | 10,400 | ||||||||
| ||||||||||
Total deposits | $ | 724,193 | 757,659 | |||||||
| ||||||||||
COVID-19 pandemic.
Long-term debt includes junior subordinated debentures related to trust preferred securities.
The average rates paid on long-term debt were 4.50% in 2018 and 3.89% in 2017.
2019, respectively.
all net income over the preceding four quarters.
The interim final rule only affects the capital buffers,and10.31%
at December 31, 2020.
| ||
| ||
| ||
| ||
| ||
| ||
| ||
|
2020.
| ||
| ||
| ||
| ||
| ||
| ||
| ||
|
2020.
The
repurchases.
| Payments due by period | ||||||||||||||||||||
| (Dollars in thousands) | Total | 1 year
or less | 1 to 3
years | 3 to 5
years | More than
5 years | |||||||||||||||
| ||||||||||||||||||||
Contractual obligations: | ||||||||||||||||||||
Deposit maturities (1) | $ | 724,193 | 651,319 | 45,518 | 27,356 | — | ||||||||||||||
Operating lease obligations | 718 | 152 | 161 | 120 | 285 | |||||||||||||||
| ||||||||||||||||||||
Total | $ | 724,911 | 651,471 | 45,679 | 27,476 | 285 | ||||||||||||||
| ||||||||||||||||||||
|
2020:
In 2018,
|
|
|
|
Value Measurement; and
|
Implementation Costs Incurred in a Cloud Computing Arrangement that is a Service Contract.
Information about these pronouncements is described in more detail below.
ASU2016-13,

statements, respectively, was
a decrease in net earnings ofTable 1 – Explanation ofNon-GAAP Financial Measures
In addition to results presented in accordance with GAAP, this annual report on Form10-K includes certain designated net interest income amounts presented on atax-equivalent basis, anon-GAAP financial measure, including the presentation of total revenue and the calculation of the efficiency ratio.
The Company believes the presentation of net interest income on atax-equivalent basis provides comparability of net interest income from both taxable andtax-exempt sources and facilitates comparability within the industry. Although the Company believes thesenon-GAAP financial measures enhance investors’ understanding of its business and performance, thesenon-GAAP financial measures should not be considered an alternative to GAAP. The reconciliation of thesenon-GAAP financial measures from GAAP tonon-GAAP is presented below.
| Year ended December 31 | ||||||||||||||||||||||
| (In thousands) |
2018 | 2017 | 2016 | 2015 | 2014 | |||||||||||||||||
| ||||||||||||||||||||||
Net interest income (GAAP) | $ | 25,570 | 24,526 | 22,732 | 22,718 | 21,453 | ||||||||||||||||
Tax-equivalent adjustment | 613 | 1,205 | 1,276 | 1,342 | 1,288 | |||||||||||||||||
| ||||||||||||||||||||||
Net interest income(Tax-equivalent) | $ | 26,183 | 25,731 | 24,008 | 24,060 | 22,741 | ||||||||||||||||
| ||||||||||||||||||||||
Table 2 - Selected Financial Data
| Year ended December 31 | ||||||||||||||||||||||
| (Dollars in thousands, except per share amounts) | 2018 | 2017 | 2016 | 2015 | 2014 | |||||||||||||||||
| ||||||||||||||||||||||
Income statement | ||||||||||||||||||||||
Tax-equivalent interest income (a) | $ | 29,859 | 29,325 | 28,092 | 28,495 | 28,105 | ||||||||||||||||
Total interest expense | 3,676 | 3,594 | 4,084 | 4,435 | 5,364 | |||||||||||||||||
| ||||||||||||||||||||||
Tax equivalent net interest income (a) | 26,183 | 25,731 | 24,008 | 24,060 | 22,741 | |||||||||||||||||
| ||||||||||||||||||||||
Provision for loan losses | — | (300 | ) | (485 | ) | 200 | 50 | |||||||||||||||
Total noninterest income | 3,325 | 3,441 | 3,383 | 4,532 | 3,933 | |||||||||||||||||
Total noninterest expense | 17,874 | 16,784 | 15,348 | 16,372 | 15,104 | |||||||||||||||||
| ||||||||||||||||||||||
Net earnings before income taxes andtax-equivalent adjustment | 11,634 | 12,688 | 12,528 | 12,020 | 11,520 | |||||||||||||||||
Tax-equivalent adjustment | 613 | 1,205 | 1,276 | 1,342 | 1,288 | |||||||||||||||||
Income tax expense | 2,187 | 3,637 | 3,102 | 2,820 | 2,784 | |||||||||||||||||
| ||||||||||||||||||||||
Net earnings | $ | 8,834 | 7,846 | 8,150 | 7,858 | 7,448 | ||||||||||||||||
| ||||||||||||||||||||||
Per share data: | ||||||||||||||||||||||
Basic and diluted net earnings | $ | 2.42 | 2.15 | 2.24 | 2.16 | 2.04 | ||||||||||||||||
Cash dividends declared | $ | 0.96 | 0.92 | 0.90 | 0.88 | 0.86 | ||||||||||||||||
Weighted average shares outstanding | ||||||||||||||||||||||
Basic and diluted | 3,643,780 | 3,643,616 | 3,643,504 | 3,643,428 | 3,643,278 | |||||||||||||||||
Shares outstanding | 3,643,868 | 3,643,668 | 3,643,523 | 3,643,478 | 3,643,328 | |||||||||||||||||
Book value | $ | 24.44 | 23.85 | 22.55 | 21.94 | 20.80 | ||||||||||||||||
Common stock price | ||||||||||||||||||||||
High | $ | 53.50 | 40.25 | 31.31 | 30.39 | 25.80 | ||||||||||||||||
Low | 28.88 | 30.75 | 24.56 | 23.15 | 22.10 | |||||||||||||||||
Period-end | $ | 31.66 | 38.90 | 31.31 | 29.62 | 23.64 | ||||||||||||||||
To earnings ratio | 13.08 | x | 18.09 | 13.98 | 13.78 | 11.59 | ||||||||||||||||
To book value | 130 | % | 163 | 139 | 135 | 114 | ||||||||||||||||
Performance ratios: | ||||||||||||||||||||||
Return on average equity | 10.14 | % | 9.17 | 9.65 | 9.98 | 10.53 | ||||||||||||||||
Return on average assets | 1.08 | % | 0.94 | 0.98 | 0.98 | 0.97 | ||||||||||||||||
Dividend payout ratio | 39.67 | % | 42.79 | 40.18 | 40.74 | 42.16 | ||||||||||||||||
Average equity to average assets | 10.63 | % | 10.30 | 10.14 | 9.79 | 9.17 | ||||||||||||||||
Asset Quality: | ||||||||||||||||||||||
Allowance for loan losses as a % of: | ||||||||||||||||||||||
Loans | 1.00 | % | 1.05 | 1.08 | 1.01 | 1.20 | ||||||||||||||||
Nonperforming loans | 2,691 | % | 160 | 196 | 158 | 433 | ||||||||||||||||
Nonperforming assets as a % of: | ||||||||||||||||||||||
Loans and other real estate owned | 0.07 | % | 0.66 | 0.59 | 0.70 | 0.41 | ||||||||||||||||
Total assets | 0.04 | % | 0.35 | 0.30 | 0.36 | 0.21 | ||||||||||||||||
Nonperforming loans as % of loans | 0.04 | % | 0.66 | 0.55 | 0.64 | 0.28 | ||||||||||||||||
Net (recoveries) charge-offs as a % of average loans | (0.01 | ) % | (0.09 | ) | (0.19 | ) | 0.18 | 0.12 | ||||||||||||||
Capital Adequacy: | ||||||||||||||||||||||
CET 1 risk-based capital ratio | 16.49 | % | 16.42 | 16.44 | 15.28 | na | ||||||||||||||||
Tier 1 risk-based capital ratio | 16.49 | % | 16.98 | 17.00 | 16.57 | 17.45 | ||||||||||||||||
Total risk-based capital ratio | 17.38 | % | 17.91 | 17.95 | 17.44 | 18.54 | ||||||||||||||||
Tier 1 leverage ratio | 11.33 | % | 10.95 | 10.27 | 10.35 | 10.32 | ||||||||||||||||
Other financial data: | ||||||||||||||||||||||
Net interest margin (a) | 3.40 | % | 3.29 | 3.05 | 3.17 | 3.15 | ||||||||||||||||
Effective income tax rate | 19.84 | % | 31.67 | 27.57 | 26.41 | 27.21 | ||||||||||||||||
Efficiency ratio (b) | 60.57 | % | 57.53 | 56.03 | 57.26 | 56.62 | ||||||||||||||||
Selected period end balances: | ||||||||||||||||||||||
Securities | $ | 239,801 | 257,697 | 243,572 | 241,687 | 267,603 | ||||||||||||||||
Loans, net of unearned income | 476,908 | 453,651 | 430,946 | 426,410 | 402,954 | |||||||||||||||||
Allowance for loan losses | 4,790 | 4,757 | 4,643 | 4,289 | 4,836 | |||||||||||||||||
Total assets | 818,077 | 853,381 | 831,943 | 817,189 | 789,231 | |||||||||||||||||
Total deposits | 724,193 | 757,659 | 739,143 | 723,627 | 693,390 | |||||||||||||||||
Long-term debt | — | 3,217 | 3,217 | 7,217 | 12,217 | |||||||||||||||||
Total stockholders’ equity | 89,055 | 86,906 | 82,177 | 79,949 | 75,799 | |||||||||||||||||
| ||||||||||||||||||||||
|
|
Table 3 - Average Balance and Net Interest Income Analysis
| Year ended December 31 | ||||||||||||||||||||||||||||
| 2018 | 2017 | |||||||||||||||||||||||||||
| Interest | Interest | |||||||||||||||||||||||||||
| Average | Income/ | Yield/ | Average | Income/ | Yield/ | |||||||||||||||||||||||
| (Dollars in thousands) | Balance | Expense | Rate | Balance | Expense | Rate | ||||||||||||||||||||||
|
|
|
|
| ||||||||||||||||||||||||
Interest-earning assets: | ||||||||||||||||||||||||||||
Loans and loans held for sale (1) | $ | 457,610 | $ 21,766 | 4.76% | $ | 442,101 | $ 20,781 | 4.70% | ||||||||||||||||||||
Securities - taxable | 181,485 | 4,051 | 2.23% | 197,108 | 4,229 | 2.15% | ||||||||||||||||||||||
Securities -tax-exempt (2) | 71,065 | 2,921 | 4.11% | 69,881 | 3,545 | 5.07% | ||||||||||||||||||||||
|
|
|
|
| ||||||||||||||||||||||||
Total securities | 252,550 | 6,972 | 2.76% | 266,989 | 7,774 | 2.91% | ||||||||||||||||||||||
Federal funds sold | 28,689 | 554 | 1.93% | 32,342 | 341 | 1.05% | ||||||||||||||||||||||
Interest bearing bank deposits | 31,339 | 567 | 1.81% | 41,317 | 429 | 1.04% | ||||||||||||||||||||||
|
|
|
|
| ||||||||||||||||||||||||
Total interest-earning assets | 770,188 | 29,859 | 3.88% | 782,749 | 29,325 | 3.75% | ||||||||||||||||||||||
Cash and due from banks | 13,802 | 13,386 | ||||||||||||||||||||||||||
Other assets | 35,539 | 34,291 | ||||||||||||||||||||||||||
|
|
|
|
| ||||||||||||||||||||||||
Total assets | $ | 819,529 | $ | 830,426 | ||||||||||||||||||||||||
|
|
|
|
| ||||||||||||||||||||||||
Interest-bearing liabilities: | ||||||||||||||||||||||||||||
Deposits: | ||||||||||||||||||||||||||||
NOW | $ | 125,533 | 428 | 0.34% | $ | 125,935 | 248 | 0.20% | ||||||||||||||||||||
Savings and money market | 220,810 | 855 | 0.39% | 230,121 | 852 | 0.37% | ||||||||||||||||||||||
Certificates of deposits | 184,010 | 2,329 | 1.27% | 198,457 | 2,351 | 1.18% | ||||||||||||||||||||||
|
|
|
|
| ||||||||||||||||||||||||
Total interest-bearing deposits | 530,353 | 3,612 | 0.68% | 554,513 | 3,451 | 0.62% | ||||||||||||||||||||||
Short-term borrowings | 2,634 | 18 | 0.68% | 3,476 | 18 | 0.52% | ||||||||||||||||||||||
Long-term debt | 1,022 | 46 | 4.50% | 3,217 | 125 | 3.89% | ||||||||||||||||||||||
|
|
|
|
| ||||||||||||||||||||||||
Total interest-bearing liabilities | 534,009 | 3,676 | 0.69% | 561,206 | 3,594 | 0.64% | ||||||||||||||||||||||
Noninterest-bearing deposits | 195,924 | 180,891 | ||||||||||||||||||||||||||
Other liabilities | 2,489 | 2,788 | ||||||||||||||||||||||||||
Stockholders’ equity | 87,107 | 85,541 | ||||||||||||||||||||||||||
|
|
|
|
| ||||||||||||||||||||||||
Total liabilities and and stockholders’ equity | $ | 819,529 | $ | 830,426 | ||||||||||||||||||||||||
|
|
|
|
| ||||||||||||||||||||||||
Net interest income and margin | $ | 26,183 | 3.40% | $ | 25,731 | 3.29% | ||||||||||||||||||||||
|
|
|
|
| ||||||||||||||||||||||||
|
|
Table 4 - Volume and Rate Variance Analysis
| Years ended December 31, 2018 vs. 2017 | Years ended December 31, 2017 vs. 2016 | |||||||||||||||||||||||||||||
| Net |
Due to change in | Net | Due to change in | |||||||||||||||||||||||||||
|
|
|
| |||||||||||||||||||||||||||
| (Dollars in thousands) | Change | Rate (2) | Volume (2) | Change | Rate (2) | Volume (2) | ||||||||||||||||||||||||
|
|
| ||||||||||||||||||||||||||||
Interest income: | ||||||||||||||||||||||||||||||
Loans and loans held for sale | $ | 985 | 247 | 738 | $ | 328 | (138) | 466 | ||||||||||||||||||||||
Securities - taxable | (178) | 171 | (349) | 947 | 298 | 649 | ||||||||||||||||||||||||
Securities -tax-exempt (1) | (624) | (673) | 49 | (209) | (279) | 70 | ||||||||||||||||||||||||
|
|
| ||||||||||||||||||||||||||||
Total securities | (802) | (502) | (300) | 738 | 19 | 719 | ||||||||||||||||||||||||
Federal funds sold | 213 | 284 | (71) | 92 | 272 | (180) | ||||||||||||||||||||||||
Interest bearing bank deposits | 138 | 319 | (181) | 75 | 373 | (298) | ||||||||||||||||||||||||
|
|
| ||||||||||||||||||||||||||||
Total interest income | $ | 534 | 348 | 186 | $ | 1,233 | 526 | 707 | ||||||||||||||||||||||
|
|
| ||||||||||||||||||||||||||||
Interest expense: | ||||||||||||||||||||||||||||||
Deposits: | ||||||||||||||||||||||||||||||
NOW | $ | 180 | 181 | (1) | $ | (85) | (93) | 8 | ||||||||||||||||||||||
Savings and money market | 3 | 39 | (36) | (38) | (29) | (9) | ||||||||||||||||||||||||
Certificates of deposits | (22) | 161 | (183) | (267) | (99) | (168) | ||||||||||||||||||||||||
|
|
| ||||||||||||||||||||||||||||
Total interest-bearing deposits | 161 | 381 | (220) | (390) | (221) | (169) | ||||||||||||||||||||||||
Short-term borrowings | — | 6 | (6) | 3 | — | 3 | ||||||||||||||||||||||||
Long-term debt | (79) | 20 | (99) | (103) | 24 | (127) | ||||||||||||||||||||||||
|
|
| ||||||||||||||||||||||||||||
Total interest expense | 82 | 407 | (325) | (490) | (197) | (293) | ||||||||||||||||||||||||
|
|
| ||||||||||||||||||||||||||||
Net interest income | $ | 452 | (59) | 511 | $ | 1,723 | 723 | 1,000 | ||||||||||||||||||||||
|
|
| ||||||||||||||||||||||||||||
|
|
Table 5 - Loan Portfolio Composition
| December 31 | ||||||||||||||||||||
|
| |||||||||||||||||||
| (In thousands) |
2018 | 2017 | 2016 | 2015 | 2014 | |||||||||||||||
| ||||||||||||||||||||
Commercial and industrial | $ | 63,467 | 59,086 | 49,850 | 52,479 | 54,329 | ||||||||||||||
Construction and land development | 40,222 | 39,607 | 41,650 | 43,694 | 37,298 | |||||||||||||||
Commercial real estate | 261,896 | 239,033 | 220,439 | 203,853 | 192,006 | |||||||||||||||
Residential real estate | 102,597 | 106,863 | 110,855 | 116,673 | 107,641 | |||||||||||||||
Consumer installment | 9,295 | 9,588 | 8,712 | 10,220 | 12,335 | |||||||||||||||
| ||||||||||||||||||||
Total loans | 477,477 | 454,177 | 431,506 | 426,919 | 403,609 | |||||||||||||||
Less: unearned income | (569) | (526) | (560) | (509) | (655) | |||||||||||||||
| ||||||||||||||||||||
Loans, net of unearned income | 476,908 | 453,651 | 430,946 | 426,410 | 402,954 | |||||||||||||||
Less: allowance for loan losses | (4,790) | (4,757) | (4,643) | (4,289) | (4,836) | |||||||||||||||
| ||||||||||||||||||||
Loans, net | $ | 472,118 | 448,894 | 426,303 | 422,121 | 398,118 | ||||||||||||||
| ||||||||||||||||||||
Table 6 - Loan Maturities and Sensitivities to Changes in Interest Rates
| December 31, 2018 | ||||||||||||||||||||||||||||
|
| |||||||||||||||||||||||||||
1 year | 1 to 5 | After 5 | Adjustable | Fixed | ||||||||||||||||||||||||
| (Dollars in thousands) |
or less | years | years | Total | Rate | Rate | Total | |||||||||||||||||||||
| ||||||||||||||||||||||||||||
Commercial and industrial | $ | 37,237 | 9,600 | 16,630 | 63,467 | 21,505 | 41,962 | 63,467 | ||||||||||||||||||||
Construction and land development | 22,910 | 16,420 | 892 | 40,222 | 16,016 | 24,206 | 40,222 | |||||||||||||||||||||
Commercial real estate | 34,196 | 98,083 | 129,617 | 261,896 | 11,932 | 249,964 | 261,896 | |||||||||||||||||||||
Residential real estate | 9,654 | 26,347 | 66,596 | 102,597 | 50,992 | 51,605 | 102,597 | |||||||||||||||||||||
Consumer installment | 3,359 | 5,372 | 564 | 9,295 | 422 | 8,873 | 9,295 | |||||||||||||||||||||
| ||||||||||||||||||||||||||||
Total loans | $ | 107,356 | 155,822 | 214,299 | 477,477 | 100,867 | 376,610 | 477,477 | ||||||||||||||||||||
| ||||||||||||||||||||||||||||
Table 7 - Allowance for Loan Losses and Nonperforming Assets
| Year ended December 31 | ||||||||||||||||||||||||
|
| |||||||||||||||||||||||
| (Dollars in thousands) | 2018 | 2017 | 2016 | 2015 | 2014 | |||||||||||||||||||
| ||||||||||||||||||||||||
Allowance for loan losses: | ||||||||||||||||||||||||
Balance at beginning of period | $ | 4,757 | 4,643 | 4,289 | 4,836 | 5,268 | ||||||||||||||||||
Charge-offs: | ||||||||||||||||||||||||
Commercial and industrial | (52 | ) | (449 | ) | (97 | ) | (100 | ) | (46) | |||||||||||||||
Construction and land development | — | — | — | — | (235) | |||||||||||||||||||
Commercial real estate | (38 | ) | — | (194 | ) | (866 | ) | — | ||||||||||||||||
Residential real estate | (26 | ) | (107 | ) | (182 | ) | (89 | ) | (438) | |||||||||||||||
Consumer installment | (52 | ) | (40 | ) | (67 | ) | (59 | ) | (89) | |||||||||||||||
| ||||||||||||||||||||||||
Total charge-offs | (168 | ) | (596 | ) | (540 | ) | (1,114 | ) | (808) | |||||||||||||||
| ||||||||||||||||||||||||
Recoveries: | ||||||||||||||||||||||||
Commercial and industrial | 70 | 461 | 29 | 22 | 71 | |||||||||||||||||||
Construction and land development | — | 347 | 1,212 | 17 | 8 | |||||||||||||||||||
Commercial real estate | 19 | — | — | — | 119 | |||||||||||||||||||
Residential real estate | 79 | 115 | 127 | 313 | 112 | |||||||||||||||||||
Consumer installment | 33 | 87 | 11 | 15 | 16 | |||||||||||||||||||
| ||||||||||||||||||||||||
Total recoveries | 201 | 1,010 | 1,379 | 367 | 326 | |||||||||||||||||||
| ||||||||||||||||||||||||
Net recoveries (charge-offs) | 33 | 414 | 839 | (747 | ) | (482) | ||||||||||||||||||
Provision for loan losses | — | (300 | ) | (485 | ) | 200 | 50 | |||||||||||||||||
| ||||||||||||||||||||||||
Ending balance | $ | 4,790 | 4,757 | 4,643 | 4,289 | 4,836 | ||||||||||||||||||
| ||||||||||||||||||||||||
as a % of loans | 1.00 | % | 1.05 | 1.08 | 1.01 | 1.20 | ||||||||||||||||||
as a % of nonperforming loans | 2,691 | % | 160 | 196 | 158 | 433 | ||||||||||||||||||
Net (recoveries) charge-offs as % of average loans | (0.01 | ) | % | (0.09 | ) | (0.19 | ) | 0.18 | 0.12 | |||||||||||||||
| ||||||||||||||||||||||||
Nonperforming assets: | ||||||||||||||||||||||||
Nonaccrual/nonperforming loans | $ | 178 | 2,972 | 2,370 | 2,714 | 1,117 | ||||||||||||||||||
Other real estate owned | 172 | — | 152 | 252 | 534 | |||||||||||||||||||
| ||||||||||||||||||||||||
Total nonperforming assets | $ | 350 | 2,972 | 2,522 | 2,966 | 1,651 | ||||||||||||||||||
| ||||||||||||||||||||||||
as a % of loans and other real estate owned | 0.07 | % | 0.66 | 0.59 | 0.70 | 0.41 | ||||||||||||||||||
as a % total assets | 0.04 | % | 0.35 | 0.30 | 0.36 | 0.21 | ||||||||||||||||||
Nonperforming loans as a % of total loans | 0.04 | % | 0.66 | 0.55 | 0.64 | 0.28 | ||||||||||||||||||
Accruing loans 90 days or more past due | $ | — | — | — | — | — | ||||||||||||||||||
| ||||||||||||||||||||||||
Table 8 - Allocation of Allowance for Loan Losses
| December 31 | ||||||||||||||||||||||||||||||||||||||||||||||||||||||||||
2018 | 2017 | 2016 | 2015 | 2014 | ||||||||||||||||||||||||||||||||||||||||||||||||||||||
| (Dollars in thousands) |
Amount | %* | Amount | %* | Amount | %* | Amount | %* | Amount | %* | ||||||||||||||||||||||||||||||||||||||||||||||||
Commercial and industrial | $ | 778 | 13.3 | $ | 653 | 13.0 | $ | 540 | 11.6 | $ | 523 | 12.3 | $ | 639 | 13.5 | |||||||||||||||||||||||||||||||||||||||||||
Construction and land development | 700 | 8.4 | 734 | 8.7 | 812 | 9.7 | 669 | 10.2 | 974 | 9.2 | ||||||||||||||||||||||||||||||||||||||||||||||||
Commercial real estate | 2,218 | 54.9 | 2,126 | 52.7 | 2,071 | 51.0 | 1,879 | 47.8 | 1,928 | 47.5 | ||||||||||||||||||||||||||||||||||||||||||||||||
Residential real estate | 946 | 21.5 | 1,071 | 23.5 | 1,107 | 25.7 | 1,059 | 27.3 | 1,119 | 26.7 | ||||||||||||||||||||||||||||||||||||||||||||||||
Consumer installment | 148 | 1.9 | 173 | 2.1 | 113 | 2.0 | 159 | 2.4 | 176 | 3.1 | ||||||||||||||||||||||||||||||||||||||||||||||||
| ||||||||||||||||||||||||||||||||||||||||||||||||||||||||||
Total allowance for loan losses | $ | 4,790 | $ | 4,757 | $ | 4,643 | $ | 4,289 | $ | 4,836 | ||||||||||||||||||||||||||||||||||||||||||||||||
| ||||||||||||||||||||||||||||||||||||||||||||||||||||||||||
|
Table 9 - CDs and Other Time Deposits of $100,000 or More
| ||||
| ||||
| ||||
| ||||
| ||||
| ||||
|
|
Report of Independent Registered Public Accounting Firm
The Board of Directors and Stockholders
Auburn National Bancorporation, Inc.
Opinion on the Consolidated Financial Statements
We have audited the accompanying consolidated balance sheets of Auburn National Bancorporation, Inc. and its subsidiaries (the “Company”) as of December 31, 2018 and 2017, the related consolidated statements of earnings, comprehensive income, stockholders’ equity, and cash flows for the years then ended, and the related notes to the consolidated financial statements and schedules (collectively, the “financial statements”). In our opinion, the financial statements present fairly, in all material respects, the financial position of the Company as of December 31, 2018 and 2017, and the results of its operations and its cash flows for the years then ended, in conformity with accounting principles generally accepted in the United States of America.
We have also audited, in accordance with the standards of the Public Company Accounting Oversight Board (United States) (“PCAOB”), the Company’s internal control over financial reporting as of December 31, 2018, based on criteria established in Internal Control — Integrated Framework issued by the Committee of Sponsoring Organizations of the Treadway Commission in 2013, and our report dated March 12, 2019 expressed an unqualified opinion on the effectiveness of the Company’s internal control over financial reporting.
Basis for Opinion
These financial statements are the responsibility of the Company’s management. Our responsibility is to express an opinion on the Company’s consolidated financial statements based on our audits. We are a public accounting firm registered with the PCAOB and are required to be independent with respect to the Company in accordance with U.S. federal securities laws and the applicable rules and regulations of the Securities and Exchange Commission and the PCAOB.
We conducted our audits in accordance with the standards of the PCAOB. Those standards require that we plan and perform the audits to obtain reasonable assurance about whether the financial statements are free of material misstatement, whether due to error or fraud. Our audits included performing procedures to assess the risks of material misstatement of the financial statements, whether due to error or fraud, and performing procedures that respond to those risks. Such procedures included examining, on a test basis, evidence regarding the amounts and disclosures in the financial statements. Our audits also included evaluating the accounting principles used and significant estimates made by management, as well as evaluating the overall presentation of the financial statements. We believe that our audits provide a reasonable basis for our opinion.
/s/ Elliott Davis, LLC
We have served as the Company’s auditor since 2015.
Greenville, South Carolina
March 12, 2019
AUBURN NATIONAL BANCORPORATION, INC. AND SUBSIDIARIES
Consolidated Balance Sheets
| December 31 | ||||||||||
|
| |||||||||
| (Dollars in thousands, except share data) | 2018 | 2017 | ||||||||
Assets: | ||||||||||
Cash and due from banks | $ | 13,043 | $ | 12,942 | ||||||
Federal funds sold | 26,918 | 41,540 | ||||||||
Interest bearing bank deposits | 25,115 | 51,046 | ||||||||
| ||||||||||
Cash and cash equivalents | 65,076 | 105,528 | ||||||||
| ||||||||||
Securitiesavailable-for-sale | 239,801 | 257,697 | ||||||||
Loans held for sale | 383 | 1,922 | ||||||||
Loans, net of unearned income | 476,908 | 453,651 | ||||||||
Allowance for loan losses | (4,790) | (4,757) | ||||||||
| ||||||||||
Loans, net | 472,118 | 448,894 | ||||||||
| ||||||||||
Premises and equipment, net | 13,596 | 13,791 | ||||||||
Bank-owned life insurance | 18,765 | 18,330 | ||||||||
Other assets | 8,338 | 7,219 | ||||||||
| ||||||||||
Total assets | $ | 818,077 | $ | 853,381 | ||||||
| ||||||||||
Liabilities: | ||||||||||
Deposits: | ||||||||||
Noninterest-bearing | $ | 201,648 | $ | 193,917 | ||||||
Interest-bearing | 522,545 | 563,742 | ||||||||
| ||||||||||
Total deposits | 724,193 | 757,659 | ||||||||
Federal funds purchased and securities sold under agreements to repurchase | 2,300 | 2,658 | ||||||||
Long-term debt | — | 3,217 | ||||||||
Accrued expenses and other liabilities | 2,529 | 2,941 | ||||||||
| ||||||||||
Total liabilities | 729,022 | 766,475 | ||||||||
| ||||||||||
Stockholders’ equity: | ||||||||||
Preferred stock of $.01 par value; authorized 200,000 shares; issued shares - none | — | — | ||||||||
Common stock of $.01 par value; authorized 8,500,000 shares; issued 3,957,135 shares | 39 | 39 | ||||||||
Additionalpaid-in capital | 3,779 | 3,771 | ||||||||
Retained earnings | 95,635 | 90,299 | ||||||||
Accumulated other comprehensive loss, net | (3,763) | (566) | ||||||||
Less treasury stock, at cost - 313,267 shares and 313,467 shares at December 31, 2018 and 2017, respectively | (6,635) | (6,637) | ||||||||
| ||||||||||
Total stockholders’ equity | 89,055 | 86,906 | ||||||||
| ||||||||||
Total liabilities and stockholders’ equity | $ | 818,077 | $ | 853,381 | ||||||
| ||||||||||
See accompanying notes to consolidated financial statements
AUBURN NATIONAL BANCORPORATION, INC. AND SUBSIDIARIES
Consolidated Statements of Earnings
| Year ended December 31 | ||||||||||||
| (Dollars in thousands, except share and per share data) |
2018 | 2017 | ||||||||||
| ||||||||||||
Interest income: | ||||||||||||
Loans, including fees | $ | 21,766 | $ | 20,781 | ||||||||
Securities: | ||||||||||||
Taxable | 4,051 | 4,229 | ||||||||||
Tax-exempt | 2,308 | 2,340 | ||||||||||
Federal funds sold and interest bearing bank deposits | 1,121 | 770 | ||||||||||
| ||||||||||||
Total interest income | 29,246 | 28,120 | ||||||||||
| ||||||||||||
Interest expense: | ||||||||||||
Deposits | 3,612 | 3,451 | ||||||||||
Short-term borrowings | 18 | 18 | ||||||||||
Long-term debt | 46 | 125 | ||||||||||
| ||||||||||||
Total interest expense | 3,676 | 3,594 | ||||||||||
| ||||||||||||
Net interest income | 25,570 | 24,526 | ||||||||||
Provision for loan losses | — | (300 | ) | |||||||||
| ||||||||||||
Net interest income after provision for loan losses | 25,570 | 24,826 | ||||||||||
| ||||||||||||
Noninterest income: | ||||||||||||
Service charges on deposit accounts | 749 | 746 | ||||||||||
Mortgage lending | 655 | 777 | ||||||||||
Bank-owned life insurance | 435 | 442 | ||||||||||
Other | 1,486 | 1,425 | ||||||||||
Securities gains, net | — | 51 | ||||||||||
| ||||||||||||
Total noninterest income | 3,325 | 3,441 | ||||||||||
| ||||||||||||
Noninterest expense: | ||||||||||||
Salaries and benefits | 10,653 | 10,011 | ||||||||||
Net occupancy and equipment | 1,465 | 1,471 | ||||||||||
Professional fees | 902 | 966 | ||||||||||
FDIC and other regulatory assessments | 310 | 346 | ||||||||||
Other | 4,544 | 3,990 | ||||||||||
| ||||||||||||
Total noninterest expense | 17,874 | 16,784 | ||||||||||
| ||||||||||||
Earnings before income taxes | 11,021 | 11,483 | ||||||||||
Income tax expense | 2,187 | 3,637 | ||||||||||
| ||||||||||||
Net earnings | $ | 8,834 | $ | 7,846 | ||||||||
| ||||||||||||
Net earnings per share: | ||||||||||||
Basic and diluted | $ | 2.42 | $ | 2.15 | ||||||||
| ||||||||||||
Weighted average shares outstanding: | ||||||||||||
Basic and diluted | 3,643,780 | 3,643,616 | ||||||||||
| ||||||||||||
See accompanying notes to consolidated financial statements
AUBURN NATIONAL BANCORPORATION, INC. AND SUBSIDIARIES
Consolidated Statements of Comprehensive Income
| Year ended December 31 | ||||||||||||||||
|
| |||||||||||||||
| (Dollars in thousands) | 2018 | 2017 | ||||||||||||||
| ||||||||||||||||
Net earnings | $ | 8,834 | $ | 7,846 | ||||||||||||
Other comprehensive (loss) income, net of tax: | ||||||||||||||||
Unrealized net holding (loss) gain on all other securities | (3,197) | 263 | ||||||||||||||
Reclassification adjustment for net gain on securities recognized in net earnings | — | (32) | ||||||||||||||
| ||||||||||||||||
Other comprehensive (loss) income | (3,197) | 231 | ||||||||||||||
| ||||||||||||||||
Comprehensive income | $ | 5,637 | $ | 8,077 | ||||||||||||
| ||||||||||||||||
See accompanying notes to consolidated financial statements
AUBURN NATIONAL BANCORPORATION, INC. AND SUBSIDIARIES
Consolidated Statements of Stockholders’ Equity
| Accumulated | ||||||||||||||||||||||||||||
| Additional | other | |||||||||||||||||||||||||||
| Common Stock | paid-in | Retained | comprehensive | Treasury | ||||||||||||||||||||||||
|
| |||||||||||||||||||||||||||
| (Dollars in thousands, except share data) |
Shares | Amount | capital | earnings | loss | stock | Total | |||||||||||||||||||||
| ||||||||||||||||||||||||||||
Balance, December 31, 2016 | 3,957,135 | $ | 39 | 3,767 | 85,716 | (708 | ) | (6,637 | ) | $ | 82,177 | |||||||||||||||||
Net earnings | — | — | — | 7,846 | — | — | 7,846 | |||||||||||||||||||||
Other comprehensive income | — | — | — | — | 231 | — | 231 | |||||||||||||||||||||
Reclassification of certain tax effects | — | — | — | 89 | (89 | ) | — | — | ||||||||||||||||||||
Cash dividends paid ($0.92 per share) | — | — | — | (3,352 | ) | — | — | (3,352 | ) | |||||||||||||||||||
Sale of treasury stock (145 shares) | — | — | 4 | — | — | — | 4 | |||||||||||||||||||||
| ||||||||||||||||||||||||||||
Balance, December 31, 2017 | 3,957,135 | $ | 39 | $ | 3,771 | $ | 90,299 | $ | (566 | ) | $ | (6,637 | ) | $ | 86,906 | |||||||||||||
| ||||||||||||||||||||||||||||
Net earnings | — | — | — | 8,834 | — | — | 8,834 | |||||||||||||||||||||
Other comprehensive loss | — | — | — | — | (3,197 | ) | — | (3,197) | ||||||||||||||||||||
Cash dividends paid ($0.96 per share) | — | — | — | (3,498 | ) | — | — | (3,498) | ||||||||||||||||||||
Sale of treasury stock (200 shares) | — | — | 8 | — | — | 2 | 10 | |||||||||||||||||||||
| ||||||||||||||||||||||||||||
Balance, December 31, 2018 | 3,957,135 | $ | 39 | $ | 3,779 | $ | 95,635 | $ | (3,763 | ) | $ | (6,635 | ) | $ | 89,055 | |||||||||||||
| ||||||||||||||||||||||||||||
See accompanying notes to consolidated financial statements
AUBURN NATIONAL BANCORPORATION, INC. AND SUBSIDIARIES
Consolidated Statements of Cash Flows
| Year ended December 31 | ||||||||||||
|
| |||||||||||
| (In thousands) | 2018 | 2017 | ||||||||||
| ||||||||||||
Cash flows from operating activities: | ||||||||||||
Net earnings | $ | 8,834 | $ | 7,846 | ||||||||
Adjustments to reconcile net earnings to net cash provided by operating activities: | ||||||||||||
Provision for loan losses | — | (300) | ||||||||||
Depreciation and amortization | 938 | 1,016 | ||||||||||
Premium amortization and discount accretion, net | 2,025 | 2,133 | ||||||||||
Deferred tax expense | 71 | 356 | ||||||||||
Net gain on securities available for sale | — | (51) | ||||||||||
Net gain on sale of loans held for sale | (311) | (504) | ||||||||||
Net gain on other real estate owned | — | (5) | ||||||||||
Loans originated for sale | (27,681) | (29,796) | ||||||||||
Proceeds from sale of loans | 29,323 | 29,651 | ||||||||||
Increase in cash surrender value of bank owned life insurance | (435) | (442) | ||||||||||
Net (increase) decrease in other assets | (221) | 592 | ||||||||||
Net decrease in accrued expenses and other liabilities | (402) | (1,095) | ||||||||||
| ||||||||||||
Net cash provided by operating activities | $ | 12,141 | $ | 9,401 | ||||||||
| ||||||||||||
Cash flows from investing activities: | ||||||||||||
Proceeds from sales of securitiesavailable-for-sale | 8,770 | 10,374 | ||||||||||
Proceeds from maturities of securitiesavailable-for-sale | 22,673 | 32,945 | ||||||||||
Purchase of securitiesavailable-for-sale | (19,841) | (59,160) | ||||||||||
Increase in loans, net | (24,749) | (22,291) | ||||||||||
Net purchases of premises and equipment | (240) | (1,618) | ||||||||||
Increase in FHLB stock | (20) | (13) | ||||||||||
Proceeds from sale of other real estate owned | 1,353 | 157 | ||||||||||
| ||||||||||||
Net cash used in investing activities | $ | (12,054) | $ | (39,606) | ||||||||
| ||||||||||||
Cash flows from financing activities: | ||||||||||||
Net increase in noninterest-bearing deposits | 7,731 | 12,027 | ||||||||||
Net (decrease) increase in interest-bearing deposits | (41,197) | 6,489 | ||||||||||
Net decrease in federal funds purchased and securities sold under agreements to repurchase | (358) | (708) | ||||||||||
Repayments or retirement of long-term debt | (3,217) | — | ||||||||||
Dividends paid | (3,498) | (3,352) | ||||||||||
| ||||||||||||
Net cash (used in) provided by financing activities | $ | (40,539) | $ | 14,456 | ||||||||
| ||||||||||||
Net change in cash and cash equivalents | $ | (40,452 | ) | $ | (15,749 | ) | ||||||
Cash and cash equivalents at beginning of period | 105,528 | 121,277 | ||||||||||
| ||||||||||||
Cash and cash equivalents at end of period | $ | 65,076 | $ | 105,528 | ||||||||
| ||||||||||||
| ||||||||||||
Supplemental disclosures of cash flow information: | ||||||||||||
Cash paid during the period for: | ||||||||||||
Interest | $ | 3,616 | $ | 3,624 | ||||||||
Income taxes | 2,688 | 3,289 | ||||||||||
Supplemental disclosure ofnon-cash transactions: | ||||||||||||
Real estate acquired through foreclosure | $ | 1,525 | $ | — | ||||||||
| ||||||||||||
See accompanying notes to consolidated financial statements
AUBURN NATIONAL BANCORPORATION, INC. AND SUBSIDIARIES
Notes to Consolidated Financial Statements
NOTE 1: SUMMARY OF SIGNIFICANT ACCOUNTING POLICIES
Nature of Business
Auburn National Bancorporation, Inc. (the “Company”) is a bank holding company whose primary business is conducted by its wholly-owned subsidiary, AuburnBank (the “Bank”). AuburnBank is a commercial bank located in Auburn, Alabama. The Bank provides a full range of banking services in its primary market area, Lee County, which includes the Auburn-Opelika Metropolitan Statistical Area.
Basis of Presentation
The consolidated financial statements include the accounts of the Company and its wholly-owned subsidiaries. Auburn National Bancorporation Capital Trust I was an affiliate of the Company and was included in these consolidated financial statements pursuant to the equity method of accounting. On April 27, 2018, the Trust was dissolved. Significant intercompany transactions and accounts are eliminated in consolidation.
Use of Estimates
The preparation of financial statements in conformity with U.S. generally accepted accounting principles requires management to make estimates and assumptions that affect the reported amounts of assets and liabilities and the disclosure of contingent assets and liabilities as of the balance sheet date and the reported amounts of income and expense during the reporting period. Actual results could differ from those estimates. Material estimates that are particularly susceptible to significant change in the near term include the determination of the allowance for loan losses, fair value measurements, valuation of other real estate owned, and valuation of deferred tax assets.
Accounting Standards Adopted in 2018
In 2018, the Company adopted new guidance related to the following Accounting Standards Update (“Update” or “ASU”):
|
|
|
|
Information about these pronouncements is described in more detail below.
ASU2014-09, Revenue from Contracts with Customers (Topic 606), was developed as a joint project with the International Accounting Standards Board to remove inconsistencies in revenue requirements and provide a more robust framework for addressing revenue issues. The ASU’s core principle is that an entity should recognize revenue when it transfers promised goods or services to customers in an amount that reflects the consideration to which an entity expects to be entitled in exchange for those goods or services. In August 2015, the FASB issued ASU2015-14, which deferred the effective date by one year (i.e., interim and annual reporting periods beginning after December 15, 2017). Early adoption was permitted, but not before the original effective date (i.e., interim and annual reporting periods beginning after December 15, 2016). The ASU may be adopted using either a modified retrospective method or a full retrospective method. The Company adopted the ASU during the first quarter of 2018, as required, using a modified retrospective approach. The majority of the Company’s revenue stream is generated from interest income on loans and deposits, which are outside the scope of Topic 606. The Company’s sources of income that fall within the scope of Topic 606 include service charges on deposits, investment services, interchange fees and gains and losses on sales of other real estate, all of which are presented as components of noninterest income. The Company has evaluated the effect of Topic 606 on thesefee-based income streams and concluded that adoption of the standard did not materially impact its financial statements. The following is a summary of the implementation considerations for the revenue streams that fall within the scope of Topic 606:
Service charges on deposits, investment services, ATM and interchange fees – Fees from these services are either transaction-based, for which the performance obligations are satisfied when the individual transaction is processed, or set periodic service charges, for which the performance obligations are satisfied over the period the service is provided. Transaction-based fees are recognized at the time the transaction is processed, and periodic service charges are recognized over the service period. The adoption of Topic 606 had no impact on the Company’s revenue recognition practice for these services.
|
ASU2016-01,Financial Instruments – Overall (Subtopic825-10): Recognition and Measurement of Financial Assets and Financial Liabilities, enhances the reporting model for financial instruments to provide users of financial statements with more decision-useful information. The ASU addresses certain aspects of recognition, measurement, presentation, and disclosure of financial instruments. Some of the amendments include the following: (1) Require equity investments (except those accounted for under the equity method of accounting or those that result in consolidation of the investee) to be measured at fair value with changes in fair value recognized in net income; (2) Simplify the impairment assessment of equity investments without readily determinable fair values by requiring a qualitative assessment to identify impairment; (3) Require public business entities to use the exit price notion when measuring the fair value of financial instruments for disclosure purposes; (4) Require an entity to present separately in other comprehensive income the portion of the total change in the fair value of a liability resulting from a change in the instrument-specific credit risk when the entity has elected to measure the liability at fair value; among others. For public business entities, the amendments of this ASU are effective for fiscal years beginning after December 15, 2017, including interim periods within those fiscal years. The adoption of this ASU on January 1, 20182020. Adoption of this
ASU2016-15, Statement of Cash Flows (Topic 230): Classification of Certain Cash Receipts and Cash Payments, provides guidance on eight specific cash flow issues where current GAAP is either unclear or does not include specific guidance on classification in the statement of cash flows. The new guidance is effective for annual and interim reporting periods in fiscal years beginning after December 15, 2017. The Company adopted ASUNo. 2016-15 on January 1, 2018. ASUNo. 2016-15 did not have a material impact on the Company’s Consolidated Financial Statements.
ASU2016-18,Statement of Cash Flows (Topic 230): Restricted Cash, amends guidance on how the statement of cash flows presents the change during the period in the total of cash, cash equivalents, and amounts generally described as restricted cash or restricted cash equivalents. Under the new guidance, amounts generally described as restricted cash and restricted cash equivalents are included with cash and cash equivalents when reconciling thebeginning-of-period andend-of-period total amounts shown on the statement of cash flows. The amendments in this Update do not provide a definition of restricted cash or restricted cash equivalents. The new guidance is effective for public business entities for annual and interim reporting periods in fiscal years beginning after December 15, 2017. The Company adopted ASUNo. 2016-18 on January 1, 2018. ASUNo. 2016-18 did not have a material impact on the Company’s Consolidated Financial Statements.
Other Real Estate Owned
Other real estate owned (“OREO”) includes properties acquired through, or in lieu of, loan foreclosure that are held for sale and are initially recorded at the lower of the loan’s carrying amount or fair value less cost to sell at the date of foreclosure, establishing a new cost basis. Subsequent to foreclosure, valuations are periodically performed by management and the assets are carried at the lower of carrying value amount or fair value less cost to sell. Gains or losses realized upon sale of OREO and additional losses related to subsequent valuation adjustments are determined on a specific property basis and are included as a component of noninterest expense along with holding costs.
Derivative Instruments
In accordance with Accounting Standards Codification (“ASC”) Topic 815,Derivatives and Hedging, all derivative instruments are recorded on the consolidated balance sheet at their respective fair values. The accounting for changes in fair value (i.e., gains or losses) of a derivative instrument depends on whether it has been designated and qualifies as part of a hedging relationship and, if so, on the reason for holding it. If the derivative instrument is not designated as part of a hedging relationship, the gain or loss on the derivative instrument is recognized in earnings in the period of change. None of the derivatives utilized by the Company have been designated as a hedge.
Subsequent Events
The Company has evaluated the effects of events or transactions through the date of this filing that have occurred subsequent to December 31, 2018. The Company does not believe there are any material subsequent events that would require further recognition or disclosure.
| Year ended December 31 | ||||||||||
| (Dollars in thousands, except share and per share data) | 2018 | 2017 | ||||||||
Basic and diluted: | ||||||||||
Net earnings | $ | 8,834 | $ | 7,846 | ||||||
Weighted average common shares outstanding | 3,643,780 | 3,643,616 | ||||||||
Net earnings per share | $ | 2.42 | $ | 2.15 | ||||||
| ||||||||||
FRB
|
| |||||||||||||||||||||||||||||||
| 1 year | 1 to 5 | 5 to 10 | After 10 | Fair | Gross Unrealized | Amortized | ||||||||||||||||||||||||||
|
| |||||||||||||||||||||||||||||||
| (Dollars in thousands) | or less | years | years | years | Value | Gains | Losses | Cost | ||||||||||||||||||||||||
| ||||||||||||||||||||||||||||||||
December 31, 2018 | ||||||||||||||||||||||||||||||||
Agency obligations (a) | $ | 14,437 | 19,865 | 16,869 | — | 51,171 | 25 | 1,200 | $ | 52,346 | ||||||||||||||||||||||
Agency RMBS (a) | — | — | 8,368 | 110,230 | 118,598 | 65 | 3,738 | 122,271 | ||||||||||||||||||||||||
State and political subdivisions | — | 3,682 | 7,726 | 58,624 | 70,032 | 518 | 692 | 70,206 | ||||||||||||||||||||||||
| ||||||||||||||||||||||||||||||||
Totalavailable-for-sale | $ | 14,437 | 23,547 | 32,963 | 168,854 | 239,801 | 608 | 5,630 | $ | 244,823 | ||||||||||||||||||||||
| ||||||||||||||||||||||||||||||||
December 31, 2017 | ||||||||||||||||||||||||||||||||
Agency obligations (a) | $ | — | 29,253 | 23,809 | — | 53,062 | 79 | 904 | $ | 53,887 | ||||||||||||||||||||||
Agency RMBS (a) | — | — | 11,201 | 121,871 | 133,072 | 330 | 1,639 | $ | 134,381 | |||||||||||||||||||||||
State and political subdivisions | — | 2,564 | 9,999 | 59,000 | 71,563 | 1,616 | 237 | $ | 70,184 | |||||||||||||||||||||||
| ||||||||||||||||||||||||||||||||
Totalavailable-for-sale | $ | — | 31,817 | 45,009 | 180,871 | 257,697 | 2,025 | 2,780 | $ | 258,452 | ||||||||||||||||||||||
| ||||||||||||||||||||||||||||||||
| Less than 12 Months | 12 Months or Longer | Total | ||||||||||||||||||||||||
|
|
|
|
|
| |||||||||||||||||||||
| (Dollars in thousands) | Fair
Value | Unrealized
Losses | Fair
Value | Unrealized
Losses | Fair
Value | Unrealized
Losses | ||||||||||||||||||||
| ||||||||||||||||||||||||||
December 31, 2018: | ||||||||||||||||||||||||||
Agency obligations | $ | 4,724 | 28 | 44,307 | 1,172 | 49,031 | $ | 1,200 | ||||||||||||||||||
Agency RMBS | 12,325 | 238 | 99,184 | 3,500 | 111,509 | 3,738 | ||||||||||||||||||||
State and political subdivisions | 14,840 | 181 | 14,384 | 511 | 29,224 | 692 | ||||||||||||||||||||
| ||||||||||||||||||||||||||
Total | $ | 31,889 | 447 | 157,875 | 5,183 | 189,764 | $ | 5,630 | ||||||||||||||||||
| ||||||||||||||||||||||||||
December 31, 2017: | ||||||||||||||||||||||||||
Agency obligations | $ | 14,381 | 99 | 20,353 | 805 | 34,734 | $ | 904 | ||||||||||||||||||
Agency RMBS | 53,440 | 363 | 50,729 | 1,276 | 104,169 | 1,639 | ||||||||||||||||||||
State and political subdivisions | 2,009 | 22 | 10,155 | 215 | 12,164 | 237 | ||||||||||||||||||||
| ||||||||||||||||||||||||||
Total | $ | 69,830 | 484 | 81,237 | 2,296 | 151,067 | $ | 2,780 | ||||||||||||||||||
| ||||||||||||||||||||||||||
●
●
●
●
●
●
residential mortgage-backed securities (“RMBS”MBS”)RMBSMBS were primarilydriven by changes in interest rates and not due to the
| Year ended December 31 | ||||||||||
|
| |||||||||
| (Dollars in thousands) | 2018 | 2017 | ||||||||
Gross realized gains | $ | — | 51 | |||||||
| ||||||||||
Realized gains, net | $ | — | 51 | |||||||
| ||||||||||
| December 31 | ||||||||||
|
| |||||||||
| (In thousands) | 2018 | 2017 | ||||||||
| ||||||||||
Commercial and industrial | $ | 63,467 | $ | 59,086 | ||||||
Construction and land development | 40,222 | 39,607 | ||||||||
Commercial real estate: | ||||||||||
Owner occupied | 56,413 | 44,192 | ||||||||
Multifamily | 40,455 | 52,167 | ||||||||
Other | 165,028 | 142,674 | ||||||||
| ||||||||||
Total commercial real estate | 261,896 | 239,033 | ||||||||
Residential real estate: | ||||||||||
Consumer mortgage | 56,223 | 59,540 | ||||||||
Investment property | 46,374 | 47,323 | ||||||||
| ||||||||||
Total residential real estate | 102,597 | 106,863 | ||||||||
Consumer installment | 9,295 | 9,588 | ||||||||
Total loans | 477,477 | 454,177 | ||||||||
Less: unearned income | (569) | (526) | ||||||||
Loans, net of unearned income | $ | 476,908 | $ | 453,651 | ||||||
| ||||||||||
segments and classes.
Constructionborrower,who owns the property.
Commercial real estate (“CRE”) —includesof these loans disaggregatedtakes into three classes: (1) owner occupied (2) multi-familyconsideration the
|
|
|
rental rates as well as the financial health of the borrower.
|
|
| (In thousands) | Current | Accruing
30-89 Days
Past Due | Accruing
Greater than
90 days | Total
Accruing
Loans | Non-
Accrual | Total
Loans | ||||||||||||||||||
| ||||||||||||||||||||||||
December 31, 2018: | ||||||||||||||||||||||||
Commercial and industrial | $ | 63,367 | 100 | — | 63,467 | — | $ | 63,467 | ||||||||||||||||
Construction and land development | 39,997 | 225 | — | 40,222 | — | 40,222 | ||||||||||||||||||
Commercial real estate: | ||||||||||||||||||||||||
Owner occupied | 56,413 | — | — | 56,413 | — | 56,413 | ||||||||||||||||||
Multifamily | 40,455 | — | — | 40,455 | — | 40,455 | ||||||||||||||||||
Other | 165,028 | — | — | 165,028 | — | 165,028 | ||||||||||||||||||
| ||||||||||||||||||||||||
Total commercial real estate | 261,896 | — | — | 261,896 | — | 261,896 | ||||||||||||||||||
Residential real estate: | ||||||||||||||||||||||||
Consumer mortgage | 54,446 | 1,599 | — | 56,045 | 178 | 56,223 | ||||||||||||||||||
Investment property | 46,233 | 141 | — | 46,374 | — | 46,374 | ||||||||||||||||||
| ||||||||||||||||||||||||
Total residential real estate | 100,679 | 1,740 | — | 102,419 | 178 | 102,597 | ||||||||||||||||||
Consumer installment | 9,254 | 41 | — | 9,295 | — | 9,295 | ||||||||||||||||||
| ||||||||||||||||||||||||
Total | $ | 475,193 | 2,106 | — | 477,299 | 178 | $ | 477,477 | ||||||||||||||||
| ||||||||||||||||||||||||
December 31, 2017: | ||||||||||||||||||||||||
Commercial and industrial | $ | 59,047 | 8 | — | 59,055 | 31 | $ | 59,086 | ||||||||||||||||
Construction and land development | 39,607 | — | — | 39,607 | — | 39,607 | ||||||||||||||||||
Commercial real estate: | ||||||||||||||||||||||||
Owner occupied | 44,192 | — | — | 44,192 | — | 44,192 | ||||||||||||||||||
Multifamily | 52,167 | — | — | 52,167 | — | 52,167 | ||||||||||||||||||
Other | 140,486 | — | — | 140,486 | 2,188 | 142,674 | ||||||||||||||||||
| ||||||||||||||||||||||||
Total commercial real estate | 236,845 | — | — | 236,845 | 2,188 | 239,033 | ||||||||||||||||||
Residential real estate: | ||||||||||||||||||||||||
Consumer mortgage | 58,195 | 746 | — | 58,941 | 599 | 59,540 | ||||||||||||||||||
Investment property | 46,871 | 312 | — | 47,183 | 140 | 47,323 | ||||||||||||||||||
| ||||||||||||||||||||||||
Total residential real estate | 105,066 | 1,058 | — | 106,124 | 739 | 106,863 | ||||||||||||||||||
Consumer installment | 9,517 | 57 | — | 9,574 | 14 | 9,588 | ||||||||||||||||||
| ||||||||||||||||||||||||
Total | $ | 450,082 | 1,123 | — | 451,205 | 2,972 | $ | 454,177 | ||||||||||||||||
| ||||||||||||||||||||||||
2019.
| Year ended December 31 | ||||||||
|
| |||||||
| (In thousands) | 2018 | 2017 | ||||||
| ||||||||
Beginning balance | $ | 4,757 | $ | 4,643 | ||||
Charged-off loans | (168) | (596) | ||||||
Recovery of previouslycharged-off loans | 201 | 1,010 | ||||||
| ||||||||
Net recoveries | 33 | 414 | ||||||
Provision for loan losses | — | (300) | ||||||
| ||||||||
Ending balance | $ | 4,790 | $ | 4,757 | ||||
| ||||||||
charged
-off.ongoing COVID
-19 pandemic.| (in thousands) | Commercial and industrial | Construction and land Development | Commercial Real Estate | Residential Real Estate | Consumer Installment | Total | ||||||||||||||||||
| ||||||||||||||||||||||||
Balance, December 31, 2016 | $ | 540 | 812 | 2,071 | 1,107 | 113 | $ | 4,643 | ||||||||||||||||
Charge-offs | (449) | — | — | (107 | ) | (40 | ) | (596) | ||||||||||||||||
Recoveries | 461 | 347 | — | 115 | 87 | 1,010 | ||||||||||||||||||
| ||||||||||||||||||||||||
Net recoveries | 12 | 347 | — | 8 | 47 | 414 | ||||||||||||||||||
Provision | 101 | (425 | ) | 55 | (44 | ) | 13 | (300) | ||||||||||||||||
| ||||||||||||||||||||||||
Balance, December 31, 2017 | $ | 653 | 734 | 2,126 | 1,071 | 173 | $ | 4,757 | ||||||||||||||||
| ||||||||||||||||||||||||
Charge-offs | (52) | — | (38 | ) | (26 | ) | (52 | ) | (168) | |||||||||||||||
Recoveries | 70 | — | 19 | 79 | 33 | 201 | ||||||||||||||||||
| ||||||||||||||||||||||||
Net recoveries | 18 | — | (19 | ) | 53 | (19 | ) | 33 | ||||||||||||||||
Provision | 107 | (34 | ) | 111 | (178 | ) | (6 | ) | — | |||||||||||||||
| ||||||||||||||||||||||||
Balance, December 31, 2018 | $ | 778 | 700 | 2,218 | 946 | 148 | $ | 4,790 | ||||||||||||||||
| ||||||||||||||||||||||||
| Collectively evaluated (1) | Individually evaluated (2) | Total | ||||||||||||||||||||||||
|
|
|
|
|
| |||||||||||||||||||||
| Allowance | Recorded | Allowance | Recorded | Allowance | Recorded | |||||||||||||||||||||
| for loan | investment | for loan | investment | for loan | investment | |||||||||||||||||||||
| (In thousands) | losses | in loans | losses | in loans | losses | in loans | ||||||||||||||||||||
| ||||||||||||||||||||||||||
December 31, 2018: | ||||||||||||||||||||||||||
Commercial and industrial | $ | 778 | 63,467 | — | — | 778 | 63,467 | |||||||||||||||||||
Construction and land development | 700 | 40,222 | — | — | 700 | 40,222 | ||||||||||||||||||||
Commercial real estate | 2,218 | 261,739 | — | 157 | 2,218 | 261,896 | ||||||||||||||||||||
Residential real estate | 946 | 102,597 | — | — | 946 | 102,597 | ||||||||||||||||||||
Consumer installment | 148 | 9,295 | — | — | 148 | 9,295 | ||||||||||||||||||||
| ||||||||||||||||||||||||||
Total | $ | 4,790 | 477,320 | — | 157 | 4,790 | 477,477 | |||||||||||||||||||
| ||||||||||||||||||||||||||
December 31, 2017: | ||||||||||||||||||||||||||
Commercial and industrial | $ | 622 | 59,055 | 31 | 31 | 653 | 59,086 | |||||||||||||||||||
Construction and land development | 734 | 39,607 | — | — | 734 | 39,607 | ||||||||||||||||||||
Commercial real estate | 2,115 | 236,322 | 11 | 2,711 | 2,126 | 239,033 | ||||||||||||||||||||
Residential real estate | 1,071 | 106,863 | — | — | 1,071 | 106,863 | ||||||||||||||||||||
Consumer installment | 173 | 9,588 | — | — | 173 | 9,588 | ||||||||||||||||||||
| ||||||||||||||||||||||||||
Total | $ | 4,715 | 451,435 | 42 | 2,742 | 4,757 | 454,177 | |||||||||||||||||||
| ||||||||||||||||||||||||||
|
|
| (In thousands) | Pass | Special Mention | Substandard Accruing | Nonaccrual | Total loans | |||||||||||||||
| ||||||||||||||||||||
December 31, 2018 |
| |||||||||||||||||||
Commercial and industrial | $ | 61,568 | 1,377 | 522 | — | $ | 63,467 | |||||||||||||
Construction and land development | 39,481 | — | 741 | — | 40,222 | |||||||||||||||
Commercial real estate: | ||||||||||||||||||||
Owner occupied | 55,942 | 154 | 317 | — | 56,413 | |||||||||||||||
Multifamily | 40,455 | — | — | — | 40,455 | |||||||||||||||
Other | 163,449 | 1,208 | 371 | — | 165,028 | |||||||||||||||
| ||||||||||||||||||||
Total commercial real estate | 259,846 | 1,362 | 688 | — | 261,896 | |||||||||||||||
Residential real estate: | ||||||||||||||||||||
Consumer mortgage | 50,903 | 1,374 | 3,768 | 178 | 56,223 | |||||||||||||||
Investment property | 45,463 | 173 | 738 | — | 46,374 | |||||||||||||||
| ||||||||||||||||||||
Total residential real estate | 96,366 | 1,547 | 4,506 | 178 | 102,597 | |||||||||||||||
Consumer installment | 9,149 | 75 | 71 | — | 9,295 | |||||||||||||||
| ||||||||||||||||||||
Total | $ | 466,410 | 4,361 | 6,528 | 178 | $ | 477,477 | |||||||||||||
| ||||||||||||||||||||
December 31, 2017 | ||||||||||||||||||||
Commercial and industrial | $ | 58,842 | 94 | 119 | 31 | $ | 59,086 | |||||||||||||
Construction and land development | 39,049 | 90 | 468 | — | 39,607 | |||||||||||||||
Commercial real estate: | ||||||||||||||||||||
Owner occupied | 43,615 | 240 | 337 | — | 44,192 | |||||||||||||||
Multifamily | 52,167 | — | — | — | 52,167 | |||||||||||||||
Other | 139,695 | 395 | 396 | 2,188 | 142,674 | |||||||||||||||
| ||||||||||||||||||||
Total commercial real estate | 235,477 | 635 | 733 | 2,188 | 239,033 | |||||||||||||||
Residential real estate: | ||||||||||||||||||||
Consumer mortgage | 54,101 | 1,254 | 3,586 | 599 | 59,540 | |||||||||||||||
Investment property | 46,463 | 53 | 667 | 140 | 47,323 | |||||||||||||||
| ||||||||||||||||||||
Total residential real estate | 100,564 | 1,307 | 4,253 | 739 | 106,863 | |||||||||||||||
Consumer installment | 9,430 | 66 | 78 | 14 | 9,588 | |||||||||||||||
| ||||||||||||||||||||
Total | $ | 443,362 | 2,192 | 5,651 | 2,972 | $ | 454,177 | |||||||||||||
| ||||||||||||||||||||
| December 31, 2018 | ||||||||||||||||||||
| (In thousands) | Unpaid principal balance (1) | Charge-offs and payments applied (2) | Recorded investment (3) | Related allowance | ||||||||||||||||
|
|
| ||||||||||||||||||
With no allowance recorded: |
| |||||||||||||||||||
Commercial real estate: | ||||||||||||||||||||
Owner occupied | $ | 157 | — | 157 | ||||||||||||||||
|
|
| ||||||||||||||||||
Total commercial real estate | 157 | — | 157 | |||||||||||||||||
|
|
| ||||||||||||||||||
Total impaired loans | $ | 157 | — | 157 | $ | — | ||||||||||||||
|
|
| ||||||||||||||||||
|
|
|
| December 31, 2017 | ||||||||||||||||||||
| (In thousands) | Unpaid principal balance (1) | Charge-offs and payments applied (2) | Recorded investment (3) | Related allowance | ||||||||||||||||
|
|
| ||||||||||||||||||
With no allowance recorded: |
| |||||||||||||||||||
Commercial real estate: | ||||||||||||||||||||
Other | $ | 3,630 | (1,094 | ) | 2,536 | |||||||||||||||
| ||||||||||||||||||||
Total commercial real estate | 3,630 | (1,094 | ) | 2,536 | ||||||||||||||||
| ||||||||||||||||||||
Total | $ | 3,630 | (1,094 | ) | 2,536 | |||||||||||||||
| ||||||||||||||||||||
With allowance recorded: |
| |||||||||||||||||||
Commercial and industrial | $ | 52 | (21 | ) | 31 | $ | 31 | |||||||||||||
Commercial real estate: | ||||||||||||||||||||
Owner occupied | 175 | — | 175 | 11 | ||||||||||||||||
|
|
| ||||||||||||||||||
Total commercial real estate | 175 | — | 175 | 11 | ||||||||||||||||
|
|
| ||||||||||||||||||
Total | $ | 227 | (21 | ) | 206 | $ | 42 | |||||||||||||
|
|
| ||||||||||||||||||
Total impaired loans | $ | 3,857 | (1,115 | ) | 2,742 | $ | 42 | |||||||||||||
|
|
| ||||||||||||||||||
|
|
|
| Year ended December 31, 2018 | Year ended December 31, 2017 | |||||||||||||||
| Average | Total interest | Average | Total interest | |||||||||||||
| recorded | income | recorded | income | |||||||||||||
| (In thousands) | investment | recognized | investment | recognized | ||||||||||||
| ||||||||||||||||
Impaired loans: |
| |||||||||||||||
Commercial and industrial | $ | 9 | — | $ | 50 | — | ||||||||||
Construction and land development | — | — | 11 | — | ||||||||||||
Commercial real estate: | ||||||||||||||||
Owner occupied | 166 | 9 | 184 | 10 | ||||||||||||
Other | 1,145 | — | 2,096 | 1 | ||||||||||||
| ||||||||||||||||
Total commercial real estate | 1,311 | 9 | 2,280 | 11 | ||||||||||||
| ||||||||||||||||
Total | $ | 1,320 | 9 | $ | 2,341 | 11 | ||||||||||
| ||||||||||||||||
restructure.
| TDRs | ||||||||||||||||||||||
| (In thousands) | Accruing | Nonaccrual | Total | Related
Allowance | ||||||||||||||||||
|
|
| ||||||||||||||||||||
December 31, 2018 | ||||||||||||||||||||||
Commercial real estate: | ||||||||||||||||||||||
Owner occupied | $ | 157 | — | 157 | $ | — | ||||||||||||||||
|
|
| ||||||||||||||||||||
Total commercial real estate | 157 | — | 157 | — | ||||||||||||||||||
|
|
| ||||||||||||||||||||
Total | $ | 157 | — | 157 | $ | — | ||||||||||||||||
|
|
| ||||||||||||||||||||
December 31, 2017 | ||||||||||||||||||||||
Commercial and industrial | $ | — | 31 | 31 | $ | 31 | ||||||||||||||||
Commercial real estate: | ||||||||||||||||||||||
Owner occupied | 175 | — | 175 | 11 | ||||||||||||||||||
Other | 287 | 1,431 | 1,718 | — | ||||||||||||||||||
|
|
| ||||||||||||||||||||
Total commercial real estate | 462 | 1,431 | 1,893 | 11 | ||||||||||||||||||
|
|
| ||||||||||||||||||||
Total | $ | 462 | 1,462 | 1,924 | $ | 42 | ||||||||||||||||
|
|
| ||||||||||||||||||||
The following table summarizes
| ($ in thousands) | Number of contracts | Pre- modification outstanding recorded investment | Post- modification outstanding recorded investment | |||||||||||||
| ||||||||||||||||
December 31, 2018 | ||||||||||||||||
Commercial real estate: | ||||||||||||||||
Other | 2 | $ | 1,447 | 1,447 | ||||||||||||
| ||||||||||||||||
Total commercial real estate | 2 | 1,447 | 1,447 | |||||||||||||
| ||||||||||||||||
Total | 2 | $ | 1,447 | 1,447 | ||||||||||||
| ||||||||||||||||
December 31, 2017 | ||||||||||||||||
Commercial and industrial | 1 | $ | 34 | 34 | ||||||||||||
Commercial real estate: | ||||||||||||||||
Other | 1 | $ | 1,275 | 1,266 | ||||||||||||
| ||||||||||||||||
Total commercial real estate | 1 | 1,275 | 1,266 | |||||||||||||
| ||||||||||||||||
Total | 2 | $ | 1,309 | 1,300 | ||||||||||||
| ||||||||||||||||
year ended
December 31, 2019.TheThe following table summarizesrequired payment of principal
| ($ in thousands) | Number of Contracts | Recorded investment (1) | ||||||||
| ||||||||||
December 31, 2018 | ||||||||||
Commercial real estate: | ||||||||||
Other | 1 | $ | 1,259 | |||||||
| ||||||||||
Total commercial real estate | 1 | 1,259 | ||||||||
| ||||||||||
Total | 1 | $ | 1,259 | |||||||
| ||||||||||
|
December 31 | ||||||||||
| (Dollars in thousands) | 2018 | 2017 | ||||||||
| ||||||||||
Land | $ | 7,473 | 7,473 | |||||||
Buildings and improvements | 10,438 | 10,394 | ||||||||
Furniture, fixtures, and equipment | 3,357 | 3,161 | ||||||||
| ||||||||||
Total premises and equipment | 21,268 | 21,028 | ||||||||
Less: accumulated depreciation | (7,672) | (7,237) | ||||||||
| ||||||||||
Premises and equipment, net | $ | 13,596 | 13,791 | |||||||
| ||||||||||
below
| Year ended December 31 | ||||||||||
|
| |||||||||
| (Dollars in thousands) | 2018 | 2017 | ||||||||
| ||||||||||
Beginning balance | $ | 1,644 | 1,952 | |||||||
Additions, net | 208 | 224 | ||||||||
Amortization expense | (411) | (533) | ||||||||
Change in valuation allowance | — | 1 | ||||||||
| ||||||||||
Ending balance | $ | 1,441 | 1,644 | |||||||
| ||||||||||
Valuation allowance included in MSRs, net: | ||||||||||
Beginning of period | $ | — | 1 | |||||||
End of period | — | — | ||||||||
| ||||||||||
Fair value of amortized MSRs: | ||||||||||
Beginning of period | $ | 2,528 | 2,678 | |||||||
End of period | 2,697 | 2,528 | ||||||||
| ||||||||||
2019.
| December 31 | ||||||||||
|
| |||||||||
| (Dollars in thousands) | 2018 | 2017 | ||||||||
| ||||||||||
Unpaid principal balance | $ | 289,981 | 312,318 | |||||||
Weighted average prepayment speed (CPR) | 8.3 % | 10.2 | ||||||||
Discount rate (annual percentage) | 10.0 % | 10.0 | ||||||||
Weighted average coupon interest rate | 3.9 % | 3.8 | ||||||||
Weighted average remaining maturity (months) | 250 | 253 | ||||||||
Weighted average servicing fee (basis points) | 25.0 | 25.0 | ||||||||
| ||||||||||
| (Dollars in thousands) | December 31, 2018 | |
| ||
2019 | $ 198 | |
2020 | 174 | |
2021 | 152 | |
2022 | 131 | |
2023 | 115 | |
| ||
| (Dollars in thousands) | December 31, 2018 | |||
| ||||
2019 | $ | 108,363 | ||
2020 | 28,888 | |||
2021 | 16,630 | |||
2022 | 20,966 | |||
2023 | 6,390 | |||
| ||||
Total certificates of deposit and other time deposits | $ | 181,237 | ||
| ||||
thousand.
| 2018 | 2017 | |||||||||||||||
| Weighted | Weighted | |||||||||||||||
| (Dollars in thousands) | Amount | Avg. Rate | Amount | Avg. Rate | ||||||||||||
| ||||||||||||||||
Federal funds purchased: | ||||||||||||||||
As of December 31 | $ | — | — | $ | — | — | ||||||||||
Average during the year | 2 | 2.50 % | 9 | 2.01 % | ||||||||||||
Maximum outstanding at anymonth-end | — | — | ||||||||||||||
Securities sold under agreements to repurchase: | ||||||||||||||||
As of December 31 | $ | 2,300 | 0.50 % | $ | 2,658 | 0.50 % | ||||||||||
Average during the year | 2,632 | 0.50 % | 3,467 | 0.52 % | ||||||||||||
Maximum outstanding at anymonth-end | 3,241 | 4,152 | ||||||||||||||
| ||||||||||||||||
2020.
At December 31, 2018LEASE COMMITMENTS
| 2018 | 2017 | |||||||||||||||
| Weighted | Weighted | |||||||||||||||
| (Dollars in thousands) | Amount | Avg. Rate | Amount | Avg. Rate | ||||||||||||
| ||||||||||||||||
Subordinated debentures, due 2033 | $ | — | — % | $ | 3,217 | 4.63% | ||||||||||
| ||||||||||||||||
Total long-term debt | $ | — | — % | $ | 3,217 | 4.63% | ||||||||||
| ||||||||||||||||
The Company formed Auburn National Bancorporation Capital Trust I (the “Trust”), a wholly-owned statutory business trust, in 2003. The Trust issued $7.0 equipment under operating leases.
On April 27, 2018, the Trust formally redeemed all of its issued and outstanding trust preferred securities at par. The Company had repurchased $4.0 million par amount of trust preferred securities issued by the Trust in October 2016, at a discount. The additional amount paid on April 27, 2018 for trust preferred securities not previously purchased by the Company was approximately $3.0 million, including accrued and unpaid distributions. All junior subordinated debentures related to the Trust were redeemed and retired as a result of the action.
The Company now has no outstanding trust preferred securities or junior subordinated debentures, and the Trust has been dissolved.
NOTE 11: OTHER COMPREHENSIVE INCOME (LOSS)
Comprehensive income is defined as the change in equity from all transactions other than those with stockholders, and it includes net earnings and other comprehensive (loss) income. Other comprehensive (loss) income forboth the years ended December 31, 20182020 and 2017,2019.
| Pre-tax | Tax benefit | Net of | ||||||||||
| (In thousands) | amount | (expense) | tax amount | |||||||||
| ||||||||||||
2018: | ||||||||||||
Unrealized net holding loss on all other securities | $ | (4,269) | 1,072 | (3,197) | ||||||||
| ||||||||||||
Other comprehensive loss | $ | (4,269) | 1,072 | (3,197) | ||||||||
| ||||||||||||
2017: | ||||||||||||
Unrealized net holding gain on all other securities | $ | 417 | (154) | 263 | ||||||||
Reclassification adjustment for net gain on securities recognized in net earnings | (51) | 19 | (32) | |||||||||
| ||||||||||||
Other comprehensive income | $ | 366 | (135) | 231 | ||||||||
| ||||||||||||
| Year ended December 31 | ||||||||||
| (Dollars in thousands) | 2018 | 2017 | ||||||||
| ||||||||||
Current income tax expense: | ||||||||||
Federal | $ | 1,685 | 2,782 | |||||||
State | 431 | 499 | ||||||||
| ||||||||||
Total current income tax expense | 2,116 | 3,281 | ||||||||
| ||||||||||
Deferred income tax expense (benefit): | ||||||||||
Federal | 56 | 384 | ||||||||
State | 15 | (28) | ||||||||
| ||||||||||
Total deferred income tax expense | 71 | 356 | ||||||||
| ||||||||||
Total income tax expense | $ | 2,187 | 3,637 | |||||||
| ||||||||||
| 2018 | 2017 | |||||||||||||||||
| Percent of | Percent of | |||||||||||||||||
| pre-tax | pre-tax | |||||||||||||||||
| (Dollars in thousands) | Amount | earnings | Amount | earnings | ||||||||||||||
| ||||||||||||||||||
Earnings before income taxes | $ | 11,021 | 11,483 | |||||||||||||||
|
|
|
| |||||||||||||||
Income taxes at statutory rate | 2,315 | 21.0 % | 3,904 | 34.0 % | ||||||||||||||
Tax-exempt interest | (515) | (4.7) | (813) | (7.0) | ||||||||||||||
State income taxes, net of federal tax effect | 361 | 3.3 | 325 | 2.8 | ||||||||||||||
Bank-owned life insurance | (92) | (0.8) | (150) | (1.3) | ||||||||||||||
Federal tax reform impact | — | — | 370 | 3.2 | ||||||||||||||
Other | 118 | 1.0 | 1 | — | ||||||||||||||
Total income tax expense | $ | 2,187 | 19.8 % | 3,637 | 31.7 % | |||||||||||||
The Tax Cuts and Jobs Act was signed into law on December 22, 2017. The
| December 31 | ||||||||||
| (Dollars in thousands) | 2018 | 2017 | ||||||||
| ||||||||||
Deferred tax assets: | ||||||||||
Allowance for loan losses | $ | 1,203 | 1,195 | |||||||
Unrealized loss on securities | 1,262 | 190 | ||||||||
Other | 135 | 216 | ||||||||
Total deferred tax assets | 2,600 | 1,601 | ||||||||
| ||||||||||
Deferred tax liabilities: | ||||||||||
Premises and equipment | 280 | 241 | ||||||||
Originated mortgage servicing rights | 362 | 413 | ||||||||
Other | 168 | 158 | ||||||||
Total deferred tax liabilities | 810 | 812 | ||||||||
| ||||||||||
Net deferred tax asset | $ | 1,790 | 789 | |||||||
| ||||||||||
below.
| Year ended December 31 | ||||||||||
| (Dollars in thousands) | 2018 | 2017 | ||||||||
| ||||||||||
Net deferred tax asset: | ||||||||||
Balance, beginning of year | $ | 789 | 1,280 | |||||||
Deferred tax expense related to continuing operations | (71) | (356) | ||||||||
Stockholders’ equity, for accumulated other comprehensive loss (income) | 1,072 | (135) | ||||||||
| ||||||||||
Balance, end of year | $ | 1,790 | 789 | |||||||
| ||||||||||
Financial derivatives are reported at fair value in other assets or other liabilities on the accompanying consolidated balance sheets. The accounting for changes in the fair value of a derivative depends on whether it has been designated and qualifies as part of a hedging relationship. For derivatives not designated as part of a hedging relationship, the gain or loss is recognized in current earnings within other noninterest income on the accompanying consolidated statements of earnings. From time to time, the Company may enter into interest rate swaps (“swaps”) to facilitate customer transactions and meet their financing needs. Upon entering into these swaps, the Company enters into offsetting positions in order to minimize the risk to the Company. These swaps qualify as derivatives, but are not designated as hedging instruments. At December 31, 2018 and December 31, 2017, the Company had no derivative contracts to assist in managing its own interest rate sensitivity.
Interest rate swap agreements involve the risk of dealing with counterparties and their ability to meet contractual terms. When the fair value of a derivative instrument is positive, this generally indicates that the counterparty or customer owes the Company, and results in credit risk to the Company. When the fair value of a derivative instrument contract is negative, the Company owes the customer or counterparty and therefore, has no credit risk.
The Company had no interest rate swaps as of December 31, 2018. A summary of the Company’s interest rate swaps as of and for the year ended December 31, 2017 is presented below.
| Other | ||||||||||||||||
Other
| Other
| noninterest
| ||||||||||||||
| Assets | Liabilities | income | ||||||||||||||
Estimated
| Estimated
| Gains
| ||||||||||||||
| (Dollars in thousands) | Notional | Fair Value | Fair Value | (Losses) | ||||||||||||
| ||||||||||||||||
December 31, 2017: | ||||||||||||||||
Pay fixed / receive variable | $ | 3,617 | — | 52 | $ | 189 | ||||||||||
Pay variable / receive fixed | 3,617 | 52 | — | (189) | ||||||||||||
| ||||||||||||||||
Total interest rate swap agreements | $ | 7,234 | 52 | 52 | $ | — | ||||||||||
| ||||||||||||||||
NOTE 15:
| December 31 | ||||||||
| (Dollars in thousands) |
2018 | 2017 | ||||||
| ||||||||
Commitments to extend credit | $ | 61,889 | $ | 57,014 | ||||
Standby letters of credit | 7,026 | 7,390 | ||||||
| ||||||||
Minimum lease payments under leases classified as operating leases due in each of the five years subsequent to
the Company has a contract with a constructioncompany for $
include broker/dealer quotes, market spreads, cash flows, market consensus
prepayment speeds, benchmark yields, reportedInterest rate swap agreements
The carrying amount
| (Dollars in thousands) | Amount | Quoted Prices in Active Markets for Identical Assets (Level 1) | Significant Other Observable Inputs (Level 2) | Significant Unobservable Inputs (Level 3) | ||||||||||||
| ||||||||||||||||
December 31, 2018: | ||||||||||||||||
Securitiesavailable-for-sale: | ||||||||||||||||
Agency obligations | $ | 51,171 | — | 51,171 | — | |||||||||||
Agency RMBS | 118,598 | — | 118,598 | — | ||||||||||||
State and political subdivisions | 70,032 | — | 70,032 | — | ||||||||||||
| ||||||||||||||||
Total securitiesavailable-for-sale | 239,801 | — | 239,801 | — | ||||||||||||
| ||||||||||||||||
Total assets at fair value | $ | 239,801 | — | 239,801 | — | |||||||||||
| ||||||||||||||||
December 31, 2017: | ||||||||||||||||
Securitiesavailable-for-sale: | ||||||||||||||||
Agency obligations | $ | 53,062 | — | 53,062 | — | |||||||||||
Agency RMBS | 133,072 | — | 133,072 | — | ||||||||||||
State and political subdivisions | 71,563 | — | 71,563 | — | ||||||||||||
| ||||||||||||||||
Total securitiesavailable-for-sale | 257,697 | — | 257,697 | — | ||||||||||||
Other assets(1) | 52 | — | 52 | — | ||||||||||||
| ||||||||||||||||
Total assets at fair value | $ | 257,749 | — | 257,749 | — | |||||||||||
| ||||||||||||||||
Other liabilities(1) | 52 | — | 52 | — | ||||||||||||
| ||||||||||||||||
Total liabilities at fair value | $ | 52 | — | 52 | — | |||||||||||
| ||||||||||||||||
(1)Represents the
Other real estate owned
Other real estate owned, consisting
| (Dollars in thousands) | Amount | Quoted Prices in
Active Markets
for
Identical Assets
(Level 1) | Other
Observable
Inputs
(Level 2) | Significant
Unobservable
Inputs
(Level 3) | ||||||||||||
| ||||||||||||||||
December 31, 2018: | ||||||||||||||||
Loans held for sale | $ | 383 | — | 383 | — | |||||||||||
Loans, net(1) | 157 | — | — | 157 | ||||||||||||
Other real estate owned | 172 | — | — | 172 | ||||||||||||
Other assets(2) | 1,441 | — | — | 1,441 | ||||||||||||
| ||||||||||||||||
Total assets at fair value | $ | 2,153 | — | 383 | 1,770 | |||||||||||
| ||||||||||||||||
December 31, 2017: | ||||||||||||||||
Loans held for sale | $ | 1,922 | — | 1,922 | — | |||||||||||
Loans, net(1) | 2,700 | — | — | 2,700 | ||||||||||||
Other assets(2) | 1,644 | — | — | 1,644 | ||||||||||||
| ||||||||||||||||
Total assets at fair value | $ | 6,266 | — | 1,922 | 4,344 | |||||||||||
| ||||||||||||||||
|
|
| (Dollars in thousands) | Carrying Amount | Valuation Technique | Significant Unobservable Input | Weighted
Average
of Input | ||||||||||||
|
|
|
|
|
|
| ||||||||||
Nonrecurring: | ||||||||||||||||
Impaired loans | $ | 157 | Appraisal | Appraisal discounts (%) | 10.0% | |||||||||||
Other real estate owned | 172 | Appraisal | Appraisal discounts (%) | 10.0% | ||||||||||||
Mortgage servicing rights, net | 1,441 | Discounted cash flow | Prepayment speed or CPR (%) | 8.3% | ||||||||||||
| Discount rate (%) | 10.0% | |||||||||||||||
| ||||||||||||||||
Long-term debt
The carrying
The carrying value, related estimated
| Fair Value Hierarchy | ||||||||||||||||||||||
| (Dollars in thousands) | Carrying
amount | Estimated
fair value | Level 1
inputs | Level 2
inputs | Level 3
Inputs | |||||||||||||||||
| ||||||||||||||||||||||
December 31, 2018: | ||||||||||||||||||||||
Financial Assets: | ||||||||||||||||||||||
Loans, net (1) | $ | 472,118 | $ | 465,456 | $ | — | $ | — | $ | 465,456 | ||||||||||||
Loans held for sale | 383 | 397 | — | 397 | — | |||||||||||||||||
Financial Liabilities: | ||||||||||||||||||||||
Time Deposits | $ | 181,237 | $ | 181,168 | $ | — | $ | 181,168 | $ | — | ||||||||||||
| ||||||||||||||||||||||
December 31, 2017: | ||||||||||||||||||||||
Financial Assets: | ||||||||||||||||||||||
Loans, net (1) | $ | 448,894 | $ | 447,468 | $ | — | $ | — | $ | 447,468 | ||||||||||||
Loans held for sale | 1,922 | 1,950 | — | 1,950 | — | |||||||||||||||||
Financial Liabilities: | ||||||||||||||||||||||
Time Deposits | $ | 188,071 | $ | 185,564 | $ | — | $ | 185,564 | $ | — | ||||||||||||
Long-term debt | 3,217 | 3,217 | — | 3,217 | — | |||||||||||||||||
| ||||||||||||||||||||||
Liabilities:
| ||||
| ||||
| ||||
| ||||
2020.
Minimum for capital
| Minimum to be | |||||||||||||||||||||||
| Actual | adequacy purposes | well capitalized | ||||||||||||||||||||||
| (Dollars in thousands) |
Amount | Ratio | Amount | Ratio | Amount | Ratio | ||||||||||||||||||
| ||||||||||||||||||||||||
At December 31, 2018: | ||||||||||||||||||||||||
Tier 1 Leverage Capital | ||||||||||||||||||||||||
AuburnBank | $ | 91,719 | 11.33 % | $ | 32,368 | 4.00 % | $ | 40,461 | 5.00 % | |||||||||||||||
Common Equity Tier 1 Capital | ||||||||||||||||||||||||
AuburnBank | $ | 91,719 | 16.49 % | $ | 25,031 | 4.50 % | $ | 36,156 | 6.50 % | |||||||||||||||
Tier 1 Risk-Based Capital | ||||||||||||||||||||||||
AuburnBank | $ | 91,719 | 16.49 % | $ | 33,375 | 6.00 % | $ | 44,500 | 8.00 % | |||||||||||||||
Total Risk-Based Capital | ||||||||||||||||||||||||
AuburnBank | $ | 96,661 | 17.38 % | $ | 44,500 | 8.00 % | $ | 55,625 | 10.00 % | |||||||||||||||
| ||||||||||||||||||||||||
At December 31, 2017: | ||||||||||||||||||||||||
Tier 1 Leverage Capital | ||||||||||||||||||||||||
Auburn National Bancorporation | $ | 90,382 | 10.95 % | $ | 33,012 | 4.00 % | N/A | N/A | ||||||||||||||||
AuburnBank | 89,217 | 10.82 | 32,978 | 4.00 | $ | 41,222 | 5.00 % | |||||||||||||||||
Common Equity Tier 1 Capital | ||||||||||||||||||||||||
Auburn National Bancorporation | $ | 87,382 | 16.42 % | $ | 23,949 | 4.50 % | N/A | N/A | ||||||||||||||||
AuburnBank | 89,217 | 16.74 | 23,987 | 4.50 | $ | 34,648 | 6.50 % | |||||||||||||||||
Tier 1 Risk-Based Capital | ||||||||||||||||||||||||
Auburn National Bancorporation | $ | 90,382 | 16.98 % | $ | 31,932 | 6.00 % | N/A | N/A | ||||||||||||||||
AuburnBank | 89,217 | 16.74 | 31,983 | 6.00 | $ | 42,644 | 8.00 % | |||||||||||||||||
Total Risk-Based Capital | ||||||||||||||||||||||||
Auburn National Bancorporation | $ | 95,300 | 17.91 % | $ | 42,576 | 8.00 % | N/A | N/A | ||||||||||||||||
AuburnBank | 94,135 | 17.66 | 42,644 | 8.00 | $ | 53,305 | 10.00 % | |||||||||||||||||
| ||||||||||||||||||||||||
| December 31 | ||||||||
| (Dollars in thousands) |
2018 |
2017 | ||||||
| ||||||||
Assets: | ||||||||
Cash and due from banks | $ | 1,941 | 1,170 | |||||
Investment in bank subsidiary | 87,956 | 88,741 | ||||||
Other assets | 626 | 1,760 | ||||||
| ||||||||
Total assets | $ | 90,523 | 91,671 | |||||
| ||||||||
Liabilities: | ||||||||
Accrued expenses and other liabilities | $ | 1,468 | 1,548 | |||||
Long-term debt | — | 3,217 | ||||||
| ||||||||
Total liabilities | 1,468 | 4,765 | ||||||
| ||||||||
Stockholders’ equity | 89,055 | 86,906 | ||||||
| ||||||||
Total liabilities and stockholders’ equity | $ | 90,523 | 91,671 | |||||
| ||||||||
| Year ended December 31 | ||||||||
| (Dollars in thousands) |
2018 |
2017 | ||||||
| ||||||||
Income: | ||||||||
Dividends from bank subsidiary | $ | 6,533 | 3,471 | |||||
Noninterest income | 149 | 141 | ||||||
| ||||||||
Total income | 6,682 | 3,612 | ||||||
| ||||||||
Expense: | ||||||||
Interest expense | 51 | 125 | ||||||
Noninterest expense | 237 | 225 | ||||||
| ||||||||
Total expense | 288 | 350 | ||||||
| ||||||||
Earnings before income tax benefit and equity in undistributed earnings of bank subsidiary | 6,394 | 3,262 | ||||||
Income tax benefit | (28 | ) | (58 | ) | ||||
| ||||||||
Earnings before equity in undistributed earnings of bank subsidiary | 6,422 | 3,320 | ||||||
Equity in undistributed earnings of bank subsidiary | 2,412 | 4,526 | ||||||
| ||||||||
Net earnings | $ | 8,834 | 7,846 | |||||
| ||||||||
Year ended December 31
| Year ended December 31 | ||||||||||
| (Dollars in thousands) | 2018 | 2017 | ||||||||
| ||||||||||
Cash flows from operating activities: | ||||||||||
Net earnings | $8,834 | 7,846 | ||||||||
Adjustments to reconcile net earnings to net cash provided by operating activities: | ||||||||||
Net decrease (increase) in other assets | 1,134 | (879) | ||||||||
Net decrease in other liabilities | (70) | (109) | ||||||||
Equity in undistributed earnings of bank subsidiary | (2,412) | (4,526) | ||||||||
| ||||||||||
Net cash provided by operating activities | 7,486 | 2,332 | ||||||||
| ||||||||||
Cash flows from financing activities: | ||||||||||
Repayments or retirement of long-term debt | (3,217) | — | ||||||||
Dividends paid | (3,498) | (3,352) | ||||||||
| ||||||||||
Net cash used in financing activities | (6,715) | (3,352) | ||||||||
| ||||||||||
Net change in cash and cash equivalents | 771 | (1,020) | ||||||||
Cash and cash equivalents at beginning of period | 1,170 | 2,190 | ||||||||
| ||||||||||
Cash and cash equivalents at end of period | $ 1,941 | 1,170 | ||||||||
| ||||||||||
NOTE 20: REVENUE RECOGNITION
On January 1, 2018, the Company implemented ASU2014-09, Revenue from Contracts with Customers, codified at ASC 606. The Company adopted ASC 606 using the modified retrospective transition method. As of December 31, 2017, the Company had no uncompleted customer contracts and, as a result, no cumulative transition adjustment was made to the Company’s accumulated deficit during the year
The majority
Service charges on deposits, investment services, ATM and interchange fees – Fees from these services are either transaction-based, for which the performance obligations are satisfied when the individual transaction is processed, or set periodic service charges, for which the performance obligations are satisfied over the period the service is provided. Transaction-based fees are recognized at the time the transaction is processed, and periodic service charges are recognized over the service period.
|
|
Management of the Company
Because of inherent limitations in any system of internal control,systems, no matter how well designed, misstatements due have inherent
Managementthe Company’s
The effectiveness of the Company’s internal control over financial reporting as of December 31, 2018 has been audited by Elliott Davis, LLC, the independent
annual report.
Report
|
As of December 31, 2018 the Company had no compensation plans under which equity securities of the Company are authorized for issuance.
|
|
2019 2019 2019 2019 20182020 and 201720182020 and 201720182020 and 201720182020 and 201720182020 and 20172019(b)Exhibits*The certifications attached as exhibits 32.1 and 32.2 to this annual report on Form10-K are “furnished” to the Securities and Exchange Commission pursuant to Section 906 of the Sarbanes-Oxley Act of 2002 and shall not be deemed “filed” by the Company for purposes of Section 18 of the Securities Exchange Act of 1934, as amended.(c)Financial Statement Schedules
|
|
| ||
|
| |||
|
| |||
| ||||
| ||||
| ||||
| ||||
| ||||
| ||||
| ||||
| ||||
| ||||
112