UNITED STATES
SECURITIES AND EXCHANGE COMMISSION
WASHINGTON, D.C. 20549
FORM
10-K
THE SECURITIES EXCHANGE ACT OF 1934
For the Fiscal Year Ended December 31, 2019
OR
OF THE SECURITIES EXCHANGE ACT OF 1934
For the Transition Period From
____________ to
Commission File Number1-6541
LOEWS CORPORATION
(Exact name of registrant as specified in its charter)
Delaware | 13-2646102 | |||||
(State or other jurisdiction of | (I.R.S. Employer | |||||
Identification No.) | ||||||
667 Madison Avenue, New York, N.Y.
NY 10065-8087
(Address of principal executive offices) (Zip Code)
(212)
521-2000
(Registrant’s telephone number, including area code)
Securities registered pursuant to Section 12(b) of the Act:
Title of each class | Trading Symbol(s) | Name of each exchange on which registered | ||||||||
Common stock, par value $0.01 per share | L | New York Stock Exchange | ||||||||
Securities registered pursuant to Section 12(g) of the Act: None
Indicate by check mark if the registrant is a well-known seasoned issuer, as defined in Rule 405 of the Securities Act.
| Yes | ☒ | No ☐ | ||||||
Indicate by check mark if the registrant is not required to file reports pursuant to Section 13 or Section 15(d) of the Act.
| Yes | ☐ | No | ☒ | ||||||||
Indicate by check mark whether the registrant (1) has filed all reports required to be filed by Section 13 or 15 (d) of the Securities Exchange Act of 1934 during the preceding 12 months (or for such shorter period that the registrant was required to file such reports), and (2) has been subject to such filing requirements for the past 90 days.
| Yes | ☒ | No | ☐ | |||||||||||
Indicate by check mark whether the registrant has submitted electronically every Interactive Data File required to be submitted pursuant to Rule 405 of Regulation
S-T
during the preceding 12 months (or for such shorter period that the registrant was required to submit such files).| Yes | ☒ | No | ☐ | |||||||||||
Indicate by check mark whether the registrant is a large accelerated filer, an accelerated filer, a
non-accelerated
filer, a smaller reporting company, or an emerging growth company. See the definitions of “large accelerated filer,” “accelerated filer,” “smaller reporting company,” and “emerging growth company” in Rule12b-2
of the Exchange Act.| Large accelerated filer | ☒ | Accelerated filer | ☐ | Non-accelerated filer | ☐ | Smaller reporting company | ☐ | ||||||||||||||||
| Emerging growth company | ☐ | ||||
If an emerging growth company, indicate by check mark if the registrant has elected not to use the extended transition period for complying with any new or revised financial accounting standards provided pursuant to Section 13(a) of the Exchange Act.
☐ | ||||||||
☒ | ||||||||
Indicate by check mark whether the registrant is a shell company (as defined in Rule
12b-2
of the Exchange Act).| Yes | ☐ | No | ☒ | ||||||||
The aggregate market value of common stock held by28, 2019,30, 2021, the last business day of the registrant’s most recently completed second fiscal quarter, was approximately $14,174,000,000.
$11,876,000,000.non-affiliates
of the registrant as of June As of February 7, 2020,4, 2022, there were 287,770,405248,202,443 shares of the registrant’s common stock outstanding.
Documents Incorporated by Reference:
Portions of the registrant’s definitive proxy statement for the 20202022 annual meeting of shareholders intended to be filed by the registrant with the Commission not later than 120 days after the close of its fiscal year are incorporated by reference into Part III of this Report.
| 1 | ||||||||
LOEWS CORPORATION
INDEX TO ANNUAL REPORT ON
FORM
10-K
FILED WITH THESECURITIES AND EXCHANGE COMMISSION
For the Year Ended December 31, 2019
Item | Page | |||||||
No. | No. | |||||||
1 | ||||||||
3 | ||||||||
7 | ||||||||
9 | ||||||||
13 | ||||||||
14 | ||||||||
15 | ||||||||
15 | ||||||||
1A | 16 | |||||||
1B | 44 | |||||||
2 | 44 | |||||||
3 | 44 | |||||||
4 | 44 | |||||||
5 | 45 | |||||||
6 | 47 | |||||||
7 | 48 | |||||||
7A | 79 | |||||||
8 | 83 | |||||||
9 | 162 | |||||||
9A | 162 | |||||||
9B | 162 | |||||||
10 | 162 | |||||||
11 | 163 | |||||||
12 | 163 | |||||||
13 | 163 | |||||||
14 | 163 | |||||||
15 | 164 | |||||||
16 | 167 | |||||||
2021
| Item No. | Page No. | |||||||
| 9C | ||||||||
| 2 | ||||||||
FORWARD-LOOKING STATEMENTS
Investors are cautioned that certain statements contained in this Report as well as in other filings with the Securities and Exchange Commission (“SEC”) and periodic press releases made by us and our subsidiaries and certain oral statements made by us and our subsidiaries and our and their officers during presentations may constitute “forward-looking statements” within the meaning of the Private Securities Litigation Reform Act of 1995 (the “Act”). Forward-looking statements include any statement that does not directly relate to any historical or current fact. Forward-looking statements may project, indicate or imply future results, events, performance or achievements, and such statements may contain the words “expect,” “intend,” “plan,” “anticipate,” “estimate,” “believe,” “will be,” “will continue,” “will likely result,” and similar expressions. In addition, any statement concerning future financial performance (including future revenues, earnings or growth rates), ongoing business strategies or prospects, and possible actions taken by us or our subsidiaries are also forward-looking statements as defined by the Act. Forward-looking statements are based on current expectations and projections about future events and are inherently subject to a variety of risks and uncertainties, many of which are beyond our or our subsidiaries’ control, that could cause actual results to differ materially from those anticipated or projected.
Developments in any of the risks or uncertainties facing us or our subsidiaries, including those summarized under the heading “Risk Factors Summary” below and described more fully under Item 1A, Risk Factors of this Report and in our and our subsidiaries’ other filings with the SEC, could cause our and our subsidiaries’ results to differ materially from results that have been or may be anticipated or projected. Given these risks and uncertainties, investors should not place undue reliance on forward-looking statements. Forward-looking statements speak only as of the date they are made and we and our subsidiaries expressly disclaim any obligation or undertaking to update these statements to reflect any change in expectations or beliefs or any change in events, conditions or circumstances on which any forward-looking statement is based.
Unless the context otherwise requires, the term “Company” as used herein means Loews Corporation including its subsidiaries, the terms “Parent Company,” “we,” “our,” “us” or like terms as used herein mean Loews Corporation excluding its subsidiaries and the term “subsidiaries” means our consolidated subsidiaries.
RISK FACTORS SUMMARY
Our business and the businesses of our subsidiaries face many risks and uncertainties. These risks and uncertainties could lead to events or circumstances that have a material adverse effect on our business, results of operations, cash flows, financial condition or equity and/or the business, results of operations, cash flows, financial condition or equity of one or more of our subsidiaries. You should carefully review and consider the full discussion of our risk factors described under Item 1A, Risk Factors of this Report, before investing in any security issued by us. Principal risks facing us and our subsidiaries include those relating to:
Risks Related to Us and Our Subsidiary, CNA Financial Corporation (“CNA”)
•CNA may need to increase its insurance reserves if it determines that its recorded reserves are insufficient;
•CNA’s actual experience could vary from the key assumptions used to determine active life reserves for its long term care policies;
•CNA’s vulnerability to material losses from natural and man-made disasters or other catastrophes;
•The impact of the coronavirus disease (“COVID-19”) on CNA;
•CNA’s exposure related to asbestos and environmental pollution (“A&EP”) claims;
•CNA’s exposure to mass tort product liability claims, changes to the social and legal environment, issues related to altered interpretation of coverage and other new and emerging claim theories;
•Intense competition in CNA’s industry; the cyclical nature of the property and casualty business and the evolving landscape of its distribution network;
•Risks relating to CNA’s reliance on reinsurance, including risks related to its ability to obtain sufficient reinsurance at a cost or on terms and conditions it deems acceptable, reinsurance counterparty risk and ineffective reinsurance coverage;
•Technological changes or disruptions in the insurance marketplace;
•Potential significant realized and unrealized investment losses and volatility in net investment income;
•CNA’s use of analytical models in key areas such as pricing, reserving catastrophe risks and capital modeling;
•Any significant interruption in the operation of CNA’s business functions, facilities and systems or its vendors’ facilities and systems could result in a material adverse effect on its operations;
| 3 | ||||||||
•Any significant breach in CNA’s data security infrastructure or its vendors’ facilities and systems could disrupt business, cause financial losses and damage its reputation, and insurance coverage may not be available for claims related to a breach;
•CNA’s potential inability to detect and prevent significant employee or service provider misconduct, inadvertent errors and omissions, or exposure relating to functions performed on CNA’s behalf;
•Capital adequacy requirements that CNA is subject to;
•Regulatory limitations on CNA’s insurance subsidiaries ability to pay dividends to CNA;
•Potential downgrades of CNA’s ratings by rating agencies; and
•Extensive state, local, federal and foreign governmental regulations to which CNA is subject.
Risks Related to Us and Our Subsidiary, Boardwalk Pipeline Partners, LP (“Boardwalk Pipelines”)
•Extensive regulation by the Federal Energy Regulatory Commission (“FERC”) of Boardwalk Pipelines’ natural gas transportation and storage operations;
•Boardwalk Pipelines’ and its customers’ operations are subject to a series of risks regarding climate change;
•Climatic conditions could adversely impact Boardwalk Pipelines’ operations, pipelines and facilities, or those of its customers or suppliers;
•Legislative and regulatory initiatives relating to pipeline safety;
•Actual results from Boardwalk Pipelines’ construction and growth projects not meeting its forecasts;
•Opposition to the operation of Boardwalk Pipelines’ pipelines and facilities or construction or expansion of new pipeline projects;
•The price differentials between natural gas supplies and market demand and the potentially resulting reduction in the transportation rates that Boardwalk Pipelines can charge on certain of its pipeline systems;
•Changes in energy commodity prices and their impact on the supply of and demand for those commodities;
•Boardwalk Pipelines’ exposure to credit risk relating to default or bankruptcy by its customers;
•Operating and financial covenants in Boardwalk Pipelines’ revolving credit facility;
•Boardwalk Pipelines’ substantial indebtedness;
•Limited access to the debt markets and increases in interest rates;
•The impact of COVID-19 on Boardwalk Pipelines;
•Boardwalk Pipelines does not own all of the land on which its pipelines and facilities are located;
•Boardwalk Pipelines may be unsuccessful in executing its strategy to grow and diversify its business;
•The impact of market conditions on Boardwalk Pipelines’ ability to replace expiring storage contracts at attractive rates or on a long-term basis and to sell short-term services at attractive rates or at all; and
•Boardwalk Pipelines’ operations are subject to catastrophic losses, operational hazards and unforeseen interruptions for which it may not be adequately insured.
Risks Related to Us and Our Subsidiary, Loews Hotels Holding Corporation (“Loews Hotels & Co”)
•The impact of COVID-19 on Loews Hotels & Co;
•Operating risks common to the hospitality industry, including competition, availability of labor, supply chain disruptions, excess supply of rooms in a given market, and dependence on travel and tourism;
•Loews Hotels & Co’s exposure to risks resulting from significant investments in owned and leased real estate;
•Seasonal and cyclical volatility in the hospitality industry;
•The high level of competition in the hospitality industry, both for customers and for acquisitions and developments of new properties;
•The risk of deterioration in the quality or reputation of Loews Hotels & Co’s brands;
•The potential for delays or increased costs in connection with developing and renovating properties;
•Co-investments in properties, which could decrease Loews Hotels & Co’s ability to manage risk;
•The geographic concentration of Loews Hotels & Co’s properties;
•The growth and use of alternative reservation channels;
•The adequacy of Loews Hotels & Co’s insurance coverage;
•Potential labor shortages; and
•Portions of Loews Hotels & Co’s labor force are covered by collective bargaining agreements.
Risks Related to Us and Our Subsidiary, Altium Packaging LLC (“Altium Packaging”)
•The impact of COVID-19 on Altium Packaging;
•Altium Packaging’s substantial indebtedness;
•Altium Packaging’s exposure to changes in consumer preferences;
| 4 | ||||||||
•Fluctuations in raw material prices and raw material availability; and
•Self-manufacturing by Altium Packaging’s customers.
Risks Related to Us and Our Subsidiaries Generally
•The impact of COVID-19 on the way we and our subsidiaries operate;
•Failures or interruptions in or breaches to our or our subsidiaries’ computer systems;
•Litigation to which we and our subsidiaries may be subject from time to time;
•Acts of terrorism;
•Compliance with environmental laws;
•Potential loss of key vendor relationships or issues relating to the transitioning of vendor relationships;
•Impairment charges related to the carrying value of long-lived assets and goodwill of our subsidiaries;
•We are a holding company and derive substantially all of our income and cash flow from our subsidiaries;
•Competition for senior executives and qualified specialized talent; and
•Increasing scrutiny and changing expectations from stakeholders with respect to environmental, social and governance practices may impose additional costs on us and our subsidiaries or expose us and our subsidiaries to new or additional risks.
PART I
Item 1. Business.
Loews Corporation was incorporated in 1969 and is a holding company. Our subsidiaries are engaged in the following lines of business:
•commercial property and casualty insurance (CNA Financial Corporation, an 89%89.6% owned subsidiary);
•transportation and storage of natural gas and natural gas liquids (Boardwalk Pipeline Partners, LP, a wholly owned subsidiary); and
•operation of a chain of hotels (Loews Hotels Holding Corporation, a wholly owned subsidiary); and.
We also own 52.7% of Altium Packaging LLC, which is engaged in the manufacture of rigid plastic packaging solutions (Altium Packaging LLC, formerly known as Consolidated Container Company LLC, a 99% owned subsidiary).solutions.
CNA FINANCIAL CORPORATION
CNA Financial Corporation (together with its subsidiaries, “CNA”) is an insurance holding company. CNA’s property and casualty and remaining life and group insurance operations are primarily conducted by Continental Casualty Company (“CCC”), The Continental Insurance Company, Western Surety Company, CNA Insurance Company Limited, Hardy Underwriting Bermuda Limited and its subsidiaries (“Hardy”) and CNA Insurance Company (Europe) S.A. CNA accounted for 72.3%81.2%, 72.0%86.0% and 69.8%72.3% of our consolidated total revenue for the years ended December 31, 2019, 20182021, 2020 and 2017.
2019.CNA’s insurance products primarily include commercial property and casualty coverages, including surety. CNA’s services include warranty, risk management, information services and claims administration. CNA’s products and services are primarily marketed through independent agents, brokers and managing general underwriters to a wide variety of customers, including small, medium and large businesses, insurance companies, associations, professionals and other groups. The property and casualty insurance industry is highly competitive, both as it relates to rate and service. CNA competes with a large number of stock and mutual insurance companies, as well as other entities, for both distributors and customers.
| 5 | ||||||||
Property & Casualty Operations
CNA’s commercial property and casualty insurance operations (“Property & Casualty Operations”) includes its Specialty, Commercial and International lines of business.
Specialty
Specialty provides management and professional liability and other coverages through property and casualty products and services using a network of brokers, independent agencies and managing general underwriters. Specialty includes the following business groups:
Management & Professional Liability
•professional liability coverages and risk management services to various professional firms, including architects, real estate agents, accounting firms and law firms;
•directors and officers (“D&O”), employment practices, fiduciary and fidelity coverages. Specific areas of focus include small and
mid-size
firms, public as well as privately held firms andnot-for-profit
organizations;•insurance products to serve the health care industry, including professional and general liability as well as associated standard property and casualty coverages. Key customer groups include aging services, allied medical facilities, dentists, physicians, hospitals, nurses and other medical practitioners.
Surety
Warranty and Alternative Risks
Commercial
Commercial works with a network of brokers and independent agents to market a broad range of property and casualty insurance products to all types of insureds, targeting small business, construction, middle markets and services to small, middle-market and large businesses.other commercial customers. Property products include standard and excess property, marine and boiler and machinery coverages. Casualty products include standard casualty insurance products such as workers’ compensation, general and product liability, commercial auto and umbrella coverages. Most insurance programs are provided on a guaranteed cost basis; however, CNA also offers specialized loss-sensitive insurance programs and total risk management services relating to claim and information services to the large commercial insurance marketplace. These property and casualtyproducts are presented in the following insurance groups: Middle Market, Small Business and Other Commercial insurance groups.
International
International underwrites property and casualty coverages on a global basis through its twoa branch operation in Canada, a European business consisting of insurance companies based in the United Kingdom and Luxembourg a branch operation in Canada as well as throughand Hardy, CNA’s Lloyd’s of London (“Lloyd’s”) syndicate. Underwriting activities are managed through three business units that operate across all locations: Property and Energy & Marine, Casualty and Specialty. International is managed from headquarters in London.
Property & Casualty Structure
CNA’s commercial property & casualty underwriting operations presence in the United States of America (“U.S.”) consists of field underwriting locations and centralized processing operations which handle policy processing, billing and collection activities and also act as call centers to optimize service. CNA’s claim operations presence in the U.S. consists of primary locations where it handles multiple claim types and key business functions, as well as regional claim offices which
| 6 | ||||||||
are aligned with CNA’s underwriting field structure. CNA also has property & casualty underwriting operations in Canada, the United Kingdom (“U.K.”) and Continental Europe, as well as access to business placed at Lloyd’s through Syndicate 382.
Other Insurance Operations
Other Insurance Operations include CNA’s run-off long term care business that is inrun-off,as well as structured settlement obligations not funded by annuities related to certain property and casualty claimants, certain corporate expenses, including interest on CNA corporate debt, and certain property and casualty businesses inasbestos and environmental pollution (“A&EP”).certain legacy mass tort reserves.
run-off,
including CNA Re, A&EP, a legacy portfolio of excess workers’ compensation (“EWC”) policies and Current Regulation:
As CNA’s insurance operations are conducted in both domestic and foreign jurisdictions, CNA is subject to a number of regulatory agency requirements applicable to a portion, or all, of CNA’s operations. These include but are not limited to, the State of Illinois Department of Insurance (which is CNA’s global group-wide supervisor), the U.K. Prudential Regulatory Authority and Financial Conduct Authority, the Office of Superintendent of Financial Institutions in Canada, the Luxembourg insurance regulator Commissariat aux Assurances and the Bermuda Monetary Authority.
The U.S. and foreign regulatory environment in which CNA operates is evolving on an ongoing basis and impacts aspects of corporate governance, risk management practices, public disclosures and cyber security. CNA continues to invest in the security of its systems and in its technology infrastructure on an enterprise-wide basis.
Domestic insurers are also required by state insurance regulators to provide coverage to certain insureds who would not otherwise be considered eligible by the insurers. Each state dictates the types of insurance and the level of coverage that must be provided to such involuntary risks. CNA’s share of these involuntary risks is mandatory and generally a function of its respective share of the voluntary market by line of insurance in each state.
Further, domestic insurance companies are subject to state guaranty fund and other insurance-related assessments. Guaranty funds are governed by state insurance guaranty associations which levy assessments to meet the funding needs of insolvent insurer estates. Other insurance-related assessments are generally levied by state agencies to fund various organizations including disaster relief funds, rating bureaus, insurance departments, and workers’ compensation second injury funds, orand by industry organizations that assist in the statistical analysis and ratemaking process and CNA has the ability to recoup certain of these assessments from policyholders.
Although the U.S. federal government does not currently directly regulate the business of insurance, federal legislative and regulatory initiatives can affect the insurance industry. These initiatives and legislation include proposals relating to terrorism and natural catastrophe exposures, cybersecurity risk management, federal financial services reforms and certain tax reforms.
Hardy, a specialized Lloyd’s underwriter, is also supervised by the Council of Lloyd’s, which is the franchisor for all Lloyd’s operations. The Council of Lloyd’s has wide discretionary powers to regulate Lloyd’s underwriting, such as establishing the capital requirements for syndicate participation. In addition, the annual business plan of each syndicate is subject to the review and approval of the Lloyd’s Franchise Board, which is responsible for business planning and monitoring for all syndicates.
Capital adequacy and risk management regulations, referred to as Solvency II, apply to CNA’s European operations and are enacted by the European Commission, the executive body of the European Union (“E.U.”). Additionally, the International Association of Insurance Supervisors (“IAIS”) continues to develop capital requirements as more fully discussed below.
| 7 | ||||||||
Regulation Outlook:
The National Association of Insurance Commissioners (“NAIC”) has developed an approach to group capital regulation and solvency-monitoring activities using the Group Capital Calculation (“GCC”). While the current U.S. regulatory regime is based on legal entity regulation, the GCC will quantify risk across the insurance group and also provide additional financial information to regulators to assess the financial condition of non-insurance entities. The GCC was adopted by the NAIC along with model legislative language designed to enable the framework once implemented by state legislatures. Alongside the GCC, the NAIC is also working with other interested jurisdictions, both domestic and international, to develop an Aggregation Method (“AM”) approach to assessing group capital. The AM is influenced by the GCC and calculated in a similar manner. By 2024, the IAIS will be assessing whether the AM provides comparable outcomes to the consolidated group insurance capital standard (“ICS”) being developed for use with IAIGs.
There have also been definitive developments with respect to prudential insurance supervision unrelated to the IAIS activities. On September 22, 2017, the U.S. Treasury Department, the U.S. Trade Representative (“USTR”) and the E.U. announced they had formally signed a covered agreement on Prudential Measures Regarding Insurance and Reinsurance(“ (“U.S.-E.U.Covered Agreement”). The(“ (“U.S.-U.K.Covered Agreement”). This Agreement has similar terms as theAgreement, and will become effective upon the U.K.’s exit from the E.U.
U.S.-E.U.
Covered Agreement requires U.S. states to prospectively eliminate the requirement that domestic insurance companies must obtain collateral from E.U. reinsurance companies that are not licensed in their state (alien reinsurers) in order to obtain reserve credit under statutory accounting. In exchange, the E.U. will not impose local presence requirements on U.S. firms operating in the E.U., and effectively must defer to U.S. group capital regulation for these firms. On December 18, 2018, the U.S. Treasury Department, the USTR, and the U.K. announced they formally signed the Bilateral Agreement on Prudential Measures Regarding Insurance and ReinsuranceU.S.-E.U.
Covered Agreement. Because these covered agreements are not self-executing, U.S. state laws will need to be revised to change reinsurance collateral requirements to conform to the provisions within each of the agreements. In addition, the National Association of Insurance Commissioners (“NAIC”) is currently developing an approach to group capital regulation as the current U.S. regulatory regime is based on legal entity regulation. Both the
The reinsurance collateral requirement change and adoption of group capital regulation must be effected by the states within five years from the signing of the Covered Agreements,covered agreements, which is September 1, 2022, or states risk federal preemption.preemption in this area. CNA will monitorhas been monitoring the modification of state laws and regulations in order to comply with the provisions of the Covered Agreementscovered agreements and assess potential effects on its operations and prospects.
The advancement of environmental, social and governance (“ESG”) frameworks intended to promote sustainable and inclusive development of insurance markets has been an area of focus for standard setters and regulatory bodies at the state, federal and international level. CNA continues to monitor the expansion of policy in this area and has established an internal ESG Committee and task force to seek to ensure compliance with future regulation, and assess and seek to implement best practices in response to the emerging guidance.
Properties:
BOARDWALK PIPELINE PARTNERS, LP
Boardwalk Pipeline Partners, LP (together with its subsidiaries, “Boardwalk Pipelines”) is engaged in the business of transportation and storage of natural gas and natural gas liquids and hydrocarbons (herein referred to together as “NGLs”) transportation and storage.. Boardwalk Pipelines accounted for 8.7%9.2%, 8.7%10.3% and 9.6%8.7% of our consolidated total revenue for the years ended December 31, 2019, 20182021, 2020 and 2017.
2019.A wholly owned subsidiary of ours, Boardwalk Pipelines Holding Corp. (“BPHC”) owns, directly and indirectly, the General Partner interest and all100% of the general partner and limited partnership interests of Boardwalk Pipelines.
Boardwalk Pipelines owns and operates approximately 13,61013,615 miles of interconnected natural gas pipelines directly serving customers in 13thirteen states and indirectly serving customers throughout the northeastern and southeastern U.S. through numerous interconnections with unaffiliated pipelines. Boardwalk Pipelines also owns and operates approximately 445450 miles of NGL pipelines in Louisiana and Texas. In 2019,2021, its pipeline systems transported approximately 2.93.4 trillion cubic feet of natural gas and approximately 86.690.4 million barrels (“MMBbls”) of NGLs. Average daily throughput on Boardwalk Pipelines’ natural gas pipeline systems during 20192021 was approximately 8.09.4 billion cubic feet (“Bcf”).
| 8 | ||||||||
Boardwalk Pipelines’ natural gas storage facilities are comprised of 14fourteen underground storage fields located in four states with aggregate working gas capacity of approximately 205.0213.0 Bcf and Boardwalk Pipelines’ NGL storage facilities consist of 11eleven salt dome storage caverns located in Louisiana with an aggregate storage capacity of approximately 31.832.1 MMBbls. Boardwalk Pipelines also owns sevennine salt dome caverns and related brine infrastructure for use in providing brine supply services and to support the NGL storage operations.
Boardwalk Pipelines’Pipelines’principal pipeline and storage systems are described below:
The Gulf South Pipeline Company, LLC (“Gulf South”), effective January 1, 2020, converted from a limited partnership to a limited liability company. Immediately subsequent to the conversion, Boardwalk Pipelines’ Gulf Crossing Pipeline Company LLC, (“Gulf Crossing”) operating subsidiary was merged into Gulf South. The merged pipeline system runs approximately 7,3607,365 miles along the Gulf Coast in the states of Oklahoma, Texas, Louisiana, Mississippi, Alabama and Florida. The pipeline system has a10.510.9 Bcf per day and average daily throughput for the year ended December 31, 20192021 was 4.96.2 Bcf per day. Gulf South has ten natural gas storage facilities. The two natural gas storage facilities located in Louisiana and Mississippi have approximately 83.591.5 Bcf of working gas storage capacity and the eight salt dome natural gas storage caverns in Mississippi have approximately 46.0 Bcf of total storage capacity, of which approximately 29.6 Bcf is working gas capacity. Gulf South also owns undeveloped land which is suitable for up to five additional storage caverns.
peak-day
delivery capacity of The Texas Gas Transmission, LLC (“Texas Gas”) pipeline system, a bi-directional pipeline, runs approximately 5,9805,970 miles and is located in Louisiana, East Texas, Arkansas, Mississippi, Tennessee, Kentucky, Indiana and Ohio with smaller diameter lines extending into Illinois. The pipeline system has a5.45.8 Bcf per day and average daily throughput for the year ended December 31, 20192021 was 3.13.2 Bcf per day. Texas Gas owns nine natural gas storage fields with 84.3 Bcf of working gas storage capacity.
peak-day
delivery capacity of Boardwalk Louisiana Midstream, LLC and Boardwalk Petrochemical Pipeline, LLC (collectively “Louisiana Midstream”) provide transportation and storage services for natural gas, NGLs and ethylene, fractionation services for NGLs and brine supply services. These assets provide approximately 48.548.7 MMBbls of salt dome storage capacity, including approximately 7.6 Bcf of working natural gas storage capacity, significant brine supply infrastructure, and approximately 285 miles of pipeline assets. Louisiana Midstream owns and operates the Evangeline Pipeline (“Evangeline”), which is an approximately 175180 mile interstate ethylene pipeline that is capable of transporting approximately 4.2 billion pounds of ethylene per year between Texas and Louisiana, where it interconnectswith interconnections with its ethylene distribution system. Throughput for Louisiana Midstream was 86.690.4 MMBbls for the year ended December 31, 2019.
In 2021, Boardwalk Pipelines has been engaged in several growth projects. Since 2016, Boardwalk Pipelines has placed into service severalapproximately $137 million of growth projects that represent more than $1.6 billionwhich primarily represents approximately 0.2 Bcf per day of total capital expenditures and provide more than 3.1 Bcf offirm natural gas transportation capacity, to producers, power plantscompressor station modernization and an LNG export facility. These projects include Boardwalk Pipelines’ Northern Supply Access, Coastal Bend Header, Sulphur Storage and Pipeline Expansion and two power plant projects, one in Louisiana and one in Texas.additional NGLs infrastructure. Boardwalk Pipelines expects to spend approximately $460$410 million on its growth projects currently under construction through 2022 that2024 and will add approximately 0.6 Bcf per day of firm natural gas transportation capacity and additional NGLs infrastructure. Those projects are expected to serve increased natural gas demand from natural gasend-userssuch as power generation plants and industrials, as well as liquids demand from petrochemical facilities. Collectively, these projects represent approximately 1.2 Bcf per day of natural gas transportation toend-users.These growth projects include two projects that will provide firm transportation services to new power plant customers, one in Mississippi and one in Texas. Boardwalk Pipelines is also progressing with the construction of several NGL growth projects that are expected to provide transportation and storage services and brine supply services to petrochemical and industrial customers in southern Louisiana. All of Boardwalk Pipelines’ growth projects are secured by long-term firm contracts.
Customers:
end-users.
These customers are located throughout the Gulf Coast, Midwest and Northeast regions of the U.S. Boardwalk Pipelines’ delivery market has diversified over time, with end-use
customers, whereas, historically its delivery markets were primarily to other pipelines who then delivered toend-use
customers.Governmental Regulation:
Pipelines for storage services on Texas Gas, with the exception ofexcept for services associated with a portion of the working gas capacity on that system, are also established through the FERC’s cost-based rate-making process. The FERC has authorized Boardwalk Pipelines to charge market-based rates for its firm and interruptible storage services for the majority of its other natural gas
| 9 | ||||||||
storage facilities. None of Boardwalk Pipelines’ FERC-regulated entities currently have an obligation to file a new rate case and Gulf South is prohibited from filing a rate case until May 1, 2023, subject to certain exceptions. Texas Intrastate transports
Some of Boardwalk Pipelines’ other subsidiaries transport natural gas in intrastate commerce under the rules and regulations established by the Texas Railroad Commission and in interstate commerce that is subject to FERC jurisdiction under Section 311 of the NGPA. The maximum rates for services are established under Section 311 of the NGPA and are generally subject to review every five years by the FERC.
The FERC issued a Notice of Inquiry (“NOI”) on April 19, 2018 (“2018 NOI”) initiating a review of its policies on certification of natural gas pipelines, including an examination of its long-standing Policy Statement on Certification of New Interstate Natural Gas Pipeline Facilities (“1999 Policy Statement”), issued in 1999, that is used to determine whether to grant certificates for new pipeline projects. On February 18, 2021, the FERC issued another NOI (“2021 NOI”), reopening its review of the 1999 Policy Statement. Comments on the 2021 NOI were due on May 26, 2021, and although the FERC has not taken any further action regarding the 2018 NOI or 2021 NOI, Boardwalk Pipelines is unable to predict what, if any, changes may be proposed as a result of the NOIs that will affect its natural gas pipeline operations or when such proposals, if any, might become effective.
The Surface Transportation Board (“STB”) regulates the rates Boardwalk Pipelines charges for interstate service on its ethylene pipelines. The Louisiana Public Service Commission (“LPSC”) regulates the rates Boardwalk Pipelines charges for intrastate service within the state of Louisiana on its petrochemical and NGL pipelines. The STB and LPSC require that Boardwalk Pipelines’ transportation rates are reasonable and that its practices cannot unreasonably discriminate among its shippers.
Boardwalk Pipelines is also regulated by the U.S. Department of Transportation (“DOT”) through the Pipeline and Hazardous MaterialMaterials Safety Administration (“PHMSA”) under the Natural Gas Pipeline Safety Act of 1968, as amended (“NGPSA”) and the Hazardous Liquids Pipeline Safety Act of 1979, as amended (“HLPSA”). The NGPSA and HLPSA govern the design, installation, testing, construction, operation, replacement and management of interstate natural gas and NGL pipeline facilities. Boardwalk Pipelines has authority from PHMSA to operate certain natural gas pipeline assets under issued permits with specific conditions that allow it to operate those pipeline assets at higher than normal operating pressures of up to 0.80 of the pipeline’s Specified Minimum Yield Strength (“SMYS”). Operating at these pressures allows these pipelines to transport all of the existing natural gas volumes Boardwalk Pipelines has contracted for on those facilities with its customers. PHMSA retains discretion whether to grant or maintain authority for Boardwalk Pipelines to operate its natural gas pipeline assets at higher pressures and, in the event that PHSMAPHMSA should elect not to allow Boardwalk Pipelines to operate at these higher pressures, it could affect its ability to transport all of its contracted quantities of natural gas on these pipeline assets, and Boardwalk Pipelines could incur significant additional costs to reinstate this authority or to develop alternate ways to meet its contractual obligations.
PHMSA’s regulations also require transportation pipeline operators to implement integrity management programs to comprehensively evaluate certain high risk areas, known as high consequence areas (“HCAs”), high-population areas (also known as and moderate consequence areas (“MCAs”), as well as Class 3 and Class 4 areas, which are determined by specific population densities near Boardwalk Pipelines’ pipelines), certain drinking water sources and unusually sensitive ecological areas, along Boardwalk Pipelines’ pipelines and take additional safety measures to protect people and property in these areas. The HCAs for natural gas pipelines are predicated on high-population density areas (which, for natural gas transmission lines, include Class 3 and 4 areas and, depending on the potential impacts of a risk event, may include Class 1 and 2 areas) whereas HCAs along Boardwalk Pipelines’ NGL pipelines are based on high-population density areas, areas near certain drinking water sources and unusually sensitive ecological areas.
Legislation in the past decade has resulted in more stringent mandates for pipeline safety and has charged PHMSA with developing and adopting regulations that impose increased pipeline safety requirements on pipeline operators. In particular, the NGPSA and HLPSA were amended by the Pipeline Safety, Regulatory Certainty, and Job Creation Act of 2011 (“2011 Act”) and, the Protecting Our Infrastructure of Pipelines and Enhancing Safety Act of 2016 (“2016 Act”) and, most recently, the Protecting Our Infrastructure of Pipelines and Enhancing Safety Act of 2020 (“2020 Act”). Each of these laws imposed increased pipeline safety obligations on pipeline operators. The 2011 Act increased the penalties for safety violations, established additional safety requirements for newly constructed pipelines and required studies of safety issues that could result in the adoption of new regulatory requirements by PHMSA for existing pipelines. The 2016 Act, extended PHMSA’s statutory mandate through September of 2019 and, among other things, required PHMSA to complete its outstanding mandates under the 2011 Act and develop new safety standards for natural gas storage facilities. The 2020 Act reauthorized PHMSA through fiscal year 2023 and directed the agency to move forward with several regulatory initiatives, including obligating operators of non-rural gas gathering lines and new and existing transmission and distribution pipeline facilities in 2018. Pursuant to conduct certain leak detection and repair programs and to require facility inspection and maintenance plans to align with those requirements.
With the adoption of the 2011 Act, the 2016 Act in Decemberand the 2020 Act, there exist mandates for PHMSA to make pipeline safety requirements more stringent. As a result, PHMSA has issued a series of 2016,significant rulemakings. In October of 2019, PHMSA published an interima final rule imposing numerous new requirements on onshore gas transmission pipelines relating to
| 10 | ||||||||
maximum allowable operating pressure (“MAOP”) reconfirmation and exceedance reporting, the integrity assessment of additional pipeline mileage found in MCAs and Class 3 and Class 4 non-HCAs by 2033, and the consideration of seismicity as a risk factor in integrity management. PHMSA published a second final rule in October of 2019 for hazardous liquid transmission and gathering pipelines that addressedsignificantly extends and expands the reach of certain of its integrity management requirements, and that requires the accommodation of in-line inspection tools by 2039 unless the pipeline cannot be modified to permit such accommodation, increased annual, accident and safety-related conditional reporting requirements, and expanded use of leak detection systems beyond HCAs. PHMSA also published final rules during February and July of 2020 that amended the minimum safety issuesrequirements related to natural gas storage facilities, including wells, wellbore tubing and casing. However, in Junecasing, and added applicable reporting requirements. In November of 2017,2021, PHMSA temporarily suspended specified enforcement actions pertaining to provisions of the December 2016 interim final rule, as PHMSA announced it would reconsider the interim final rule, and subsequentlyre-openedthe rule to public comment in October of 2017. The rule has yet to be finalized. In October of 2019, PHMSA released its “Enhanced Emergency Order Procedures” final rule, which replaced an interim final rule issued by the agency in2016 and empowers PHMSA to respond to imminent hazards by imposing emergency restrictions, prohibitions and safety measures on owners and operators of gas or hazardous liquid pipeline facilities without prior notice or an opportunity for a hearing. In 2016, PHMSA published a proposed rulemaking that would impose new or more stringent requirements for certain natural gas pipelines including, expanding certain of PHMSA’s current regulatory safety programs for natural gas lines in MCAs that do not qualify as HCAs and requiring maximum allowable operating pressure (“MAOP”) validation throughre-verificationof all historical records for pipelines in service, which may require natural gas pipelines installed before 1970 (previously excluded from certain pressure testing obligations) to be pressure tested. However, PHMSA has since decided to split this proposed rule which has become known as the “gas Mega Rule,” into three separate rulemaking proceedings. The first of these three rulemakings, relating to onshore gas transmission pipelines, was published as a final rule that will impose safety regulations on October 1, 2019,approximately 400,000 miles of previously unregulated onshore gas gathering lines that, among other things, will impose criteria for inspection and imposes numerousrepair of fugitive emissions, extend reporting requirements including MAOP reconfirmation,to all gas gathering operators and apply a set of minimum safety requirements to certain gas gathering pipelines with large diameters and high operating pressures. Separately in June 2021, PHMSA issued an Advisory Bulletin advising pipeline and pipeline facility operators of applicable requirements to update their inspection and maintenance plans for the periodic assessmentelimination of additionalhazardous leaks and minimization of natural gas released from pipeline mileage outside of HCAs (in MCAs as well as Class 3 and Class 4 areas), the reporting of exceedances of MAOP and the consideration of seismicity as a
Boardwalk Pipelines’ operations are also subject to extensive federal, state, and local laws and regulations relating to protection of the environment and occupational health and safety. Such laws and regulations impose, among other things, restrictions, liabilities and obligations in connection with the generation, handling, use, storage, transportation, treatment and disposal of various substances including hazardous substances and waste and in connection with spills, releases, discharges and emissions of various substances into the environment. Environmental regulations also require that Boardwalk Pipelines’ facilities, sites and other properties be operated, maintained, abandoned and reclaimed to the satisfaction of applicable regulatory authorities. Occupational health and safety regulations establish standards protective of workers, both generally and within the pipeline industry.
Many states where Boardwalk Pipelines operates also have, or are developing, similar environmental or occupational health and safety legal requirements governing many of the same types of activities, and those requirements can be more stringent than those adopted under federal laws and regulations. Failure to comply with these federal, state and local laws and regulations may result in the assessment of administrative, civil and criminal penalties, the imposition of corrective or remedial obligations, the incurrence of capital expenditures, the occurrence of delays, denials or cancellations in permitting or the development or expansion of projects and the issuance of orders enjoining performance of some or all of Boardwalk Pipelines’ operations in the affected areas.
President Biden has initiated, and indicated that he intends to continue to pursue additional environmental regulations, whether by new legislation, executive actions or regulatory initiatives, which may impact Boardwalk Pipelines’ operations. For example, the Biden Administration has announced that it plans to reconsider or revise various rulemakings to be more stringent than those issued by the Trump Administration, including, among others, ground level ozone emission standards, requirements for environmental reviews under the National Environmental Policy Act, and the definition of Waters of the United States for purposes of Clean Water Act jurisdiction. Similarly, President Biden has issued executive orders bolstering greenhouse gas (“GHG”) emissions limitations, and the Biden Administration continues to consider actions to further advance responses to climate change, as described under Item 1A. Risk Factors of this Report.
Historically, Boardwalk Pipelines’ environmental compliance costs have not had a material adverse effect on its business, but there can be no assurance that future compliance with existing requirements will not materially affect them,Boardwalk Pipelines, or that the current regulatory standards will not become more onerous in the future, resulting in more significant costs to maintain compliance orand increased exposure to significant liabilities.
Climate Change: Climate change continues to attract considerable public, governmental and scientific attention. As a result, numerous proposals have been made and are likely to continue to be made at the international, national, regional, state and local levels of government to monitor and limit emissions of GHGs. These efforts have included consideration of cap-and-trade programs, carbon taxes and GHG reporting and tracking programs, and regulations that directly limit GHG emissions from certain sources. Boardwalk Pipelines recognizes that relative to certain other fossil fuels, natural gas has an important role in reducing GHG emissions and may act as a bridge to scaling up renewable energy or other alternative energy sources in the U.S. Boardwalk Pipelines is actively working to reduce its GHG emissions but cannot predict all risks that may be associated with climate change or other ESG matters. For more information, see Boardwalk Pipelines’
| 11 | ||||||||
risk factor titled “Boardwalk Pipelines’ operations, and those of Boardwalk Pipelines’ customers, are subject to a series of risks regarding climate change” under Item 1A.
Boardwalk Pipelines has been focused on seeking to meet and, in certain instances, pursuing projects aimed at exceeding regulatory obligations (such as those found in the Clean Air Act (“CAA”)) by reducing emissions of regulated air pollutants, including methane, associated with its pipeline transportation and storage assets. For example, in selecting new compression equipment for growth or asset reliability projects, Boardwalk Pipelines considers air emissions as a component in the decision-making process and, when appropriate, places increased emphasis in the selection process on equipment with emissions performance that exceeds applicable federal standards. Several of Boardwalk Pipelines’ reliability projects over the last few years have resulted in replacement of older, higher-emitting compressor drivers with units equipped with advanced emission control systems. As a result, these projects have resulted in decreases in emissions of nitrogen oxides and other air pollutants.
Boardwalk Pipelines has identified the reduction of GHG emissions as an area of focus and looks for opportunities to reduce emissions using a variety of strategies, including the following:
•replacing older compression equipment, where appropriate, with low emission, fuel efficient units;
•modifying fuel systems on certain reciprocating compression equipment to lower fuel consumption and emissions;
•conducting emissions surveys and performing maintenance and repairs on identified component leaks;
•performing annual leak surveys along Boardwalk Pipelines’ pipelines with the aid of helicopters and fixed-wing planes, and analytical field surveys when appropriate;
•performing leak detection and recovery and Subpart W surveys on all of Boardwalk Pipelines’ compressor stations (the U.S. Environmental Protection Agency (“EPA”) only requires Boardwalk Pipelines to survey 48 of its 79 compressor stations);
•using optical gas imaging cameras to scan all natural gas piping and components at Boardwalk Pipelines’ compressor stations to visualize any leaks in real time;
•employing experts in air emissions to monitor efforts in reducing emissions and improving air quality;
•reducing methane emissions vented to the atmosphere from transmission pipeline blowdowns by using pipeline evacuators when feasible;
•installing certain repair sleeves and composite wraps to avoid pipeline blowdowns; and
•replacing certain high bleed natural gas pneumatic devices with low or zero flow bleed devices.
However, Boardwalk Pipelines cannot guarantee that it will be able to implement any of the opportunities it may review or explore, or, for any opportunities it chooses to implement, to implement them in their intended manner or within a specific timeframe or across all operational assets.
Boardwalk Pipelines is an active member of several industry groups. These include the Our Nation’s Energy Future Coalition (“ONE Future”), a group of natural gas companies working together to voluntarily reduce methane emissions across the natural gas supply chain. ONE Future’s goal is to lower methane emissions to less than 1% of total natural gas produced by 2025. Boardwalk Pipelines also adheres to the Interstate Natural Gas Association of America’s Methane Emissions Commitments and Climate Statement aimed at improving practices to minimize methane emissions from interstate natural gas transmission and storage operations in a prudent and environmentally responsible manner. Boardwalk Pipelines also participates in the EPA Natural Gas STAR Program for voluntary methane and GHG reductions and reporting.
Properties: Boardwalk Pipelines is headquartered in approximately 103,000 square feet of leased office space located in Houston, Texas. Boardwalk Pipelines also leases approximately 60,000 square feet of office space in Owensboro, Kentucky. Boardwalk Pipelines’ operating subsidiaries own their respective pipeline systems in fee. However, substantial portions of these systems are constructed and maintained on property owned by others pursuant to
rights-of-way,
easements, permits, licenses or consents.| 12 | ||||||||
LOEWS HOTELS HOLDING CORPORATION
Loews Hotels Holding Corporation (together with its subsidiaries, “Loews Hotels & Co”) operates a chain of 26 hotels. 11Ten of these hotels are owned by Loews Hotels & Co, 10twelve are owned by joint ventures in which Loews Hotels & Co has noncontrolling equity interests and fivefour are managed for unaffiliated owners. Loews Hotels & Co’s earnings are derived from the operation of its wholly owned hotels, its share of earnings in joint venture hotels and hotel management fees earned from both joint venture and managed hotels. Loews Hotels & Co accounted for 4.6%3.3%, 5.4%,2.2% and 5.0%4.6% of our consolidated total revenue for the years ended December 31, 2019, 20182021, 2020 and 2017.2019. The hotels are described below.
Number of | ||||||||
Name and Location | Rooms | |||||||
Owned: | ||||||||
Loews Chicago Hotel, Chicago, Illinois | 400 | |||||||
Loews Chicago O’Hare Hotel, Chicago, Illinois | 556 | |||||||
Loews Coronado Bay Resort, San Diego, California | 439 | |||||||
Loews Kansas City Hotel, | 800 | |||||||
Loews Miami Beach Hotel, Miami Beach, Florida | 790 | |||||||
Loews Minneapolis Hotel, Minneapolis, Minnesota | 251 | |||||||
Loews Philadelphia Hotel, Philadelphia, Pennsylvania | 581 | |||||||
Loews Regency New York Hotel, New York, New York | 379 | |||||||
Loews Vanderbilt Hotel, Nashville, Tennessee | 340 | |||||||
Loews Ventana Canyon Resort, Tucson, | 398 | |||||||
Joint Venture: | ||||||||
Hard Rock Hotel, at Universal Orlando, Orlando, Florida | 650 | |||||||
Live! by Loews, Arlington, Texas | 300 | |||||||
Live! By Loews, St. Louis, Missouri | 216 | |||||||
| Loews Atlanta Hotel, Atlanta, Georgia | 414 | |||||||
Loews Hollywood Hotel, Hollywood, California | 628 | |||||||
Loews Portofino Bay Hotel, at Universal Orlando, Orlando, Florida | 750 | |||||||
Loews Royal Pacific Resort, at Universal Orlando, Orlando, Florida | 1,000 | |||||||
Loews Sapphire Falls Resort, at Universal Orlando, Orlando, Florida | 1,000 | |||||||
Universal’s Aventura Hotel, Orlando, Florida | 600 | |||||||
Universal’s Cabana Bay Beach Resort, Orlando, Florida | 2,200 | |||||||
Universal’s Endless Summer Resort – Dockside Inn and Suites, Orlando, Florida | 2,050 | |||||||
| Universal’s Endless Summer Resort – Surfside Inn and Suites, Orlando, Florida | 750 | |||||||
Management Contract: | ||||||||
Bisha Hotel and Residences, Toronto, Canada | 96 | |||||||
Loews Boston Hotel, Boston, Massachusetts | 225 | |||||||
Loews New Orleans Hotel, New Orleans, Louisiana | 285 | |||||||
Loews Santa Monica Beach Hotel, Santa Monica, California | 347 | |||||||
Note: Three owned hotels and dependent on general and local economic conditions. Loews Hotels & Co properties also compete with facilities offering similar services in locations other than those in which itsnine joint venture hotels are located. Competition among hotels is based primarily on qualitysubject to land leases.
| 13 | ||||||||
Recent Developments and Growth Projects:
•In 2019, Live! by Loews in Arlington, Texas, a 300 guestroom hotel opened. Loews Hotels & Co serves as manager and has a joint venture interest;
•In 2022, Loews Coral Gables Hotel in Coral Gables, Florida is expected to be completed. The hotel, which is currently under construction, is planned to be an approximately 242 guestroom hotel in which Loews Hotels & Co will serve as manager and will have a joint venture interest upon completion,noncontrolling equity interest; and
•In 2024, Loews Arlington Hotel and Convention Center in Arlington, Texas is expected to be completed. The hotel, which is currently under construction, is planned to be an approximately 888 guestroom hotel with over 250,000 square feet of function space in which Loews Hotels & Co will serve as manager and has a controlling majority equity interest.
ALTIUM PACKAGING LLC
mid-
andshort-run
packaging solutions, serving a diverse customer base in the pharmaceutical, dairy, household chemicals, food/nutraceuticals, industrial/specialty chemicals, water and beverage/juice On April 1, 2021, we sold 47% of Altium Packaging’s net sales forPackaging and following the year ended December 31, 2018 and 11% of its net sales, since the date of acquisition, for the year ended December 31, 2017. No other customertransaction deconsolidated Altium Packaging. Subsequent to deconsolidation, our investment in Altium Packaging is accounted for 10% or moreunder the equity method of Altium Packaging’s net sales during 2019, 2018 or 2017.
accounting.Including our operating subsidiaries, as described below, we employed approximately 18,60510,340 persons at December 31, 2019.2021. CNA employed approximately 5,9005,600 persons. Diamond Offshore employed approximately 2,500 persons, including international crew personnel furnished through independent labor contractors. Boardwalk Pipelines employed approximately 1,2351,210 persons, approximately 10095 of whom are union memberswere covered under collective bargaining agreements. Loews Hotels & Co employed approximately 5,7003,400 persons, approximately 1,8401,000 of whom are union members covered under collective bargaining agreements. Altium Packaging employed approximately 3,100 persons, approximately 300 of whom arewere covered under collective bargaining agreements. We and our subsidiaries have satisfactory labor relations. Separately, unconsolidated entities employ approximately 4,200 persons at properties managed by Loews Hotels & Co and approximately 3,500 persons at Altium Packaging.
We and our subsidiaries understand that seeking to hire the best people and cultivating an engaging workplace is critical to our businesses’ long-term strategic success. The specialist nature of our businesses also requires commitment to maintaining that talent pool. Each of us has programs in place to help employees build their knowledge, skills and experience, as well as to guide their career development.
Across the Loews enterprise, a cornerstone of our human capital strategy is our commitment to fostering a diverse, inclusive and engaging work environment, where all people are respected and encouraged to contribute their ideas. We believe that by employing individuals with different backgrounds and experiences, we can better meet the diverse needs of our stakeholders. Cultivating an engaging workplace and continuously improving the employee experience helps attract and retain key talent.
We and our subsidiaries offer compensation and benefits packages that are appropriate to each of our businesses. These packages may include 401k and other retirement plans, healthcare and insurance benefits, health savings and flexible spending accounts, paid time off and family assistance programs, including paid family leave. We and certain of our subsidiaries also offer stock-based compensation to certain management and other senior personnel as a way to attract and retain key talent.
| 14 | ||||||||
INFORMATION ABOUT OUR EXECUTIVE OFFICERS
First | ||||||||||
Became | ||||||||||
Name | Position and Offices Held | Age | Officer | |||||||
Marc A. Alpert | Senior Vice President, General Counsel and Secretary | 57 | 2016 | |||||||
David B. Edelson | Senior Vice President and Chief Financial Officer | 60 | 2005 | |||||||
Richard W. Scott | Senior Vice President and Chief Investment Officer | 66 | 2009 | |||||||
Kenneth I. Siegel | Senior Vice President | 62 | 2009 | |||||||
Andrew H. Tisch | Office of the President, Co-Chairman of the Board | 70 | 1985 | |||||||
and Chairman of the Executive Committee | ||||||||||
James S. Tisch | Office of the President, President and | 67 | 1981 | |||||||
Chief Executive Officer | ||||||||||
Jonathan M. Tisch | Office of the President and Co-Chairman of the Board | 66 | 1987 | |||||||
| First | |||||||||||
| Became | |||||||||||
| Name | Position and Offices Held | Age | Officer | ||||||||
| Marc A. Alpert | Senior Vice President, General Counsel and Secretary | 59 | 2016 | ||||||||
| David B. Edelson | Senior Vice President and Chief Financial Officer | 62 | 2005 | ||||||||
| Richard W. Scott | Senior Vice President and Chief Investment Officer | 68 | 2009 | ||||||||
| Kenneth I. Siegel | Senior Vice President | 64 | 2009 | ||||||||
| James S. Tisch | Office of the President, President and Chief Executive Officer | 69 | 1981 | ||||||||
| Jonathan M. Tisch | Office of the President and Co-Chairman of the Board | 68 | 1987 | ||||||||
On October 28, 2021, David B. Edelson informed the Company that he will resign as Chief Financial Officer on May 10, 2022 and as Senior Vice President on June 30, 2022. He will remain a senior advisor after June 30, 2022. Our Board of Directors has elected Jane Wang as Senior Vice President and Chief Financial Officer, effective May 10, 2022. Ms. Wang, age 40, has been a Vice President since 2014. Ms. Wang joined our corporate development department in 2006.
James S. Tisch is the brother of Andrew H. Tisch, andCo-Chairman of the Board. Jonathan M. Tisch is a cousin of James S. Tisch are brothers and are cousins of Jonathan M.Andrew H. Tisch. None of our other executive officers or directors is related to any other.
All of our executive officers except for Marc A. Alpert, have served in their current roles at the CompanyLoews Corporation for at least the past five years. Prior to assuming his current role at the Company in July of 2016, Mr. Alpert served as a partner and head of the Public Companies Practice Group at the law firm of Chadbourne & Parke LLP.
Officers are elected annually and hold office until their successors are elected and qualified, and are subject to removal by the Board of Directors.
AVAILABLE INFORMATION
Our website address is www.loews.com. We make available, free of charge, through the website our Annual Report on Form
10-K,
Quarterly Reports on Form10-Q,
Current Reports on Form8-K,
and amendments to those reports, filed or furnished pursuant to Section 13(a) or 15(d) of the Securities Exchange Act of 1934, as amended, as soon as reasonably practicable after these reports are electronically filed with or furnished to the SEC. Copies ofour Code of Business Conduct and Ethics, Corporate Governance Guidelines, Audit Committee charter, Compensation Committee charter and Nominating and Governance Committee charter are also available on our website. Information on or accessible through our website is not incorporated by reference into this Report. This Annual Report on Form made by the Company are also accessible through the SEC’s website at www.sec.gov.
10-K
and our other SEC filingsItem 1A. Risk Factors.
Our business and the businesses of our subsidiaries face many risks and uncertainties. These risks and uncertainties could lead to events or circumstances that have a material adverse effect on our business, results of operations, cash flows, financial condition or equity and/or the business, results of operations, cash flows, financial condition, or equity of one or more of our subsidiaries. We have described below the most significantmaterial risks facing us and our subsidiaries. There may be additional risks that we do not yet know of or that we do not currently perceive to be as significantmaterial that may also materially adversely impact our business or the businesses of our subsidiaries.
You should carefully consider and evaluate all of the information included in this Report and any subsequent reports we may file with the Securities and Exchange Commission (“SEC”)SEC and the information we make available to the public before investing in any securities issued by us. Our subsidiaries, CNA Financial Corporation Diamond Offshore Drilling, Inc. and Boardwalk Pipeline Partners, LP, also file reports with the SEC. You are also cautioned to carefully review and consider the information contained in the reports filed by those subsidiaries with the SEC and the information they make available to the public before investing in any of their securities.
| 15 | ||||||||
Risks Related to Us and Our Subsidiary, CNA
If CNA determines that its recorded insurance reserves are insufficient to cover its estimated ultimate unpaid liability for claim and claim adjustment expenses, CNA may need to increase its insurance reserves which would result in a charge to CNA’s earnings.
CNA maintains insurance reserves to cover its estimated ultimate unpaid liability for claim and claim adjustment expenses, including the estimated cost of the claims adjudication process, for reported and unreported claims. Insurance reserves are not an exact calculation of liability but instead are complex management estimates developed utilizing a variety of actuarial reserve estimation techniques as of a given reporting date. The reserve estimation process involves a high degree of judgment and variability and is subject to a number of factors which are highly uncertain. These variables can be affected by both changes in internal processes and external events. Key variables include frequency of claims, claim severity, mortality, morbidity, discount rates, economic, social and medical inflation, claim handling policies and procedures, case reserving approach, underwriting and pricing policies, changes in the legal and regulatory environment and the lag time between the occurrence of an insured event and the time of its ultimate settlement. Mortality is the relative incidence of death. Morbidity is the frequency and severity of injury, illness, sickness and diseases contracted.
There is generally a higher degree of variability in estimating required reserves for long-tail coverages, such as workers’ compensation, general liability and workers’ compensation,professional liability, as they require a relatively longer period of time for claims to be reported and settled. The impact of changes in economic and social inflation, and medical costs are also more pronounced for long-tail coverages due to the longer settlement period. Certain risks and uncertainties associated with CNA’s insurance reserves are outlined in the Insurance Reserves and Critical Accounting Estimates sections of MD&A in Item 7.
CNA is subject to the uncertain effects of emerging or potential claims and coverage issues that arise as industry practices and legal, judicial, social, economic and other environmental conditions change. Further, the impact of social inflation continues to be significant, and the trajectory of its future impact remains uncertain. These issues, as well as social inflation, have had, and may continue to have, a negative effect on CNA’s business, results of operations and financial condition by either extending coverage beyond the original underwriting intent or by increasing the number or size of claims, resulting in further increases in CNA’s reserves. The effects of unforeseen emerging claim and coverage issues are extremely difficult to predict.
predict and may be material.In light of the many uncertainties associated with establishing the estimates and making the judgments necessary to establish reserve levels, CNA continually reviews and changes its reserve estimates in a regular and ongoing process as experience develops from the actual reporting and settlement of claims and as the legal, regulatory and economic environment evolves. If CNA’s recorded reserves are insufficient for any reason, the required increase in reserves would be recorded as a charge against its earnings in the period in which reserves are determined to be insufficient. These charges could be substantial.
CNA’s actual experience could vary from the key assumptions used to determine active life reserves for long term care policies.
CNA’s active life reserves for long term care policies are based on CNA’s best estimate assumptions as of September 30, 2019,2020, due to a reserve unlocking at that date. Key assumptions include morbidity, persistency (the percentage of policies remaining in force), discount rate and future premium rate increases. These assumptions, which are critical bases for its reserve estimates are inherently uncertain. If actual experience varies from these assumptions or the future outlook for these assumptions changes, CNA may be required to increase its reserves. See the Long Term Care Policyholder Reserves portion of the Insurance Reserves section of MD&A in Item 7 for more information.
Estimating future experience for long term care policies is highly uncertain, because the adequacy of the reserves is contingent upon actual experience and CNA’s future expectations related to these key assumptions. If actual or expected future experience differs from these assumptions, the reserves may not be adequate, requiring CNA to add reserves. The required increase in reserves would be recorded as a charge against its earnings in the period in which reserves are determined to be insufficient. These charges could be substantial.
See the Life & Group Policyholder Reserves portion of the Insurance Reserves section of MD&A in Item 7 for more information.Morbidity and persistency experience, inclusive of mortality, can be volatile and may be negatively affected by many factors including, but not limited to, policyholder behavior, judicial decisions regarding policy terms, socioeconomic factors, cost of care inflation, changes in health trends and advances in medical care.
A prolonged period during which interest ratesinvestment returns remain at levels lower than those anticipated in CNA’s reserving woulddiscount rate assumptions could result in shortfalls in investment income on assets supporting CNA’s obligations under long term care policies, which may require changesincreases to its reserves. This risk is more significant for CNA’s long term care products because the long potential duration of the policy obligations exceeds the duration of the supporting investment assets. Further, changes to the Internal Revenue Code may also affect the rate at which CNA discounts its reserves. In
| 16 | ||||||||
addition, CNA may not receive regulatory approval for the level of premium rate increases it requests. Any adverse deviation between the level of future premium rate increases approved and the level included in CNA’s reserving assumptions may require an increase to its reserves.
CNA is vulnerable to material losses from natural and
man-made
disasters.Catastrophe losses are an inevitable part of CNA’s business. Various events can cause catastrophe losses. These events can be natural orcommotion, cyber attacks,unrest, cyber-attacks, pandemics and acts of terrorism. The frequency and severity of these catastrophe events are inherently unpredictable. In addition, longer-term natural catastrophe trends may be changing and new types of catastrophe losses may be developing due to climate change, a phenomenon that has been associated with extreme weather events linked to rising temperatures, and includes effects on global weather patterns, greenhouse gases, sea, land and air temperatures, sea levels, rain, hail and snow.
man-made,
and may include hurricanes, windstorms, earthquakes, hail, severe winter weather, fires, floods, riots, strikes, civil The extent of CNA’s losses from catastrophes is a function of the total amount of its insured exposures in the affected areas, the frequency and severity of the events themselves, the level of reinsurance coverage, reinsurance reinstatement premiums and state residual market assessments, if any. It can take a long time for the ultimate cost of any catastrophe losses to CNA to be finally determined, as a multitude of factors contribute to such costs, including evaluation of general liability and pollution exposures, infrastructure disruption, business interruption and reinsurance collectibility. Further, significant catastrophic events or a series of catastrophic events have the potential to impose financial stress on the reinsurance industry, which could impact CNA’s ability to collect amounts owed to CNA by reinsurers, thereby resulting in higher net incurred losses.
Reinsurance coverage for terrorism events is provided only in limited circumstances, especially in regard to “unconventional” terrorism acts, such as nuclear, biological, chemical or radiological attacks. CNA’s principal reinsurance protection against these large-scale terrorist attacks is the coverage currently provided through TRIPRAthe Terrorism Risk Insurance Program Reauthorization Act of 2019 (“TRIPRA”) through December 31, 2027. However, such coverage is subject to a mandatory deductible and other limitations. It is also possible that future legislation could change or eliminate the program, which could adversely affect CNA’s business by increasing its exposure to terrorism losses, or by lowering its business volume through efforts to avoid that exposure. For a further discussion of TRIPRA, see Part II, Item 7, MD&A - Catastrophes and Related Reinsurance.
As a result of the items discussed above, catastrophe losses are particularly difficult to estimate. Additionally, catastrophic eventsestimate, could cause CNA to exhaust its available reinsurance limits and could adversely affect the cost and availability of reinsurance. Accordingly, catastrophic events could have a material adverse effect on CNA’s business, results of operations, financial condition and liquidity.
The COVID-19 pandemic and measures to mitigate the spread of the virus have resulted in increased claims and related litigation risk across CNA’s enterprise, whichmay continue to have adverse impacts on its business, results of operations and financial condition and could be material.
CNA has experienced, and may continue to experience, increased claim submissions and litigation related to denial of claims based on policy coverage, or the facts of the claim, in certain lines of business that are implicated by the pandemic and mitigating actions taken by its customers and governmental authorities in response to its spread. These lines include primarily healthcare professional liability, workers’ compensation, commercial property-related business interruption coverage, management liability (directors and officers, employment practices, and professional liability lines) and trade credit. CNA recorded significant losses during 2020, the majority of which are classified as incurred but not reported (“IBNR”) reserves, in these areas and may experience continued losses, which could be material.
Increased frequency or severity in any or all of the foregoing lines, or others where the exposure has yet to emerge, may have a material impact on CNA’s business, results of operations and financial condition.
CNA has incurred and may continue to incur substantial expenses related to litigation activity in connection with COVID-related legal claims. These actions primarily relate to denial of claims submitted as a result of the pandemic and the mitigating actions under commercial property policies for business interruption coverage, including lockdowns and closing of certain businesses. The significance of such litigation, both in substance and volume, and the resultant activities CNA has initiated, including external counsel engagement, and the costs related thereto, may have a material impact on CNA’s business, results of operations and financial condition.
| 17 | ||||||||
CNA has exposure related to A&EP claims, which could result in material losses.
CNA’s property and casualty insurance subsidiaries have exposures related to A&EP claims. CNA’s experience has been that establishing claim and claim adjustment expense reserves for casualty coverages relating to A&EP claims is subject to uncertainties that are greater than those presented by other claims. Additionally, traditional actuarial methods and techniques employed to estimate the ultimate cost of claims for more traditional property and casualty exposures are less precise in estimating claim and claim adjustment expense reserves for A&EP. As a result, estimating the ultimate cost of both reported and unreported A&EP claims is subject to a higher degree of variability.
On August 31, 2010, CNA completed a retroactive reinsurance transaction under which substantially all of its legacy A&EP liabilities were ceded to National Indemnity Company (“NICO”), a subsidiary of Berkshire Hathaway Inc., subject to an aggregate limit of $4.0 billion (“loss portfolio transfer” or “LPT”). The cumulative amount ceded under the loss portfolio transfer as of December 31, 20192021 is $3.2$3.4 billion. If the other parties to the loss portfolio transfer do not fully perform their obligations, net losses incurred on A&EP claims covered by the loss portfolio transfer exceed the aggregate limit of $4.0 billion or CNA determines it has exposures to A&EP claims not covered by the loss portfolio transfer, CNA may need to increase its recorded net reserves which would result in a charge against earnings. These charges could be substantial. Additionally, if the A&EP claims exceed the limit of the loss portfolio transfer, CNA will need to assess whether to purchase additional limit or to reassume claim handling responsibility for A&EP claims from an affiliate of NICO. Any additional reinsurance premium or future claim handling costs would also reduce CNA’s earnings.
CNA is exposed to, and may face adverse developments related to, mass tort claims that could arise from its insureds’ sale or use of potentially harmful products or substances, changes to the social and legal environment, issues related to altered interpretation of coverage and other new and emerging claim theories.
CNA faces potential exposure to various types of new and emerging mass tort claims including, but not limited to, those related to exposure to potentially harmful products or substances such as glyphosate, lead paint and opioids; claims arising from changes that expand the right to sue, remove limitations on recovery, extend the statutes of limitations or otherwise repeal or weaken tort reforms, such as those related to abuse reviver statutes, including New York reviver statutes; and claims related to new and emerging theories of liability, such as those related to global warming and climate change. Evolving judicial interpretations and new legislation regarding the application of various tort theories and defenses, including application of various theories of joint and several liability, as well as the application of insurance coverage to these claims, give rise to new claimant activity. Emerging mass tort claim activity, including activity based on such changing judicial interpretations and recent and proposed legislation could materially and adversely affecthave a material adverse effect on CNA’s results of operations.
CNA faces intense competition in its industry.
All aspects of the insurance industry are highly competitive and CNA must continuously allocate resources to refine and improve its insurance products and services to remain competitive. CNA competes with a large number of stock and mutual insurance companies and other entities, some of which may be larger or have greater financial or other resources than CNA does, for both distributors and customers. This includes agents, brokers and managing general underwriters who may increasingly compete with CNA to the extent that they continue to have direct access to providers of capital seeking exposure to insurance risk. Insurers compete on the basis of many factors, including products, price, services, ratings and financial strength. The competitor landscape has evolved substantially in recent years, with significant consolidation and new market entrants, such as insuretech firms, resulting in increased pressures on CNA’s ability to remain competitive, particularly in obtaining pricing that is both attractive to CNA’s customer base and risk appropriate to CNA.
CNA markets its insurance products worldwide primarily through independent insurance agents, insurance brokers and managing general underwriters who also promote and distribute the products of CNA’s competitors. Any change in CNA’s relationships with its distribution network agents, brokers or managing general underwriters, including as a result of consolidation and their increased promotion and distribution of CNA’s competitors’ products, could adversely affect CNA’s ability to sell its products. As a result, CNA’s business volume and results of operations could be materially adversely impacted.
| 18 | ||||||||
CNA’s underwriting strategies currently rely on the effectiveness of reinsurance arrangements and CNA accordingly faces risks relating to reinsurance, including obtaining reinsurance at a cost or on terms and conditions it deems acceptable, reinsurance counterparty risk and ineffective reinsurance coverage.
A primary reason CNA purchases reinsurance is to manage its exposure to risk, thereby facilitating its underwriting strategies in certain key areas.Under CNA’s ceded reinsurance arrangements, a reinsurer assumes a specified portion of its exposure in exchange for a specified portion of policy premiums.Market conditions determine the availability and cost of the reinsurance protection CNA purchases, which affects the volatility of its business and profitability, as well as the level and types of risk CNA retains.If CNA is unable to obtain sufficient reinsurance at a cost or on terms and conditions it deems acceptable, CNA’s risk exposure will not be mitigated or it may forego such increased risk, thereby adversely impacting its underwriting strategies.In addition, use of reinsurance exposes CNA to credit risk of the reinsurers, as the reinsurance arrangements do not relieve it of the liability to the customer.If a reinsurer is unable to meet its financial obligations under a reinsurance arrangement, CNA will remain obligated under the original policies issued to its customers.Furthermore, while CNA uses various risk management methods, including the use of reinsurance, to effectively manage risk, there is the possibility that one or more natural catastrophes and/or terrorism or other events could result in claims substantially exceeding expectations, thereby making the reinsurance strategy significantly less effective.Such reinsurance-related risks could have a material adverse effect on CNA’s business, results of operations and financial condition and adversely affect its underwriting strategies in certain lines of business.
CNA may be adversely affected by technological changes or disruptions in the insurance marketplace.
Technological changes in the way insurance transactions are completed in the marketplace, and CNA’s ability to react effectively to such change, may present significant competitive risks. For example, more insurers are utilizing “big data” analytics to make underwriting and other decisions that impact product design and pricing. If such utilization is more effective than how CNA uses similar data and information, CNA will be at a competitive disadvantage. There can be no assurance that CNA will continue to compete effectively with its industry peers due to technological changes; accordingly this may have a material adverse effect on CNA’s business, and results of operations.
operations and financial condition.In addition, agents and brokers, technology companies or other third parties may create alternate distribution channels for commercial business that may adversely impact product differentiation and pricing. For example, they may create a digitally enabled distribution channel that may adversely impact CNA’s competitive position. CNA’s efforts or the efforts of agents and brokers with respect to new products or alternate distribution channels, as well as changes in the way agents and brokers utilize greater levels of data and technology, could adversely impact CNA’s business relationships with independent agents and brokers who currently market its products, resulting in a lower volume and/or profitability of business generated from these sources.
CNA may incur significant realized and unrealized investment losses and volatility in net investment income arising from changes in the financial markets.
CNA’s investment portfolio is exposed to various risks, such as interest rate, credit spread, issuer default, equity prices and foreign currency, which are unpredictable. Financial markets are highly sensitive to changes in economic conditions, monetary policies, tax policies, domestic and international geopolitical issues and many other factors. Changes in financial markets including fluctuations in interest rates, credit, equity prices and foreign currency prices, and many other factors beyond CNA’s control can adversely affect the value of its investments, the realization of investment income and the rate at which it discounts certain liabilities.
CNA’s investment portfolio is also subject to increased valuation uncertainties when investment markets are illiquid. The valuation of investments is more subjective when markets are illiquid, thereby increasing the risk that the estimated fair value (i.e., the carrying amount) of the portion of CNA’s investment portfolio that is carried at fair value in the financial statements is not reflective of prices at which actual transactions could occur.CNA has significant holdings in fixed maturity investments that are sensitive to changes in interest rates. A decline in interest rates may reduce the returns earned on new fixed maturity investments, thereby reducing CNA’s net investment income, while an increase in interest rates may reduce the value of its existing fixed maturity investments, which could reduce CNA’s net unrealized gains included in Accumulated Other Comprehensive Income (“AOCI”). The value of CNA’s fixed maturity investments is also subject to risk that certain investments may default or become impaired due to deterioration in the financial condition of issuers of the investments CNA holds or in the underlying collateral of the security.
| 19 | ||||||||
In addition, CNA invests a portion of its assets in limited partnerships and common stock which are subject to greater market volatility than its fixed maturity investments. Limited partnership investments generally provide a lower level of liquidity than fixed maturity or equity investments, which may also limit CNA’s ability to withdraw funds from these investments. The timing and amount of income or losses on such investments is inherently variable and can contribute to volatility in reported earnings.
Further, CNA holds a portfolio of commercial mortgage loans. CNA is subject to risk related to the recoverability of loan balances, which is influenced by declines in the estimated cash flows from underlying property leases, fair value of collateral, refinancing risk and the creditworthiness of tenants of the underlying properties, where lease payments directly service the loan. Collecting amounts from borrowers that are less than the amounts recordedAny changes in actual or expected collections would result in a charge to earnings.
As a result of these factors, CNA may not earn an adequate return on its investments, may be required to write down the value of its investments and may incur losses on the disposition of its investments, all of which wouldcould materially adversely affect CNA’s business, results of operations and financial condition.
CNA uses analytical models to assist its decision making in key areas such as pricing, reserving, catastrophe risks and capital modeling and may be adversely affected if actual results differ materially from the model outputs and related analyses.
CNA uses various modeling techniques and data analytics (e.g., scenarios, predictive, stochastic and/or forecasting) to analyze and estimate exposures, loss trends and other risks associated with its assets and liabilities. This includes both proprietary and third party modeled outputs and related analyses to assist CNA in decision-making related to underwriting, pricing, capital allocation, reserving, investing, reinsurance and catastrophe risk, among other things. CNA incorporates numerous assumptions and forecasts about the future level and variability of policyholder behavior, loss frequency and severity, interest rates, equity markets, inflation, capital requirements, and currency exchange rates, among others. The modeled outputs and related analyses from both proprietary models and third parties are subject to various assumptions, uncertainties, model design errors and the inherent limitations of any statistical analysis. Further, climate change may make modeled outcomes less certain or produce new, non-modeled risks.
In addition, the effectiveness of any model can be degraded by operational risks, including the improper use of the model, input errors, data errors and human error. As a result, actual results may differ materially from CNA’s modeled results. CNA’s profitability and financial condition substantially depends on the extent to which its actual experience is consistent with the assumptions CNA uses in its models and ultimate model outputs. If, based upon these models or other factors, CNA misprices its products or fails to appropriately estimate the risks it is exposed to, its business, results of operations and financial condition may be materially adversely affected.
Any significant interruption in the operation of CNA’s business functions, facilities and systems or its vendors’ facilities and systems could result in a chargematerially adverse effect on its operations.
CNA’s business is highly dependent upon its ability to perform, in an efficient and uninterrupted manner, through its employees or vendor relationships and using its and its vendor’s facilities and systems, necessary business functions, such as internet support and 24-hour call centers, processing new and renewal business, providing customer service, processing and paying claims and other obligations and issuing financial statements.
CNA’s, earnings.or its vendors’, facilities and systems could become unavailable, inoperable, or otherwise impaired from a variety of causes, including natural events, such as hurricanes, tornadoes, windstorms, earthquakes, severe winter weather and fires, or other events, such as explosions, terrorist attacks, computer security breaches or cyber attacks, riots, hazardous material releases, medical epidemics or pandemics, utility outages, interruptions of data processing and storage systems or unavailability of communications facilities. An interruption in CNA’s system availability occurred in March 2021 as a result of a cybersecurity attack sustained by CNA. Please refer to the immediately following risk factor for further information regarding this incident. Likewise, CNA could experience a significant failure, interruption or corruption of one or more of its vendors’ information technology, telecommunications, or other systems for various reasons, including significant failures or interruptions that might occur as existing systems are replaced or upgraded. The shut-down or unavailability of one or more of CNA’s or its vendors’ systems or facilities for these or any other reasons could significantly impair CNA’s ability to perform critical business functions in a timely basis.
In addition, because CNA’s information technology and telecommunications systems interface with and depend on third-party systems, CNA could experience service denials if demand for such service exceeds capacity or a third-party system fails or experiences an interruption. If sustained or repeated, such events could result in a deterioration of CNA’s ability to perform necessary business functions.
| 20 | ||||||||
The foregoing risks could expose CNA to monetary and reputational damages. Potential exposures resulting from the March 2021 cybersecurity attack, described in the immediately following risk factor, as well as any future incidents may include substantially increased compliance costs, as well as increased costs relating to investments in computer system and security-related upgrades, with those costs potentially not recoverable under relevant insurance coverage. CNA anticipates making continued investments to improve its security and infrastructure which are not recoverable under relevant insurance coverage. If CNA’s business continuity plans or system security do not sufficiently address these risks, they could have a material adverse effect on CNA’s business, results of operations and financial condition.
Any significant breach in CNA’s data security infrastructure or its vendors’ facilities and systems could disrupt business, cause financial losses and damage its reputation, and insurance coverage may not be available for claims related to a breach.
A significant breach of CNA’s data security infrastructure may result from actions by its employees, vendors, third-party administrators, or unknown third parties or through cyber attacks. The risk of a breach can exist whether software services are in CNA’s data centers or are cloud-based software services. Breaches have occurred, and may occur again, in CNA’s systems and in the systems of its vendors and third party administrators.
Such a breach could affect CNA’s data framework or cause a failure to protect the personal information of its customers, claimants or employees, or sensitive and confidential information regarding its business and may result in operational impairments and financial losses, as well as significant harm to its reputation. The breach of confidential information also could give rise to legal liability and regulatory action under data protection and privacy laws, as well as evolving regulation in this regard. During the third quarter of 2021, CNA was notified of a breach of certain systems of a third party administrator, which resulted in breach notifications sent by such administrator to potentially impacted persons, including a limited number of CNA’s claimants. While CNA does not believe such notifications and resultant actions will have a material adverse effect on its business, this or similar incidents, or any other such breach of CNA’s or its vendors’ data security infrastructure could have a material adverse effect on its business, results of operations and financial condition.
CNA sustained a sophisticated cybersecurity attack in March 2021 involving ransomware that caused a network disruption and impacted certain of its systems. Upon detection, CNA undertook steps to address the incident, including engaging a team of third-party forensic experts and notifying law enforcement and key regulators. CNA restored network systems and resumed normal operations. CNA is continuing to assess all actions that it will take to improve its existing systems.
CNA’s investigation revealed that an unauthorized third party copied some personal information relating to certain current and former employees, contractor workers and their dependents and certain other persons, including some policyholders. In July 2021, CNA provided notifications to the impacted individuals and to regulators, in accordance with applicable law. Although CNA currently has no indication that the impacted data has been misused, or that CNA or its policyholder data was specifically targeted by the unauthorized third party, it may be subject to subsequent investigations, claims or actions in addition to other costs, fines, penalties, or other obligations related to impacted data, whether or not such data is misused. In addition, the misuse, or perceived misuse, of sensitive or confidential information regarding its business or policyholders could cause harm to CNA’s reputation and result in the loss of business with existing or potential customers, which could adversely impact its business, results of operations and financial condition.
Although CNA maintains cybersecurity insurance coverage insuring against costs resulting from cyber attacks (including the March 2021 attack), CNA does not expect the amount available under its coverage policy to cover all losses. Costs and expenses incurred and likely to be incurred by CNA in connection with the March 2021 attack include both direct and indirect costs and are not all covered by its insurance coverage. In addition, potential disputes with its insurers about the availability of insurance coverage for claims relating to the March 2021 attack or any future incident could occur. Further, as a result of the March 2021 attack, CNA incurred higher costs for the replenishment of its current policy through the end of the term, and CNA believes it will incur higher costs for future cybersecurity insurance coverage beyond the current term.
Based on the information currently known, CNA does not believe that the March 2021 cybersecurity attack will have a material impact on its business, results of operations or financial condition, but no assurances can be given as it continues to assess the full impact from the incident, including costs, expenses and insurance coverage. CNA may also be subject to future incidents that could have a material adverse effect on its business, results of operations or financial condition or may result in operational impairments and financial losses, as well as significant harm to CNA’s reputation.
| 21 | ||||||||
Inability to detect and prevent significant employee or third party service provider misconduct, inadvertent errors and omissions, or exposure relating to functions performed on CNA’s behalf could result in a material adverse effect on CNA’s operations.business, results of operations and financial condition.
CNA may incur losses which arise from employees or third party service providers engaging in intentional, negligent or inadvertent misconduct, fraud, errors and omissions, failure to comply with internal guidelines, including with respect to underwriting authority, or failure to comply with regulatory requirements. CNA’s or its third party service providers’ controls may not be able to detect all possible circumstances of employee and third party service provideroperations.operations and financial condition.
such non-compliant
activity and the internal structures in place to prevent this activity may not be effective in all cases. Any losses relating to suchnon-compliant
activity could adversely affect CNA’s business, results of Portions of CNA’s insurance business isare underwritten and serviced by third parties. With respect to underwriting, CNA’s contractual arrangements with third parties will typically grant them limited rights to write new and renewal policies, subject to contractual restrictions and obligations, andincluding requiring them to underwrite within the terms of CNA’s licenses. Should these third parties issue policies that exceed these contractual restrictions, CNA could be deemed liable for such policies and subject to regulatory fines and penalties for any breach of licensing requirements. It is possible that in such circumstance CNA might not be fully indemnified for such third parties’ contractual breaches.
Additionally, CNA relies on certain third-party claims administrators, including the administrators of its long term care claims, to handle policyholder services and perform significant claim administration and claim adjudication functions. Any failure by such administrator to properly perform service functions may result in losses as a result of over-payment of claims, legal claims against CNA and adverse regulatory enforcement exposure.
CNA has also licensed certain systems from third parties. CNA cannot be certain that it will have access to these systems or that its information technology or application systems will continue to operate as intended.
These risks could adversely impact CNA’s reputation orand client relationships orand have a material adverse effect on its financial condition orbusiness, results of operations.
operations and financial condition.CNA is subject to capital adequacy requirements and, if it is unable to maintain or raise sufficient capital to meet these requirements, regulatory agencies may restrict or prohibit CNA from operating its business.
Insurance companies such as CNA are subject to capital adequacy standards set by regulators to help identify companies that merit further regulatory attention. In the U.S., these standards apply specified risk factors to various asset, premium and reserve components of CNA’s legal entity statutory basis of accounting financial statements. Current rules, including those promulgated by insurance regulators and specialized markets such as Lloyd’s, require companies to maintain statutory capital and surplus at a specified minimum level determined using the applicable jurisdiction’s regulatory capital adequacy formula. If CNA does not meet these minimum requirements, CNA may be restricted or prohibited from operating its business in the applicable jurisdictions and specialized markets. If CNA is required to record a material charge against earnings in connection with a change in estimated insurance reserves or the occurrence of a catastrophic event or if it incurs significant losses related to its investment portfolio, which severely deteriorates its capital position, CNA may violate these minimum capital adequacy requirements unless it is able to raise sufficient additional capital. CNA may be limited in its ability to raise significant amounts of capital on favorable terms or at all.
The IAIS recentlyhas adopted a common framework for the supervision of internationally active insurance groups and continues to develop a group basis Insurance Capital Standard (“ICS”).ICS. The NAIC is also developing a group capital standard that is intended to be comparable to the ICS. The development and adoption of these capital standards could increase CNA’s prescribed capital requirement, the level at which regulatory scrutiny intensifies, as well as significantly increase its cost of regulatory compliance.
CNA’s insurance subsidiaries, upon whom CNA depends for dividends in order to fund its corporate obligations, are limited by insurance regulators in their ability to pay dividends.
CNA is a holding company and is dependent upon dividends, loans and other sources of cash from its subsidiaries in order to meet its obligations. Ordinary dividend payments or dividends that do not require prior approval by the insurance subsidiaries’ domiciliary insurance regulator are generally limited to amounts determined by formulas that vary by jurisdiction. If CNA is restricted from paying or receiving intercompany dividends, by regulatory rule or otherwise, CNA may not be able to fund its corporate obligations and debt service requirements or pay stockholder
dividends from available cash. As a result, CNA would need to look topursue other sources of capital which may be more expensive or may not be available at all.
| 22 | ||||||||
Rating agencies may downgrade their ratings of CNA, and thereby adversely affectaffecting its ability to write insurance at competitive rates or at all.
Ratings are an important factor in establishing the competitive position of insurance companies. CNA’s insurance company subsidiaries, as well as CNA’s public debt, are rated by rating agencies, including, A.M. Best Company (“A.M. Best”), Moody’s Investors Service, Inc. (“Moody’s”) and, S&P Global Ratings (“S&P”) and Fitch Ratings, Inc. (“Fitch”). Ratings reflect the rating agency’s opinions of an insurance company’s or insurance holding company’s financial strength, capital adequacy, enterprise risk management practices, operating performance, strategic position and ability to meet its obligations to policyholders and debt holders.
holders, and may also reflect opinions on other areas such as information security and ESG matters.The rating agencies may take action to lower CNA’s ratings in the future as a result of any significant financial loss or possible changes in the methodology or criteria applied by the rating agencies. The severity of the impact on CNA’s business is dependent on the level of downgrade and, for certain products, which rating agency takes the rating action. Among the adverse effects in the event of such downgrades would be the inability to obtain a material volume of business from certain major insurance brokers, the inability to sell a material volume of CNA’s insurance products to certain markets and the required collateralization of certain future payment obligations or reserves.
Further, if one or more of CNA’s corporate debt ratings were downgraded, CNA may find it more difficult to access the capital markets and may incur higher borrowing costs.In addition, it is possible that a significant lowering of our corporate debt ratings by certain of the rating agencies could result in an adverse effect on CNA’s ratings, independent of any change in CNA’s circumstances.
For further discussion of CNA’s ratings, see the Subsidiaries portion of the Liquidity and Capital Resources section of MD&A in Item 7.CNA is subject to extensive existing state, local, federal and foreign governmental regulations that restrict its ability to do business and generate revenues.
The insurance industry is subject to comprehensive and detailed regulation and supervision. Most insurance regulations are designed to protect the interests of CNA’s policyholders and third-party claimants rather than its investors. Each jurisdiction in which CNA does business has established supervisory agencies that regulate the manner in which CNA conducts its business. Any changes in regulation could impose significant burdens on CNA. In addition, the Lloyd’s marketplace sets rules under which its members, including CNA’s Hardy syndicate, operate.
These rules and regulations relate to, among other things, the standards of solvency (including risk-based capital measures), government-supported backstops for certain catastrophic events (including terrorism), investment restrictions, accounting and reporting methodology, establishment of reserves and potential assessments of funds to settle covered claims against impaired, insolvent or failed private or quasi-governmental insurers. In addition, rules and regulations have recently been introduced, or are being considered, in the areas of information security and ESG, which may also affect CNA’s business.
Regulatory powers also extend to premium rate regulations which require that rates not be excessive, inadequate or unfairly discriminatory. State jurisdictions ensure compliance with such regulations through market conduct exams, which may result in losses to the extent
non-compliance
is ascertained, either as a result of failure to document transactions properly or failure to comply with internal guidelines, or otherwise. CNA may also be required by the jurisdictions in which it does business to provide coverage to persons who would not otherwise be considered eligible or restrict CNA from withdrawing from unprofitable lines of business or unprofitable market areas. Each jurisdiction dictates the types of insurance and the level of coverage that must be provided to such involuntary risks. CNA’s share of these involuntary risks is mandatory and generally a function of its respective share of the voluntary market by line of insurance in each jurisdiction.Risks Related to Us and Our Subsidiary, Boardwalk Pipelines
Boardwalk Pipelines’ natural gas transportation and storage operations are subject to extensive regulation by the FERC, including rules and regulations related to the rates it can charge for its services and its ability to construct or abandon facilities. Boardwalk Pipelines may not be able to recover the full cost of operating its pipelines, including earning a reasonable return.
Boardwalk Pipelines’ natural gas transportation and storageoperations are subject to extensive regulation by the FERC, including the types, rates and terms of services Boardwalk Pipelines may offer to its customers, construction of new
| 23 | ||||||||
facilities, creation, modification or abandonment of services or facilities and recordkeeping and relationships with affiliated companies. An adverse FERC action in any of these areas could affect Boardwalk Pipelines’ ability to compete for business, construct new facilities, offer new services or recover the full cost of operating its pipelines. This regulatory oversight can result in longer lead times to develop and complete any future project than competitors that are not subject to the FERC’s regulations. The FERC can also deny Boardwalk Pipelines the right to abandon certain facilities from service.
The FERC also regulates the rates Boardwalk Pipelines can charge for its natural gas transportation and storage operations. For cost-based services, the FERC establishes both the maximum and minimum rates Boardwalk Pipelines can charge. The basic elements that the FERC considers are the costs of providing service, the volumes of gas being transported, the rate design, the allocation of costs between services, the capital structure and the rate of return a pipeline is permitted to earn. Boardwalk Pipelines may not be able to recover all its costs, including certain costs associated with pipeline integrity, through existing or future rates.
The FERC and/or Boardwalk Pipelines’ customers could challenge the maximum applicable rates that any of its regulated pipelines are allowed tocan charge in accordance with Section 5 of the NGA. The Tax Cuts and Jobs ActAdoption of 2017 and the Revised Policy Statement that was issued by the FERC in 2018 may increase the likelihood of such a challenge. Pendingpotential legislation that would amend Section 5 of the NGA to add refund provisions could increase the likelihood of such a challenge. If such a challenge is successful for any of Boardwalk Pipelines’ pipelines, the revenues associated with transportation and storage services the pipeline provides pursuant to
cost-of-service
rates could materially decrease in the future, which would adversely affect the revenues on that pipeline going forward.Boardwalk Pipelines’ operations, and those of Boardwalk Pipelines’ customers, are subject to a series of risks regarding climate change.
The threat of climate change continues to attract considerable attention in the U.S. and in other countries. Numerous proposals have been made and could continue to be made at the international, national, regional, state and local levels of government to monitor, limit and eliminate both existing and future emissions of GHGs. These proposals expose Boardwalk Pipelines’ operations as well as the operations of its fossil fuel producer customers to a series of regulatory, political, litigation and financial risks.
In the U.S., no comprehensive climate change legislation has been implemented at the federal level. However, the EPA has issued several rules regulating GHGs following the U.S. Supreme Court finding that GHGs are air pollutants under the CAA and the EPA’s own endangerment finding for certain GHGs, including carbon dioxide and methane. The EPA regulates GHGs through various requirements, including permitting for GHG emissions from large stationary sources, annual reporting on GHG emissions from oil and gas facilities, New Source Performance Standards (“NSPS”) restricting methane emissions from new facilities in the natural gas sector, and GHG emissions limits on vehicles together with the DOT. The EPA’s regulation of methane emissions continues to undergo significant changes. In June 2021, President Biden signed into law a joint resolution of Congress under the Congressional Review Act that rescinded the EPA’s 2020 Policy Rule, effectively reinstating the 2012 and 2016 NSPS for the transmission and storage sector. In November 2021, the EPA proposed a rule to establish standards of performance for methane and volatile organic compound emissions from new sources and, for the first time, existing sources, within the crude oil and natural gas source category, including the transmission and storage sector. The proposed rule includes several requirements relevant to Boardwalk Pipelines’ operations, including stricter emissions limits for various facilities and equipment (including pneumatic controllers, storage tanks, reciprocating compressors and wet seal centrifugal compressors), more frequent leak detection and monitoring of fugitive emissions from compressor stations, and deadlines for repairing fugitive emissions. The EPA plans to issue a supplemental proposal containing proposed regulations in 2022 and aims to finalize the rule by the end of 2022.
Governmental entities, including certain states and groups of states, have adopted or are considering legislation, regulations or other initiatives such as GHG cap and trade programs, carbon taxes, GHG reporting and tracking programs, and emissions limits. At the international level, in February 2021 the U.S. rejoined the Paris Agreement, which requires member nations to submit non-binding GHG emissions reduction goals every five years. In April 2021, President Biden announced a new target for the U.S. to reduce GHG emissions 50-52% from 2005 levels by 2030. In November 2021, the U.S. joined other nations for the 26th Conference to the Parties (COP26), during which nations including the U.S. made various commitments, including the Global Methane Pledge to reduce methane emissions 30% from 2020 levels by 2030.
Governmental, scientific and public concern over the threat of climate change arising from GHG emissions has resulted in increasing political risks in the U.S. The Biden administration and future administrations could take various actions to curtail oil and natural gas production and transportation, including limiting fracturing of oil and natural gas wells, restricting flaring and venting during natural gas production on federal properties, limiting or banning oil and gas leases on federal lands and offshore waters, increasing requirements for construction and permitting of pipeline infrastructure and
| 24 | ||||||||
LNG export facilities, and further restricting GHG emissions from oil and gas facilities. Litigation risks are also increasing, as a number of cities and other governmental entities have brought suit alleging that fossil fuel producers created public nuisances by producing fuels that contributed to global warming effects such as rising sea levels, are responsible for associated roadway and infrastructure damage, or defrauded investors or customers by failing to timely and adequately disclose adverse effects of climate change.
There are also increasing financial risks for fossil fuel energy companies as investors become increasingly concerned about the potential effects of climate change and may elect in the future to shift some or all of their investments into non-fossil fuel energy related sectors. Institutional lenders who provide financing to fossil fuel energy companies also have become more attentive to sustainable lending practices that favor alternative power sources (such as wind, solar, geothermal, tidal and biofuels), making those sources more attractive, and some of them may elect not to provide funding for fossil fuel energy companies. Many of the largest U.S. banks have made “net zero” carbon emission commitments and have announced that they will be assessing financed emissions across their portfolios and taking steps to quantify and reduce those emissions. At COP26, the Glasgow Financial Alliance for Net Zero announced that commitments from over 450 firms across 45 countries had resulted in over $130 trillion in capital committed to net zero goals. Financial institutions could be required to adopt policies that limit funding for fossil fuel energy companies. In late 2020 the Federal Reserve joined the Network for Greening the Financial System (“NGFS”), a consortium of financial regulators focused on addressing climate-related risks in the financial sector, and in 2021 the Federal Reserve issued a statement supporting the efforts of NGFS in identifying potential solutions for climate-related challenges relevant to central banks and supervisory authorities. While Boardwalk Pipelines cannot predict what policies may result from these announcements, a material reduction in the capital available to the fossil fuel industry could make it more difficult to secure funding for exploration and production or midstream energy business activities, which could adversely impact its business and operations. Separately, the SEC has also announced that it is scrutinizing existing climate-change related disclosures in public filings, increasing the potential for enforcement if the SEC were to allege an issuer’s existing climate disclosures are misleading or deficient.
The adoption and implementation of new or more stringent international, federal, regional, state or local legislation, regulations or other initiatives that impose more stringent standards for GHG emissions from the oil and gas sector or otherwise restrict fossil fuel production could result in increased costs of compliance for fossil fuel use, and thereby reduce demand for fossil fuels, which could reduce demand for Boardwalk Pipelines’ transportation and storage services. Political, litigation and financial risks may result in Boardwalk Pipelines’ fossil fuel producer customers restricting or canceling production activities, incurring liability for infrastructure damages as a result of climatic changes, or impairing their ability to continue to operate in an economic manner, which also could reduce demand for Boardwalk Pipelines’ services. Moreover, the increased competitiveness of alternative energy sources could reduce demand for hydrocarbons and for Boardwalk Pipelines’ services. Finally, Boardwalk Pipelines may also be subject to various physical risks from climate change. For more information on these physical risks, see Boardwalk Pipelines’ risk factor titled “Climatic conditions and events could adversely impact Boardwalk Pipelines’operations, pipelines and facilities, or those of itscustomers or suppliers” below.
Climatic conditions and events could adversely impact Boardwalk Pipelines’ operations, pipelines and facilities, or those of its customers or suppliers.
Climatic events can cause disruptions to, delays in or suspension of Boardwalk Pipelines’ services, by interrupting its operations, causing loss of or damage to equipment, or having similar impacts on its customers or third party suppliers. In general, Boardwalk Pipelines’ operations could be significantly impacted by climatic conditions such as increased frequency and severity of storms, floods and wintry conditions. Boardwalk Pipelines’ pipeline operations along coastal waters and offshore in the Gulf of Mexico could be adversely impacted by climatic conditions such as rising sea levels, subsidence and erosion, which could result in serious damage to Boardwalk Pipelines’ facilities and affect its ability to provide transportation services. Such damage could result in leakage, migration, releases or spills from Boardwalk Pipelines’ operations and could result in liability, remedial obligations or otherwise have a negative impact on operations. Such climactic conditions could also impact Boardwalk Pipelines’ customers’ ability to utilize Boardwalk Pipelines’ services and third party suppliers’ ability to provide Boardwalk Pipelines with the products and services necessary to maintain operation of its facilities. Boardwalk Pipelines may incur significant damages as well as costs to repair or maintain its facilities, which could adversely affect its operations and the financial health of its business. In recent years, local governments and landowners in Louisiana have filed lawsuits against energy companies, alleging that their operations contributed to increased coastal rising seas and erosion and seeking substantial damages. Changing meteorological conditions, particularly temperature, may affect the amount, timing, or location of demand for energy or the products Boardwalk Pipelines transports, which may impact demand for its services.
| 25 | ||||||||
Legislative and regulatory initiatives relating to pipeline safety that require the use of new or more prescriptive compliance activities, substantial changes to existing integrity management programs or withdrawal of regulatory waivers could subject Boardwalk Pipelines to increased capital and operating costs and operational delays.
Boardwalk Pipelines’ interstate pipelines are subject to regulation by PHMSA, which is part of the DOT. PHMSA regulates the design, installation, testing, construction, operation, and maintenance of existing interstate natural gas and NGLs pipeline facilities. PHMSA regulation currently requires pipeline operators to implement integrity management programs, including frequent inspections, correctionremediation of certain identified anomalies and other measures to promote pipeline safety in HCAs, MCAs, Class 1 and 2 areas (depending on the potential impacts of a risk event), Class 3 and Class 4 areas, as well as in areas unusually sensitive to environmental damage and commercially navigable waterways. States have jurisdiction over certain of Boardwalk Pipelines’ intrastate pipelines and have adopted regulations similar to existing PHMSA regulations. State regulations may impose more stringent requirements than found under federal law that affect Boardwalk Pipelines’ intrastate operations. Compliance with these rules over time generally has resulted in an overall increase in maintenance costs. The imposition of new or more stringent pipeline safety rules applicable to natural gas or NGL pipelines, or any issuance or reinterpretation of guidance from PHMSA or any state agencies, with respect thereto could cause Boardwalk Pipelines to install new or modified safety controls, pursue additional capital projects or conduct maintenance programs on an accelerated basis, any or all of which tasks could result in Boardwalk Pipelines incurring increased capital and operating costs, experiencing operational delays and suffering potential adverse impacts to its operations or ability to reliably serve its customers. Requirements that are imposed under the 2011 Act, the 2016 Act or the more recent 20162020 Act, or other pipeline safety legislation or implementing regulations, may also increase Boardwalk Pipelines’ capital and operating costs or impact the operation of its pipelines. For example, in 2016, PHMSA published a proposed rulemaking that would impose new or more stringent requirements for certain natural gas pipelines including, among other things, expanding certain of PHMSA’s current regulatory safety programs for natural gas lines in newly defined MCAs that do not qualify as HCAs and requiring MAOP validation throughre-verificationof all historical records for pipelines in service, which may require natural gas pipelines installed before 1970 (previously excluded from certain pressure testing obligations) to be pressure tested. New pipeline safety legislation is expected to be proposed and finalized in 2020 that will reauthorize PHMSA pipeline safety programs, which under the 2016 Act expired at the end of September of 2019. Any such new pipeline safety legislation or implementing regulations could impose more stringent or costly compliance obligations on Boardwalk Pipelines and could require it to pursue additional capital projects or conduct integrity or maintenance programs on an accelerated basis, any or all of which tasks could result in Boardwalk Pipelines incurring increased operating costs that could have a material adverse effect on its costs of providing transportation services.
Boardwalk Pipelines has entered into certain firm transportation contracts with shippers on certain of its expansion projects that utilize the design capacity of certain of its pipeline assets, based upon the authority Boardwalk Pipelines received from PHMSA to operate those pipelines at higher than normal operating pressures of up to 0.80 of the pipeline’s SMYS under issued permits with specific conditions. PHMSA retains discretion to withdraw or modify this authority. If PHMSA were to withdraw or materially modify such authority, it could affect Boardwalk Pipelines’ ability to transport all of its contracted quantities of natural gas on these pipeline assets and it could incur significant additional costs to reinstate this authority or to develop alternate ways to meet its contractual obligations.
Boardwalk Pipelines’ actual construction and development costs could exceed its forecasts,forecasts; its anticipated cash flow from construction and development projects will not be immediateimmediate; and its construction and development projects may not be completed on time or at all.
Boardwalk Pipelines has been and is currently engaged in several construction projects involving its existing assets and the construction of new facilities for which it has expended or will expend significant capital. Boardwalk Pipelines expects to continue to engage in the construction of additional growth projects and modifications of its system. When Boardwalk Pipelines builds a new pipeline or expands or modifies an existing facility, the design, construction and development occurs over an extended period of time, and it will not receive any revenue or cash flow from that project until after it is placed into commercial service. On Boardwalk Pipelines’ interstate pipelines there are several years between when the project is announced and when customers begin using the new facilities. During this period, Boardwalk Pipelines spends capital and incurs costs without receiving any of the financial benefits associated with the projects. The construction of new assets involves regulatory (federal, state and local), landowner opposition, environmental, activist, legal, political, materials and labor costs, as well as operational and other risks that are difficult to predict and some are beyond Boardwalk Pipelines’ control. A project may not be completed on time or at all due to a variety of factors, may be impacted by significant cost overruns or may be materially changed prior to completion as a result of developments or circumstances that Boardwalk Pipelines is not aware of when it commits to the project. Any of these events could result in material unexpected costs or have a material adverse effect on Boardwalk Pipelines’ ability to realize the anticipated benefits from its growth projects.
Boardwalk Pipelines may face opposition to the operation of its pipelines and facilities or construction or expansion of facilities or new pipeline projects from various groups.
Boardwalk Pipelines may face opposition to the operation of its pipelines and facilities or construction or expansion of its facilities or new pipeline projects from governmental officials, environmental groups, landowners, communities, tribal or local groups and other advocates. Such opposition could take many forms, including organized protests, attempts to block or sabotage Boardwalk Pipelines’ and its customers’ operations, are subjectacts of eco-terrorism, intervention in regulatory or administrative proceedings involving Boardwalk Pipelines’ assets, or lawsuits or other actions designed to a series of risks arising out ofprevent, disrupt or delay the threat of climate change that could result in increased operating costs, limit the areas in which fossil fuels are produced and reduce demand for the services Boardwalk Pipelines provides.
| 26 | ||||||||
The price differentials between natural gas supplies and market demand for natural gas have reducedmay reduce the transportation rates that Boardwalk Pipelines can charge on certain portions of its pipeline systems.
Each year a portion of Boardwalk Pipelines firm natural gas transportation contracts expire and need to be replaced or renewed. Over the past several years, asAs a result of current market conditions, Boardwalk Pipelines has renewedmay renew some expiring contracts at lower rates or for shorter terms than in the past. The transportation rates Boardwalk Pipelines is able to charge customers are heavily influenced by market trends (both short and longer term), including the available supply, geographical location of natural gas production, the competition between producing basins, competition with other pipelines for supply and markets, the demand for gas byThe prevailing market conditions may also lead some of its customers to seek to renegotiate existing contracts to terms that are less attractive to Boardwalk Pipelines; for example, seeking a current price reduction in exchange for an extension of the contract term. Boardwalk Pipelines expects these market conditions to continue.
end-users
such as power plants, petrochemical facilities and LNG export facilities and the price differentials between the gas supplies and the market demand for the gas (basis differentials). Market conditions have resulted in a sustained narrowing of basis differentials on certain portions of Boardwalk Pipelines’ pipeline system, which has reduced transportation rates that can be charged in the affected areas and adversely affected the contract terms Boardwalk Pipelines can secure from its customers for available transportation capacity and for contracts being renewed or replaced. Changes in energy prices, including natural gas, oil and NGLs, impact the supply of and demand for those commodities, which impact Boardwalk Pipelines’ business.
Boardwalk Pipelines’ customers, especially producers and certain plant operators, are directly impacted by changes in commodity prices. The prices of natural gas, oil and NGLs fluctuate in response to changes in both domestic and worldwide supply and demand, market uncertainty and a variety of additional factors, including for natural gas, the realization of potential LNG exports and demand growth within the power generation market. Volatility in the pricing levels of natural gas, oil and NGLs could adversely affect the businesses of certain of Boardwalk Pipelines’ producer customers and could result in defaults or the non-renewal of Boardwalk Pipelines’ contracted capacity when existing contracts expire. Commodity prices could affect the operations of certain of Boardwalk Pipelines’ industrial customers, including the temporary closure or reduction of plant operations, resulting in decreased deliveries to those customers. Future increases in the price of natural gas and NGLs could make alternative energy and feedstock sources more competitive and decrease demand for natural gas and NGLs. A reduced level of demand for natural gas and NGLs could diminish the utilization of capacity on Boardwalk Pipelines’ systems and reduce the demand of its services.
Boardwalk Pipelines is exposed to credit risk relating to default or bankruptcy by its customers.
Credit risk relates to the risk of loss resulting from the default by a customer of its contractual obligations or the customer filing bankruptcy. Boardwalk Pipelines has credit risk with both its existing customers and those supporting its growth projects.
Credit risk exists in relation to Boardwalk Pipelines’ growth projects, both because foundationexpansion customers make long term firm capacity commitments to Boardwalk Pipelines for such projects and certain of those foundationexpansion customers agree to provide credit support as construction for such projects progresses. If a customer fails to post the required credit support or defaults during the growth project process, overall returns on the project may be reduced to the extent an adjustment to the scope of the project resultsoccurs or Boardwalk Pipelines is unable to replace the defaulting customer. Boardwalk Pipelines recently hadcustomer with a customer declarewilling to pay similar rates. In 2020 and 2019, two expansion customers declared bankruptcy for which itBoardwalk Pipelines was able to use the credit support obtained during the growth project process to cover a portion of the customer’s remaining long term commitment.
Boardwalk Pipelines’ credit exposure also includes receivables for services provided, future performance under firm agreements and volumes of gas owed by customers for imbalances or gas loaned by Boardwalk Pipelines to them under certain NNS and parking and lending (“PAL”) services.
Boardwalk Pipelines’ revolving credit facility contains operating and financial covenants that restrict its business and financing activities.
Boardwalk Pipelines’ revolving credit facility contains operating and financial covenants that may restrict its ability to finance future operations or capital needs or to expand or pursue business activities. Its credit agreement limits its ability to make loans or investments, make material changes to the nature of its business, merge, consolidate or engage in asset sales, or grant liens or make negative pledges. This agreement also requires it to maintain a ratio of consolidated debt to consolidated EBITDA (as defined in the agreement) of not more than 5.0 to 1.0, or up to 5.5 to 1.0 for the three quarters following a qualified acquisition or series of acquisitions, where the purchase price exceeds $100.0 million over a rolling 12-month period, which limits the amount of additional indebtedness Boardwalk Pipelines can incur to grow its business,
| 27 | ||||||||
Boardwalk Pipelines’ customers, especially producers, are directly impactedability to comply with the covenants and restrictions contained in its credit agreement may be affected by changes in commodity prices. The pricesevents beyond its control, including economic, financial and market conditions. If market, economic conditions or its financial performance deteriorate, its ability to comply with these covenants may be impaired. If Boardwalk Pipelines is not able to incur additional indebtedness, it may be required to seek other sources of natural gas, oil and NGLs fluctuate in response to changes in supply and demand, market uncertainty andfunding that may be on less favorable terms. If it defaults under its credit agreement or another financing agreement, significant additional restrictions may become applicable. In addition, a variety of additional factors, including for natural gas the realization of potential LNG exports and demand growth within the power generation market. The declines in the levels of natural gas, oil and NGLs prices experienced in recent history have adversely affected the businesses of Boardwalk Pipelines’ producer customers and reduced the demand for Boardwalk Pipelines’ services anddefault could result in defaults or thenon-renewalof Boardwalk Pipelines’ contracted capacity when existing contracts expire. Future increases in the price of natural gas and NGLs could make alternative energy and feedstock sources more competitive and reduce demand for natural gas and NGLs. A reduced level of demand for natural gas and NGLs could reduce the utilization of capacity on Boardwalk Pipelines’ systems and reduce the demanda significant portion of its services.indebtedness becoming immediately due and payable, and its lenders could terminate their commitment to make further loans to it. If such event occurs, Boardwalk Pipelines would not have, and may not be able to obtain, sufficient funds to make these accelerated payments.
Boardwalk Pipelines’ substantial indebtedness could affect its ability to meet its obligations and may otherwise restrict its activities.
As of December 31, 2021, Boardwalk Pipelines has a significanthad $3.4 billion in principal amount of indebtedness, whichlong-term debt outstanding. This level of debt requires significant interest payments. Boardwalk Pipelines’ inability to generate sufficient cash flow to satisfy its debt obligations, or to refinance its obligations on commercially reasonable terms, would have a material adverse effect on its business. Boardwalk Pipelines’ substantial indebtedness could have important consequences. For example, it could:
•limit Boardwalk Pipelines’ ability to borrow money for its working capital, capital expenditures, debt service requirements or other general business activities;
•impact the ratings received from credit rating agencies;
•increase Boardwalk Pipelines’ vulnerability to general adverse economic and industry conditions; and
•limit Boardwalk Pipelines’ ability to respond to business opportunities, including growing its business through acquisitions.
Boardwalk Pipelines will beis permitted, under its revolving credit facility and the indentures governing its notes, to incur additional debt, subject to certain limitations under its revolving credit facility and in the case of unsecured debt, under the indentures governing the notes. If Boardwalk Pipelines incurs additional debt, its increased leverage could also result in the consequences described above.
Limited access to the debt markets and increases in interest rates could adversely affect Boardwalk Pipelines’ business.
Boardwalk Pipelines anticipates funding its capital and other spending requirements through its available financing options, including cash generated from operations, and borrowings under its revolving credit facility.facility and issuances of additional debt. Changes in the debt markets, including market disruptions, limited liquidity, and an increase in interest rates, may increase the cost of financing as well as the risks of refinancing maturing debt. This may affect its ability to raise needed funding and reduce the amount of cash available to fund its operations or growth projects.projects or refinance maturing debt. If the debt markets were not available, it is not certain if other adequate financing options would be available to Boardwalk Pipelines on terms and conditions that it would find acceptable.
Any disruption in the debt markets could require Boardwalk Pipelines to take additional measures to conserve cash until the markets stabilize or until it can arrange alternative credit arrangements or other funding for its business needs. Such measures could include reducing or delaying business activities, reducing its operations to lower expenses and reducing other discretionary uses of cash. Boardwalk Pipelines may be unable to execute its growth strategy or take advantage of certain business opportunities.
The outbreak of COVID-19 and the measures to mitigate the spread of COVID-19 could materially adversely affect Boardwalk Pipelines’ business, financial condition and results of operations and those of its customers, suppliers and other business partners.
The global outbreak of the COVID-19 pandemic and measures to mitigate the spread of COVID-19 significantly impacted the world and the U.S., and impacted global demand for oil and petrochemical products. COVID-19 has also resulted in significant business and operational disruptions, including business closures, supply chain disruptions, travel restrictions, stay-at-home orders and limitations on the availability of workforces. Boardwalk Pipelines’ operations are considered essential critical infrastructure under current Cybersecurity and Infrastructure Security Agency guidelines;
| 28 | ||||||||
however, if significant portions of Boardwalk Pipelines’ workforce are unable to work effectively, including because of illness or quarantines, its business could be materially adversely affected. Boardwalk Pipelines may also be unable to perform fully on its contracts, and its costs may increase as a result of the COVID-19 outbreak. These cost increases may not be fully recoverable. It is possible that the continued spread of COVID-19 could also further cause disruption in Boardwalk Pipelines’ customers’ business; cause delay, or limit the ability of its customers to perform, including in making timely payments to it. The impact of COVID-19 has impacted capital markets, which may impact Boardwalk Pipelines’ customers’ financial position. The COVID-19 pandemic may also have the effect of increasing several of the other risk factors contained herein.
Boardwalk Pipelines does not own all of the land on which its pipelines and facilities are located, which could result in disruptions to its operations.
Substantial portions of Boardwalk Pipelines does not own all of the land on which itsPipelines’ pipelines, storage and other facilities have beenare constructed and maintained on property owned by others pursuant to rights-of-way, easements, permits, licenses or consents, and Boardwalk PipelinePipelines is subject to the possibility of more onerous terms and/or increased costs to retain necessary land use rights if it does not have validrights-of-way land use rights or if suchrights-of-way land use rights lapse or terminate. Boardwalk Pipelines obtainsSome of the rights to construct and operate itsBoardwalk Pipelines’ pipelines storage or other facilities on land owned by third parties and governmental agencies that it obtains are for a specific periodperiods of time. Boardwalk Pipelines cannot guarantee that it will always be able to renew, when necessary, existingrights-of-way land use rights or obtain newrights-of-way land use rights without experiencing significant costs or experiencing landowner opposition. Any loss of these land use rights with respect to the operation of Boardwalk Pipelines’ pipelines, storage and other facilities, through its inability to acquire or renewbusiness.operations.
right-of-way
or easement contracts or permits, licenses, consents or otherwise, could have a material adverse effect on its Boardwalk Pipelines may not be successful in executing its strategy to grow and diversify its business.
Boardwalk Pipelines relies primarily on the revenues generated from its natural gas transportation and storage services. Negative developments in these services have significantly greater impact on Boardwalk Pipelines’ financial condition and results of operations than if it maintained more diverse assets. Boardwalk Pipelines’ ability to grow, diversify and increase cash flows will depend, in part, on its ability to expand its existing business lines and to close and execute on accretive acquisitions. Boardwalk Pipelines may not be successful in acquiring or developing such assets or may do so on terms that ultimately are not profitable. Any such transactions involve potential risks that may include, among other things:
Boardwalk Pipelines’ ability to replace expiring gas storage contracts at attractive rates or on a long-term basis and to sell short-term services at attractive rates or at all are subject to market conditions.
Boardwalk Pipelines owns and operates substantial natural gas storage facilities. The market for the storage and PAL services that it offers is impacted by the factors and market conditions discussed above for Boardwalk Pipelines’ transportation services, and is also impacted by natural gas price differentials between time periods, such as winter to summer (time period price spreads), and the volatility in time period price spreads. When market conditions cause a narrowing of time period price spreads and a decline in the price volatility of natural gas, these factors adversely impact the rates Boardwalk Pipelines can charge for its storage and PAL services.
Boardwalk Pipelines’ operations are subject to catastrophic losses, operational hazards and unforeseen interruptions for which it may not be adequately insured.
There are a variety of operating risks inherent in transporting and storing natural gas, ethylene and NGLs, such as leaks and other forms of releases, explosions, fires, cyber-attacks and mechanical problems, which could have catastrophic consequences. Additionally, the nature and location of Boardwalk Pipelines’ business may make it susceptible to catastrophic losses from hurricanes or other named storms, particularly with regard to its assets in the Gulf Coast region, windstorms, earthquakes, hail, and other severe weather. Any of these or other similar occurrences could result in the disruption of Boardwalk Pipelines’ operations, substantial repair costs, personal injury or loss of life, significant damage to property, environmental pollution, impairment of its operations and substantial financial losses. The location of pipelines in HCAs, which includes populated areas, residential areas, commercial business centers and industrial sites, could significantly increase the level of damages resulting from some of these risks.
Boardwalk Pipelines currently possesses property, business interruption, cyber threat and general liability insurance, but proceeds from such insurance coverage may not be adequate for all liabilities or expenses incurred or revenues lost. Moreover, such insurance may not be available in the future at commercially reasonable costs and terms. The insurance coverage Boardwalk Pipelines does obtain may contain large deductibles or fail to cover certain events, hazards or all potential losses.
| 29 | ||||||||
Risks Related to Us and Our Subsidiary, Loews Hotels & Co
The COVID-19 pandemic and efforts to mitigate the spread of the virus have had, and are expected to continue to have, material adverse impacts on Loews Hotels & Co’s results of operations, financial condition and cash flows.
In response to the spread of COVID-19, governments across the globe have implemented measures to mitigate the spread of the virus, such as through city, regional or national lockdowns or stay-at-home orders, narrowly defined and widespread business closures, restrictions on travel, limitations on large group gatherings and quarantines, among others. Some of these measures, such as international travel restrictions in particular, continue in order to contain further spread. Beyond the existence of governmental restrictions, the perception of health risks associated with COVID-19 has limited, and continues to limit, business and leisure travel. The spread of the coronavirus, including its resurgence through new variants, and the continuing related containment efforts have had, and continue to have, macro-economic implications, the effects of which could be felt well beyond the time the spread of the virus is mitigated or contained. These developments have caused unprecedented disruptions to the global economy, including supply chains, air travel and normal business operations across sectors, including the hospitality industry that depends on active levels of business and leisure travel.
In response to the pandemic, Loews Hotels & Co temporarily suspended operations at the majority of its owned and/or operated hotels. While all of these hotels have resumed general operations, occupancy rates remain considerably lower, particularly for certain hotels that rely on business travel, when compared to occupancy rates prior to March of 2020. As such, revenues have been lower and may be insufficient to offset certain fixed costs, such as insurance and property taxes. The potential for the resuspension of operations varies by hotel property and will depend on numerous factors, many of which are outside Loews Hotels & Co’s control, including the transmissivity and virulence of future virus variants, the velocity of future virus spread and quarantine periods for individuals exposed or infected required or recommended by governmental authorities or medical professionals. In addition, as a result of the pandemic, Loews Hotels & Co has had to implement a number of new measures for the health and safety of its guests and employees. These new measures, which may need to remain in place for the foreseeable future, have resulted and will continue to result in increased costs.
Given that Loews Hotels & Co owns and leases, relative to some of its competitors, a higher proportion of its hotel properties, compared to the number of properties that it manages for third-party owners, it may as a result of COVID-19 and mitigation measures face increased risks associated with mortgage debt, including the possibility of default, cash trap periods, the inability to draw further loan disbursements and reduced availability of replacement financing at reasonable terms or at all; difficulty reducing costs; declines in real estate values and potential additional impairments in the value of Loews Hotels & Co’s assets; and a limited ability to respond to market conditions. In addition, uncertain or fluctuating real estate valuations and the inability for third-party purchasers to obtain capital may prevent Loews Hotels & Co from selling properties on acceptable terms.
The full extent and duration of the impacts caused by the COVID-19 outbreak on Loews Hotels & Co’s business, financial condition, operating results and cash flows remains largely uncertain and dependent on future developments that cannot be accurately predicted at this time, such as the severity, duration, transmission rate and geographic spread of current and future variants of COVID-19 worldwide, including in the United States and Canada, the extent and effectiveness, whether perceived or actual, of the containment and mitigation measures taken, the cost to implement containment and mitigation measures, the impact of containment and mitigation measures on operations and Loews Hotels & Co’s workforce, the timing, efficacy and ability of vaccinations and other treatments to combat COVID-19, and the response of the overall economy, the travel and leisure sector, financial markets, governmental authorities and the population, particularly in areas where Loews Hotels & Co operates. Accordingly, COVID-19 presents continuing material uncertainty and risk with respect to Loews Hotels & Co’s business, results of operations, financial condition, and cash flows.
Even following containment and mitigation of COVID-19, continuing uncertainty exists around when and if Loews Hotels & Co will be able to resume normal, pre-COVID-19 level operations for business or leisure travel. Once the COVID-19 outbreak is mitigated or contained, whenever that may be, historical travel patterns, both domestic and international, may continue to be disrupted either on a temporary basis or with longer term effects. For example, certain travel is dependent on commercial airlines restoring capacity, and their inability to restore full capacity or avoid the necessity to curtail operations in the future on a temporary or more permanent basis, could impact demand for Loews Hotels & Co’s services. Additionally, businesses that continue to rely on remote working and videoconferences may reduce the level of business travel both to save costs and to reduce the risk of exposure for their employees, and they may also seek alternatives to large public gatherings such as conferences and conventions. Leisure travelers may also be less inclined to travel or gather in large groups out of ongoing safety concerns, regardless of the lifting of mandated or recommended restrictions. In addition, with the potential adverse impact on jobs and the economy more broadly, leisure travel may be further impacted due to economic reasons. Further, the demand for lodging, and consumer confidence in travel generally, may not recover as quickly as other industries. Any of these trends could have continuing material adverse effects on Loews Hotels & Co’s results of operations, financial condition and cash flow.
| 30 | ||||||||
As part of cost containment efforts at the outset of the pandemic, Loews Hotels & Co put a substantial number of its employees on unpaid leaves of absence or severed them from the organization. Now that conditions have warranted the resumption of operations that necessitate increased staffing levels, finding and attracting sufficient talent to fill the roles that have been furloughed or eliminated has been challenging in certain markets in which Loews Hotels & Co operates. Additionally, many of Loews Hotels & Co’s service providers and suppliers also put their employees on leaves of absence or severed employees. Should they be unable to find and attract sufficient talent to fill the roles that they have furloughed or eliminated, Loews Hotels & Co may not have the requisite services or supplies available to resume operations at the time or in the manner of its choosing.
Loews Hotels & Co continues to evaluate spending and manage operating expenses as variants of COVID-19 impact different markets in which it operates. Loews Hotels & Co has received and may receive additional demands or requests from labor unions that represent its employees, whether in the course of its periodic renegotiation of collective bargaining agreements or otherwise, for additional compensation, healthcare benefits, operational protocols or other terms that could increase costs, and could experience labor disputes or disruptions as it continues to implement mitigation plans. Some actions Loews Hotels & Co has taken, or may take in the future, to reduce costs for it or its third-party owners may negatively impact guest loyalty, owner preference, and its ability to attract and retain employees, and its reputation and market share may suffer as a result. Further, the recovery period could be extensive and certain operational changes, particularly with respect to enhanced health and safety measures, may continue to be necessary and could increase ongoing costs.
Loews Hotels & Co’s construction projects could be delayed as a result of COVID-19 and related containment efforts, including containment efforts applicable to or affecting contractors, suppliers and inspectors required to review projects.
As a manager of hotels owned by joint ventures that Loews Hotels & Co invests in and by third parties, Loews Hotels & Co earns fees based on the revenues that those managed hotels generate. As a result of reduced revenues described above due to COVID-19 and mitigating measures, Loews Hotels & Co’s fee-based revenues are also materially reduced. Certain of these properties also have contracts that require payments by Loews Hotels & Co to preserve its management of the hotel if the hotel’s operating results do not achieve certain performance levels. These payments may be uneconomical for Loews Hotels & Co and lead to Loews Hotels & Co no longer managing one or more of those properties.
In properties in which Loews Hotels & Co has an ownership interest, Loews Hotels & Co leases space to third-party tenants and earns both fixed and variable amounts of rent, depending on each underlying lease arrangement. Some of these tenants informed Loews Hotels & Co that their operations have been adversely impacted by COVID-19 business restrictions causing rent abatement periods in certain circumstances. In addition, variable rent, which is generally tied to the tenant’s sales, has been, and will continue to be, materially adversely affected by the effects of the pandemic.
Loews Hotels & Co’s business may be materially adversely affected by various operating risks common to the hospitality industry, including competition, excess supply and dependence on business travel and tourism.
Loews Hotels & Co owns and operates hotels whichthat have different economic characteristics than many other real estate assets. A typical office property, for example, has long-term leases with third-party tenants, which provide a relatively stable long-term stream of revenue. Hotels, on the other hand, generate revenue from guests that typically stay at the hotel for only a few nights, which causes the room rate and occupancy levels at each hotel to change nearly every day, and results in earnings that can be highly volatile.
In addition, Loews Hotels & Co’s properties are subject to various operating risks common to the hospitality industry, many of which are beyond Loews Hotels & Co’s control, including:
•changes in general economic conditions, including the severity and duration of any downturn in the U.S. or global economy and financial markets;markets, as well as more localized changes in the economy of each hotel’s geographic location;
•disruptions or delays in our supply chain for goods and materials, including those used for hotel development, renovations and operations;
•labor supply disruptions or shortages;
•war, political conditions or civil unrest, terrorist activities or threats and heightened travel security measures instituted in response to these events;
| 31 | ||||||||
•outbreaks of pandemic or contagious diseases, such as the recent coronavirus;
•federal, state or local government-mandated travel restrictions and/or shut-down orders of hotels or other drivers that reduce demand for hotel businesses;
•natural ordisasters; disasters or other catastrophes;
man-made
•decreased corporate or government travel-related budgets and spending and cancellations, deferrals or renegotiations of group business due to self-imposed and/or government-mandated travel restrictions, adverse economic conditions or otherwise;
•decreased need for business-related travel due to innovations in business-related technology;
•the financial condition and general operational condition of the airline, automotive and other transportation-related industries and its impact on travel;
•decreased airline capacities and routes and disruption in airline operations;
•competition from other hotels and alternative accommodations, such as Airbnb, in the markets in which Loews Hotels & Co operates;
•requirements for periodic capital reinvestment to maintain and upgrade hotels;
•increases in operating costs, including labor (such as from minimum wage increases)increases or labor shortages), workers’ compensation, benefits, insurance, food and beverage, commodity costs, energy and unanticipated costs resulting from force majeure events, due to inflation, new or different federal, state or local governmental regulations, including tariffs, constrained supply, and other factors that may not be offset by increased revenues;
•the costs and administrative burdens associated with compliance with applicable laws and regulations;
•organized labor activities, which could cause a diversion of business from hotels involved in labor negotiations and loss of business for Loews Hotels & Co’s properties generally as a result of certain labor tactics;
•changes in the desirability of particular locations or travel patterns of customers, including with respect to the underlying attractions supporting Loews Hotels & Co’s existing and under development immersive destination properties, such as the Universal theme parkparks for its Orlando, Florida properties, theand stadiums, in Arlington, Texas and St. Louis, Missouri for its Live! by Loews hotelsarenas and convention centers for properties in other markets;
•geographic concentration of operations and customers;
•shortages of desirable locations for development; and
•relationships with third-party property owners, developers, landlords and joint venture partners, including the risk that third-party property owners, developers, landlords and/or partners may encounter financial difficulties, may not fulfill material obligations and/or may terminate lease, management, or joint venture or other agreements.
Loews Hotels & Cois exposed to the risks resulting from significant investments in owned and leased real estate, which could increase its costs, reduce its profits, limit its ability to respond to market conditions or restrict its growth strategy.
Loews Hotels & Co’s proportion of owned and leased properties, compared to the number of properties that it manages for third-party owners, is larger than that of some of its competitors. Real estate ownership and leasing is subject to risks not applicable to managed or franchised properties, including:
•real estate, insurance, zoning, tax, environmental and eminent domain laws;
| 32 | ||||||||
•the ongoing need for owner-funded capital improvements and expenditures to maintain or upgrade properties;
•risks associated with mortgage debt, including the possibility of default, fluctuating interest rate levels and the availability of replacement financing;
•risks associated with the possibility that cost increases will outpace revenue increases and that, in the event of an economic slowdown, a high proportion of fixed costs will make it difficult to reduce costs to the extent required to offset declining revenues;
•risks associated with real estate and property leases, including the possibility of rent increases and the inability to renew or extend upon favorable terms;
•risks associated with real estate condominiums, including the possibility of special assessments by condominiums that Loews Hotels & Co does not control;
•fluctuations in real estate values and potential impairments in the value of Loews Hotels & Co’s assets; and
•the relative illiquidity of real estate compared to some other assets.
The hospitality industry is subject to seasonal and cyclical volatility.
The hospitality industry is seasonal in nature. The periods during which Loews Hotels & Co’s properties experience higher revenues vary from property to property, depending principally upon location and the consumer base served. Historically, Loews Hotels & Co generally expectshas experienced revenues and earnings to bethat are lower in the third quarter of each year than in each of the other quarters. In addition, the hospitality industry is cyclical and demand generally follows the general economy on a lagged basis. The seasonality and cyclicality of its industry may contribute to fluctuation in Loews Hotels & Co’s results of operations, financial condition and financial condition.
cash flows.Loews Hotels & Co operates in a highly competitive industry, both for customers and for acquisitions and developments of new properties.
The hospitality industry is highly competitive. Loews Hotels & Co’s properties compete with other hotels and alternative accommodations based on a number of factors, including room rates, quality of accommodations, service levels and amenities, location, brand affiliation, reputation and reservation systems. New hotels may be constructed and these additions to supply create new competitors, in some cases without corresponding increases in demand for hotel rooms. Some of its competitors also have greater financial and marketing resources than Loews Hotels & Co. In addition, travelers can book stays on websites that facilitate the short-term rental of homes and apartments from owners, thereby providing an alternative to hotel rooms.
Loews Hotels & Co also competes for hotel acquisitions and development projects with entities that have similar investment objectives as it does. This competition could limit the number of suitable investment opportunities. It may also increase the bargaining power of Loews Hotels & Co’s counterparties, making it more difficult for Loews Hotels & Co to acquire or develop new properties on attractive terms or on the terms contemplated in its business plan.
plans.Any deterioration in the quality or reputation of Loews Hotels & Co’s brands could have ana material adverse effect on its reputation and business.
Loews Hotels & Co’s brands and its reputation are among its most important assets. Its ability to attract and retain guests depends, in part, on the public recognition of its brands and their associated reputation. If its brands become obsolete or consumers view them as unfashionable or lacking in consistency and quality, or its brands or reputation are otherwise harmed, Loews Hotels & Co may be unable to attract guests to its properties, and may further be unable to attract or retain joint venture partners or hotel owners. Loews Hotels & Co’s reputation may also suffer as a result of negative publicity regarding its hotels, including as a result of social media reports, regardless of the accuracy of such publicity. The continued expansion of media and social media formats has compounded the potential breadth and scope of negative publicity and has made it more difficult to control and effectively manage negative publicity.
Loews Hotels & Co’s efforts to develop new properties and renovate existing properties could be delayed or become more expensive.
Loews Hotels & Co from time to time renovates its properties and is currently expanding its portfolio through the a number of new developments, including new properties in Orlando,Coral Gables, Florida, Kansas City, Missouri, St. Louis, Missouri and Coral Gables,Arlington, Texas, along with a support facility in
ground-up
construction of| 33 | ||||||||
Apopka, Florida, and in the future may similarly develop additional new properties. Often these projects are undertaken with joint venture partners who may also serve as developer. These renovation and construction efforts are subject to a number of risks, including:
•construction delays, orchanges to plans and specifications and cost overruns (including labor and materials or unforeseeable site conditions) that may increase project costs; cause new development projects to not be completed by lender or municipal imposed required completion dates or subject Loews Hotels & Co to cancellation penalties for reservations accepted;
•obtaining zoning, occupancy and other required permits or authorizations;
•changes in economic conditions that may result in weakened or lack of demand or negative project returns;
•governmental restrictions on the size or kind of development;
•projects financed with construction debt are subject to interest rate risk as uncertain timing and amount of draws make effective hedging difficult to obtain;
•weather delays and force majeure events, including earthquakes, tornados, hurricanes, floods and other natural or floods;man made catastrophes; and
•design defects that could increase costs.
Additionally, renovating existing properties and developing new properties typically involvesinvolve lengthy development periods during which significant amounts of capital must be funded before the properties begin to operate and generate revenue. If the cost of fundingrenovations or new development exceeds budgeted amounts, and/or the time period for development is longer than initially anticipated, Loews Hotels & Co’s profitsoperating results could be reduced. Loews Hotels & Co has seen construction timelines lengthen due to various factors, including competition for skilled construction labor, challenges related to financing, disruption in the supply chain for materials, and the impact of COVID-19 generally, and these circumstances could continue or worsen in the future. Accordingly, there can be no assurance that all development pipeline projects will result in new hotels entering Loews Hotel & Co’s system, or that those hotels will open when anticipated. Further, due to the lengthy development cycle, intervening adverse economic conditions in general and as they apply to Loews Hotels & Co and its development partners may alter or impede the development plans, thereby resulting in incremental costs or potential impairment charges. In addition, using multiple sources of capital to develop new properties reduces or eliminates the ability of Loews Hotels & Co to cease commenced projects if the overall economic environment conditions change. Moreover, during the early stages of operations, charges related to interest expense and depreciation may substantially detract from, or even outweigh, the profitability of certain new property investments.
Co-investing in hotel properties decreases Loews Hotels & Co’s ability to manage risk.
Loews Hotels & Co’s properties are geographically concentrated, which exposes its business to the effects of regional events and occurrences.
Loews Hotels & Co has a concentration of hotels in Florida. Specifically, as of December 31, 2019, seven2021, eight hotels, representing 50%55% of rooms in its system, were located at Universal Orlando in Orlando, Florida and eightnine hotels, representing approximately 56%60% of rooms in its system, were located in Florida. The concentration of hotels in one region or a limited number of markets may expose Loews Hotels & Co to risks of adverse economic and other developments that are greater than if its portfolio were more geographically diverse. These developments include regional economic downturns, a decline in the popularity of or access to area tourist attractions, such as theme parks, significant increases in the number of Loews Hotels & Co’s competitors’ hotels in these markets and potentially higher local property, sales and income taxes, property insurance costs or other expenses in the geographic markets in which it is concentrated. In addition,
| 34 | ||||||||
Loews Hotels & Co’s properties in Florida are subject to the effects of adverse acts of nature, such as hurricanes, strong winds and flooding, which have in the past caused damage to its hotels in Florida, and which may in the future be intensified as a result of climate change, as well as outbreaks of pandemic or contagious diseases.
Loews Hotels & Co’s business may be significantly affected by other risks common to the Florida tourism industry. For example, the cost and availability of air services and the impact of any events that disrupt or reduce air travel to and from Florida for any reason can adversely affect its business.The growth and use of alternative reservation channels adversely affects Loews Hotels & Co’s business.
A significant percentage of hotel rooms for guests at Loews Hotels & Co’s properties is booked through internet travel and other intermediaries. In most cases, Loews Hotels & Co has agreements with such intermediaries and pays them commissions and/or fees for sales of its rooms through their systems. If such bookings increase, these intermediaries may be able to obtain higher commissions or fees, reduced room rates or other significant concessions from Loews Hotels & Co. There can be no assurance that Loews Hotels & Co will be able to negotiate such agreements in the future with terms as favorable as those that exist today. Moreover, these intermediaries generally employ aggressive marketing strategies, including expending significant resources for online and television advertising campaigns to drive consumers to their websites and other outlets. As a result, consumers may develop brand loyalties to the intermediaries’ offered brands, websites and reservations systems rather than to Loews Hotels & Co’s brands.
Although Loews Hotels & Co maintains various property, casualty and other insurance policies, proceeds from such insurance coverage may not be adequate for all liabilities or expenses incurred or revenues lost. Moreover, suchAdditionally, insurance policies that it maintains may not be available in the future at commercially reasonable costs and terms. The insurance coverage Loews Hotels & Co does obtainmaintains may contain large deductibles or failmay not cover all risks to cover certain events, hazards or all potential losses.
which its properties are potentially subject.Labor shortages could restrict Loews Hotels & Co’s ability to operate its properties or grow its business or result in increased labor costs that could reduce its profits.
Loews Hotels & Co’s properties are staffed 24 hours a day, seven days a week by thousands of employees. If it is unable to attract, retain, train and engage a sufficient number of skilled employees, its ability to manage and staff its properties adequately could be impaired, which could reduce customer satisfaction. Staffing shortages could also hinder its ability to grow and expand its business. Because payroll costs are a major component of the operating expenses at its properties, a shortage of skilled labor could also require higher wages that would increase its labor costs.
costs or temporarily ceasing to offer certain services, which could harm Loews Hotel & Co’s reputation or guest satisfaction.A portion of Loews Hotels & Co’s labor force is covered by collective bargaining agreements.
Work stoppages and other labor problems could negatively affect Loews Hotels & Co’s business and results of operations. A prolonged dispute with covered employees or any labor unrest, strikes or other business interruptions in connection with labor negotiations or otherwise could have an adverse impact on Loews Hotels & Co’s operations. Adverse publicity in the marketplace related to union messaging could further harm its reputation and reduce customer demand for its services. Also, wage and/or benefit increases resulting from new labor agreements may be significant and could have an adverse impact on its results of operations. To the extent that Loews Hotels & Co’s non-union employees join unions, Loews Hotels & Co would have greater exposure to risks associated with such labor problems. Furthermore, Loews Hotels & Co may have, or acquire in the future, multi-employer plans that are classified as “endangered,” “seriously endangered,” or “critical” status and a withdrawal in the future could result in the incurrence of a contingent liability that would be payable in an amount and at such time (or over a period of time) that would vary based on a number of factors at the time of (and after) withdrawal. Any such events or additional costs may have materially adverse effects.
Risks Related to Us and Our Subsidiary, Altium Packaging
The COVID-19 pandemic may have an adverse impact on Altium Packaging.
Altium Packaging manufactures packaging that is used with products in critical sectors, such as the pharmaceutical, household and industrial cleaning and food and beverage markets, and is thus an essential business as contemplated by state and local orders. It therefore has operated, and continues to operate, all of its manufacturing facilities to support those sectors. If widespread infections were to affect any of its facilities or workers, including those supporting critical sectors, it may be required to temporarily shut down or otherwise modify the working conditions at such facilities to address the
| 35 | ||||||||
infections. Any such changes could cause Altium Packaging to be unable to meet demand from its customers if it cannot provide support from other facilities in its network.
In addition, the COVID-19 pandemic’s wide-reaching impact on the global economy has disrupted global supply chains, including those that supply Altium Packaging with raw materials and other inputs necessary for it to manufacture its packaging products. Further, the pandemic has led to labor market dislocations that have led to employee-retention issues and an increase in the cost of labor at Altium Packaging’s manufacturing facilities. If these supply chain and/or labor market disruptions continue, Altium Packaging’s business may be materially adversely affected.
Altium Packaging’s substantial indebtedness could affect its ability to meet its obligations and may otherwise restrict its activities.
Altium Packaging has a significant amount of indebtedness, which requires significant interest payments. Its inability to generate sufficient cash flow to satisfy its debt obligations, or to refinance its obligations on commercially reasonable terms, would have a material adverse effect on its business. Altium Packaging’s substantial indebtedness could have important consequences. For example, it could:
•limit its ability to borrow money for its working capital, capital expenditures, debt service requirements or other corporate purposes;
•increase its vulnerability to general adverse economic and industry conditions; and
•limit its ability to respond to business opportunities, including growing its business through acquisitions.
In addition, the credit agreements governing its current indebtedness contain, and any future debt instruments would likely contain, financial and other restrictive covenants, which impose significant operating and financial restrictions on it. As a result of these covenants, Altium Packaging could be limited in the manner in which it conducts its business and may be unable to engage in favorable business activities or finance future operations or capital needs. Furthermore, a failure to comply with these covenants could result in an event of default which, if not cured or waived, could have a material adverse effect on Altium Packaging.
Altium Packaging is exposed to changes in consumer preferences.
Sales of Altium Packaging’s plastic containers depend heavily on the volume of sales made by its customers to consumers. Consequently, changes in consumer preferences for products in the industries that it serves or the packaging formats in which such products are delivered, whether as a result of changes in cost, convenience or health, environmental and social concerns or perceptions regarding plastics, may result in a decline in the demand for Altium Packaging’s plastic container products.
Fluctuations in raw material prices and raw material availability may materially affect Altium Packaging’s results.
To produce its products, Altium Packaging uses large quantities of plastic resins and recycled plastic materials. It faces the risk that its access to these raw materials may be interrupted or that it may not be able to purchase these raw materials at prices that are acceptable to it. In general, Altium Packaging does not have long-term supply contracts with its suppliers, and its purchases of raw materials are subject to market price volatility. Although Altium Packaging generally is able to pass changes in the prices of raw materials through to its customers over a period of time, it may not always be able to do so or there may be a lag between when its costs increase and when it passes those costs through to its customers. It may not be able to pass through all future raw material price increases in a timely manner or at all due to competitive pressures. In addition, a sustained increase in resin and recycled plastic prices, relative to alternative packaging materials, would make plastic containers less economical for its customers and could result in reductions in the use of plastic containers. Any limitation on its ability to procure its primary raw materials or to pass through price increases in such materials on a timely basis could materially negatively affect Altium Packaging.
Altium Packaging’s customers may increase their self-manufacturing.
Increased self-manufacturing by Altium Packaging’s customers may have a material adverse impact on its sales volume and financial results. Altium Packaging believes that its customers may engage in self-manufacturing over time at locations where transportation costs are high, and where low complexity and available space to install blow molding equipment exist.
| 36 | ||||||||
Risks Related to Us and Our Subsidiaries Generally
In addition to the specific risks and uncertainties faced by our subsidiaries, as discussed above, we and all of our subsidiaries face additional risks and uncertainties described below.
The COVID-19 pandemic is having widespread impacts on the way we and our subsidiaries operate.
The spread of COVID-19 and mitigating measures has had, and continues to have, macroeconomic implications, the effects of which could be felt well beyond the time during which the spread of the virus is mitigated or contained. These developments have caused unprecedented disruptions to the global economy and normal business operations across sectors and countries, including the sectors and countries in which we and our subsidiaries operate. Because of the size and breadth of the pandemic, all of the direct and indirect consequences of COVID-19 are not yet known and may not emerge for some time.
In response to the COVID-19 pandemic, large portions of our and our subsidiaries’ employees continue to work remotely on at least a part time basis, which, among other things, may disrupt their productivity. Similar workplace restrictions are in place at many of our and our subsidiaries’ critical vendors, which may result in interruptions in service delivery or failure by vendors to properly perform required services. In addition, having shifted to remote working arrangements and being more dependent on internet and telecommunications access and capabilities, we and our subsidiaries also face a heightened risk of cybersecurity attacks or data security incidents. We and our subsidiaries also self-insure our health benefits and therefore may experience increased medical claims as a result of the pandemic.
Failures or interruptions in or breaches to our or our subsidiaries’ computer systems or information technology or communication infrastructure or those of our third party vendors could materially and adversely affect our or our subsidiaries’ operations.
We and our subsidiaries are dependent upon information technologies, computer and communication systems and networks, including those maintained by us and our subsidiaries and those maintained and provided to us and our subsidiaries by third parties (for example, “software-as-a-service” and cloud solutions), to conduct operations and are reliant on technology to help increase efficiency in our and their businesses. We and our subsidiaries are dependent upon operational and financial computer and communication systems and information technology infrastructure to process the data necessary to conduct almost all aspects of our and their businesses. Any failure of our or our subsidiaries’ systems or information technology infrastructure, or those of our or their customers, vendors or others with whom we and they do business, could materially disrupt business operations. Computer, telecommunications and other business facilities and systems could become unavailable or impaired from a variety of causes, including cyber attacks or other cyber incidents, storms and other natural disasters, terrorist attacks, fires, utility outages, theft, design defects, human error or complications encountered as existing systems are replaced or upgraded. Cyber attacks and other cyber incidents are occurring more frequently, are constantly evolving in nature, are becoming more difficult to prevent, detect and remediate, and are being carried out by groups and individuals with a wide range of expertise and motives, and that may have the backing of foreign governmental actors. The U.S. government has issued public warnings that indicate energy assets may be specific targets of cyber attacks, which can have catastrophic consequences, and hotel chains, among other consumer-facing businesses, have been subject to various cyber attacks targeting payment card and other sensitive consumer information. Cyber attacks and cyber incidents take many forms, including cyber extortion, denial of service, social engineering, introduction of viruses or malware, exploiting vulnerabilities in hardware, software or other infrastructure, hacking, website defacement, theft of passwords and other credentials, unauthorized use of computing resources for digital currency mining and business email compromise. CNA was recently subjected to a sophisticated cybersecurity incident involving ransomware. In addition, one of CNA’s vendors also recently experienced a cybersecurity incident. For additional information about these incidents see “Risks Related to Us and Our Subsidiary, CNA Financial Corporation” above under this Part II, Item 1A.
As with other large companies, we and our subsidiaries and our and their third party vendors have experienced cyber attacks and other cyber incidents and expect this to continue. If we and our subsidiaries and our and their third party vendors do not allocate and effectively manage the resources necessary to continue to build and maintain our and their information technology security infrastructure, or if we or our subsidiaries or our or our subsidiaries’ vendors fail to timely identify or appropriately respond to cyber attacks or other cyber incidents, then this may disrupt our and our subsidiaries’ operations, cause significant damage to our or their assets and surrounding areas, cause loss of life or serious bodily injury, impact our or their data framework or cause a failure to protect personal information of customers, employees or others.
The foregoing risks relating to disruption of service, interruption of operations and data loss could impact our and our subsidiaries’ ability to timely perform critical business functions, resulting in disruption or deterioration in our and our subsidiaries’ operations and business and expose us and our subsidiaries to significant financial losses and monetary and reputational damages. In addition, potential exposures include substantially increased compliance costs and required
| 37 | ||||||||
computer system upgrades and security related investments. The breach of confidential information also could give rise to legal liability and regulatory action under data protection and privacy laws and regulations, both in the U.S. and foreign jurisdictions.
From time to time we and our subsidiaries may be subject to litigation, for which we and they may be unable to accurately assess the level of exposure and which if adversely determined, may have a significant adverse effect on our or their financial condition or results of operations.
We and our subsidiaries are or may become parties to legal proceedings and disputes. These matters may include, among others, contract disputes, claims disputes, reinsurance disputes, personal injury claims, environmental claims or proceedings, asbestos and other toxic tort claims, intellectual property disputes, disputes related to employment and tax matters and other litigation incidental to our or their businesses. For instance, we and certain of our Boardwalk Pipelines-related subsidiaries are defendants in a class action litigation in the State of Delaware related to our 2018 acquisition of the Boardwalk Pipelines limited partnership units not already owned by our affiliates. For additional information regarding this matter, see Note 17 of the Notes to Consolidated Financial Statements included under Item 8. Litigation is inherently subject to great uncertainty and it is difficult to predict the outcome or effect of any litigation matters. The outcome of any pending or future litigation could have a significant adverse impact on our or our subsidiaries’ financial condition or results of operations.
Acts of terrorism could harm us and our subsidiaries.
Terrorist attacks and the continued threat of terrorism in the United States or abroad, the continuation or escalation of existing armed hostilities or the outbreak of additional hostilities, including military and other action by the United States and its allies, could have a significant impact on us and the assets and businesses of our subsidiaries. CNA issues coverages that are exposed to risk of loss from an act of terrorism. Terrorist acts or the threat of terrorism could also result in increased political, economic and financial market instability, a decline in energy consumption and volatility in the price of oil and gas, which could affect the market for Diamond Offshore’s drilling services and Boardwalk Pipelines’ transportation and storage services. In addition, future terrorist attacks could lead to reductions in business travel and tourism which could harm Loews Hotels.Hotels & Co. While our subsidiaries take steps that they believe are appropriate to secure their assets, there is no assurance that they can completely secure them against a terrorist attack or obtain adequate insurance coverage for terrorist acts at reasonable rates.
Our subsidiaries face significant risks related to compliance with environmental laws.
Our subsidiaries have extensive obligations and financial exposure related to compliance with federal, state, local, foreign and international environmental laws, including those relating to the discharge of substances into the environment, the disposal, removal or clean up of hazardous wastes and other activities relating to the protection of the environment. Many of such laws have become increasingly stringent in recent years and may in some cases impose strict liability, which could be substantial, rendering a person liable for environmental damage without regard to negligence or fault on the part of that person. For example, Diamond Offshore could be liable for damagesBoardwalk Pipelines is subject to extensive federal, state and costs incurredlocal laws and regulations relating to protection of the environment. Such laws and regulations impose, among other things, restrictions, liabilities and obligations in connection with oilthe generation, handling, use, storage, transportation, treatment and disposal of various substances, including hazardous substances and waste in connection with spills, related to its operations, including for conductreleases, discharges and emissions of or conditions caused by others. Boardwalk Pipelines is also subject to environmental laws and regulations, including requiringvarious substances into the acquisition of permits or other approvals to conduct regulated activities, restricting the manner in which it disposes of waste, requiring remedial action to remove or mitigate contamination resulting from a spill or other release and requiring capital expenditures to comply with pollution control requirements.environment. In addition, Altium Packaging may be adversely affected by laws or regulations concerning environmental matters that increase the cost of producing, or otherwise adversely affect the demand for, plastic products. Further, existing environmental laws or the interpretation or enforcement thereof may be amended and new laws may be adopted in the future.
Loss of key vendor relationships or issues relating to the transitioning of vendor relationships could result in a materially adverse effect on our and our subsidiaries’ operations.
We and our subsidiaries rely on products, equipment and services provided by many third partythird-party suppliers, manufacturers and service providers in the United States and abroad, which exposes us and them to volatility in the quality, price and availability of such items. These include, for example, vendors of computer hardware, software and services, as well as other critical materials and services (including, in the case of CNA, claims administrators performing significant claims administration and adjudication functions). Certain products, equipment and services may be available from a limited number of sources. If one or more key vendors becomes unable to continue to provide products, equipment or services at the requisite level for any reason, or fails to protect our proprietary information, including in some cases personal information of employees, customers, or hotel guests or others, we and our subsidiaries may experience a material adverse effect on our or their business, operations and reputation.
| 38 | ||||||||
We could incur impairment charges related to the carrying value of the long-lived assets and goodwill of our subsidiaries.
Our subsidiaries regularly evaluate their long-lived assets and goodwill for impairment whenever events or changes in circumstances indicate the carrying value of these assets may not be recoverable. Most notably, we could incur impairment charges related to the carrying value of offshore drilling equipment at Diamond Offshore, pipeline and storage assets at Boardwalk Pipelines, our equity method investment in Altium Packaging and hotel propertiesinvestments owned by Loews Hotels.
Hotels & Co.We also test goodwill for impairment on an annual basis or when events or changes in circumstances indicate that a potential impairment exists. Asset impairment evaluations by us and our subsidiaries with respect to both long-lived assets and goodwill are, by nature, highly subjective. The use of different estimates and assumptions could result in materially different carrying values of our assets which could impact the need to record an impairment charge and the amount of any charge taken.
We are a holding company and derive substantially all of our income and cash flow from our subsidiaries.
We rely upon our invested cash balances and distributions from our subsidiaries to generate the funds necessary to meet our obligations and to declare and pay any dividends to holders of our common stock. Our subsidiaries are separate and independent legal entities and have no obligation, contingent or otherwise, to make funds available to us, whether in the form of loans, dividends or otherwise. The ability of our subsidiaries to pay dividends is subject to, among other things, the availability of sufficient earnings and funds in such subsidiaries, applicable state laws, including in the case of the insurance subsidiaries of CNA, laws and rules governing the payment of dividends by regulated insurance companies, and their compliance with covenants in their respective loan agreements. Claims of creditors of our subsidiaries will generally have priority as to the assets of such subsidiaries over our claims and those of our creditors and shareholders.
We and our subsidiaries face competition for senior executives and qualified specialized talent.
We and our subsidiaries depend on the services of our key personnel, who possess skills critical to the operation of our and their businesses. Our and our subsidiaries’ executive management teams are highly experienced and possess extensive skills in their relevant industries. The ability to retain senior executives and to attract and retain highly skilled professionals and personnel with specialized industry and technical experience is important to our and our subsidiaries’ success and future growth. Competition for this talent can be intense, and we and our subsidiaries may not be successful in our efforts. The unexpected loss of the services of these individuals could have a detrimental effect on us and our subsidiaries and could hinder our and their ability to effectively compete in the various industries in which we and they operate.
Companies across all industries are facing increasing scrutiny from stakeholders related to their ESG practices. Certain influential investors in recent years have been focused on ESG practices and have placed increasing importance on the implications and social cost of their investments. In addition, organizations that provide information on corporate governance and related matters have developed ratings processes for evaluating companies on their approach to ESG matters, and many of these ratings processes are inconsistent with each other. Such ratings are used by some investors to inform their investment and voting decisions. Regardless of the industry, investors’ increased focus and activism related to ESG and similar matters may hinder access to, or increase the cost of, capital, as investors may decide to reallocate capital or to not commit capital as a result of their assessment of a company’s ESG practices. In addition, other stakeholders, including customers, employees, suppliers, regulators and ratings agencies, have also been focused on ESG matters.
Companies have also increasingly been requested by stakeholders to create and publish disclosures regarding their ESG practices. While we and our subsidiaries are subject to litigation, for which we and they may be unable to accurately assess the level of exposure and which if adversely determined, may have a significant adverse effect on our or their consolidated financial condition or results of operations.
As a holding company, our stakeholders generally focus on the ESG practices across our enterprise, including those at our subsidiaries. As our subsidiaries operate in different industries, the particular ESG issues that stakeholders tend to focus on differ from subsidiary to subsidiary. For instance, as a defendantproperty and casualty insurer, CNA’s stakeholders may focus on the ESG practices of companies in tobacco-related lawsuitswhich CNA invests, while Boardwalk Pipelines’ stakeholders may focus on climate change and could be named as a defendant in additional tobacco-related suits, notwithstandingemissions from Boardwalk Pipelines’ operations and Loews Hotels & Co’s stakeholders may focus on the completion of the Separation. In the Separation Agreement entered into between us and Lorillard and its subsidiaries in connection with the Separation, Lorillard and eachcarbon footprint of its subsidiaries has agreed to indemnify us for liabilities related to Lorillard’s tobacco business, including liabilities that we may incur for current and future tobacco-related litigation against us. While we do not believe that we have any liability for tobacco-related claims, and we have never been held liable for any such claims, an adverse decision in a tobacco-related lawsuit against us could, if the indemnification is deemed for any reason to be unenforceable or any amounts owed to us thereunder are not collectible, in whole or in part, have a material adverse effect on us.properties.
| 39 | ||||||||
Companies that do not adapt to or comply with investor or other stakeholder expectations and standards, which are evolving, or that are perceived to have not responded appropriately to the growing concern regarding ESG issues, regardless of whether there is a legal requirement to do so, may suffer from reputational damage and other adverse consequences. Additionally, to the extent ESG matters negatively impact our reputation, we may not be able to compete as effectively to recruit or retain employees, which may adversely affect our operations.
Item 1B. Unresolved Staff Comments.
None.
Item 2. Properties.
Our corporate headquarters is located in approximately 136,000 square feet of leased office space in two buildings in New York City. We also lease approximately 21,000 square feet of office space in one building in White Plains, New York. Information relating to our subsidiaries’ properties is contained under Item 1.
Item 3. Legal Proceedings.
Information on our legal proceedings is included in Notes 18 and 19Note 17 of the Notes to Consolidated Financial Statements, included under Item 8.
In addition, information regarding the bankruptcy of Diamond Offshore is included in the Overview section of MD&A in Item 7 and Note 2 of the Notes to Consolidated Financial Statements, included under Item 8.Item 4. Mine Safety Disclosures.
Not applicable.
| 40 | ||||||||
PART II
Item 5. Market for the Registrant’s Common Equity, Related Stockholder Matters and Issuer Purchases of Equity Securities.
Our common stock is listed on the New York Stock Exchange under the symbol “L”.
The following graph compares annual total return of our Common Stock, the Standard & Poor’s 500 Composite Stock Index (“S&P 500 Index”) and our peer group set forth below (“Loews Peer Group”) for the five years ended December 31, 2019.2021. The graph assumes that the value of the investment in our Common Stock, the S&P 500 Index and the Loews Peer Group was $100 on December 31, 20142016 and that all dividends were reinvested.
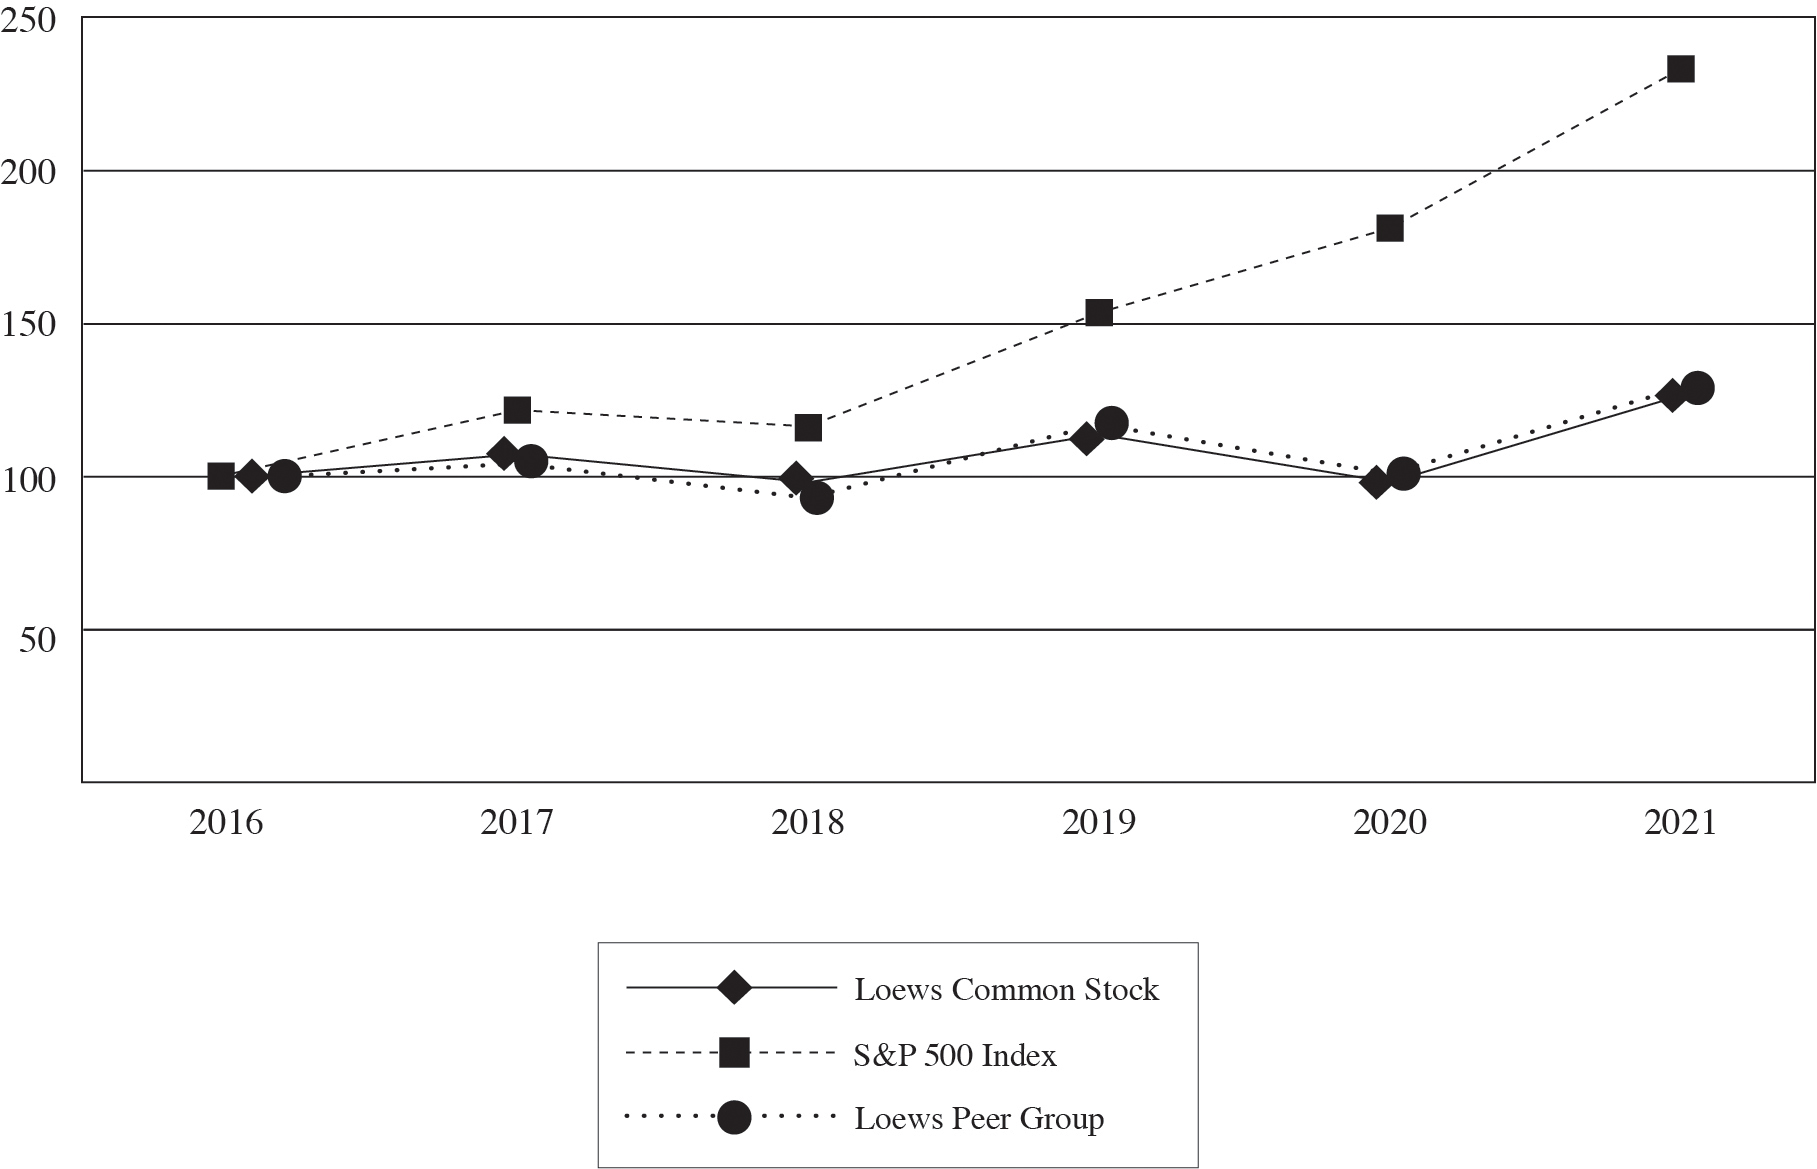
| 2016 | 2017 | 2018 | 2019 | 2020 | 2021 | |||||||||||||||
| Loews Common Stock | 100.0 | 107.39 | 98.21 | 113.82 | 98.23 | 126.61 | ||||||||||||||
| S&P 500 Index | 100.0 | 121.83 | 116.49 | 153.17 | 181.35 | 233.41 | ||||||||||||||
Loews Peer Group (a) | 100.0 | 104.31 | 93.13 | 117.09 | 101.03 | 129.05 | ||||||||||||||
(a)The Loews Peer Group consists of the following companies that are industry peers of our principal operating subsidiaries or our investment in Altium Packaging: Berry Global, Inc., Chubb Limited, Diamond Rock Hospitality Company, Enbridge Inc., Energy Transfer LP, Kinder Morgan, Inc., Ryman Hospitality Properties, Inc., Silgan Holdings Inc., Sunstone Hotel Investors, Inc., The Hartford Financial Services Group, Inc., The Travelers Companies, Inc., W.R. Berkley Corporation and Xenia Hotels & Resorts, Inc.
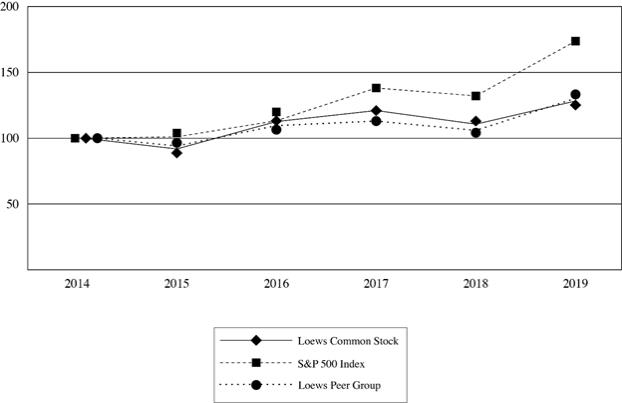
2014 | 2015 | 2016 | 2017 | 2018 | 2019 | ||||||||
Loews Common Stock | 100.0 | 91.98 | 112.86 | 121.21 | 110.84 | 128.46 | |||||||
S&P 500 Index | 100.0 | 101.38 | 113.51 | 138.29 | 132.23 | 173.86 | |||||||
Loews Peer Group (a) | 100.0 | 94.68 | 109.90 | 113.20 | 106.21 | 130.57 | |||||||
| 41 | ||||||||
Securities Authorized for Issuance Under Equity Compensation Plans
The following table provides certain information as of December 31, 20192021 with respect to our equity compensation plans under which our equity securities are authorized for issuance.
Number of | ||||||||||||
securities remaining | ||||||||||||
Number of | available for future | |||||||||||
securities to be | issuance under | |||||||||||
issued upon exercise | Weighted average | equity compensation | ||||||||||
of outstanding | exercise price of | plans (excluding | ||||||||||
options, warrants | outstanding options, | securities reflected | ||||||||||
Plan category | and rights | warrants and rights | in the first column) | |||||||||
Equity compensation plans approved by security holders (a) | 3,025,294 | $ �� 41.11 | 5,597,156 | |||||||||
Equity compensation plans not approved by security holders (b) | N/A | N/A | N/A | |||||||||
| Plan category | Number of securities to be issued upon exercise of outstanding options, warrants and rights | Weighted average exercise price of outstanding options, warrants and rights | Number of securities remaining available for future issuance under equity compensation plans (excluding securities reflected in the first column) | ||||||||
Equity compensation plans approved by security holders (a) | 1,946,731 | $ | 42.15 | 5,887,617 | |||||||
Equity compensation plans not approved by security holders (b) | N/A | N/A | N/A | ||||||||
(a)Reflects 1,364,502 outstanding stock appreciation rights awarded under the Loews Corporation 2000 Stock Option Plan, 454,469 outstanding unvested time-based and/or performance-based restricted stock units (“RSUs”) and 127,760 deferred vested RSUs awarded under the Loews Corporation 2016 Incentive Compensation Plan. The weighted average exercise price does not take into account RSUs as they do not have an exercise price.
(b)We do not have equity compensation plans that have not been approved by our shareholders.
Approximate Number of Equity Security Holders
As of February 3, 2020,1, 2022, we had approximately 700620 holders of record of our common stock.
Common Stock Repurchases
Our Board of Directors has authorized our management, as it deems appropriate, to purchase, in the open market, through privately negotiated transactions or otherwise, our outstanding common stock.
During the fourth quarter of 2019,2021, we purchased shares of our common stock as follows:
Period | (a) Total number of shares purchased | (b) Average price paid per share | (c) Total number of shares purchased as part of publicly announced plans or programs | (d) Maximum number of shares (or approximate dollar value) of shares that may yet be purchased under the plans or programs (in millions) | ||||||||||||
October 1, 2019 - October 31, 2019 | 2,565,169 | $ 49.76 | N/A | N/A | ||||||||||||
November 1, 2019 - November 30, 2019 | 2,161,832 | 50.38 | N/A | N/A | ||||||||||||
December 1, 2019 - December 31, 2019 | 3,562,239 | 50.78 | N/A | N/A | ||||||||||||
| Period | (a) Total number of shares purchased | (b) Average price paid per share | (c) Total number of shares purchased as part of publicly announced plans or programs | (d) Maximum number of shares (or approximate dollar value) of shares that may yet be purchased under the plans or programs (in millions) | |||||||||||||||||||
| October 1, 2021 - October 31, 2021 | 83,330 | $ | 54.81 | N/A | N/A | ||||||||||||||||||
| November 1, 2021 - November 30, 2021 | 3,100,048 | 56.72 | N/A | N/A | |||||||||||||||||||
| December 1, 2021 - December 31, 2021 | 2,227,755 | 56.33 | N/A | N/A | |||||||||||||||||||
| 42 | ||||||||
Year Ended December 31 | 2019 | 2018 | 2017 (a) | 2016 (a) | 2015 (a) | |||||||||||||||
(In millions, except per share data) | ||||||||||||||||||||
Results of Operations: | ||||||||||||||||||||
Revenues | $ | 14,931 | $ | 14,066 | $ | 13,735 | $ | 13,105 | $ | 13,415 | ||||||||||
Income before income tax | $ | 1,119 | $ | 834 | $ | 1,582 | $ | 936 | $ | 244 | ||||||||||
Net income | $ | 871 | $ | 706 | $ | 1,412 | $ | 716 | $ | 287 | ||||||||||
Amounts attributable to noncontrolling interests | 61 | (70 | ) | (248 | ) | (62 | ) | (27) | ||||||||||||
Net income attributable to Loews Corporation | $ | 932 | $ | 636 | $ | 1,164 | $ | 654 | $ | 260 | ||||||||||
Diluted net income per share | $ | 3.07 | $ | 1.99 | $ | 3.45 | $ | 1.93 | $ | 0.72 | ||||||||||
Financial Position: | ||||||||||||||||||||
Investments | $ | 51,250 | $ | 48,186 | $ | 52,226 | $ | 50,711 | $ | 49,400 | ||||||||||
Total assets | 82,243 | 78,316 | 79,586 | 76,594 | 76,006 | |||||||||||||||
Debt | 11,533 | 11,376 | 11,533 | 10,778 | 10,560 | |||||||||||||||
Shareholders’ equity | 19,119 | 18,518 | 19,204 | 18,163 | 17,561 | |||||||||||||||
Cash dividends per share | 0.25 | 0.25 | 0.25 | 0.25 | 0.25 | |||||||||||||||
Book value per share | 65.71 | 59.34 | 57.83 | 53.96 | 51.67 | |||||||||||||||
Shares outstanding | 290.97 | 312.07 | 332.09 | 336.62 | 339.90 | |||||||||||||||
Item 7. Management’s Discussion and Analysis of Financial Condition and Results of Operations.
No. | ||||
OVERVIEW
Unless the context otherwise requires, the term “Company” as used herein means Loews Corporation including its consolidated subsidiaries, is headed by a chief executive officer who is responsible for the operation ofterms “Parent Company,” “we,” “our,” “us” or like terms as used herein mean Loews Corporation excluding its businesssubsidiaries, the term “Net income (loss) attributable to Loews Corporation” as used herein means Net income (loss) attributable to Loews Corporation shareholders and has the duties and authority commensurate with that position.
term “subsidiaries” means the Loews Corporation’s consolidated subsidiaries.We rely upon our invested cash balances and distributions from our subsidiaries to generate the funds necessary to meet our obligations and to declare and pay any dividends to our shareholders. The ability of our subsidiaries to pay dividends is subject to, among other things, the availability of sufficient earnings and funds in such subsidiaries, applicable state laws, including in the case of the insurance subsidiaries of CNA, laws and rules governing the payment of dividends by regulated insurance companies (see Note 14 of the Notes to Consolidated Financial Statements included under Item 8) and compliance with covenants in their respective loan agreements. Claims of creditors of our subsidiaries will generally have priority as to the assets of such subsidiaries over our claims and those of our creditors and shareholders.
The following discussion should be read in conjunction with Item 1A, Risk Factors, and Item 8, Financial Statements and Supplementary Data of this Form20182020 and 20172019 for Loews Corporation and its subsidiaries see Part II, Item 7, Management’s Discussion and Analysis of Financial Condition and Results of Operations in our Annual Report on Form2018,2020, filed with the SEC on February 13, 2019.9, 2021.
10-K.
For a discussion of changes in results of operations comparing the years ended December 31, 10-K
for the year ended December 31, | 43 | ||||||||
RESULTS OF OPERATIONS
Consolidated Financial Results
The following table summarizes net income (loss) attributable to Loews Corporation by segment and net income (loss) per share attributable to Loews Corporation for the years ended December 31, 20192021 and 2018:
Year Ended December 31 | 2019 | 2018 | ||||||
(In millions, except per share) | ||||||||
CNA Financial | $ | 894 | $ | 726 | ||||
Diamond Offshore | (175) | (112) | ||||||
Boardwalk Pipelines | 209 | 135 | ||||||
Loews Hotels & Co | (31) | 48 | ||||||
Corporate | 35 | (161) | ||||||
Net income attributable to Loews Corporation | $ | 932 | $ | 636 | ||||
Basic net income per common share | $ | 3.08 | $ | 1.99 | ||||
Diluted net income per common share | 3.07 | 1.99 | ||||||
2020:
| Year Ended December 31 | 2021 | 2020 | |||||||||
| (In millions, except per share data) | |||||||||||
| CNA Financial | $ | 1,077 | $ | 618 | |||||||
| Boardwalk Pipelines | 235 | 206 | |||||||||
| Loews Hotels & Co | (14) | (212) | |||||||||
| Corporate (a) | 280 | (1,067) | |||||||||
| Diamond Offshore (b) | — | (476) | |||||||||
| Net income (loss) attributable to Loews Corporation | $ | 1,578 | $ | (931) | |||||||
| Basic net income (loss) per share | $ | 6.08 | $ | (3.32) | |||||||
| Diluted net income (loss) per share | $ | 6.07 | $ | (3.32) | |||||||
| (a) | Includes a net investment gain of $555 million ($438 million after tax) related to the sale of 47% of Altium Packaging in 2021 and a net investment loss of $1.2 billion ($957 million after tax) caused by the write down of the carrying value of our interest in Diamond Offshore in 2020. | ||||
| (b) | Includes impairment charges of $774 million ($408 million after tax and noncontrolling interests) at Diamond Offshore in the first quarter of 2020, prior to deconsolidation. | ||||
The improvement in Loews Corporation’s results in 2021 compared to $636 million, or $1.99 per share,2020 was driven by improved current accident year underwriting results, higher net investment income and investment gains in 2018.
| 44 | ||||||||
CNA Financial
The following table summarizes the results of operations for CNA for the years ended December 31, 20192021 and 20182020 as presented in Note 2019 of the Notes to Consolidated Financial Statements included under Item 8. For further discussion of Net investment income and Net investmentInvestment gains or losses,(losses), see the Investments section of this MD&A.
Year Ended December 31 | 2019 | 2018 | ||||||||||
(In millions) | ||||||||||||
Revenues: | ||||||||||||
Insurance premiums | $ | 7,428 | $ | 7,312 | ||||||||
Net investment income | 2,118 | 1,817 | ||||||||||
Investment gains (losses) | 49 | (57 | ) | |||||||||
Non-insurance warranty revenue | 1,161 | 1,007 | ||||||||||
Operating revenues and other | 32 | 55 | ||||||||||
Total | 10,788 | 10,134 | ||||||||||
Expenses: | ||||||||||||
Insurance claims and policyholders’ benefits | 5,806 | 5,572 | ||||||||||
Amortization of deferred acquisition costs | 1,383 | 1,335 | ||||||||||
Non-insurance warranty expense | 1,082 | 923 | ||||||||||
Other operating expenses | 1,141 | 1,203 | ||||||||||
Interest | 152 | 138 | ||||||||||
Total | 9,564 | 9,171 | ||||||||||
Income before income tax | 1,224 | 963 | ||||||||||
Income tax expense | (224 | ) | (151 | ) | ||||||||
Net income | 1,000 | 812 | ||||||||||
Amounts attributable to noncontrolling interests | (106 | ) | (86 | ) | ||||||||
Net income attributable to Loews Corporation | $ | 894 | $ | 726 | ||||||||
| Year Ended December 31 | 2021 | 2020 | |||||||||
| (In millions) | |||||||||||
| Revenues: | |||||||||||
| Insurance premiums | $ | 8,175 | $ | 7,649 | |||||||
| Net investment income | 2,159 | 1,935 | |||||||||
| Investment gains (losses) | 120 | (35) | |||||||||
| Non-insurance warranty revenue | 1,430 | 1,252 | |||||||||
| Other revenues | 24 | 26 | |||||||||
| Total | 11,908 | 10,827 | |||||||||
| Expenses: | |||||||||||
| Insurance claims and policyholders’ benefits | 6,349 | 6,170 | |||||||||
| Amortization of deferred acquisition costs | 1,443 | 1,410 | |||||||||
| Non-insurance warranty expense | 1,328 | 1,159 | |||||||||
| Other operating expenses | 1,191 | 1,125 | |||||||||
| Interest | 113 | 142 | |||||||||
| Total | 10,424 | 10,006 | |||||||||
| Income before income tax | 1,484 | 821 | |||||||||
| Income tax expense | (282) | (131) | |||||||||
| Net income | 1,202 | 690 | |||||||||
| Amounts attributable to noncontrolling interests | (125) | (72) | |||||||||
| Net income attributable to Loews Corporation | $ | 1,077 | $ | 618 | |||||||
Net income attributable to Loews Corporation increased $168$459 million in 2019for 2021 as compared with 20182020. The increase was primarily due to improved current accident year underwriting results. Net catastrophe losses were $397 million ($280 million after tax and noncontrolling interests) for 2021 as compared to $550 million ($388 million after tax and noncontrolling interests) in 2020. Net catastrophe losses for 2021 were driven by severe weather related events, primarily Hurricane Ida and Winter Storms Uri and Viola. Net catastrophe losses for 2020 included $294 million related primarily to severe weather-related events, $195 million related to the COVID-19 pandemic and $61 million related to civil unrest. Results also reflect higher net investment income and investment gains in 2021 as compared with investment losses in 2020. Higher net investment income was driven by limited partnership and common stock returns and favorable current accident year underwriting results. Earnings also benefited from higher net realizedthe improvement in investment resultsgains (losses) was driven by lower impairment losses. Results for 2021 also reflect the change in fair valueabsence ofnon-redeemablepreferred stock still held as of December 31, 2019 and lower adverse prior year A&EP reserve development. These increases were partially offset by a $151$74 million charge (after($52 million after tax and noncontrolling interests) related to the recognition of aan active life reserve premium deficiency as a result of the third quarter 2019 gross premium valuation (“GPV”) and lower favorable net prior period loss reserve developmentfor long term care policies in the current year.2020.
CNA’s Property & Casualty and Other Insurance Operations
CNA’s commercial property and casualty insurance operations (“Property & Casualty Operations”) include its Specialty, Commercial and International lines of business. CNA’s Other Insurance Operations outside of Property & Casualty Operations include its long term care business that is in&EP.&EP”), a legacy portfolio of excess workers’ compensation (“EWC”) policies and certain legacy mass tort reserves. CNA’s products and services are primarily marketed through independent agents, brokers and managing general underwriters to a wide variety of customers, including small, medium and large businesses, insurance companies, associations, professionals and other groups. We believe the presentation of CNA as one reportable segment is
run-off,
certain corporate expenses, including interest on CNA’s corporate debt, and the results of certain property and casualty businesses inrun-off,
including CNA Re, asbestos and environmental pollution (“A| 45 | ||||||||
appropriate in accordance with applicable accounting standards on segment reporting. However, for purposes of this discussion and analysis of the results of operations, we provide greater detail with respect to CNA’s Property & Casualty Operations and Other Insurance Operations to enhance the reader’s understanding and to provide further transparency into key drivers of CNA’s financial results.
In assessing CNA’sits insurance operations, the CompanyCNA utilizes the core income (loss) financial measure. Core income (loss) is calculated by excluding from net income (loss) (i) net, investment gains or losses (ii) income or loss from discontinued operations, (iii)and any cumulative effects of changes in accounting guidance and (iv) deferred tax asset and liability remeasurement as a result of an enacted U.S. federal tax rate change.guidance. In addition, core income (loss) excludes the effects of noncontrolling interests. The calculation of core income (loss) excludes net investment gains or losses because net investment gains or losses are generally driven by economic factors that are not necessarily reflective of CNA’s primary insurance operations. Core income (loss) is deemed to be a
non-GAAP
financial measure and management believes this measure is useful for investors to evaluate its insurance operations.Please see the non-GAAP reconciliation of core income (loss) to net income (loss) that follows in this MD&A.Property & Casualty Operations
In evaluating the results of Property & Casualty Operations, CNA utilizes the loss ratio, the loss ratio excluding catastrophes and development, the expense ratio, the dividend ratio, the combined ratio and the combined ratio.ratio excluding catastrophes and development. These ratios are calculated using GAAP financial results. The loss ratio is the percentage of net incurred claim and claim adjustment expenses to net earned premiums. The loss ratio excluding catastrophes and development excludes net catastrophes losses and changes in estimates of claim and claim adjustment expense reserves, net of reinsurance, for prior years from the loss ratio. The expense ratio is the percentage of insurance underwriting and acquisition expenses, including the amortization of deferred acquisition costs, to net earned premiums. The dividend ratio is the ratio of policyholders’ dividends incurred to net earned premiums. The combined ratio is the sum of the loss, expense and dividend ratios. The combined ratio excluding catastrophes and development is the sum of the loss ratio excluding catastrophes and development, the expense ratio and the dividend ratio. In addition, CNA also utilizes renewal premium change, rate, retention and new business are also utilized in evaluating operating trends. Renewal premium change represents the estimated change in average premium on policies that renew, including rate and exposure changes. Rate represents the average change in price on policies that renew excluding exposure change. For certain products within Small Business, where quantifiable, rate includes the influence of new business as well. Exposure represents the measure of risk used in the pricing of the insurance product. Retention represents the percentage of premium dollars renewed in comparison to the expiring premium dollars from policies available to renew. Renewal premium change, rate and retention presented for the prior year are updated to reflect subsequent activity on policies written in the period. New business represents premiums from policies written with new customers and additional policies written with existing customers. Gross written premiums, excluding third partythird-party captives, represents gross written premiums excludingexcludes business which is mostly ceded to third partythird-party captives, including business related to large warranty programs.
| 46 | ||||||||
The following tables summarize the results of CNA’s Property & Casualty Operations for the years ended December 31, 20192021 and 2018.
Year Ended December 31, 2019 | Specialty | Commercial | International | Total | ||||||||||||||
(In millions, except %) | ||||||||||||||||||
Gross written premiums | $ 6,900 | $ 3,693 | $ 1,111 | $ 11,704 | ||||||||||||||
Gross written premiums excluding third party captives | 3,015 | 3,609 | 1,111 | 7,735 | ||||||||||||||
Net written premiums | 2,848 | 3,315 | 971 | 7,134 | ||||||||||||||
Net earned premiums | 2,773 | 3,162 | 974 | 6,909 | ||||||||||||||
Net investment income | 556 | 654 | 63 | 1,273 | ||||||||||||||
Core income | 671 | 489 | 30 | 1,190 | ||||||||||||||
Other performance metrics: | ||||||||||||||||||
Loss and loss adjustment expense ratio | 57.5 | % | 67.3 | % | 64.1 | % | 62.9 | % | ||||||||||
Expense ratio | 32.5 | 32.9 | 37.7 | 33.5 | ||||||||||||||
Dividend ratio | 0.2 | 0.6 | 0.3 | |||||||||||||||
Combined ratio | 90.2 | % | 100.8 | % | 101.8 | % | 96.7 | % | ||||||||||
Rate | 5% | 3% | 8% | 5% | ||||||||||||||
Renewal premium change | 6 | 5 | 7 | 6 | ||||||||||||||
Retention | 87 | 86 | 71 | 84 | ||||||||||||||
New business | $ 367 | $ 683 | $ 273 | $ 1,323 | ||||||||||||||
2020.
| Year Ended December 31, 2021 | Specialty | Commercial | International | Total | |||||||||||||||||||
| (In millions, except %) | |||||||||||||||||||||||
| Gross written premiums | $ | 7,665 | $ | 4,445 | $ | 1,297 | $ | 13,407 | |||||||||||||||
| Gross written premiums excluding third- | |||||||||||||||||||||||
| party captives | 3,672 | 4,334 | 1,297 | 9,303 | |||||||||||||||||||
| Net written premiums | 3,225 | 3,595 | 1,101 | 7,921 | |||||||||||||||||||
| Net earned premiums | 3,076 | 3,552 | 1,057 | 7,685 | |||||||||||||||||||
| Net investment income | 497 | 624 | 57 | 1,178 | |||||||||||||||||||
| Core income | 704 | 394 | 86 | 1,184 | |||||||||||||||||||
| Other performance metrics: | |||||||||||||||||||||||
| Loss ratio excluding catastrophes | |||||||||||||||||||||||
| and development | 59.1 | % | 61.0 | % | 59.0 | % | 60.0 | % | |||||||||||||||
| Effect of catastrophe impacts | 0.4 | 10.0 | 2.6 | 5.1 | |||||||||||||||||||
| Effect of development-related items | (1.4) | 0.5 | 0.1 | (0.3) | |||||||||||||||||||
| Loss ratio | 58.1 | % | 71.5 | % | 61.7 | % | 64.8 | % | |||||||||||||||
| Expense ratio | 30.5 | 31.1 | 33.1 | 31.1 | |||||||||||||||||||
| Dividend ratio | 0.1 | 0.5 | 0.3 | ||||||||||||||||||||
| Combined ratio | 88.7 | % | 103.1 | % | 94.8 | % | 96.2 | % | |||||||||||||||
| Combined ratio excluding catastrophes | |||||||||||||||||||||||
| and development | 89.7 | % | 92.6 | % | 92.1 | % | 91.4 | % | |||||||||||||||
| Rate | 11 | % | 7 | % | 13 | % | 9 | % | |||||||||||||||
| Renewal premium change | 11 | 8 | 13 | 10 | |||||||||||||||||||
| Retention | 83 | 82 | 78 | 82 | |||||||||||||||||||
| New business | $ | 551 | $ | 843 | $ | 274 | $ | 1,668 | |||||||||||||||
Year Ended December 31, 2018 | |||||||||||||||||||||||||||||||||||||||||||
| Year Ended December 31, 2020 | Year Ended December 31, 2020 | ||||||||||||||||||||||||||||||||||||||||||
Gross written premiums | $ 6,904 | $ 3,350 | $ 1,150 | $ 11,404 | Gross written premiums | $ | 7,180 | $ | 4,086 | $ | 1,133 | $ | 12,399 | ||||||||||||||||||||||||||||||
Gross written premiums excluding third party captives | 2,834 | 3,267 | 1,150 | 7,251 | |||||||||||||||||||||||||||||||||||||||
| Gross written premiums excluding third- | Gross written premiums excluding third- | ||||||||||||||||||||||||||||||||||||||||||
| party captives | party captives | 3,296 | 3,993 | 1,133 | 8,422 | ||||||||||||||||||||||||||||||||||||||
Net written premiums | 2,744 | 3,060 | 1,018 | 6,822 | Net written premiums | 3,040 | 3,565 | 961 | 7,566 | ||||||||||||||||||||||||||||||||||
Net earned premiums | 2,732 | 3,050 | 1,001 | 6,783 | Net earned premiums | 2,883 | 3,323 | 940 | 7,146 | ||||||||||||||||||||||||||||||||||
Net investment income | 439 | 500 | 57 | 996 | Net investment income | 449 | 513 | 58 | 1,020 | ||||||||||||||||||||||||||||||||||
Core income (loss) | 629 | 357 | (19 | ) | 967 | ||||||||||||||||||||||||||||||||||||||
| Core income | Core income | 535 | 267 | 38 | 840 | ||||||||||||||||||||||||||||||||||||||
Other performance metrics: | Other performance metrics: | ||||||||||||||||||||||||||||||||||||||||||
Loss and loss adjustment expense ratio | 55.9 | % | 67.3 | % | 69.8 | % | 63.1 | % | |||||||||||||||||||||||||||||||||||
| Loss ratio excluding catastrophes | Loss ratio excluding catastrophes | ||||||||||||||||||||||||||||||||||||||||||
| and development | and development | 59.9 | % | 60.4 | % | 60.1 | % | 60.2 | % | ||||||||||||||||||||||||||||||||||
| Effect of catastrophe impacts | Effect of catastrophe impacts | 4.3 | 10.7 | 7.1 | 7.7 | ||||||||||||||||||||||||||||||||||||||
| Effect of development-related items | Effect of development-related items | (2.1) | 0.5 | (0.3) | (0.7) | ||||||||||||||||||||||||||||||||||||||
| Loss ratio | Loss ratio | 62.1 | % | 71.6 | % | 66.9 | % | 67.2 | % | ||||||||||||||||||||||||||||||||||
Expense ratio | 32.1 | 33.1 | 36.7 | 33.2 | Expense ratio | 31.3 | 33.0 | 35.5 | 32.6 | ||||||||||||||||||||||||||||||||||
Dividend ratio | 0.2 | 0.7 | 0.4 | Dividend ratio | 0.1 | 0.5 | 0.3 | ||||||||||||||||||||||||||||||||||||
Combined ratio | 88.2 | % | 101.1 | % | 106.5 | % | 96.7 | % | Combined ratio | 93.5 | % | 105.1 | % | 102.4 | % | 100.1 | % | ||||||||||||||||||||||||||
| Combined ratio excluding catastrophes | Combined ratio excluding catastrophes | ||||||||||||||||||||||||||||||||||||||||||
| and development | and development | 91.3 | % | 93.9 | % | 95.6 | % | 93.1 | % | ||||||||||||||||||||||||||||||||||
Rate | 2% | 1% | 4% | 2% | Rate | 12 | % | 10 | % | 14 | % | 11 | % | ||||||||||||||||||||||||||||||
Renewal premium change | 5 | 5 | 6 | 5 | Renewal premium change | 13 | 10 | 12 | 11 | ||||||||||||||||||||||||||||||||||
Retention | 85 | 85 | 77 | 84 | Retention | 86 | 84 | 73 | 83 | ||||||||||||||||||||||||||||||||||
New business | $ 353 | $ 566 | $ 307 | $ 1,226 | New business | $ | 389 | $ | 761 | $ | 245 | $ | 1,395 | ||||||||||||||||||||||||||||||
| 47 | ||||||||
2021 Compared with 2018
Gross written premiums for Specialty, excluding third party captives,Commercial increased $181$359 million in 20192021 as compared with 20182020 driven by strong retentionrate and rate.higher new business. Net written premiums for SpecialtyCommercial increased $104$30 million in 20192021 as compared with 2018. 2020. Net written premiums for 2021 were unfavorably impacted by the June 1, 2021 written premium catch-up resulting from the addition of the quota share treaty to the property reinsurance program. Excluding the impact of the June 1, 2021 written premium catch-up, net written premiums increased $142 million for 2021 as compared with 2020. Net earned premiums for Commercial increased $229 million in 2021 as compared with 2020. The increase in net earned premiums for 2021 was consistent with the trendpartially impacted by a reduction in net writtenestimated audit premiums related to COVID-19 in 2020 for Specialty.
Commercial.Gross written premiums for International decreased $39increased $164 million in 20192021 as compared with 2018. 2020. Excluding the effect of foreign currency exchange rates, gross written premiums decreased $7increased $104 million driven by the premium reduction from Hardy’s strategic exit from certain business classes announced in the fourth quarter of 2018 largely offset by growth in Canadarate and Europe. higher new business. Net written premiums for International decreased $47increased $140 million in 20192021 as compared with 2018. 2020. Excluding the effect of foreign currency exchange rates, net written premiums decreased $16 million. increased $85 million in 2021 as compared with 2020. The decreaseincrease in net earned premiums in 2021 as compared with 2020 was consistent with the trend in net written premiums for International.
Core income increased $223$344 million in 20192021 as compared with 20182020 primarily due to improved current accident year underwriting results and higher net investment income driven by limited partnership and common stock returns and improved current accident year underwriting results in International, partially offset by lower favorablereturns.
Total net prior year loss reserve development.
Favorable net prior year loss reserve development of $73$49 million and $181$70 million was recorded in 20192021 and 2018.2020. In 20192021 and 2018,2020, Specialty recorded favorable net prior year loss reserve development of $92$45 million and $150$61 million, Commercial recorded favorable net prior year loss reserve development of $6 million and $7 million and International recorded unfavorable net prior year loss reserve development of $2 million as compared with $25 million and International recorded unfavorable net prior year loss reserve development of $21 million as compared with favorable net prior year loss reserve development of $4$2 million. Further information on net prior year loss reserve development is included in Note 8 of the Notes to Consolidated Financial Statements included under Item 8.
Specialty’s combined ratio increased 2.0improved 4.8 points in 20192021 as compared with 2018. The2020 primarily due to a 4.0 point improvement in the loss ratio increased 1.6 points driven byand a 0.8 point improvement in the expense ratio. The improvement in the loss ratio was primarily due to lower favorable net prior year loss reserve development. The expense ratio increasedcatastrophe losses, which were 0.4 points of the loss ratio in 20192021, as compared with 20184.3 points of the loss ratio in 2020. The improvement in the expense ratio was driven by higher employee costs.
net earned premiums.Commercial’s combined ratio improved 0.32.0 points in 20192021 as compared with 2018.2020 primarily due to a 1.9 point improvement in the expense ratio. The loss ratio was consistent withimprovement in the prior year. Less favorable net prior year loss reserve development and unfavorable retrospective premium development were largely offset by lower catastrophe losses. The expense ratio was largely consistentprimarily due to higher net earned premiums and lower acquisition costs. Net catastrophe losses were 10.0 points of the loss ratio in 2021, as compared with 2018.
10.7 points of the loss ratio in 2020.International’s combined ratio improved 4.77.6 points in 20192021 as compared with 2018. The2020 due to a 5.2 point improvement in the loss ratio improved 5.7 points,and a 2.4 point improvement in the expense ratio. The improvement in the loss ratio was driven by lower net catastrophe losses, which were 2.6 points of the loss ratio in 2021, as compared with 7.1 points of the loss ratio in 2020, and improved non-catastrophe current accident year underwriting results partially offset by unfavorable net prior year loss reserve developmentresults. The improvement in the current year. The expense ratio increased 1.0 point in 2019 as compared with 2018was driven by lower net earned premiums.acquisition costs.
| 48 | ||||||||
Other Insurance Operations
The following table summarizes the results of CNA’s Other Insurance Operations for the years ended December 31, 20192021 and 2018.
Years Ended December 31 | 2019 | 2018 | ||||||||||||||
(In millions) | ||||||||||||||||
Net earned premiums | $ | 520 | $ | 530 | ||||||||||||
Net investment income | 845 | 821 | ||||||||||||||
Core loss | (211 | ) | (122 | ) | ||||||||||||
2020.
| Years Ended December 31 | 2021 | 2020 | |||||||||
| (In millions) | |||||||||||
| Net earned premiums | $ | 491 | $ | 504 | |||||||
| Net investment income | 981 | 915 | |||||||||
| Core loss | (78) | (105) | |||||||||
Core loss increased $89results improved $27 million in 20192021 as compared with 20182020 primarily due to higher net investment income driven by limited partnership returns. Core results in 2021 included a $170$31 million charge related to recognition of an active life reserve premium deficiency partially offset by a $44 millionfavorable impact from the reduction in long term care claim reserves resulting from the annual claim experience studyreserve reviews in the third quarter of 2019.2021. Core results in 2020 included a $59 million charge related to the recognition of an active life reserve premium deficiency for long term care policies. The favorable claim reserve development was primarily dueresults for 2020 also included a $36 million charge related to lower claim severity than anticipatedan increase in the reserve estimates. The prior year includedstructured settlement claim reserves, partially offset by a $24$30 million favorable impact from the reduction in long term care claim reserves, both resulting from the 2018 annual claim study. reserve reviews in the third quarter of 2020.
Core results benefitedfor 2021 also included expenses related to the March 2021 cybersecurity attack, the recognition of a $12 million loss resulting from lower adversethe legacy excess workers’ compensation loss portfolio transfer (“EWC LPT”) and higher unfavorable net prior year loss reserve development recordedon legacy mass tort exposures as compared with 2020. The application of retroactive reinsurance accounting to additional cessions to the A&EP Loss Portfolio Transfer (“LPT”) in 2019 forboth periods resulted in charges of $25 million and $5 million in 2021 and 2020, which have no economic impact.For further information on the A&EP under theLPT, EWC LPT and net prior year loss portfolio transfer as further discussed inreserve development see Note 8 of the Notes to Consolidated Financial Statements included under Item 8. Additionally, 2018 includednon-recurringcosts of $27 million associated with the transition to a new IT infrastructure service provider.
Non-GAAP
Reconciliation of Core Income to Net IncomeThe following table reconciles core income to net income attributable to Loews Corporation for the CNA segment for the years ended December 31, 2019 and 2018:
| �� | ||||||||||||||||
Year Ended December 31 | 2019 | 2018 | ||||||||||||||
(In millions) | ||||||||||||||||
Core income (loss): | ||||||||||||||||
Property & Casualty Operations | $ | 1,190 | $ | 967 | ||||||||||||
Other Insurance Operations | (211 | ) | (122 | ) | ||||||||||||
Total core income | 979 | 845 | ||||||||||||||
Investment gains (losses) (after tax) | 37 | (43 | ) | |||||||||||||
Consolidating adjustments including purchase accounting and noncontrolling interests | (122 | ) | (76 | ) | ||||||||||||
Net income attributable to Loews Corporation | $ | 894 | $ | 726 | ||||||||||||
| Year Ended December 31 | 2021 | 2020 | |||||||||
| (In millions) | |||||||||||
| Core income (loss): | |||||||||||
| Property & Casualty Operations | $ | 1,184 | $ | 840 | |||||||
| Other Insurance Operations | (78) | (105) | |||||||||
| Total core income | 1,106 | 735 | |||||||||
| Investment gains (losses) | 96 | (30) | |||||||||
| Consolidating adjustments including noncontrolling interests | (125) | (87) | |||||||||
| Net income attributable to Loews Corporation | $ | 1,077 | $ | 618 | |||||||
Year Ended December 31 | 2019 | 2018 | ||||||||||||||
(In millions) | ||||||||||||||||
Revenues: | ||||||||||||||||
Net investment income | $ | 6 | $ | 8 | ||||||||||||
Contract drilling revenues | 935 | 1,060 | ||||||||||||||
Other revenues | 47 | 25 | ||||||||||||||
Total | 988 | 1,093 | ||||||||||||||
Expenses: | ||||||||||||||||
Contract drilling expenses | 793 | 723 | ||||||||||||||
Other operating expenses: | ||||||||||||||||
Impairment of assets | 27 | |||||||||||||||
Other expenses | 474 | 446 | ||||||||||||||
Interest | 123 | 123 | ||||||||||||||
Total | 1,390 | 1,319 | ||||||||||||||
Loss before income tax | (402 | ) | (226 | ) | ||||||||||||
Income tax benefit | 60 | 30 | ||||||||||||||
Amounts attributable to noncontrolling interests | 167 | 84 | ||||||||||||||
Net loss attributable to Loews Corporation | $ | (175 | ) | $ | (112 | ) | ||||||||||
Boardwalk Pipelines
Overview
Boardwalk Pipelines derives revenues primarily fromoperates in the transportation and storagemidstream portion of the natural gas and natural gas liquids (“NGLs”). Transportation services consist of firm natural gas industry, providing transportation where the customer pays a capacity reservation charge to reserve pipeline capacity at receipt and delivery points along pipeline systems, plus a commodity and fuel charge on the volume of natural gas actually transported, and interruptible natural gas transportation, under which the customer pays to transport gas only when capacity is available and used. The transportation rates Boardwalk Pipelines is able to charge customers are heavily influenced by market trends (both short and longer term), including the available natural gas supplies, geographical location of natural gas production, the demandstorage for gas byend-userssuch as power plants, petrochemical facilities and liquefied natural gas (“LNG”) export facilities and the price differentials between the gas supplies and the market demand for the gas (basis differentials). Rates for short term firm and interruptible transportation services are influenced by shorter term market conditions such as current and forecasted weather.
| 49 | ||||||||
amount of products transported, with the exception of costs recorded in fuel consumed at its compressor stations and nottransportation expense, which are netted with fuel retained on our Consolidated Statements of Operations. For further information on Boardwalk Pipelines’ revenue recognition policies see Note 1 of the Notes to Consolidated Financial Statements included in a fuel tracker.
under Item 8.Firm Agreements
A substantial portion of Boardwalk Pipelines’ transportation and storage capacity is contracted for under firm agreements. For the year ended December 31, 2019,2021, approximately 87%89% of Boardwalk Pipelines’ revenues excluding retained fuel, were derived from fixedcapacity reservation fees under firm agreements.contracts. The table below shows a rollforward of operating revenues under committed firm agreements in place as of December 31, 20182020 to December 31, 2019,2021, including agreements for transportation, storage and other services, over the remaining term of those agreements:
As of December 31, 2019 | ||||||
(In millions) | ||||||
Total projected operating revenues under committed firm agreements as of December 31, 2018 | $ | 9,133 | ||||
Adjustments for: | ||||||
Actual revenues recognized from firm agreements in 2019 (a) | (1,157 | ) | ||||
Firm agreements entered into in 2019 | 1,353 | |||||
Total projected operating revenues under committed firm agreements as of December 31, 2019 | $ | 9,329 | ||||
| As of | |||||
| (In millions) | |||||
| Total projected operating revenues | $ | 9,450 | |||
| Adjustments for: | |||||
| Actual revenues recognized from | (1,180) | ||||
| Firm agreements entered into in 2021 | 790 | ||||
| Total projected operating revenues under committed firm agreements as of December 31, 2021 | $ | 9,060 | |||
(a)Reflects an increase of $70 million in Boardwalk Pipelines’ actual 2021 revenues recognized from fixed fees under firm agreements as compared with its expected 2021 revenues from fixed fees under firm agreements, including agreements for transportation, storage and other services as of December 31, 2020, primarily due to an increase from contract renewals that occurred in 2021.
During 2019,2021, Boardwalk Pipelines entered into approximately $1.4 billion$790 million of new firm agreements, of which over halfapproximately 28% were from new growth projects executed in 2019, but will2021. For firm agreements associated with new growth projects, the associated assets may not be placed into commercial service until 2020 or later years. For Boardwalk Pipelines’ customers that are charged maximum tariff rates related to its FERC-regulated operating subsidiaries, the revenues expected to be earned from fixed fees under committed firm agreements reflect the current tariff rate for such services for the term of the agreements, however, the tariff rates may be subject to future adjustment. The estimated revenues reflectedsometime in the table may also include estimated revenues that are anticipated under executed precedent transportation agreements for projects that are subject to regulatory approval. The revenues expected to be earned from fixed fees under committed firm agreements do not include additional revenues Boardwalk Pipelines has recognized and may recognize under firm agreements based on actual utilization of the contracted
future. Each year a portion of Boardwalk Pipelines’ firm transportation and storage agreements expire. The rates Boardwalk Pipelines is able to charge customers are heavily influenced by market trends (both short and longer term), including the available supply, geographical location of natural gas production, the competition between producing basins, competition with other pipelines for supply and markets, the demand for gas by and. As of December 31, 2021, Boardwalk Pipelines’ storage rates are additionally impacted by natural gas price differentials between time periods, such as winter to summer (time period price spreads), andtop ten customers holding firm capacity under firm agreements comprised approximately 39% of its total projected operating revenues. Additionally, the volatility in time period price spreads. Demand for firm service is primarily based on market conditions which can vary acrosscredit profile associated with Boardwalk Pipelines’ pipeline systems. The amount of change incustomers comprising the total projected operating revenues under firm reservation fees under contract reflects the overall market trends, including the impact from Boardwalk Pipelines’ growth projects. Boardwalk Pipelines focuses its marketing efforts on enhancing the value of the capacity that is up for renewal and works with customers to match gas supplies from various basins to new and existing customers and markets, including aggregating supplies at key locations along its pipelines to provideend-usecustomers with attractive and diverse supply options. If the market perceives the value of Boardwalk Pipelines’ available capacity to be lower than its long term view of the capacity, Boardwalk Pipelines may seek to shorten contract terms until market perception improves.
end-users
such as power plants, petrochemical facilities and LNG export facilities and the price differentials between the gas supplies and the market demand for the gas (basis differentials)Pipeline System Maintenance
Boardwalk Pipelines incurs substantial costs for ongoing maintenance of its pipeline systems and related facilities, including those incurred for pipeline integrity management activities, equipment overhauls, general upkeep and repairs. These costs are not dependent on the amount of revenues earned from its transportation services. PHMSA has developed regulations that require transportation pipeline operators to implement integrity management programs to comprehensively evaluate certain high risk areas, known as HCAs, and MCAs, along pipelines and take additional safety measures to protect pipeline segments locatedpeople and property in highly populatedthese areas. The HCAs for natural gas pipelines are predicated on high-population density areas (which, for natural gas transmission lines, include Class 3 and 4 areas and, depending on the potential impacts of a risk event, may include Class 1 and 2 areas) whereas HCAs along Boardwalk Pipelines’ NGL pipelines are based on high-population density areas, areas near certain drinking water sources and unusually sensitive ecological areas. These regulations have resulted in an overall increase in Boardwalk Pipelines’ ongoing maintenance costs, including maintenance capital and maintenance expense. In 2019, PHMSA issued the first part of its gas Mega Rule, which imposesbecame effective on July 1, 2020. This regulation imposed numerous requirements, including MAOP reconfirmation through re-verification of all historical records for pipelines in service, which re-certification process may require natural gas pipelines installed before 1970 (previously excluded from certain pressure testing obligations) to be pressure tested, the periodic assessment of additional pipeline mileage outside of HCAs (in MCAs as well as Class 3 and Class 4 areas), the reporting of exceedances of MAOP and the consideration of seismicity as a risk factor in integrity management. The remaining rulemakings comprisingIn 2021, PHMSA issued a final rule that will impose safety regulations related to onshore gas gathering lines and in June 2021, PHMSA
| 50 | ||||||||
issued an Advisory Bulletin advising pipeline and pipeline facility operators of applicable requirements to update their inspection and maintenance plans for the elimination of hazardous leaks and minimization of natural gas Mega Rule arereleased from pipeline facilities. PHMSA, together with state regulators, is expected to be issuedcommence inspection of these plans in 2020 and will include revised pipeline repair criteria as well as more stringent corrosion control requirements.2022. It is expected that these new rules will cause Boardwalk Pipelines to incur increased capital and operating costs, experience operational delays and result in potential adverse impacts to its ability to reliably serve its customers as described under Item 1A,1A. Risk Factors of this Report.
Maintenance costs may be capitalized or expensed, depending on the nature of the activities. For any given reporting period, the mix of projects that Boardwalk Pipelines undertakes will affect the amounts recordedwe record as property, plant and equipment on the Consolidated Balance Sheets or recognize as expenses, which impacts earnings. In 2020,2022, Boardwalk Pipelines expects to spend approximately $370$400 million to maintain its pipeline systems and to comply with new regulatory initiatives previously mentioned, of which approximately $155 million is expected to be maintenance capital. In 2019,2021, Boardwalk Pipelines spent $358$381 million to maintain its pipeline systems, of which $139$154 million was recorded as maintenance capital.
Results of Operations
The following table summarizes the results of operations for Boardwalk Pipelines for the years ended December 31, 20192021 and 20182020 as presented in Note 2019 of the Notes to Consolidated Financial Statements included under Item 8:
Year Ended December 31 | 2019 | 2018 | ||||||||||||
(In millions) | ||||||||||||||
Revenues: | ||||||||||||||
Operating revenues and other | $ | 1,300 | $ | 1,227 | ||||||||||
Total | 1,300 | 1,227 | ||||||||||||
Expenses: | ||||||||||||||
Operating and other | 840 | 820 | ||||||||||||
Interest | 179 | 176 | ||||||||||||
Total | 1,019 | 996 | ||||||||||||
Income before income tax | 281 | 231 | ||||||||||||
Income tax expense | (72 | ) | (28 | ) | ||||||||||
Amounts attributable to noncontrolling interests | (68 | ) | ||||||||||||
Net income attributable to Loews Corporation | $ | 209 | $ | 135 | ||||||||||
| Year Ended December 31 | 2021 | 2020 | |||||||||
| (In millions) | |||||||||||
| Revenues: | |||||||||||
| Operating revenues and other | $ | 1,349 | $ | 1,302 | |||||||
| Total | 1,349 | 1,302 | |||||||||
| Expenses: | |||||||||||
| Operating and other | 885 | 855 | |||||||||
| Interest | 161 | 170 | |||||||||
| Total | 1,046 | 1,025 | |||||||||
| Income before income tax | 303 | 277 | |||||||||
| Income tax expense | (68) | (71) | |||||||||
| Net income attributable to Loews Corporation | $ | 235 | $ | 206 | |||||||
Total revenues increased $73$47 million in 20192021 as compared with 2018. Excluding2020. Including the net effect of items offset in fuel and transportation expense and excluding net proceeds of approximately $24$34 million in 2020 as a result of drawing on lettersa letter of credit due to a customer bankruptcy in 2020, operating revenues increased $53$77 million primarily driven by Boardwalk Pipelines’ recently completed growth projects partially offset by contract restructurings and contract expirations that were recontracted at overall lower average rates.
higher utilization based revenues due to higher volumes.Operating expenses increased $20$30 million in 20192021 as compared with 2018.2020. Excluding items offset inwith operating revenues, operating expenses increased $18$26 million, as compared with the prior year primarily due to higheran increase in maintenance project expensescosts and an increased asset base from recently completed growth projects.
| 51 | ||||||||
Loews Hotels & Co
The following table summarizes the results of operations for Loews Hotels & Co for the years ended December 31, 20192021 and 20182020 as presented in Note 2019 of the Notes to Consolidated Financial Statements included under Item 8:
Year Ended December 31 | 2019 | 2018 | ||||||||||
(In millions) | ||||||||||||
Revenues: | ||||||||||||
Operating revenues | $ | 578 | $ | 628 | ||||||||
Gain on sale of owned hotel | 23 | |||||||||||
Revenues related to reimbursable expenses | 114 | 104 | ||||||||||
Total | 692 | 755 | ||||||||||
Expenses: | ||||||||||||
Operating and other: | ||||||||||||
Operating | 493 | 533 | ||||||||||
Asset impairments | 99 | 22 | ||||||||||
Reimbursable expenses | 114 | 104 | ||||||||||
Depreciation | 61 | 67 | ||||||||||
Equity income from joint ventures | (69 | ) | (73 | ) | ||||||||
Interest | 22 | 29 | ||||||||||
Total | 720 | 682 | ||||||||||
Income (loss) before income tax | (28 | ) | 73 | |||||||||
Income tax expense | (3 | ) | (25 | ) | ||||||||
Net income (loss) attributable to Loews Corporation | $ | (31 | ) | $ | 48 | |||||||
| Year Ended December 31 | 2021 | 2020 | |||||||||
| (In millions) | |||||||||||
| Revenues: | |||||||||||
| Operating revenue | $ | 337 | $ | 167 | |||||||
| Other revenues | 47 | 37 | |||||||||
| Revenues related to reimbursable expenses | 96 | 74 | |||||||||
| Total | 480 | 278 | |||||||||
| Expenses: | |||||||||||
| Operating and other: | |||||||||||
| Operating | 334 | 273 | |||||||||
| Asset impairments | 10 | 36 | |||||||||
| Reimbursable expenses | 96 | 74 | |||||||||
| Depreciation | 63 | 63 | |||||||||
| Equity (income) loss from joint ventures | (47) | 73 | |||||||||
| Interest | 36 | 33 | |||||||||
| Total | 492 | 552 | |||||||||
| Loss before income tax | (12) | (274) | |||||||||
| Income tax (expense) benefit | (2) | 62 | |||||||||
| Net loss attributable to Loews Corporation | $ | (14) | $ | (212) | |||||||
Loews Hotels & Co’s results have been significantly impacted by the COVID-19 pandemic. By April 2020, most hotel properties owned and/or operated by Loews Hotels & Co had temporarily suspended operations. These hotel properties gradually resumed operations at various times, culminating with all hotels having resumed operations by June 30, 2021. During 2021, overall occupancy rates gradually improved, with hotel properties located in resort destinations improving sooner than hotel properties located in city centers. However, occupancy levels have not reached pre-pandemic levels at many hotels owned and/or operated by Loews Hotels & Co, and business in certain markets continues to be adversely impacted by COVID-19 variants.
Operating revenues decreased $50improved by $170 million and operating expenses increased by $61 million in 2021 as compared with 2018 primarily due2020. This comparison is impacted by robust pre-pandemic business levels prior to an increase in hotel renovations, which reducedmid-March 2020 followed by results that were significantly depressed by the numberpandemic for the remainder of available guestrooms2020. Through 2021, occupancy levels have gradually increased leading to improved revenues at severalall hotel properties, particularly those in resort areas, with operating expense also increasing to support the increased demand levels. As all properties have not resumed all levels of pre-pandemic service offerings, hotel operating expense, including staffing levels, will continue to increase as those resume.
Equity (income) loss from joint ventures improved $120 million in 2021 as compared to 2020, driven by the resumption of operations and the sale of two owned hotel properties, oneassociated occupancy improvements primarily at joint venture hotels in the second quarter of 2019 and one in the third quarter of 2018. Revenues were also impacted by lower management fees due to reduced operating revenues at managed properties. In addition, resort destinations.
Loews Hotels operating revenues and expenses for 2019 each include a $15 million reduction due to the reclassification of services provided to customers by a third party vendor.
Other revenues for 2021 included $39 million related to the one-time acceleration of government grant payments, used to retire outstanding debt of an owned hotel prior to maturity and two in 2018.cover certain prepayment costs, and net gains of $8 million
| 52 | ||||||||
related primarily to the sale of undeveloped land. Other revenues for 2020 included gains of $37 million related to the sales of an owned hotel and an office building.
Interest expense decreased $7for 2021 increased $3 million as compared with 20182020 primarily due to additional capitalized interest on development projects in progress.
the write off of unamortized issuance costs and the prepayment premium associated with the debt retirement mentioned above.Corporate
Corporate operations consist primarily of investment income, interest expense and administrative costs at the Parent Company, operating results of Altium Packaging, Parent Company interest expenses and other Parent Company administrative costs.Company. Investment income includes earnings on cash and short term investments held at the Parent Company to meet current and future liquidity needs, as well as results of limited partnership investmentsthe trading portfolio held at the Parent Company. Corporate also includes the operating results of Altium Packaging through March 31, 2021 and the trading portfolio.
The following table summarizes the results of operations for Corporate for the years ended December 31, 20192021 and 20182020 as presented in Note 2019 of the Notes to Consolidated Financial Statements included under Item 8:
Year Ended December 31 | 2019 | 2018 | ||||||||||
(In millions) | ||||||||||||
Revenues: | ||||||||||||
Net investment income (loss) | $ | 230 | $ | (10 | ) | |||||||
Operating revenues and other | 933 | 867 | ||||||||||
Total | 1,163 | 857 | ||||||||||
Expenses: | ||||||||||||
Operating and other | 1,004 | 956 | ||||||||||
Interest | 115 | 108 | ||||||||||
Total | 1,119 | 1,064 | ||||||||||
Income (loss) before income tax | 44 | (207 | ) | |||||||||
Income tax (expense) benefit | (9 | ) | 46 | |||||||||
Net income (loss) attributable to Loews Corporation | $ | 35 | $ | (161 | ) | |||||||
| Year Ended December 31 | 2021 | 2020 | |||||||||
| (In millions) | |||||||||||
| Revenues: | |||||||||||
| Net investment income | $ | 99 | $ | 59 | |||||||
| Investment gains (losses) | 540 | (1,211) | |||||||||
| Operating revenues and other | 281 | 1,023 | |||||||||
| Total | 920 | (129) | |||||||||
| Expenses: | |||||||||||
| Operating and other | 399 | 1,098 | |||||||||
| Interest | 114 | 127 | |||||||||
| Total | 513 | 1,225 | |||||||||
| Income (loss) before income tax | 407 | (1,354) | |||||||||
| Income tax (expense) benefit | (127) | 287 | |||||||||
| Net income (loss) attributable to Loews Corporation | $ | 280 | $ | (1,067) | |||||||
Net investment income was $230for the Parent Company increased $40 million in 20192021 as compared with a loss of $10 million in 2018,2020 primarily due to improved performanceresults from equity based investments, in the Parent Company trading portfolio, partially offset by lower income from limited partnership investmentsaverage yields on short term investments.
Investment gains of $540 million in 2021 were primarily due to a gain of $555 million ($438 million after tax) on the sale of 47% of Altium Packaging. Investment losses of $1.2 billion ($957 million after tax) for 2020 was due to the loss recognized upon deconsolidation of Diamond Offshore as a result of lower invested balances.
its Chapter 11 Filing.Operating revenues and other for 2021 include Altium Packaging revenues of $932$280 million prior to its deconsolidation on April 1, 2021and $867$1,022 million for 2019 and 2018. The increase of $65 million in 2019 as compared with 2018, reflects an increase of $97 million related to acquisitions in 2018 and 2019. This increase was partially offset by lower volumes in the existing business and the pass-through effect of lower year-over-year resin prices. Altium Packaging’s contracts generally provide for resin price changes to be passed through to its customers on a short-term lag, generally about one month. When a pass-through occurs, revenues and expenses generally change by the same amount so that Altium Packaging’s gross margin returns to the same level as prior to the change in prices.
2020.Operating and other expenses include Altium Packaging operating expenses of $913 million and $828 million for 2019 and 2018, which include depreciation and amortization expense. The increasedecreased in Altium Packaging’s operating expenses of $85 million in 20192021 as compared with 2018 is2020 primarily due to an increasethe deconsolidation of $96 million related to acquisitions in 2018 and 2019, partially offset by lower cost of goods sold due to lower volumes and lower resin prices.
Interest expenses decreased $13 million in 2021 as compared with 2020, primarily due to the deconsolidation of Altium Packaging on April 1, 2021, partially offset by the May 2020 issuance of the Parent Company’s $500 million 3.2% senior notes and a charge of approximately $14 million to write off debt issuance costs for the early retirement of debt at Altium Packaging in the first quarter of 2021.
| 53 | ||||||||
Income tax expense includes the recognition of a $40 million deferred tax liability related to the sale of Altium Packaging.
Diamond Offshore
Amounts presented for Diamond Offshore for 2020 only include the period through its deconsolidation on April 26, 2020. Contract drilling revenues and contract drilling expenses were $287 million and $128$254 million for 2019this 2020 period. Results for 2020 also include an aggregate asset impairment charge of $774 million ($408 million after tax and 2018. The $37 million decrease from 2018noncontrolling interests) recognized in the first quarter of 2020. For more information on the deconsolidation of Diamond Offshore see Note 2 of the Notes to 2019 stems from lower gross Parent Company expenses, severance costs incurred in 2018, the netting of investment expenses against investment income in 2019 and higher allocations to the subsidiaries in 2019.
Consolidated Financial Statements included under Item 8 for further information.LIQUIDITY AND CAPITAL RESOURCES
Parent Company
Parent Company cash and investments, net of receivables and payables, totaled $3.3$3.4 billion at December 31, 20192021 as compared to $3.1$3.5 billion at December 31, 2018.2020. In 2019, 2021, we received $927$853 million in cash dividends from our subsidiaries, including a special cash dividend of $182 million from CNA and a $199 million cash dividend from CNA of $485 million. Cash inflows also included $183 million from Loews Hotels & Co. Altium Packaging in connection with a debt recapitalization prior to its deconsolidation on April 1, 2021. Cash outflows in 2021 included the payment of $1.1 billion to fund treasury stock purchases, and $76$65 million of cash dividends to our shareholders.shareholders and $32 million of cash contributions to Loews Hotels & Co. On April 1, 2021, we sold 47% of Altium Packaging to GIC and received $420 million in cash consideration. In March of 2022, we will receive cash dividends of $584 million from CNA. As a holding company we depend on dividends from our subsidiaries and returns on our investment portfolio to fund our obligations. We also have an effective Registration Statement on FormS-3shelf registration statement on file with the Securities and Exchange Commission (“SEC”) registering the future sale of an unlimited amount of our debt and equity securities.securities from time to time. We are not responsible for the liabilities and obligations of our subsidiaries and there are no Parent Company guarantees.
Depending on market and other conditions, we may purchase our shares and shares of our subsidiaries outstanding common stock in the open market, in privately negotiated transactions or otherwise. In 2019,2021, we purchased 21.521.1 million shares of Loews Corporation common stock. As of February 7, 2020,4, 2022, we had purchased an additional 3.30.2 million shares of Loews Corporation common stock in 20202022 at an aggregate cost of $172$14 million. As of February 7, 2020,4, 2022, there were 287,770,405248,202,443 shares of Loews Corporation common stock outstanding.
Future uses of our cash may include investing in our subsidiaries, new acquisitions, dividends and/or repurchases of our and our subsidiaries’ outstanding common stock. The declaration and payment of future dividends to holders of our common stock will be at the discretion of our Board of Directors and will depend on many factors, including our earnings, financial condition and business needs.
Subsidiaries
CNA’s cash provided by operating activities was $1.1$2.0 billion in 20192021 and $1.2$1.8 billion in 2018. Cash2020. The increase in cash provided by operating activities in 2019 reflected a $125 million pension contribution, a lower level of distributions on limited partnerships and higher net claim payments, partially offsetwas driven by an increase in net premiums collected as compared with 2018.
and lower net claim payments, which were impacted by a slowdown in court dockets. These items were partially offset by the payment of the EWC LPT premium. For further information on the EWC LPT see Note 8 of the Notes to Consolidated Financial Statements included under Item 8.CNA paid cash dividends of $3.40$2.27 per share on its common stock, including a special cash dividend of $2.00$0.75 per share in 2019.2021. On February 7, 2020,4, 2022, CNA’s Board of Directors declared a quarterly cash dividend of $0.37$0.40 per share and a special cash dividend of $2.00 per share payable March 12, 202010, 2022 to shareholders of record on February 24, 2020.22, 2022. CNA’s declaration and payment of future dividends is at the discretion of its Board of Directors and will depend on many factors, including CNA’s earnings, financial condition, business needs and regulatory constraints. The payment of dividends by CNA’s insurance subsidiaries without prior approval of the insurance department of each subsidiary’s domiciliary jurisdiction is limited by formula. Dividends in excess of these amounts are subject to prior approval by the respective state insurance departments.
| 54 | ||||||||
Dividends from Continental Casualty Company (“CCC”), a subsidiary of CNA, are subject to the insurance holding company laws of the State of Illinois, the domiciliary state of CCC. Under these laws, ordinary dividends, or dividends that do not require prior approval by the Illinois Department of Insurance (the “Department”), are determined based on the greater of the prior year’s statutory net income or 10% of statutory surplus as of the end of the prior year, as well as the timing and amount of dividends paid in the preceding 12 months. Additionally, ordinary dividends may only be paid from earned surplus, which is calculated by removing unrealized gains from unassigned surplus. As of December 31, 2019,2021, CCC iswas in a positive earned surplus position. The maximum allowable dividend CCC could pay during 20202022 that would not be subject to the Department’s prior approval is $1,078 million,$1.2 billion, less dividends paid during the preceding 12twelve months measured at that point in time. CCC paid dividends of $1,065$880 million in 2019.2021. The actual level of dividends paid in any year is determined after an assessment of available dividend capacity, holding company liquidity and cash needs as well as the impact the dividends will have on the statutory surplus of the applicable insurance company.
CNA has a financial strength rating of 2019,A and senior debt rating of bbb+ from A.M. Best Company (“A.M. Best”) upgraded CNA’s long term issuer credit rating from bbb to bbb+. In November of 2019, S&P upgraded CNA’s, a financial strength rating of A2 and senior debt rating of Baa2 from A toMoody’s, a financial strength rating of A+ and long term issuer creditsenior debt rating of A- from S&P and financial strength rating of A+ and senior debt rating of BBB+ toA-.from Fitch. A.M. Best, Moody’s, S&P and S&PFitch maintain stable outlooks across CNA’s financial strength and long term issuersenior debt credit ratings.
Boardwalk Pipelines’ cash provided by operating activities increased $96decreased $12 million in 20192021 compared to 2018,2020, primarily due to the timing of receivables partially offset by the change in net income.
For 20192021 and 2018,2020, Boardwalk Pipelines’ capital expenditures were $416$349 million and $468$438 million, consisting primarily of a combination of growth and maintenance capital. During 2019 and 2018, Boardwalk Pipelines purchased $13 million and $19 million of natural gas to be used as base gas for its pipeline system. Boardwalk Pipelines expects total capital expenditures to be approximately $475$360 million in 2020,2022, including approximately $155 million for maintenance capital and $320$205 million related to growth projects.
As of December 31, 2021, Loews Hotels & Co has loans that mature within twelve months and is actively working with lenders to refinance $93 million in current maturities of long-term debt.
In October 2021 Loews Hotels & Co announced the development of the Loews Arlington Hotel and Convention Center in Arlington, Texas. The hotel, for which Loews Hotels & Co will serve as manager and hold a majority equity interest, is expected to open in early 2024 with approximately $87888 guestrooms and over 250,000 square feet of function space. The
| 55 | ||||||||
approximately $550 million to its developments in progress, whichhotel project will be derived fromfunded initially through a mix of partner contributions before drawing on a $300 million construction loan in the second half of 2022. Based on the timing of construction relative to the seasonality of Loews Hotels & Co’s business and restrictions on certain cash on hand, cash generated from operations and cashheld by Loews Hotels & Co, a Loews Corporation capital contribution may be required to fund all or part Loews Hotels & Co’s partner contributions.
In 2021, Loews Hotels & Co received capital contributions of $32 million from Loews Corporation.
We and our subsidiaries have contractual obligations which arise in the U.S.ordinary course of business. For a discussion regarding the obligations related to our and Canada, funded with approximately $250 million ofour subsidiaries long term debt financing proceeds and available cash, see Notes 2 andNote 11 of the Notes to the Consolidated Financial Statements included under Item 8 for further discussion.
| Payments Due by Period | |||||||||||||||||||||||||||||
| December 31, 2021 | Total | Less than 1 year | 1-3 years | 3-5 years | More than 5 years | ||||||||||||||||||||||||
| (In millions) | |||||||||||||||||||||||||||||
| Claim and claim adjustment expense | |||||||||||||||||||||||||||||
reserves (a) | $ | 24,955 | $ | 6,015 | $ | 6,719 | $ | 3,401 | $ | 8,820 | |||||||||||||||||||
Future policy benefit reserves (b) | 25,581 | (301) | 158 | 909 | 24,815 | ||||||||||||||||||||||||
(a)The claim and claim adjustment expense reserves reflected above are not discounted and represent CNA’s estimate of the amount and timing of the ultimate settlement and administration of gross claims based on its assessment of facts and circumstances known as follows:
Payments Due by Period | ||||||||||||||||||||||||
Less than | More than | |||||||||||||||||||||||
December 31, 2019 | Total | 1 year | 1-3 years | 3-5 years | 5 years | |||||||||||||||||||
(In millions) | ||||||||||||||||||||||||
Debt (a) | $ | 16,279 | $ | 616 | $ | 2,620 | $ | 4,185 | $ | 8,858 | ||||||||||||||
Operating leases | 860 | 114 | 215 | 170 | 361 | |||||||||||||||||||
Claim and claim adjustment expense reserves (b) | 22,814 | 5,512 | 5,928 | 2,994 | 8,380 | |||||||||||||||||||
Future policy benefit reserves (c) | 27,539 | (350 | ) | 55 | 813 | 27,021 | ||||||||||||||||||
Purchase and other obligations | 485 | 262 | 83 | 80 | 60 | |||||||||||||||||||
Total | $ | 67,977 | $ | 6,154 | $ | 8,901 | $ | 8,242 | $ | 44,680 | ||||||||||||||
of December 31, 2021. See the Insurance Reserves section of this MD&A for further information.
(b)The future policy benefit reserves reflected above are not discounted and represent CNA’s estimate of the ultimate amount and timing of the settlement of benefits net of expected premiums, and are based on its assessment of facts and circumstances known as of December 31, 2021. Additional information on future policy benefit reserves is included in Note 1 of the Notes to Consolidated Financial Statements included under Item 8.
Further information on our commitments, contingencies and guarantees is provided in the Notes to Consolidated Financial Statements included under Item 8.
Investment activities ofincludeconsist of investments in fixed income securities, including short term investments. The Parent Company portfolio also includes equity securities, including short sales and derivative instruments, and investments in limited partnerships. TheseCertain of these types of investments generally presenthave greater volatility, less liquidity and greater risk than fixed income investments and are included within Results of Operations – Corporate.
our non-insurance
subsidiaries primarily Credit exposure associated with our derivative instruments is generally limited to the uncollateralized change in fair value of the derivative instruments recognized in the Consolidated Balance Sheets. We mitigate theThe risk of non-performance is mitigated by monitoring the creditworthiness of counterparties and diversifying derivatives by using multiple counterparties. WeCollateral is occasionally require collateralrequired from our derivative investment counterparties depending on the amount of the exposure and the credit rating of the counterparty.
non-performance
by counterparties toInsurance
CNA maintains a large portfolio of fixed maturity and equity securities, including large amounts of corporate and government issued debt securities, residential and commercial mortgage-backed securities, and other asset-backed securities and investments in limited partnerships which pursue a variety of long and short investment strategies across a broad array
| 56 | ||||||||
of asset classes. CNA’s investment portfolio supports its obligation to pay future insurance claims and provides investment returns which are an important part of CNA’s overall profitability.
Net Investment Income
The significant components of CNA’s net investment income are presented in the following table. Fixed income securities, as presented, include both fixed maturity securities and
non-redeemable
preferred stock.Year Ended December 31 | 2019 | 2018 | ||||||||
(In millions) | ||||||||||
Fixed income securities: | ||||||||||
Taxable fixed income securities | $ | 1,538 | $ | 1,449 | ||||||
Tax-exempt fixed income securities | 318 | 384 | ||||||||
Total fixed income securities | 1,856 | 1,833 | ||||||||
Limited partnership and common stock investments | 226 | (42 | ) | |||||||
Other, net of investment expense | 36 | 26 | ||||||||
Pretax net investment income | $ | 2,118 | $ | 1,817 | ||||||
Fixed income securities after tax and noncontrolling interests | $ | 1,358 | $ | 1,351 | ||||||
Net investment income after tax and noncontrolling interests | $ | 1,543 | $ | 1,341 | ||||||
Effective income yield for the fixed income securities portfolio, before tax | 4.8% | 4.7% | ||||||||
Effective income yield for the fixed income securities portfolio, after tax | 3.9% | 3.9% | ||||||||
Limited partnership and common stock return | 11.7% | (1.9)% |
| Year Ended December 31 | 2021 | 2020 | |||||||||
| (In millions) | |||||||||||
| Fixed income securities: | |||||||||||
| Taxable fixed income securities | $ | 1,439 | $ | 1,451 | |||||||
| Tax-exempt fixed income securities | 311 | 319 | |||||||||
| Total fixed income securities | 1,750 | 1,770 | |||||||||
| Limited partnership and common stock investments | 402 | 144 | |||||||||
| Other, net of investment expense | 7 | 21 | |||||||||
| Net investment income | $ | 2,159 | $ | 1,935 | |||||||
| Effective income yield for the fixed income securities | |||||||||||
| portfolio | 4.3 | % | 4.5 | % | |||||||
| Limited partnership and common stock return | 22.3 | % | 8.3 | % | |||||||
CNA’s net investment income before tax and noncontrolling interests increased $301$224 million in 20192021 as compared with 2018. The increase was2020 driven by higher limited partnership and common stock investments.returns partially offset by lower yields in the fixed income portfolio.
| 57 | ||||||||
The components of CNA’s net investment gains (losses) are presented in the following table:
Year Ended December 31 | 2019 | 2018 | ||||||||||||||
(In millions) | ||||||||||||||||
Investment gains (losses): | ||||||||||||||||
Fixed maturity securities: | ||||||||||||||||
Corporate and other bonds | $ (8 | ) | $ | 26 | ||||||||||||
States, municipalities and political subdivisions | 13 | 36 | ||||||||||||||
Asset-backed | (11 | ) | (58 | ) | ||||||||||||
Total fixed maturity securities | (6 | ) | 4 | |||||||||||||
Non-redeemable preferred stock | 66 | (74 | ) | |||||||||||||
Short term and other | (11 | ) | 13 | |||||||||||||
Total investment gains (losses) | 49 | (57 | ) | |||||||||||||
Income tax (expense) benefit | (12 | ) | 14 | |||||||||||||
Amounts attributable to noncontrolling interests | (4 | ) | 5 | |||||||||||||
Net investment gains (losses) attributable to Loews Corporation | $ 33 | $ | (38 | ) | ||||||||||||
| Year Ended December 31 | 2021 | 2020 | |||||||||
| (In millions) | |||||||||||
| Investment gains (losses): | |||||||||||
| Fixed maturity securities: | |||||||||||
| Corporate and other bonds | $ | 134 | $ | (71) | |||||||
| States, municipalities and political subdivisions | 40 | ||||||||||
| Asset-backed | (38) | 31 | |||||||||
| Total fixed maturity securities | 96 | — | |||||||||
| Non-redeemable preferred stock | 4 | (3) | |||||||||
| Short term and other | 20 | (32) | |||||||||
| Total investment gains (losses) | 120 | (35) | |||||||||
| Income tax (expense) benefit | (24) | 5 | |||||||||
| Amounts attributable to noncontrolling interests | (10) | 3 | |||||||||
| Investment gains (losses) attributable to Loews Corporation | $ | 86 | $ | (27) | |||||||
CNA’s investment results after tax and noncontrolling interestsgains (losses) improved $71$155 million in 20192021 as compared with 2018. The improvement was2020, driven by the favorable change in fair value ofnon-redeemablepreferred stock, partially offset by higher OTTI losses recognized in earnings.lower impairment losses.
Further information on CNA’s investment gains and losses including other-than-temporary impairment losses, is set forth in Notes 1 andNote 3 of the Notes to Consolidated Financial Statements included under Item 8.
Portfolio Quality
The following table presents the estimated fair value and net unrealized gains (losses) of CNA’s fixed maturity securities by rating distribution:
December 31, 2019 | December 31, 2018 | |||||||||||||||||||
Estimated Fair Value | Net Unrealized Gains (Losses) | Estimated Fair Value | Net Unrealized Gains (Losses) | |||||||||||||||||
(In millions) | ||||||||||||||||||||
U.S. Government, Government agencies and Government-sponsored enterprises | $ | 4,136 | $ | 95 | $ | 4,334 | $ | (24 | ) | |||||||||||
AAA | 3,254 | 349 | 3,027 | 245 | ||||||||||||||||
AA | 6,663 | 801 | 6,510 | 512 | ||||||||||||||||
A | 9,062 | 1,051 | 8,768 | 527 | ||||||||||||||||
BBB | 16,839 | 1,684 | 14,205 | 274 | ||||||||||||||||
Non-investment grade | 2,253 | 101 | 2,702 | (73 | ) | |||||||||||||||
Total | $ | 42,207 | $ | 4,081 | $ | 39,546 | $ | 1,461 | ||||||||||||
| December 31, 2021 | December 31, 2020 | ||||||||||||||||||||||
| Estimated Fair Value | Net Unrealized Gains (Losses) | Estimated Fair Value | Net Unrealized Gains (Losses) | ||||||||||||||||||||
| (In millions) | |||||||||||||||||||||||
| U.S. Government, Government agencies and | |||||||||||||||||||||||
| Government-sponsored enterprises | $ | 2,600 | $ | 42 | $ | 3,672 | $ | 117 | |||||||||||||||
| AAA | 3,784 | 360 | 3,627 | 454 | |||||||||||||||||||
| AA | 7,665 | 823 | 7,159 | 1,012 | |||||||||||||||||||
| A | 9,511 | 1,087 | 9,543 | 1,390 | |||||||||||||||||||
| BBB | 18,458 | 2,043 | 18,007 | 2,596 | |||||||||||||||||||
| Non-investment grade | 2,362 | 91 | 2,623 | 149 | |||||||||||||||||||
| Total | $ | 44,380 | $ | 4,446 | $ | 44,631 | $ | 5,718 | |||||||||||||||
As of December 31, 20192021 and 2018, only2020, 1% of CNA’s fixed maturity portfolio was rated internally. AAA rated securities included $1.5$1.7 billion and $1.3$1.8 billion ofpre-funded pre-refunded municipal bonds as of December 31, 20192021 and 2018.2020.
| 58 | ||||||||
The following table presents CNA’s
available-for-sale
fixed maturity securities in a gross unrealized loss position by ratings distribution:December 31, 2019 | Estimated Fair Value | Gross Unrealized Losses | ||||||||
(In millions) | ||||||||||
U.S. Government, Government agencies and Government-sponsored enterprises | $ | 271 | $ | 3 | ||||||
AAA | 91 | 2 | ||||||||
AA | 165 | 1 | ||||||||
A | 667 | 6 | ||||||||
BBB | 832 | 13 | ||||||||
Non-investment grade | 394 | 20 | ||||||||
Total | $ | 2,420 | $ | 45 | ||||||
| December 31, 2021 | Estimated Fair Value | Gross Unrealized Losses | |||||||||
| (In millions) | |||||||||||
| U.S. Government, Government agencies and | |||||||||||
| Government-sponsored enterprises | $ | 898 | $ | 8 | |||||||
| AAA | 368 | 6 | |||||||||
| AA | 875 | 17 | |||||||||
| A | 1,516 | 23 | |||||||||
| BBB | 1,812 | 42 | |||||||||
| Non-investment grade | 596 | 16 | |||||||||
| Total | $ | 6,065 | $ | 112 | |||||||
The following table presents the maturity profile for these
available-for-sale
fixed maturity securities. Securities not due to mature on a single date are allocated based on weighted average life:December 31, 2019 | Estimated Fair Value | Gross Unrealized Losses | ||||||||
(In millions) | ||||||||||
Due in one year or less | $ | 77 | $ | 1 | ||||||
Due after one year through five years | 613 | 15 | ||||||||
Due after five years through ten years | 1,367 | 16 | ||||||||
Due after ten years | 363 | 13 | ||||||||
Total | $ | 2,420 | $ | 45 | ||||||
| December 31, 2021 | Estimated Fair Value | Gross Unrealized Losses | |||||||||
| (In millions) | |||||||||||
| Due in one year or less | $ | 144 | $ | 4 | |||||||
| Due after one year through five years | 1,191 | 22 | |||||||||
| Due after five years through ten years | 2,803 | 44 | |||||||||
| Due after ten years | 1,927 | 42 | |||||||||
| Total | $ | 6,065 | $ | 112 | |||||||
Duration
A primary objective in the management of CNA’s investment portfolio is to optimize return relative to the corresponding liabilities and respective liquidity needs. CNA’s views on the current interest rate environment, tax regulations, asset class valuations, specific security issuer and broader industry segment conditions as well as domestic and global economic conditions, are some of the factors that enter into an investment decision. CNA also continually monitors exposure to issuers of securities held and broader industry sector exposures and may from time to time adjust such exposures based on its views of a specific issuer or industry sector.
A further consideration in the management of CNA’s investment portfolio is the characteristics of the corresponding liabilities and the ability to align the duration of the portfolio to those liabilities and to meet future liquidity needs, minimize interest rate risk and maintain a level of income sufficient to support the underlying insurance liabilities. For portfolios where future liability cash flows are determinable and typically long term in nature, CNA segregates investments for asset/liability management purposes. The segregated investments support the long term care and structured settlement liabilities in Other Insurance Operations.
| 59 | ||||||||
The effective durations of CNA’s fixed income securities and short term investments are presented in the following table. Amounts presented are net of payable and receivable amounts for securities purchased and sold, but not yet settled.
December 31, 2019 | December 31, 2018 | |||||||||||||||||
Estimated Fair Value | Effective Duration (In Years) | Estimated Fair Value | Effective Duration (In Years) | |||||||||||||||
(In millions of dollars) | ||||||||||||||||||
Investments supporting Other Insurance Operations | $ | 18,015 | 8.9 | $ | 16,212 | 8.4 | ||||||||||||
Other investments | 26,813 | 4.1 | 25,428 | 4.4 | ||||||||||||||
Total | $ | 44,828 | 6.0 | $ | 41,640 | 6.0 | ||||||||||||
| December 31, 2021 | December 31, 2020 | ||||||||||||||||||||||
| Estimated Fair Value | Effective Duration (Years) | Estimated Fair Value | Effective Duration (Years) | ||||||||||||||||||||
| (In millions of dollars) | |||||||||||||||||||||||
| Investments supporting Other Insurance | |||||||||||||||||||||||
| Operations | $ | 18,458 | 9.2 | $ | 18,518 | 9.2 | |||||||||||||||||
| Other investments | 28,915 | 4.9 | 28,839 | 4.5 | |||||||||||||||||||
| Total | $ | 47,373 | 6.6 | $ | 47,357 | 6.3 | |||||||||||||||||
December 31 | 2019 | 2018 | ||||||||
(In millions) | ||||||||||
Short term investments: | ||||||||||
Commercial paper | $ | 1,181 | $ | 705 | ||||||
U.S. Treasury securities | 364 | 185 | ||||||||
Other | 316 | 396 | ||||||||
Total short term investments | $ | 1,861 | $ | 1,286 | ||||||
INSURANCE RESERVES
The level of claim reserves CNA maintains represents its best estimate, as of a particular point in time, of what the ultimate settlement and administration of claims will cost based on CNA’s assessment of facts and circumstances known at that time. Reserves are not an exact calculation of liability but instead are complex estimates that CNA derives, generally utilizing a variety of actuarial reserve estimation techniques, from numerous assumptions and expectations about future events, both internal and external, many of which are highly uncertain. As noted below, CNA reviews its reserves for each segment of its business periodically, and any such review could result in the need to increase reserves in amounts which could be material and could adversely affect our results of operations and equity and CNA’s equity, business and insurer financial strength and corporate debt ratings. Further information on reserves is provided in Note 8 of the Notes to Consolidated Financial Statements included under Item 8.
Property and Casualty Claim and Claim Adjustment Expense Reserves
CNA maintains loss reserves to cover its estimated ultimate unpaid liability for claim and claim adjustment expenses, including the estimated cost of the claims adjudication process, for claims that have been reported but not yet settled (case reserves) and claims that have been incurred but not reported (“IBNR”). IBNR includes a provision for development on known cases as well as a provision for late reported incurred claims. Claim and claim adjustment expense reserves are reflected as liabilities and are included on the Consolidated Balance Sheets under the heading “Insurance Reserves.” Adjustments to prior year reserve estimates, if necessary, are reflected in results of operations in the period that the need for such adjustments is determined. The carried case and IBNR reserves as of each balance sheet date are provided in the discussion that follows and in Note 8 of the Notes to Consolidated Financial Statements included under Item 8.
There is a risk that CNA’s recorded reserves are insufficient to cover its estimated ultimate unpaid liability for claims and claim adjustment expenses. Unforeseen emerging or potential claims and coverage issues are also difficult to predict and could materially adversely affect the adequacy of CNA’s claim and claim adjustment expense reserves and could lead to future reserve additions.
In addition, CNA’s property and casualty insurance subsidiaries also have actual and potential exposures related to A&EP claims, which could result in material losses. To mitigate the risks posed by CNA’s exposure to A&EP claims and claim adjustment expenses, CNA completed a transaction with National Indemnity Company (“NICO”), under which substantially all of CNA’s legacy A&EP liabilities were ceded to NICO effective January 1, 2010. See Note 8 of the Notes to the Consolidated Financial Statements included under Item 8 for further discussion about the transaction with NICO, its impact on CNA’s results of operations and the deferred retroactive reinsurance gaingains and the amount of remaining reinsurance limit.
| 60 | ||||||||
Establishing Property & Casualty Reserve Estimates
In developing claim and claim adjustment expense (“loss” or “losses”) reserve estimates, CNA’s actuaries perform detailed reserve analyses that are staggered throughout the year. The data is organized at a reserve group level. A reserve group typically can be a line of business covering a subset of insureds such as commercial automobile liability for small or middle market customers, or it can be a particular type of claim such as construction defect. Every reserve group is reviewed at least once during the year, but most are reviewed more frequently. The analyses generally review losses gross of ceded reinsurance and apply the ceded reinsurance terms to the gross estimates to establish estimates net of reinsurance. In addition to the detailed analyses, CNA reviews actual loss emergence for all products each quarter.
Most of CNA’s business can be characterized as long-tail. For long-tail business, it will generally be several years between the time the business is written and the time when all claims are settled. CNA’s long-tail exposures include commercial automobile liability, workers’ compensation, general liability, medical professional liability, other professional liability and management liability coverages, assumed reinsurance
run-off
and products liability. Short-tail exposures include property, commercial automobile physical damage, marine, surety and warranty. Property & Casualty Operations contain both long-tail and short-tail exposures. Other Insurance Operations contain long-tail exposures.Various methods are used to project ultimate losses for both long-tail and short-tail exposures.
The paid development method estimates ultimate losses by reviewing paid loss patterns and applying them to accident or policy years with further expected changes in paid losses. Selection of the paid loss pattern may require consideration of several factors including the impact of economic, social and medical inflation on claim costs, the rate at which claims professionals make claim payments and close claims, the impact of judicial decisions, the impact of underwriting changes, the impact of large claim payments and other factors. Claim cost inflation itself may require evaluation of changes in the cost of repairing or replacing property, changes in the cost of medical care, changes in the cost of wage replacement, judicial decisions, legislative changes and other factors. Because this method assumes that losses are paid at a consistent rate, changes in any of these factors can affect the results. Since the method does not rely on case reserves, it is not directly influenced by changes in their adequacy.
For many reserve groups, paid loss data for recent periods may be too immature or erratic for accurate predictions. This situation often exists for long-tail exposures. In addition, changes in the factors described above may result in inconsistent payment patterns. Finally, estimating the paid loss pattern subsequent to the most mature point available in the data analyzed often involves considerable uncertainty for long-tail products such as workers’ compensation.
The incurred development method is similar to the paid development method, but it uses case incurred losses instead of paid losses. Since the method uses more data (case reserves in addition to paid losses) than the paid development method, the incurred development patterns may be less variable than paid patterns. However, selection of the incurred loss pattern typically requires analysis of all of the same factors described above. In addition, the inclusion of case reserves can lead to distortions if changes in case reserving practices have taken place, and the use of case incurred losses may not eliminate the issues associated with estimating the incurred loss pattern subsequent to the most mature point available.
The loss ratio method multiplies earned premiums by an expected loss ratio to produce ultimate loss estimates for each accident or policy year. This method may be useful for immature accident or policy periods or if loss development patterns are inconsistent, losses emerge very slowly or there is relatively little loss history from which to estimate future losses. The selection of the expected loss ratio typically requires analysis of loss ratios from earlier accident or policy years or pricing studies and analysis of inflationary trends, frequency trends, rate changes, underwriting changes and other applicable factors.
The Bornhuetter-Ferguson method using paid loss is a combination of the paid development method and the loss ratio method. This method normally determines expected loss ratios similar to the approach used to estimate the expected loss ratio for the loss ratio method and typically requires analysis of the same factors described above. This method assumes that future losses will develop at the expected loss ratio level. The percent of paid loss to ultimate loss implied from the paid development method is used to determine what percentage of ultimate loss is yet to be paid. The use of the pattern from the paid development method typically requires consideration of the same factors listed in the description of the paid development method. The estimate of losses yet to be paid is added to current paid losses to estimate the ultimate loss for each year. For long-tail lines, this method will react very slowly if actual ultimate loss ratios are different from expectations due to changes not accounted for by the expected loss ratio calculation.
| 61 | ||||||||
The Bornhuetter-Ferguson method using incurred loss is similar to the Bornhuetter-Ferguson method using paid loss except that it uses case incurred losses. The use of case incurred losses instead of paid losses can result in development patterns that are less variable than paid patterns. However, the inclusion of case reserves can lead to distortions if changes in case reserving have taken place, and the method typically requires analysis of the same factors that need to be reviewed for the loss ratio and incurred development methods.
The frequency times severity method multiplies a projected number of ultimate claims by an estimated ultimate average loss for each accident or policy year to produce ultimate loss estimates. Since projections of the ultimate number of claims are often less variable than projections of ultimate loss, this method can provide more reliable results for reserve groups where loss development patterns are inconsistent or too variable to be relied on exclusively. In addition, this method can more directly account for changes in coverage that affect the number and size of claims. However, this method can be difficult to apply to situations where very large claims or a substantial number of unusual claims result in volatile average claim sizes. Projecting the ultimate number of claims may require analysis of several factors, including the rate at which policyholders report claims to CNA, the impact of judicial decisions, the impact of underwriting changes and other factors. Estimating the ultimate average loss may require analysis of the impact of large losses and claim cost trends based on changes in the cost of repairing or replacing property, changes in the cost of medical care, changes in the cost of wage replacement, judicial decisions, legislative changes and other factors.
Stochastic modeling produces a range of possible outcomes based on varying assumptions related to the particular reserve group being modeled. For some reserve groups, CNA uses models which rely on historical development patterns at an aggregate level, while other reserve groups are modeled using individual claim variability assumptions supplied by the claims department. In either case, multiple simulations using varying assumptions are run and the results are analyzed to produce a range of potential outcomes. The results will typically include a mean and percentiles of the possible reserve distribution which aid in the selection of a point estimate.
For many exposures, especially those that can be considered long-tail, a particular accident or policy year may not have a sufficient volume of paid losses to produce a statistically reliable estimate of ultimate losses. In such a case, CNA’s actuaries typically assign more weight to the incurred development method than to the paid development method. As claims continue to settle and the volume of paid loss increases, the actuaries may assign additional weight to the paid development method. For most of CNA’s products, even the incurred losses for accident or policy years that are early in the claim settlement process will not be of sufficient volume to produce a reliable estimate of ultimate losses. In these cases, CNA may not assign much, if any, weight to the paid and incurred development methods. CNA may use the loss ratio, Bornhuetter-Ferguson and/or frequency times severity methods. For short-tail exposures, the paid and incurred development methods can often be relied on sooner primarily because CNA’s history includes a sufficient number of years to cover the entire period over which paid and incurred losses are expected to change. However, CNA may also use the loss ratio, Bornhuetter-Ferguson and/or frequency times severity methods for short-tail exposures.
For other more complex reserve groups where the above methods may not produce reliable indications, CNA uses additional methods tailored to the characteristics of the specific situation.
Periodic Reserve Reviews
The reserve analyses performed by CNA’s actuaries result in point estimates. Each quarter, the results of the detailed reserve reviews are summarized and discussed with CNA’s senior management to determine management’sthe best estimate of reserves. CNA’s senior management considers many factors in making this decision. CNA’s recorded reserves reflect its best estimate as of a particular point in time based upon known facts and circumstances, consideration of the factors cited above and its judgment. The carried reserve differs from the actuarial point estimate as discussed further below.
Currently, CNA’s recorded reserves are modestly higher than the actuarial point estimate. For Property & Casualty Operations, the difference between CNA’s reserves and the actuarial point estimate is primarily driven by uncertainty with respect to immature accident years, claim cost inflation, changes in claims handling, changes to the tort environment which may adversely affect claim costs and the effects from the economy. For CNA’s legacy A&EP liabilities, the difference between CNA’s reserves and the actuarial point estimate is primarily driven by the potential tail volatility of
run-off
exposures.The key assumptions fundamental to the reserving process are often different for various reserve groups and accident or policy years. Some of these assumptions are explicit assumptions that are required of a particular method, but most of the assumptions are implicit and cannot be precisely quantified. An example of an explicit assumption is the pattern employed in the paid development method. However, the assumed pattern is itself based on several implicit assumptions such as the impact of inflation on medical costs and the rate at which claim professionals close claims. As a result, the effect on reserve
| 62 | ||||||||
estimates of a particular change in assumptions typically cannot be specifically quantified, and changes in these assumptions cannot be tracked over time.
CNA’s recorded reserves are management’s best estimate. In order to provide an indication of the variability associated with CNA’s net reserves, the following discussion provides a sensitivity analysis that shows the approximate estimated impact of variations in significant factors affecting CNA’s reserve estimates for particular types of business. These significant factors are the ones that CNA believes could most likely materially affect the reserves. This discussion covers the major types of business for which CNA believes a material deviation to its reserves is reasonably possible. There can be no assurance that actual experience will be consistent with the current assumptions or with the variation indicated by the discussion. In addition, there can be no assurance that other factors and assumptions will not have a material impact on CNA’s reserves.
The three areas for which CNA believes a significant deviation to its net reserves is reasonably possible are (i) professional liability, management liability and surety products (ii) workers’ compensation and (iii) general liability.
Professional liability, management liability and surety products include U.S. professional liability coverages provided to various professional firms, including architects, real estate agents, small and$400$450 million. If the estimated claim severity decreases by 3%, CNA estimates that net reserves would decrease by approximately $150 million. CNA’s net reserves for these products were approximately $4.4$5.0 billion as of December 31, 2019.2021.
mid-sized
accounting firms, law firms and other professional firms. They also include D&O, employment practices, fiduciary, fidelity and surety coverages and medical liability. The most significant factor affecting reserve estimates for these liability coverages is claim severity. Claim severity is driven by the cost of medical care, the cost of wage replacement, legal fees, judicial decisions, legislative changes and other factors. Underwriting and claim handling decisions such as the classes of business written and individual claim settlement decisions can also affect claim severity. If the estimated claim severity increases by 9%, CNA estimates that net reserves would increase by approximately For workers’ compensation, since many years will pass from the time the business is written until all claim payments have been made, the most significant factor affecting workers’ compensation reserve estimateestimates is claim cost inflation on claim payments. Workers’ compensation claim cost inflation is driven by the cost of medical care, the cost of wage replacement, expected claimant lifetimes, judicial decisions, legislative changes and other factors. If estimated workers’ compensation claim cost inflation increases by 100 basis points for the entire period over which claim payments will be made, CNA estimates that its net reserves would increase by approximately $350 million. If estimated workers’ compensation claim cost inflation decreases by 100 basis points for the entire period over which claim payments will be made, CNA estimates that its net reserves would decrease by approximately $350 million. Net reserves for workers’ compensation were approximately $4.0$3.9 billion as of December 31, 2019.
2021.For general liability, the most significant factor affecting reserve estimates is claim severity. Claim severity is driven by changes in the cost of repairing or replacing property, the cost of medical care, the cost of wage replacement, judicial decisions, legislation and other factors. If the estimated claim severity for general liability increases by 6%, CNA estimates that its net reserves would increase by approximately $200 million. If the estimated claim severity for general liability decreases by 3%, CNA estimates that its net reserves would decrease by approximately $100 million. Net reserves for general liability were approximately $3.4$3.2 billion as of December 31, 2019.
2021.Given the factors described above, it is not possible to quantify precisely the ultimate exposure represented by claims and related litigation. As a result, CNA regularly reviews the adequacy of its reserves and reassesses its reserve estimates as historical loss experience develops, additional claims are reported and settled and additional information becomes available in subsequent periods. In reviewing CNA’s reserve estimates, CNA makes adjustments in the period that the need for such adjustments is determined. These reviews have resulted in CNA’s identification of information and trends that have caused CNA to change its reserves in prior periods and could lead to CNA’s identification of a need for additional material increases or decreases in claim and claim adjustment expense reserves, which could materially affect our results of operations and equity and CNA’s business and insurer financial strength and corporate debt ratings positively or negatively. See Note 8 of the Notes to the Consolidated Financial Statements included under Item 8 for additional information about reserve development.
| 63 | ||||||||
The following table summarizes gross and net carried reserves for CNA’s Property & Casualty Operations:
December 31 | 2019 | 2018 | December 31 | 2021 | 2020 | ||||||||||||||||
(In millions) | (In millions) | ||||||||||||||||||||
Gross Case Reserves | $ | 6,276 | $ | 6,671 | Gross Case Reserves | $ | 5,621 | $ | 5,674 | ||||||||||||
Gross IBNR Reserves | 9,494 | 9,287 | Gross IBNR Reserves | 11,982 | 10,415 | ||||||||||||||||
Total Gross Carried Claim and Claim Adjustment Expense Reserves | $ | 15,770 | $ | 15,958 | Total Gross Carried Claim and Claim Adjustment Expense Reserves | $ | 17,603 | $ | 16,089 | ||||||||||||
Net Case Reserves | $ | 5,645 | $ | 6,063 | Net Case Reserves | $ | 4,932 | $ | 5,072 | ||||||||||||
Net IBNR Reserves | 8,508 | 8,290 | Net IBNR Reserves | 10,338 | 9,123 | ||||||||||||||||
Total Net Carried Claim and Claim Adjustment Expense Reserves | $ | 14,153 | $ | 14,353 | Total Net Carried Claim and Claim Adjustment Expense Reserves | $ | 15,270 | $ | 14,195 | ||||||||||||
The following table summarizes the gross and net carried reserves for other insurance businesses in
run-off,
including CNA Re and A&EP:December 31 | 2019 | 2018 | ||||||||
(In millions) | ||||||||||
Gross Case Reserves | $ | 1,137 | $ | 1,208 | ||||||
Gross IBNR Reserves | 1,097 | 1,217 | ||||||||
Total Gross Carried Claim and Claim Adjustment Expense Reserves | $ | 2,234 | $ | 2,425 | ||||||
Net Case Reserves | $ | 92 | $ | 96 | ||||||
Net IBNR Reserves | 83 | 96 | ||||||||
Total Net Carried Claim and Claim Adjustment Expense Reserves | $ | 175 | $ | 192 | ||||||
| December 31 | 2021 | 2020 | |||||||||
| (In millions) | |||||||||||
| Gross Case Reserves | $ | 1,551 | $ | 1,614 | |||||||
| Gross IBNR Reserves | 1,266 | 1,260 | |||||||||
| Total Gross Carried Claim and Claim Adjustment Expense Reserves | $ | 2,817 | $ | 2,874 | |||||||
| Net Case Reserves | $ | 146 | $ | 560 | |||||||
| Net IBNR Reserves | 148 | 331 | |||||||||
| Total Net Carried Claim and Claim Adjustment Expense Reserves | $ | 294 | $ | 891 | |||||||
CNA’s Other Insurance OperationsLife & Group business includes its
run-off
long term care business as well as structured settlement obligations not funded by annuities related to certain property and casualty claimants. Long term care policies provide benefits for nursing homes, assisted living facilities and home health care subject to various daily and lifetime caps. Generally, policyholders must continue to make periodic premium payments to keep the policy in force and CNA has the ability to increase policy premiums, subject to state regulatory approval.CNA maintains both claim and claim adjustment expense reserves as well as future policy benefit reserves for policyholder benefits for its long term careLife & Group business. Claim and claim adjustment expense reserves consist of estimated reserves for long term care policyholders that are currently receiving benefits, including claims that have been incurred but are not yet reported. In developing the claim and claim adjustment expense reserve estimates for CNA’s long term care policies, its actuaries perform a detailed claim experience studyreserve review on an annual basis. The study reviewsreview analyzes the sufficiency of existing reserves for policyholders currently on claim and includes an evaluation of expected benefit utilization and claim duration. CNA’s recorded claim and claim adjustment expense reserves reflect CNA management’s best estimate after incorporating the results of the most recent study. In addition, claim and claim adjustment expense reserves are also maintained for the structured settlement obligations. In developing the claim and claim adjustment expense reserve estimates for CNA’s structured settlement obligations, CNA’s actuaries monitor mortality experience on an annual basis. Both elementsCNA’s recorded claim and claim adjustment expense reserves reflect CNA’s best estimate after incorporating the results of the most recent reviews. Claim and claim adjustment expense reserves for long term care reservespolicies and structured settlement obligations are discounted as discussed in Note 1 to the Consolidated Financial Statements included under Item 8.
Future policy benefit reserves representconsist of the active life reserves related to CNA’s long term care policies whichfor policyholders that are not currently receiving benefits and represent the present value of expected future benefit payments and expenses less expected future premium. The determination of these reserves requires management to make estimates and assumptions about expected investment and policyholder experience over the life of the contract. Since many of these contracts may be in force for several decades, these assumptions are subject to significant estimation risk.
| 64 | ||||||||
The actuarial assumptions that management believes are subject to the most variability are morbidity, persistency, discount rates and anticipated future premium rate increases. Morbidity is the frequency and severity of injury, illness, sickness and diseases contracted. Persistency is the percentage of policies remaining in force and can be affected by policy lapses, benefit reductions and death. Discount rates are influenced by the investment yield on assets supporting long term care reserves which is subject to interest rate and market volatility and may also be affected by changes to the Internal Revenue Code. Future premium rate increases are generally subject to regulatory approval, and therefore the exact timing and size of the approved rate increases are unknown. As a result of this variability, CNA’s long term care reserves may be subject to material increases if actual experience develops adversely to its expectations.
Annually, in the third quarter, managementCNA assesses the adequacy of its long term care future policy benefit reserves by performing a gross premium valuation (“GPV”) to determine if there is a premium deficiency. Management also uses the GPV process to evaluate the adequacy of CNA’s claim and claim adjustment expense reserves for structured settlement obligations. Under the GPV, management estimates required reserves using best estimate assumptions as of the date of the assessment without provisions for adverse deviation. The GPV required reserves are then compared to the existing recorded reserves. If the GPV required reserves are greater than the existing recorded reserves, the
existing assumptions are unlocked and future policy benefit reserves are increased to the greater amount. Any such increase is reflected in CNA’s results of operations in the period in which the need for such adjustment is determined. If the GPV required reserves are less than the existing recorded reserves, the assumptions remain locked in and no adjustment is required.
(In millions) | ||||||||||||
Long term care active life reserve - change in estimated reserve margin | ||||||||||||
| September 30, 2020 estimated margin | $ | — | ||||||||||
Changes in underlying discount rate assumptions | 65 | |||||||||||
Changes in underlying morbidity assumptions | 205 | |||||||||||
Changes in underlying persistency assumptions | (233) | |||||||||||
Changes in underlying premium rate action assumptions | 27 | |||||||||||
Changes in underlying expense and other assumptions | 8 | |||||||||||
September 30, | $ | 72 | ||||||||||
(a) Including cost of care inflation assumption.
The premium deficiencyincrease in the margin in 2021 was primarily driven by changes in discount rate assumptions driven by lowerdue to higher near term expected reinvestment rates contemplating both near-term market indications and long-term normativefavorable changes to underlying morbidity assumptions. The premium deficiency was also adversely affected by changes in persistency assumptions, primarily from lower projected active life mortality rates. Recognition of margin in earnings subsequent to the 2018 GPV also contributed to the premium deficiency. These unfavorablefavorable drivers were partially offset by higher than expected rate increases on active rate increase programs, new planned rate increase filings and favorableunfavorable changes to the underlying morbidity and expensepersistency assumptions.
| 65 | ||||||||
The table below summarizes the estimated pretax impact on CNA’s results of operations from various hypothetical revisions to its active life reserve assumptions. The annual GPV process involves updating all assumptions to management’s then current best estimate, and historically all significant assumptions have been revised each year. In the hypothetical revisions table below, CNA has assumed that revisions to such assumptions would occur in each policy type, age and duration within each policy group and would occur absent any changes, mitigating or otherwise, in the other assumptions. Although such hypothetical revisions are not currently required or anticipated, CNA believes they could occur based on past variances in experience and its expectations of the ranges of future experience that could reasonably occur. Any required increase in the recorded reserves resulting from a hypothetical revision in the table below would first reduce the margin in the carried reserves before it would affect results from operations. Any actual adjustment would be dependent on the specific policies affected and, therefore, may differ from the estimates summarized below. The estimated impacts to results of operations in the table below are after consideration of the existing margin.
Estimated Reduction | ||||||||
(In millions) | ||||||||
Hypothetical revisions | ||||||||
Morbidity: | ||||||||
2.5% increase in morbidity | $ | 300 | ||||||
| 5% increase in morbidity | 600 | |||||||
5% decrease in active life mortality and lapse | $ | |||||||
10% decrease in active life mortality and lapse | 300 | |||||||
Discount rates: | ||||||||
25 basis point decline in new money interest rates | $ | 100 | ||||||
| 50 basis point decline in new money interest rates | 200 | |||||||
Premium rate actions: | ||||||||
50% decrease in anticipated future premium rate increases | $ | — | ||||||
| 66 | ||||||||
The following tables summarize policyholder reserves for CNA’s long term care operations:
December 31, 2019 | Claim and claim adjustment expenses | Future policy benefits | Total | |||||||||
(In millions) | ||||||||||||
Long term care | $ | 2,863 | $ | 9,470 | $ | 12,333 | ||||||
Structured settlement annuities | 515 | 515 | ||||||||||
Other | 12 | 12 | ||||||||||
Total | 3,390 | 9,470 | 12,860 | |||||||||
Shadow adjustments (a) | 167 | 2,615 | 2,782 | |||||||||
Ceded reserves (b) | 159 | 226 | 385 | |||||||||
Total gross reserves | $ | 3,716 | $ | 12,311 | $ | 16,027 | ||||||
| December 31, 2021 | Claim and claim adjustment expenses | Future policy benefits | Total | ||||||||||||||
| (In millions) | |||||||||||||||||
| Long term care | $ | 2,905 | $ | 10,012 | $ | 12,917 | |||||||||||
| Structured settlement obligations | 526 | 526 | |||||||||||||||
| Other | 10 | 10 | |||||||||||||||
| Total | 3,441 | 10,012 | 13,453 | ||||||||||||||
Shadow adjustments (a) | 200 | 2,936 | 3,136 | ||||||||||||||
Ceded reserves (b) | 113 | 288 | 401 | ||||||||||||||
| Total gross reserves | $ | 3,754 | $ | 13,236 | $ | 16,990 | |||||||||||
| December 31, 2020 | |||||||||||||||||
| Long term care | $ | 2,844 | $ | 9,762 | $ | 12,606 | |||||||||||
| Structured settlement obligations | 543 | 543 | |||||||||||||||
| Other | 10 | 10 | |||||||||||||||
| Total | 3,397 | 9,762 | 13,159 | ||||||||||||||
Shadow adjustments (a) | 218 | 3,293 | 3,511 | ||||||||||||||
Ceded reserves (b) | 128 | 263 | 391 | ||||||||||||||
| Total gross reserves | $ | 3,743 | $ | 13,318 | $ | 17,061 | |||||||||||
(a)To the extent that unrealized gains on fixed maturity securities supporting structured settlements not funded by annuities were realized, or that unrealized gains on fixed maturity securities supporting long term care products would result in a premium deficiency if realized, a related increase in Insurance reserves is recorded, after tax and noncontrolling interests, as a reduction of net unrealized gains through Other comprehensive income (“Shadow Adjustments”).
(b)Ceded reserves relate to claim or policy reserves fully reinsured in connection with a sale or exit from the underlying business.
December 31, 2018 | Claim and claim adjustment expenses | Future policy benefits | Total | |||||||||
(In millions) | ||||||||||||
Long term care | $ | 2,761 | $ | 9,113 | $ | 11,874 | ||||||
Structured settlement annuities | 530 | 530 | ||||||||||
Other | 14 | 14 | ||||||||||
Total | 3,305 | 9,113 | 12,418 | |||||||||
Shadow adjustments (a) | 115 | 1,250 | 1,365 | |||||||||
Ceded reserves (b) | 181 | 234 | 415 | |||||||||
Total gross reserves | $ | 3,601 | $ | 10,597 | $ | 14,198 | ||||||
CATASTROPHES AND RELATED REINSURANCE
Catastrophes are an inherent risk of the property and casualty insurance business and have contributed to material$179$397 million and $252$550 million for the years ended December 31, 20192021 and 2018.2020. Net catastrophe losses for the year ended December 31, 2019 are related primarily to U.S.2021 were driven by severe weather related events.events, primarily Hurricane Ida and Winter Storms Uri and Viola. Net catastrophe losses for the year ended December 31, 20182020 included $88$294 million related primarily to Hurricane Michael, $47severe weather related events, $195 million related to the California wildfiresCOVID-19 pandemic and $33$61 million related to Hurricane Florence. The remaining netcivil unrest.
period-to-period
fluctuations in CNA’s results of operations and/or equity. CNA reported catastrophe losses, net of reinsurance, of CNA uses various analyses and methods, including using one of the industry standard natural catastrophe models to estimate hurricane and earthquake losses in 2018 resulted primarily from U.S. weather relatedat various return periods, to inform underwriting and reinsurance decisions designed to manage its exposure to catastrophic events.
CNA generally seeks to manage its exposure to catastrophes through the purchase of catastrophe reinsurance and has catastrophe reinsurance treaties that cover property and workers’ compensation losses. CNA conducts an ongoing review of its risk and catastrophe reinsurance coverages and from time to time makemakes changes as it deems appropriate.
| 67 | ||||||||
During the second quarter of 2021, CNA added a quota share treaty to its property reinsurance program, which covers policies written during the treaty term and in-force as of June 1, 2021. As a result of the coverage of in-force policies, net written premiums were reduced by $122 million during the second quarter for the one-time catch-up under the treaty of unearned premium on policies previously written as of the June 1, 2021 treaty inception. This ceded premium will earn in future quarters consistent with the underlying gross policies.
The following discussion summarizes CNA’s most significant catastrophe reinsurance coverage at January 1, 2020.
2022.Group North American Property Treaty
CNA purchased corporate catastropheexcluded.excluded and covered under a separate treaty. The treaty has a term of JanuaryJune 1, 20192021 to MayJune 1, 2020. The 2019 treaty2022 and provides coverage for the accumulation of covered losses from catastrophe occurrences above CNA’s per occurrence retention of $250$190 million up to $900 million for all losses other than earthquakes. Earthquakes are covered up to $1.0 billion. Losses stemming from terrorism events are covered unless they are due to a nuclear, biological or chemical attack. All layers of the treaty provide for one full reinstatement.
excess-of-loss
treaty reinsurance covering its U.S. states and territories and Canadian property exposures underwritten in its North American and European companies. Exposures underwritten through Hardy are Group WorkersWorkers’ Compensation Treaty
CNA also purchased corporate WorkersWorkers’ Compensation catastrophe20202022 to January 1, 20212023 providing $275 million of coverage for the accumulation of covered losses related to natural catastrophes above CNA’s per occurrence retention of $25 million. The treaty provides $475 million of coverage for the accumulation of covered losses related to terrorism events above CNA’s retention of $25 million. Of the $475 million in terrorism coverage, $200 million is provided for nuclear, biological, chemical and radiation events. One full reinstatement is available for the first $275 million above the retention, regardless of the covered peril. CNA also purchased a targeted facultative facility to address exposure accumulations in specific peak terrorism zones.
excess-of-loss
treaty reinsurance for the period January 1, Terrorism Risk Insurance Program Reauthorization Act of 2019 (“TRIPRA”)
CNA’s principal reinsurance protection against large-scale terrorist attacks, including nuclear, biological, chemical or radiological attacks, is the coverage currently provided through TRIPRA which has been extendedruns through the end of 2027. TRIPRA provides a U.S. government backstop for insurance-related losses resulting from any “act of terrorism”,terrorism,” which is certified by the Secretary of Treasury in consultation with the Secretary of Homeland Security for losses that exceed a threshold of $200 million industry-wide for the calendar year 2020.2022. Under the current provisions of the program, in 20202022 the federal government will reimburse 80% of CNA’s covered losses in excess of its applicable deductible up to a total industry program cap of $100 billion. CNA’s deductible is based on eligible commercial property and casualty earned premiums for the preceding calendar year. Based on 20192021 earned premiums, CNA’s estimated deductible under the program is $850$915 million for 2020.2022. If an act of terrorism or acts of terrorism result in covered losses exceeding the $100 billion annual industry aggregate limit, Congress would be responsible for determining how additional losses in excess of $100 billion will be paid.
CRITICAL ACCOUNTING ESTIMATES
The preparation of the Consolidated Financial Statements in conformity with GAAP requires us to make estimates and assumptions that affect the amounts reported in the Consolidated Financial Statements and the related notes. Actual results could differ from those estimates.
The Consolidated Financial Statements and accompanying notes have been prepared in accordance with GAAP, applied on a consistent basis. We continually evaluate the accounting policies and estimates used to prepare the Consolidated Financial Statements. In general, our estimates are based on historical experience, evaluation of current trends, information from third party professionals and various other assumptions that we believe are reasonable under the known facts and circumstances.
We consider the accounting policies discussed below to be critical to an understanding of our Consolidated Financial Statements as their application places the most significant demands on our judgment. Due to the inherent uncertainties involved with these types of judgments, actual results could differ significantly from estimates whichand may have a material adverse impact on our results of operations, and/orfinancial condition, equity, business and CNA’s insurer financial strength and corporate debt ratings.
| 68 | ||||||||
Insurance Reserves
Insurance reserves are established for both short and long-duration insurance contracts. Short-duration contracts are primarily related to property and casualty insurance policies where the reserving process is based on actuarial estimates of the amount of loss, including amounts for known and unknown claims. Long-duration contracts are primarily related to long term care policies and are estimated using actuarial estimates about morbidity and persistency as well as assumptions about expected investment returns and future premium rate increases. The reserve for unearned premiums represents the portion of premiums written related to the unexpired terms of coverage. The reserving process is discussed in further detail in the Insurance Reserves section of this MD&A.
Long Term Care Reserves
Future policy benefit reserves for CNA’s long term care policies are based on certain assumptions including morbidity, persistency, inclusive of mortality, discount rates and future premium rate increases. The adequacy of the reserves is contingent upon actual experience and CNA’s future expectations related to these key assumptions. If actual or CNA’s expected future experience differs from these assumptions, the reserves may not be adequate, requiring CNA to add to reserves.
A prolonged period during which interest ratesinvestment returns remain at levels lower than those anticipated in CNA’s reserving discount rate assumption could result in shortfalls in investment income on assets supporting CNA’s obligations under long term care policies, which may also require an increaseincreases to CNA’s reserves. In addition, CNA may not receive regulatory approval for the level of premium rate increases it requests.
These changes to CNA’s reserves could materially adversely impact our results of operations, financial condition and equity. The reserving process is discussed in further detail in the Insurance Reserves section of this MD&A.
Reinsurance and Other Receivables
Exposure exists with respect to the collectibility of ceded property and casualty and life reinsurance to the extent that any reinsurer is unable to meet its obligations or disputes the liabilities CNA has ceded under reinsurance agreements. An allowance for doubtful accounts on reinsurance receivables is recorded on the basis of periodic evaluations of balances due from reinsurers, reinsurer financial strength rating and solvency, industry experience and current and forecast economic conditions. Further information on CNA’s reinsurance receivables is included in Note 16 of the Notes to Consolidated Financial Statements included under Item 8.
Additionally, exposure exists with respect to the collectibility of amounts due from customers on other receivables. An allowance for doubtful accounts is recorded on the basis of periodic evaluations of balances due, currently as well as in the future, historical reinsurer default data, management’s experience and current and forecast economic conditions.
If actual experience differs from the estimates made by management in determining the allowances for doubtful accounts on reinsurance and other receivables, net receivables as reflected on our Consolidated Balance Sheets may not be collected. Therefore, our results of operations, financial condition and/or equity could be materially adversely affected.
Further information on CNA’s process for determining the allowance for doubtful accounts on reinsurance and insurance receivables is in Note 1 to the Consolidated Financial Statements included under Item 8.Valuation of Investments and Impairment of Securities
Fixed maturity and equity securities are carried at fair value on the balance sheet. Fair value represents the price that would be received in a sale of an asset in an orderly transaction between market participants on the measurement date, the determination of which may require us to make a significant number of assumptions and judgments. Securities with the greatest level of subjectivity around valuation are those that rely on inputs that are significant to the estimated fair value and that are not observable in the market or cannot be derived principally from or corroborated by observable market data. These unobservable inputs are based on assumptions consistent with what we believe other market participants would use to price such securities. Further information on fair value measurements is included in Note 4 of the Notes to Consolidated Financial Statements included under Item 8.
CNA’s investment portfolio isfixed maturity securities are subject to market declines below amortized cost that may be other-than-temporary and therefore result in the recognition of impairment losses in earnings. Factors considered in the determination of whether or not a declinean impairment loss is other-than-temporaryrecognized in earnings include a current intention or need to sell the security or an indication that a credit loss exists. Significant judgment exists regardingis required in the evaluationdetermination of whether a credit loss has occurred for a security. CNA considers all available evidence when determining whether a security requires a credit allowance to be recorded, including the financial condition
| 69 | ||||||||
and expected near-term and long term prospects of the issuer, whether the issuer is current with interest and principal payments, credit ratings on the security or the underlying collateral, the relevantchanges in ratings over time, general market conditions, industry, conditions and trends,sector or other specific factors and whether CNA expects to receive cash flows sufficient to recover the entire amortized cost basis of the security.
CNA’s mortgage loan portfolio is subject to the expected credit loss model, which requires immediate recognition of estimated credit losses over the life of the asset and the presentation of the asset at the net amount expected to be collected. Significant judgment is required in the determination of estimated credit losses and any changes in CNA’s expectation of the net amount to be collected are recognized in earnings.
Further information on CNA’s process for evaluating impairments and expected credit losses is included in Note 1 of the Notes to Consolidated Financial Statements included under Item 8.
ACCOUNTING STANDARDS UPDATE
For a discussion of accounting standards updates that have been adopted or will be adopted in the future, please read Note 1 of the Notes to Consolidated Financial Statements included under Item 8.
Item 7A. Quantitative and Qualitative Disclosures about Market Risk.
We are a large diversified holding company. As such, we and our subsidiaries have significant amounts of financial instruments that involve market risk. Our measure of market risk exposure represents an estimate of the change in fair value of our financial instruments. Changes in the trading portfolio are recognized in the Consolidated Statements of Income. Market risk exposure is presented for each class of financial instrument held by us and our subsidiaries at December 31, assuming immediate adverse market movements of the magnitude described below. We believe that the various rates of adverse market movements represent a measure of exposure to loss under hypothetically assumed adverse conditions. The
estimated market risk exposure represents the hypothetical loss to future earnings and does not represent the maximum possible loss nor any expected actual loss, even under adverse conditions, because actual adverse fluctuations would likely differ. In addition, since our and our subsidiaries investment portfolio isportfolios are subject to change based on our portfolio management strategy as well as in response to changes in the market, these estimates are not necessarily indicative of the actual results which may occur.
Exposure to market risk is managed and monitored by senior management.management of the parent company and its subsidiaries. Senior management approves ourthe overall investment strategy and has responsibility to ensure that the investment positions are consistent with that strategy with an acceptable level of risk. WeManagement of risk may manage risk byinclude buying or selling instruments or entering into offsetting positions.
Interest Rate Risk – We and our subsidiaries have exposure to interest rate risk arising from changes in the level or volatility of interest rates. We and our subsidiaries attempt to mitigate our exposure to interest rate risk by utilizing instruments such as interest rate swaps, commitments to purchase securities, options, futures and forwards. We and our subsidiaries monitor our sensitivity to interest rate changes by revaluing financial assets and liabilities using a variety of different interest rates. The Company uses durationDuration and convexity at the security level are used to estimate the change in fair value that would result from a change in each security’s yield. Duration measures the price sensitivity of an asset to changes in yield. Convexity measures how the duration of the asset changes with interest rates. The duration and convexity analysis takes into account the unique characteristics (e.g., call and put options and prepayment expectations) of each security, in determining the hypothetical change in fair value. The analysis is performed at the security level and is aggregated up to the asset category level.
The evaluation is performed by applying an instantaneous change in the yield rates by varying magnitudes on a static balance sheet to determine the effect such a change in rates would have on the recorded market value of our investments and the resulting effect on shareholders’ equity. The analysis presents the sensitivity of the market value of our financial instruments to selected changes in market rates and prices which we believe are reasonably possible over a one year period.
The sensitivity analysis estimates the change in the fair value of our interest sensitive assets and liabilities that were held on December 31, 20192021 and 20182020 due to an instantaneous change in the yield of the security at the end of the period of 100 basis points, with all other variables held constant.
The interest rates on certain types of assets and liabilities may fluctuate in advance of changes in market interest rates, while interest rates on other types may lag behind changes in market rates. Accordingly, the analysis may not be indicative of, is not intended to provide, and does not provide a precise forecast of the effect of changes of market interest rates on our
| 70 | ||||||||
earnings or shareholders’ equity. Further, the computations do not contemplate any actions wethat could undertakebe undertaken in response to changes in interest rates.
Our and our subsidiaries’ debt is primarily denominated in U.S. dollars and has been primarily issued at fixed rates, therefore, interest expense would not be impacted by interest rate shifts. The impact of a 100 basis point increase in interest rates on fixed rate debt would result in a decrease in market value of $554$546 million and $492$636 million at December 31, 20192021 and 2018.2020. The impact of a 100 basis point decrease would result in an increase in market value of $602$683 million and $537$742 million at December 31, 20192021 and 2018. Altium Packaging has entered into interest rate swaps for a notional amount of $675 million to hedge its exposure to fluctuations in LIBOR on a portion of its variable rate debt. These swaps effectively fix the interest rate on the hedged portion of the term loan at a weighted-average rate of approximately 2.0% plus an applicable margin.2020. At December 31, 2019 and 2018,2021, the impact of a 100 basis point increase in interest rates on variable rate debt, net of the effects of the swaps, would not increase interest expense and at December 31, 2020 would increase interest expense by approximately $5 million and $7$3 million on an annual basis.
Equity Price Risk – We and our subsidiaries have exposure to equity price risk as a result of our investmentinvestments in equity securities and equity derivatives. Equity price risk results from changes in the level or volatility of equity prices which affect the value of equity securities or instruments that derive their value from such securities or indexes. Equity price risk was measured assuming an instantaneous 25% decrease in the underlying reference price or index from its level at December 31, 20192021 and 2018,2020, with all other variables held constant. A model was developed to analyzeFor limited partnership holdings, the observed changes in the value of limited partnerships held by the Company over a multiple year period along with the corresponding changes in various equity indices. The result of the model allowed us to estimate theestimated change in value was largely derived from a beta analysis calculation of limited partnerships when equity markets decline by 25%.
Foreign Exchange Rate Risk – Foreign exchange rate risk arises from the possibility that changes in foreign currency exchange rates will impact the value of financial instruments. We and our subsidiaries have foreign exchange rate exposure when we buy or sell foreign currencies or financial instruments denominated in a foreign currency, which is reduced through the use of forward contracts. The sensitivity analysis assumes an instantaneous 20% decrease in the foreign currency exchange rates versus the U.S. dollar from their levels at December 31, 20192021 and 2018,2020, with all other variables held constant.
Commodity Price Risk – We and our subsidiaries have exposure to price risk as a result of our investments in commodities. Commodity price risk results from changes in the level or volatility of commodity prices that impact instruments which derive their value from such commodities. Commodity price risk was measured assuming an instantaneous decrease of 20% from their levels at December 31, 20192021 and 2018.
2020.We have exposure to price risk as a result of Altium Packaging’s purchases of certain raw materials, such as high-density polyethylene, polycarbonate, polypropylene and polyethylene terephthalate resins in connection with the production of its products. The purchase prices of these raw materials are determined based on prevailing market conditions. While Altium Packaging’s operations are affected bycontracts with its customers provide for price adjustments for changes in resin prices on a prospective basis. Due to fluctuations in resin prices, its net income over time is generally unaffected by these changes as theseresin raw material costs are generally passed throughoffset by the change in revenues, so that Altium Packaging’s gross margins return to its customers.
the same level as prior to the change in prices.Credit Risk – We and our subsidiaries are exposed to credit risk relating to the risk of loss resulting from the nonperformance by a customer of its contractual obligations. Although nearly all of the Company’s customers pay for itstheir services on a timely basis, the Company and its subsidiaries actively monitors the credit exposure to its customers. Certain of the Company’sour subsidiaries may perform credit reviews of customers and may require customers to provide cash collateral, post a letter of credit, prepay for services or provide other credit enhancements.
| 71 | ||||||||
The following tables present the estimated effects on the fair value of our and our subsidiaries’ financial instruments as of December 31, 20192021 and 20182020 due to an increase in yield rates of 100 basis points, a 20% decline in foreign currency exchange rates and a 25% decline in the S&P 500, with all other variables held constant, on the basis of those entered into for trading purposes and other than trading purposes.
Trading portfolio:
Increase (Decrease) | ||||||||||||||||
December 31, 2019 | Fair Value Asset (Liability) | Interest Rate Risk | Equity Price Risk | |||||||||||||
(In millions) | ||||||||||||||||
Fixed maturities – long | $ | 53 | ||||||||||||||
Equity securities – long | 440 | $ | (110) | |||||||||||||
– short | (17 | ) | 4 | |||||||||||||
Options – purchased | 1 | 3 | ||||||||||||||
– written | (1 | ) | (5) | |||||||||||||
Other invested assets | 7 | |||||||||||||||
Short term investments | 2,521 | $ | (5 | ) | ||||||||||||
Increase (Decrease) | |||||||||||||||||
| December 31, 2021 | Fair Value Asset (Liability) | Interest Rate Risk | Equity Price Risk | ||||||||||||||
| (In millions) | |||||||||||||||||
| Fixed maturities – long | $ | 7 | |||||||||||||||
| Equity securities – long | 639 | $ | (160) | ||||||||||||||
| – short | (70) | 18 | |||||||||||||||
| Other invested assets | 27 | ||||||||||||||||
| Short term investments | 2,707 | $ | (7) | ||||||||||||||
Other than trading portfolio:
Increase (Decrease) | |||||||||||||||||||||||
| December 31, 2021 | Fair Value Asset (Liability) | Interest Rate Risk | Foreign Currency Risk | Equity Price Risk | |||||||||||||||||||
| (In millions) | |||||||||||||||||||||||
Fixed maturities (a) | $ | 44,373 | $ | (3,061) | $ | (530) | |||||||||||||||||
| Equity securities | 1,035 | (28) | (1) | $ | (66) | ||||||||||||||||||
| Limited partnership investments | 1,933 | (205) | |||||||||||||||||||||
| Other invested assets | 91 | (17) | |||||||||||||||||||||
| Mortgage loans | 1,018 | (44) | |||||||||||||||||||||
| Short term investments | 2,154 | (3) | (37) | ||||||||||||||||||||
| Other derivatives | (12) | 35 | |||||||||||||||||||||
(a)From a financial reporting perspective, Shadow Adjustments related to life and group reserves would reduce the impact of the decrease in fixed maturity securities.
Increase (Decrease) | ||||||||||||||||||
December 31, 2019 | Fair Value Asset (Liability) | Interest Rate Risk | Foreign Currency Risk | Equity Price Risk | ||||||||||||||
(In millions) | ||||||||||||||||||
Fixed maturities (a) | $ | 42,187 | $ | (2,669 | ) | $ | (458 | ) | ||||||||||
Equity securities | 865 | (28 | ) | (3 | ) | $ | (45) | |||||||||||
Limited partnership investments | 2,004 | (238) | ||||||||||||||||
Other invested assets | 65 | (11 | ) | |||||||||||||||
Mortgage loans | 1,025 | (45 | ) | |||||||||||||||
Short term investments | 2,107 | (1 | ) | (27 | ) | |||||||||||||
Interest rate swaps (b) | (8 | ) | 11 | |||||||||||||||
Other derivatives | (7 | ) | 16 | |||||||||||||||
| 72 | ||||||||
Trading portfolio:
Increase (Decrease) | ||||||||||||||
December 31, 2018 | Fair Value Asset (Liability) | Interest Rate Risk | Equity Price Risk | |||||||||||
(In millions) | ||||||||||||||
Fixed maturities – long | $ | 157 | $ | (1 | ) | |||||||||
Equity securities – long | 495 | $ | (124 | ) | ||||||||||
– short | (6 | ) | 2 | |||||||||||
Options – purchased | 18 | 28 | ||||||||||||
– written | (17 | ) | (19 | ) | ||||||||||
Other invested assets | 5 | |||||||||||||
Short term investments | 1,926 | (4 | ) | |||||||||||
| Increase (Decrease) | |||||||||||||||||
| December 31, 2020 | Fair Value Asset (Liability) | Interest Rate Risk | Equity Price Risk | ||||||||||||||
| (In millions) | |||||||||||||||||
| Fixed maturities – long | $ | 42 | |||||||||||||||
| Equity securities – long | 566 | $ | (141) | ||||||||||||||
| – short | (14) | 4 | |||||||||||||||
| Options – purchased | 3 | 6 | |||||||||||||||
| Other invested assets | 21 | ||||||||||||||||
| Short term investments | 2,680 | $ | (6) | ||||||||||||||
Other than trading portfolio:
Increase (Decrease) | ||||||||||||||||||
December 31, 2018 | Fair Value Asset (Liability) | Interest Rate Risk | Foreign Currency Risk | Equity Price Risk | ||||||||||||||
(In millions) | ||||||||||||||||||
Fixed maturities | $ | 39,542 | $ | (2,440 | ) | $ | (406 | ) | ||||||||||
Equity securities | 780 | (29 | ) | (3 | ) | $ | (46) | |||||||||||
Limited partnership investments | 2,424 | (308) | ||||||||||||||||
Other invested assets | 53 | (9 | ) | |||||||||||||||
Mortgage loans | 827 | (36 | ) | |||||||||||||||
Short term investments | 1,943 | (1 | ) | (24 | ) | |||||||||||||
Interest rate swaps (a) | 11 | 22 | ||||||||||||||||
Other derivatives | 4 | 15 | ||||||||||||||||
| Increase (Decrease) | |||||||||||||||||||||||
| December 31, 2020 | Fair Value Asset (Liability) | Interest Rate Risk | Foreign Currency Risk | Equity Price Risk | |||||||||||||||||||
| (In millions) | |||||||||||||||||||||||
Fixed maturities (a) | $ | 44,604 | $ | (2,963) | $ | (513) | |||||||||||||||||
| Equity securities | 992 | (30) | (2) | $ | (57) | ||||||||||||||||||
| Limited partnership investments | 1,798 | (207) | |||||||||||||||||||||
| Other invested assets | 76 | (12) | |||||||||||||||||||||
| Mortgage loans | 1,151 | (51) | |||||||||||||||||||||
| Short term investments | 1,994 | (2) | (26) | ||||||||||||||||||||
Interest rate swaps (b) | (29) | 2 | |||||||||||||||||||||
| Other derivatives | (19) | 20 | |||||||||||||||||||||
(a)From a financial reporting perspective, Shadow Adjustments related to life and group reserves would reduce the impact of the decrease in fixed maturity securities.
(b)The market risk at December 31, 2020 will generally be offset by recognition of the underlying hedged transaction.
| 73 | ||||||||
Item 8. Financial Statements and Supplementary Data.
Financial Statements and Supplementary Data are comprised of the following sections:
Page No. | ||||||
84 | ||||||
85 | ||||||
90 | ||||||
92 | ||||||
93 | ||||||
94 | ||||||
96 | ||||||
98 | ||||||
1. | 98 | |||||
2. | 108 | |||||
3. | 109 | |||||
4. | 114 | |||||
5. | 120 | |||||
6. | 120 | |||||
7. | 122 | |||||
8. | 123 | |||||
9. | 138 | |||||
10. | 139 | |||||
11. | 143 | |||||
12. | 146 | |||||
13. | 147 | |||||
14. | 148 | |||||
15. | 149 | |||||
16. | 155 | |||||
17. | 156 | |||||
18. | 157 | |||||
19. | 157 | |||||
20. | 158 | |||||
| Page No. | |||||
9.Leases | |||||
10.Income Taxes | |||||
11.Debt | |||||
16.Reinsurance | |||||
19.Segments | |||||
| 74 | ||||||||
MANAGEMENT’S REPORT ON INTERNAL CONTROL OVER FINANCIAL REPORTING
Our management is responsible for establishing and maintaining adequate internal control over financial reporting (as defined in Exchange Act Rules
13a-15(f)
and15d-15(f))
for us. Our internal control system was designed to provide reasonable assurance to our management and Board of Directors regarding the preparation and fair presentation of published financial statements.There are inherent limitations to the effectiveness of any control system, however well designed, including the possibility of human error and the possible circumvention or overriding of controls. Further, the design of a control system must reflect the fact that there are resource constraints, and the benefits of controls must be considered relative to their costs. Management must make judgments with respect to the relative cost and expected benefits of any specific control measure. The design of a control system also is based in part upon assumptions and judgments made by management about the likelihood of future events, and there can be no assurance that a control will be effective under all potential future conditions. As a result, even an effective system of internal control over financial reporting can provide no more than reasonable assurance with respect to the fair presentation of financial statements and the processes under which they were prepared.
Our management assessed the effectiveness of our internal control over financial reporting as of December 31, 2019.2021. In making this assessment, management used the criteria set forth by the Committee of Sponsoring Organizations of the Treadway Commission in. Based on this assessment, our management believes that, as of December 31, 2019,2021, our internal control over financial reporting was effective.
Internal Control – Integrated Framework (2013)
Our independent registered public accounting firm, Deloitte & Touche LLP, has issued an audit report on the Company’s internal control over financial reporting. The report of Deloitte & Touche LLP follows this Report.
| 75 | ||||||||
REPORT OF INDEPENDENT REGISTERED PUBLIC ACCOUNTING FIRM
To the shareholders and the Board of Directors of Loews Corporation
Opinion on Internal Control over Financial Reporting
We have audited the internal control over financial reporting of Loews Corporation and subsidiaries (the “Company”) as of December 31, 2019,2021, based on criteria established in Internal Control — Integrated Framework (2013) issued by the Committee of Sponsoring Organizations of the Treadway Commission (COSO). In our opinion, the Company maintained, in all material respects, effective internal control over financial reporting as of December 31, 2019,2021, based on criteria established in Internal Control — Integrated Framework (2013) issued by COSO.
We have also audited, in accordance with the standards of the Public Company Accounting Oversight Board (United States) (PCAOB), the consolidated financial statements as of and for the year ended December 31, 2019,2021, of the Company and our report dated February 11, 2020,8, 2022, expressed an unqualified opinion on those financial statements and included an explanatory paragraph regarding the Company’s change in its method of accounting for recognition and measurement of equity securitiescredit losses on financial instruments in 2018.
2020.Basis for Opinion
The Company’s management is responsible for maintaining effective internal control over financial reporting and for its assessment of the effectiveness of internal control over financial reporting, included in the accompanying management’s reportManagement’s Report on internal controlInternal Control over financial reporting.Financial Reporting. Our responsibility is to express an opinion on the Company’s internal control over financial reporting based on our audit. We are a public accounting firm registered with the PCAOB and are required to be independent with respect to the Company in accordance with the U.S. federal securities laws and the applicable rules and regulations of the Securities and Exchange Commission and the PCAOB.
We conducted our audit in accordance with the standards of the PCAOB. Those standards require that we plan and perform the audit to obtain reasonable assurance about whether effective internal control over financial reporting was maintained in all material respects. Our audit included obtaining an understanding of internal control over financial reporting, assessing the risk that a material weakness exists, testing and evaluating the design and operating effectiveness of internal control based on the assessed risk, and performing such other procedures as we considered necessary in the circumstances. We believe that our audit provides a reasonable basis for our opinion.
Definition and Limitations of Internal Control over Financial Reporting
A company’s internal control over financial reporting is a process designed to provide reasonable assurance regarding the reliability of financial reporting and the preparation of financial statements for external purposes in accordance with generally accepted accounting principles. A company’s internal control over financial reporting includes those policies and procedures that (1) pertain to the maintenance of records that, in reasonable detail, accurately and fairly reflect the transactions and dispositions of the assets of the company; (2) provide reasonable assurance that transactions are recorded as necessary to permit preparation of financial statements in accordance with generally accepted accounting principles, and that receipts and expenditures of the company are being made only in accordance with authorizations of management and directors of the company; and (3) provide reasonable assurance regarding prevention or timely detection of unauthorized acquisition, use, or disposition of the company’s assets that could have a material effect on the financial statements.
Because of its inherent limitations, internal control over financial reporting may not prevent or detect misstatements. Also, projections of any evaluation of effectiveness to future periods are subject to the risk that controls may become inadequate because of changes in conditions, or that the degree of compliance with the policies or procedures may deteriorate.
/s/ DELOITTE & TOUCHE LLP
New York, NY
February 8, 2022
| 76 | ||||||||
REPORT OF INDEPENDENT REGISTERED PUBLIC ACCOUNTING FIRM
To the shareholders and the Board of Directors of Loews Corporation
Opinion on the Financial Statements
We have audited the accompanying consolidated balance sheets of Loews Corporation and subsidiaries (the “Company”) as of December 31, 20192021 and 2018,2020, the related consolidated statements of income,operations, comprehensive income (loss), equity, and cash flows, for each of the three years in the period ended December 31, 2019,2021, and the related notes and the schedules listed in the Index at Item 15 (a) 2 (collectively referred to as the “financial statements”). In our opinion, the financial statements present fairly, in all material respects, the financial position of the Company as of December 31, 20192021 and 2018,2020, and the results of its operations and its cash flows for each of the three years in the period ended December 31, 2019,2021, in conformity with accounting principles generally accepted in the United States of America.
We have also audited, in accordance with the standards of the Public Company Accounting Oversight Board (United States) (PCAOB), the Company’s internal control over financial reporting as of December 31, 2019,2021, based on criteria established in issued by the Committee of Sponsoring Organizations of the Treadway Commission and our report dated February 11, 2020,8, 2022, expressed an unqualified opinion on the Company’s internal control over financial reporting.
Internal Control — Integrated Framework (2013)
Change in Accounting Principle
As discussed in Note 1 to the financial statements, the Company changed its method of accounting for recognition and measurement of equity securitiescredit losses on financial instruments in 2018.
2020.Basis for Opinion
These financial statements are the responsibility of the Company’s management. Our responsibility is to express an opinion on the Company’s financial statements based on our audits. We are a public accounting firm registered with the PCAOB and are required to be independent with respect to the Company in accordance with the U.S. federal securities laws and the applicable rules and regulations of the Securities and Exchange Commission and the PCAOB.
We conducted our audits in accordance with the standards of the PCAOB. Those standards require that we plan and perform the audit to obtain reasonable assurance about whether the financial statements are free of material misstatement, whether due to error or fraud. Our audits included performing procedures to assess the risks of material misstatement of the financial statements, whether due to error or fraud, and performing procedures that respond to those risks. Such procedures included examining, on a test basis, evidence regarding the amounts and disclosures in the financial statements. Our audits also included evaluating the accounting principles used and significant estimates made by management, as well as evaluating the overall presentation of the financial statements. We believe that our audits provide a reasonable basis for our opinion.
Critical Audit Matters
The critical audit matters communicated below are matters arising from the current-period audit of the financial statements that were communicated or required to be communicated to the audit committee and that (1) relate to accounts or disclosures that are material to the financial statements and (2) involved our especially challenging, subjective, or complex judgments. The communication of critical audit matters does not alter in any way our opinion
on the financial statements, taken as a whole, and we are not, by communicating the critical audit matters below, providing separate opinions on the critical audit matters or on the accounts or disclosures to which they relate.
Claim and claim adjustment expense reserves – Property & Casualty — Refer to Notes 1 and 8 to the consolidated financial statements.
Critical Audit Matter Description
The estimation of property and casualty claim and claim adjustment expense reserves (“P&C claim and claim adjustment expense reserves”), including those claims that are incurred but not reported, requires significant judgment. Estimating P&C claim and claim adjustment expense reserves is subject to a high degree of variability as it involves complex
| 77 | ||||||||
estimates that are generally derived using a variety of actuarial estimation techniques and numerous assumptions and expectations about future events, many of which are highly uncertain. Modest changes in judgments and assumptions can materially impact the valuation of these liabilities, particularly for claims with longer-tailed exposures such as workers’ compensation, general liability and professional liability claims.
Given the significant judgments made by management in estimating P&C claim and claim adjustment expense reserves, auditing P&C claim and claim adjustment expense reserves required a high degree of auditor judgment and an increased extent of effort, including the involvement of our actuarial specialists.
How the Critical Audit Matter Was Addressed in the Audit
Our audit procedures related to P&C claim and claim adjustment expense reserves included the following, among others:
◦We developed a range of independent estimates of P&C claim and claim adjustment expense reserves and compared our estimates to the recorded reserves.
◦We compared our prior year estimates of expected incurred losses to actual experience during the most recent year to identify potential bias in the Company’s determination of P&C claim and claim adjustment expense reserves.
Future policy benefit reserves – Long Term Care — Refer to Notes 1 and 8 to the consolidated financial statements.
Critical Audit Matter Description
The estimation of long term care future policy benefit reserves (“LTC future policy benefit reserves”) requires significant judgment in the selection of key assumptions, including morbidity, persistency (inclusive of mortality), discount rate and future premium rate increases.
A gross premium valuation (“GPV”) is performed annually to assess the adequacy of the LTC future policy benefit reserves. The actuarial assumptions underlying the recorded LTC future policy benefit reserves are“locked-in” “locked-in” absent an indicated premium deficiency. If the GPV indicates the recorded LTC future policy benefit reserves are not adequate (i.e. a premium deficiency exists), the assumptions are “unlocked” and the recorded LTC future policy benefit reserves are increased to eliminate the premium deficiency.
Estimating future experience for long term care policies is subject to significant estimation risk becauseas the required projection period spans several decades. Morbidity and persistency experience can be volatile while discount rates and premium rate increases can be difficult to predict. Modest changes in each of these assumptions can materially impact the valuation of these liabilities.
Given the significant judgments made by management in estimating LTC future policy benefit reserves, auditing LTC future policy benefit reserves required a high degree of auditor judgment and an increased extent of effort, including the involvement of our actuarial specialists.
| 78 | ||||||||
How the Critical Audit Matter Was Addressed in the Audit
Our audit procedures related to LTC future policy benefit reserves included the following, among others:
◦We independently recalculated a sample of LTC future policy benefit reserves and compared our estimates to the recorded reserves.
| ◦We evaluated the key assumptions applied in the GPV analysis, including comparing those assumptions |
◦We assessed the Company’s reviewprojection of future cash flows to evaluate the undiscounted probability-weighted cash flow analyses.
adequacy of recorded reserves using “locked-in” assumptions./s/ DELOITTE & TOUCHE LLP
New York, NY
February 8, 2022
We have served as the Company’sCompany's auditor since 1969.
| 79 | ||||||||
Loews Corporation and Subsidiaries
CONSOLIDATED BALANCE SHEETS
| Assets: | |||||||||||
| December 31 | 2021 | 2020 | |||||||||
| (Dollar amounts in millions, except per share data) | |||||||||||
| Investments: | |||||||||||
Fixed maturities, amortized cost of $39,952 and $38,963, less allowance for credit loss of $18 and $40 | $ | 44,380 | $ | 44,646 | |||||||
| Equity securities, cost of $1,546 and $1,456 | 1,674 | 1,561 | |||||||||
| Limited partnership investments | 1,933 | 1,798 | |||||||||
Other invested assets, primarily mortgage loans, less allowance for credit loss of $16 and $26 | 1,091 | 1,165 | |||||||||
| Short term investments | 4,860 | 4,674 | |||||||||
| Total investments | 53,938 | 53,844 | |||||||||
| Cash | 621 | 478 | |||||||||
| Receivables | 9,273 | 7,833 | |||||||||
| Property, plant and equipment | 9,888 | 10,451 | |||||||||
| Goodwill | 349 | 785 | |||||||||
| Deferred non-insurance warranty acquisition expenses | 3,476 | 3,068 | |||||||||
| Deferred acquisition costs of insurance subsidiaries | 737 | 708 | |||||||||
| Other assets | 3,344 | 3,069 | |||||||||
| Total assets | $ | 81,626 | $ | 80,236 | |||||||
December 31 | 2019 | 2018 | ||||||
(Dollar amounts in millions, except per share data) | ||||||||
Investments: | ||||||||
Fixed maturities, amortized cost of $38,157 and $38,234 | $ | $ | 39,699 | |||||
Equity securities, cost of $1,244 and $1,479 | 1,306 | 1,293 | ||||||
Limited partnership investments | 2,004 | 2,424 | ||||||
Other invested assets, primarily mortgage loans | 1,072 | 901 | ||||||
Short term investments | 4,628 | 3,869 | ||||||
Total investments | 51,250 | 48,186 | ||||||
Cash | 336 | 405 | ||||||
Receivables | 7,675 | 7,960 | ||||||
Property, plant and equipment | 15,568 | 15,511 | ||||||
Goodwill | 767 | 665 | ||||||
Deferred non-insurance warranty acquisition expenses | 2,840 | 2,513 | ||||||
Deferred acquisition costs of insurance subsidiaries | 662 | 633 | ||||||
Other assets | 3,145 | 2,443 | ||||||
Total assets | $ | 82,243 | $ | 78,316 | ||||
See Notes to Consolidated Financial Statements.
| 80 | ||||||||
Loews Corporation and Subsidiaries
CONSOLIDATED BALANCE SHEETS
| Liabilities and Equity: | |||||||||||
| December 31 | 2021 | 2020 | |||||||||
| (Dollar amounts in millions, except per share data) | |||||||||||
| Insurance reserves: | |||||||||||
| Claim and claim adjustment expense | $ | 24,174 | $ | 22,706 | |||||||
| Future policy benefits | 13,236 | 13,318 | |||||||||
| Unearned premiums | 5,761 | 5,119 | |||||||||
| Total insurance reserves | 43,171 | 41,143 | |||||||||
| Payable to brokers | 90 | 92 | |||||||||
| Short term debt | 93 | 37 | |||||||||
| Long term debt | 8,986 | 10,072 | |||||||||
| Deferred income taxes | 1,079 | 1,065 | |||||||||
| Deferred non-insurance warranty revenue | 4,503 | 4,023 | |||||||||
| Other liabilities | 4,529 | 4,623 | |||||||||
| Total liabilities | 62,451 | 61,055 | |||||||||
| Commitments and contingent liabilities | 0 | 0 | |||||||||
| Shareholders’ equity: | |||||||||||
| Preferred stock, $0.10 par value: | |||||||||||
| Authorized – 100,000,000 shares | 0 | 0 | |||||||||
| Common stock, $0.01 par value: | |||||||||||
| Authorized – 1,800,000,000 shares | |||||||||||
| Issued – 248,467,051 and 269,360,973 shares | 2 | 3 | |||||||||
| Additional paid-in capital | 2,885 | 3,133 | |||||||||
| Retained earnings | 14,776 | 14,150 | |||||||||
| Accumulated other comprehensive income | 186 | 581 | |||||||||
| 17,849 | 17,867 | ||||||||||
| Less treasury stock, at cost (50,000 and 150,000 shares) | (3) | (7) | |||||||||
| Total shareholders’ equity | 17,846 | 17,860 | |||||||||
| Noncontrolling interests | 1,329 | 1,321 | |||||||||
| Total equity | 19,175 | 19,181 | |||||||||
| Total liabilities and equity | $ | 81,626 | $ | 80,236 | |||||||
December 31 | 2019 | 2018 | ||||||
(Dollar amounts in millions, except per share data) | ||||||||
Insurance reserves: | ||||||||
Claim and claim adjustment expense | $ | 21,720 | $ | 21,984 | ||||
Future policy benefits | 12,311 | 10,597 | ||||||
Unearned premiums | 4,583 | 4,183 | ||||||
Total insurance reserves | 38,614 | 36,764 | ||||||
Payable to brokers | 108 | 42 | ||||||
Short term debt | 77 | 17 | ||||||
Long term debt | 11,456 | 11,359 | ||||||
Deferred income taxes | 1,168 | 841 | ||||||
Deferred non-insurance warranty revenue | 3,779 | 3,402 | ||||||
Other liabilities | 5,111 | 4,505 | ||||||
Total liabilities | 60,313 | 56,930 | ||||||
Commitments and contingent liabilities | ||||||||
Shareholders’ equity: | ||||||||
Preferred stock, $0.10 par value: | ||||||||
Authorized – 100,000,000 shares | ||||||||
Common stock, $0.01 par value: | ||||||||
Authorized – 1,800,000,000 shares | ||||||||
Issued – 291,210,222 and 312,169,189 shares | 3 | 3 | ||||||
Additional paid-in capital | 3,374 | 3,627 | ||||||
Retained earnings | 15,823 | 15,773 | ||||||
Accumulated other comprehensive loss | (68 | ) | (880 | ) | ||||
19,132 | 18,523 | |||||||
Less treasury stock, at cost (240,000 and 100,000 shares) | (13 | ) | (5 | ) | ||||
Total shareholders’ equity | 19,119 | 18,518 | ||||||
Noncontrolling interests | 2,811 | 2,868 | ||||||
Total equity | 21,930 | 21,386 | ||||||
Total liabilities and equity | $ | 82,243 | $ | 78,316 | ||||
See Notes to Consolidated Financial Statements.
| 81 | ||||||||
Loews Corporation and Subsidiaries
CONSOLIDATED STATEMENTS OF INCOME
Year Ended December 31 | 2019 | 2018 | 2017 | |||||||||
(In millions, except per share data) | ||||||||||||
Revenues: | ||||||||||||
Insurance premiums | $ | 7,428 | $ | 7,312 | $ | 6,988 | ||||||
Net investment income | 2,355 | 1,817 | 2,182 | |||||||||
Investment gains (losses): | ||||||||||||
Other-than-temporary impairment losses | (44 | ) | (21 | ) | (14 | ) | ||||||
Other net investment gains (losses) | 93 | (36 | ) | 136 | ||||||||
Total investment gains (losses) | 49 | (57 | ) | 122 | ||||||||
Non-insurance warranty revenue | 1,161 | 1,007 | 390 | |||||||||
Operating revenues and other | 3,938 | 3,987 | 4,053 | |||||||||
Total | 14,931 | 14,066 | 13,735 | |||||||||
Expenses: | ||||||||||||
Insurance claims and policyholders’ benefits | 5,806 | 5,572 | 5,310 | |||||||||
Amortization of deferred acquisition costs | 1,383 | 1,335 | 1,233 | |||||||||
Non-insurance warranty expense | 1,082 | 923 | 299 | |||||||||
Operating expenses and other | 4,950 | 4,828 | 4,665 | |||||||||
Interest | 591 | 574 | 646 | |||||||||
Total | 13,812 | 13,232 | 12,153 | |||||||||
Income before income tax | 1,119 | 834 | 1,582 | |||||||||
Income tax expense | (248 | ) | (128 | ) | (170 | ) | ||||||
Net income | 871 | 706 | 1,412 | |||||||||
Amounts attributable to noncontrolling interests | 61 | (70 | ) | (248 | ) | |||||||
Net income attributable to Loews Corporation | $ | 932 | $ | 636 | $ | 1,164 | ||||||
Basic net income per common share | $ | 3.08 | $ | 1.99 | $ | 3.46 | ||||||
Diluted net income per common share | $ | 3.07 | $ | 1.99 | $ | 3.45 | ||||||
Basic weighted average number of shares outstanding | 302.70 | 319.06 | 336.61 | |||||||||
Diluted weighted average number of shares outstanding | 303.35 | 319.93 | 337.50 | |||||||||
OPERATIONS
| Year Ended December 31 | 2021 | 2020 | 2019 | ||||||||||||||
| (In millions, except per share data) | |||||||||||||||||
| Revenues: | |||||||||||||||||
| Insurance premiums | $ | 8,175 | $ | 7,649 | $ | 7,428 | |||||||||||
| Net investment income | 2,259 | 1,995 | 2,355 | ||||||||||||||
| Investment gains (losses) (Note 2) | 660 | (1,246) | 49 | ||||||||||||||
| Non-insurance warranty revenue | 1,430 | 1,252 | 1,161 | ||||||||||||||
| Operating revenues and other | 2,133 | 2,933 | 3,938 | ||||||||||||||
| Total | 14,657 | 12,583 | 14,931 | ||||||||||||||
| Expenses: | |||||||||||||||||
| Insurance claims and policyholders’ benefits | 6,349 | 6,170 | 5,806 | ||||||||||||||
| Amortization of deferred acquisition costs | 1,443 | 1,410 | 1,383 | ||||||||||||||
| Non-insurance warranty expense | 1,328 | 1,159 | 1,082 | ||||||||||||||
| Operating expenses and other | 2,931 | 4,793 | 4,950 | ||||||||||||||
| Interest | 424 | 515 | 591 | ||||||||||||||
| Total | 12,475 | 14,047 | 13,812 | ||||||||||||||
| Income (loss) before income tax | 2,182 | (1,464) | 1,119 | ||||||||||||||
| Income tax (expense) benefit | (479) | 173 | (248) | ||||||||||||||
| Net income (loss) | 1,703 | (1,291) | 871 | ||||||||||||||
| Amounts attributable to noncontrolling interests | (125) | 360 | 61 | ||||||||||||||
| Net income (loss) attributable to Loews Corporation | $ | 1,578 | $ | (931) | $ | 932 | |||||||||||
| Basic net income (loss) per share | $ | 6.08 | $ | (3.32) | $ | 3.08 | |||||||||||
| Diluted net income (loss) per share | $ | 6.07 | $ | (3.32) | $ | 3.07 | |||||||||||
| Basic weighted average number of shares outstanding | 259.67 | 280.32 | 302.70 | ||||||||||||||
| Diluted weighted average number of shares outstanding | 260.20 | 280.32 | 303.35 | ||||||||||||||
See Notes to Consolidated Financial Statements.
| 82 | ||||||||
Loews Corporation and Subsidiaries
CONSOLIDATED STATEMENTS OF COMPREHENSIVE INCOME (LOSS)
Year Ended December 31 | 2019 | 2018 | 2017 | |||||||||
(In millions) | ||||||||||||
Net income | $ | 871 | $ | 706 | $ | 1,412 | ||||||
Other comprehensive income (loss), after tax Changes in: | ||||||||||||
Net unrealized losses on investments with other-than-temporary impairments | (1 | ) | (14 | ) | (5 | ) | ||||||
Net other unrealized gains (losses) on investments | 949 | (798 | ) | 108 | ||||||||
Total unrealized gains (losses) on investments | 948 | (812 | ) | 103 | ||||||||
Unrealized gains (losses) on cash flow hedges | (11 | ) | 6 | 3 | ||||||||
Pension and postretirement benefits | (68 | ) | (2 | ) | 12 | |||||||
Foreign currency translation | 42 | (84 | ) | 100 | ||||||||
Other comprehensive income (loss) | 911 | (892 | ) | 218 | ||||||||
Comprehensive income (loss) | 1,782 | (186 | ) | 1,630 | ||||||||
Amounts attributable to noncontrolling interests | (38 | ) | 25 | (269 | ) | |||||||
Total comprehensive income (loss) attributable to Loews Corporation | $ | 1,744 | $ | (161 | ) | $ | 1,361 | |||||
| Year Ended December 31 | 2021 | 2020 | 2019 | ||||||||||||||
| (In millions) | |||||||||||||||||
| Net income (loss) | $ | 1,703 | $ | (1,291) | $ | 871 | |||||||||||
| Other comprehensive income (loss), after tax | |||||||||||||||||
| Changes in: | |||||||||||||||||
| Net unrealized losses on investments with an allowance for credit losses | (2) | 0 | 0 | ||||||||||||||
| Net unrealized gains (losses) on other investments | (706) | 720 | 948 | ||||||||||||||
| Total unrealized gains (losses) on investments | (708) | 720 | 948 | ||||||||||||||
| Unrealized gains (losses) on cash flow hedges | 17 | (17) | (11) | ||||||||||||||
| Pension and postretirement benefits | 266 | (24) | (68) | ||||||||||||||
| Foreign currency translation | (20) | 48 | 42 | ||||||||||||||
| Other comprehensive income (loss) | (445) | 727 | 911 | ||||||||||||||
| Comprehensive income (loss) | 1,258 | (564) | 1,782 | ||||||||||||||
| Amounts attributable to noncontrolling interests | (75) | 282 | (38) | ||||||||||||||
| Total comprehensive income (loss) attributable to Loews Corporation | $ | 1,183 | $ | (282) | $ | 1,744 | |||||||||||
See Notes to Consolidated Financial Statements.
| 83 | ||||||||
Loews Corporation and Subsidiaries
CONSOLIDATED STATEMENTS OF EQUITY
Loews Corporation Shareholders | ||||||||||||||||||||||||||||
Accumulated | Common | |||||||||||||||||||||||||||
Additional | Other | Stock | ||||||||||||||||||||||||||
Common | Paid-in | Retained | Comprehensive | Held in | Noncontrolling | |||||||||||||||||||||||
Total | Stock | Capital | Earnings | Income (Loss) | Treasury | Interests | ||||||||||||||||||||||
(In millions) | ||||||||||||||||||||||||||||
Balance, January 1, 2017 | $ | 23,361 | $ | 3 | $ | 3,187 | $ | 15,196 | $ | (223 | ) | $ | - | $ | 5,198 | |||||||||||||
Net income | 1,412 | 1,164 | 248 | |||||||||||||||||||||||||
Other comprehensive income | 218 | 197 | 21 | |||||||||||||||||||||||||
Dividends paid ($0.25 per share) | (223 | ) | (84 | ) | (139 | ) | ||||||||||||||||||||||
Purchases of Loews treasury stock | (237 | ) | (237 | ) | ||||||||||||||||||||||||
Retirement of treasury stock | 1 | (41 | ) | (175 | ) | 217 | ||||||||||||||||||||||
Stock-based compensation | 35 | 2 | 33 | |||||||||||||||||||||||||
Other | (1 | ) | 3 | (5 | ) | 1 | ||||||||||||||||||||||
Balance, December 31, 2017 | $ | 24,566 | $ | 3 | $ | 3,151 | $ | 16,096 | $ | (26 | ) | $ | (20 | ) | $ | 5,362 | ||||||||||||
Cumulative effect adjustments from changes in accounting standards | (91 | ) | (43 | ) | (28 | ) | (20 | ) | ||||||||||||||||||||
Balance, January 1, 2018, as adjusted | 24,475 | 3 | 3,151 | 16,053 | (54 | ) | (20 | ) | 5,342 | |||||||||||||||||||
Net income | 706 | 636 | 70 | |||||||||||||||||||||||||
Other comprehensive loss | (892 | ) | (797 | ) | (95 | ) | ||||||||||||||||||||||
Dividends paid ($0.25 per share) | (201 | ) | (80 | ) | (121 | ) | ||||||||||||||||||||||
Purchase of Boardwalk Pipelines common units | (1,718 | ) | 658 | (29 | ) | (2,347 | ) | |||||||||||||||||||||
Purchases of Loews treasury stock | (1,011 | ) | (1,011 | ) | ||||||||||||||||||||||||
Retirement of treasury stock | - | (195 | ) | (831 | ) | 1,026 | ||||||||||||||||||||||
Stock-based compensation | 31 | 19 | 12 | |||||||||||||||||||||||||
Other | (4 | ) | (6 | ) | (5 | ) | 7 | |||||||||||||||||||||
Balance, December 31, 2018 | $ | 21,386 | $ | 3 | $ | 3,627 | $ | 15,773 | $ | (880 | ) | $ | (5 | ) | $ | 2,868 | ||||||||||||
| Loews Corporation Shareholders | |||||||||||||||||||||||||||||||||||||||||
| Total | Common Stock | Additional Paid-in Capital | Retained Earnings | Accumulated Other Comprehensive Income (Loss) | Common Stock Held in Treasury | Noncontrolling Interests | |||||||||||||||||||||||||||||||||||
| (In millions) | |||||||||||||||||||||||||||||||||||||||||
| Balance, January 1, 2019 | $ | 21,386 | $ | 3 | $ | 3,627 | $ | 15,773 | $ | (880) | $ | (5) | $ | 2,868 | |||||||||||||||||||||||||||
| Net income | 871 | 932 | (61) | ||||||||||||||||||||||||||||||||||||||
| Other comprehensive income | 911 | 812 | 99 | ||||||||||||||||||||||||||||||||||||||
| Dividends paid ($0.25 per share) | (174) | (76) | (98) | ||||||||||||||||||||||||||||||||||||||
| Purchase of subsidiary stock from noncontrolling interests | (23) | (23) | |||||||||||||||||||||||||||||||||||||||
| Purchases of Loews Corporation treasury stock | (1,059) | (1,059) | |||||||||||||||||||||||||||||||||||||||
| Retirement of treasury stock | — | (248) | (803) | 1,051 | |||||||||||||||||||||||||||||||||||||
| Stock-based compensation | 27 | 4 | 23 | ||||||||||||||||||||||||||||||||||||||
| Other | (9) | (9) | (3) | 3 | |||||||||||||||||||||||||||||||||||||
| Balance, December 31, 2019, as reported | $ | 21,930 | $ | 3 | $ | 3,374 | $ | 15,823 | $ | (68) | $ | (13) | $ | 2,811 | |||||||||||||||||||||||||||
| Cumulative effect adjustment from change in accounting standards (Note 1) | (5) | (5) | |||||||||||||||||||||||||||||||||||||||
| Balance, January 1, 2020, as adjusted | 21,925 | 3 | 3,374 | 15,818 | (68) | (13) | 2,811 | ||||||||||||||||||||||||||||||||||
| Net loss | (1,291) | (931) | (360) | ||||||||||||||||||||||||||||||||||||||
| Other comprehensive income | 727 | 649 | 78 | ||||||||||||||||||||||||||||||||||||||
| Dividends paid ($0.25 per share) | (169) | (70) | (99) | ||||||||||||||||||||||||||||||||||||||
| Deconsolidation of Diamond Offshore | (1,087) | (1,087) | |||||||||||||||||||||||||||||||||||||||
| Purchase of subsidiary stock from noncontrolling interests | (37) | 5 | (42) | ||||||||||||||||||||||||||||||||||||||
| Purchases of Loews Corporation treasury stock | (917) | (917) | |||||||||||||||||||||||||||||||||||||||
| Retirement of treasury stock | — | (256) | (667) | 923 | 0 | ||||||||||||||||||||||||||||||||||||
| Stock-based compensation | 26 | 8 | 18 | ||||||||||||||||||||||||||||||||||||||
| Other | 4 | 2 | 0 | 2 | |||||||||||||||||||||||||||||||||||||
| Balance, December 31, 2020 | $ | 19,181 | $ | 3 | $ | 3,133 | $ | 14,150 | $ | 581 | $ | (7) | $ | 1,321 | |||||||||||||||||||||||||||
See Notes to Consolidated Financial Statements.
| 84 | ||||||||
Loews Corporation and Subsidiaries
CONSOLIDATED STATEMENTS OF EQUITY
Loews Corporation Shareholders | ||||||||||||||||||||||||||||
Accumulated | Common | |||||||||||||||||||||||||||
Additional | Other | Stock | ||||||||||||||||||||||||||
Common | Paid-in | Retained | Comprehensive | Held in | Noncontrolling | |||||||||||||||||||||||
Total | Stock | Capital | Earnings | Income (Loss) | Treasury | Interests | ||||||||||||||||||||||
(In millions) | ||||||||||||||||||||||||||||
Balance, December 31, 2018 | $ | 21,386 | $ | 3 | $ | 3,627 | $ | 15,773 | $ | (880 | ) | $ | (5 | ) | $ | 2,868 | ||||||||||||
Net income | 871 | 932 | (61 | ) | ||||||||||||||||||||||||
Other comprehensive income | 911 | 812 | 99 | |||||||||||||||||||||||||
Dividends paid ($0.25 per share) | (174 | ) | (76 | ) | (98 | ) | ||||||||||||||||||||||
Purchase of subsidiary stock from noncontrolling interests | | (23 | ) | (23 | ) | |||||||||||||||||||||||
Purchases of Loews treasury stock | (1,059 | ) | (1,059 | ) | ||||||||||||||||||||||||
Retirement of treasury stock | - | (248 | ) | (803 | ) | 1,051 | ||||||||||||||||||||||
Stock-based compensation | 27 | 4 | 23 | |||||||||||||||||||||||||
Other | (9 | ) | (9 | ) | (3 | ) | 3 | |||||||||||||||||||||
Balance, December 31, 2019 | $ | 21,930 | $ | 3 | $ | 3,374 | $ | 15,823 | $ | (68 | ) | $ | (13 | ) | $ | 2,811 | ||||||||||||
| Loews Corporation Shareholders | |||||||||||||||||||||||||||||||||||||||||
| Total | Common Stock | Additional Paid-in Capital | Retained Earnings | Accumulated Other Comprehensive Income (Loss) | Common Stock Held in Treasury | Noncontrolling Interests | |||||||||||||||||||||||||||||||||||
| (In millions) | |||||||||||||||||||||||||||||||||||||||||
| Balance, December 31, 2020 | $ | 19,181 | $ | 3 | $ | 3,133 | $ | 14,150 | $ | 581 | $ | (7) | $ | 1,321 | |||||||||||||||||||||||||||
| Net income | 1,703 | 1,578 | 125 | ||||||||||||||||||||||||||||||||||||||
| Other comprehensive loss | (445) | (395) | (50) | ||||||||||||||||||||||||||||||||||||||
| Dividends paid ($0.25 per share) | (129) | (65) | (64) | ||||||||||||||||||||||||||||||||||||||
| Purchase of subsidiary stock from noncontrolling interests | (18) | (18) | |||||||||||||||||||||||||||||||||||||||
| Purchases of Loews Corporation treasury stock | (1,132) | (1,132) | |||||||||||||||||||||||||||||||||||||||
| Retirement of treasury stock | — | (1) | (246) | (889) | 1,136 | ||||||||||||||||||||||||||||||||||||
| Stock-based compensation | 15 | (2) | 17 | ||||||||||||||||||||||||||||||||||||||
| Other | — | 2 | (2) | ||||||||||||||||||||||||||||||||||||||
| Balance, December 31, 2021 | $ | 19,175 | $ | 2 | $ | 2,885 | $ | 14,776 | $ | 186 | $ | (3) | $ | 1,329 | |||||||||||||||||||||||||||
See Notes to Consolidated Financial Statements.
| 85 | ||||||||
Loews Corporation and Subsidiaries
CONSOLIDATED STATEMENTS OF CASH FLOWS
Year Ended December 31 | 2019 | 2018 | 2017 | |||||||||
(In millions) | ||||||||||||
Operating Activities: | ||||||||||||
Net income | $ | 871 | $ | 706 | $ | 1,412 | ||||||
Adjustments to reconcile net income to net cash provided (used) by operating activities: | ||||||||||||
Investment (gains) losses | (49 | ) | 57 | (122) | ||||||||
Equity method investees | 20 | 572 | 25 | |||||||||
Amortization of investments | (89 | ) | (70 | ) | (40) | |||||||
Depreciation and amortization | 943 | 912 | 874 | |||||||||
Asset impairments | 99 | 44 | 106 | |||||||||
Provision for deferred income taxes | 70 | 86 | (47) | |||||||||
Other non-cash items | 87 | 72 | 164 | |||||||||
Changes in operating assets and liabilities, net: | ||||||||||||
Receivables | 114 | (131 | ) | 93 | ||||||||
Deferred acquisition costs | (26 | ) | (6 | ) | (24) | |||||||
Insurance reserves | 358 | 482 | 22 | |||||||||
Other assets | (356 | ) | (102 | ) | (95) | |||||||
Other liabilities | 193 | (102 | ) | 114 | ||||||||
Trading securities | (494 | ) | 1,702 | 108 | ||||||||
Net cash flow provided by operating activities | 1,741 | 4,222 | 2,590 | |||||||||
Investing Activities: | ||||||||||||
Purchases of fixed maturities | (8,661 | ) | (10,785 | ) | (9,065) | |||||||
Proceeds from sales of fixed maturities | 5,842 | 8,408 | 5,438 | |||||||||
Proceeds from maturities of fixed maturities | 2,997 | 2,370 | 3,641 | |||||||||
Purchases of limited partnership investments | (198 | ) | (420 | ) | (171) | |||||||
Proceeds from sales of limited partnership investments | 742 | 470 | 212 | |||||||||
Purchases of property, plant and equipment | (1,041 | ) | (995 | ) | (1,031) | |||||||
Acquisitions | (257 | ) | (37 | ) | (1,218) | |||||||
Dispositions | 140 | 113 | 79 | |||||||||
Change in short term investments | (57 | ) | (339 | ) | (167) | |||||||
Other, net | (178 | ) | (229 | ) | (373) | |||||||
Net cash flow used by investing activities | (671 | ) | (1,444 | ) | (2,655) | |||||||
| Year Ended December 31 | 2021 | 2020 | 2019 | ||||||||||||||
| (In millions) | |||||||||||||||||
| Operating Activities: | |||||||||||||||||
| Net income (loss) | $ | 1,703 | $ | (1,291) | $ | 871 | |||||||||||
Adjustments to reconcile net income (loss) to net cash provided (used) by operating activities: | |||||||||||||||||
| Investment (gains) losses | (660) | 1,246 | (49) | ||||||||||||||
| Equity method investees | (74) | 102 | 20 | ||||||||||||||
| Amortization of investments | (81) | (67) | (89) | ||||||||||||||
| Depreciation and amortization | 515 | 734 | 943 | ||||||||||||||
| Asset impairments | 10 | 810 | 99 | ||||||||||||||
| Provision for deferred income taxes | 213 | (235) | 70 | ||||||||||||||
| Other non-cash items | 71 | 61 | 87 | ||||||||||||||
| Changes in operating assets and liabilities, net: | |||||||||||||||||
| Receivables | (1,409) | (425) | 114 | ||||||||||||||
| Deferred acquisition costs | (30) | (43) | (26) | ||||||||||||||
| Insurance reserves | 2,463 | 1,681 | 358 | ||||||||||||||
| Other assets | (946) | (513) | (356) | ||||||||||||||
| Other liabilities | 897 | 256 | 193 | ||||||||||||||
| Trading securities | (49) | (571) | (494) | ||||||||||||||
| Net cash flow provided by operating activities | 2,623 | 1,745 | 1,741 | ||||||||||||||
| Investing Activities: | |||||||||||||||||
| Purchases of fixed maturities | (9,307) | (10,269) | (8,661) | ||||||||||||||
| Proceeds from sales of fixed maturities | 3,816 | 5,904 | 5,842 | ||||||||||||||
| Proceeds from maturities of fixed maturities | 4,464 | 3,760 | 2,997 | ||||||||||||||
| Purchases of equity securities | (304) | (452) | (186) | ||||||||||||||
| Proceeds from sales of equity securities | 316 | 355 | 214 | ||||||||||||||
| Purchases of limited partnership investments | (440) | (224) | (198) | ||||||||||||||
| Proceeds from sales of limited partnership investments | 307 | 398 | 742 | ||||||||||||||
| Purchases of property, plant and equipment | (482) | (710) | (1,041) | ||||||||||||||
| Acquisitions | 0 | (58) | (257) | ||||||||||||||
| Dispositions | 80 | 65 | 140 | ||||||||||||||
| Sale of interest in Altium Packaging | 417 | 0 | 0 | ||||||||||||||
| Deconsolidation of Diamond Offshore | 0 | (483) | 0 | ||||||||||||||
| Change in short term investments | (141) | 427 | (57) | ||||||||||||||
| Other, net | 87 | (127) | (206) | ||||||||||||||
| Net cash flow used by investing activities | $ | (1,187) | $ | (1,414) | $ | (671) | |||||||||||
| 86 | ||||||||
Loews Corporation and Subsidiaries
CONSOLIDATED STATEMENTS OF CASH FLOWS
Year Ended December 31 | 2019 | 2018 | 2017 | |||||||||
(In millions) | ||||||||||||
Financing Activities: | ||||||||||||
Dividends paid | $ | (76 | ) | $ | (80 | ) | $ | (84) | ||||
Dividends paid to noncontrolling interests | (98 | ) | (121 | ) | (139) | |||||||
Purchase of Boardwalk Pipeline common units | (1,504 | ) | ||||||||||
Purchases of Loews treasury stock | (1,051 | ) | (1,026 | ) | (216) | |||||||
Purchases of subsidiary stock from noncontrolling interests | (23 | ) | ||||||||||
Principal payments on debt | (1,956 | ) | (1,043 | ) | (2,411) | |||||||
Issuance of debt | 2,076 | 865 | 3,067 | |||||||||
Other, net | (16 | ) | 74 | (16) | ||||||||
| Net cash flow (used) provided by financing activities | (1,144 | ) | (2,835 | ) | 201 | |||||||
Effect of foreign exchange rate on cash | 5 | (10 | ) | 9 | ||||||||
Net change in cash | (69 | ) | (67 | ) | 145 | |||||||
Cash, beginning of year | 405 | 472 | 327 | |||||||||
Cash, end of year | $ | 336 | $ | 405 | $ | 472 | ||||||
| Year Ended December 31 | 2021 | 2020 | 2019 | ||||||||||||||
| (In millions) | |||||||||||||||||
| Financing Activities: | |||||||||||||||||
| Dividends paid | $ | (65) | $ | (70) | $ | (76) | |||||||||||
| Dividends paid to noncontrolling interests | (64) | (99) | (98) | ||||||||||||||
| Purchases of Loews Corporation treasury stock | (1,136) | (923) | (1,051) | ||||||||||||||
| Purchases of subsidiary stock from noncontrolling interests | (18) | (37) | (23) | ||||||||||||||
| Principal payments on debt | (1,193) | (1,726) | (1,956) | ||||||||||||||
| Issuance of debt | 1,199 | 2,659 | 2,076 | ||||||||||||||
| Other, net | (12) | (2) | (16) | ||||||||||||||
| Net cash flow used by financing activities | (1,289) | (198) | (1,144) | ||||||||||||||
| Effect of foreign exchange rate on cash | (4) | 9 | 5 | ||||||||||||||
| Net change in cash | 143 | 142 | (69) | ||||||||||||||
| Cash, beginning of year | 478 | 336 | 405 | ||||||||||||||
| Cash, end of year | $ | 621 | $ | 478 | $ | 336 | |||||||||||
See Notes to Consolidated Financial Statements.
| 87 | ||||||||
Loews Corporation and Subsidiaries
NOTES TO CONSOLIDATED FINANCIAL STATEMENTS
Note 1. Summary of Significant Accounting Policies
Basis of presentation
On April 1, 2021, Loews Corporation sold 47% of Altium Packaging LLC (“Altium Packaging”), previously a 99% owned subsidiary.In the second quarter of 2020, Diamond Offshore Drilling, Inc. (“Diamond Offshore”), previously a 53% owned subsidiary, was deconsolidated from the Company’s consolidated financial statements. See Note 2 for further discussion.
Accounting estimates and principles of consolidation
Investments
available-for-sale
or trading, and as such, they are carried at fair value. Short term investments are carried at fair value. Changes in fair value of trading securities are reported within Net investment income on the Consolidated Statements of available-for-sale
securities are reported as a component of Other comprehensive income.The cost of fixed maturity securities classified asIncome.Operations. The amortization of premium and accretion of discount for fixed maturity securities takes into consideration call and maturity dates that produce the lowest yield.
available-for-sale
is adjusted for amortization of premiums and accretion of discounts, which are included in Net investment income on the Consolidated Statements of For asset-backed securities included in fixed maturity securities, the Company recognizes income is recognized using an effective yield based on anticipated prepayments and the estimated economic life of the securities. When estimates of prepayments change, the effective yield is recalculated to reflect actual payments to date and anticipated future payments.
payments predominantly using the retrospective method.To the extent that unrealized gains on fixed maturity securities supporting structured settlements not funded by annuities were realized, or that unrealized gains on fixed maturity securities supporting long term care products and structured settlements not funded by annuities would result in a premium deficiency if those gains were realized, a related increase in Insurance reserves is recorded, net of tax and noncontrolling interests, as a reduction of net unrealized gains through Other comprehensive income (“Shadow Adjustments”). Shadow Adjustments increased $1.0 billiondecreased $265 million (after tax and noncontrolling interests) and decreased $298increased $515 million (after tax and noncontrolling interests) for the years ended December 31, 20192021 and 2018.2020. As of December 31, 20192021 and 2018,2020, net unrealized gains on investments included in Accumulated other comprehensive income (“AOCI”) were correspondingly reduced by Shadow Adjustments of $2.0 billion$2.2 billion (after tax and $964 millionnoncontrolling interests) and $2.5 billion (after tax and noncontrolling interests).
Equity securities are carried at fair value. CNA’snon-redeemableNon-redeemable preferred stock investments contain characteristics of debt securities, are priced similarly to bonds and are held primarily for income generation through periodic dividends. While recognition of gains and losses on these securities is not discretionary, CNA does not consider the changes in fair value of. T
non-redeemable
preferred stock are not considered to be reflective of its primary operations. As such, the changes in the fair value of these securities are recorded through Investment gains (losses)| 88 | ||||||||
The Company’s carrying value of investments in limited partnerships is its share of the net asset value of each partnership, as determined by the general partner. Certain partnerships for which results are not available on a timely basis are reported on a lag, primarily three months or less. These investments are accounted for under the equity method and changes in net asset values are recorded within Net investment income on the Consolidated Statements of Income.
Operations.Mortgage loans are commercial in nature, are carried at unpaid principal balance, net of unamortized fees and any valuationan allowance for expected credit losses, and are recorded once funded. The allowance for expected credit losses on mortgage loans is developed by assessing the credit quality of pools of mortgage loans in good standing using debt service coverage ratios (“DSCR”) and loan-to-value (“LTV”) ratios. The DSCR compares a property’s net operating income to its debt service payments, including principal and interest. The LTV ratio compares the current unpaid principal balance of the loan to the estimated fair value of the underlying property collateralizing the loan. The pools developed to measure the credit loss allowance use increments of DSCR and LTV to draw distinctions between risk levels. Expected credit loss rates are applied by pool to the outstanding receivable balances. Changes in the allowance for mortgage loans are presented as a component of Investment gains (losses) on the Consolidated Statements of Operations. Mortgage loans are included in Other invested assets on the Consolidated Balance Sheets. Prior to 2020, mortgage loans were evaluated on an individual loan basis considering the collection experience of each loan and other credit quality indicators such as DSCR and the credit-worthiness of the borrower or tenants of credit tenant loan properties. Mortgage loans were considered to be impaired and a loss incurred when it was probable that contractual principal and interest payments would not be collected and any impairment losses were recognized as a direct write-down of amortized cost. Interest income from mortgage loans is recognized on an accrual basis using the effective yield method. Mortgage loans are considered to be impaired loans when it is probable that contractual principal and interest payments will not be collected. CNA evaluates loans for impairment on an individual loan basis and identifies loans for evaluation of impairment based on the collection experience of each loan and other credit quality indicators such as debt service coverage ratio and the creditworthiness of the borrower or tenants of credit tenant loan properties. Accrual of income is generally suspended for mortgage loans that are impaired and collection of principal and interest payments is unlikely. Mortgage loans are considered past due when full principal or interest payments have not been received according to contractual terms. As of December 31, 2019 and 2018, there were no loans past due or in
Investments in derivative securities are carried at fair value with changes in fair value reported as a component of Investment gains (losses), Income (loss) from trading portfolio,Net investment income or Other comprehensive income (loss), depending on their hedge designation. A derivative is typically defined as an instrument whose value is “derived” from an underlying instrument, index or rate, has a notional amount, requires little or no initial investment and can be net settled. Derivatives include but are not limited to, the following types of investments: interest rate swaps, interest rate caps and floors, put and call options, warrants, futures, forwards, commitments to purchase securities, credit default swaps and combinations of the foregoing. Derivatives embedded within
non-derivative
instruments (such as call options embedded in convertible bonds) must be split from the host instrument when the embedded derivative is not clearly and closely related to the host instrument.Anpreviously recorded other-than-temporary impairment (“OTTI”) losses, otherwise defined as an unrealized loss.allowance for credit losses. When a security is impaired, the impairmentit is evaluated to determine whether itthere is temporaryan intent to sell the security before recovery of amortized cost or other-than-temporary.When the decline in value is determined by the Companywhether a credit loss exists. Losses on securities that are intended to be other-than-temporary, lossessold are recognized as impairment losses within Investment gains (losses) on the Consolidated Statements of Income.Operations. If a credit loss exists, an allowance is established and the corresponding amount is recognized as an impairment loss within Investment gains (losses) on the Consolidated Statements of Operations. The allowance for credit losses related to available-for-sale fixed maturity securities is the difference between the present value of cash flows expected to be collected and the amortized cost basis. In subsequent periods, the allowance is reviewed, with any changes in the allowance presented as a component of Investment gains (losses) on the Consolidated Statements of Operations. Changes in the difference between the amortized cost basis, net of the allowance, and the fair value, are recognized in Other comprehensive income.
available-for-sale
security is impaired if the fair value of the security is less than its cost adjusted for accretion, amortization and Significant judgment is required in the determination of whether an OTTIimpairment loss has occurred for a security. CNA follows aA consistent and systematic process is followed for determining and recording an OTTIimpairment loss, including the evaluation of securities in an unrealized loss position and securities with an allowance for credit losses on at least a quarterly basis.
| 89 | ||||||||
Prior to 2020, the assessment of whether an impairment loss occurred also incorporated both quantitative and qualitative information. Fixed maturity securities in an unrealized loss position for which there was an intent to sell, or more likely than not would be required to be sold before recovery of amortized cost, were considered to be impaired and the entire difference between the amortized cost basis and fair value of the security was recognized as an impairment loss in earnings as a direct write-down of amortized cost. The remaining fixed maturity securities in an unrealized loss position were evaluated to determine if a credit loss existed. If a credit loss was determined to exist, the credit loss was recognized in earnings as a direct write-down of amortized cost.
Credit losses - The allowances for credit losses on fixed maturity securities, mortgage loans, reinsurance receivables, insurance receivables and trade receivables are valuation accounts that are reported as a reduction of a financial asset’s cost basis and are measured on a pool basis when similar risk characteristics exist. The allowance is estimated using relevant available information from both internal and external sources. Historical credit loss experience provides the basis for the estimation of expected credit losses and adjustments may be made to reflect current conditions and reasonable and supportable forecasts. Adjustments to historical loss information are made for additional factors that come to the Company’s attention. This could include significant shifts in counterparty financial strength ratings, aging of past due receivables, amounts sent to collection agencies, or other underlying portfolio changes. Current and forecast economic conditions are considered, using a variety of economic metrics and forecast indices. The sensitivity of expected credit losses relative to changes to the forecast of economic conditions can vary by financial asset class. A reasonable and supportable forecast period is up to 24 months from the balance sheet date. After the forecast period, the Company reverts to historical credit experience. Collateral arrangements such as letters of credit and amounts held in beneficiary trusts to mitigate credit risk are considered in the estimate of the net amount expected to be collected. Amounts are written off against the allowance when determined to be uncollectible. Prior to 2020, the allowance for doubtful accounts for reinsurance, insurance and trade receivables was measured using an incurred loss methodology.
A policy election has been made to present accrued interest balances separately from the amortized cost basis of assets, and a practical expedient has been elected to exclude the accrued interest from the tabular disclosures for mortgage loans and available-for-sale securities. An election has been made not to estimate an allowance for credit losses on accrued interest receivables. The accrual of interest income is discontinued and the asset is placed on nonaccrual status within 90 days of the interest becoming delinquent. Interest accrued but not received for assets on nonaccrual status is reversed through Net investment income. Interest received for assets that are on nonaccrual status is recognized as payment is received. The asset is returned to accrual status when the principal and interest amounts contractually due are brought current, and future payments are expected. Interest receivables are presented in Receivables on the Consolidated Balance Sheet.
Equity method investments
Loews Hotels &
Co
has
interests in operating joint ventures related to hotel properties over which it exercises significant influence, but does not have control over them.
Co
uses
the equity method
of accounting for these investments
Corporation’s sale of 47% of Altium Packaging to GIC, Singapore’s sovereign wealth fund, Loews Corporation’s investment in theseAltium Packaging is accounted for under the equity method of accounting. See Note 2 for further discussion. The Company’s total investment in entities accounted for under the equity method of accounting, excluding limited partnership investments, was $
$734 million and $
$299 million
as of
December
31, 2021 and
2020 and is reported in Other assets on the Consolidated Balance Sheets. Equity income (loss) for these investments accounted for under the equity method of accounting, excluding limited partnerships, was $
$26 million, $
$(73) million and $
$69 million for the years ended December
31,and
Year Ended December 31 | 2019 | 2018 | ||||||
(In millions) | ||||||||
Total assets | $ 2,261 | $ 1,924 | ||||||
Total liabilities | 1,727 | 1,451 | ||||||
Year Ended December 31 | 2019 | 2018 | 2017 | |||||||||
Revenues | $ 804 | $ 731 | $ 731 | |||||||||
Net income | 106 | 114 | 261 | |||||||||
Hedging
Securities lending activities
| 90 | ||||||||
Securities lending is typically done on a matched-book basis where the collateral is invested to substantially match the term of the loan. This matching of terms tends to limit risk. In accordance with the Company’s lending agreements, securities on loan are returned immediately to the Company upon notice. Collateral is not reflected as an asset of the Company. There was no collateral held at December 31, 20192021 and 2018.
Revenue recognition
Property and casualty contracts that are retrospectively rated or subject to audit premiums contain provisions that result in an adjustment to the initial policy premium depending on the contract provisions. These provisions andstipulate the adjustment due to loss experience of the insured during the experience period.coverage period, or changes in the level of exposure to insurance risk. For such contracts, CNA estimates the amount of ultimate premiums that it may earn upon completion of the experiencecoverage period and recognizes either an asset or a liability for the difference between the initial policy premium and the estimated ultimate premium. CNA either adjusts such estimated ultimate premium amounts during the course of the experiencecoverage period based on actual results to date.date or by conducting premium audits after the policy has expired to determine the final exposure to insured risks. The resulting adjustment is recorded as either a reduction of or an increase to the earned premiums for the period.
Insurance receivables include balances due currently or in the future, including amounts due from insureds related to paid losses under high deductible policies, and are presented at unpaid balances, net of an allowance for doubtful accounts. As of December 31, 2021, an allowance for doubtful accounts of $29 million for insurance receivables has been established using a loss rate methodology to determine expected credit losses for premium receivables. This methodology uses CNA’s historical annual credit losses relative to gross premium written to develop a range of credit loss rates for each dollar of gross written premium underwritten. Additionally, an expected credit loss for amounts due from insureds under high deductible and retrospectively rated policies is calculated on a pool basis, informed by historical default rate data obtained from major rating agencies. Changes in the allowance are presented as a component of Other operating expenses on the Consolidated Statements of Operations. Amounts are considered past due based on policy payment terms. Insurance receivables and any related allowance are written off after collection efforts are exhausted or a negotiated settlement is reached.
CNA’sNon-insurance Non-insurance warranty revenue is is reported on a gross basis, with amounts paid by customers reported asIncome.Prior to 2018,Non-insurancewarranty revenue was recognized net of dealer costs and earned based on the estimated claims emergence pattern over the contract period.Operations. Additionally, CNA provides warranty administration services for dealer and manufacturer warranty products.
non-insurance
warranty revenues are primarily generated from separately-priced service contracts that provide mechanical breakdown and other coverages to vehicle or consumer goods owners, which generally provide coverage from one month to ten years. For warranty products where CNA acts as the principal in the transaction,Non-insurance
warranty revenue and commissions paid to agents reported asNon-insurance
warranty expense on the Consolidated Statements of Non-insurance
revenues are recognized when obligations under the terms of the contract with CNA’s customers are satisfied, which is generally over time as obligations are fulfilled. CNA recognizesnon-insurance
warranty revenue over the service period in proportion to the actuarially determined expected claims emergence pattern. Customers predominantly pay in full at the inception of the warranty contract. The liability for unearned warranty revenue, reported as Deferrednon-insurance
warranty revenue on the Consolidated Balance Sheets, represents the unearned portion of revenue in advance of CNA’s performance, including amounts which are refundable upon cancellation.Contract costs to obtain or fulfill
non-insurance
warranty contracts with customers are deferred and recorded as Deferrednon-insurance
warranty acquisition expenses on the Consolidated Balance Sheets. These costs are expected to be recoverable over the term of the contract and are amortized in the same manner the related revenue is recognized. CNA evaluates deferred costs for recoverability including consideration of anticipated investment income. Adjustments to deferred costs, if necessary, are recorded in the current period results of operations.Diamond Offshore’s contract drilling revenues primarily resultresulted from providing a drilling rig and the crew and supplies necessary to operate the rig, mobilizing and demobilizing the rig to and from the drill site and performing rig preparation activities and/or modifications required for the contract. Consideration received for performing these activities may consist of dayrate drilling revenue, mobilization and demobilization revenue, contract preparation revenue and reimbursement revenue for the purchase of supplies, equipment, personnel services and other services requested by the customer. Diamond Offshore accountsaccounted for these integrated services provided within its drilling contracts as a single performance obligation satisfied over time and comprised of a series of distinct time increments in which drilling services are provided. The total transaction price iswas determined for each individual contract by estimating both fixed and variable consideration expected to be earned over the term of the contract. The standard contract term rangesranged from two to 60 months.
| 91 | ||||||||
Boardwalk Pipelines primarily earns revenues by providing transportation and storage services for natural gas and natural gas liquids and hydrocarbons (referred to together as “NGLs”) on a firm and interruptible basis and provides interruptible natural gas parking and lending services. The majority of Boardwalk Pipelines’ operating subsidiaries are subject to Federal Energy Regulatory Commission (“FERC”) regulations and certain revenues collected, under certain circumstances, may be subject to possible refunds to its customers. An estimated refund liability is recorded considering regulatory proceedings, advice of counsel and estimated total exposure. The majority of Boardwalk Pipelines’ revenues are from firm service contracts which are accounted for as a single promise to stand ready each month of the contract term to provide the committed capacity for either transportation or storage services. The transaction price is comprised of a fixed fee based on the capacity reserved plus a usage fee paid on the volume of commodity transported or injected and withdrawn from storage. Both the fixed and the usage fees are allocated to the single performance obligation of providing transportation or storage service and recognized over time as control is passed to the customer. These service contracts can range in term from one to 20 years and are invoiced monthly.
Loews Hotels & Co provides lodging and related goods and services as well as management and marketing services. Lodging and related revenues are recognized as the guest takes possession of the goods or receives the services. Management and marketing services revenues are recognized as the services are provided and billed on a monthly basis. In addition, Loews Hotels & Co recognizes revenue for the reimbursement of payroll and other expenses as they are incurred on behalf of the owners of joint venture and managed hotel properties.
Altium Packaging is a packaging solutions provider and manufacturer in North America, serving a diverse customer base in the pharmaceutical, dairy, household chemicals, food/nutraceuticals, industrial/specialty chemicals, water and beverage/juice segments. Altium Packaging recognizes revenue when obligations under the terms of a contract with a customer have been satisfied. This occurs at the time control is transferred to the customer, there is persuasive evidencewhich generally occurs upon delivery or completion of an arrangement, the sales price is fixed and determinable and collection is reasonably assured.
Claim and claim adjustment expense reserves
Claim and claim adjustment expense reserves are presented net of anticipated amounts due from insureds related to losses under deductible policies of $1.1 billion and $1.2 billion as of December 31, 20192021 and 2018.2020. A significant portion of these amounts are supported by collateral. CNA also has an allowance for uncollectible deductible amounts, which is presented as a component of the allowance for doubtful accounts included in Receivables on the Consolidated Balance Sheets.
Structured settlements have been negotiated for certain property and casualty insurance claims. Structured settlements are agreements to provide fixed periodic payments to claimants. CNA’s obligations for structured settlements not funded by annuities are included in claim and claim adjustment expense reserves and carriedare discounted at present values determined usinga weighted average interest rates ranging from 5.5% to 7.6%20192021 and 2018.2020. As of December 31, 20192021 and 2018,2020, the discounted reserves for unfunded structured settlements were $497$503 million and $512$520 million, net of discount of $724$621 million and $760$657 million. For the years ended December 31, 2019, 20182021, 2020 and 2017,2019, the amount of interest recognized on the discounted reserves of unfunded structured settlements was $36 million, $40$35 million and $41$36 million. This interest accretion is presented as a component of Insurance claims and policyholders’ benefits on the Consolidated Statements of IncomeOperations but is excluded from the disclosure of prior year loss reserve development.
rate of 6.4% and 5.5%to8.0%
6.5% as of December 31, Workers’ compensation lifetime claim reserves are calculated using mortality assumptions determined through statutory regulation and economic factors. AtAs of December 31, 20192021 and 2018,2020, workers’ compensation lifetime claim reserves are discounted at a 3.5% interest rate. As of December 31, 20192021 and 2018,2020, the discounted reserves for workers’ compensation lifetime claim reserves were $293$228 million and $343$258 million, net of discount of $135$97 million and $168$113 million. For the years ended December 31, 2019, 20182021, 2020 and 2017,2019, the amount of interest accretion recognized on the discounted reserves of workers’ compensation lifetime claim reserves was $21$12 million, $16$15 million and $19$21 million. This interest accretion is presented as a component of Insurance claims and policyholders’ benefits on the Consolidated Statements of Income,Operations, but is excluded from the Company’s disclosure of prior year loss reserve development.
| 92 | ||||||||
Long term care claim reserves for policyholders that are currently receiving benefits are calculated using mortality and morbidity assumptions based on CNA and industry experience. LongThese long term care claim reserves are discounted interest rate of 5.9% and 6.0%5.8% as of December 31,20192018. 2020. As of December 31, 20192021 and 2018,2020, such discounted reserves totaled $2.7 billion, and $2.6 billion, net of discountdiscounts of $462$428 million and $460$439 million.
at
a
weighted average 2021 and
Future policy benefit reserves
These
assumptions policy; however if
a premium deficiencyare
unlocked, and the future policy benefit reservesare
September 30, 2019
2021gross premium valuation (“GPV”) indicated the recorded reserves included a premium deficiencymargin of $216 million and future policy benefit reserves at that date were increased accordingly. As a result, the
weighted average
interest rate of In circumstances where the cash flow projections supporting future policy benefit reserves are expected to result in profits being recognized in early future years followed by losses in later future years, the future policy benefit reserves are increased in the future profitable years by an amount necessary to offset losses that are projected to be recognized in later future years. The amount of theCNA has not recorded additional future policy benefit reserves recorded in each period is determinedfor profits followed by applying the ratio of the present value of future losses divided by the present value of future profits from the most recently completed GPV to long term care core income in that period.
Reinsurance
Reinsurance receivables related to paid losses are presented at unpaid balances. Reinsurance receivables related to unpaid losses are estimated in a manner consistent with claim and claim adjustment expense reserves or future policy benefit reserves. Reinsurance receivables are reported net of an allowance for doubtful accounts on the Consolidated Balance Sheets. The cost of reinsurance is primarily accounted for over the life of the underlying reinsured policies using assumptions consistent with those used to account for the underlying policies or over the reinsurance contract period. The ceding of insurance does not discharge the primary liability of CNA.
Amounts are considered past due based on the reinsurance contract terms. Reinsurance receivables related to paid losses and any related allowance are written off after collection efforts have been exhausted or a negotiated settlement is reached with the reinsurer. Reinsurance receivables from insolvent insurers related to paid losses are written off when the settlement due from the estate can be reasonably estimated. At the time reinsurance receivables related to paid losses are written off, any required adjustment to reinsurance receivables related to unpaid losses is recorded as a component of Insurance claims and policyholders’ benefits on the Consolidated Statements of Income.Operations.
| 93 | ||||||||
A loss portfolio transfer is a retroactive reinsurance contract. If the cumulative claim and allocated claim adjustment expenses ceded under a loss portfolio transfer exceed the consideration paid, the resulting gain from such excess is deferred and amortized into earnings in future periods in proportion to actual recoveries under the loss portfolio transfer. In any period in which there is a revised estimate of claim and allocated claim adjustment expenses and the loss portfolio transfer is in a gain position, the deferred gain is recalculated as if the revised estimate was available at the inception date of the loss portfolio transfer and the change in the deferred gain is recognized in earnings.
Deferred acquisition costs
CNA evaluates deferred acquisition costs for recoverability. Anticipated investment income is considered in the determination of the recoverability of deferred acquisition costs. Adjustments, if necessary, are recorded in current period results of operations.
Policyholder dividends
Policyholder dividends are paid to participating policyholders within the
Goodwill and other intangible assets
Other intangible assets are reported within Other assets. Finite-lived intangible assets are amortized over their estimated useful lives. Indefinite-lived other intangible assets are tested for impairment annually or when certain triggering events require such tests. See Note 7 for additional information on the Company’s goodwill and other intangible assets.
Property, plant and equipment
The principal service lives used in computing provisions for depreciation are as follows:
| Years | |||||||||||
| Pipeline equipment | 30 | to | 50 | ||||||||
| Hotel properties and other | 3 | to | 40 | ||||||||
Impairment of long-lived assets
Assets to be disposed of and assets not expected to provide any future service potential to the Company are recorded at the lower of carrying amount or fair value less cost to sell.
Income taxes
| 94 | ||||||||
The Company recognizes uncertain tax positions that it has taken or expects to take on a tax return. The tax benefit of a qualifying position is the largest amount of tax benefit that is greater than 50% likely of being realized upon ultimate settlement with a taxing authority having full knowledge of all relevant information. See Note 10 for additional information on the provision for income taxes.
Pension and postretirement benefits
Stock-based compensation
Net income per share
For each of the years ended December 31, 2021 and 2019, 2018 and 2017, approximately 0.7 million, 0.90.5 million and 0.90.7 million potential shares attributable to issuances and exercises under the Loews Corporation 2016 Incentive Compensation
Plan and the prior plan were included in the calculation of diluted net income per share. For the years ended December 31, 2019share, and 2018, there were 0no shares and forattributable to employee stock-based compensation awards excluded from the calculation of diluted net income per share because the effect would have been antidilutive.
For the year ended December 31, 2017,2020, 0.1 million potential shares attributable to issuances and exercises under the Loews Corporation 2016 Incentive Compensation Plan and the prior plan were excluded from the calculation of diluted net income per share because the effect would have been antidilutive due to the net loss position of the Company. In addition, there were 0.40.2 million shares attributable to employee stock-based compensation awards excluded from the calculation of diluted net income per share because the effect would have been antidilutive.
Foreign currency
Regulatory accounting
Supplementary cash flow information
| 95 | ||||||||
Accounting changes
On January 1, 2020, the Company adopted the updated accounting guidance using thea modified retrospective method.method with a cumulative effect adjustment recorded to beginning Retained earnings. Prior period amounts have not been adjusted and continue to be reported in accordance with the previous accounting guidance. The Company utilized the package of practical expedients allowing the Company to not reassess whether any expired or existing contracts contain a lease, the classification for any expired or existing leases or the initial direct costs for any existing leases. The Company has also elected to apply an exemption for short term leases whereby leases with initial lease terms of one year or less are not recorded on the balance sheet.
available-for-sale
The allowance for doubtful accounts for reinsurance, insurance and trade receivables was unchanged as a result of adopting the guidance will haveupdated guidance. At adoption, an allowance for credit losses of $6 million was established for available-for-sale fixed maturity securities that were PCD assets, with a corresponding increase to amortized cost, resulting in no adjustment to the carrying value of the securities.
See the accounting policy discussion within this note as well as Note 3 for additional information on its financial statements and determined that the impact at the date of adoption will not be material.
Recently issued ASUs – In August of 2018, the FASB issued ASU“Financial “Financial Services – Insurance (Topic 944): Targeted Improvements to the Accounting for Long-Duration Contracts.” The updated accounting guidance requires changes to the measurement and disclosure of long-duration contracts. The guidance requires entitiesEntities will be required to update annually cash flow assumptions including(including morbidity and persistency,persistency) at least annually, and to update quarterly discount rate assumptions using an upper-medium grade fixed-income instrument yield. The effect of changes in cash flow assumptions will be recorded in Net income and the effect of changes in discount rate assumptions will be recorded in Other comprehensive income
2018-12,
(“OCI”). ThisThe guidance is effective for interim and annual periods beginning after December 15, 2021. 2022, with early adoption permitted, and may be applied using either a modified retrospective transition method or a full retrospective transition method. Restatement of prior periods presented is required.
The Company will adopt the new guidance oneffective January 1, 2022.2023, using the modified retrospective method applied as of the transition date of January 1, 2021. The guidance requires restatementmost significant impact at the transition date will be the effect of prior periods presented.updating the discount rate assumption to reflect an upper-medium grade fixed-income instrument yield, which will be partially offset by the de-recognition of shadow adjustments associated with long duration contracts. The Company is currently evaluatingexpects the methodnet impact of adoption andthese changes will be a material decrease in AOCI as of the effect the updated guidance will have on its consolidated financial statements, including increased disclosure requirements.transition date. The annual updating ofrequirement to update cash flow assumptions at least annually is expected to increase income statement volatility. The quarterly change in the discount rate is expected to increase volatility inpattern of earnings emergence being recognized. Adoption will also significantly expand the Company’s Shareholders’ equity, but thatdisclosures, and will be somewhat mitigated because Shadow Adjustments are eliminated under the new guidance.impact systems, processes, and controls. While the requirements of the new guidance represent a material change from existing accounting guidance, the new guidance will not impact capital and surplus under statutory accounting practices, related cash flows, or the underlying economics of CNA’s businessthe business.
The Company continues to make progress in connection with these matters and related cash flows are unchanged.
Note 2. AcquisitionsDivestitures and Divestitures
Altium Packaging
On June 29, 2018, Boardwalk GP, LP (“General Partner”), the general partnerApril 1, 2021, Loews Corporation sold 47% of Boardwalk PipelinesAltium Packaging to GIC, Singapore’s sovereign wealth fund, for $420 million in cash consideration. Loews Corporation shares certain participating rights with GIC related to capital allocation and an indirect wholly owned subsidiary of the Company, elected to exercise its right to purchase all of the issued and outstanding common units representing limited partnership interests in Boardwalk Pipelinesnot already ownedother decisions by the General Partner or its affiliates pursuant to Section 15.1(b) of Boardwalk Pipelines’ Third Amended and Restated Agreement of Limited Partnership, as amended (“Limited Partnership Agreement”) for a cash purchase price, determinedAltium Packaging. Therefore, in accordance with Accounting Standards Codification 810
| 96 | ||||||||
(“ASC 810”), “Consolidation,” Altium Packaging was deconsolidated from Loews Corporation’s consolidated financial statements. Effective April 1, 2021, Loews Corporation’s investment in Altium Packaging is accounted for under the Limited Partnership Agreement,equity method of $12.06 per unit, or approximately $1.5 billion,accounting, with the investment reported in Other assets on the aggregate. Consolidated Balance Sheets and equity income (loss) reported in Operating expenses and other on the Consolidated Statements of Operations.
The purchase pricetransaction resulted in a gain of $555 million ($438 million after tax) for the common unitsyear ended December 31, 2021, which is recorded in Investment gains (losses) on the Consolidated Statement of Operations. Loews Corporation’s retained investment in Altium Packaging was lower thanrecorded at an estimated fair value of $473 million. The difference between the fair value of Loews Corporation’s retained investment in Altium Packaging and Loews Corporation’s 52.7% share of the carrying value of Altium Packaging’s net assets was attributed to finite lived intangible assets and goodwill. The amortization of the noncontrolling interests for Boardwalk Pipelines, resultingamounts attributed to finite lived intangible assets will be recognized as a component of equity income (loss) reported in an increase to Additionalpaid-incapitalOperating expenses and other on the Consolidated Statements of $658Operations. The assets and liabilities deconsolidated from the Consolidated Balance Sheets were property, plant and equipment of $490 million, an increase to deferred income taxgoodwill of $436 million, intangible assets of $488 million, other assets of approximately $370 million, long term debt of $1.1 billion and other liabilities of $approximately $380 million.
Diamond Offshore
As a decrease to AOCI of $29 million.
Loews Hotels & Co
Net investment income is as follows:
Year Ended December 31 | 2019 | 2018 | 2017 | |||||||||
(In millions) | ||||||||||||
Fixed maturity securities | $ | 1,817 | $ | 1,795 | $ | 1,812 | ||||||
Limited partnership investments | 204 | 22 | 277 | |||||||||
Short term investments | 52 | 43 | 18 | |||||||||
Equity securities | 85 | 18 | 12 | |||||||||
Income (loss) from trading portfolio (a) | 216 | (54 | ) | 87 | ||||||||
Other | 56 | 54 | 35 | |||||||||
Total investment income | 2,430 | 1,878 | 2,241 | |||||||||
Investment expenses | (75 | ) | (61 | ) | (59 | ) | ||||||
Net investment income | $ | 2,355 | $ | 1,817 | $ | 2,182 | ||||||
| Year Ended December 31 | 2021 | 2020 | 2019 | ||||||||||||||
| (In millions) | |||||||||||||||||
| Fixed maturity securities | $ | 1,707 | $ | 1,728 | $ | 1,817 | |||||||||||
| Limited partnership investments | 375 | 127 | 204 | ||||||||||||||
| Short term investments | 2 | 10 | 52 | ||||||||||||||
| Equity securities | 83 | 65 | 85 | ||||||||||||||
Income from trading portfolio (a) | 106 | 83 | 216 | ||||||||||||||
| Other | 61 | 58 | 56 | ||||||||||||||
| Total investment income | 2,334 | 2,071 | 2,430 | ||||||||||||||
| Investment expenses | (75) | (76) | (75) | ||||||||||||||
| Net investment income | $ | 2,259 | $ | 1,995 | $ | 2,355 | |||||||||||
(a) | Net | |||||
As of December 31, 2019, the Company held less than $1 million ofnon-incomeproducing fixed maturity securities.
2020, no investments in a single issuer exceeded 10% of shareholders’ equity, other than investments in securities issued by the U.S.
Treasuryand obligations of government-sponsored enterprises.
| 97 | ||||||||
Investment gains (losses) are as follows:
Year Ended December 31 | 2019 | 2018 | 2017 | |||||||||
(In millions) | ||||||||||||
Fixed maturity securities | $ | (6 | ) | $ | 4 | $ | 122 | |||||
Equity securities | 66 | (74 | ) | |||||||||
Derivative instruments | (11 | ) | 9 | (4 | ) | |||||||
Short term investments and other | 4 | 4 | ||||||||||
Investment gains (losses) (a) | $ | 49 | $ | (57 | ) | $ | 122 | |||||
| Year Ended December 31 | 2021 | 2020 | 2019 | ||||||||||||||
| (In millions) | |||||||||||||||||
| Fixed maturity securities: | |||||||||||||||||
| Gross gains | $ | 186 | $ | 220 | $ | 125 | |||||||||||
| Gross losses | (90) | (220) | (131) | ||||||||||||||
| Investment gains (losses) on fixed maturity securities | 96 | — | (6) | ||||||||||||||
| Equity securities | 4 | (3) | 66 | ||||||||||||||
| Derivative instruments | 6 | (10) | (11) | ||||||||||||||
| Short term investments and other | 14 | (22) | 0 | ||||||||||||||
| Altium Packaging (see Note 2) | 555 | 0 | 0 | ||||||||||||||
| Diamond Offshore (see Note 2) | (15) | (1,211) | 0 | ||||||||||||||
| Investment gains (losses) (a) | $ | 660 | $ | (1,246) | $ | 49 | |||||||||||
| (a) | For the years ended December 31, 2021, 2020 and 2019, $66 of investment end of | ||||
| 98 | ||||||||
The following tables present the activity related to the allowance on available-for-sale securities with credit impairments and PCD assets. Accrued interest receivable on available-for-sale fixed maturity securities totaled $369 million and $371 million as of December 31, 2021 and December 31, 2020 and is excluded from the estimate of expected credit losses and the amortized cost basis in the tables within this Note.
| Year Ended December 31, 2021 | Corporate and Other Bonds | Asset-backed | Total | ||||||||||||||
| (In millions) | |||||||||||||||||
| Allowance for credit losses: | |||||||||||||||||
| Balance as of January 1, 2021 | $ | 23 | $ | 17 | $ | 40 | |||||||||||
| Additions to the allowance for credit losses: | |||||||||||||||||
| Securities for which credit losses were not previously recorded | 14 | 0 | 14 | ||||||||||||||
| Available-for-sale securities accounted for as PCD assets | 5 | 6 | 11 | ||||||||||||||
| Reductions to the allowance for credit losses: | |||||||||||||||||
| Securities sold during the period (realized) | 7 | 17 | 24 | ||||||||||||||
| Write-offs charged against the allowance | 16 | 0 | 16 | ||||||||||||||
Additional increases or (decreases) to the allowance for credit losses on securities that had an allowance recorded in a previous period | (8) | 1 | (7) | ||||||||||||||
| Total allowance for credit losses | $ | 11 | $ | 7 | $ | 18 | |||||||||||
| Year Ended December 31, 2020 | |||||||||||||||||
| Allowance for credit losses: | |||||||||||||||||
| Balance as of January 1, 2020 | $ | — | $ | — | $ | — | |||||||||||
| Additions to the allowance for credit losses: | |||||||||||||||||
| Impact of adopting ASC 326 | 6 | 0 | 6 | ||||||||||||||
| Securities for which credit losses were not previously recorded | 67 | 12 | 79 | ||||||||||||||
| Available-for-sale securities accounted for as PCD assets | 5 | 0 | 5 | ||||||||||||||
| Reductions to the allowance for credit losses: | |||||||||||||||||
| Securities sold during the period (realized) | 22 | 0 | 22 | ||||||||||||||
Intent to sell or more likely than not will be required to sell the security before recovery of its amortized cost basis | 1 | 0 | 1 | ||||||||||||||
Additional increases or (decreases) to the allowance for credit losses on securities that had an allowance recorded in a previous period | (32) | 5 | (27) | ||||||||||||||
| Total allowance for credit losses | $ | 23 | $ | 17 | $ | 40 | |||||||||||
Year Ended December 31 | 2019 | 2018 | 2017 | |||||||||
(In millions) | ||||||||||||
Fixed maturity securities | $ | 2,620 | $ | (1,811 | ) | $ | 728 | |||||
Equity securities (a) | 32 | |||||||||||
Other | (2 | ) | ||||||||||
Total net change in unrealized gains (losses) on investments | $ | 2,620 | $ | (1,811 | ) | $ | 758 | |||||
| 99 | ||||||||
The components of OTTIavailable-for-sale impairment losses recognized in earnings by asset type are as follows:
Year Ended December 31 | 2019 | 2018 | 2017 | |||||||||
(In millions) | ||||||||||||
Fixed maturity securities available-for-sale: | ||||||||||||
Corporate and other bonds | $ | 33 | $ | 12 | $ | 12 | ||||||
Asset-backed | 11 | 9 | 1 | |||||||||
Total fixed maturity securities available-for-sale | 44 | 21 | 13 | |||||||||
Equity securities available-for-sale | 1 | |||||||||||
Net OTTI losses recognized in earnings | $ | 44 | $ | 21 | $ | 14 | ||||||
presented in the following table. The table includes losses on securities with an intention to sell and changes in the allowance for credit losses on securities since acquisition date:
| Year Ended December 31 | 2021 | 2020 | 2019 | ||||||||||||||
| (In millions) | |||||||||||||||||
| Fixed maturity securities available-for-sale: | |||||||||||||||||
| Corporate and other bonds | $ | 11 | $ | 87 | $ | 33 | |||||||||||
| Asset-backed | 20 | 24 | 11 | ||||||||||||||
| Impairment losses recognized in earnings | $ | 31 | $ | 111 | $ | 44 | |||||||||||
Gains of $10 million and losses of $21 million were recognized for the years ended December 31, 2021 and 2020 related to mortgage loans primarily due to changes in expected credit losses.
The net change in unrealized gains (losses) on investments, which consists solely of the change in unrealized gains on fixed maturity securities, was $(1.3) billion, $1.6 billion and $2.6 billion for the years ended December 31, 2021, 2020 and 2019.
The amortized cost and fair values of fixed maturity and equity securities are as follows:
December 31, 2019 | Cost Amortized Cost | Gross Unrealized Gains | Gross Unrealized Loss es | Estimated Fair Value | Unrealized OTTI (Gains) | |||||||||||||||
(In millions) | ||||||||||||||||||||
Fixed maturity securities: | ||||||||||||||||||||
Corporate and other bonds | $ | 19,789 | $ | 2,292 | $ | 32 | $ | 22,049 | ||||||||||||
States, municipalities and political subdivisions | 9,093 | 1,559 | 10,652 | |||||||||||||||||
Asset-backed: | ||||||||||||||||||||
Residential mortgage-backed | 4,387 | 133 | 1 | 4,519 | $ | ) | ||||||||||||||
Commercial mortgage-backed | 2,265 | 86 | 5 | 2,346 | 1 | |||||||||||||||
Other asset-backed | 1,925 | 41 | 4 | 1,962 | (3 | ) | ||||||||||||||
Total asset-backed | 8,577 | 260 | 10 | 8,827 | (19) | |||||||||||||||
U.S. Treasury and obligations of government- | 146 | 1 | 2 | 145 | ||||||||||||||||
Foreign government | 491 | 14 | 1 | 504 | ||||||||||||||||
Redeemable preferred stock | 10 | 10 | ||||||||||||||||||
Fixed maturities available-for-sale | 38,106 | 4,126 | 45 | 42,187 | (19) | |||||||||||||||
Fixed maturities trading | 51 | 2 | 53 | |||||||||||||||||
Total fixed maturities | $ | 38,157 | $ | 4,128 | $ | 45 | $ | 42,240 | $ (19) | |||||||||||
| December 31, 2021 | Cost or Amortized Cost | Gross Unrealized Gains | Gross Unrealized Losses | Allowance for Credit Losses | Estimated Fair Value | ||||||||||||||||||||||||
| (In millions) | |||||||||||||||||||||||||||||
| Fixed maturity securities: | |||||||||||||||||||||||||||||
| Corporate and other bonds | $ | 21,444 | $ | 2,755 | $ | 56 | $ | 11 | $ | 24,132 | |||||||||||||||||||
| States, municipalities and political subdivisions | 10,358 | 1,599 | 14 | 0 | 11,943 | ||||||||||||||||||||||||
| Asset-backed: | |||||||||||||||||||||||||||||
| Residential mortgage-backed | 2,893 | 71 | 8 | 0 | 2,956 | ||||||||||||||||||||||||
| Commercial mortgage-backed | 1,987 | 63 | 19 | 0 | 2,031 | ||||||||||||||||||||||||
| Other asset-backed | 2,561 | 54 | 10 | 7 | 2,598 | ||||||||||||||||||||||||
| Total asset-backed | 7,441 | 188 | 37 | 7 | 7,585 | ||||||||||||||||||||||||
| U.S. Treasury and obligations of government sponsored enterprises | 132 | 1 | 3 | 0 | 130 | ||||||||||||||||||||||||
| Foreign government | 570 | 15 | 2 | 0 | 583 | ||||||||||||||||||||||||
| Fixed maturities available-for-sale | 39,945 | 4,558 | 112 | 18 | 44,373 | ||||||||||||||||||||||||
| Fixed maturities trading | 7 | 0 | 0 | 0 | 7 | ||||||||||||||||||||||||
| Total fixed maturity securities | $ | 39,952 | $ | 4,558 | $ | 112 | $ | 18 | $ | 44,380 | |||||||||||||||||||
| 100 | ||||||||
December 31, 2018 | Cost or Amortized Cost | Gross Unrealized Gains | Gross Losses | Estimated Fair Value | Unrealized OTTI Losses (Gains) | |||||||||||||||
(In millions) | ||||||||||||||||||||
Fixed maturity securities: | ||||||||||||||||||||
Corporate and other bonds | $ | 18,764 | $ | 791 | $ | 395 | $ | 19,160 | ||||||||||||
States, municipalities and political subdivisions | 9,681 | 1,076 | 9 | 10,748 | ||||||||||||||||
Asset-backed: | ||||||||||||||||||||
Residential mortgage-backed | 4,815 | 68 | 57 | 4,826 | $ (20 | ) | ||||||||||||||
Commercial mortgage-backed | 2,200 | 28 | 32 | 2,196 | ||||||||||||||||
Other asset-backed | 1,975 | 11 | 24 | 1,962 | ||||||||||||||||
Total asset-backed | 8,990 | 107 | 113 | 8,984 | (20 | ) | ||||||||||||||
U.S. Treasury and obligations of government-sponsored enterprises | 156 | 3 | 159 | |||||||||||||||||
Foreign government | 480 | 5 | 4 | 481 | ||||||||||||||||
Redeemable preferred stock | 10 | 10 | ||||||||||||||||||
Fixed maturities available-for-sale | 38,081 | 1,982 | 521 | 39,542 | (20 | ) | ||||||||||||||
Fixed maturities trading | 153 | 4 | 157 | |||||||||||||||||
Total fixed maturities | $ | 38,234 | $ | 1,986 | $ | 521 | $ | 39,699 | $ | (20 | ) | |||||||||
| December 31, 2020 | Cost or Amortized Cost | Gross Unrealized Gains | Gross Unrealized Losses | Allowance for Credit Losses | Estimated Fair Value | ||||||||||||||||||||||||
| (In millions) | |||||||||||||||||||||||||||||
| Fixed maturity securities: | |||||||||||||||||||||||||||||
| Corporate and other bonds | $ | 20,792 | $ | 3,578 | $ | 22 | $ | 23 | $ | 24,325 | |||||||||||||||||||
| States, municipalities and political subdivisions | 9,729 | 1,863 | 0 | 0 | 11,592 | ||||||||||||||||||||||||
| Asset-backed: | |||||||||||||||||||||||||||||
| Residential mortgage-backed | 3,442 | 146 | 1 | 0 | 3,587 | ||||||||||||||||||||||||
| Commercial mortgage-backed | 1,933 | 93 | 42 | 17 | 1,967 | ||||||||||||||||||||||||
| Other asset-backed | 2,179 | 81 | 9 | 0 | 2,251 | ||||||||||||||||||||||||
| Total asset-backed | 7,554 | 320 | 52 | 17 | 7,805 | ||||||||||||||||||||||||
| U.S. Treasury and obligations of government sponsored enterprises | 339 | 2 | 3 | 0 | 338 | ||||||||||||||||||||||||
| Foreign government | 512 | 32 | 0 | 0 | 544 | ||||||||||||||||||||||||
| Fixed maturities available-for-sale | 38,926 | 5,795 | 77 | 40 | 44,604 | ||||||||||||||||||||||||
| Fixed maturities trading | 37 | 5 | 0 | 42 | |||||||||||||||||||||||||
| Total fixed maturity securities | $ | 38,963 | $ | 5,800 | $ | 77 | $ | 40 | $ | 44,646 | |||||||||||||||||||
| 101 | ||||||||
The
available-for-sale
securities in a gross unrealized loss position for which an allowance for credit losses has not been recorded are as follows:Less than 12 Months | 12 Months or Longer | Total | ||||||||||||||||||||||
December 31, 2019 | Estimated Fair V alue | Gross Unrealized Losses | Estimated Fair Value | Gross Unrealized Losses | Estimated Fair Value | Gross Unrealized Losses | ||||||||||||||||||
(In millions ) | ||||||||||||||||||||||||
Fixed maturity securities: | ||||||||||||||||||||||||
Corporate and other bonds | $ | 914 | $ | 21 | $ | 186 | $ | 11 | $ | 1,100 | $ | 32 | ||||||||||||
States, municipalities and political subdivisions | 34 | 34 | ||||||||||||||||||||||
Asset-backed: | ||||||||||||||||||||||||
Residential mortgage-backed | 249 | 1 | 30 | 279 | 1 | |||||||||||||||||||
Commercial mortgage-backed | 381 | 3 | 20 | 2 | 401 | 5 | ||||||||||||||||||
Other asset-backed | 449 | 3 | 33 | 1 | 482 | 4 | ||||||||||||||||||
Total asset-backed | 1,079 | 7 | 83 | 3 | 1,162 | 10 | ||||||||||||||||||
U.S. Treasury and obligations of government-sponsored enterprises | 62 | 2 | 2 | 64 | 2 | |||||||||||||||||||
Foreign government | 59 | 1 | 1 | 60 | 1 | |||||||||||||||||||
Total fixed maturity securities | $ | 2,148 | $ | 31 | $ | 272 | $ | 14 | $ | 2,420 | $ | 45 | ||||||||||||
December 31, 2018 | ||||||||||||||||||||||||
Fixed maturity securities: | ||||||||||||||||||||||||
Corporate and other bonds | $ | 8,543 | $ | 340 | $ | 825 | $ | 55 | $ | 9,368 | $ | 395 | ||||||||||||
States, municipalities and political subdivisions | 517 | 8 | 5 | 1 | 522 | 9 | ||||||||||||||||||
Asset-backed: | ||||||||||||||||||||||||
Residential mortgage-backed | 1,932 | 23 | 1,119 | 34 | 3,051 | 57 | ||||||||||||||||||
Commercial mortgage-backed | 728 | 10 | 397 | 22 | 1,125 | 32 | ||||||||||||||||||
Other asset-backed | 834 | 21 | 125 | 3 | 959 | 24 | ||||||||||||||||||
Total asset-backed | 3,494 | 54 | 1,641 | 59 | 5,135 | 113 | ||||||||||||||||||
U.S. Treasury and obligations of government-sponsored enterprises | 21 | 19 | 40 | |||||||||||||||||||||
Foreign government | 114 | 2 | 124 | 2 | 238 | 4 | ||||||||||||||||||
Total fixed maturity securities | $ | 12,689 | $ | 404 | $ | 2,614 | $ | 117 | $ | 15,303 | $ | 521 | ||||||||||||
| Less than 12 Months | 12 Months or Longer | Total | |||||||||||||||||||||||||||||||||
| December 31, 2021 | Estimated Fair Value | Gross Unrealized Losses | Estimated Fair Value | Gross Unrealized Losses | Estimated Fair Value | Gross Unrealized Losses | |||||||||||||||||||||||||||||
| (In millions) | |||||||||||||||||||||||||||||||||||
| Fixed maturity securities: | |||||||||||||||||||||||||||||||||||
| Corporate and other bonds | $ | 2,389 | $ | 48 | $ | 136 | $ | 8 | $ | 2,525 | $ | 56 | |||||||||||||||||||||||
| States, municipalities and political subdivisions | 730 | 14 | 0 | 0 | 730 | 14 | |||||||||||||||||||||||||||||
| Asset-backed: | |||||||||||||||||||||||||||||||||||
| Residential mortgage-backed | 1,043 | 8 | 0 | 0 | 1,043 | 8 | |||||||||||||||||||||||||||||
| Commercial mortgage-backed | 527 | 7 | 167 | 12 | 694 | 19 | |||||||||||||||||||||||||||||
| Other asset-backed | 840 | 10 | 62 | 0 | 902 | 10 | |||||||||||||||||||||||||||||
| Total asset-backed | 2,410 | 25 | 229 | 12 | 2,639 | 37 | |||||||||||||||||||||||||||||
| U.S. Treasury and obligations of government-sponsored enterprises | 69 | 3 | 5 | 0 | 74 | 3 | |||||||||||||||||||||||||||||
| Foreign government | 97 | 2 | 0 | 0 | 97 | 2 | |||||||||||||||||||||||||||||
| Total fixed maturity securities | $ | 5,695 | $ | 92 | $ | 370 | $ | 20 | $ | 6,065 | $ | 112 | |||||||||||||||||||||||
| December 31, 2020 | |||||||||||||||||||||||||||||||||||
| Fixed maturity securities: | |||||||||||||||||||||||||||||||||||
| Corporate and other bonds | $ | 609 | $ | 21 | $ | 12 | $ | 1 | $ | 621 | $ | 22 | |||||||||||||||||||||||
| States, municipalities and political subdivisions | 33 | 0 | 0 | 0 | 33 | 0 | |||||||||||||||||||||||||||||
| Asset-backed: | |||||||||||||||||||||||||||||||||||
| Residential mortgage-backed | 71 | 1 | 11 | 0 | 82 | 1 | |||||||||||||||||||||||||||||
| Commercial mortgage-backed | 533 | 40 | 28 | 2 | 561 | 42 | |||||||||||||||||||||||||||||
| Other asset-backed | 344 | 9 | 13 | 0 | 357 | 9 | |||||||||||||||||||||||||||||
| Total asset-backed | 948 | 50 | 52 | 2 | 1,000 | 52 | |||||||||||||||||||||||||||||
| U.S. Treasury and obligations of government-sponsored enterprises | 63 | 3 | 0 | 0 | 63 | 3 | |||||||||||||||||||||||||||||
| Foreign government | 13 | 0 | 0 | 0 | 13 | 0 | |||||||||||||||||||||||||||||
| Total fixed maturity securities | $ | 1,666 | $ | 74 | $ | 64 | $ | 3 | $ | 1,730 | $ | 77 | |||||||||||||||||||||||
Based on current facts and circumstances, the Company believes the unrealized losses presented in the December 31, 20192021 securities in a gross unrealized loss position table above are not believed to be indicative of the ultimate collectibilitycollectability of the current amortized cost of the securities, but rather are attributable to changes in interest rates, credit spreads and other
factors. The Company hasThere is no current intent to sell securities with unrealized losses, nor is it more likely than not that itsale will be required to sell prior to recovery of amortized cost; accordingly, the Company hasit was determined that there are 0no additional OTTIimpairment losses to be recorded at December 31, 2019.2021.
| 102 | ||||||||
Contractual Maturity
The following table presents the activity related to the pretax credit loss component reflected in Retained earnings on fixed maturity securities still held at December 31, 2019, 2018 and 2017 for which a portion of an OTTI loss was recognized in Other comprehensive income.
Year Ended December 31 | 2019 | 2018 | 2017 | |||||||||
(In millions) | ||||||||||||
Beginning balance of credit losses on fixed maturity securities | $ | 18 | $ | 27 | $ | 36 | ||||||
Reductions for securities sold during the period | (8 | ) | (9 | ) | (9 | ) | ||||||
Ending balance of credit losses on fixed maturity securities | $ | 10 | $ | 18 | $ | 27 | ||||||
available-for-sale
fixed maturity securities by contractual maturity.December 31 | 2019 | 2018 | ||||||||||||||
Cost Cost | Estimated Fair Value | Cost Cost | Estimated Fair Value | |||||||||||||
(In millions) | ||||||||||||||||
Due in one year or less | $ | 1,334 | $ | 1,356 | $ | 1,350 | $ | 1,359 | ||||||||
Due after one year through five years | 9,746 | 10,186 | 7,979 | 8,139 | ||||||||||||
Due after five years through ten years | 14,892 | 15,931 | 16,859 | 16,870 | ||||||||||||
Due after ten years | 12,134 | 14,714 | 11,893 | 13,174 | ||||||||||||
Total | $ | 38,106 | $ | 42,187 | $ | 38,081 | $ | 39,542 | ||||||||
| December 31 | 2021 | 2020 | |||||||||||||||||||||
| Cost or Amortized Cost | Estimated Fair Value | Cost or Amortized Cost | Estimated Fair Value | ||||||||||||||||||||
| (In millions) | |||||||||||||||||||||||
| Due in one year or less | $ | 1,603 | $ | 1,624 | $ | 1,456 | $ | 1,458 | |||||||||||||||
| Due after one year through five years | 10,637 | 11,229 | 12,304 | 13,098 | |||||||||||||||||||
| Due after five years through ten years | 13,294 | 14,338 | 12,319 | 13,878 | |||||||||||||||||||
| Due after ten years | 14,411 | 17,182 | 12,847 | 16,170 | |||||||||||||||||||
| Total | $ | 39,945 | $ | 44,373 | $ | 38,926 | $ | 44,604 | |||||||||||||||
Actual maturities may differ from contractual maturities because certain securities may be called or prepaid. Securities not due at a single date are allocated based on weighted average life.
Limited Partnerships
The carrying value of limited partnerships as of December 31, 20192021 and 20182020 was approximately $2.0$1.9 billion and $2.4$1.8 billion, which includes net undistributed earnings of $297$266 million and $208$252 million. Limited partnerships comprising 64.4%35% of the total carrying value are reported on a current basis through December 31, 20192021 with no reporting lag, 9.1%6% of the total carrying value are reported on a one month lag and the remainder are reported on more than a one month lag. The number of limited partnerships held and the strategies employed provide diversification to the limited partnership portfolio and the overall invested asset portfolio.
Limited partnerships comprising 65.7%65% and 71.3%44% of the carrying value at December 31, 2021 and 2020 were invested in private debt and equity. Limited partnerships comprising 35% and 56% of the carrying value as of December 31, 20192021 and 20182020 employ hedge fund strategies. Limited partnerships comprising 29.1% and 24.3% of the carrying value at December 31, 2019 and 2018 were invested in privatePrivate debt and equity the remainder were primarily invested in real estate strategies. distressed investing. Hedge fund strategies include both long and short positions in fixed income, equity and derivative instruments. These hedge fund strategies may seek to generate gains from mispriced or undervalued securities, price differentials between securities, distressed investments, sector rotation or various arbitrage disciplines. Within hedge fund strategies, approximately 44.0% were equity related, 32.3% pursued a multi-strategy approach, 18.8% were focused on distressed investments and 4.9% were fixed income related as of December 31, 2019.
funds cover a broad range of investment strategies including buyout, co-investment, private credit, growth capital and
The ten10 largest limited partnership positions held totaled $1.1 billion$665 million and $914 million as of December 31, 20192021 and 2018.2020. Based on the most recent information available regarding the Company’s percentage ownership of the individual limited partnerships, the carrying value reflected on the Consolidated Balance Sheets represents approximately 2.3%1% and 2.6%2% of the aggregate partnership equity at December 31, 20192021 and 2018,2020, and the related income reflected on the Consolidated Statements of IncomeOperations represents approximately 2.5%2%, 3.3%2% and 3.0%2% of the changes in aggregate partnership equity for the years ended December 31, 2019, 20182021, 2020 and 2017.
2019.There are risks inherent in limited partnership investments which may result in losses due to short-selling, derivatives or other speculative investment practices. The use of leverage increases volatility generated by the underlying investment strategies.
| 103 | ||||||||
Mortgage Loans
The following table presents the amortized cost basis of mortgage loans for each credit quality indicator by year of origination. The primary credit quality indicators utilized are debt service coverage ratios (“DSCR”) and loan-to-value (“LTV”) ratios.
| Mortgage Loans Amortized Cost Basis by Origination Year (a) | |||||||||||||||||||||||||||||||||||||||||
| As of December 31, 2021 | 2021 | 2020 | 2019 | 2018 | 2017 | Prior | Total | ||||||||||||||||||||||||||||||||||
| (In millions) | |||||||||||||||||||||||||||||||||||||||||
| DSCR ≥1.6x | |||||||||||||||||||||||||||||||||||||||||
| LTV less than 55% | $ | 2 | $ | 75 | $ | 6 | $ | 38 | $ | 99 | $ | 181 | $ | 401 | |||||||||||||||||||||||||||
| LTV 55% to 65% | 5 | 38 | 15 | 17 | 0 | 24 | 99 | ||||||||||||||||||||||||||||||||||
| LTV greater than 65% | 17 | 0 | 8 | 0 | 0 | 0 | 25 | ||||||||||||||||||||||||||||||||||
| DSCR 1.2x - 1.6x | |||||||||||||||||||||||||||||||||||||||||
| LTV less than 55% | 14 | 14 | 95 | 0 | 5 | 42 | 170 | ||||||||||||||||||||||||||||||||||
| LTV 55% to 65% | 36 | 0 | 0 | 24 | 10 | 0 | 70 | ||||||||||||||||||||||||||||||||||
| LTV greater than 65% | 0 | 24 | 0 | 0 | 8 | 0 | 32 | ||||||||||||||||||||||||||||||||||
| DSCR ≤1.2x | |||||||||||||||||||||||||||||||||||||||||
| LTV less than 55% | 0 | 0 | 35 | 0 | 30 | 0 | 65 | ||||||||||||||||||||||||||||||||||
| LTV 55% to 65% | 0 | 0 | 28 | 0 | 0 | 0 | 28 | ||||||||||||||||||||||||||||||||||
| LTV greater than 65% | 21 | 9 | 62 | 0 | 0 | 7 | 99 | ||||||||||||||||||||||||||||||||||
| Total | $ | 95 | $ | 160 | $ | 249 | $ | 79 | $ | 152 | $ | 254 | $ | 989 | |||||||||||||||||||||||||||
| (a) | The values in the table above reflect DSCR on a standardized amortization period and LTV ratios based on the most recent appraised values trended forward using changes in a commercial real estate price index. | ||||
Derivative Financial Instruments
In addition to the derivatives used for risk management purposes described above, the Companyderivatives may also use derivativesbe used for purposes of income enhancement. Income enhancement transactions include but are not limited to interest rate swaps, call options, put options, credit default swaps, index futures and foreign currency forwards. See Note 4 for information regarding the fair value of derivative instruments.
| 104 | ||||||||
The following tables present the aggregate contractual or notional amount and estimated fair value related to derivative financial instruments.
December 31 | 2019 | 2018 | ||||||||||||||||||||||
Contractual/ | Contractual/ | |||||||||||||||||||||||
Notional | Estimated Fair Value | Notional | Estimated Fair Value | |||||||||||||||||||||
Amount | Asset | (Liability) | Amount | Asset | (Liability) | |||||||||||||||||||
(In millions) | ||||||||||||||||||||||||
With hedge designation: | ||||||||||||||||||||||||
Interest rate swaps | $ | 715 | $ | (8 | ) | $ | 500 | $ | 11 | |||||||||||||||
Without hedge designation: | ||||||||||||||||||||||||
Equity markets: | ||||||||||||||||||||||||
Options – purchased | 57 | $ | 1 | 213 | 18 | |||||||||||||||||||
– written | 100 | (1) | 239 | $ | (17 | ) | ||||||||||||||||||
Commodity futures – long | 32 | |||||||||||||||||||||||
Embedded derivative on funds withheld liability | 182 | (7) | 172 | 4 | ||||||||||||||||||||
| December 31 | 2021 | 2020 | |||||||||||||||||||||||||||||||||
| Contractual/Notional Amount | Estimated Fair Value | Contractual/Notional Amount | Estimated Fair Value | ||||||||||||||||||||||||||||||||
| Asset | (Liability) | Asset | (Liability) | ||||||||||||||||||||||||||||||||
| (In millions) | |||||||||||||||||||||||||||||||||||
| With hedge designation: | |||||||||||||||||||||||||||||||||||
| Interest rate swaps | 0 | 0 | 0 | $ | 675 | 0 | $ | (26) | |||||||||||||||||||||||||||
| Without hedge designation: | |||||||||||||||||||||||||||||||||||
| Equity markets: | |||||||||||||||||||||||||||||||||||
| Options – purchased | 0 | 0 | 0 | 135 | $ | 3 | 0 | ||||||||||||||||||||||||||||
| Interest rate swaps | $ | 100 | 0 | 0 | 100 | 0 | (3) | ||||||||||||||||||||||||||||
| Embedded derivative on funds withheld liability | 270 | 0 | $ | (12) | 190 | 0 | (19) | ||||||||||||||||||||||||||||
Investment Commitments
As part of itsthe overall investment strategy, the Company investsinvestments are made in various assets which require future purchase, sale or funding of commitments. These investments are recorded once funded, and the related commitments may include future capital calls from various third-party limited partnerships, signed and accepted mortgage loan applications and obligations related to privately placed debtprivate placement securities. As of December 31, 2019, the Company had2021, commitments to purchase or fund were approximately $945 million$1.2 billion and to sell were approximately $85$90 million under the terms of these investments.
Investments on Deposit
Securities with carrying values of approximately $2.7 billion and $2.5$3.0 billion were deposited by CNA’s insurance subsidiaries under requirements of regulatory authorities and others as of December 31, 20192021 and 2018.
2020.Cash and securities with carrying values of approximately $1.1$1.2 billion and $1.0$1.1 billion were deposited with financial institutions in trust accounts or as collateral for letters of credit to secure obligations with various third parties as of December 31, 20192021 and 2018.
Note 4. Fair Value
Fair value is the price that would be received upon sale of an asset or paid to transfer a liability in an orderly transaction between market participants at the measurement date. The following fair value hierarchy is used in selecting inputs, with the highest priority given to Level 1, as these are the most transparent or reliable:
•Level 1 – Quoted prices for identical instruments in active markets.
•Level 2 – Quoted prices for similar instruments in active markets; quoted prices for identical or similar instruments in markets that are not active; and model-derived valuations in which all significant inputs are observable in active markets.
•Level 3 – Valuations derived from valuation techniques in which one or more significant inputs are not observable.
| 105 | ||||||||
Prices may fall within Level 1, 2 or 3 depending upon the methodology and inputs used to estimate fair value for each specific security. In general, the Company seeks to price securities are priced using third party pricing services. Securities not priced by pricing services are submitted to independent brokers for valuation and, if those are not available, internally developed pricing models are used to value assets using a methodology and inputs the Company believesthat market participants presumably would use to value the assets. Prices obtained from third-party pricing services or brokers are not adjusted by the Company.
adjusted. and
(iv) detailed analysis, whereAssets and liabilities measured at fair value on a recurring basis are summarized in the following tables. Corporate bonds and other includes obligations of the U.S. Treasury, government-sponsored enterprises, foreign governments and redeemable preferred stock.
December 31, 2019 | Level 1 | Level 2 | Level 3 | Total | |||||||||||||||||||||||||||||||||||
| December 31, 2021 | December 31, 2021 | Level 1 | Level 2 | Level 3 | Total | ||||||||||||||||||||||||||||||||||
(In millions) | (In millions) | ||||||||||||||||||||||||||||||||||||||
Fixed maturity securities: | Fixed maturity securities: | ||||||||||||||||||||||||||||||||||||||
Corporate bonds and other | $ | 175 | $ | 22,065 | $ | 468 | $ | 22,708 | Corporate bonds and other | $ | 140 | $ | 23,768 | $ | 937 | $ | 24,845 | ||||||||||||||||||||||
States, municipalities and political subdivisions | 10,652 | 10,652 | States, municipalities and political subdivisions | 0 | 11,887 | 56 | 11,943 | ||||||||||||||||||||||||||||||||
Asset-backed | 8,662 | 165 | 8,827 | Asset-backed | 0 | 7,029 | 556 | 7,585 | |||||||||||||||||||||||||||||||
Fixed maturities available-for-sale | 175 | 41,379 | 633 | 42,187 | Fixed maturities available-for-sale | 140 | 42,684 | 1,549 | 44,373 | ||||||||||||||||||||||||||||||
Fixed maturities trading | 49 | 4 | 53 | Fixed maturities trading | 0 | 7 | 0 | 7 | |||||||||||||||||||||||||||||||
Total fixed maturities | $ | 175 | $ | 41,428 | $ | 637 | $ | 42,240 | Total fixed maturities | $ | 140 | $ | 42,691 | $ | 1,549 | $ | 44,380 | ||||||||||||||||||||||
Equity securities | $ | 629 | $ | 658 | $ | 19 | $ | 1,306 | Equity securities | $ | 924 | $ | 721 | $ | 29 | $ | 1,674 | ||||||||||||||||||||||
Short term and other | 3,138 | 1,383 | 4,521 | Short term and other | 4,696 | 74 | 0 | 4,770 | |||||||||||||||||||||||||||||||
Receivables | 2 | 2 | |||||||||||||||||||||||||||||||||||||
Payable to brokers | (18 | ) | (10 | ) | (28 | ) | Payable to brokers | (70) | 0 | 0 | (70) | ||||||||||||||||||||||||||||
December 31, 2018 | |||||||||||||||||||||||||||||||||||||||
| December 31, 2020 | December 31, 2020 | ||||||||||||||||||||||||||||||||||||||
Fixed maturity securities: | Fixed maturity securities: | ||||||||||||||||||||||||||||||||||||||
Corporate bonds and other | $ | 196 | $ | 19,392 | $ | 222 | $ | 19,810 | Corporate bonds and other | $ | 355 | $ | 24,082 | $ | 770 | $ | 25,207 | ||||||||||||||||||||||
States, municipalities and political subdivisions | 10,748 | 10,748 | States, municipalities and political subdivisions | 0 | 11,546 | 46 | 11,592 | ||||||||||||||||||||||||||||||||
Asset-backed | 8,787 | 197 | 8,984 | Asset-backed | 0 | 7,497 | 308 | 7,805 | |||||||||||||||||||||||||||||||
Fixed maturities available-for-sale | 196 | 38,927 | 419 | 39,542 | Fixed maturities available-for-sale | 355 | 43,125 | 1,124 | 44,604 | ||||||||||||||||||||||||||||||
Fixed maturities trading | 151 | 6 | 157 | Fixed maturities trading | 0 | 34 | 8 | 42 | |||||||||||||||||||||||||||||||
Total fixed maturities | $ | 196 | $ | 39,078 | $ | 425 | $ | 39,699 | Total fixed maturities | $ | 355 | $ | 43,159 | $ | 1,132 | $ | 44,646 | ||||||||||||||||||||||
Equity securities | $ | 704 | $ | 570 | $ | 19 | $ | 1,293 | Equity securities | $ | 796 | $ | 722 | $ | 43 | $ | 1,561 | ||||||||||||||||||||||
Short term and other | 2,647 | 1,111 | 3,758 | Short term and other | 4,538 | 39 | 0 | 4,577 | |||||||||||||||||||||||||||||||
Receivables | 11 | 11 | |||||||||||||||||||||||||||||||||||||
Payable to brokers | (23 | ) | (23) | Payable to brokers | (14) | (29) | 0 | (43) | |||||||||||||||||||||||||||||||
| 106 | ||||||||
The following tables below present reconciliations for all assets and liabilities measured at fair value on a recurring basis using significant unobservable inputs (Level 3) for the years ended December 31, 20192021 and 2018:
Unrealized | ||||||||||||||||||||||||||||||||||||||||||||
Gains | ||||||||||||||||||||||||||||||||||||||||||||
Unrealized | (Losses) | |||||||||||||||||||||||||||||||||||||||||||
Gains | Recognized in | |||||||||||||||||||||||||||||||||||||||||||
(Losses) | Other | |||||||||||||||||||||||||||||||||||||||||||
Recognized in | Comprehensive | |||||||||||||||||||||||||||||||||||||||||||
Net Realized Investment | Net Income | Income (Loss) | ||||||||||||||||||||||||||||||||||||||||||
Gains (Losses) and Net | (Loss) on Level | on Level 3 | ||||||||||||||||||||||||||||||||||||||||||
Change in Unrealized | 3 Assets and | Assets and | ||||||||||||||||||||||||||||||||||||||||||
Investment Gains (Losses) | Transfers | Transfers | Liabilities | Liabilities | ||||||||||||||||||||||||||||||||||||||||
Balance, | Included in | Included in | into | out of | Balance, | Held at | Held at | |||||||||||||||||||||||||||||||||||||
2019 | January 1 | Net Income | OCI | Purchases | Sales | Settlements | Level 3 | Level 3 | December 31 | December 31 | December 31 | |||||||||||||||||||||||||||||||||
(In millions) | ||||||||||||||||||||||||||||||||||||||||||||
Fixed maturity securities: | ||||||||||||||||||||||||||||||||||||||||||||
Corporate bonds and other | $ | 222 | $ | 33 | $ | 256 | $ | (11) | $ | (32) | $ | 468 | $ | 28 | ||||||||||||||||||||||||||||||
Asset-backed | 197 | 8 | 48 | (16) | $ | 45 | (117) | 165 | 7 | |||||||||||||||||||||||||||||||||||
Fixed maturities available-for-sale | 419 | $ | - | 41 | 304 | $ | - | (27) | 45 | (149) | 633 | $ | - | 35 | ||||||||||||||||||||||||||||||
Fixed maturities trading | 6 | (2) | 4 | (2) | ||||||||||||||||||||||||||||||||||||||||
Total fixed maturities | $ | 425 | $ | (2) | $ | 41 | $ | 304 | $ | - | $ | (27) | $ | 45 | $ | (149) | $ | 637 | $ | (2) | $ | 35 | ||||||||||||||||||||||
Equity securities | $ | 19 | $ | (2) | $ | 2 | $ | 19 | $ | (2) | ||||||||||||||||||||||||||||||||||
2020:
| Net Realized Investment Gains (Losses) and Net Change in Unrealized Investment Gains (Losses) | Unrealized Gains (Losses) Recognized in Net Income (Loss) on Level 3 Assets and Liabilities Held at December 31 | Unrealized Gains (Losses) Recognized in Other Comprehensive Income (Loss)on Level 3 Assets and Liabilities Held at December 31 | |||||||||||||||||||||||||||||||||||||||||||||||||||||||||||||||
| 2021 | Balance, January 1 | Included in Net Income | Included in OCI | Purchases | Sales | Settlements | Transfers into Level 3 | Transfers out of Level 3 | Balance, December 31 | ||||||||||||||||||||||||||||||||||||||||||||||||||||||||
| (In millions) | |||||||||||||||||||||||||||||||||||||||||||||||||||||||||||||||||
| Fixed maturity securities: | |||||||||||||||||||||||||||||||||||||||||||||||||||||||||||||||||
| Corporate bonds and other | $ | 770 | $ | (10) | $ | (32) | $ | 312 | $ | (3) | $ | (68) | $ | 20 | $ | (52) | $ | 937 | 0 | $ | (32) | ||||||||||||||||||||||||||||||||||||||||||||
| States, municipalities and political subdivisions | 46 | 0 | (1) | 12 | 0 | (1) | 0 | 0 | 0 | 0 | 56 | 0 | (1) | ||||||||||||||||||||||||||||||||||||||||||||||||||||
| Asset-backed | 308 | 7 | (10) | 287 | (9) | (61) | 109 | (75) | 556 | 0 | (11) | ||||||||||||||||||||||||||||||||||||||||||||||||||||||
| Fixed maturities available-for-sale | 1,124 | (3) | (43) | 611 | (12) | (130) | 129 | (127) | 1,549 | $ | — | (44) | |||||||||||||||||||||||||||||||||||||||||||||||||||||
| Fixed maturities trading | 8 | (6) | 0 | 0 | 0 | (2) | 0 | 0 | — | 0 | 0 | ||||||||||||||||||||||||||||||||||||||||||||||||||||||
| Total fixed maturities | $ | 1,132 | $ | (9) | $ | (43) | $ | 611 | $ | (12) | $ | (132) | $ | 129 | $ | (127) | $ | 1,549 | $ | — | $ | (44) | |||||||||||||||||||||||||||||||||||||||||||
| Equity securities | $ | 43 | $ | (15) | 0 | $ | 11 | $ | (21) | 0 | $ | 21 | $ | (10) | $ | 29 | $ | (2) | 0 | ||||||||||||||||||||||||||||||||||||||||||||||
| 107 | ||||||||||||||||||||||||||||||||||||||||||||
Unrealized | Net Realized Investment Gains (Losses) and Net Change in Unrealized Investment Gains (Losses) | Unrealized Gains (Losses) Recognized in Net Income (Loss) on Level 3 Assets and Liabilities Held at December 31 | Unrealized Gains (Losses) Recognized in Other Comprehensive Income (Loss)on Level 3 Assets and Liabilities Held at December 31 | ||||||||||||||||||||||||||||||||||||||||||||||||||||||||||||||||||||||||||||||||||||||||||||||||||||||||||
| 2020 | 2020 | Balance, January 1 | Included in Net Income | Included in OCI | Purchases | Sales | Settlements | Transfers into Level 3 | Transfers out of Level 3 | Balance, December 31 | |||||||||||||||||||||||||||||||||||||||||||||||||||||||||||||||||||||||||||||||||||||||||||||||||||
| (In millions) | (In millions) | ||||||||||||||||||||||||||||||||||||||||||||||||||||||||||||||||||||||||||||||||||||||||||||||||||||||||||||
Gains | |||||||||||||||||||||||||||||||||||||||||||||||||||||||||||||||||||||||||||||||||||||||||||||||||||||||||||||
Unrealized | (Losses) | ||||||||||||||||||||||||||||||||||||||||||||||||||||||||||||||||||||||||||||||||||||||||||||||||||||||||||||
Gains | Recognized in | ||||||||||||||||||||||||||||||||||||||||||||||||||||||||||||||||||||||||||||||||||||||||||||||||||||||||||||
(Losses) | Other | ||||||||||||||||||||||||||||||||||||||||||||||||||||||||||||||||||||||||||||||||||||||||||||||||||||||||||||
Recognized in | Comprehensive | ||||||||||||||||||||||||||||||||||||||||||||||||||||||||||||||||||||||||||||||||||||||||||||||||||||||||||||
Net Realized Investment | Net Income | Income (Loss) | |||||||||||||||||||||||||||||||||||||||||||||||||||||||||||||||||||||||||||||||||||||||||||||||||||||||||||
Gains (Losses) and Net | (Loss) on Level | on Level 3 | |||||||||||||||||||||||||||||||||||||||||||||||||||||||||||||||||||||||||||||||||||||||||||||||||||||||||||
Change in Unrealized | 3 Assets and | Assets and | |||||||||||||||||||||||||||||||||||||||||||||||||||||||||||||||||||||||||||||||||||||||||||||||||||||||||||
Investment Gains (Losses) | Transfers | Transfers | Liabilities | Liabilities | |||||||||||||||||||||||||||||||||||||||||||||||||||||||||||||||||||||||||||||||||||||||||||||||||||||||||
Balance, | Included in | Included in | into | out of | Balance, | Held at | Held at | ||||||||||||||||||||||||||||||||||||||||||||||||||||||||||||||||||||||||||||||||||||||||||||||||||||||
2018 | January 1 | Net Income | OCI | Purchases | Sales | Settlements | Level 3 | Level 3 | December 31 | December 31 | December 31 | ||||||||||||||||||||||||||||||||||||||||||||||||||||||||||||||||||||||||||||||||||||||||||||||||||
(In millions) | |||||||||||||||||||||||||||||||||||||||||||||||||||||||||||||||||||||||||||||||||||||||||||||||||||||||||||||
Fixed maturity securities: | Fixed maturity securities: | ||||||||||||||||||||||||||||||||||||||||||||||||||||||||||||||||||||||||||||||||||||||||||||||||||||||||||||
Corporate bonds and other | $ | 98 | $ | (1) | $ | (4) | $ | 117 | $ | (5) | $ | (9) | $ | 35 | $ | (9) | $ | 222 | $ | (5 | ) | Corporate bonds and other | $ | 468 | $ | 1 | $ | 43 | $ | 264 | $ | (3) | $ | (13) | $ | 10 | 0 | $ | 770 | 0 | $ | 43 | |||||||||||||||||||||||||||||||||||||||||||||||||||||||||||||||||||
States, municipalities and political subdivisions | 1 | (1) | - | States, municipalities and political subdivisions | 0 | 0 | 1 | 45 | 0 | 0 | 0 | 0 | 46 | 0 | 1 | ||||||||||||||||||||||||||||||||||||||||||||||||||||||||||||||||||||||||||||||||||||||||||||||
Asset-backed | 335 | 5 | (8) | 162 | (72) | (64) | 42 | (203) | 197 | $ | (2) | (4 | ) | Asset-backed | 165 | 1 | 16 | 154 | (9) | (32) | 30 | $ | (17) | 308 | 0 | 18 | |||||||||||||||||||||||||||||||||||||||||||||||||||||||||||||||||||||||||||||||||||
Fixed maturities available-for-sale | 434 | 4 | (12) | 279 | (77) | (74) | 77 | (212) | 419 | (2) | (9 | ) | Fixed maturities available-for-sale | 633 | 2 | 60 | 463 | (12) | (45) | 40 | (17) | 1,124 | $ | — | 62 | ||||||||||||||||||||||||||||||||||||||||||||||||||||||||||||||||||||||||||||||||||||
Fixed maturities trading | 4 | 3 | (1) | 6 | 2 | Fixed maturities trading | 4 | 4 | 0 | 0 | 0 | 0 | 0 | 0 | 8 | 4 | 0 | ||||||||||||||||||||||||||||||||||||||||||||||||||||||||||||||||||||||||||||||||||||||||||||
Total fixed maturities | $ | 438 | $ | 7 | $ | (12) | $ | 279 | $ | (78) | $ | (74 ) | $ | 77 | $ | (212) | $ | 425 | $ | - | $ | (9 | ) | Total fixed maturities | $ | 637 | $ | 6 | $ | 60 | $ | 463 | $ | (12) | $ | (45) | $ | 40 | $ | (17) | $ | 1,132 | $ | 4 | $ | 62 | |||||||||||||||||||||||||||||||||||||||||||||||||||||||||||||||
Equity securities | $ | 22 | $ | (2) | $ | (1) | $ | 19 | $ | (2) | Equity securities | $ | 19 | $ | (6) | 0 | $ | 15 | 0 | 0 | $ | 15 | 0 | $ | 43 | $ | (6) | 0 | |||||||||||||||||||||||||||||||||||||||||||||||||||||||||||||||||||||||||||||||||
Net investment gains and losses are reported in Net income as follows:
Major Category of Assets and Liabilities | Consolidated Statements of | |||||
Fixed maturity securities available-for-sale | Investment gains (losses) | |||||
Fixed maturity securities trading | Net investment income | |||||
Equity securities | Investment gains (losses) and Net investment income | |||||
Other invested assets | Investment gains (losses) and Net investment income | |||||
Derivative financial instruments held in a trading portfolio | Net investment income | |||||
Derivative financial instruments, other | Investment gains (losses) and Operating revenues and other | |||||
| 108 | ||||||||
Securities may be transferred in or out of levels within the fair value hierarchy based on the availability of observable market information and quoted prices used to determine the fair value of the security. The availability of observable market information and quoted prices varies based on market conditions and trading volume.
Valuation Methodologies and Inputs
The following section describes the valuation methodologies and relevant inputs used to measure different financial instruments at fair value, including an indication of the level in the fair value hierarchy in which the instruments are generally classified.
Fixed Maturity Securities
Level 1 securities include highly liquid
government securities
and exchange traded bonds valued using quoted market prices. Level 2 securities include most other fixed maturity securities as the significant inputs are observable in the marketplace. All classes of Level 2 fixed maturity securities are valued using a methodology based on information generated by market transactions involving identical or comparable assets, a discounted cash flow methodology or a combination of both when necessary. Common inputs for all classes of fixed maturity securities include prices from recently executed transactions of similar securities, marketplace quotes, benchmark yields, spreads off benchmark yields, interest rates and U.S. Treasury or swap curves. Specifically for asset-backed securities, key inputs include prepayment and default projections based on past performance of the underlying collateral and current market data. Fixed maturity securities are primarily assigned to Level 3 in cases where broker/dealer quotes are significant inputs to the valuation, and there is a lack of transparency as to whether these quotes are based on information that is observable in the marketplace. Level 3 securities also include private placement debt securities whose fair value is determined using internal models with
some
inputs that are not market observable.Equity Securities
Level 1 securities include publicly traded securities valued using quoted market prices. Level 2 securities are primarily valued using pricing for similar securities, recently executed transactions and other pricing models utilizing market observable inputs. Level 3 securities are primarily priced using broker/dealer quotes and internal models with
some
inputs that are not market observable.Derivative Financial Instruments
Over-the-counter
derivatives, principally interest rate swaps,currency forwards,
forwards, total return swaps, commodity swaps, equity warrants and options, are valued using inputs including broker/dealer quotes and are classified within Level 2 or Level 3 of the valuation hierarchy, depending on the amount of transparency as to whether these quotes are based on information that is observable in the marketplace.Short Term and Other Invested Assets
Securities that are actively traded or have quoted prices are classified as Level 1. These securities include money market funds, treasury bills and exchange traded
open-end
funds valued using quoted market prices. Level 2 primarily includes non-U.S. government securities and commercial paper, for which all inputs are market observable. Fixed maturity securities purchased within one year of maturity are classified consistent with fixed maturity securities discussed above. Short term investments as presented in the tables above differ from the amounts presented in the Consolidated Balance Sheets because certain short term investments, such as time deposits, are not measured at fair value.| 109 | ||||||||
Significant Unobservable Inputs
The following tables present quantitative information about the significant unobservable inputs utilized by the Company in the fair value measurement of Level 3 assets. Valuations for assets and liabilities not presented in the tables below are primarily based on broker/dealer quotes for which there is a lack of transparency as to inputs used to develop the valuations. The quantitative detail of unobservable inputs from these broker quotes is neither provided nor reasonably available to the Company.available. The weighted average rate is calculated based on fair value.
| December 31, 2021 | Estimated Fair Value | Valuation Techniques | Unobservable Inputs | Range (Weighted Average) | ||||||||||||||||||||||||||||
| (In millions) | ||||||||||||||||||||||||||||||||
| Fixed maturity securities | $ | 1,225 | Discounted cash flow | Credit spread | 1% | — | 7% | (2%) | ||||||||||||||||||||||||
| December 31, 2020 | ||||||||||||||||||||||||||||||||
| Fixed maturity securities | $ | 966 | Discounted cash flow | Credit spread | 1% | — | 8% | (3%) | ||||||||||||||||||||||||
For fixed maturity securities, an increase to the credit spread assumptions would result in a lower fair value measurement.
Financial Assets and Liabilities Not Measured at Fair Value
The carrying amount, estimated fair value and the level of the fair value hierarchy of the Company’s financial assets and liabilities which are not measured at fair value on the Consolidated Balance Sheets are presented in the following tables. The carrying amounts and estimated fair values of short term debt and long term debt exclude
finance
lease obligations. The carrying amounts reported on the Consolidated Balance Sheets for cash and short term investments not carried at fair value and certain other assets and liabilities approximate fair value due to the short term nature of these items.Carrying | Estimated Fair Value | |||||||||||||||||||
December 31, 2019 | Amount | Level 1 | Level 2 | Level 3 | Total | |||||||||||||||
(In millions) | ||||||||||||||||||||
Assets: | ||||||||||||||||||||
Other invested assets, primarily mortgage loans | $ | 994 | $ | 1,025 | $ | 1,025 | ||||||||||||||
Liabilities: | ||||||||||||||||||||
Short term debt | 75 | $ | 9 | 66 | 75 | |||||||||||||||
Long term debt | 11,443 | 10,884 | 626 | 11,510 | ||||||||||||||||
December 31, 2018 | ||||||||||||||||||||
Assets: | ||||||||||||||||||||
Other invested assets, primarily mortgage loans | $ | 839 | $ | 827 | $ | 827 | ||||||||||||||
Liabilities: | ||||||||||||||||||||
Short term debt | 15 | $ | 14 | 14 | ||||||||||||||||
Long term debt | 11,345 | 10,111 | 653 | 10,764 | ||||||||||||||||
| Carrying Amount | Estimated Fair Value | ||||||||||||||||||||||||||||
| December 31, 2021 | Level 1 | Level 2 | Level 3 | Total | |||||||||||||||||||||||||
| (In millions) | |||||||||||||||||||||||||||||
| Assets: | |||||||||||||||||||||||||||||
| Other invested assets, primarily mortgage loans | $ | 973 | 0 | 0 | $ | 1,018 | $ | 1,018 | |||||||||||||||||||||
| Liabilities: | |||||||||||||||||||||||||||||
| Short term debt | 93 | 0 | 0 | 93 | 93 | ||||||||||||||||||||||||
| Long term debt | 8,981 | 0 | $ | 9,170 | 611 | 9,781 | |||||||||||||||||||||||
| December 31, 2020 | |||||||||||||||||||||||||||||
| Assets: | $ | 1,068 | 0 | 0 | $ | 1,151 | $ | 1,151 | |||||||||||||||||||||
| Other invested assets, primarily mortgage loans | |||||||||||||||||||||||||||||
| Liabilities: | |||||||||||||||||||||||||||||
| Short term debt | 35 | 0 | $ | 19 | 17 | 36 | |||||||||||||||||||||||
| Long term debt | 10,042 | 0 | 10,482 | 765 | 11,247 | ||||||||||||||||||||||||
| 110 | ||||||||
The fair values of debt were based on observable market prices when available. When observable market prices were not available, the fair values of debt were based on observable market prices of comparable instruments adjusted for differences between the observed instruments and the instruments being valued or is estimated using discounted cash flow analyses, based on current incremental borrowing rates for similar types of borrowing arrangements.
Note 5. Receivables
December 31 | 2019 | 2018 | ||||||
(In millions) | ||||||||
Reinsurance (Note 16) | $ | 4,204 | $ | 4,455 | ||||
Insurance | 2,481 | 2,365 | ||||||
Receivable from brokers | 124 | 296 | ||||||
Accrued investment income | 395 | 394 | ||||||
Federal income taxes | 14 | 52 | ||||||
Other, primarily customer accounts | 520 | 477 | ||||||
Total | 7,738 | 8,039 | ||||||
Less: allowance for doubtful accounts on reinsurance receivables | 25 | 29 | ||||||
allowance for other doubtful accounts | 38 | 50 | ||||||
Receivables | $ | 7,675 | $ | |||||
| December 31 | 2021 | 2020 | |||||||||
| (In millions) | |||||||||||
| Reinsurance (Note 16) | $ | 5,484 | $ | 4,478 | |||||||
| Insurance | 2,974 | 2,640 | |||||||||
| Receivable from brokers | 280 | 97 | |||||||||
| Accrued investment income | 377 | 381 | |||||||||
| Federal income taxes | 11 | 4 | |||||||||
| Other, primarily customer accounts | 200 | 290 | |||||||||
| Total | 9,326 | 7,890 | |||||||||
| Less: allowance for doubtful accounts on reinsurance receivables | 21 | 21 | |||||||||
| allowance for other doubtful accounts | 32 | 36 | |||||||||
| Receivables | $ | 9,273 | $ | 7,833 | |||||||
Note 6. Property, Plant and Equipment
December 31 | 2019 | 2018 | ||||||
(In millions) | ||||||||
Pipeline equipment (net of accumulated depreciation of $3,075 and $2,761) | $ | 8,229 | $ | |||||
Offshore drilling equipment (net of accumulated depreciation of $2,885 and $3,067) | 5,119 | 5,144 | ||||||
Other (net of accumulated depreciation of $1,114 and $1,056 ) | 1,625 | 1,812 | ||||||
Construction in process | 595 | 317 | ||||||
Property, plant and equipment | $ | 15,568 | $ | |||||
| December 31 | 2021 | 2020 | |||||||||
| (In millions) | |||||||||||
| Pipeline equipment (net of accumulated depreciation of $3,742 and $3,402) | $ | 8,308 | $ | 8,368 | |||||||
| Hotel properties (net of accumulated depreciation of $472 and $439) | 959 | 1,083 | |||||||||
| Other (net of accumulated depreciation of $522 and $688) | 281 | 719 | |||||||||
| Construction in process | 340 | 281 | |||||||||
| Property, plant and equipment | $ | 9,888 | $ | 10,451 | |||||||
Depreciation expense and capital expenditures are as follows:
Year Ended December 31 | 2019 | 2018 | 2017 | |||||||||||||||||||||
Depre- | Capital | Depre- | Capital | Depre- | Capital | |||||||||||||||||||
ciation | Expend. | ciation | Expend. | ciation | Expend. | |||||||||||||||||||
(In millions) | ||||||||||||||||||||||||
CNA Financial | $ | 64 | $ | 26 | $ | 76 | $ | 99 | $ | 80 | $ | 101 | ||||||||||||
Diamond Offshore | 356 | 345 | 332 | 222 | 349 | 113 | ||||||||||||||||||
Boardwalk Pipelines | 348 | 418 | 346 | 487 | 325 | 689 | ||||||||||||||||||
Loews Hotels & Co | 60 | 216 | 67 | 139 | 63 | 57 | ||||||||||||||||||
Corporate | 70 | 53 | 59 | 48 | 37 | 30 | ||||||||||||||||||
Total | $ | 898 | $ | 1,058 | $ | 880 | $ | 995 | $ | 854 | $ | 990 | ||||||||||||
| Year Ended December 31 | 2021 | 2020 | 2019 | ||||||||||||||||||||||||||||||||
| Depre-ciation | Capital Expend. | Depre-ciation | Capital Expend. | Depre-ciation | Capital Expend. | ||||||||||||||||||||||||||||||
| (In millions) | |||||||||||||||||||||||||||||||||||
| CNA Financial | $ | 51 | $ | 26 | $ | 56 | $ | 25 | $ | 64 | $ | 26 | |||||||||||||||||||||||
| Boardwalk Pipelines | 368 | 340 | 361 | 415 | 348 | 418 | |||||||||||||||||||||||||||||
| Loews Hotels & Co | 63 | 100 | 63 | 88 | 60 | 216 | |||||||||||||||||||||||||||||
| Corporate | 21 | 23 | 74 | 90 | 70 | 53 | |||||||||||||||||||||||||||||
Diamond Offshore (a) | 0 | 0 | 119 | 52 | 356 | 345 | |||||||||||||||||||||||||||||
| Total | $ | 503 | $ | 489 | $ | 673 | $ | 670 | $ | 898 | $ | 1,058 | |||||||||||||||||||||||
| (a) | Amounts presented for Diamond Offshore reflect the periods prior to deconsolidation. See Note 2 for further discussion. | ||||
| 111 | ||||||||
Capitalized interest related to the construction and upgrade of qualifying assets amounted to approximately $18$12 million, $27$14 million and $37$18 million for the years ended December 31, 2019, 20182021, 2020 and 2017.
2019.Asset Impairments
Loews Hotels & Co evaluates properties with indications that their carrying amounts may not be recoverable. It was determined that the carrying values of 1 property and capitalized costs related to a potential development project in 2020 and 4 properties in 2019 were impaired. Loews Hotels & Co recorded aggregate impairment charges of $30 million ($22 million after tax) and $99 million ($77 million after tax) for the years ended December 31, 2020 and 2019 and are reported within Operating expenses and other on the Consolidated Statements of Operations.
Loews Hotels & Co utilizes an undiscounted probability-weighted cash flow analysis in testing the recoverability of its long-lived assets for potential impairment. Assumptions and estimates underlying this analysis include, among other things, (i) room revenue based on occupancy and average room rates, (ii) other revenue generated by the property, including food and beverage sales and ancillary services, as well as property specific revenue sources, (iii) operating expenses, including management and marketing fees and (iv) expenditures for repairs and refurbishments to maintain the asset’s value. When necessary, scenarios are developed using multiple assumptions of expected future events which Loews Hotels & Co assigns a probability of occurrence based on management’s expectations. This initial analysis results in a projected probability-weighted cash flow of the property, which is compared to the carrying value of the asset to assess recoverability. If the long-lived asset’s carrying value exceeds the undiscounted cash flows, Loews Hotels & Co compares the long-lived asset’s carrying value to fair value, estimating the fair value of the asset by discounting future cash flows using market participant assumptions or third-party indicators of fair value such as a recent independent appraisal. These calculations, at times, utilize significant unobservable inputs, including estimating the growth in the asset’s revenue and cost structure and are therefore considered Level 3 fair value measurements.
During 2019, Diamond Offshore evaluated threethe first quarter of 2020, 5 drilling rigs withthat had indicators of impairment.impairment were evaluated. Based on the assumptions and analysis at that time, Diamond Offshore determined that the undiscounted probability-weighted cash flow of each of these rigsit was in excess of its carrying value. As a result, Diamond Offshore concluded that no impairment of these rigs had occurred at December 31, 2019.
Note 7. Goodwill and Other Intangible Assets
A summary of the changes in the carrying amount of goodwill is as follows:
CNA | Boardwalk | |||||||||||||||
Financial | Pipelines | Corporate | Total | |||||||||||||
(In millions) | ||||||||||||||||
Balance, December 31, 2017 | $ | 112 | $ | 237 | $ | 310 | $ | 659 | ||||||||
Acquisition | 8 | 8 | ||||||||||||||
Other adjustments | (2 | ) | (2) | |||||||||||||
Balance, December 31, 2018 | 110 | 237 | 318 | 665 | ||||||||||||
Acquisition s | 100 | 100 | ||||||||||||||
Other adjustments | 2 | 2 | ||||||||||||||
Balance, December 31, 2019 | $ | 112 | $ | 237 | $ | 418 | $ | 767 | ||||||||
| CNA Financial | Boardwalk Pipelines | Corporate | Total | ||||||||||||||||||||
| (In millions) | |||||||||||||||||||||||
| Balance, December 31, 2019 | $ | 112 | $ | 237 | $ | 418 | $ | 767 | |||||||||||||||
| Acquisition | 18 | 18 | |||||||||||||||||||||
| Balance, December 31, 2020 | 112 | 237 | 436 | 785 | |||||||||||||||||||
| Deconsolidation of Altium Packaging (see Note 2) | (436) | (436) | |||||||||||||||||||||
| Balance, December 31, 2021 | $ | 112 | $ | 237 | $ | — | $ | 349 | |||||||||||||||
| 112 | ||||||||
A summary of the net carrying amount of other intangible assets is as follows:
December 31, 2019 | December 31, 2018 | |||||||||||||||
Gross | Gross | |||||||||||||||
Carrying | Accumulated | Carrying | Accumulated | |||||||||||||
Amount | Amortization | Amount | Amortization | |||||||||||||
(In millions) | ||||||||||||||||
Finite-lived intangible assets: | ||||||||||||||||
Customer relationships | $ | 611 | 76 | $ | 532 | 47 | ||||||||||
Other | 71 | 34 | 72 | 20 | ||||||||||||
Total finite-lived intangible assets | 682 | 110 | 604 | 67 | ||||||||||||
Indefinite-lived intangible assets | 75 | 74 | ||||||||||||||
Total other intangible assets | $ | 757 | 110 | $ | 678 | 67 | ||||||||||
| December 31, 2021 | December 31, 2020 | ||||||||||||||||||||||
| Gross Carrying Amount | Accumulated Amortization | Gross Carrying Amount | Accumulated Amortization | ||||||||||||||||||||
| (In millions) | |||||||||||||||||||||||
| Finite-lived intangible assets: | |||||||||||||||||||||||
| Customer relationships | $ | 59 | $ | 17 | $ | 647 | $ | 111 | |||||||||||||||
| Other | 19 | 15 | 71 | 61 | |||||||||||||||||||
| Total finite-lived intangible assets | 78 | 32 | 718 | 172 | |||||||||||||||||||
| Indefinite-lived intangible assets | 63 | 64 | |||||||||||||||||||||
| Total other intangible assets | $ | 141 | $ | 32 | $ | 782 | $ | 172 | |||||||||||||||
The balance as of December 31, 2019 and 2018 includes assets from acquisitions made by
2021 reflects the deconsolidation of Altium Packaging
in 2021.Amortization expense for the years ended December 31, 2021, 2020 and 2019 2018 and 2017 of $45$3 million, $32$61 million and $20$45 million is reported in Operating expenses and other on the Consolidated Statements of Income.Operations. At December 31, 2019,2021, estimated amortization expense in each of the next five years is approximately $61 million in 2020, $38 million in 2021, $37 million in 2022, $36 million in 2023 and $34 million in 2024.$3 million.
Note 8. Claim, Claim Adjustment Expense and Future Policy Benefit Reserves
Establishing claim and claim adjustment expense reserves, including claim and claim adjustment expense reserves for catastrophic events that have occurred, is an estimation process. Many factors can ultimately affect the final settlement of a claim and, therefore, the necessary reserve. Changes in the law, results of litigation, medical costs, the cost of repair materials and labor rates can affect ultimate claim costs. In addition, time can be a critical part of reserving determinations since the longer the span between the incidence of a loss and the payment or settlement of the claim, the more variable the ultimate settlement amount can be. Accordingly, short-tail claims, such as property damage claims, tend to be more reasonably estimable than long-tail claims, such as workers’ compensation, general liability and professional liability claims. Adjustments to prior year reserve estimates, if necessary, are reflected in the results of operations in the period that the need for such adjustments is determined. There can be no assurance that CNA’sthe ultimate cost for insurance losses will not exceed current estimates.
CNA’s commercial property and casualty insurance operations (“Property & Casualty Operations”) include its Specialty, Commercial and International lines of business. CNA’s Other Insurance Operations outside of Property & Casualty Operations include its long term care business that is inA&EP.certain legacy mass tort reserves.
run-off,
certain corporate expenses, including interest on CNA’s corporate debt, and certain property and casualty businesses inrun-off,
including CNA Re, A&EP, a legacy portfolio of excess workers’ compensation policies and | 113 | ||||||||
Liability for Unpaid Claim and Claim Adjustment Expenses
The table below reconciles the net liability for unpaid claim and claim adjustment expenses to the amount presentedon on the Consolidated Balance Sheets.
December 31 | 2021 | |||||||
(In millions) | ||||||||
Net liability for unpaid claim and claim adjustment expenses: | ||||||||
Property & Casualty Operations | $ | |||||||
Other Insurance Operations (a) | 3,935 | |||||||
Total net claim and claim adjustment expenses | 19,205 | |||||||
Reinsurance receivables: (b) | ||||||||
Property & Casualty Operations | 2,333 | |||||||
Other Insurance Operations (c) | 2,636 | |||||||
Total reinsurance receivables | 4,969 | |||||||
Total gross liability for unpaid claims and claims adjustment expenses | $ | |||||||
| (a) | ||||||||
Other Insurance Operations amounts are primarily related to long term care claim reserves, which are long duration insurance contracts, but also include amounts related to unfunded structured settlements arising from short duration insurance contracts. |
| (b) | Reinsurance receivables presented are gross of the allowance for uncollectible reinsurance and do not include reinsurance receivables related to paid losses. | ||||
| (c) | The Other Insurance Operations reinsurance receivables are primarily related to A&EP claims covered under the loss portfolio transfer | ||||
| 114 | ||||||||
The following table presents a reconciliation between beginning and ending claim and claim adjustment expense reserves, including claim and claim adjustment expense reserves of Other Insurance Operations.
Year Ended December 31 | 2019 | 2018 | 2017 | |||||||||
(In millions) | ||||||||||||
Reserves, beginning of year: | ||||||||||||
Gross | $ | 21,984 | $ | 22,004 | $ | 22,343 | ||||||
Ceded | 4,019 | 3,934 | 4,094 | |||||||||
Net reserves, beginning of year | 17,965 | 18,070 | 18,249 | |||||||||
Net incurred claim and claim adjustment expenses: | ||||||||||||
Provision for insured events of current year | 5,356 | 5,358 | 5,201 | |||||||||
Decrease in provision for insured events of prior years | (127 | ) | (179 | ) | (381 | ) | ||||||
Amortization of discount | 184 | 176 | 179 | |||||||||
Total net incurred (a) | 5,413 | 5,355 | 4,999 | |||||||||
Net payments attributable to: | ||||||||||||
Current year events | (992 | ) | (1,046 | ) | (975 | ) | ||||||
Prior year events | (4,584 | ) | (4,285 | ) | (4,366 | ) | ||||||
Total net payments | (5,576 | ) | (5,331 | ) | (5,341 | ) | ||||||
Foreign currency translation adjustment and other | 83 | (129 | ) | 163 | ||||||||
Net reserves, end of year | 17,885 | 17,965 | 18,070 | |||||||||
Ceded reserves, end of year | 3,835 | 4,019 | 3,934 | |||||||||
Gross reserves, end of year | $ | 21,720 | $ | 21,984 | $ | 22,004 | ||||||
| Year Ended December 31 | 2021 | 2020 | 2019 | ||||||||||||||
| (In millions) | |||||||||||||||||
| Reserves, beginning of year: | |||||||||||||||||
| Gross | $ | 22,706 | $ | 21,720 | $ | 21,984 | |||||||||||
| Ceded | 4,005 | 3,835 | 4,019 | ||||||||||||||
| Net reserves, beginning of year | 18,701 | 17,885 | 17,965 | ||||||||||||||
| Reduction of net reserves due to the excess workers’ compensation loss portfolio transfer | (632) | 0 | 0 | ||||||||||||||
| Net incurred claim and claim adjustment expenses: | |||||||||||||||||
| Provision for insured events of current year | 5,970 | 5,793 | 5,356 | ||||||||||||||
| Decrease in provision for insured events of prior years | (104) | (119) | (127) | ||||||||||||||
| Amortization of discount | 174 | 183 | 184 | ||||||||||||||
Total net incurred (a) | 6,040 | 5,857 | 5,413 | ||||||||||||||
| Net payments attributable to: | |||||||||||||||||
| Current year events | (1,014) | (948) | (992) | ||||||||||||||
| Prior year events | (3,830) | (4,216) | (4,584) | ||||||||||||||
| Total net payments | (4,844) | (5,164) | (5,576) | ||||||||||||||
| Foreign currency translation adjustment and other | (60) | 123 | 83 | ||||||||||||||
| Net reserves, end of year | 19,205 | 18,701 | 17,885 | ||||||||||||||
| Ceded reserves, end of year | 4,969 | 4,005 | 3,835 | ||||||||||||||
| Gross reserves, end of year | $ | 24,174 | $ | 22,706 | $ | 21,720 | |||||||||||
| (a) | Total net incurred above does not agree to Insurance claims and policyholders’ benefits as reflected on the Consolidated Statements of | ||||
Reserving Methodology
In developing claim and claim adjustment expense (“loss” or “losses”) reserve estimates, CNA’s actuaries perform detailed reserve analyses that are staggered throughout the year. The data is organized at a reserve group level. Every reserve group is reviewed at least once during the year, but most are reviewed more frequently. The analyses generally review losses gross of ceded reinsurance and apply the ceded reinsurance terms to the gross estimates to establish estimates net of reinsurance. Factors considered include, but are not limited to, the historical pattern and volatility of the actuarial indications, the sensitivity of the actuarial indications to changes in paid and incurred loss patterns, the consistency of claims handling processes, the consistency of case reserving practices, changes in CNA’s pricing and underwriting, pricing and underwriting trends in the insurance market and legal, judicial, social and economic trends. In addition to the detailed analyses, CNA reviews actual loss emergence for all products each quarter.
In developing the loss reserve estimates for property and casualty contracts, CNA generally projects ultimate losses using several common actuarial methods as listed below. CNA reviews the various indications from the various methods and applies judgment to select an actuarial point estimate. The carried reserve may differ from the actuarial point estimate as thea result of CNA’s consideration of the factors noted above as well as the potential volatility of the projections associated with
| 115 | ||||||||
the specific product being analyzed and other factors affecting claims costs that may not be quantifiable through traditional actuarial analysis. The indicated required reserve is the difference between the selected ultimate loss and the
inception-to-date
paid losses. The difference between the selected ultimate loss and the case incurred or reported loss is IBNR. IBNR includes a provision for development on known cases as well as a provision for late reported incurred claims.The most frequently utilized methods to project ultimate losses include the following:
•Paid development: The paid development method estimates ultimate losses by reviewing paid loss patterns and applying them to accident years with further expected changes in paid losses.
•Incurred development: The incurred development method is similar to the paid development method, but it uses case incurred losses instead of paid losses.
•Loss ratio: The loss ratio method multiplies premiums by an expected loss ratio to produce ultimate loss estimates for each accident year.
•Bornhuetter-Ferguson paid loss: The Bornhuetter-Ferguson paid loss method is a combination of the paid development approach and the loss ratio approach. This method normally determines expected loss ratios similar to the approach used to estimate the expected loss ratio for the loss ratio method.
•Bornhuetter-Ferguson incurred loss: The Bornhuetter-Ferguson incurred loss method is similar to the Bornhuetter-Ferguson using premiums and paid loss method except that it uses case incurred losses.
•Frequency times severity: The frequency times severity method multiplies a projected number of Contents
ultimate claims by an estimated ultimate average loss for each accident year to produce ultimate loss estimates.•Stochastic modeling: The stochastic modeling produces a range of possible outcomes based on varying assumptions related to the particular product being modeled.
For many exposures, especially those that arecan be considered long-tail, a particular accident or policy year may not have a sufficient volume of paid losses to produce a statistically reliable estimate of ultimate losses. In such a case, CNA’s actuaries typically assign more weight to the incurred development method than to the paid development method. As claims continue to settle and the volume of paid loss increases, the actuaries may assign additional weight to the paid development method. For most of CNA’s products, even the incurred losses for accident or policy years that are early in the claim settlement process will not be of sufficient volume to produce a reliable estimate of ultimate losses. In these cases, CNA may not assign much, if any weight to the paid and incurred development methods. CNA may use the loss ratio, Bornhuetter-Ferguson andand/or frequency times severity methods. For short-tail exposures, the paid and incurred development methods can often be relied on sooner, primarily because CNA’s history includes a sufficient number of years to cover the entire period over which paid and incurred losses are expected to change. However, CNA may also use the loss ratio, Bornhuetter-Ferguson andand/or frequency times severity methods for short-tail exposures. For other more complex reserve groups where the above methods may not produce reliable indications, CNA uses additional methods tailored to the characteristics of the specific situation.
CNA’s reserving methodologies for mass tort and A&EP are similar as both are based on detailed reviews of large accounts with estimates of ultimate payments based on the facts in each case and CNA’s view of applicable law and coverage litigation.
| 116 | ||||||||
Gross and Net Carried Reserves
The following tables present the gross and net carried reserves:
Property | Other | |||||||||||
and Casualty | Insurance | |||||||||||
December 31, 2019 | Operations | Operations | Total | |||||||||
(In millions) | ||||||||||||
Gross Case Reserves | $ | 6,276 | $ | 4,713 | $ | 10,989 | ||||||
Gross IBNR Reserves | 9,494 | 1,237 | 10,731 | |||||||||
Total Gross Carried Claim and Claim Adjustment Expense Reserves | $ | 15,770 | $ | 5,950 | $ | 21,720 | ||||||
Net Case Reserves | $ | 5,645 | $ | 3,533 | $ | 9,178 | ||||||
Net IBNR Reserves | 8,508 | 199 | 8,707 | |||||||||
Total Net Carried Claim and Claim Adjustment Expense Reserves | $ | 14,153 | $ | 3,732 | $ | 17,885 | ||||||
December 31, 2018 | ||||||||||||
Gross Case Reserves | $ | 6,671 | $ | 4,724 | $ | 11,395 | ||||||
Gross IBNR Reserves | 9,287 | 1,302 | 10,589 | |||||||||
Total Gross Carried Claim and Claim Adjustment Expense Reserves | $ | 15,958 | $ | 6,026 | $ | 21,984 | ||||||
Net Case Reserves | $ | 6,063 | $ | 3,460 | $ | 9,523 | ||||||
Net IBNR Reserves | 8,290 | 152 | 8,442 | |||||||||
Total Net Carried Claim and Claim Adjustment Expense Reserves | $ | 14,353 | $ | 3,612 | $ | 17,965 | ||||||
| December 31, 2021 | Property and Casualty Operations | Other Insurance Operations | Total | ||||||||||||||
| (In millions) | |||||||||||||||||
| Gross Case Reserves | $ | 5,621 | $ | 4,934 | $ | 10,555 | |||||||||||
| Gross IBNR Reserves | 11,982 | 1,637 | 13,619 | ||||||||||||||
| Total Gross Carried Claim and Claim Adjustment Expense Reserves | $ | 17,603 | $ | 6,571 | $ | 24,174 | |||||||||||
| Net Case Reserves | $ | 4,932 | $ | 3,437 | $ | 8,369 | |||||||||||
| Net IBNR Reserves | 10,338 | 498 | 10,836 | ||||||||||||||
| Total Net Carried Claim and Claim Adjustment Expense Reserves | $ | 15,270 | $ | 3,935 | $ | 19,205 | |||||||||||
| December 31, 2020 | |||||||||||||||||
| Gross Case Reserves | $ | 5,674 | $ | 5,020 | $ | 10,694 | |||||||||||
| Gross IBNR Reserves | 10,415 | 1,597 | 12,012 | ||||||||||||||
| Total Gross Carried Claim and Claim Adjustment Expense Reserves | $ | 16,089 | $ | 6,617 | $ | 22,706 | |||||||||||
| Net Case Reserves | $ | 5,072 | $ | 3,858 | $ | 8,930 | |||||||||||
| Net IBNR Reserves | 9,123 | 648 | 9,771 | ||||||||||||||
| Total Net Carried Claim and Claim Adjustment Expense Reserves | $ | 14,195 | $ | 4,506 | $ | 18,701 | |||||||||||
Net Prior Year Development
Changes in estimates of claim and claim adjustment expense reserves, net of reinsurance, for prior years are defined as net prior year loss reserve development (“development”).development. These changes can be favorable or unfavorable.
| 117 | ||||||||
The following table and discussion presents detailpresent details of the net prior year loss reserve development in CNA’s Property & Casualty Operations and Other Insurance Operations:
Year Ended December 31 | 2019 | 2018 | 2017 | |||||||||
(In millions) | ||||||||||||
Medical professional liability | $ | 75 | $ | 47 | $ | 30 | ||||||
Other professional liability and management liability | (69) | (127) | (126) | |||||||||
Surety | (92) | (70) | (84) | |||||||||
Commercial auto | (25) | 1 | (35) | |||||||||
General liability | 54 | 32 | (24) | |||||||||
Workers’ compensation | (13) | (32) | (63) | |||||||||
Other | (3) | (32) | (6) | |||||||||
Total pretax favorable development | $ | (73) | $ | (181) | $ | (308) | ||||||
| Year Ended December 31 | 2021 | 2020 | 2019 | ||||||||||||||
| (In millions) | |||||||||||||||||
| Medical professional liability | $ | 23 | $ | 35 | $ | 75 | |||||||||||
| Other professional liability and management liability | 24 | (15) | (69) | ||||||||||||||
| Surety | (73) | (69) | (92) | ||||||||||||||
| Commercial auto | 53 | 33 | (25) | ||||||||||||||
| General liability | 15 | 15 | 16 | ||||||||||||||
| Workers’ compensation | (82) | (96) | (13) | ||||||||||||||
| Property and other | (9) | 27 | (3) | ||||||||||||||
| Other insurance operations | 60 | 50 | 38 | ||||||||||||||
| Total pretax (favorable) unfavorable development | $ | 11 | $ | (20) | $ | (73) | |||||||||||
Development Tables
For CNA’s Property & Casualty Operations, the following tables present further detail and commentary on the development reflected in the financial statements for each of the periods presented. Also presented are loss reserve development tables that illustrate the change over time of reserves established for claim and allocated claim adjustment expenses arising from short durationshort-duration insurance contracts for certain lines of business within CNA’s Property & Casualty Operations. Not all lines of business are presented based on their context to CNA’s overall loss reserves, calendar year reserve development, or calendar year net earned premiums. Insurance contracts are considered to be short durationshort-duration contracts when the contracts are not expected to remain in force for an extended period of time.
The Cumulative Net Incurred Claim and Allocated Claim Adjustment Expenses tables, reading across, show the cumulative net incurred claim and allocated claim adjustment expenses relating to each accident year at the end of the stated calendar year. Changes in the cumulative amount across time are the result of CNA’s expanded awareness of additional facts and circumstances that pertain to the unsettled claims. The Cumulative Net Paid Claim and Allocated Claim Adjustment Expenses tables, reading across, show the cumulative amount paid for claims in each accident year as of the end of the stated calendar year. The Net Strengthening or (Releases) of Prior Accident Year Reserves tables, reading across, show the net increase or decrease in the cumulative net incurred accident year claim and allocated claim adjustment expenses during each stated calendar year and indicates whether the reserves for that accident year were strengthened or released.
The information in the tables is reported on a net basis after reinsurance and does not include the effects of discounting. The information contained in calendar years 20182020 and prior is unaudited. To the extent CNA enters into a commutation, the transaction is reported on a prospective basis. To the extent that CNA enters into a disposition, the effects of the disposition are reported on a retrospective basis by removing the balances associated with it.
The amounts reported for the cumulative number of reported claims include direct and assumed open and closed claims by accident year at the claimant level. The number excludes claim counts for claims within a policy deductible where the insured is responsible for payment of losses in the deductible layer. Claim count data for certain assumed reinsurance contracts is unavailable.
In the loss reserve development tables, IBNR includes reserves for incurred but not reported losses and expected development on case reserves. CNA does not establish case reserves for allocated loss adjusted expenses (ALAE)(“ALAE”), therefore ALAE reserves are also included in the estimate of IBNR.
2021
Unfavorable development in medical professional liability was due to higher than expected large loss activity in recent accident years.
| 118 | ||||||||
Unfavorable development in other professional liability and management liability was due to higher than expected frequency of large losses in multiple accident years and higher than expected claim severity and frequency in CNA’s cyber business in recent accident years.
Favorable development in surety was primarily due to lower than expected frequency and lack of systemic activity in recent accident years.
Unfavorable development in commercial auto was due to higher than expected claim severity in CNA’s middle market and construction businesses in multiple accident years.
Unfavorable development in general liability was due to higher than expected claim severity in CNA’s construction and umbrella businesses in multiple accident years.
Favorable development in workers’ compensation was due to favorable medical trends driving lower than expected severity in multiple accident years.
Unfavorable development in other insurance operations was due to higher than expected emergence in mass tort exposures in older accident years primarily related to abuse.
2020
Unfavorable development in medical professional liability was primarily due to higher than expected frequency of large losses in recent accident years and unfavorable outcomes on specific claims in older accident years.
Favorable development in other professional liability and management liability was primarily due to lower than expected loss emergence in accident year 2017 and accident years prior to 2010.
Favorable development in surety was due to lower than expected frequency and lack of systemic loss activity for accident years 2019 and prior.
Unfavorable development in commercial auto was due to higher than expected claim severity in CNA’s middle market and construction business in recent accident years.
Unfavorable development in general liability was driven by increased bodily injury severities in accident years 2012 through 2016 and higher than expected frequency and severity in CNA’s umbrella business in accident years 2015 through 2019.
Favorable development in workers’ compensation was due to favorable medical trends driving lower than expected severity in multiple accident years.
Unfavorable development in property and other was primarily due to higher than expected large loss activity in accident year 2019 in CNA’s middle market, national accounts and marine business units.
Unfavorable development in other insurance operations was due to higher than expected emergence in mass tort exposures in older accident years primarily related to abuse.
2019
Unfavorable development in medical professional liability was primarily due to higher than expected severity in accident years 2016 through 2018 in CNA’s aging services business, higher than expected severity in accident year 2013 in the allied healthcare business, unfavorable outcomes on individual claims and higher than expected severity in accident year 2017 in the dentists business.
Favorable development in other professional liability and management liability was primarily due to lower than expected claim frequency and favorable outcomes on individual claims in accident years 2017 and prior related to financial institutions, lower than expected large claim losses in recent accident years in CNA’s public company directors and officers liability business and lower than expected loss adjustment expenses across accident years 2010 through 2018.
Favorable development in surety was due to lower than expected frequency for accident years 2018 and prior.
| 119 | ||||||||
Favorable development in commercial auto was primarily due to continued lower than expected severity across accident years 2015 and prior and a decline in bodily injury frequency in accident year 2018.
Unfavorable development in general liability was primarily due todriven by higher than expected large loss emergence in mass tort exposures, primarily fromCNA’s umbrella business in multiple accident years 2016, 2015 and prior to 2010.
Favorable development in workers’ compensation was due to favorable medical trends driving lower than expected severity in accident years 2012 through 2018.
Favorable development in property and other coverages was primarily due to lower than expected paid loss emergence on vehicle products in warranty favorable medical trends driving lower than expected severity in accident years 2012 through 2018 in workers’ compensation,and lower than expected claim severity related to catastrophe events in accident years 2017 and 2018 in property and other in Commercial and lower than expected large losses and claim severity in accident years 2018 and prior in Hardy, Europe and Canada in casualty.2018. This was mostly offset by unfavorableunfavorable development driven by higher than expected claims in Hardy on 2018 accident year Asian catastrophe events in property in International anddue to potential design and construct exposures in professional indemnity within Europe financial lines in accident years 2017 and 2018.
Unfavorable development in medical professional liabilityother insurance operations was primarily due to higher than expected severityemergence in accident years 2014 and 2017environmental mass tort exposures in CNA’s hospitals business. In addition, there was higher than expected frequency and severity in aging services in accident years 2014 through 2017 combined, partially offset by lower than expected frequency in accident year 2015.
Property & Casualty Operations – Line of Business Composition
The table below presents the net liability for unpaid claim and claim adjustment expenses, by line of business for Property & Casualty Operations:
December 31 | 2019 | |||
(In millions) | ||||
Medical professional liability | $ | 1,429 | ||
Other professional liability and management liability | 2,739 | |||
Surety | 369 | |||
Commercial auto | 404 | |||
General liability | 3,176 | |||
Workers’ compensation | 3,932 | |||
Other | 2,104 | |||
Total net liability for unpaid claim and claim adjustment expenses | $ | 14,153 | ||
| December 31 | 2021 | ||||
| (In millions) | |||||
| Medical professional liability | $ | 1,556 | |||
| Other professional liability and management liability | 3,159 | ||||
| Surety | 406 | ||||
| Commercial auto | 673 | ||||
| General liability | 2,911 | ||||
| Workers’ compensation | 3,850 | ||||
| Property and other | 2,715 | ||||
| Total net liability for unpaid claim and claim adjustment expenses | $ | 15,270 | |||
| 120 | ||||||||
Medical Professional Liability
December 31, 2019 | ||||||||||||||||||||||||||||||||||||||||||||||||
Cumulative Net Incurred Claim and Allocated Claim Adjustment Expenses | Cumulative | |||||||||||||||||||||||||||||||||||||||||||||||
Number of | ||||||||||||||||||||||||||||||||||||||||||||||||
December 31 | 2010 (a) | 2011 (a) | 2012 (a) | 2013 (a) | 2014 (a) | 2015 (a) | 2016 (a) | 2017 (a) | 2018 (a) | 2019 | IBNR | Claims | ||||||||||||||||||||||||||||||||||||
(In millions, except reported claims data) | ||||||||||||||||||||||||||||||||||||||||||||||||
Accident Year | ||||||||||||||||||||||||||||||||||||||||||||||||
2010 | $ | 402 | $ | 412 | $ | 423 | $ | 426 | $ | 415 | $ | 395 | $ | 365 | $ | 360 | $ | 356 | $ | 369 | $ | 1 | 14,624 | |||||||||||||||||||||||||
2011 | 429 | 437 | 443 | 468 | 439 | 434 | 437 | 437 | 439 | 2 | 16,526 | |||||||||||||||||||||||||||||||||||||
2012 | 464 | 469 | 508 | 498 | 493 | 484 | 493 | 499 | 8 | 17,724 | ||||||||||||||||||||||||||||||||||||||
2013 | 462 | 479 | 500 | 513 | 525 | 535 | 545 | 27 | 19,510 | |||||||||||||||||||||||||||||||||||||||
2014 | 450 | 489 | 537 | 530 | 535 | 529 | 16 | 19,723 | ||||||||||||||||||||||||||||||||||||||||
2015 | 433 | 499 | 510 | 494 | 488 | 29 | 18,029 | |||||||||||||||||||||||||||||||||||||||||
2016 | 427 | 487 | 485 | 499 | 63 | 15,823 | ||||||||||||||||||||||||||||||||||||||||||
2017 | 412 | 449 | 458 | 127 | 14,636 | |||||||||||||||||||||||||||||||||||||||||||
2018 | 404 | 429 | 216 | 13,760 | ||||||||||||||||||||||||||||||||||||||||||||
2019 | 430 | 364 | 10,467 | |||||||||||||||||||||||||||||||||||||||||||||
Total | $ | 4,685 | $ | 853 | ||||||||||||||||||||||||||||||||||||||||||||
| Cumulative Net Incurred Claim and Allocated Claim Adjustment Expenses | December 31, 2021 | |||||||||||||||||||||||||||||||||||||||||||||||||||||||||||||||||||||||||
| December 31 | 2012 (a) | 2013 (a) | 2014 (a) | 2015 (a) | 2016 (a) | 2017 (a) | 2018 (a) | 2019 (a) | 2020 (a) | 2021 | IBNR | Cumulative Number of Claims | ||||||||||||||||||||||||||||||||||||||||||||||||||||||||||||||
| (In millions, except reported claims data) | ||||||||||||||||||||||||||||||||||||||||||||||||||||||||||||||||||||||||||
| Accident Year | ||||||||||||||||||||||||||||||||||||||||||||||||||||||||||||||||||||||||||
| 2012 | $ | 464 | $ | 469 | $ | 508 | $ | 498 | $ | 493 | $ | 484 | $ | 493 | $ | 499 | $ | 497 | $ | 497 | $ | 4 | 17,755 | |||||||||||||||||||||||||||||||||||||||||||||||||||
| 2013 | 462 | 479 | 500 | 513 | 525 | 535 | 545 | 531 | 530 | 11 | 19,565 | |||||||||||||||||||||||||||||||||||||||||||||||||||||||||||||||
| 2014 | 450 | 489 | 537 | 530 | 535 | 529 | 527 | 524 | 8 | 19,800 | ||||||||||||||||||||||||||||||||||||||||||||||||||||||||||||||||
| 2015 | 433 | 499 | 510 | 494 | 488 | 510 | 501 | 28 | 18,170 | |||||||||||||||||||||||||||||||||||||||||||||||||||||||||||||||||
| 2016 | 427 | 487 | 485 | 499 | 508 | 510 | 24 | 16,085 | ||||||||||||||||||||||||||||||||||||||||||||||||||||||||||||||||||
| 2017 | 412 | 449 | 458 | 460 | 455 | 41 | 15,197 | |||||||||||||||||||||||||||||||||||||||||||||||||||||||||||||||||||
| 2018 | 404 | 429 | 431 | 448 | 60 | 14,997 | ||||||||||||||||||||||||||||||||||||||||||||||||||||||||||||||||||||
| 2019 | 430 | 445 | 458 | 156 | 13,804 | |||||||||||||||||||||||||||||||||||||||||||||||||||||||||||||||||||||
| 2020 | 477 | 476 | 347 | 9,935 | ||||||||||||||||||||||||||||||||||||||||||||||||||||||||||||||||||||||
| 2021 | 377 | 337 | 6,761 | |||||||||||||||||||||||||||||||||||||||||||||||||||||||||||||||||||||||
| Total | $ | 4,776 | $ | 1,016 | ||||||||||||||||||||||||||||||||||||||||||||||||||||||||||||||||||||||
| Cumulative Net Paid Claim and Allocated Claim Adjustment Expenses | ||||||||||||||||||||||||||||||||||||||||||||||||||||||||||||||||||||||||||
| Accident Year | ||||||||||||||||||||||||||||||||||||||||||||||||||||||||||||||||||||||||||
| 2012 | $ | 14 | $ | 117 | $ | 221 | $ | 323 | $ | 388 | $ | 427 | $ | 457 | $ | 479 | $ | 482 | $ | 487 | ||||||||||||||||||||||||||||||||||||||||||||||||||||||
| 2013 | 17 | 119 | 255 | 355 | 414 | 462 | 495 | 508 | 512 | |||||||||||||||||||||||||||||||||||||||||||||||||||||||||||||||||
| 2014 | 23 | 136 | 258 | 359 | 417 | 472 | 489 | 497 | ||||||||||||||||||||||||||||||||||||||||||||||||||||||||||||||||||
| 2015 | 22 | 101 | 230 | 313 | 384 | 420 | 444 | |||||||||||||||||||||||||||||||||||||||||||||||||||||||||||||||||||
| 2016 | 18 | 121 | 246 | 339 | 401 | 436 | ||||||||||||||||||||||||||||||||||||||||||||||||||||||||||||||||||||
| 2017 | 19 | 107 | 235 | 308 | 355 | |||||||||||||||||||||||||||||||||||||||||||||||||||||||||||||||||||||
| 2018 | 21 | 115 | 211 | 290 | ||||||||||||||||||||||||||||||||||||||||||||||||||||||||||||||||||||||
| 2019 | 17 | 91 | 183 | |||||||||||||||||||||||||||||||||||||||||||||||||||||||||||||||||||||||
| 2020 | 11 | 61 | ||||||||||||||||||||||||||||||||||||||||||||||||||||||||||||||||||||||||
| 2021 | 11 | |||||||||||||||||||||||||||||||||||||||||||||||||||||||||||||||||||||||||
| Total | $ | 3,276 | ||||||||||||||||||||||||||||||||||||||||||||||||||||||||||||||||||||||||
| Net liability for unpaid claim and allocated claim adjustment expenses for the accident years presented | $ | 1,500 | ||||||||||||||||||||||||||||||||||||||||||||||||||||||||||||||||||||||||
| Net liability for unpaid claim and claim adjustment expenses for accident years prior to 2012 | 28 | |||||||||||||||||||||||||||||||||||||||||||||||||||||||||||||||||||||||||
| Liability for unallocated claim adjustment expenses for accident years presented | 28 | |||||||||||||||||||||||||||||||||||||||||||||||||||||||||||||||||||||||||
| Total net liability for unpaid claim and claim adjustment expenses | $ | 1,556 | ||||||||||||||||||||||||||||||||||||||||||||||||||||||||||||||||||||||||
| Net Strengthening (Releases) of Prior Accident Year Reserves | ||||||||||||||||||||||||||||||||||||||||||||||||||||||||||||||||||||||||||
| Years Ended December 31 | Total | |||||||||||||||||||||||||||||||||||||||||||||||||||||||||||||||||||||||||
| Accident Year | ||||||||||||||||||||||||||||||||||||||||||||||||||||||||||||||||||||||||||
| 2012 | $ | 5 | $ | 39 | $ | (10) | $ | (5) | $ | (9) | $ | 9 | $ | 6 | $ | (2) | $ | — | $ | 33 | ||||||||||||||||||||||||||||||||||||||||||||||||||||||
| 2013 | 17 | 21 | 13 | 12 | 10 | 10 | (14) | (1) | 68 | |||||||||||||||||||||||||||||||||||||||||||||||||||||||||||||||||
| 2014 | 39 | 48 | (7) | 5 | (6) | (2) | (3) | 74 | ||||||||||||||||||||||||||||||||||||||||||||||||||||||||||||||||||
| 2015 | 66 | 11 | (16) | (6) | 22 | (9) | 68 | |||||||||||||||||||||||||||||||||||||||||||||||||||||||||||||||||||
| 2016 | 60 | (2) | 14 | 9 | 2 | 83 | ||||||||||||||||||||||||||||||||||||||||||||||||||||||||||||||||||||
| 2017 | 37 | 9 | 2 | (5) | 43 | |||||||||||||||||||||||||||||||||||||||||||||||||||||||||||||||||||||
| 2018 | 25 | 2 | 17 | 44 | ||||||||||||||||||||||||||||||||||||||||||||||||||||||||||||||||||||||
| 2019 | 15 | 13 | 28 | |||||||||||||||||||||||||||||||||||||||||||||||||||||||||||||||||||||||
| 2020 | (1) | (1) | ||||||||||||||||||||||||||||||||||||||||||||||||||||||||||||||||||||||||
| Total net development for the accident years presented above | 52 | 32 | 13 | |||||||||||||||||||||||||||||||||||||||||||||||||||||||||||||||||||||||
| Total net development for accident years prior to 2012 | 21 | 3 | 3 | |||||||||||||||||||||||||||||||||||||||||||||||||||||||||||||||||||||||
| Total unallocated claim adjustment expense development | 2 | — | 7 | |||||||||||||||||||||||||||||||||||||||||||||||||||||||||||||||||||||||
| Total | $ | 75 | $ | 35 | $ | 23 | ||||||||||||||||||||||||||||||||||||||||||||||||||||||||||||||||||||
Cumulative Net Paid Claim and Allocated Claim Adjustment Expenses | ||||||||||||||||||||||||||||||||||||||||||||||||
Accident Year | ||||||||||||||||||||||||||||||||||||||||||||||||
2010 | $ | 10 | $ | 86 | $ | 173 | $ | 257 | $ | 306 | $ | 326 | $ | 337 | $ | 346 | $ | 350 | $ | 353 | ||||||||||||||||||||||||||||
2011 | 17 | 109 | 208 | 295 | 347 | 375 | 398 | 409 | 414 | |||||||||||||||||||||||||||||||||||||||
2012 | 14 | 117 | 221 | 323 | 388 | 427 | 457 | 479 | ||||||||||||||||||||||||||||||||||||||||
2013 | 17 | 119 | 255 | 355 | 414 | 462 | 495 | |||||||||||||||||||||||||||||||||||||||||
2014 | 23 | 136 | 258 | 359 | 417 | 472 | ||||||||||||||||||||||||||||||||||||||||||
2015 | 22 | 101 | 230 | 313 | 384 | |||||||||||||||||||||||||||||||||||||||||||
2016 | 18 | 121 | 246 | 339 | ||||||||||||||||||||||||||||||||||||||||||||
2017 | 19 | 107 | 235 | |||||||||||||||||||||||||||||||||||||||||||||
2018 | 21 | 115 | ||||||||||||||||||||||||||||||||||||||||||||||
2019 | 17 | |||||||||||||||||||||||||||||||||||||||||||||||
Total | $ | 3,303 | ||||||||||||||||||||||||||||||||||||||||||||||
Net liability for unpaid claim and allocated claim adjustment expenses for the accident years presented | $ | 1,382 | ||||||||||||||||||||||||||||||||||||||||||||||
Net liability for unpaid claim and claim adjustment expenses for accident years prior to 2010 | 22 | |||||||||||||||||||||||||||||||||||||||||||||||
Liability for unallocated claim adjustment expenses for accident years presented | 25 | |||||||||||||||||||||||||||||||||||||||||||||||
Total net liability for unpaid claim and claim adjustment expenses | $ | 1,429 | ||||||||||||||||||||||||||||||||||||||||||||||
| Net Strengthening (Releases) of Prior Accident Year Reserves | ||||||||||||||||||||||||||||||||||||||||||||||||
Years Ended | ||||||||||||||||||||||||||||||||||||||||||||||||
December 31 | Total | |||||||||||||||||||||||||||||||||||||||||||||||
Accident Year | ||||||||||||||||||||||||||||||||||||||||||||||||
2010 | $ | 10 | $ | 11 | $ | 3 | $ | (11 | ) | $ | (20 | ) | $ | (30 | ) | $ | (5 | ) | $ | (4 | ) | $ | 13 | $ | (33 | ) | ||||||||||||||||||||||
2011 | 8 | 6 | 25 | (29 | ) | (5 | ) | 3 | - | 2 | 10 | |||||||||||||||||||||||||||||||||||||
2012 | �� | 5 | 39 | (10 | ) | (5 | ) | (9 | ) | 9 | 6 | 35 | ||||||||||||||||||||||||||||||||||||
2013 | 17 | 21 | 13 | 12 | 10 | 10 | 83 | |||||||||||||||||||||||||||||||||||||||||
2014 | 39 | 48 | (7 | ) | 5 | (6 | ) | 79 | ||||||||||||||||||||||||||||||||||||||||
2015 | 66 | 11 | (16 | ) | (6 | ) | 55 | |||||||||||||||||||||||||||||||||||||||||
2016 | 60 | (2 | ) | 14 | 72 | |||||||||||||||||||||||||||||||||||||||||||
2017 | 37 | 9 | 46 | |||||||||||||||||||||||||||||||||||||||||||||
2018 | 25 | 25 | ||||||||||||||||||||||||||||||||||||||||||||||
Total net development for the accident years presented above | 65 | 39 | 67 | |||||||||||||||||||||||||||||||||||||||||||||
Total net development for accident years prior to 2010 | (28 | ) | 9 | 6 | ||||||||||||||||||||||||||||||||||||||||||||
Total unallocated claim adjustment expense development | (7 | ) | (1 | ) | 2 | |||||||||||||||||||||||||||||||||||||||||||
Total | $ | 30 | $ | 47 | $ | 75 | ||||||||||||||||||||||||||||||||||||||||||
| (a) | Data presented for these calendar years is required supplemental information, which is unaudited. | ||||
| 121 | ||||||||
Other Professional Liability and Management Liability
December 31, 2019 | ||||||||||||||||||||||||||||||||||||||||||||||||
Cumulative Net Incurred Claim and Allocated Claim Adjustment Expenses | Cumulative | |||||||||||||||||||||||||||||||||||||||||||||||
Number of | ||||||||||||||||||||||||||||||||||||||||||||||||
December 31 | 2010 (a) | 2011 (a) | 2012 (a) | 2013 (a) | 2014 (a) | 2015 (a) | 2016 (a) | 2017 (a) | 2018 (a) | 2019 | IBNR | Claims | ||||||||||||||||||||||||||||||||||||
(In millions, except reported claims data) | ||||||||||||||||||||||||||||||||||||||||||||||||
Accident Year | ||||||||||||||||||||||||||||||||||||||||||||||||
2010 | $ | 828 | $ | 828 | $ | 848 | $ | 848 | $ | 847 | $ | 837 | $ | 824 | $ | 827 | $ | 821 | $ | 821 | $ | 9 | 17,891 | |||||||||||||||||||||||||
2011 | 880 | 908 | 934 | 949 | 944 | 911 | 899 | 888 | 885 | 21 | 18,738 | |||||||||||||||||||||||||||||||||||||
2012 | 923 | 909 | 887 | 878 | 840 | 846 | 833 | 831 | 18 | 18,499 | ||||||||||||||||||||||||||||||||||||||
2013 | 884 | 894 | 926 | 885 | 866 | 863 | 850 | 45 | 17,928 | |||||||||||||||||||||||||||||||||||||||
2014 | 878 | 898 | 885 | 831 | 835 | 854 | 74 | 17,553 | ||||||||||||||||||||||||||||||||||||||||
2015 | 888 | 892 | 877 | 832 | 807 | 120 | 17,390 | |||||||||||||||||||||||||||||||||||||||||
2016 | 901 | 900 | 900 | 904 | 188 | 17,890 | ||||||||||||||||||||||||||||||||||||||||||
2017 | 847 | 845 | 813 | 308 | 18,015 | |||||||||||||||||||||||||||||||||||||||||||
2018 | 850 | 864 | 460 | 19,468 | ||||||||||||||||||||||||||||||||||||||||||||
2019 | 837 | 714 | 16,722 | |||||||||||||||||||||||||||||||||||||||||||||
Total | $ | 8,466 | $ | 1,957 | ||||||||||||||||||||||||||||||||||||||||||||
| Cumulative Net Incurred Claim and Allocated Claim Adjustment Expenses | December 31, 2021 | |||||||||||||||||||||||||||||||||||||||||||||||||||||||||||||||||||||||||
| December 31 | 2012 (a) | 2013 (a) | 2014 (a) | 2015 (a) | 2016 (a) | 2017 (a) | 2018 (a) | 2019 (a) | 2020 (a) | 2021 | IBNR | Cumulative Number of Claims | ||||||||||||||||||||||||||||||||||||||||||||||||||||||||||||||
| (In millions, except reported claims data) | ||||||||||||||||||||||||||||||||||||||||||||||||||||||||||||||||||||||||||
| Accident Year | ||||||||||||||||||||||||||||||||||||||||||||||||||||||||||||||||||||||||||
| 2012 | $ | 923 | $ | 909 | $ | 887 | $ | 878 | $ | 840 | $ | 846 | $ | 833 | $ | 831 | $ | 850 | $ | 848 | $ | 18 | 18,506 | |||||||||||||||||||||||||||||||||||||||||||||||||||
| 2013 | 884 | 894 | 926 | 885 | 866 | 863 | 850 | 846 | 833 | 30 | 17,950 | |||||||||||||||||||||||||||||||||||||||||||||||||||||||||||||||
| 2014 | 878 | 898 | 885 | 831 | 835 | 854 | 845 | 841 | 37 | 17,577 | ||||||||||||||||||||||||||||||||||||||||||||||||||||||||||||||||
| 2015 | 888 | 892 | 877 | 832 | 807 | 813 | 836 | 41 | 17,436 | |||||||||||||||||||||||||||||||||||||||||||||||||||||||||||||||||
| 2016 | 901 | 900 | 900 | 904 | 907 | 891 | 84 | 17,968 | ||||||||||||||||||||||||||||||||||||||||||||||||||||||||||||||||||
| 2017 | 847 | 845 | 813 | 791 | 775 | 152 | 18,159 | |||||||||||||||||||||||||||||||||||||||||||||||||||||||||||||||||||
| 2018 | 850 | 864 | 869 | 906 | 202 | 19,926 | ||||||||||||||||||||||||||||||||||||||||||||||||||||||||||||||||||||
| 2019 | 837 | 845 | 856 | 283 | 19,357 | |||||||||||||||||||||||||||||||||||||||||||||||||||||||||||||||||||||
| 2020 | 930 | 944 | 568 | 19,095 | ||||||||||||||||||||||||||||||||||||||||||||||||||||||||||||||||||||||
| 2021 | 1,037 | 911 | 15,487 | |||||||||||||||||||||||||||||||||||||||||||||||||||||||||||||||||||||||
| Total | $ | 8,767 | $ | 2,326 | ||||||||||||||||||||||||||||||||||||||||||||||||||||||||||||||||||||||
| Cumulative Net Paid Claim and Allocated Claim Adjustment Expenses | ||||||||||||||||||||||||||||||||||||||||||||||||||||||||||||||||||||||||||
| Accident Year | ||||||||||||||||||||||||||||||||||||||||||||||||||||||||||||||||||||||||||
| 2012 | $ | 56 | $ | 248 | $ | 400 | $ | 573 | $ | 651 | $ | 711 | $ | 755 | $ | 792 | $ | 812 | $ | 816 | ||||||||||||||||||||||||||||||||||||||||||||||||||||||
| 2013 | 54 | 249 | 447 | 618 | 702 | 754 | 771 | 779 | 787 | |||||||||||||||||||||||||||||||||||||||||||||||||||||||||||||||||
| 2014 | 51 | 223 | 392 | 515 | 647 | 707 | 743 | 787 | ||||||||||||||||||||||||||||||||||||||||||||||||||||||||||||||||||
| 2015 | 60 | 234 | 404 | 542 | 612 | 677 | 725 | |||||||||||||||||||||||||||||||||||||||||||||||||||||||||||||||||||
| 2016 | 64 | 248 | 466 | 625 | 701 | 736 | ||||||||||||||||||||||||||||||||||||||||||||||||||||||||||||||||||||
| 2017 | 57 | 222 | 394 | 498 | 557 | |||||||||||||||||||||||||||||||||||||||||||||||||||||||||||||||||||||
| 2018 | 54 | 282 | 473 | 599 | ||||||||||||||||||||||||||||||||||||||||||||||||||||||||||||||||||||||
| 2019 | 64 | 263 | 422 | |||||||||||||||||||||||||||||||||||||||||||||||||||||||||||||||||||||||
| 2020 | 67 | 248 | ||||||||||||||||||||||||||||||||||||||||||||||||||||||||||||||||||||||||
| 2021 | 58 | |||||||||||||||||||||||||||||||||||||||||||||||||||||||||||||||||||||||||
| Total | $ | 5,735 | ||||||||||||||||||||||||||||||||||||||||||||||||||||||||||||||||||||||||
| Net liability for unpaid claim and allocated claim adjustment expenses for the accident years presented | $ | 3,032 | ||||||||||||||||||||||||||||||||||||||||||||||||||||||||||||||||||||||||
| Net liability for unpaid claim and claim adjustment expenses for accident years prior to 2012 | 74 | |||||||||||||||||||||||||||||||||||||||||||||||||||||||||||||||||||||||||
| Liability for unallocated claim adjustment expenses for accident years presented | 53 | |||||||||||||||||||||||||||||||||||||||||||||||||||||||||||||||||||||||||
| Total net liability for unpaid claim and claim adjustment expenses | $ | 3,159 | ||||||||||||||||||||||||||||||||||||||||||||||||||||||||||||||||||||||||
| Net Strengthening (Releases) of Prior Accident Year Reserves | ||||||||||||||||||||||||||||||||||||||||||||||||||||||||||||||||||||||||||
Years Ended December 31 | Total | |||||||||||||||||||||||||||||||||||||||||||||||||||||||||||||||||||||||||
| Accident Year | ||||||||||||||||||||||||||||||||||||||||||||||||||||||||||||||||||||||||||
| 2012 | $ | (14) | $ | (22) | $ | (9) | $ | (38) | $ | 6 | $ | (13) | $ | (2) | $ | 19 | $ | (2) | $ | (75) | ||||||||||||||||||||||||||||||||||||||||||||||||||||||
| 2013 | 10 | 32 | (41) | (19) | (3) | (13) | (4) | (13) | (51) | |||||||||||||||||||||||||||||||||||||||||||||||||||||||||||||||||
| 2014 | 20 | (13) | (54) | 4 | 19 | (9) | (4) | (37) | ||||||||||||||||||||||||||||||||||||||||||||||||||||||||||||||||||
| 2015 | 4 | (15) | (45) | (25) | 6 | 23 | (52) | |||||||||||||||||||||||||||||||||||||||||||||||||||||||||||||||||||
| 2016 | (1) | — | 4 | 3 | (16) | (10) | ||||||||||||||||||||||||||||||||||||||||||||||||||||||||||||||||||||
| 2017 | (2) | (32) | (22) | (16) | (72) | |||||||||||||||||||||||||||||||||||||||||||||||||||||||||||||||||||||
| 2018 | 14 | 5 | 37 | 56 | ||||||||||||||||||||||||||||||||||||||||||||||||||||||||||||||||||||||
| 2019 | 8 | 11 | 19 | |||||||||||||||||||||||||||||||||||||||||||||||||||||||||||||||||||||||
| 2020 | 14 | 14 | ||||||||||||||||||||||||||||||||||||||||||||||||||||||||||||||||||||||||
| Total net development for the accident years presented above | (35) | 6 | 34 | |||||||||||||||||||||||||||||||||||||||||||||||||||||||||||||||||||||||
| Total net development for accident years prior to 2012 | (20) | (21) | (12) | |||||||||||||||||||||||||||||||||||||||||||||||||||||||||||||||||||||||
| Total unallocated claim adjustment expense development | (14) | — | 2 | |||||||||||||||||||||||||||||||||||||||||||||||||||||||||||||||||||||||
| Total | $ | (69) | $ | (15) | $ | 24 | ||||||||||||||||||||||||||||||||||||||||||||||||||||||||||||||||||||
Cumulative Net Paid Claim and Allocated Claim Adjustment Expenses | ||||||||||||||||||||||||||||||||||||||||||||||||
Accident Year | ||||||||||||||||||||||||||||||||||||||||||||||||
2010 | $ | 31 | $ | 204 | $ | 405 | $ | 541 | $ | 630 | $ | 670 | $ | 721 | $ | 752 | $ | 784 | $ | 790 | ||||||||||||||||||||||||||||
2011 | 71 | 314 | 503 | 605 | 683 | 726 | 781 | 796 | 828 | |||||||||||||||||||||||||||||||||||||||
2012 | 56 | 248 | 400 | 573 | 651 | 711 | 755 | 792 | ||||||||||||||||||||||||||||||||||||||||
2013 | 54 | 249 | 447 | 618 | 702 | 754 | 771 | |||||||||||||||||||||||||||||||||||||||||
2014 | 51 | 223 | 392 | 515 | 647 | 707 | ||||||||||||||||||||||||||||||||||||||||||
2015 | 60 | 234 | 404 | 542 | 612 | |||||||||||||||||||||||||||||||||||||||||||
2016 | 64 | 248 | 466 | 625 | ||||||||||||||||||||||||||||||||||||||||||||
2017 | 57 | 222 | 394 | |||||||||||||||||||||||||||||||||||||||||||||
2018 | 54 | 282 | ||||||||||||||||||||||||||||||||||||||||||||||
2019 | 64 | |||||||||||||||||||||||||||||||||||||||||||||||
Total | $ | 5,865 | ||||||||||||||||||||||||||||||||||||||||||||||
Net liability for unpaid claim and allocated claim adjustment expenses for the accident years presented | $ | 2,601 | ||||||||||||||||||||||||||||||||||||||||||||||
Net liability for unpaid claim and claim adjustment expenses for accident years prior to 2010 | 88 | |||||||||||||||||||||||||||||||||||||||||||||||
Liability for unallocated claim adjustment expenses for accident years presented | 50 | |||||||||||||||||||||||||||||||||||||||||||||||
Total net liability for unpaid claim and claim adjustment expenses | $ | 2,739 | ||||||||||||||||||||||||||||||||||||||||||||||
Years Ended | ||||||||||||||||||||||||||||||||||||||||||||||||
December 31 | Total | |||||||||||||||||||||||||||||||||||||||||||||||
Accident Year | ||||||||||||||||||||||||||||||||||||||||||||||||
2010 | $ | - | $ | 20 | $ | - | $ | (1 | ) | $ | (10 | ) | $ | (13 | ) | $ | 3 | $ | (6 | ) | $ | - | $ | (7 | ) | |||||||||||||||||||||||
2011 | 28 | 26 | 15 | (5 | ) | (33 | ) | (12 | ) | (11 | ) | (3 | ) | 5 | ||||||||||||||||||||||||||||||||||
2012 | (14 | ) | (22 | ) | (9 | ) | (38 | ) | 6 | (13 | ) | (2 | ) | (92 | ) | |||||||||||||||||||||||||||||||||
2013 | 10 | 32 | (41 | ) | (19 | ) | (3 | ) | (13 | ) | (34 | ) | ||||||||||||||||||||||||||||||||||||
2014 | 20 | (13 | ) | (54 | ) | 4 | 19 | (24 | ) | |||||||||||||||||||||||||||||||||||||||
2015 | 4 | (15 | ) | (45 | ) | (25 | ) | (81 | ) | |||||||||||||||||||||||||||||||||||||||
2016 | (1 | ) | - | 4 | 3 | |||||||||||||||||||||||||||||||||||||||||||
2017 | (2 | ) | (32 | ) | (34 | ) | ||||||||||||||||||||||||||||||||||||||||||
2018 | 14 | 14 | ||||||||||||||||||||||||||||||||||||||||||||||
Total net development for the accident years presented above | (92 | ) | (76 | ) | (38 | ) | ||||||||||||||||||||||||||||||||||||||||||
Total net development for accident years prior to 2010 | (27 | ) | (44 | ) | (17 | ) | ||||||||||||||||||||||||||||||||||||||||||
Total unallocated claim adjustment expense development | (7 | ) | (7 | ) | (14 | ) | ||||||||||||||||||||||||||||||||||||||||||
Total | $ | (126 | ) | $ | (127 | ) | $ | (69 | ) | |||||||||||||||||||||||||||||||||||||||
| (a) | Data presented for these calendar years is required supplemental information, which is unaudited. | ||||
| 122 | ||||||||
Surety
| Cumulative Net Incurred Claim and Allocated Claim Adjustment Expenses | December 31, 2021 | |||||||||||||||||||||||||||||||||||||||||||||||||||||||||||||||||||||||||
| December 31 | 2012 (a) | 2013 (a) | 2014 (a) | 2015 (a) | 2016 (a) | 2017 (a) | 2018 (a) | 2019 (a) | 2020 (a) | 2021 | IBNR | Cumulative Number of Claims | ||||||||||||||||||||||||||||||||||||||||||||||||||||||||||||||
| (In millions, except reported claims data) | ||||||||||||||||||||||||||||||||||||||||||||||||||||||||||||||||||||||||||
| Accident Year | ||||||||||||||||||||||||||||||||||||||||||||||||||||||||||||||||||||||||||
| 2012 | $ | 120 | $ | 122 | $ | 98 | $ | 70 | $ | 52 | $ | 45 | $ | 39 | $ | 38 | $ | 37 | $ | 36 | $ | 1 | 5,586 | |||||||||||||||||||||||||||||||||||||||||||||||||||
| 2013 | 120 | 121 | 115 | 106 | 91 | 87 | 83 | 82 | 82 | 2 | 5,088 | |||||||||||||||||||||||||||||||||||||||||||||||||||||||||||||||
| 2014 | 123 | 124 | 94 | 69 | 60 | 45 | 45 | 43 | 1 | 5,118 | ||||||||||||||||||||||||||||||||||||||||||||||||||||||||||||||||
| 2015 | 131 | 131 | 104 | 79 | 63 | 58 | 53 | 9 | 5,055 | |||||||||||||||||||||||||||||||||||||||||||||||||||||||||||||||||
| 2016 | 124 | 124 | 109 | 84 | 67 | 64 | 10 | 5,521 | ||||||||||||||||||||||||||||||||||||||||||||||||||||||||||||||||||
| 2017 | 120 | 115 | 103 | 84 | 71 | 9 | 5,795 | |||||||||||||||||||||||||||||||||||||||||||||||||||||||||||||||||||
| 2018 | 114 | 108 | 91 | 62 | 19 | 6,097 | ||||||||||||||||||||||||||||||||||||||||||||||||||||||||||||||||||||
| 2019 | 119 | 112 | 98 | 44 | 5,816 | |||||||||||||||||||||||||||||||||||||||||||||||||||||||||||||||||||||
| 2020 | 128 | 119 | 104 | 4,006 | ||||||||||||||||||||||||||||||||||||||||||||||||||||||||||||||||||||||
| 2021 | 137 | 129 | 2,592 | |||||||||||||||||||||||||||||||||||||||||||||||||||||||||||||||||||||||
| Total | $ | 765 | $ | 328 | ||||||||||||||||||||||||||||||||||||||||||||||||||||||||||||||||||||||
| Cumulative Net Paid Claim and Allocated Claim Adjustment Expenses | ||||||||||||||||||||||||||||||||||||||||||||||||||||||||||||||||||||||||||
| Accident Year | ||||||||||||||||||||||||||||||||||||||||||||||||||||||||||||||||||||||||||
| 2012 | $ | 5 | $ | 32 | $ | 34 | $ | 35 | $ | 35 | $ | 36 | $ | 37 | $ | 37 | $ | 36 | $ | 36 | ||||||||||||||||||||||||||||||||||||||||||||||||||||||
| 2013 | 16 | 40 | 69 | 78 | 78 | 78 | 77 | 78 | 79 | |||||||||||||||||||||||||||||||||||||||||||||||||||||||||||||||||
| 2014 | 7 | 30 | 38 | 36 | 38 | 38 | 39 | 39 | ||||||||||||||||||||||||||||||||||||||||||||||||||||||||||||||||||
| 2015 | 7 | 26 | 38 | 40 | 42 | 44 | 42 | |||||||||||||||||||||||||||||||||||||||||||||||||||||||||||||||||||
| 2016 | 5 | 37 | 45 | 45 | 43 | 43 | ||||||||||||||||||||||||||||||||||||||||||||||||||||||||||||||||||||
| 2017 | 23 | 37 | 41 | 46 | 49 | |||||||||||||||||||||||||||||||||||||||||||||||||||||||||||||||||||||
| 2018 | 5 | 25 | 34 | 39 | ||||||||||||||||||||||||||||||||||||||||||||||||||||||||||||||||||||||
| 2019 | 12 | 34 | 44 | |||||||||||||||||||||||||||||||||||||||||||||||||||||||||||||||||||||||
| 2020 | 4 | 20 | ||||||||||||||||||||||||||||||||||||||||||||||||||||||||||||||||||||||||
| 2021 | 5 | |||||||||||||||||||||||||||||||||||||||||||||||||||||||||||||||||||||||||
| Total | $ | 396 | ||||||||||||||||||||||||||||||||||||||||||||||||||||||||||||||||||||||||
| Net liability for unpaid claim and allocated claim adjustment expenses for the accident years presented | $ | 369 | ||||||||||||||||||||||||||||||||||||||||||||||||||||||||||||||||||||||||
| Net liability for unpaid claim and claim adjustment expenses for accident years prior to 2012 | 17 | |||||||||||||||||||||||||||||||||||||||||||||||||||||||||||||||||||||||||
| Liability for unallocated claim adjustment expenses for accident years presented | 20 | |||||||||||||||||||||||||||||||||||||||||||||||||||||||||||||||||||||||||
| Total net liability for unpaid claim and claim adjustment expenses | $ | 406 | ||||||||||||||||||||||||||||||||||||||||||||||||||||||||||||||||||||||||
| Net Strengthening (Releases) of Prior Accident Year Reserves | ||||||||||||||||||||||||||||||||||||||||||||||||||||||||||||||||||||||||||
| Years Ended December 31 | Total | |||||||||||||||||||||||||||||||||||||||||||||||||||||||||||||||||||||||||
| Accident Year | ||||||||||||||||||||||||||||||||||||||||||||||||||||||||||||||||||||||||||
| 2012 | $ | 2 | $ | (24) | $ | (28) | $ | (18) | $ | (7) | $ | (6) | $ | (1) | $ | (1) | $ | (1) | $ | (84) | ||||||||||||||||||||||||||||||||||||||||||||||||||||||
| 2013 | 1 | (6) | (9) | (15) | (4) | (4) | (1) | — | (38) | |||||||||||||||||||||||||||||||||||||||||||||||||||||||||||||||||
| 2014 | 1 | (30) | (25) | (9) | (15) | — | (2) | (80) | ||||||||||||||||||||||||||||||||||||||||||||||||||||||||||||||||||
| 2015 | — | (27) | (25) | (16) | (5) | (5) | (78) | |||||||||||||||||||||||||||||||||||||||||||||||||||||||||||||||||||
| 2016 | — | (15) | (25) | (17) | (3) | (60) | ||||||||||||||||||||||||||||||||||||||||||||||||||||||||||||||||||||
| 2017 | (5) | (12) | (19) | (13) | (49) | |||||||||||||||||||||||||||||||||||||||||||||||||||||||||||||||||||||
| 2018 | (6) | (17) | (29) | (52) | ||||||||||||||||||||||||||||||||||||||||||||||||||||||||||||||||||||||
| 2019 | (7) | (14) | (21) | |||||||||||||||||||||||||||||||||||||||||||||||||||||||||||||||||||||||
| 2020 | (9) | (9) | ||||||||||||||||||||||||||||||||||||||||||||||||||||||||||||||||||||||||
| Total net development for the accident years presented above | (79) | (67) | (76) | |||||||||||||||||||||||||||||||||||||||||||||||||||||||||||||||||||||||
| Total net development for accident years prior to 2012 | (3) | (2) | 3 | |||||||||||||||||||||||||||||||||||||||||||||||||||||||||||||||||||||||
| Total unallocated claim adjustment expense development | (10) | — | — | |||||||||||||||||||||||||||||||||||||||||||||||||||||||||||||||||||||||
| Total | $ | (92) | $ | (69) | $ | (73) | ||||||||||||||||||||||||||||||||||||||||||||||||||||||||||||||||||||
December 31, 2019 | ||||||||||||||||||||||||||||||||||||||||||||||||
Cumulative Net Incurred Claim and Allocated Claim Adjustment Expenses | Cumulative | |||||||||||||||||||||||||||||||||||||||||||||||
Number of | ||||||||||||||||||||||||||||||||||||||||||||||||
December 31 | 2010 (a) | 2011 (a) | 2012 (a) | 2013 (a) | 2014 (a) | 2015 (a) | 2016 (a) | 2017 (a) | 2018 (a) | 2019 | IBNR | Claims | ||||||||||||||||||||||||||||||||||||
(In millions, except reported claims data) | ||||||||||||||||||||||||||||||||||||||||||||||||
Accident Year | ||||||||||||||||||||||||||||||||||||||||||||||||
2010 | $ | 112 | $ | 112 | $ | 111 | $ | 84 | $ | 76 | $ | 66 | $ | 63 | $ | 59 | $ | 61 | $ | 61 | $ | - | 5,982 | |||||||||||||||||||||||||
2011 | 120 | 121 | 116 | 87 | 75 | 70 | 66 | 62 | 62 | 2 | 5,813 | |||||||||||||||||||||||||||||||||||||
2012 | 120 | 122 | 98 | 70 | 52 | 45 | 39 | 38 | 1 | 5,568 | ||||||||||||||||||||||||||||||||||||||
2013 | 120 | 121 | 115 | 106 | 91 | 87 | 83 | 3 | 5,062 | |||||||||||||||||||||||||||||||||||||||
2014 | 123 | 124 | 94 | 69 | 60 | 45 | 4 | 5,078 | ||||||||||||||||||||||||||||||||||||||||
2015 | 131 | 131 | 104 | 79 | 63 | 11 | 4,976 | |||||||||||||||||||||||||||||||||||||||||
2016 | 124 | 124 | 109 | 84 | 36 | 5,379 | ||||||||||||||||||||||||||||||||||||||||||
2017 | 120 | 115 | 103 | 54 | 5,496 | |||||||||||||||||||||||||||||||||||||||||||
2018 | 114 | 108 | 76 | 5,451 | ||||||||||||||||||||||||||||||||||||||||||||
2019 | 119 | 102 | 3,549 | |||||||||||||||||||||||||||||||||||||||||||||
Total | $ | 766 | $ | 289 | ||||||||||||||||||||||||||||||||||||||||||||
Cumulative Net Paid Claim and Allocated Claim Adjustment Expenses | ||||||||||||||||||||||||||||||||||||||||||||||||
Accident Year | ||||||||||||||||||||||||||||||||||||||||||||||||
2010 | $ | 13 | $ | 34 | $ | 50 | $ | 55 | $ | 57 | $ | 58 | $ | 55 | $ | 52 | $ | 52 | $ | 53 | ||||||||||||||||||||||||||||
2011 | 19 | 42 | 55 | 58 | 60 | 60 | 56 | 57 | 57 | |||||||||||||||||||||||||||||||||||||||
2012 | 5 | 32 | 34 | 35 | 35 | 36 | 37 | 37 | ||||||||||||||||||||||||||||||||||||||||
2013 | 16 | 40 | 69 | 78 | 78 | 78 | 77 | |||||||||||||||||||||||||||||||||||||||||
2014 | 7 | 30 | 38 | 36 | 38 | 38 | ||||||||||||||||||||||||||||||||||||||||||
2015 | 7 | 26 | 38 | 40 | 42 | |||||||||||||||||||||||||||||||||||||||||||
2016 | 5 | 37 | 45 | 45 | ||||||||||||||||||||||||||||||||||||||||||||
2017 | 23 | 37 | 41 | |||||||||||||||||||||||||||||||||||||||||||||
2018 | 5 | 25 | ||||||||||||||||||||||||||||||||||||||||||||||
2019 | 12 | |||||||||||||||||||||||||||||||||||||||||||||||
Total | $ | 427 | ||||||||||||||||||||||||||||||||||||||||||||||
Net liability for unpaid claim and allocated claim adjustment expenses for the accident years presented | $ | 339 | ||||||||||||||||||||||||||||||||||||||||||||||
Net liability for unpaid claim and claim adjustment expenses for accident years prior to 2010 | 10 | |||||||||||||||||||||||||||||||||||||||||||||||
Liability for unallocated claim adjustment expenses for accident years presented | 20 | |||||||||||||||||||||||||||||||||||||||||||||||
Total net liability for unpaid claim and claim adjustment expenses | $ | 369 | ||||||||||||||||||||||||||||||||||||||||||||||
Years Ended | ||||||||||||||||||||||||||||||||||||||||||||||||
December 31 | Total | |||||||||||||||||||||||||||||||||||||||||||||||
Accident Year | ||||||||||||||||||||||||||||||||||||||||||||||||
2010 | $ | - | $ | (1 | ) | $ | (27 | ) | $ | (8 | ) | $ | (10 | ) | $ | (3 | ) | $ | (4 | ) | $ | 2 | $ | - | $ | (51 | ) | |||||||||||||||||||||
2011 | 1 | (5 | ) | (29 | ) | (12 | ) | (5 | ) | (4 | ) | (4 | ) | - | (58 | ) | ||||||||||||||||||||||||||||||||
2012 | 2 | (24 | ) | (28 | ) | (18 | ) | (7 | ) | (6 | ) | (1 | ) | (82 | ) | |||||||||||||||||||||||||||||||||
2013 | 1 | (6 | ) | (9 | ) | (15 | ) | (4 | ) | (4 | ) | (37 | ) | |||||||||||||||||||||||||||||||||||
2014 | 1 | (30 | ) | (25 | ) | (9 | ) | (15 | ) | (78 | ) | |||||||||||||||||||||||||||||||||||||
2015 | - | (27 | ) | (25 | ) | (16 | ) | (68 | ) | |||||||||||||||||||||||||||||||||||||||
2016 | - | (15 | ) | (25 | ) | (40 | ) | |||||||||||||||||||||||||||||||||||||||||
2017 | (5 | ) | (12 | ) | (17 | ) | ||||||||||||||||||||||||||||||||||||||||||
2018 | (6 | ) | (6 | ) | ||||||||||||||||||||||||||||||||||||||||||||
Total net development for the accident years presented above | (82 | ) | (66 | ) | (79 | ) | ||||||||||||||||||||||||||||||||||||||||||
Total net development for accident years prior to 2010 | 1 | (4 | ) | (3 | ) | |||||||||||||||||||||||||||||||||||||||||||
Total unallocated claim adjustment expense development | (3 | ) | - | (10 | ) | |||||||||||||||||||||||||||||||||||||||||||
Total | $ | (84 | ) | $ | (70 | ) | $ | (92 | ) | |||||||||||||||||||||||||||||||||||||||
| (a) | Data presented for these calendar years is required supplemental information, which is unaudited. | ||||
| 123 | ||||||||
Commercial Auto
| Cumulative Net Incurred Claim and Allocated Claim Adjustment Expenses | December 31, 2021 | |||||||||||||||||||||||||||||||||||||||||||||||||||||||||||||||||||||||||
| December 31 | 2012 (a) | 2013 (a) | 2014 (a) | 2015 (a) | 2016 (a) | 2017 (a) | 2018 (a) | 2019 (a) | 2020 (a) | 2021 | IBNR | Cumulative Number of Claims | ||||||||||||||||||||||||||||||||||||||||||||||||||||||||||||||
| (In millions, except reported claims data) | ||||||||||||||||||||||||||||||||||||||||||||||||||||||||||||||||||||||||||
| Accident Year | ||||||||||||||||||||||||||||||||||||||||||||||||||||||||||||||||||||||||||
| 2012 | $ | 275 | $ | 289 | $ | 299 | $ | 303 | $ | 307 | $ | 299 | $ | 299 | $ | 297 | $ | 296 | $ | 295 | $ | 1 | 46,288 | |||||||||||||||||||||||||||||||||||||||||||||||||||
| 2013 | 246 | 265 | 265 | 249 | 245 | 245 | 241 | 241 | 241 | 2 | 39,430 | |||||||||||||||||||||||||||||||||||||||||||||||||||||||||||||||
| 2014 | 234 | 223 | 212 | 205 | 205 | 201 | 201 | 202 | 2 | 33,628 | ||||||||||||||||||||||||||||||||||||||||||||||||||||||||||||||||
| 2015 | 201 | 199 | 190 | 190 | 183 | 181 | 183 | 3 | 30,427 | |||||||||||||||||||||||||||||||||||||||||||||||||||||||||||||||||
| 2016 | 198 | 186 | 186 | 186 | 190 | 195 | 3 | 30,449 | ||||||||||||||||||||||||||||||||||||||||||||||||||||||||||||||||||
| 2017 | 199 | 198 | 200 | 221 | 232 | 5 | 30,940 | |||||||||||||||||||||||||||||||||||||||||||||||||||||||||||||||||||
| 2018 | 229 | 227 | 227 | 245 | 8 | 34,292 | ||||||||||||||||||||||||||||||||||||||||||||||||||||||||||||||||||||
| 2019 | 257 | 266 | 289 | 31 | 37,142 | |||||||||||||||||||||||||||||||||||||||||||||||||||||||||||||||||||||
| 2020 | 310 | 303 | 107 | 28,837 | ||||||||||||||||||||||||||||||||||||||||||||||||||||||||||||||||||||||
| 2021 | 397 | 271 | 27,182 | |||||||||||||||||||||||||||||||||||||||||||||||||||||||||||||||||||||||
| Total | $ | 2,582 | $ | 433 | ||||||||||||||||||||||||||||||||||||||||||||||||||||||||||||||||||||||
| Cumulative Net Paid Claim and Allocated Claim Adjustment Expenses | ||||||||||||||||||||||||||||||||||||||||||||||||||||||||||||||||||||||||||
| Accident Year | ||||||||||||||||||||||||||||||||||||||||||||||||||||||||||||||||||||||||||
| 2012 | $ | 78 | $ | 160 | $ | 220 | $ | 259 | $ | 282 | $ | 285 | $ | 290 | $ | 291 | $ | 291 | $ | 292 | ||||||||||||||||||||||||||||||||||||||||||||||||||||||
| 2013 | 74 | 135 | 168 | 200 | 225 | 234 | 238 | 239 | 239 | |||||||||||||||||||||||||||||||||||||||||||||||||||||||||||||||||
| 2014 | 64 | 102 | 137 | 166 | 187 | 196 | 198 | 199 | ||||||||||||||||||||||||||||||||||||||||||||||||||||||||||||||||||
| 2015 | 52 | 96 | 130 | 153 | 172 | 175 | 178 | |||||||||||||||||||||||||||||||||||||||||||||||||||||||||||||||||||
| 2016 | 52 | 93 | 126 | 154 | 175 | 185 | ||||||||||||||||||||||||||||||||||||||||||||||||||||||||||||||||||||
| 2017 | 58 | 107 | 150 | 178 | 203 | |||||||||||||||||||||||||||||||||||||||||||||||||||||||||||||||||||||
| 2018 | 66 | 128 | 175 | 212 | ||||||||||||||||||||||||||||||||||||||||||||||||||||||||||||||||||||||
| 2019 | 77 | 147 | 203 | |||||||||||||||||||||||||||||||||||||||||||||||||||||||||||||||||||||||
| 2020 | 71 | 134 | ||||||||||||||||||||||||||||||||||||||||||||||||||||||||||||||||||||||||
| 2021 | 83 | |||||||||||||||||||||||||||||||||||||||||||||||||||||||||||||||||||||||||
| Total | $ | 1,928 | ||||||||||||||||||||||||||||||||||||||||||||||||||||||||||||||||||||||||
| Net liability for unpaid claim and allocated claim adjustment expenses for the accident years presented | $ | 654 | ||||||||||||||||||||||||||||||||||||||||||||||||||||||||||||||||||||||||
| Net liability for unpaid claim and claim adjustment expenses for accident years prior to 2012 | 5 | |||||||||||||||||||||||||||||||||||||||||||||||||||||||||||||||||||||||||
| Liability for unallocated claim adjustment expenses for accident years presented | 14 | |||||||||||||||||||||||||||||||||||||||||||||||||||||||||||||||||||||||||
| Total net liability for unpaid claim and claim adjustment expenses | $ | 673 | ||||||||||||||||||||||||||||||||||||||||||||||||||||||||||||||||||||||||
| Net Strengthening (Releases) of Prior Accident Year Reserves | ||||||||||||||||||||||||||||||||||||||||||||||||||||||||||||||||||||||||||
| Years Ended December 31 | Total | |||||||||||||||||||||||||||||||||||||||||||||||||||||||||||||||||||||||||
| Accident Year | ||||||||||||||||||||||||||||||||||||||||||||||||||||||||||||||||||||||||||
| 2012 | $ | 14 | $ | 10 | $ | 4 | $ | 4 | $ | (8) | $ | — | $ | (2) | $ | (1) | $ | (1) | $ | 20 | ||||||||||||||||||||||||||||||||||||||||||||||||||||||
| 2013 | 19 | — | (16) | (4) | — | (4) | — | — | (5) | |||||||||||||||||||||||||||||||||||||||||||||||||||||||||||||||||
| 2014 | (11) | (11) | (7) | — | (4) | — | 1 | (32) | ||||||||||||||||||||||||||||||||||||||||||||||||||||||||||||||||||
| 2015 | (2) | (9) | — | (7) | (2) | 2 | (18) | |||||||||||||||||||||||||||||||||||||||||||||||||||||||||||||||||||
| 2016 | (12) | — | — | 4 | 5 | (3) | ||||||||||||||||||||||||||||||||||||||||||||||||||||||||||||||||||||
| 2017 | (1) | 2 | 21 | 11 | 33 | |||||||||||||||||||||||||||||||||||||||||||||||||||||||||||||||||||||
| 2018 | (2) | — | 18 | 16 | ||||||||||||||||||||||||||||||||||||||||||||||||||||||||||||||||||||||
| 2019 | 9 | 23 | 32 | |||||||||||||||||||||||||||||||||||||||||||||||||||||||||||||||||||||||
| 2020 | (7) | (7) | ||||||||||||||||||||||||||||||||||||||||||||||||||||||||||||||||||||||||
| Total net development for the accident years presented above | (17) | 31 | 52 | |||||||||||||||||||||||||||||||||||||||||||||||||||||||||||||||||||||||
| Total net development for accident years prior to 2012 | (7) | 2 | 1 | |||||||||||||||||||||||||||||||||||||||||||||||||||||||||||||||||||||||
| Total unallocated claim adjustment expense development | (1) | — | — | |||||||||||||||||||||||||||||||||||||||||||||||||||||||||||||||||||||||
| Total | $ | (25) | $ | 33 | $ | 53 | ||||||||||||||||||||||||||||||||||||||||||||||||||||||||||||||||||||
December 31, 2019 | ||||||||||||||||||||||||||||||||||||||||||||||||
Cumulative Net Incurred Claim and Allocated Claim Adjustment Expenses | Cumulative | |||||||||||||||||||||||||||||||||||||||||||||||
Number of | ||||||||||||||||||||||||||||||||||||||||||||||||
December 31 | 2010 (a) | 2011 (a) | 2012 (a) | 2013 (a) | 2014 (a) | 2015 (a) | 2016 (a) | 2017 (a) | 2018 (a) | 2019 | IBNR | Claims | ||||||||||||||||||||||||||||||||||||
(In millions, except reported claims data) | ||||||||||||||||||||||||||||||||||||||||||||||||
Accident Year | ||||||||||||||||||||||||||||||||||||||||||||||||
2010 | $ | 267 | $ | 283 | $ | 287 | $ | 291 | $ | 298 | $ | 293 | $ | 289 | $ | 288 | $ | 288 | $ | 288 | $ | 1 | 48,035 | |||||||||||||||||||||||||
2011 | 268 | 281 | 288 | 302 | 300 | 294 | 294 | 294 | 291 | - | 47,909 | |||||||||||||||||||||||||||||||||||||
2012 | 275 | 289 | 299 | 303 | 307 | 299 | 299 | 297 | 3 | 46,288 | ||||||||||||||||||||||||||||||||||||||
2013 | 246 | 265 | 265 | 249 | 245 | 245 | 241 | 2 | 39,429 | |||||||||||||||||||||||||||||||||||||||
2014 | 234 | 223 | 212 | 205 | 205 | 201 | 3 | 33,622 | ||||||||||||||||||||||||||||||||||||||||
2015 | 201 | 199 | 190 | 190 | 183 | 7 | 30,418 | |||||||||||||||||||||||||||||||||||||||||
2016 | 198 | 186 | 186 | 186 | 7 | 30,414 | ||||||||||||||||||||||||||||||||||||||||||
2017 | 199 | 198 | 200 | 9 | 30,850 | |||||||||||||||||||||||||||||||||||||||||||
2018 | 229 | 227 | 47 | 33,959 | ||||||||||||||||||||||||||||||||||||||||||||
2019 | 257 | 128 | 31,455 | |||||||||||||||||||||||||||||||||||||||||||||
Total | $ | 2,371 | $ | 207 | ||||||||||||||||||||||||||||||||||||||||||||
| Cumulative Net Paid Claim and Allocated Claim Adjustment Expenses | ||||||||||||||||||||||||||||||||||||||||||||||||
Accident Year | ||||||||||||||||||||||||||||||||||||||||||||||||
2010 | $ | 74 | $ | 141 | $ | 203 | $ | 246 | $ | 271 | $ | 281 | $ | 286 | $ | 287 | $ | 287 | $ | 287 | ||||||||||||||||||||||||||||
2011 | 79 | 145 | 199 | 248 | 274 | 284 | 287 | 289 | 289 | |||||||||||||||||||||||||||||||||||||||
2012 | 78 | 160 | 220 | 259 | 282 | 285 | 290 | 291 | ||||||||||||||||||||||||||||||||||||||||
2013 | 74 | 135 | 168 | 200 | 225 | 234 | 238 | |||||||||||||||||||||||||||||||||||||||||
2014 | 64 | 102 | 137 | 166 | 187 | 196 | ||||||||||||||||||||||||||||||||||||||||||
2015 | 52 | 96 | 130 | 153 | 172 | |||||||||||||||||||||||||||||||||||||||||||
2016 | 52 | 93 | 126 | 154 | ||||||||||||||||||||||||||||||||||||||||||||
2017 | 58 | 107 | 150 | |||||||||||||||||||||||||||||||||||||||||||||
2018 | 66 | 128 | ||||||||||||||||||||||||||||||||||||||||||||||
2019 | 77 | |||||||||||||||||||||||||||||||||||||||||||||||
Total | $ | 1,982 | ||||||||||||||||||||||||||||||||||||||||||||||
Net liability for unpaid claim and allocated claim adjustment expenses for the accident years presented | $ | 389 | ||||||||||||||||||||||||||||||||||||||||||||||
Net liability for unpaid claim and claim adjustment expenses for accident years prior to 2010 | 1 | |||||||||||||||||||||||||||||||||||||||||||||||
Liability for unallocated claim adjustment expenses for accident years presented | 14 | |||||||||||||||||||||||||||||||||||||||||||||||
Total net liability for unpaid claim and claim adjustment expenses | $ | 404 | ||||||||||||||||||||||||||||||||||||||||||||||
Years Ended | ||||||||||||||||||||||||||||||||||||||||||||||||
December 31 | Total | |||||||||||||||||||||||||||||||||||||||||||||||
Accident Year | ||||||||||||||||||||||||||||||||||||||||||||||||
2010 | $ | 16 | $ | 4 | $ | 4 | $ | 7 | $ | (5 | ) | $ | (4 | ) | $ | (1 | ) | $ | - | $ | - | $ | 21 | |||||||||||||||||||||||||
2011 | 13 | 7 | 14 | (2 | ) | (6 | ) | - | - | (3 | ) | 23 | ||||||||||||||||||||||||||||||||||||
2012 | 14 | 10 | 4 | 4 | (8 | ) | - | (2 | ) | 22 | ||||||||||||||||||||||||||||||||||||||
2013 | 19 | - | (16 | ) | (4 | ) | - | (4 | ) | (5 | ) | |||||||||||||||||||||||||||||||||||||
2014 | (11 | ) | (11 | ) | (7 | ) | - | (4 | ) | (33 | ) | |||||||||||||||||||||||||||||||||||||
2015 | (2 | ) | (9 | ) | - | (7 | ) | (18 | ) | |||||||||||||||||||||||||||||||||||||||
2016 | (12 | ) | - | - | (12 | ) | ||||||||||||||||||||||||||||||||||||||||||
2017 | (1 | ) | 2 | 1 | ||||||||||||||||||||||||||||||||||||||||||||
2018 | (2 | ) | (2 | ) | ||||||||||||||||||||||||||||||||||||||||||||
Total net development for the accident years presented above | (41 | ) | (1 | ) | (20 | ) | ||||||||||||||||||||||||||||||||||||||||||
Total net development for accident years prior to 2010 | 4 | 1 | (4 | ) | ||||||||||||||||||||||||||||||||||||||||||||
Total unallocated claim adjustment expense development | 2 | 1 | (1 | ) | ||||||||||||||||||||||||||||||||||||||||||||
Total | $ | (35 | ) | $ | 1 | $ | (25 | ) | ||||||||||||||||||||||||||||||||||||||||
| (a) | Data presented for these calendar years is required supplemental information, which is unaudited. | ||||
| 124 | ||||||||
General Liability
December 31, 2019 | ||||||||||||||||||||||||||||||||||||||||||||||||
Cumulative Net Incurred Claim and Allocated Claim Adjustment Expenses | Cumulative | |||||||||||||||||||||||||||||||||||||||||||||||
Number of | ||||||||||||||||||||||||||||||||||||||||||||||||
December 31 | 2010 (a) | 2011 (a) | 2012 (a) | 2013 (a) | 2014 (a) | 2015 (a) | 2016 (a) | 2017 (a) | 2018 (a) | 2019 | IBNR | Claims | ||||||||||||||||||||||||||||||||||||
(In millions, except reported claims data) | ||||||||||||||||||||||||||||||||||||||||||||||||
Accident Year | ||||||||||||||||||||||||||||||||||||||||||||||||
2010 | $ | 646 | $ | 664 | $ | 658 | $ | 709 | $ | 750 | $ | 726 | $ | 697 | $ | 691 | $ | 691 | $ | 690 | $ | 19 | 44,229 | |||||||||||||||||||||||||
2011 | 591 | 589 | 631 | 677 | 676 | 681 | 670 | 669 | 667 | 20 | 39,361 | |||||||||||||||||||||||||||||||||||||
2012 | 587 | 611 | 639 | 636 | 619 | 635 | 635 | 630 | 31 | 35,219 | ||||||||||||||||||||||||||||||||||||||
2013 | 650 | 655 | 650 | 655 | 613 | 623 | 620 | 27 | 33,570 | |||||||||||||||||||||||||||||||||||||||
2014 | 653 | 658 | 654 | 631 | 635 | 658 | 57 | 27,877 | ||||||||||||||||||||||||||||||||||||||||
2015 | 581 | 576 | 574 | 589 | 600 | 73 | 23,834 | |||||||||||||||||||||||||||||||||||||||||
2016 | 623 | 659 | 667 | 671 | 166 | 23,817 | ||||||||||||||||||||||||||||||||||||||||||
2017 | 632 | 632 | 632 | 226 | 21,114 | |||||||||||||||||||||||||||||||||||||||||||
2018 | 653 | 644 | 408 | 17,889 | ||||||||||||||||||||||||||||||||||||||||||||
2019 | 680 | 602 | 12,916 | |||||||||||||||||||||||||||||||||||||||||||||
Total | $ | 6,492 | $ | 1,629 | ||||||||||||||||||||||||||||||||||||||||||||
| Cumulative Net Incurred Claim and Allocated Claim Adjustment Expenses | December 31, 2021 | |||||||||||||||||||||||||||||||||||||||||||||||||||||||||||||||||||||||||
| December 31 | 2012 (a) | 2013 (a) | 2014 (a) | 2015 (a) | 2016 (a) | 2017 (a) | 2018 (a) | 2019 (a) | 2020 (a) | 2021 | IBNR | Cumulative Number of Claims | ||||||||||||||||||||||||||||||||||||||||||||||||||||||||||||||
| (In millions, except reported claims data) | ||||||||||||||||||||||||||||||||||||||||||||||||||||||||||||||||||||||||||
| Accident Year | ||||||||||||||||||||||||||||||||||||||||||||||||||||||||||||||||||||||||||
| 2012 | $ | 587 | $ | 611 | $ | 639 | $ | 636 | $ | 619 | $ | 635 | $ | 635 | $ | 630 | $ | 632 | $ | 632 | $ | 20 | 35,313 | |||||||||||||||||||||||||||||||||||||||||||||||||||
| 2013 | 650 | 655 | 650 | 655 | 613 | 623 | 620 | 623 | 624 | 24 | 33,706 | |||||||||||||||||||||||||||||||||||||||||||||||||||||||||||||||
| 2014 | 653 | 658 | 654 | 631 | 635 | 658 | 659 | 659 | 28 | 28,064 | ||||||||||||||||||||||||||||||||||||||||||||||||||||||||||||||||
| 2015 | 581 | 576 | 574 | 589 | 600 | 602 | 617 | 42 | 24,118 | |||||||||||||||||||||||||||||||||||||||||||||||||||||||||||||||||
| 2016 | 623 | 659 | 667 | 671 | 673 | 683 | 68 | 24,511 | ||||||||||||||||||||||||||||||||||||||||||||||||||||||||||||||||||
| 2017 | 632 | 632 | 632 | 634 | 630 | 67 | 22,195 | |||||||||||||||||||||||||||||||||||||||||||||||||||||||||||||||||||
| 2018 | 653 | 644 | 646 | 639 | 205 | 19,917 | ||||||||||||||||||||||||||||||||||||||||||||||||||||||||||||||||||||
| 2019 | 680 | 682 | 682 | 330 | 18,602 | |||||||||||||||||||||||||||||||||||||||||||||||||||||||||||||||||||||
| 2020 | 723 | 722 | 516 | 13,028 | ||||||||||||||||||||||||||||||||||||||||||||||||||||||||||||||||||||||
| 2021 | 782 | 706 | 9,759 | |||||||||||||||||||||||||||||||||||||||||||||||||||||||||||||||||||||||
| Total | $ | 6,670 | $ | 2,006 | ||||||||||||||||||||||||||||||||||||||||||||||||||||||||||||||||||||||
| Cumulative Net Paid Claim and Allocated Claim Adjustment Expenses | ||||||||||||||||||||||||||||||||||||||||||||||||||||||||||||||||||||||||||
| Accident Year | ||||||||||||||||||||||||||||||||||||||||||||||||||||||||||||||||||||||||||
| 2012 | $ | 28 | $ | 132 | $ | 247 | $ | 374 | $ | 454 | $ | 510 | $ | 559 | $ | 579 | $ | 597 | $ | 602 | ||||||||||||||||||||||||||||||||||||||||||||||||||||||
| 2013 | 31 | 128 | 240 | 352 | 450 | 510 | 551 | 572 | 582 | |||||||||||||||||||||||||||||||||||||||||||||||||||||||||||||||||
| 2014 | 31 | 119 | 247 | 376 | 481 | 547 | 569 | 607 | ||||||||||||||||||||||||||||||||||||||||||||||||||||||||||||||||||
| 2015 | 19 | 110 | 230 | 357 | 446 | 501 | 530 | |||||||||||||||||||||||||||||||||||||||||||||||||||||||||||||||||||
| 2016 | 32 | 163 | 279 | 407 | 481 | 524 | ||||||||||||||||||||||||||||||||||||||||||||||||||||||||||||||||||||
| 2017 | 23 | 118 | 250 | 399 | 471 | |||||||||||||||||||||||||||||||||||||||||||||||||||||||||||||||||||||
| 2018 | 33 | 107 | 228 | 307 | ||||||||||||||||||||||||||||||||||||||||||||||||||||||||||||||||||||||
| 2019 | 25 | 98 | 181 | |||||||||||||||||||||||||||||||||||||||||||||||||||||||||||||||||||||||
| 2020 | 23 | 99 | ||||||||||||||||||||||||||||||||||||||||||||||||||||||||||||||||||||||||
| 2021 | 26 | |||||||||||||||||||||||||||||||||||||||||||||||||||||||||||||||||||||||||
| Total | $ | 3,929 | ||||||||||||||||||||||||||||||||||||||||||||||||||||||||||||||||||||||||
| Net liability for unpaid claim and allocated claim adjustment expenses for the accident years presented | $ | 2,741 | ||||||||||||||||||||||||||||||||||||||||||||||||||||||||||||||||||||||||
| Net liability for unpaid claim and claim adjustment expenses for accident years prior to 2012 | 119 | |||||||||||||||||||||||||||||||||||||||||||||||||||||||||||||||||||||||||
| Liability for unallocated claim adjustment expenses for accident years presented | 51 | |||||||||||||||||||||||||||||||||||||||||||||||||||||||||||||||||||||||||
| Total net liability for unpaid claim and claim adjustment expenses | $ | 2,911 | ||||||||||||||||||||||||||||||||||||||||||||||||||||||||||||||||||||||||
Cumulative Net Paid Claim and Allocated Claim Adjustment Expenses | ||||||||||||||||||||||||||||||||||||||||||||||||
Accident Year | ||||||||||||||||||||||||||||||||||||||||||||||||
2010 | $ | 27 | $ | 145 | $ | 280 | $ | 429 | $ | 561 | $ | 611 | $ | 642 | $ | 652 | $ | 656 | $ | 667 | ||||||||||||||||||||||||||||
2011 | 28 | 148 | 273 | 411 | 517 | 568 | 602 | 622 | 638 | |||||||||||||||||||||||||||||||||||||||
2012 | 28 | 132 | 247 | 374 | 454 | 510 | 559 | 579 | ||||||||||||||||||||||||||||||||||||||||
2013 | 31 | 128 | 240 | 352 | 450 | 510 | 551 | |||||||||||||||||||||||||||||||||||||||||
2014 | 31 | 119 | 247 | 376 | 481 | 547 | ||||||||||||||||||||||||||||||||||||||||||
2015 | 19 | 110 | 230 | 357 | 446 | |||||||||||||||||||||||||||||||||||||||||||
2016 | 32 | 163 | 279 | 407 | ||||||||||||||||||||||||||||||||||||||||||||
2017 | 23 | 118 | 250 | |||||||||||||||||||||||||||||||||||||||||||||
2018 | 33 | 107 | ||||||||||||||||||||||||||||||||||||||||||||||
2019 | 25 | |||||||||||||||||||||||||||||||||||||||||||||||
Total | $ | 4,217 | ||||||||||||||||||||||||||||||||||||||||||||||
Net liability for unpaid claim and allocated claim adjustment expenses for the accident years presented | $ | 2,275 | ||||||||||||||||||||||||||||||||||||||||||||||
Net liability for unpaid claim and claim adjustment expenses for accident years prior to 2010 | 836 | |||||||||||||||||||||||||||||||||||||||||||||||
Liability for unallocated claim adjustment expenses for accident years presented | 65 | |||||||||||||||||||||||||||||||||||||||||||||||
Total net liability for unpaid claim and claim adjustment expenses | $ | 3,176 | ||||||||||||||||||||||||||||||||||||||||||||||
Net Strengthening (Releases) of Prior Accident Year Reserves
Years Ended December 31 | Total | |||||||||||||||||||||||||||||||||||||||||||||||
Accident Year | ||||||||||||||||||||||||||||||||||||||||||||||||
2010 | $ | 18 | $ | (6 | ) | $ | 51 | $ | 41 | $ | (24 | ) | $ | (29 | ) | $ | (6 | ) | $ | - | $ | (1 | ) | $ | 44 | |||||||||||||||||||||||
2011 | (2 | ) | 42 | 46 | (1 | ) | 5 | (11 | ) | (1 | ) | (2 | ) | 76 | ||||||||||||||||||||||||||||||||||
2012 | 24 | 28 | (3 | ) | (17 | ) | 16 | - | (5 | ) | 43 | |||||||||||||||||||||||||||||||||||||
2013 | 5 | (5 | ) | 5 | (42 | ) | 10 | (3 | ) | (30 | ) | |||||||||||||||||||||||||||||||||||||
2014 | 5 | (4 | ) | (23 | ) | 4 | 23 | 5 | ||||||||||||||||||||||||||||||||||||||||
2015 | (5 | ) | (2 | ) | 15 | 11 | 19 | |||||||||||||||||||||||||||||||||||||||||
2016 | 36 | 8 | 4 | 48 | ||||||||||||||||||||||||||||||||||||||||||||
2017 | - | - | - | |||||||||||||||||||||||||||||||||||||||||||||
2018 | (9 | ) | (9 | ) | ||||||||||||||||||||||||||||||||||||||||||||
Total net development for the accident years presented above | (32 | ) | 36 | 18 | ||||||||||||||||||||||||||||||||||||||||||||
Total net development for accident years prior to 2010 | - | - | 29 | |||||||||||||||||||||||||||||||||||||||||||||
Total unallocated claim adjustment expense development | 8 | (4 | ) | 7 | ||||||||||||||||||||||||||||||||||||||||||||
Total | $ | (24 | ) | $ | 32 | $ | 54 | |||||||||||||||||||||||||||||||||||||||||
| Years Ended December 31 | Total | |||||||||||||||||||||||||||||||||||||||||||||||||||||||||||||||||||||||||
| Accident Year | ||||||||||||||||||||||||||||||||||||||||||||||||||||||||||||||||||||||||||
| 2012 | $ | 24 | $ | 28 | $ | (3) | $ | (17) | $ | 16 | $ | — | $ | (5) | $ | 2 | $ | — | $ | 45 | ||||||||||||||||||||||||||||||||||||||||||||||||||||||
| 2013 | 5 | (5) | 5 | (42) | 10 | (3) | 3 | 1 | (26) | |||||||||||||||||||||||||||||||||||||||||||||||||||||||||||||||||
| 2014 | 5 | (4) | (23) | 4 | 23 | 1 | — | 6 | ||||||||||||||||||||||||||||||||||||||||||||||||||||||||||||||||||
| 2015 | (5) | (2) | 15 | 11 | 2 | 15 | 36 | |||||||||||||||||||||||||||||||||||||||||||||||||||||||||||||||||||
| 2016 | 36 | 8 | 4 | 2 | 10 | 60 | ||||||||||||||||||||||||||||||||||||||||||||||||||||||||||||||||||||
| 2017 | — | — | 2 | (4) | (2) | |||||||||||||||||||||||||||||||||||||||||||||||||||||||||||||||||||||
| 2018 | (9) | 2 | (7) | (14) | ||||||||||||||||||||||||||||||||||||||||||||||||||||||||||||||||||||||
| 2019 | 2 | — | 2 | |||||||||||||||||||||||||||||||||||||||||||||||||||||||||||||||||||||||
| 2020 | (1) | (1) | ||||||||||||||||||||||||||||||||||||||||||||||||||||||||||||||||||||||||
| Total net development for the accident years presented above | 21 | 16 | 14 | |||||||||||||||||||||||||||||||||||||||||||||||||||||||||||||||||||||||
| Total net development for accident years prior to 2012 | (4) | (1) | (1) | |||||||||||||||||||||||||||||||||||||||||||||||||||||||||||||||||||||||
| Total unallocated claim adjustment expense development | (1) | — | 2 | |||||||||||||||||||||||||||||||||||||||||||||||||||||||||||||||||||||||
| Total | $ | 16 | $ | 15 | $ | 15 | ||||||||||||||||||||||||||||||||||||||||||||||||||||||||||||||||||||
| (a) | Data presented for these calendar years is required supplemental information, which is unaudited. | ||||
| 125 | ||||||||
Workers’ Compensation
December 31, 2019 | ||||||||||||||||||||||||||||||||||||||||||||||||
Cumulative Net Incurred Claim and Allocated Claim Adjustment Expenses | Cumulative | |||||||||||||||||||||||||||||||||||||||||||||||
Number of | ||||||||||||||||||||||||||||||||||||||||||||||||
December 31 | 2010 (a) | 2011 (a) | 2012 (a) | 2013 (a) | 2014 (a) | 2015 (a) | 2016 (a) | 2017 (a) | 2018 (a) | 2019 | IBNR | Claims | ||||||||||||||||||||||||||||||||||||
(In millions, except reported claims data) | ||||||||||||||||||||||||||||||||||||||||||||||||
Accident Year | ||||||||||||||||||||||||||||||||||||||||||||||||
2010 | $ | 583 | $ | 632 | $ | 654 | $ | 676 | $ | 698 | $ | 710 | $ | 730 | $ | 733 | $ | 732 | $ | 735 | $ | 55 | 49,333 | |||||||||||||||||||||||||
2011 | 607 | 641 | 647 | 659 | 651 | 676 | 676 | 674 | 688 | 40 | 45,959 | |||||||||||||||||||||||||||||||||||||
2012 | 601 | 627 | 659 | 669 | 678 | 673 | 671 | 668 | 67 | 42,586 | ||||||||||||||||||||||||||||||||||||||
2013 | 537 | 572 | 592 | 618 | 593 | 582 | 561 | 93 | 38,688 | |||||||||||||||||||||||||||||||||||||||
2014 | 467 | 480 | 479 | 452 | 450 | 446 | 99 | 33,480 | ||||||||||||||||||||||||||||||||||||||||
2015 | 422 | 431 | 406 | 408 | 394 | 130 | 31,861 | |||||||||||||||||||||||||||||||||||||||||
2016 | 426 | 405 | 396 | 382 | 144 | 31,945 | ||||||||||||||||||||||||||||||||||||||||||
2017 | 440 | 432 | 421 | 138 | 33,029 | |||||||||||||||||||||||||||||||||||||||||||
2018 | 450 | 440 | 185 | 34,647 | ||||||||||||||||||||||||||||||||||||||||||||
2019 | 452 | 257 | 29,795 | |||||||||||||||||||||||||||||||||||||||||||||
Total | $ | 5,187 | $ | 1,208 | ||||||||||||||||||||||||||||||||||||||||||||
| Cumulative Net Incurred Claim and Allocated Claim Adjustment Expenses | December 31, 2021 | |||||||||||||||||||||||||||||||||||||||||||||||||||||||||||||||||||||||||
| December 31 | 2012 (a) | 2013 (a) | 2014 (a) | 2015 (a) | 2016 (a) | 2017 (a) | 2018 (a) | 2019 (a) | 2020 (a) | 2021 | IBNR | Cumulative Number of Claims | ||||||||||||||||||||||||||||||||||||||||||||||||||||||||||||||
| (In millions, except reported claims data) | ||||||||||||||||||||||||||||||||||||||||||||||||||||||||||||||||||||||||||
| Accident Year | ||||||||||||||||||||||||||||||||||||||||||||||||||||||||||||||||||||||||||
| 2012 | $ | 601 | $ | 627 | $ | 659 | $ | 669 | $ | 678 | $ | 673 | $ | 671 | $ | 668 | $ | 663 | $ | 664 | $ | 66 | 42,804 | |||||||||||||||||||||||||||||||||||||||||||||||||||
| 2013 | 537 | 572 | 592 | 618 | 593 | 582 | 561 | 552 | 548 | 91 | 38,867 | |||||||||||||||||||||||||||||||||||||||||||||||||||||||||||||||
| 2014 | 467 | 480 | 479 | 452 | 450 | 446 | 439 | 448 | 105 | 33,502 | ||||||||||||||||||||||||||||||||||||||||||||||||||||||||||||||||
| 2015 | 422 | 431 | 406 | 408 | 394 | 382 | 372 | 101 | 31,894 | |||||||||||||||||||||||||||||||||||||||||||||||||||||||||||||||||
| 2016 | 426 | 405 | 396 | 382 | 366 | 355 | 104 | 31,981 | ||||||||||||||||||||||||||||||||||||||||||||||||||||||||||||||||||
| 2017 | 440 | 432 | 421 | 400 | 402 | 92 | 33,121 | |||||||||||||||||||||||||||||||||||||||||||||||||||||||||||||||||||
| 2018 | 450 | 440 | 428 | 415 | 104 | 34,851 | ||||||||||||||||||||||||||||||||||||||||||||||||||||||||||||||||||||
| 2019 | 452 | 449 | 437 | 134 | 34,248 | |||||||||||||||||||||||||||||||||||||||||||||||||||||||||||||||||||||
| 2020 | 477 | 466 | 228 | 29,188 | ||||||||||||||||||||||||||||||||||||||||||||||||||||||||||||||||||||||
| 2021 | 468 | 300 | 25,711 | |||||||||||||||||||||||||||||||||||||||||||||||||||||||||||||||||||||||
| Total | $ | 4,575 | $ | 1,325 | ||||||||||||||||||||||||||||||||||||||||||||||||||||||||||||||||||||||
| Cumulative Net Paid Claim and Allocated Claim Adjustment Expenses | ||||||||||||||||||||||||||||||||||||||||||||||||||||||||||||||||||||||||||
| Accident Year | ||||||||||||||||||||||||||||||||||||||||||||||||||||||||||||||||||||||||||
| 2012 | $ | 87 | $ | 232 | $ | 342 | $ | 416 | $ | 470 | $ | 509 | $ | 524 | $ | 536 | $ | 538 | $ | 541 | ||||||||||||||||||||||||||||||||||||||||||||||||||||||
| 2013 | 80 | 213 | 300 | 370 | 417 | 419 | 411 | 414 | 417 | |||||||||||||||||||||||||||||||||||||||||||||||||||||||||||||||||
| 2014 | 61 | 159 | 215 | 258 | 282 | 290 | 297 | 306 | ||||||||||||||||||||||||||||||||||||||||||||||||||||||||||||||||||
| 2015 | 51 | 131 | 180 | 212 | 231 | 243 | 251 | |||||||||||||||||||||||||||||||||||||||||||||||||||||||||||||||||||
| 2016 | 53 | 129 | 169 | 198 | 219 | 227 | ||||||||||||||||||||||||||||||||||||||||||||||||||||||||||||||||||||
| 2017 | 63 | 151 | 207 | 243 | 265 | |||||||||||||||||||||||||||||||||||||||||||||||||||||||||||||||||||||
| 2018 | 68 | 163 | 229 | 259 | ||||||||||||||||||||||||||||||||||||||||||||||||||||||||||||||||||||||
| 2019 | 71 | 169 | 223 | |||||||||||||||||||||||||||||||||||||||||||||||||||||||||||||||||||||||
| 2020 | 65 | 147 | ||||||||||||||||||||||||||||||||||||||||||||||||||||||||||||||||||||||||
| 2021 | 67 | |||||||||||||||||||||||||||||||||||||||||||||||||||||||||||||||||||||||||
| Total | $ | 2,703 | ||||||||||||||||||||||||||||||||||||||||||||||||||||||||||||||||||||||||
| Net liability for unpaid claim and allocated claim adjustment expenses for the accident years presented | $ | 1,872 | ||||||||||||||||||||||||||||||||||||||||||||||||||||||||||||||||||||||||
| Net liability for unpaid claim and claim adjustment expenses for accident years prior to 2012 | 1,941 | |||||||||||||||||||||||||||||||||||||||||||||||||||||||||||||||||||||||||
| Other (b) | (14) | |||||||||||||||||||||||||||||||||||||||||||||||||||||||||||||||||||||||||
| Liability for unallocated claim adjustment expenses for accident years presented | 51 | |||||||||||||||||||||||||||||||||||||||||||||||||||||||||||||||||||||||||
| Total net liability for unpaid claim and claim adjustment expenses | $ | 3,850 | ||||||||||||||||||||||||||||||||||||||||||||||||||||||||||||||||||||||||
Cumulative Net Paid Claim and Allocated Claim Adjustment Expenses | ||||||||||||||||||||||||||||||||||||||||||||||||
Accident Year | ||||||||||||||||||||||||||||||||||||||||||||||||
2010 | $ | 97 | $ | 251 | $ | 359 | $ | 442 | $ | 510 | $ | 542 | $ | 577 | $ | 615 | $ | 625 | $ | 631 | ||||||||||||||||||||||||||||
2011 | 99 | 249 | 358 | 438 | 478 | 522 | 564 | 571 | 581 | |||||||||||||||||||||||||||||||||||||||
2012 | 87 | 232 | 342 | 416 | 470 | 509 | 524 | 536 | ||||||||||||||||||||||||||||||||||||||||
2013 | 80 | 213 | 300 | 370 | 417 | 419 | 411 | |||||||||||||||||||||||||||||||||||||||||
2014 | 61 | 159 | 215 | 258 | 282 | 290 | ||||||||||||||||||||||||||||||||||||||||||
2015 | 51 | 131 | 180 | 212 | 231 | |||||||||||||||||||||||||||||||||||||||||||
2016 | 53 | 129 | 169 | 198 | ||||||||||||||||||||||||||||||||||||||||||||
2017 | 63 | 151 | 207 | |||||||||||||||||||||||||||||||||||||||||||||
2018 | 68 | 163 | ||||||||||||||||||||||||||||||||||||||||||||||
2019 | 71 | |||||||||||||||||||||||||||||||||||||||||||||||
Total | $ | 3,319 | ||||||||||||||||||||||||||||||||||||||||||||||
Net liability for unpaid claim and allocated claim adjustment expenses for the accident years presented | $ | 1,868 | ||||||||||||||||||||||||||||||||||||||||||||||
Net liability for unpaid claim and claim adjustment expenses for accident years prior to 2010 | 2,061 | |||||||||||||||||||||||||||||||||||||||||||||||
Other (b) | (22 | ) | ||||||||||||||||||||||||||||||||||||||||||||||
Liability for unallocated claim adjustment expenses for accident years presented | 25 | |||||||||||||||||||||||||||||||||||||||||||||||
Total net liability for unpaid claim and claim adjustment expenses | $ | 3,932 | ||||||||||||||||||||||||||||||||||||||||||||||
Net Strengthening (Releases) of Prior Accident Year Reserves
Years Ended | ||||||||||||||||||||||||||||||||||||||||||||||||
December 31 | Total | |||||||||||||||||||||||||||||||||||||||||||||||
Accident Year | ||||||||||||||||||||||||||||||||||||||||||||||||
2010 | $ | 49 | $ | 22 | $ | 22 | $ | 22 | $ | 12 | $ | 20 | $ | 3 | $ | (1 | ) | $ | 3 | $ | 152 | |||||||||||||||||||||||||||
2011 | 34 | 6 | 12 | (8 | ) | 25 | - | (2 | ) | 14 | 81 | |||||||||||||||||||||||||||||||||||||
2012 | 26 | 32 | 10 | 9 | (5 | ) | (2 | ) | (3 | ) | 67 | |||||||||||||||||||||||||||||||||||||
2013 | 35 | 20 | 26 | (25 | ) | (11 | ) | (21 | ) | 24 | ||||||||||||||||||||||||||||||||||||||
2014 | 13 | (1 | ) | (27 | ) | (2 | ) | (4 | ) | (21 | ) | |||||||||||||||||||||||||||||||||||||
2015 | 9 | (25 | ) | 2 | (14 | ) | (28 | ) | ||||||||||||||||||||||||||||||||||||||||
2016 | (21 | ) | (9 | ) | (14 | ) | (44 | ) | ||||||||||||||||||||||||||||||||||||||||
2017 | (8 | ) | (11 | ) | (19 | ) | ||||||||||||||||||||||||||||||||||||||||||
2018 | (10 | ) | (10 | ) | ||||||||||||||||||||||||||||||||||||||||||||
Total net development for the accident years presented above | (100 | ) | (33 | ) | (60 | ) | ||||||||||||||||||||||||||||||||||||||||||
Adjustment for development on a discounted basis | (3 | ) | - | 3 | ||||||||||||||||||||||||||||||||||||||||||||
Total net development for accident years prior to 2010 | 39 | 8 | 21 | |||||||||||||||||||||||||||||||||||||||||||||
Total unallocated claim adjustment expense development | 1 | (7 | ) | 23 | ||||||||||||||||||||||||||||||||||||||||||||
Total | $ | (63 | ) | $ | (32 | ) | $ | (13 | ) | |||||||||||||||||||||||||||||||||||||||
| Years Ended December 31 | Total | |||||||||||||||||||||||||||||||||||||||||||||||||||||||||||||||||||||||||
| Accident Year | ||||||||||||||||||||||||||||||||||||||||||||||||||||||||||||||||||||||||||
| 2012 | $ | 26 | $ | 32 | $ | 10 | $ | 9 | $ | (5) | $ | (2) | $ | (3) | $ | (5) | $ | 1 | $ | 63 | ||||||||||||||||||||||||||||||||||||||||||||||||||||||
| 2013 | 35 | 20 | 26 | (25) | (11) | (21) | (9) | (4) | 11 | |||||||||||||||||||||||||||||||||||||||||||||||||||||||||||||||||
| 2014 | 13 | (1) | (27) | (2) | (4) | (7) | 9 | (19) | ||||||||||||||||||||||||||||||||||||||||||||||||||||||||||||||||||
| 2015 | 9 | (25) | 2 | (14) | (12) | (10) | (50) | |||||||||||||||||||||||||||||||||||||||||||||||||||||||||||||||||||
| 2016 | (21) | (9) | (14) | (16) | (11) | (71) | ||||||||||||||||||||||||||||||||||||||||||||||||||||||||||||||||||||
| 2017 | (8) | (11) | (21) | 2 | (38) | |||||||||||||||||||||||||||||||||||||||||||||||||||||||||||||||||||||
| 2018 | (10) | (12) | (13) | (35) | ||||||||||||||||||||||||||||||||||||||||||||||||||||||||||||||||||||||
| 2019 | (3) | (12) | (15) | |||||||||||||||||||||||||||||||||||||||||||||||||||||||||||||||||||||||
| 2020 | (11) | (11) | ||||||||||||||||||||||||||||||||||||||||||||||||||||||||||||||||||||||||
| Total net development for the accident years presented above | (77) | (85) | (49) | |||||||||||||||||||||||||||||||||||||||||||||||||||||||||||||||||||||||
| Adjustment for development on a discounted basis | 3 | 2 | 2 | |||||||||||||||||||||||||||||||||||||||||||||||||||||||||||||||||||||||
| Total net development for accident years prior to 2012 | 38 | (13) | (35) | |||||||||||||||||||||||||||||||||||||||||||||||||||||||||||||||||||||||
| Total unallocated claim adjustment expense development | 23 | — | — | |||||||||||||||||||||||||||||||||||||||||||||||||||||||||||||||||||||||
| Total | $ | (13) | $ | (96) | $ | (82) | ||||||||||||||||||||||||||||||||||||||||||||||||||||||||||||||||||||
| (a) | Data presented for these calendar years is required supplemental information, which is unaudited. | ||||
| (b) | Other includes the effect of discounting lifetime claim reserves. |
| 126 | ||||||||
The table below presents information about average historical claims duration as of December 31, 20192021 and is presented as required supplementary information, which is unaudited.
Average Annual Percentage Payout of Ultimate Net Incurred Claim and Allocated Claim Adjustment Expenses in Year: | ||||||||||||||||||||||||||||||||||||||||||||
1 | 2 | 3 | 4 | 5 | 6 | 7 | 8 | 9 | 10 | Total | ||||||||||||||||||||||||||||||||||
Medical professional liability | 3.8 | % | 20.0 | % | 24.3 | % | 19.4 | % | 12.4 | % | 7.8 | % | 5.1 | % | 3.1 | % | 1.1 | % | 0.8 | % | 97.8 | % | ||||||||||||||||||||||
Other professional liability and management liability | 6.6 | 22.6 | 21.7 | 16.9 | 10.5 | 6.0 | 4.9 | 3.3 | 3.8 | 0.7 | 97.0 | |||||||||||||||||||||||||||||||||
Surety (a) | 20.0 | 44.5 | 21.0 | 4.4 | 2.2 | 0.9 | (2.5 | ) | (1.1 | ) | 1.6 | 91.0 | ||||||||||||||||||||||||||||||||
Commercial auto | 28.6 | 24.0 | 18.6 | 14.3 | 9.4 | 3.2 | 1.5 | 0.4 | 100.0 | |||||||||||||||||||||||||||||||||||
General liability | 4.3 | 15.8 | 19.0 | 20.1 | 15.7 | 8.7 | 6.0 | 2.5 | 1.5 | 1.6 | 95.2 | |||||||||||||||||||||||||||||||||
Workers’ compensation | 14.1 | 21.4 | 13.9 | 10.3 | 7.0 | 3.7 | 2.9 | 2.7 | 1.4 | 0.8 | 78.2 | |||||||||||||||||||||||||||||||||
| Average Annual Percentage Payout of Ultimate Net Incurred Claim and Allocated Claim Adjustment Expenses in Year: | |||||||||||||||||||||||||||||||||||||||||||||||||||||||||||
| 1 | 2 | 3 | 4 | 5 | 6 | 7 | 8 | 9 | 10 | ||||||||||||||||||||||||||||||||||||||||||||||||||
| Medical professional liability | 3.6 | % | 18.3 | % | 23.7 | % | 18.2 | % | 12.0 | % | 8.3 | % | 5.1 | % | 2.8 | % | 0.7 | % | 1.0 | % | |||||||||||||||||||||||||||||||||||||||
| Other professional liability and management liability | 6.7 | 21.9 | 21.1 | 16.7 | 9.9 | 6.4 | 4.3 | 3.5 | 1.7 | 0.5 | |||||||||||||||||||||||||||||||||||||||||||||||||
| Surety (a) | 14.1 | 48.7 | 18.9 | 2.6 | 1.1 | 1.3 | — | 0.4 | (0.8) | — | |||||||||||||||||||||||||||||||||||||||||||||||||
| Commercial auto | 26.7 | 23.2 | 18.0 | 13.6 | 10.1 | 3.2 | 1.5 | 0.4 | — | 0.3 | |||||||||||||||||||||||||||||||||||||||||||||||||
| General liability | 4.1 | 14.1 | 18.0 | 19.0 | 13.5 | 8.7 | 5.6 | 4.1 | 2.2 | 0.8 | |||||||||||||||||||||||||||||||||||||||||||||||||
| Workers’ compensation | 14.7 | 21.7 | 13.9 | 9.5 | 6.4 | 2.7 | 1.1 | 1.5 | 0.4 | 0.5 | |||||||||||||||||||||||||||||||||||||||||||||||||
(a)Due to the nature of the Surety business, average annual percentage payout of ultimate net incurred claim and allocated claim adjustment expenses has been calculated using only the payouts of mature accident years presented in the loss reserve development tables.
A&EP Reserves
In 2010, Continental Casualty Company (“CCC”) together with several of CNA’s insurance subsidiaries completed a transaction with National Indemnity Company (“NICO”), a subsidiary of Berkshire Hathaway Inc., under which substantially all of CNA’stheir legacy A&EP liabilities were ceded to NICO (“through a loss portfolio transfer” or “LPT”transfer (“LPT”). At the effective date of the transaction, CNA ceded approximately $1.6 billion of net A&EP claim and allocated claim adjustment expense reserves were ceded to NICO under a retroactive reinsurance agreement with an aggregate limit of $4.0 billion. The $1.6 billion of claim and allocated claim adjustment expense reserves ceded to NICO was net of $1.2 billion of ceded claim and allocated claim adjustment expense reserves under existing third party reinsurance contracts. The NICO LPT aggregate reinsurance limit also covers credit risk on the existing third party reinsurance related to these liabilities. CNANICO was paid NICO a reinsurance premium of $2.0 billion and transferred to NICO billed third party reinsurance receivables related to A&EP claims with a net book value of $215 million were transferred to NICO, resulting in total consideration of $2.2 billion.
In years subsequent to the effective date of the LPT, CNA recognized adverse prior year development on its A&EP reserves was recognized resulting in additional amounts ceded under the LPT. As a result, the cumulative amounts ceded under the LPT have exceeded the $2.2 billion consideration paid, resulting in the NICO LPT moving into a gain position, requiring retroactive reinsurance accounting. Under retroactive reinsurance accounting, this gain is deferred and only recognized in earnings in proportion to actual paid recoveries under the LPT. Over the life of the contract, there is no economic impact as long as any additional losses incurred are within the limit of the LPT. In a period in which CNA recognizes a change in the estimate of A&EP reserves is recognized that increases or decreases the amounts ceded under the LPT, the proportion of actual paid recoveries to total ceded losses is affected and the change in the deferred gain is recognized in earnings as if the revised estimate of ceded losses was available at the effective date of the LPT. The effect of the deferred retroactive reinsurance benefit is recorded in Insurance claims and policyholders’ benefits on the Consolidated Statements of Income.
Operations.The following table presents the impact of the loss portfolio transferLoss Portfolio Transfer on the Consolidated Statements of Income.
Year Ended December 31 | 2019 | 2018 | 2017 | |||||||||
(In millions) | ||||||||||||
Additional amounts ceded under LPT: | ||||||||||||
Net A&EP adverse development before consideration of LPT | $ | 150 | $ | 178 | $ | 60 | ||||||
Provision for uncollectible third-party reinsurance on A&EP | (25 | ) | (16 | ) | ||||||||
Total additional amounts ceded under LPT | 125 | 162 | 60 | |||||||||
Retroactive reinsurance benefit recognized | (107 | ) | (114 | ) | (68 | ) | ||||||
Pretax impact of deferred retroactive reinsurance | $ | 18 | $ | 48 | $ | (8 | ) | |||||
Operations.
| Year Ended December 31 | 2021 | 2020 | 2019 | ||||||||||||||
| (In millions) | |||||||||||||||||
| Additional amounts ceded under LPT: | |||||||||||||||||
| Net A&EP adverse development before consideration of LPT | $ | 143 | $ | 125 | $ | 150 | |||||||||||
| Provision for uncollectible third-party reinsurance on A&EP | (5) | (25) | (25) | ||||||||||||||
| Total additional amounts ceded under LPT | 138 | 100 | 125 | ||||||||||||||
| Retroactive reinsurance benefit recognized | (107) | (94) | (107) | ||||||||||||||
| Pretax impact of deferred retroactive reinsurance | $ | 31 | $ | 6 | $ | 18 | |||||||||||
| 127 | ||||||||
Net unfavorable prior year development of $150$143 million, $178$125 million and $60$150 million was recognized before consideration of cessions to the LPT for the years ended December 31, 2019, 20182021, 2020 and 2017.
2019. The 2019 unfavorable development of $150 millionin 2021, 2020 and 2019 was primarily driven by higher than anticipated defense and indemnity costs on known direct asbestos and environmental accounts and a reduction in estimated reinsurance recoverable. The 2018 unfavorable development of $178 million was driven by higher than anticipated defense and indemnity costs on known direct asbestos and environmental accounts and by paid losses on assumed reinsurance exposures. Additionally, in 2021, 2020 and 2019, and 2018, the company released
As of December 31, 20192021 and 2018,2020, the cumulative amounts ceded under the LPT were $3.2$3.4 billion and $3.1$3.3 billion. The unrecognized deferred retroactive reinsurance benefit was $392$429 million and $374$398 million as of December 31, 20192021 and 20182020 and is included within Other liabilities on the Consolidated Balance Sheets.
NICO established a collateral trust account as security for its obligations to CNA.under the LPT. The fair value of the collateral trust account was $3.7 billion and $2.7$3.1 billion as of December 31, 2019 and 2018.2021. In addition, Berkshire Hathaway Inc. guaranteed the payment obligations of NICO up to the aggregate reinsurance limit as well as certain of NICO’s performance obligations under the trust agreement. NICO is responsible for claims handling and billing and collection from third-party reinsurers related to CNA’s A&EP claims.
Excess Workers’ Compensation LPT
As of December 31, 2021, the cumulative amount ceded under the EWC LPT was $690 million.
Cavello established a collateral trust account as security for its obligations. The fair value of the collateral trust account was $634 million as of December 31, 2021.
Life & Group Policyholder Reserves
CNA’s Other Insurance Operations
run-off
long term care business as well as structured settlement obligations not funded by annuities related to certain property and casualty claimants. Long term care policies provide benefits for nursing homes, assisted living facilities and home health care subject to various daily and lifetime caps. Generally, policyholders must continue to make periodic premium payments to keep the policy in force and CNA has the ability to increase policy premiums, subject to state regulatory approval.CNA maintains both claim and claim adjustment expense reserves as well as future policy benefit reserves for policyholder benefits for its long term careLife & Group business. Claim and claim adjustment expense reserves consist of estimated reserves for long term care policyholders that are currently receiving benefits, including claims that have been incurred but are not yet reported. In developing the claim and claim adjustment expense reserve estimates for long term care policies, CNA’s actuaries perform a detailed claim experience studyreserve review on an annual basis. The study reviewsreview analyzes the sufficiency of existing reserves for policyholders currently on claim and includes an evaluation of expected benefit utilization and claim duration. In addition, claim and claim adjustment expense reserves are also maintained for the structured settlement obligations. In developing the claim and claim adjustment expense reserve estimates for structured settlement obligations, CNA’s actuaries review mortality experience on an annual basis. CNA’s recorded claim and claim adjustment expense reserves reflect management’s best estimate after incorporating the results of the most recent study. In addition,reviews.
CNA completed its annual claim reserve reviews in the third quarters of 2021, 2020 and claim adjustment expense reserves are also maintained for the structured settlement obligations.
Future policy benefit reserves represent theconsist of active life reserves related to CNA’s long term care policies whichfor policyholders that are not currently receiving benefits and represent the present value of expected future benefit payments and expenses less expected future premium. The determination of these reserves requires management to make estimates and
| 128 | ||||||||
assumptions about expected investment and policyholder experience over the life of the contract. Since many of these contracts may be in force for several decades, these assumptions are subject to significant estimation risk.
The actuarial assumptions that managementCNA believes are subject to the most variability are morbidity, persistency, discount rates and anticipated future premium rate increases. Morbidity is the frequency and severity of injury, illness, sickness and diseases contracted. Persistency is the percentage of policies remaining in force and can be affected by policy lapses, benefit reductions and death. Discount rates are influenced by the investment yield on assets supporting long term care reserves which is subject to interest rate and market volatility and may also be affected by changes to the Internal Revenue Code.Future Future premium rate increases are generally subject to regulatory approval,
and therefore
the exact timing and size of the approved rate increases are unknown. As a result of this variability, CNA’s long term care reserves may be subject to material increases if actual experience develops adversely to CNA’s expectations.Annually, in the third quarter, managementCNA assesses the adequacy of its long term care future policy benefit reserves by performing a GPVgross premium valuation (“GPV”) to determine if there is a premium deficiency. Management also uses the GPV process to evaluate the adequacy of its claim and claim adjustment expense reserves for structured settlement obligations not funded by annuities. Under the GPV, management estimates required reserves using best estimate assumptions as of the date of the assessment without provisions for adverse deviation. The GPV required reserves are then compared to the existing recorded reserves. If the GPV required reserves are greater than the existing recorded reserves, the existing assumptions are unlocked and future policy benefit reserves are increased to the greater amount. Any such increase is reflected in the Company’s results of operations in the period in which the need for such adjustment is determined.
If the GPV required reserves are less than the existing recorded reserves, assumptions remain locked in and no adjustment is required.
The GPV for the long term care future policy benefit reserves performed in the third quarter of 2020 and 2019 indicated a premium deficiency primarily driven by lower discount rate assumptions. Recognition of the premium deficiency resulted in a $74 million and a $216 million pretaxcharge increase in policyholders’ benefits reflected in the Company’s results of operations. CNA’s 2018 and 2017 GPVoperations for the long term care future policy benefit reserves indicated the reserves were not deficientyears ended December 31, 2020 and no adjustment was required.2019.
Note 9.Leases
Operating lease right of use assets and lease liabilities are recognized at the lease commencement date based on the present value of lease payments over the lease term. The discount rate used to determine the commencement date present value of lease payments is typically the Company’s secured borrowing rate, as most of the Company’s leases do not provide an implicit rate. The Company’s operating lease right of use asset was $573$272 million and $370 million and the Company’s operating lease liability was $694$363 million and $501 million at December 31, 2019.
2021 and 2020.Total
lease expense
wasexpense of
expense of
million for year ended December 31, 2021, 2020 and 2019. Operating lease right of use assets obtained in exchange for lease obligations was $35 million, $40 million and $54 million for the yearyears ended December 31, 2021, 2020 and 2019.
| 129 | ||||||||
The table below presents the maturities of lease liabilities:
As of December 31, 2019 | Operating Leases | |||
(In millions) | ||||
2020 | $ | 114 | ||
2021 | 113 | |||
2022 | 102 | |||
2023 | 89 | |||
2024 | 81 | |||
Thereafter | 361 | |||
Total | 860 | |||
Less: discount | 166 | |||
Total lease liabilities | $ | 694 | ||
| Operating | |||||
| As of December 31, 2021 | Leases | ||||
| (In millions) | |||||
| 2022 | $ | 63 | |||
| 2023 | 58 | ||||
| 2024 | 46 | ||||
| 2025 | 38 | ||||
| 2026 | 34 | ||||
| Thereafter | 243 | ||||
| Total | 482 | ||||
| Less: discount | 119 | ||||
| Total lease liabilities | $ | 363 | |||
The table below presents the weighted average remaining lease term for operating leases and weighted average discount rate used in calculating the operating lease asset and liability.
As of December 31, | ||||||||
| Weighted average remaining lease term | ||||||||
Weighted average discount rate | 3.4 | % | ||||||
Future Minimum Lease | ||||||||
Year Ended December 31 | Payments | Receipts | ||||||
(In millions) | ||||||||
2019 | $ | 75 | $ | 6 | ||||
2020 | 79 | 5 | ||||||
2021 | 79 | 5 | ||||||
2022 | 68 | 4 | ||||||
2023 | 57 | 4 | ||||||
Thereafter | 344 | 14 | ||||||
Total | $ | 702 | $ | 38 | ||||
Note 10. Income Taxes
For 20172019 through 2019,2021, the Company participates in the Internal Revenue Service (“IRS”) has accepted the Company into the Compliance Assurance Process (“CAP”), which is a voluntary program for large corporations. Under CAP, the IRS conductsconducted a real-time audit and worksworked contemporaneously with the Company to resolve any issues prior to the filing of the 2019 tax return. The 2019 examination is completed. For 2020 and 2021, the Company was selected to participate in the phase of CAP reserved for taxpayers whose risk of noncompliance does not support use of IRS resources. The Company believes this approachthat participation in CAP should reduce2015.2017.
tax-related
uncertainties, if any. Although the outcome of tax audits is always uncertain, the Company believes that any adjustments resulting from audits will not have a material impact on its results of operations, financial position or cash flows. The Company and/or its subsidiaries also file income tax returns in various state, local and foreign jurisdictions. These returns, with few exceptions, are no longer subject to examination by the various taxing authorities before | 130 | ||||||||
The current and deferred components of income tax expense (benefit) are as follows:
Year Ended December 31 | 2019 | 2018 | 2017 | |||||||||
(In millions) | ||||||||||||
Income tax expense (benefit): | ||||||||||||
Federal: | ||||||||||||
Current | $ | 108 | $ | 6 | $ | 157 | ||||||
Deferred | 47 | 85 | (63 | ) | ||||||||
State and city: | ||||||||||||
Current | 18 | 15 | 22 | |||||||||
Deferred | 22 | 9 | 17 | |||||||||
Foreign | 53 | 13 | 37 | |||||||||
Total | $ | 248 | $ | 128 | $ | 170 | ||||||
| Year Ended December 31 | 2021 | 2020 | 2019 | ||||||||||||||
| (In millions) | |||||||||||||||||
| Income tax expense (benefit): | |||||||||||||||||
| Federal: | |||||||||||||||||
| Current | $ | 239 | $ | 43 | $ | 108 | |||||||||||
| Deferred | 197 | (260) | 47 | ||||||||||||||
| State and city: | |||||||||||||||||
| Current | 13 | 1 | 18 | ||||||||||||||
| Deferred | 13 | 13 | 22 | ||||||||||||||
| Foreign | 17 | 30 | 53 | ||||||||||||||
| Total | $ | 479 | $ | (173) | $ | 248 | |||||||||||
The components of U.S. and foreign income before income tax and a reconciliation between the federal income tax expense at statutory rates and the actual income tax expense (benefit) is as follows:
Year Ended December 31 | 2019 | 2018 | 2017 | |||||||||
(In millions) | ||||||||||||
Income ( before income tax:loss ) | ||||||||||||
U.S. | $ | 1,145 | $ | 775 | $ | 1,322 | ||||||
Foreign | (26 | ) | 59 | 260 | ||||||||
Total | $ | 1,119 | $ | 834 | $ | 1,582 | ||||||
Income tax expense at statutory rate | $ | 235 | $ | 175 | $ | 554 | ||||||
Increase (decrease) in income tax expense resulting from: | ||||||||||||
Effect of the Tax Act | (14 | ) | (6 | ) | (190 | ) | ||||||
Exempt investment income | (50 | ) | (64 | ) | (134 | ) | ||||||
Foreign related tax differential | (55 | ) | 1 | (36 | ) | |||||||
Taxes related to domestic affiliate | (15 | ) | (7 | ) | 1 | |||||||
Partnership earnings not subject to taxes | (14 | ) | (51 | ) | ||||||||
Valuation allowance | 12 | 12 | 7 | |||||||||
Unrecognized tax positions, settlements and adjustments relating to prior years | 97 | 2 | (8 | ) | ||||||||
State taxes | 37 | 20 | 23 | |||||||||
Other | 1 | 9 | 4 | |||||||||
Income tax expense | $ | 248 | $ | 128 | $ | 170 | ||||||
| Year Ended December 31 | 2021 | 2020 | 2019 | ||||||||||||||
| (In millions) | |||||||||||||||||
| Income (loss) before income tax: | |||||||||||||||||
| U.S. | $ | 2,058 | $ | (768) | $ | 1,145 | |||||||||||
| Foreign | 124 | (696) | (26) | ||||||||||||||
| Total | $ | 2,182 | $ | (1,464) | $ | 1,119 | |||||||||||
| Income tax expense (benefit) at statutory rate | $ | 458 | $ | (307) | $ | 235 | |||||||||||
| Increase (decrease) in income tax expense (benefit) resulting from: | |||||||||||||||||
| Effect of the 2017 tax act | 0 | 0 | (14) | ||||||||||||||
| Exempt investment income | (48) | (49) | (50) | ||||||||||||||
| Foreign related tax differential | (2) | 63 | (55) | ||||||||||||||
| Taxes related to domestic affiliate | 40 | 0 | (15) | ||||||||||||||
| Valuation allowance | 1 | 55 | 12 | ||||||||||||||
| Unrecognized tax positions, settlements and adjustments relating to prior years | 0 | 68 | 97 | ||||||||||||||
| State taxes | 24 | 4 | 37 | ||||||||||||||
| Other | 6 | (7) | 1 | ||||||||||||||
| Income tax expense (benefit) | $ | 479 | $ | (173) | $ | 248 | |||||||||||
| 131 | ||||||||
A reconciliation of the beginning and ending amount of unrecognized tax benefits, excluding tax carryforwards and interest and penalties, is as follows:
Year Ended December 31 | 2019 | 2018 | 2017 | |||||||||
(In millions) | ||||||||||||
Balance at January 1 | $ | 58 | $ | 84 | $ | 35 | ||||||
Additions for tax positions related to the current year | 86 | 3 | 51 | |||||||||
Additions for tax positions related to a prior year | 2 | 20 | 5 | |||||||||
Reductions for tax positions related to a prior year | (23 | ) | (48 | ) | (1 | ) | ||||||
Lapse of statute of limitations | (2 | ) | (1 | ) | (6 | ) | ||||||
Balance at December 31 | $ | 121 | $ | 58 | $ | 84 | ||||||
| Year Ended December 31 | 2021 | 2020 | 2019 | ||||||||||||||
| (In millions) | |||||||||||||||||
| Balance at January 1 | $ | 2 | $ | 121 | $ | 58 | |||||||||||
| Additions for tax positions related to the current year | 0 | 68 | 86 | ||||||||||||||
| Additions for tax positions related to a prior year | 0 | 0 | 2 | ||||||||||||||
| Reductions for tax positions related to a prior year | 0 | 0 | (23) | ||||||||||||||
| Lapse of statute of limitations | 0 | 0 | (2) | ||||||||||||||
| Reduction due to deconsolidation of subsidiaries | (2) | (187) | 0 | ||||||||||||||
| Balance at December 31 | $ | — | $ | 2 | $ | 121 | |||||||||||
Income tax expense (benefit)
on the Consolidated Statements of Operations. NaN interest expense (benefit)
and 0 penalties were recorded for the year ended December 31, 2021, and amounts recorded| 132 | ||||||||
The following table summarizes deferred tax assets and liabilities:
December 31 | 2019 | 2018 | ||||||
(In millions) | ||||||||
Deferred tax assets: | ||||||||
Insurance reserves: | ||||||||
Property and casualty claim and claim adjustment expense reserves | $ | 129 | $ | 108 | ||||
Unearned premium reserves | 153 | 108 | ||||||
Receivables | 11 | 13 | ||||||
Employee benefits | 212 | 222 | ||||||
Deferred retroactive reinsurance benefit | 82 | 79 | ||||||
Net operating loss carryforwards | 275 | 251 | ||||||
Tax credit carryforwards | 47 | 101 | ||||||
Net unrealized losses | 24 | |||||||
Basis differential in investment in subsidiary | 8 | 8 | ||||||
Disallowed interest deduction | 41 | 16 | ||||||
Other | 179 | 181 | ||||||
Total deferred tax assets | 1,137 | 1,111 | ||||||
Valuation allowance | (187 | ) | (175 | ) | ||||
Net deferred tax assets | 950 | 936 | ||||||
Deferred tax liabilities: | ||||||||
Deferred acquisition costs | (83 | ) | �� | (78 | ) | |||
Net unrealized gains | (263 | ) | ||||||
Property, plant and equipment | (848 | ) | (840 | ) | ||||
Basis differential in investment in subsidiary | (679 | ) | (586 | ) | ||||
Other liabilities | (208 | ) | (236 | ) | ||||
Total deferred tax liabilities | (2,081 | ) | (1,740 | ) | ||||
Net deferred tax liabilities (a) | $ | (1,131 | ) | $ | (804 | ) | ||
| December 31 | 2021 | 2020 | |||||||||
| (In millions) | |||||||||||
| Deferred tax assets: | |||||||||||
| Insurance reserves: | |||||||||||
| Property and casualty claim and claim adjustment expense reserves | $ | 173 | $ | 157 | |||||||
| Unearned premium reserves | 193 | 174 | |||||||||
| Receivables | 11 | 11 | |||||||||
| Employee benefits | 111 | 197 | |||||||||
| Deferred retroactive reinsurance benefit | 90 | 83 | |||||||||
| Net operating loss carryforwards | 29 | 13 | |||||||||
| Tax credit carryforwards | 4 | 11 | |||||||||
| Basis differential in investment in subsidiary | 8 | 8 | |||||||||
| Other | 180 | 189 | |||||||||
| Total deferred tax assets | 799 | 843 | |||||||||
| Valuation allowance | (15) | (13) | |||||||||
| Net deferred tax assets | 784 | 830 | |||||||||
| Deferred tax liabilities: | |||||||||||
| Deferred acquisition costs | (99) | (93) | |||||||||
| Net unrealized gains | (275) | (441) | |||||||||
| Property, plant and equipment | (751) | (721) | |||||||||
| Basis differential in investment in subsidiary | (503) | (432) | |||||||||
| Other liabilities | (190) | (165) | |||||||||
| Total deferred tax liabilities | (1,818) | (1,852) | |||||||||
Net deferred tax liabilities (a) | $ | (1,034) | $ | (1,022) | |||||||
(a)Includes $45 and $43 of deferred tax assets reflected in Other assets in the Consolidated Balance Sheets at December 31, 2021 and 2020.
Although realization of deferred tax assets is not assured, management believes it is more likely than not that the recognized deferred tax assets will be realized through recoupment of ordinary and capital taxes paid in prior carryback years and through future earnings, reversal of existing temporary differences and available tax planning strategies. AsDue to the mix of state tax jurisdictions in which our subsidiaries operate, as of December 31, 2019, Diamond Offshore recorded2021, a valuation allowance of $187$15 million was recorded related primarily to state net operating losses, foreign tax credits, and other deferred tax assets.
losses.| 133 | ||||||||
Note 11. Debt
December 31 | 2019 | 2018 | ||||||
(In millions) | ||||||||
Loews Corporation (Parent Company): | ||||||||
Senior: | ||||||||
2.6% notes due 2023 (effective interest rate of 2.8%) (authorized, $ 500 ) | $ | 500 | $ | 500 | ||||
3.8% notes due 2026 (effective interest rate of 3.9%) (authorized, $ 500 ) | 500 | 500 | ||||||
6.0% notes due 2035 (effective interest rate of 6.2%) (authorized, $ 300 ) | 300 | 300 | ||||||
4.1% notes due 2043 (effective interest rate of 4.3%) (authorized, $ 500 ) | 500 | 500 | ||||||
CNA Financial: | ||||||||
Senior: | ||||||||
5.9% notes due 2020 (effective interest rate of 6.0%) (authorized, $ 500 ) | 500 | |||||||
5.8% notes due 2021 (effective interest rate of 5.9%) (authorized, $ 400 ) | 400 | 400 | ||||||
7.3% debentures due 2023 (effective interest rate of 7.3%) (authorized, $ 250 ) | 243 | 243 | ||||||
4.0% notes due 2024 (effective interest rate of 4.0%) (authorized, $ 550 ) | 550 | 550 | ||||||
4.5% notes due 2026 (effective interest rate of 4.5%) (authorized, $ 500 ) | 500 | 500 | ||||||
3.5% notes due 2027 (effective interest rate of 3.5%) (authorized, $ 500 ) | 500 | 500 | ||||||
3.9% notes due 2029 (effective interest rate of 3.9%) (authorized, $ 500 ) | 500 | |||||||
F inance | 1 | |||||||
Diamond Offshore: | ||||||||
Senior: | ||||||||
3.5% notes due 2023 (effective interest rate of 3.5%) (authorized, $ 250 ) | 250 | 250 | ||||||
7.9% notes due 2025 (effective interest rate of 8.0%) (authorized, $ 500 ) | 500 | 500 | ||||||
5.7% notes due 2039 (effective interest rate of 5.8%) (authorized, $ 500 ) | 500 | 500 | ||||||
4.9% notes due 2043 (effective interest rate of 4.9%) (authorized, $ 750 ) | 750 | 750 | ||||||
Boardwalk Pipelines: | ||||||||
Senior: | ||||||||
Variable rate revolving credit facility due 2022 (effective interest rate of 3.0% and 3.7%) | 295 | 580 | ||||||
5.8% notes due 2019 (effective interest rate of 5.9%) (authorized, $ 350 ) | 350 | |||||||
4.5% notes due 2021 (effective interest rate of 5.0%) (authorized, $ 440 ) | 440 | 440 | ||||||
4.0% notes due 2022 (effective interest rate of 4.4%) (authorized, $ 300 ) | 300 | 300 | ||||||
3.4% notes due 2023 (effective interest rate of 3.5%) (authorized, $ 300 ) | 300 | 300 | ||||||
5.0% notes due 2024 (effective interest rate of 5.2%) (authorized, $ 600 ) | 600 | 600 | ||||||
6.0% notes due 2026 (effective interest rate of 6.2%) (authorized, $ 550 ) | 550 | 550 | ||||||
4.5% notes due 2027 (effective interest rate of 4.6%) (authorized, $ 500 ) | 500 | 500 | ||||||
7.3% debentures due 2027 (effective interest rate of 8.1%) (authorized, $ 100 ) | 100 | 100 | ||||||
4.8% notes due 2029 (effective interest rate of 4.9%) (authorized, $ 500 ) | 500 | |||||||
Finance lease obligation | 7 | 8 | ||||||
Loews Hotels & Co: | ||||||||
Senior debt, principally mortgages (effective interest rates approximate 4.7% and 4.4% ) | 712 | 653 | ||||||
Altium Packaging : | ||||||||
Senior: | ||||||||
Variable rate asset based lending facility due 2022 (effective interest rate of 5.5%) | 9 | |||||||
Variable rate term loan due 2024 (effective interest rate of 4.9% and 5.0%) | 591 | 597 | ||||||
Variable rate term loan due 2026 (effective interest rate of 5.3%) | 249 | |||||||
Finance lease obligation | 6 | 7 | ||||||
11,643 | 11,488 | |||||||
Less unamortized discount and issuance costs | 110 | 112 | ||||||
Debt | $ | 11,533 | $ | 11,376 | ||||
| December 31 | 2021 | 2020 | |||||||||
| (In millions) | |||||||||||
| Loews Corporation (Parent Company): | |||||||||||
| Senior: | |||||||||||
| 2.6% notes due 2023 (effective interest rate of 2.8%) (authorized, $500) | $ | 500 | $ | 500 | |||||||
| 3.8% notes due 2026 (effective interest rate of 3.9%) (authorized, $500) | 500 | 500 | |||||||||
| 3.2% notes due 2030 (effective interest rate of 3.3%) (authorized, $500) | 500 | 500 | |||||||||
| 6.0% notes due 2035 (effective interest rate of 6.2%) (authorized, $300) | 300 | 300 | |||||||||
| 4.1% notes due 2043 (effective interest rate of 4.3%) (authorized, $500) | 500 | 500 | |||||||||
| CNA Financial: | |||||||||||
| Senior: | |||||||||||
| 7.3% debentures due 2023 (effective interest rate of 7.3%) (authorized, $250) | 243 | 243 | |||||||||
| 4.0% notes due 2024 (effective interest rate of 4.0%) (authorized, $550) | 550 | 550 | |||||||||
| 4.5% notes due 2026 (effective interest rate of 4.5%) (authorized, $500) | 500 | 500 | |||||||||
| 3.5% notes due 2027 (effective interest rate of 3.5%) (authorized, $500) | 500 | 500 | |||||||||
| 3.9% notes due 2029 (effective interest rate of 3.9%) (authorized, $500) | 500 | 500 | |||||||||
| 2.1% notes due 2030 (effective interest rate of 2.1%) (authorized, $500) | 500 | 500 | |||||||||
| Boardwalk Pipelines: | |||||||||||
| Senior: | |||||||||||
| Variable rate revolving credit facility due 2026 (effective interest rate of 1.4%) | 0 | 130 | |||||||||
| 4.0% notes due 2022 (effective interest rate of 4.4%) (authorized, $300) | 300 | 300 | |||||||||
| 3.4% notes due 2023 (effective interest rate of 3.5%) (authorized, $300) | 300 | 300 | |||||||||
| 5.0% notes due 2024 (effective interest rate of 5.2%) (authorized, $600) | 600 | 600 | |||||||||
| 6.0% notes due 2026 (effective interest rate of 6.2%) (authorized, $550) | 550 | 550 | |||||||||
| 4.5% notes due 2027 (effective interest rate of 4.6%) (authorized, $500) | 500 | 500 | |||||||||
| 7.3% debentures due 2027 (effective interest rate of 8.1%) (authorized, $100) | 100 | 100 | |||||||||
| 4.8% notes due 2029 (effective interest rate of 4.9%) (authorized, $500) | 500 | 500 | |||||||||
| 3.4% notes due 2031 (effective interest rate of 3.5%) (authorized, $500) | 500 | 500 | |||||||||
| Finance lease obligation | 6 | 7 | |||||||||
| Loews Hotels & Co: | |||||||||||
| Senior debt, principally mortgages (effective interest rates approximate 4.6% and 4.7%) | 692 | 750 | |||||||||
| Altium Packaging (a): | |||||||||||
| Senior: | |||||||||||
| Variable rate asset based lending facility due 2022 (effective interest rate of 3.5%) | 0 | 10 | |||||||||
| Variable rate term loan due 2024 (effective interest rate of 4.7%) | 0 | 585 | |||||||||
| Variable rate term loan due 2026 (effective interest rate of 4.1%) | 0 | 246 | |||||||||
| Finance lease obligation | 0 | 26 | |||||||||
| 9,141 | 10,197 | ||||||||||
| Less unamortized discount and issuance costs | 62 | 88 | |||||||||
| Debt | $ | 9,079 | $ | 10,109 | |||||||
(a) Amounts presented for Altium Packaging reflect the period prior to the deconsolidation.
| 134 | ||||||||
December 31, 2019 | Principal | Unamortized Discount and Issuance Costs | Net | Short Term Debt | Long Term Debt | ||||||||||||||||||||||||||||||||||||||||||||
| December 31, 2021 | December 31, 2021 | Principal | Unamortized Discount and Issuance Costs | Net | Short Term Debt | Long Term Debt | |||||||||||||||||||||||||||||||||||||||||||
(In millions) | (In millions) | ||||||||||||||||||||||||||||||||||||||||||||||||
Loews Corporation | $ | 1,800 | $ | 21 | $ | 1,779 | $ | 1,779 | Loews Corporation | $ | 2,300 | $ | 22 | $ | 2,278 | 0 | $ | 2,278 | |||||||||||||||||||||||||||||||
CNA Financial | 2,693 | 14 | 2,679 | 2,679 | CNA Financial | 2,793 | 14 | 2,779 | 0 | 2,779 | |||||||||||||||||||||||||||||||||||||||
Diamond Offshore | 2,000 | 24 | 1,976 | 1,976 | |||||||||||||||||||||||||||||||||||||||||||||
Boardwalk Pipelines | 3,592 | 26 | 3,566 | 3,566 | Boardwalk Pipelines | 3,356 | 21 | 3,335 | 0 | 3,335 | |||||||||||||||||||||||||||||||||||||||
Loews Hotels & Co | 712 | 7 | 705 | $ | 67 | 638 | Loews Hotels & Co | 692 | 5 | 687 | $ | 93 | 594 | ||||||||||||||||||||||||||||||||||||
Altium Packaging | 846 | 18 | 828 | 10 | 818 | ||||||||||||||||||||||||||||||||||||||||||||
Total | $ | 11,643 | $ | 110 | $ | 11,533 | $ | 77 | $ | 11,456 | Total | $ | 9,141 | $ | 62 | $ | 9,079 | $ | 93 | $ | 8,986 | ||||||||||||||||||||||||||||
At December 31, 2019,2021, the aggregate long term debt maturing in each of the next five years is approximately as follows: $77 million in 2020, $861 million in 2021, $744$394 million in 2022, $1.3$1.2 billion in 2023, $2.0$1.5 billion in 2024, $2 million in 2025, $1.5 billion in 2026 and $6.6$4.5 billion thereafter. Long term debt is generally redeemable in whole or in part at the greater of the principal amount or the net present value of remaining scheduled payments discounted at the specified treasury rate plus a margin.
CNA is a member of the Federal Home Loan Bank of Chicago (“FHLBC”). FHLBC membership provides participants with access to additional sources of liquidity through various programs and services. As a requirement of membership in the FHLBC, CNA held $5 million of FHLBC stock as of December 31, 2019,2021, giving it access to approximately $111$106 million of additional liquidity. As of December 31, 20192021 and 2018,2020, CNA had0 no outstanding borrowings from the FHLBC.
In May of 2019, CNA completed a public offering of $500 million aggregate principal amount of its 3.9% senior notes dueMay 1, 2029and used the net proceeds to redeem the entire $500 million outstanding aggregate principal balance of its 5.9% senior notes dueAugust 15, 2020. The redemption of the $500 million senior notes resulted in a loss of $21 million ($15 million after tax and noncontrolling interests) and is included in Interest expense on the Consolidated Statements of Income for the year ended December 31, 2019.
a
five-year $250 million
senior unsecured revolving credit facility which is intended to be used for general corporate purposes. At CNA’s election, the commitments under the amended and restated credit agreement may be increased from time to time up to an additional aggregate amount of $100 million, and two2019,2021, CNA had no outstanding borrowings under the credit agreement and was in compliance with all covenants.
2 one-year
extensions are available prior to any anniversary of the closing date, each subject to applicable consents. As of December 31, 2021, Boardwalk Pipelines entered into an amended revolving credit agreement. The revolving credit facility provided under the credit agreement has a borrowing capacity of $1.0 billion through May 27, 2026, with 2 one-year extensions at Boardwalk Pipelines’ election. As of December 31, 2021 and February 4, 2022, Boardwalk Pipelines had no outstanding borrowings and all of the $1.0 billion available borrowing capacity under the revolving credit facility. As of December 31, 2019, Diamond Offshore had0outstanding borrowings under its credit agreements and2021, Boardwalk Pipelines was in compliance with all covenant requirementscovenants under itsthe credit agreements.
agreement.financial and for general corporate purposes
| 135 | ||||||||
Note 12. Shareholders’ Equity
Accumulated other comprehensive income (loss)
The tables below present the changes in AOCI by component for the years ended December 31, 2017, 20182019, 2020 and 2019:
Net Unrealized Gains (Losses) on Investments with OTTI Losses | Net Other Unrealized Gains (Losses) on Investments | Unrealized Gains (Losses) on Cash Flow Hedges | Pension and Postretirement Benefits | Foreign Currency Translation | Total Accumulated Other Comprehensive Income (Loss) | |||||||||||||||||||
(In millions) | ||||||||||||||||||||||||
Balance, January 1, 2017 | $ | 27 | $ | 576 | $ | (2 | ) | $ | (646 | ) | $ | (178 | ) | $ | (223 | ) | ||||||||
Other comprehensive income (loss) before reclassifications, after tax of $1, $(106), $(2), $4 and $0 | (3 | ) | 190 | 1 | (18 | ) | 100 | 270 | ||||||||||||||||
Reclassification of (gains) losses from accumulated other comprehensive loss, after tax of $1, $38, $0, $(16) and $0 | (2 | ) | (82 | ) | 2 | 30 | (52 | ) | ||||||||||||||||
Other comprehensive income (loss) | (5 | ) | 108 | 3 | 12 | 100 | 218 | |||||||||||||||||
Amounts attributable to noncontrolling interests | (11 | ) | (1 | ) | 1 | (10 | ) | (21 | ) | |||||||||||||||
Balance, December 31, 2017 | 22 | 673 | – | (633 | ) | (88 | ) | (26 | ) | |||||||||||||||
Cumulative effect adjustment from changes in accounting standards , after tax of $0, $8, $0, $0 and $0 | 4 | 98 | (130 | ) | (28 | ) | ||||||||||||||||||
Balance, January 1, 2018, as adjusted | 26 | 771 | – | (763 | ) | (88 | ) | (54 | ) | |||||||||||||||
Other comprehensive income (loss) before reclassifications, after tax of $2, $213, $(2), $9 and $0 | (7 | ) | (801 | ) | 4 | (34 | ) | (84 | ) | (922 | ) | |||||||||||||
Reclassification of (gains) losses from accumulated other comprehensive loss, after tax of $2, $(2), $0, $(6) and $0 | (7 | ) | 3 | 2 | 32 | 30 | ||||||||||||||||||
Other comprehensive income (loss) | (14 | ) | (798 | ) | 6 | (2 | ) | (84 | ) | (892 | ) | |||||||||||||
Amounts attributable to noncontrolling interests | 2 | 84 | 9 | 95 | ||||||||||||||||||||
Purchase of Boardwalk Pipelines common units | (1 | ) | (28 | ) | (29 | ) | ||||||||||||||||||
Balance, December 31, 2018 | 14 | 57 | 5 | (793 | ) | (163 | ) | (880 | ) | |||||||||||||||
Other comprehensive income (loss) before reclassifications, after tax of $3, $(256), $5, $28 and $0 | (13 | ) | 957 | (11 | ) | (102 | ) | 42 | 873 | |||||||||||||||
Reclassification of (gains) losses from accumulated other comprehensive loss, after tax of $(3), $1, $0, $(9) and $0 | 12 | (8 | ) | 34 | 38 | |||||||||||||||||||
Other comprehensive income (loss) | (1 | ) | 949 | (11 | ) | (68 | ) | 42 | 911 | |||||||||||||||
Amounts attributable to noncontrolling interests | (101 | ) | 6 | (4 | ) | (99 | ) | |||||||||||||||||
Balance, December 31, 2019 | $ | 13 | $ | 905 | $ | (6 | ) | $ | (855 | ) | $ | (125 | ) | $ | (68 | ) | ||||||||
2021:
| Net Unrealized Gains (Losses) on Investments with OTTI Losses | Net Other Unrealized Gains (Losses) on Investments | Unrealized Gains (Losses) on Cash Flow Hedges | Pension and Postretirement Benefits | Foreign Currency Translation | Total Accumulated Other Comprehensive Income (Loss) | ||||||||||||||||||||||||||||||
| (In millions) | |||||||||||||||||||||||||||||||||||
| Balance, January 1, 2019 | $ | 14 | $ | 57 | $ | 5 | $ | (793) | $ | (163) | $ | (880) | |||||||||||||||||||||||
| Other comprehensive income (loss) before reclassifications, after tax of $3, $(256), $5, $28 and $0 | (13) | 957 | (11) | (102) | 42 | 873 | |||||||||||||||||||||||||||||
| Reclassification of (gains) losses from accumulated other comprehensive loss, after tax of $(3), $1, $0, $(9) and $0 | 12 | (8) | 0 | 34 | 0 | 38 | |||||||||||||||||||||||||||||
| Other comprehensive income (loss) | (1) | 949 | (11) | (68) | 42 | 911 | |||||||||||||||||||||||||||||
| Amounts attributable to noncontrolling interests | 0 | (101) | 6 | (4) | (99) | ||||||||||||||||||||||||||||||
| Balance, December 31, 2019 | $ | 13 | $ | 905 | $ | (6) | $ | (855) | $ | (125) | $ | (68) | |||||||||||||||||||||||
| Balance, January 1, 2020 (a) | $ | — | $ | 918 | $ | (6) | $ | (855) | $ | (125) | $ | (68) | |||||||||||||||||||||||
| Other comprehensive income (loss) before reclassifications, after tax of $12, $(201), $8, $18 and $0 | (43) | 763 | (22) | (66) | 48 | 680 | |||||||||||||||||||||||||||||
| Reclassification of (gains) losses from accumulated other comprehensive loss, after tax of $(12), $12, $(2), $(11) and $0 | 43 | (43) | 5 | 42 | 0 | 47 | |||||||||||||||||||||||||||||
| Other comprehensive income (loss) | — | 720 | (17) | (24) | 48 | 727 | |||||||||||||||||||||||||||||
| Amounts attributable to noncontrolling interests | 0 | (75) | 0 | 2 | (5) | (78) | |||||||||||||||||||||||||||||
| Balance, December 31, 2020 | $ | — | $ | 1,563 | $ | (23) | $ | (877) | $ | (82) | $ | 581 | |||||||||||||||||||||||
| Other comprehensive income (loss) before reclassifications, after tax of $2, $167, $(2), $(59) and $0 | (7) | (625) | 13 | 220 | (20) | (419) | |||||||||||||||||||||||||||||
| Reclassification of (gains) losses from accumulated other comprehensive loss, after tax of $(1), $21, $(1), $(12) and $0 | 5 | (81) | 4 | 46 | 0 | (26) | |||||||||||||||||||||||||||||
| Other comprehensive income (loss) | (2) | (706) | 17 | 266 | (20) | (445) | |||||||||||||||||||||||||||||
| Amounts attributable to noncontrolling interests | 0 | 73 | 0 | (25) | 2 | 50 | |||||||||||||||||||||||||||||
| Balance, December 31, 2021 | $ | (2) | $ | 930 | $ | (6) | $ | (636) | $ | (100) | $ | 186 | |||||||||||||||||||||||
| (a) | On January 1, 2020, the Company adopted ASU 2016-13; see Note 1. The Net Unrealized Gains (Losses) on Investments with OTTI Losses column that tracked the change in unrealized gains (losses) on investments with OTTI losses has been replaced with the Net Unrealized Gains (Losses) on Investments with an Allowance for Credit Losses column. The balance as of January 1, 2020 in the Net Unrealized Gains (Losses) on Investments with OTTI Losses column is now reported in the Net Unrealized Gains (Losses) on Other Investments column. Prior period amounts were not adjusted for the adoption of this standard. | ||||
| 136 | ||||||||
Amounts reclassified from AOCI shown above are reported in Net income as follows:
Major Category of AOCI | Affected Line Item | |||||
| Net unrealized gains (losses) on investments with an allowance for credit losses, Net unrealized gains (losses) on investments with OTTI losses | ||||||
and Net | Investment gains (losses) | |||||
Unrealized gains (losses) on cash flow hedges | Operating revenues and other, Interest expense and Operating expenses and other | |||||
Pension and postretirement benefits | Operating expenses and other | |||||
Common Stock Dividends
There are no restrictions on the Company’sLoews Corporation’s retained earnings or net income with regard to payment of dividends. However, as a holding company, Loews Corporation relies upon invested cash balances and distributions from its subsidiaries to generate the funds necessary to declare and pay any dividends to holders of its common stock. The ability of the Company’sLoews Corporation’s subsidiaries to pay dividends is subject to, among other things, the availability of sufficient earnings and funds in such subsidiaries, compliance with covenants in their respective credit agreements and applicable state laws, including in the case of the insurance subsidiaries of CNA, laws and rules governing the payment of dividends by regulated insurance companies. See Note 14 for a discussion of the regulatory restrictions on CNA’s availability to pay dividends.
Treasury Stock
Note 13. Revenue from Contracts with Customers
Disaggregation of revenues
Revenue from contracts with customers, other than insurance premiums, is reported as
Non-insurance
warranty revenue and within Operating revenues and other on the Consolidated Statements of Year Ended December 31 | 2019 | 2018 | 2017 (a) | |||||||||
(In millions) | ||||||||||||
Non-insurance warranty – CNA Financial | $ | 1,161 | $ | 1,007 | $ | 390 | ||||||
Contract drilling – Diamond Offshore | $ | 981 | $ | 1,083 | $ | 1,486 | ||||||
Transportation and storage of natural gas and NGLs and other services – Boardwalk Pipelines | 1,266 | 1,206 | 1,298 | |||||||||
Lodging and related services – Loews Hotels & Co | 691 | 730 | 682 | |||||||||
Rigid plastic packaging and recycled resin – Corporate | 932 | 867 | 498 | |||||||||
Total revenues from contracts with customers | 3,870 | 3,886 | 3,964 | |||||||||
Other revenues | 68 | 101 | 89 | |||||||||
Operating revenues and other | $ | 3,938 | $ | 3,987 | $ | 4,053 | ||||||
19:
| Year Ended December 31 | 2021 | 2020 | 2019 | ||||||||||||||
| (In millions) | |||||||||||||||||
| Non-insurance warranty – CNA Financial | $ | 1,430 | $ | 1,252 | $ | 1,161 | |||||||||||
| Transportation and storage of natural gas and NGLs and other services – Boardwalk Pipelines | $ | 1,306 | $ | 1,264 | $ | 1,266 | |||||||||||
| Lodging and related services – Loews Hotels & Co | 419 | 234 | 691 | ||||||||||||||
| Rigid plastic packaging and recycled resin – Corporate (a) | 280 | 1,022 | 932 | ||||||||||||||
Contract drilling – Diamond Offshore (b) | 0 | 300 | 981 | ||||||||||||||
| Total revenues from contracts with customers | 2,005 | 2,820 | 3,870 | ||||||||||||||
| Other revenues | 128 | 113 | 68 | ||||||||||||||
| Operating revenues and other | $ | 2,133 | $ | 2,933 | $ | 3,938 | |||||||||||
(a)Revenues presented for Corporate reflect the periods prior to the deconsolidation of Altium Packaging. See Note 2 for further discussion.
(b)Revenues presented for Diamond Offshore reflect the periods prior to deconsolidation. See Note 2 for further discussion.
| 137 | ||||||||
Receivables from contracts with customers
Deferred revenue
non-insurance
warranty revenue and within Other liabilities on the Consolidated Balance Sheets. $1.2 billion
and Contract costs
$3.5 billion
and non-insurance
warranty contracts, which are reported as Deferrednon-insurance
warranty acquisition expenses on the Consolidated Balance Sheets. For the year ended December 31, 2021 and 2018,
2020, amortization expense totaled Non-insurance
warranty expense and Operating expenses and other in the Consolidated Statement of Income. There were no adjustments to deferred costs recorded for the year ended December 31, 2021 and 2018.
2020.Performance obligations
non-insurance
warranty services at CNA. Approximately Note 14. Statutory Accounting Practices
CNA’s insurance subsidiaries are domiciled in various jurisdictions. These subsidiaries prepare statutory financial statements in accordance with accounting practices prescribed or permitted by the respective jurisdictions’ insurance regulators. Domestic prescribed statutory accounting practices are set forth in a variety of publications of the National Association of Insurance Commissioners (“NAIC”) as well as state laws, regulations and general administrative rules. These statutory accounting principles vary in certain respects from GAAP. In converting from statutory accounting principles to GAAP, the more significant adjustments include deferral of policy acquisition costs and the inclusion of net unrealized holding gains or losses in shareholders’ equity relating to certain fixed maturity securities.
CNA has a prescribed practice as it relates to the accounting under Statement of Statutory Accounting Principles No. 62R, (“SSAP No. 62R”),, paragraphs 6788 and 6889 in conjunction with the 2010 loss portfolio transfer with NICO which is further discussed in Note 8. The prescribed practice allows CNA to aggregate all third party A&EP reinsurance balances administered by NICO in Schedule F and to utilize the LPT as collateral for the underlying third-party reinsurance balances for purposes of calculating the statutory reinsurance penalty. This prescribed practice increased statutory capital and surplus by $91$67 million and $88$91 million at December 31, 20192021 and 2018.2020.
Property and Casualty Reinsurance
The payment of dividends by CNA’s insurance subsidiaries without prior approval of the insurance department of each subsidiary’s domiciliary jurisdiction is generally limited by formula. Dividends in excess of these amounts are subject to prior approval by the respective insurance regulator.
Dividends from CCC are subject to the insurance holding company laws of the State of Illinois, the domiciliary state of CCC. Under these laws, ordinary dividends, or dividends that do not require prior approval by the Illinois Department of Insurance (the “Department”) are determined based on the greater of the prior year’s statutory net income or 10% of statutory surplus as of the end of the prior year, as well as the timing and amount of dividends paid in the preceding 12 months. Additionally, ordinary dividends may only be paid from earned surplus, which is calculated by removing unrealized gains from unassigned surplus. As of December 31, 2019,2021, CCC iswas in a positive earned surplus position. The maximum allowable dividend CCC could pay during 20202022 that would not be subject to the Department’s prior approval is $1,078 million,$1.2 billion, less dividends paid during the preceding 12 months measured at that point in time. CCC paid dividends of $1,065 million$880 million in 2019.2021. The actual level of dividends paid in any year is determined after an assessment of available dividend capacity, holding company liquidity and cash needs as well as the impact the dividends will have on the statutory surplus of the applicable insurance company.
| 138 | ||||||||
Combined statutory capital and surplus and statutory net income for the Combined Continental Casualty Companies are presented in the table below, determined in accordance with accounting practices prescribed or permitted by insurance and/or other regulatory authorities.
Statutory Capital and Surplus | Statutory Net Income | |||||||||||||||||||
December 31 | Year Ended December 31 | |||||||||||||||||||
2019(a) | 2018 | 2019(a) | 2018 | 2017 | ||||||||||||||||
(In millions) | ||||||||||||||||||||
Combined Continental Casualty Companies | $ | 10,787 | $ | 10,411 | $ | 1,062 | $ | 1,405 | $ | 1,029 | ||||||||||
| Statutory Capital and Surplus | Statutory Net Income | ||||||||||||||||||||||||||||
| December 31 | Year Ended December 31 | ||||||||||||||||||||||||||||
2021(a) | 2020 | 2021(a) | 2020 | 2019 | |||||||||||||||||||||||||
| (In millions) | |||||||||||||||||||||||||||||
| Combined Continental Casualty Companies | $11,321 | $10,708 | $1,253 | $800 | $1,062 | ||||||||||||||||||||||||
(a)Information derived from the statutory-basis financial statements to be filed with insurance regulators.
CNA’s domestic insurance subsidiaries are subject to risk-based capital (“RBC”) requirements. RBC is a method developed by the NAIC to determine the minimum amount of statutory capital appropriate for an insurance company to support its overall business operations in consideration of its size and risk profile. The formula for determining the amount of RBC specifies various factors, weighted based on the perceived degree of risk, which are applied to certain financial balances and financial activity. The adequacy of a company’s actual capital is evaluated by a comparison to the RBC results, as determined by the formula. Companies below minimum RBC requirements are classified within certain levels, each of which requires specified corrective action.
The statutory capital and surplus presented above for CCC was approximately 291%264% and 266% of company action level RBC at December 31, 20192021 and 2018.2020. Company action level RBC is the level of RBC which triggers a heightened level of regulatory supervision. The statutory capital and surplus of CNA’sCNA’s foreign insurance subsidiaries, which is not significant to the overall statutory capital and surplus, also met or exceeded their respective regulatory and other capital requirements.
Note 15. Benefit Plans
Pension Plans – The Company and its subsidiaries have severalBenefits forFor benefits in certain plans, are determined annuallythe accrued pension balance is credited with interest based on a specified percentage of annual earnings (based on the participant’s age or years of service) and a specified interest raterates (which isare established annually for all participants) applied to accrued balances.. The benefits for another plan which covers salaried employees are based on formulas which include, among others, years of service and average pay. The Company and its subsidiaries’Company’s funding policy is to make contributions in accordance with applicable governmental regulatory requirements.The Company eliminated future benefit accruals associated with the Loews Corporation Cash Balance Retirement Plan, effective January 1, 2020. However, years of service will continue to count for purposes of vesting.
Several non-contributory
defined benefit plans are maintained for eligible employees. Other Postretirement Benefit Plans – The Company and its subsidiaries have severalSeveral postretirement benefit plans coveringcover eligible employees and retirees. Participants generally become eligible after reaching age 55 with required years of service. Actual requirements for coverage vary by plan. Benefits for retirees who were covered by bargaining agreements vary by each unit and contract. Benefits for certain retirees are in the form of a Company health care account.
Benefits for retirees reaching agethe Company and its subsidiaries reimbursing a portion of the unpaid amount;amount being reimbursed by the employer; or are reimbursed for the Medicare Part B premium or have no Company coverage. The benefits provided by the Company and its subsidiaries are basically health and, for certain retirees, life insurance type benefits.
65
are generally integrated with Medicare. Other retirees, based on plan provisions, must use Medicare as their primary coverage, with | 139 | ||||||||
Weighted average assumptions used to determine benefit obligations:
Pension Benefits | Other Postretirement Benefits | |||||||||||||||||||||||
December 31 | 2019 | 2018 | 2017 | 2019 | 2018 | 2017 | ||||||||||||||||||
Discount rate | 3.0 | % | 4.1 | % | 3.5 | % | 3.0 | % | 4.1 | % | 3.4 | % | ||||||||||||
Expected long term rate of return on plan assets | 7.5 | % | 7.5 | % | 7.5 | % | 3.6 | % | 5.3 | % | 5.3 | % | ||||||||||||
Interest crediting rate | 3.7 | % | 3.8 | % | 3.7 | % | ||||||||||||||||||
Rate of compensation increase | 3.0% to 5.5 | % | 3.9% to 5.5 | % | 3.9% to 5.5 | % | ||||||||||||||||||
| Pension Benefits | Other Postretirement Benefits | ||||||||||||||||||||||||||||||||||
| December 31 | 2021 | 2020 | 2019 | 2021 | 2020 | 2019 | |||||||||||||||||||||||||||||
| Discount rate | 2.6 | % | 2.1 | % | 3.0 | % | 2.6 | % | 2.2 | % | 3.0 | % | |||||||||||||||||||||||
| Interest crediting rate | 3.0 | % | 3.0 | % | 3.7 | % | 0 | 0 | 0 | ||||||||||||||||||||||||||
| Rate of compensation increase | 0.0% to 3.0% | 0.0% to 3.0% | 3.0% to 5.5% | ||||||||||||||||||||||||||||||||
Weighted average assumptions used to determine net periodic benefit cost:
Pension Benefits | Other Postretirement Benefits | |||||||||||||||||||||||
Year Ended December 31 | 2019 | 2018 | 2017 | 2019 | 2018 | 2017 | ||||||||||||||||||
Discount rate | 4.0 | % | 3.6 | % | 3.8 | % | 4.0 | % | 3.4 | % | 3.7 | % | ||||||||||||
Expected long term rate of return on plan assets | 7.5 | % | 7.5 | % | 7.5 | % | 3.6 | % | 5.3 | % | 5.3 | % | ||||||||||||
Interest crediting rate | 3.7 | % | 3.7 | % | 3.7 | % | ||||||||||||||||||
Rate of compensation increase | 3.0% to 5.5 | % | 3.9% to 5.5 | % | 3.9% to 5.5 | % | ||||||||||||||||||
| Pension Benefits | Other Postretirement Benefits | ||||||||||||||||||||||||||||||||||
| Year Ended December 31 | 2021 | 2020 | 2019 | 2021 | 2020 | 2019 | |||||||||||||||||||||||||||||
| Discount rate | 2.1 | % | 3.0 | % | 4.0 | % | 2.2 | % | 2.9 | % | 4.0 | % | |||||||||||||||||||||||
| Expected long term rate of return on plan assets | 6.7 | % | 7.2 | % | 7.5 | % | 2.8 | % | 3.6 | % | 3.6 | % | |||||||||||||||||||||||
| Interest crediting rate | 3.0 | % | 3.7 | % | 3.7 | % | 0 | 0 | 0 | ||||||||||||||||||||||||||
| Rate of compensation increase | 0.0% to 3.0% | 0.0% to 3.0% | 3.0% to 5.5% | ||||||||||||||||||||||||||||||||
In determining the discount rate assumption, current market and liability informationutilized
is
the
pension and postretirement obligations. In particular, the basis forthe
discount rate selection was the yield on indices of highly rated fixed income debt securities with durations comparable to that ofThe expected long term rate of return for plan assets is determined based on widely-accepted capital market principles, long term return analysis for global fixed income and equity markets as well as the active total return oriented portfolio management style. Long term trends are evaluated relative to market factors such as inflation, interest rates and fiscal and monetary policies, in order to assess the capital market assumptions as applied to the plan. Consideration of diversification needs and rebalancing is maintained.
Assumed health care cost trend rates:
December 31 | 2019 | 2018 | 2017 | |||||||||
Health care cost trend rate assumed for next year | 4.0% to 8.0% | 4.0% to 6.5 | % | 4.0% to 7.0 | % | |||||||
Rate to which the cost trend rate is assumed to decline (the ultimate trend rate) | 4.0% to 5.0% | 4.0% to 5.0 | % | 4.0% to 5.0 | % | |||||||
Year that the rate reaches the ultimate trend rate | 2021-2026 | 2019-2022 | 2018-2022 | |||||||||
| December 31 | 2021 | 2020 | 2019 | ||||||||||||||
| Health care cost trend rate assumed for next year | 4.0% to 7.0% | 4.0% to 7.5% | 4.0% to 8.0% | ||||||||||||||
| Rate to which the cost trend rate is assumed to decline (the ultimate trend rate) | 4.0% to 5.0% | 4.0% to 5.0% | 4.0% to 5.0% | ||||||||||||||
| Year that the rate reaches the ultimate trend rate | 2022-2026 | 2021-2026 | 2021-2026 | ||||||||||||||
| 140 | ||||||||
Net periodic benefit(benefit) cost components:
Pension Benefits | Other Postretirement Benefits | |||||||||||||||||||||||
Year Ended December 31 | 2019 | 2018 | 2017 | 2019 | 2018 | 2017 | ||||||||||||||||||
(In millions) | ||||||||||||||||||||||||
Service cost | $ | 7 | $ | 8 | $ | 8 | $ | 1 | $ | 1 | ||||||||||||||
Interest cost | 117 | 110 | 119 | $ | 2 | 2 | 2 | |||||||||||||||||
Expected return on plan assets | (159 | ) | (179 | ) | (173 | ) | (3 | ) | (5 | ) | (5 | ) | ||||||||||||
Amortization of unrecognized | ||||||||||||||||||||||||
net loss | 45 | 42 | 43 | (1 | ) | (1 | ) | |||||||||||||||||
Amortization of unrecognized prior | ||||||||||||||||||||||||
service benefit | (2 | ) | (2 | ) | ||||||||||||||||||||
| Settlements and curtailments | 1 | 9 | 11 | |||||||||||||||||||||
Net periodic benefit cost | $ | 11 | $ | (10 | ) | $ | 8 | $ | ) | $ | (5 | ) | $ | (4 | ) | |||||||||
Pension Benefits | Other Postretirement Benefits | ||||||||||||||||||||||||||||||||||
| Year Ended December 31 | 2021 | 2020 | 2019 | 2021 | 2020 | 2019 | |||||||||||||||||||||||||||||
| (In millions) | |||||||||||||||||||||||||||||||||||
| Service cost | $ | 3 | $ | 3 | $ | 7 | 0 | 0 | 0 | ||||||||||||||||||||||||||
| Interest cost | 70 | 92 | 117 | $ | 1 | $ | 2 | $ | 2 | ||||||||||||||||||||||||||
| Expected return on plan assets | (169) | (173) | (159) | (3) | (3) | (3) | |||||||||||||||||||||||||||||
| Amortization of unrecognized net loss | 49 | 48 | 45 | 0 | (1) | (1) | |||||||||||||||||||||||||||||
| Settlements and curtailments | 3 | 10 | 1 | 0 | (1) | 0 | |||||||||||||||||||||||||||||
| Regulatory asset decrease | 3 | 0 | 0 | 0 | 0 | 0 | |||||||||||||||||||||||||||||
| Net periodic (benefit) cost | $ | (41) | $ | (20) | $ | 11 | $ | (2) | $ | (3) | $ | (2) | |||||||||||||||||||||||
The following provides a reconciliation of benefit obligations and plan assets:
Pension Benefits | Other Postretirement Benefits | |||||||||||||||
2019 | 2018 | 2019 | 2018 | |||||||||||||
(In millions) | ||||||||||||||||
Change in benefit obligation: | ||||||||||||||||
Benefit obligation at January 1 | $ | 2,919 | $ | 3,242 | $ | 53 | $ | 62 | ||||||||
Acquisitions | ||||||||||||||||
Service cost | 7 | 8 | 1 | |||||||||||||
Interest cost | 117 | 110 | 2 | 2 | ||||||||||||
Plan participants’ contributions | 4 | 4 | ||||||||||||||
Amendments | 1 | |||||||||||||||
Actuarial (gain) loss | 299 | (212 | ) | 3 | (6 | ) | ||||||||||
Benefits paid from plan assets | (191 | ) | (187 | ) | (10 | ) | (10 | ) | ||||||||
| Settlements and curtailments | (19 | ) | (35 | ) | ||||||||||||
Foreign exchange | 4 | (7 | ) | |||||||||||||
Benefit obligation at December 31 | 3,137 | 2,919 | 52 | 53 | ||||||||||||
Change in plan assets: | ||||||||||||||||
Fair value of plan assets at January 1 | 2,304 | 2,577 | 85 | 88 | ||||||||||||
Acquisitions | ||||||||||||||||
Actual return on plan assets | 328 | (83 | ) | 8 | ||||||||||||
Company contributions | 146 | 39 | 3 | 3 | ||||||||||||
Plan participants’ contributions | 4 | 4 | ||||||||||||||
Benefits paid from plan assets | (191 | ) | (187 | ) | (10 | ) | (10 | ) | ||||||||
| Settlements | (15 | ) | (35 | ) | ||||||||||||
Foreign exchange | 4 | (7 | ) | |||||||||||||
Fair value of plan assets at December 31 | 2,576 | 2,304 | 90 | 85 | ||||||||||||
Funded status | $ | (561 | ) | $ | (615 | ) | $ | 38 | $ | 32 | ||||||
Pension Benefits | Other Postretirement Benefits | ||||||||||||||||||||||
| 2021 | 2020 | 2021 | 2020 | ||||||||||||||||||||
| (In millions) | |||||||||||||||||||||||
| Change in benefit obligation: | |||||||||||||||||||||||
| Benefit obligation at January 1 | $ | 3,243 | $ | 3,137 | $ | 51 | $ | 52 | |||||||||||||||
| Deconsolidation | (98) | 0 | 0 | 0 | |||||||||||||||||||
| Service cost | 3 | 3 | 0 | 0 | |||||||||||||||||||
| Interest cost | 70 | 92 | 1 | 2 | |||||||||||||||||||
| Plan participants’ contributions | 0 | 0 | 4 | 4 | |||||||||||||||||||
| Actuarial (gain) loss | (89) | 236 | (2) | 3 | |||||||||||||||||||
| Benefits paid from plan assets | (193) | (189) | (10) | (10) | |||||||||||||||||||
| Settlements and curtailments | (19) | (40) | 0 | 0 | |||||||||||||||||||
| Foreign exchange | (1) | 4 | 0 | 0 | |||||||||||||||||||
| Benefit obligation at December 31 | $ | 2,916 | $ | 3,243 | $ | 44 | $ | 51 | |||||||||||||||
| Change in plan assets: | |||||||||||||||||||||||
| Fair value of plan assets at January 1 | $ | 2,739 | $ | 2,576 | $ | 96 | $ | 90 | |||||||||||||||
| Deconsolidation | (85) | 0 | 0 | 0 | |||||||||||||||||||
| Actual return on plan assets | 355 | 327 | 0 | 8 | |||||||||||||||||||
| Company contributions | 20 | 61 | 3 | 4 | |||||||||||||||||||
| Plan participants' contributions | 0 | 0 | 4 | 4 | |||||||||||||||||||
| Benefits paid from plan assets | (193) | (189) | (10) | (10) | |||||||||||||||||||
| Settlements | (19) | (40) | 0 | 0 | |||||||||||||||||||
| Foreign exchange | (1) | 4 | 0 | 0 | |||||||||||||||||||
| Fair value of plan assets at December 31 | $ | 2,816 | $ | 2,739 | $ | 93 | $ | 96 | |||||||||||||||
| Funded status | $ | (100) | $ | (504) | $ | 49 | $ | 45 | |||||||||||||||
| 141 | ||||||||
Pension | Other Postretirement Benefits | Pension Benefits | Other Postretirement Benefits | ||||||||||||||||||||||||||||||||||||
2019 | 2018 | 2019 | 2018 | 2021 | 2020 | 2021 | 2020 | ||||||||||||||||||||||||||||||||
(In millions) | (In millions) | ||||||||||||||||||||||||||||||||||||||
Amounts recognized in the Consolidated Balance Sheets consist of: | Amounts recognized in the Consolidated Balance Sheets consist of: | ||||||||||||||||||||||||||||||||||||||
Other assets | $ | 5 | $ | 9 | $ | 54 | $ | 49 | Other assets | $ | 90 | $ | 4 | $ | 62 | $ | 61 | ||||||||||||||||||||||
Other liabilities | (566 | ) | (624 | ) | (16 | ) | (17 | ) | Other liabilities | (190) | (508) | (13) | (16) | ||||||||||||||||||||||||||
Net amount recognized | $ | (561 | ) | $ | (615 | ) | $ | 38 | $ | 32 | Net amount recognized | $ | (100) | $ | (504) | $ | 49 | $ | 45 | ||||||||||||||||||||
| Amounts recognized in Accumulated other comprehensive income (loss), not yet recognized in net periodic (benefit) cost: | Amounts recognized in Accumulated other comprehensive income (loss), not yet recognized in net periodic (benefit) cost: | ||||||||||||||||||||||||||||||||||||||
| Net actuarial loss | Net actuarial loss | $ | 837 | $ | 1,169 | $ | (5) | $ | (5) | ||||||||||||||||||||||||||||||
| Net amount recognized | Net amount recognized | $ | 837 | $ | 1,169 | $ | (5) | $ | (5) | ||||||||||||||||||||||||||||||
| Information for plans with projected and accumulated benefit obligations in excess of plan assets: (a) | Information for plans with projected and accumulated benefit obligations in excess of plan assets: (a) | ||||||||||||||||||||||||||||||||||||||
| Projected benefit obligation | Projected benefit obligation | $ | 292 | $ | 3,103 | 0 | 0 | ||||||||||||||||||||||||||||||||
| Accumulated benefit obligation | Accumulated benefit obligation | 286 | 3,096 | $ | 13 | $ | 16 | ||||||||||||||||||||||||||||||||
| Fair value of plan assets | Fair value of plan assets | 104 | 2,596 | 0 | 0 | ||||||||||||||||||||||||||||||||||
(a)Changes in the values in the table above are due to a plan’s assets exceeding the obligation in 2021.
Amounts recognized in Accumulated other comprehensive income (loss), not yet recognized in net periodic (benefit) cost: | ||||||||||||||||
Prior service credit | $ | (2 | ) | $ | (1 | ) | $ | (1 | ) | |||||||
Net actuarial loss | $ | 1,144 | 1,065 | (4 | ) | (3 | ) | |||||||||
Net amount recognized | $ | 1,144 | $ | 1,063 | $ | (5 | ) | $ | (4 | ) | ||||||
Information for plans with projected and accumulated benefit obligations in excess of plan assets: | ||||||||||||||||
Projected benefit obligation | $ | 3,021 | $ | 2,825 | ||||||||||||
Accumulated benefit obligation | 3,014 | 2,813 | $ | 16 | $ | 18 | ||||||||||
Fair value of plan assets | 2,456 | 2,201 |
The accumulated benefit obligation for all defined benefit pension plans was $3.1$2.9 billion and $2.9$3.2 billion at December 31, 20192021 and 2018.2020. Changes for the years ended December 31, 20192021 and 20182020 include actuarial (gains)gains of $89 million and actuarial losses of $300 million and $(212)$236 million primarily driven by changes in the discount rate used to determine the benefit obligations.
| 142 | ||||||||
The table below presents the estimated future minimum benefit payments at December 31, 2019.
Expected future benefit payments | Pension Benefits | Other Postretirement Benefits | ||||||
(In millions) | ||||||||
2020 | $ | 234 | $ | 5 | ||||
2021 | 211 | 5 | ||||||
2022 | 215 | 4 | ||||||
2023 | 217 | 4 | ||||||
2024 | 212 | 3 | ||||||
2025 – 2029 | 1,001 | 14 | ||||||
2021.
| Expected future benefit payments | Pension Benefits | Other Postretirement Benefits | |||||||||
| (In millions) | |||||||||||
| 2022 | $ | 223 | $ | 4 | |||||||
| 2023 | 209 | 4 | |||||||||
| 2024 | 205 | 3 | |||||||||
| 2025 | 204 | 3 | |||||||||
| 2026 | 205 | 3 | |||||||||
| 2027 – 2031 | 911 | 11 | |||||||||
In 2020,2022, it is expected that contributions of approximately $14$16 million will be made to pension plans and $2 million to postretirement health care and life insurance benefit plans.
Pension plan assets measured at fair value on a recurring basis are summarized below.
December 31, 2019 | Level 1 | Level 2 | Level 3 | Total | |||||||||||||||||||||||||||||||||||
| December 31, 2021 | December 31, 2021 | Level 1 | Level 2 | Level 3 | Total | ||||||||||||||||||||||||||||||||||
(In millions) | (In millions) | ||||||||||||||||||||||||||||||||||||||
Plan assets at fair value: | Plan assets at fair value: | ||||||||||||||||||||||||||||||||||||||
Fixed maturity securities: | Fixed maturity securities: | ||||||||||||||||||||||||||||||||||||||
Corporate and other bonds | $ | 587 | $ | 10 | $ | 597 | Corporate and other bonds | 0 | $ | 645 | $ | 8 | $ | 653 | |||||||||||||||||||||||||
States, municipalities and political subdivisions | 51 | 51 | States, municipalities and political subdivisions | 0 | 30 | 0 | 30 | ||||||||||||||||||||||||||||||||
Asset-backed | 154 | 154 | Asset-backed | 0 | 110 | 0 | 110 | ||||||||||||||||||||||||||||||||
Total fixed maturities | $ | – | 792 | 10 | 802 | Total fixed maturities | $ | — | 785 | 8 | 793 | ||||||||||||||||||||||||||||
Equity securities | 541 | 128 | 669 | Equity securities | 801 | 141 | 0 | 942 | |||||||||||||||||||||||||||||||
Short term investments | 74 | 7 | 81 | Short term investments | 47 | 0 | 0 | 47 | |||||||||||||||||||||||||||||||
Fixed income mutual funds | 128 | 128 | Fixed income mutual funds | 111 | 0 | 0 | 111 | ||||||||||||||||||||||||||||||||
Other assets | 11 | 9 | 20 | Other assets | 2 | 8 | 0 | 10 | |||||||||||||||||||||||||||||||
Total plan assets at fair value | $ | 754 | $ | 936 | $ | 10 | $ | 1,700 | Total plan assets at fair value | $ | 961 | $ | 934 | $ | 8 | $ | 1,903 | ||||||||||||||||||||||
Plan assets at net asset value: (a) | Plan assets at net asset value: (a) | ||||||||||||||||||||||||||||||||||||||
| Equity securities | Equity securities | 20 | |||||||||||||||||||||||||||||||||||||
Limited partnerships | 876 | Limited partnerships | 893 | ||||||||||||||||||||||||||||||||||||
Total plan assets | $ | 754 | $ | 936 | $ | 10 | $ | 2,576 | Total plan assets | $ | 961 | $ | 934 | $ | 8 | $ | 2,816 | ||||||||||||||||||||||
December 31, 2018 | Level 1 | Level 2 | Level 3 | Total | |||||||||||||||||||||||||||||||||||
Plan assets at fair value: | |||||||||||||||||||||||||||||||||||||||
Fixed maturity securities: | |||||||||||||||||||||||||||||||||||||||
Corporate and other bonds | $ | 472 | $ | 10 | $ | 482 | |||||||||||||||||||||||||||||||||
States, municipalities and political subdivisions | 58 | 58 | |||||||||||||||||||||||||||||||||||||
Asset-backed | 165 | 165 | |||||||||||||||||||||||||||||||||||||
Total fixed maturities | $ | – | 695 | 10 | 705 | ||||||||||||||||||||||||||||||||||
Equity securities | 406 | 110 | 516 | ||||||||||||||||||||||||||||||||||||
Short term investments | 36 | 54 | 90 | ||||||||||||||||||||||||||||||||||||
Fixed income mutual funds | 120 | 120 | |||||||||||||||||||||||||||||||||||||
Other assets | 9 | 9 | |||||||||||||||||||||||||||||||||||||
Total plan assets at fair value | $ | 562 | $ | 868 | $ | 10 | $ | 1,440 | |||||||||||||||||||||||||||||||
Plan assets at net asset value: (a) | |||||||||||||||||||||||||||||||||||||||
Limited partnerships | 864 | ||||||||||||||||||||||||||||||||||||||
Total plan assets | $ | 562 | $ | 868 | $ | 10 | $ | 2,304 | |||||||||||||||||||||||||||||||
| 143 | ||||||||
| December 31, 2020 | Level 1 | Level 2 | Level 3 | Total | |||||||||||||||||||
| (In millions) | |||||||||||||||||||||||
| Plan assets at fair value: | |||||||||||||||||||||||
| Fixed maturity securities: | |||||||||||||||||||||||
| Corporate and other bonds | 0 | $ | 643 | $ | 9 | $ | 652 | ||||||||||||||||
| States, municipalities and political subdivisions | 0 | 32 | 0 | 32 | |||||||||||||||||||
| Asset-backed | 0 | 98 | 0 | 98 | |||||||||||||||||||
| Total fixed maturities | $ | — | 773 | 9 | 782 | ||||||||||||||||||
| Equity securities | 785 | 137 | 0 | 922 | |||||||||||||||||||
| Short term investments | 37 | 38 | 0 | 75 | |||||||||||||||||||
| Fixed income mutual funds | 139 | 0 | 0 | 139 | |||||||||||||||||||
| Other assets | 0 | 8 | 0 | 8 | |||||||||||||||||||
| Total plan assets at fair value | $ | 961 | $ | 956 | $ | 9 | $ | 1,926 | |||||||||||||||
Plan assets at net asset value: (a) | |||||||||||||||||||||||
| Limited partnerships | 813 | ||||||||||||||||||||||
| Total plan assets | $ | 961 | $ | 956 | $ | 9 | $ | 2,739 | |||||||||||||||
(a)Certain investments that are measured at fair value using the net asset value per share (or its equivalent) practical expedient have not been classified in the fair value hierarchy. The fair value amounts presented in this table for these investments are intended to permit reconciliation of the fair value hierarchy to the amounts presented in the statement of financial position.
The limited partnership investments held within the plans are recorded at fair value, which represents the plans’ shares of the net asset value of each partnership, as determined by the general partner. Limited partnerships comprising 80%66% and 82%75% of the carrying value as of December 31, 20192021 and 20182020 employ hedge fund strategies that generate returns through investing in marketable securities in the public fixed income and equity markets and the remainder were primarily invested in private debt and equity. Within hedge fund strategies, approximately 62%76% were equity related, 31%20% pursued a multi-strategy approach and 7%4% were focused on distressed investments at December 31, 2019.
2021.For a discussion of the valuation methodologies used to measure fixed maturity securities, equities and short term investments, see Note 4.
Other postretirement benefits plan assets measured at fair value on a recurring basis are summarized below.
| December 31, 2021 | Level 1 | Level 2 | Level 3 | Total | |||||||||||||||||||
| (In millions) | |||||||||||||||||||||||
| Fixed maturity securities: | |||||||||||||||||||||||
| Corporate and other bonds | 0 | $ | 31 | 0 | $ | 31 | |||||||||||||||||
| States, municipalities and political subdivisions | 0 | 32 | 0 | 32 | |||||||||||||||||||
| Asset-backed | 0 | 7 | 0 | 7 | |||||||||||||||||||
| Total fixed maturities | $ | — | 70 | $ | — | $ | 70 | ||||||||||||||||
| Short term investments | 4 | 0 | 0 | 4 | |||||||||||||||||||
| Fixed income mutual funds | 19 | 0 | 0 | 19 | |||||||||||||||||||
| Total | $ | 23 | $ | 70 | $ | — | $ | 93 | |||||||||||||||
December 31, 2019 | Level 1 | Level 2 | Level 3 | Total | ||||||||||||
(In millions) | ||||||||||||||||
Fixed maturity securities: | ||||||||||||||||
Corporate and other bonds | $ | 22 | $ | 22 | ||||||||||||
States, municipalities and political subdivisions | 16 | 16 | ||||||||||||||
Asset-backed | 31 | 31 | ||||||||||||||
Total fixed maturities | $ | - | 69 | $ | - | 69 | ||||||||||
Short term investments | 3 | 3 | ||||||||||||||
Fixed income mutual funds | 18 | 18 | ||||||||||||||
Total | $ | 21 | $ | 69 | $ | - | $ | 90 | ||||||||
December 31, 2018 | ||||||||||||||||
Fixed maturity securities: | ||||||||||||||||
Corporate and other bonds | $ | 24 | $ | 24 | ||||||||||||
States, municipalities and political subdivisions | 11 | 11 | ||||||||||||||
Asset-backed | 30 | 30 | ||||||||||||||
Total fixed maturities | $ | - | 65 | $ | - | 65 | ||||||||||
Short term investments | 4 | 4 | ||||||||||||||
Fixed income mutual funds | 16 | 16 | ||||||||||||||
Total | $ | 20 | $ | 65 | $ | - | $ | 85 | ||||||||
| 144 | ||||||||
| December 31, 2020 | Level 1 | Level 2 | Level 3 | Total | |||||||||||||||||||
| (In millions) | |||||||||||||||||||||||
| Fixed maturity securities: | |||||||||||||||||||||||
| Corporate and other bonds | 0 | $ | 24 | 0 | $ | 24 | |||||||||||||||||
| States, municipalities and political subdivisions | 0 | 14 | 0 | 14 | |||||||||||||||||||
| Asset-backed | 0 | 33 | 0 | 33 | |||||||||||||||||||
| Total fixed maturities | $ | — | 71 | $ | — | $ | 71 | ||||||||||||||||
| Short term investments | 5 | 0 | 0 | 5 | |||||||||||||||||||
| Fixed income mutual funds | 20 | 0 | 0 | 20 | |||||||||||||||||||
| Total | $ | 25 | $ | 71 | $ | — | $ | 96 | |||||||||||||||
There were 0no Level 3 assets at December 31, 20192021 and 2018.
2020.Savings Plans – The Company and its subsidiaries have severalSeveral contributory savings plans are maintained which allow employees to make regular contributions based upon a percentage of their salaries. Matching contributions are made up to specified percentages of employees’ contributions. TheEmployer contributions by the Company and its subsidiaries to these plans amounted to $102$83 million, $100$90 million and $105$102 million for the years ended December 31, 2019, 20182021, 2020 and 2017.
2019.Stock-based Compensation – In 2016, shareholders approved the Loews Corporation 2016 Incentive Compensation Plan (the “2016 Loews Plan”) which replaced a previously existing plan. The aggregate number of shares of Loews Corporation common stock authorized under the 2016 Loews Plan is 6,000,000 shares, plus up to 3,000,000 shares that may be forfeited under the prior plan. The maximum number of shares of Loews Corporation common stock with respect to which awards may be granted to any individual in any calendar year is 500,000 shares. In accordance with the 2016 Loews Plan and theCompany
prior
equity plan,
SARs:
equity
plan. The exercise price per share may not be less than the fair market value of the common stock on the date of grant. Generally, SARs vest ratably over a four-year period and expire in ten years.Time-based Restricted Stock Units:
Performance-based Restricted Stock Units:
In 2019, the Company2021, Loews Corporation granted an aggregate of216,802 223,664 RSUs and PSUs at a weighted average grant-date fair value of $48.10$47.68 per unit.3,621 16,528 RSUs were forfeited during the year.2,469,756 1,364,502 SARs were outstanding at December 31, 20192021 with a weighted average exercise price of $41.11.
$42.15.The Company recognized compensation expense in connection with stock-based compensation that decreased net income by $33 million, $37 million $35 million and $33$37 million for the years ended December 31, 2019, 20182021, 2020 and 2017.2019. Several of the Company’sLoews Corporation’s subsidiaries also maintain their own stock-based compensation plans. Such amounts include the Company’sLoews Corporation’s share of expense related to its subsidiaries’these plans.
| 145 | ||||||||
Note 16. Reinsurance
CNA cedes insurance to reinsurers to limit its maximum loss, provide greater diversification of risk, minimize exposures on larger risks and to exit certain lines of business. The ceding of insurance does not discharge the primary liability of CNA. A credit exposure exists with respect to reinsurance ceded to the extent that any reinsurer is unable to meet its obligations. A collectability exposure also exists to the extent that the reinsurer disputes the liabilities assumed under reinsurance agreements. Property and casualty reinsurance coverages are tailored to the specific risk characteristics of each product line and CNA’s retained amount varies by type of coverage. Reinsurance contracts are purchased to protect specific lines of business such as property and workers’ compensation. Corporate catastrophe reinsurance is also purchased for property and workers’ compensation exposure. CNA also utilizes facultative reinsurance in certain lines. In addition, CNA assumes reinsurance, primarily through Hardy and as a member of various reinsurance pools and associations.
The following table presents the amounts receivable from reinsurers:
December 31 | 2019 | 2018 | ||||||
(In millions) | ||||||||
Reinsurance receivables related to insurance reserves: | ||||||||
Ceded claim and claim adjustment expenses | $ | 3,835 | $ | 4,019 | ||||
Ceded future policy benefits | 226 | 233 | ||||||
| Reinsurance receivables related to paid losses | 143 | 203 | ||||||
Reinsurance receivables | 4,204 | 4,455 | ||||||
Less allowance for doubtful accounts | 25 | 29 | ||||||
Reinsurance receivables, net of allowance for doubtful accounts | $ | 4,179 | $ | 4,426 | ||||
| December 31 | 2021 | 2020 | |||||||||
| (In millions) | |||||||||||
| Reinsurance receivables related to insurance reserves: | |||||||||||
| Ceded claim and claim adjustment expenses | $ | 4,969 | $ | 4,005 | |||||||
| Ceded future policy benefits | 288 | 263 | |||||||||
| Reinsurance receivables related to paid losses | 227 | 210 | |||||||||
| Reinsurance receivables | 5,484 | 4,478 | |||||||||
| Less allowance for doubtful accounts | 21 | 21 | |||||||||
| Reinsurance receivables, net of allowance for doubtful accounts | $ | 5,463 | $ | 4,457 | |||||||
CNA has established an allowance for doubtful accounts on voluntary reinsurance receivables relatedwhich relates to credit risk. CNA reviewsboth amounts already billed on ceded paid losses as well as ceded reserves that will be billed when losses are paid in the allowance quarterly and adjustsfuture. The following table summarizes the allowance as necessary to reflect changes in estimatesoutstanding amount of uncollectible balances. The allowance may also be reducedvoluntary reinsurance receivables, gross of any collateral arrangements, by write-offs of reinsurance receivable balances.
financial strength rating:| As of December 31, 2021 | |||||
| (In millions) | |||||
| A- to A++ | $ | 3,812 | |||
| B- to B++ | 987 | ||||
| Insolvent | 3 | ||||
Total voluntary reinsurance outstanding balance (a) | $ | 4,802 | |||
| (a) | Expected credit losses for legacy A&EP receivables are ceded to NICO and the reinsurance limit on the LPT has not been exhausted, therefore no allowance is recorded for these receivables and they are excluded from the table above. See Note 8 for more information on the LPT. Also excluded are receivables from involuntary pools. | ||||
CNA attempts to mitigate its credit risk related to reinsurance by entering into reinsurance arrangements with reinsurers that have credit ratings above certain levels and by obtaining collateral. On a limited basis, CNA may enter into reinsurance agreements with reinsurers that are not rated, primarily captive reinsurers. Receivables from captive reinsurers are backed by collateral arrangements and comprise the majority of the voluntary reinsurance receivables within the B- to B++ rating distribution in the table above. The primary methods of obtaining collateral are through reinsurance trusts, letters of credit and funds withheld balances. Such collateral,, limited by therecoverables, was approximately $3.2$4.0 billion and $3.3 billion at December 31, 20192021 and 2018.2020.
the balance of open recoverables,
| 146 | ||||||||
CNA’s largest recoverables from a single reinsurer, including ceded unearned premium reserves as of December 31, 20192021 were approximately $2.0$1.8 billion from subsidiariessubsidiaries of the Berkshire Hathaway Insurance Group, $289$612 million from Cavello Bay Reinsurance Limited and $425 million from thePalo Verde Gateway Rivers Insurance Company and $226 million fromasubsidiary of Wilton Re.Company. These amounts are substantially collateralized.collateralized or otherwise secured. The recoverable from subsidiaries subsidiaries ofthe Berkshire Hathaway Insurance Group includes amounts related to third party reinsurance for which NICO has assumed the credit risk under the terms of the loss portfolio transfer as discussed in Note 8.
The effects of reinsurance on earned premiums are presented in the following table:
Direct | Assumed | Ceded | Net | Assumed/ Net % | ||||||||||||||||
(In millions) | ||||||||||||||||||||
Year Ended December 31, 2019 | ||||||||||||||||||||
Property and casualty | $ | 11,021 | $ | 288 | $ | 4,401 | $ | 6,908 | 4.2 | % | ||||||||||
Long term care | 470 | 50 | 520 | 9.6 | ||||||||||||||||
Earned premiums | $ | 11,491 | $ | 338 | $ | 4,401 | $ | 7,428 | 4.6 | % | ||||||||||
Year Ended December 31, 2018 | ||||||||||||||||||||
Property and casualty | $ | 10,857 | $ | 305 | $ | 4,380 | $ | 6,782 | 4.5 | % | ||||||||||
Long term care | 480 | 50 | 530 | 9.4 | ||||||||||||||||
Earned premiums | $ | 11,337 | $ | 355 | $ | 4,380 | $ | 7,312 | 4.9 | % | ||||||||||
Year Ended December 31, 2017 | ||||||||||||||||||||
Property and casualty | $ | 10,447 | $ | 317 | $ | 4,315 | $ | 6,449 | 4.9 | % | ||||||||||
Long term care | 489 | 50 | 539 | 9.3 | ||||||||||||||||
Earned premiums | $ | 10,936 | $ | 367 | $ | 4,315 | $ | 6,988 | 5.3 | % | ||||||||||
| Assumed/ | |||||||||||||||||||||||||||||
| Direct | Assumed | Ceded | Net | Net % | |||||||||||||||||||||||||
| (In millions) | |||||||||||||||||||||||||||||
| Year Ended December 31, 2021 | |||||||||||||||||||||||||||||
| Property and casualty | $ | 12,554 | $ | 240 | $ | 5,110 | $ | 7,684 | 3.1 | % | |||||||||||||||||||
| Long term care | 443 | 48 | 0 | 491 | 9.8 | ||||||||||||||||||||||||
| Earned premiums | $ | 12,997 | $ | 288 | $ | 5,110 | $ | 8,175 | 3.5 | % | |||||||||||||||||||
| Year Ended December 31, 2020 | |||||||||||||||||||||||||||||
| Property and casualty | $ | 11,547 | $ | 238 | $ | 4,640 | $ | 7,145 | 3.3 | % | |||||||||||||||||||
| Long term care | 454 | 50 | 0 | 504 | 9.9 | ||||||||||||||||||||||||
| Earned premiums | $ | 12,001 | $ | 288 | $ | 4,640 | $ | 7,649 | 3.8 | % | |||||||||||||||||||
| Year Ended December 31, 2019 | |||||||||||||||||||||||||||||
| Property and casualty | $ | 11,021 | $ | 288 | $ | 4,401 | $ | 6,908 | 4.2 | % | |||||||||||||||||||
| Long term care | 470 | 50 | 0 | 520 | 9.6 | ||||||||||||||||||||||||
| Earned premiums | $ | 11,491 | $ | 338 | $ | 4,401 | $ | 7,428 | 4.6 | % | |||||||||||||||||||
Included in the direct and ceded earned premiums for the years ended December 31, 2019, 20182021, 2020 and 20172019 are $3.6 billion, $3.7$3.5 billion and $3.9$3.6 billion related to property business that is 100% reinsured under a significant third party captive program. The third party captives that participate in this program are affiliated with the
non-insurance
company policyholders, therefore this program provides a means for the policyholders to self-insure this property risk. CNA receives and retains a ceding commission.Long term care premiums are from long durationlong-duration contracts; property and casualty premiums are from short durationshort-duration contracts.
Insurance claims and policyholders’ benefits reported on the Consolidated Statements of IncomeOperations are net of$2.7$3.1 billion, $2.8$3.2 billion and $3.1$2.7 billion for the years ended December 31, 2021, 2020 and 2019, 2018 and 2017, including $2.1$2.0 billion, $1.9$2.4 billion and $2.5$2.1 billion related to the significant third party captive program discussed above.
estimated
reinsurance recoveries of Note 17. Quarterly Financial Data (Unaudited)
2019 Quarter Ended | Dec. 31 | Sept. 30 | June 30 | March 31 | ||||||||||||
(In millions, except per share data) | ||||||||||||||||
Total revenues | $ | 3,876 | $ | 3,675 | $ | 3,623 | $ | 3,757 | ||||||||
Net income (a) (b) | 217 | 72 | 249 | 394 | ||||||||||||
Per share-basic and diluted | 0.73 | 0.24 | 0.82 | 1.27 | ||||||||||||
2018 Quarter Ended | ||||||||||||||||
Total revenues | $ | 3,287 | $ | 3,608 | $ | 3,590 | $ | 3,581 | ||||||||
Net income (loss) ( c ) | (165 | ) | 278 | 230 | 293 | |||||||||||
Per share-basic and diluted | (0.53 | ) | 0.88 | 0.72 | 0.89 | |||||||||||
Boardwalk Pipelines
On May 25, 2018,
plaintiffs Tsemach Mishal and Paul Berger (on behalf of themselves and the purported class, “Plaintiffs”) initiated a purported class action in the Court of Chancery of the State of Delaware (the “Court”“Trial Court”) against the following defendants: Boardwalk Pipelines, Boardwalk GP, LP (“General Partner”), Boardwalk GP, LLC and Boardwalk Pipelines Holding Corp. (“BPHC”) (together, “Defendants”), regarding the potential exercise by the General Partner of its right to purchase all of the issued and outstanding common units representing limited partnership interests in Boardwalk Pipelines not already owned by the General Partner or its affiliates.
| 147 | ||||||||
On June 25, 2018, Plaintiffs and Defendants entered into a Stipulation and Agreement of Compromise and Settlement, subject to the approval of the Trial Court (the “Proposed Settlement”). Under the terms of the Proposed Settlement, the lawsuit would be dismissed, and related claims against the Defendants would be released by the Plaintiffs, if BPHC, the sole member of the General Partner, elected to cause the General Partner to exercise its right to purchase the issued and outstanding common units of
Boardwalk Pipelines pursuant to Boardwalk Pipelines’ Third Amended and Restated Agreement of Limited Partnership, as amended (“Limited Partnership Agreement”),
within a period specified by the Proposed Settlement. As discussed in Note
the Limited Partnership Agreement within the period specified by the Proposed Settlement. The transaction was completed on July
18,On September 28, 2018, the Trial Court denied approval of the Proposed Settlement. On February 11, 2019, a substitute verified class action complaint was filed in this proceeding.
Trial Court held that the General Partner breached the Limited Partnership Agreement and awarded Plaintiffs approximately $690 million, plus pre-judgment interest (approximately $166 million), post-judgment interest and attorneys’ fees.proceeding, which among other things, added the Parent Company as a Defendant. The
Defendants filed a motion to dismiss, which was heard by the Trial Court in July of 2019. In October of 2019, the Trial Court ruled on the motion and granted a partial dismissal,,with certain aspects of the case proceeding to trial. A trial was held the week of February 22, 2021 and post-trial oral arguments were held on July 14, 2021.
On November 12, 2021, the Trial Court issued a ruling in the case. The case will be set for trial in early 2021.
The Company believes that the Trial Court ruling includes factual and its subsidiaries arelegal errors. Therefore on January 3, 2022, the Defendants appealed the Trial Court’s ruling to the Supreme Court of the State of Delaware (the “Supreme Court”). On January 17, 2022, the Plaintiffs filed a cross-appeal to the Supreme Court contesting the calculation of damages by the Trial Court.
At this time, given the Trial Court’s ruling and the pending appeals, the Company believes that it is reasonably possible that a loss has occurred, although the Company is unable to estimate any potential loss as it may range from zero up to the full amount of the Trial Court’s award of $690 million, plus pre- and post-judgment interest and attorneys’ fees, or more, depending on the extent of the Defendants’ and Plaintiffs’ success on appeal. The Company has not recorded a liability related to this matter.
As litigation is inherently unpredictable, if an unfavorable final outcome occurs, there is a possibility of a material adverse impact to the Company’s consolidated financial statements in the period in which the effects become known.
Other Litigation
The Company is from time to time partiesparty to other litigation arising in the ordinary course of business. While it is difficult to predict the outcome or effect of any such litigation, management does not believe that the outcome of any such pending litigation will materially affect the Company’s results of operations or equity.
Note 19.18. Commitments and Contingencies
CNA Data Breach-related Contingency
As previously disclosed, CNA sustained a sophisticated cybersecurity attack in March of 2021 involving ransomware. CNA’s investigation revealed that an unauthorized third party copied some personal information relating to certain current and former employees, contractor workers and their dependents and certain other persons, including some policyholders. In July of 2021, CNA provided notifications to the impacted individuals and to regulators, in accordance with applicable law. CNA may be subject to subsequent investigations, fines or penalties, as well as other legal claims and actions, related to the foregoing. The likelihood is reasonably possible, but the amount of such fines, penalties or costs, if any, cannot be estimated at this time.
Based on the information currently known, CNA does not believe that the March 2021 cybersecurity attack will have a material impact on its business, results of operations or financial condition, but no assurances can be given as it continues to assess the full impact from the incident, including costs, expenses and insurance coverage.
| 148 | ||||||||
CNA Guarantees
CNA2019,2021, the potential amount of future payments CNA could be required to pay under these guarantees was approximately $1.7$1.6 billion, which will be paid over the lifetime of the annuitants. CNA does not believe any payment is likely under these guarantees, as CNA is the beneficiary of a trust that must be maintained at a level that approximates the discounted reserves for these annuities.
has
provided guarantees, if the primary obligor fails to perform, to holders of structured settlement annuitiesissued
bya previously owned subsidiary. As of December 31, Note 19. Segments
In the first quarter of 2020, Diamond Offshore was a reportable segment; Diamond Offshore was deconsolidated during the second quarter of 2020. The Corporate segment is primarily comprised of Loews Corporation, excluding its subsidiaries, and the operations of Altium Packaging sincethrough March 31, 2021. On April 1, 2021, Loews Corporation sold 47% of Altium Packaging and as a result, Altium Packaging was deconsolidated from Loews Corporation’s consolidated financial results. Subsequent to deconsolidation, Loews Corporation’s investment in Altium Packaging is accounted for under the acquisition date are includedequity method of accounting, with Equity income (loss) reported in Operating expenses and other on the Consolidated Statements of Operations in the Corporate segment. For further information on the deconsolidations of Diamond Offshore and Altium Packaging see Note 2. Each of the operating subsidiaries is headed by a chief executive officer who is responsible for the operation of its business and has the duties and authority commensurate with that position.
CNA’s business is the sale of property and casualty insurance coverageproducts and services, including surety, primarily through a network of independent agents, brokers and managing general underwriters. CNA’s operations also include its long term care business that is inA&EP.
certain legacy mass tort reserves.run-off,
certain corporate expenses, including interest on CNA’s corporate debt, and the results of certain property and casualty businesses inrun-off,
including CNA Re, A&EP, a legacy portfolio of EWC policies and Boardwalk Pipelines is engagedoperates in the interstatemidstream portion of the natural gas and NGLs industry, providing transportation and storage for those commodities. Boardwalk Pipeline owns approximately 14,065 miles of natural gas and NGLs. This segment consists of interstateNGL pipelines and underground storage caverns. Boardwalk Pipelines’ natural gas pipeline systems are located in the Gulf Coast region, Oklahoma, Arkansas, and the midwestern states of Tennessee, Kentucky, Illinois, Indiana and Ohio, natural gas storage facilities in 4 states and its NGL pipelines and storage facilities are located in Louisiana and Texas, with approximately 14,055 miles of pipeline.
Texas.Loews Hotels & Co operates a chain of 26 hotels, 2425 of which are in the United States and 21 of which areis in Canada.
The Corporate segment consists of investment income from the Parent Company’s cash and investments,expenses expenses. Corporate also includes the operating results of Altium Packaging through March 31, 2021 and the resultsequity method accounting for Altium Packaging beginning on April 1, 2021, as a result of since and the acquisition date.resulting deconsolidation. See Note 2 for further information. Purchase accounting adjustments have been pushed down to the appropriate subsidiary.
Parent Company
interest expense and other unallocatedParent Company
the sale of 47% of Altium Packaging
The accounting policies of the segments are the same as those described in the summary of significant accounting policies in Note 1.
In the following tables certain financial measures are presented to provide information used by management to monitor the Company’s operating performance. These schedules present the reportable segments of the Company and their contribution to the consolidated financial statements. Amounts presented will not necessarily be the same as those in the individual financial statements of the Company’s subsidiaries due to adjustments for purchase accounting, income taxes and noncontrolling interests.
| 149 | ||||||||
Statements of IncomeOperations and Total assets by segment are presented in the following tables.
Year Ended December 31, 2019 | CNA Financial | Diamond Offshore | Boardwalk Pipelines | Loews Hotels & Co | Corporate | Total | ||||||||||||||||||
(In millions) | ||||||||||||||||||||||||
Revenues: | ||||||||||||||||||||||||
Insurance premiums | $ | 7,428 | $ | 7,428 | ||||||||||||||||||||
Net investment income | 2,118 | $ | 6 | $ | 1 | $ | 230 | 2,355 | ||||||||||||||||
Investment gains | 49 | 49 | ||||||||||||||||||||||
Non-insurance warranty revenue | 1,161 | 1,161 | ||||||||||||||||||||||
Operating revenues and other | 32 | 982 | $ | 1,300 | 691 | 933 | 3,938 | |||||||||||||||||
Total | 10,788 | 988 | 1,300 | 692 | 1,163 | 14,931 | ||||||||||||||||||
Expenses: | ||||||||||||||||||||||||
Insurance claims and policyholders’ benefits | 5,806 | 5,806 | ||||||||||||||||||||||
Amortization of deferred acquisition costs | 1,383 | 1,383 | ||||||||||||||||||||||
Non-insurance warranty expense | 1,082 | 1,082 | ||||||||||||||||||||||
Operating expenses and other | 1,141 | 1,267 | 840 | 698 | 1,004 | 4,950 | ||||||||||||||||||
Interest | 152 | 123 | 179 | 22 | 115 | 591 | ||||||||||||||||||
Total | 9,564 | 1,390 | 1,019 | 720 | 1,119 | 13,812 | ||||||||||||||||||
Income (loss) before income tax | 1,224 | (402 | ) | 281 | (28 | ) | 44 | 1,119 | ||||||||||||||||
Income tax (expense) benefit | (224 | ) | 60 | (72 | ) | (3 | ) | (9 | ) | (248 | ) | |||||||||||||
Net income (loss) | 1,000 | (342 | ) | 209 | (31 | ) | 35 | 871 | ||||||||||||||||
Amounts attributable to noncontrolling interests | (106 | ) | 167 | 61 | ||||||||||||||||||||
Net income (loss) attributable to Loews Corporation | $ | 894 | $ | (175 | ) | $ | 209 | $ | (31 | ) | $ | 35 | $ | 932 | ||||||||||
December 31, 2019 | ||||||||||||||||||||||||
Total assets | $ | 60,583 | $ | 5,834 | $ | 9,248 | $ | 1,728 | $ | 4,850 | $ | 82,243 | ||||||||||||
| Year Ended December 31, 2021 | CNA Financial | Boardwalk Pipelines | Loews Hotels & Co | Corporate (a) | Total | ||||||||||||||||||||||||||||||
| (In millions) | |||||||||||||||||||||||||||||||||||
| Revenues: | |||||||||||||||||||||||||||||||||||
| Insurance premiums | $ | 8,175 | 0 | 0 | 0 | $ | 8,175 | ||||||||||||||||||||||||||||
| Net investment income | 2,159 | 0 | $ | 1 | $ | 99 | 2,259 | ||||||||||||||||||||||||||||
| Investment gains | 120 | 0 | 0 | 540 | 660 | ||||||||||||||||||||||||||||||
| Non-insurance warranty revenue | 1,430 | 0 | 0 | 0 | 1,430 | ||||||||||||||||||||||||||||||
| Operating revenues and other | 24 | $ | 1,349 | 479 | 281 | 2,133 | |||||||||||||||||||||||||||||
| Total | 11,908 | 1,349 | 480 | 920 | 14,657 | ||||||||||||||||||||||||||||||
| Expenses: | |||||||||||||||||||||||||||||||||||
| Insurance claims and policyholders’ benefits | 6,349 | 0 | 0 | 0 | 6,349 | ||||||||||||||||||||||||||||||
| Amortization of deferred acquisition costs | 1,443 | 0 | 0 | 0 | 1,443 | ||||||||||||||||||||||||||||||
| Non-insurance warranty expense | 1,328 | 0 | 0 | 0 | 1,328 | ||||||||||||||||||||||||||||||
| Operating expenses and other | 1,191 | 885 | 456 | 399 | 2,931 | ||||||||||||||||||||||||||||||
| Interest | 113 | 161 | 36 | 114 | 424 | ||||||||||||||||||||||||||||||
| Total | 10,424 | 1,046 | 492 | 513 | 12,475 | ||||||||||||||||||||||||||||||
| Income (loss) before income tax | 1,484 | 303 | (12) | 407 | 2,182 | ||||||||||||||||||||||||||||||
| Income tax expense | (282) | (68) | (2) | (127) | (479) | ||||||||||||||||||||||||||||||
| Net income (loss) | 1,202 | 235 | (14) | 280 | 1,703 | ||||||||||||||||||||||||||||||
| Amounts attributable to noncontrolling interests | (125) | 0 | 0 | 0 | (125) | ||||||||||||||||||||||||||||||
| Net income (loss) attributable to Loews Corporation | $ | 1,077 | $ | 235 | $ | (14) | $ | 280 | $ | 1,578 | |||||||||||||||||||||||||
| December 31, 2021 | |||||||||||||||||||||||||||||||||||
| Total assets | $ | 66,588 | $ | 9,418 | $ | 1,671 | $ | 3,949 | $ | 81,626 | |||||||||||||||||||||||||
| (a) | Amounts presented for Corporate include the operating results of Altium Packaging through March 31, 2021. Beginning April 1, 2021, Altium Packaging is recorded as an equity method investment. | ||||
| 150 | ||||||||
| Year Ended December 31, 2020 | CNA Financial | Boardwalk Pipelines | Loews Hotels & Co | Corporate (a) | Diamond Offshore (b) | Total | |||||||||||||||||||||||||||||
| (In millions) | |||||||||||||||||||||||||||||||||||
| Revenues: | |||||||||||||||||||||||||||||||||||
| Insurance premiums | $ | 7,649 | 0 | 0 | 0 | 0 | $ | 7,649 | |||||||||||||||||||||||||||
| Net investment income | 1,935 | 0 | $ | 1 | $ | 59 | 0 | 1,995 | |||||||||||||||||||||||||||
| Investment losses | (35) | 0 | 0 | (1,211) | 0 | (1,246) | |||||||||||||||||||||||||||||
| Non-insurance warranty revenue | 1,252 | 0 | 0 | 0 | 0 | 1,252 | |||||||||||||||||||||||||||||
| Operating revenues and other | 26 | $ | 1,302 | 277 | 1,023 | $ | 305 | 2,933 | |||||||||||||||||||||||||||
| Total | 10,827 | 1,302 | 278 | (129) | 305 | 12,583 | |||||||||||||||||||||||||||||
| Expenses: | |||||||||||||||||||||||||||||||||||
| Insurance claims and policyholders’ benefits | 6,170 | 0 | 0 | 0 | 0 | 6,170 | |||||||||||||||||||||||||||||
| Amortization of deferred acquisition costs | 1,410 | 0 | 0 | 0 | 0 | 1,410 | |||||||||||||||||||||||||||||
| Non-insurance warranty expense | 1,159 | 0 | 0 | 0 | 0 | 1,159 | |||||||||||||||||||||||||||||
| Operating expenses and other | 1,125 | 855 | 519 | 1,098 | 1,196 | 4,793 | |||||||||||||||||||||||||||||
| Interest | 142 | 170 | 33 | 127 | 43 | 515 | |||||||||||||||||||||||||||||
| Total | 10,006 | 1,025 | 552 | 1,225 | 1,239 | 14,047 | |||||||||||||||||||||||||||||
| Income (loss) before income tax | 821 | 277 | (274) | (1,354) | (934) | (1,464) | |||||||||||||||||||||||||||||
| Income tax (expense) benefit | (131) | (71) | 62 | 287 | 26 | 173 | |||||||||||||||||||||||||||||
| Net income (loss) | 690 | 206 | (212) | (1,067) | (908) | (1,291) | |||||||||||||||||||||||||||||
| Amounts attributable to noncontrolling interests | (72) | 0 | 0 | 0 | 432 | 360 | |||||||||||||||||||||||||||||
| Net income (loss) attributable to Loews Corporation | $ | 618 | $ | 206 | $ | (212) | $ | (1,067) | $ | (476) | $ | (931) | |||||||||||||||||||||||
| December 31, 2020 | |||||||||||||||||||||||||||||||||||
| Total assets | $ | 63,976 | $ | 9,353 | $ | 1,637 | $ | 5,270 | $ | — | $ | 80,236 | |||||||||||||||||||||||
| (b) | Amounts presented for Diamond Offshore reflect the periods prior to the deconsolidation. | ||||
Year Ended December 31, 2018 | CNA Financial | Diamond Offshore | Boardwalk Pipelines | Loews Hotels & Co | Corporate | Total | ||||||||||||||||||
(In millions) | ||||||||||||||||||||||||
Revenues: | ||||||||||||||||||||||||
Insurance premiums | $ | 7,312 | $ | 7,312 | ||||||||||||||||||||
Net investment income (loss) | 1,817 | $ | 8 | $ | 2 | $ | (10 | ) | 1,817 | |||||||||||||||
Investment losses | (57 | ) | (57 | ) | ||||||||||||||||||||
Non-insurance warranty revenue | 1,007 | 1,007 | ||||||||||||||||||||||
Operating revenues and other | 55 | 1,085 | $ | 1,227 | 753 | 867 | 3,987 | |||||||||||||||||
Total | 10,134 | 1,093 | 1,227 | 755 | 857 | 14,066 | ||||||||||||||||||
Expenses: | ||||||||||||||||||||||||
Insurance claims and policyholders’ benefits | 5,572 | 5,572 | ||||||||||||||||||||||
Amortization of deferred acquisition costs | 1,335 | 1,335 | ||||||||||||||||||||||
Non-insurance warranty expense | 923 | 923 | ||||||||||||||||||||||
Operating expenses and other | 1,203 | 1,196 | 820 | 653 | 956 | 4,828 | ||||||||||||||||||
Interest | 138 | 123 | 176 | 29 | 108 | 574 | ||||||||||||||||||
Total | 9,171 | 1,319 | 996 | 682 | 1,064 | 13,232 | ||||||||||||||||||
Income (loss) before income tax | 963 | (226 | ) | 231 | 73 | (207 | ) | 834 | ||||||||||||||||
Income tax (expense) benefit | (151 | ) | 30 | (28 | ) | (25 | ) | 46 | (128 | ) | ||||||||||||||
Net income (loss) | 812 | (196 | ) | 203 | 48 | (161 | ) | 706 | ||||||||||||||||
Amounts attributable to noncontrolling interests | (86 | ) | 84 | (68 | ) | (70 | ) | |||||||||||||||||
Net income (loss) attributable to Loews Corporation | $ | 726 | $ | (112 | ) | $ | 135 | $ | 48 | $ | (161 | ) | $ | 636 | ||||||||||
December 31, 2018 | ||||||||||||||||||||||||
Total assets | $ | 57,123 | $ | 6,036 | $ | 9,131 | $ | 1,812 | $ | 4,214 | $ | 78,316 | ||||||||||||
| 151 | ||||||||
Year Ended December 31, 2017 | CNA Financial | Diamond Offshore | Boardwalk Pipelines | Loews Hotels & Co | Corporate | Total | ||||||||||||||||||
(In millions) | ||||||||||||||||||||||||
Revenues: | ||||||||||||||||||||||||
Insurance premiums | $ | 6,988 | $ | 6,988 | ||||||||||||||||||||
Net investment income | 2,034 | $ | 2 | $ | 146 | 2,182 | ||||||||||||||||||
Investment gains | 122 | 122 | ||||||||||||||||||||||
Non-insurance warranty revenue | 390 | 390 | ||||||||||||||||||||||
Operating revenues and other | 49 | 1,498 | $ | 1,325 | $ | 682 | 499 | 4,053 | ||||||||||||||||
Total | 9,583 | 1,500 | 1,325 | 682 | 645 | 13,735 | ||||||||||||||||||
Expenses: | ||||||||||||||||||||||||
Insurance claims and policyholders’ benefits | 5,310 | 5,310 | ||||||||||||||||||||||
Amortization of deferred acquisition costs | 1,233 | 1,233 | ||||||||||||||||||||||
Non-insurance warranty expense | 299 | 299 | ||||||||||||||||||||||
Operating expenses and other | 1,224 | 1,373 | 861 | 589 | 618 | 4,665 | ||||||||||||||||||
Interest | 203 | 149 | 171 | 28 | 95 | 646 | ||||||||||||||||||
Total | 8,269 | 1,522 | 1,032 | 617 | 713 | 12,153 | ||||||||||||||||||
Income (loss) before income tax | 1,314 | (22 | ) | 293 | 65 | (68 | ) | 1,582 | ||||||||||||||||
Income tax (expense) benefit | (419 | ) | 4 | 232 | (1 | ) | 14 | (170 | ) | |||||||||||||||
Net income (loss) | 895 | (18 | ) | 525 | 64 | (54 | ) | 1,412 | ||||||||||||||||
Amounts attributable to noncontrolling interests | (94 | ) | (9 | ) | (145 | ) | (248 | ) | ||||||||||||||||
Net income (loss) attributable to Loews Corporation | $ | 801 | $ | (27 | ) | $ | 380 | $ | 64 | $ | (54 | ) | $ | 1,164 | ||||||||||
| CNA | Boardwalk | Loews | Diamond | ||||||||||||||||||||||||||||||||
| Year Ended December 31, 2019 | Financial | Pipelines | Hotels & Co | Corporate (a) | Offshore (b) | Total | |||||||||||||||||||||||||||||
| (In millions) | |||||||||||||||||||||||||||||||||||
| Revenues: | |||||||||||||||||||||||||||||||||||
| Insurance premiums | $ | 7,428 | 0 | 0 | 0 | 0 | $ | 7,428 | |||||||||||||||||||||||||||
| Net investment income | 2,118 | 0 | $ | 1 | $ | 230 | $ | 6 | 2,355 | ||||||||||||||||||||||||||
| Investment gains | 49 | 0 | 0 | 0 | 0 | 49 | |||||||||||||||||||||||||||||
| Non-insurance warranty revenue | 1,161 | 0 | 0 | 0 | 0 | 1,161 | |||||||||||||||||||||||||||||
| Operating revenues and other | 32 | $ | 1,300 | 691 | 933 | 982 | 3,938 | ||||||||||||||||||||||||||||
| Total | 10,788 | 1,300 | 692 | 1,163 | 988 | 14,931 | |||||||||||||||||||||||||||||
| Expenses: | |||||||||||||||||||||||||||||||||||
| Insurance claims and policyholders’ benefits | 5,806 | 0 | 0 | 0 | 0 | 5,806 | |||||||||||||||||||||||||||||
| Amortization of deferred acquisition costs | 1,383 | 0 | 0 | 0 | 0 | 1,383 | |||||||||||||||||||||||||||||
| Non-insurance warranty expense | 1,082 | 0 | 0 | 0 | 0 | 1,082 | |||||||||||||||||||||||||||||
| Operating expenses and other | 1,141 | 840 | 698 | 1,004 | 1,267 | 4,950 | |||||||||||||||||||||||||||||
| Interest | 152 | 179 | 22 | 115 | 123 | 591 | |||||||||||||||||||||||||||||
| Total | 9,564 | 1,019 | 720 | 1,119 | 1,390 | 13,812 | |||||||||||||||||||||||||||||
| Income (loss) before income tax | 1,224 | 281 | (28) | 44 | (402) | 1,119 | |||||||||||||||||||||||||||||
| Income tax (expense) benefit | (224) | (72) | (3) | (9) | 60 | (248) | |||||||||||||||||||||||||||||
| Net income (loss) | 1,000 | 209 | (31) | 35 | (342) | 871 | |||||||||||||||||||||||||||||
| Amounts attributable to noncontrolling interests | (106) | 0 | 0 | 0 | 167 | 61 | |||||||||||||||||||||||||||||
| Net income (loss) attributable to Loews Corporation | $ | 894 | $ | 209 | $ | (31) | $ | 35 | $ | (175) | $ | 932 | |||||||||||||||||||||||
| 152 | ||||||||
Item 9. Changes in and Disagreements with Accountants on Accounting and Financial Disclosure. |
None.
Disclosure Controls and Procedures
The Company maintains a system of disclosure controls and procedures (as defined in Rules
13a-15(e)
and15d-15(e)
under the Securities Exchange Act of 1934, as amended (the “Exchange Act”)), which is designed to ensure that information required to be disclosed by the Company in reports that it files or submits under the Exchange Act, including this Report, is recorded, processed, summarized and reported on a timely basis. These disclosure controls and procedures include controls and procedures designed to ensure that information required to be disclosed by the Company under the Exchange Act is accumulated and communicated to the Company’s management on a timely basis to allow decisions regarding required disclosure.The Company’s management, including the Company’s principal executive officer (“CEO”) and principal financial officer (“CFO”) conducted an evaluation of the effectiveness of the Company’s disclosure controls and procedures as of the end of the period covered by this Report and, based on that evaluation, the CEO and CFO concluded that the Company’s disclosure controls and procedures were effective as of December 31, 2019.
Internal Control Over Financial Reporting
Pursuant to Section 404 of the Sarbanes-Oxley Act of 2002, and the implementing rules of the Securities and Exchange Commission, the Company included a report of management’s assessment of the design and effectiveness of its internal control over financial reporting as part of this Annual Report on Form2019.2021. The independent registered public accounting firm of the Company also reported on the effectiveness of the Company’s internal control over financial reporting as of December 31, 2019.2021. Management’s report and the independent registered public accounting firm’s report are included under Item 8 of this Report under the captions entitled “Management’s Report on Internal Control Over Financial Reporting” and “Report of Independent Registered Public Accounting Firm.”
10-K
for the year ended December 31, There were no changes in the Company’s internal control over financial reporting (as defined in Rules20192021 that have materially affected or that are reasonably likely to materially affect the Company’s internal control over financial reporting.
13a-15(f)
and15d-15(f)
under the Exchange Act) that occurred during the quarter ended December 31, Item 9B. Other Information.
None.
Item 9C. Disclosure Regarding Foreign Jurisdictions that Prevent Inspections.
Not applicable.
| 153 | ||||||||
PART III
Item 10. Directors, Executive Officers and Corporate Governance.
Information about our executive officers is reported under the caption “Information about our Executive Officers” in Part I of this Report.
We have a Code of Business Conduct and Ethics which applies to all of our directors, officers and employees, including our principal executive officer, principal financial officer and principal accounting officer. This Code can be found on our website at www.loews.com and is available in print to any shareholder who requests a copy by writing to our Corporate Secretary at Loews Corporation, 667 Madison Avenue, New York, N.Y. 10065-8087. We intend to post any changes to or waivers of this Code for our directors and executive officers, including our principal executive officer, principal financial officer, principal accounting officer or persons performing similar functions, on our website. Any amendment to this Code and any waiver applicable to our executive officers or senior financial officers will be posted on our website within the time period required by the SEC and New York Stock Exchange.
Additional information required by this Item can be found in our Proxy Statement for our 20202022 Annual Meeting of Shareholders to be filed with the SEC within 120 days after December 31, 20192021 (the “2020“2022 Proxy Statement”) and is incorporated herein by reference.
Item 11. Executive Compensation.
Information required by this item can be found in our 20202022 Proxy Statement and is incorporated herein by reference.
Item 12. Security Ownership of Certain Beneficial Owners and Management and Related Stockholder Matters.
Information about securities authorized for issuance under equity compensation plans can be found under the caption “Securities Authorized for Issuance Under Equity Compensation Plans” under Item 5 of this Report.
Additional information required by this item can be found in our 20202022 Proxy Statement and is incorporated herein by reference.
Item 13. Certain Relationships and Related Transactions, and Director Independence.
Information required by this Item can be found in our 20202022 Proxy Statement and is incorporated herein by reference.
Item 14. Principal Accounting Fees and Services.
Information required by this Item can be found in our 20202022 Proxy Statement and is incorporated herein by reference.
| 154 | ||||||||
PART IV
Item 15. Exhibits and Financial Statement Schedules.
(a) 1.Financial Statements:
The financial statements above appear under Item 8. The following additional financial data should be read in conjunction with those financial statements. Schedules not included with these additional financial data have been omitted because they are not applicable or the required information is shown in the consolidated financial statements or notes to consolidated financial statements.
| Page Number | ||||||||
2. Financial Statement Schedules: | ||||||||
Loews Corporation and Subsidiaries: | ||||||||
| 2019 | ||||||||
| 2019 | ||||||||
| Description | Exhibit | |||||||||||
3. Exhibits: | ||||||||||||
(3) | Articles of Incorporation and By-Laws | |||||||||||
3.01 | ||||||||||||
3.02 | ||||||||||||
(4) | Instruments Defining the Rights of Security Holders, Including Indentures | |||||||||||
| 4.01 | ||||||||||||
Registrant hereby agrees to furnish to the Commission upon request copies of instruments with respect to long term debt, pursuant to Item 601(b)(4)(iii) of Regulation S-K | 4.02 | |||||||||||
(10) | Material Contracts | |||||||||||
10.01 + | ||||||||||||
| 155 | ||||||||
Number | |||||||||||||
| Description | Exhibit Number | ||||||||||||
10.02 + | |||||||||||||
10.03 + | |||||||||||||
10.04 + | |||||||||||||
10.05 + | |||||||||||||
10.06 + | |||||||||||||
10.07 + | |||||||||||||
10.09 + | |||||||||||||
10.10 + | |||||||||||||
Number | ||||||||||||
10.11+ | ||||||||||||
| 156 | ||||||||
| Description | Exhibit Number | |||||||||||
10.15+ | ||||||||||||
10.16+ | ||||||||||||
10.18+ | ||||||||||||
10.19+ | ||||||||||||
Number | ||||||||||||
| (21) | ||||||||||||
Subsidiaries of the Registrant | ||||||||||||
21.01* | ||||||||||||
(23) | Consent of Experts and Counsel | |||||||||||
23.01* | ||||||||||||
(24) | 24.01* | |||||||||||
| (31) | Rule 13a-14(a)/15d-14(a) Certifications | |||||||||||
31.01* | ||||||||||||
| 31.02* | ||||||||||||
| 157 | ||||||||
| Description | Exhibit Number | ||||||||||
| (32) | Section 1350 Certifications | ||||||||||
32.01* | |||||||||||
32.02* | |||||||||||
| (101) | XBRL Related Documents | ||||||||||
| XBRL Instance Document – the instance document does not appear in the Interactive Data File because its XBRL tags are embedded within the Inline XBRL document | 101.INS* | ||||||||||
| Inline XBRL Taxonomy Extension Schema | 101.SCH* | ||||||||||
| Inline XBRL Taxonomy Extension Calculation Linkbase | 101.CAL* | ||||||||||
| Inline XBRL Taxonomy Extension Definition Linkbase | 101.DEF* | ||||||||||
| Inline XBRL Taxonomy Label Linkbase | 101.LAB* | ||||||||||
| Inline XBRL Taxonomy Extension Presentation Linkbase | 101.PRE* | ||||||||||
| (104) | (Cover Page Interactive Data File (formatted as Inline XBRL and contained in Exhibit 101) | 104* | |||||||||
*Filed herewith.
+Management contract or compensatory plan or arrangement.
Not included.
| 158 | ||||||||
SIGNATURES
Pursuant to the requirements of Section 13 or 15(d) of the Securities Exchange Act of 1934, the Registrant has duly caused this Report to be signed on its behalf by the undersigned, thereunto duly authorized.
| LOEWS CORPORATION | |||||||||||||||
Dated: | February | By | |||||||||||||
(David B. Edelson, Senior Vice President and | |||||||||||||||
| Chief Financial Officer) | |||||||||||||||
| Pursuant to the requirements of the Securities Exchange Act of 1934, this Report has been signed below by the following persons on behalf of the Registrant and in the capacities and on the dates indicated. | |||||||||||||||
| Dated: | February 8, 2022 | By | * | ||||||||||||
| (James S. Tisch, President, | |||||||||||||||
Chief Executive Officer and Director) | |||||||||||||||
| Dated: | February 8, 2022 | By | * | ||||||||||||
| (David B. Edelson, Senior Vice President and | |||||||||||||||
Chief Financial Officer) | |||||||||||||||
| Dated: | February 8, 2022 | By | * | ||||||||||||
| (Mark S. Schwartz, Vice President, | |||||||||||||||
Chief Accounting | |||||||||||||||
| Dated: | February 8, 2022 | By | * | ||||||||||||
| (Ann E. Berman, Director) | |||||||||||||||
| Dated: | February 8, 2022 | By | * | ||||||||||||
| (Joseph L. Bower, Director) | |||||||||||||||
| Dated: | February 8, 2022 | By | * | ||||||||||||
| (Charles D. Davidson, Director) | |||||||||||||||
| 159 | ||||||||
Dated: | February | By | * | ||||||||||||
(Charles M. Diker, Director) | |||||||||||||||
| Dated: | February 8, 2022 | By | * | ||||||||||||
| (Paul J. Fribourg, Director) | |||||||||||||||
| Dated: | February 8, 2022 | By | * | ||||||||||||
| (Walter L. Harris, Director) | |||||||||||||||
| Dated: | February 8, 2022 | By | * | ||||||||||||
| (Philip A. Laskawy, Director) | |||||||||||||||
| Dated: | February 8, 2022 | By | * | ||||||||||||
| (Susan P. Peters, Director) | |||||||||||||||
| Dated: | February 8, 2022 | By | * | ||||||||||||
| (Andrew H. Tisch, Director) | |||||||||||||||
| Dated: | February 8, 2022 | By | * | ||||||||||||
| (Jonathan M. Tisch, Director) | |||||||||||||||
| Dated: | February 8, 2022 | By | * | ||||||||||||
| (Anthony Welters, Director) | |||||||||||||||
*By: | /s/ Marc A. Alpert | ||||||||
(Marc A. Alpert, Senior Vice President, General | |||||||||
| Counsel and Secretary) | |||||||||
| Attorney-in-Fact | |||||||||
| 160 | ||||||||
SCHEDULE I
Condensed Financial Information of Registrant
LOEWS CORPORATION
BALANCE SHEETS
ASSETS
December 31 | 2019 | 2018 | ||||||
(In millions) | ||||||||
Current assets, principally investment in short term instruments | $ | 2,550 | $ | 2,050 | ||||
Investments in securities | 734 | 1,112 | ||||||
Investments in capital stocks of subsidiaries, at equity | 18,123 | 17,556 | ||||||
Other assets | 24 | 402 | ||||||
Total assets | $ | 21,431 | $ | 21,120 | ||||
LIABILITIES AND SHAREHOLDERS’ EQUITY | ||||||||
Current liabilities | $ | 77 | $ | 109 | ||||
Long term debt | 1,779 | 1,778 | ||||||
Deferred income tax and other | 456 | 715 | ||||||
Total liabilities | 2,312 | 2,602 | ||||||
Shareholders’ equity | 19,119 | 18,518 | ||||||
Total liabilities and shareholders’ equity | $ | 21,431 | $ | 21,120 | ||||
| December 31 | 2021 | 2020 | |||||||||
| (In millions) | |||||||||||
| Current assets, principally investment in short term instruments | $ | 2,818 | $ | 2,766 | |||||||
| Investments in securities | 734 | 775 | |||||||||
| Investments in capital stocks of subsidiaries, at equity | 16,794 | 16,861 | |||||||||
| Other assets | 20 | 22 | |||||||||
| Total assets | $ | 20,366 | $ | 20,424 | |||||||
| LIABILITIES AND SHAREHOLDERS’ EQUITY | |||||||||||
| Current liabilities | $ | 92 | $ | 63 | |||||||
| Long term debt | 2,278 | 2,276 | |||||||||
| Deferred income tax and other | 150 | 225 | |||||||||
| Total liabilities | 2,520 | 2,564 | |||||||||
| Shareholders’ equity | 17,846 | 17,860 | |||||||||
| Total liabilities and shareholders’ equity | $ | 20,366 | $ | 20,424 | |||||||
STATEMENTS OF INCOMEOPERATIONS AND COMPREHENSIVE INCOME (LOSS)
Year Ended December 31 | 2019 | 2018 | 2017 | |||||||||
(In millions) | ||||||||||||
Revenues: | ||||||||||||
Equity in income of subsidiaries (a) | $ | 867 | $ | 819 | $ | 1,199 | ||||||
Net investment income (loss), interest and other | 239 | (11 | ) | 167 | ||||||||
Total | 1,106 | 808 | 1,366 | |||||||||
Expenses: | ||||||||||||
Administrative | 83 | 127 | 134 | |||||||||
Interest | 72 | 72 | 72 | |||||||||
Total | 155 | 199 | 206 | |||||||||
Income before income tax | 951 | 609 | 1,160 | |||||||||
| Income tax (expense) benefit | (19 | ) | 27 | 4 | ||||||||
Net income | 932 | 636 | 1,164 | |||||||||
Equity in other comprehensive income (loss) of subsidiaries | 812 | (797 | ) | 197 | ||||||||
Total comprehensive income (loss) | $ | 1,744 | $ | (161 | ) | $ | 1,361 | |||||
| Year Ended December 31 | 2021 | 2020 | 2019 | ||||||||||||||
| (In millions) | |||||||||||||||||
| Revenues: | |||||||||||||||||
Equity in income of subsidiaries (a) | $ | 1,655 | $ | 120 | $ | 867 | |||||||||||
| Net investment income, interest and other | 103 | 65 | 239 | ||||||||||||||
| Investment loss | (15) | (1,211) | 0 | ||||||||||||||
| Total | 1,743 | (1,026) | 1,106 | ||||||||||||||
| Expenses: | |||||||||||||||||
| Administrative | 93 | 98 | 83 | ||||||||||||||
| Interest | 89 | 83 | 72 | ||||||||||||||
| Total | 182 | 181 | 155 | ||||||||||||||
| Income (loss) before income tax | 1,561 | (1,207) | 951 | ||||||||||||||
| Income tax (expense) benefit | 17 | 276 | (19) | ||||||||||||||
| Net income (loss) | 1,578 | (931) | 932 | ||||||||||||||
| Equity in other comprehensive income (loss) of subsidiaries | (395) | 649 | 812 | ||||||||||||||
| Total comprehensive income (loss) | $ | 1,183 | $ | (282) | $ | 1,744 | |||||||||||
| 161 | ||||||||
SCHEDULE I
(Continued)
Condensed Financial Information of Registrant
LOEWS CORPORATION
STATEMENTS OF CASH FLOWS
Year Ended December 31 | 2019 | 2018 | 2017 | |||||||||
(In millions) | ||||||||||||
Operating Activities: | ||||||||||||
Net income | $ | 932 | $ | 636 | $ | 1,164 | ||||||
Adjustments to reconcile net income to net cash provided (used) by operating activities: | ||||||||||||
Equity method investees | 36 | 401 | (405 | ) | ||||||||
Provision for deferred income taxes | 106 | 113 | 77 | |||||||||
Changes in operating assets and liabilities, net: | ||||||||||||
Receivables | 1 | 3 | 4 | |||||||||
Accounts payable and accrued liabilities | (29 | ) | 92 | (20 | ) | |||||||
Trading securities | (478 | ) | 1,702 | 100 | ||||||||
Other, net | 36 | 19 | (41 | ) | ||||||||
604 | 2,966 | 879 | ||||||||||
Investing Activities: | ||||||||||||
Investments in and advances to subsidiaries | 183 | (135 | ) | 12 | ||||||||
Change in investments, primarily short term | 326 | (187 | ) | 30 | ||||||||
Purchase of Boardwalk Pipelines common units | (1,504 | ) | ||||||||||
Acquisition | (620 | ) | ||||||||||
Other | (2 | ) | (1 | ) | ||||||||
509 | (1,828 | ) | (579 | ) | ||||||||
Financing Activities: | ||||||||||||
Dividends paid | (76 | ) | (80 | ) | (84 | ) | ||||||
Purchases of treasury shares | (1,051 | ) | (1,026 | ) | (216 | ) | ||||||
Other | (5 | ) | (3 | ) | ||||||||
(1,132 | ) | (1,109 | ) | (300 | ) | |||||||
Net change in cash | (19 | ) | 29 | - | ||||||||
Cash, beginning of year | 29 | |||||||||||
Cash, end of year | $ | 10 | $ | 29 | $ | - | ||||||
| Year Ended December 31 | 2021 | 2020 | 2019 | ||||||||||||||
| (In millions) | |||||||||||||||||
| Operating Activities: | |||||||||||||||||
| Net income (loss) | $ | 1,578 | $ | (931) | $ | 932 | |||||||||||
| Adjustments to reconcile net income (loss) to net cash provided (used) by operating activities: | |||||||||||||||||
| Equity method investees | (820) | 834 | 36 | ||||||||||||||
| Loss on deconsolidation | 15 | 1,211 | 0 | ||||||||||||||
| Provision for deferred income taxes | 7 | (196) | 106 | ||||||||||||||
| Changes in operating assets and liabilities, net: | |||||||||||||||||
| Receivables | 0 | 0 | 1 | ||||||||||||||
| Accounts payable and accrued liabilities | (48) | (38) | (29) | ||||||||||||||
| Trading securities | (69) | (566) | (478) | ||||||||||||||
| Other, net | 82 | 44 | 36 | ||||||||||||||
| 745 | 358 | 604 | |||||||||||||||
| Investing Activities: | |||||||||||||||||
| Investments in and advances to subsidiaries | 385 | (169) | 183 | ||||||||||||||
| Change in investments, primarily short term | 72 | 326 | 326 | ||||||||||||||
| 457 | 157 | 509 | |||||||||||||||
| Financing Activities: | |||||||||||||||||
| Dividends paid | (65) | (70) | (76) | ||||||||||||||
| Purchases of treasury shares | (1,136) | (923) | (1,051) | ||||||||||||||
| Issuance of debt | 0 | 495 | 0 | ||||||||||||||
| Other | (4) | (5) | (5) | ||||||||||||||
| (1,205) | (503) | (1,132) | |||||||||||||||
| Net change in cash | (3) | 12 | (19) | ||||||||||||||
| Cash, beginning of year | 22 | 10 | 29 | ||||||||||||||
| Cash, end of year | $ | 19 | $ | 22 | $ | 10 | |||||||||||
(a) | Cash dividends paid to the Company by affiliates amounted to | |||||
| 162 | ||||||||
SCHEDULE V
LOEWS CORPORATION AND SUBSIDIARIES
Supplemental Information Concerning Property and Casualty Insurance Operations
| Consolidated Property and Casualty Operations | |||||||||||
| December 31 | 2021 | 2020 | |||||||||
| (In millions) | |||||||||||
| Deferred acquisition costs | $ | 737 | $ | 708 | |||||||
| Reserves for unpaid claim and claim adjustment expenses | 24,174 | 22,706 | |||||||||
| Discount deducted from claim and claim adjustment expense reserves above (based on interest rates ranging from 3.5% to 6.4%) | 1,146 | 1,209 | |||||||||
| Unearned premiums | 5,761 | 5,119 | |||||||||
| Year Ended December 31 | 2021 | 2020 | 2019 | ||||||||||||||
| (In millions) | |||||||||||||||||
| Net written premiums | $ | 8,405 | $ | 8,059 | $ | 7,656 | |||||||||||
| Net earned premiums | 8,175 | 7,649 | 7,428 | ||||||||||||||
| Net investment income | 2,111 | 1,896 | 2,063 | ||||||||||||||
| Incurred claim and claim adjustment expenses related to current year | 5,970 | 5,793 | 5,356 | ||||||||||||||
| Incurred claim and claim adjustment expenses related to prior years | (104) | (119) | (127) | ||||||||||||||
| Amortization of deferred acquisition costs | 1,443 | 1,410 | 1,383 | ||||||||||||||
| Paid claim and claim adjustment expenses | 4,844 | 5,164 | 5,576 | ||||||||||||||
| 163 | ||||||||
December 31 | 2019 | 2018 | ||||||
(In millions) | ||||||||
Deferred acquisition costs | $ | 662 | $ | 633 | ||||
Reserves for unpaid claim and claim adjustment expenses | 21,720 | 21,984 | ||||||
Discount deducted from claim and claim adjustment expense | ||||||||
reserves above (based on interest rates ranging from 3.5% to 7.6%) | 1,321 | 1,388 | ||||||
Unearned premiums | 4,583 | 4,183 | ||||||
Year Ended December 31 | 2019 | 2018 | 2017 | |||||||||
(In millions) | ||||||||||||
Net written premiums | $ | 7,656 | $ | 7,345 | $ | 7,069 | ||||||
Net earned premiums | 7,428 | 7,312 | 6,988 | |||||||||
Net investment income | 2,063 | 1,751 | 1,992 | |||||||||
Incurred claim and claim adjustment expenses related to current year | 5,356 | 5,358 | 5,201 | |||||||||
Incurred claim and claim adjustment expenses related to prior years | (127 | ) | (179 | ) | (381 | ) | ||||||
Amortization of deferred acquisition costs | 1,383 | 1,335 | 1,233 | |||||||||
Paid claim and claim adjustment expenses | 5,576 | 5,331 | 5,341 | |||||||||