UNITED STATES
SECURITIES AND EXCHANGE COMMISSION
Washington, D.C. 20549
FORM10-K10-K/A
Amendment No. 1
(Mark One)
| ☒ | ANNUAL REPORT PURSUANT TO SECTION 13 OR 15(d) OF THE SECURITIES EXCHANGE |
For the fiscal year ended December 31, 20192021
or
| ☐ | TRANSITION REPORT PURSUANT TO SECTION 13 OR 15(d) OF THE SECURITIES EXCHANGE ACT OF 1934 |
For the transition period from
to
Commission file number:
001-38068
ZYMEWORKS INC.
(Exact name of registrant as specified in its charter)
British Columbia, Canada | ||
(State or other jurisdiction of incorporation or organization) | (I.R.S. Employer Identification Number) |
Suite 540—1385 West 8800 — 114 East 4
th
AvenueVancouver, BC V6H 3V9V5T 1G4
(Address of principal executive offices, including zip code)
Registrant’s telephone number, including area code: (604)
678-1388
Securities registered pursuant to Section 12(b) of the Act:
Title of each class | Trading Symbol(s) | Name of each exchange on which registered | ||
Common | ZYME | New York Stock Exchange |
Securities registered pursuant to Section 12(g) of the Act: None
Indicate by check mark if the registrant is a well-known seasoned issuer, as defined in Rule 405 of the Securities Act. Yes No
☒
☐
Indicate by check mark if the registrant is not required to file reports pursuant to Section 13 or 15(d) of the Act. Yes
☐
No ☒
Indicate by check mark whether the registrant: (1) has filed all reports required to be filed by Section 13 or 15(d) of the Securities Exchange Act of 1934 during the preceding 12 months (or for such shorter period that the registrant was required to file such reports), and (2) has been subject to such filing requirements for the past 90 days. Yes No
☒
☐
Indicate by check mark whether the registrant has submitted electronically every Interactive Data File required to be submitted pursuant to Rule 405 of Regulation No
S-T
(§232.405 of this chapter) during the preceding 12 months (or for such shorter period that the registrant was required to submit such files). Yes ☒
☐
Indicate by check mark whether the registrant is a large accelerated filer, an accelerated filer, a
non-accelerated
filer, a smaller reporting company, or an emerging growth company. See the definitions of “large accelerated filer,” “accelerated filer,” “smaller reporting company,” and “emerging growth company” in Rule12b-2
of the Exchange Act.| Large accelerated filer | ☒ | Accelerated filer | ☐ | |||
☐ | ||||||
Emerging growth company | ☐ | |||||
If an emerging growth company, indicate by check mark if the registrant has elected not to use the extended transition period for complying with any new or revised financial accounting standards provided pursuant to Section 13(a) of the Exchange Act. ☐
Indicate by check mark whether the registrant has filed a report on and attestation to its management’s assessment of the effectiveness of its internal control over financial reporting under Section 404(b) of the Sarbanes-Oxley Act (15 U.S.C. 7262(b)) by the registered public accounting firm that prepared or issued its audit report. ☒
Indicate by check mark whether the registrant is a shell company (as defined in Rule
12b-2
of the Securities Exchange Act of 1934). Yes ☐
No ☒
The aggregate market value of the voting and$851.7$1,590.8 million.
non-voting
common shares held bynon-affiliates
of the registrant, based on the closing sale price of the registrant’s common shares on the last business day of its most recently completed second fiscal quarter, as reported on the NYSE was approximately The number of outstanding common shares of the registrant, no par value per share, as of February27, 2020April 28, 2022 was 45,518,869.57,771,204.
DOCUMENTS INCORPORATED BY REFERENCE
| Auditor Name: KPMG LLP | Auditor Location: Vancouver, Canada | Auditor Firm PCAOB ID: 85 |
EXPLANATORY NOTE
This Amendment No. 1 on Form”), amends Zymeworks Inc.’s (the “,” “,” “,” “,” and “”) annual report on Form”). We are amending and refiling Part III to include information required by Items 10, 11, 12, 13 and 14 because our definitive proxy statement will not be filed within 120 days after December 31, 2021, the end of the fiscal year covered by our annual report on Form
10-K/A
(this “Amendment
Company
Zymeworks
we
us
our
10-K
for the year ended December 31, 2021, originally filed with the Securities and Exchange Commission, or SEC, on February 24, 2022 (the “Original Filing
10-K.
Pursuant to the rules of the SEC, we have also included as exhibits currently dated certifications required under Section 302 of The Sarbanes-Oxley Act of 2002. Because no financial statements are contained within this Amendment, we are not including certifications pursuant to Section 906 of The Sarbanes-Oxley Act of 2002. We are amending and refiling Part IV to reflect the inclusion of those certifications, along with any changes to Part IV that occurred after the date of the Original Filing.
In addition, we made certain revisions to the cover page, including the deletion of the reference to our proxy statement and inclusion of updated outstanding share information.
Except as described above, no other changes have been made to the Original Filing. Except as otherwise indicated herein, this Amendment continues to speak as of the date of the Original Filing, and we have not updated the disclosures contained therein to reflect any events that occurred subsequent to the date of the Original Filing. The filing of this Amendment is not a representation that any statements contained in items of our annual report on Form
10-K
other than Part III, Items 10 through 14, Part IV and the aforementioned portions of the cover page are true or complete as of any date subsequent to the Original Filing.ZYMEWORKS INC.
FORM10-K10-K/A
For the Fiscal Year Ended December 31, 20192021
Table of Contents
| PART III | 4 | |||||
Item 10. | ||||||
Item 11. | ||||||
Item 12. | ||||||
Item 13. | ||||||
Item 14. | 36 | |||||
| PART IV | 38 | |||||
Item 15. | Exhibits, Financial Statement Schedules | 38 | ||||
3
Item 10. | Directors, Executive Officers and Corporate Governance |
BOARD OF DIRECTORS
Name | Residence | Age | Position(s) | |||
Kenneth Galbraith | Cambridge, United Kingdom | 59 | President, Chief Executive Officer and Chair of Board of Directors | |||
Susan Mahony (1) (2) | Indiana, USA | 57 | Director | |||
Kelvin Neu (4) | Singapore | 48 | Director | |||
Troy M. Cox (1) (3) | Florida, USA | 57 | Director | |||
Kenneth Hillan (3)(4) | California, USA | 61 | Director | |||
Hollings C. Renton (2) | California, USA | 75 | Director | |||
Natalie Sacks (3) (4) | California, USA | 57 | Director | |||
Lota Zoth (1) (2) | Texas, USA | 62 | Director |
| (1) | Member of the audit committee. |
| (2) | Member of the compensation committee. |
| (3) | Member of the nominating and corporate governance committee. |
| (4) | Member of the research and development committee. |
Kenneth Galbraith
Mr. Galbraith is 59 years old and has served as our President, Chief Executive Officer and Chair of our Board of Directors since January 2022. Mr. Galbraith was a Managing Director at Five Corners Capital, Inc., which he founded in 2013. Most recently he served as Executive in Residence at Syncona Limited from April 2021 until January 2022. He served as Chief Executive Officer of Liminal BioSciences Inc. (formerly Prometic Life Sciences Inc.), a publicly held company, from April 2019 to November 2020, continuing as an advisor to that company from November 2020 to February 2021. He also served as Chief Executive Officer of Fairhaven Pharmaceuticals Inc. from June 2017 to April 2019. Mr. Galbraith served as a director of MacroGenics, Inc. from July 2008 until January 2022, and has served as a director of Profound Medical Corp. since January 2017, both of which are publicly held companies. He has also served as a director of several privately held companies. Previously, he joined Ventures West Capital in 2007 and founded Five Corners Capital Inc. in 2013 to manage the risk of employee misconduct including noncompliance with regulatory standards and insider trading;
Directors.
Susan Mahony
Dr. Mahony is 57 years old and has served as a member of our Board of Directors since June 2019. Dr. Mahony is an executive with over 30 years of experience in pharmaceutical and life sciences companies. Dr. Mahony served as Senior Vice President of Eli Lilly and Company and President of Lilly Oncology from February 2011 until August 2018. She joined Lilly in 2000, holding senior leadership positions in product development, marketing, human resources, and general management. Prior to joining Lilly, Dr. Mahony served in sales and marketing roles in Europe for over a decade for Schering-Plough, Amgen, and Bristol-Myers Squibb. Dr. Mahony has served on the board of directors of Assembly Biosciences, Inc. since December 2017, on the board of directors for Vifor Pharma since May 2019, and on the board of directors of Horizon Therapeutics Public Limited Company since August 2019. Dr. Mahony received a B.Sc. and a Ph.D. from Aston University and an M.B.A. from London Business School. Dr. Mahony is a resident of Indiana, USA.
4
Kelvin Neu
Dr. Neu is 48 years old and has served as a member of our Board of Directors since March 2020. Dr. Neu was a Partner at Baker Bros. Advisors LP, a registered investment adviser, from April 2004 until January 2021. Dr. Neu previously served on the board of directors of IGM Biosciences, Prelude Therapeutics, Idera Pharmaceuticals, Aquinox Pharmaceuticals and XOMA Corporation. Dr. Neu holds an M.D. from the Harvard
Medical School-MIT Health
Sciences and Technology program, and spent three years in the Immunology Ph.D. program at Stanford University as a Howard Hughes Medical Institute Fellow. Dr. Neu holds an A.B. (summa cum laude) from Princeton University, where he was awarded the Khoury Prize for graduating first in his department of Molecular Biology. Prior to attending Princeton, Dr. Neu served for two and a half years in the military of his native Singapore. Dr. Neu is a resident of Singapore.We believe that Dr. Neu is qualified to serve on our Board of Directors because of his extensive investment and leadership experience, knowledge of our industry, and educational background in biology and biotechnology.
Troy M. Cox
Mr. Cox is 57 years old and has served as a member of our Board of Directors since June 2019. Mr. Cox served as Chief Executive Officer of Foundation Medicine, Inc. from February 2017 through February 2019, as a member of Foundation Medicine’s board of directors from February 2017 until July 2018, and in the additional role of President of Foundation Medicine from February 2018 until July 2018. Prior to Foundation Medicine, Mr. Cox served as Senior Vice President, Sales & Marketing at Genentech, Inc. from February 2010 until February 2017. Before joining Genentech, Mr. Cox served as President of CNS operations at UCB S.A., with responsibility for developing and commercializing therapeutics for diseases primarily related to the central nervous system. Prior to UCB BioPharma, Mr. Cox held senior commercial leadership roles with Sanofi-Aventis and Schering-Plough. Mr. Cox serves on the board of directors of SomaLogic, Inc. and SOPHiA GENETICS SA. Mr. Cox received a B.B.A. in finance from the University of Kentucky and an M.B.A. from the University of Missouri. Mr. Cox is a resident of Florida, USA.
We believe Mr. Cox’s nearly three decades of proven leadership and expertise in the global, strategic and operational aspects of the biopharmaceutical industry qualifies him to serve on our Board of Directors.
Kenneth Hillan
Dr. Hillan is 61 years old and has served as a member of our Board of Directors since February 2017. Dr. Hillan has served as Head of Therapeutics at 23andMe since February 2019. Dr. Hillan served on the board of directors of Achaogen, Inc., a public biopharmaceutical company, from October 2011 until April 2019. Dr. Hillan served as Achaogen’s President and President, R&D from January 2018 to October 2018, as its Chief Executive Officer from October 2011 until December 2017, and as its Chief Medical Officer from April 2011 to July 2014. Prior to joining Achaogen, Dr. Hillan worked at Genentech, Inc., a pharmaceutical company and a member of the Roche Group, from August 1994 to March 2011. Dr. Hillan held progressively senior roles at Genentech, most recently holding the position of Senior Vice President & Head of Roche Product Development, Asia Pacific from April 2010 to March 2011, and was responsible for numerous successful drug approvals and led the medical and scientific strategies for Genentech’s immunology, tissue growth and repair drug portfolio. Dr. Hillan has served on the board of directors of Sangamo Therapeutics, Inc. since September 2020, and served on the board of directors of Relypsa, Inc., a publicly traded biotechnology company that was acquired in September 2016 by Galencia AG for $1.5 billion, from June 2014 to September 2016. Dr. Hillan has an M.B. and a Ch.B. (Bachelor of Medicine and Surgery) degree from the Faculty of Medicine at the University of Glasgow in the United Kingdom. Dr. Hillan is a Fellow of the Royal College of Surgeons, and a Fellow of the Royal College of Pathologists. Dr. Hillan is a resident of California, USA.
We believe that Dr. Hillan’s extensive experience and knowledge in the development of therapeutics and in the biotechnology industry provides the Board of Directors with valuable insight and contribution to the Company’s development of genomic medicines.
Hollings C. Renton
Mr. Renton is 75 years old and has served as a member of our Board of Directors since February 2017. Mr. Renton served as Chief Executive Officer and President of Onyx Pharmaceuticals, Inc. from March 1993 to March 2008 and was the chair of the board of directors of Onyx from June 2000 to March 2008. Onyx was acquired by Amgen Inc. in 2013 for $10.4 billion. Before joining Onyx, Mr. Renton was the President and Chief Operating Officer of Chiron Corporation, a pharmaceutical company,
5
from December 1991 to December 1993. Mr. Renton served in a variety of executive roles at Cetus Corporation from 1983, including as President from 1990 to 1991, Chief Operating Officer from 1987 to 1990 and Chief Financial Officer from 1983 to 1987, prior to its acquisition by Chiron in 1991. Mr. Renton has served on the board of directors of AnaptysBio, Inc. since June 2015. Previously, Mr. Renton served on the boards of four other biopharmaceutical companies, Portola Pharmaceuticals Inc., where he had also been board chairman (March 2010 to July 2020), KYTHERA Biopharmaceuticals, Inc. (December 2014 to October 2015), Affymax, Inc. (June 2009 to November 2014) and Rigel Pharmaceuticals, Inc. (January 2004 to March 2014). Mr. Renton also previously served on the board of Cepheid Inc., a molecular diagnostics company, from March 2000 to November 2016. Mr. Renton received his M.B.A. from the University of Michigan and his B.S. in Mathematics from Colorado State University. Mr. Renton is a resident of California, USA.
Because of Mr. Renton’s extensive experience building successful biotechnology companies and commercializing drug products, we believe he is able to bring valuable insights to our Board of Directors.
Natalie Sacks
Dr. Sacks is 57 years old and has served as a member of our Board of Directors since August 2017. Dr. Sacks is a trained oncologist, and has served as the Chief Medical Officer of Harpoon Therapeutics, Inc. since October 2018. She has served as a director on the board of Caribou Biosciences, Inc., a genome editing company, since May 2018 and on the board of STipe Therapeutics since April 2020. Prior to joining Harpoon, Dr. Sacks served as Chief Medical Officer of Aduro Biotech from September 2016 until September 2018. Previously, she was Vice President of Clinical Development at Onyx Pharmaceuticals (acquired by Amgen Inc.), where she played a key role in the development and approval of Kyprolis
®
, anFDA-approved
therapy for the treatment of multiple myeloma. Prior to that, she served as Vice President of Clinical Research for Exelixis where she directed the development of a portfolio of small molecules, including late-stage development of Cometriq™
. In addition to her industry experience, Dr. Sacks held a faculty appointment at the University of California, San Francisco, as an assistant clinical professor of medicine in the Division of Hematology/Oncology from 2003 to 2016. She received her M.D. from the University of Pennsylvania School of Medicine, her M.S. in Biostatistics from Harvard University School of Public Health and her B.A. in Mathematics from Bryn Mawr College. Dr. Sacks is a resident of California, USA.We believe Dr. Sacks’ is qualified to serve on our Board of Directors because of her extensive experience and education background in biology and biotechnology, in addition to her leadership experience as an executive for biotechnology companies.
Lota Zoth
Ms. Zoth is 62 years old and has served as a member of our Board of Directors since November 2016. Ms. Zoth has served as Lead Independent Director of our Board of Directors since January 2022, and served as the Chair of our Board of Directors from September 2019 to January 2022. Ms. Zoth is a Certified Public Accountant and has served as Chief Financial Officer, Chief Accounting Officer and Controller for various publicly traded companies, including MedImmune, Inc. and PSINet, Inc., and as a financial executive in various roles at Sodexho Marriott, Marriott International, Pepsi-Cola International and PepsiCo. Ms. Zoth began her career as an auditor with Ernst & Young. Ms. Zoth serves on the boards and audit committees of Nasdaq-listed biopharmaceutical companies Inovio Pharmaceuticals, Inc., Lumos Pharma, Inc. and 89Bio, Inc. Previously, Ms. Zoth served on the boards of six other biopharmaceutical companies (Aeras, Circassia Pharmaceuticals, plc, Hyperion Therapeutics, Inc., Ikaria, Inc. Orexigen Therapeutics, Inc., and Spark Therapeutics, Inc.). Ms. Zoth is a resident of Texas, USA.
We believe Ms. Zoth is qualified to serve on our Board of Directors because of her experience as a senior executive and member of the board of other life science companies.
EXECUTIVE OFFICERS
The following table sets forth the names, ages and positions of our executive officers as of April 29, 2022.
| Name | Residence | Age | Position(s) | |||
| Kenneth Galbraith | Cambridge, United Kingdom | 59 | President, Chief Executive Officer and Chair of Board of Directors | |||
| Neil Klompas, CPA, CA | British Columbia, Canada | 50 | Chief Operating Officer | |||
| Neil Josephson, M.D. | Washington, USA | 61 | Chief Medical Officer | |||
| Christopher Astle, Ph.D. | British Columbia, Canada | 42 | Senior Vice President, Chief Financial Officer |
There are no family relationships among any of the directors or executive officers.
6
The following is biographical information for our executive officers, other than Mr. Galbraith, whose biographical information is included above.
Neil Klompas
Mr. Klompas joined Zymeworks in March 2007 and currently serves as our Chief Operating Officer. Previously, Mr. Klompas served as our Chief Financial Officer from December 2007 to February 2022 and as our Executive Vice President, Business Operations from September 2019 until January 2022. Prior to joining Zymeworks, he worked with KPMG LLP in Canada and the United States, most recently (from 2005 to 2007) with KPMG’s Pharmaceuticals, Biotechnology and Medical Device M&A Transaction Services practice in Princeton, New Jersey, where he advised on transactions including mergers, acquisitions, divestitures and strategic alliances. Prior to that, from 2000 to 2005 Mr. Klompas worked with KPMG’s Canadian Biotechnology and Pharmaceuticals practice. Mr. Klompas currently serves on the Board of Liminal BioSciences Inc. (NASDAQ: LMNL). Mr. Klompas is a Chartered Professional Accountant and is a member of Chartered Professional Accountants of British Columbia. Mr. Klompas also holds a degree in Microbiology & Immunology from the University of British Columbia. He serves on the faculty advisory board for Biotechnology and Chemistry for Camosun College and as a member of the board of directors of Ovensa Inc., a private biotechnology company.
Neil Josephson
Dr. Josephson joined Zymeworks in April 2019 and has served as our Chief Medical Officer since November 2021. Dr. Josephson served as our Vice President, Clinical Research from April 2019 until August 2020, as our Senior Vice President, Clinical Research from August 2020 to November 2021, and as our interim Chief Medical Officer from May 2021 until November 2021. Prior to joining Zymeworks he was a Vice President in Clinical Development at Seattle Genetics where he worked on multiple early and late-stage programs from 2013-2019, including leading the first line approval of ADCETRIS
®
in Hodgkin Lymphoma. From 2002-2013 Dr. Josephson was a full-time faculty member of the Division of Hematology at the University of Washington and the Puget Sound Blood Center, serving as an Associate Professor of Medicine and the Director of Hemophilia Care Program. He completed fellowship training in Hematology and Oncology at the University of Washington and holds an M.D. degree from Columbia University and an A.B. in biology from Dartmouth College.Christopher Astle
Dr. Astle joined Zymeworks in April 2021 and was promoted to Senior Vice President and Chief Financial Officer in February 2022. He previously served as our Executive Director, Corporate and Commercial Finance from April 2021 to February 2022. Prior to joining Zymeworks, Dr. Astle worked as a Chief Financial Officer at the CFO Centre in British Columbia, Canada from March 2020 to March 2021, and as Vice President, Finance at Alder BioPharmaceuticals Inc. in Seattle, USA from April 2019 to February 2020. From August 2017 to January 2020, he served as Chief Executive Officer and founder of Think Forwards, a boutique financial consulting firm in London, United Kingdom. Dr. Astle worked at Allergan from 2011 to 2017, including as the Associate Vice President Finance, International Division from July 2016 to July 2017, managing multiple product launches, M&A transactions and restructurings, with a team of 170 across 60 countries. He is a UK Chartered Accountant (ICAS), qualifying at PwC London, UK in Audit & Pharmaceutical Performance Improvement Consulting with audit clients including GSK. He is a board member of two private biotechnology companies, Oak Bay Biosciences (2020-present) and Healome Therapeutics (2021-present). During his time in the United Kingdom, he was the Chair of the 2018 CFO Agenda conference, guest lecturer at the Henley Business School, and judge at the British Accountancy Awards. Dr. Astle holds a PhD in Organic Chemistry from the University of Bristol (UK) and a MChem in Chemistry from the University of Liverpool (UK).
Although the Company has not adopted specific targets for women and other diverse candidates in executive positions, the Board of Directors has always considered diversity as an important aspect of its decision making when recommending appointments for individuals to serve as executive officers.
GOVERNANCE
Code of Conduct and Ethics
Our Board of Directors has adopted corporate governance guidelines that set forth expectations for directors, director independence standards, board committee structure and functions, and other policies for the Company’s governance. It also has adopted a Code of Business Conduct and Ethics (the “”) that applies to members of our Board of Directors and our executive officers as well as all of our employees. Several standing committees (audit, compensation, nominating and corporate governance, and research and development) assist our Board of Directors in carrying out its responsibilities. Each standing committee operates under a written charter adopted by our Board of Directors. Our Board of Directors has adopted written position descriptions for the Chair of the Board of Directors and lead independent director, the chair of each committee
Code of Conduct
7
and our Chief Executive Officer. The full text of our Code of Conduct is posted on our website at www.zymeworks.com. We intend to post on our website any amendments or waivers to our Code of Conduct requiring disclosure under applicable SEC or NYSE rules.
Audit Committee
Our audit committee consists of Mr. Cox, Dr. Mahony and Ms. Zoth. Ms. Zoth serves as the chair of our audit committee. Our Board of Directors has determined that each of Mr. Cox and Ms. Zoth is an “audit committee financial expert” as that term is defined in the rules and regulations established by the SEC. The members of our audit committee are “financially literate” and “independent” within the meaning of NYSE rules and Canadian National Instrument(“”).
52-110
–Audit Committees
NI
52-110
Ms. Zoth currently serves on the audit committees of three other public companies: 89 Bio, Inc., Inovio Pharmaceuticals, Inc., and Lumos Pharma, Inc. Our Board of Directors has determined that Ms. Zoth’s simultaneous service on those audit committees does not impair her ability to effectively serve on our audit committee.
The principal purpose of our audit committee is to assist our Board of Directors in its oversight of:
the quality and integrity of our financial statements and related information;
the independence, qualifications, appointment and performance of our external auditor;
our disclosure controls and procedures, internal control over financial reporting and management’s responsibility for assessing and reporting on the effectiveness of such controls;
our compliance with applicable legal and regulatory requirements; and
our enterprise risk management processes.
Our Board of Directors has established a written charter setting forth the purpose, composition, authority and responsibility of our audit committee, consistent with the rules of the NYSE, the SEC and NI
52-110,
a current copy of which is available on our website at www.zymeworks.com. Our audit committee has access to all of our books, records, facilities and personnel and may request any information about us as it may deem appropriate. It also has the authority in its sole discretion and at our expense to retain and set the compensation of outside legal, accounting or other advisors as necessary to assist in the performance of its duties and responsibilities. Both our independent auditors and internal financial personnel regularly meet privately with the audit committee and have unrestricted access to this committee.Our audit committee held four meetings in 2021.
Item 11. | Executive Compensation |
Compensation Discussion and Analysis
CD&A
This Compensation Discussion and Analysis describes our executive compensation philosophy and how we implemented it through our 2021 compensation program for our principal executive officer, our principal financial officer, our three other most highly compensated executive officers serving at the end of 2021 and our former chief medical officer, who was not serving as an executive officer at the end of 2021 (collectively, the “”). The named executive officers who are the subject of this CD&A are*:
named executive officers
Ali Tehrani, Ph.D., former President and Chief Executive Officer;
Neil Klompas, CPA, CA, Chief Operating Officer (former Chief Financial Officer);
Neil Josephson, M.D., Chief Medical Officer;
Anthony Polverino, Ph.D., former Executive Vice President, Early Development and Chief Scientific Officer;
James Priour, former Chief Commercial Officer; and
Diana Hausman, M.D., former Chief Medical Officer.
| * | Please see the section entitled “Executive Team Changes and Restructuring” below for additional information regarding the changes to our management team. References to “Chief Executive Officer” in this CD&A mean Dr. Tehrani, unless specifically noted otherwise. |
This discussion contains forward-looking statements that are based on our current plans, considerations, expectations and projections regarding future compensation programs. Actual compensation programs adopted in the future may differ materially from the various planned programs summarized in this discussion.
8
In the paragraphs that follow, we provide an overview and analysis of our compensation program and policies, the material compensation decisions we have made under those programs and policies, and the material factors that we considered in making those decisions. Following this section, you will find a series of tables containing specific information about the compensation earned or paid in fiscal 2021 to our named executive officers.
Company Overview
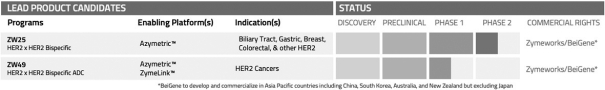
Zymeworks is a clinical-stage biopharmaceutical company dedicated to the development of next-generation multifunctional biotherapeutics. Our suite of complementary therapeutic platforms and our fully integrated drug development engine provide the flexibility and compatibility to precisely engineer and develop highly differentiated product candidates. These capabilities have resulted in multiple product candidates with the potential to drive positive outcomes in large underserved and unaddressed patient populations.
Our lead product candidate, ZW25,zanidatamab, is a novel bispecific (dual-targeting) antibody that targets two distinct domains of the human epidermal growth factor receptor 2 (“HER2””). TheZanidatamab’s unique mechanismbinding properties result in multiple mechanisms of action of ZW25that may enable it to address unmet need in patient populations with HER2-expressing cancers, including those with lower levels of expression, for which there are no approved HER2-targeted agents.cancers. In clinical trials, single agent ZW25zanidatamab monotherapy and ZW25zanidatamab in combination with chemotherapy have been well tolerated with promising anti-tumorantitumor activity in patients with treatment-naive and heavily pretreatedhave progressed after standardincluded HER2-targeted agents. Based on these data, a number of care, including multiple HER2-targeted regimens. In 2019, we initiated a global multicenter Phase 2 clinical trial evaluating ZW25trials have been initiated to evaluate zanidatamab in specific indications and lines of therapy. These include pivotal clinical trials in (i) previously treated HER2 gene amplified biliary tract cancer (“”) and (ii) first-line locally advanced or metastatic HER2-positive gastroesophageal adenocarcinomas (“”) in combination with chemotherapy with or without BeiGene, Ltd.’s (“”) tislelizumab, as well as proof of concept trials in (iii) first-line locally advanced or metastatic HER2-positive colorectal cancer, GEA, or BTC in combination with standard of care chemotherapy, for the(iv) first-line treatment oflocally advanced or metastatic HER2-positive GEA in combination with tislelizumab and chemotherapy, (v) first-line locally advanced or metastatic gastroesophageal adenocarcinomas (“GEA”). Recently, we initiated a second Phase 2 clinical trial evaluating ZW25HER2-positive breast cancer in combination with docetaxel, (vi) previously-treated locally advanced or metastatic HER2-positive, hormone receptor-positive breast cancer in combination with Pfizer’s Ibrance®(palbociclib) and fulvestrant, in patients withand (vii) previously-treated locally advanced and/or metastatic HER2-expressing cancers (including HER2-positive hormone receptorandHR””)-positive breast cancer. In addition, ZW25 continues to be evaluated in multiple expansion cohorts in the ongoing Phase 1 trial as a single agent in several indications including biliary tract (“BTC”), colorectal, gynecological and other HER2-expressing cancers. evorpacept (ALX148).
HER2
HER2-expressing
cancers, including individuals whose disease had progressed on multiple prior treatment regimens that BTC
GEA
BeiGene
HER2-low
breast cancer) in combination with ALX Oncology Inc.’s (“ALX Oncology
Our second product candidate, ZW49, combines the unique design of ZW25zanidatamab with our ZymeLink antibody-drug conjugate (“ADC””) platform, comprised of our proprietary cytotoxin (cancer cell-killing compound) and cleavable linker. We designed ZW49 to be aADC to further address unmet need across a range ofanti-tumorantitumor activity of ZW49 began in 2019.is currently ongoing.
ADC
best-in-class
HER2-targetingHER2-expressing
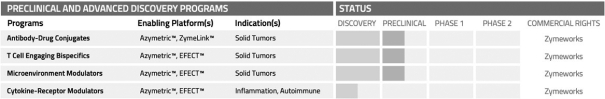
cancers. A Phase 1 clinical trial to establish safety and We are also advancing a deep pipeline of preclinical product candidates and discovery-stage programs in oncology (including immuno-oncology(“I-O”)agents) and other therapeutic areas.
Our proprietary capabilities and technologies include several modular, complementary therapeutic platforms that can be used in combination with each other and with existing approaches. This ability to layer technologies without compromising manufacturability enables us to engineer next-generation biotherapeutics with synergistic activity, which we believe will result in improved patient outcomes. Our core platforms include:
Azymetric
ZymeLink
EFECT
ProTECT
co-stimulation
or checkpoint modulation that may increase efficacy.Our goal is to leverage our next-generation therapeutic platforms and proprietary protein engineering capabilities to become a domain dominatorleader in the discovery, development and commercialization ofmultifunctional biotherapeutics for the treatment of cancer and other diseases with high unmet medical need.
best-in-class

9

NYSE | TSX | |||||||||||||||
High | Low | High | Low | |||||||||||||
US$ | C$ | |||||||||||||||
Quarter Ended | ||||||||||||||||
December 31, 2019 | 45.83 | 24.00 | n/a | n/a | ||||||||||||
September 30, 2019 | 29.75 | 21.52 | 39.10 | 29.64 | ||||||||||||
June 30, 2019 | 23.17 | 14.65 | 30.43 | 19.75 | ||||||||||||
March 31, 2019 | 17.30 | 13.96 | 23.02 | 18.73 | ||||||||||||
December 31, 2018 | 15.73 | 10.72 | 20.52 | 14.34 | ||||||||||||
September 30, 2018 | 16.88 | 12.15 | 21.69 | 15.84 | ||||||||||||
June 30, 2018 | 29.00 | 10.37 | 30.36 | 13.37 | ||||||||||||
March 31, 2018 | 14.00 | 7.69 | 17.31 | 9.62 | ||||||||||||
December 31, 2017 | 9.33 | 6.87 | 11.60 | 9.00 | ||||||||||||
September 30, 2017 | 9.12 | 6.25 | 11.48 | 8.05 | ||||||||||||
April 28, 2017 to June 30, 2017 | 14.25 | 7.24 | 19.55 | 10.50 | ||||||||||||
Year Ended December 31, | ||||||||||||||||||||
2019 | 2018 | 2017 | 2016 | 2015 | ||||||||||||||||
(dollars in thousands except share and per share amounts) | ||||||||||||||||||||
Consolidated Statement of Operations Data | ||||||||||||||||||||
Revenue | $ | 29,544 | $ | 53,019 | $ | 51,762 | $ | 11,009 | $ | 9,660 | ||||||||||
Operating Expenses: | ||||||||||||||||||||
Research and development | 115,900 | 56,926 | 41,144 | 35,551 | 24,403 | |||||||||||||||
General and administrative | 64,177 | 29,457 | 18,550 | 12,554 | 5,217 | |||||||||||||||
Impairment on acquired IPR&D | 768 | — | 1,536 | 768 | — | |||||||||||||||
Total operating expenses | 180,845 | 86,383 | 61,230 | 48,873 | 29,620 | |||||||||||||||
Loss from Operations | (151,301 | ) | (33,364 | ) | (9,468 | ) | (37,864 | ) | (19,960 | ) | ||||||||||
Other income (expense), net | 5,282 | (1,021 | ) | (494 | ) | (1,020 | ) | 824 | ||||||||||||
Loss before income taxes | (146,019 | ) | (34,385 | ) | (9,962 | ) | (38,884 | ) | (19,136 | ) | ||||||||||
Net income tax recovery (expense), net | 582 | (2,171 | ) | (444 | ) | 5,075 | (34 | ) | ||||||||||||
Net loss | $ | (145,437 | ) | $ | (36,556 | ) | $ | (10,406 | ) | $ | (33,809 | ) | $ | (19,170 | ) | |||||
Net loss per common share (basic) (1) | (3.83 | ) | (1.26 | ) | (0.51 | ) | (2.65 | ) | (1.70 | ) | ||||||||||
Net loss per common share (diluted) (1) | (3.83 | ) | (1.26 | ) | (0.64 | ) | (2.65 | ) | (1.70 | ) | ||||||||||
Weighted-average number of common shares (basic) (1) | 38,022,014 | 29,089,896 | 21,249,414 | 12,736,567 | 11,266,451 | |||||||||||||||
Weighted-average number of commons shares (diluted) (1) | 38,022,014 | 29,089,896 | 21,321,209 | 12,736,567 | 11,266,451 | |||||||||||||||
Year Ended December 31, | ||||||||||||||||
2019 | 2018 | 2017 | 2016 | |||||||||||||
(dollars in thousands) | ||||||||||||||||
Consolidated Balance Sheet Data | ||||||||||||||||
Cash and cash equivalents | $ | 128,451 | $ | 42,205 | $ | 35,946 | $ | 16,437 | ||||||||
Short-term investments | 170,453 | 157,959 | 51,851 | 23,824 | ||||||||||||
Working capital | 229,278 | 174,383 | 77,674 | 29,928 | ||||||||||||
Long-term obligations | 39,972 | 34,001 | 866 | 9,577 | ||||||||||||
Total assets | 368,205 | 244,477 | 131,955 | 93,995 | ||||||||||||
Total liabilities | 122,524 | 63,987 | 15,527 | 26,133 | ||||||||||||
Total shareholders’ equity | 245,681 | 180,490 | 116,428 | 9,002 | ||||||||||||
In January 2020,2021, we announced an agreement with Pfizer and the initiation of a Phase 2presented updated clinical trial evaluating ZW25 in combination with Pfizer’s Ibrance®(palbociclib), an oral CDK4/6 inhibitor, and the hormone therapy fulvestrant with the goal of providing a chemotherapy-free treatment option to people with advanced HER2-positive, hormone receptor-positive breast cancer. We will sponsor the study, and Pfizer will provide palbociclib. Part one of the study will evaluate the safety and tolerability of ZW25 in combination with palbociclib and fulvestrant and identify the RD of ZW25 and palbociclib. Part two of the study will evaluate anti-tumor activitydata at the RD level. The trial will enroll up to 76 patients at sitesAmerican Society of Clinical Oncology (“”) Gastrointestinal Cancers Symposium for zanidatamab, in the United States and Canada, and expansion to Spain is planned.
ASCO
TRAEs
In October 2019,July 2021, we announced the first data frompatient dosed in a new cohort of our Phase 1 study evaluating ZW25trial to evaluate zanidatamab in combination with Seagen’s HER2-selective tyrosine kinase inhibitor, Tukysa (tucatinib), and chemotherapy in patients with previously-treated locally advanced or metastatic HER2-expressing breast cancer.
In September 2021, we presented Phase 2 clinical data for zanidatamab in combination with chemotherapy in first-line locally advanced or metastatic HER2-positive GEA at the ESMO Annual Congress. The data demonstrated that zanidatamab in combination with chemotherapy exhibited promising response rates and durability and, overall, was well tolerated in patients with the majority of TRAEs considered mild to moderate in severity (Grade 1 or 2). The data presented compare favorably to current standard of care and support initiation of a global, randomized Phase 3 trial,
HERIZON-GEA-01.
In October 2021, we announced the first patient dosed in the Phase 1b/2 clinical trial of zanidatamab in combination with ALX Oncology’s CD47 blocker, evorpacept (ALX148), in patients with advanced HER2-expressing GEA. Overall,breast cancer and other solid tumors.
In December 2021, we presented Phase 2 clinical data for zanidatamab in combination with chemotherapy in heavily pretreated locally advanced or metastatic HER2-positive breast cancer at the San Antonio Breast Cancer Symposium. The data exhibited promising response rates, with the majority of patients experiencedexperiencing a decreasereduction in their target lesions and responses were observedtumor size. Zanidatamab in both low and high HER2-expressing GEA.combination with chemotherapy was also well tolerated, with the majority of the TRAEs considered mild to moderate in severity (Grade 1 or 2).
HERIZON-GEA-01
PD-1
inhibitor, tislelizumab, compared to trastuzumab plus physician’s choice chemotherapy for first-line treatment in subjects with locally advanced or metastatic HER2-positive GEA.In April 2022, Zymeworks, in conjunction with its Asia-Pacific partner BeiGene, announced the acceptance of abstracts and plans to present data at the upcoming ASCO meeting in June on the first-line treatment of patients with HER2-overexpressing GEA in combination with standard of care chemotherapy.
ZW49 Clinical Program:
ProgramIn January 2020,2021, we announced an interim update from the ongoing ZW49 Phase 1 dose-escalation study highlighting thatstudy. In 35 patients who have received ZW49 across all dosing regimens, there have been no dose-limiting toxicities, observedno treatment-related hematologic, pulmonary, or liver toxicity, and no treatment-related deaths. Over 90% of treatment-related adverse events have been mild or moderate (Grade 1 or 2) in severity, with the most common being keratitis, fatigue, and diarrhea, which have been reversible and manageable in an outpatient setting. There have been no discontinuations due to treatment-related adverse events, and the maximum tolerated dose has not yet been reached. With over ten patients treated,established. ZW49 has demonstrated antitumor activity at all dose levels evaluated in the majorityonce every three week regimen including confirmed partial responses and stable disease per RECIST 1.1. Three indication-specific expansion cohorts (HER2-positive breast cancer, HER2-positive GEA, and a basket cohort of treatment-related adverse events have been grade 1 or 2, andother HER2-positive cancers) utilizing the 2.5 mg/kg once every three week regimen were reversible and manageable on an outpatient basis. Preliminary results from these initial dose cohorts include anti-tumor activity.also initiated to better ascertain antitumor activity in more homogeneous patient populations.
10
In our ongoing ZW49 Phase 1 dose-escalation study, the expansion cohorts evaluating 2.5 mg/kg every three weeks have completed enrollment of 30 patients. In parallel, we continue to evaluate an expansion cohort evaluating dosing at 1.5 mg/kg weekly and continue to enroll into the escalation cohort evaluating 1.75mg/kg weekly. Patient enrollment continues to progress well in both the weekly expansion and escalation cohorts and we remain on target to submit data for presentation at a major medical meeting in the second half of this year.
Preclinical Programs:
In April 2021, we presented five posters at the American Association for Cancer Research Annual Meeting. The presentations highlight preclinical data that reveal new insights into the unique mechanisms of action of our lead product candidate, zanidatamab, introduce our fourth therapeutic platform, ProTECT, and describe two new preclinical assets focused on the cytokine,
IL-12,
and the immune-oncology target,4-1BB.
In March 2022, we presented information on our topoisomerase 1 inhibitor (“”) ADC technology at the World ADC London conference. The presentation highlighted preclinical data and the development of our TOPO1i-based payload technology to be used in conjunction with our auristatin-based payload technology in the generation ofand indication-specific ADCs.
TOPO1i
fit-for-purpose
Licensing and Collaboration Agreements:
In July 2019,August 2021, we announced that we earnedour partner, Janssen Biotech, Inc. (“”), dosed the first patient with a $7.5 million milestone payment from Celgene (now BMS) underbispecific antibody developed using our 2014Azymetric and EFECT platforms. Under our 2017 collaboration and licensing agreement with BMS,Janssen, we received a payment of $4.0 million in connection with BMS exercising its optionthis milestone. In November 2021, Janssen dosed the first patient under the second program for a commercial license to a proprietary immune-oncology bispecific built on our Azymetric platform.
Janssen
Per an amendment of the sublicensing agreement between Iconic Therapeutics, Inc. (“”) and Exelixis, Inc. (“”) in December 2021, Iconic notified us that they will receive aMerck under our 2014 research and license agreement with Merck,Exelixis in connection with Merck’s completion of a late-stage preclinical studyexchange for a bispecific antibody candidate using our proprietary Azymetric and EFECT therapeutic platforms.
Iconic
Exelixis
one-time
fee from ICON-2
program. As such, we will receive a share of In May 2019, we entered intoDecember 2021, BeiGene dosed the first patient in South Korea in the pivotalstudy. We received a payment of $8.0 million in relation to this milestone.
HERIZON-GEA-01
In April 2022, Atreca Inc. announced a licensing agreement with Iconic granting Iconicnon-exclusiverightsZymeworks to utilize our proprietary ZymeLink ADC platform for thetechnology to develop novel ADCs. We received an undisclosed upfront payment in association with this licensing agreement in conjunction with future option exercise fees and development, of Iconic’sICON-2Tissue Factor ADC for cancer. This is the first collaboration leveraging the ZymeLink platform and represents our third technology platform licensed to a collaborator. Under the terms of the agreement, we will be eligible to receive developmentregulatory, and commercial milestone payments andmilestones as well as tiered royalties on worldwide net sales.
Financing Activities:
On January 27, 2020,31, 2022, we announced the closing of our underwritten public offering which consisted of the issuance of 5,824,729900,0001,875,000 additional shares, and, in lieu of common shares, to a certain investor,investors,1,075,2713,340,000 common shares. The common shares were offeredsold at a price to the public of $46.50$8.00 per common share and theofferedsold at a price of $46.4999$ 7.9999 perapproximately $320.8$115.0 million, before deducting underwriting discounts and commissions and estimated offering expenses. The securities were offered in Canada pursuant to our final prospectus supplement, dated January 22, 2020 (the “Canadian Supplement”), to our Canadian final base shelf prospectus, dated November 18, 2019 (the “Base Prospectus”), and in the United States pursuant to our final prospectus, supplement, dated January 22, 2020 (the “U.S. Supplement”, together with the Canadian Supplement, the “Supplements”),26, 2022, to our U.S. automatic shelf registration statement on FormS-3ASR,S-3ARS,including a prospectus dated November 5, 2019 (the “Registration Statement”). The SupplementsOctober 1, 2021. No securities were filedoffered or sold, directly or indirectly, in Canada or to any resident of Canada.
11,035,000 common shares, including the exercise in full of the underwriters’ over-allotment option to purchase
pre-funded
warrants to purchase up to pre-funded
warrants were pre-funded
warrant, for aggregate gross proceeds to the Company of Executive Team Changes and the United States on January 23, 2020.Restructuring
In November 2019, we filed an automatic shelf registration statementMay 2021, Dr. Diana Hausman transitioned from her role as our Chief Medical Officer and Dr. Neil Josephson, our Senior Vice President, Clinical Research, assumed the role of interim Chief Medical Officer. Dr. Hausman remained with the SECCompany as a clinical advisor through November 2021, and Dr. Josephson was promoted to replaceChief Medical Officer in November 2021.
On January 5, 2022, we announced the appointment of Mr. Kenneth Galbraith as Chair of our existing shelf registration statement on FormS-3, which permits usBoard of Directors, Chief Executive Officer and President, effective January 15, 2022. In connection with Mr. Galbraith’s appointment, Dr. Ali Tehrani resigned from the positions of President and Chief Executive Officer and as a member of our board of directors, effective January 15, 2022. We also announced the promotion of our Chief Financial Officer, Mr. Neil Klompas, to take advantagethe dual position of certain benefits only available to well-Chief Operating Officer and Chief Financial Officer. Our Board of Directors also appointed Ms. Lota Zoth as the Board of Directors’ lead independent director, effective January 15, 2022.
11
On January 19, 2022, we announced a restructuring of our workforce (the “”), with a target of reducing employee headcount by at least 25% across the organization by the end of 2022. We took these steps as part of our renewed focus on achieving our key strategic priorities and to help create a more cost-efficient organization in order to execute on our strategic priorities. In connection with the filingRestructuring, we announced changes in our leadership, with the Executive Vice President, Early Development & Chief Scientific Officer, Chief People Officer and Chief Commercial Officer leaving the Company. As of March 31, 2022, we had exceeded the registration statement, we entered into anat-the-marketequity offering sales agreement (the “ATM Sales Agreement”) with Jefferies LLC, effective aspreviously announced workforce reduction of November 5, 2019. Under the ATM Sales Agreement, we may sell our common shares from time to time for up to $75.0 million in aggregate sales proceeds in“at-the-market”transactions.25%, ahead of schedule.
Restructuring
2021 Advisory Vote on Executive Compensation
At our 2021 annual general meeting, we conducted an advisory vote on executive compensation. At that meeting, 89.30% of the votes cast on the advisory vote proposal were supportive of our named executive officer compensation program as disclosed in our 2021 proxy statement.
The compensation committee reviewed the advisory vote results in the context of our overall compensation philosophy and programs, and based on the level of support, determined that no significant changes to our compensation policies and programs were necessary. The compensation committee will continue to consider the results from future stockholder advisory votes on executive compensation and other relevant market developments affecting executive officer compensation in order to determine whether any subsequent changes to our executive compensation programs and policies would be warranted to reflect any stockholder concerns reflected in those advisory votes or to address market developments.
Overview of Compensation Program
Compensation Philosophy
The goal of our compensation program is to attract, retain and motivate our employees and executives, including our named executive officers. The compensation committee is responsible for setting our executive compensation and reviewing and recommending, for the approval of the Board of Directors, succeeding Nick Bedford,the Company’s annual corporate performance objectives. In considering executive compensation, the compensation committee strives to ensure that our total compensation is competitive within the industry in which we operate and supports our overall strategy and corporate objectives. The combination of base salary, annual incentives and long-term incentives that we provide our executives is designed to accomplish this.
Compensation Objectives
The objectives of our compensation program are to:
attract and retain highly qualified executive officers who retiredhave a history of proven success;
align the interests of executive officers with our shareholders’ interests and with the execution of our business strategy;
motivate and reward our executive officers through competitive pay practices and an appropriate mix of short- and long-term incentives;
evaluate and reward executive performance on the basis of achievement of program development goals and key financial measurements which we believe closely correlate to long-term shareholder value; and
tie compensation awards directly to program development goals and key financial measurements with evaluations based on achieving and overachieving predetermined objectives.
Role of the Compensation Committee
During 2021, the compensation committee’s work included the following:
Executive Compensation Review – The compensation committee reviewed compensation practices and policies with respect to our executives against Zymeworks’ peer group of companies (as further described below), in order to allow us to place our compensation practices for these positions in a market context. This reference exercise included a review of base salary, total cash compensation and total direct compensation.
Executive Compensation – The compensation committee reviewed the corporate goals and objectives applicable to the compensation of the Company’s executives and evaluated the executives’ performance in light of those goals and objectives. Based on this review and evaluation, the compensation committee approved the 2021 compensation for the
12
Company’s executives, including each of the named executive officers (other than Dr. Tehrani) and recommended the 2021 compensation for Dr. Tehrani, which recommendation was approved by the Board of Directors. |
Long-Term Incentive Plan – The compensation committee reviewed the effectiveness of all outstanding incentive compensation plans and equity-based plans.
In reaching its decisions, the compensation committee may consider input from his functionsmanagement and other factors that the compensation committee considers appropriate. Decisions made by the compensation committee are the responsibility of the compensation committee and may reflect factors and considerations other than the information and/or recommendations provided by management.
Independent Compensation Consultant
In 2021, the compensation committee retained Radford, which is part of the Rewards Solutions practice at Aon plc, as Chairan independent consultant to the compensation committee to conduct competitive reviews and Board member. Mr. Bedford served as Board Chair since September 2004.assessments of Zymeworks’ executive compensation program and recommend
go-forward
strategies. The compensation committee made the decision to retain Radford in its sole discretion and was directly responsible for the appointment, compensation and oversight of Radford’s work. The compensation committee is involved in and approves the adoption of the following procedures during Radford’s assessments:establishing the public company peer group used in the executive compensation assessment;
reviewing the detailed assessment of Zymeworks’ executive compensation program versus the market; and
reviewing and approving executive pay mix.
The compensation committee utilizes these strategies when contemplating future executive compensation matters.
In June 2019, we announced2021 Radford was retained to review the appointmentsalaries, bonuses and equity plan participation of two independent biopharmaceutical executives, Susan Mahonyexecutive employees, as well as equity plan participation of employees below the executive level. Zymeworks’ management did not make or recommend such engagements and Troy Cox,all such other services were approved by the compensation committee. Radford did not perform other services to the BoardCompany other than as a compensation consultant. The compensation committee determined Radford to be independent after evaluating the factors required under the applicable listing standard.
Aon received $166,873 in fees in 2021 for services related to determining or recommending the amount or form of Directors. Dr. Mahony brings extensive operational, clinical,executive and commercialization experienceZymeworks Boardperform unrelated risk brokerage services and Aon was paid $623,258 for these services, which included global risk in Canada and the United States and other services. The compensation committee was informed about these services.
non-employee
director compensation. Separately, management engaged Aon to Peer Companies and Use of DirectorsMarket Data
We compare our executive compensation program to those of a group of peer companies (North American biotechnology companies of a similar size and stage of development). The first step in the process is that the compensation committee, with the support of Radford and management, reviews trends in biotechnology compensation practices and reviews and approves the list of peer companies used for benchmarking. As part of its analysis for 2021, Radford collected and analyzed compensation information from over 30 yearsa comparative group of combined experiencebiotechnology companies, or peer group, approved by the compensation committee. The compensation committee evaluates the criteria used in establishing the peer group at least annually. The compensation committee seeks input from management in addition to Radford to ensure the peer group is consistent with Lilly, Schering-Plough Corporation (“Schering-Plough”), Amgen Inc.,our current business objectives and BMS. Mr. Cox brings extensive biotechnology businessstrategy.
The list of peer companies is approved based on various factors including industry classification, market capitalization, headcount and executive leadership experiencestage of development. In July 2020, with assistance from numerous senior leadership positions at leading Radford, the compensation committeecompanies such as Foundation Medicine, Inc., Roche-Genentech, Inc., UCB S.A., Sanofi-Aventis U.S. LLC, and Schering-Plough.companies:
re-evaluated
the peer group. The compensation committee approved a peer group consisting of publicly traded,pre-commercial
biopharmaceutical with generally between 100 and benefits;500 employees;
that are located in Canada and the United States, with a focus on companies headquartered in biotechnology hub markets; and
preferably that have gone public in the last five years.
13
| Adverum Biotechnologies, Inc. | Epizyme, Inc. | MacroGenics, Inc. | ||
| Alector, Inc. (1) | Fate Therapeutics, Inc. | NGM Biopharmaceuticals, Inc. (1) | ||
| Allakos Inc. | G1 Therapeutics, Inc. | Principia Biopharma Inc. (1) | ||
| AnaptysBio, Inc. | Gossamer Bio, Inc. (1) | REGENXBIO Inc. | ||
| Deciphera Pharmaceuticals, Inc. | Iovance Biotherapeutics, Inc. (1) | Turning Point Therapeutics, Inc. (1) | ||
| Denali Therapeutics Inc. | Karyopharm Therapeutics Inc. | Xencor, Inc. | ||
Dicerna Pharmaceuticals, Inc. | Kura Oncology, Inc. | |||
| (1) | Added to the peer group in July 2020. The following companies were deleted from the peer group in July 2020: Acceleron Pharma Inc., Alder Biopharmaceuticals, Inc., Cellular Biomedicine Group, Inc., CytomX Therapeutics, Inc., Ra Pharmaceuticals, Inc., Stemline Therapeutics, Inc., and Voyager Therapeutics, Inc. |
Our researchcompensation committee uses comparative data from our peer group as a reference when setting and development expenditures increasedadjusting executive compensation, but it does not target our overall program or any particular element of compensation to $115.9 million for the year ended December 31, 2019,be at a particular percentile compared to $56.9 millionour peers. Rather, our compensation committee uses a range of peer group data for the year ended December 31, 2018. This was primarily dueeach position, along with an assessment of each executive’s performance, criticality and tenure, to an increaseensure that our executive compensation program and its constituent elements are and remain competitive in activities relatedrelation to the progression and expansion of ZW25 clinical studies and the associated manufacturing costs, as well as development activities for ZW49 in 2019, and an increase in other research and development, which includes an increase in salaries and benefits expense as a result of an increase in headcount andnon-cashstock-based compensation expense compared to the same period in 2018.our peers.
Components of Compensation Package
In 2021, our executive compensation program consisted of three major components:
base salary;
annual cash bonuses based on a comparison of individual and corporate performance to determine
pre-set
goals and objectives; andlong-term incentives, which in 2021, consisted of grants of stock options and restricted stock units.
In making 2021 compensation decisions, our compensation committee believed that each component of executive compensation must be evaluated and determined with certaintyreference to competitive market data, individual and Company-wide performance, our recruiting and retention goals, internal equity and consistency, and other information it deems relevant. As it evaluated executive compensation in 2021, the durationcompensation committee believed that in the biopharmaceutical/biotechnology industry, long-term incentives such as stock options and completion costsrestricted stock units are a primary motivator in attracting and retaining executives, in addition to salary and cash incentive bonuses.
The primary components of our current or future clinical trials2021 executive compensation program are described in more detail below.
Base Salary
Annual base salary is designed to provide a competitive fixed rate of pay recognizing different levels of responsibility and preclinical programsperformance within Zymeworks. This compensation component helps us to attract and retain highly qualified executives who have a history of proven success. In determining whether to increase the base salary for a particular executive, our product candidates, or if, when or to what extent we will generate revenue fromcompensation committee in discussions with our Chief Executive Officer (for executives other than the commercialization and sale of any of our product candidates that obtain regulatory approval. We may never succeed in achieving regulatory approval for any of our product candidates. The duration, costs and timing of clinical trials and development of our product candidates will depend onChief Executive Officer) considers a variety of factors, including performance, length of service and criticality of role. The determination of base salary affects the uncertaintiesamount of clinical trials and preclinical studies, uncertainties in clinical trial enrollment rates and significant and changing government regulation. In addition,an executive’s cash bonus. The table below shows the probability of success for each product candidate will depend on numerous factors, including competition, manufacturing capability and commercial viability. We will determine which programs to pursue and how much to fund each program in responsechanges to the scientificbase salaries of our named executive officers between 2020 and clinical success of each product candidate, as well as an assessment of each product candidate’s commercial potential.2021:
Name and Principal Position | 2020 Base Salary ($) | 2021 Base Salary ($) | Increase between 2020 and 2021 | |||||||||
Ali Tehrani, Former President and CEO | 573,036 | 593,092 | 3.5 | % | ||||||||
Neil Klompas, Chief Operating Officer (former CFO) | 424,424 | 437,124 | 3.0 | % | ||||||||
Neil Josephson, Chief Medical Officer (1) | 406,850 | 453,200 | 11.4 | % | ||||||||
Anthony Polverino, Former Executive Vice President, Early Development and Chief Scientific Officer | 428,000 | 440,800 | 3.0 | % | ||||||||
James Priour, Former Chief Commercial Officer (2) | 375,000 | 400,000 | 6.7 | % | ||||||||
Diana Hausman, Former Chief Medical Officer (3) | 449,946 | 463,446 | 3.0 | % | ||||||||
| (1) | Dr. Josephson was promoted from Vice President, Clinical Research to Senior Vice President, Clinical Research in 2020. Dr. Josephson was further promoted to Chief Medical Officer in 2021. As a result of this promotion, his base salary increased to $480,000 in November 2021 and the table above does not reflect the November 2021 increase. Salary paid to Dr. Josephson in 2021 is set forth in the “Summary Compensation Table” below. |
| (2) | Mr. Priour joined the Company in April 2020 and was promoted to Chief Commercial Officer in January 2021. |
| (3) | On April 15, 2021, Dr. Hausman provided notice of her resignation as Chief Medical Officer. As such, she did not receive her full base salary for 2021 as listed in this table. Salary paid to Dr. Hausman in 2021 is set forth in the “Summary Compensation Table” below. |
Cash Bonus
The annual cash incentive compensation represents pay at risk – it results in payment only if and administrative expenses consistto the extent certain goals and objectives are met – and does not affect decisions regarding other components of salariescompensation. This compensation component motivates and related benefit costs for employees inrewards our executive finance, intellectual property, business development, human resources and other support functions, as well as legal and professional fees. We expect general and administrative expensesofficers for outstanding performance. The annual cash incentive that each executive is eligible to increase as we expand our infrastructure to support our ongoing research and development activities and operate as a public company.
pre-determined
target percentage of For 2021, the annual target bonus for each of our named executive officer is as follows:
Name | 2020 Target Bonus (% of Base Salary) | 2021 Target Bonus (% of Base Salary) | ||||||
Ali Tehrani, Former President and CEO | 55 | % | 55 | % | ||||
Neil Klompas, Chief Operating Officer (former CFO) | 40 | % | 40 | % | ||||
Neil Josephson, Chief Medical Officer (1) | 30 | % | 35 | % | ||||
Anthony Polverino, Former Executive Vice President, Early Development and Chief Scientific Officer | 40 | % | 40 | % | ||||
James Priour, Former Chief Commercial Officer (2) | 35 | % | 40 | % | ||||
Diana Hausman, Former Chief Medical Officer (3) | 40 | % | 40 | % | ||||
| (1) | Dr. Josephson was promoted from Vice President, Clinical Research to Senior Vice President, Clinical Research in 2020. Dr. Josephson was further promoted to Chief Medical Officer in 2021. As a result of this promotion, his target bonus increased to 40% in November 2021 and the table above does not reflect the November 2021 increase. |
| (2) | Mr. Priour joined the Company in April 2020 and was promoted to Chief Commercial Officer in January 2021. |
| (3) | Dr. Hausman forfeited her right to receive payments under the 2021 bonus plan upon her resignation in April 2021. |
At the beginning of each year, our Board of Directors, in consultation with the compensation committee, approves performance targets that are tied to the level of achievement of corporate goals, and the compensation committee approves the weighting assigned to each goal. For 2021, the corporate and individual weighting was 100% corporate, 0% individual for the Chief Executive Officer and 75% corporate, 25% individual for all other executive officers. Achievement of corporate goals (and individual goals with respect to executive officers other than the Chief Executive Officer) was a precondition for payment of
15
The compensation committee determines performance bonus payments based on the partresults achieved as compared to targets established for a particular year. The maximum performance bonus payments that can be earned by executives is 125% of management in their application.respective target performance bonuses. There have beenis no material changes to our critical accounting policies during the year ended December 31, 2019, except the adoption of ASU 2016–02, Leases (Topic 842), effective on January 1, 2019.minimum bonus payable.
The 2021 corporate goals were divided into three main categories: (i) Clinical, (ii) Commercial, (iii)
Pre-Clinical
Research, and (iii) Corporate Finance and Business Development. Additional detail on these goals is set forth in the table below:2021 Corporate Goal Category | Key Elements of Goal | Target Weight of Goal | ||
| Clinical | ZW25-203: | 20% | ||
ZW25-301: | 25% | |||
ZW49-101: | 15% | |||
| Commercial | Finalize comprehensive zanidatamab breast cancer strategy by June 30, 2021 | 10% | ||
| Preclinical Research | Two preclinical development decisions by December 31, 2021 | 15% | ||
| Corporate Finance and Business Development | Execute on (a) a material dilutive or non-dilutive financing event to support financial runway through launch in BTC; and (b) achieve significant new business development cash flow in 2021 | 15% | ||
| Total | 100% | |||
2021 Individual Performance Objectives
During 2021, the individual objectives for each of amounts earned under researchthe Company’s executives, other than our Chief Executive Officer, were established between each such executive and development licensethe Chief Executive Officer and collaboration agreementsdiscussed with the Compensation Committee. These objectives were established, in the Chief Executive Officer’s judgment, to provide the greatest opportunity for the Company to meet its annual and long-term objectives. In light of the decision by the Board of Directors that our strategic partners. Promised deliverables within these agreements may include grantscorporate goals and objectives were not achieved at a sufficient level to warrant the payment of licenses,cash bonuses for 2021, we did not conduct an evaluation of the performance of each executive against his or options to obtain licenses, to our intellectual property, research and development services, and participation on joint research and/or development committees.
In accordanceJanuary 2022, the compensation committee reviewed our performance against the corporate goals under the 2021 bonus plan and determined that these goals were not achieved at a sufficient enough level to warrant payment of any bonus to executives with ASC 606,respect to 2021 corporate goals, and that because the Company recognizes revenue whencorporate goal component of the Company’s customer obtains control2021 bonus plan was not achieved, none of promised goods or services, in an amount that reflects the consideration which the Company expectsour executive officers were eligible to receive in exchangebonuses for those goods or services. To determine revenue recognition for arrangements that the Company determines are withinindividual performance component of the scope of Topic 606, the Company performs the following five steps: (i) identify the contract(s) with a customer; (ii) identify the performance obligations in the contract; (iii) determine the transaction price; (iv) allocate the transaction price2021 bonus plan.
Long-Term Incentives
Our new stock option plan, as amended, which became effective immediately prior to the performance obligations in the contract;consummation of our initial public offering (the “Equity Compensation Plan”) (as defined under “Equity Compensation Plan Information” section below) authorizes us to make grants to eligible recipients of stock options, restricted stock, restricted stock units and (v) recognize revenue when orother share-based awards, to attract, retain, motivate and reward qualified directors and employees and to enable and encourage such directors and employees to acquire common shares as the Company satisfies a performance obligation. The Company only applies the five-step model to contracts when it is probable that the Company will collect the consideration that it is entitled to in exchange for the goods and services transferred to the customer. If the expectation at contract inception is such that the period between payment by the licensee and the completion of related performance obligations will be one year or less, the Company assumes that the contract does not have a significant financing component.long-term investments.
Until 2020, the endonly type of each subsequent reporting period, the Companyre-evaluatesthe probability of achievement of such development milestones and any related constraint, and if necessary, adjusts its estimate of the overall transaction price. Any such adjustments are recorded on a cumulativecatch-upbasis, which would affect license, collaboration and other revenues and earnings in the period of adjustment. The process of successfully achieving the criteria for the milestone payments is highly uncertain. Consequently, there is a significant risklong-term incentive equity that the Company had granted was stock options. In 2020 and 2021, the Company granted a mix of stock options and restricted stock units to Company executives. The compensation committee believes that a mix of stock options and restricted stock units aligns the interests of our executives (including those of our named executive officers) with our shareholders’ interests by rewarding for improvements in stock price over a period of time. The Company issues stock options to reward for future performance and appreciation while providing restricted stock units because they provide some value even during periods of stock price or market volatilities, provide retention incentives during the vesting period, and reinforce a culture of ownership. By granting restricted stock units, the Company can also reduce the dilutive effect of the equity incentive awards in the form of stock options, which benefits our shareholders over time. The compensation committee evaluates the long-term incentive programs for each year, and the appropriate mix of equity awards to grant to our executive officers. In future years, the compensation committee may approve a different mix of equity awards if they determine necessary or appropriate to achieve our compensation objectives.
The option exercise price may not earn allbe less than the closing price of our common shares on the date of grant. For the 2021 stock option grants to our named executive officers, 25% of the milestone payments fromgranted options will vest on the first anniversary of grant date (subject to continued service). On the last day of each month thereafter, a further 1/36 of the total number of remaining granted options will vest.
Each restricted stock unit provides the recipient with one common share at a designated issue date following the vesting of that unit, without the payment of an exercise price or other cash consideration for the issued common shares. For the 2021 grants of restricted stock units to our named executive officers,
one-third
of the restricted stock units will vest each year on the first, second and third anniversary of the grant date (subject to continued service).The following table shows information regarding stock option and restricted stock unit grants to each of its strategic partners. Management applies significant judgment when assessingour named executive officers made during the likelihoodyear ended December 31, 2021:
Name | Grant Date | Restricted Stock Units Granted (#) (1) | Stock Options Granted (#) (2) | Exercise Price of Stock Options ($/Sh) (3) | Grant Date Fair Value of Stock and Option Awards ($) (4) | |||||||||||||||
Ali Tehrani | 3/10/2021 | — | 150,000 | 34.82 | 3,625,121 | |||||||||||||||
| 3/10/2021 | 25,000 | — | — | 870,500 | ||||||||||||||||
Neil Klompas | 3/10/2021 | — | 48,750 | 34.82 | 1,178,164 | |||||||||||||||
| 3/10/2021 | 8,125 | — | — | 282,913 | ||||||||||||||||
Neil Josephson | 3/10/2021 | — | 30,000 | 34.82 | 725,024 | |||||||||||||||
| 5/6/2021 | — | 15,000 | 29.49 | 299,271 | ||||||||||||||||
| 11/10/2021 | — | 105,943 | 21.18 | 1,501,228 | ||||||||||||||||
| 3/10/2021 | 5,000 | — | — | 174,100 | ||||||||||||||||
| 11/10/2021 | 17,657 | — | — | 373,975 | ||||||||||||||||
Anthony Polverino | 3/10/2021 | — | 48,750 | 34.82 | 1,178,164 | |||||||||||||||
| 3/10/2021 | 8,125 | — | — | 282,913 | ||||||||||||||||
James Priour | 3/10/2021 | — | 37,500 | 34.82 | 906,280 | |||||||||||||||
| 3/10/2021 | 6,250 | — | — | 217,625 | ||||||||||||||||
Diana Hausman | 3/10/2021 | — | 48,750 | 34.82 | 1,178,164 | |||||||||||||||
| 3/10/2021 | 8,125 | — | — | 282,913 | ||||||||||||||||
| (1) | Restricted stock units vest in three equal annual installments on each of the first, second, and third anniversaries of the date of grant. |
| (2) | Options vest and become exercisable with respect to (i) 25% of the underlying shares one year after the grant date and (ii) the remainder of the underlying shares in 36 equal monthly installments following the first anniversary of the date of grant. |
| (3) | The exercise price of the stock options is the closing price of the Company’ stock on the NYSE on the grant date. |
| (4) | The amounts set forth in this column reflect the grant date fair value for restricted stock unit awards and stock option awards computed in accordance with Financial Accounting Standards Board Accounting Standards Codification Topic 718, Compensation – Stock Compensation. See Note 2 to the “Notes to Consolidated Financial Statements – Summary of Significant Accounting Policies – Stock-Based Compensation” and Note 10(e) “Notes to Consolidated Financial Statements – Shareholders’ Equity – Stock-Based Compensation” included in our Annual Report on Form 10-K for our year ended December 31, 2021. |
17
Anti-Hedging Policy
Our executives and directors are prohibited from purchasing financial instruments (including, for greater certainty, prepaid variable forward contracts, equity swaps, collars, or units of exchange funds) designed to hedge or offset a significant portiondecrease in the market value of these activitiesour securities, including securities granted as compensation or held, directly or indirectly, by the executive or director.
Potential Payments upon Termination or Change in Control
Certain of our executives, including each of our named executive officers, are parties to third party contract research organizations. Third-party clinical trial expenses include investigator fees, site costs, clinical research organization costsemployment agreements with us which set forth conditions of employment and other trial-related vendor costs. As partthe payments that will be made upon termination of preparing our consolidated financial statements, we estimate accrued liabilities for services that have been performed by clinical research organizations or investigator sites but have not yet been invoiced to us. When making these estimates, management uses operational and contractual information from third party service providers, operational data from internal personnel, and considerable judgment. The accrued balance factors in management’s best estimatetheir employment. Additional discussion of the date on which certain services commence, the levelemployment agreements with our named executive officers is set forth below under “Executive Compensation – Executive Employment Arrangements and Potential Payments upon Termination or Change in Control.”
18
Contents
Summary Compensation Table
The following table presents the compensation awarded to, earned by or paid to each of our named executive officers for the years ended December 31, 2021, December 31, 2020 and December 31, 2019. We do not have
non-qualified
deferred compensation.Name and Principal Position | Year | Salary ($) (1) | Stock Awards ($) (2) | Option Awards ($) (2) | Non-Equity Incentive Plan Compensation ($) (1) (3) | All Other Compensation ($) (1) | Total ($) | |||||||||||||||||||||
Ali Tehrani, Former President & CEO | 2021 | 593,092 | 870,500 | 3,625,121 | — | 21,924 | (4) | 5,110,637 | ||||||||||||||||||||
| 2020 | 573,036 | 814,000 | 3,185,803 | 283,653 | 20,967 | (5) | 4,877,459 | |||||||||||||||||||||
| 2019 | 540,788 | — | 2,375,128 | 341,930 | 20,223 | (6) | 3,278,069 | |||||||||||||||||||||
Neil Klompas, Chief Operating Officer (former CFO) | 2021 | 437,124 | 282,913 | 1,178,164 | — | 2,277 | (7) | 1,900,478 | ||||||||||||||||||||
| 2020 | 424,424 | 264,000 | 1,033,233 | 163,403 | 2,037 | (8) | 1,887,097 | |||||||||||||||||||||
| 2019 | 379,082 | — | 1,060,041 | 172,422 | 12,629 | (9) | 1,624,174 | |||||||||||||||||||||
Neil Josephson, Chief Medical Officer (10) | 2021 | 456,653 | 548,075 | 2,525,523 | — | 17,438 | (11) | 3,547,689 | ||||||||||||||||||||
Anthony Polverino, Former Executive VP, Early Development & Chief Scientific Officer | 2021 | 440,800 | 282,913 | 1,178,164 | — | 16,031 | (12) | 1,917,908 | ||||||||||||||||||||
| 2020 | 428,000 | 264,000 | 1,033,233 | 158,360 | 20,348 | (13) | 1,903,941 | |||||||||||||||||||||
| 2019 | 400,000 | — | 758,019 | 178,000 | 384 | (14) | 1,336,403 | |||||||||||||||||||||
James Priour, Former Chief Commercial Officer (15) | 2021 | 400,000 | 217,625 | 906,280 | — | 17,438 | (16) | 1,541,343 | ||||||||||||||||||||
Diana Hausman, Former Chief Medical Officer (17) | 2021 | 173,792 | 282,913 | 1,178,164 | — | 11,220 | (18) | 1,646,089 | ||||||||||||||||||||
| 2020 | 449,946 | 264,000 | 1,033,233 | 166,480 | 20,188 | (19) | 1,933,847 | |||||||||||||||||||||
| 2019 | 432,640 | — | 758,019 | 192,525 | 21,341 | (20) | 1,404,525 | |||||||||||||||||||||
| (1) | Salary for all named executive officers is determined in U.S. dollars. However, 2021, 2020 and 2019 cash compensation amounts for Dr. Tehrani and Mr. Klompas were paid in Canadian dollars and have been converted to U.S. dollars for the purposes of the table. For 2021, 2020 and 2019, the U.S. dollar per Canadian dollar exchange rates used for such conversions were 0.7978, 0.7455 and 0.7537, which were the average annual Bank of Canada exchange rates for 2021, 2020 and 2019, respectively. |
| (2) | The amounts set forth in these columns reflect the aggregate grant date fair value for restricted stock unit awards and option awards computed in accordance with Financial Accounting Standards Board Accounting Standards Codification Topic 718, Compensation – Stock Compensation. See Note 2 to the “Notes to Consolidated Financial Statements – Summary of Significant Accounting Policies – Stock-Based Compensation” and Note 10(e) “Notes to Consolidated Financial Statements – Shareholders’ Equity – Stock-Based Compensation” included in our Annual Report on Form 10-K for our year ended December 31, 2021. |
| (3) | The amounts reflect the dollar value of incentive bonuses paid in 2021 and 2020 for performance during 2020 and 2019, respectively, as discussed further above under “Executive Compensation – Components of Compensation Package – Cash Bonus.” |
| (4) | Of the total amount for 2021, (i) $17,814 represents contributions to our registered retirement savings plan and (ii) $4,110 represents life insurance premiums through our group extended benefit plan. |
| (5) | Of the total amount for 2020, (i) $17,191 represents contributions to our registered retirement savings plan and (ii) $3,776 represents life insurance premiums through our group extended benefit plan. |
| (6) | Of the total amount for 2019, (i) $16,224 represents contributions to our registered retirement savings plan and (ii) $3,999 represents life insurance premiums through our group extended benefit plan. |
| (7) | The total amount for 2021 represents life insurance premiums through our group extended benefit plan. |
| (8) | The total amount for 2020 represents life insurance premiums through our group extended benefit plan. |
| (9) | Of the total amount for 2019, (i) $10,474 represents contributions to our registered retirement savings plan and (ii) $2,155 represents life insurance premiums through our group extended benefit plan. |
| (10) | Dr. Josephson was promoted to Chief Medical Officer in 2021. As a result of this promotion, his base salary increased to $480,000 in November 2021. |
19
| (11) | Of the total amount for 2021, (i) $17,400 represents contributions to our 401(k) plan and (ii) $38 represents life insurance premiums through our group extended benefit plan. |
| (12) | Of the total amount for 2021, (i) $15,993 represents contributions to our 401(k) plan and (ii) $38 represents life insurance premiums through our group extended benefit plan. |
| (13) | Of the total amount for 2020, (i) $20,310 represents contributions to our 401(k) plan and (ii) $38 represents life insurance premiums through our group extended benefit plan. |
| (14) | The total amount for 2019 represents life insurance premiums through our group extended benefit plan. |
| (15) | Mr. Priour was promoted to Chief Commercial Officer in January 2021. |
| (16) | Of the total amount for 2021, (i) $17,400 represents contributions to our 401(k) plan and (ii) $38 represents life insurance premiums through our group extended benefit plan. |
| (17) | On April 15, 2021, Dr. Hausman provided notice of her resignation as Chief Medical Officer. She continued to serve in an executive advisory role until November 15, 2021. |
| (18) | Of the total amount for 2021, (i) $11,204 represents contributions to our 401(k) plan and (ii) $16 represents life insurance premiums through our group extended benefit plan. |
| (19) | Of the total amount for 2020, (i) $20,150 represents contributions to our 401(k) plan and (ii) $38 represents life insurance premiums through our group extended benefit plan. |
| (20) | Of the total amount for 2019, (i) $20,957 represents contributions to our 401(k) plan and (ii) $384 represents life insurance premiums through our group extended benefit plan. |
20
Grants of Plan-Based Awards Table
The following table shows information regarding grants to each of our named executive officers of plan-based awards that were (i) made during the year ended December 31, 2021 or (ii) made with respect to 2021 cash incentive bonuses:
Name | Grant Date | Date of Action | Estimated Future Payouts Under Non-Equity Incentive Plan Awards (1) | All Other Stock Awards: Number of Shares of Stock or Units (#) (2) | All Other Option Awards: Number of Securities Underlying Options (#) (3) | Closing Price on Date of Grant ($/Sh) | Grant Date Fair Value of Stock and Option Awards ($) (4) | |||||||||||||||||||||||||||||
Threshold ($) | Target ($) | Maximum ($) | ||||||||||||||||||||||||||||||||||
Ali Tehrani | 3/10/2021 | 3/10/2021 | — | — | — | — | 150,000 | 34.82 | 3,625,121 | |||||||||||||||||||||||||||
| 3/10/2021 | 3/10/2021 | — | — | — | 25,000 | — | — | 870,500 | ||||||||||||||||||||||||||||
| 2/2/2021 | (5) | 2/2/2021 | (5) | — | 326,200 | 407,750 | — | — | — | — | ||||||||||||||||||||||||||
Neil Klompas | 3/10/2021 | 3/10/2021 | — | — | — | — | 48,750 | 34.82 | 1,178,164 | |||||||||||||||||||||||||||
| 3/10/2021 | 3/10/2021 | — | — | — | 8,125 | — | — | 282,913 | ||||||||||||||||||||||||||||
| 1/29/2021 | (6) | 1/29/2021 | (6) | — | 174,849 | 218,562 | — | — | — | — | ||||||||||||||||||||||||||
Neil Josephson | 3/10/2021 | 3/10/2021 | — | — | — | — | 30,000 | 34.82 | 725,024 | |||||||||||||||||||||||||||
| 5/6/2021 | 5/6/2021 | — | — | — | — | 15,000 | 29.49 | 299,271 | ||||||||||||||||||||||||||||
| 11/10/2021 | 11/10/2021 | — | — | — | — | 105,943 | 21.18 | 1,501,228 | ||||||||||||||||||||||||||||
| 3/10/2021 | 3/10/2021 | — | — | — | 5,000 | — | — | 174,100 | ||||||||||||||||||||||||||||
| 11/10/2021 | 11/10/2021 | — | — | — | 17,657 | — | — | 373,975 | ||||||||||||||||||||||||||||
| 1/29/2021 | (7) | 1/29/2021 | (7) | — | 158,620 | 198,275 | — | — | — | — | ||||||||||||||||||||||||||
Anthony Polverino | 3/10/2021 | 3/10/2021 | — | — | — | — | 48,750 | 34.82 | 1,178,164 | |||||||||||||||||||||||||||
| 3/10/2021 | 3/10/2021 | — | — | — | 8,125 | — | — | 282,913 | ||||||||||||||||||||||||||||
| 1/29/2021 | (6) | 1/29/2021 | (6) | — | 176,320 | 220,400 | — | — | — | — | ||||||||||||||||||||||||||
James Priour | 3/10/2021 | 3/10/2021 | — | — | — | — | 37,500 | 34.82 | 906,280 | |||||||||||||||||||||||||||
| 3/10/2021 | 3/10/2021 | — | — | — | 6,250 | — | — | 217,625 | ||||||||||||||||||||||||||||
| 1/29/2021 | (6) | 1/29/2021 | (6) | — | 160,000 | 200,000 | — | — | — | — | ||||||||||||||||||||||||||
Diana Hausman | 3/10/2021 | 3/10/2021 | — | — | — | — | 48,750 | 34.82 | 1,178,164 | |||||||||||||||||||||||||||
| 3/10/2021 | 3/10/2021 | — | — | — | 8,125 | — | — | 282,913 | ||||||||||||||||||||||||||||
| 1/29/2021 | (6) | 1/29/2021 | (6) | — | 185,378 | 231,723 | — | — | — | — | ||||||||||||||||||||||||||
| (1) | Non-equity incentive plan awards consist of cash incentive bonuses as discussed above under “Executive Compensation – Components of Compensation Package – Cash Bonus.” The amounts reflect the U.S. dollar value of target cash bonuses for performance in 2021. As discussed above under “Executive Compensation – Components of Compensation Package – Cash Bonus,” no cash bonuses with respect to 2021 performance were paid. |
| (2) | Restricted stock units vest in three equal annual installments on each of the first, second, and third anniversaries of the date of grant. |
| (3) | Options vest and become exercisable with respect to (i) 25% of the underlying shares one year after the grant date and (ii) the remainder of the underlying shares in 36 equal monthly installments following the first anniversary of the date of grant. |
| (4) | The amounts set forth in this column reflect the grant date fair value for restricted stock unit awards and stock option awards computed in accordance with Financial Accounting Standards Board Accounting Standards Codification Topic 718, Compensation – Stock Compensation. See Note 2 to the “Notes to Consolidated Financial Statements – Summary of Significant Accounting Policies – Stock-Based Compensation” and Note 10(e) “Notes to Consolidated Financial Statements – Shareholders’ Equity – Stock-Based Compensation” included in our Annual Report on Form 10-K for our year ended December 31, 2021. |
| (5) | On February 2, 2021, the Board of Directors approved a 2021 target cash incentive bonus for Dr. Tehrani of 55% of his 2021 base salary. |
| (6) | On February 3, 2021, the compensation committee approved a 2021 target cash incentive bonus for each of Mr. Klompas, Dr. Polverino, Mr. Priour and Dr. Hausman of 40% of each of their respective 2021 base salaries. |
| (7) | On February 3, 2021, the compensation committee approved a 2021 target cash incentive bonus for Dr. Josephson of 35% of his 2021 base salary. Dr. Josephson was promoted to Chief Medical Officer in November 2021. In connection with this promotion, his base salary was increased to $480,000 and his target cash incentive bonus was increased to 40% of his base salary. The figures in the table with respect to his target and maximum target cash incentive bonus are based on his original (pre-promotion) 2021 base salary and target cash incentive bonus percentage. |
21
The following table lists all outstanding equity awards granted in Canadian dollars under our initial employee stock option plan, as amended, (the “Original Plan”) (described under “Employee Benefit Plans – Original Plan,” below) and equity awards granted in U.S. dollars under the Equity Compensation Plan (described under “Employee Benefit PlansEquity Compensation Plan” below) held by our named executive officers as of potential patients, market prices of future commercial products and cost to commercialize them and for the probability of success. Changes in these estimates and assumptions used could have a material impact on the amount of goodwill and intangible assets recorded and the results of impairment tests performed in future periods.December 31, 2021:
–
Option Awards | Stock Awards | |||||||||||||||||||||||||||
Name | Grant Date | Number of Securities Underlying Unexercised Options (#) Exercisable (1) | Number of Securities Underlying Unexercised Options (#) Unexercisable (1) | Option Exercise Price ($) | Option Expiration Date | Number of Shares or Units of Stock That Have Not Vested (#) (2) | Market Value of Shares or Units of Stock That Have Not Vested ($) (2) | |||||||||||||||||||||
Ali Tehrani | 1/1/2013 | 20,950 | — | 5.79 | (3) | 1/1/2023 | — | — | ||||||||||||||||||||
| 1/1/2014 | 20,950 | — | 9.26 | (3) | 1/1/2024 | — | — | |||||||||||||||||||||
| 1/1/2015 | 23,464 | — | 11.52 | (3) | 1/1/2025 | — | — | |||||||||||||||||||||
| 1/29/2016 | 293,300 | — | 9.66 | (3) | 1/29/2026 | — | — | |||||||||||||||||||||
| 2/3/2017 | 41,900 | — | 18.03 | (3) | 2/3/2027 | — | — | |||||||||||||||||||||
| 6/12/17 | 250,000 | — | 9.82 | 6/12/2027 | — | — | ||||||||||||||||||||||
| 3/19/2018 | 239,583 | 10,417 | 11.84 | 3/18/2028 | — | — | ||||||||||||||||||||||
| 1/8/2019 | 176,250 | 58,750 | 15.53 | 1/7/2029 | — | — | ||||||||||||||||||||||
| 3/10/2020 | 63,594 | 75,156 | 35.20 | 3/9/2030 | — | — | ||||||||||||||||||||||
| 3/10/2021 | — | 150,000 | 34.82 | 3/9/2031 | — | — | ||||||||||||||||||||||
| 3/10/2020 | — | — | — | — | 15,417 | 542,678 | ||||||||||||||||||||||
| 3/10/2021 | — | — | — | — | 25,000 | 870,500 | ||||||||||||||||||||||
Neil Klompas | 1/1/2013 | 4,330 | — | 5.79 | (3) | 1/1/2023 | — | — | ||||||||||||||||||||
| 1/1/2014 | 20,950 | — | 9.26 | (3) | 1/1/2024 | — | — | |||||||||||||||||||||
| 1/1/2015 | 23,464 | — | 11.52 | (3) | 1/1/2025 | — | — | |||||||||||||||||||||
| 1/29/2016 | 125,700 | — | 9.66 | (3) | 1/29/2026 | — | — | |||||||||||||||||||||
| 2/3/2017 | 35,615 | 18.03 | (3) | 2/3/2027 | — | — | ||||||||||||||||||||||
| 6/12/2017 | 85,000 | 9.82 | 6/12/2027 | — | — | |||||||||||||||||||||||
| 3/19/2018 | 71,875 | 3,125 | 11.84 | 3/18/2028 | — | — | ||||||||||||||||||||||
| 1/8/2019 | 67,500 | 22,500 | 15.53 | 1/7/2029 | — | — | ||||||||||||||||||||||
| 3/27/2019 | 10,625 | 4,375 | 15.23 | 3/26/2029 | — | — | ||||||||||||||||||||||
| 3/10/2020 | 20,625 | 24,375 | 35.20 | 3/9/2030 | — | — | ||||||||||||||||||||||
| 3/10/2021 | — | 48,750 | 34.82 | 3/9/2031 | — | — | ||||||||||||||||||||||
| 3/10/2020 | — | — | — | — | 5,000 | 176,000 | ||||||||||||||||||||||
| 3/10/2021 | — | — | — | — | 8,125 | 282,913 | ||||||||||||||||||||||
Neil Josephson | 5/6/2019 | 53,333 | 26,667 | 19.11 | 5/5/2029 | — | — | |||||||||||||||||||||
| 3/10/2020 | 6,016 | 7,109 | 35.20 | 3/9/2030 | — | — | ||||||||||||||||||||||
| 3/10/2021 | — | 30,000 | 34.82 | 3/9/2031 | — | — | ||||||||||||||||||||||
| 5/6/2021 | — | 15,000 | 29.49 | 5/5/2031 | — | — | ||||||||||||||||||||||
| 11/10/2021 | (4) | — | 105,943 | 21.18 | 11/9/2031 | — | — | |||||||||||||||||||||
| 3/10/2020 | — | — | — | — | 1,459 | 51,357 | ||||||||||||||||||||||
| 3/10/2021 | — | — | — | — | 5,000 | 174,100 | ||||||||||||||||||||||
| 11/10/2021 | (4) | — | — | — | — | 17,657 | 373,975 | |||||||||||||||||||||
Anthony Polverino | 12/12/2018 | 52,392 | 25,208 | 15.00 | 12/11/2028 | — | — | |||||||||||||||||||||
| 1/8/2019 | 56,250 | 18,750 | 15.53 | 1/7/2029 | — | — | ||||||||||||||||||||||
| 3/10/2020 | 20,625 | 24,375 | 35.20 | 3/9/2030 | — | — | ||||||||||||||||||||||
| 3/10/2021 | — | 48,750 | 34.82 | 3/9/2031 | — | — | ||||||||||||||||||||||
| 3/10/2020 | — | — | — | — | 5,000 | 176,000 | ||||||||||||||||||||||
| 3/10/2021 | — | — | — | — | 8,125 | 282,913 | ||||||||||||||||||||||
James Priour | 4/13/2020 | 17,850 | 22,950 | 37.65 | 4/12/2030 | — | — | |||||||||||||||||||||
| 3/10/2021 | — | 37,500 | 34.82 | 3/9/2031 | — | — | ||||||||||||||||||||||
| 4/13/2020 | — | — | — | — | 4,534 | 170,705 | ||||||||||||||||||||||
| 3/10/2021 | — | — | — | — | 6,250 | 217,625 | ||||||||||||||||||||||
Diana Hausman | 3/10/2020 | 18,750 | — | 35.20 | 3/9/2030 | — | — | |||||||||||||||||||||
| (1) | Options vest and become exercisable with respect to (i) 25% of the underlying shares one year after the grant date and (ii) the remainder of the underlying shares in 36 equal monthly installments following the first anniversary of the date of grant. |
| (2) | Restricted stock units vest in three equal annual installments on each of the first, second, and third anniversaries of the date of grant. |
| (3) | These options were granted with exercise prices denominated in Canadian dollars. The U.S. dollar per Canadian dollar exchange rate used to convert option exercise price to U.S. dollars was 0.7978, which was the average annual Bank of Canada exchange rate for 2021. |
| (4) | Pursuant to the terms of Dr. Josephson’s promotion letter in connection with his promotion to Chief Medical Officer in November 2021, if prior to the first anniversary of the grant date the Company (A) removes Dr. Josephson from the role of Chief Medical Officer or (B) terminates Dr. Josephson’s employment without cause (the effectiveness of such removal or termination, the “Acceleration Date”), the date upon which 25% of such stock options become exercisable and 25% of such RSUs become vested shall be accelerated to such Acceleration Date. |
Option Exercises and Stock Vested Table
The following table sets forth the number of shares and value realized by the named executive officers during 2021 on share awards granted to employees and membersthe exercise of the board of directors based on their estimated fair values using the Black-Scholes option pricing model. The Black-Scholes option pricing model requires assumptions for various inputs to measure fair value, including expected term of the awards, underlying share price volatility, forfeiture rates, risk-free interest rate and expected dividend yields of our common shares. Management uses judgement to determine the inputs to the Black-Scholes option pricing model and changes in these assumptions could have a material impact to the fair value calculationsstock options and the amount and timingvesting of share-based compensation expense recognized in earnings.restricted stock units:
Options | Restricted Stock Units | |||||||||||||||
Name | Number of Shares Acquired on Exercise (#) | Value Realized on Exercise ($) | Number of Shares Vested (#) | Value Realized on Vesting ($) | ||||||||||||
Ali Tehrani | 57,660 | 1,830,223 | 7,708 | 269,421 | ||||||||||||
Neil Klompas | Nil | Nil | 2,500 | 87,384 | ||||||||||||
Neil Josephson | Nil | Nil | 729 | 25,481 | ||||||||||||
Anthony Polverino | 4,900 | 83,202 | 2,500 | 87,384 | ||||||||||||
James Priour | Nil | Nil | 2,266 | 63,288 | ||||||||||||
Diana Hausman | 193,812 | 3,883,985 | 2,500 | 87,384 | ||||||||||||
Pension Benefits
We do not have any
non-qualified
defined contribution plans or other deferred compensation plans.Executive Employment Arrangements and 2017Potential Payments upon Termination or Change in Control
Key provisions of the employment agreements that were in effect as of December 31, 2021, for our named executive officers (other than Dr. Hausman) are described below. For Dr. Hausman, the description of her employment agreement below reflects the terms that were in effect immediately prior to her resignation in 2021.
Year Ended December 31, | ||||||||||||||||||||
2019 | 2018 | 2017 | Change 2019 – 2018 | |||||||||||||||||
(dollars in millions) | ||||||||||||||||||||
Revenue from research and development collaborations | $ | 29.5 | $ | 53.0 | $ | 51.8 | $ | (23.5 | ) | (44 | %) | |||||||||
non-competition
andnon-solicitation,
as well as not-for-cause
On January 25, 2007, we entered into an employment agreement with Mr. Klompas, our current Chief Operating Officer, setting forth the terms and conditions of his employment as our Director of Finance and Operations, which provided for developmenthis initial base salary and initial equity award, and which includes, among other things, provisions regarding confidentiality, ownership of ZW25. Revenuedevelopments,2018 included recognitionour incentive plans. This agreement was amended on October 23, 2007, and January 1, 2014. On January 17, 2017, we entered into an amended and restated employment agreement with Mr. Klompas that superseded and replaced the January 2007 agreement, as amended, and set forth revised termination and change of $23.5 millioncontrol provisions. Under the newtermination severance formula, during the first three years of an upfront fee from BeiGeneemployment, Mr. Klompas is entitled to 12 months of written notice or payment in relationlieu of notice equal to the Company granting
non-competition
andnon-solicitation,
as well as eligibility for not-for-cause
12
24
On April 29, 2019, we entered into an employment agreement with Dr. Josephson, our current Chief Medical Officer, setting forth the terms and conditions of his employment as our Vice President, Clinical Research. His employment agreement provided for his initial base salary, initial equity awards and target annual bonus, and which includes, among other things, provisions regarding confidentiality, ownership of developments,granting licenseseligibility for developmentour incentive plans. If Dr. Josephson’s employment is terminated without cause during the first three years of ZW25;employment, he is entitled to 12 months of written notice or payment equal to 12 months of his base salary and continuation of benefits for 12 months, or any combination thereof. Commencing in the fourth year of employment, Dr. Josephson is entitled to an $18.0 million upfront fee in relationadditional one month’s written notice or payment equal to the second licensingone month of his base salary and continuation of benefits for one month, or any combination thereof, for each additional completed year of service, up to a total maximum of 18 months. If Dr. Josephson is terminated without cause within 12 months following a change of control, he shall receive severance equal to 18 months of his base salary, continuation of benefits for 18 months and full vesting acceleration of all unvested stock options or other equity grants made as at that date.
non-competition
andnon-solicitation,
as well as On September 20, 2018, we entered into an employment agreement with Daiichi Sankyo; a $5.0 million upfront feeDr. Polverino setting forth the terms and conditions of his employment as our Executive Vice President, Early Development and Chief Scientific Officer until his termination in relation to the licensingJanuary 2022. His employment agreement with LEO; a $4.0 million research program expansion fee from BMS; a $2.0 million development milestone payment triggered upon Lilly’s submissionprovided for his initial base salary and initial equity award, and which includes, among other things, provisions regarding confidentiality, ownership of an IND application under the first licensing agreement with Lilly developments, $0.5 million in research support payments from various collaborations.
non-competition
andnon-solicitation,
Year Ended December 31, | ||||||||||||||||||||
2019 | 2018 | 2017 | Change 2019 – 2018 | |||||||||||||||||
(dollars in millions) | ||||||||||||||||||||
Total research and development expense | $ | 115.9 | $ | 56.9 | $ | 41.1 | $ | 59.0 | 104 | % | ||||||||||
Year Ended December 31, | ||||||||||||||||||||
2019 | 2018 | 2017 | Change 2019 – 2018 | |||||||||||||||||
(dollars in millions) | ||||||||||||||||||||
General and administrative expense | $ | 64.2 | $ | 29.5 | $ | 18.6 | $ | 34.7 | 118 | % | ||||||||||
Year Ended December 31, | ||||||||||||||||||||
2019 | 2018 | 2017 | Change 2019 – 2018 | |||||||||||||||||
(dollars in millions) | ||||||||||||||||||||
Other income (expense), net | $ | 5.3 | $ | (1.0 | ) | $ | (0.5 | ) | $ | 6.3 | 630 | % | ||||||||
non-competition
andnon-solicitation,
as well as eligibility for our incentive plans. If Mr. Priour’s employment is terminated without cause during the first three years of employment, he is entitled to 12 months of written notice or payment equal to 12 months of his base salary and continuation of health and dental benefits for 12 months. Commencing in the fourth year of employment, Mr. Priour is entitled to an additional one month’s written notice or payment equal to one month of his base salary and continuation of health and dental benefits for each additional completed year of service, up to a On June 1, 2016, we entered into an employment agreement with Dr. Hausman setting forth the terms and conditions of her employment as our Chief Medical Officer until her resignation in April 2021. Her employment agreement provided for her initial base salary and initial equity award, and which we sold (i) 5,824,729 common shares (includingincludes, among other things, provisions regarding confidentiality, ownership of developments,salecase of 900,000 common sharestermination of employment other than for cause, she will be entitled to the underwriters upon their full exercise of their over-allotment option) and (ii) 1,075,271pre-fundedwarrants12 months’ notice, or payment in lieu of common shares. We received gross proceedsnotice equal to 12 months of approximately $320.8 million and net cash proceedsher base salary, or any combination thereof, should termination occur within the first year of approximately $301.1 million, after underwriting discounts, commissions and estimated offering expenses.
non-competition
andnon-solicitation,
as well as eligibility for our incentive plans. Dr. Hausman’s employment agreement also specifies, in the Year Ended December 31, | ||||||||||||
2019 | 2018 | 2017 | ||||||||||
(dollars in millions) | ||||||||||||
Net cash provided by (used in): | ||||||||||||
Operating activities | $ | (81.8 | ) | $ | 24.2 | $ | 0.2 | |||||
Investing activities | (25.6 | ) | (109.0 | ) | (30.9 | ) | ||||||
Financing activities | 193.7 | 91.4 | 50.0 | |||||||||
Effect of exchange rate changes on cash and cash equivalents | (0.0 | ) | (0.3 | ) | 0.2 | |||||||
Net increase in cash and cash equivalents | $ | 86.3 | $ | 6.3 | $ | 19.5 | ||||||
2022 Executive Employment Arrangements
In addition, we lease office space in Seattle, Washington which expires in February 2022. On February 25, 2019, weconnection with Mr. Galbraith’s appointment as President and Chief Executive Officer, the Company and Mr. Galbraith entered into an employment agreement (the “”). The Galbraith Employment Agreement does not have a new lease for office space in Seattle. The commencement date of this lease was July 30, 2019 for a portion of the space and is April 1, 2020, subject to adjustment related to ongoing construction, for the remaining portion of the space. The expiration date of the lease is September 30, 2025.
Galbraith Employment Agreement
Payments due by period | ||||||||||||||||||||||||
Less Than 1 Year | 1 to 2 Years | 2 to 3 Years | 3 to 4 Years | Thereafter | Total | |||||||||||||||||||
(dollars in thousands) | ||||||||||||||||||||||||
Capital lease obligations | $ | 31 | $ | 16 | $ | 6 | $ | 3 | $ | 1 | $ | 57 | ||||||||||||
Operating lease obligations | 1,438 | 2,076 | 1,007 | 991 | 1,019 | 6,531 | ||||||||||||||||||
Total contractual obligations | $ | 1,469 | $ | 2,092 | $ | 1,013 | $ | 994 | $ | 1,020 | $ | 6,588 | ||||||||||||
specific term.
An annual base salary of $600,000, with eligibility to payearn an aggregateannual discretionary bonus of $12.0 million inup to 60% of his annual licensing fees to ITS over a five-year period, the full outstanding amount of which was paid in the period ended December 31, 2019 in accordance with the prepayment terms thereunder. As a result, as of December 31, 2019, we have no further licensing fee payment obligations under the agreement. Licensing fees paid have been recorded in intangible assets and are being amortized over their useful lives. We may also be required to make future payments to ITSbase salary, based upon the achievement of certain development and commercial milestones, as well as royalty payments on net sales.Company goals determined by the Board.
Options to purchase 500,000 of the Company’s common shares at an exercise price per share equal to the fair market value on the date of grant (the “”). 25% of the Inducement Options vest and become exercisable on the
Inducement Options
one-year
anniversary of the date of grant, and thereafter 1/36 of the remaining Inducement Options will vest on the last day of each month, until all of the Inducement Options have vested, subject to Mr. Galbraith’s continued service.Enrollment in a qualifying pension scheme under the UK Pensions Act 2008.
Reimbursement of relocation expenses up to a maximum gross amount of $300,000, grossed up for the impact of any taxable withholding, for reasonable moving expenses incurred by Mr. Galbraith and his immediate family during relocation from Mr. Galbraith’s primary residence to the Vancouver, British Columbia or Seattle, Washington area during the first eighteen months of employment. The total amount reimbursed shall be repaid to the Company if Mr. Galbraith’s employment terminates within two years following the effective date of employment.
Temporary housing through the earlier of Mr. Galbraith’s relocation or the date that is 18 months following the effective date of employment, grossed up for the impact of any tax withholding.
A tax equalization payment if Mr. Galbraith is subject to income taxation or other taxation outside of the United Kingdom during the period of his employment, grossed up for the impact of any tax withholding, and tax preparation services.
If the Company terminates Mr. Galbraith’s employment, then Mr. Galbraith will be eligible to receive twelve months of notice or the equivalent of twelve months of base salary as of the date notice is given, or any combination thereof that totals twelve months of combined notice and base salary. If such termination of employment or resignation occurs on or after the fourth year of employment, Mr. Galbraith will be eligible to receive an additional one month of notice or the equivalent of one month of base salary as of the date notice is given, or any combination thereof, for each additional completed year of service, up to a total maximum of eighteen months. Mr. Galbraith will also be eligible for continuation of group health and dental benefits through the applicable notice period to the extent permitted by any applicable benefit plan.
In the event of termination on death or disability, as defined in the Company’s long-term disability plan or policy then in effect with respect to him, Mr. Galbraith, or his estate, will receive (x) a lump sum payment equal to the difference between (1) eighteen months of base salary plus target annual cash bonus as of the date of death or disability and (2) the amount that Mr. Galbraith or his estate will receive as a result of death or disability under the Company’s applicable insurance policies in effect as of the date of termination, (y) group extended health and dental benefits continuation for his surviving family members for eighteen months (or lump sum payment for the premium costs of such benefits in lieu thereof), and (z) full vesting acceleration of all unvested and outstanding stock options or other equity grants made to Mr. Galbraith as of the date of death or disability.
If Mr. Galbraith’s employment is terminated by the Company without cause within twelve months following, or within three months prior to, a Change of Control (as defined in the Galbraith Employment Agreement), Mr. Galbraith will be eligible to receive (x) a lump sum payment of eighteen months of base salary and 100% of target annual cash bonus as of the date of termination, (y) group extended health and dental benefits continuation as of the date of termination for eighteen months (or lump sum payment for the premium costs of such benefit plans in lieu thereof) and (z) full vesting acceleration of all unvested and outstanding stock options or other equity grants as of the date of termination. Such payments will be subject to Mr. Galbraith entering into a valid settlement agreement with the Company.
In addition, the Galbraith Employment Agreement requires Mr. Galbraith, among other things, not to compete, either directly or indirectly, with the Company while employed by the Company and for up to six months following the termination of his employment with the Company. The Galbraith Employment Agreement also requires Mr. Galbraith not to solicit the Company’s employees or consultants to terminate their relationship with the Company while he is employed by the Company and for up to one year following the termination of his employment with the Company.
26
In connection with our acquisitionDr. Tehrani’s resignation, the Company and Mr. Tehrani entered into a Separation Agreement and Release (the “) providing for the following benefits:
Tehrani Separation Agreement”
A lump sum payment of Kairos Therapeutics Inc. (“Kairos”), we may be required$889,638, equivalent to make future payments to CDRD Ventures Inc. (“CVI”) uponeighteen months of base salary.
Payment of the directannual performance bonus for 2021 that he would have received had he remained employed with the Company through the applicable bonus payment date, calculated based on actual achievement of the applicable performance goals under the bonus plan as determined by the Board of Directors. Payment of the bonus, if any, will be made in a lump sum at the same time as the other Company senior executives receive their 2021 bonus. As described in the “Cash Bonus” section above, the Compensation Committee determined that the 2021 goals were not achieved at a level sufficient to warrant the payment of a bonus to executives, and therefore no bonus was paid to Dr. Tehrani.
Eligibility to participate in the Company’s employee benefit plans for the lesser of (a) eighteen months from January 15, 2022 (the “”) or (b) the date of enrollment in the benefit plans of a new employer. The aggregate value of the premiums for extended participation under these plans is $5,377.
Tehrani Termination Date
Entry into a Consulting Services Agreement, whereby he will assist certain development milestones for products incorporating certain Kairos intellectual property,transitional matters at the request and direction of the Company on an as well as royalty paymentsneeded basis. The Consulting Services agreement will begin on the net sales of such products. Forout-licensedproductsTehrani Termination Date and technologies incorporating certain Kairos intellectual property, we maycease on September 30, 2023. Dr. Tehrani will be requiredentitled to pay CVI amid-single-digitpercentage of the future revenue as a result of a revenue sharing agreement. As of December 31, 2019, the development milestone payments had an estimated fair value of approximately $1.0 million, which has been recorded as contingent consideration within other long-term liabilities (December 31, 2018: $0.7 million). The contingent consideration was calculated using a probability weighted assessment of the likelihood the milestones would be met, a probability adjusted discount rate that reflects the stage of the developmentcontinued vesting and time to complete the development. Contingent consideration is a financial liability and measured at its fair value at each reporting period, with any changes in fair value from the previous reporting period recorded in the statement of operations and comprehensive loss.
Reimbursement for all reasonable and documented business expenses actually and properly incurred in relation to Company business up to the Tehrani Termination Date.
Klompas Promotion Letter
Pursuant to the Klompas Promotion Letter, Mr. Klompas is entitled to the following modifications to his existing compensation and benefits:
In connection with Dr. Polverino’s departure from the U.S. dollar as most of our revenuesCompany, the Company and operating expensesDr. Polverino entered into a Separation Agreement and Release providing for the following benefits (which benefits are denominated in U.S. dollars. We incur certain operating expenses in Canadian dollars and accordingly, are subject to foreign currency transaction risk. We do not use derivative instruments to hedge exposure to foreign transaction risk duesubstantially similar to the low volumeseverance benefits under his employment agreement in effect immediately prior to his termination date):
Severance paid in installments of transactions denominated in Canadian dollars and other foreign currencies. We do not anticipate$18,367.00 on each of the Company’s semi-monthly payroll dates for the twelve (12) month period beginning on the first payroll date to occur after March 22, 2022; provided, however, that foreign currency transaction gains or lossesany such payments that would, according to such schedule, be paid after March 15, 2023, will be significant at our current level of operations.accelerated and paid on the Company’s first regular payroll date in March 2023 that occurs on or before March 15, 2023.
Reimbursement for Dr. Polverino’s payments for COBRA coverage for the lesser of (i) twelve (12) months or (ii) until Dr. Polverino has secured health insurance coverage through a new employer.
In connection with Mr. Priour’s departure from the Company, the Company and Mr. Priour entered into a Separation Agreement and Release providing for the following benefits (which benefits are substantially similar to the severance benefits under his employment agreement in Canadian dollars were $5.0 million (C$6.4 million). We are subjecteffect immediately prior to foreign currency translation risk when translating these foreign currency denominated net monetary assets to U.S. dollars for period end financial statement preparation. The fluctuationhis termination date):
Severance paid installments of $16,667.00 on each of the Canadian dollar relative toCompany’s semi-monthly payroll dates for the U.S. dollar will have an impacttwelve (12) month period beginning on the reported balancesfirst payroll date to occur after February 12, 2022.
Reimbursement for net assets, net loss and shareholders’ equity in our consolidated financial statements. A hypothetical 10% increase (decrease) in the value of the Canadian dollar relative to the U.S. dollar would result in a foreign exchange gain (loss) of $0.5 million in Consolidated Statements of Loss and Comprehensive LossMr. Priour’s payments for COBRA coverage for the year ended December 31, 2019.lesser of (i) twelve (12) months or (ii) until Mr. Priour has secured health insurance coverage through a new employer.
27
The table below shows the estimated amounts of the termination payments and benefits that will be made to our named executive officers upon the termination of their employment under the terms of their current employment agreements (assuming termination took place on December 31, 2021 and the price per share is the closing market price as of that date):
Name and Principal Position | Event | Severance ($) | Options ($) (1) (2) | Restricted Stock Units ($) (3) | Other Payments ($) (1) (4) | Total ($) | ||||||||||||||||
Ali Tehrani, Former President & CEO | Termination other than for cause | 889,638 | 5,418,454 | — | 5,377 | 6,313,469 | ||||||||||||||||
Termination following a change of control event (double trigger) | 1,186,184 | 5,516,376 | 662,435 | 7,169 | 7,372,164 | |||||||||||||||||
Neil Klompas, Chief Operating Officer (former CFO) | Termination other than for cause | 655,686 | 2,137,014 | — | 5,377 | 2,798,077 | ||||||||||||||||
Termination following a change of control event (double trigger) | 655,686 | 2,175,658 | 215,119 | 5,377 | 3,051,840 | |||||||||||||||||
Neil Josephson, Chief Medical Officer | Termination other than for cause | 480,000 | — | — | 33,240 | 513,240 | ||||||||||||||||
Termination following a change of control event (double trigger) | 720,000 | — | 395,261 | 49,860 | 1,165,121 | |||||||||||||||||
Anthony Polverino, Former Executive VP, Early Development & Chief Scientific Officer | Termination other than for cause | 440,800 | 121,200 | — | 27,951 | 589,951 | ||||||||||||||||
Termination following a change of control event (double trigger) | 661,200 | 172,364 | 215,119 | 41,927 | 1,090,610 | |||||||||||||||||
James Priour, Former Chief Commercial Officer | Termination other than for cause | 400,000 | — | — | 33,240 | 433,240 | ||||||||||||||||
Termination following a change of control event (double trigger) | 600,000 | — | 176,750 | 49,860 | 826,610 | |||||||||||||||||
Diana Hausman, Former Chief Medical Officer | Termination other than for cause | 540,687 | — | — | — | 540,687 | ||||||||||||||||
Termination following a change of control event (double trigger) | 695,169 | — | — | — | 695,169 | |||||||||||||||||
| (2) | The value of accelerated vesting of options is calculated based on the closing price on the NYSE of $16.39 per share as of December 31, 2021. |
28
| (3) | The value of accelerated vesting of restricted stock units is calculated based on the closing price on the NYSE of $16.39 per share as of December 31, 2021. |
| (4) | For Canadian named executive officers (Dr. Tehrani and Mr. Klompas) amounts shown in the “Other Payments” column relate to contributions to our extended medical benefits premiums. For U.S. named executive officers (Dr. Hausman, Dr. Polverino, Dr. Josephson and Mr. Priour), these amounts relate to health benefits plan premiums. For our Canadian named executive officers, these amounts are denominated in U.S. dollars but paid in Canadian dollars. |
non-equity
incentive plan compensation ornon-qualified
deferred compensation.Name | Fees Earned or Paid in Cash ($) | Option Awards ($) (1) (2) | Total ($) | |||||||||
Troy M. Cox | 52,316 | 172,408 | 224,724 | |||||||||
Kenneth Hillan | 56,286 | 172,408 | 228,694 | |||||||||
Susan Mahony | 53,580 | 172,408 | 225,988 | |||||||||
Kelvin Neu (3) | 47,166 | 172,408 | 219,574 | |||||||||
Hollings C. Renton | 51,727 | 172,408 | 224,135 | |||||||||
Natalie Sacks | 59,749 | 172,408 | 232,157 | |||||||||
Lota Zoth | 90,612 | 172,408 | 263,020 | |||||||||
| (1) | ||||
| (2) | ||||
| (3) | ||||
Director Compensation
The written charter of our compensation committee provides that the compensation committee will review compensation for members of our Board of Directors on at least an annual basis, taking into account their responsibilities and time commitment and information regarding the compensation paid at peer companies. The compensation committee will make recommendations to our Board of Directors with respect to changes to our approach to director compensation as it considers appropriate.
In 2020, the compensation committee engaged Radford to conduct a competitive assessment of our Board of Director compensation program. Radford analyzed board of director compensation practices of our peer group, and compared our Board of Director compensation program to these practices. Based on these findings, the compensation committee determined that it was appropriate and in line with market practices to maintain the Board cash and equity compensation of
non-employee
directors at the 2020 levels for 2021, with the exception that the annual cash retainer fee for service as chair of the research and development committee be increased from $12,000 to $15,000. The Board of Directors approved this adjustment in March 2021. This change positioned our 2021 individual director compensation and total aggregate director compensation between the 25th and 50th percentile compared to the 2021 peer group. No other changes to Board of Director compensation were made for 2021.In March 2022, the compensation committee engaged Radford to conduct a competitive assessment of our Board of Director compensation program. Based on these findings, the compensation committee recommended, and the Board approved, the following changes to the cash and equity compensation of
non-employee
directors:The cash component for Board of Directors and committee membership was maintained at the 2021 levels, with the exception that the cash retainer fee for service as lead independent director was reduced from $70,000 to $65,000.
29
The initial option grants for new directors, to be granted upon joining the Board of Independent Registered Public Accounting FirmDirectors, was changed from 18,000 options to 40,000 options, with the vesting schedule remaining as 1/36 vesting on each monthly anniversary of the effective award date; and
The annual equity grant to directors, to be granted at a time of the Company’s annual general meeting of shareholders, was changed from 9,000 options to 20,000 options, with the vesting schedule remaining that such options cliff vest on the date of the next year’s annual general meeting of shareholders.
These changes positioned our 2022 individual director compensation and total aggregate director compensation between the 25th and 50th percentile compared to the 2022 peer group, consisting of publicly traded,
pre-commercial
biopharmaceutical companies: (i) that are clinical stage companies (with a focus on Phase 2 and Phase 3), particularly those with a therapeutic focus in oncology; (ii) with market capitalizations generally between $250 million and $2.2 billion; (iii) with generally between 100 and 500 employees; (iv) that are located in Canada and the United States, with a focus on companies headquartered in biotechnology hub markets; and (v) preferably that have gone public in the last five years.Following the recommendation of the compensation committee, the Board of Directors also determined to not implement stock ownership guidelines at this time. No other changes to Board of Director compensation were made for 2022.
Cash Compensation for Directors
Amount ($) | ||||
Board of Directors: | ||||
Member | 40,000 | |||
Chair or Lead Independent Director | 70,000 | |||
Audit Committee: | ||||
Member | 7,500 | |||
Chair | 15,000 | |||
Compensation Committee: | ||||
Member | 5,000 | |||
Chair | 10,000 | |||
Nominating and Corporate Governance Committee: | ||||
Member | 3,750 | |||
Chair | 7,500 | |||
Research and Development Committee: | ||||
Member | 6,000 | |||
Chair | 15,000 | |||
Cash retainer fees were amended in March 2022 as discussed above.
Equity Compensation for Directors
We have audited the accompanying consolidated balance sheets of Zymeworks Inc. (the Company) as of December 31, 2019 and 2018, the related consolidated statements of loss and comprehensive loss, changes in redeemable convertible preferred shares and shareholder’s equity, and cash flows for eachgrant members of the yearsBoard of Directors an initial grant of options in the three-year period ended December 31, 2019, and the related notes (collectively, the consolidated financial statements). In our opinion, the consolidated financial statements present fairly, in all material respects, the financial position of the Company as of December 31, 2019 and 2018, and the results of its operations and its cash flows for each of the years in the three-year period ended December 31, 2019, in conformityconnection with U.S. generally accepted accounting principles.
We conducted our audits in accordance with the standardsgrant an annual award of options to each member of the PCAOB. Those standards require thatBoard of Directors, which we plan and performtypically grant on or about the audit to obtain reasonable assurance about whetherdate of our annual general meeting. Annual award options vest in full on the consolidated financial statements are free of material misstatement, whether due to error or fraud. Our audits included performing procedures to assess the risks of material misstatementdate of the consolidated financial statements, whether duefirst annual general meeting following the grant date. In 2021, the annual grant was 9,000 options. In March 2022 the annual grant was increased to error or fraud, and performing procedures that respond to those risks. Such procedures included examining, on a test basis, evidence regarding the amounts and disclosures in the consolidated financial statements. Our audits also included evaluating the accounting principles used and significant estimates made by management,20,000 options, as well as evaluating the overall presentation of the consolidated financial statements. We believe that our audits provide a reasonable basis for our opinion.discussed above.
December 31, | ||||||||
2019 | 2018 | |||||||
Assets | ||||||||
Current assets: | ||||||||
Cash and cash equivalents | $ | 128,451 | $ | 42,205 | ||||
Short-term investments (note 5 ) | 170,453 | 157,959 | ||||||
Accounts receivable | 2,185 | 358 | ||||||
Prepaid expenses and other current assets | 10,741 | 3,847 | ||||||
Total current assets | 311,830 | 204,369 | ||||||
Deferred financing fees | 650 | 265 | ||||||
Long-term prepaid assets | 2,306 | 1,135 | ||||||
Deferred tax asset (note 15) | 1,218 | 198 | ||||||
Property and equipment, net (note 7 ) | 11,100 | 6,484 | ||||||
Operating lease right-of-use assets (note 16 ) | 5,400 | — | ||||||
Intangible assets, net (note 8 ) | 6,057 | 1,614 | ||||||
Acquired in-process research and development (note 6 ) | 17,628 | 18,396 | ||||||
Goodwill (note 6) | 12,016 | 12,016 | ||||||
Total assets | $ | 368,205 | $ | 244,477 | ||||
Liabilities and shareholders’ equity | ||||||||
Current liabilities: | ||||||||
Accounts payable and accrued liabilities (note 9 ) | $ | 35,691 | $ | 13,403 | ||||
Fair value of liability classified options (note 17 ) | 45,569 | 12,603 | ||||||
Current portion of operating lease liability (note 1 6 ) | 1,282 | — | ||||||
Current portion of deferred revenue (note 1 3 ) | — | 3,530 | ||||||
Other current liabilities | 10 | 450 | ||||||
Total current liabilities | 82,552 | 29,986 | ||||||
Long-term portion of operating lease liability (note 1 6 ) | 5,599 | — | ||||||
Long-term portion of deferred revenue (note 1 3 ) | 32,941 | 32,941 | ||||||
Other long-term liabilities ( note 9 ) | 1,024 | 946 | ||||||
Deferred tax liability (note 15) | 408 | 114 | ||||||
Total liabilities | 122,524 | 63,987 | ||||||
Shareholders’ equity: | ||||||||
Common shares, 0 par value; unlimited authorized shares at December 31, 2019 and 2018;39,564,529 and31,977,668 shares issued and outstanding at December 31, 2019 and 2018, respectively (note 11b ) | 450,210 | 320,074 | ||||||
Additional paid-in capital | 92,839 | 12,347 | ||||||
Accumulated other comprehensive loss | (6,659 | ) | (6,659 | ) | ||||
Accumulated deficit | (290,709 | ) | (145,272 | ) | ||||
Total shareholders’ equity | 245,681 | 180,490 | ||||||
Total liabilities and shareholders’ equity | $ | 368,205 | �� | $ | 244,477 | |||
Research collaboration and licensing agreements (note 1 3 ) | ||||||||
Commitments and contingencies (note 1 8 | ||||||||
Subsequent event (note 1 9 | ||||||||
Year Ended December 31, | ||||||||||||
2019 | 2018 | 2017 | ||||||||||
Revenue: | ||||||||||||
Research and development collaborations (note 1 3 ) | $ | 29,544 | $ | 53,019 | $ | 51,762 | ||||||
Operating expenses: | ||||||||||||
Research and development , net of government grants and c redits | 115,900 | 56,926 | 41,144 | |||||||||
General and administrative | 64,177 | 29,457 | 18,550 | |||||||||
Impairment on acquired IPR&D (note 6) | 768 | — | 1,536 | |||||||||
Total operating expenses | 180,845 | 86,383 | 61,230 | |||||||||
Loss from operations | (151,301 | ) | (33,364 | ) | (9,468 | ) | ||||||
Other income (expense): | ||||||||||||
Interest and other income | 6,022 | 2,638 | 743 | |||||||||
Other expense, net (note 14) | (740 | ) | (3,659 | ) | (1,237 | ) | ||||||
Total other income (expense), net | 5,282 | (1,021 | ) | (494 | ) | |||||||
Loss before income taxes | (146,019 | ) | (34,385 | ) | (9,962 | ) | ||||||
Income tax recovery (expense), net (note 15) | 582 | (2,171 | ) | (444 | ) | |||||||
Net loss and comprehensive loss | $ | (145,437 | ) | $ | (36,556 | ) | $ | (10,406 | ) | |||
Net loss per common share (note 4): | ||||||||||||
Basic | $ | (3.83 | ) | $ | (1.26 | ) | $ | (0.51 | ) | |||
Diluted | $ | (3.83 | ) | $ | (1.26 | ) | $ | (0.64 | ) | |||
Weighted-average common shares outstanding (note 4 ): | ||||||||||||
Basic | 38,022,014 | 29,089,896 | 21,249,414 | |||||||||
Diluted | 38,022,014 | 29,089,896 | 21,321,209 | |||||||||
Rede emable Convertible C lass A Preferred shares | Com mon s hares | Accumulated | Accumulated o thercomprehensive | A dditionalpaid-i n | T otal shareholders' | |||||||||||||||||||||||||||||||
Shares | Amount | Shares | Amount | deficit | loss | capital | equity | |||||||||||||||||||||||||||||
Balance at December 31, 2016 | 5,260,404 | $ | 58,860 | 13,126,248 | $ | 106,595 | $ | (97,790 | ) | $ | (6,659 | ) | $ | 6,856 | $ | 9,002 | ||||||||||||||||||||
Issuance of common shares on exercise of options | — | — | 207,777 | 1,777 | — | — | (512 | ) | 1,265 | |||||||||||||||||||||||||||
Issuance of common shares on exercise of warrants | — | — | 117,320 | 1,563 | — | — | — | 1,563 | ||||||||||||||||||||||||||||
Fair value adjustments upon reclassification of options to liabilities | — | — | — | — | — | — | (2,879 | ) | (2,879 | ) | ||||||||||||||||||||||||||
Stock -based compensation | — | — | — | — | — | — | 4,827 | 4,827 | ||||||||||||||||||||||||||||
Beneficial conversion feature recognized on the conversion of redeemable convertible class A preferred shares (note 11 )c | — | — | — | — | (520 | ) | — | 520 | — | |||||||||||||||||||||||||||
Conversion of redeemable convertible class A preferred shares to common shares in connection with initial public offering (note 11c ) | (5,260,404 | ) | (58,860 | ) | 7,098,194 | 58,860 | — | — | — | 58,860 | ||||||||||||||||||||||||||
Issuance of common shares in connection with initial public offering, net of offering costs (note 11 a) | — | — | 4,894,467 | 54,196 | — | — | — | 54,196 | ||||||||||||||||||||||||||||
Net loss | — | — | — | — | (10,406 | ) | — | — | (10,406 | ) | ||||||||||||||||||||||||||
Balance at December 31, 2017 | — | $ | — | 25,444,006 | $ | 222,991 | $ | (108,716 | ) | $ | (6,659 | ) | $ | 8,812 | $ | 116,428 | ||||||||||||||||||||
Issuance of common shares on exercise stock options(note 1 1 )e | — | — | 94,812 | 1,166 | — | — | (341 | ) | 825 | |||||||||||||||||||||||||||
Issuance of common shares through employee stock purchase plan (note 11 )f | — | — | 22,489 | 252 | — | — | — | 252 | ||||||||||||||||||||||||||||
Stock -based compensation | — | — | — | — | — | — | 3,876 | 3,876 | ||||||||||||||||||||||||||||
Issuance of common shares on exercise of warrants (note 10 ) | — | — | 206,361 | 4,913 | — | — | — | 4,913 | ||||||||||||||||||||||||||||
Issuance of common shares in connection with public offering, net of offering costs (note 11a ) | — | — | 6,210,000 | 90,752 | — | — | — | 90,752 | ||||||||||||||||||||||||||||
Net loss | — | — | — | — | (36,556 | ) | — | — | (36,556 | ) | ||||||||||||||||||||||||||
Balance at December 31, 2018 | — | $ | — | 31,977,668 | $ | 320,074 | $ | (145,272 | ) | $ | (6,659 | ) | $ | 12,347 | $ | 180,490 | ||||||||||||||||||||
Issuance of common shares on exercise of options (note 1 1 )e | — | — | 529,661 | 11,432 | — | — | (2,129 | ) | 9,303 | |||||||||||||||||||||||||||
Issuance of common shares through employee share purchase plan (note 1 1 )f | — | — | 43,308 | 763 | — | — | — | 763 | ||||||||||||||||||||||||||||
Fair value adjustments upon reclassification of options to liabilities | — | — | — | — | — | — | (119 | ) | (119 | ) | ||||||||||||||||||||||||||
Stock -based compensation | — | — | — | — | — | — | 12,676 | 12,676 | ||||||||||||||||||||||||||||
Issuance of common shares and pre-funded warrants in connection with public offering, net of offering costs (notes 11a and 11d) | — | — | 7,013,892 | 117,941 | — | — | 70,064 | 188,005 | ||||||||||||||||||||||||||||
Net loss | — | — | — | — | (145,437 | ) | — | — | (145,437 | ) | ||||||||||||||||||||||||||
Balance at December 31, 2019 | — | $ | — | 39,564,529 | $ | 450,210 | $ | (290,709 | ) | $ | (6,659 | ) | $ | 92,839 | $ | 245,681 | ||||||||||||||||||||
Year Ended December 31, | ||||||||||||
2019 | 2018 | 2017 | ||||||||||
Cash flows from operating activities: | ||||||||||||
Net loss | $ | (145,437 | ) | $ | (36,556 | ) | $ | (10,406 | ) | |||
Items not involving cash: | ||||||||||||
Depreciation of property and equipment | 2,312 | 1,880 | 1,681 | |||||||||
Amortization of intangible assets | 3,113 | 1,750 | 1,058 | |||||||||
Impairment on acquired IPR&D | 768 | — | 1,536 | |||||||||
Stock-based compensation (note 11 e ) | 48,996 | 13,441 | 3,429 | |||||||||
Amortization of operating lease right-of-use assets | 1,906 | — | — | |||||||||
Deferred income tax (recovery) expense | (726 | ) | (17 | ) | 15 | |||||||
Change in fair value of contingent consideration (note 18 ) | 271 | 237 | 470 | |||||||||
Change in fair value of warrant liabilities (note 10) | — | 3,565 | (2,450 | ) | ||||||||
Accretion on long-term debt | — | — | 248 | |||||||||
Loss on debt extinguishment | — | — | 3,114 | |||||||||
Unrealized foreign exchange loss/(gain) | 504 | (48 | ) | (254 | ) | |||||||
Changes in non-cash operating working capital: | ||||||||||||
Accounts receivable | (1,828 | ) | (119 | ) | 2,409 | |||||||
Prepaid expenses and other current assets | (8,680 | ) | (251 | ) | (202 | ) | ||||||
Accounts payable and accrued liabilities | 21,572 | 3,684 | (358 | ) | ||||||||
Operating lease liabilities | (795 | ) | — | — | ||||||||
Deferred revenue | (3,530 | ) | 36,471 | — | ||||||||
Income taxes payable | (299 | ) | 140 | (71 | ) | |||||||
Net cash (used in) provided by operating activities | $ | (81,853 | ) | $ | 24,177 | $ | 219 | |||||
Cash flows from financing activities: | ||||||||||||
Proceeds from initial public offering, net of issuance costs (note 11a) | — | — | 55,791 | |||||||||
Proceeds from subsequent public offerings, net of issuance costs (note 11a ) | 188,231 | 90,752 | — | |||||||||
Issuance of common shares on exercise of options (note 1 1 )e | 5,498 | 682 | 965 | |||||||||
Issuance of common shares on exercise of warrants (note 10 ) | — | — | 1,018 | |||||||||
Issuance of common shares through employee stock purchase plan (note 11 )f | 598 | 233 | — | |||||||||
Repayment of debt (note 10 ) | — | — | (7,814 | ) | ||||||||
Deferred financing fees | (650 | ) | (225 | ) | — | |||||||
Finance lease payments | (16 | ) | (11 | ) | (9 | ) | ||||||
Net cash provided by financing activities | $ | 193,661 | $ | 91,431 | $ | 49,951 | ||||||
Cash flows from investing activities: | ||||||||||||
Purchase of s hort-term investments | (11,714 | ) | (105,626 | ) | (27,767 | ) | ||||||
Acquisition of property and equipment | (6,322 | ) | (803 | ) | (2,015 | ) | ||||||
Acquisition of intangible assets | (7,556 | ) | (2,617 | ) | (1,106 | ) | ||||||
Net cash used in investing activities | $ | (25,592 | ) | $ | (109,046 | ) | $ | (30,888 | ) | |||
Effect of exchange rate changes on cash and cash equivalents | 30 | (303 | ) | 227 | ||||||||
Net change in cash and cash equivalents | 86,246 | 6,259 | 19,509 | |||||||||
Cash and cash equivalents, beginning of year | 42,205 | 35,946 | 16,437 | |||||||||
Cash and cash equivalents, end of year | $ | 128,451 | $ | 42,205 | $ | 35,946 | ||||||
Supplemental disclosure of non-cash investing and finance items: | ||||||||||||
Leased assets obtained in exchange for operating lease liabilities | $ | 7,026 | $ | — | $ | — | ||||||
Acquisition of property and equipment in accounts payable and accrued liabilities | 607 | 382 | 123 | |||||||||
Cashless exercise of warrants (note 10 ) | — | 4,913 | — | |||||||||
Risk
Management
Pay Ratio Disclosure
Under rules adopted pursuant to the Dodd-Frank Act, we are required to calculate and disclose the total compensation paid to our median paid employee, as well as the ratio of the total compensation paid to the median employee as compared to the total compensation paid to our Chief Executive Officer (the “”). The paragraphs that follow describe our methodology and the resulting CEO Pay Ratio.
CEO Pay Ratio
Measurement Date
We identified the median employee using our employee population on October 1, 2021 (including all employees, whether employed on a full-time, part-time, seasonal or temporary basis).
CACM
year-to-date
non-U.S.
countries and did not make anycost-of-living
Methodology and Pay Ratio
After applying our CACM methodology, we identified the median employee. Once the median employee was identified, we calculated the median employee’s annual target total direct compensation in accordance with the requirements of the Summary Compensation Table.
Our median employee compensation in 2021 as calculated using the Black-Scholes option pricing model. The Company recognizesSummary Compensation Table requirements was $164,072. Our Chief Executive Officer’s compensation expensein 2021 as reported in the consolidated statementsSummary Compensation Table was $5,100,637. Therefore, our CEO Pay Ratio for 2021 is approximately 31:1.
This information is being provided for compliance purposes and is a reasonable estimate calculated in a manner consistent with the SEC rules, based on our internal records and the methodology described above. The SEC rules for identifying the median compensated employee allow companies to adopt a variety of lossmethodologies, to apply certain exclusions and comprehensive loss on a straight-line basis overto make reasonable estimates and assumptions that reflect their employee populations and compensation practices. Accordingly, the requisite service period.pay ratio reported by other companies may not be comparable to the pay ratio reported above, as other companies have different employee populations and compensation practices and may use different methodologies, exclusions, estimates and assumptions in calculating their own pay ratios. Neither the compensation committee nor management of the Company used the CEO Pay Ratio measure in making compensation decisions.
Mr. Renton, Ms. Zoth, Dr. Mahony and Dr. Hillan served as members of the acquisition method. The fair valuecompensation committee in 2021, with Mr. Renton serving as chair of total purchase considerationthe committee. (Dr. Hillan served on the compensation committee until May 2021, when he stepped down from this committee and Ms. Zoth joined). None of our compensation committee members is allocatedcurrently, or has been within the last completed fiscal year, one of our officers or employees or had any relationship with respect to the fair values of identifiable tangible and intangible assets acquired and liabilities assumed, with the remaining amount being classified as goodwill. All assets, liabilities and contingent liabilities acquired or assumed in a business combination are recorded at their fair values at the date of acquisition. If the Company’s interest in the fair value of the acquiree’s net identifiable assets exceeds the cost of the acquisition, the excess is recognized in earnings or loss immediately. Transaction costs that are incurred in connection with a business combination, other than costs associated with the issuance of debt or equity securities, are expensed as incurred.Company requiring
31
December 31, 2018 | Adjustments Due to the Adoption of Topic 842 | January 1, 2019 | ||||||||||
Operating lease right-of-use assets(1) | $ | — | $ | 3,222 | $ | 3,222 | ||||||
Total lease inducements (2) | 333 | (333 | ) | — | ||||||||
Total operating lease liabilities (3) | — | 3,561 | 3,561 | |||||||||
As reported | Effect of Adoption of Topic 842 Higher / (Lower) | Balances Without the Adoption of Topic 842 | ||||||||||
Operating expenses for the year ended December 31, 2019 | $ | 180,845 | $ | 311 | $ | 180,534 | ||||||
Year Ended December 31, | ||||||||||||
2019 | 2018 | 2017 | ||||||||||
Numerator | ||||||||||||
Net loss attributable to common shareholders: | $ | (145,437 | ) | $ | (36,556 | ) | $ | (10,406 | ) | |||
Deemed dividend due to beneficial conversion feature | — | — | (520 | ) | ||||||||
Basic | $ | (145,437 | ) | $ | (36,556 | ) | $ | (10,926 | ) | |||
Adjustment for change in fair value of ASC 815 liability classified stock options and warrant | — | — | (2,757 | ) | ||||||||
Diluted | $ | (145,437 | ) | $ | (36,556 | ) | $ | (13,683 | ) | |||
Denominator: | ||||||||||||
Weighted-average common shares outstanding: | ||||||||||||
Basic (*) | 38,022,014 | 29,089,896 | 21,249,414 | |||||||||
Adjustment for dilutive effect of liability classified stock options and warrants | — | — | 71,795 | |||||||||
Diluted | 38,022,014 | 29,089,896 | 21,321,209 | |||||||||
Net loss per common share – basic | $ | (3.83 | ) | $ | (1.26 | ) | $ | (0.51 | ) | |||
Net loss per common share – diluted | $ | (3.83 | ) | $ | (1.26 | ) | $ | (0.64 | ) | |||
Acquired IPR&D | Accumulated Impairment | Net | ||||||||||
Balance at December 31, 2016 | $ | 20,700 | $ | (768 | ) | $ | 19,932 | |||||
Change during the period | — | (1,536 | ) | (1,536 | ) | |||||||
Balance at December 31, 2017 | $ | 20,700 | $ | (2,304 | ) | $ | 18,396 | |||||
Change during the period | — | — | — | |||||||||
Balance at December 31, 2018 | $ | 20,700 | $ | (2,304 | ) | $ | 18,396 | |||||
Change during the period | — | (768 | ) | (768 | ) | |||||||
Balance at December 31, 2019 | $ | 20,700 | $ | (3,072 | ) | $ | 17,628 | |||||
December 31, | ||||||||
2019 | 2018 | |||||||
Computer hardware | $ | 2,438 | $ | 1,439 | ||||
Furniture and fixtures | 1,248 | 747 | ||||||
Office equipment | 729 | 535 | ||||||
Laboratory equipment | 6,628 | 5,270 | ||||||
Leasehold improvements | 6,374 | 3,377 | ||||||
Construction in progress | 915 | 221 | ||||||
Property and equipment | $ | 18,332 | $ | 11,589 | ||||
Less accumulated depreciation | (7,232 | ) | (5,105 | ) | ||||
Property and equipment, net | $ | 11,100 | $ | 6,484 | ||||
December 31, | ||||||||
2019 | 2018 | |||||||
Computer software and research license | $ | 12,985 | $ | 5,429 | ||||
Less accumulated amortization | (6,928 | ) | (3,815 | ) | ||||
Intangible assets, net | $ | 6,057 | $ | 1,614 | ||||
December 31, | ||||||||
2019 | 2018 | |||||||
Trade payables | $ | 5,349 | $ | 2,599 | ||||
Accrued research expenses | 24,262 | 6,633 | ||||||
Employee compensation and vacation accruals | 5,009 | 2,926 | ||||||
Accrued legal and professional fees | 231 | 556 | ||||||
Other | 840 | 689 | ||||||
Total | $ | 35,691 | $ | 13,403 | ||||
December 31, | ||||||||
2019 | 2018 | |||||||
Liability for contingent consideration (note 18 ) | $ | 978 | $ | 707 | ||||
Lease inducements | — | 197 | ||||||
Finance lease liability (note 1 6 ) | 46 | 42 | ||||||
Total | $ | 1,024 | $ | 946 | ||||
Year ended December 31, 2017 | ||||
Long term debt at January 1, 2017 | $ | 4,810 | ||
Less: unamortized debt issue costs at January 1, 2017 | (393 | ) | ||
Long term debt at January 1, 2017, net of deferred charges | $ | 4,417 | ||
Accretion during the period up to the Repayment Date | 248 | |||
Amortization of debt issue costs during the period up to the Repayment Date | 35 | |||
Carrying value of long term debt on the Repayment Date, net of deferred charges | $ | 4,700 | ||
Repayment, including repayment premium and expenses | (7,814 | ) | ||
Loss on debt extinguishment | $ | (3,114 | ) | |
Number of Options | Weighted- Average Exercise Price (C$) | Weighted- Average Exercise Price ($) | Weighted- Average Contractual Term (years) | Aggregate intrinsic value (C$) | Aggregate intrinsic value ($) | |||||||||||||||||||
Outstanding, December 31, 2017 | 2,263,712 | 14.24 | 11.35 | 7.53 | 1,455 | 1,160 | ||||||||||||||||||
Granted | 326,975 | 16.51 | 12.74 | |||||||||||||||||||||
Expired | (7,908 | ) | 16.22 | 12.52 | ||||||||||||||||||||
Exercised | (94,812 | ) | 8.81 | 6.80 | ||||||||||||||||||||
Forfeited | (41,977 | ) | 18.09 | 13.96 | ||||||||||||||||||||
Outstanding, December 31, 2018 | 2,445,990 | 14.66 | 10.74 | 6.99 | 14,421 | 10,571 | ||||||||||||||||||
Granted | 358,800 | 22.92 | 17.14 | |||||||||||||||||||||
Expired | (1,047 | ) | 4.75 | 3.65 | ||||||||||||||||||||
Exercised | (403,553 | ) | 12.53 | 9.46 | ||||||||||||||||||||
Forfeited | (43,777 | ) | 18.42 | 13.91 | ||||||||||||||||||||
Outstanding, December 31, 2019 | 2,356,413 | 16.21 | 12.46 | 6.70 | 101,404 | 77,807 | ||||||||||||||||||
December 31, 2019 | ||||||||||||||||||||||||
Exercisable | 1,623,284 | 14.49 | 11.12 | 5.89 | 72,648 | 55,743 | ||||||||||||||||||
Vested and expected to vest | 2,317,044 | 16.15 | 12.39 | 6.67 | 99,860 | 76,622 | ||||||||||||||||||
Number of Options | Weighted- Average Exercise Price ($) | Weighted- Average Contractual Term (years) | Aggregate intrinsic value ($) | |||||||||||||
Outstanding, December 31, 2017 | 636,595 | 9.70 | 9.46 | 15 | ||||||||||||
Granted | 910,783 | 13.03 | ||||||||||||||
Expired | — | — | ||||||||||||||
Exercised | — | — | ||||||||||||||
Forfeited | (7,600 | ) | 9.82 | |||||||||||||
Outstanding, December 31, 2018 | 1,539,778 | 11.67 | 9.02 | 4,876 | ||||||||||||
Granted | 1,501,750 | 19.89 | ||||||||||||||
Expired | — | — | ||||||||||||||
Exercised | (126,108 | ) | 13.32 | |||||||||||||
Forfeited | (62,074 | ) | 14.91 | |||||||||||||
Outstanding, December 31, 2019 | 2,853,346 | 15.85 | 8.66 | 84,481 | ||||||||||||
December 31, 2019 | ||||||||||||||||
Exercisable | 712,423 | 11.21 | 7.66 | 24,403 | ||||||||||||
Vested and expected to vest | 2,738,378 | 15.79 | 8.60 | 81,255 | ||||||||||||
Number of options | Weighted-average date (C$) | Weighted- average date (US$) | ||||||||||
Non-vested, December 31, 2018 | 899,079 | 10.25 | 7.51 | |||||||||
Options granted | 358,800 | 14.89 | 11.42 | |||||||||
Options vested | (482,042 | ) | 28.06 | 21.53 | ||||||||
Options forfeited and cancelled | (42,708 | ) | 16.43 | 12.60 | ||||||||
Non-vested, December 31, 2019 | 733,129 | 16.03 | 12.30 | |||||||||
Number of options | Weighted- average grant date fair value (US$) | |||||||
Non-vested, December 31, 2018 | 1,254,428 | 7.31 | ||||||
Options granted | 1,501,750 | 13.01 | ||||||
Options vested | (553,181 | ) | 7.43 | |||||
Options forfeited and cancelled | (62,074 | ) | 9.63 | |||||
Non-vested, December 31, 2019 | 2,140,923 | 11.21 | ||||||
Year Ended December 31, | ||||||||||||
2019 | 2018 | 2017 | ||||||||||
Research and development expenses: | ||||||||||||
Stock-based compensation for equity classified instruments | $ | 5,939 | $ | 2,203 | $ | 913 | ||||||
Change in fair value of liability classified equity instruments | 8,358 | 2,032 | 492 | |||||||||
| $ | 14,297 | $ | 4,235 | $ | 1,405 | |||||||
General and administrative expenses: | ||||||||||||
Stock-based compensation for equity classified instruments | $ | 6,737 | $ | 3,693 | $ | 1,852 | ||||||
Change in fair value of liability classified equity instruments | 27,470 | 5,362 | 486 | |||||||||
| $ | 34,207 | $ | 9,055 | $ | 2,338 | |||||||
Finance expense (income): | ||||||||||||
Stock-based compensation for equity classified instruments | $ | — | $ | 1 | $ | — | ||||||
Change in fair value of liability classified equity instruments | 166 | 150 | (314 | ) | ||||||||
| $ | 166 | $ | 151 | $ | (314 | ) | ||||||
Year ended December 31, | ||||||||||||
2019 | 2018 | 2017 | ||||||||||
Dividend yield | 0 | % | 0 | % | 0 | % | ||||||
Expected volatility | 73.59 | % | 66.25 | % | 66.25 | % | ||||||
Risk-free interest rate | 1.47 | % | 2.18 | % | 1.44 | % | ||||||
| Forfeiture rate | 5.37 | % | 5.37 | % | 4.75 | % | ||||||
Expected average life of options | 6.05 years | 5.91 years | 5.90 years | |||||||||
Year ended December 31, | ||||||||||||
2019 | 2018 | 2017 | ||||||||||
Dividend yield | 0 | % | 0 | % | 0 | % | ||||||
Expected volatility | 73.15 | % | 66.78 | % | 65.89 | % | ||||||
Risk-free interest rate | 2.23 | % | 2.69 | % | 1.84 | % | ||||||
| Forfeiture rate | 5.37 | % | 5.37 | % | 4.75 | % | ||||||
Expected average life of options | 6.03 years | 5.88 years | 5.89 years | |||||||||
December 31, 2019 | December 31, 2018 | ||||||||
Dividend yield | 0 | % | 0 | % | |||||
Expected volatility | 76.09 | % | 72.27 | % | |||||
Risk-free interest rate | 1.68 | % | 1.94 | % | |||||
| Forfeiture rate | 5.37 | % | 5.37 | % | |||||
Expected average option term | 3.38 years | 3.59 years | |||||||
Number of liability classified share options outstanding | 1,249,365 | 1,437,163 | |||||||
Year Ended December 31, | ||||||||||||
2019 | 2018 | 2017 | ||||||||||
SR&ED credits (expense), net | $ | 110 | $ | (5 | ) | $ | 857 | |||||
IRAP credits | — | — | 218 | |||||||||
Total | $ | 110 | $ | (5 | ) | $ | 1,075 | |||||
Year ended December 31, | ||||||||||||
2019 | 2018 | 2017 | ||||||||||
Janssen: | ||||||||||||
Recognition of upfront fee | $ | — | $ | — | $ | 50,000 | ||||||
Merck: | ||||||||||||
Milestone revenue | 2,000 | — | — | |||||||||
Lilly: | ||||||||||||
Milestone revenue | 8,000 | 2,000 | — | |||||||||
BMS: | ||||||||||||
Option exercise fee | 7,500 | 4,000 | — | |||||||||
Daiichi Sankyo: | ||||||||||||
Technology access fee | — | 18,000 | — | |||||||||
Milestone revenue | — | — | 1,000 | |||||||||
Commercial license option fee | 3,500 | |||||||||||
LEO: | ||||||||||||
Recognition of upfront fee | — | 5,000 | $ | — | ||||||||
BeiGene: | ||||||||||||
Recognition of upfront fee | 3,530 | 23,530 | $ | — | ||||||||
Iconic: | ||||||||||||
Milestone revenue | 1,000 | — | $ | — | ||||||||
Research support payments and other payments | 4,014 | 489 | 762 | |||||||||
| $ | 29,544 | $ | 53,019 | $ | 51,762 | |||||||
Year ended December 31, | ||||||||||||
2019 | 2018 | 2017 | ||||||||||
Foreign exchange (loss) gain | $ | (567 | ) | $ | 72 | $ | 97 | |||||
Change in fair value of warrant liabilities (note 10) | — | (3,565 | ) | 2,450 | ||||||||
Loss on debt extinguishment (note 10) | — | — | (3,114 | ) | ||||||||
Accretion expense | — | — | (248 | ) | ||||||||
Other | (173 | ) | (166 | ) | (422 | ) | ||||||
$(740) | $(3,659) | $(1,237) | ||||||||||
Year Ended December 31, | ||||||||||||
2019 | 2018 | 2017 | ||||||||||
Current income tax expense | $ | (1,373 | ) | $ | (2,188 | ) | $ | (429 | ) | |||
Deferred income tax recovery (expense) | 1,955 | 17 | (15 | ) | ||||||||
Income tax recovery (expense) | $ | 582 | $ | (2,171 | ) | $ | (444 | ) | ||||
Year Ended December 31, | ||||||||||||
2019 | 2018 | 2017 | ||||||||||
Computed taxes at Canadian tax rate | $ | 39,453 | $ | 9,284 | $ | 2,587 | ||||||
Non-deductible expenses | (13,020 | ) | (4,311 | ) | (259 | ) | ||||||
Difference between domestic and foreign tax rate | 104 | 14 | 11 | |||||||||
Effect of change in tax rates | (10 | ) | (2 | ) | 860 | |||||||
Adjustments to prior year | (39 | ) | (543 | ) | 313 | |||||||
Change in valuation allowance | (29,057 | ) | (9,340 | ) | (8,510 | ) | ||||||
Share issuance costs in equity | 3,578 | 1,906 | 2,547 | |||||||||
Change in recognition and measurement of tax positions | (2,391 | ) | (672 | ) | — | |||||||
Changes due to SR&ED | 2,200 | 1,668 | 1,973 | |||||||||
Other | (236 | ) | (175 | ) | 34 | |||||||
Income tax recovery (expen se) | $ | 582 | $ | (2,171 | ) | $ | (444 | ) | ||||
December 31, 2019 | December 31, 2018 | |||||||
Deferred tax assets: | ||||||||
Non-capital losses carried forward | $ | 33,016 | $ | 6,680 | ||||
Deferred revenue | 8,894 | 9,848 | ||||||
Share issue costs | 5,473 | 3,428 | ||||||
Property and equipment | 1,731 | 1,167 | ||||||
Research and development deductions and credits | 21,813 | 20,749 | ||||||
Contingent consideration | 264 | 191 | ||||||
Stock options | 1,242 | 220 | ||||||
Operating lease liability | 1,540 | — | ||||||
Other | 348 | 314 | ||||||
| $ | 74,321 | $ | 42,597 | |||||
Deferred tax liabilities: | ||||||||
Property and equipment | (583 | ) | (54 | ) | ||||
| IPR&D | (4,760 | ) | (4,967 | ) | ||||
Operating lease right-of-use assets | (1,016 | ) | — | |||||
Other | (408 | ) | (132 | ) | ||||
| $ | (6,767 | ) | $ | (5,153 | ) | |||
67,554 | 37,444 | |||||||
Less: valuation allowance | (66,744 | ) | (37,360 | ) | ||||
Net deferred tax assets (liabilities) | $ | 810 | $ | 84 | ||||
Deferred tax asset | $ | 1,218 | $ | 198 | ||||
Deferred tax liability | (408 | ) | (114 | ) | ||||
Net deferred tax assets (liability) | $ | 810 | $ | 84 | ||||
Expiry date | Investment tax credits | Non-capital losses | ||||||
2029 | 1,078 | — | ||||||
2030 | — | — | ||||||
2031 | — | — | ||||||
2032 | — | — | ||||||
2033 | — | — | ||||||
2034 | 230 | — | ||||||
2035 | 1,068 | 3,961 | ||||||
2036 | 878 | 24,578 | ||||||
2037 | 1,587 | 10,625 | ||||||
Expiry date | Investment tax credits | Non-capital losses | ||||||
2038 | 1,485 | — | ||||||
2039 | 1,749 | 83,117 | ||||||
| $ | 8,075 | $ | 122,281 | |||||
Year Ended December 31, | ||||||||||||
2019 | 2018 | 2017 | ||||||||||
Balance, beginning of year | $ | 672 | $ | — | $ | — | ||||||
Increases related to prior year tax positions | — | 142 | — | |||||||||
Increases related to current year tax positions | 2,391 | 530 | — | |||||||||
Balance, end of year | $ | 3,063 | $ | 672 | $ | — | ||||||
S-K.
None of our executive officers currently serve, or have served during the last completed fiscal year, as a December 31, 2019 | December 31, 2018 | |||||||
Operating lease liabilities: | ||||||||
Current portion | $ | 1,282 | $ | — | ||||
Long-term portion | 5,599 | — | ||||||
Total operating lease liabilities | 6,881 | $ | — | |||||
Finance lease liabilities: | ||||||||
Current portion included in other current liabilities | 10 | 15 | ||||||
Long-term portion included in other long-term liabilities | 46 | 42 | ||||||
Total finance lease liabilities | 56 | 57 | ||||||
Total lease liabilities | $ | 6,937 | $ | 57 | ||||
Operating leases | ||||
Within 1 year | $ | 1,438 | ||
1 to 2 years | 2,076 | |||
2 to 3 years | 1,007 | |||
3 to 4 years | 991 | |||
4 to 5 years | 1,019 | |||
Thereafter | 781 | |||
Total operating lease payments | 7,312 | |||
Less: | ||||
Imputed interest | (431 | ) | ||
Operating lease liabilities | $ | 6,881 | ||
The Company evaluates financial assetsmaterial in this report is not “soliciting material,” is not deemed “filed” with the SEC, and liabilities subjectis not to fair value measurements on a recurring basis to determinebe incorporated by reference into any filing by Zymeworks under the appropriate level of classification each reporting period. This determination requiresSecurities Act or the Company to make subjective judgments as to the significance of inputs used in determining fair value and where such inputs lie within the fair value hierarchy.Exchange Act.
December 31, 2019 | Level 1 | Level 2 | Level 3 | |||||||||||||
Liabilities | ||||||||||||||||
Liability classified stock options | $ | 45,569 | $ | — | $ | — | $ | 45,569 | ||||||||
Liability for contingent consideration | 978 | — | — | 978 | ||||||||||||
Total | $ | 46,547 | $ | — | $ | — | $ | 46,547 | ||||||||
December 31, 2018 | Level 1 | Level 2 | Level 3 | |||||||||||||
Liabilities | ||||||||||||||||
Liability classified stock options | $ | 12,603 | $ | — | $ | — | $ | 12,603 | ||||||||
Liability for contingent consideration | 707 | — | — | 707 | ||||||||||||
Total | $ | 13,310 | $ | — | $ | — | $ | 13,310 | ||||||||
Liability at the beginning of the period | Increase (decrease) in fair value of liability for contingent consideration | Liability at end of the period | ||||||||||
Year ended December 31, 2019 | $ | 707 | $ | 271 | $ | 978 | ||||||
Year ended December 31, 2018 | $ | 470 | $ | 237 | $ | 707 | ||||||
Liability at the beginning of the period | Reclassification to liability from equity | Increase (decrease) in fair value of warrant liabilities | Exercise of warrants | Liability at end of the period | ||||||||||||||||
Year ended December 31, 2019 | $ | — | $ | — | $ | — | $ | — | $ | — | ||||||||||
Year ended December 31, 2018 | $ | 1,348 | $ | — | $ | 3,565 | $ | (4,913 | ) | $ | — | |||||||||
Liability at beginning of the period | Reclassification to liabilities from equity | Increase (decrease) in fair value of liability classified stock options | Exercise of options | Unrealized foreign currency loss (gain) | Liability at end of the period | |||||||||||||||||||
Year ended December 31, 2019 | $ | 12,603 | $ | 119 | $ | 35,994 | $ | (3,804 | ) | $ | 657 | $ | 45,569 | |||||||||||
Year ended December 31, 2018 | $ | 3,945 | $ | — | $ | 9,451 | $ | (142 | ) | $ | (651 | ) | $ | 12,603 | ||||||||||
Susan Mahony
| Item 12. | Security Ownership of Certain Beneficial Owners and Management and Related Shareholder Matters |
Equity Compensation Plan Information
The following table sets forth summary information required by Item 12. of Form10-Kis incorporated by referencerelating to our 2020 Proxy Statement,Equity Compensation Plan, employee share purchase plan, as amended, which became effective immediately prior to be filedthe consummation of our initial public offering (the “ESPP”) and Original Plan as of December 31, 2021:
Plan Category | Number of securities to be issued upon exercise of outstanding options, warrants and rights (1) | Weighted average exercise price of outstanding options, warrants, and rights (2) | Number of securities remaining available for future issuance under equity compensation plans (excluding securities reflected in column a) | |||||||||
| (a) | (b) | (c) | ||||||||||
Equity compensation plans approved by security holder | ||||||||||||
Equity Compensation Plan | 6,618,717 | (3) | $ | 26.67 | (4) | 952,632 | ||||||
ESPP | — | $ | — | 1,482,477 | ||||||||
Original Plan | 1,078,121 | $ | 12.66 | (5) | — | |||||||
| (1) | Includes restricted stock units. |
| (2) | Does not include restricted stock units, which do not have an exercise price. |
| (3) | The original maximum number of common shares reserved for issuance under the Equity Compensation Plan as of June 7, 2018, was 5,686,097. Beginning in 2019 and ending in 2028, this maximum number may be increased on the first day of each calendar year by up to 4.0% of the number of outstanding shares on the last day of the immediately preceding calendar year. |
| (4) | Stock options granted under the Equity Compensation Plan are granted with exercise prices in both Canadian dollars and U.S. dollars. As of December 31, 2021, there were 6,327,448 outstanding stock options under the Equity Compensation Plan, consisting of 1,410,534 stock options with a weighted average exercise price of C$34.01 ($27.13 based on the U.S. dollar per Canadian dollar exchange rate of 0.7978, which was the average annual Bank of Canada exchange rate for 2021) and 4,916,914 stock options with a weighted average exercise price of $26.59. |
| (5) | Stock options granted under the Original Plan were granted with exercise prices in Canadian dollars. As of December 31, 2021, there were 1,078,121 outstanding stock options under the Original Plan, with a weighted average exercise price of C$15.87 ($12.66 based on the U.S. dollar per Canadian dollar exchange rate of 0.7978, which was the average annual Bank of Canada exchange rate for 2021). |
32
The following table sets forth certain additional information with respect to our Original Plan, Equity Compensation Plan and ESPP as of December 31, 2021:
Original Plan | Equity Compensation Plan | ESPP | ||||||||||
Number of outstanding securities awarded under plan | 1,078,121 | 6,681,717 | 178,734 | (1) | ||||||||
Issued and outstanding securities under plan as a percentage of issued and outstanding shares | 2.3 | % | 14.3 | % | 0.4 | % | ||||||
Number of securities available for grant under plan | — | 952,632 | 1,482,477 | |||||||||
Number of securities available for grant under plan as a percentage of issued and outstanding shares | — | 2.0 | % | 3.2 | % | |||||||
| (1) | Amount reflects the total number of outstanding securities awarded under the ESPP since the Company’s inception. |
The following table sets forth the SEC within 120 days after the endburn rate under our Original Plan and our Equity Compensation Plan for each of the fiscal yearyears ended December 31, 2021, 2020, and 2019. The burn rate is a percentage calculated based on the number of stock options and restricted stock units granted under each plan during the relevant year divided by the weighted average number of the Company’s issued and outstanding shares during that year.
Original Plan | Equity Compensation Plan | |||||||
Year ended December 31, 2021 | 0 | % | 4.9 | % | ||||
Year ended December 31, 2020 | 0 | % | 3.5 | % | ||||
Year ended December 31, 2019 | 0 | % | 4.9 | % | ||||
SHARE OWNERSHIP
The table below indicates information as of April 15, 2022, regarding the beneficial ownership of our common shares for:
each person who is known by us to beneficially own more than 5% of our common shares;
each named executive officer;
each of our directors; and
all executive officers and directors as a group.
For the purposes of calculating percent ownership, as of April 15, 2022, 57,770,246 shares were issued and outstanding, and, for any individual who beneficially owns shares represented by options exercisable, or restricted stock units vesting, within sixty days of April 15, 2022, these shares are treated as if outstanding for that person, but not for any other person. Unless otherwise indicated in the footnotes to the table, and subject to community property laws where applicable, the following persons have sole voting and investment control with respect to the shares beneficially owned by them. In accordance with SEC rules, if a person has a right to acquire beneficial ownership of any common shares on or within 60 days, upon conversion or exercise of outstanding securities or otherwise, the shares are deemed beneficially owned by that person and are deemed to be outstanding solely for the purpose of determining the percentage of our shares that person beneficially owns. These shares are not included in the computations of percentage ownership for any other person. To our knowledge, except as noted in the table below, no person or entity is the beneficial owner of more than 5% of the voting power of our common shares.
Except as otherwise indicated, the address of each of the persons in this table is Suite 800 – 114 East 4th Avenue, Vancouver, British Columbia, Canada, V5T 1G4.
33
Name and Address of Beneficial Owner | Shares Beneficially Owned | Percentage of Shares Beneficially Owned | ||||||
5% and Greater Shareholders: | ||||||||
Baker Bros. Advisors LP | 6,218,706 | (1) | 9.99 | % | ||||
Armistice Capital, LLC | 3,965,197 | (2) | 6.56 | % | ||||
Perceptive Advisors LLC | 3,679,845 | (3) | 6.37 | % | ||||
All Blue Falcons FZE | 3,419,498 | (4) | 5.92 | % | ||||
Directors and Named Executive Officers: | ||||||||
Christopher Astle (5) | 5,342 | (6) | * | |||||
Troy M. Cox | 55,500 | (7) | * | |||||
Kenneth Galbraith | — | — | ||||||
Diana Hausman | 7,377 | (8) | * | |||||
Kenneth Hillan | 59,425 | (9) | * | |||||
Neil Josephson | 92,001 | (10) | * | |||||
Neil Klompas | 513,644 | (11) | * | |||||
Susan Mahony | 48,000 | (12) | * | |||||
Kelvin Neu | 9,000 | (13) | * | |||||
Anthony Polverino | 165,674 | (14) | * | |||||
James Priour | 20,363 | (15) | * | |||||
Hollings C. Renton | 59,425 | (16) | * | |||||
Natalie Sacks | 53,140 | (17) | * | |||||
Ali Tehrani | 1,542,051 | (18) | 2.61 | % | ||||
Lota Zoth | 61,117 | (19) | * | |||||
All Directors and Executive Officers: | ||||||||
All current executive officers and directors as a group (11) persons) (20) | 956,594 | 1.63 | % | |||||
| * | Less than one percent |
| (1) | Based on a Schedule 13G/A filed February 14, 2022 and company records, consists of 22,000 common shares issuable upon exercise of options exercisable within 60 days after April 15, 2022, 1,708,472 common shares and 4,488,234 shares issuable upon exercise of prefunded warrants held by Baker Bros. Advisors LP, Baker Bros. Advisors (GP) LLC, Felix J. Baker and Julian C. Baker. The address for these entities and individuals is 860 Washington Street, 3 rd Floor, New York, NY 10014. |
| (2) | Based on a Schedule 13F filed February 14, 2022 and company records, consists of 1,250,197 common shares as of December 31, 2022 and 2,715,000 shares issuable upon exercise of prefunded warrants held by Armistice Capital, LLC. The address for this entity is 510 Madison Avenue, 7th Floor, New York, New York 10022. |
| (3) | Based solely on a Schedule 13G/A filed February 14, 2022, consists of 3,679,845 common shares held by Perceptive Advisors LLC, Joseph Edelman and Perceptive Life Sciences Master Fund, Ltd. as of December 31, 2021. The address for these entities and individual is 51 Astor Place, 10 th Floor, New York, NY 10003. |
| (4) | Based solely on a Schedule 13D/A filed April 28, 2022, consists of 3,139,498 common shares directly beneficially owned by All Blue Falcons FZE and 280,000 common shares underlying call options (and including 200,000 shares purchased after April 15, 2022 as set forth in such Schedule 13D). Daniel Edward Llewellen Cookson may be deemed to beneficially own all of these common shares by virtue of his position as a control person of All Blue Falcons FZE. The address for this entity and individual is Office 2301, 23 rd Floor API Trio Tower, Al Bashra 1, Dubai, United Arab Emirates. |
| (5) | Dr. Astle is not a named executive officer in this Form 10-K/A, but he is a current executive officer as a result of his appointment as Chief Financial Officer on February 24, 2022. |
| (6) | Consists of 670 common shares and 4,672 common shares issuable upon the exercise of options exercisable within 60 days after April 15, 2022. |
| (7) | Consists of 7,500 common shares and 48,000 common shares issuable upon the exercise of options exercisable within 60 days after April 15, 2022. |
| (8) | Shareholdings are based on information available to the Company as of the date of Dr. Hausman’s resignation in May 2021. Consists of 5,377 shares held personally and 2,000 shares held by Dr. Hausman’s spouse as of May 15, 2021, Dr. Hausman’s last day as an employee of the Company. |
| (9) | Consists of 59,425 common shares issuable upon the exercise of options exercisable within 60 days after April 15, 2022. |
| (10) | Consists of 9,514 common shares and 82,487 common shares issuable upon the exercise of options exercisable within 60 days after April 15, 2022. |
| (11) | Consists of 13,276 shares held personally and 700 shares held by S. Jennifer Heine, and 499,668 common shares issuable upon the exercise of options exercisable within 60 days after April 15, 2022. |
| (12) | Consists of 48,000 common shares issuable upon the exercise of options exercisable within 60 days after April 15, 2022. |
| (13) | Consists of 9,000 common shares issuable upon the exercise of options exercisable within 60 days after April 15, 2022. Dr. Neu was an employee of Baker Bros. Advisors LP until January 2021. Pursuant to the terms of Dr. Neu’s employment by Baker Brothers Advisors LP, options granted to him in 2020 were, and will continue to be, beneficially owned by Baker Bros. Advisors LP. |
| (14) | Shareholdings are based on information available to the Company as of the date of Dr. Polverino’s termination in January 2022. Consists of 36,407 common shares and 129,267 common shares issuable upon the exercise of options exercisable within 60 days after April 15, 2022. |
34
| (15) | Shareholdings are based on information available to the Company as of the date of Mr. Priour’s termination in January 2022. Consists of 2,513 common shares and 17,850 common shares issuable upon the exercise of options exercisable within 60 days after April 15, 2022. |
| (16) | Consists of 59,425 common shares issuable upon the exercise of options exercisable within 60 days after April 15, 2022. |
| (17) | Consists of 53,140 common shares issuable upon the exercise of options exercisable within 60 days after April 15, 2022. |
| (18) | Consists of 260,325 common shares held personally and 55,511 common shares held by Charissa Tehrani, and 1,226,215 common shares issuable upon the exercise of options exercisable within 60 days after April 15, 2022. |
| (19) | Consists of 61,117 common shares issuable upon the exercise of options exercisable within 60 days after April 15, 2022. |
| (20) | Although Dr. Hausman, Dr. Polverino, Mr. Priour and Dr. Tehrani are considered named executive officers for the purposes of this Form 10-K/A, they are no longer with the Company and are thus not included in the total of shares beneficially owned by the directors and executive officers as a group. |
Item 13. | Certain Relationships and Related Transactions and Director Independence |
Certain Relationships and Related Transactions
In March 2020, we granted to Baker Brothers Life Sciences, L.P. and 667, L.P. certain registration rights requiring us, upon request delivered by such persons on or after April 22, 2020 and subject to certain terms and conditions, to register the endresale by such persons of the fiscal year ended Decembercommon shares held by them (the “”). Dr. Neu, who joined our board in March 2020, served as an employee of Baker Bros. Advisors L.P., which serves as an investment adviser to Baker Brothers Life Sciences, L.P. and 667, L.P., until January 2021.
Registration Rights Agreement
On January 31, 2019.
pre-funded
warrants to purchase up to 3,340,000 common shares. The common shares were sold at a price to the public of $8.00 per common share and thepre-funded
warrants were sold at a price of $7.9999 perpre-funded
warrant, for aggregate gross proceeds to the Company of $115.0 million, before deducting underwriting discounts and commissions and estimated offering expenses. Entities affiliated with Armistice Capital, LLC and Perceptive Advisors LLC purchased 2,285,000 and 1,100,000 common shares, respectively. Armistice Capital Master Fund Ltd, Baker Brothers Life Sciences, L.P. and 667, L.P. purchased 2,715,000, 577,293 and 47,707pre-funded
warrants, respectively.Indebtedness of Directors, Executive Officers and Employees
None of our directors, executive officers, employees, former directors, former executive officers or former employees, and none of their associates, is indebted to us or another entity whose indebtedness is the subject of a guarantee, support agreement, letter of credit or other similar agreement or understanding provided by us.
Policy Regarding Related Party Transactions
All transactions between us and our officers, directors, principal shareholders and their affiliates must be approved by the audit committee, or a similar committee consisting of entirely independent directors.
Requirements under the Business Corporations Act (British Columbia)
Pursuant to the BCBCA, directors and officers are required to act honestly and in good faith with a view to the best interests of the Company. Under the BCBCA, subject to certain limited exceptions, a director who holds a disclosable interest in a material contract or transaction into which we have entered or propose to enter shall not vote on any directors’ resolution to approve the contract or transaction. A director or officer has a disclosable interest in a material contract or transaction if the director or officer:
is a party to the contract or transaction;
is a director or officer, or an individual acting in a similar capacity, of a party to the contract or transaction; or
has a material interest in a party to the contract or transaction.
Generally, as a matter of practice, directors or officers who have disclosed a material interest in any contract or transaction that our Board of Directors is considering will not take part in any board discussion respecting that contract or transaction. If such directors were to participate in the discussions, they would abstain from voting on any matters relating to matters in which they have disclosed a disclosable interest.
35
Interests of Management and Others in Material Transactions
Other than as described elsewhere in this Amendment, there are no material interests, direct or indirect, of any of our directors or executive officers, any shareholder that beneficially owns, or controls or directs (directly or indirectly), more than 10% of any class or series of our outstanding voting securities, or any associate or affiliate of any of the foregoing persons, in any transaction within the year ended December 31, 2021 that has materially affected or is reasonably expected to materially affect us or our subsidiaries.
Director Independence
Under the NYSE Listing Rules, independent directors must comprise a majority of a listed company’s board of directors. In addition, the listing standards of the NYSE require that, subject to specified exceptions, each member of a listed company’s audit, compensation, and nominating and corporate governance committees be independent. Under the NYSE Listing Rules, a director will only qualify as an “independent director” if the listed company’s board of directors affirmatively determines that the director does not have a material relationship with the company (either directly or as a partner, shareholder, or officer of an organization that has a relationship with the company). As noted in the commentary to the listing standards, the concern is independence from management.
Audit committee members must also satisfy the additional independence criteria set forth in Rule
10A-3
under the Exchange Act and the NYSE Listing Rules. Compensation committee members must also satisfy the additional independence criteria set forth in Rule10C-1
under the Exchange Act and the NYSE Listing Rules.The Board of Directors has determined that all directors, except Mr. Galbraith, meet the independence requirements under the NYSE Listing Rules and applicable Canadian securities laws, and qualify as “independent directors” under the NYSE Listing Rules and applicable Canadian securities laws. Mr. Galbraith is not considered independent by virtue of being our President and Chief Executive Officer. Each of the members of our compensation committee, audit committee, corporate governance and nominating committee, and research and development committee is an independent director under the NYSE Listing Rules.
The following directors are directors of other reporting issuers, as set out below:
Director | Reporting Issuer | |
Troy M. Cox | SomaLogic, Inc. SOPHIA GENETICS SA | |
Kenneth Galbraith | Profound Medical Corp. | |
Kenneth Hillan | Sangamo Therapeutics, Inc. | |
Susan Mahony | Assembly Biosciences, Inc. Horizon Therapeutics Public Limited Company Vifor Pharma Ltd. | |
Hollings C. Renton | AnaptysBio, Inc. | |
Natalie Sacks | Caribou Biosciences, Inc. | |
Lota Zoth | 89 Bio, Inc. Inovio Pharmaceuticals, Inc. Lumos Pharma, Inc. | |
Item 14. | Principal Accounting Fees and Services |
Principal Independent Accountant Fees and Services
KPMG has served as our independent registered public accounting firm since June 24, 2015.
36
Aggregate fees billed by our independent auditors, KPMG, for the years ended December 31, 2021 and December 31, 2020, are detailed in the table below:
2021 ($) (5) | 2020 ($) (6) | |||||||
Audit Fees (1) | 639,300 | 523,800 | ||||||
Audit Related Fees (2) | — | — | ||||||
Tax Fees (3) | 293,800 | 242,600 | ||||||
All Other Fees (4) | — | — | ||||||
Total Fees Paid | 933,100 | 766,400 | ||||||
| (1) | Fees for audit service on an accrued basis. |
| (2) | Fees not included in audit fees that are billed by the auditor for assurance and related services that are reasonably related to the performance of the audit of the financial statements. |
| (3) | Fees for professional services rendered for tax compliance, tax advice and tax planning. |
| (4) | All other fees billed by the auditor for products and services not included in the foregoing categories. |
| (5) | Canadian dollar amounts have been converted to U.S. dollars based on the historical Canadian to U.S. average daily rate of exchange as at December 31, 2021. |
| (6) | Canadian dollar amounts have been converted to U.S. dollars based on the historical Canadian to U.S. average daily rate of exchange as at December 31, 2020. |
Pre-approval
Policies and ProceduresOur audit committee has established a policy of reviewing, in advance, and either approving or not approving, all audit, audit-related, tax and other
non-audit
services that our independent registered public accounting firm provides to us. This policy requires that all services received from independent registered public accounting firms be approved in advance by the audit committee or a delegate of the audit committee. The audit committee has delegatedpre-approval
responsibility to the chair of the audit committee with respect tonon-audit
related fees and services forpre-approval
requests made between audit committee meetings. All services that KPMG provided to us in 2021 and 2020 have beenpre-approved
by our audit committee.Our audit committee has determined that the provision of the services as set out above is compatible with the maintaining of KPMG’s independence in the conduct of their auditing functions.
37
PART IV
Item 15. | Exhibits, Financial Statement Schedules |
(a)(1) Financial Statements—The financial statements included in Item 8 are filed as part of this Annual Report on Form10-K.10-K/A.
(a)(2) Financial Statement Schedules—All schedules have been omitted because they are not applicable or required, or the information required to be set forth therein is included in the consolidated Financial Statements or notes thereto included in Item 8 of this Annual Report on Form10-K.10-K/A.
(a)(3) Exhibits—The exhibits required by Item 601 of Regulation
S-K
are listed in paragraph (b) below.(b) Exhibits—The exhibits listed on the Exhibit Index below are filed herewith or are incorporated by reference to exhibits previously filed with the SEC.
EXHIBITS INDEX
Exhibit No. | Description | ||||
3.1 | |||||
| 3.2 | |||||
| 4.1 | |||||
| 4.2 | |||||
4.3 | |||||
| 4.4 | |||||
| 4.5 | |||||
| 4.6 | |||||
| 10.1# | |||||
| 10.2# | |||||
| 10.3# | |||||
| 10.4# | ||||
| 10.5# | ||||
38
| 10.6# | ||||
| 10.7# | ||||
| 10.8† | ||||
| 10.9† | ||||
| 10.10† | ||||
| 10.11† | ||||
| 10.12† | ||||
| 10.13† | ||||
| 10.14† | ||||
| 10.15† | |||||
| 10.16* | |||||
| 10.17* | |||||
| 10.18* | |||||
| 10.19* | |||||
| 10.20† | |||||
| 10.21† | |||||
39
| 10.22* | |||||
| 10.23* | |||||
| 10.24* | |||||
| 10.25* | |||||
| 10.26† | |||||
| 10.27* | |||||
| 10.28* | |||||
| 10.29† | |||||
| 10.30† | |||||
| 10.31* | |||||
| 10.32 | |||||
| 10.33# | |||||
| 10.34† | |||||
| 10.35† | |||||
| 10.36† | |||||
40
| 10.37† | |||||
| 10.38† | |||||
| 10.39* | |||||
| 10.40* | |||||
| 10.41* | |||||
| 10.42† | |||||
| 10.43* | |||||
| 10.44* | |||||
| 10.45* | |||||
| 10.46† | |||||
| 10.47* | |||||
| 10.48 | |||||
| 10.49 | |||||
| 10.50 | |||||
| 10.51 | |||||
| 10.52 | |||||
| 10.53# | |||||
41
| 10.54* | |||||
| 10.55* | |||||
| 10.56 | |||||
| 10.57# | |||||
| 10.58 | |||||
| 10.59 | |||||
| 10.60# | |||||
| 10.61# | |||||
| 10.62# | |||||
| 10.63# | |||||
| 10.64# | |||||
| 10.65# | |||||
| 10.66# | |||||
| 10.67# | |||||
| 10.68# | |||||
| 10.69# | |||||
| 10.70# | |||||
| 10.71# | |||||
| 10.72# | |||||
42
| 21.1 | |||||
| 23.1 | |||||
| 31.1 | |||||
| 31.2 | |||||
| 31.3 | |||||
| 31.4 | |||||
| 32.1 | |||||
| 32.2 | |||||
101 | The following materials from the 10-K for the year ended December 31, | ||||
104 | Cover Page Interactive Data File (formatted as Inline XBRL and contained in Exhibit 101). | ||||
| † | The Company has omitted portions of the referenced exhibit pursuant to a request for confidential treatment under Rule |
| * | Certain portions of this exhibit (indicated by “[…***…]”) have been omitted S-K because the omitted information is not material and |
| # | Indicates management contract or compensatory plan. |
SIGNATURES
Pursuant to the requirements of Section 13 or 15(d) of the Securities Exchange Act of 1934, the registrant has duly caused this report to be signed on its behalf by the undersigned, thereunto duly authorized.
Dated: MarchMay 2, 20202022
ZYMEWORKS INC. | |||||
By: | /s/ | ||||
Name: | |||||
Title: | |||||
Pursuant to the requirements of the Securities Exchange Act of 1934, this report has been signed below by the following persons on behalf of the registrant and in the capacities and on the dates indicated.
Signature | Title | Date | ||||
/s/ | ||||||
| Kenneth Galbraith | ||||||
/s/ | ||||||
| Christopher Astle | ||||||
| Director | May 2, 2022 | |||||
| Troy M. Cox | ||||||
| Director | May 2, 2022 | |||||
| Kenneth Hillan | ||||||
* | Director | May 2, 2022 | ||||
| Susan Mahony | ||||||
* | Director | May 2, 2022 | ||||
| Kelvin Neu | ||||||
* | Director | May 2, 2022 | ||||
| Hollings C. Renton | ||||||
* | Director | May 2, 2022 | ||||
| Natalie Sacks | ||||||
* | Director | May 2, 2022 | ||||
| Lota Zoth | ||||||
| By: | /s/ Kenneth | |||
Kenneth Galbraith Attorney-in-fact | ||||