| ☒ | ANNUAL REPORT PURSUANT TO SECTION 13 OR 15(d) OF THE SECURITIES EXCHANGE ACT OF 1934 |
2020
| ☐ | TRANSITION REPORT PURSUANT TO SECTION 13 OR 15(d) OF THE SECURITIES EXCHANGE ACT OF 1934 |
Class B Common Stock, $.01 par value
| Large accelerated filer | ☐ | Accelerated filer ☒ | ||||
Non-accelerated filer | ☐ | Smaller reporting company | ☒ | |||
$216,494,411.
1, 2021.
| Page | ||||||
| ||||||
Item 1. | 1 | |||||
| ||||||
Item 1A. | ||||||
| ||||||
Item 1B. | ||||||
| ||||||
Item 2. | ||||||
| ||||||
Item 3. | ||||||
| ||||||
Item 4. | ||||||
| ||||||
Item 5. | ||||||
| ||||||
Item 6. | ||||||
| ||||||
Item 7. | ||||||
| ||||||
Item 7A. | ||||||
| ||||||
Item 8. | ||||||
| ||||||
Item 9. | ||||||
| ||||||
Item 9A. | ||||||
| ||||||
Item 9B. | ||||||
| ||||||
Item 10. | ||||||
| ||||||
Item 11. | ||||||
| ||||||
Item 12. | ||||||
| ||||||
Item 13. | ||||||
| ||||||
Item 14. | ||||||
| ||||||
Item 15. | ||||||
| ||||||
Item 16. | ||||||
Item 1. Business. |
|
companies that are affiliated with Donegal Mutual.
In July 2018, we consolidated
-1-
Since we established Atlantic States in 1986, Donegal Mutual and our insurance subsidiaries have conducted business together as the Donegal Insurance Group. As the Donegal Insurance Group,
-2-
business Atlantic States derives from the underwriting pool represents a significant percentage of our total consolidated revenues. However, that percentage has gradually decreased over the past few years as we have acquired a number of other property and casualty insurance companies that do not participate in the underwriting pool.
Donegal Mutual completed the merger of Mountain States Mutual Casualty Company, or Mountain States,wholly owns and has a 100% quota-share reinsurance agreement with and into Donegal Mutual effective May 25, 2017. Donegal Mutual was the surviving company in the merger, and Mountain States’ insurance subsidiaries, Mountain States Indemnity Company and Mountain States Commercial Insurance Company, became insurance subsidiaries of Donegal Mutual upon completion of the merger. Upon completion of the merger, Donegal Mutual assumed all of the policy obligations of Mountain States and began to market its products together with its insurance subsidiaries as the Mountain States Insurance Group in four Southwestern states. Donegal Mutual currently plans to place the business of the Mountain States Insurance Group into the underwriting pool beginninginsurance subsidiaries. Beginning with policies effective in 2021. As a result, our consolidated financial results will exclude the results of Donegal Mutual’s operations in those Southwestern states until2021, Donegal Mutual places suchits assumed business from Mountain States insurance subsidiaries into the underwriting pool.
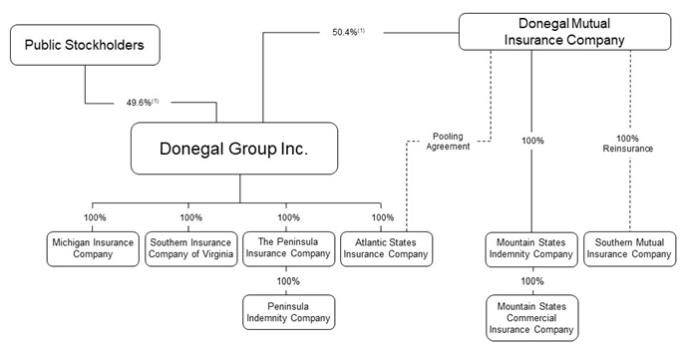
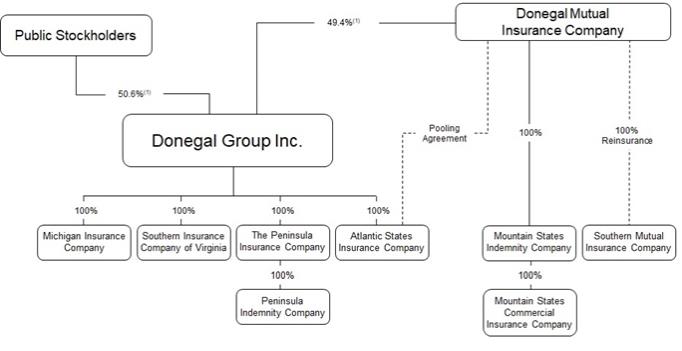
| (1) | Because of the different relative voting power of our Class A common stock and our Class B common stock, our public stockholders hold approximately 29% of the combined voting power of our Class A common stock and our Class B common stock and Donegal Mutual holds approximately 71% of the combined voting power of our Class A common stock and our Class B common stock. |
-3-
respect, with an environment designed to facilitate excellent service to the agents and customers of Donegal Mutual and our insurance subsidiaries. At December 31, 2020, Donegal Mutual had 879 employees, of which 519 were based in its Marietta, Pennsylvania headquarters and 360 were based in regional offices or were permanent remote employees. There were 866 full-time employees and 13 part-time employees. Since March 2020, approximately 90% of Donegal Mutual’s employees have been working remotely from their homes due to health and safety concerns related to the
-4-
stockholders and fair and equitable to Donegal Mutual and its policyholders or if Donegal Mutual and we should mutually agree to certain adjustments to the terms of the agreements. In the case of these reinsurance agreements, the annual adjustments typically relate to the reinsurance premiums, losses and reinstatement premiums. These agreements are ongoing in nature and will continue in effect throughout 20202021 in the ordinary course of our business.
| 2019 | 2018 | 2017 | 2016 | 2015 | ||||||||||||||||
Our GAAP combined ratio | 99.5 | % | 110.1 | % | 103.0 | % | 98.1 | % | 99.0 | % | ||||||||||
Our SAP combined ratio | 98.7 | 109.4 | 101.7 | 96.8 | 97.4 | |||||||||||||||
Industry SAP combined ratio(1) | 98.2 | 99.6 | 105.1 | 100.9 | 98.3 | |||||||||||||||
2020 | 2019 | 2018 | 2017 | 2016 | ||||||||||||||||
Our GAAP combined ratio | 96.0 | % | 99.5 | % | 110.1 | % | 103.0 | % | 98.1 | % | ||||||||||
Our SAP combined ratio | 95.4 | 98.7 | 109.4 | 101.7 | 96.8 | |||||||||||||||
Industry SAP combined ratio (1) | 99.3 | 99.2 | 99.6 | 104.0 | 100.9 | |||||||||||||||
| (1) | As reported (projected for |
-5-
|
|
field visitations by
|
agencies.
-6-
-7-
Company Name | State of Domicile | Year Control Acquired | Method of Acquisition/Affiliation | |||
| ||||||
| ||||||
| ||||||
| ||||||
Southern Heritage Insurance Company (1) | Georgia | 1998 | Purchase of stock by us in 1998. | |||
Le Mars Mutual Insurance Company of Iowa and then Le Mars Insurance Company (1)(2) | Iowa | 2002 | Surplus note investment by Donegal Mutual in 2002; demutualization in 2004; acquisition of stock by us in 2004. | |||
Peninsula Insurance Group | Maryland | 2004 | Purchase of stock by us in 2004. | |||
Sheboygan Falls Mutual Insurance Company and then Sheboygan Falls Insurance Company (1)(2) | Wisconsin | 2007 | Contribution note investment by Donegal Mutual in 2007; demutualization in 2008; acquisition of stock by us in 2008. | |||
Southern Mutual Insurance Company (3) | Georgia | 2009 | Surplus note investment by Donegal Mutual and quota-share reinsurance in 2009. | |||
Michigan Insurance Company | Michigan | 2010 | Purchase of stock by us and surplus note investment by Donegal Mutual in 2010. | |||
Mountain States Mutual Casualty Company (4) | New Mexico | 2017 | Merger with and into Donegal Mutual in | |||
| (1) | To reduce administrative and compliance costs and expenses, these subsidiaries subsequently merged into one of our existing insurance subsidiaries. |
| (2) | Each of these acquisitions initially took the form of an affiliation with Donegal Mutual. Donegal Mutual provided surplus note financing to the insurance company, and, in connection with that financing, sufficient designees of Donegal Mutual were appointed so as to constitute a majority of the members of the board of directors of the insurance company. Donegal Mutual and the insurance company simultaneously entered into a services agreement whereby Donegal Mutual provided services to improve the operations of the insurance company. Once the insurance company’s results of operations improved to the satisfaction of Donegal Mutual, Donegal Mutual sponsored the demutualization of the insurance company. Upon the consummation of the demutualization, Donegal Mutual converted the surplus note to capital stock of the newly demutualized insurance company. We then purchased all of the capital stock of the insurance company from Donegal Mutual and made an additional capital contribution in cash to provide adequate surplus to support the insurance company’s planned premium growth. |
|
| (3) | Control acquired by Donegal Mutual. |
| (4) | Donegal Mutual completed the merger of Mountain States with and into Donegal Mutual effective May 25, 2017. Donegal Mutual was the surviving company in the merger, and Mountain |
-8-
|
|
|
2020.
|
-9-
portfolios of our insurance subsidiaries consist of both taxable and(5.0%(4.8% at December 31, 2019)2020) of their portfolios in equity securities.
securities that have a history of paying cash dividends or that our insurance subsidiaries expect will appreciate in value over time.
-10-
| Year Ended December 31, | ||||||||||||||||||||||||
| 2019 | 2018 | 2017 | ||||||||||||||||||||||
| (dollars in thousands) | Amount | % | Amount | % | Amount | % | ||||||||||||||||||
Commercial lines: | ||||||||||||||||||||||||
Automobile | $ | 122,142 | 16.2 | % | $ | 108,123 | 14.5 | % | $ | 99,333 | 13.6 | % | ||||||||||||
Workers’ compensation | 113,684 | 15.1 | 109,022 | 14.7 | 109,884 | 15.1 | ||||||||||||||||||
Commercial multi-peril | 138,750 | 18.5 | 117,509 | 15.8 | 110,313 | 15.1 | ||||||||||||||||||
Other | 30,303 | 4.0 | 15,241 | 2.0 | 9,586 | 1.3 | ||||||||||||||||||
|
|
|
|
|
|
|
|
|
|
|
| |||||||||||||
Total commercial lines | 404,879 | 53.8 | 349,895 | 47.0 | 329,116 | 45.1 | ||||||||||||||||||
|
|
|
|
|
|
|
|
|
|
|
| |||||||||||||
Personal lines: | ||||||||||||||||||||||||
Automobile | 210,507 | 28.0 | 249,275 | 33.5 | 255,297 | 35.0 | ||||||||||||||||||
Homeowners | 117,118 | 15.5 | 123,782 | 16.6 | 125,054 | 17.2 | ||||||||||||||||||
Other | 20,097 | 2.7 | 21,064 | 2.9 | 19,672 | 2.7 | ||||||||||||||||||
|
|
|
|
|
|
|
|
|
|
|
| |||||||||||||
Total personal lines | 347,722 | 46.2 | 394,121 | 53.0 | 400,023 | 54.9 | ||||||||||||||||||
|
|
|
|
|
|
|
|
|
|
|
| |||||||||||||
Total business | $ | 752,601 | 100.0 | % | $ | 744,016 | 100.0 | % | $ | 729,139 | 100.0 | % | ||||||||||||
|
|
|
|
|
|
|
|
|
|
|
| |||||||||||||
Year Ended December 31, | ||||||||||||||||||||||||
2020 | 2019 | 2018 | ||||||||||||||||||||||
| (dollars in thousands) | Amount | % | Amount | % | Amount | % | ||||||||||||||||||
Commercial lines: | ||||||||||||||||||||||||
Automobile | $ | 135,294 | 18.2 | % | $ | 122,142 | 16.2 | % | $ | 108,123 | 14.5 | % | ||||||||||||
Workers’ compensation | 109,960 | 14.8 | 113,684 | 15.1 | 109,022 | 14.7 | ||||||||||||||||||
Commercial multi-peril | 147,993 | 19.9 | 138,750 | 18.5 | 117,509 | 15.8 | ||||||||||||||||||
Other | 32,739 | 4.5 | 30,303 | 4.0 | 15,241 | 2.0 | ||||||||||||||||||
Total commercial lines | 425,986 | 57.4 | 404,879 | 53.8 | 349,895 | 47.0 | ||||||||||||||||||
Personal lines: | ||||||||||||||||||||||||
Automobile | 184,602 | 24.9 | 210,507 | 28.0 | 249,275 | 33.5 | ||||||||||||||||||
Homeowners | 111,886 | 15.1 | 117,118 | 15.5 | 123,782 | 16.6 | ||||||||||||||||||
Other | 19,666 | 2.6 | 20,097 | 2.7 | 21,064 | 2.9 | ||||||||||||||||||
Total personal lines | 316,154 | 42.6 | 347,722 | 46.2 | 394,121 | 53.0 | ||||||||||||||||||
Total business | $ | 742,140 | 100.0 | % | $ | 752,601 | 100.0 | % | $ | 744,016 | 100.0 | % | ||||||||||||
-11-
Pennsylvania | % | |||
Michigan | ||||
Maryland | 9.3 | |||
Georgia | ||||
Virginia | ||||
Delaware | ||||
Wisconsin | ||||
Ohio | ||||
Iowa | 2.3 | |||
Indiana | 2.2 | |||
Tennessee | ||||
Other | ||||
Total | 100.0 | % | ||
-12-
The next release of new systems related to the project will include three personal lines of business and is scheduled for phased implementation beginning in the third quarter of 2021.
-13-
establishing its estimates, an insurer recognizes that its ultimate liability for losses and loss expenses will exceed or be less than such estimates. Our insurance subsidiaries base their estimates of liabilities for losses and loss expenses on assumptions as to future loss trends, expected claims severity, judicial theories of liability and other factors. However, during the loss adjustment period, our insurance subsidiaries may learn additional facts regarding individual claims, and, consequently, it often becomes necessary for our insurance subsidiaries to refine and adjust their estimates for these liabilities. We reflect any adjustments to the liabilities for losses and loss expenses of our insurance subsidiaries in our consolidated results of operations in the period in which our insurance subsidiaries make adjustments to their estimates.
-14-
commercial automobile and personal automobile claims that led our insurance subsidiaries to conclude that their prior actuarial assumptions did not fully anticipate recent changes in severity and reporting trends. Our insurance subsidiaries have encountered increasing difficulties in projecting the ultimate severity of automobile losses over recent accident years, which our insurance subsidiaries attribute to worsening litigation trends and an increased delay in the reporting to our insurance subsidiaries of information with respect to the severity of claims. As a result, our insurance subsidiaries’ actuaries increased their projections of the ultimate cost of our insurance subsidiaries’ prior-year personal automobile and commercial automobile losses, and our insurance subsidiaries added $17.7 million to their reserves for personal automobile and $20.8 million to their reserves for commercial automobile for accident years prior to 2018. The 2017 development represented 1.9% of the December 31, 2016 net carried reserves and resulted primarily from higher-than-expected severity in the commercial multi-peril, personal automobile and commercial automobile lines of business, offset by lower-than-expected severity in the workers’ compensation line of business, for accident years prior to 2017. The majority of the 2017 development related to increases in the liability for losses and loss expenses of prior years for Atlantic States and Peninsula.
-15-
| Year Ended December 31, | ||||||||||||
| (in thousands) | 2019 | 2018 | 2017 | |||||||||
Gross liability for unpaid losses and loss expenses at beginning of year | $ | 814,665 | $ | 676,672 | $ | 606,665 | ||||||
Less reinsurance recoverable | 339,267 | 293,271 | 259,147 | |||||||||
|
|
|
|
|
| |||||||
Net liability for unpaid losses and loss expenses at beginning of year | 475,398 | 383,401 | 347,518 | |||||||||
|
|
|
|
|
| |||||||
Provision for net losses and loss expenses for claims incurred in the current year | 519,320 | 540,827 | 480,647 | |||||||||
Change in provision for estimated net losses and loss expenses for claims incurred in prior years | (12,932 | ) | 35,631 | 6,621 | ||||||||
|
|
|
|
|
| |||||||
Total incurred | 506,388 | 576,458 | 487,268 | |||||||||
|
|
|
|
|
| |||||||
Net losses and loss expense payments for claims incurred during: | ||||||||||||
The current year | 278,924 | 308,578 | 288,380 | |||||||||
Prior years | 195,956 | 175,883 | 163,005 | |||||||||
|
|
|
|
|
| |||||||
Total paid | 474,880 | 484,461 | 451,385 | |||||||||
|
|
|
|
|
| |||||||
Net liability for unpaid losses and loss expenses at end of year | 506,906 | 475,398 | 383,401 | |||||||||
Plus reinsurance recoverable | 362,768 | 339,267 | 293,271 | |||||||||
|
|
|
|
|
| |||||||
Gross liability for unpaid losses and loss expenses at end of year | $ | 869,674 | $ | 814,665 | $ | 676,672 | ||||||
|
|
|
|
|
| |||||||
Year Ended December 31, | ||||||||||||
| (in thousands) | 2020 | 2019 | 2018 | |||||||||
Gross liability for unpaid losses and loss expenses at beginning of year | $ | 869,674 | $ | 814,665 | $ | 676,672 | ||||||
Less reinsurance recoverable | 362,768 | 339,267 | 293,271 | |||||||||
Net liability for unpaid losses and loss expenses at beginning of year | 506,906 | 475,398 | 383,401 | |||||||||
Provision for net losses and loss expenses for claims incurred in the current year | 472,709 | 519,320 | 540,827 | |||||||||
Change in provision for estimated net losses and loss expenses for claims incurred in prior years | (12,945 | ) | (12,932 | ) | 35,631 | |||||||
Total incurred | 459,764 | 506,388 | 576,458 | |||||||||
Net losses and loss expense payments for claims incurred during: | ||||||||||||
The current year | 236,984 | 278,924 | 308,578 | |||||||||
Prior years | 172,497 | 195,956 | 175,883 | |||||||||
Total paid | 409,481 | 474,880 | 484,461 | |||||||||
Net liability for unpaid losses and loss expenses at end of year | 557,189 | 506,906 | 475,398 | |||||||||
Plus reinsurance recoverable | 404,818 | 362,768 | 339,267 | |||||||||
Gross liability for unpaid losses and loss expenses at end of year | $ | 962,007 | $ | 869,674 | $ | 814,665 | ||||||
Amounts shown in the 2010 column
| Year Ended December 31, | ||||||||||||||||||||||||||||||||||||||||||||
| (in thousands) | 2009 | 2010 | 2011 | 2012 | 2013 | 2014 | 2015 | 2016 | 2017 | 2018 | 2019 | |||||||||||||||||||||||||||||||||
Net liability at end of year for unpaid losses and loss expenses | $ | 180,262 | $ | 217,896 | $ | 243,015 | $ | 250,936 | $ | 265,605 | $ | 292,301 | $ | 322,054 | $ | 347,518 | $ | 383,401 | $ | 475,398 | $ | 506,906 | ||||||||||||||||||||||
Net liabilityre-estimated as of: | ||||||||||||||||||||||||||||||||||||||||||||
One year later | 177,377 | 217,728 | 250,611 | 261,294 | 280,074 | 299,501 | 325,043 | 354,139 | 419,032 | 462,466 | ||||||||||||||||||||||||||||||||||
Two years later | 177,741 | 217,355 | 255,612 | 268,877 | 281,782 | 299,919 | 329,115 | 375,741 | 413,535 | |||||||||||||||||||||||||||||||||||
Three years later | 178,403 | 218,449 | 257,349 | 270,473 | 281,666 | 304,855 | 338,118 | 376,060 | ||||||||||||||||||||||||||||||||||||
Four years later | 179,909 | 218,514 | 256,460 | 270,794 | 284,429 | 307,840 | 339,228 | |||||||||||||||||||||||||||||||||||||
Five years later | 179,961 | 218,202 | 255,660 | 271,954 | 285,130 | 310,354 | ||||||||||||||||||||||||||||||||||||||
Six years later | 179,858 | 217,430 | 256,388 | 272,553 | 287,439 | |||||||||||||||||||||||||||||||||||||||
Seven years later | 179,996 | 217,703 | 257,132 | 274,111 | ||||||||||||||||||||||||||||||||||||||||
Eight years later | 180,130 | 218,173 | 257,935 | |||||||||||||||||||||||||||||||||||||||||
Nine years later | 180,487 | 218,603 | ||||||||||||||||||||||||||||||||||||||||||
Ten years later | 180,681 | |||||||||||||||||||||||||||||||||||||||||||
Cumulative deficiency (excess) | 419 | 707 | 14,920 | 23,175 | 21,834 | 18,053 | 17,174 | 28,542 | 30,134 | (12,932 | ) | |||||||||||||||||||||||||||||||||
|
|
|
|
|
|
|
|
|
|
|
|
|
|
|
|
|
|
|
| |||||||||||||||||||||||||
Cumulative amount of liability paid through: | ||||||||||||||||||||||||||||||||||||||||||||
One year later | $ | 84,565 | $ | 96,202 | $ | 119,074 | $ | 126,677 | $ | 131,766 | $ | 131,779 | $ | 149,746 | $ | 163,005 | $ | 175,883 | $ | 195,956 | ||||||||||||||||||||||||
Two years later | 123,204 | 148,140 | 181,288 | 191,208 | 194,169 | 206,637 | 228,506 | 250,678 | 276,331 | |||||||||||||||||||||||||||||||||||
Three years later | 147,165 | 178,073 | 217,138 | 225,956 | 233,371 | 251,654 | 274,235 | 306,338 | ||||||||||||||||||||||||||||||||||||
Four years later | 161,363 | 195,948 | 234,392 | 245,094 | 255,451 | 274,248 | 300,715 | |||||||||||||||||||||||||||||||||||||
Five years later | 169,452 | 203,633 | 241,538 | 254,502 | 265,841 | 287,178 | ||||||||||||||||||||||||||||||||||||||
Six years later | 173,153 | 206,731 | 245,774 | 259,437 | 272,431 | |||||||||||||||||||||||||||||||||||||||
Seven years later | 174,376 | 209,527 | 248,195 | 263,386 | ||||||||||||||||||||||||||||||||||||||||
Eight years later | 175,662 | 210,982 | 250,272 | |||||||||||||||||||||||||||||||||||||||||
Nine years later | 176,514 | 212,340 | ||||||||||||||||||||||||||||||||||||||||||
Ten years later | 177,433 | |||||||||||||||||||||||||||||||||||||||||||
| Year Ended December 31, | ||||||||||||||||||||||||||||||||||||
| (in thousands) | 2011 | 2012 | 2013 | 2014 | 2015 | 2016 | 2017 | 2018 | 2019 | |||||||||||||||||||||||||||
Gross liability at end of year | $ | 442,408 | $ | 458,827 | $ | 495,619 | $ | 538,258 | $ | 578,205 | $ | 606,665 | $ | 676,672 | $ | 814,665 | $ | 869,674 | ||||||||||||||||||
Reinsurance recoverable | 199,393 | 207,891 | 230,014 | 245,957 | 256,151 | 259,147 | 293,271 | 339,266 | 362,768 | |||||||||||||||||||||||||||
Net liability at end of year | 243,015 | 250,936 | 265,605 | 292,301 | 322,054 | 347,518 | 383,401 | 475,398 | 506,906 | |||||||||||||||||||||||||||
Grossre-estimated liability | 515,334 | 511,331 | 536,133 | 584,517 | 615,168 | 664,526 | 742,616 | 846,081 | ||||||||||||||||||||||||||||
Re-estimated recoverable | 257,399 | 237,220 | 248,694 | 274,163 | 275,940 | 288,466 | 329,081 | 383,615 | ||||||||||||||||||||||||||||
Netre-estimated liability | 257,935 | 274,111 | 287,439 | 310,354 | 339,228 | 376,060 | 413,535 | 462,466 | ||||||||||||||||||||||||||||
Gross cumulative deficiency (excess) | 72,926 | 52,504 | 40,514 | 46,259 | 36,963 | 57,861 | 65,944 | 31,416 | ||||||||||||||||||||||||||||
-17-
Year Ended December 31, | ||||||||||||||||||||||||||||||||||||||||||||
(in thousands) | 2010 | 2011 | 2012 | 2013 | 2014 | 2015 | 2016 | 2017 | 2018 | 2019 | 2020 | |||||||||||||||||||||||||||||||||
Net liability at end of year for unpaid losses and loss expenses | $ | 217,896 | $ | 243,015 | $ | 250,936 | $ | 265,605 | $ | 292,301 | $ | 322,054 | $ | 347,518 | $ | 383,401 | $ | 475,398 | $ | 506,906 | $ | 557,189 | ||||||||||||||||||||||
Net liability re-estimated as of: | ||||||||||||||||||||||||||||||||||||||||||||
One year later | 217,728 | 250,611 | 261,294 | 280,074 | 299,501 | 325,043 | 354,139 | 419,032 | 462,466 | 493,961 | ||||||||||||||||||||||||||||||||||
Two years later | 217,355 | 255,612 | 268,877 | 281,782 | 299,919 | 329,115 | 375,741 | 413,535 | 450,862 | |||||||||||||||||||||||||||||||||||
Three years later | 218,449 | 257,349 | 270,473 | 281,666 | 304,855 | 338,118 | 376,060 | 404,902 | ||||||||||||||||||||||||||||||||||||
Four years later | 218,514 | 256,460 | 270,794 | 284,429 | 307,840 | 339,228 | 372,230 | |||||||||||||||||||||||||||||||||||||
Five years later | 218,202 | 255,660 | 271,954 | 285,130 | 310,354 | 338,020 | ||||||||||||||||||||||||||||||||||||||
Six years later | 217,430 | 256,388 | 272,553 | 287,439 | 310,380 | |||||||||||||||||||||||||||||||||||||||
Seven years later | 217,703 | 257,132 | 274,111 | 287,063 | ||||||||||||||||||||||||||||||||||||||||
Eight years later | 218,173 | 257,935 | 274,472 | |||||||||||||||||||||||||||||||||||||||||
Nine years later | 218,603 | 258,272 | ||||||||||||||||||||||||||||||||||||||||||
Ten years later | 218,885 | |||||||||||||||||||||||||||||||||||||||||||
Cumulative deficiency (excess) | 989 | 15,257 | 23,536 | 21,458 | 18,079 | 15,966 | 24,712 | 21,501 | (24,536 | ) | (12,945 | ) | ||||||||||||||||||||||||||||||||
Cumulative amount of liability paid through: | ||||||||||||||||||||||||||||||||||||||||||||
One year later | $ | 96,202 | $ | 119,074 | $ | 126,677 | $ | 131,766 | $ | 131,779 | $ | 149,746 | $ | 163,005 | $ | 175,883 | $ | 195,956 | $ | 172,497 | ||||||||||||||||||||||||
Two years later | 148,140 | 181,288 | 191,208 | 194,169 | 206,637 | 228,506 | 250,678 | 276,331 | 275,993 | |||||||||||||||||||||||||||||||||||
Three years later | 178,073 | 217,138 | 225,956 | 233,371 | 251,654 | 274,235 | 306,338 | 317,447 | ||||||||||||||||||||||||||||||||||||
Four years later | 195,948 | 234,392 | 245,094 | 255,451 | 274,248 | 300,715 | 324,628 | |||||||||||||||||||||||||||||||||||||
Five years later | 203,633 | 241,538 | 254,502 | 265,841 | 287,178 | 309,630 | ||||||||||||||||||||||||||||||||||||||
Six years later | 206,731 | 245,774 | 259,437 | 272,431 | 292,327 | |||||||||||||||||||||||||||||||||||||||
Seven years later | 209,527 | 248,195 | 263,386 | 275,357 | ||||||||||||||||||||||||||||||||||||||||
Eight years later | 210,982 | 250,272 | 265,026 | |||||||||||||||||||||||||||||||||||||||||
Nine years later | 212,340 | 251,696 | ||||||||||||||||||||||||||||||||||||||||||
Ten years later | 213,333 | |||||||||||||||||||||||||||||||||||||||||||
Year Ended December 31, | ||||||||||||||||||||||||||||||||||||
(in thousands) | 2012 | 2013 | 2014 | 2015 | 2016 | 2017 | 2018 | 2019 | 2020 | |||||||||||||||||||||||||||
Gross liability at end of year | $ | 458,827 | $ | 495,619 | $ | 538,258 | $ | 578,205 | $ | 606,665 | $ | 676,672 | $ | 814,665 | $ | 869,674 | $ | 962,007 | ||||||||||||||||||
Reinsurance recoverable | 207,891 | 230,014 | 245,957 | 256,151 | 259,147 | 293,271 | 339,266 | 362,768 | 404,818 | |||||||||||||||||||||||||||
Net liability at end of year | 250,936 | 265,605 | 292,301 | 322,054 | 347,518 | 383,401 | 475,398 | 506,906 | 557,189 | |||||||||||||||||||||||||||
Gross re-estimated liability | 492,274 | 519,465 | 560,090 | 592,023 | 629,162 | 692,908 | 782,595 | 838,833 | ||||||||||||||||||||||||||||
Re-estimated recoverable | 217,802 | 232,402 | 249,710 | 254,003 | 256,932 | 288,006 | 331,733 | 344,872 | ||||||||||||||||||||||||||||
Net re-estimated liability | 274,472 | 287,063 | 310,380 | 338,020 | 372,230 | 404,902 | 450,862 | 493,961 | ||||||||||||||||||||||||||||
Gross cumulative deficiency (excess) | 33,447 | 23,846 | 21,832 | 13,818 | 22,497 | 16,236 | (32,070 | ) | (30,841 | ) | ||||||||||||||||||||||||||
2020.
| (dollars in thousands) | December 31, 2019 | |||||||
Rating(1) | Amount | Percent | ||||||
U.S. Treasury and U.S. agency securities(2) | $ | 463,974 | 44.6 | % | ||||
Aaa or AAA | 26,154 | 2.5 | ||||||
Aa or AA | 212,877 | 20.4 | ||||||
A | 171,822 | 16.5 | ||||||
BBB | 164,217 | 15.8 | ||||||
B | 2,002 | 0.2 | ||||||
|
|
|
| |||||
Total | $ | 1,041,046 | 100.0 | % | ||||
|
|
|
| |||||
| (dollars in thousands) | December 31, 2020 | |||||||
Rating (1) | Amount | Percent | ||||||
U.S. Treasury and U.S. agency securities (2) | $ | 374,483 | 32.8 | % | ||||
Aaa or AAA | 23,734 | 2.1 | ||||||
Aa or AA | 315,352 | 27.6 | ||||||
A | 211,456 | 18.5 | ||||||
BBB | 214,719 | 18.8 | ||||||
B | 2,001 | 0.2 | ||||||
Total | $ | 1,141,745 | 100.0 | % | ||||
| (1) | Ratings assigned by Moody’s Investors Services, Inc. or Standard & Poor’s Corporation. |
| (2) | Includes mortgage-backed securities of |
-18-
| December 31, | ||||||||||||||||||||||||
| 2019 | 2018 | 2017 | ||||||||||||||||||||||
| (dollars in thousands) | Amount | Percent of Total | Amount | Percent of Total | Amount | Percent of Total | ||||||||||||||||||
Fixed maturities(1): | ||||||||||||||||||||||||
Held to maturity: | ||||||||||||||||||||||||
U.S. Treasury securities and obligations of U.S. government corporations and agencies | $ | 82,916 | 7.5 | % | $ | 76,223 | 7.4 | % | $ | 71,736 | 7.1 | % | ||||||||||||
Obligations of states and political subdivisions | 204,634 | 18.4 | 159,292 | 15.5 | 137,581 | 13.7 | ||||||||||||||||||
Corporate securities | 156,399 | 14.1 | 127,010 | 12.3 | 108,025 | 10.7 | ||||||||||||||||||
Mortgage-backed securities | 32,145 | 2.9 | 40,274 | 3.9 | 49,313 | 4.9 | ||||||||||||||||||
|
|
|
|
|
|
|
|
|
|
|
| |||||||||||||
Total held to maturity | 476,094 | 42.9 | 402,799 | 39.1 | 366,655 | 36.4 | ||||||||||||||||||
|
|
|
|
|
|
|
|
|
|
|
| |||||||||||||
Available for sale: | ||||||||||||||||||||||||
U.S. Treasury securities and obligations of U.S. government corporations and agencies | 19,364 | 1.7 | 44,210 | 4.3 | 44,049 | 4.4 | ||||||||||||||||||
Obligations of states and political subdivisions | 56,796 | 5.1 | 75,216 | 7.3 | 132,117 | 13.1 | ||||||||||||||||||
Corporate securities | 159,244 | 14.3 | 137,833 | 13.4 | 105,740 | 10.5 | ||||||||||||||||||
Mortgage-backed securities | 329,548 | 29.7 | 269,299 | 26.1 | 257,040 | 25.6 | ||||||||||||||||||
|
|
|
|
|
|
|
|
|
|
|
| |||||||||||||
Total available for sale | 564,952 | 50.8 | 526,558 | 51.1 | 538,946 | 53.6 | ||||||||||||||||||
|
|
|
|
|
|
|
|
|
|
|
| |||||||||||||
Total fixed maturities | 1,041,046 | 93.7 | 929,357 | 90.2 | 905,601 | 90.0 | ||||||||||||||||||
Equity securities(2) | 55,477 | 5.0 | 43,667 | 4.2 | 50,445 | 5.0 | ||||||||||||||||||
Investment in affiliate(3) | — | — | 41,026 | 4.0 | 38,774 | 3.9 | ||||||||||||||||||
Short-term investments(4) | 14,030 | 1.3 | 16,749 | 1.6 | 11,050 | 1.1 | ||||||||||||||||||
|
|
|
|
|
|
|
|
|
|
|
| |||||||||||||
Total investments | $ | 1,110,553 | 100.0 | % | $ | 1,030,799 | 100.0 | % | $ | 1,005,870 | 100.0 | % | ||||||||||||
|
|
|
|
|
|
|
|
|
|
|
| |||||||||||||
December 31, | ||||||||||||||||||||||||
2020 | 2019 | 2018 | ||||||||||||||||||||||
| (dollars in thousands) | Amount | Percent of Total | Amount | Percent of Total | Amount | Percent of Total | ||||||||||||||||||
Fixed maturities (1) : | ||||||||||||||||||||||||
Held to maturity: | ||||||||||||||||||||||||
U.S. Treasury securities and obligations of U.S. government corporations and agencies | $ | 77,435 | 6.3 | % | $ | 82,916 | 7.5 | % | $ | 76,223 | 7.4 | % | ||||||||||||
Obligations of states and political subdivisions | 312,319 | 25.6 | 204,634 | 18.4 | 159,292 | 15.5 | ||||||||||||||||||
Corporate securities | 173,270 | 14.2 | 156,399 | 14.1 | 127,010 | 12.3 | ||||||||||||||||||
Mortgage-backed securities | 23,585 | 1.9 | 32,145 | 2.9 | 40,274 | 3.9 | ||||||||||||||||||
Total held to maturity | 586,609 | 48.0 | 476,094 | 42.9 | 402,799 | 39.1 | ||||||||||||||||||
Available for sale: | ||||||||||||||||||||||||
U.S. Treasury securities and obligations of U.S. government corporations and agencies | 47,815 | 3.9 | 19,364 | 1.7 | 44,210 | 4.3 | ||||||||||||||||||
Obligations of states and political subdivisions | 68,965 | 5.7 | 56,796 | 5.1 | 75,216 | 7.3 | ||||||||||||||||||
Corporate securities | 212,708 | 17.4 | 159,244 | 14.3 | 137,833 | 13.4 | ||||||||||||||||||
Mortgage-backed securities | 225,648 | 18.5 | 329,548 | 29.7 | 269,299 | 26.1 | ||||||||||||||||||
Total available for sale | 555,136 | 45.5 | 564,952 | 50.8 | 526,558 | 51.1 | ||||||||||||||||||
Total fixed maturities | 1,141,745 | 93.5 | 1,041,046 | 93.7 | 929,357 | 90.2 | ||||||||||||||||||
Equity securities (2) | 58,556 | 4.8 | 55,477 | 5.0 | 43,667 | 4.2 | ||||||||||||||||||
Investment in affiliate (3) | — | — | — | — | 41,026 | 4.0 | ||||||||||||||||||
Short-term investments (4) | 20,901 | 1.7 | 14,030 | 1.3 | 16,749 | 1.6 | ||||||||||||||||||
Total investments | $ | 1,221,202 | 100.0 | % | $ | 1,110,553 | 100.0 | % | $ | 1,030,799 | 100.0 | % | ||||||||||||
| (1) | We refer to Notes 1 and 4 to our Consolidated Financial Statements. We value those fixed maturities we classify as held to maturity at amortized cost; we value those fixed maturities we classify as available for sale at fair value. The total fair value of fixed maturities we classified as held to maturity was $632.6 million at December 31, 2020, $500.3 million at December 31, 2019 and $405.0 million at December 31, |
| (2) | We value equity securities at fair value. The total cost of equity securities was $42.4 million at December 31, 2020, $43.4 million at December 31, 2019 and $40.9 million at December 31, |
| (3) | We valued our investment in our affiliate at cost, adjusted for our share of earnings and losses of our affiliate as well as changes in equity of our affiliate due to unrealized gains and losses. |
| (4) | We value short-term investments at cost, which approximates fair value. |
-19-
| December 31, | ||||||||||||||||||||||||
| 2019 | 2018 | 2017 | ||||||||||||||||||||||
| (dollars in thousands) | Amount | Percent of Total | Amount | Percent of Total | Amount | Percent of Total | ||||||||||||||||||
Due in(1): | ||||||||||||||||||||||||
One year or less | $ | 29,209 | 2.8 | % | $ | 39,282 | 4.2 | % | $ | 53,826 | 6.0 | % | ||||||||||||
Over one year through three years | 71,738 | 6.9 | 74,773 | 8.1 | 74,140 | 8.2 | ||||||||||||||||||
Over three years through five years | 93,982 | 9.0 | 84,987 | 9.1 | 82,476 | 9.1 | ||||||||||||||||||
Over five years through ten years | 297,836 | 28.6 | 256,267 | 27.6 | 221,904 | 24.5 | ||||||||||||||||||
Over ten years through fifteen years | 116,368 | 11.2 | 117,875 | 12.7 | 131,531 | 14.5 | ||||||||||||||||||
Over fifteen years | 70,220 | 6.8 | 46,600 | 5.0 | 35,371 | 3.9 | ||||||||||||||||||
Mortgage-backed securities | 361,693 | 34.7 | 309,573 | 33.3 | 306,353 | 33.8 | ||||||||||||||||||
|
|
|
|
|
|
|
|
|
|
|
| |||||||||||||
| $ | 1,041,046 | 100.0 | % | $ | 929,357 | 100.0 | % | $ | 905,601 | 100.0 | % | |||||||||||||
|
|
|
|
|
|
|
|
|
|
|
| |||||||||||||
December 31, | ||||||||||||||||||||||||
2020 | 2019 | 2018 | ||||||||||||||||||||||
| (dollars in thousands) | Amount | Percent of Total | Amount | Percent of Total | Amount | Percent of Total | ||||||||||||||||||
Due in (1) : | ||||||||||||||||||||||||
One year or less | $ | 73,166 | 6.4 | % | $ | 29,209 | 2.8 | % | $ | 39,282 | 4.2 | % | ||||||||||||
Over one year through three years | 85,805 | 7.5 | 71,738 | 6.9 | 74,773 | 8.1 | ||||||||||||||||||
Over three years through five years | 111,258 | 9.8 | 93,982 | 9.0 | 84,987 | 9.1 | ||||||||||||||||||
Over five years through ten years | 341,947 | 30.0 | 297,836 | 28.6 | 256,267 | 27.6 | ||||||||||||||||||
Over ten years through fifteen years | 139,604 | 12.2 | 116,368 | 11.2 | 117,875 | 12.7 | ||||||||||||||||||
Over fifteen years | 140,732 | 12.3 | 70,220 | 6.8 | 46,600 | 5.0 | ||||||||||||||||||
Mortgage-backed securities | 249,233 | 21.8 | 361,693 | 34.7 | 309,573 | 33.3 | ||||||||||||||||||
| $ | 1,141,745 | 100.0 | % | $ | 1,041,046 | 100.0 | % | $ | 929,357 | 100.0 | % | |||||||||||||
| (1) | Based on stated maturity dates with no prepayment assumptions. Actual maturities will differ because borrowers may have the right to call or prepay obligations with or without call or prepayment penalties. |
| Year Ended December 31, | ||||||||||||
| (dollars in thousands) | 2019 | 2018 | 2017 | |||||||||
Invested assets(1) | $ | 1,070,676 | $ | 1,018,334 | $ | 975,695 | ||||||
Investment income(2) | 29,515 | 26,908 | 23,527 | |||||||||
Average yield | 2.8 | % | 2.6 | % | 2.4 | % | ||||||
Averagetax-equivalent yield | 2.9 | 2.8 | 2.8 | |||||||||
Year Ended December 31, | ||||||||||||
| (dollars in thousands) | 2020 | 2019 | 2018 | |||||||||
Invested assets (1) | $ | 1,165,878 | $ | 1,070,676 | $ | 1,018,334 | ||||||
Investment income (2) | 29,504 | 29,515 | 26,908 | |||||||||
Average yield | 2.5 | % | 2.8 | % | 2.6 | % | ||||||
Average tax-equivalent yield | 2.7 | 2.9 | 2.8 | |||||||||
| (1) | Average of the aggregate invested amounts at the beginning and end of the period. |
| (2) | Investment income is net of investment expenses and does not include investment gains or losses or provision for income taxes. |
-20-
require by a substantial margin.
-21-
of risks attributable to such insureds to each company on the basis of the direct premiums it has written in that state or the number of automobiles it insures in that state. Generally, state law requires participation in these programs as a condition to obtaining a certificate of authority. Our loss ratio on insurance we write under these involuntary programs has traditionally been significantly greater than our loss ratio on insurance we voluntarily write in those states.
Name of Insurance Subsidiary | Ordinary Dividend Amount | |||
Atlantic States | $ | 25,903,087 | ||
MICO | 6,576,859 | |||
Peninsula | 1,983,678 | |||
Southern | 5,440,557 | |||
|
| |||
Total | $ | 39,904,181 | ||
|
| |||
Name of Insurance Subsidiary | Ordinary Dividend Amount | |||
Atlantic States | $ | 27,979,670 | ||
MICO | 12,236,054 | |||
Peninsula | 10,907,098 | |||
Southern | 300,409 | |||
Total | $ | 51,423,231 | ||
-22-
-23-
insurance subsidiaries expect their ultimate liability to be. Significant periods of time often elapse between the occurrence of an insured loss, the reporting of the loss and the settlement of that loss. It is possible that our insurance subsidiaries’ ultimate liability could exceed these estimates because of the future development of known losses, the existence of losses that have occurred but are currently unreported and larger than historical settlements of pending and unreported claims. The process of estimating reserves is inherently judgmental and can be influenced by a number of factors, including the following:
-24-
unanticipated
-25-
-26-
-27-
-28-
marketing systemsdistribution channels other than independent agents.Our
-29-
from stable to negative as a result of the decline in the operating performance of Donegal Mutual and our insurance subsidiaries in 2017 and 2018. In March 2020,2021, A.M. Best affirmed its A (Excellent) ratings of Donegal Mutual and our insurance subsidiaries. However, if A.M. Best were to downgrade the rating of Donegal Mutual or any of our insurance subsidiaries, it would adversely affect the competitive position of Donegal Mutual or that insurance subsidiary and make it more difficult for it to market its products and retain its existing policyholders.
-30-
independent agents. Many of these insurers have greater capital than our insurance subsidiaries and Donegal Mutual, have substantially greater financial, technical and operating resources and have equal or higher ratings from A.M. Best than our insurance subsidiaries.subsidiaries and Donegal Mutual. In addition, our competitors may become increasingly better capitalized in the future as the property and casualty insurance industry continues to consolidate.
Because the
-31-
liable to them for any reinsured losses, the reinsurance agreements do not generally relieve our insurance subsidiaries from their primary liability to their policyholders if the reinsurer fails to pay the reinsurance claims of our insurance subsidiaries. To the extent that a reinsurer is unable to pay losses for which it is liable to our insurance subsidiaries, our insurance subsidiaries remain liable for such losses. At December 31, 2019,2020, our insurance subsidiaries had approximately $141.0$129.5 million of reinsurance receivables from third-party reinsurers relating to paid and unpaid losses. Any insolvency or inability of these reinsurers to make timely payments to our insurance subsidiaries under the terms of their reinsurance agreements would adversely affect the results of operations of our insurance subsidiaries.
The growth and profitability of our insurance subsidiaries depend, in part, on the effective maintenance and ongoing development of Donegal Mutual’s information technology systems, and the allocation of related costs to our insurance subsidiaries may adversely impact their profitability.
Our insurance subsidiaries utilize Donegal Mutual’s information technology systems to conduct their insurance business, including policy quoting and issuance, claims processing, processing of incoming premium payments and other important functions. As a result, the ability of our insurance subsidiaries to grow their business and conduct profitable operations depends on Donegal Mutual’s ability to maintain its existing information technology systems and to develop new technology systems that will support the business of Donegal Mutual and our insurance subsidiaries in a cost-efficient manner and provide information technology capabilities equivalent to those of our competitors. The allocation among our insurance subsidiaries and Donegal Mutual of the costs of developing and maintaining Donegal Mutual’s information technology systems may impact adversely our insurance subsidiaries’ expense ratio and underwriting profitability, and such costs may exceed Donegal Mutual’s and our expectations.
Donegal Mutual is currently in the midst of a multi-year effort to modernize certain of its key infrastructure and applications systems. These new systems are intended to provide various benefits to Donegal Mutual and our insurance subsidiaries, including streamlined workflows and business processes, service enhancements for their agents and policyholders, opportunities to implement new product models and innovative business solutions, greater utilization of data analytics and operational efficiencies. Our insurance subsidiaries will issue workers’ compensation policies from the new systems beginning with new policies effective in May 2020 and renewal policies effective in June 2020. Over the next several years, Donegal Mutual expects to implement new systems for the remaining lines of business Donegal Mutual and our insurance subsidiaries offer currently. Even with Donegal Mutual’s and our best planning and efforts and the involvement of third-party experts, Donegal Mutual may not complete the implementation of these new systems within its planned time frames or budget. Further, Donegal Mutual’s information technology systems may not deliver the benefits Donegal Mutual and we expect and may fail to keep pace with our competitors’ information technology systems. As a result, Donegal Mutual and our insurance subsidiaries may not have the ability to grow their business and meet their profitability objectives.
-32-
Donegal Mutual has established various security measures to protect its information technology systems and confidential data, unanticipated computer viruses, malware, power outages, unauthorized access or other cyberattacks could disrupt those systems or result in the misappropriation or loss of confidential data. Donegal Mutual could experience technology system failures or other outages that would impact the availability of its information technology systems. Donegal Mutual has experienced brief disruptions of systems in the past, including those systems that allow underwriting and processing of new policies. Disruption in the availability of Donegal Mutual’s information technology systems could impactaffect the ability of Donegal Mutual and our insurance subsidiaries to underwrite and process their policies timely, process and settle claims promptly and provide expected levels of customer service to agents and policyholders.
-33-
Item 2. Properties. |
|
Item 3. Legal |
Proceedings. |
Item 4. Mine |
Safety Disclosures. |
-34-
-35-
Period | (a) Total Number of Shares (or Units) Purchased | (b) Average Price Paid per Share (or Unit) | (c) Total Number of Shares (or Units) Purchased as Part of Publicly Announced Plans or Programs | (d) Maximum Number (or Approximate Dollar Value) of Shares (or Units) that May Yet Be Purchased Under the Plans or Programs | ||||
| Month #1 October 1-31, 2020 | Class A – None Class B – None | Class A – None Class B – None | Class A – None Class B – None | |||||
Month #2 November 1-30, 2020 | Class A – None Class B – None | Class A – None Class B – None | Class A – None Class B – None | |||||
| Month #3 December 1-31, 2020 | Class A – 135,000 Class B – None | Class A – $14.17 Class B – None | Class A – 135,000 Class B – None | (1) | ||||
Total | Class A – 135,000 Class B – None | Class A – $14.17 Class B – None | Class A – 135,000 Class B – None | |||||
| (1) | Donegal Mutual purchased these shares pursuant to its announcement on August 17, 2004 that it will, at its discretion, purchase shares of our Class A common stock and Class B common stock at market prices prevailing from time to time in the open market subject to the provisions of SEC Rule 10b-18 and in privately negotiated transactions. Such announcement did not stipulate a maximum number of shares that may be purchased under this program. |
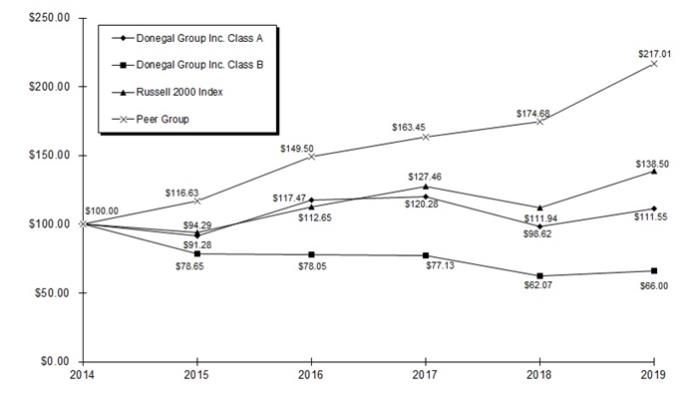
| 2014 | 2015 | 2016 | 2017 | 2018 | 2019 | |||||||||||||||||||
Donegal Group Inc. Class A | $ | 100.00 | $ | 91.28 | $ | 117.47 | $ | 120.28 | $ | 98.62 | $ | 111.55 | ||||||||||||
Donegal Group Inc. Class B | 100.00 | 78.65 | 78.05 | 77.13 | 62.07 | 66.00 | ||||||||||||||||||
Russell 2000 Index | 100.00 | 94.29 | 112.65 | 127.46 | 111.94 | 138.50 | ||||||||||||||||||
Peer Group | 100.00 | 116.63 | 149.50 | 163.45 | 174.68 | 217.01 | ||||||||||||||||||

2015 | 2016 | 2017 | 2018 | 2019 | 2020 | |||||||||||||||||||
Donegal Group Inc. Class A | $ | 100.00 | $ | 128.69 | $ | 131.77 | $ | 108.04 | $ | 122.20 | $ | 119.72 | ||||||||||||
Donegal Group Inc. Class B | 100.00 | 99.24 | 98.07 | 78.92 | 83.91 | 84.83 | ||||||||||||||||||
Russell 2000 Index | 100.00 | 121.31 | 139.08 | 123.77 | 156.60 | 188.27 | ||||||||||||||||||
Peer Group | 100.00 | 128.19 | 140.15 | 149.78 | 186.07 | 161.93 | ||||||||||||||||||
-36-
Item 6. | Selected Financial Data. |
| Year Ended December 31, | 2019 | 2018 | 2017 | 2016 | 2015 | |||||||||||||||
Income Statement Data | ||||||||||||||||||||
Premiums earned | $ | 756,078,400 | $ | 741,290,873 | $ | 702,514,755 | $ | 656,204,797 | $ | 605,640,728 | ||||||||||
Investment income, net | 29,514,955 | 26,907,656 | 23,527,304 | 22,632,730 | 20,949,698 | |||||||||||||||
Investment gains (losses) | 21,984,617 | (4,801,509 | ) | 5,705,255 | 2,525,575 | 1,934,424 | ||||||||||||||
Total revenues | 812,451,471 | 771,828,320 | 739,026,537 | 688,423,020 | 636,387,263 | |||||||||||||||
Income (loss) before income tax expense (benefit) | 57,081,030 | (48,236,849 | ) | 12,114,462 | 41,328,407 | 27,592,268 | ||||||||||||||
Income tax expense (benefit) | 9,929,286 | (15,476,509 | ) | 4,998,362 | 10,527,270 | 6,602,235 | ||||||||||||||
Net income (loss) | 47,151,744 | (32,760,340 | ) | 7,116,100 | 30,801,137 | 20,990,033 | ||||||||||||||
Basic earnings (loss) per share - Class A | 1.68 | (1.18 | ) | 0.27 | 1.19 | 0.78 | ||||||||||||||
Diluted earnings (loss) per share - Class A | 1.67 | (1.18 | ) | 0.26 | 1.16 | 0.77 | ||||||||||||||
Cash dividends per share - Class A | 0.58 | 0.57 | 0.56 | 0.55 | 0.54 | |||||||||||||||
Basic earnings (loss) per share - Class B | 1.51 | (1.09 | ) | 0.22 | 1.06 | 0.69 | ||||||||||||||
Diluted earnings (loss) per share - Class B | 1.51 | (1.09 | ) | 0.22 | 1.06 | 0.69 | ||||||||||||||
Cash dividends per share - Class B | 0.51 | 0.50 | 0.49 | 0.48 | 0.47 | |||||||||||||||
Balance Sheet Data at Year End | ||||||||||||||||||||
Total investments | $ | 1,110,553,363 | $ | 1,030,798,566 | $ | 1,005,869,705 | $ | 945,519,655 | $ | 900,822,274 | ||||||||||
Total assets | 1,923,161,131 | 1,832,078,267 | 1,737,919,778 | 1,623,131,037 | 1,537,834,415 | |||||||||||||||
Debt obligations | 40,000,000 | 65,000,000 | 64,000,000 | 74,000,000 | 86,000,000 | |||||||||||||||
Stockholders’ equity | 451,015,519 | 398,869,901 | 448,696,104 | 438,615,320 | 408,388,568 | |||||||||||||||
Book value per share | 15.67 | 14.05 | 15.95 | 16.21 | 15.66 | |||||||||||||||
-37-
Year Ended December 31, | 2020 | 2019 | 2018 | 2017 | 2016 | |||||||||||||||
Income Statement Data | ||||||||||||||||||||
Premiums earned | $ | 742,040,339 | $ | 756,078,400 | $ | 741,290,873 | $ | 702,514,755 | $ | 656,204,797 | ||||||||||
Investment income, net | 29,504,466 | 29,514,955 | 26,907,656 | 23,527,304 | 22,632,730 | |||||||||||||||
Investment gains (losses) | 2,777,919 | 21,984,617 | (4,801,509 | ) | 5,705,255 | 2,525,575 | ||||||||||||||
Total revenues | 777,819,910 | 812,451,471 | 771,828,320 | 739,026,537 | 688,423,020 | |||||||||||||||
Income (loss) before income tax expense (benefit) | 63,272,503 | 57,081,030 | (48,236,849 | ) | 12,114,462 | 41,328,407 | ||||||||||||||
Income tax expense (benefit) | 10,457,251 | 9,929,286 | (15,476,509 | ) | 4,998,362 | 10,527,270 | ||||||||||||||
Net income (loss) | 52,815,252 | 47,151,744 | (32,760,340 | ) | 7,116,100 | 30,801,137 | ||||||||||||||
Basic earnings (loss) per share - Class A | 1.84 | 1.68 | (1.18 | ) | 0.27 | 1.19 | ||||||||||||||
Diluted earnings (loss) per share - Class A | 1.83 | 1.67 | (1.18 | ) | 0.26 | 1.16 | ||||||||||||||
Cash dividends per share - Class A | 0.60 | 0.58 | 0.57 | 0.56 | 0.55 | |||||||||||||||
Basic earnings (loss) per share - Class B | 1.65 | 1.51 | (1.09 | ) | 0.22 | 1.06 | ||||||||||||||
Diluted earnings (loss) per share - Class B | 1.65 | 1.51 | (1.09 | ) | 0.22 | 1.06 | ||||||||||||||
Cash dividends per share - Class B | 0.53 | 0.51 | 0.50 | 0.49 | 0.48 | |||||||||||||||
Balance Sheet Data at Year End | ||||||||||||||||||||
Total investments | $ | 1,221,201,784 | $ | 1,110,553,363 | $ | 1,030,798,566 | $ | 1,005,869,705 | $ | 945,519,655 | ||||||||||
Total assets | 2,160,520,324 | 1,923,161,131 | 1,832,078,267 | 1,737,919,778 | 1,623,131,037 | |||||||||||||||
Debt obligations | 90,000,000 | 40,000,000 | 65,000,000 | 64,000,000 | 74,000,000 | |||||||||||||||
Stockholders’ equity | 517,774,120 | 451,015,519 | 398,869,901 | 448,696,104 | 438,615,320 | |||||||||||||||
Book value per share | 17.13 | 15.67 | 14.05 | 15.95 | 16.21 | |||||||||||||||
Item 7. | Management’s Discussion and Analysis of Financial Condition and Results of Operations |
During
2020.
-38-
-39-
represented 2.7% of the December 31, 2018 net carried reserves and resulted primarily from lower-than-expected severity in the workers’ compensation line of business, partially offset by higher-than-expected severity in the commercial automobile and commercial multi-peril lines of business, for accident years prior to 2019. The majority of the 2019 development related to decreases in the liability for losses and loss expenses of prior years for Atlantic States and Michigan.MICO. The 2018 development represented 9.3% of the December 31, 2017 net carried reserves and resulted primarily from higher-than-expected severity in the commercial multi-peril,multi-
-40-
| 2019 | 2018 | |||||||
| (in thousands) | ||||||||
Commercial lines: | ||||||||
Automobile | $ | 126,224 | $ | 106,734 | ||||
Workers’ compensation | 109,060 | 109,512 | ||||||
Commercial multi-peril | 102,424 | 85,937 | ||||||
Other | 9,115 | 5,207 | ||||||
|
|
|
| |||||
Total commercial lines | 346,823 | 307,390 | ||||||
|
|
|
| |||||
Personal lines: | ||||||||
Automobile | 132,191 | 144,788 | ||||||
Homeowners | 23,494 | 18,374 | ||||||
Other | 4,398 | 4,846 | ||||||
|
|
|
| |||||
Total personal lines | 160,083 | 168,008 | ||||||
|
|
|
| |||||
Total commercial and personal lines | 506,906 | 475,398 | ||||||
Plus reinsurance recoverable | 362,768 | 339,267 | ||||||
|
|
|
| |||||
Total liability for losses and loss expenses | $ | 869,674 | $ | 814,665 | ||||
|
|
|
| |||||
2020 | 2019 | |||||||
| (in thousands) | ||||||||
Commercial lines: | ||||||||
Automobile | $ | 151,813 | $ | 126,224 | ||||
Workers’ compensation | 118,037 | 109,060 | ||||||
Commercial multi-peril | 126,299 | 102,424 | ||||||
Other | 13,212 | 9,115 | ||||||
Total commercial lines | 409,361 | 346,823 | ||||||
Personal lines: | ||||||||
Automobile | 120,861 | 132,191 | ||||||
Homeowners | 20,976 | 23,494 | ||||||
Other | 5,991 | 4,398 | ||||||
Total personal lines | 147,828 | 160,083 | ||||||
Total commercial and personal lines | 557,189 | 506,906 | ||||||
Plus reinsurance recoverable | 404,818 | 362,768 | ||||||
Total liability for losses and loss expenses | $ | 962,007 | $ | 869,674 | ||||
Change in Loss and Loss Expense Reserves Net of Reinsurance | Adjusted Loss and Loss Reinsurance at December 31, 2019 | Percentage Change in Equity at December 31, 2019(1) | Adjusted Loss and Loss Reinsurance at December 31, 2018 | Percentage Change in Equity at December 31, 2018(1) | ||||
| (dollars in thousands) | ||||||||
-10.0% | $456,215 | 8.9% | $427,858 | 9.4% | ||||
-7.5 | 468,888 | 6.7 | 439,743 | 7.1 | ||||
-5.0 | 481,561 | 4.4 | 451,628 | 4.7 | ||||
-2.5 | 494,233 | 2.2 | 463,513 | 2.4 | ||||
Base | 506,906 | — | 475,398 | — | ||||
2.5 | 519,579 | -2.2 | 487,283 | -2.4 | ||||
5.0 | 532,251 | -4.4 | 499,168 | -4.7 | ||||
7.5 | 544,924 | -6.7 | 511,053 | -7.1 | ||||
10.0 | 557,597 | -8.9 | 522,938 | -9.4 | ||||
Change in Loss and Loss Expense Reserves Net of Reinsurance | Adjusted Loss and Loss Expense Reserves Net of Reinsurance at December 31, 2020 | Percentage Change in Equity at December 31, 2020(1) | Adjusted Loss and Loss Expense Reserves Net of Reinsurance at December 31, 2019 | Percentage Change in Equity at December 31, 2019(1) | ||||||||||||
| (dollars in thousands) | ||||||||||||||||
-10.0% | $ | 501,470 | 8.5 | % | $ | 456,215 | 8.9 | % | ||||||||
-7.5 | 515,400 | 6.4 | 468,888 | 6.7 | ||||||||||||
-5.0 | 529,330 | 4.3 | 481,561 | 4.4 | ||||||||||||
-2.5 | 543,259 | 2.1 | 494,233 | 2.2 | ||||||||||||
Base | 557,189 | — | 506,906 | — | ||||||||||||
2.5 | 571,119 | -2.1 | 519,579 | -2.2 | ||||||||||||
5.0 | 585,048 | -4.3 | 532,251 | -4.4 | ||||||||||||
7.5 | 598,978 | -6.4 | 544,924 | -6.7 | ||||||||||||
10.0 | 612,908 | -8.5 | 557,597 | -8.9 | ||||||||||||
| (1) | Net of income tax effect. |
-41-
subsidiaries consistently apply actuarial loss reserving techniques and assumptions, which rely on historical information as adjusted to reflect current conditions, including consideration of recent case reserve activity. Our insurance subsidiaries use the most-likely numberpoint estimate their actuaries determine.Forselect.
| For the Year Ended December 31, | ||||||||
| (dollars in thousands) | 2019 | 2018 | ||||||
Number of claims pending, beginning of period | 2,902 | 2,906 | ||||||
Number of claims reported | 6,868 | 6,475 | ||||||
Number of claims settled or dismissed | 6,756 | 6,479 | ||||||
Number of claims pending, end of period | 3,014 | 2,902 | ||||||
Losses paid | $ | 42,043 | $ | 43,129 | ||||
Loss expenses paid | 8,885 | 9,226 | ||||||
-42-
For the Year Ended December 31, | ||||||||
| (dollars in thousands) | 2020 | 2019 | ||||||
Number of claims pending, beginning of period | 3,014 | 2,902 | ||||||
Number of claims reported | 5,935 | 6,868 | ||||||
Number of claims settled or dismissed | 6,051 | 6,756 | ||||||
Number of claims pending, end of period | 2,898 | 3,014 | ||||||
Losses paid | $ | 38,204 | $ | 42,043 | ||||
Loss expenses paid | 9,065 | 8,885 | ||||||
2019.
| Year Ended December 31, | ||||||||||||
| (in thousands) | 2019 | 2018 | 2017 | |||||||||
Net premiums written: | ||||||||||||
Commercial lines: | ||||||||||||
Automobile | $ | 122,142 | $ | 108,123 | $ | 99,333 | ||||||
Workers’ compensation | 113,684 | 109,022 | 109,884 | |||||||||
Commercial multi-peril | 138,750 | 117,509 | 110,313 | |||||||||
Other | 30,303 | 15,241 | 9,586 | |||||||||
|
|
|
|
|
| |||||||
Total commercial lines | 404,879 | 349,895 | 329,116 | |||||||||
|
|
|
|
|
| |||||||
Personal lines: | ||||||||||||
Automobile | 210,507 | 249,275 | 255,297 | |||||||||
Homeowners | 117,118 | 123,782 | 125,054 | |||||||||
Other | 20,097 | 21,064 | 19,672 | |||||||||
|
|
|
|
|
| |||||||
Total personal lines | 347,722 | 394,121 | 400,023 | |||||||||
|
|
|
|
|
| |||||||
Total net premiums written | $ | 752,601 | $ | 744,016 | $ | 729,139 | ||||||
|
|
|
|
|
| |||||||
Components of combined ratio: | ||||||||||||
Loss ratio | 67.0 | % | 77.8 | % | 69.4 | % | ||||||
Expense ratio | 31.3 | 31.6 | 32.9 | |||||||||
Dividend ratio | 1.2 | 0.7 | 0.7 | |||||||||
|
|
|
|
|
| |||||||
Combined ratio | 99.5 | % | 110.1 | % | 103.0 | % | ||||||
|
|
|
|
|
| |||||||
Revenues: | ||||||||||||
Premiums earned: | ||||||||||||
Commercial lines | $ | 385,465 | $ | 337,924 | $ | 318,391 | ||||||
Personal lines | 370,613 | 403,367 | 384,124 | |||||||||
|
|
|
|
|
| |||||||
Total premiums earned | 756,078 | 741,291 | 702,515 | |||||||||
Net investment income | 29,515 | 26,908 | 23,527 | |||||||||
Investment gains (losses) | 21,985 | (4,802 | ) | 5,705 | ||||||||
Equity in earnings of DFSC | 295 | 2,694 | 1,622 | |||||||||
Other | 4,578 | 5,737 | 5,658 | |||||||||
|
|
|
|
|
| |||||||
Total revenues | $ | 812,451 | $ | 771,828 | $ | 739,027 | ||||||
|
|
|
|
|
| |||||||
-43-
Year Ended December 31, | ||||||||||||
| (in thousands) | 2020 | 2019 | 2018 | |||||||||
Net premiums written: | ||||||||||||
Commercial lines: | ||||||||||||
Automobile | $ | 135,294 | $ | 122,142 | $ | 108,123 | ||||||
Workers’ compensation | 109,960 | 113,684 | 109,022 | |||||||||
Commercial multi-peril | 147,993 | 138,750 | 117,509 | |||||||||
Other | 32,739 | 30,303 | 15,241 | |||||||||
Total commercial lines | 425,986 | 404,879 | 349,895 | |||||||||
Personal lines: | ||||||||||||
Automobile | 184,602 | 210,507 | 249,275 | |||||||||
Homeowners | 111,886 | 117,118 | 123,782 | |||||||||
Other | 19,666 | 20,097 | 21,064 | |||||||||
Total personal lines | 316,154 | 347,722 | 394,121 | |||||||||
Total net premiums written | $ | 742,140 | $ | 752,601 | $ | 744,016 | ||||||
Components of combined ratio: | ||||||||||||
Loss ratio | 62.0 | % | 67.0 | % | 77.8 | % | ||||||
Expense ratio | 33.0 | 31.3 | 31.6 | |||||||||
Dividend ratio | 1.0 | 1.2 | 0.7 | |||||||||
Combined ratio | 96.0 | % | 99.5 | % | 110.1 | % | ||||||
Revenues: | ||||||||||||
Net premiums earned: | ||||||||||||
Commercial lines | $ | 412,877 | $ | 385,465 | $ | 337,924 | ||||||
Personal lines | 329,163 | 370,613 | 403,367 | |||||||||
Total net premiums earned | 742,040 | 756,078 | 741,291 | |||||||||
Net investment income | 29,504 | 29,515 | 26,908 | |||||||||
Investment gains (losses) | 2,778 | 21,985 | (4,802 | ) | ||||||||
Equity in earnings of DFSC | — | 295 | 2,694 | |||||||||
Other | 3,497 | 4,578 | 5,737 | |||||||||
Total revenues | $ | 777,819 | $ | 812,451 | $ | 771,828 | ||||||
| Year Ended December 31, | ||||||||||||
| (in thousands) | 2019 | 2018 | 2017 | |||||||||
Components of net income: | ||||||||||||
Underwriting income (loss): | ||||||||||||
Commercial lines | $ | 8,404 | $ | (22,059 | ) | $ | 13,263 | |||||
Personal lines | (1,617 | ) | (53,590 | ) | (39,042 | ) | ||||||
|
|
|
|
|
| |||||||
SAP underwriting income (loss) | 6,787 | (75,649 | ) | (25,779 | ) | |||||||
GAAP adjustments | (3,079 | ) | 894 | 4,408 | ||||||||
|
|
|
|
|
| |||||||
GAAP underwriting income (loss) | 3,708 | (74,755 | ) | (21,371 | ) | |||||||
Net investment income | 29,515 | 26,908 | 23,527 | |||||||||
Investment gains (losses) | 21,985 | (4,802 | ) | 5,705 | ||||||||
Equity in earnings of DFSC | 295 | 2,694 | 1,622 | |||||||||
Other | 1,578 | 1,718 | 2,631 | |||||||||
|
|
|
|
|
| |||||||
Income (loss) before income tax expense (benefit) | 57,081 | (48,237 | ) | 12,114 | ||||||||
Income tax expense (benefit) | 9,929 | (15,477 | ) | 4,998 | ||||||||
|
|
|
|
|
| |||||||
Net income (loss) | $ | 47,152 | $ | (32,760 | ) | $ | 7,116 | |||||
|
|
|
|
|
| |||||||
Year Ended December 31, | ||||||||||||
| (in thousands) | 2020 | 2019 | 2018 | |||||||||
Components of net income (loss): | ||||||||||||
Underwriting income (loss): | ||||||||||||
Commercial lines | $ | (858 | ) | $ | 8,404 | $ | (22,059 | ) | ||||
Personal lines | 31,764 | (1,617 | ) | (53,590 | ) | |||||||
SAP underwriting income (loss) | 30,906 | 6,787 | (75,649 | ) | ||||||||
GAAP adjustments | (959 | ) | (3,079 | ) | 894 | |||||||
GAAP underwriting income (loss) | 29,947 | 3,708 | (74,755 | ) | ||||||||
Net investment income | 29,504 | 29,515 | 26,908 | |||||||||
Investment gains (losses) | 2,778 | 21,985 | (4,802 | ) | ||||||||
Equity in earnings of DFSC | — | 295 | 2,694 | |||||||||
Other | 1,043 | 1,578 | 1,718 | |||||||||
Income (loss) before income tax expense (benefit) | 63,272 | 57,081 | (48,237 | ) | ||||||||
Income tax expense (benefit) | 10,457 | 9,929 | (15,477 | ) | ||||||||
Net income (loss) | $ | 52,815 | $ | 47,152 | $ | (32,760 | ) | |||||
| Year Ended December 31, | ||||||||||||
| 2019 | 2018 | 2017 | ||||||||||
Net premiums earned | $ | 756,078,400 | $ | 741,290,873 | $ | 702,514,755 | ||||||
Change in net unearned premiums | (3,477,111 | ) | 2,724,931 | 26,624,163 | ||||||||
|
|
|
|
|
| |||||||
Net premiums written | $ | 752,601,289 | $ | 744,015,804 | $ | 729,138,918 | ||||||
|
|
|
|
|
| |||||||
2018:
Year Ended December 31, | ||||||||||||
2020 | 2019 | 2018 | ||||||||||
Net premiums earned | $ | 742,040,339 | $ | 756,078,400 | $ | 741,290,873 | ||||||
Change in net unearned premiums | 99,554 | (3,477,111 | ) | 2,724,931 | ||||||||
Net premiums written | $ | 742,139,893 | $ | 752,601,289 | $ | 744,015,804 | ||||||
-44-
| Year Ended December 31, | ||||||||||||
| 2019 | 2018 | 2017 | ||||||||||
GAAP Combined Ratios (Total Lines) | ||||||||||||
Loss ratio(non-weather) | 60.9 | % | 69.0 | % | 61.1 | % | ||||||
Loss ratio (weather-related) | 6.1 | 8.8 | 8.3 | |||||||||
Expense ratio | 31.3 | 31.6 | 32.9 | |||||||||
Dividend ratio | 1.2 | 0.7 | 0.7 | |||||||||
|
|
|
|
|
| |||||||
Combined ratio | 99.5 | % | 110.1 | % | 103.0 | % | ||||||
|
|
|
|
|
| |||||||
Statutory Combined Ratios | ||||||||||||
Commercial lines: | ||||||||||||
Automobile | 117.4 | % | 133.3 | % | 115.0 | % | ||||||
Workers’ compensation | 78.5 | 86.6 | 79.0 | |||||||||
Commercial multi-peril | 93.7 | 98.1 | 96.7 | |||||||||
Other | 72.6 | 54.6 | 10.2 | |||||||||
Total commercial lines | 95.0 | 103.8 | 93.6 | |||||||||
Personal lines: | ||||||||||||
Automobile | 105.7 | 117.4 | 109.3 | |||||||||
Homeowners | 101.2 | 110.5 | 109.9 | |||||||||
Other | 73.2 | 96.4 | 90.8 | |||||||||
Total personal lines | 102.6 | 114.1 | 108.5 | |||||||||
Total commercial and personal lines | 98.7 | 109.4 | 101.7 | |||||||||
-45-
Year Ended December 31, | ||||||||||||
2020 | 2019 | 2018 | ||||||||||
GAAP Combined Ratios (Total Lines) | ||||||||||||
Loss ratio (non-weather) | 55.1 | % | 60.9 | % | 69.0 | % | ||||||
Loss ratio (weather-related) | 6.9 | 6.1 | 8.8 | |||||||||
Expense ratio | 33.0 | 31.3 | 31.6 | |||||||||
Dividend ratio | 1.0 | 1.2 | 0.7 | |||||||||
Combined ratio | 96.0 | % | 99.5 | % | 110.1 | % | ||||||
Statutory Combined Ratios | ||||||||||||
Commercial lines: | ||||||||||||
Automobile | 112.7 | % | 117.4 | % | 133.3 | % | ||||||
Workers’ compensation | 86.3 | 78.5 | 86.6 | |||||||||
Commercial multi-peril | 98.4 | 93.7 | 98.1 | |||||||||
Other | 74.0 | 72.6 | 54.6 | |||||||||
Total commercial lines | 97.8 | 95.0 | 103.8 | |||||||||
Personal lines: | ||||||||||||
Automobile | 91.3 | 105.7 | 117.4 | |||||||||
Homeowners | 97.2 | 101.2 | 110.5 | |||||||||
Other | 74.9 | 73.2 | 96.4 | |||||||||
Total personal lines | 92.4 | 102.6 | 114.1 | |||||||||
Total commercial and personal lines | 95.4 | 98.7 | 109.4 | |||||||||
-46-
YEAR ENDED DECEMBER 31, 2018 COMPARED TO YEAR ENDED DECEMBER 31, 2017
Net Premiums Earned
Our insurance subsidiaries’ net premiums earned increased to $741.3 million for 2018, an increase of $38.8 million, or 5.5%, over 2017, reflecting increases in net premiums written during 2017 and 2018. Our insurance subsidiaries earn premiums and recognize them as income over the terms of the policies they issue. Such terms are generally one year or less in duration. Therefore, increases or decreases in net premiums earned generally reflect increases or decreases in net premiums written in the preceding twelve-month period compared to the same period one year earlier.
Net Premiums Written
Our insurance subsidiaries’ 2018 net premiums written increased 2.0% to $744.0 million, compared to $729.1 million for 2017. We attribute the increase primarily to the impact of premium rate increases and an increase in the writing of new accounts in commercial lines of business. Commercial lines net premiums written increased $20.8 million, or 6.3%, for 2018 compared to 2017. Personal lines net premiums written decreased $5.9 million, or 1.5%, for 2018 compared to 2017. We attribute the decrease in personal lines primarily to net attrition that resulted from increased pricing on renewal policies and underwriting measures our insurance subsidiaries implemented to slow new policy growth.
-47-
Investment Income
For 2018, our net investment income increased to $26.9 million, an increase of $3.4 million, or 14.4%, over 2017. We attribute the increase primarily to an increase in average invested assets.
Net Investment (Losses) Gains
Our net investment (losses) gains in 2018 and 2017 were ($4.8 million) and $5.7 million, respectively. The net investment losses for 2018 were primarily related to a decrease in the market value of the equity securities we held at December 31, 2018. We adopted new accounting guidance effective January 1, 2018 that requires us to measure equity investments at fair value and recognize changes in fair value in our results of operations. The net investment gains for 2017 resulted primarily from strategic sales of equity securities within our investment portfolio and unrealized gains within a limited partnership that invests in equity securities. We did not recognize any impairment losses during 2018 or 2017.
Equity in Earnings of DFSC
Our equity in the earnings of DFSC in 2018 and 2017 was $2.7 million and $1.6 million, respectively. We attribute the increase in DFSC’s earnings primarily to higher net interest income related to loan portfolio growth that DFSC achieved during 2018.
Losses and Loss Expenses
Our insurance subsidiaries’ loss ratio, which is the ratio of incurred losses and loss expenses to premiums earned, was 77.8% in 2018, compared to 69.4% in 2017. Our insurance subsidiaries’ commercial lines loss ratio increased to 72.9% in 2018, compared to 62.0% in 2017. This increase resulted primarily from the commercial automobile loss ratio increasing to 101.9% in 2018, compared to 80.3% in 2017, and the commercial multi-peril loss ratio increasing to 67.0% in 2018, compared to 64.6% in 2017. The personal lines loss ratio was 81.8% in 2018 compared to 75.5% in 2017. Our insurance subsidiaries experienced unfavorable loss reserve development of approximately $35.6 million during 2018 in their reserves for prior accident years, compared to approximately $6.6 million during 2017. The unfavorable loss reserve development resulted primarily from higher-than-expected severity in the commercial multi-peril, personal automobile and commercial automobile lines of business, offset by lower-than-expected severity in the workers’ compensation line of business.
Underwriting Expenses
Our insurance subsidiaries’ expense ratio, which is the ratio of policy acquisition and other underwriting expenses to premiums earned, was 31.6% in 2018, compared to 32.9% in 2017. We attribute the decrease to lower underwriting-based incentive compensation in 2018.
Combined Ratio
Our insurance subsidiaries’ combined ratio was 110.1% and 103.0% in 2018 and 2017, respectively. The combined ratio represents the sum of the loss ratio, the expense ratio and the dividend ratio, which is the ratio of workers’ compensation policy dividends incurred to premiums earned. We attribute the increase in our combined ratio primarily to the increase in our loss ratio.
Interest Expense
Our interest expense in 2018 increased to $2.3 million, compared to $1.6 million in 2017. We attribute the increase to higher interest rates in effect during 2018 compared to 2017.
Income Taxes
Our income tax benefit was $15.5 million in 2018, compared to income tax expense of $5.0 million in 2017. Our 2018 income tax benefit reflected our anticipation of an estimated carryback of our taxable loss in 2018 to prior tax years. Our 2017 income tax expense reflected additional tax expense of $4.8 million in 2017 related to the revaluation of our net deferred tax assets pursuant to the Tax Cuts and Jobs Act (the “TCJA”).
-48-
Net (Loss) Income and (Loss) Earnings Per Share
Our net loss in 2018 was $32.8 million, or $1.18 per share of Class A common stock and $1.09 per share of Class B common stock, compared to net income of $7.1 million, or $0.26 per share of Class A common stock on a diluted basis and $0.22 per share of Class B common stock, in 2017. We had 22.8 million and 22.6 million Class A shares outstanding at December 31, 2018 and 2017, respectively. We had 5.6 million Class B shares outstanding for both periods. There are no outstanding securities that dilute our shares of Class B common stock.
Book Value Per Share
Our stockholders’ equity decreased by $49.8 million in 2018 as a result of our net loss, net unrealized losses within ouravailable-for-sale fixed maturity investments and dividends we declared to our stockholders during the year. Our book value per share decreased to $14.05 at December 31, 2018, compared to $15.95 a year earlier.
-49-
| (in thousands) | Total | Less than 1 year | 1-3 years | 4-5 years | After 5 years | |||||||||||||||
Net liability for unpaid losses and loss expenses of our insurance subsidiaries | $ | 506,906 | $ | 231,924 | $ | 237,195 | $ | 18,976 | $ | 18,811 | ||||||||||
Subordinated debentures | 5,000 | — | — | — | 5,000 | |||||||||||||||
Borrowings under lines of credit | 35,000 | — | — | 35,000 | — | |||||||||||||||
|
|
|
|
|
|
|
|
|
| |||||||||||
Total contractual obligations | $ | 546,906 | $ | 231,924 | $ | 237,195 | $ | 53,976 | $ | 23,811 | ||||||||||
|
|
|
|
|
|
|
|
|
| |||||||||||
2020:
| (in thousands) | Total | Less than 1 year | 1-3 years | 4-5 years | After 5 years | |||||||||||||||
Net liability for unpaid losses and loss expenses of our insurance subsidiaries | $ | 557,189 | $ | 256,165 | $ | 260,460 | $ | 20,237 | $ | 20,327 | ||||||||||
Subordinated debentures | 5,000 | — | — | — | 5,000 | |||||||||||||||
Borrowings under lines of credit | 85,000 | 50,000 | — | 35,000 | — | |||||||||||||||
Total contractual obligations | $ | 647,189 | $ | 306,165 | $ | 260,460 | $ | 55,237 | $ | 25,327 | ||||||||||
-50-
| December 31, | ||||||||||||||||
| 2019 | 2018 | |||||||||||||||
| (dollars in thousands) | Amount | Percent of Total | Amount | Percent of Total | ||||||||||||
Fixed maturities: | ||||||||||||||||
Total held to maturity | $ | 476,094 | 42.9 | % | $ | 402,799 | 39.1 | % | ||||||||
Total available for sale | 564,952 | 50.8 | 526,558 | 51.1 | ||||||||||||
|
|
|
|
|
|
|
| |||||||||
Total fixed maturities | 1,041,046 | 93.7 | 929,357 | 90.2 | ||||||||||||
Equity securities | 55,477 | 5.0 | 43,667 | 4.2 | ||||||||||||
Investment in affiliate | — | — | 41,026 | 4.0 | ||||||||||||
Short-term investments | 14,030 | 1.3 | 16,749 | 1.6 | ||||||||||||
|
|
|
|
|
|
|
| |||||||||
Total investments | $ | 1,110,553 | 100.0 | % | $ | 1,030,799 | 100.0 | % | ||||||||
|
|
|
|
|
|
|
| |||||||||
December 31, | ||||||||||||||||
2020 | 2019 | |||||||||||||||
| (dollars in thousands) | Amount | Percent of Total | Amount | Percent of Total | ||||||||||||
Fixed maturities: | ||||||||||||||||
Total held to maturity | $ | 586,609 | 48.0 | % | $ | 476,094 | 42.9 | % | ||||||||
Total available for sale | 555,136 | 45.5 | 564,952 | 50.8 | ||||||||||||
Total fixed maturities | 1,141,745 | 93.5 | 1,041,046 | 93.7 | ||||||||||||
Equity securities | 58,556 | 4.8 | 55,477 | 5.0 | ||||||||||||
Short-term investments | 20,901 | 1.7 | 14,030 | 1.3 | ||||||||||||
Total investments | $ | 1,221,202 | 100.0 | % | $ | 1,110,553 | 100.0 | % | ||||||||
2019.
2019.
In January 2016, the FASB issued guidance that generally requires entities to measure equity investments at fair value and recognize changes in fair value in their results of operations. This guidance also simplifies the impairment assessment of equity investments without readily determinable fair values by requiring entities to perform a qualitative assessment to identify impairment. The FASB issued other disclosure and presentation improvements related to financial instruments within the guidance. The guidance was effective for annual and interim reporting periods beginning after December 15, 2017. As a result of the adoption of this guidance on January 1, 2018, we transferred $4.9 million of net unrealized gains from accumulated other comprehensive income (“AOCI”) to retained earnings. We recognized $8.9 million of unrealized gains and $25,751 of unrealized losses on equity securities held at December 31, 2019 in net investment gains for 2019. We recognized $1.2 million of unrealized gains and $4.4 million of unrealized losses on equity securities held at December 31, 2018 in net investment losses for 2018.
-51-
Item 7A. | Quantitative and Qualitative Disclosures About Market Risk. |
-52-
| (in thousands) | Principal Cash Flows | Weighted- Average Interest Rate | ||||||
Fixed-maturity and short-term investments: | ||||||||
2020 | $ | 43,644 | 2.40 | % | ||||
2021 | 38,710 | 3.42 | ||||||
2022 | 37,547 | 3.06 | ||||||
2023 | 46,126 | 2.87 | ||||||
2024 | 53,971 | 3.71 | ||||||
Thereafter | 821,889 | 3.47 | ||||||
|
| |||||||
Total | $ | 1,041,887 | ||||||
|
| |||||||
Fair value | $ | 1,079,296 | ||||||
|
| |||||||
Debt: | ||||||||
2024 | $ | 35,000 | 1.74 | % | ||||
Thereafter | 5,000 | 5.00 | ||||||
|
| |||||||
Total | $ | 40,000 | ||||||
|
| |||||||
Fair value | $ | 40,000 | ||||||
|
| |||||||
| (in thousands) | Principal Cash Flows | Weighted- Average Interest Rate | ||||||
Fixed-maturity and short-term investments: | ||||||||
2021 | $ | 97,539 | 1.83 | % | ||||
2022 | 41,382 | 3.15 | ||||||
2023 | 44,923 | 3.22 | ||||||
2024 | 52,046 | 3.58 | ||||||
2025 | 60,038 | 3.53 | ||||||
Thereafter | 839,306 | 3.28 | ||||||
Total | $ | 1,135,234 | ||||||
Fair value | $ | 1,208,677 | ||||||
Debt: | ||||||||
2021 | $ | 50,000 | 0.83 | % | ||||
2024 | 35,000 | 1.74 | % | |||||
Thereafter | 5,000 | 5.00 | ||||||
Total | $ | 90,000 | ||||||
Fair value | $ | 90,000 | ||||||
-53-
| December 31, | ||||||||
| 2019 | 2018 | |||||||
Assets | ||||||||
Investments | ||||||||
Fixed maturities | ||||||||
Held to maturity, at amortized cost (fair value $500,314,344 and $405,038,296) | $ | 476,093,782 | $ | 402,798,518 | ||||
Available for sale, at fair value (amortized cost $556,839,278 and $535,112,451) | 564,951,803 | 526,558,304 | ||||||
Equity securities, at fair value | 55,477,556 | 43,667,009 | ||||||
Investment in Donegal Financial Services Corporation | — | 41,025,975 | ||||||
Short-term investments, at cost, which approximates fair value | 14,030,222 | 16,748,760 | ||||||
|
|
|
| |||||
Total investments | 1,110,553,363 | 1,030,798,566 | ||||||
Cash | 49,318,930 | 52,594,461 | ||||||
Accrued investment income | 7,066,029 | 6,561,199 | ||||||
Premiums receivable | 165,732,949 | 156,702,250 | ||||||
Reinsurance receivable | 367,021,468 | 343,369,065 | ||||||
Deferred policy acquisition costs | 59,284,859 | 60,615,127 | ||||||
Deferred tax asset, net | 8,514,311 | 13,069,755 | ||||||
Prepaid reinsurance premiums | 142,475,767 | 135,379,777 | ||||||
Property and equipment, net | 4,558,072 | 4,690,704 | ||||||
Accounts receivable - securities | 4,961 | 261,829 | ||||||
Federal income taxes recoverable | — | 19,032,604 | ||||||
Goodwill | 5,625,354 | 5,625,354 | ||||||
Other intangible assets | 958,010 | 958,010 | ||||||
Other | 2,047,058 | 2,419,566 | ||||||
|
|
|
| |||||
Total assets | $ | 1,923,161,131 | $ | 1,832,078,267 | ||||
|
|
|
| |||||
Liabilities and Stockholders’ Equity | ||||||||
Liabilities | ||||||||
Losses and loss expenses | $ | 869,673,849 | $ | 814,665,224 | ||||
Unearned premiums | 510,147,485 | 506,528,606 | ||||||
Accrued expenses | 28,453,744 | 25,442,146 | ||||||
Reinsurance balances payable | 2,116,084 | 3,882,193 | ||||||
Borrowings under lines of credit | 35,000,000 | 60,000,000 | ||||||
Cash dividends declared to stockholders | 4,075,234 | 3,948,484 | ||||||
Subordinated debentures | 5,000,000 | 5,000,000 | ||||||
Accounts payable - securities | 1,119 | 1,003,810 | ||||||
Income taxes payable | 84,831 | — | ||||||
Due to affiliate | 10,069,171 | 10,874,540 | ||||||
Other | 7,524,095 | 1,863,363 | ||||||
|
|
|
| |||||
Total liabilities | 1,472,145,612 | 1,433,208,366 | ||||||
|
|
|
| |||||
Stockholders’ Equity | ||||||||
Preferred stock, $.01 par value, authorized 2,000,000 shares; none issued | — | — | ||||||
Class A common stock, $.01 par value, authorized 50,000,000 shares, issued 26,203,935 and 25,819,341 shares and outstanding 23,201,347 and 22,816,753 shares | 262,040 | 258,194 | ||||||
Class B common stock, $.01 par value, authorized 10,000,000 shares, issued 5,649,240 shares and outstanding 5,576,775 shares | 56,492 | 56,492 | ||||||
Additionalpaid-in capital | 268,151,601 | 261,258,423 | ||||||
Accumulated other comprehensive income (loss) | 504,170 | (14,228,059 | ) | |||||
Retained earnings | 223,267,573 | 192,751,208 | ||||||
Treasury stock, at cost | (41,226,357 | ) | (41,226,357 | ) | ||||
|
|
|
| |||||
Total stockholders’ equity | 451,015,519 | 398,869,901 | ||||||
|
|
|
| |||||
Total liabilities and stockholders’ equity | $ | 1,923,161,131 | $ | 1,832,078,267 | ||||
|
|
|
| |||||
December 31, | ||||||||
2020 | 2019 | |||||||
Assets | ||||||||
Investments | ||||||||
Fixed maturities | ||||||||
Held to maturity, at amortized cost (fair value $632,640,821 and $500,314,344) | $ | 586,609,439 | $ | 476,093,782 | ||||
Available for sale, at fair value (amortized cost $534,958,100 and $556,839,278) | 555,136,017 | 564,951,803 | ||||||
Equity securities, at fair value | 58,556,173 | 55,477,556 | ||||||
Short-term investments, at cost, which approximates fair value | 20,900,155 | 14,030,222 | ||||||
Total investments | 1,221,201,784 | 1,110,553,363 | ||||||
Cash | 103,094,236 | 49,318,930 | ||||||
Accrued investment income | 7,936,879 | 7,066,029 | ||||||
Premiums receivable | 169,596,332 | 165,732,949 | ||||||
Reinsurance receivable | 408,908,850 | 367,021,468 | ||||||
Deferred policy acquisition costs | 59,156,958 | 59,284,859 | ||||||
Deferred tax asset, net | 5,683,113 | 8,514,311 | ||||||
Prepaid reinsurance premiums | 169,418,333 | 142,475,767 | ||||||
Property and equipment, net | 4,390,377 | 4,558,072 | ||||||
| Accounts receivable - securities | 67,676 | 4,961 | ||||||
Federal income taxes recoverable | 3,089,369 | — | ||||||
Goodwill | 5,625,354 | 5,625,354 | ||||||
Other intangible assets | 958,010 | 958,010 | ||||||
Other | 1,393,053 | 2,047,058 | ||||||
Total assets | $ | 2,160,520,324 | $ | 1,923,161,131 | ||||
Liabilities and Stockholders’ Equity | ||||||||
Liabilities | ||||||||
Losses and loss expenses | $ | 962,007,437 | $ | 869,673,849 | ||||
Unearned premiums | 537,189,598 | 510,147,485 | ||||||
Accrued expenses | 29,115,198 | 28,453,744 | ||||||
Reinsurance balances payable | 3,233,523 | 2,116,084 | ||||||
Borrowings under lines of credit | 85,000,000 | 35,000,000 | ||||||
Cash dividends declared to stockholders | 4,436,301 | 4,075,234 | ||||||
Subordinated debentures | 5,000,000 | 5,000,000 | ||||||
| Accounts payable - securities | 0— | 1,119 | ||||||
Income taxes payable | 0— | 84,831 | ||||||
Due to affiliate | 10,293,495 | 10,069,171 | ||||||
Other | 6,470,652 | 7,524,095 | ||||||
Total liabilities | 1,642,746,204 | 1,472,145,612 | ||||||
Stockholders’ Equity | ||||||||
Preferred stock, $.01 par value, authorized 2,000,000 shares; 0ne issued | 0— | 0— | ||||||
Class A common stock, $.01 par value, authorized 50,000,000 shares, issued 27,651,774 and 26,203,935 shares and outstanding 24,649,186 and 23,201,347 shares | 276,518 | 262,040 | ||||||
Class B common stock, $.01 par value, authorized 10,000,000 shares, issued 5,649,240 shares and outstanding 5,576,775 shares | 56,492 | 56,492 | ||||||
Additional paid-in capital | 289,149,567 | 268,151,601 | ||||||
Accumulated other comprehensive income | 11,130,612 | 504,170 | ||||||
Retained earnings | 258,387,288 | 223,267,573 | ||||||
Treasury stock, at cost | (41,226,357 | ) | (41,226,357 | ) | ||||
Total stockholders’ equity | 517,774,120 | 451,015,519 | ||||||
Total liabilities and stockholders’ equity | $ | 2,160,520,324 | $ | 1,923,161,131 | ||||
-55-
| Years Ended December 31, | ||||||||||||
| 2019 | 2018 | 2017 | ||||||||||
Statements of Income (Loss) | ||||||||||||
Revenues | ||||||||||||
Net premiums earned (includes affiliated reinsurance of $203,409,131, $198,580,547 and $190,924,704 - see note 3) | $ | 756,078,400 | $ | 741,290,873 | $ | 702,514,755 | ||||||
Investment income, net of investment expenses | 29,514,955 | 26,907,656 | 23,527,304 | |||||||||
Installment payment fees | 4,134,749 | 5,256,721 | 5,157,163 | |||||||||
Lease income | 443,750 | 480,617 | 500,455 | |||||||||
Net investment gains (losses) (includes $147,236, ($499,244) and $5,705,255 accumulated other comprehensive income reclassification) | 21,984,617 | (4,801,509 | ) | 5,705,255 | ||||||||
Equity in earnings of Donegal Financial Services Corporation | 295,000 | 2,693,962 | 1,621,605 | |||||||||
|
|
|
|
|
| |||||||
Total revenues | 812,451,471 | 771,828,320 | 739,026,537 | |||||||||
|
|
|
|
|
| |||||||
Expenses | ||||||||||||
Net losses and loss expenses (includes affiliated reinsurance of $103,218,679, $140,113,591 and $114,865,113 - see note 3) | 506,387,664 | 576,458,420 | 487,268,054 | |||||||||
Amortization of deferred policy acquisition costs | 122,443,000 | 120,964,000 | 115,065,000 | |||||||||
Other underwriting expenses | 114,561,741 | 113,270,131 | 116,538,431 | |||||||||
Policyholder dividends | 8,978,406 | 5,353,023 | 5,014,624 | |||||||||
Interest | 1,579,299 | 2,302,082 | 1,593,437 | |||||||||
Other, net | 1,420,331 | 1,717,513 | 1,432,529 | |||||||||
|
|
|
|
|
| |||||||
Total expenses | 755,370,441 | 820,065,169 | 726,912,075 | |||||||||
|
|
|
|
|
| |||||||
Income (loss) before income tax expense (benefit) | 57,081,030 | (48,236,849 | ) | 12,114,462 | ||||||||
Income tax expense (benefit) (includes $30,920, ($104,841) and $1,939,787 income tax expense (benefit) from reclassification items) | 9,929,286 | (15,476,509 | ) | 4,998,362 | ||||||||
|
|
|
|
|
| |||||||
Net income (loss) | $ | 47,151,744 | $ | (32,760,340 | ) | $ | 7,116,100 | |||||
|
|
|
|
|
| |||||||
Basic earnings (loss) per common share: | ||||||||||||
Class A common stock | $ | 1.68 | $ | (1.18 | ) | $ | 0.27 | |||||
|
|
|
|
|
| |||||||
Class B common stock | $ | 1.51 | $ | (1.09 | ) | $ | 0.22 | |||||
|
|
|
|
|
| |||||||
Diluted earnings (loss) per common share: | ||||||||||||
Class A common stock | $ | 1.67 | $ | (1.18 | ) | $ | 0.26 | |||||
|
|
|
|
|
| |||||||
Class B common stock | $ | 1.51 | $ | (1.09 | ) | $ | 0.22 | |||||
|
|
|
|
|
| |||||||
Statements of Comprehensive Income (Loss) | ||||||||||||
Net income (loss) | $ | 47,151,744 | $ | (32,760,340 | ) | $ | 7,116,100 | |||||
|
|
|
|
|
| |||||||
Other comprehensive income (loss), net of tax | ||||||||||||
Unrealized gain (loss) on securities: | ||||||||||||
Unrealized holding gain (loss) arising during the period, net of income tax expense (benefit) of $3,947,082, ($1,865,948) and $1,964,385 | 14,848,545 | (7,019,532 | ) | 3,811,151 | ||||||||
Reclassification adjustment for (gains) losses included in net income (loss), net of income tax expense (benefit) of $30,920, ($104,841) and $1,939,787 | (116,316 | ) | 394,403 | (3,765,468 | ) | |||||||
|
|
|
|
|
| |||||||
Other comprehensive income (loss) | 14,732,229 | (6,625,129 | ) | 45,683 | ||||||||
|
|
|
|
|
| |||||||
Comprehensive income (loss) | $ | 61,883,973 | $ | (39,385,469 | ) | $ | 7,161,783 | |||||
|
|
|
|
|
| |||||||
Years Ended December 31, | ||||||||||||
2020 | 2019 | 2018 | ||||||||||
Statements of Income (Loss) | ||||||||||||
Revenues | ||||||||||||
Net premiums earned (includes affiliated reinsurance of $192,861,276, $203,409,131 and $198,580,547 - see note 3) | $ | 742,040,339 | $ | 756,078,400 | $ | 741,290,873 | ||||||
Investment income, net of investment expenses | 29,504,466 | 29,514,955 | 26,907,656 | |||||||||
Installment payment fees | 3,063,097 | 4,134,749 | 5,256,721 | |||||||||
Lease income | 434,089 | 443,750 | 480,617 | |||||||||
Net investment gains (losses) (includes $572,106, $147,236 and ($499,244) accumulated other comprehensive income reclassification) | 2,777,919 | 21,984,617 | (4,801,509 | ) | ||||||||
Equity in earnings of Donegal Financial Services Corporation | — | 295,000 | 2,693,962 | |||||||||
Total revenues | 777,819,910 | 812,451,471 | 771,828,320 | |||||||||
Expenses | ||||||||||||
Net losses and loss expenses (includes affiliated reinsurance of $87,374,791, $103,218,679 and $140,113,591 - see note 3) | 459,764,293 | 506,387,664 | 576,458,420 | |||||||||
Amortization of deferred policy acquisition costs | 119,072,000 | 122,443,000 | 120,964,000 | |||||||||
Other underwriting expenses | 125,862,651 | 114,561,741 | 113,270,131 | |||||||||
Policyholder dividends | 7,394,310 | 8,978,406 | 5,353,023 | |||||||||
Interest | 1,196,406 | 1,579,299 | 2,302,082 | |||||||||
Other, net | 1,257,747 | 1,420,331 | 1,717,513 | |||||||||
Total expenses | 714,547,407 | 755,370,441 | 820,065,169 | |||||||||
Income (loss) before income tax expense (benefit) | 63,272,503 | 57,081,030 | (48,236,849 | ) | ||||||||
Income tax expense (benefit) (includes $120,142, $30,920 and ($104,841) income tax expense (benefit) from reclassification items) | 10,457,251 | 9,929,286 | (15,476,509 | ) | ||||||||
Net income (loss) | $ | 52,815,252 | $ | 47,151,744 | $ | (32,760,340 | ) | |||||
Basic earnings (loss) per common share: | ||||||||||||
Class A common stock | $ | 1.84 | $ | 1.68 | $ | (1.18 | ) | |||||
Class B common stock | $ | 1.65 | $ | 1.51 | $ | (1.09 | ) | |||||
Diluted earnings (loss) per common share: | ||||||||||||
Class A common stock | $ | 1.83 | $ | 1.67 | $ | (1.18 | ) | |||||
Class B common stock | $ | 1.65 | $ | 1.51 | $ | (1.09 | ) | |||||
Statements of Comprehensive Income (Loss) | ||||||||||||
Net income (loss) | $ | 52,815,252 | $ | 47,151,744 | $ | (32,760,340 | ) | |||||
Other comprehensive income (loss), net of tax | ||||||||||||
Unrealized gain (loss) on securities: | ||||||||||||
Unrealized holding gain (loss) arising during the period, net of income tax expense (benefit) of $2,944,892, $3,947,082 and ($1,865,948) | 11,078,406 | 14,848,545 | (7,019,532 | ) | ||||||||
Reclassification adjustment for (gains) losses included in net income (loss), net of income tax expense (benefit) of $120,142, $30,920 and ($104,841) | (451,964 | ) | (116,316 | ) | 394,403 | |||||||
Other comprehensive income (loss) | 10,626,442 | 14,732,229 | (6,625,129 | ) | ||||||||
Comprehensive income (loss) | $ | 63,441,694 | $ | 61,883,973 | $ | (39,385,469 | ) | |||||
-56-
| Common Stock | ||||||||||||||||||||||||||||||||||||
| Class A Shares | Class B Shares | Class A Amount | Class B Amount | Additional Paid-In Capital | Accumulated Other Comprehensive (Loss) Income | Retained Earnings | Treasury Stock | Total Stockholders’ Equity | ||||||||||||||||||||||||||||
Balance, January 1, 2017 | 24,483,377 | 5,649,240 | $ | 244,834 | $ | 56,492 | $ | 236,851,709 | $ | (2,254,271 | ) | $ | 244,942,913 | $ | (41,226,357 | ) | $ | 438,615,320 | ||||||||||||||||||
|
|
|
|
|
|
|
|
|
|
|
|
|
|
|
|
|
| |||||||||||||||||||
Issuance of common stock (stock compensation plans) | 157,085 | 1,571 | 2,486,762 | 2,488,333 | ||||||||||||||||||||||||||||||||
Stock-based compensation | 924,019 | 9,240 | 15,462,479 | 15,471,719 | ||||||||||||||||||||||||||||||||
Net income | 7,116,100 | 7,116,100 | ||||||||||||||||||||||||||||||||||
Cash dividends | (15,041,051 | ) | (15,041,051 | ) | ||||||||||||||||||||||||||||||||
Grant of stock options | 600,608 | (600,608 | ) | — | ||||||||||||||||||||||||||||||||
Reclassification of tax effects | (475,687 | ) | 475,687 | — | ||||||||||||||||||||||||||||||||
Other comprehensive income | 45,683 | 45,683 | ||||||||||||||||||||||||||||||||||
|
|
|
|
|
|
|
|
|
|
|
|
|
|
|
|
|
| |||||||||||||||||||
Balance, December 31, 2017 | 25,564,481 | 5,649,240 | $ | 255,645 | $ | 56,492 | $ | 255,401,558 | $ | (2,684,275 | ) | $ | 236,893,041 | $ | (41,226,357 | ) | $ | 448,696,104 | ||||||||||||||||||
|
|
|
|
|
|
|
|
|
|
|
|
|
|
|
|
|
| |||||||||||||||||||
Issuance of common stock (stock compensation plans) | 174,899 | 1,749 | 2,469,220 | 2,470,969 | ||||||||||||||||||||||||||||||||
Stock-based compensation | 79,961 | 800 | 2,853,111 | 2,853,911 | ||||||||||||||||||||||||||||||||
Net loss | (32,760,340 | ) | (32,760,340 | ) | ||||||||||||||||||||||||||||||||
Cash dividends | (15,765,614 | ) | (15,765,614 | ) | ||||||||||||||||||||||||||||||||
Grant of stock options | 534,534 | (534,534 | ) | — | ||||||||||||||||||||||||||||||||
Reclassification of equity unrealized gains | (4,918,655 | ) | 4,918,655 | — | ||||||||||||||||||||||||||||||||
Other comprehensive loss | (6,625,129 | ) | (6,625,129 | ) | ||||||||||||||||||||||||||||||||
|
|
|
|
|
|
|
|
|
|
|
|
|
|
|
|
|
| |||||||||||||||||||
Balance, December 31, 2018 | 25,819,341 | 5,649,240 | $ | 258,194 | $ | 56,492 | $ | 261,258,423 | $ | (14,228,059 | ) | $ | 192,751,208 | $ | (41,226,357 | ) | $ | 398,869,901 | ||||||||||||||||||
|
|
|
|
|
|
|
|
|
|
|
|
|
|
|
|
|
| |||||||||||||||||||
Issuance of common stock (stock compensation plans) | 167,096 | 1,671 | 2,225,527 | 2,227,198 | ||||||||||||||||||||||||||||||||
Stock-based compensation | 217,498 | 2,175 | 4,251,665 | 4,253,840 | ||||||||||||||||||||||||||||||||
Net income | 47,151,744 | 47,151,744 | ||||||||||||||||||||||||||||||||||
Cash dividends | (16,219,393 | ) | (16,219,393 | ) | ||||||||||||||||||||||||||||||||
Grant of stock options | 415,986 | (415,986 | ) | — | ||||||||||||||||||||||||||||||||
Other comprehensive income | 14,732,229 | 14,732,229 | ||||||||||||||||||||||||||||||||||
|
|
|
|
|
|
|
|
|
|
|
|
|
|
|
|
|
| |||||||||||||||||||
Balance, December 31, 2019 | 26,203,935 | 5,649,240 | $ | 262,040 | $ | 56,492 | $ | 268,151,601 | $ | 504,170 | $ | 223,267,573 | $ | (41,226,357 | ) | $ | 451,015,519 | |||||||||||||||||||
|
|
|
|
|
|
|
|
|
|
|
|
|
|
|
|
|
| |||||||||||||||||||
Common Stock | ||||||||||||||||||||||||||||||||||||
Class A Shares | Class B Shares | Class A Amount | Class B Amount | Additional Paid-In Capital | Accumulated Other Comprehensive (Loss) Income | Retained Earnings | Treasury Stock | Total Stockholders’ Equity | ||||||||||||||||||||||||||||
Balance, | 25,564,481 | 5,649,240 | $ | 255,645 | $ | 56,492 | $ | 255,401,558 | $ | (2,684,275 | ) | $ | 236,893,041 | $ | (41,226,357 | ) | $ | 448,696,104 | ||||||||||||||||||
Issuance of common stock (stock compensation plans) | 174,899 | 1,749 | 2,469,220 | 2,470,969 | ||||||||||||||||||||||||||||||||
Stock-based | 79,961 | 800 | 2,853,111 | 2,853,911 | ||||||||||||||||||||||||||||||||
Net loss | (32,760,340 | ) | (32,760,340 | ) | ||||||||||||||||||||||||||||||||
Cash dividends | (15,765,614 | ) | (15,765,614 | ) | ||||||||||||||||||||||||||||||||
Grant of stock options | 534,534 | (534,534 | ) | — | ||||||||||||||||||||||||||||||||
Reclassification of | (4,918,655 | ) | 4,918,655 | — | ||||||||||||||||||||||||||||||||
Other comprehensive loss | (6,625,129 | ) | (6,625,129 | ) | ||||||||||||||||||||||||||||||||
Balance, 2018 | 25,819,341 | 5,649,240 | $ | 258,194 | $ | 56,492 | $ | 261,258,423 | $ | (14,228,059 | ) | $ | 192,751,208 | $ | (41,226,357 | ) | $ | 398,869,901 | ||||||||||||||||||
Issuance of common stock (stock compensation plans) | 167,096 | 1,671 | 2,225,527 | 2,227,198 | ||||||||||||||||||||||||||||||||
Stock-based compensation | 217,498 | 2,175 | 4,251,665 | 4,253,840 | ||||||||||||||||||||||||||||||||
Net income | 47,151,744 | 47,151,744 | ||||||||||||||||||||||||||||||||||
Cash dividends | (16,219,393 | ) | (16,219,393 | ) | ||||||||||||||||||||||||||||||||
Grant of stock options | 415,986 | (415,986 | ) | — | ||||||||||||||||||||||||||||||||
Other comprehensive income | 14,732,229 | 14,732,229 | ||||||||||||||||||||||||||||||||||
Balance, December 31, 2019 | 26,203,935 | 5,649,240 | $ | 262,040 | $ | 56,492 | $ | 268,151,601 | $ | 504,170 | $ | 223,267,573 | $ | (41,226,357 | ) | $ | 451,015,519 | |||||||||||||||||||
Issuance of common stock (stock compensation plans) | 153,233 | 1,532 | 2,057,504 | 2,059,036 | ||||||||||||||||||||||||||||||||
Stock-based compensation | 1,294,606 | 12,946 | 18,582,085 | 18,595,031 | ||||||||||||||||||||||||||||||||
Net income | 52,815,252 | 52,815,252 | ||||||||||||||||||||||||||||||||||
Cash dividends | (17,337,160 | ) | (17,337,160 | ) | ||||||||||||||||||||||||||||||||
Grant of stock options | 358,377 | (358,377 | ) | — | ||||||||||||||||||||||||||||||||
Other income | 10,626,442 | 10,626,442 | ||||||||||||||||||||||||||||||||||
Balance, December 31, 2020 | 27,651,774 | 5,649,240 | $ | 276,518 | $ | 56,492 | $ | 289,149,567 | $ | 11,130,612 | $ | 258,387,288 | $ | (41,226,357 | ) | $ | 517,774,120 | |||||||||||||||||||
-57-
| Years Ended December 31, | ||||||||||||
| 2019 | 2018 | 2017 | ||||||||||
Cash Flows from Operating Activities: | ||||||||||||
Net income (loss) | $ | 47,151,744 | $ | (32,760,340 | ) | $ | 7,116,100 | |||||
|
|
|
|
|
| |||||||
Adjustments to reconcile net income (loss) to net cash provided by operating activities: | ||||||||||||
Depreciation, amortization and othernon-cash items | 5,573,074 | 6,609,632 | 6,109,869 | |||||||||
Net investment (gains) losses | (21,984,617 | ) | 4,801,509 | (5,705,255 | ) | |||||||
Equity in earnings of Donegal Financial Services Corporation | (295,000 | ) | (2,693,962 | ) | (1,621,605 | ) | ||||||
Changes in Assets and Liabilities: | ||||||||||||
Losses and loss expenses | 55,008,625 | 137,993,497 | 70,007,137 | |||||||||
Unearned premiums | 3,618,879 | 3,072,065 | 37,401,313 | |||||||||
Accrued expenses | 3,011,598 | (2,591,630 | ) | (212,915 | ) | |||||||
Premiums receivable | (9,030,699 | ) | 3,704,182 | (1,016,765 | ) | |||||||
Deferred policy acquisition costs | 1,330,268 | (325,267 | ) | (3,980,664 | ) | |||||||
Deferred income taxes | 649,928 | (4,179,805 | ) | 11,889,970 | ||||||||
Reinsurance receivable | (23,652,403 | ) | (45,026,502 | ) | (35,314,555 | ) | ||||||
Accrued investment income | (504,830 | ) | (8,078 | ) | (257,608 | ) | ||||||
Amounts due to affiliate | (805,369 | ) | 3,560,172 | 16,519,278 | ||||||||
Reinsurance balances payable | (1,766,109 | ) | (233,966 | ) | (253,369 | ) | ||||||
Prepaid reinsurance premiums | (7,095,990 | ) | (347,136 | ) | (10,777,146 | ) | ||||||
Current income taxes | 19,117,435 | (8,097,499 | ) | (9,826,855 | ) | |||||||
Other, net | 6,033,243 | 299,262 | (113,482 | ) | ||||||||
Dividends received from Donegal Financial Services Corporation | — | — | 1,036,750 | |||||||||
|
|
|
|
|
| |||||||
Net adjustments | 29,208,033 | 96,536,474 | 73,884,098 | |||||||||
|
|
|
|
|
| |||||||
Net cash provided by operating activities | 76,359,777 | 63,776,134 | 81,000,198 | |||||||||
|
|
|
|
|
| |||||||
Cash Flows from Investing Activities: | ||||||||||||
Purchases of fixed maturities: | ||||||||||||
Held to maturity | (96,724,391 | ) | (48,969,776 | ) | (51,049,152 | ) | ||||||
Available for sale | (165,989,508 | ) | (116,961,667 | ) | (138,675,907 | ) | ||||||
Purchases of equity securities | (20,722,416 | ) | (11,303,361 | ) | (17,033,093 | ) | ||||||
Sales of fixed maturities: | ||||||||||||
Available for sale | 19,527,658 | 13,202,367 | 10,081,785 | |||||||||
Maturity of fixed maturities: | ||||||||||||
Held to maturity | 24,460,749 | 13,184,665 | 20,577,326 | |||||||||
Available for sale | 119,113,273 | 105,266,805 | 99,544,479 | |||||||||
Sales of equity securities | 40,465,748 | 13,779,330 | 20,880,814 | |||||||||
Net purchases of property and equipment | (149,603 | ) | (105,525 | ) | (1,090,726 | ) | ||||||
Sale of investment in Donegal Financial Services Corporation | 33,922,773 | — | — | |||||||||
Net sales (purchases) of short-term investments | 2,718,538 | (5,698,845 | ) | (1,678,908 | ) | |||||||
|
|
|
|
|
| |||||||
Net cash used in investing activities | (43,377,179 | ) | (37,606,007 | ) | (58,443,382 | ) | ||||||
|
|
|
|
|
| |||||||
Cash Flows from Financing Activities: | ||||||||||||
Issuance of common stock | 4,834,514 | 3,249,849 | 15,511,457 | |||||||||
Cash dividends paid | (16,092,643 | ) | (15,658,950 | ) | (14,822,052 | ) | ||||||
Payments on lines of credit | (25,000,000 | ) | — | (10,000,000 | ) | |||||||
Borrowings under lines of credit | — | 1,000,000 | — | |||||||||
|
|
|
|
|
| |||||||
Net cash used in financing activities | (36,258,129 | ) | (11,409,101 | ) | (9,310,595 | ) | ||||||
|
|
|
|
|
| |||||||
Net (decrease) increase in cash | (3,275,531 | ) | 14,761,026 | 13,246,221 | ||||||||
Cash at beginning of year | 52,594,461 | 37,833,435 | 24,587,214 | |||||||||
|
|
|
|
|
| |||||||
Cash at end of year | $ | 49,318,930 | $ | 52,594,461 | $ | 37,833,435 | ||||||
|
|
|
|
|
| |||||||
Years Ended December 31, | ||||||||||||
2020 | 2019 | 2018 | ||||||||||
Cash Flows from Operating Activities: | ||||||||||||
Net income (loss) | $ | 52,815,252 | $ | 47,151,744 | $ | (32,760,340 | ) | |||||
Adjustments to reconcile net income (loss) to net cash provided by operating activities: | ||||||||||||
Depreciation, amortization and other non-cash items | 6,721,621 | 5,573,074 | 6,609,632 | |||||||||
Net investment (gains) losses | (2,777,919 | ) | (21,984,617 | ) | 4,801,509 | |||||||
Equity in earnings of Donegal Financial Services Corporation | — | (295,000 | ) | (2,693,962 | ) | |||||||
Changes in Assets and Liabilities: | ||||||||||||
Losses and loss expenses | 92,333,588 | 55,008,625 | 137,993,497 | |||||||||
Unearned premiums | 27,042,113 | 3,618,879 | 3,072,065 | |||||||||
Accrued expenses | 661,454 | 3,011,598 | (2,591,630 | ) | ||||||||
Premiums receivable | (3,863,383 | ) | (9,030,699 | ) | 3,704,182 | |||||||
Deferred policy acquisition costs | 127,901 | 1,330,268 | (325,267 | ) | ||||||||
Deferred income taxes | 6,448 | 649,928 | (4,179,805 | ) | ||||||||
Reinsurance receivable | (41,887,382 | ) | (23,652,403 | ) | (45,026,502 | ) | ||||||
Accrued investment income | (870,850 | ) | (504,830 | ) | (8,078 | ) | ||||||
Amounts due to affiliate | 224,324 | (805,369 | ) | 3,560,172 | ||||||||
Reinsurance balances payable | 1,117,439 | (1,766,109 | ) | (233,966 | ) | |||||||
Prepaid reinsurance premiums | (26,942,566 | ) | (7,095,990 | ) | (347,136 | ) | ||||||
Current income taxes | (3,174,200 | ) | 19,117,435 | (8,097,499 | ) | |||||||
Other, net | (399,440 | ) | 6,033,243 | 299,262 | ||||||||
Net adjustments | 48,319,148 | 29,208,033 | 96,536,474 | |||||||||
Net cash provided by operating activities | 101,134,400 | 76,359,777 | 63,776,134 | |||||||||
Cash Flows from Investing Activities: | ||||||||||||
Purchases of fixed maturities: | ||||||||||||
Held to maturity | (157,048,527 | ) | (96,724,391 | ) | (48,969,776 | ) | ||||||
Available for sale | (176,500,255 | ) | (165,989,508 | ) | (116,961,667 | ) | ||||||
Purchases of equity securities | (6,964,092 | ) | (20,722,416 | ) | (11,303,361 | ) | ||||||
Sales of fixed maturities: | ||||||||||||
Available for sale | 22,172,930 | 19,527,658 | 13,202,367 | |||||||||
Maturity of fixed maturities: | ||||||||||||
Held to maturity | 47,448,424 | 24,460,749 | 13,184,665 | |||||||||
Available for sale | 172,084,542 | 119,113,273 | 105,266,805 | |||||||||
Sales of equity securities | 6,091,288 | 40,465,748 | 13,779,330 | |||||||||
Net purchases of property and equipment | (89,702 | ) | (149,603 | ) | (105,525 | ) | ||||||
Sale of investment in Donegal Financial Services Corporation | — | 33,922,773 | — | |||||||||
Net (purchases) sales of short-term investments | (6,869,933 | ) | 2,718,538 | (5,698,845 | ) | |||||||
Net cash used in investing activities | (99,675,325 | ) | (43,377,179 | ) | (37,606,007 | ) | ||||||
Cash Flows from Financing Activities: | ||||||||||||
Issuance of common stock | 19,292,324 | 4,834,514 | 3,249,849 | |||||||||
Cash dividends paid | (16,976,093 | ) | (16,092,643 | ) | (15,658,950 | ) | ||||||
Payments on lines of credit | — | (25,000,000 | ) | — | ||||||||
Borrowings under lines of credit | 50,000,000 | — | 1,000,000 | |||||||||
Net cash provided by (used in) financing activities | 52,316,231 | (36,258,129 | ) | (11,409,101 | ) | |||||||
Net increase (decrease) in cash | 53,775,306 | (3,275,531 | ) | 14,761,026 | ||||||||
Cash at beginning of year | 49,318,930 | 52,594,461 | 37,833,435 | |||||||||
Cash at end of year | $ | 103,094,236 | $ | 49,318,930 | $ | 52,594,461 | ||||||
-58-
underwriting pool.
In July 2018, we consolidated
-59-
-60-
impairment loss in our results of operations. If we do not intend to sell the debt security, we determine whether it is more likely than not that we will be required to sell the debt security prior to recovery. If we determine it is more likely than not that we will be required to sell the debt security prior to recovery, we recognize an impairment loss in our results of operations. If we determine it is more likely than not that we will not be required to sell the debt security prior to recovery, we then evaluate whether a credit loss has occurred. We determine whether a credit loss has occurred by comparing the amortized cost of the debt security to the present value of the cash flows we expect to collect. If we expect a cash flow shortfall, we consider that a credit loss has occurred. If we determine that a credit loss has occurred, we consider the impairment to be other than temporary. We then recognize the amount of the impairment loss related to the credit loss in our results of operations, and we recognize the remaining portion of the impairment loss in our other comprehensive income, net of applicable taxes. In addition, we may write down securities in an unrealized loss position based on a number of other factors, including when the fair value of an investment is significantly below its cost, when the financial condition of the issuer of a security has deteriorated, the occurrence of industry, company or geographic events that have negatively impacted the value of a security and rating agency downgrades.
-61-
-62-
-63-
common share. Thetwo-class method
In January 2016, the FASB issued guidance that generally requires entities to measure equity investments at fair value and recognize changes in fair value in their results of operations. This guidance also simplifies the impairment assessment of equity investments without readily determinable fair values by requiring entities to perform a qualitative assessment to identify impairment. The FASB issued other disclosure and presentation improvements related to financial instruments within the guidance. The guidance was effective for annual and interim reporting periods beginning after December 15, 2017. As a result of the adoption of this guidance on January 1, 2018, we transferred $4.9 million of net unrealized gains from accumulated other comprehensive income (“AOCI”) to retained earnings. We recognized $8.9 million of unrealized gains and $25,751 of unrealized losses on equity securities held at December 31, 2019 in net investment gains for 2019. We recognized $1.2 million of unrealized gains and $4.4 million of unrealized losses on equity securities held at December 31, 2018 in net investment losses for 2018.
-64-
| 2019 | 2018 | 2017 | ||||||||||
Premiums earned | $ | 218,642,984 | $ | 212,928,238 | $ | 200,752,599 | ||||||
Losses and loss expenses | 173,238,503 | 159,495,489 | 140,015,950 | |||||||||
Prepaid reinsurance premiums | 116,189,929 | 106,224,424 | 103,991,861 | |||||||||
Liability for losses and loss expenses | 183,326,589 | 158,081,925 | 136,786,070 | |||||||||
2018:
2020 | 2019 | 2018 | ||||||||||
Premiums earned | $ | 266,400,636 | $ | 218,642,984 | $ | 212,928,238 | ||||||
Losses and loss expenses | 181,205,743 | 173,238,503 | 159,495,489 | |||||||||
Prepaid reinsurance premiums | 146,387,565 | 116,189,929 | 106,224,424 | |||||||||
Liability for losses and loss expenses | 232,540,607 | 183,326,589 | 158,081,925 | |||||||||
| 2019 | 2018 | 2017 | ||||||||||
Premiums earned | $ | 479,835,362 | $ | 473,512,781 | $ | 451,470,894 | ||||||
Losses and loss expenses | 309,852,141 | 335,789,280 | 289,503,373 | |||||||||
Unearned premiums | 237,106,338 | 231,958,181 | 228,988,598 | |||||||||
Liability for losses and loss expenses | 322,658,731 | 303,546,744 | 252,263,547 | |||||||||
2018:
2020 | 2019 | 2018 | ||||||||||
Premiums earned | $ | 514,172,448 | $ | 479,835,362 | $ | 473,512,781 | ||||||
Losses and loss expenses | 309,315,497 | 309,852,141 | 335,789,280 | |||||||||
Unearned premiums | 262,004,199 | 237,106,338 | 231,958,181 | |||||||||
Liability for losses and loss expenses | 377,530,215 | 322,658,731 | 303,546,744 | |||||||||
| 2019 | 2018 | 2017 | ||||||||||
Premiums earned | $ | 42,079,112 | $ | 42,813,929 | $ | 42,578,047 | ||||||
Losses and loss expenses | 19,617,787 | 23,175,456 | 24,978,631 | |||||||||
Prepaid reinsurance premiums | 19,217,849 | 19,047,084 | 19,827,115 | |||||||||
Liability for losses and loss expenses | 36,597,834 | 38,434,078 | 36,396,109 | |||||||||
2018:
2020 | 2019 | 2018 | ||||||||||
Premiums earned | $ | 39,315,398 | $ | 42,079,112 | $ | 42,813,929 | ||||||
Losses and loss expenses | 15,471,037 | 19,617,787 | 23,175,456 | |||||||||
Prepaid reinsurance premiums | 17,155,909 | 19,217,849 | 19,047,084 | |||||||||
Liability for losses and loss expenses | 35,306,627 | 36,597,834 | 38,434,078 | |||||||||
-65-
combination of these subsidiaries, up to the amount Donegal Mutual and our insurance subsidiaries retained under catastrophe reinsurance agreements with unaffiliated reinsurers. The set retention was $2,000,000, $1,500,000 and $750,000 for Atlantic States, Southern and Le Mars, respectively, for 2017. Through December 31, 2018, Donegal Mutual and Southern had an excess of loss reinsurance agreement in which Donegal Mutual assumed up to $500,000 of Southern’s losses in excess of $500,000.
| 2019 | 2018 | 2017 | ||||||||||
Premiums earned | $ | 14,404,636 | $ | 19,190,067 | $ | 17,215,273 | ||||||
Losses and loss expenses | 13,769,736 | 12,899,927 | 8,953,411 | |||||||||
Liability for losses and loss expenses | 3,149,907 | 4,847,176 | 3,399,207 | |||||||||
2018:
2020 | 2019 | 2018 | ||||||||||
Premiums earned | $ | 15,595,138 | $ | 14,404,636 | $ | 19,190,067 | ||||||
Losses and loss expenses | 25,259,527 | 13,769,736 | 12,899,927 | |||||||||
Liability for losses and loss expenses | 3,812,339 | 3,149,907 | 4,847,176 | |||||||||
| 2019 | 2018 | 2017 | ||||||||||
Assumed | $ | 479,835,362 | $ | 473,512,781 | $ | 451,470,623 | ||||||
Ceded | (275,126,732 | ) | (274,932,234 | ) | (260,545,919 | ) | ||||||
|
|
|
|
|
| |||||||
Net | $ | 204,708,630 | $ | 198,580,547 | $ | 190,924,704 | ||||||
|
|
|
|
|
| |||||||
2018:
2020 | 2019 | 2018 | ||||||||||
Assumed | $ | 514,172,448 | $ | 479,835,362 | $ | 473,512,781 | ||||||
Ceded | (321,311,172 | ) | (275,126,732 | ) | (274,932,234 | ) | ||||||
Net | $ | 192,861,276 | $ | 204,708,630 | $ | 198,580,547 | ||||||
| 2019 | 2018 | 2017 | ||||||||||
Assumed | $ | 309,844,705 | $ | 335,684,463 | $ | 288,813,105 | ||||||
Ceded | (206,626,026 | ) | (195,570,872 | ) | (173,947,992 | ) | ||||||
|
|
|
|
|
| |||||||
Net | $ | 103,218,679 | $ | 140,113,591 | $ | 114,865,113 | ||||||
|
|
|
|
|
| |||||||
2018:
2020 | 2019 | 2018 | ||||||||||
Assumed | $ | 309,311,098 | $ | 309,844,705 | $ | 335,684,463 | ||||||
Ceded | (221,936,307 | ) | (206,626,026 | ) | (195,570,872 | ) | ||||||
Net | $ | 87,374,791 | $ | 103,218,679 | $ | 140,113,591 | ||||||
we maintain a coordinating committee that consists of two members of our board of directors, neither of whom is a member of Donegal Mutual’s board of directors, and two members of Donegal Mutual’s board of directors, neither of whom is a member of our board of directors. The purpose of the coordinating committee is to maintain a process for an ongoing evaluation of the fairness of the terms of all transactions between Donegal Mutual and our insurance subsidiaries.
-66-
| 2019 | ||||||||||||||||
| Held to Maturity | Amortized Cost | Gross Unrealized Gains | Gross Unrealized Losses | Estimated Fair Value | ||||||||||||
U.S. Treasury securities and obligations of U.S. government corporations and agencies | $ | 82,916,052 | $ | 1,803,230 | $ | 68,560 | $ | 84,650,722 | ||||||||
Obligations of states and political subdivisions | 204,634,486 | 14,236,736 | 288,174 | 218,583,048 | ||||||||||||
Corporate securities | 156,398,001 | 8,274,912 | 333,166 | 164,339,747 | ||||||||||||
Mortgage-backed securities | 32,145,243 | 611,641 | 16,057 | 32,740,827 | ||||||||||||
|
|
|
|
|
|
|
| |||||||||
Totals | $ | 476,093,782 | $ | 24,926,519 | $ | 705,957 | $ | 500,314,344 | ||||||||
|
|
|
|
|
|
|
| |||||||||
| 2019 | ||||||||||||||||
| Available for Sale | Amortized Cost | Gross Unrealized Gains | Gross Unrealized Losses | Estimated Fair Value | ||||||||||||
U.S. Treasury securities and obligations of U.S. government corporations and agencies | $ | 19,302,056 | $ | 81,773 | $ | 19,370 | $ | 19,364,459 | ||||||||
Obligations of states and political subdivisions | 55,162,046 | 1,641,171 | 6,929 | 56,796,288 | ||||||||||||
Corporate securities | 154,946,586 | 4,477,035 | 180,312 | 159,243,309 | ||||||||||||
Mortgage-backed securities | 327,428,590 | 2,856,820 | 737,663 | 329,547,747 | ||||||||||||
|
|
|
|
|
|
|
| |||||||||
Totals | $ | 556,839,278 | $ | 9,056,799 | $ | 944,274 | $ | 564,951,803 | ||||||||
|
|
|
|
|
|
|
| |||||||||
| 2018 | ||||||||||||||||
| Held to Maturity | Amortized Cost | Gross Unrealized Gains | Gross Unrealized Losses | Estimated Fair Value | ||||||||||||
U.S. Treasury securities and obligations of U.S. government corporations and agencies | $ | 76,222,306 | $ | 174,904 | $ | 1,086,613 | $ | 75,310,597 | ||||||||
Obligations of states and political subdivisions | 159,292,158 | 8,236,804 | 704,104 | 166,824,858 | ||||||||||||
Corporate securities | 127,010,071 | 396,197 | 4,391,451 | 123,014,817 | ||||||||||||
Mortgage-backed securities | 40,273,983 | 64,318 | 450,277 | 39,888,024 | ||||||||||||
|
|
|
|
|
|
|
| |||||||||
Totals | $ | 402,798,518 | $ | 8,872,223 | $ | 6,632,445 | $ | 405,038,296 | ||||||||
|
|
|
|
|
|
|
| |||||||||
| 2018 | ||||||||||||||||
| Available for Sale | Amortized Cost | Gross Unrealized Gains | Gross Unrealized Losses | Estimated Fair Value | ||||||||||||
U.S. Treasury securities and obligations of U.S. government corporations and agencies | $ | 45,188,053 | $ | 25,241 | $ | 1,003,365 | $ | 44,209,929 | ||||||||
Obligations of states and political subdivisions | 73,760,836 | 1,762,127 | 306,994 | 75,215,969 | ||||||||||||
Corporate securities | 140,688,937 | 203,393 | 3,059,185 | 137,833,145 | ||||||||||||
Mortgage-backed securities | 275,474,625 | 148,967 | 6,324,331 | 269,299,261 | ||||||||||||
|
|
|
|
|
|
|
| |||||||||
Totals | $ | 535,112,451 | $ | 2,139,728 | $ | 10,693,875 | $ | 526,558,304 | ||||||||
|
|
|
|
|
|
|
| |||||||||
2020 | ||||||||||||||||
Held to Maturity | Amortized Cost | Gross Unrealized Gains | Gross Unrealized Losses | Estimated Fair Value | ||||||||||||
U.S. Treasury securities and obligations of U.S. government corporations and agencies | $ | 77,435,268 | $ | 3,983,890 | $ | 223,564 | $ | 81,195,594 | ||||||||
Obligations of states and political subdivisions | 312,319,238 | 23,211,483 | 142,750 | 335,387,971 | ||||||||||||
Corporate securities | 173,269,560 | 18,172,244 | 205,761 | 191,236,043 | ||||||||||||
Mortgage-backed securities | 23,585,373 | 1,235,840 | — | 24,821,213 | ||||||||||||
Totals | $ | 586,609,439 | $ | 46,603,457 | $ | 572,075 | $ | 632,640,821 | ||||||||
2020 | ||||||||||||||||
Available for Sale | Amortized Cost | Gross Unrealized Gains | Gross Unrealized Losses | Estimated Fair Value | ||||||||||||
U.S. Treasury securities and obligations of U.S. government corporations and agencies | $ | 47,511,872 | $ | 423,855 | $ | 121,015 | $ | 47,814,712 | ||||||||
Obligations of states and political subdivisions | 66,286,667 | 2,690,335 | 11,765 | 68,965,237 | ||||||||||||
Corporate securities | 202,396,309 | 10,496,218 | 184,464 | 212,708,063 | ||||||||||||
Mortgage-backed securities | 218,763,252 | 6,901,676 | 16,923 | 225,648,005 | ||||||||||||
Totals | $ | 534,958,100 | $ | 20,512,084 | $ | 334,167 | $ | 555,136,017 | ||||||||
2019 | ||||||||||||||||
Held to Maturity | Amortized Cost | Gross Unrealized Gains | Gross Unrealized Losses | Estimated Fair Value | ||||||||||||
U.S. Treasury securities and obligations of U.S. government corporations and agencies | $ | 82,916,052 | $ | 1,803,230 | $ | 68,560 | $ | 84,650,722 | ||||||||
Obligations of states and political subdivisions | 204,634,486 | 14,236,736 | 288,174 | 218,583,048 | ||||||||||||
Corporate securities | 156,398,001 | 8,274,912 | 333,166 | 164,339,747 | ||||||||||||
Mortgage-backed securities | 32,145,243 | 611,641 | 16,057 | 32,740,827 | ||||||||||||
Totals | $ | 476,093,782 | $ | 24,926,519 | $ | 705,957 | $ | 500,314,344 | ||||||||
2019 | ||||||||||||||||
Available for Sale | Amortized Cost | Gross Unrealized Gains | Gross Unrealized Losses | Estimated Fair Value | ||||||||||||
U.S. Treasury securities and obligations of U.S. government corporations and agencies | $ | 19,302,056 | $ | 81,773 | $ | 19,370 | $ | 19,364,459 | ||||||||
Obligations of states and political subdivisions | 55,162,046 | 1,641,171 | 6,929 | 56,796,288 | ||||||||||||
Corporate securities | 154,946,586 | 4,477,035 | 180,312 | 159,243,309 | ||||||||||||
Mortgage-backed securities | 327,428,590 | 2,856,820 | 737,663 | 329,547,747 | ||||||||||||
Totals | $ | 556,839,278 | $ | 9,056,799 | $ | 944,274 | $ | 564,951,803 | ||||||||
-67-
At December 31, 2018, our holdings of obligations of states and political subdivisions included general obligation bonds with an aggregate fair value of $157.7 million and an amortized cost of $152.2 million. Our holdings also included special revenue bonds with an aggregate fair value of $84.3 million and an amortized cost of $80.9 million. With respect to both categories of bonds, we held no securities of any issuer that comprised more than 10% of that category at December 31, 2018. Education bonds and water and sewer utility bonds represented 49% and 29%, respectively, of our total investments in special revenue bonds based on their carrying values at December 31, 2018. Many of the issuers of the special revenue bonds we held at December 31, 2018 have the authority to impose ad valorem taxes. In that respect, many of the special revenue bonds we held are similar to general obligation bonds.
income.
| Amortized Cost | Estimated Fair Value | |||||||
Held to maturity | ||||||||
Due in one year or less | $ | 16,132,891 | $ | 16,205,362 | ||||
Due after one year through five years | 73,727,277 | 76,542,800 | ||||||
Due after five years through ten years | 182,428,771 | 191,642,042 | ||||||
Due after ten years | 171,659,600 | 183,183,313 | ||||||
Mortgage-backed securities | 32,145,243 | 32,740,827 | ||||||
|
|
|
| |||||
Total held to maturity | $ | 476,093,782 | $ | 500,314,344 | ||||
|
|
|
| |||||
Available for sale | ||||||||
Due in one year or less | $ | 12,943,726 | $ | 13,075,792 | ||||
Due after one year through five years | 89,684,400 | 91,992,458 | ||||||
Due after five years through ten years | 112,308,452 | 115,407,525 | ||||||
Due after ten years | 14,474,110 | 14,928,281 | ||||||
Mortgage-backed securities | 327,428,590 | 329,547,747 | ||||||
|
|
|
| |||||
Total available for sale | $ | 556,839,278 | $ | 564,951,803 | ||||
|
|
|
| |||||
Amortized Cost | Estimated Fair Value | |||||||
Held to maturity | ||||||||
Due in one year or less | $ | 17,487,922 | $ | 17,751,370 | ||||
Due after one year through five years | 91,293,064 | 97,632,535 | ||||||
Due after five years through ten years | 205,058,526 | 222,703,673 | ||||||
Due after ten years | 249,184,554 | 269,732,030 | ||||||
Mortgage-backed securities | 23,585,373 | 24,821,213 | ||||||
Total held to maturity | $ | 586,609,439 | $ | 632,640,821 | ||||
Available for sale | ||||||||
Due in one year or less | $ | 55,448,556 | $ | 55,677,592 | ||||
Due after one year through five years | 99,633,832 | 105,770,506 | ||||||
Due after five years through ten years | 130,984,165 | 136,888,915 | ||||||
Due after ten years | 30,128,295 | 31,150,999 | ||||||
Mortgage-backed securities | 218,763,252 | 225,648,005 | ||||||
Total available for sale | $ | 534,958,100 | $ | 555,136,017 | ||||
Cost | Gross Gains | Gross Losses | Estimated Value | |||||||||||||
Equity securities | $ | 42,409,750 | $ | 17,103,055 | $ | 956,632 | $ | 58,556,173 | ||||||||
| Cost | Gross Gains | Gross Losses | Estimated Fair Value | |||||||||||||
Equity securities | $ | 43,419,136 | $ | 12,179,912 | $ | 121,492 | $ | 55,477,556 | ||||||||
The cost and estimated fair values of our equity securities at December 31, 2018 were as follows:
| Cost | Gross Gains | Gross Losses | Estimated Fair Value | |||||||||||||
Equity securities | $ | 40,942,716 | $ | 4,817,917 | $ | 2,093,624 | $ | 43,667,009 | ||||||||
-68-
Cost | Gross Gains | Gross Losses | Estimated Fair Value | |||||||||||||
Equity securities | $ | 43,419,136 | $ | 12,179,912 | $ | 121,492 | $ | 55,477,556 | ||||||||
| 2019 | 2018 | 2017 | ||||||||||
Fixed maturities | $ | 29,969,774 | $ | 27,733,555 | $ | 26,143,924 | ||||||
Equity securities | 1,268,056 | 1,264,120 | 999,335 | |||||||||
Short-term investments | 1,243,104 | 795,522 | 407,580 | |||||||||
Other | 29,251 | 29,450 | 33,316 | |||||||||
|
|
|
|
|
| |||||||
Investment income | 32,510,185 | 29,822,647 | 27,584,155 | |||||||||
Investment expenses | (2,995,230 | ) | (2,914,991 | ) | (4,056,851 | ) | ||||||
|
|
|
|
|
| |||||||
Net investment income | $ | 29,514,955 | $ | 26,907,656 | $ | 23,527,304 | ||||||
|
|
|
|
|
| |||||||
2020 | 2019 | 2018 | ||||||||||
Fixed maturities | $ | 30,750,231 | $ | 29,969,774 | $ | 27,733,555 | ||||||
Equity securities | 1,386,343 | 1,268,056 | 1,264,120 | |||||||||
Short-term investments | 427,392 | 1,243,104 | 795,522 | |||||||||
Other | 29,250 | 29,251 | 29,450 | |||||||||
Investment income | 32,593,216 | 32,510,185 | 29,822,647 | |||||||||
Investment expenses | (3,088,750 | ) | (2,995,230 | ) | (2,914,991 | ) | ||||||
Net investment income | $29,504,466 | $29,514,955 | $ | 26,907,656 | ||||||||
| 2019 | 2018 | 2017 | ||||||||||
Gross gains: | ||||||||||||
Fixed maturities | $ | 470,983 | $ | 131,660 | $ | 168,855 | ||||||
Equity securities | 10,471,285 | 1,890,762 | 6,197,253 | |||||||||
Investment in affiliate | 12,662,147 | |||||||||||
|
|
|
|
|
| |||||||
| 23,604,415 | 2,022,422 | 6,366,108 | ||||||||||
|
|
|
|
|
| |||||||
Gross losses: | ||||||||||||
Fixed maturities | 323,746 | 630,904 | 98,723 | |||||||||
Equity securities | 1,296,052 | 6,193,027 | 562,130 | |||||||||
|
|
|
|
|
| |||||||
| 1,619,798 | 6,823,931 | 660,853 | ||||||||||
|
|
|
|
|
| |||||||
Net investment gains (losses) | $ | 21,984,617 | $ | (4,801,509 | ) | $ | 5,705,255 | |||||
|
|
|
|
|
| |||||||
Change in difference between fair value and cost of investments: | ||||||||||||
Fixed maturities | $ | 38,647,456 | $ | (20,641,433 | ) | $ | 2,335,578 | |||||
Equity securities | 9,334,127 | (3,501,853 | ) | 1,569,999 | ||||||||
|
|
|
|
|
| |||||||
Totals | $ | 47,981,583 | $ | (24,143,286 | ) | $ | 3,905,577 | |||||
|
|
|
|
|
| |||||||
2020 | 2019 | 2018 | ||||||||||
Gross gains: | ||||||||||||
Fixed maturities | $ | 818,350 | $ | 470,983 | $ | 131,660 | ||||||
Equity securities | 8,532,881 | 10,471,285 | 1,890,762 | |||||||||
Investment in affiliate | — | 12,662,147 | ||||||||||
| 9,351,231 | 23,604,415 | 2,022,422 | ||||||||||
Gross losses: | ||||||||||||
Fixed maturities | 246,243 | 323,746 | 630,904 | |||||||||
Equity securities | 6,327,069 | 1,296,052 | 6,193,027 | |||||||||
| 6,573,312 | 1,619,798 | 6,823,931 | ||||||||||
Net investment gains (losses) | $ | 2,777,919 | $ | 21,984,617 | $ | (4,801,509 | ) | |||||
Change in difference between fair value and cost of | ||||||||||||
Fixed maturities | $ | 33,876,212 | $ | 38,647,456 | $ | (20,641,433 | ) | |||||
Equity securities | 4,088,003 | 9,334,127 | (3,501,853 | ) | ||||||||
Totals | $ | 37,964,215 | $ | 47,981,583 | $ | (24,143,286 | ) | |||||
2020 as follows:
Less than 12 months | 12 months or longer | |||||||||||||||
Fair Value | Unrealized Losses | Fair Value | Unrealized Losses | |||||||||||||
U.S. Treasury securities and obligations of U.S. government corporations and | $ | 29,144,224 | $ | 344,579 | $ | — | $ | — | ||||||||
Obligations of states and political subdivisions | 9,361,435 | 154,515 | — | — | ||||||||||||
Corporate securities | 26,142,933 | 114,606 | 8,229,646 | 275,619 | ||||||||||||
Mortgage-backed securities | 3,091,272 | 15,425 | 236,560 | 1,498 | ||||||||||||
Totals | $ | 67,739,864 | $ | 629,125 | $ | 8,466,206 | $ | 277,117 | ||||||||
| Less than 12 months | 12 months or longer | |||||||||||||||
| Fair Value | Unrealized Losses | Fair Value | Unrealized Losses | |||||||||||||
U.S. Treasury securities and obligations of U.S. government corporations and agencies | $ | 7,461,245 | $ | 45,688 | $ | 5,394,735 | $ | 42,242 | ||||||||
Obligations of states and political subdivisions | 23,339,340 | 293,516 | 2,326,813 | 1,587 | ||||||||||||
Corporate securities | 19,362,346 | 263,280 | 18,803,546 | 250,198 | ||||||||||||
Mortgage-backed securities | 28,507,123 | 55,729 | 74,088,769 | 697,991 | ||||||||||||
|
|
|
|
|
|
|
| |||||||||
Totals | $ | 78,670,054 | $ | 658,213 | $ | 100,613,863 | $ | 992,018 | ||||||||
|
|
|
|
|
|
|
| |||||||||
-69-
We held fixed maturities with unrealized losses representing declines that we considered temporary at December 31, 2018 as follows:
| Less than 12 months | 12 months or longer | |||||||||||||||
| Fair Value | Unrealized Losses | Fair Value | Unrealized Losses | |||||||||||||
U.S. Treasury securities and obligations of U.S. government corporations and agencies | $ | 26,342,398 | $ | 165,774 | $ | 54,900,027 | $ | 1,924,204 | ||||||||
Obligations of states and political subdivisions | 28,321,962 | 477,357 | 21,559,520 | 533,741 | ||||||||||||
Corporate securities | 149,269,854 | 4,482,870 | 59,396,885 | 2,967,766 | ||||||||||||
Mortgage-backed securities | 82,593,454 | 912,616 | 181,379,875 | 5,861,992 | ||||||||||||
|
|
|
|
|
|
|
| |||||||||
Totals | $ | 286,527,668 | $ | 6,038,617 | $ | 317,236,307 | $ | 11,287,703 | ||||||||
|
|
|
|
|
|
|
| |||||||||
Less than 12 months | 12 months or longer | |||||||||||||||
Fair Value | Unrealized Losses | Fair Value | Unrealized Losses | |||||||||||||
U.S. Treasury securities and obligations of U.S. government corporations and | $ | 7,461,245 | $ | 45,688 | $ | 5,394,735 | $ | 42,242 | ||||||||
Obligations of states and political subdivisions | 23,339,340 | 293,516 | 2,326,813 | 1,587 | ||||||||||||
Corporate securities | 19,362,346 | 263,280 | 18,803,546 | 250,198 | ||||||||||||
Mortgage-backed securities | 28,507,123 | 55,729 | 74,088,769 | 697,991 | ||||||||||||
Totals | $ | 78,670,054 | $ | 658,213 | $ | 100,613,863 | $ | 992,018 | ||||||||
2018.
-70-
addition, the valuation of fixed maturity investments is more subjective when markets are less liquid, increasing the potential
2019.
| Fair Value Measurements Using | ||||||||||||||||
| Fair Value | Quoted Prices in Active Markets for Identical Assets (Level 1) | Significant Other Observable Inputs (Level 2) | Significant Unobservable Inputs (Level 3) | |||||||||||||
| (in thousands) | ||||||||||||||||
U.S. Treasury securities and obligations of U.S. government corporations and agencies | $ | 19,364,459 | $ | — | $ | 19,364,459 | $ | — | ||||||||
Obligations of states and political subdivisions | 56,796,288 | — | 56,796,288 | — | ||||||||||||
Corporate securities | 159,243,309 | — | 159,243,309 | — | ||||||||||||
Mortgage-backed securities | 329,547,747 | — | 329,547,747 | — | ||||||||||||
Equity securities | 55,477,556 | 53,124,368 | 2,353,188 | — | ||||||||||||
|
|
|
|
|
|
|
| |||||||||
Total investments in the fair value hierarchy | $ | 620,429,359 | $ | 53,124,368 | $ | 567,304,991 | $ | — | ||||||||
|
|
|
|
|
|
|
| |||||||||
-71-
Fair Value Measurements Using | ||||||||||||||||
Fair Value | Quoted Prices in Active Markets for Identical Assets (Level 1) | Significant Other Observable Inputs (Level 2) | Significant Unobservable Inputs (Level 3) | |||||||||||||
| (in thousands) | ||||||||||||||||
U.S. Treasury securities and obligations of U.S. government corporations and agencies | $ | 47,814,712 | $ | — | $ | 47,814,712 | $ | — | ||||||||
Obligations of states and political subdivisions | 68,965,237 | — | 68,965,237 | — | ||||||||||||
Corporate securities | 212,708,063 | — | 212,708,063 | — | ||||||||||||
Mortgage-backed securities | 225,648,005 | — | 225,648,005 | — | ||||||||||||
Equity securities | 58,556,173 | 54,152,085 | 4,404,088 | — | ||||||||||||
Total investments in the fair value hierarchy | $ | 613,692,190 | $ | 54,152,085 | $ | 559,540,105 | $ | — | ||||||||
| Fair Value Measurements Using | ||||||||||||||||
| Fair Value | Quoted Prices in Active Markets for Identical Assets (Level 1) | Significant Other Observable Inputs (Level 2) | Significant Unobservable Inputs (Level 3) | |||||||||||||
U.S. Treasury securities and obligations of U.S. government corporations and agencies | $ | 44,209,929 | $ | — | $ | 44,209,929 | $ | — | ||||||||
Obligations of states and political subdivisions | 75,215,969 | — | 75,215,969 | — | ||||||||||||
Corporate securities | 137,833,145 | — | 137,833,145 | — | ||||||||||||
Mortgage-backed securities | 269,299,261 | — | 269,299,261 | — | ||||||||||||
Equity securities | 30,674,835 | 28,351,110 | 2,323,725 | — | ||||||||||||
|
|
|
|
|
|
|
| |||||||||
Total investments in the fair value hierarchy | 557,233,139 | 28,351,110 | 528,882,029 | — | ||||||||||||
|
|
|
|
|
|
|
| |||||||||
Investment measured at net asset value | 12,992,174 | — | — | — | ||||||||||||
|
|
|
|
|
|
|
| |||||||||
Totals | $ | 570,225,313 | $ | 28,351,110 | $ | 528,882,029 | $ | — | ||||||||
|
|
|
|
|
|
|
| |||||||||
2019:
Fair Value Measurements Using | ||||||||||||||||
Fair Value | Quoted Prices Active for Assets (Level | Significant Other Observable Inputs (Level 2) | Significant Unobservable Inputs (Level 3) | |||||||||||||
| (in thousands) | ||||||||||||||||
U.S. Treasury securities and obligations of U.S. government corporations and agencies | $ | 19,364,459 | $ | — | $ | 19,364,459 | $ | — | ||||||||
Obligations of states and political subdivisions | 56,796,288 | — | 56,796,288 | — | ||||||||||||
Corporate securities | 159,243,309 | — | 159,243,309 | — | ||||||||||||
Mortgage-backed securities | 329,547,747 | — | 329,547,747 | — | ||||||||||||
Equity securities | 55,477,556 | 53,124,368 | 2,353,188 | — | ||||||||||||
Total investments in the fair value hierarchy | $ | 620,429,359 | $ | 53,124,368 | $ | 567,304,991 | $ | — | ||||||||
| 2019 | 2018 | 2017 | ||||||||||
Balance, January 1 | $ | 60,615,127 | $ | 60,289,860 | $ | 56,309,196 | ||||||
Acquisition costs deferred | 121,112,732 | 121,289,267 | 119,045,664 | |||||||||
Amortization charged to earnings | (122,443,000 | ) | (120,964,000 | ) | (115,065,000 | ) | ||||||
|
|
|
|
|
| |||||||
Balance, December 31 | $ | 59,284,859 | $ | 60,615,127 | $ | 60,289,860 | ||||||
|
|
|
|
|
| |||||||
2020 | 2019 | 2018 | ||||||||||
Balance, January 1 | $ | 59,284,859 | $ | 60,615,127 | $ | 60,289,860 | ||||||
Acquisition costs deferred | 118,944,099 | 121,112,732 | 121,289,267 | |||||||||
Amortization charged to earnings | (119,072,000 | ) | (122,443,000 | ) | (120,964,000 | ) | ||||||
Balance, December 31 | $ | 59,156,958 | $ | 59,284,859 | $ | 60,615,127 | ||||||
| 2019 | 2018 | Estimated Useful Life | ||||||||||
Office equipment | $ | 8,660,163 | $ | 10,049,884 | 3-15 years | |||||||
Automobiles | 301,119 | 448,015 | 5 years | |||||||||
Real estate | 4,977,813 | 4,977,813 | 5-50 years | |||||||||
Software | 2,065,927 | 2,843,782 | 5 years | |||||||||
|
|
|
| |||||||||
| 16,005,022 | 18,319,494 | |||||||||||
Accumulated depreciation | (11,446,950 | ) | (13,628,790 | ) | ||||||||
|
|
|
| |||||||||
| $ | 4,558,072 | $ | 4,690,704 | |||||||||
|
|
|
| |||||||||
2020 | 2019 | Estimated Useful Life | ||||||||||
Office equipment | $ | 8,809,344 | $ | 8,660,163 | 3-15 years | |||||||
Automobiles | 301,119 | 301,119 | 5 years | |||||||||
Real estate | 4,921,056 | 4,977,813 | 5 -50 | |||||||||
Software | 2,065,927 | 2,065,927 | 5 years | |||||||||
| 16,097,446 | 16,005,022 | |||||||||||
Accumulated depreciation | (11,707,069 | ) | (11,446,950 | ) | ||||||||
| $ | 4,390,377 | $ | 4,558,072 | |||||||||
-72-
| 2019 | 2018 | 2017 | ||||||||||
Balance at January 1 | $ | 814,665,224 | $ | 676,671,727 | $ | 606,664,590 | ||||||
Less reinsurance recoverable | (339,267,525 | ) | (293,271,257 | ) | (259,147,147 | ) | ||||||
|
|
|
|
|
| |||||||
Net balance at January 1 | 475,397,699 | 383,400,470 | 347,517,443 | |||||||||
|
|
|
|
|
| |||||||
Incurred related to: | ||||||||||||
Current year | 519,319,941 | 540,826,810 | 480,646,641 | |||||||||
Prior years | (12,932,277 | ) | 35,631,610 | 6,621,413 | ||||||||
|
|
|
|
|
| |||||||
Total incurred | 506,387,664 | 576,458,420 | 487,268,054 | |||||||||
|
|
|
|
|
| |||||||
Paid related to: | ||||||||||||
Current year | 278,923,614 | 308,578,285 | 288,379,600 | |||||||||
Prior years | 195,956,327 | 175,882,906 | 163,005,427 | |||||||||
|
|
|
|
|
| |||||||
Total paid | 474,879,941 | 484,461,191 | 451,385,027 | |||||||||
|
|
|
|
|
| |||||||
Net balance at December 31 | 506,905,422 | 475,397,699 | 383,400,470 | |||||||||
Plus reinsurance recoverable | 362,768,427 | 339,267,525 | 293,271,257 | |||||||||
|
|
|
|
|
| |||||||
Balance at December 31 | $ | 869,673,849 | $ | 814,665,224 | $ | 676,671,727 | ||||||
|
|
|
|
|
| |||||||
2020 | 2019 | 2018 | ||||||||||
Balance at January 1 | $ | 869,673,849 | $ | 814,665,224 | $ | 676,671,727 | ||||||
Less reinsurance recoverable | (362,768,427 | ) | (339,267,525 | ) | (293,271,257 | ) | ||||||
Net balance at January 1 | 506,905,422 | 475,397,699 | 383,400,470 | |||||||||
Incurred related to: | ||||||||||||
Current year | 472,709,060 | 519,319,941 | 540,826,810 | |||||||||
Prior years | (12,944,767 | ) | (12,932,277 | ) | 35,631,610 | |||||||
Total incurred | 459,764,293 | 506,387,664 | 576,458,420 | |||||||||
Paid related to: | ||||||||||||
Current year | 236,984,291 | 278,923,614 | 308,578,285 | |||||||||
Prior years | 172,496,467 | 195,956,327 | 175,882,906 | |||||||||
Total paid | 409,480,758 | 474,879,941 | 484,461,191 | |||||||||
Net balance at December 31 | 557,188,957 | 506,905,422 | 475,397,699 | |||||||||
Plus reinsurance recoverable | 404,818,480 | 362,768,427 | 339,267,525 | |||||||||
Balance at December 31 | $ | 962,007,437 | $ | 869,673,849 | $ | 814,665,224 | ||||||
-73-
-74-
Personal Automobile | At December 31, 2019 | |||||||||||||||||||||||||||||||||||||||||||||||
Incurred Claims and Allocated Claim Adjustment Expenses, Net of Reinsurance For the Year Ended December 31, | ||||||||||||||||||||||||||||||||||||||||||||||||
Accident Year | 2010 | 2011 | 2012 | 2013 | 2014 | 2015 | 2016 | 2017 | 2018 | 2019 | Total IBNR Plus Expected Development on Reported Claims | Cumulative Number of Reported Claims | ||||||||||||||||||||||||||||||||||||
| Unaudited | ||||||||||||||||||||||||||||||||||||||||||||||||
| (dollars and reported claims in thousands) | ||||||||||||||||||||||||||||||||||||||||||||||||
2010 | $ | 117,967 | $ | 117,552 | $ | 118,562 | $ | 118,876 | $ | 118,916 | $ | 118,587 | $ | 118,385 | $ | 118,289 | $ | 118,314 | $ | 118,294 | $ | 27 | 70 | |||||||||||||||||||||||||
2011 | 127,929 | 131,678 | 132,987 | 133,229 | 133,617 | 133,218 | 133,145 | 133,142 | 133,207 | 73 | 75 | |||||||||||||||||||||||||||||||||||||
2012 | 130,415 | 133,201 | 135,592 | 136,493 | 136,552 | 136,463 | 136,141 | 136,677 | 215 | 69 | ||||||||||||||||||||||||||||||||||||||
2013 | 124,965 | 130,737 | 131,594 | 132,643 | 132,604 | 132,934 | 132,853 | 175 | 66 | |||||||||||||||||||||||||||||||||||||||
2014 | 124,426 | 124,806 | 124,210 | 126,200 | 126,779 | 126,734 | 264 | 71 | ||||||||||||||||||||||||||||||||||||||||
2015 | 137,596 | 139,333 | 139,181 | 142,493 | 142,408 | 732 | 70 | |||||||||||||||||||||||||||||||||||||||||
2016 | 150,216 | 153,937 | 157,516 | 157,943 | 2,372 | 73 | ||||||||||||||||||||||||||||||||||||||||||
2017 | 166,690 | 176,728 | 175,939 | 4,884 | 79 | |||||||||||||||||||||||||||||||||||||||||||
2018 | 186,580 | 183,358 | 10,675 | 80 | ||||||||||||||||||||||||||||||||||||||||||||
2019 | 161,056 | 28,339 | 66 | |||||||||||||||||||||||||||||||||||||||||||||
|
| |||||||||||||||||||||||||||||||||||||||||||||||
| Total | $ | 1,468,469 | ||||||||||||||||||||||||||||||||||||||||||||||
|
| |||||||||||||||||||||||||||||||||||||||||||||||
Personal Automobile | ||||||||||||||||||||||||||||||||||||||||
Cumulative Paid Claims and Allocated Claim Adjustment Expenses, Net of Reinsurance For the Year Ended December 31, | ||||||||||||||||||||||||||||||||||||||||
Accident Year | 2010 | 2011 | 2012 | 2013 | 2014 | 2015 | 2016 | 2017 | 2018 | 2019 | ||||||||||||||||||||||||||||||
| Unaudited | ||||||||||||||||||||||||||||||||||||||||
| (in thousands) | ||||||||||||||||||||||||||||||||||||||||
2010 | $ | 75,889 | $ | 96,749 | $ | 107,662 | $ | 113,243 | $ | 116,748 | $ | 117,812 | $ | 117,978 | $ | 118,054 | $ | 118,093 | $ | 118,119 | ||||||||||||||||||||
2011 | 87,191 | 110,249 | 121,621 | 127,545 | 131,319 | 132,479 | 132,714 | 132,777 | 132,835 | |||||||||||||||||||||||||||||||
2012 | 87,517 | 111,941 | 124,652 | 130,862 | 133,428 | 134,581 | 135,132 | 136,137 | ||||||||||||||||||||||||||||||||
2013 | 84,241 | 109,051 | 120,118 | 125,946 | 130,026 | 131,326 | 131,642 | |||||||||||||||||||||||||||||||||
2014 | 85,377 | 104,736 | 114,893 | 120,491 | 123,815 | 124,926 | ||||||||||||||||||||||||||||||||||
2015 | 93,611 | 116,303 | 128,395 | 135,027 | 139,121 | |||||||||||||||||||||||||||||||||||
2016 | 102,433 | 129,507 | 143,321 | 151,159 | ||||||||||||||||||||||||||||||||||||
2017 | 111,964 | 142,372 | 159,879 | |||||||||||||||||||||||||||||||||||||
2018 | 115,585 | 150,175 | ||||||||||||||||||||||||||||||||||||||
2019 | 103,101 | |||||||||||||||||||||||||||||||||||||||
|
| |||||||||||||||||||||||||||||||||||||||
| Total | 1,347,094 | |||||||||||||||||||||||||||||||||||||||
| All outstanding liabilities before 2010, net of reinsurance | 719 | |||||||||||||||||||||||||||||||||||||||
|
| |||||||||||||||||||||||||||||||||||||||
| Liabilities for claims and claims adjustment expenses, net of reinsurance | $ | 122,094 | ||||||||||||||||||||||||||||||||||||||
|
| |||||||||||||||||||||||||||||||||||||||
-75-
Personal Automobile | At December 31, 2020 | |||||||||||||||||||||||||||||||||||||||||||||||
Incurred Claims and Allocated Claim Adjustment Expenses, Net of Reinsurance For the Year Ended December 31, | ||||||||||||||||||||||||||||||||||||||||||||||||
Accident Year | 2011 | 2012 | 2013 | 2014 | 2015 | 2016 | 2017 | 2018 | 2019 | 2020 | Total IBNR Plus Expected Development on Reported Claims | Cumulative Number of Reported Claims | ||||||||||||||||||||||||||||||||||||
| Unaudited | ||||||||||||||||||||||||||||||||||||||||||||||||
| (dollars and reported claims in thousands) | ||||||||||||||||||||||||||||||||||||||||||||||||
2011 | $ | 127,929 | $ | 131,678 | $ | 132,987 | $ | 133,229 | $ | 133,617 | $ | 133,218 | $ | 133,145 | $ | 133,142 | $ | 133,207 | $ | 133,192 | $ | 69 | 75 | |||||||||||||||||||||||||
2012 | 130,415 | 133,201 | 135,592 | 136,493 | 136,552 | 136,463 | 136,141 | 136,677 | 136,648 | 194 | 69 | |||||||||||||||||||||||||||||||||||||
2013 | 124,965 | 130,737 | 131,594 | 132,643 | 132,604 | 132,934 | 132,853 | 132,690 | 136 | 66 | ||||||||||||||||||||||||||||||||||||||
2014 | 124,426 | 124,806 | 124,210 | 126,200 | 126,779 | 126,734 | 126,861 | 219 | 71 | |||||||||||||||||||||||||||||||||||||||
2015 | 137,569 | 139,333 | 139,181 | 142,493 | 142,408 | 142,073 | 499 | 70 | ||||||||||||||||||||||||||||||||||||||||
2016 | 150,216 | 153,937 | 157,516 | 157,943 | 156,935 | 1,349 | 73 | |||||||||||||||||||||||||||||||||||||||||
2017 | 166,690 | 176,728 | 175,939 | 174,784 | 2,567 | 79 | ||||||||||||||||||||||||||||||||||||||||||
2018 | 186,580 | 183,358 | 181,558 | 5,837 | 81 | |||||||||||||||||||||||||||||||||||||||||||
2019 | 161,056 | 157,689 | 10,276 | 68 | ||||||||||||||||||||||||||||||||||||||||||||
2020 | 111,483 | 25,587 | 42 | |||||||||||||||||||||||||||||||||||||||||||||
| Total | $ | 1,453,913 | ||||||||||||||||||||||||||||||||||||||||||||||
Personal Automobile | ||||||||||||||||||||||||||||||||||||||||
Cumulative Paid Claims and Allocated Claim Adjustment Expenses, Net of Reinsurance For the Year Ended December 31, | ||||||||||||||||||||||||||||||||||||||||
Accident Year | 2011 | 2012 | 2013 | 2014 | 2015 | 2016 | 2017 | 2018 | 2019 | 2020 | ||||||||||||||||||||||||||||||
Unaudited | ||||||||||||||||||||||||||||||||||||||||
(in thousands) | ||||||||||||||||||||||||||||||||||||||||
2011 | $ | 87,191 | $ | 110,249 | $ | 121,621 | $ | 127,545 | $ | 131,319 | $ | 132,479 | $ | 132,714 | $ | 132,777 | $ | 132,835 | $ | 133,002 | ||||||||||||||||||||
2012 | 87,517 | 111,941 | 124,652 | 130,862 | 133,428 | 134,581 | 135,132 | 136,137 | 136,165 | |||||||||||||||||||||||||||||||
2013 | 84,241 | 109,051 | 120,118 | 125,946 | 130,026 | 131,326 | 131,642 | 132,215 | ||||||||||||||||||||||||||||||||
2014 | 85,377 | 104,736 | 114,893 | 120,491 | 123,815 | 124,926 | 125,619 | |||||||||||||||||||||||||||||||||
2015 | 93,611 | 116,303 | 128,395 | 135,027 | 139,121 | 140,028 | ||||||||||||||||||||||||||||||||||
2016 | 102,433 | 129,507 | 143,321 | 151,159 | 153,521 | |||||||||||||||||||||||||||||||||||
2017 | 111,964 | 142,372 | 159,879 | 166,099 | ||||||||||||||||||||||||||||||||||||
2018 | 115,585 | 150,175 | 163,036 | |||||||||||||||||||||||||||||||||||||
2019 | 103,101 | 127,187 | ||||||||||||||||||||||||||||||||||||||
2020 | 66,084 | |||||||||||||||||||||||||||||||||||||||
| Total | 1,342,956 | |||||||||||||||||||||||||||||||||||||||
| All outstanding liabilities before 2011, net of reinsurance | 647 | |||||||||||||||||||||||||||||||||||||||
| Liabilities for claims and claims adjustment expenses, net of reinsurance | $ | 111,604 | ||||||||||||||||||||||||||||||||||||||
Homeowners | At December 31, 2019 | |||||||||||||||||||||||||||||||||||||||||||||||
Incurred Claims and Allocated Claim Adjustment Expenses, Net of Reinsurance For the Year Ended December 31, | ||||||||||||||||||||||||||||||||||||||||||||||||
Accident Year | 2010 | 2011 | 2012 | 2013 | 2014 | 2015 | 2016 | 2017 | 2018 | 2019 | Total IBNR Plus Expected Development on Reported Claims | Cumulative Number of Reported Claims | ||||||||||||||||||||||||||||||||||||
| Unaudited | ||||||||||||||||||||||||||||||||||||||||||||||||
| (dollars and reported claims in thousands) | ||||||||||||||||||||||||||||||||||||||||||||||||
2010 | $ | 60,315 | $ | 60,729 | $ | 60,248 | $ | 59,972 | $ | 60,355 | $ | 60,440 | $ | 60,443 | $ | 60,542 | $ | 60,624 | $ | 60,641 | $ | — | 25 | |||||||||||||||||||||||||
2011 | 71,256 | 70,461 | 70,436 | 70,381 | 70,297 | 70,351 | 70,479 | 70,642 | 70,682 | — | 27 | |||||||||||||||||||||||||||||||||||||
2012 | 53,962 | 54,794 | 54,468 | 54,351 | 54,281 | 54,381 | 54,523 | 54,537 | — | 19 | ||||||||||||||||||||||||||||||||||||||
2013 | 50,887 | 51,121 | 51,122 | 50,874 | 50,988 | 50,971 | 51,008 | — | 13 | |||||||||||||||||||||||||||||||||||||||
2014 | 56,916 | 58,378 | 57,680 | 57,332 | 57,288 | 57,402 | (4 | ) | 18 | |||||||||||||||||||||||||||||||||||||||
2015 | 63,359 | 63,925 | 63,053 | 63,071 | 63,099 | 45 | 14 | |||||||||||||||||||||||||||||||||||||||||
2016 | 62,443 | 64,064 | 63,735 | 63,355 | 78 | 13 | ||||||||||||||||||||||||||||||||||||||||||
2017 | 79,283 | 79,911 | 79,305 | 724 | 18 | |||||||||||||||||||||||||||||||||||||||||||
2018 | 81,965 | 83,385 | 1,657 | 19 | ||||||||||||||||||||||||||||||||||||||||||||
2019 | 73,294 | 6,775 | 14 | |||||||||||||||||||||||||||||||||||||||||||||
|
| |||||||||||||||||||||||||||||||||||||||||||||||
| Total | $ | 656,708 | ||||||||||||||||||||||||||||||||||||||||||||||
|
| |||||||||||||||||||||||||||||||||||||||||||||||
Homeowners | ||||||||||||||||||||||||||||||||||||||||
Cumulative Paid Claims and Allocated Claim Adjustment Expenses, Net of Reinsurance For the Year Ended December 31, | ||||||||||||||||||||||||||||||||||||||||
Accident Year | 2010 | 2011 | 2012 | 2013 | 2014 | 2015 | 2016 | 2017 | 2018 | 2019 | ||||||||||||||||||||||||||||||
| Unaudited | ||||||||||||||||||||||||||||||||||||||||
| (in thousands) | ||||||||||||||||||||||||||||||||||||||||
2010 | $ | 47,419 | $ | 57,334 | $ | 59,283 | $ | 59,875 | $ | 60,239 | $ | 60,486 | $ | 60,501 | $ | 60,525 | $ | 60,540 | $ | 60,557 | ||||||||||||||||||||
2011 | 57,588 | 69,345 | 70,125 | 70,351 | 70,541 | 70,626 | 70,648 | 70,692 | 70,692 | |||||||||||||||||||||||||||||||
2012 | 46,566 | 53,619 | 54,028 | 54,298 | 54,317 | 54,356 | 54,557 | 54,557 | ||||||||||||||||||||||||||||||||
2013 | 40,949 | 49,410 | 50,210 | 50,478 | 51,043 | 50,902 | 50,967 | |||||||||||||||||||||||||||||||||
2014 | 45,823 | 56,255 | 56,990 | 57,195 | 56,995 | 57,243 | ||||||||||||||||||||||||||||||||||
2015 | 51,885 | 61,542 | 62,204 | 62,590 | 62,844 | |||||||||||||||||||||||||||||||||||
2016 | 50,125 | 61,145 | 62,760 | 63,144 | ||||||||||||||||||||||||||||||||||||
2017 | 67,077 | 77,663 | 78,006 | |||||||||||||||||||||||||||||||||||||
2018 | 70,385 | 79,892 | ||||||||||||||||||||||||||||||||||||||
2019 | 58,074 | |||||||||||||||||||||||||||||||||||||||
|
| |||||||||||||||||||||||||||||||||||||||
| Total | 635,976 | |||||||||||||||||||||||||||||||||||||||
| All outstanding liabilities before 2010, net of reinsurance | 30 | |||||||||||||||||||||||||||||||||||||||
|
| |||||||||||||||||||||||||||||||||||||||
| | Liabilities for claims and claims adjustment expenses, net of | | $ | 20,762 | ||||||||||||||||||||||||||||||||||||
|
| |||||||||||||||||||||||||||||||||||||||
-76-
Homeowners | At December 31, 2020 | |||||||||||||||||||||||||||||||||||||||||||||||
Incurred Claims and Allocated Claim Adjustment Expenses, Net of Reinsurance For the Year Ended December 31, | ||||||||||||||||||||||||||||||||||||||||||||||||
Accident Year | 2011 | 2012 | 2013 | 2014 | 2015 | 2016 | 2017 | 2018 | 2019 | 2020 | Total IBNR Plus Expected Development on Reported Claims | Cumulative Number of Reported Claims | ||||||||||||||||||||||||||||||||||||
| Unaudited | ||||||||||||||||||||||||||||||||||||||||||||||||
| (dollars and reported claims in thousands) | ||||||||||||||||||||||||||||||||||||||||||||||||
2011 | $ | 71,256 | $ | 70,461 | $ | 70,436 | $ | 70,381 | $ | 70,297 | $ | 70,351 | $ | 70,479 | $ | 70,642 | $ | 70,682 | $ | 70,689 | $ | 0 | 26 | |||||||||||||||||||||||||
2012 | 53,962 | 54,794 | 54,468 | 54,351 | 54,281 | 54,381 | 54,523 | 54,557 | 54,548 | 0 | 18 | |||||||||||||||||||||||||||||||||||||
2013 | 50,887 | 51,121 | 51,122 | 50,874 | 50,988 | 50,971 | 51,008 | 51,064 | 0 | 12 | ||||||||||||||||||||||||||||||||||||||
2014 | 56,916 | 58,378 | 57,680 | 57,332 | 57,288 | 57,402 | 57,367 | 0 | 17 | |||||||||||||||||||||||||||||||||||||||
2015 | 63,359 | 63,925 | 63,053 | 63,071 | 63,099 | 62,993 | 28 | 13 | ||||||||||||||||||||||||||||||||||||||||
2016 | 62,443 | 64,064 | 63,735 | 63,355 | 63,279 | 25 | 12 | |||||||||||||||||||||||||||||||||||||||||
2017 | 79,283 | 79,911 | 79,305 | 79,247 | 342 | 17 | ||||||||||||||||||||||||||||||||||||||||||
2018 | 81,965 | 83,385 | 82,905 | 838 | 19 | |||||||||||||||||||||||||||||||||||||||||||
2019 | 73,294 | 73,554 | 1,830 | 15 | ||||||||||||||||||||||||||||||||||||||||||||
2020 | 61,633 | 6,235 | 12 | |||||||||||||||||||||||||||||||||||||||||||||
| Total | $ | 657,279 | ||||||||||||||||||||||||||||||||||||||||||||||
Homeowners | ||||||||||||||||||||||||||||||||||||||||
Cumulative Paid Claims and Allocated Claim Adjustment Expenses, Net of Reinsurance For the Year Ended December 31, | ||||||||||||||||||||||||||||||||||||||||
Accident Year | 2011 | 2012 | 2013 | 2014 | 2015 | 2016 | 2017 | 2018 | 2019 | 2020 | ||||||||||||||||||||||||||||||
Unaudited | ||||||||||||||||||||||||||||||||||||||||
(in thousands) | ||||||||||||||||||||||||||||||||||||||||
2011 | $ | 57,588 | $ | 69,345 | $ | 70,125 | $ | 70,351 | $ | 70,541 | $ | 70,626 | $ | 70,648 | $ | 70,692 | $ | 70,692 | $ | 70,693 | ||||||||||||||||||||
2012 | 46,566 | 53,619 | 54,028 | 54,298 | 54,317 | 54,356 | 54,557 | 54,557 | 54,553 | |||||||||||||||||||||||||||||||
2013 | 40,949 | 49,410 | 50,210 | 50,478 | 51,043 | 50,902 | 50,967 | 50,965 | ||||||||||||||||||||||||||||||||
2014 | 45,823 | 56,255 | 56,990 | 57,195 | 56,995 | 57,243 | 57,336 | |||||||||||||||||||||||||||||||||
2015 | 51,885 | 61,542 | 62,204 | 62,590 | 62,844 | 62,943 | ||||||||||||||||||||||||||||||||||
2016 | 50,125 | 61,145 | 62,760 | 63,144 | 63,162 | |||||||||||||||||||||||||||||||||||
2017 | 67,077 | 77,663 | 78,006 | 78,127 | ||||||||||||||||||||||||||||||||||||
2018 | 70,385 | 79,892 | 80,905 | |||||||||||||||||||||||||||||||||||||
2019 | 58,074 | 69,145 | ||||||||||||||||||||||||||||||||||||||
2020 | 51,226 | |||||||||||||||||||||||||||||||||||||||
| Total | 639,055 | |||||||||||||||||||||||||||||||||||||||
| All outstanding liabilities before 2011, net of reinsurance | 99 | |||||||||||||||||||||||||||||||||||||||
| Liabilities for claims and claims adjustment expenses, net of reinsurance | $ | 18,323 | ||||||||||||||||||||||||||||||||||||||
Commercial Automobile | At December 31, 2019 | |||||||||||||||||||||||||||||||||||||||||||||||
Incurred Claims and Allocated Claim Adjustment Expenses, Net of Reinsurance For the Year Ended December 31, | ||||||||||||||||||||||||||||||||||||||||||||||||
Accident Year | 2010 | 2011 | 2012 | 2013 | 2014 | 2015 | 2016 | 2017 | 2018 | 2019 | Total IBNR Plus Expected Development on Reported Claims | Cumulative Number of Reported Claims | ||||||||||||||||||||||||||||||||||||
| Unaudited | ||||||||||||||||||||||||||||||||||||||||||||||||
| (dollars and reported claims in thousands) | ||||||||||||||||||||||||||||||||||||||||||||||||
2010 | $ | 19,315 | $ | 19,913 | $ | 20,695 | $ | 21,477 | $ | 21,490 | $ | 21,756 | $ | 21,746 | $ | 21,713 | $ | 21,726 | $ | 21,768 | $ | 9 | 7 | |||||||||||||||||||||||||
2011 | 26,642 | 27,157 | 28,570 | 28,893 | 29,112 | 29,107 | 29,487 | 29,751 | 29,542 | 18 | 9 | |||||||||||||||||||||||||||||||||||||
2012 | 26,557 | 27,720 | 30,606 | 31,435 | 31,278 | 31,648 | 31,803 | 31,896 | 28 | 8 | ||||||||||||||||||||||||||||||||||||||
2013 | 32,902 | 33,749 | 34,751 | 35,240 | 36,404 | 36,435 | 36,569 | 89 | 9 | |||||||||||||||||||||||||||||||||||||||
2014 | 42,760 | 44,544 | 47,326 | 48,213 | 49,284 | 49,168 | 270 | 11 | ||||||||||||||||||||||||||||||||||||||||
2015 | 46,526 | 48,323 | 51,412 | 54,259 | 54,517 | 662 | 12 | |||||||||||||||||||||||||||||||||||||||||
2016 | 54,302 | 57,353 | 65,905 | 67,127 | 2,134 | 13 | ||||||||||||||||||||||||||||||||||||||||||
2017 | 61,484 | 67,927 | 67,697 | 5,149 | 14 | |||||||||||||||||||||||||||||||||||||||||||
2018 | 79,307 | 81,396 | 11,763 | 15 | ||||||||||||||||||||||||||||||||||||||||||||
2019 | 88,864 | 27,764 | 15 | |||||||||||||||||||||||||||||||||||||||||||||
|
| |||||||||||||||||||||||||||||||||||||||||||||||
| Total | $ | 528,544 | ||||||||||||||||||||||||||||||||||||||||||||||
|
| |||||||||||||||||||||||||||||||||||||||||||||||
Commercial Automobile | ||||||||||||||||||||||||||||||||||||||||
Cumulative Paid Claims and Allocated Claim Adjustment Expenses, Net of Reinsurance For the Year Ended December 31, | ||||||||||||||||||||||||||||||||||||||||
Accident Year | 2010 | 2011 | 2012 | 2013 | 2014 | 2015 | 2016 | 2017 | 2018 | 2019 | ||||||||||||||||||||||||||||||
| Unaudited | ||||||||||||||||||||||||||||||||||||||||
| (in thousands) | ||||||||||||||||||||||||||||||||||||||||
2010 | $ | 10,778 | $ | 14,180 | $ | 16,426 | $ | 19,030 | $ | 20,804 | $ | 21,014 | $ | 21,482 | $ | 21,549 | $ | 21,558 | $ | 21,559 | ||||||||||||||||||||
2011 | 13,876 | 19,106 | 24,267 | 26,973 | 28,014 | 28,758 | 28,836 | 29,102 | 29,474 | |||||||||||||||||||||||||||||||
2012 | 13,642 | 20,240 | 23,718 | 27,417 | 29,873 | 30,402 | 31,104 | 31,228 | ||||||||||||||||||||||||||||||||
2013 | 16,306 | 23,557 | 26,879 | 31,053 | 34,083 | 36,004 | 36,106 | |||||||||||||||||||||||||||||||||
2014 | 22,707 | 31,089 | 39,436 | 44,374 | 47,290 | 48,418 | ||||||||||||||||||||||||||||||||||
2015 | 23,875 | 35,342 | 41,678 | 48,261 | 51,605 | |||||||||||||||||||||||||||||||||||
2016 | 27,033 | 38,237 | 48,837 | 57,237 | ||||||||||||||||||||||||||||||||||||
2017 | 28,707 | 40,213 | 49,703 | |||||||||||||||||||||||||||||||||||||
2018 | 33,862 | 47,941 | ||||||||||||||||||||||||||||||||||||||
2019 | 36,948 | |||||||||||||||||||||||||||||||||||||||
|
| |||||||||||||||||||||||||||||||||||||||
| Total | 410,219 | |||||||||||||||||||||||||||||||||||||||
| All outstanding liabilities before 2010, net of reinsurance | 47 | |||||||||||||||||||||||||||||||||||||||
|
| |||||||||||||||||||||||||||||||||||||||
| | Liabilities for claims and claims adjustment expenses, net of | | $ | 118,372 | ||||||||||||||||||||||||||||||||||||
|
| |||||||||||||||||||||||||||||||||||||||
-77-
Commercial Automobile | At December 31, 2020 | |||||||||||||||||||||||||||||||||||||||||||||||
Incurred Claims and Allocated Claim Adjustment Expenses, Net of Reinsurance For the Year Ended December 31, | ||||||||||||||||||||||||||||||||||||||||||||||||
Accident Year | 2011 | 2012 | 2013 | 2014 | 2015 | 2016 | 2017 | 2018 | 2019 | 2020 | Total IBNR Plus Expected Development on Reported Claims | Cumulative Number of Reported Claims | ||||||||||||||||||||||||||||||||||||
| Unaudited | ||||||||||||||||||||||||||||||||||||||||||||||||
| (dollars and reported claims in thousands) | ||||||||||||||||||||||||||||||||||||||||||||||||
2011 | $ | 26,642 | $ | 27,157 | $ | 28,570 | $ | 28,893 | $ | 29,112 | $ | 29,107 | $ | 29,487 | $ | 29,751 | $ | 29,542 | $ | 29,493 | $ | 17 | 4 | |||||||||||||||||||||||||
2012 | 26,557 | 27,720 | 30,606 | 31,435 | 31,278 | 31,648 | 31,803 | 31,896 | 31,930 | 27 | 8 | |||||||||||||||||||||||||||||||||||||
2013 | 32,902 | 33,749 | 34,751 | 35,240 | 36,404 | 36,435 | 36,569 | 36,181 | 64 | 8 | ||||||||||||||||||||||||||||||||||||||
2014 | 42,760 | 44,544 | 47,326 | 48,213 | 49,284 | 49,168 | 49,308 | 192 | 11 | |||||||||||||||||||||||||||||||||||||||
2015 | 46,526 | 48,323 | 51,412 | 54,259 | 54,517 | 54,619 | 452 | 12 | ||||||||||||||||||||||||||||||||||||||||
2016 | 54,302 | 57,353 | 65,905 | 67,127 | 66,894 | 861 | 13 | |||||||||||||||||||||||||||||||||||||||||
2017 | 61,484 | 67,927 | 67,697 | 67,249 | 2,823 | 13 | ||||||||||||||||||||||||||||||||||||||||||
2018 | 79,307 | 81,396 | 82,313 | 5,254 | 15 | |||||||||||||||||||||||||||||||||||||||||||
2019 | 88,864 | 91,245 | 15,356 | 15 | ||||||||||||||||||||||||||||||||||||||||||||
2020 | 90,367 | 32,130 | 13 | |||||||||||||||||||||||||||||||||||||||||||||
| Total | $ | 599,599 | ||||||||||||||||||||||||||||||||||||||||||||||
Commercial Automobile | ||||||||||||||||||||||||||||||||||||||||
Cumulative Paid Claims and Allocated Claim Adjustment Expenses, Net of Reinsurance For the Year Ended December 31, | ||||||||||||||||||||||||||||||||||||||||
Accident Year | 2011 | 2012 | 2013 | 2014 | 2015 | 2016 | 2017 | 2018 | 2019 | 2020 | ||||||||||||||||||||||||||||||
Unaudited | ||||||||||||||||||||||||||||||||||||||||
(in thousands) | ||||||||||||||||||||||||||||||||||||||||
2011 | $ | 13,876 | $ | 19,106 | $ | 24,267 | $ | 26,973 | $ | 28,014 | $ | 28,758 | $ | 28,836 | $ | 29,102 | $ | 29,474 | $ | 29,476 | ||||||||||||||||||||
2012 | 13,642 | 20,240 | 23,718 | 27,417 | 29,873 | 30,402 | 31,104 | 31,228 | 31,263 | |||||||||||||||||||||||||||||||
2013 | 16,306 | 23,557 | 26,879 | 31,053 | 34,083 | 36,004 | 36,106 | 36,092 | ||||||||||||||||||||||||||||||||
2014 | 22,707 | 31,089 | 39,436 | 44,374 | 47,290 | 48,418 | 48,603 | |||||||||||||||||||||||||||||||||
2015 | 23,875 | 35,342 | 41,678 | 48,261 | 51,605 | 51,992 | ||||||||||||||||||||||||||||||||||
2016 | 27,033 | 38,237 | 48,837 | 57,237 | 60,485 | |||||||||||||||||||||||||||||||||||
2017 | 28,707 | 40,213 | 49,703 | 57,128 | ||||||||||||||||||||||||||||||||||||
2018 | 33,862 | 47,941 | 57,451 | |||||||||||||||||||||||||||||||||||||
2019 | 36,948 | 53,026 | ||||||||||||||||||||||||||||||||||||||
2020 | 31,884 | |||||||||||||||||||||||||||||||||||||||
| Total | 457,400 | |||||||||||||||||||||||||||||||||||||||
| All outstanding liabilities before 2011, net of reinsurance | 244 | |||||||||||||||||||||||||||||||||||||||
| Liabilities for claims and claims adjustment expenses, net of reinsurance | $ | 142,443 | ||||||||||||||||||||||||||||||||||||||
Commercial | At December 31, 2019 | |||||||||||||||||||||||||||||||||||||||||||||||
Incurred Claims and Allocated Claim Adjustment Expenses, Net of Reinsurance For the Year Ended December 31, | ||||||||||||||||||||||||||||||||||||||||||||||||
Accident Year | 2010 | 2011 | 2012 | 2013 | 2014 | 2015 | 2016 | 2017 | 2018 | 2019 | Total IBNR Plus Expected Development on Reported Claims | Cumulative Number of Reported Claims | ||||||||||||||||||||||||||||||||||||
| Unaudited | ||||||||||||||||||||||||||||||||||||||||||||||||
| (dollars and reported claims in thousands) | ||||||||||||||||||||||||||||||||||||||||||||||||
2010 | $ | 28,745 | $ | 29,656 | $ | 29,390 | $ | 29,169 | $ | 29,373 | $ | 29,453 | $ | 29,463 | $ | 29,779 | $ | 29,925 | $ | 30,105 | $ | — | 6 | |||||||||||||||||||||||||
2011 | 33,054 | 35,411 | 35,942 | 37,576 | 37,385 | 38,270 | 38,105 | 38,160 | 38,434 | — | 7 | |||||||||||||||||||||||||||||||||||||
2012 | 29,789 | 30,716 | 32,449 | 34,117 | 35,755 | 36,214 | 36,525 | 36,876 | — | 6 | ||||||||||||||||||||||||||||||||||||||
2013 | 35,683 | 35,679 | 37,292 | 37,205 | 37,981 | 37,365 | 37,453 | 38 | 6 | |||||||||||||||||||||||||||||||||||||||
2014 | 48,204 | 50,135 | 51,843 | 52,336 | 53,294 | 53,116 | 147 | 7 | ||||||||||||||||||||||||||||||||||||||||
2015 | 42,070 | 43,874 | 44,728 | 45,104 | 45,873 | 519 | 6 | |||||||||||||||||||||||||||||||||||||||||
2016 | 43,005 | 46,988 | 48,267 | 48,871 | 2,015 | 6 | ||||||||||||||||||||||||||||||||||||||||||
2017 | 56,185 | 56,043 | 56,517 | 4,604 | 7 | |||||||||||||||||||||||||||||||||||||||||||
2018 | 66,265 | 66,470 | 10,568 | 7 | ||||||||||||||||||||||||||||||||||||||||||||
2019 | 71,865 | 21,633 | 6 | |||||||||||||||||||||||||||||||||||||||||||||
|
| |||||||||||||||||||||||||||||||||||||||||||||||
| Total | $ | 485,580 | ||||||||||||||||||||||||||||||||||||||||||||||
|
| |||||||||||||||||||||||||||||||||||||||||||||||
Commercial Multi-Peril | ||||||||||||||||||||||||||||||||||||||||
Cumulative Paid Claims and Allocated Claim Adjustment Expenses, Net of Reinsurance For the Year Ended December 31, | ||||||||||||||||||||||||||||||||||||||||
Accident Year | 2010 | 2011 | 2012 | 2013 | 2014 | 2015 | 2016 | 2017 | 2018 | 2019 | ||||||||||||||||||||||||||||||
| Unaudited | ||||||||||||||||||||||||||||||||||||||||
| (in thousands) | ||||||||||||||||||||||||||||||||||||||||
2010 | $ | 17,007 | $ | 22,017 | $ | 24,749 | $ | 26,832 | $ | 27,768 | $ | 28,681 | $ | 28,906 | $ | 29,632 | $ | 29,721 | $ | 29,923 | ||||||||||||||||||||
2011 | 18,773 | 24,767 | 30,286 | 33,526 | 36,722 | 37,759 | 38,240 | 38,366 | 38,413 | |||||||||||||||||||||||||||||||
2012 | 16,666 | 23,384 | 26,634 | 29,370 | 33,327 | 35,331 | 35,909 | 36,329 | ||||||||||||||||||||||||||||||||
2013 | 19,875 | 26,216 | 29,159 | 33,614 | 35,104 | 36,321 | 37,333 | |||||||||||||||||||||||||||||||||
2014 | 27,920 | 35,520 | 40,936 | 47,021 | 50,017 | 51,615 | ||||||||||||||||||||||||||||||||||
2015 | 21,837 | 29,419 | 34,323 | 39,162 | 42,849 | |||||||||||||||||||||||||||||||||||
2016 | 19,660 | 29,402 | 34,612 | 41,193 | ||||||||||||||||||||||||||||||||||||
2017 | 27,399 | 36,926 | 42,691 | |||||||||||||||||||||||||||||||||||||
2018 | 30,597 | 42,296 | ||||||||||||||||||||||||||||||||||||||
2019 | 28,210 | |||||||||||||||||||||||||||||||||||||||
|
| |||||||||||||||||||||||||||||||||||||||
| Total | 390,852 | |||||||||||||||||||||||||||||||||||||||
| All outstanding liabilities before 2010, net of reinsurance | 425 | |||||||||||||||||||||||||||||||||||||||
|
| |||||||||||||||||||||||||||||||||||||||
| | Liabilities for claims and claims adjustment expenses, net of | | $ | 95,153 | ||||||||||||||||||||||||||||||||||||
|
| |||||||||||||||||||||||||||||||||||||||
-78-
Commercial Multi-Peril | At December 31, 2020 | |||||||||||||||||||||||||||||||||||||||||||||||
Incurred Claims and Allocated Claim Adjustment Expenses, Net of Reinsurance For the Year Ended December 31, | ||||||||||||||||||||||||||||||||||||||||||||||||
Accident Year | 2011 | 2012 | 2013 | 2014 | 2015 | 2016 | 2017 | 2018 | 2019 | 2020 | Total IBNR Plus Expected Development on Reported Claims | Cumulative Number of Reported Claims | ||||||||||||||||||||||||||||||||||||
| Unaudited | ||||||||||||||||||||||||||||||||||||||||||||||||
| (dollars and reported claims in thousands) | ||||||||||||||||||||||||||||||||||||||||||||||||
2011 | $ | 33,054 | $ | 35,411 | $ | 35,942 | $ | 37,576 | $ | 37,385 | $ | 38,270 | $ | 38,105 | $ | 38,160 | $ | 38,434 | $ | 38,478 | $ | 0 | 7 | |||||||||||||||||||||||||
2012 | 29,789 | 30,716 | 32,449 | 34,117 | 35,755 | 36,214 | 36,525 | 36,876 | 36,662 | 0 | 6 | |||||||||||||||||||||||||||||||||||||
2013 | 35,683 | 35,679 | 37,292 | 37,205 | 37,981 | 37,365 | 37,453 | 37,495 | (1 | ) | 6 | |||||||||||||||||||||||||||||||||||||
2014 | 48,204 | 50,135 | 51,843 | 52,336 | 53,294 | 53,116 | 52,926 | 119 | 7 | |||||||||||||||||||||||||||||||||||||||
2015 | 42,070 | 43,874 | 44,728 | 45,104 | 45,873 | 45,366 | 186 | 6 | ||||||||||||||||||||||||||||||||||||||||
2016 | 43,005 | 46,988 | 48,267 | 48,871 | 48,732 | 857 | 6 | |||||||||||||||||||||||||||||||||||||||||
2017 | 56,185 | 56,043 | 56,517 | 54,812 | 2,253 | 7 | ||||||||||||||||||||||||||||||||||||||||||
2018 | 66,265 | 66,470 | 67,749 | 6,243 | 7 | |||||||||||||||||||||||||||||||||||||||||||
2019 | 71,865 | 73,836 | 12,530 | 7 | ||||||||||||||||||||||||||||||||||||||||||||
2020 | 83,195 | 26,981 | 7 | |||||||||||||||||||||||||||||||||||||||||||||
| Total | $ | 539,251 | ||||||||||||||||||||||||||||||||||||||||||||||
Commercial Multi-Peril | ||||||||||||||||||||||||||||||||||||||||
Cumulative Paid Claims and Allocated Claim Adjustment Expenses, Net of Reinsurance For the Year Ended December 31, | ||||||||||||||||||||||||||||||||||||||||
Accident Year | 2011 | 2012 | 2013 | 2014 | 2015 | 2016 | 2017 | 2018 | 2019 | 2020 | ||||||||||||||||||||||||||||||
Unaudited | ||||||||||||||||||||||||||||||||||||||||
| (in thousands) | ||||||||||||||||||||||||||||||||||||||||
2011 | $ | 18,773 | $ | 24,767 | $ | 30,286 | $ | 33,526 | $ | 36,722 | $ | 37,759 | $ | 38,240 | $ | 38,366 | $ | 38,413 | $ | 38,457 | ||||||||||||||||||||
2012 | 16,666 | 23,384 | 26,634 | 29,370 | 33,327 | 35,331 | 35,909 | 36,329 | 36,399 | |||||||||||||||||||||||||||||||
2013 | 19,875 | 26,216 | 29,159 | 33,614 | 35,104 | 36,321 | 37,333 | 37,436 | ||||||||||||||||||||||||||||||||
2014 | 27,920 | 35,520 | 40,936 | 47,021 | 50,017 | 51,615 | 52,103 | |||||||||||||||||||||||||||||||||
2015 | 21,837 | 29,419 | 34,323 | 39,162 | 42,849 | 44,090 | ||||||||||||||||||||||||||||||||||
2016 | 19,660 | 29,402 | 34,612 | 41,193 | 43,435 | |||||||||||||||||||||||||||||||||||
2017 | 27,399 | 36,926 | 42,691 | 46,361 | ||||||||||||||||||||||||||||||||||||
2018 | 30,597 | 42,296 | 48,050 | |||||||||||||||||||||||||||||||||||||
2019 | 28,210 | 41,266 | ||||||||||||||||||||||||||||||||||||||
2020 | 34,729 | |||||||||||||||||||||||||||||||||||||||
| Total | 422,326 | |||||||||||||||||||||||||||||||||||||||
| All outstanding liabilities before 2011, net of reinsurance | 612 | |||||||||||||||||||||||||||||||||||||||
Liabilities for claims and claims adjustment expenses, net of reinsurance | | $ | 117,537 | |||||||||||||||||||||||||||||||||||||
Workers’ Compensation | At December 31, 2019 | |||||||||||||||||||||||||||||||||||||||||||||||
Incurred Claims and Allocated Claim Adjustment Expenses, Net of Reinsurance For the Year Ended December 31, | ||||||||||||||||||||||||||||||||||||||||||||||||
Accident Year | 2010 | 2011 | 2012 | 2013 | 2014 | 2015 | 2016 | 2017 | 2018 | 2019 | Total IBNR Plus Expected Development on Reported Claims | Cumulative Number of Reported Claims | ||||||||||||||||||||||||||||||||||||
| Unaudited | ||||||||||||||||||||||||||||||||||||||||||||||||
| (dollars and reported claims in thousands) | ||||||||||||||||||||||||||||||||||||||||||||||||
2010 | $ | 27,304 | $ | 27,859 | $ | 27,010 | $ | 26,637 | $ | 26,944 | $ | 27,121 | $ | 27,037 | $ | 26,984 | $ | 26,801 | $ | 26,829 | $ | 37 | 5 | |||||||||||||||||||||||||
2011 | 32,490 | 35,757 | 36,614 | 36,369 | 35,670 | 35,039 | 35,194 | 34,926 | 35,034 | 53 | 6 | |||||||||||||||||||||||||||||||||||||
2012 | 39,142 | 39,516 | 38,827 | 37,926 | 37,163 | 36,468 | 35,954 | 35,932 | 75 | 6 | ||||||||||||||||||||||||||||||||||||||
2013 | 46,325 | 47,027 | 44,289 | 42,828 | 42,327 | 42,555 | 42,651 | 187 | 6 | |||||||||||||||||||||||||||||||||||||||
2014 | 51,508 | 51,553 | 49,288 | 48,537 | 47,540 | 47,693 | 264 | 6 | ||||||||||||||||||||||||||||||||||||||||
2015 | 53,332 | 49,615 | 45,991 | 44,986 | 43,006 | 836 | 6 | |||||||||||||||||||||||||||||||||||||||||
2016 | 58,814 | 49,802 | 47,883 | 44,969 | 1,630 | 6 | ||||||||||||||||||||||||||||||||||||||||||
2017 | 60,450 | 56,351 | 52,687 | 3,362 | 6 | |||||||||||||||||||||||||||||||||||||||||||
2018 | 62,197 | 55,291 | 7,081 | 6 | ||||||||||||||||||||||||||||||||||||||||||||
2019 | 60,998 | 19,280 | 6 | |||||||||||||||||||||||||||||||||||||||||||||
|
| |||||||||||||||||||||||||||||||||||||||||||||||
| Total | $ | 445,090 | ||||||||||||||||||||||||||||||||||||||||||||||
|
| |||||||||||||||||||||||||||||||||||||||||||||||
Workers’ Compensation | ||||||||||||||||||||||||||||||||||||||||
Cumulative Paid Claims and Allocated Claim Adjustment Expenses, Net of Reinsurance For the Year Ended December 31, | ||||||||||||||||||||||||||||||||||||||||
Accident Year | 2010 | 2011 | 2012 | 2013 | 2014 | 2015 | 2016 | 2017 | 2018 | 2019 | ||||||||||||||||||||||||||||||
| Unaudited | ||||||||||||||||||||||||||||||||||||||||
| (in thousands) | ||||||||||||||||||||||||||||||||||||||||
2010 | $ | 8,066 | $ | 15,937 | $ | 21,176 | $ | 23,137 | $ | 24,539 | $ | 25,337 | $ | 25,804 | $ | 26,050 | $ | 26,295 | $ | 26,301 | ||||||||||||||||||||
2011 | 9,157 | 21,450 | 27,517 | 31,905 | 32,394 | 33,067 | 33,577 | 33,963 | 34,109 | |||||||||||||||||||||||||||||||
2012 | 11,097 | 22,963 | 28,812 | 31,244 | 33,196 | 34,177 | 34,460 | 34,622 | ||||||||||||||||||||||||||||||||
2013 | 13,052 | 26,043 | 32,783 | 36,351 | 38,877 | 39,617 | 40,361 | |||||||||||||||||||||||||||||||||
2014 | 13,932 | 28,513 | 36,284 | 40,393 | 42,465 | 43,866 | ||||||||||||||||||||||||||||||||||
2015 | 13,071 | 27,531 | 34,192 | 36,929 | 37,936 | |||||||||||||||||||||||||||||||||||
2016 | 14,709 | 30,344 | 37,178 | 40,570 | ||||||||||||||||||||||||||||||||||||
2017 | 15,581 | 31,990 | 39,684 | |||||||||||||||||||||||||||||||||||||
2018 | 17,644 | 31,928 | ||||||||||||||||||||||||||||||||||||||
2019 | 16,939 | |||||||||||||||||||||||||||||||||||||||
|
| |||||||||||||||||||||||||||||||||||||||
| Total | 346,316 | |||||||||||||||||||||||||||||||||||||||
All outstanding liabilities before 2010, net of reinsurance | 3,261 | |||||||||||||||||||||||||||||||||||||||
|
| |||||||||||||||||||||||||||||||||||||||
| | Liabilities for claims and claims adjustment expenses, net of | | $ | 102,035 | ||||||||||||||||||||||||||||||||||||
|
| |||||||||||||||||||||||||||||||||||||||
-79-
Workers’ Compensation | At December 31, 2020 | |||||||||||||||||||||||||||||||||||||||||||||||
Incurred Claims and Allocated Claim Adjustment Expenses, Net of Reinsurance For the Year Ended December 31, | ||||||||||||||||||||||||||||||||||||||||||||||||
Accident Year | 2011 | 2012 | 2013 | 2014 | 2015 | 2016 | 2017 | 2018 | 2019 | 2020 | Total IBNR Plus Expected Development on Reported Claims | Cumulative Number of Reported Claims | ||||||||||||||||||||||||||||||||||||
| Unaudited | ||||||||||||||||||||||||||||||||||||||||||||||||
| (dollars and reported claims in thousands) | ||||||||||||||||||||||||||||||||||||||||||||||||
2011 | $ | 32,490 | $ | 35,757 | $ | 36,614 | $ | 36,369 | $ | 35,670 | $ | 35,039 | $ | 35,194 | $ | 34,926 | $ | 35,034 | $ | 35,045 | $ | 27 | 5 | |||||||||||||||||||||||||
2012 | 39,142 | 39,516 | 38,827 | 37,926 | 37,163 | 36,468 | 35,954 | 35,932 | 36,014 | 69 | 5 | |||||||||||||||||||||||||||||||||||||
2013 | 46,325 | 47,027 | 44,289 | 42,828 | 42,327 | 42,555 | 42,651 | 42,341 | 116 | 6 | ||||||||||||||||||||||||||||||||||||||
2014 | 51,508 | 51,553 | 49,288 | 48,537 | 47,540 | 47,693 | 47,849 | 193 | 6 | |||||||||||||||||||||||||||||||||||||||
2015 | 53,332 | 49,615 | 45,991 | 44,986 | 43,006 | 42,597 | 548 | 5 | ||||||||||||||||||||||||||||||||||||||||
2016 | 58,814 | 49,802 | 47,883 | 44,969 | 44,098 | 840 | 5 | |||||||||||||||||||||||||||||||||||||||||
2017 | 60,450 | 56,351 | 52,687 | 51,464 | 2,742 | 5 | ||||||||||||||||||||||||||||||||||||||||||
2018 | 62,197 | 55,291 | 52,514 | 4,114 | 6 | |||||||||||||||||||||||||||||||||||||||||||
2019 | 60,998 | 59,624 | 7,825 | 6 | ||||||||||||||||||||||||||||||||||||||||||||
2020 | 57,172 | 19,283 | 5 | |||||||||||||||||||||||||||||||||||||||||||||
| Total | $ | 468,718 | ||||||||||||||||||||||||||||||||||||||||||||||
Workers’ Compensation | ||||||||||||||||||||||||||||||||||||||||
Cumulative Paid Claims and Allocated Claim Adjustment Expenses, Net of Reinsurance For the Year Ended December 31, | ||||||||||||||||||||||||||||||||||||||||
Accident Year | 2011 | 2012 | 2013 | 2014 | 2015 | 2016 | 2017 | 2018 | 2019 | 2020 | ||||||||||||||||||||||||||||||
| Unaudited | ||||||||||||||||||||||||||||||||||||||||
| (in thousands) | ||||||||||||||||||||||||||||||||||||||||
2011 | $ | 9,157 | $ | 21,450 | $ | 27,517 | $ | 31,905 | $ | 32,394 | $ | 33,067 | $ | 33,577 | $ | 33,963 | $ | 34,109 | $ | 34,261 | ||||||||||||||||||||
2012 | 11,097 | 22,963 | 28,812 | 31,244 | 33,196 | 34,177 | 34,460 | 34,622 | 34,691 | |||||||||||||||||||||||||||||||
2013 | 13,052 | 26,043 | 32,783 | 36,351 | 38,877 | 39,617 | 40,361 | 40,827 | ||||||||||||||||||||||||||||||||
2014 | 13,932 | 28,513 | 36,284 | 40,393 | 42,465 | 43,866 | 44,403 | |||||||||||||||||||||||||||||||||
2015 | 13,071 | 27,531 | 34,192 | 36,929 | 37,936 | 38,596 | ||||||||||||||||||||||||||||||||||
2016 | 14,709 | 30,344 | 37,178 | 40,570 | 41,208 | |||||||||||||||||||||||||||||||||||
2017 | 15,581 | 31,990 | 39,684 | 42,954 | ||||||||||||||||||||||||||||||||||||
2018 | 17,644 | 31,928 | 37,072 | |||||||||||||||||||||||||||||||||||||
2019 | 16,939 | 33,009 | ||||||||||||||||||||||||||||||||||||||
2020 | 14,591 | |||||||||||||||||||||||||||||||||||||||
| Total | 361,612 | |||||||||||||||||||||||||||||||||||||||
| All outstanding liabilities before 2011, net of reinsurance | 3,343 | |||||||||||||||||||||||||||||||||||||||
| Liabilities for claims and claims adjustment expenses, net of reinsurance | $ | 110,449 | ||||||||||||||||||||||||||||||||||||||
| At December 31, | ||||
| (in thousands) | 2019 | |||
Net outstanding liabilities: | ||||
Personal automobile | $ | 122,094 | ||
Homeowners | 20,762 | |||
Commercial automobile | 118,372 | |||
Commercial multi-peril | 95,153 | |||
Workers’ compensation | 102,035 | |||
Other | 12,524 | |||
|
| |||
| 470,940 | ||||
|
| |||
Reinsurance recoverable: | ||||
Personal automobile | $ | 119,364 | ||
Homeowners | 10,216 | |||
Commercial automobile | 70,973 | |||
Commercial multi-peril | 58,765 | |||
Workers’ compensation | 81,837 | |||
Other | 7,177 | |||
|
| |||
| 348,332 | ||||
|
| |||
Unallocated loss adjustment expenses | $ | 50,402 | ||
|
| |||
Gross liability for unpaid losses and loss expenses | $ | 869,674 | ||
|
| |||
| (in thousands) | At December 31, 2020 | |||
Net outstanding liabilities: | ||||
Personal automobile | $ | 111,604 | ||
Homeowners | 18,323 | |||
Commercial automobile | 142,443 | |||
Commercial multi-peril | 117,537 | |||
Workers ’ | 110,449 | |||
Other | 17,759 | |||
| 518,115 | ||||
Reinsurance recoverable: | ||||
Personal automobile | $ | 117,575 | ||
Homeowners | 10,597 | |||
Commercial automobile | 90,436 | |||
Commercial multi-peril | 75,801 | |||
Workers ’ | 86,479 | |||
Other | 7,420 | |||
| 388,308 | ||||
Unallocated loss adjustment expenses | $ | 55,584 | ||
Gross liability for unpaid losses and loss expenses | $ | 962,007 | ||
| Average Annual Percentage Payout of Incurred Claims by Age, Net of Reinsurance | ||||||||||||||||||||||||||||||||||||||||
Years | 1 | 2 | 3 | 4 | 5 | 6 | 7 | 8 | 9 | 10 | ||||||||||||||||||||||||||||||
Personal automobile | 64.6 | % | 17.3 | % | 8.8 | % | 4.6 | % | 2.7 | % | 0.9 | % | 0.2 | % | 0.3 | % | — | % | — | % | ||||||||||||||||||||
Homeowners | 81.5 | 15.3 | 1.5 | 0.6 | 0.3 | 0.2 | 0.1 | — | — | — | ||||||||||||||||||||||||||||||
Commercial automobile | 44.0 | 18.1 | 13.3 | 11.3 | 6.6 | 2.5 | 1.2 | 0.5 | 0.7 | — | ||||||||||||||||||||||||||||||
Commercial multi-peril | 47.8 | 17.0 | 10.2 | 10.0 | 6.6 | 3.5 | 1.6 | 1.3 | 0.2 | 0.7 | ||||||||||||||||||||||||||||||
Workers’ compensation | 29.9 | 31.5 | 16.3 | 8.2 | 4.1 | 2.5 | 1.4 | 0.8 | 0.7 | — | ||||||||||||||||||||||||||||||
2020:
Average Annual Percentage Payout of Incurred Claims by Age, Net of Reinsurance | ||||||||||||||||||||||||||||||||||||||||
Years | 1 | 2 | 3 | 4 | 5 | 6 | 7 | 8 | 9 | 10 | ||||||||||||||||||||||||||||||
Personal automobile | 64.6 | % | 17.1 | % | 8.6 | % | 4.4 | % | 2.5 | % | 0.8 | % | 0.3 | % | 0.4 | % | 0 | % | 0.1 | % | ||||||||||||||||||||
Homeowners | 82.0 | 15.2 | 1.2 | 0.4 | 0.2 | 0.1 | 0.2 | 0 | 0 | 0 | ||||||||||||||||||||||||||||||
Commercial automobile | 42.5 | 18.3 | 13.5 | 11.1 | 6.1 | 2.5 | 0.8 | 0.4 | 0.7 | 0 | ||||||||||||||||||||||||||||||
Commercial multi-peril | 46.4 | 17.1 | 10.2 | 10.0 | 6.9 | 3.4 | 1.6 | 0.6 | 0.2 | 0.1 | ||||||||||||||||||||||||||||||
Workers’ compensation | 29.9 | 31.6 | 15.2 | 8.1 | 3.5 | 2.2 | 1.3 | 0.9 | 0.3 | 0.4 | ||||||||||||||||||||||||||||||
-80-
Atlantic States is a member of the Federal Home Loan Bank (“FHLB”)FHLB of Pittsburgh. Through its membership, Atlantic States has the ability to issue debt to the FHLB of Pittsburgh in exchange for cash advances. In August 2019, Atlantic States exchanged a variable-rate cash advance of $35.0 million that was due in March 2020 for a fixed-rate cash advance of $35.0 million that was outstanding at December 31, 2019.2020. Atlantic States incurred a penalty of $176,000 related to the early termination of its previous cash advance. The new cash advance carries a fixed interest rate of 1.74% and is due in August 2024. In March 2020, Atlantic States issued $50.0 million of debt to the FHLB of Pittsburgh in exchange for a cash advance in the same amount that was outstanding at December 31, 2020. The debt carries a fixed interest rate of 0.83% and is due in March 2021. Atlantic States obtained this contingent liquidity funding in light of uncertainty surrounding the economic impact of the
FHLB stock purchased and owned as part of the agreement | $ | 1,639,200 | ||
Collateral pledged, at par (carrying value $36,295,910) | 36,370,886 | |||
Borrowing capacity currently available | 240,569 |
MICO is2020.
FHLB stock purchased and owned as part of the agreement | $ | 3,690,100 | ||
Collateral pledged, at par (carrying value $87,466,236) | 85,915,094 | |||
Borrowing capacity currently available | 1,330,109 |
Subordinated Debentures
In January 2002, West Bend Mutual Insurance Company (“West Bend”) purchased a$5.0 million surplus note fromthat MICO for $5.0 millionissued to increase MICO’s statutory surplus. On December 1, 2010, Donegal Mutual purchased the surplus note from West Bend at face value. The surplus note carries an interest rate of 5.00%, and any repayment of principal or payment of interest on the surplus note requires prior insurance regulatory approval.approval of the Michigan Department of Insurance and Financial Services. Upon receipt of regulatory approval, MICO paid $250,000 in interest to Donegal Mutual during each of 2020, 2019 2018 and 2017.
2018.
Our insurance subsidiaries and Donegal Mutual also purchased facultative reinsurance to cover exposures in excess
-81-
| 2019 | 2018 | 2017 | ||||||||||
Premiums written | $ | 36,941,997 | $ | 50,160,604 | $ | 51,241,267 | ||||||
Premiums earned | 39,732,282 | 51,266,000 | 49,633,348 | |||||||||
Losses and loss expenses | 33,615,819 | 50,652,202 | 44,575,268 | |||||||||
Prepaid reinsurance premiums | 7,067,989 | 10,108,269 | 11,213,665 | |||||||||
Liability for losses and loss expenses | 139,694,097 | 137,904,346 | 116,689,871 | |||||||||
2018:
2020 | 2019 | 2018 | ||||||||||
Premiums written | $ | 34,165,635 | $ | 36,941,997 | $ | 50,160,604 | ||||||
Premiums earned | 35,358,765 | 39,732,282 | 51,266,000 | |||||||||
Losses and loss expenses | 9,835,268 | 33,615,819 | 50,652,202 | |||||||||
Prepaid reinsurance premiums | 5,874,859 | 7,067,989 | 10,108,269 | |||||||||
Liability for losses and loss expenses | 133,158,907 | 139,694,097 | 137,904,346 | |||||||||
| 2019 | 2018 | 2017 | ||||||||||
Premiums earned | $ | 314,859,014 | $ | 326,198,234 | $ | 310,179,267 | ||||||
Losses and loss expenses | 240,241,845 | 246,223,074 | 218,523,260 | |||||||||
Prepaid reinsurance premiums | 142,475,767 | 135,379,777 | 135,032,641 | |||||||||
Liability for losses and loss expenses | 362,768,427 | 339,267,525 | 293,271,257 | |||||||||
2018:
2020 | 2019 | 2018 | ||||||||||
Premiums earned | $ | 356,669,937 | $ | 314,859,014 | $ | 326,198,234 | ||||||
Losses and loss expenses | 231,771,575 | 240,241,845 | 246,223,074 | |||||||||
Prepaid reinsurance premiums | 169,418,333 | 142,475,767 | 135,379,777 | |||||||||
Liability for losses and loss expenses | 404,818,480 | 362,768,427 | 339,267,525 | |||||||||
| 2019 | 2018 | 2017 | ||||||||||
Direct | $ | 589,572,526 | $ | 594,078,723 | $ | 584,007,351 | ||||||
Assumed | 485,233,762 | 476,482,451 | 466,087,983 | |||||||||
Ceded | (322,204,999 | ) | (326,545,370 | ) | (320,956,412 | ) | ||||||
|
|
|
|
|
| |||||||
Net premiums written | $ | 752,601,289 | $ | 744,015,804 | $ | 729,138,922 | ||||||
|
|
|
|
|
| |||||||
2018:
2020 | 2019 | 2018 | ||||||||||
Direct | $ | 586,681,839 | $ | 589,572,526 | $ | 594,078,723 | ||||||
Assumed | 539,070,557 | 485,233,762 | 476,482,451 | |||||||||
Ceded | (383,612,503 | ) | (322,204,999 | ) | (326,545,370 | ) | ||||||
Net premiums written | $ | 742,139,893 | $ | 752,601,289 | $ | 744,015,804 | ||||||
| 2019 | 2018 | 2017 | ||||||||||
Direct | $ | 591,101,804 | $ | 593,976,241 | $ | 561,178,447 | ||||||
Assumed | 479,835,610 | 473,512,866 | 451,515,575 | |||||||||
Ceded | (314,859,014 | ) | (326,198,234 | ) | (310,179,267 | ) | ||||||
|
|
|
|
|
| |||||||
Net premiums earned | $ | 756,078,400 | $ | 741,290,873 | $ | 702,514,755 | ||||||
|
|
|
|
|
| |||||||
Percentage of assumed premiums earned to net premiums earned | 63.5 | % | 63.9 | % | 64.3 | % | ||||||
|
|
|
|
|
| |||||||
2018:
2020 | 2019 | 2018 | ||||||||||
Direct | $ | 584,537,580 | $ | 591,101,804 | $ | 593,976,241 | ||||||
Assumed | 514,172,696 | 479,835,610 | 473,512,866 | |||||||||
Ceded | (356,669,937 | ) | (314,859,014 | ) | (326,198,234 | ) | ||||||
Net premiums earned | $ | 742,040,339 | $ | 756,078,400 | $ | 741,290,873 | ||||||
Percentage of assumed premiums earned to net premiums earned | 69.3 | % | 63.5 | % | 63.9 | % | ||||||
On December 22, 2017, the
tax.
-82-
| 2019 | 2018 | 2017 | ||||||||||
Current federal income tax | $ | 8,454,358 | $ | (11,296,704 | ) | $ | (2,139,061 | ) | ||||
Deferred federal income tax | 649,928 | (4,179,805 | ) | 7,137,423 | ||||||||
|
|
|
|
|
| |||||||
Federal income tax expense (benefit) | $ | 9,104,286 | $ | (15,476,509 | ) | $ | 4,998,362 | |||||
|
|
|
|
|
| |||||||
Pennsylvania income tax | 825,000 | — | — | |||||||||
|
|
|
|
|
| |||||||
Income tax expense (benefit) | $ | 9,929,286 | $ | (15,476,509 | ) | $ | 4,998,362 | |||||
|
|
|
|
|
| |||||||
2020 | 2019 | 2018 | ||||||||||
Current federal income tax | $ | 10,450,803 | $ | 8,454,358 | $ | (11,296,704 | ) | |||||
Deferred federal income tax | 6,448 | 649,928 | (4,179,805 | ) | ||||||||
Federal income tax expense (benefit) | $ | 10,457,251 | $ | 9,104,286 | $ | (15,476,509 | ) | |||||
Pennsylvania income tax | — | 825,000 | — | |||||||||
Income tax expense (benefit) | $ | 10,457,251 | $ | 9,929,286 | $ | (15,476,509 | ) | |||||
| 2019 | 2018 | 2017 | ||||||||||
Income (loss) before income taxes | $ | 57,081,030 | $ | (48,236,849 | ) | $ | 12,114,462 | |||||
|
|
|
|
|
| |||||||
Computed “expected” taxes | 11,987,016 | (10,129,738 | ) | 4,240,062 | ||||||||
Tax-exempt interest | (1,325,197 | ) | (1,521,090 | ) | (3,241,530 | ) | ||||||
Proration | 357,044 | 405,204 | 518,948 | |||||||||
Effect of tax reform | — | — | 4,752,547 | |||||||||
Dividends received deduction | (1,913,238 | ) | (99,726 | ) | (508,409 | ) | ||||||
Net operating loss carryback | — | (4,210,523 | ) | — | ||||||||
Tax benefit on exercise of options | (64,765 | ) | (25,938 | ) | (873,515 | ) | ||||||
Other, net | 236,676 | 105,302 | 110,259 | |||||||||
Pennsylvania income tax, net of federal benefit | 651,750 | — | — | |||||||||
|
|
|
|
|
| |||||||
Income tax expense (benefit) | $ | 9,929,286 | $ | (15,476,509 | ) | $ | 4,998,362 | |||||
|
|
|
|
|
| |||||||
2020 | 2019 | 2018 | ||||||||||
Income (loss) before income taxes | $ | 63,272,503 | $ | 57,081,030 | $ | (48,236,849 | ) | |||||
Computed “expected” taxes | 13,287,226 | 11,987,016 | (10,129,738 | ) | ||||||||
Tax-exempt interest | (1,468,806 | ) | (1,325,197 | ) | (1,521,090 | ) | ||||||
Proration | 395,663 | 357,044 | 405,204 | |||||||||
Dividends received deduction | (113,845 | ) | (1,913,238 | ) | (99,726 | ) | ||||||
Net operating loss carryback | (1,640,084 | ) | — | (4,210,523 | ) | |||||||
Tax benefit on exercise of options | (302,901 | ) | (64,765 | ) | (25,938 | ) | ||||||
Other, net | 299,998 | 236,676 | 105,302 | |||||||||
Pennsylvania income tax, net of federal benefit | — | 651,750 | — | |||||||||
Income tax expense (benefit) | $ | 10,457,251 | $ | 9,929,286 | $ | (15,476,509 | ) | |||||
| 2019 | 2018 | |||||||
Deferred tax assets: | ||||||||
Unearned premium | $ | 15,482,366 | $ | 15,634,433 | ||||
Loss reserves | 7,820,683 | 7,644,415 | ||||||
Net operating loss carryforward | 200,942 | 3,090,010 | ||||||
Net state operating loss carryforward - DGI Parent | 7,519,991 | 8,070,196 | ||||||
Net unrealized losses | — | 3,782,145 | ||||||
Other | 2,603,155 | 2,517,791 | ||||||
|
|
|
| |||||
Total gross deferred tax assets | 33,627,137 | 40,738,990 | ||||||
Less valuation allowance | (7,538,024 | ) | (8,334,663 | ) | ||||
|
|
|
| |||||
Net deferred tax assets | 26,089,113 | 32,404,327 | ||||||
|
|
|
| |||||
Deferred tax liabilities: | ||||||||
Deferred policy acquisition costs | 12,449,820 | 12,729,176 | ||||||
Loss reserve transition adjustment | 1,733,056 | 2,339,068 | ||||||
Other | 3,391,926 | 4,266,328 | ||||||
|
|
|
| |||||
Total gross deferred tax liabilities | 17,574,802 | 19,334,572 | ||||||
|
|
|
| |||||
Net deferred tax asset | $ | 8,514,311 | $ | 13,069,755 | ||||
|
|
|
| |||||
-83-
2020 | 2019 | |||||||
Deferred tax assets: | ||||||||
Unearned premium | $ | 15,481,602 | $ | 15,482,366 | ||||
Loss reserves | 8,808,342 | 7,820,683 | ||||||
Net operating loss carryforward | 104,041 | 200,942 | ||||||
Net state operating loss carryforward - DGI Parent | 7,850,334 | 7,519,991 | ||||||
Other | 2,342,967 | 2,603,155 | ||||||
Total gross deferred tax assets | 34,587,286 | 33,627,137 | ||||||
Less valuation allowance | (7,850,334 | ) | (7,538,024 | ) | ||||
Net deferred tax assets | 26,736,952 | 26,089,113 | ||||||
Deferred tax liabilities: | ||||||||
Deferred policy acquisition costs | 12,422,961 | 12,449,820 | ||||||
Loss reserve transition adjustment | 1,440,793 | 1,733,056 | ||||||
Other | 7,190,085 | 3,391,926 | ||||||
Total gross deferred tax liabilities | 21,053,839 | 17,574,802 | ||||||
Net deferred tax asset | $ | 5,683,113 | $ | 8,514,311 | ||||
2018
.2020.
-84-
The weighted-average grant date fair value
| Number of Options | Weighted- Average Exercise Price Per Share | |||||||
Outstanding at December 31, 2016 | 9,338,648 | $ | 14.95 | |||||
Granted - 2017 | 943,000 | 17.58 | ||||||
Exercised - 2017 | (924,019 | ) | 14.45 | |||||
Forfeited - 2017 | (93,167 | ) | 15.43 | |||||
|
|
|
| |||||
Outstanding at December 31, 2017 | 9,264,462 | 15.26 | ||||||
Granted - 2018 | 1,063,000 | 13.69 | ||||||
Exercised - 2018 | (79,961 | ) | 13.74 | |||||
Forfeited - 2018 | (222,639 | ) | 16.00 | |||||
|
|
|
| |||||
Outstanding at December 31, 2018 | 10,024,862 | 15.09 | ||||||
Granted - 2019 | 1,045,400 | 14.97 | ||||||
Exercised - 2019 | (217,498 | ) | 13.23 | |||||
Forfeited - 2019 | (416,774 | ) | 15.88 | |||||
|
|
|
| |||||
Outstanding at December 31, 2019 | 10,435,990 | $ | 15.09 | |||||
|
|
|
| |||||
Exercisable at: | ||||||||
December 31, 2017 | 6,946,677 | $ | 14.90 | |||||
|
|
|
| |||||
December 31, 2018 | 7,936,659 | $ | 15.02 | |||||
|
|
|
| |||||
December 31, 2019 | 8,449,389 | $ | 15.13 | |||||
|
|
|
| |||||
Number of Options | Weighted- Average Exercise Price Per Share | |||||||
Outstanding at December 31, 2017 | 9,264,462 | $ | 15.26 | |||||
Granted - 2018 | 1,063,000 | 13.69 | ||||||
Exercised - 2018 | (79,961 | ) | 13.74 | |||||
Forfeited - 2018 | (222,639 | ) | 16.00 | |||||
Outstanding at December 31, 2018 | 10,024,862 | 15.09 | ||||||
Granted - 2019 | 1,045,400 | 14.97 | ||||||
Exercised - 2019 | (217,498 | ) | 13.23 | |||||
Forfeited - 2019 | (416,774 | ) | 15.88 | |||||
Outstanding at December 31, 2019 | 10,435,990 | 15.09 | ||||||
Granted - 2020 | 935,099 | 14.45 | ||||||
Exercised - 2020 | (1,294,606 | ) | 13.52 | |||||
Forfeited - 2020 | (303,908 | ) | 15.23 | |||||
Expired - 2020 | (78,223 | ) | $ | 13.64 | ||||
Outstanding at December 31, 2020 | 9,694,352 | $ | 15.24 | |||||
Exercisable at: | ||||||||
December 31, 2018 | 7,936,659 | $ | 15.02 | |||||
December 31, 2019 | 8,449,389 | $ | 15.13 | |||||
December 31, 2020 | 7,786,934 | $ | 15.42 | |||||
Grant Date | Exercise Price | Number of Options Outstanding | Weighted-Average Remaining Contractual Life | Number of Options Exercisable | ||||||||||||
July 27, 2011 | $ | 12.50 | 907,101 | 2.0 years | 907,101 | |||||||||||
December 20, 2012 | 14.50 | 1,009,819 | 3.0 years | 1,009,819 | ||||||||||||
December 19, 2013 | 15.90 | 1,991,804 | 4.0 years | 1,991,804 | ||||||||||||
December 18, 2014 | 15.80 | 1,270,581 | 5.0 years | 1,270,581 | ||||||||||||
December 17, 2015 | 13.64 | 1,191,845 | 1.0 years | 1,191,845 | ||||||||||||
December 15, 2016 | 16.48 | 1,202,808 | 2.0 years | 1,202,808 | ||||||||||||
December 21, 2017 | 17.60 | 799,832 | 3.0 years | 533,168 | ||||||||||||
December 20, 2018 | 13.69 | 1,016,800 | 4.0 years | 338,930 | ||||||||||||
March 4, 2019 | 13.51 | 10,000 | 4.2 years | 3,333 | ||||||||||||
December 19, 2019 | 14.98 | 1,035,400 | 5.0 years | — | ||||||||||||
|
|
|
| |||||||||||||
| Total | 10,435,990 | 8,449,389 | ||||||||||||||
|
|
|
| |||||||||||||
2020:
Grant Date | Exercise Price | Number of Options Outstanding | Weighted-Average Remaining Contractual Life | Number of Options Exercisable | ||||||||||
July 27, 2011 | $12.50 | 743,934 | 1.0 years | 743,934 | ||||||||||
December 20, 2012 | 14.50 | 981,759 | 2.0 years | 981,759 | ||||||||||
December 19, 2013 | 15.90 | 1,939,970 | 3.0 years | 1,939,970 | ||||||||||
December 18, 2014 | 15.80 | 1,235,081 | 4.0 years | 1,235,081 | ||||||||||
December 15, 2016 | 16.48 | 1,165,308 | 1.0 years | 1,165,308 | ||||||||||
December 21, 2017 | 17.60 | 763,633 | 2.0 years | 763,633 | ||||||||||
December 20, 2018 | 13.69 | 910,367 | 3.0 years | 606,851 | ||||||||||
March 4, 2019 | 13.51 | 10,000 | 3.2 years | 6,666 | ||||||||||
December 19, 2019 | 14.98 | 1,031,300 | 4.0 years | 343,732 | ||||||||||
December 17, 2020 | 14.43 | 913,000 | 5.0 years | — | ||||||||||
| Total | 9,694,352 | 7,786,934 | ||||||||||||
-86-
| Shares Issued | ||||||||
| Price | Shares | |||||||
January 1, 2017 | 13.76 | 18,512 | ||||||
July 1, 2017 | 13.52 | 25,155 | ||||||
January 1, 2018 | 13.34 | 20,662 | ||||||
July 1, 2018 | 11.57 | 27,802 | ||||||
January 1, 2019 | 11.60 | 24,834 | ||||||
July 1, 2019 | 12.24 | 22,926 | ||||||
Shares Issued | ||||
Price | Shares | |||
January 1, 2018 | 13.34 | 20,662 | ||
July 1, 2018 | 11.57 | 27,802 | ||
January 1, 2019 | 11.60 | 24,834 | ||
July 1, 2019 | 12.24 | 22,926 | ||
January 1, 2020 | 12.28 | 20,424 | ||
July 1, 2020 | 12.09 | 22,662 | ||
| 2019 | 2018 | 2017 | ||||||||||
Atlantic States: | ||||||||||||
Statutory capital and surplus | $ | 259,030,868 | $ | 230,736,313 | $ | 260,428,754 | ||||||
Statutory unassigned surplus | 155,909,822 | 140,713,118 | 172,709,955 | |||||||||
Statutory net income (loss) | 22,282,231 | (23,458,516 | ) | (2,037,672 | ) | |||||||
Southern: | ||||||||||||
Statutory capital and surplus | 54,405,568 | 45,355,785 | 54,503,581 | |||||||||
Statutory unassigned (deficit) surplus | (2,375,794 | ) | (6,346,270 | ) | 2,914,532 | |||||||
Statutory net income (loss) | 5,061,477 | (9,822,457 | ) | (3,375,434 | ) | |||||||
Peninsula: | ||||||||||||
Statutory capital and surplus | 39,244,570 | 32,717,996 | 39,396,818 | |||||||||
Statutory unassigned surplus | 20,936,805 | 14,415,949 | 21,148,253 | |||||||||
Statutory net income (loss) | 7,360,378 | (6,316,130 | ) | (841,119 | ) | |||||||
MICO: | ||||||||||||
Statutory capital and surplus | 65,768,590 | 55,708,442 | 52,796,379 | |||||||||
Statutory unassigned surplus | 38,910,008 | 28,949,919 | 26,162,540 | |||||||||
Statutory net income | 9,976,610 | 6,350,686 | 7,931,774 | |||||||||
2020 | 2019 | 2018 | ||||||||||
Atlantic States: | ||||||||||||
Statutory capital and surplus | $ | 279,796,696 | $ | 259,030,868 | $ | 230,736,313 | ||||||
Statutory unassigned surplus | 175,777,393 | 155,909,822 | 140,713,118 | |||||||||
Statutory net income (loss) | 20,735,871 | 22,282,231 | (23,458,516 | ) | ||||||||
Southern: | ||||||||||||
Statutory capital and surplus | 57,142,228 | 54,405,568 | 45,355,785 | |||||||||
Statutory unassigned surplus (deficit) | 300,409 | (2,375,794 | ) | (6,346,270 | ) | |||||||
Statutory net income (loss) | 4,350,677 | 5,061,477 | (9,822,457 | ) | ||||||||
Peninsula: | ||||||||||||
Statutory capital and surplus | 49,285,069 | 39,244,570 | 32,717,996 | |||||||||
Statutory unassigned surplus | 30,975,869 | 20,936,805 | 14,415,949 | |||||||||
Statutory net income (loss) | 10,955,796 | 7,360,378 | (6,316,130 | ) | ||||||||
MICO: | ||||||||||||
Statutory capital and surplus | 72,183,575 | 65,768,590 | 55,708,442 | |||||||||
Statutory unassigned surplus | 45,247,698 | 38,910,008 | 28,949,919 | |||||||||
Statutory net income | 12,240,173 | 9,976,610 | 6,350,686 | |||||||||
-87-
surplus at December 31, 20192020 exceeded the amount of statutory capital and surplus necessary to satisfy regulatory requirements, including the RBC requirements, by a significant margin. Amounts available for distribution to us as dividends from our insurance subsidiaries without prior approval of insurance regulatory authorities in 20202021 are $25.9approximately $28.0 million from Atlantic States, $5.4 million$300,000 from Southern, $2.0$10.9 million from Peninsula and $6.6$12.2 million from MICO, or a total of approximately $39.9$51.4 million.
| Year Ended December 31, | ||||||||||||
| 2019 | 2018 | 2017 | ||||||||||
Statutory net income (loss) of insurance subsidiaries | $ | 44,680,696 | $ | (33,246,417 | ) | $ | 1,677,549 | |||||
Increases (decreases): | ||||||||||||
Deferred policy acquisition costs | (1,330,268 | ) | 325,267 | 3,980,664 | ||||||||
Deferred federal income taxes | 639,284 | 4,179,807 | 1,334,410 | |||||||||
Salvage and subrogation recoverable | 207,000 | 2,061,600 | 1,199,200 | |||||||||
Consolidating eliminations and adjustments | (11,048,314 | ) | (16,013,971 | ) | (13,534,428 | ) | ||||||
Parent-only net income | 14,003,346 | 9,933,374 | 12,458,705 | |||||||||
|
|
|
|
|
| |||||||
Net income (loss) | $ | 47,151,744 | $ | (32,760,340 | ) | $ | 7,116,100 | |||||
|
|
|
|
|
| |||||||
| December 31, | ||||||||||||
| 2019 | 2018 | 2017 | ||||||||||
Statutory capital and surplus of insurance subsidiaries | $ | 418,449,596 | $ | 364,518,536 | $ | 407,125,532 | ||||||
Increases (decreases): | ||||||||||||
Deferred policy acquisition costs | 59,284,859 | 60,615,127 | 60,289,860 | |||||||||
Deferred federal income taxes | (15,477,843 | ) | (20,094,374 | ) | (14,422,511 | ) | ||||||
Salvage and subrogation recoverable | 20,245,200 | 20,038,200 | 17,976,600 | |||||||||
Non-admitted assets and other adjustments, net | 1,727,754 | 1,904,083 | 1,960,089 | |||||||||
Fixed maturities | (326,795 | ) | (16,528,367 | ) | (8,748,140 | ) | ||||||
Parent-only equity and other adjustments | (32,887,252 | ) | (11,583,304 | ) | (15,485,326 | ) | ||||||
|
|
|
|
|
| |||||||
Stockholders’ equity | $ | 451,015,519 | $ | 398,869,901 | $ | 448,696,104 | ||||||
|
|
|
|
|
| |||||||
Year Ended December 31, | ||||||||||||
2020 | 2019 | 2018 | ||||||||||
Statutory net income (loss) of insurance subsidiaries | $ | 48,282,517 | $ | 44,680,696 | $ | (33,246,417 | ) | |||||
Increases (decreases): | ||||||||||||
Deferred policy acquisition costs | (127,901 | ) | (1,330,268 | ) | 325,267 | |||||||
Deferred federal income taxes | (6,448 | ) | 639,284 | 4,179,807 | ||||||||
Salvage and subrogation recoverable | 713,400 | 207,000 | 2,061,600 | |||||||||
Consolidating eliminations and adjustments | (9,516,984 | ) | (11,048,314 | ) | (16,013,971 | ) | ||||||
Parent-only net income | 13,470,668 | 14,003,346 | 9,933,374 | |||||||||
Net income (loss) | $ | 52,815,252 | $ | 47,151,744 | $ | (32,760,340 | ) | |||||
December 31, | ||||||||||||
2020 | 2019 | 2018 | ||||||||||
Statutory capital and surplus of insurance subsidiaries | $ | 458,407,568 | $ | 418,449,596 | $ | 364,518,536 | ||||||
Increases (decreases): | ||||||||||||
Deferred policy acquisition costs | 59,156,958 | 59,284,859 | 60,615,127 | |||||||||
Deferred federal income taxes | (18,586,428 | ) | (15,477,843 | ) | (20,094,374 | ) | ||||||
Salvage and subrogation recoverable | 20,958,600 | 20,245,200 | 20,038,200 | |||||||||
Non-admitted assets and other adjustments, net | 1,315,378 | 1,727,754 | 1,904,083 | |||||||||
Fixed maturities | 15,309,610 | (326,795 | ) | (16,528,367 | ) | |||||||
Parent-only equity and other adjustments | (18,787,566 | ) | (32,887,252 | ) | (11,583,304 | ) | ||||||
Stockholders’ equity | $ | 517,774,120 | $ | 451,015,519 | $ | 398,869,901 | ||||||
| 2019 | 2018 | 2017 | ||||||||||
Income taxes | $ | (9,827,433 | ) | $ | (3,290,247 | ) | $ | 3,050,000 | ||||
Interest | 321,585 | 1,280,352 | 1,341,706 | |||||||||
-88-
2020 | 2019 | 2018 | ||||||||||
Income taxes | $ | 12,800,000 | $ | (9,827,433 | ) | $ | (3,290,247 | ) | ||||
Interest | 1,191,800 | 321,585 | 1,280,352 | |||||||||
| Year Ended December 31, | ||||||||||||
| (in thousands, except per share amounts) | 2019 | 2018 | 2017 | |||||||||
Basic earnings (loss) per share: | ||||||||||||
Numerator: | ||||||||||||
Allocation of net income (loss) | $ | 38,718 | $ | (26,691 | ) | $ | 5,879 | |||||
|
|
|
|
|
| |||||||
Denominator: | ||||||||||||
Weighted-average shares outstanding | 22,986 | 22,705 | 21,799 | |||||||||
|
|
|
|
|
| |||||||
Basic earnings (loss) per share | $ | 1.68 | $ | (1.18 | ) | $ | 0.27 | |||||
|
|
|
|
|
| |||||||
Diluted earnings (loss) per share: | ||||||||||||
Numerator: | ||||||||||||
Allocation of net income (loss) | $ | 38,718 | $ | (26,691 | ) | $ | 5,879 | |||||
|
|
|
|
|
| |||||||
Denominator: | ||||||||||||
Number of shares used in basic computation | 22,986 | 22,705 | 21,799 | |||||||||
Weighted-average effect of dilutive securities | ||||||||||||
Add: Director and employee stock options | 211 | — | 843 | |||||||||
|
|
|
|
|
| |||||||
Number of shares used in per share computations | 23,197 | 22,705 | 22,642 | |||||||||
|
|
|
|
|
| |||||||
Diluted earnings (loss) per share | $ | 1.67 | $ | (1.18 | ) | $ | 0.26 | |||||
|
|
|
|
|
| |||||||
Year Ended December 31, | ||||||||||||
| (in thousands, except per share amounts) | 2020 | 2019 | 2018 | |||||||||
Basic earnings (loss) per share: | ||||||||||||
Numerator: | ||||||||||||
Allocation of net income (loss) | $ | 43,609 | $ | 38,718 | $ | (26,691 | ) | |||||
Denominator: | ||||||||||||
Weighted-average shares outstanding | 23,707 | 22,986 | 22,705 | |||||||||
Basic earnings (loss) per share | $ | 1.84 | $ | 1.68 | $ | (1.18 | ) | |||||
Diluted earnings (loss) per share: | ||||||||||||
Numerator: | ||||||||||||
Allocation of net income (loss) | $ | 43,609 | $ | 38,718 | $ | (26,691 | ) | |||||
Denominator: | ||||||||||||
Number of shares used in basic computation | 23,707 | 22,986 | 22,705 | |||||||||
Weighted-average effect of dilutive securities | ||||||||||||
Add: Director and employee stock options | 180 | 211 | — | |||||||||
Number of shares used in per share computations | 23,887 | 23,197 | 22,705 | |||||||||
Diluted earnings (loss) per share | $ | 1.83 | $ | 1.67 | $ | (1.18 | ) | |||||
| Year Ended December 31, | ||||||||||||
| (in thousands, except per share amounts) | 2019 | 2018 | 2017 | |||||||||
Basic and diluted earnings (loss) per share: | ||||||||||||
Numerator: | ||||||||||||
Allocation of net income (loss) | $ | 8,434 | $ | (6,069 | ) | $ | 1,237 | |||||
|
|
|
|
|
| |||||||
Denominator: | ||||||||||||
Weighted-average shares outstanding | 5,577 | 5,577 | 5,577 | |||||||||
|
|
|
|
|
| |||||||
Basic and diluted earnings (loss) per share | $ | 1.51 | $ | (1.09 | ) | $ | 0.22 | |||||
|
|
|
|
|
| |||||||
Year Ended December 31, | ||||||||||||
| (in thousands, except per share amounts) | 2020 | 2019 | 2018 | |||||||||
Basic and diluted earnings (loss) per share: | ||||||||||||
Numerator: | ||||||||||||
Allocation of net income (loss) | $ | 9,206 | $ | 8,434 | $ | (6,069 | ) | |||||
Denominator: | ||||||||||||
Weighted-average shares outstanding | 5,577 | 5,577 | 5,577 | |||||||||
Basic and diluted earnings (loss) per share | $ | 1.65 | $ | 1.51 | $ | (1.09 | ) | |||||
-89-
| December 31, | 2019 | 2018 | ||||||
Assets | ||||||||
Investment in subsidiaries/affiliates (equity method) | $ | 489,657 | $ | 465,030 | ||||
Short-term investments | 2,502 | 29 | ||||||
Cash | 2,350 | 1,542 | ||||||
Property and equipment | 944 | 928 | ||||||
Other | — | — | ||||||
|
|
|
| |||||
Total assets | $ | 495,453 | $ | 467,529 | ||||
|
|
|
| |||||
Liabilities and Stockholders’ Equity | ||||||||
Liabilities | ||||||||
Cash dividends declared to stockholders | $ | 4,075 | $ | 3,948 | ||||
Borrowings under lines of credit | 35,000 | 60,000 | ||||||
Other | 5,362 | 4,711 | ||||||
|
|
|
| |||||
Total liabilities | 44,437 | 68,659 | ||||||
|
|
|
| |||||
Stockholders’ equity | 451,016 | 398,870 | ||||||
|
|
|
| |||||
Total liabilities and stockholders’ equity | $ | 495,453 | $ | 467,529 | ||||
|
|
|
| |||||
December 31, | 2020 | 2019 | ||||||
Assets | ||||||||
Investment in subsidiaries/affiliates (equity method) | $ | 540,665 | $ | 489,657 | ||||
Short-term investments | 9 | 2,502 | ||||||
Cash | 15,321 | 2,350 | ||||||
Property and equipment | 833 | 944 | ||||||
Other | 1,721 | — | ||||||
Total assets | $ | 558,549 | $ | 495,453 | ||||
Liabilities and Stockholders’ Equity | ||||||||
Liabilities | ||||||||
Cash dividends declared to stockholders | $ | 4,436 | $ | 4,075 | ||||
| Notes payable to subsidiary | 35,000 | 35,000 | ||||||
Other | 1,339 | 5,362 | ||||||
Total liabilities | 40,775 | 44,437 | ||||||
Stockholders’ equity | 517,774 | 451,016 | ||||||
Total liabilities and stockholders’ equity | $ | 558,549 | $ | 495,453 | ||||
| Year Ended December 31, | 2019 | 2018 | 2017 | |||||||||
Statements of Income (Loss) | ||||||||||||
Revenues | ||||||||||||
Dividends from subsidiaries | $ | 4,000 | $ | 11,000 | $ | 13,000 | ||||||
Realized investment gains | 12,378 | — | — | |||||||||
Other | 1,009 | 3,196 | 2,131 | |||||||||
|
|
|
|
|
| |||||||
Total revenues | 17,387 | 14,196 | 15,131 | |||||||||
|
|
|
|
|
| |||||||
Expenses | ||||||||||||
Operating expenses | 1,420 | 1,628 | 1,433 | |||||||||
Interest | 1,327 | 2,224 | 1,929 | |||||||||
|
|
|
|
|
| |||||||
Total expenses | 2,747 | 3,852 | 3,362 | |||||||||
|
|
|
|
|
| |||||||
Income before income tax expense (benefit) and equity in undistributed net income (loss) of subsidiaries | 14,640 | 10,344 | 11,769 | |||||||||
Income tax expense (benefit) | 636 | 411 | (690 | ) | ||||||||
|
|
|
|
|
| |||||||
Income before equity in undistributed net income (loss) of subsidiaries | 14,004 | 9,933 | 12,459 | |||||||||
Equity in undistributed net income (loss) of subsidiaries | 33,148 | (42,693 | ) | (5,343 | ) | |||||||
|
|
|
|
|
| |||||||
Net income (loss) | $ | 47,152 | $ | (32,760 | ) | $ | 7,116 | |||||
|
|
|
|
|
| |||||||
Statements of Comprehensive Income (Loss) | ||||||||||||
Net income (loss) | $ | 47,152 | $ | (32,760 | ) | $ | 7,116 | |||||
|
|
|
|
|
| |||||||
Other comprehensive income (loss), net of tax | ||||||||||||
Unrealized gain (loss) - subsidiaries | 14,732 | (6,625 | ) | 46 | ||||||||
|
|
|
|
|
| |||||||
Other comprehensive income (loss), net of tax | 14,732 | (6,625 | ) | 46 | ||||||||
|
|
|
|
|
| |||||||
Comprehensive income (loss) | $ | 61,884 | $ | (39,385 | ) | $ | 7,162 | |||||
|
|
|
|
|
| |||||||
-90-
Year Ended December 31, | 2020 | 2019 | 2018 | |||||||||
Statements of Income (Loss) | ||||||||||||
Revenues | ||||||||||||
Dividends from subsidiaries | $ | 14,000 | $ | 4,000 | $ | 11,000 | ||||||
Realized investment gains | — | 12,378 | — | |||||||||
Other | 463 | 1,009 | 3,196 | |||||||||
Total revenues | 14,463 | 17,387 | 14,196 | |||||||||
Expenses | ||||||||||||
Operating expenses | 1,258 | 1,420 | 1,628 | |||||||||
Interest | 794 | 1,327 | 2,224 | |||||||||
Total expenses | 2,052 | 2,747 | 3,852 | |||||||||
Income before income tax expense (benefit) and equity in undistributed net income (loss) of subsidiaries | 12,411 | 14,640 | 10,344 | |||||||||
Income tax expense (benefit) | 1,059 | 636 | 411 | |||||||||
Income before equity in undistributed net income (loss) of subsidiaries | 13,470 | 14,004 | 9,933 | |||||||||
Equity in undistributed net income (loss) of subsidiaries | 39,345 | 33,148 | (42,693 | ) | ||||||||
Net income (loss) | $ | 52,815 | $ | 47,152 | $ | (32,760 | ) | |||||
Statements of Comprehensive Income (Loss) | ||||||||||||
Net income (loss) | $ | 52,815 | $ | 47,152 | $ | (32,760 | ) | |||||
Other comprehensive income (loss), net of tax | ||||||||||||
Unrealized gain (loss) - subsidiaries | 10,427 | 14,732 | (6,625 | ) | ||||||||
Other comprehensive income (loss), net of tax | 10,627 | 14,732 | (6,625 | ) | ||||||||
Comprehensive income (loss) | $ | 63,442 | $ | 61,884 | $ | (39,385 | ) | |||||
| Year Ended December 31, | 2019 | 2018 | 2017 | |||||||||
Cash flows from operating activities: | ||||||||||||
Net income (loss) | $ | 47,152 | $ | (32,760 | ) | $ | 7,116 | |||||
|
|
|
|
|
| |||||||
Adjustments: | ||||||||||||
Equity in undistributed net (income) loss of subsidiaries | (33,148 | ) | 42,694 | 5,343 | ||||||||
Realized investment gains | (12,378 | ) | — | — | ||||||||
Dividends received from DFSC | — | — | 1,037 | |||||||||
Other | 490 | 2,531 | 1,011 | |||||||||
|
|
|
|
|
| |||||||
Net adjustments | (45,036 | ) | 45,225 | 7,391 | ||||||||
|
|
|
|
|
| |||||||
Net cash provided | 2,116 | 12,465 | 14,507 | |||||||||
|
|
|
|
|
| |||||||
Cash flows from investing activities: | ||||||||||||
Net (purchases) sale of short-term investments | (2,473 | ) | — | 1 | ||||||||
Net purchase of property and equipment | (150 | ) | (106 | ) | (788 | ) | ||||||
Sale of DFSC | 33,923 | — | — | |||||||||
Sale of equity securities - available for sale | 20,287 | — | — | |||||||||
Investment in subsidiaries | (18,283 | ) | (2,644 | ) | (2,992 | ) | ||||||
Other | — | (1 | ) | (1 | ) | |||||||
|
|
|
|
|
| |||||||
Net cash received (used) | 33,304 | (2,751 | ) | (3,780 | ) | |||||||
|
|
|
|
|
| |||||||
Cash flows from financing activities: | ||||||||||||
Cash dividends paid | (16,093 | ) | (15,659 | ) | (14,821 | ) | ||||||
Issuance of common stock | 6,481 | 3,250 | 15,511 | |||||||||
Payments on lines of credit | (25,000 | ) | — | (10,000 | ) | |||||||
Borrowings under lines of credit | — | 1,000 | — | |||||||||
|
|
|
|
|
| |||||||
Net cash used | (34,612 | ) | (11,409 | ) | (9,310 | ) | ||||||
|
|
|
|
|
| |||||||
Net change in cash | 808 | (1,695 | ) | 1,417 | ||||||||
Cash at beginning of year | 1,542 | 3,237 | 1,820 | |||||||||
|
|
|
|
| �� | |||||||
Cash at end of year | $ | 2,350 | $ | 1,542 | $ | 3,237 | ||||||
|
|
|
|
|
| |||||||
Year Ended December 31, | 2020 | 2019 | 2018 | |||||||||
Cash flows from operating activities: | ||||||||||||
Net income (loss) | $ | 52,815 | $ | 47,152 | $ | (32,760 | ) | |||||
Adjustments: | ||||||||||||
Equity in undistributed net (income) loss of subsidiaries | (39,345 | ) | (33,148 | ) | 42,694 | |||||||
Realized investment gains | — | (12,378 | ) | — | ||||||||
Other | (5,615 | ) | 490 | 2,531 | ||||||||
Net adjustments | (44,960 | ) | (45,036 | ) | 45,225 | |||||||
Net cash provided | 7,855 | 2,116 | 12,465 | |||||||||
Cash flows from investing activities: | ||||||||||||
Net sale (purchases) of short-term investments | 2,493 | (2,473 | ) | — | ||||||||
Net purchase of property and equipment | (18 | ) | (150 | ) | (106 | ) | ||||||
Sale of DFSC | — | 33,923 | — | |||||||||
| Sale of equity securities - available for sale | — | 20,287 | — | |||||||||
Investment in subsidiaries | (1,037 | ) | (18,283 | ) | (2,644 | ) | ||||||
Other | — | — | (1 | ) | ||||||||
Net cash received (used) | 1,438 | 33,304 | (2,751 | ) | ||||||||
Cash flows from financing activities: | ||||||||||||
Cash dividends paid | (16,976 | ) | (16,093 | ) | (15,659 | ) | ||||||
Issuance of common stock | 20,654 | 6,481 | 3,250 | |||||||||
Payments on lines of credit | — | (25,000 | ) | — | ||||||||
Borrowings under lines of credit | — | — | 1,000 | |||||||||
Net cash received (used) | 3,678 | (34,612 | ) | (11,409 | ) | |||||||
Net change in cash | 12,971 | 808 | (1,695 | ) | ||||||||
Cash at beginning of year | 2,350 | 1,542 | 3,237 | |||||||||
Cash at end of year | $ | 15,321 | $ | 2,350 | $ | 1,542 | ||||||
-91-
| 2019 | 2018 | 2017 | ||||||||||
| (in thousands) | ||||||||||||
Revenues: | ||||||||||||
Premiums earned: | ||||||||||||
Commercial lines | $ | 385,465 | $ | 337,924 | $ | 318,391 | ||||||
Personal lines | 370,613 | 403,367 | 384,124 | |||||||||
|
|
|
|
|
| |||||||
GAAP premiums earned | 756,078 | 741,291 | 702,515 | |||||||||
Net investment income | 29,515 | 26,908 | 23,527 | |||||||||
Investment gains (losses) | 21,985 | (4,802 | ) | 5,705 | ||||||||
Equity in earnings of DFSC | 295 | 2,694 | 1,622 | |||||||||
Other | 4,578 | 5,737 | 5,658 | |||||||||
|
|
|
|
|
| |||||||
Total revenues | $ | 812,451 | $ | 771,828 | $ | 739,027 | ||||||
|
|
|
|
|
| |||||||
| 2019 | 2018 | 2017 | ||||||||||
| (in thousands) | ||||||||||||
Income (loss) before income taxes: | ||||||||||||
Underwriting income (loss): | ||||||||||||
Commercial lines | $ | 8,404 | $ | (22,059 | ) | $ | 13,263 | |||||
Personal lines | (1,617 | ) | (53,590 | ) | (39,042 | ) | ||||||
|
|
|
|
|
| |||||||
SAP underwriting income (loss) | 6,787 | (75,649 | ) | (25,779 | ) | |||||||
GAAP adjustments | (3,079 | ) | 894 | 4,408 | ||||||||
|
|
|
|
|
| |||||||
GAAP underwriting income (loss) | 3,708 | (74,755 | ) | (21,371 | ) | |||||||
Net investment income | 29,515 | 26,908 | 23,527 | |||||||||
Investment gains (losses) | 21,985 | (4,802 | ) | 5,705 | ||||||||
Equity in earnings of DFSC | 295 | 2,694 | 1,622 | |||||||||
Other | 1,578 | 1,718 | 2,631 | |||||||||
|
|
|
|
|
| |||||||
Income (loss) before income taxes | $ | 57,081 | $ | (48,237 | ) | $ | 12,114 | |||||
|
|
|
|
|
| |||||||
2020 | 2019 | 2018 | ||||||||||
| (in thousands) | ||||||||||||
Revenues: | ||||||||||||
Premiums earned: | ||||||||||||
Commercial lines | $ | 412,877 | $ | 385,465 | $ | 337,924 | ||||||
Personal lines | 329,163 | 370,613 | 403,367 | |||||||||
GAAP premiums earned | 742,040 | 756,078 | 741,291 | |||||||||
Net investment income | 29,504 | 29,515 | 26,908 | |||||||||
Investment gains (losses) | 2,778 | 21,985 | (4,802 | ) | ||||||||
Equity in earnings of DFSC | — | 295 | 2,694 | |||||||||
Other | 3,497 | 4,578 | 5,737 | |||||||||
Total revenues | $ | 777,819 | $ | 812,451 | $ | 771,828 | ||||||
2020 | 2019 | 2018 | ||||||||||
| (in thousands) | ||||||||||||
Income (loss) before income taxes: | ||||||||||||
Underwriting income (loss): | ||||||||||||
Commercial lines | $ | (858 | ) | $ | 8,404 | $ | (22,059 | ) | ||||
Personal lines | 31,764 | (1,617 | ) | (53,590 | ) | |||||||
SAP underwriting income (loss) | 30,906 | 6,787 | (75,649 | ) | ||||||||
GAAP adjustments | (959 | ) | (3,079 | ) | 894 | |||||||
GAAP underwriting income (loss) | 29,947 | 3,708 | (74,755 | ) | ||||||||
Net investment income | 29,504 | 29,515 | 26,908 | |||||||||
Investment gains (losses) | 2,778 | 21,985 | (4,802 | ) | ||||||||
Equity in earnings of DFSC | — | 295 | 2,694 | |||||||||
Other | 1,043 | 1,578 | 1,718 | |||||||||
Income (loss) before income taxes | $ | 63,272 | $ | 57,081 | $ | (48,237 | ) | |||||
-92-
| 2019 | ||||||||||||||||
| First Quarter | Second Quarter | Third Quarter | Fourth Quarter | |||||||||||||
Net premiums earned | $ | 188,073,242 | $ | 188,763,313 | $ | 189,821,058 | $ | 189,420,787 | ||||||||
Total revenues | 214,713,874 | 198,788,954 | 198,009,900 | 200,938,743 | ||||||||||||
Net losses and loss expenses | 123,110,656 | 131,507,280 | 130,743,395 | 121,026,333 | ||||||||||||
Net income | 23,023,164 | 4,788,454 | 5,186,379 | 14,153,747 | ||||||||||||
Net earnings per common share: | ||||||||||||||||
Class A common stock - basic | 0.82 | 0.17 | 0.19 | 0.50 | ||||||||||||
Class A common stock - diluted | 0.82 | 0.17 | 0.18 | 0.50 | ||||||||||||
Class B common stock - basic and diluted | 0.75 | 0.15 | 0.16 | 0.45 | ||||||||||||
| 2018 | ||||||||||||||||
| First Quarter | Second Quarter | Third Quarter | Fourth Quarter | |||||||||||||
Net premiums earned | $ | 181,764,580 | $ | 185,714,110 | $ | 187,661,705 | $ | 186,150,478 | ||||||||
Total revenues | 189,328,278 | 195,790,028 | 199,904,180 | 186,805,834 | ||||||||||||
Net losses and loss expenses | 156,583,268 | 135,753,645 | 140,726,106 | 143,395,401 | ||||||||||||
Net (loss) income | (18,178,078 | ) | (789,855 | ) | 1,206,356 | (14,998,763 | ) | |||||||||
Net (loss) earnings per common share: | ||||||||||||||||
Class A common stock - basic | (0.66 | ) | (0.03 | ) | 0.04 | (0.53 | ) | |||||||||
Class A common stock - diluted | (0.66 | ) | (0.03 | ) | 0.04 | (0.53 | ) | |||||||||
Class B common stock - basic and diluted | (0.60 | ) | (0.03 | ) | 0.04 | (0.50 | ) | |||||||||
-93-
2020 | ||||||||||||||||
First Quarter | Second Quarter | Third Quarter | Fourth Quarter | |||||||||||||
Net premiums earned | $ | 187,252,778 | $ | 184,373,768 | $ | 184,925,733 | $ | 185,488,060 | ||||||||
Total revenues | 184,911,206 | 198,899,772 | 196,512,266 | 197,496,666 | ||||||||||||
Net losses and loss expenses | 117,246,526 | 105,349,019 | 120,881,041 | 116,287,707 | ||||||||||||
Net income | 3,731,121 | 22,678,778 | 11,836,998 | 14,568,355 | ||||||||||||
Net earnings per common share: | ||||||||||||||||
Class A common stock - basic | 0.13 | 0.80 | 0.41 | 0.50 | ||||||||||||
Class A common stock - diluted | 0.13 | 0.79 | 0.41 | 0.49 | ||||||||||||
Class B common stock - basic and diluted | 0.12 | 0.72 | 0.37 | 0.44 | ||||||||||||
2019 | ||||||||||||||||
First Quarter | Second Quarter | Third Quarter | Fourth Quarter | |||||||||||||
Net premiums earned | $ | 188,073,242 | $ | 188,763,313 | $ | 189,821,058 | $ | 189,420,787 | ||||||||
Total revenues | 214,713,874 | 198,788,954 | 198,009,900 | 200,938,743 | ||||||||||||
Net losses and loss expenses | 123,110,656 | 131,507,280 | 130,743,395 | 121,026,333 | ||||||||||||
Net income | 23,023,164 | 4,788,454 | 5,186,379 | 14,153,747 | ||||||||||||
Net earnings per common share: | ||||||||||||||||
Class A common stock - basic | 0.82 | 0.17 | 0.19 | 0.50 | ||||||||||||
Class A common stock - diluted | 0.82 | 0.17 | 0.18 | 0.50 | ||||||||||||
Class B common stock - basic and diluted | 0.75 | 0.15 | 0.16 | 0.45 | ||||||||||||
We did not audit the financial statements of Donegal Financial Services Corporation (previously a 48.2 percent-owned investee company). The Company’s investment in Donegal Financial Services Corporation was $41,025,975 as of December 31, 2018, and its equity in earnings of Donegal Financial Services Corporation was $2,693,962 and $1,621,605 for the years 2018 and 2017, respectively. The financial statements of Donegal Financial Services Corporation were audited by other auditors whose report was furnished to us, and our opinion, insofar as it relates to the amounts included for Donegal Financial Services Corporation, is based solely on the report of the other auditors.
Change in Accounting Principle
As discussed in Note 2 to the consolidated financial statements, the Company changed its method of accounting for changes in fair value of equity securities in 2018 due to the adoption of Accounting Standards Update2016-01,Recognition and Measurement of Financial Assets and Liabilities.

-94-
Item 9. | Changes in and Disagreements with Accountants on Accounting and Financial Disclosure. |
Item 9A. | Controls and Procedures. |
2020.
There were no
Item 9B. | Other Information. |
Inc.andInc. and subsidiaries’ (the Company) internal control over financial reporting as of December 31, 2019,2020, based on criteria established in2019,2020, based on criteria established in20192020 and 2018,2019, the related consolidated statements of income (loss) and comprehensive income (loss), stockholders’ equity, and cash flows for each of the years in the three-year period ended December 31, 2019,2020, and the related notes and financial statement schedule III (collectively, the consolidated financial statements), and our report dated March 6, 20205, 2021 expressed an unqualified opinion on those consolidated financial statements.
-96-
Item 10. | Directors, Executive Officers and Corporate Governance. |
Name | Age | Position | ||
Kevin G. Burke | President and Chief Executive Officer of us since 2015; President and Chief Executive Officer of Donegal Mutual since 2018; | |||
| ||||
Jeffrey D. Miller | ||||
| Executive Vice President and Chief Financial Officer of Donegal Mutual and us since 2014; Senior Vice President and Chief Financial Officer of Donegal Mutual and us from 2005 to 2014; Vice President and Controller of Donegal Mutual and us from 2000 to 2005; other positions from | |||
| ||||
Kristi S. Altshuler | 40 | Senior Vice President and Chief Analytics Officer of us since 2020; Senior Vice President and Chief Analytics Officer of Donegal Mutual since 2019; Director of Willis Towers Watson from 2018 to 2019; Director of Pricing Innovation of USAA from 2014 to 2018; other positions at USAA from 2001 to 2014. | ||
William A. Folmar | 62 | Senior Vice President of Claims of Donegal Mutual and Senior Vice President of us since 2019; Vice President of Claims of Donegal Mutual from 2010 to 2019; other positions from 1998 to 2010. | ||
Francis J. Haefner, Jr. | 57 | Senior Vice President of us since 2020; Senior Vice President of Commercial Lines Underwriting of Donegal Mutual since 2012; Vice President of Commercial Lines Underwriting of Donegal Mutual from 2008 to 2012; other positions from 1984 to 2012. | ||
Jeffery T. Hay | 46 | Senior Vice President and Chief Underwriting Officer of Donegal Mutual and Senior Vice President of us since 2021; Senior Director of Willis Towers Watson from 2018 to 2021; Head of Personal Lines Product Management of The Hartford from 2015 to 2018; other positions at The Hartford from 2005 to 2015. | ||
Christina M. Hoffman | 46 | Senior Vice President and Chief Risk Officer of Donegal Mutual and us since 2019; Senior Vice President of Internal Audit of Donegal Mutual and Senior Vice President of us from 2013 to 2019; Vice President of Internal Audit of Donegal Mutual and Vice President of us from 2009 to 2013. | ||
Jeffrey A. Jacobsen | 67 | Senior Vice President of us since 2020; Senior Vice President of Personal Lines Underwriting of Donegal Mutual since 2008; Vice President of Personal Lines Underwriting of Donegal Mutual from 2001 to 2008; other positions from 1991 to 2001. | ||
Richard G. Kelley | 66 | Senior Vice President and Head of Field Operations of Donegal Mutual and Senior Vice President of us since 2018; Senior Vice President of Donegal Mutual from 2007 to 2018; other positions from 2000 to 2007. | ||
Robert R. Long, Jr. | 62 | Senior Vice President and General Counsel of Donegal Mutual and us since 2018; Vice President and House Counsel of Donegal Mutual from 2012 to 2018; other positions from 2010 to 2012. | ||
Sanjay Pandey | 54 | Senior Vice President and Chief Information Officer of Donegal Mutual and us since 2013; Vice President and Chief Information Officer of Donegal Mutual and us from 2009 to 2013; other positions from 2000 to 2009. | ||
V. Anthony Viozzi | 47 | Senior Vice President and Chief Investment Officer of Donegal Mutual and us since 2012; Vice President of Investments of Donegal Mutual and us from 2007 to 2012. | ||
Daniel J. Wagner | Senior Vice President and Treasurer of Donegal Mutual and us since 2005; Vice President and Treasurer of Donegal Mutual and us from 2000 to 2005; other positions from | |||
-97-
Item 11. Executive |
Compensation. |
|
-98-
| Financial |
(a) Financial statements, financial statement schedule and exhibits filed:
(a) Consolidated Financial Statements
| (i) | Consolidated Financial Statements |
| Page | ||||
| 114 | ||||
Donegal Group Inc. and Subsidiaries: | ||||
| 68 | ||||
| 69 | ||||
| 70 | ||||
| 71 | ||||
| 72 | ||||
| ||||
| ||||
(b) Financial Statement Schedule | ||||
| 126 | ||||
| Filed herewith | ||||
(c) Exhibits
| (c) | Exhibits |
Exhibit
| Description of Exhibits | Reference | ||||
| 3.1 | Certificate of Incorporation of Donegal Group Inc., as amended. | |||||
3.2 | Amended and RestatedBy-laws of Donegal Group Inc. | (h) | ||||
4.1 | Description of Donegal Group Inc’s Securities Registered pursuant to Section 12 of the Exchange Act. | Filed herewith | ||||
Management Contracts and Compensatory Plans or Arrangements | ||||||
10.1 | Donegal Group Inc. 2011 Equity Incentive Plan for Employees. | (b) | ||||
10.2 | Donegal Group Inc. 2011 Equity Incentive Plan for Directors. | (b) | ||||
10.3 | Donegal Group Inc. 2011 Employee Stock Purchase Plan. | (b) | ||||
10.4 | Donegal Group Inc. 2013 Equity Incentive Plan for Employees. | (c) | ||||
10.5 | Donegal Group Inc. 2013 Equity Incentive Plan for Directors. | (c) | ||||
| ||||||
-99-
-100-
| Filed herewith | ||||
14 | Code of Business Conduct and Ethics. | (g) | ||
21 | Subsidiaries of Registrant. | Filed herewith | ||
23.1 | Report and Consent of Independent Registered Public Accounting Firm. | Filed herewith | ||
| ||||
| Rule 13a-14(a)/15(d)-14(a) Certification of Chief Executive Officer. | Filed herewith | ||
31.2 | Rule 13a-14(a)/15(d)-14(a) Certification of Chief Financial Officer. | Filed herewith | ||
32.1 | Section 1350 Certification of Chief Executive Officer. | Filed herewith | ||
32.2 | Section 1350 Certification of Chief Financial Officer. | Filed herewith | ||
Exhibit 101.INS | XBRL Instance Document | Filed herewith | ||
Exhibit 101.SCH | XBRL Taxonomy Extension Schema Document | Filed herewith | ||
Exhibit 101.PRE | XBRL Taxonomy Presentation Linkbase Document | Filed herewith | ||
Exhibit 101.CAL | XBRL Taxonomy Calculation Linkbase Document | Filed herewith | ||
Exhibit 101.LAB | XBRL Taxonomy Label Linkbase Document | Filed herewith | ||
Exhibit 101.DEF | XBRL Taxonomy Extension Definition Linkbase Document | Filed herewith | ||
| (a) | We incorporate such exhibit by reference to the like-described exhibit in Registrant’s Form 10-K Report for the year ended December 31, 2001. |
| (b) | We incorporate such exhibit by reference to the like-described exhibit in Registrant’s Form 8-K Report dated April 22, 2011. |
| (c) | We incorporate such exhibit by reference to the like-described exhibit in Registrant’s Form 8-K Report dated April 22, 2013. |
| (d) | We incorporate such exhibit by reference to the like-described exhibit in Registrant’s Form 8-K Report dated August 3, 2011. |
| (e) | We incorporate such exhibit by reference to the like-described exhibit in Registrant’s Form 10-K Report for the year ended December 31, 1999. |
| (f) | We incorporate such exhibit by reference to the like-described exhibit in Registrant’s Form 10-K Report for the year ended December 31, 2002. |
| (g) | We incorporate such exhibit by reference to the like-described exhibit in Registrant’s Form 10-K Report for the year ended December 31, 2003. |
| (h) | We incorporate such exhibit by reference to the like-described exhibit in Registrant’s Form 8-K Report dated July 18, 2008. |
| (i) | We incorporate such exhibit by reference to the like-described exhibit in Registrant’s Form 10-K Report for the year ended December 31, 2009. |
| (j) | We incorporate such exhibit by reference to the like-described exhibit in Registrant’s Form 10-K Report for the year ended December 31, 2010. |
| (k) | We incorporate such exhibit by reference to the like-described exhibit filed in Registrant’s Form S-3 registration statement filed on April 28, 2015. |
|
We incorporate such exhibit by reference to the description of such plan in Registrant’s definitive proxy statement for its Annual Meeting of Stockholders held on April 16, 2015 filed on March 16, 2015. |
|
We incorporate such exhibit by reference to the description of such plan in Registrant’s definitive proxy statement for its Annual Meeting of Stockholders held on April 20, 2017 filed on March 16, 2017. |
We incorporate such exhibit by reference to the like-described exhibit in Registrant’s Form |
-101-
|
We incorporate such exhibit by reference to the description of such plan in Registrant’s definitive proxy statement for its Annual Meeting of Stockholders held on April 18, 2019 filed on March 18, 2019. |
|
| (q) | We incorporate such exhibit by reference to the like-described exhibit in Registrant’s Form 8-K Report dated October 1, 2020. |
-102-
2018
Segment | Net Premiums Earned | Net Investment Income | Net Losses and Loss Expenses | Amortization of Deferred Policy Acquisition Costs | Other Underwriting Expenses | Net Premiums Written | ||||||||||||||||||
Year Ended December 31, 2019 | ||||||||||||||||||||||||
Commercial lines | $ | 385,465 | $ | — | $ | 242,685 | $ | 62,424 | $ | 61,631 | $ | 404,879 | ||||||||||||
Personal lines | 370,613 | — | 263,703 | 60,019 | 52,931 | 347,722 | ||||||||||||||||||
Investments | — | 29,515 | — | — | — | — | ||||||||||||||||||
|
|
|
|
|
|
|
|
|
|
|
| |||||||||||||
| $ | 756,078 | $ | 29,515 | $ | 506,388 | $ | 122,443 | $ | 114,562 | $ | 752,601 | |||||||||||||
|
|
|
|
|
|
|
|
|
|
|
| |||||||||||||
Year Ended December 31, 2018 | ||||||||||||||||||||||||
Commercial lines | $ | 337,924 | $ | — | $ | 246,048 | $ | 55,143 | $ | 51,635 | $ | 349,895 | ||||||||||||
Personal lines | 403,367 | — | 330,410 | 65,821 | 61,635 | 394,121 | ||||||||||||||||||
Investments | — | 26,908 | — | — | — | — | ||||||||||||||||||
|
|
|
|
|
|
|
|
|
|
|
| |||||||||||||
| $ | 741,291 | $ | 26,908 | $ | 576,458 | $ | 120,964 | $ | 113,270 | $ | 744,016 | |||||||||||||
|
|
|
|
|
|
|
|
|
|
|
| |||||||||||||
Year Ended December 31, 2017 | ||||||||||||||||||||||||
Commercial lines | $ | 318,391 | $ | — | $ | 197,344 | $ | 52,149 | $ | 52,817 | $ | 329,116 | ||||||||||||
Personal lines | 384,124 | — | 289,924 | 62,916 | 63,721 | 400,023 | ||||||||||||||||||
Investments | — | 23,527 | — | — | — | — | ||||||||||||||||||
|
|
|
|
|
|
|
|
|
|
|
| |||||||||||||
| $ | 702,515 | $ | 23,527 | $ | 487,268 | $ | 115,065 | $ | 116,538 | $ | 729,139 | |||||||||||||
|
|
|
|
|
|
|
|
|
|
|
| |||||||||||||
-103-
Segment | Net Premiums Earned | Net Investment Income | Net Losses and Loss Expenses | Amortization of Deferred Policy Acquisition Costs | Other UnderwritingExpenses | Net Premiums Written | ||||||||||||||||||
Year Ended December 31, 2020 | ||||||||||||||||||||||||
Commercial lines | $ | 412,877 | $ | — | $ | 264,053 | $ | 66,253 | $ | 72,245 | $ | 425,986 | ||||||||||||
Personal lines | 329,163 | — | 195,711 | 52,819 | 53,618 | 316,154 | ||||||||||||||||||
Investments | — | 29,504 | — | — | — | — | ||||||||||||||||||
| $ | 742,040 | $ | 29,504 | $ | 459,764 | $ | 119,072 | $ | 125,863 | $ | 742,140 | |||||||||||||
Year Ended December 31, 2019 | ||||||||||||||||||||||||
Commercial lines | $ | 385,465 | $ | — | $ | 242,685 | $ | 62,424 | $ | 61,631 | $ | 404,879 | ||||||||||||
Personal lines | 370,613 | — | 263,703 | 60,019 | 52,931 | 347,722 | ||||||||||||||||||
Investments | — | 29,515 | — | — | — | — | ||||||||||||||||||
| $ | 756,078 | $ | 29,515 | $ | 506,388 | $ | 122,443 | $ | 114,562 | $ | 752,601 | |||||||||||||
Year Ended December 31, 2018 | ||||||||||||||||||||||||
Commercial lines | $ | 337,924 | $ | — | $ | 246,048 | $ | 55,143 | $ | 51,635 | $ | 349,895 | ||||||||||||
Personal lines | 403,367 | — | 330,410 | 65,821 | 61,635 | 394,121 | ||||||||||||||||||
Investments | — | 26,908 | — | — | — | — | ||||||||||||||||||
| $ | 741,291 | $ | 26,908 | $ | 576,458 | $ | 120,964 | $ | 113,270 | $ | 744,016 | |||||||||||||
| At December 31, | ||||||||||||||||
Segment | Deferred Policy Acquisition Costs | Liability For Losses and Loss Expenses | Unearned Premiums | Other Policy Claims and Benefits Payable | �� | |||||||||||
2019 | ||||||||||||||||
Commercial lines | $ | 30,947 | $ | 582,682 | $ | 266,297 | $ | — | ||||||||
Personal lines | 28,338 | 286,992 | 243,850 | — | ||||||||||||
Investments | — | — | — | — | ||||||||||||
|
|
|
|
|
|
|
| |||||||||
| $ | 59,285 | $ | 869,674 | $ | 510,147 | $ | — | |||||||||
|
|
|
|
|
|
|
| |||||||||
2018 | ||||||||||||||||
Commercial lines | $ | 27,762 | $ | 518,127 | $ | 231,990 | $ | — | ||||||||
Personal lines | 32,853 | 296,538 | 274,539 | — | ||||||||||||
Investments | — | — | — | — | ||||||||||||
|
|
|
|
|
|
|
| |||||||||
| $ | 60,615 | $ | 814,665 | $ | 506,529 | $ | — | |||||||||
|
|
|
|
|
|
|
| |||||||||
-104-
| At December 31, | ||||||||||||||||
Segment | Deferred Policy Acquisition Costs | Liability For Losses and Loss Expenses | Unearned Premiums | Other Policy Claims and Benefits Payable | ||||||||||||
2020 | ||||||||||||||||
Commercial lines | $ | 33,246 | $ | 694,569 | $ | 301,901 | $ | — | ||||||||
Personal lines | 25,911 | 267,438 | 235,289 | — | ||||||||||||
Investments | — | — | — | — | ||||||||||||
$ | 59,157 | $ | 962,007 | $ | 537,190 | $ | — | |||||||||
2019 | ||||||||||||||||
Commercial lines | $ | 30,947 | $ | 582,682 | $ | 266,297 | $ | — | ||||||||
Personal lines | 28,338 | 286,992 | 243,850 | — | ||||||||||||
Investments | — | — | — | — | ||||||||||||
| $ | 59,285 | $ | 869,674 | $ | 510,147 | $ | — | |||||||||
ReportTable of Independent Registered Public Accounting FirmBoard of Directors and ShareholdersDonegal Financial Services CorporationMount Joy, PennsylvaniaOpinion on the Consolidated Financial StatementsWe have audited the accompanying consolidated balance sheet of Donegal Financial Services Corporation and subsidiary (the “Company”) as of December 31, 2018, the related consolidated statements of income, comprehensive income, shareholders’ equity, and cash flows for each of the two years in the period ended December 31, 2018, and the related notes (collectively referred to as the “consolidated financial statements”) (not presented separately herein). In our opinion, the consolidated financial statements present fairly, in all material respects, the financial position of the Company at December 31, 2018, and the results of its operations and its cash flows for each of the two years in the period ended December 31, 2018, in conformity with accounting principles generally accepted in the United States of America.Emphasis of a MatterOn March 8, 2019 the Company was acquired by Northwest Bancshares, Inc.Basis for OpinionThese consolidated financial statements are the responsibility of the Company’s management. Our responsibility is to express an opinion on the Company’s consolidated financial statements based on our audits. We are a public accounting firm registered with the Public Company Accounting Oversight Board (United States) (“PCAOB”) and are required to be independent with respect to the Company in accordance with the U.S. federal securities laws and the applicable rules and regulations of the Securities and Exchange Commission and the PCAOB.We conducted our audits in accordance with the standards of the PCAOB and in accordance with auditing standards generally accepted in the United States of America. Those standards require that we plan and perform the audit to obtain reasonable assurance about whether the consolidated financial statements are free of material misstatement, whether due to error or fraud. Our audits included performing procedures to assess the risks of material misstatement of the consolidated financial statements, whether due to error or fraud, and performing procedures that respond to those risks. Such procedures included examining, on a test basis, evidence regarding the amounts and disclosures in the consolidated financial statements. Our audits also included evaluating the accounting principles used and significant estimates made by management, as well as evaluating the overall presentation of the consolidated financial statements. We believe that our audits provide a reasonable basis for our opinion./s/ BDO USA, LLPWe served as the Company’s auditor from 2013 to 2019.Harrisburg, PennsylvaniaMarch 7, 2019-105-
| DONEGAL GROUP INC. | ||
| By: | /s/ Kevin G. Burke | |
| Kevin G. Burke, President and Chief Executive Officer | ||
5, 2021
Signature | Title | Date | ||
/s/ Kevin G. Burke | President, Chief Executive Officer and a Director | March | ||
| Kevin G. Burke | (principal executive officer) | |||
/s/ Jeffrey D. Miller | Executive Vice President and Chief Financial Officer | March | ||
| Jeffrey D. Miller | (principal financial and accounting officer) | |||
/s/ Scott A. Berlucchi | Director | March | ||
| Scott A. Berlucchi | ||||
/s/ Dennis J. Bixenman | Director | March | ||
| Dennis J. Bixenman | ||||
/s/ | Director | March | ||
| ||||
| ||||
| Jack L. Hess | ||||
/s/ Barry C. Huber | Director | March | ||
| Barry C. Huber | ||||
/s/ | Director | March | ||
| David C. King | ||||
/s/ Kevin M. Kraft, Sr. | Director | March 5, 2021 | ||
| Kevin M. Kraft, Sr. | ||||
/s/ Jon M. Mahan | Director | March | ||
| Jon M. Mahan | ||||
/s/ S. Trezevant Moore, Jr. | Director | March | ||
| S. Trezevant Moore, Jr. | ||||
/s/ | Director | March | ||
Annette B. Szady | ||||
/s/ Richard D. Wampler, II | Director | March 5, 2021 | ||
| Richard D. Wampler, II | ||||
-106-