FORWARD-LOOKING STATEMENTS
This Annual Report on Form 10-K (“Form 10-K”) contains forward-looking statements which are made pursuant to the safe harbor provisions of Section 27A of the Securities Act of 1933, as amended, (the “Securities Act”) and Section 21E of the Securities Exchange Act of 1934, as amended (the “Exchange Act”).amended. The forward-looking statements in this Form 10-K do not constitute guarantees of future performance. Investors are cautioned that express or implied statements in this Form 10-K that are not strictly historical statements, including, without limitation, statements regarding current or future financial performance, potential impairment of future earnings, management’s strategy, plans and objectives for future operations or acquisitions, product development and sales, research and development, selling, general and administrative expenditures, intellectual property and adequacy of capital resources and financing plans constitute forward-looking statements. Such forward-looking statements are subject to a number of risks and uncertainties that could cause actual results to differ materially from those anticipated, including, without limitation, the risks identified under the caption “Risk Factors” and other risks detailed in this Form 10-K and our other filings with the Securities and Exchange Commission. We assume no obligation to update any forward-looking information contained in this Form 10-K, except as required by law.
1
PART I
ITEM 1. BUSINESS
The following discussion of our business contains forward-looking statements that involve risks and uncertainties. When used in this report, the words “intend,” “anticipate,” “believe,” “estimate,” “plan” and “expect” and similar expressions as they relate to us are included to identify forward-looking statements. Our actual results could differ materially from those anticipated in these forward-looking statements and are a result of certain factors, including those set forth under “Risk Factors” and elsewhere in this Annual Report on Form 10-K (“Form 10-K”).
References throughout this Form 10-K to “Repligen Corporation”, “Repligen”, “we”, “us”, “our”, or the “Company” refer to Repligen Corporation and its subsidiaries, taken as a whole, unless the context otherwise indicates.
Overview
Repligen Corporation is a global life sciences company that develops and commercializes highly innovative bioprocessing technologies and systems that increase efficiencies and flexibility in the process of manufacturing biological drugs.
As the overall market for biologics continues to grow and expand, our primary customers – global biopharmaceutical companies, and contract development and manufacturing organizations (“CDMOs”)and other life science companies (integrators) – face critical production cost, capacity, quality and time pressures. Built to address these concerns, our products are helping tohelp set new standards for the way biologics are manufactured. We are committed to inspiring advances in bioprocessing as a trusted partner in the production of critical biologic drugs – including monoclonal antibodies (“mAbs”), and mAb derivatives, recombinant proteins, vaccines, and cell and gene therapies (“C>”) – that are improving human health worldwide.
We currently operate as one bioprocessing business, with a comprehensive suite of products to serve both upstream and downstream processes in biological drug manufacturing. Building on over 3540 years of industry expertise, we have developed a broad and diversified product portfolio that reflects our passion for innovation and the customer-first culture that drives our entire organization. We continue to capitalize on opportunities to maximize the value of our product platform through both organic growth initiatives (internal innovation and commercial leverage) and targeted acquisitions.
Our corporate headquarters are located in Waltham, Massachusetts, with additional administrative and manufacturing operations worldwide. The majority of our 15 key19 manufacturing sites and assembly centers are located in the United States (California, Massachusetts, New Hampshire, New Jersey, New York and New York); and outsideTexas). Outside the United States, we have sites in Estonia, France, Germany, Ireland, the Netherlands and Sweden.
Our Products
Our bioprocessing business is comprised of four main franchises: Filtration; Chromatography; Process Analytics;filtration (including fluid management); chromatography; process analytics; and Proteins.
Since 2012, we have significantly expanded andpurposely built a highly diversified the product linesportfolio of products offered under these franchises, introducing multiple first-to-market differentiateddeveloping high-value technologies that enable more efficient drug manufacturing processes for our customers, through internal research and development (“R&D”) programs and strategic acquisitions. We are committed to our customers.sustainable innovation and have earned a reputation as an innovation leader in bioprocessing. We have achieved this expansion through innovations and strategic acquisitions of complementary assets or businesses.consistently introduced disruptive new products that solve for specific bioprocessing challenges faced by customers. Our growth strategy continues to expand our geographic scope ourand customer base and broaden the applications of our technologies.
To support our sales growth goals for these products, we make ongoing investments in our commercial organization, our research and development (“R&D”) team&D programs, our business systems and our manufacturing capacity. We regularly evaluate and invest in these areas as needed to ensure timely deliveries and to stay ahead of increased customer demand for our products.
2
The majority of our revenue is derived from consumable and/or single-campaign (“single-use”) product sales, as compared to associated hardware and equipment. The customization, scalability and plug-and-play convenience of these products, and in many cases the closed nature of our technologies, make them ideal for use in biologics manufacturing processes where contamination risk is a critical concern of our customers.
Shifting to Integrated Solutions
Since 2012, we have completed 13 acquisitions across our four franchises, building a base of technology assets that we can improve upon and/or develop next-generation versions of through our internal R&D team. Our acquisition strategy is purposeful, considering the potential for integration with our internally-developed technologies, and across products and franchises.
In 2023, the results of our mergers and acquisitions and R&D efforts are reflected in our ability to offer more integrated solutions across the bioproduction workflow. Our commercial approach is shifting from “individual product” to “whole system” sales that can support entire unit operations, the management of fluids between unit operations, and in-line advanced analytics. For example, providing filtration systems for production and harvest steps (upstream), and connecting those to chromatography and filtration systems for purification and formulation steps (downstream).
Key Products Within Each of Our Franchises
FILTRATION
Filtration
XCell ATF
Our Filtrationfiltration products offer a number of advantages to manufacturers of biologic drugs and are used in process development and process scale (clinical and commercial) production. Our XCell Alternating Tangential Flow (“ATF”)ATF systems are used in upstream perfusion (continuous) and N-1 (intensified fed-batch or hybrid perfusion) cell culture processing.
XCell ATF is a cell retention technology. The system is comprised of an advanced hollow fiber (“HF”) filtration device, a low shear pump and a controller. The XCell ATF system is connected to a bioreactor and enables the cell culture to be run continuously, with cells being retained in the bioreactor, fresh nutrients (cell culture media) being fed into the reactor continuously, and clarified biological product and cell waste being removed (harvested) continuously. The cells are maintained in a consistent nutrient-rich environment and can reach cell densities two- and three-times higher than those achieved by standard
Through internal innovation, we developed and launched single-use formats of the original stainless steel XCell ATF devices to address increasing industry demand for single-use sterile systems with “plug-and-play” technology. The XCell ATF device is now available to customers in both its original configuration (steel housing and single-use filters) in all sizes (2, 4, 6 and 10), and/or as a single-use device (disposable housing/filter combination) in most sizes (2, 6, and 10). The availability of XCell ATF technology in a single-use format reduces implementation time by eliminating the time intensive workflow associated with autoclaving and enables our customers to accelerate evaluations of the product with a lower initial overall cost of ownership.
In September 2018,2023, we entered intointroduced next-generation XCell® Large-Scale controllers, enabling increased process intensification through dual-operation of ATF devices from a collaboration agreementsingle controller, and through advance monitoring and control of flow rates with industry leader Sartorius Stedim Biotechsmart sensor
3
technology. Our ATF large-scale controllers are designed for scalability from bench top to commercial manufacturing, and for versatility of applications, including perfusion and modified fed-batch (N-1) manufacturing.
Tangential Flow Filtration Consumables
Our TangenX® product portfolio includes flat sheet (“SSB”FS”) to integrate our XCell ATF controller technology into SSB’s BIOSTAT®STR large-scale, single-use bioreactors, to create novel perfusion-enabled bioreactors.
TFF is a rapid and efficient method for the concentration and formulation of biomolecules that is widely used in many applications in biopharmaceutical development and manufacturing. SIUSOur TangenX FS TFF cassettes feature high performing-membrane chemistries that offer superior selectivity for a high performingwide range of applications. A controlled manufacturing process that balances flux and selectivity delivers maximum flux for increased productivity and tight control of the membrane pore size for enhanced selectivity and unique cartridge construction that enables a lower price point.recovery. Each disposablesingle-use cassette is delivered pre-sanitized and ready to be equilibrated and used for tangential flow, ultrafiltration and diafiltration applications.
Use of SIUS TFF cassettes eliminates non-value-added steps (cleaning, testing between uses, storage and flushing) that are required with reusable TFF products, providing cost and time savings. TheFor process economics requiring reusable cassettes, TangenX PRO cassettes are available with the same high performance membranes used in SIUS cassettes. Our TangenX cassettes are interchangeable with filter hardware from multiple manufacturers, simplifying customer trial and adoption of SIUS products.
Our TangenX® SC Device simplifies and streamlines downstream flat sheet UF/DF processes by reducing set up time by 80%, eliminating holders and torquing requirements which reduces the risk of product loss caused by changes in compression or cassette misalignment during installation, allowing users to chromatography.seamlessly transition from traditional cassettes and reducing bioburden risk and enhancing safety because it is aseptically closed and gamma irradiated and isolates operators from potentially hazardous materials.
Tangential Flow Filtration Systems: KrosFlo® TFF
Our KrosFlo systems for TFF combine significant configurability with premium quality manufacturing. Our TFF systems are designed for scalability from small to large (up to 5,000 liters) volumes, flexibility between HF and FS filter formats, and the ability to use the same system in different unit operations while deploying ready-to-use application-specific flow paths.
Our KrosFlo TFF systems are turnkey solutions for TFF, offered with either TangenX FS cassettes or with our HF filters.
KrosFlo® Flat Sheet TFF Systems
Our 2020 acquisition of ARTeSYN Biosolutions Holdings Ireland Limited (“ARTeSYN”) enabled us to develop and market KrosFlo RS TFF systems that integrate our consumable and equipment offering, providing greater convenience and efficiency for our customers.
We launched our KrosFlo RS 20 series systems in 2022, focusing their use in mRNA and C> therapy applications, where they are used primarily in downstream formulation. These responsive TFF systems completely automate sanitization, concentration and product recovery processes. The combination of injection molded tubing, over-molded connectors and valve blocks significantly lowers product hold-up volume to maximize product recovery. With the same software, hardware, controls and cGMP compliance built into every system, and with pre-assembled flow kits for error-free installation, the KrosFlo RS platform offers operational
4
simplicity that can easily be scalable from lab- through production-scale use. KrosFlo FS systems integrate over 10 components with specifications to process volumes between 140 milliliters and 500 liters.
KrosFlo®
Our filtration business is strengthened by a leading portfolio of Spectrum®®Systems systems with Konduit sensingautomated process monitoring and ProConnexfor product concentration is fully scalable fromintegrate multiple components with specifications to process volume between 2 milliliters toand 5,000 liters – from lab-scale tothrough commercial manufacturing. Designed for purification and formulation applications, KrosFlo Systems enable robust downstream ultrafiltration and microfiltration.
In early 2023 we introduced our RS 30 series of KrosFlo TFF systems, featuring increased automation capabilities. The RS 30 series systems integrate a single-use tulip tank re-circulation vessel, which allows for dynamic control and response to changing fluid levels for maximum product recovery in fed-batch, batch concentration and diafiltration processes. The cGMP compliant, fully automated 1/2 inch single-use TFF system delivers outstanding performance in a small footprint. In alignment with our integrated systems strategy, the KrosFlo®TFDF™ (Tangentialsystem includes ProConnex flow paths to integrate advanced fluid management technologies including overmolded connections, pump heads, tubing filters and sensors in a single-use device. Flow paths easily attach to the system to simplify operation and increase process efficiency.
Tangential Flow Depth Filtration) Systems, which weFiltration Systems: KrosFlo® TFDF®
We believe our KrosFlo Tangential Flow Depth Filtration (“TFDF”) systems, have the potential to disrupt and displace
Strengthening our Filtration Franchise through Acquisitions
With our acquisition of Polymem S.A. (“Polymem”) on July 1, 2021, we further expanded our HF membrane and module production capabilities and added core R&D, engineering and production expertise in HF technology for both industrial and bioprocessing markets. The Polymem business complements our Spectrum®ofwhich includes KrosFlo HF filters is used in bench-tops through commercial-scale processes, primarily for the filtration, purification and concentration of biologics and diagnostic products. Our KrosFlo filtrationTFF systems and equipment offerProConnex fluid management. The acquisition of Polymem accelerated our HF manufacturing buildout and added a Europe-based HF manufacturing center of excellence.
With our acquisition of BioFlex Solutions LLC (“BioFlex”) and Newton T&M Corp. (“NTM”) on December 16, 2021, we complemented and expanded our filtration franchise, as both standardBioFlex and customized solutions toNTM focus on single-use fluid management components, including single-use clamps, adapters, end caps and hose assemblies. These products are essential components in our upstream and downstream product offerings – especially our systems with line-sets and flow paths. These acquisitions streamline and increase our control over many components in our single-use supply chain, which ultimately should drive reduced lead-times for our customers in the coming years.
We acquired FlexBiosys, Inc. (“FlexBiosys”) on April 17, 2023, further complementing and expanding our fluid management portfolio of offerings with its expert design and custom manufacturing of single-use bioprocessing customers,products and a comprehensive range of products that include bioprocessing bags, bottles, and tubing assemblies.
With our acquisition of Metenova Holding AB (“Metenova”) on October 2, 2023, we strengthened our fluid management portfolio with particular strength in consumablethe addition of magnetic mixing and single-use offerings.
The growth of our filtration business has allowed us to substantially increase our direct sales presence in Europe and Asia and diversify our end markets to include all biologic classes, including mAb,mAbs, vaccines, recombinant proteins and gene therapies.C>.
5
CHROMATOGRAPHY
Our Chromatographychromatography franchise includes a number of products used in downstream purification, development, manufacturing and quality control of biological drugs. The main driver of growth in this portfolio is our OPUS
In addition to OPUS, with our acquisition of ARTeSYN in 2020, we are addingadded chromatography systems to our offerings, as well as single-use components and flow path assemblies for fluid management, providing greater flexibility and market opportunity as we scale and expand our systems portfolio.
Additional chromatography products include our affinity capture resins, such as CaptivAthatwhich are used in a small number of commercial drug processes and our ELISA test kits, used by quality control departments to detect and measure the presence of leached Protein A and/or growth factor in the final product.
OPUS Pre-Packed Columns
Our Chromatographychromatography franchise features a wide range of OPUS columns, which we deliver to our customers sealed and pre-packed with their choice of resin. These are single-use or campaign-use
We launched our first production scale OPUS columns in 2012 and have since added larger diameter options that scale up to use with 2,000 liter bioreactors. Our OPUS 80R column is the largest available PPC on the market for use in late-stage clinical or commercial purification processes. We offer unique features such as a resin recovery port on our larger columns, which allows our customers to remove and reuse the recovered resin in other applications. We believe the OPUS 5-80R product line is the most flexible product line available in the market, serving the purification needs of customers manufacturing mAbs and other biologics such as vaccines and gene therapies.
In addition to our larger scale OPUS columns, our portfolio includes our smaller-scale OPUS columns, including our RoboColumnMiniChrom™MiniChrom® and ValiChrom
We maintain customer-facing centers in both the United States and Europe for our OPUS column customers, and offer a premier ability to pack any of hundreds of chromatography capture resins available, as per our customers’ choice.
KRM™ Chromatography Systems
Through our acquisition of ARTeSYN in 2020, we gained state-of-the-art, configurable chromatography systems that can integrate a wide range of hardware, components and consumable products to simplify bioprocessing operations for our customers. Our Process AnalyticsKRM chromatography systems are precision engineered for high product recovery (low hold-up volumes), high bioactivity (less stress on the product of interest) and reduced risk of deviation (simple changeovers and pre-assembled flow kits). The KRM systems contain closed single-use flow paths (less risk of contamination and product loss) and other advanced fluid management technologies (over-molded connectors, pump heads, filters and pressure sensors), intuitive software and our process analytics technology enabled.
PROCESS ANALYTICS
Our process analytics products complement and support our Filtration, Chromatographyfiltration, chromatography and Proteinsproteins franchises as they allow end-users to make at-line or in-line absorbance measurements allowing for the determination of protein concentration in filtration, chromatography formulation and fill-finish applications.
SoloVPE
Our SoloVPE Slope Spectroscopy®
6
FlowVPE
Our FlowVPE Slope Spectroscopyslope spectroscopy system enhances the power of Slope Spectroscopyslope spectroscopy and provides in-line protein concentration measurement for filtration, chromatography and fill-finish applications. A key benefit of this in-line solution is the ability to monitor a manufacturing process in real time. We are developing a
FlowVPX® System
FlowVPX slope spectroscopy system is our next-generation FlowVPE launched at the beginning of 2021 and designed to incorporatemeet the rigors of regulatory GMP requirements. FlowVPX offers reliable real-time results with integrated ease for concentration measurements during every stage of the downstream GMP-compliant software for production-scale biologics manufacturing.
Use of VPE Slope Spectroscopyslope spectroscopy systems delivers multiple process benefits for our biopharmaceutical manufacturing customers, compared to traditional UV-Vis approaches. Key benefits include: the elimination of manual dilutions and sample transfers from process development/manufacturing to labs, rapid time to results (minutes versus hours), improved precision, built-in data quality for improved reporting and validation, and ease of use.
KrosFlo RPM systems monitor concentration during UF/DF runs without having to depend on mass inputs and off-line fixed pathlength UV-Vis spectrophotometers. Risk is further mitigated with fully enclosed ProConnex custom flow paths as a part of the automated TFF process.
Since the debut of the KrosFlo KR2i RPM (2 mL-15L) system, we expanded the KrosFlo RPM offering, introducing KrosFlo FS-15 RPM (150mL-15L) toward the end of 2023. The portfolio continues to expand to cover a wide range of volumes from lab-to production-scale requirements. We believe KrosFlo RPM solutions provide key process insights to users to reduce cycling time and minimize batch risks, both highly value attributes for bioprocessing users.
Culpeo® QCL-IR Liquid Analyzer
Pursuant to a 15-year license agreement that we entered into with DRS Daylight Solutions, Inc. (“Daylight”) in September 2022, we obtained the exclusive right to use Daylight's quantum cascade laser technology (“QCL”), including its Culpeo® QCL-IR Liquid Analyzer (“Culpeo”) specifically in the field of bioprocessing. Culpeo is a compact, intelligent spectrometer that uses the power of QCL to analyze and identify chemicals. Our Proteinsin-licensing of these rights complements our existing process analytics franchise. Adding mid-IR (higher sensitivity QCL-IR) to UV spectroscopy, we believe this will serve to accelerate and expand adoption of off-line and in-line process monitoring in the bioprocessing industry. Additionally, we are focused on expanding the QCL portfolio, with plans to integrate these solutions into our chromatography and filtration systems.
PROTEINS
Our proteins franchise is represented by our Protein A affinity ligands which are a critical component of Protein A chromatography resins used in downstream purification of virtually all mAb-based drugs on the market or in development, and viral vector affinity ligands and resins. Our proteins franchise also includes cell culture growth factor products, which are a key component of cell culture media used in upstream bioprocessing to increase cell density and improve product yield. Our recent addition to the Proteins franchise is a novel spike protein affinity ligand, which has the potential to be utilized in the purification of COVID-19 vaccines.
Protein A Affinity Ligands
We are a leading provider of Protein A affinity ligands to other life sciences companies.companies (integrators), whose final products are Protein A resins. Protein A ligands are an essential “binding” component of Protein A affinity chromatography resins used in the purification of virtually all mAb-based drugs on the market or in development. We manufacture multiple forms of Protein A ligands under
7
long-term supply agreements with major life sciences companies including Cytiva (formerly GE Healthcare and now a member of the(a standalone operating company owned by Danaher Life Sciences platform)Corporation), MilliporeSigma and Purolite, Life Sciencesan Ecolab Inc. company (“Purolite”), who in turn sell their Protein A chromatography resins to end users (mAb manufacturers). We have two manufacturing sites supporting overall global demand for our Protein A ligands: one in Lund, Sweden and anotherthe other in Waltham, Massachusetts.
Protein A chromatography resins are considered the industry standard“gold standard” for purification of antibody-based therapeutics due to the ability of the Protein A ligand to very selectively bind to or “capture” antibodies from crude protein mixtures. Protein A resins are packed into the first chromatography column of typically three columns used in a mAb purification process. As a result of Protein A’s high affinity for antibodies, the mAb product is highly purified and concentrated within this first capture step before moving to polishing steps.
Our Affinity Ligand Collaborations
In June 2018, we entered into an agreement with Navigo Proteins GmbH (“Navigo”) for the exclusive co-development of multiple affinity ligands for which Repligen holds commercialization rights. We manufacture and exclusively supply the first of these ligands, NGL-Impactinwith their Praesto® Jetted A50 Protein A resin product.
In September 2021, the Company and Navigo successfully completed co-development of a novel affinity ligand that addresses aggregation issues associated with pH sensitive antibodies and Fc-fusion proteins. We are manufacturing and supplying this ligand, NGL-Impact® HipH, to Purolite for use in a platform use resin product.
We have a long-term supply agreement with Purolite for NGL-Impact and potential additional affinity ligands that may advance from our Navigo collaboration.
Our Purolite Agreement
In October 2020,2022, we announcedextended our long-term supply agreement with Purolite through 2032 and broadened its scope to include affinity ligands targeting antibody fragments in addition to those targeting mAbs and Fc-fusion proteins. This extension and product line expansion aligns with our Proteins strategy and supports the successfulacceleration in market adoption of the Praesto® affinity resin portfolio. It provides Purolite with exclusive access to mAb fragment ligands developed at Avitide, Inc. (“Avitide”), in addition to the NGL portfolio developed at Navigo. Repligen will continue to receive access to Purolite's leading-edge base bead technology, as we proceed with the development (with Navigo)and commercialization of novel affinity resins focused on new modalities and C>.
mAb Fragment Affinity Ligands and Resins from Avitide
Our acquisition of Avitide also led to our development and 2022 launch of AVIPure® CH1, a cross-linked agarose-based resin specifically engineered for the capture of the CH1 region of antigen-binding fragments (“Fabs”) from human immunoglobins (“IgGs”) and mAbs. We believe that the high dynamic binding capacity for Fab and IgG1 even at short residence times position these resins well for market success.
Adeno-Associated Virus Affinity Ligands and Resins from Avitide
In September 2021, we completed our strategic acquisition of Avitide, a market leader in affinity ligand discovery and development. This acquisition was a major step forward in building our proteins franchise, moving Repligen into affinity resin solutions for C> and other emerging modalities.
In February 2022, we launched three advanced affinity chromatography resins for use in gene therapy manufacturing workflows. The resins AVIPure®-AAV9; AVIPure®-AAV8; and AVIPure®-AAV2, were developed by Avitide and are specific to the major adeno-associated virus (“AAV”) C> vectors used today. AAV vectors are the leading platform for gene delivery for the treatment of a spike protein ligand,variety of human diseases. In 2023, a new affinity resin for AAV5 was also launched, expanding the portfolio.
We are integrating these high performance AVIPure® resins with our OPUS PPC and ARTeSYN chromatography systems to provide our planscustomers with a seamless chromatography solution. Caustic stability has been a challenge that the AVIPure resins are designed to manufacture and commercialize the associated chromatography
8
overcome without sacrificing high dynamic binding capacity. We believe customers will benefit from superior process economics, including multi-cycle resin as a Repligen branded product beginning in early 2021. The spike protein is a characterizing feature of SARS-CoV-2, the virus that causes COVID-19; it is the primary antigen being evaluated in clinical trials to induce an immune response as a COVID-19 vaccine.
Growth Factors
Most biopharmaceuticals are produced through an upstream mammalian cell culture process. In order to stimulate increased cell growth and maximize overall yield from a bioreactor, manufacturers often add growth factors, such as insulin, to their cell culture media. Our cell culture growth factor additives include LONG (“LR3”), our insulin-like growth factor that has been shown to be up to 100 times more biologically potent than insulin (the industry standard), thereby increasing recombinant protein production in cell culture fermentation applications. LR3 will be sold through a distribution partnership with MilliporeSigma until we take over the direct selling of our growth factor portfolio in 2021.
Corporate Information
We are a Delaware corporation with our global headquarters in Waltham, Massachusetts. We were incorporated in 1981 and became a publicly traded company in 1986. Our common stock is listed on Thethe Nasdaq Global Market under the symbol “RGEN”. We have over 1,100approximately 1,800 employees and operate globally with offices and manufacturing sites located at multiple locations in the United States, Europe and Asia. Our principal executive offices are located at 41 Seyon Street, Waltham, Massachusetts 02453, our website is
2023 Acquisitions
Metenova Holding AB
On October 27, 2020,2, 2023, our subsidiary, Repligen Sweden AB, acquired Metenova from the former shareholders of Metenova (the “Metenova Seller”) pursuant to a Share Sale and Purchase Agreement (the “Share Purchase Agreement”), dated as of September 23, 2023 (such acquisition, the “Metenova Acquisition”), by and among Repligen Sweden AB, the Metenova Seller, and us, in our capacity as guarantor of the obligations of Repligen Sweden AB under the Share Purchase Agreement.
Metenova, which is headquartered in Molndal, Sweden, offers magnetic mixing and drive train technologies that are widely used by global biopharmaceutical companies and contract development and manufacturing organizations. The Metenova Acquisition further strengthens our fluid management portfolio with these products.
FlexBiosys, Inc.
On April 17, 2023, we entered intocompleted the acquisition of all of the outstanding equity interests in FlexBiosys, pursuant to an Equity and Asset Purchase Agreement with ARTeSYN, a company organized underFlexBiosys, TSAP Holdings Inc. (“NJ Seller”), Gayle Tarry and Stanley Tarry, as individuals (collectively with NJ Seller, the laws of Ireland, Third Creek Holdings, LLC, a Nevada limited liability company, Alphinity, LLC, a Nevada limited liability company (“Alphinity”, and together with Third Creek Holdings, LLC the “Sellers”“FlexBiosys Sellers”), and Michael Gagne, solelyStanley Tarry, in his capacity as the representative of the Sellers, pursuant toFlexBiosys Sellers.
FlexBiosys, which we acquired (i) all of the outstanding equity securities of ARTeSYN and (ii) certain assets from Alphinity related to the business of ARTeSYN (collectively, the “ARTeSYN Acquisition”) for approximately $200 million, comprised of approximately $130 million in cash to the Sellers and approximately $70 million in our common stock to Third Creek. The transaction closed on December 3, 2020.
Our Market Opportunity
Bioprocessing Addressable Market
The global addressable market for bioprocessing products is estimated to be over $12approximately $20 billion of which we estimate Repligen’s addressable market to be approximately $3.7$12 billion at year end 2020.2023. This market includes bioprocessing products used to manufacture therapeutic antibodies, recombinant proteins and vaccines, as well as gene therapies.
Monoclonal Antibody Market
Antibody-based biologics alone accounted for over $130approximately $175 billion of global biopharma revenue in 2019.2022. Industry sources project the mAbs market to grow in the range of approximately 7%10% to 12% annually through 2022,2026, driven by new approvals and expanded clinical uses for marketed antibodies, as well as the emergence of biosimilar versions of originator mAbs. As of December 31, 2020,2023, over 120150 mAbs were approved by the U.S. Food and Drug Administration (“FDA”) to treat a diverse range of diseases.
9
Biological R&D remains robust, with more than 6002,000 active mAb clinical trials ongoing to address a wide range of medical conditions.
In addition to investments in the discovery and development of novel biologic drugs, there has been substantial investment in follow-on products (biosimilars) by generic and specialty pharmaceutical as well as large biopharmaceutical companies. Development of follow-on products accelerated as the first major mAbs came off patent in the European Union and United States. Due to the high cost of biologic drugs, many countries in developing and emerging markets have been aggressively investing in biomanufacturing capabilities to supply lower cost biosimilars for the local markets. For both originator and follow-on biologics manufacturing, Repligen products are well-positioned to enable greater manufacturing flexibility, production yields and lower costs through improved process efficiencies.
Cell and Gene Therapy Market
C>”) have> has emerged in the past few years to become a rapidly growing area of biological drug development, with an estimated global market of greater than $7 billion in 2022, and over 1,1003,000 active clinical trials underway at year-end 2020
Our Strategy
We are focused on the development, production and commercialization of highly differentiated, technology-leading systems and solutions or products that address specific pressure points in the biologics manufacturing process and deliver substantial value to our customers. Our products are designed to increaseoptimize our customers’ product yield,workflow to maximize productivity and we are committed to supporting our customers with strong customer service and applications expertise.
We intend to build on our recent history of developing market-leading solutions and delivering strong financial performance through the following strategies:
10
Research and Development
Our researchR&D activities are focused on developing new high-value bioprocessing products across all of our franchises. We strive to continue to introduce truly differentiated products that address specific pain points in the biologics manufacturing process. Our commitment to innovation is core to the Repligen culture and our success as a company, with approximately 5% to 7% of revenue focused on new product development and market expansion for existing products.
Sales and Marketing
Our sales and marketing strategy supports our objective of strengthening our position as a leading provider of products and services, addressing upstream, downstream and quality control needs of bioprocessing customers in the biopharmaceutical industry.
Our Commercial Team
To support our sales goals for our direct-to-consumer products, we have invested in our commercial organization. Since 2014,2018, we have significantly expanded our global commercial organization from less than 10,103, to a commercial team of 180342 employees as of December 31, 2020.2023. This includes 140277 people in field positions (sales, field applications and field service), and 4038 people in internal positions (marketingcustomer service and customer service).27 in marketing. Geographically, 112173 members of our commercial team are located in North America, 2889 in Europe and 4080 in Asia-Pacific (“APAC”) regions.
Our bioprocess account managers are supported in each region by bioprocess sales specialists with expertise in Filtration, Chromatographyfiltration, chromatography or Process Analytics,process analytics, and by technically trained field applications specialists and field service providers, who can work closely with customers on product demonstrations, implementation and support. We believe that this model helps drive further adoption at our key accounts and also open up new sales opportunities within each region.
Ligand Supply Agreements
For our Proteinsproteins franchise, we are committed to be a partner of choice for our customers with distributor and supply agreements in place with large life sciences companies such as Cytiva, (formerly GE Healthcare), MilliporeSigma and Purolite. The Cytiva Protein A supply agreement relating to our Waltham, Massachusetts facility runs,was amended in September 2021 and pursuant to its amended terms, runs through 2021. During 2020, Cytiva moved a portion of its ligand manufacturing in-house.2025. Our Protein A supply agreement with MilliporeSigma runs, pursuant to its terms, through 2023, and in 2018 we amended our Protein A supply agreement with Purolite that runs,was amended in October 2022 and, pursuant to its amended terms, to August 2026 with an option for renewalruns through 2028.2032. Our dual manufacturing capability provides strong business continuity and reduces overall supply risk for our ligand customers.
Significant Customers and Geographic Reporting
Customers for our bioprocessing products include major life sciences companies, contract manufacturing organizations, biopharmaceutical companies, diagnostics companies and laboratory researchers.
The following table represents the Company’s total revenue by geographic area (based on the location of the customer):
For the Years Ended December 31, | ||||||||||||
2020 | 2019 | 2018 | ||||||||||
Revenue by customers’ geographic locations: | ||||||||||||
North America | 48 | % | 51 | % | 48 | % | ||||||
Europe | 38 | % | 37 | % | 40 | % | ||||||
APAC/Other | 14 | % | 12 | % | 12 | % | ||||||
Total revenue | 100 | % | 100 | % | 100 | % | ||||||
|
| For the Years Ended December 31, |
| |||||||||
|
| 2023 |
|
| 2022 |
|
| 2021 |
| |||
Revenue by customers' geographic locations: |
|
|
|
|
|
|
|
|
| |||
North America |
|
| 44 | % |
|
| 43 | % |
|
| 41 | % |
Europe |
|
| 37 | % |
|
| 37 | % |
|
| 40 | % |
APAC/Other |
|
| 19 | % |
|
| 20 | % |
|
| 19 | % |
Total revenue |
|
| 100 | % |
|
| 100 | % |
|
| 100 | % |
There was no revenue from customers that represented 10% or more of our biggest customers, accountedthe Company's total revenue for 11%, 13% and 15% of total revenues in the years ended December 31, 2020, 20192023 and 2018, respectively. Another customer, Cytiva (formerly GE Healthcare)2022. Revenue from Pfizer Inc. accounted for 12% and 15%10% of total revenues inrevenue for the yearsyear ended December 31, 20192021.
11
Human Capital
Employees
Repligen performs in a highly competitive industry and 2018, respectively.
Code of Business Conduct and Ethics
Repligen is committed to conducting business in accordance with the highest ethical standards. This means how we conduct ourselves and our global work is more than just a matter of policy and law; it’s a reflection of our core principles. Our Second Amended and Restated Code of Business Conduct and Ethics reflects Repligen’s five core principles – (1) trustworthiness, (2) respectfulness, (3) responsibility, (4) fairness and (5) corporate citizenship. Our Second Amended and Restated Code of Business Conduct and Ethics applies to all Repligen employees, including those who are integrated into the Company through acquisitions.
Inclusive Workforce
Repligen maintains a resolute commitment to fostering a diverse and inclusive workplace. We have established talent acquisition processes, as well as training and employee engagement resources, including the formation of inclusive workforce initiatives, to drive the principles of diversity and inclusion at all levels of our organization starting with our Board of Directors (“Board”) and our Leadership team.
In our hiring practices, we strive to hire the most qualified person for the job and believe that, over time, this will lead to an increasingly diverse workforce. As part of finding the most qualified candidates, we are committed to ensuring that qualified, diverse slates of applicants are identified and considered for all roles, from the boardroom and C-suite to all levels of the workforce. We believe our focus on fostering diversity, inclusion, equitytalent identification, development, engagement and belongingsuccession planning has been particularly successful in developing a deep and diverse talent pipeline.
Employee Engagement and Development
Our goal is criticalto develop and maintain a talented, engaged and diverse workforce that has a positive impact on our performance and on our customers. We regularly conduct engagement surveys to gain insight on employee perspectives. Additional channels for employee engagement include Company-wide all-hands meetings led by our Chief Executive Officer (“CEO”) and site town halls ran by site leaders. We are committed to colleague recognition, which includes acknowledging, appreciating and celebrating each other's contributions and achievements. Our CEO-led all-hands meetings serve as a platform for CEO awards and platinum awards, which reward and recognize both teams and individual colleagues who have made significant and notable contributions to Repligen's success. We also offer a range of programs to develop our managers and enhance our leadership across the Company. Our professional development efforts are aimed at increasing organizational talent and capabilities as well as identifying and developing potential successors for key leadership positions.
Health, Safety and Well-Being
We actively promote the safety, health and well-being of our employees and end users of our products. Creating a culture where all employees feel supported and valued is paramount to our corporate mission. Our well-being goals are for employees to physically thrive, flourish mentally and emotionally, be socially connected and achieve financial security. We are proud to provide all of our full time employees in the United States with access to an employee assistance program (“EAP”). Our EAP offers employees and their eligible dependents counseling and well-being resources 24 hours a day, seven days a week by phone, online or via the mobile site.
12
Our environmental health and safety policy advances our vision of zero workplace incidents and our efforts to reduce our environmental impacts.
Repligen Performance System
In 2022, we formalized the Repligen Performance System ("RPS"), to provide the tools and a framework for engaging employees across the organization to continuously improve operational performance, with a focus on product quality, customer lead times, material supply, production costs and sustainability. Through a standard implementation network, all teams were empowered to implement just-do-it process improvements, solve priority problems through stand-up meetings and improve key processes through kaizen events. We believe RPS improved our teams' ability to continuously resolve customer challenges, enhance product quality and improve operational efficiencies. The impact of RPS was seen during 2022 and into 2023 in productivity savings, customer lead-time reductions, manufacturing capacity expansions, product quality improvements and significant reductions in manufacturing scrap at several key sites. There are a number of programs setup using RPS over the next twelve months.
Sustainability - Environmental, Social and Governance Matters
Our Commitment to Sustainability
We believe our commitment to Environmental, Social and Governance (“ESG”) topics across all our global talentfacilities matters and is an important part of creating long-term business value for all stakeholders. We are deeply committed to corporate responsibility and transparency, and we continue to factor sustainability into our business decisions and integrate its core principles into our daily operations.
In establishing a formal approach to ESG, we joined the United Nations Global Compact in 2020 in support of its Ten Principles related to human rights, labor, the environment, and anti-corruption. The actions we have taken while building and implementing our robust ESG strategy demonstrate our long-term commitment to being a responsible global corporate citizen.
In preparation for our initial sustainability report, published in 2021, we formed a Corporate Responsibility Team (“CRT”) with oversight by our Board. The CRT was headed by a member of our operations leadership team and represented multiple disciplines within the organization. We completed our first materiality assessment gleaning insights from internal and external stakeholders, and we established a financial grade ESG software platform to inform current and future ESG-related reporting and decisions.
Together, we are advancing our ESG initiatives at an ambitious pace and taking bold steps to engage stakeholders throughout our upstream and downstream value chain.
Our Reporting Frameworks
We have become an active participant in the sustainability reporting ecosystem through our alignment with the Greenhouse Gas Protocol and membership with the United Nations Global Compact (“UNGC”), the Global Reporting Initiative (“GRI”) and the International Financial Reporting Standards Sustainability Alliance, which now includes the International Sustainability Standards Board standards. Sustainability Accounting Standards Board (“SASB”) standards and Task Force on Climate-related Financial Disclosures (“TCFD”) recommendations. In 2023, we completed our first CDP Climate and CDP Water surveys, and submitted our commitment letter to the Science Based Targets Initiative to develop a greenhouse gas emissions reduction plan aligned with the latest climate science.
With our 2022 sustainability report, which was published in November 2023 (the “2022 Sustainability Report”), we hope to convey our Progress on Repligen's Integrated Sustainability Management program, which recognizes that an effective sustainability strategy reflects multiple stakeholders' lenses, perspectives on materiality and measurements of success and collaborative engagement. The 2022 Sustainability Report is intended to provide transparency insights into the positive impacts of our ESG programs for all of our stakeholders. To that end, we created reporting indexes for multiple disclosure frameworks including UNGC, SASB, GRI and TCFD.
Oversight of ESG Matters
The Nominating and Corporate Governance (“N&CG”) Committee of our Board oversees our ESG program. The N&CG Committee meets regularly and reviews and advises on ESG strategy and pivotalapprises the full Board in order to buildingensure that our ESG program and
13
strategy align with the Company's mission. In addition, the Audit Committee of the Board regularly reviews ESG-related topics such as enterprise risk management, anti-corruption, ethics and compliance, supply chain management, human rights protections, and cybersecurity and data privacy.
The Head of Sustainability, under strategic direction of our CEO and Chief Operating Officer, is responsible for the development and implementation of our expanding ESG program. In collaboration with all key business functions, the mandate of this globally focused role is to consider our existing ESG initiatives, understand stakeholder perspectives, identify business-relevant areas of opportunity to make a positive impact on global ESG efforts, and work collaboratively to drive initiatives designed to accelerate our ESG progress and stretch our ESG ambition.
Our Sustainability Pillars
Our sustainability initiatives are organized around four pillars that reflect our ESG priorities and topics considered material (or potentially material) to the Company and the bioprocessing industry: Principles, People, Product and Planet. Our “4Ps” embody the belief shared by our Board and the executive leadership team that corporate responsibility is essential to sustaining business and economic growth in a manner that can also deliver positive environmental and social impact.
Our ESG pillars are as follows:
During 2022 and support2023, we led and participated in numerous stakeholder communications across the workplace.business with key customers, critical suppliers, leading institutional investors, industry associations and employee resource groups to better understand their interests, priorities, targets and challenges through the increasingly relevant lens of sustainability. We considerremain committed to periodically updating our employee relationsmateriality matrices and reviewing the foundational aspects of our 4Ps to be good.
Intellectual Property
We are committed to protecting our intellectual property through a combination of patent, copyright,patents, trade secretsecrets, copyrights and trademark laws,trademarks, as well as confidentiality and material transfer agreements. As further described below, we own or have exclusive rights to a number of U.S. patentsat least 263 active patent grants and U.S. pending patent applications as well as corresponding foreign patents and patent applications.
Our policy is to require each of our employees, consultants, business partners, potential collaborators and major customers to execute confidentiality agreements upon the commencement of an employment, consulting, business relationship, or product related audit with us.or research evaluation. These agreements provide that all confidential information developed or made known to the other party during the course of the relationship with us is to be kept confidential and not disclosed to third parties except in specific circumstances. In the case of employees and consultants, the agreements generally provide that all inventions conceived by the individual in the course of employment or rendering services to Repligen shall be our exclusive property and must be assigned to Repligen.
14
Filtration
For our filtration franchise, our patent grants include coverage for, ATF filtration, TFDF and TFF HF and FS systems, membranes, filters, mixers flow paths and single-use technologies. We continually seek to improve upon these technologies and have multiple new patent filings including patents covering next generation TFDF filters, next generation ATF filtration technologies, and proprietary reduced cost system components.
Chromatography
Our issued patents coverpatent grants include coverage for certain unique methods and features of our OPUS PPC, including methods of making and loading these chromatography columns as well as themanufacturing column structure. We continually seek to improve upon this technology and have multiple new patent filings, including those covering gamma irradiation sterilization, packing methods, and methods ofcomponents, systems for removing air using specialized tubing and valve systems, medium recovery systems, methods for packing, as well as systems for testing chromatography columns. We strive to improve upon our chromatography technologies, including developing potentially disruptive technology related to gamma irradiated columns and resin packing methods.
Through the ARTeSYN Acquisition in 2020, our patent portfolio includes exo-technology, valves, integrated sensors and integrated flow path systems.
Process Analytics
Through our 2019 acquisition of C Technologies, Inc. (“C Technologies”), we hold issued patentspatent grants to Slope Spectroscopyvarious slope spectroscopy instruments, and related methods. These include patents to an “Interactive Variable Pathlength Device” that are set to expire in the United States beginning in April 2028. We also hold granted patents to methods of making Slope Spectroscopy standards and methods for using anincluding interactive variable pathlength device.
Proteins
We currently hold a patent grant for “Nucleic Acids Encoding Recombinant Protein A,” which claims sequences that encode a truncated recombinant proteinProtein A but are otherwise identical to the natural proteinProtein A, which has long been commercializedis used for bioprocessing applications. This patent will remain in effect until June 2028. We
Pursuant to our collaboration with Navigo, we also have twomultiple patent grants and multiple pending patentspatent applications globally covering Protein A-based affinity ligands through our collaboration with Navigo.
In addition, following the acquisition of Avitide in September 2021, we continue to file multiple patent applications globally covering affinity ligands.
Trademarks
We vigilantly protect our productsprocure and services’ branding by maintainingmaintain trademark registrations globally for the Repligen trademark and our keyvarious product brands. We prioritize our “housemarks”, (e.g., Repligen, the stylized “R” logo, Spectrum, TangenX, C Technologies, ARTeSYN, Polymem, Avitide, Metenova, etc.), and ensure continued protection globally. We also have trademark registrations for various product lines, including OPUS, XCell, XCell ATF, TFDF, KrosFlo, SIUS, ProConnex, Spectra/Por, NGL-Impact, SoloVPE, FlowVPE, FlowVPX, RPM, XO and AVIPure, that provide valuable company recognition and goodwill with our customers.
We have a comprehensive branding policy that includes trademark usage guidelines to ensure Repligen trademarks are used in a manner that provides the maximum protection.
Licensing Agreements
We have entered into multiple licensing and collaboration relationships with third-party business partners in an effort to fully exploit our technology and advance our bioprocessing business strategy. For example, we entered into a 15-year exclusive License Agreement with Daylight (the “Daylight Agreement”), giving us exclusive license and commercialization rights to use certain technology and
15
intellectual property subject to conditions set forth in the Daylight Agreement. See Note 13, “Commitments and Contingencies” to our consolidated financial statements included in this report for more information on this license agreement.
Competition
Our bioprocessing products compete on the basis of value proposition, performance, quality, cost effectiveness, and application suitability with numerous established technologies. Additional products using new technologies that may be competitive with our products may also be introduced. Many of the companies selling or developing competitive products which in some cases include Cytiva (formerly GE Healthcare) and MilliporeSigma (the life sciences business of Merck KGaA), two of our largest customers, have greater financial and human resources, and greater R&D, manufacturing and marketing experience than we do. They may undertake their own development of products that are substantially similar to or compete with our products and they may succeed in developing products that are more effective or less costly than any that we may develop. These competitors may also prove to be more successful in their production, marketing and commercialization activities. We cannot be certain that the research, development and commercialization efforts of our competitors will not render any of our existing or potential products obsolete.
Manufacturing
A majority of our 15 key19 manufacturing sites are located in the United States (California, Massachusetts, New Jersey, New Hampshire, New York and New York)Texas). Outside the United States, we have manufacturing sites in Estonia, France, Germany, Ireland, the Netherlands and Sweden.
The proteins products we provide are manufactured at our sites in Waltham, Massachusetts and Lund, Sweden. Native Protein A ligands and our growth factor products are manufactured in Lund, while recombinant Protein A ligands are manufactured in both Waltham and Lund. Our primary chromatography assembly and manufacturing sites are located in Waltham, andMassachusetts, Ravensburg, Germany with additional chromatography manufacturing suites being added inand Breda, the Netherlands in 2021.Netherlands. Our primary filtration manufacturing sites, including manufacturing of fluid management systems, products and consumables, are located in Marlborough, Massachusetts andMassachusetts; Rancho Dominguez, California. InCalifornia; Clifton Park, New York; Auburn, Massachusetts; Waterford, Ireland; Tallinn, Estonia and Toulouse, France. Our facility in Marlborough, the focus is focused on XCell ATF and flat sheetFS TFF products, while in Rancho Dominguez the focus is on Spectrum hollow fiber,HF, TFDF and ProConnex products. Our process analytics products are manufactured in Bridgewater, New Jersey. Our operating room products are manufactured in Irving, Texas. As part of our capacity expansion activities, we have added a site in Hopkinton, Massachusetts that serves as an assembly center for single-use products and will also have the capacity to manufacture our protein products when the current buildout is completed. With our threefive acquisitions in 2020,since the beginning of 2021, we gained manufacturing sites in Clifton Park,Molndal, Sweden (Metenova), Branchburg, New York (EMT)Jersey (FlexBiosys), Toulouse, France (Polymem) and Auburn, Massachusetts (NMS) for fluid management consumables. ARTeSYN’s primaryLebanon, New Hampshire (Avitide). We undertook restructuring activities in 2023 that included consolidating a portion of our manufacturing operations between certain U.S. locations, discontinuing the sale of certain product SKUs, and evaluating the fair value of finished goods and raw materials secured during the 2020-2022 COVID-19 pandemic period. As a result of these activities, we closed manufacturing sites for fluid management productsin Newton, New Jersey and systems are located in Waterford, Ireland and Harju maakond, Estonia, with additional sites inOceanside, California.
We utilize our own facilities in Waltham, Massachusetts and Lund, Sweden as well as third-party contract manufacturing organizations to carry out certain fermentation and recovery operations, while theand purification, immobilization, packaging and quality control testing of our protein-based bioprocessing products are conducted at our facilities.products. Our facilities located in Waltham, Massachusetts; Marlborough, Massachusetts; Lund, Sweden; Ravensburg, Germany; Bridgewater, New Jersey; Clifton Park, New York; and Rancho Dominguez, California among other sites, are ISO® 9001:2015 certified and maintain formal quality systems to maintain process control, traceability, and product conformance. Additionally, our facilityfacilities in Irving, Texas isand Auburn, Massachusetts are ISO® 13485:20122016 certified. We practice continuous improvement initiatives based on routine internal audits as well as external feedback and audits performed by our partners and customers. In addition, we maintain a business continuity management system that focuses on key areas such as contingency planning, security stocks and off-site storage of raw materials and finished goods to ensure continuous supply of our products.
16
Available Information
We maintain a website with the addressAnnual Report on Form 10-K (“Form 10-K”).10-K. We make available free of charge through our website our Form 10-Ks, Quarterly Reports on Form 10-Q and Current Reports on Form 8-K, including exhibits and amendments to these reports, as soon as reasonably practicable after we electronically file such materials with, or furnish such materials to, the Securities and Exchange Commission (“SEC”). OurWe also provide corporate governance, such as our Second Amended and Restated Code of Business Conduct and Ethics is also availableand other information, including our 2022 Sustainability Report, free of charge, through our website.
Our filings with the SEC may be accessed through the SEC’s Electronic Data Gathering, Analysis and Retrieval (“EDGAR”) system atwww.sec.gov.
17
ITEM 1A. RISK FACTORS
Investors should carefully consider the risk factors described below before making an investment decision.
If any of the events described in the following risk factors occur, our business, financial condition or results of operations could be materially harmed. In that case, the trading price of our common stock
This Annual Report on Form 10-K (“Form 10-K”) contains forward looking statements that involve risks and uncertainties. Our actual results could differ materially from those anticipated in these forward-looking statements as a result of certain factors, including the risks faced by us described below and elsewhere in this Form 10-K.
Risks Related to Our Business
We compete with life sciences, pharmaceutical and biotechnology companies who are capable of developing new approaches that could make our products and technology obsolete.
The bioprocessing market is intensely competitive, subject to rapid change and significantly affected by new product introductions and other market activities of industry participants.
We compete with several medium and small companies in each of our product categories as well as several large companies, including Danaher Corporation (Pall Corporation and Cytiva (formerly GE Healthcare))Cytiva), Thermo Fisher Scientific Inc., MilliporeSigma and Sartorius. Many of our competitors are large, well-capitalized companies that may have greater financial, manufacturing, marketing, research and development (“R&D”) resources than we have, as well as stronger name recognition, longer operating histories and benefits derived from greater economies of scale. As a consequence, they are able to spend more aggressively on product development, marketing, sales and other product initiatives than we can. Many of these competitors have:
These factors, among others, may enable our competitors to market their products at lower prices or on terms more advantageous to customers than what we can offer. Competition may result in price reduction, reduced gross margins and loss of market share, any of which could have a material adverse effect on our business, financial condition and results of operations.
Our current and future competitors, including certain of our customers, may at any time develop additional products that compete with our products. If any company develops products that compete with or are superior to our products, our revenue may decline. Additionally, new approaches by these competitors may make our products and technologies obsolete or noncompetitive.
If we are unable to continue to hire and retain skilled personnel, then we will have trouble developing and marketing our products.
Our success depends largely upon the continued service of our management and scientific staff and our ability to attract, retain and motivate highly skilled technical, scientific, management and marketing personnel. We also face significant competition in the hiring and retention of such personnel from other companies, research and academic institutions, government and other organizations who have superior funding and resources. The loss of key personnel or our inability to hire and retain skilled personnel could materially adversely affect our product development efforts and our business.
Despite our increasingly diversified client base, we have historically depended on a limited number of customers for a high percentage of our revenues.
The loss of, or a significant reduction in orders from, any of our large customers, including following any termination or failure to renew a long-term supply contract, would significantly reduce our revenues and harm our results of operations. If a large customer purchases fewer of our products, defers orders or fails to place additional orders with us for any reason, including for business continuity purposes, our revenue could decline, and our operating results may not meet market expectations.
In addition, if our customers order our products, but fail to pay on time or at all, our liquidity and operating results could be materially and adversely affected. Furthermore, if any of our current or future products compete with those of any of our largest customers, these
18
customers may place fewer orders with us or cease placing orders with us, which would negatively affect our revenues and operating results.
Certain of our products are used by customers in the production of gene therapies, which represent a relatively new and still-developing mode of treatment. Unforeseen adverse events, negative clinical outcomes, or increased regulatory scrutiny of cell and gene therapy (“C>”) and its financial cost may damage public perception of the safety, utility, or efficacy of gene therapies and may harm our customers’ ability to conduct their business. Such events may negatively impact our revenues and have an adverse effect on our performance.
C> remains a relatively new and developing treatment method, with only a fewlimited number of gene therapies approved to date by regulatory authorities. Public perception may be influenced by claims that gene therapyC> is unsafe or ineffective, and gene therapyC> may not gain the acceptance of the public or the medical community. In addition, ethical, social, legal, and financial concerns about gene therapyC> and
Risks Related to Product Development and Acquisitions
If we are unable to expand our product portfolio, our ability to generate revenue could be adversely affected.
We are increasingly seeking to develop and commercialize our portfolio of products. Our future financial performance will depend, in part, on our ability to successfully develop and acquire additional bioprocessing products. There is no guarantee that we will be able to successfully acquire or develop additional bioprocessing products, and the Company’sour financial performance will likely suffer if we are unable to do so.
Our acquisitions expose us to risks that could adversely affect our business, and we may not achieve the anticipated benefits of acquisitions of businesses or technologies.
As a part of our growth strategy, we may make selected acquisitions of complementary products and/or businesses, such as our most recent acquisitions of ARTeSYN Biosolutions Holdings Ireland Limited, Non-Metallic Solutions,Metenova Holding AB and FlexBiosys, Inc. or Engineered Molding Technology LLC. Any acquisition involves numerous risks and operational, financial, and managerial challenges, including the following, any of which could adversely affect our business, financial condition, or results of operations:
19
In addition, the successful integration of acquired businesses requires significant efforts and expense across all operational areas, including sales and marketing, research and development,R&D, manufacturing, finance, legal, and information technologies. There can be no assurance that any of the acquisitions we
If intangible assets and goodwill that we recorded in connection with our acquisitions become impaired, we may have to take significant charges against earnings.
In connection with the accounting for our completed acquisitions, we recorded a significant amount of intangible assets, including developed technology and customer relationships relating to the acquired product lines, and goodwill. Under accounting principles generally accepted in the United States, (“GAAP”), we must assess, at least annually and potentially more frequently, whether the value of intangible assets and goodwill has been impaired. Intangible assets and goodwill will be assessed for impairment in the event of an impairment indicator. Any reduction or impairment of the value of intangible assets and goodwill will result in a charge against earnings, which could materially adversely affect our results of operations and shareholders’ equity in future periods.
Risks Related to Manufacturing and Supply
If we are unable to manufacture our products in sufficient quantities and in a timely manner, our operating results will be harmed, our ability to generate revenue could be diminished and our gross margin may be negatively impacted.
Our revenues and other operating results will depend in large part on our ability to manufacture and assemble our products in sufficient quantities and in a timely manner. Any interruptions we experience in the manufacturing or shipping of our products could delay our ability to recognize revenues in a particular quarter. Manufacturing problems can and do arise, and as demand for our products increases, any such problems could have an increasingly significant impact on our operating results. While we have not generally experienced problems with, or delays in, our production capabilities that resulted in delays in our ability to ship finished products, there can be no assurance that we will not encounter such problems in the future. We may not be able to quickly ship products and recognize anticipated revenues for a given period if we experience significant delays in the manufacturing process. In addition, we must maintain sufficient production capacity in order to meet anticipated customer demand, which carries fixed costs that we may not be able to offset if orders were to slow, which would adversely affect our operating margins. If we are unable to manufacture our products consistently, in sufficient quantities, and on a timely basis, our bioprocessing revenue, gross margins and our other operating results will be materially and adversely affected.
We rely on a limited number of suppliers or, for certain of our products, one supplier, and we may not be able to find replacements or immediately transition to alternative suppliers, which could have a material adverse effect on our financial condition, results of operations and reputation.
There are only a limited number of suppliers of materials for certain of our products. An interruption in operations of the business related to these products could occur if we encounter delays or difficulties in securing the required materials, or if we cannot then obtain an acceptable substitute. Any such interruption could significantly affect the business related to these products and our financial condition, results of operations and reputation.
20
There can be no assurance that we will be able to secure
Risks Related to Our Financial Position and Need for Additional Capital
Servicing our debt will require a significant amount of cash, and we may not have sufficient cash flow from our business to make payments on our debt.
In 2019,December 2023, we incurred significant indebtedness inwith the amountissuance of $287.5$600.0 million in aggregate principal with additional accrued interest underamount of 1.00% Convertible Senior Notes due 2028 (the “2023 Notes”) where $309.9 million principal amount of the 2023 Notes were issued in exchange for $217.7 million principal amount of our 0.375% Convertible Senior Notes due 2024 (the “2019 Notes”, and together with the 2023 Notes, the “Notes”). and $290.1 million principal amount of the 2023 Notes were issued for $290.1 million in cash. As of December 31, 2023, $69.7 million in aggregate principal amount of the 2019 Notes remain outstanding. Our ability to make scheduled payments of the principal of, to pay interest on, or to refinance our indebtedness, including the 2019 Notes, depends on our future performance, which is subject to economic, financial, competitive and other factors that may be beyond our control. Our business may not continue to generate cash flow from operations in the future sufficient to service our debt and make necessary capital expenditures. If we are unable to generate such cash flow, we may be required to adopt one or more alternatives, such as selling assets, restructuring debt or obtaining additional equity capital on terms that may be onerous or highly dilutive. Our ability to refinance our indebtedness will depend on the capital markets and our financial condition at such time. In addition, in the event of a fundamental change or a default under the 2019 Notes, the holders and/or the trustee under the indentures governing the 2019 Notes may accelerate the payment obligations or trigger the holders’ repurchase rights under the 2019 Notes. We may not be able to engage in any of these activities or engage in these activities on desirable terms, which could result in a default on our debt obligations, including the 2019 Notes.
In addition, holders of the Notes have the right, subject to certain conditions, to require us to repurchase all or any portion of their Notes upon the occurrence of a make-whole“fundamental change” (as defined in the indentures governing the Notes) at a fundamental change such as an acquisition of our company, occurs priorrepurchase price equal to the maturity100% of the 2019principal amount of the Notes under certain circumstances,to be repurchased, plus accrued and unpaid interest, if any, but excluding the conversion rate for the 2019 Notes will increase such that additional shares of our common stock will be issued uponfundamental change repurchase date. Upon any conversion of the 2019 Notes, in connection with such make-whole fundamental change. The increase in the conversion rate will be determined based on the date on which the make-whole fundamental change occurs or becomes effective and the price paid (or deemed paid) per share of our common stock in such transaction. Upon conversion of the 2019 Notes, unless we elect to deliver solely shares of our common stock to settle such conversion (other than paying cash in lieu of delivering any fractional share), we will also be required to make cash payments in respectfor each $1,000 principal amount of 2023 Notes converted of at least the lesser of $1,000 and the sum of the 2019 Notes being converted. We“daily conversion values” (as defined in the indenture governing the 2023 Notes). However, we may not have enough available cash or be able to obtain financing at the time we are required to make repurchases of 2019 Notes surrendered therefor or notespay cash with respect to Notes being converted. In addition, our ability to repurchase the Notes or to pay cash upon conversions of the Notes may be limited by law, by regulatory authority or by agreements governing our future indebtedness. Our failure to repurchase 2019 Notes at a time when the repurchase is required by the applicable indenture or to pay any cash payable on future conversions of the 2019 Notes as required by the applicable indenture would constitute a default under such indenture. A default under either indenture governing the indenture.Notes or the fundamental change itself could also lead to a default under agreements governing our future indebtedness. If the repayment of the related indebtedness were to be accelerated after any applicable notice or grace periods, we may not have sufficient funds to repay the indebtedness and repurchase the 2019 Notes or make cash payments upon conversions thereof.
In addition, our significant indebtedness, combined with our other financial obligations and contractual commitments, could have other important consequences. For example, it could:
21
Any of these factors could materially and adversely affect our business, financial condition and results of operations. In addition, if we incur additional indebtedness, the risks related to our business and our ability to service or repay our indebtedness would increase.
The conditional conversion feature of the Notes, if triggered, may adversely affect our financial condition and liquidity.
In the event the conditional conversion feature of the Notes is triggered, holders of Notes will be entitled to convert the Notes at any time during specified periods at their option, as described in the indentures governing the Notes. If one or more holders elect to convert their Notes, we would be required to settle any converted principal through the payment of cash, which could adversely affect our liquidity. In addition, even if holders do not elect to convert their Notes, we could be required under applicable accounting rules to reclassify all or a portion of the outstanding principal of the notes as a current rather than long-term liability, which would result in a material reduction of our net working capital. As a result of the satisfaction of one of the conversion triggers, the 2019 Notes are convertible at the option of the holders thereof during the calendar quarter ending March 31, 2024. Because the 2019 Notes mature within one year of the report date, the Company classifies the carrying value of the 2019 Notes of $69.5 million as current liabilities on the Company's consolidated balance sheets at December 31, 2023.
Future strategic transactions or acquisitions may require us to seek additional financing, which we may not be able to secure on favorable terms, if at all.
We plan to continue a strategy of growth and development for our bioprocessing business, and we actively evaluate various strategic transactions on an ongoing basis, including licensing or acquiring complementary products, technologies or businesses that would complement our existing portfolio of development programs. In order to complete such strategic transactions, we may need to seek additional financing to fund these investments and acquisitions. Should we need to do so, we may not be able to secure such financing, or obtain such financing on favorable terms because of the volatile nature of the biotechnology marketplace. In addition, future acquisitions may require the issuance or sale of additional equity or debt securities, which may result in additional dilution to our stockholders.
Our corporate restructuring and the associated headcount reduction may not result in anticipated savings, could result in total costs and expenses that are greater than expected and could disrupt our business.
In July 2023, our Board of Directors (“Board”) authorized the Company's management team to undertake restructuring activities to simplify and streamline our organization and strengthen the overall effectiveness of our operations (the “Restructuring Plan”). As part of the Restructuring Plan, we consolidated a portion of our manufacturing business between certain U.S. locations and reduced our headcount. We may not realize, in full or in part, the anticipated benefits, savings and improvements in our cost structure from our restructuring efforts due to unforeseen difficulties, delays or unexpected costs. If we are unable to realize the expected operational efficiencies and cost savings from the restructuring, our operating results and financial condition could be adversely affected. Furthermore, the Restructuring Plan may be disruptive to our operations. For example, our headcount reductions could yield unanticipated consequences, such as increased difficulties in implementing our business strategy, including retention of our remaining employees.
Our exposure to political, economic and other risks that arise from operating a multinational business has and may continue to increase.
We operate on a global basis with offices or activities in Japan, South Korea, China, India, Europe and North America. Our operations and sales outside of the United States have increased as a result of our strategic acquisitions and the continued expansion of our commercial organization. Risks related to these increased foreign operations include:
22
Our business success depends in part on our ability to anticipate and effectively manage these and other related factors. We cannot assure you that these and other related factors will not materially adversely affect our international operations or business as a whole.
In addition, a deterioration in diplomatic relations between the United States and any country where we conduct business could adversely affect our future operations and lead to a decline in profitability. In 2018 and 2019, the United States imposed tariffs on goods imported from China and certain other countries, which has resulted in retaliatory tariffs by China and other countries. Additional tariffs or further retaliatory trade measures taken by China or other countries in response, could affect the demand for our products and services, impact the competitive position of our products, prevent us from being able to sell products in certain countries or otherwise adversely impact our results of operations.
We may be unable to efficiently manage our growth as a larger and more geographically diverse organization.
Our strategic acquisitions, the continued expansion of our commercial sales operations, and our organic growth have increased the scope and complexity of our business. As a result, we will face challenges inherent in efficiently managing a more complex business with an increased number of employees over large geographic distances, including the need to implement appropriate systems, policies, benefits and compliance programs. Our inability to manage successfully the geographically moreand culturally diverse, (including from a cultural perspective) and substantially larger combined organization could materially adversely affect our operating results and, as a result, the market price of our common stock.
Our results of operations could be negatively affected by potential fluctuations in foreign currency exchange rates.
We conduct a large portion of our business in international markets. For the fiscal year ended December 31, 2020, 30%2023, 38.5% of our revenues and 7% of our costs and expenses were denominated in foreign currencies primarilywith the primary foreign currency exposures being the Swedish krona, the British pound sterling,Euro and the Euro.Chinese yuan. We are exposed to the risk of an increase or decrease in the value of the foreign currencies relative to the U.S. Dollar,dollar, which could decrease the value of our revenue and increase the value of our expenses and decrease the value of our revenuecosts when measured in U.S. Dollars.dollars. These fluctuations could also adversely affect the demand for products and services provided by us. As a result, our results of operation may be influenced by the effects of future exchange rate fluctuations and such effects may have an adverse impact on our common stock price.
Natural disasters, geopolitical unrest, war, terrorism, public health issues or other catastrophic events could disrupt the supply, delivery or demand of products, which could negatively affect our operations and performance.
We are subject to the risk of disruption by earthquakes, floods and other natural disasters, fire, power shortages, geopolitical unrest, war, terrorist attacks and other hostile acts, public health issues, epidemics or pandemics and other events beyond our control and the control of the third parties on which we depend. Any of these catastrophic events whether in the United States or abroad, may have a strong negative impact on the global economy, our employees, facilities, partners, suppliers, distributors or customers, and could decrease demand for our products, create delays and inefficiencies in our supply chain and make it difficult or impossible for us to deliver products to our customers.
23
In addition, a catastrophic event that results in the destruction or disruption of our data centers or our critical business or information technology systems would severely affect our ability to conduct normal business operations and, as a result, our operating results would be adversely affected.
Our business, financial condition and economic uncertainty surroundingresults from operations could be adversely affected by disruptions in the withdrawalglobal economy caused by geopolitical events, such as the ongoing conflicts between Russia and Ukraine and Israel and Palestine.
Global conflicts could increase costs and limit availability of fuel, energy, and other resources we depend upon for our business operations. For example, while we do not operate in Russia or Ukraine, the increasing tensions between the United States and Russia and the other effects of the ongoing conflict of Ukraine, have resulted in many broader economic impacts such as the United Kingdom from theStates and European Union is a source of instabilityimposing sanctions and uncertainty.
Adverse developments affecting the financial services industry, such as actual events or concerns involving liquidity, defaults, or non-performance by financial institutions or transactional counterparties, could adversely affect our current and projected business operations and our financial condition and results of operations.
Actual events involving limited liquidity, defaults, non-performance or other adverse developments that affect financial institutions, transactional counterparties or other companies in the financial services industry or the financial services industry generally, or concerns or rumors about any events of these kinds or other similar risks, have in the past and may in the future lead to market-wide liquidity problems. For example, on March 10, 2023, Silicon Valley Bank (“SVB”) was closed by the California Department of Financial Protection and Innovation, which appointed the Federal Deposit Insurance Corporation (“FDIC”) as receiver. Similarly, on March 12, 2023, Signature Bank and Silvergate Capital Corp. were each swept into receivership. If any of our lenders or counterparties to any such instruments were to be subjectplaced into receivership, we may be unable to increased market volatility.
Inflation and rapid increases in interest rates have led to a decline in the trading value of previously issued government securities with interest rates below current market interest rates. Although the U.S. Department of Treasury, FDIC and Federal Reserve Board have announced a program to provide up to $25 billion of loans to financial institutions secured by certain of such government securities held by financial institutions to mitigate the risk of potential losses on the sale of such instruments, widespread demands for customer withdrawals or other liquidity needs of financial institutions for immediately liquidity may exceed the capacity of such program. Additionally, there is no guarantee that the U.S. Department of Treasury, FDIC and Federal Reserve Board will provide access to uninsured funds in the future in the event of the closure of other banks or financial institutions, or that they would do so in a timely fashion.
Although we assess our banking and customer relationships as we believe necessary or appropriate, our access to funding sources and other credit arrangements in amounts adequate to finance or capitalize our current and projected future business operations could be significantly impaired by factors that affect the Company, the financial institutions with which the Company has credit agreements or arrangements directly, or the financial services industry or economy in general. These factors could include, among others, events such as liquidity constraints or failures, the ability to perform obligations under various types of financial, credit or liquidity agreements or arrangements, disruptions or instability in the financial services industry or financial markets, or concerns or negative expectations about the prospects for companies in the financial services industry. These factors could involve financial institutions or
24
financial services industry companies with which the Company has financial or business relationships, but could also include factors involving financial markets or the financial services industry generally. The results of events or concerns that involve one or more of these factors could include a variety of material and adverse impacts on our current and projected business operations and our financial condition and results of operations.
In addition, investor concerns regarding the U.S. or international financial systems could result in less favorable commercial financing terms, including higher interest rates or costs and tighter financial and operating covenants, or systemic limitations on access to credit and liquidity sources, thereby making it more difficult for us to acquire financing on acceptable trading and customs terms or if other EU Member States pursue withdrawal, barrier-free access between the U.K. and other EU Member Statesat all. Any decline in available funding or among the European Economic Area (“E.E.A.”) overall could be diminished or eliminated. The long-term effects of Brexit will depend on any agreements (or lack thereof) between the U.K. and the EU and, in particular, any arrangements for the U.K. to retain access to EU markets after the Transition Period. Such a withdrawalour cash and liquidity resources could, among other risks, adversely impact our ability to meet our operating expenses, financial obligations or fulfill our other obligations, result in breaches of our financial and/or contractual obligations or result in violations of federal or state wage and hour laws. Any of these impacts, or any other impacts resulting from the EU is unprecedented, and it is unclear how the restrictions on the U.K.’s access to the European single market for goods, capital, services and labor within the EU,factors described above or single market, and the wider commercial, legal and regulatory environment, could impact our U.K. operations.
In addition, any further deterioration in the macroeconomic economy or financial services industry, could lead to losses or defaults by our suppliers, which in turn, could have a material adverse effect on our current and/or projected business operations and development programs. For example, the U.K. could lose the benefits of global trade agreements negotiated by the EU on behalf of its members, which may result in increased trade barriers that could make our doing business in the EU and the E.E.A. more difficult. There may continue to be economic uncertainty surrounding the consequences of Brexit, which could adversely affect our financial condition, results of operations cash flows and market price of our common stock.
Risks Related to Ownership of Our Common Stock
Risks Related to Investment in Our Securities
Our operating results may fluctuate significantly, our customers’ future purchases are difficult to predict and any failure to meet financial expectations may result in a decline in our stock price.
Our quarterly operating results may fluctuate in the future as a result ofdue to many factors, such as the impact of seasonal spending patterns, changes in overall spending levels in the life sciences industry, the inability of some of our customers to consummate anticipated purchases of our products due to changes in end-user demand, and other unpredictable factors that may affect ordering patterns. Because our revenue and operating results are difficult to predict, we believe that our past results of operations are not necessarily a good indicator of our future performance. Additionally, if revenue declines in a quarter, whether due to a delay in recognizing expected revenue, adverse economic conditions or otherwise, our results of operations will be harmed because many of our expenses are relatively fixed. In particular, a large portion of our manufacturing costs, our research and development,R&D, sales and marketing and general and administrative expenses are not significantly affected by variations in revenue. Further, our gross margins are dependent on product mix. A shift in sales mix away from our higher-margin products to lower margin products will adversely affect our gross margins. If our quarterly operating results fail to meet investor expectations, the price of our common stock may decline.
Securities or industry analysts may not publish favorable research or reports about our business or may publish no information, which could cause our stock price or trading volume to decline.
The trading market for our common stock is influenced by the research and reports that industry or securities analysts publish about us and our business. We do not have any control over these analysts, and we cannot provide any assurance that analysts will cover us or provide favorable coverage. If any of the analysts who cover us issue an adverse opinion regarding our stock price, our business or stock price would likely decline. If one or more of these analysts cease coverage of our company or fail to regularly publish reports covering us, we could lose visibility in the market, which in turn could cause our stock price or trading volume to decline.
Our stock price could be volatile, which could cause shareholders to lose part or all of their investment.
The market price of our common stock, like that of the common stock of many other companies with similar market capitalizations, is highly volatile. In addition, theThe stock market has experienced extreme pricein general, and volume fluctuations. This volatility has significantly affected the market prices of securities of manyfor life sciences, biotechnology and pharmaceutical companies for reasons frequentlyin particular, have experienced extreme price and volume fluctuations that have often been unrelated to or disproportionate to the operating performance of specific companies, the specific companies. These broadconflict in Ukraine and Israel, and rising inflation and interest rates in the United States, which have resulted in decreased stock prices for many companies notwithstanding the lack of a fundamental change in their underlying business models or prospects. Broad market fluctuationsand industry factors, including potentially worsening economic conditions, may adversely affect the market price of our common stock.stock, regardless of our actual operating performance.
25
If we fail to maintain an effective system of internal controls, we may not be able to accurately report financial results or prevent fraud. If we identify a material weakness in our internal control over financial reporting, our ability to meet our reporting obligations and the trading price of our stock could be negatively affected.
Effective internal controls are necessary to provide reliable financial reports and to assist in the effective prevention of fraud. Any inability to provide reliable financial reports or prevent fraud could harm our
If we cannot conclude that we have effective internal control over our financial reporting, or if our independent registered public accounting firm is unable to provide an unqualified opinion regarding the effectiveness of our internal control over financial reporting, investors could lose confidence in the reliability of our financial statements, which could lead to a decline in our stock price. Failure to comply with reporting requirements could also subject us to sanctions and/or investigations by the SEC, TheSecurities and Exchange Commission, the Nasdaq StockGlobal Select Market or other regulatory authorities.
We have previously implemented several significant ERPenterprise resource planning (“ERP”) modules and expect to implement additional ERP modules in the future. The implementation of the ERP system represents a change in our internal control over financial reporting. Although we continue to monitor and assess our internal controls in the new ERP system environment as changes are made and new modules are implemented, and we have taken additional steps to modify and enhance the design and effectiveness of our internal control over financial reporting, there is a risk that deficiencies may occur that could aggregate to a material weakness.
As discussed below in Part II, Item 9A, “Controls and Procedures,” of this report, we identified a material weakness in our internal control over financial reporting related to the accounting for deferred income taxes on the December 2023 exchange of a portion of our 2019 Notes and issuance of our 2023 Notes. As a result of this material weakness, our management concluded that our internal control over financial reporting was not effective as of December 31, 2023.
We have designed and are implementing a remediation plan for the material weakness. However, we may not be successful in remediating this material weakness in the near-term, or at all, particularly in light of the infrequency with which we are likely to undertake the types of transactions that could test our remediation efforts, or be able to identify and remediate any additional control deficiency, including any material weakness, that may arise in the future. If we fail to remedyremediate the material weakness or any future deficiencies or fail to otherwise maintain the adequacy of our internal controls, we could be subject to regulatory scrutiny, civil or criminal penalties or shareholder litigation. In addition, failure to maintain adequate internal controls could result in financial statements that do not accurately reflect our operating results or financial condition.
Risks Related to Our Charter and Bylaws
Anti-takeover provisions in our charter documents, certain of our contracts with third parties, and under Delaware law could make an acquisition of us, even one that may be beneficial to our stockholders, more difficult and may prevent attempts by our stockholders to replace or remove our current management.
Provisions in our certificate of incorporation and by-laws may delay or prevent an acquisition of us or a change in our management. These provisions include the ability of our board of directorsBoard to issue preferred stock without stockholder approval. In addition, because we are incorporated in Delaware, we are governed by the provisions of Section 203 of the Delaware General Corporation Law, which limits the ability of stockholders owning in excess of 15% of our outstanding voting stock to merge or combine with us. Although we
26
believe these provisions collectively provide for an opportunity to obtain greater value for stockholders by requiring potential acquirers to negotiate with our board of directors,the Board, they would apply even if an offer rejected by our board was considered beneficial by some stockholders. Additionally, certain of our contracts with third parties allow for termination upon specified change of control transactions. Anti-takeover provisions may frustrate or prevent any attempts by our stockholders to replace or remove our current management by making it more difficult for stockholders to replace members of our board of directors,the Board, which is responsible for appointing the members of our management, and anti-takeover or change of control contract termination rights may frustrate or prevent any attempts by a third-party to acquire or attempt to acquire the Company.
Risks Related to Tax Matters
The enactment of legislation implementing changes in taxation of international business activities, the adoption of other corporate tax reform policies, or changes in tax legislation or policies, or interpretations thereof, could materially impact our financial position and results of operations.
Corporate tax reform, base-erosion efforts and tax transparency continue to be high priorities in many tax jurisdictions where we have business operations. As a result, policies regarding corporate income and other taxes in numerous jurisdictions are under heightened scrutiny and tax reform legislation is being proposed or enacted in a number of jurisdictions. For example, the Tax Cuts and Jobs Act (the “2017 Tax Reform Act”), adopting broad U.S. corporate income tax reform will, among other things, reduce the U.S. corporate income tax rate, but will impose base-erosion prevention measures on earnings of non-U.S. subsidiaries of U.S. entities as well as the transition tax on mandatory deemed repatriation of accumulated non-U.S. earnings of U.S. controlled foreign corporations. There is no assurance that our actual income tax liability will not be materially different than what is reflected in our income tax provisions and accruals.
In addition, many countries are beginning to implement legislation and other guidance to align their international tax rules with the Organisation for Economic Co-operation and Development’s Base Erosion and Profit Shifting recommendations and action plan that aim to standardize and modernize global corporate tax policy, including changes to cross-border tax, transfer pricing documentation rules, and nexus-based tax incentive practices. Because of the heightened scrutiny of corporate taxation policies, prior decisions by tax authorities regarding treatments and positions of corporate income taxes could be subject to enforcement activities, and legislative investigation and inquiry, which could also result in changes in tax policies or prior tax rulings. Any such changes in policies or rulings may also result in the taxes we previously paid being subject to change.
Due to the large scale of our international business activities, any substantial changes in international corporate tax policies, enforcement activities or legislative initiatives may materially adversely affect our business, the amount of taxes we are required to pay and our financial condition and results of operations generally.
Our ability to use net operating loss and tax credit carryforwards and certain built-in losses to reduce future tax payments is limited by provisions of the Internal Revenue Code, and it is possible that certain transactions or a combination of certain transactions may result in material additional limitations on our ability to use our net operating loss and tax credit carryforwards.
Section 382 and 383 of the Internal Revenue Code of 1986, as amended, contain rules that limit the ability of a company that undergoes an ownership change, which is generally any change in ownership of more than 50%50 percentage points of its stock over a three-year period, to utilize its net operating loss and tax credit carryforwards and certain built-in losses recognized in years after the ownership change. These rules generally operate by focusing on ownership changes involving stockholders owning directly or indirectly 5% or more of the stock of a company and any change in ownership arising from a new issuance of stock by the company. Generally, if an ownership change occurs, the yearly taxable income limitation on the use of net operating loss and tax credit carryforwards and certain built-in losses is equal to the product of the applicable long-term, tax-exempt rate and the value of the company’s stock immediately before the ownership change. We may be unable to offset our taxable income with losses, or our tax liability with credits, before such losses and credits expire and therefore would incur larger federal income tax liability. While our most recent Section 382 analysis did not show any current exposure, future transactions or combinations of future transactions may result in a change in control under Section 382 in the future. Federal net operating losses generated after December 31, 2017, are not subject to expiration and generally may not be carried back to prior taxable years except that, under the
27
Risks Related to Government Regulation
Risks Related to Regulations and Compliance
We are subject to export and import control laws and regulations that could impair our ability to compete in international markets or subject us to liability if we violate such laws and regulations.
We are subject to U.S. export controls and sanctions regulations that restrict the shipment or provision of certain products and services to certain countries, governments, and persons. While we take precautions to prevent our products and services from being exported in violation of these laws, we cannot guarantee that the precautions we take will prevent violations of export control and sanctions laws. We believe that, in the past, we and our subsidiaries may have exported certain products without a required export license in apparent violation of U.S. export control laws. As a result, we have submitted to the U.S. Department of Commerce’s Bureau of Industry and Security various notices of voluntary self-disclosure concerning potential violations. If we are found to be in violation of U.S. sanctions or export control laws, it could result in substantial fines and penalties for us and for the individuals working for us. We may also be adversely affected through other penalties, reputational harm, loss of access to certain markets, or otherwise.
Complying with export control and sanctions regulations may be time-consuming and may result in the delay or loss of sales opportunities or impose other costs. Any change in export or import regulations, economic sanctions or related legislation, or change in the countries, governments, persons or technologies targeted by such regulations, could result in our decreased ability to export or sell certain products to existing or potential customers in affected jurisdictions.
Our business is subject to a number of environmental risks.
Our manufacturing business involves the controlled use of hazardous materials and chemicals and is therefore subject to numerous environmental and safety laws and regulations and periodic inspections for possible violations of these laws and regulations. In addition to these hazardous materials and chemicals, our facility in Sweden also uses Staphylococcus aureus and toxins produced by Staphylococcus aureus in some of its manufacturing processes. Staphylococcus aureus and the toxins it produces, particularly enterotoxins, can cause severe illness in humans. The costs of compliance with environmental and safety laws and regulations are significant. Any violations, even if inadvertent or accidental, of current or future environmental and safety laws or regulations and the cost of compliance with any resulting order or fine could adversely affect our operations.
Climate change, climate change-related regulation and sustainability concerns could adversely affect our businesses and the operations of our subsidiaries, and any actions we take or fail to take in response to such matters could damage our reputation.
Investor advocacy groups, certain institutional investors, investment funds, other market participants and other stakeholders have focused increasingly on the Environmental, Social and Governance (“ESG”) practices of companies, including those associated with climate change. These parties have placed increased importance on the importance on the implications of the social cost of their investments. If our ESG practices do not meet investor or other industry stakeholder expectations and standards, which continue to evolve, our reputation and associate retention may be negatively impacted based on an assessment of our ESG practices. Any sustainability disclosures we make may include our policies and practices on a variety of social and ethical matters, including corporate governance, environmental compliance, employee health and safety practices, human capital management, product quality, supply chain management, and workforce inclusion and diversity. It is possible that stakeholders may not be satisfied with our ESG practices or the speed of their adoption, or that we may not sufficiently communicate our ESG practices sufficiently to stakeholders. We could also incur additional costs and require additional resources to monitor, report, and comply with various ESG practices. In addition, investors may decide to refrain from investing in us as a result of their assessment of our approach to and consideration of the ESG factors.
In addition, we face physical risks associated with climate change. These physical risks include risks to our manufacturing and supply chain from flooding, severe storms, wildfires, droughts or extreme temperatures, all of which could increase costs and impair our ability to meet customer demands in a timely manner. To date, we have not experienced material losses or disruptions to our operations related to climate change, and we do not anticipate that these risks will have a material impact to our Company in the near term.
28
Health care reform measures could adversely affect our business.
The efforts of governmental and third-party payors to contain or reduce the costs of health care may adversely affect the business and financial condition of pharmaceutical and biotechnology companies, including ours. Specifically, in both the United States and some foreign jurisdictions, there have been a number of legislative and regulatory proposals to change the health care system in ways that could affect our ability to sell our products profitably. For example, in March 2010, the Patient Protection and Affordable Care Act, as amended by the Health Care and Education Reconciliation Act of 2010 (together, the “ACA”), was passed, which substantially changeschanged the way health care is financed by both governmental and private insurers and significantly impacts the U.S. life sciences industry.insurers. The ACA and other federal and state proposals and health care reforms could limit the prices that can be charged for the products we develop and may limit our commercial opportunity.
In August 2022, the United States, the
Additionally, the federal government and individual states in the United States have also become increasingly active in passing legislation and implementing regulations designed to control pharmaceutical product pricing, including price or patient reimbursement constraints, discounts, restrictions on certain product access and marketing cost disclosure and transparency measures, and, in some cases, designed to encourage importation from other countries and bulk purchasing. President Biden has issued multiple executive orders that have sought to reduce prescription drug costs. In February 2023, HHS also issued a proposal in response to an October 2022 executive order from President Biden that includes a proposed prescription drug pricing model that will test whether targeted Medicare payment adjustments will sufficiently incentivize manufacturers to complete confirmatory trials for drugs approved through the U.S. Food and Drug Administration’s (“FDA's”) accelerated approval pathway. Although a number of these and other proposed measures may require authorization through additional legislation to become effective, and the Biden administration may reverse or otherwise change these measures, both the Biden administration and Congress have indicated that they will continue to seek new legislation measures to control drug costs.
Legally mandated price controls on payment amounts by third-party payors or other restrictions could harm our business, financial condition, results of operations and prospects. In addition, regional healthcare authorities and individual hospitals are increasingly using bidding procedures to determine what pharmaceutical products and which suppliers will be included in their prescription drug and other healthcare programs. This could reduce the ultimate demand for our products or put pressure on drug pricing, which could negatively affect our business, financial condition, results of operations and prospects. We expect that additional state and federal healthcare reform measures will be adopted in the future.
We may be exposed to liabilities under the Foreign Corrupt Practices Act, and any determination that we violated the Foreign Corrupt Practices Act could have a material adverse effect on our business.
We are subject to the Foreign Corrupt Practice Act of 1977 (the “FCPA”)FCPA and other laws that prohibit improper payments or offers of payments to foreign governments and their officials and political parties by U.S. persons and issuers as defined by the statute for the purpose of obtaining or retaining business. We have operations and agreements with third parties and make sales in jurisdictions outside of the United States, which may experience corruption. Our activities in jurisdictions outside of the United States create the risk of unauthorized payments or offers of payments by one of our employees, consultants, sales agents or distributors, because these parties are not always subject to our control. These risks have increased following our recent acquisitions of overseas operations and facilities. It is our policy to implement safeguards to discourage these practices by our employees. However, our existing safeguards and any future improvements may prove to be less than effective, and the employees, consultants, sales agents or distributors of Repligen may engage in conduct for which we might be held responsible. Violations of the FCPA may result in severe criminal or civil sanctions, and we may be subject to other liabilities, which could negatively affect our business, operating results and financial
29
Changes in accounting standards and subjective assumptions, estimates, and judgments by management related to complex accounting matters could significantly affect our financial results or financial condition.
Generally accepted accounting principles and related accounting pronouncements, implementation guidelines, and interpretations with regard to a wide range of matters that are relevant to our business, such as revenue recognition, asset impairment and fair value determinations, inventories, business combinations and intangible asset valuations, leases, and litigation, are highly complex and involve many subjective assumptions, estimates, and judgments. Changes in these rules or their interpretation or changes in underlying assumptions, estimates, or judgments could significantly change our reported or expected financial performance or financial condition.
Risks Related to Data and Privacy
Our internal computer systems, or those of our customers, collaborators or other contractors, may be subject to cyber-attacks or security breaches, which could result in a material disruption of our product development programs.
Despite the implementation of security measures, our internal computer systems and those of our customers, collaborators “cloud”-basedcloud-based platform service providers, and other contractors are vulnerable to damage from unauthorized access and from cyber-attacks, such as computer viruses, and unauthorized access. Cyber-attacks are increasing in their frequency, sophistication and intensity, and have become increasingly difficult to detect. Cyber-attacks could include the deployment of harmful malware, ransomware, phishing denial-of-service attacks, social engineering and other means to affect service reliability and threaten the confidentiality, integrity and availability of information. Cyber-attacks also could include phishing attempts or e-mail fraud to cause payments or information to be transmitted to an unintended recipient. A material cyber-attack or security breach could cause interruptions in our operations and could result in a material disruption of our business operations, damage to our reputation or a loss of revenues.
In the ordinary course of our business, we collect and store sensitive data, including, among other things, personally identifiable information about our employees, intellectual property, and proprietary business information. Any cyber-attack or security breach that leads to unauthorized access, use or disclosure of personal or proprietary information could harm our reputation, cause us not to comply with federal and/or state breach notification laws and foreign law equivalents and otherwise subject us to liability under laws and regulations that protect the privacy and security of personal information. In addition, we could be subject to risks caused by misappropriation, misuse, leakage, falsification or intentional or accidental release or loss of information maintained in the information systems and networks of our company and our vendors, including personal information of our employees, and company and vendor confidential data. In addition, outside parties may attempt to penetrate our systems or those of our vendors or fraudulently induce our personnel or the personnel of our vendors to disclose sensitive information in order to gain access to our data and/or systems. Like other companies, we have on occasion experienced, and believe we will continue to experience, data security incidents involving access to company data threats to our data and systems, including malicious codes and viruses, phishing, business email compromise attacks, or other cyber-attacks. The number and complexity of these threats continue to increase over time.systems. If a material breach of our information technology systems or those of our vendors occurs, the market perception of the effectiveness of our security measures could be harmed and our reputation and credibility could be damaged.
We could be required to expend significant amounts of money and other resources to respond to these threats or breaches, and to repair or replace information systems or networks and could suffer financial loss or the loss of valuable confidential information. In addition, we could be subject to regulatory
Changes in laws and regulations governing the privacy and protection of data and personal information could adversely affect our business.
We are subject to data privacy and protection laws and regulations that apply to the collection, transmission, storage and use of proprietary information and personally-identifying information, which among other things, imposes certain requirements relating to the privacy, security and transmission of certain individually identifiable information. In addition, numerous other federal and state laws, including state security breach notification laws, state health information privacy laws and federal and state consumer protection laws, govern the collection, use, disclosure and security of personal information. These laws continue to change and evolve and are increasing in breadth and impact.
For example, California enacted the California Consumer Privacy Act (“CCPA”), which went into effect in January 2020European Union's and became enforceable by the California AttorneyUnited Kingdom’s General in July 2020,Data Protection Regulations impose significant requirements on how we collect, process and which, among other things, requires companies covered by the legislation to provide new disclosures to California consumers and afford such consumers new rights with respect to theirtransfer personal information, including the right to request deletion of their personal information, the right to receive the personal information on record for them, the right to know what categories of personal information generally are maintained about them,data, as well as the rightsignificant regulatory penalties and legal liability for non-compliance. Complying with these laws may impose significant costs or otherwise require us to opt-out of certain sales of personal information. The CCPA provides for civil penalties for violations, as well as a private right of action for certain data breaches thatdivert resources or implement changes to our business processes, and any actual or perceived non-compliance could result in the loss of personal information. This private right of action may increase the likelihood of,significant penalties, claims and reputational damage.
30
Additionally, we face risks associated with, data breach litigation.
In addition, federal and state legislators and regulators are imposing new and heightened protections for health and other sensitive information that could impact our business. For example, the Federal Trade Commission (“FTC”) has imposed stringent requirements on the collection and disclosure of sensitive categories of personal information, including health information, and has expanded the application of its Health Breach Notification Rule. Washington’s My Health My Data Act requires regulated entities to implementobtain consent to collect health information, grants consumers certain rights, including to request deletion, and enforceprovides for robust enforcement mechanisms, including enforcement by the CCPAstate attorney-general and the CPRA. The effectsby litigants through a private right of the CCPAaction for consumer claims. These current and the CPRA are potentially significantfuture data privacy laws and regulations may require us to modify our data collection or processing practices and policies, and to incur substantial costs and expenses in an effort to comply and increase our potential exposure to regulatory enforcement, reputational damage, and/or litigation.
Also, our customers may be subject to different privacy laws, rules and legislation, which may mean that they require us to be bound by varying contractual requirements applicable to certain other jurisdictions. Adherence to such contractual requirements may impact our collection, use, processing, storage, sharing and disclosure of various types of information including financial information and other personal information, and may mean we become bound by, or voluntarily comply with, self-regulatory or other industry standards relating to these matters that may further change as laws, rules and regulations evolve. Complying with these requirements and changing our policies and practices may be onerous and costly, and we may not be able to respond quickly or effectively to regulatory, legislative and other developments. These changes may in turn impair our ability to offer our existing or planned features, products and services and/or increase our cost of doing business.information. As we expand our customer base, these requirements may vary from customer to customer, further increasing the cost of compliance and doing business.
Risks Related to Our Products and Technology
Risks Related to Our Intellectual Property
If we are unable to obtain or maintain our intellectual property, we may not be able to succeed commercially.
We endeavor to obtain and maintain trade secrets and to a lesser extent with respect to the products that currently account for a majority of our revenue,pursue strategic patent protection when available in order to protect our products and processes from unauthorized use, and to produce a financial return consistent with the
We consider trade secrets, know-how and other forms of market protection to be among the most important elements of our proprietary position, in particular, as it relates to many of the products that currently account for a majority of our revenue. We also own or have exclusive rights to a number of U.S. patents and U.S. pending patent applications as well as corresponding foreign patents and patent applications. We continue to actively and selectively pursue patent protection and seek to expand our patent estate, particularly for our products currently in development, and we cannot be sure that any patent applications that we will file in the future or that any currently pending applications will issue on a timely basis, if ever. We cannot be certain that we were the first to makeconceive the inventions coveredinvention(s) described by each of our pending patent applications or that we were the first to file patent applications for such inventions.invention(s). Even if patents are issued, the degree of protection afforded by such patents will depend upon the:
Patents that may be granted to us in certain foreign countries may be subject to opposition proceedings brought by third parties or result in suits by us, which may be costly and result in adverse consequences for us.
31
In some cases, litigation or other proceedings may be necessary to assert claims of infringement, to enforce patents issued to us or our licensors, to protect trade secrets, know-how or other intellectual property rights we own or to determine the scope and validity of the proprietary rights of third parties. Such litigation could result in substantial costs to us and diversion of our resources. An adverse outcome in any such litigation or proceeding could have a material adverse effect on our business, financial condition and results of operations. If our competitors prepare and file patent applications in the United States that claim technology also claimed by us, we may be required to participate in interference proceedings declared by the U.S. Patent and Trademark OfficeOffices to determine priority of invention, which would result in substantial costs to us.
While one of our U.S. patents covering recombinantwe continue to obtain patent grants directed towards Protein A, had its term adjusted to expire in 2028, our other U.S. patents covering recombinantpatent grants directed towards Protein A have expired, and as a result, we may face increased competition, which could harm our results of operations, financial condition, cash flow and future prospects.
Other companies could begin manufacturing and selling native or some of the commercial forms of recombinant Protein A in the United States and may directly compete with us on certain Protein A products. This may induce us to sell Protein A at lower prices and may erode our market share, which could adversely affect our results of operations, financial condition, cash flow and future prospects.
Our freedom to develop our products may be challenged by others, and we may have to engage in litigation to determine the scope and validity of competitors’ patents and proprietary rights, which, if we do not prevail, could harm our business, results of operations, financial condition, cash flow and future prospects.
There has been substantial litigation and other proceedings regarding the complex patent and other intellectual property rights in the life sciences industry. We have been a party to, and in the future may become a party to, patent litigation or other proceedings regarding intellectual property rights.
We may become involved in patent litigation or other intellectual property proceedings, including the following situations:
The cost to us of any patent litigation or other proceeding, even if resolved in our favor, could be substantial. Some of our competitors may be able to sustain the cost of such litigation or proceedings more effectively than we can because of their substantially greater financial resources. If a patent litigation or other intellectual property proceeding is resolved in a way that is unfavorable to us, we or our collaborative or strategic partners may be enjoined from manufacturing or selling our products and services without a license from the other party and be held liable for significant damages. The failure to obtain any required license on commercially acceptable terms or at all may harm our business, results of operations, financial condition, cash flow and future prospects.
Uncertainties resulting from the initiation and continuation of patent litigation or other proceedings could have a material adverse effect on our ability to compete in the marketplace. Patent litigation and other proceedings may also absorb significant management time, attention and resources.
32
Risks Related to Our Products
The market may not be receptive to our new bioprocessing products upon their introduction.
We expect a portion of our future revenue growth to come from introducing new bioprocessing products, including line extensions and new features for our OPUS
Our products are subject to quality control requirements.
Whether a product is produced by us or purchased from outside suppliers, it is subjected to quality control procedures, including the verification of porosity and with certain products, the complete
If our products do not perform as expected or the reliability of the technology on which our products are based is questioned, we could experience lost revenue, delayed or reduced market acceptance of our products, increased costs and damage to our reputation.
Our success depends on the market’s confidence that we can provide reliable, high-quality bioprocessing products. We believe that customers in our target markets are likely to be particularly sensitive to product defects and errors. Our reputation and the public image of our products and technologies may be impaired if our products fail to perform as expected. Although our products are tested prior to shipment, defects or errors could nonetheless occur in our products. Furthermore, the Protein A that we manufacture is subsequently incorporated into products that are sold by other life sciences companies and we have no control over the manufacture and production of those products. In the future, if our products experience, or are perceived to experience, a material defect or error, this could result in loss or delay of revenues, delayed market acceptance, damaged reputation, diversion of development resources, legal claims, increased insurance costs or increased service and warranty costs, any of which could harm our business. Such defects or errors could also narrow the scope of the use of our products, which could hinder our success in the market. Even after any underlying concerns or problems are resolved, any lingering concerns in our target market regarding our technology or any manufacturing defects or performance errors in our products could continue to result in lost revenue, delayed market acceptance, damaged reputation, increased service and warranty costs and claims against us.
Risks Related to Litigation
We may become involved in litigation or other proceedings with collaborative partners, which may be time consuming, costly and could result in delays in our development and commercialization efforts.
In connection with the Company’sour decision to focus its efforts on the growth of itsour core bioprocessing business, we sought development and commercialization partnerships for our remaining portfolio of clinical stage assets. Any disputes with such partners that lead to litigation or similar proceedings may result in us incurring legal expenses, as well as facing potential legal liability. Such disputes, litigation or other proceedings are also time-consuming and may cause delays in our development and commercialization efforts. If we fail to resolve these disputes quickly and with terms that are no less favorable to us than the current terms of the arrangements, our business, results of operations, financial condition, cash flow and future prospects may be harmed.
We may become subject to litigation, which could result in substantial costs and divert management’s attention and resources from our business.
From time to time, we may become involved in litigation or other legal proceedings relating to claims arising from the ordinary course of business. Litigation is subject to inherent risks and uncertainties that may cause actual results to differ materially from our
33
expectations. If we receive an adverse judgment in any litigation, we could be required to pay substantial damages. With or without merit, litigation can be complex, can extend for a protracted period of time, can be very expensive and the expense can be unpredictable. Litigation initiated by us could also result in counter-claimscounterclaims against us, which could increase the costs associated with the litigation and result in our payment of damages or other judgments
ITEM 1B. UNRESOLVED STAFF COMMENTS
None.
ITEM 1C. CYBERSECURITY
Governance Related to Cybersecurity Risks
Our Board of Directors (“Board”) holds overall oversight responsibility for the Company’s strategy and risk management, including in relation to cybersecurity risks. Our Board exercises its oversight function through the Audit Committee, which oversees the management of risk exposure across various areas, including data security risks, in accordance with its charter. The Audit Committee receives quarterly reports from our Chief Information Officer (“CIO”) on the status of the Company’s cybersecurity program, including measures implemented to monitor and address cybersecurity risks and threats, as appropriate.
Under the leadership of our general counsel, we have constituted an enterprise risk management committee (“ERMC”) composed of senior management, including the CIO and other senior executives. The ERMC monitors and oversees risk areas that potentially could pose a high impact to the business, and cybersecurity currently is one of the ERMC’s priority focus areas. The ERMC reports on our top identified risks and steps to address those risks to the full Board on a semi-annual basis.
Our IT Infrastructure & Operations team manages the day-to-day administration of our cybersecurity program. We also work with a managed security service provider to monitor for vulnerabilities and threats, which are reported to the IT Infrastructure & Operations team and up to the CIO and other members of senior management, where appropriate. We engage employees in our cybersecurity efforts through a quarterly process for employees to complete security and awareness training as well as periodic simulated phishing campaigns. We also conduct specific training and tabletop exercises for key personnel involved in cybersecurity risk management.
Cybersecurity Risk Management and Strategy
We maintain a cybersecurity program, which is informed by industry standards, that includes processes for identification, assessment, and management of cybersecurity risks. We conduct periodic risk assessments, including with support from external vendors, to assess our cyber program, identify areas of enhancement, and develop strategies for the mitigation of cyber risks. We also conduct regular security testing and have established a vulnerability management process supported by security testing, for the treatment of identified security risks based on severity. Third-parties that access, process, collect, share, create, store, transmit or destroy our information or have access to our systems may have additional contractual controls.
Our IT Infrastructure & Operations team is informed about and monitors the prevention, detection, mitigation, and remediation of cybersecurity risks through various means, including by leveraging managed security service providers and other third-party security software and technology services. In addition, we institute processes and technologies for the monitoring of security alerts from internal parties and external resources, including from information security research sources. We also have implemented processes and technologies for network monitoring and data loss prevention procedures.
We maintain processes to inform and update management and, as needed, the Audit Committee, about security incidents that may pose a significant risk for the business, as applicable. Although risks from cybersecurity threats have to date not materially affected us, our business strategy, results of operations or financial condition, we have, from time to time, experienced threats and security incidents relating to our and our third party vendors’ information systems. See Item 1A, ”Risk Factors,” to this report for more information.
34
ITEM 2. PROPERTIES
Our material office, manufacturing and manufacturingwarehouse leases are detailed below:
Location |
| Square Feet |
|
| Principal Use |
| Lease Expiration | |
Waltham, Massachusetts |
|
| 182,243 |
|
| Corporate headquarters, manufacturing, research and development, marketing and administrative offices |
| October 31, 2030 |
Marlborough, Massachusetts |
|
| 130,700 |
|
| Manufacturing operations |
| November 30, 2033 |
Rancho Dominguez, California |
|
| 68,908 |
|
| Manufacturing, research and development, marketing and administrative operations |
| July 15, 2035 |
Toulouse, France |
|
| 67,285 |
| (1) | Manufacturing and administrative operations |
| March 31, 2032 |
Lund, Sweden |
|
| 65,240 |
|
| Manufacturing and administrative operations |
|
|
Hopkinton, Massachusetts |
|
| 64,000 |
|
| Manufacturing, assembly site |
| July 13, 2034 |
Bridgewater, New Jersey |
|
| 57,739 |
|
| Manufacturing and administrative operations |
| February 1, 2034 |
Compton, California |
|
| 54,060 |
|
| Warehouse |
| May 31, 2029 |
Waterford, Ireland |
|
| 50,311 |
|
| Manufacturing, administrative operations and assembly site |
| January 31, 2037 |
Clifton Park, New York |
|
| 34,386 |
|
| Manufacturing operations |
| November 30, 2029 |
Lebanon, New Hampshire |
|
| 31,313 |
|
| Research and development and administrative operations |
| July 31, 2026 |
Location | Square Feet | Principal Use | Lease Expiration | |||||
Waltham, Massachusetts | 108,135 | (1) | Corporate headquarters, manufacturing, research and development, marketing and administrative offices | April 1, 2030 | ||||
Rancho Dominguez, California | 68,908 | Manufacturing, research and development, marketing and administrative operations | November 30, 2025 (2) | |||||
Marlborough, Massachusetts | 63,761 | (3) | Manufacturing operations | November 30, 2028 | ||||
Lund, Sweden | 58,405 | (4) | Manufacturing and administrative operations | December 31, 2026 | ||||
Bridgewater, New Jersey (5) | 33,669 | Manufacturing and administrative operations | January 14, 2029 | |||||
The Company entered into a lease agreement to lease approximately 76,000 square feet of office, manufacturing and storage space in Jüri, Estonia. The Company gained access to the space and the right to control the use of the space was conveyed effective January 1, 2024.
In addition to the above, the Company also entered into a lease agreement to lease approximately 139,000 square foot of primarily warehouse space in Shrewsbury, Massachusetts. The Company gained access to the space and the right to control the use of the space was conveyed effective February 1, 2024.
During the year ended December 31, 2020,2023, we incurred total rental costs for all facilities of $7.7$25.1 million.
ITEM 3. LEGAL PROCEEDINGS
From time to time, we may be subject to legal proceedings and claims in the ordinary course of business. We are not currently aware of any such proceedings or claims that we believe will have, individually or in the aggregate, a material adverse effect on our business, financial condition or results of operations.
ITEM 4. MINE SAFETY DISCLOSURES
Not applicable.
35
PART II
ITEM 5. MARKET FOR REGISTRANT’S COMMON EQUITY, RELATED STOCKHOLDER MATTERS AND ISSUER PURCHASES OF EQUITY SECURITIES
Market Information for Common Stock
Our common stock is traded on the Nasdaq Global Select Market under the symbol “RGEN.”
Stockholders and Dividends
As of February 19, 2021,16, 2024, there were 307259 stockholders of record of our common stock. We have not paid any dividends since our inception and do not intend to pay any dividends on our common stock in the foreseeable future. We anticipate that we will retain all earnings, if any, to support our operations. Any future determination as to the payment of dividends will be at the sole discretion of our Board of Directors (“Board”) and will depend on our financial condition, results of operations, capital requirements and other factors ourthe Board of Directors deems relevant.
Equity Compensation Plan Information
The following table sets forth information as of December 31, 20202023, regarding shares of common stock that may be issued under the Company’s equity compensation plans, consisting of the Second Amended and Restated 2001 Repligen Corporation Stock Plan, the Amended and Restated 2012 Stock Option and Incentive Plan and the 2018 Stock Option and Incentive Plan.
Plan Category |
| Number of |
|
| Weighted- |
|
| Number of |
| |||
|
| (a) |
|
| (b) |
|
| (c) |
| |||
Equity compensation plans approved by security holders |
|
| 1,123,450 |
| (1) | $ | 85.97 |
| (2) |
| 1,671,408 |
|
Plan Category | Number of securities to be issued upon exercise of outstanding options, warrants and rights | Weighted- average exercise price of outstanding options, warrants and rights | Number of securities remaining available for future issuance under equity compensation plans (excluding securities reflected in column (a)) | |||||||||
(a) | (b) | (c) | ||||||||||
Equity compensation plans approved by security holders | 1,362,251 | (1) | $ | 43.88 | (2) | 2,306,943 | ||||||
Stock Performance Graph
The graph below matches Repligen Corporation’s cumulative20152018 to December 31, 2020.2023. The comparisons shown in the graph below are based upon historical data. We caution that the stock price performance shown in the graph below is not necessarily indicative of, nor is it intended to forecast, the potential future performance of our common stock.
36
COMPARISON OF 5 YEAR CUMULATIVE TOTAL RETURN*
Among Repligen Corporation, the Nasdaq Composite Index,
the Nasdaq Pharmaceutical Index and the Nasdaq Biotechnology Index
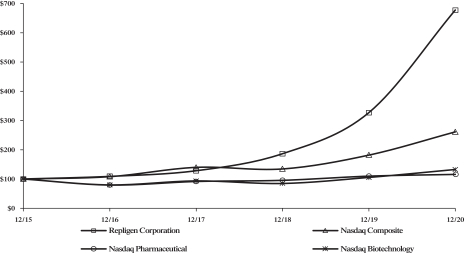

Issuer Purchases of Equity Securities
In June 2008, the Board of Directors authorized a program to repurchase up to 1.25 million shares of our common stock to be repurchased at the discretion of management from time to time in the open market or through privately negotiated transactions.transactions (the “2008 Share Repurchase Program”). The repurchase program2008 Repurchase Program has no set expiration date and may be suspended or discontinued at any time. We did not repurchase any shares of common stock under the 2008 Repurchase Program during the year ended December 31, 2020.2023. In prior years, we repurchased a total of 592,827 shares, leaving 657,173 shares remaining under this authorization.
In December 2023, the Board authorized and approved a stock repurchase, separate from the 2008 Share Repurchase Program, of up to $25.0 million of our common stock concurrent with the issuance of $600.0 million aggregate principal amount of 1.00% Convertible Senior Notes due 2028 (“2023 Notes”). See Note 14, “Convertible Senior Notes,” included in this report for more information on the issuance. We used $14.4 million of the proceeds from the issuance of the 2023 Notes to repurchase 92,090 shares at a price of $156.22, including transaction costs, to offset the impact of dilution from the issuance of 2023 Notes and equity compensation programs as well as to reduce our outstanding share count (“2023 Share Repurchase Program”). We have elected to retire the shares repurchased to date under the 2023 Share Repurchase Program. Retired shares become part of the pool of authorized but unissued shares. The purchase price of the retired shares in excess of par value, including transaction costs, is recorded as a decrease to additional paid-in capital in our consolidated balance sheets as of December 31, 2023.
37
ITEM 6. RESERVED
38
ITEM 7. MANAGEMENT’S DISCUSSION AND ANALYSIS OF FINANCIAL CONDITION AND RESULTS OF OPERATIONS
Information pertaining to fiscal year 2018years 2022 and 2021 was included in the Company’s Annual Report on Form(“ (“Form20192022, on pages 3537 through 5153 under Part II, Item 7, “Management’s Discussion and Analysis of Financial Condition and Results of Operations,” which was filed with the SECSecurities and Exchange Commission on February 26, 2020.
Repligen and its subsidiaries, collectively doing business as Repligen Corporation (“Repligen”, “we”, “our”, or “the Company”) is a global life sciences company that develops and commercializes highly innovated bioprocessing technology and systems that increase efficiencies and flexibility in the process of manufacturing biological drugs.
As the overall market for biologics continues to grow and expand, our customers – primarily large biopharmaceutical companies and contract development and manufacturing organizations and other life sciences companies (integrators) – face critical production cost, capacity, quality and time pressures. Built to address these concerns, our products helpinghelp set new standards for the way biologics are manufactured. We are committed to inspiring advances in bioprocessing as a trusted partner in the production of critical biologic drugs – including monoclonal antibodies (“mAbs”), recombinant proteins, vaccines and cell and gene therapies (“C>”) – that are improving human health worldwide. Increasingly, our technologies are being implemented to overcome challenges in processing plasmid DNA (a starting material for the production of mRNA) and gene delivery vectors such as lentivirus and adeno-associated viral vectors. For more information regarding our business, products and acquisitions, see above sections in Part I, entitledItem 1. "Business" including “Overview”, “Our Products”, “2020“2023 Acquisitions”, “2019 Acquisition”“2021 Acquisitions” and “Our Market Opportunity”.
Macroeconomic Trends
As a result of our global presence, a significant portion of our revenue and expenses is denominated in currencies other than the U.S. dollar. We are therefore subject to non-U.S. exchange exposure. Exchange rates can be volatile and a substantial weakening or strengthening of foreign currencies against the U.S. dollar could increase or reduce our revenue and gross profit margin and impact the comparability of results from period to period.
We have experienced, and expect to continue to experience, cost inflation, primarily in raw materials, and other supply chain costs, as a result of global macroeconomic trends, including global geopolitical conflicts and labor shortages. Actions taken to mitigate supply chain disruptions and inflation, including price increases and productivity improvements, have generally been successful in offsetting the impact of these trends. In addition, decreasing demand for vaccines for the COVID-19 pandemic, including all subsequent variants of the SARS-CoV-1 coronavirus (“COVID-19”) is driving a reduction in future demand of our products related to these vaccines. We expect that these trends will continue to impact our results for 2024 as well.
Critical Accounting Policies and Estimates
While our significant accounting policies are more fully described in the notes to our consolidated financial statements, we have identified the policies and estimates below as being critical to our business operations and the understanding of our results of operations. These policies require management’s most difficult, subjective or complex judgements,judgments, often as a result of the need to make estimates about the effect of matters that are inherently uncertain. The impact of and any associated risks related to these policies on our business operations are discussed throughout “Management’s Discussion and Analysis of Financial Condition and Results of Operations,” includingspecifically in the “Results of Operations” section, where such policies affect our reported and expected financial results. Although we believe that our estimates, assumptions, and judgementsjudgments are reasonable, they are based upon information presently available. Actual results may differ significantly from these estimates under different assumptions, judgments, or conditions.
Revenue recognition
We generate revenue from the sale of bioprocessing products, equipment devices, and related consumables used with these equipment devices to customers in the life science and biopharmaceutical industries. Under ASCAccounting Standards Codification No. (“ASC”) 606, “the Company expectswe expect to receive in exchange for transferring products or services to a customer (“transaction price”). To the extent the transaction price includes variable consideration, the Company estimateswe estimate the amount of variable consideration that should be included in the
39
transaction price utilizing the expected value method or the most likely amount method, depending on the facts and circumstances relative to the contract. Variable consideration is included in the transaction price if, in the Company’sour judgment, it is probable that a significant future reversal of cumulative revenue under the contract will not occur. Estimates of variable consideration and determination of whether to include estimated amounts in the transaction price are based largely on an assessment of the Company’sour anticipated performance and all information (historical, current and forecasted) that is reasonably available. Sales, value add, and other taxes collected on behalf of third parties are excluded from revenue.
When determining the transaction price of a contract, an adjustment is made if payment from a customer occurs either significantly before or significantly after performance, resulting in a significant financing
Contracts with customers may contain multiple performance obligations. For such arrangements, the transaction price is allocated to each performance obligation based on the estimated relative standalone selling prices of the promised products or services underlying each performance obligation. The Company determinesWe determine standalone selling prices based on the price at which the performance obligation is sold separately. If the standalone selling price is not observable through past transactions, the Company estimateswe estimate the standalone selling price taking into account available information such as market conditions and internally approved pricing guidelines related to the performance obligations.
We recognize product revenue under the terms of each customer agreement upon transfer of control to the customer, which occurs at a point in time.
Shipping and handling fees are recorded as a component of product revenue, with the associated costs recorded as a component of cost of product revenue in our consolidated statements of comprehensive income.
Allowance for credit losses
We evaluate our global accounts receivable through a continuous process of assessing our portfolio on an individual customer and overall basis. This process consists of a thorough review of historical collection experience, current aging status of the customer accounts, financial condition of our customers, and whether the receivables involve retainages. We also consider the economic environment of our customers, both from a marketplace and geographic perspective, in evaluating the need for an allowance. Based on our review of these factors, we establish or adjust allowances for specific customers. Credit losses can vary substantially over time and the process involves judgment and estimation that require a number of assumptions about matters that are uncertain. Accordingly, our results of operations can be affected by adjustments to the allowance due to actual write-offs that differ from estimated amounts. See Note 6,
Inventories
We value inventory at cost or, if lower, net realizable value, using therevenue.revenue in our consolidated statements of comprehensive income. Manufacturing of bioprocessing finished goods is done to order and tested for quality specifications prior to shipment.
A change in the estimated timing or amount of demand for our products could result in additional provisions for excess inventory quantities on hand. Any significant unanticipated changes in demand or unexpected quality failures could have a significant impact on the value of inventory and reported operating results. During all periods presentedIn 2023, we recorded a $23.6 million in inventory adjustments, which included the impact of the Company discontinuing the sale of certain product SKUs and the impact of having proactively secured materials during the 2020-2022 COVID-19 pandemic period (the “COVID-19 Period”) to meet accelerated demand during a challenging supply chain environment in the accompanying consolidated financial statements, there have been no material industry. Where demand has reduced, finished goods and raw materials, whose value exceeded the projected requirements to be used before reaching their expiration date, were adjusted down to their net realizable value. In addition, these
40
adjustments related toinclude inventory that could not be repurposed as a revised estimateresult of inventory valuations.
Business combinations
Total consideration transferred for acquisitions areis allocated to the tangible and intangible assets acquired and liabilities assumed, if any, based on their fair values at the dates of acquisition. This purchase price allocation process requires management to make significant estimates and assumptions with respect to intangible assets and deferred revenue obligations. The fair value of identifiable intangible assets is based on
We use the income approach to determine the fair value of certain identifiable intangible assets including customer relationships and developed technology. This approach determines fair value by estimatingin processin-process research and development ("R&D") amounts so determined represent the fair value at the date of acquisition and do not exceed the amount a third-party would pay for the assets.
Intangible assets and goodwill
Intangible assets
Intangible assets with a definite life are amortized over their useful lives using the straight-line method and the amortization expense is recorded within cost of product revenue, research and developmentR&D and selling, general and administrative expense in the consolidated statements of comprehensive income. Intangible assets and their related useful lives are reviewed at least annually to determine if any adverse conditions exist, that would indicate the carrying value of these assets may not be recoverable. More frequent impairment assessments are conducted if certain conditions exist, including a change in the competitive landscape, any internal decisions to pursue new or different technology strategies, a loss of a significant customer, or a significant change in the marketplace, including changes in the prices paid for the Company’s products or changes in the size of the market for the Company’s products. If impairment indicators are present, the Company determines whether the underlying intangible asset is recoverable through estimated future undiscounted cash flows. If the asset is not found to be recoverable, it is written down to the estimated fair value of the asset based on the sum of the future discounted cash flows expected to result from the use and disposition of the asset. If the estimate of an intangible asset’s remaining useful life is changed, the remaining carrying amount of the intangible asset is amortized prospectively over the revised remaining useful life. The Company continues to believe that its definite-lived intangible assets are recoverable at December 31, 2020.
Indefinite-lived intangible assets are tested for impairment at least annually. There has been no impairment of our intangible assets for the periods presented.
41
Goodwill
We test goodwill for impairment on an annual basis and between annual tests if events and circumstances indicate it is more likely than not that the fair value of a reporting unit is less than its carrying value. Events that would indicate impairment and trigger an interim impairment assessment include, but are not limited to, current economicmacroeconomic conditions, industry and market conditions, including a decline in market capitalization,entity specific factors such as strategies and financial performance, a significant adverse change in legal factors business climate or operational performance of the business, and an adverse action or assessment by a regulator. Goodwill is tested for impairment as of December 31
We operate as one reporting unit since this reorganization. The fair value of the reporting unit is determined using both an income approach and market approach. Our income approach model usedunit. We performed a qualitative assessment for our reporting unit valuation is consistent with that used for ouras of December 31, 2019 goodwill impairment valuation noted above, except that cash flows from2023, 2022 and 2021. Based on the entire business enterprise were used for the reporting unit valuation. Our market approach model estimated the fair value of the reporting unit based on market prices paid in actual precedent transactions of similar businesses and market multiples of guideline public companies. As a result of our 2019 quantitative assessment, we concluded that goodwill was not impaired as of December 31, 2019. During the qualitative assessment of the Company’s one reporting unit during the 2020 goodwill impairment testing, it was determined that it was not more likely than not that itsthe estimated fair value of our reporting unit for 2023, 2022 and 2021 was lesshigher than its carrying amount. Asvalue for such ayears, and that the performance of the quantitative impairment assessmenttest was not required. Therefore, no impairment was required for any of the periods presented.
We have historically tested for impairment on our goodwill annually as of our measurement date of December 31st pursuant to Company policy. Subsequent to the 2023 annual impairment test, which was completed on December 31, 2020. If2023, we voluntarily changed our annual impairment assessment date from December 31st to October 1st, the first day of our fourth quarter, beginning on October 1, 2024. The change is being made to better align the annual impairment assessment date with our annual planning and budgeting process as well as the long-term planning and forecasting process. We have determined that this voluntary change in accounting principle is preferable and will not impact our consolidated financial statements nor is it being done to accelerate, avoid or trigger an event occurs or circumstancesimpairment charge. This change thatis not going to be applied retrospectively as it is impracticable to do so because retrospective application would more likely than not reducerequire application of significant estimates and assumptions with the fair valueuse of its reporting unit below its carrying value,hindsight. Therefore, the Companychange will evaluate its goodwill for impairment between annual tests.
Accrued liabilities
We estimate accrued liabilities by identifying services performed on our behalf, estimating the level of service performed and determining the associated cost incurred for such service as of each balance sheet date. For example, we would accrue for professional and consulting fees incurred with law firms, audit and accounting service providers and other third-party consultants. These expenses are determined by either requesting those service providers to estimate unbilled services at each reporting date for services incurred or tracking costs incurred by service providers under fixed fee arrangements.
We have processes in place to estimate the appropriate amounts to record for accrued liabilities, which principally involve the applicable personnel reviewing the services provided. In the event that we do not
A change in the estimated cost or volume of services provided could result in additional accrued liabilities. Any significant unanticipated changes in such estimates could have a significant impact on our accrued liabilities and reported operating results. There have been no material adjustments to our accrued liabilities in any of the periods presented in the accompanying consolidated financial statements.
Debt accounting
In December 2023, we issued $600.0 million aggregate principal amount of 1.00% Convertible Senior Notes due 2028 (“2023 Notes”) in a private placement pursuant to separate, privately negotiated exchange and subscription agreements (the “Exchange and
42
Subscription Agreements”) with a limited number of holders of our outstanding 0.375% Convertible Senior Notes due 2024 (“2019 Notes”) and certain other qualified institutional buyers pursuant to Rule 144A under the Securities Act of 1933, as amended. Pursuant to the Exchange and Subscription Agreements, we exchanged $217.7 million of our 2019 Notes for $309.9 million aggregate principal amount of the 2023 Notes (the “Exchange Transaction”) and issued $290.1 million aggregate principal amount of the 2023 Notes in a private placement to accredited institutional buyers (the “Subscription Transactions”) for cash. Immediately following the closing of the aforementioned transactions, $69.7 million in aggregate principal amount of the 2019 Notes remained outstanding.
We evaluated the Exchange Transaction and determined approximately $29.6 million of the $217.7 million principal of the exchanged 2019 Notes were accounted for as extinguishments of debt and approximately $188.1 million were accounted for as modification of debt. As a result, we recognized a $12.7 million loss on extinguishment of debt in our consolidated statements of comprehensive income for the year ended December 31, 2023. This included unamortized debt issuance costs related to the extinguished 2019 Notes. Under modification accounting, the carrying amount of the modified 2019 Notes was reduced by $2.8 million, with the offset going to additional paid-in capital, to account for the increase in fair value of the embedded conversion option in the modification. The increase in principal, along with the increased option value, totaling $82.1 million, is reflected as a debt discount and is a direct reduction from the carrying value of the debt on our consolidated balance sheets. This amount will be accreted as an adjustment to interest expense using the effective interest method and will accrete up to the full face value of the 2023 Notes of $600.0 million.
Proceeds from the Subscription Transactions amounted to $276.1 million after debt issuance costs of $14.0 million. The exchange resulted in $6.2 million of the debt issuance costs related to the modified notes to be recorded to amortization of debt issuance costs in our 2023 consolidated statement of comprehensive income under the rules of modification accounting. The remaining debt issuance costs of $7.8 million as well as $0.7 million of unamortized costs carried over from the 2019 Notes at the exchange date, were capitalized within long-term debt (as a contra-liability) in our consolidated balance sheets as of December 31, 2023 and will be amortized as an adjustment to amortization of debt issuance costs over the five-year term of the 2023 Notes in our consolidated statement of comprehensive income. The carrying value of the 2023 Notes of $510.1 million is included in long-term debt on our consolidated balance sheets as of December 31, 2023.
Prior to the close of business on the business day immediately preceding September 15, 2028, the 2023 Notes will be convertible at the option of the holders of 2023 Notes only upon the satisfaction of specified conditions and during certain periods into cash up to their principal amount, and into cash, shares of the Company's common stock or a combination of cash and the Company's common stock, at the Company's election, for the conversion value above the principal amount, if any. Thereafter until the close of business on the second scheduled trading day immediately preceding the maturity date, the 2023 Notes will be convertible at the options of the holders of 2023 Notes at any time regardless of these conditions. The Company may redeem for cash, all or a portion of the 2023 Notes, at its option, on or after December 18, 2026 and prior to the 21st scheduled trading day immediately preceding the maturity date at a redemption price of 100% of the principal amount of the 2023 Notes to be redeemed, plus accrued and unpaid interest to, but excluding the redemption date, if certain conditions are met in accordance to the indenture.
Our short-term debt balance is related to our 0.375% Convertible Senior2019 Notes, due 2024 (the “2019 Notes”), which were issued in July 2019. Prior to the adoption of Accounting Standards Update No. (“ASU”) 2020-06, “Debt - Debt with Conversion and Other Options (Subtopic 470-20) and Derivatives and Hedging - Contracts in Entity's Own Equity (Subtopic 815-40)”, the 2019 and areNotes were carried at their principal amount less unamortized debt discount.discount and unamortized debt issuance costs. We accounthad accounted for our convertible notes as separate liability and equity components.components prior to the adoption of 2020-06. We estimateestimated the carrying amount of the liability component by estimating the fair value of a similar liability that doesdid not have an associated conversion feature. The Company allocatesallocated transaction costs related to the issuance of convertible notes to the liability and equity components using the same proportions as the initial carrying value of the convertible notes. The carrying value of the equity component iswas calculated by deducting the carrying value of the liability component from the principal amount of the convertible notes as a whole. The difference representsrepresented a debt discount that, isprior to the adoption of ASU 2020-06, was amortized to interest expense in our consolidated statementstatements of comprehensive income over the term of the convertible notes using the effective interest rate method. We assessassessed the equity classification of the cash conversion feature quarterly. We allocated transaction costs related to the issuance of the 2019 Notes to the liability and equity components using the same proportions as the initial carrying value of the 2019 Notes. Effective January 1, 2022, the Company adopted ASU 2020-06. After adoption, the Company now accounts for the 2019 Notes as a single liability measured at amortized cost. See Note 14, “Convertible Senior Notes,” to our consolidated financial statements included in this report for more information on our adoption of ASU 2020-06.
43
During the fourth quarter of 2020,2023, the closing price of the Company’s common stock exceeded 130% of the conversion price of the 2019 Notes for more than 20 trading days of the last 30 consecutive trading days of the quarter. As a result, the remaining $69.7 million aggregate principal amount of 2019 Notes are convertible at the option of the holders of the 2019 Notes during the first quarter of 2021,2024, the quarter immediately following the quarter when the conditions are met, as stated in the terms of the 2019 Notes. Expecting to continue meeting these terms,These conditions have been met since the Company reclassifiedthird quarter of 2020. Since the 2019 Notes mature within one year of the report date, we classify the carrying value of the 2019 Notes from long-term liabilities toof $69.5 million as current liabilities on the Company’sour consolidated balance sheetsheets as of December 31, 2020. This classification is reassessed each quarter.
Stock-based compensation
We use the Black-Scholes option pricing model to calculate the fair value of stock option awards on the grant date. The expected term of options granted represents the period of time for which the options are expected to be outstanding and is derived from our historical stock option exercise experience and option expiration data. For purposes of estimating the expected term, we have aggregated all individual option awards into one group, as we do not expect substantial differences in exercise behavior among our employees. The expected volatility is a measure of the amount by which our stock price is expected to fluctuate during the expected term of options granted. We determined the expected volatility based upon the historical volatility of our common stock over a period commensurate with the option’s expected term. The risk-free interest rate is the implied yield available on U.S. Treasury
The fair value for stock units, which include restricted stock units and performance stock units, wasis calculated using the closing price of the Company’s common stock on the date of grant. We recognize compensation expense on awards that vest based on service conditions on a straight-line basis over the requisite service period based upon the number of options that are ultimately expected to vest, and accordingly, such compensation expense has been adjusted by an amount of estimated forfeitures. We recognize compensation expense on awards that vest based on performance conditions following our assessment of the probability that the performance condition will be achieved over the service period. Forfeitures represent only the unvested portion of a surrendered option.options, restricted stock units and performance stock units. Forfeitures are estimated at the time of grant and revised, if necessary, in subsequent periods if actual forfeitures differ from those estimates. Based on an analysis of historical data, we have calculated an 8% annual forfeiture rate forsuch amountsa cumulative adjustment to stock-based compensation expense will be recorded as a cumulative adjustment in the period estimates are revised.
For the years ended December 31, 2020, 20192023, 2022 and 2018,2021, we recorded stock-based compensation expense of $17.0$25.6 million, $12.8$27.3 million and $10.2$27.5 million, respectively, for share-based awards granted under all of the Company’s stock plans.
As of December 31, 2020,2023, there was $46.7$63.8 million of total unrecognized compensation cost related to unvested share-based awards. This cost is expected to be recognized over a weighted average remaining requisite service period of 3.552.84 years. We expect 1,853,0282,185,873 unvested options and stock units to vest over the next five years.
Income taxes
Deferred taxes are determined based on the difference between the consolidated financial statementstatements and tax basis of assets and liabilities using enacted tax rates in effect in the years in which the differences are expected to reverse. Valuation allowances are provided, if, based upon the weight of available evidence, it is more likely than not that some or all of the deferred tax assets will not be realized. We account for uncertain tax positions using a“more-likely-than-not”
44
Global Intangible Low-Taxed Income (“GILTI”) earned by certain foreign subsidiaries. We adopted an accounting policy to provide for the tax expense related to GILTI in the year the tax is incurred as a period expense.
In addition, we are subject to the continual examination of our income tax returns by the U.S. Internal Revenue Service (“IRS”) and other domestic and foreign tax authorities. We expect future examinations to focus on our intercompany transfer pricing practices as well as other matters. We regularly assess the likelihood of outcomes resulting from these examinations to determine the adequacy of our provision for income taxes and have reserved for potential adjustments that may result from such examinations. We believe such estimates to be reasonable; however, the final determination of any of these examinations could significantly impact the amounts provided for income taxes in our consolidated financial statements.
Recent accounting standards update
See Note 2,
Results of Operations
The following discussion of the financial condition and results of operations should be read in conjunction with the accompanying consolidated financial statements and the related footnotes thereto.
Revenues
Total revenues for years ended December 31, 2020, 2019,2023 and 20182022 were comprised of the following:
For the Years Ended December 31, | 2020 vs. 2019 | 2019 vs. 2018 | ||||||||||||||||||||||||||
2020 | 2019 | 2018 | $ Change | % Change | $ Change | % Change | ||||||||||||||||||||||
(Amounts in thousands, except for percentage data) | ||||||||||||||||||||||||||||
Revenue: | ||||||||||||||||||||||||||||
Product | $ | 366,136 | $ | 270,097 | $ | 193,891 | $ | 96,039 | 35.6 | % | $ | 76,206 | 39.3 | % | ||||||||||||||
Royalty and other | 124 | 148 | 141 | (24 | ) | (16.2 | %) | 7 | 5.0 | % | ||||||||||||||||||
Total revenue | $ | 366,260 | $ | 270,245 | $ | 194,032 | $ | 96,015 | 35.5 | % | $ | 76,213 | 39.3 | % | ||||||||||||||
|
| For the Years Ended December 31, |
|
| 2023 vs 2022 |
|
|
|
| |||||||
|
| 2023 |
|
| 2022 |
|
| $ Change |
|
| % Change |
| ||||
|
| (Amounts in thousands, except for percentage data) |
| |||||||||||||
Revenue: |
|
|
|
|
|
|
|
|
|
|
|
| ||||
Product |
| $ | 638,381 |
|
| $ | 801,183 |
|
| $ | (162,802 | ) |
|
| (20.3 | %) |
Royalty and other income |
|
| 383 |
|
|
| 353 |
|
|
| 30 |
|
|
| 8.5 | % |
Total revenue |
| $ | 638,764 |
|
| $ | 801,536 |
|
| $ | (162,772 | ) |
|
| (20.3 | %) |
Product revenues
Since 2016, we have been increasingly focused on selling our products directly to customers in the pharmaceutical industry and to our contract manufacturers. These direct sales have increased to approximately 78.0%represented 85.8% of our total product revenue during 2020. We expect that direct sales will continue2023 compared to account for an increasing percentage87.8% of our total product revenues, as the largest customer of our protein products diversified its supply chainrevenue in 2020.2022. Sales of our bioprocessing products can be impacted by the timing of large-scale production orders and the regulatory approvals for such antibodies, which may result in significant quarterly fluctuations.
Product revenues were comprised of the following:
|
| For the Years Ended December 31, |
| |||||
|
| 2023(1) |
|
| 2022 |
| ||
|
| (Amounts in thousands) |
| |||||
Filtration products |
| $ | 347,781 |
|
| $ | 495,930 |
|
Chromatography products |
|
| 126,629 |
|
|
| 131,680 |
|
Process analytics products |
|
| 56,820 |
|
|
| 53,512 |
|
Proteins products |
|
| 103,463 |
|
|
| 114,320 |
|
Other |
|
| 3,688 |
|
|
| 5,741 |
|
Total product revenue |
| $ | 638,381 |
|
| $ | 801,183 |
|
|
|
|
|
|
|
| ||
For the Years Ended December 31, | ||||||||||||
2020 (1) | 2019 (2) | 2018 | ||||||||||
(Amounts in thousands) | ||||||||||||
Filtration products | $ | 174,896 | $ | 119,534 | $ | 90,586 | ||||||
Chromatography products | 73,551 | 64,635 | 45,326 | |||||||||
Process analytics products | 33,346 | 16,405 | — | |||||||||
Proteins products | 80,732 | 65,124 | 54,375 | |||||||||
Other | 3,611 | 4,399 | 3,604 | |||||||||
Total product revenue | $ | 366,136 | $ | 270,097 | $ | 193,891 | ||||||
45
Revenue from our chromatography products includes the sale of our OPUS chromatography columns, chromatography resins and ELISA test kits. Revenue fromproducts which make up our filtration, products includeschromatography, process analytics and proteins franchises comes from the sale of our XCell ATF systems and consumables, KrosFlo filtrationa number of products SIUS filtration products, the silicone-molded products offered by EMT, which we acquired on July 13, 2020 and the products offered by NMS and ARTeSYN, which were both acquired during the fourth quarter as described in Part I, Item 1. “Business - Our Products” of 2020. Revenue from protein products includes the sale of our Protein A ligands and cell culture growth factors. Revenue from our Process Analytics products includes the sale of our SoloVPE and FlowVPE systems, consumables and
For 2020,2023, product revenue increaseddecreased by $96.0$162.8 million, or 35.6%20.3%, as compared to 2019. The increase2022. This is mainly due to the continued adoptiona decrease in revenue from programs related to COVID-19 as customers’ inventory has reduced at a slower pace than initially expected, which has primarily affected revenue from sales of our products by key bioprocessing customers across all our key product lines. Beginningfiltration products. Partially offsetting these revenue declines in the second quarter of 2020, we experienced an increase in overall sales2023, as a result of accelerated demand, which was from broad-based covering mAb, gene therapy andCOVID-19customers working on vaccines and therapeutics. We expect there will be a continued increase in direct sales during 2021, especially fromCOVID-19customers as theyscale-upand move vaccine and therapy drug candidates through clinical trial processes. In 2020, we also had good performance from our acquisitions executed in 2019 and through 2020. C Technologies revenue increased by $16.9 million in 2020, compared to 2019,2022, were price increases and strong performances within our chromatography and process analytics franchises, specifically from chromatography systems and flowpaths, as 2020 represented twelve months of ownership of C Technologies, which was acquired in May 2019, compared to only seven months of ownership in 2019. Finally,well as a resultslope spectroscopy, consumables and service. The impact of our acquisitions of EMT, NMSFlexBiosys and ARTeSYNMetenova also increased revenue in the second half of 2020, revenue from our filtration products includes $6.2 million of additional revenue.
Sales of our bioprocessing products are impacted by the timing of orders, development efforts at our customers or
Royalty revenues
Royalty revenues in 2020 and 2019for all periods presented relate to royalties received from a third-party systems manufacturer associated with our OPUS® chromatography columns. Royalty revenues are variable and are dependent on sales generated by our partner.
Costs and operating expenses
Total costs and operating expenses for the years ended December 31, 2020, 20192023 and 20182022 were comprised of the following:
For the Years Ended December 31, | 2020 vs. 2019 | 2019 vs. 2018 | ||||||||||||||||||||||||||
2020 | 2019 | 2018 | $ Change | % Change | $ Change | % Change | ||||||||||||||||||||||
(Amounts in thousands, except for percentage data) | ||||||||||||||||||||||||||||
Cost of product revenue | $ | 156,634 | $ | 119,099 | $ | 86,531 | $ | 37,535 | 31.5 | % | $ | 32,568 | 37.6 | % | ||||||||||||||
Research and development | 20,182 | 19,450 | 15,821 | 732 | 3.8 | % | 3,629 | 22.9 | % | |||||||||||||||||||
Selling, general and administrative | 119,621 | 95,613 | 65,692 | 24,008 | 25.1 | % | 29,921 | 45.5 | % | |||||||||||||||||||
Total costs and operating expenses | $ | 296,437 | $ | 234,162 | $ | 168,044 | $ | 62,275 | 26.6 | % | $ | 66,118 | 39.3 | % | ||||||||||||||
|
| For the Years Ended December 31, |
|
| 2023 vs 2022 |
|
| ||||||||||
|
| 2023 |
|
| 2022 |
|
| $ Change |
|
| % Change |
|
| ||||
|
| (Amounts in thousands, except for percentage data) |
|
| |||||||||||||
Cost of product revenue |
| $ | 353,922 |
|
| $ | 345,830 |
|
| $ | 8,092 |
|
|
| 2.3 | % |
|
Research and development |
|
| 42,722 |
|
|
| 43,936 |
|
|
| (1,214 | ) |
|
| (2.8 | )% |
|
Selling, general and administrative |
|
| 218,113 |
|
|
| 215,829 |
|
|
| 2,284 |
|
|
| 1.1 | % |
|
Contingent consideration |
|
| (30,569 | ) |
|
| (28,729 | ) |
|
| (1,840 | ) |
|
| 6.4 | % |
|
Total costs and operating expenses |
| $ | 584,188 |
|
| $ | 576,866 |
|
| $ | 7,322 |
|
|
| 1.3 | % |
|
|
|
|
|
|
|
|
|
|
|
|
|
|
| ||||
Cost of product revenue
In 2023, cost of product revenue increased $37.5$8.1 million, or 31.5%2.3%, as compared to 2019,2022, primarily due primarilyto restructuring charges, including $23.6 million in inventory adjustments to reflect inventory at net realizable value, a $3.8 million charge for accelerated depreciation on equipment related to manufacturing facilities closed and $3.0 million in severance and other charges during 2023 as a result of our restructuring activities, which commenced in July 2023. See Note 5, “Restructuring Plan” of this report for more information on the restructuring activities to simplify and streamline our organization and strengthen our overall effectiveness of our operations (“Restructuring Plan”). Our restructuring activities include consolidating a portion of our manufacturing facilities between certain U.S. locations, discontinuing the sale of certain product SKUs, and evaluating the fair value of finished goods and raw materials secured during the COVID-19 Period to meet increasing demand during a challenging supply chain environment in the industry. Where demand has reduced, finished goods and raw materials, whose value exceeded the projected requirements to be used before reaching their expiration date, were written down to their net realizable value. The inventory adjustments include reserved values which may be recoverable in future periods, if salvageable. Also contributing to the increase in cost of product revenue mentioned aboveis cost inflation, primarily in raw materials as well as freight charges due to fuel costs and carrier market conditions in 2023, compared to 2022. Also, our occupancy costs and depreciation expense increased during 2023, as compared to 2022, due to expanded facilities and manufacturing equipment being placed into service towards the end of 2022 and throughout 2023. These increases were partially offset by a decrease in costs associated with higher product volume. An increaselower revenue as well as a decrease in manufacturing headcount resulted in higher employee-related costs not related to the restructuring activities in 2020,2023, as compared to 2019. Additional facility costs, including personal protection equipment purchased for essential manufacturing personnel on site2022.
Gross margin was 44.6% in 2023, compared to protect againstCOVID-19,were also incurred56.9% in 2022. The reduction in gross margin in 2023 as compared to 2022, is primarily due to restructuring activities as noted above during 20202023 to simplify and streamline our organization and strengthen the
46
overall effectiveness of our operations for which there were no comparable amountscosts in 2019.
Research and development expenses
R&D”)&D expenses are related to bioprocessing products, which include personnel, supplies and other research expenses. Due to the size of the Company and the fact that these various programs share personnel and fixed costs, we do not track all of our expenses or allocate any fixed costs by program, and therefore, have not provided historical costs incurred by project.
R&D expenses increased $0.7decreased $1.2 million, or 3.8% in 2020,2.8%, during 2023, compared to 2019.2022. The increasedecrease during the periods is primarily due to a $1.1 milliondecrease in occupancy costs for facilities where R&D work is performed, which more than offset the increase in C Technologies R&D expenses. C Technologies was acquiredemployee-related costs, depreciation expense and spending on May 31, 2019. Therefore, only seven months of expenses were recognized in 2019,new product development during 2023, as compared to a full 12 months in 2020. The increase is partially offset by a decrease in R&D spending on external projects, as certain R&D process development laboratories were not fully functional for most of 2020 due toCOVID-19.
R&D expense also includes investmentspayments made to expand our proteins product offering through our development agreement with Navigo Proteins GmbH (“Navigo”). The Company invested $0.9Such expenses were $3.8 million in 2020 and $1.02023, $2.6 million in 20192022 and $2.3 million in 2021 in the form of milestone payments to Navigo.
Selling, general and administrative expenses
Selling, general and administrative (“SG&A”) expenses include the costs associated with selling our commercial products and costs required to support our marketing efforts, including legal, accounting, patent, shareholder services, amortization of intangible assets and other administrative functions.
SG&A costs increased by $24.0$2.3 million, or 25.1%1.1%, in 2023, as compared to 2019. The increase is partially2022 primarily due to the continued expansion of our customer-facing activities to drive sales of our bioprocessing products, and the continued buildout of our administrative infrastructure, primarily through increased headcount, to support expected future growth. Stock-based compensation expense and other employee-related costs increased in 2020, as compared to 2019, resulting from an increase in headcount and higher share prices period over period. In addition, $4.2 million of the increase in SG&A costs for 2020 was related to the C Technologies operations of FlexBiosys and Metenova, which was acquired in May 2019. C Technologies’ SG&A costs for 2020 include a full year of costs, compared to only seven months in 2019. With the acquisitions of EMT, NMS and ARTeSYN in 2020, an additional $2.2 million of SG&A costs werehave been included in the consolidated results.
Contingent consideration
Contingent consideration represents the change in fair value of the contingent consideration obligation included in current and noncurrent contingent consideration on the consolidated balance sheets as of the end of each period. Remeasurement of the contingent consideration obligation is done each quarter and the carrying value of the obligation is adjusted to the increasecurrent fair value through our consolidated statements of comprehensive income. In 2023, 2022 and 2021, actual and expected results and a change in revenue. Stock compensation expense increased as comparedmarket inputs used to 2018 resulting fromcalculate the increasediscount rate, resulted in headcountadjustments to the fair value of the contingent consideration obligation for the years ended December 31, 2023, 2022 and higher share prices period over period.
Other expenses,income (expenses), net
The table below provides detail regarding our other expenses,income (expenses), net:
|
| For the Years Ended December 31, |
|
| 2023 vs 2022 |
| ||||||||||
|
| 2023 |
|
| 2022 |
|
| $ Change |
|
| % Change |
| ||||
|
| (Amounts in thousands, except for percentage data) |
| |||||||||||||
Investment income |
| $ | 24,135 |
|
| $ | 6,978 |
|
| $ | 17,157 |
|
|
| 245.9 | % |
Interest expense |
|
| (1,951 | ) |
|
| (1,162 | ) |
|
| (789 | ) |
|
| 67.9 | % |
Loss on extinguishment of debt |
|
| (12,676 | ) |
|
| — |
|
|
| (12,676 | ) |
|
| 100.0 | % |
Amortization of debt issuance costs |
|
| (8,075 | ) |
|
| (1,815 | ) |
|
| (6,260 | ) |
|
| 344.9 | % |
Other income (expenses) |
|
| 8,123 |
|
|
| (9,531 | ) |
|
| 17,654 |
|
|
| (185.2 | )% |
Total other income (expenses), net |
| $ | 9,556 |
|
| $ | (5,530 | ) |
| $ | 15,086 |
|
|
| (272.8 | )% |
|
|
|
|
|
|
|
|
|
|
|
|
| ||||
47
For the Years Ended December 31, | 2020 vs. 2019 | 2019 vs. 2018 | ||||||||||||||||||||||||||
2020 | 2019 | 2018 | $ Change | % Change | $ Change | % Change | ||||||||||||||||||||||
(Amounts in thousands, except for percentage data) | ||||||||||||||||||||||||||||
Investment income | $ | 1,741 | $ | 5,324 | $ | 1,895 | $ | (3,583 | ) | (67.3 | )% | $ | 3,429 | 180.9 | % | |||||||||||||
Loss on extinguishment of debt | — | (5,650 | ) | — | 5,650 | (100.0 | )% | (5,650 | ) | 100.0 | % | |||||||||||||||||
Interest expense | (12,133 | ) | (9,292 | ) | (6,709 | ) | (2,841 | ) | 30.6 | % | (2,583 | ) | 38.5 | % | ||||||||||||||
Other (expenses) income | (214 | ) | (314 | ) | 262 | 100 | (31.8 | )% | (576 | ) | (219.8 | )% | ||||||||||||||||
Total other expenses, net | $ | (10,606 | ) | $ | (9,932 | ) | $ | (4,552 | ) | $ | (674 | ) | 6.8 | % | $ | (5,380 | ) | 118.2 | % | |||||||||
Investment income
Investment income includes income earned on invested cash balances. The decrease of $3.6Our investment income increased by $17.2 million in 2020,2023, as compared to 2019, was attributable2022 due to a decreasean increase in interest rates on our invested cash
Interest expense
Interest expense in 2023 is primarily from contractual coupon interest on the convertible debt outstanding as of December 31, 2023. On December 14, 2023, we entered into a privately negotiated exchange and subscription agreement with certain holders of the 2019 Notes and certain new investors pursuant to which we issued $600.0 million aggregate principal amount of the 2023 Notes. Interest expense in 2023 includes $1.0 million of interest on the 2019 Notes, compared to $1.1 million of interest expense on the 2019 due toNotes in 2022. Interest expense in 2023 also includes $0.3 million of contractual coupon interest on the completion2023 Notes for which there were no comparable amounts in 2022 as well as $0.6 million in accretion of a public offeringthe $82.1 million debt discount on the modified notes, which includes the accretion of an increase in principal and the issuanceaccretion of increased fair value of the conversion option in 2023, for which there were no comparable costs in 2022. See Note 14, “Convertible Senior Notes,” to our 2019 Notes during the third quarter of 2019, partially offset the decreaseconsolidated financial statements included in interest rates mentioned above. We expect investment income to vary basedthis report for more information on changes in the amount of funds invested and fluctuation of interest rates.
Loss on extinguishment of debt
In 2023, as part of the Exchange Transaction, we exchanged $217.7 million in aggregate principal amount of the 2019 Notes for $309.9 million in aggregate principal amount of the 2023 Notes. Upon evaluation of the Exchange Transaction, approximately $29.6 million, of the $217.7 million in aggregate principal amount of the 2019 Notes were deemed extinguished. As a result, we recorded a $12.7 million loss on extinguishment of debt in 2020.
Amortization of settlement.
Transaction costs related to the issuance of our 2016 Notes, which were settled during the third quarter of 2019 and our 2019 Notes. Interest expense increased $2.8 million in 2020, as compared to 2019 based on the increase in debt issued from $115.0 million for the 2016 Notes to $287.5 million for the 2019 Notes.
Other income (expenses) income
The changechanges in other expenses, during 2020,net in 2023, as compared to 2019,2022, is primarily attributable to realized and unrealized foreign currency gains and losses related to amounts due fromnon-Swedishkrona-basedtransactions with customers and vendors. In addition, $0.5 million was included in other expenses in 2019, which represents a bridge loan commitment fee incurredvendors, as partwell as the revaluation impact of the C Technologies Acquisition.
Income tax (benefit) provision
Income tax (benefit) provision for the years ended December 31, 2020, 20192023 and 20182022 was as follows:
For the Years Ended December 31, | 2020 vs. 2019 | 2019 vs. 2018 | ||||||||||||||||||||||||||
2020 | 2019 | 2018 | $ Change | % Change | $ Change | % Change | ||||||||||||||||||||||
(Amounts in thousands, except for percentage data) | ||||||||||||||||||||||||||||
Income tax (benefit) provision | $ | (709 | ) | $ | 4,740 | $4,819 | $(5,449) | (115.0 | )% | $ | (79 | ) | (1.6 | )% | ||||||||||||||
Effective tax rate | (1.2 | )% | 18.1 | % | 22.5 | % | ||||||||||||||||||||||
|
| For the Years Ended December 31, |
|
| 2023 vs 2022 |
| ||||||||||
|
| 2023 |
|
| 2022 |
|
| $ Change |
|
| % Change |
| ||||
|
| (Amounts in thousands, except for percentage data) |
| |||||||||||||
Income tax provision |
| $ | 22,555 |
|
| $ | 33,181 |
|
| $ | (10,626 | ) |
|
| (32.0 | )% |
Effective tax rate |
|
| 35.2 | % |
|
| 15.1 | % |
|
|
|
|
|
| ||
For the year ended December 31, 2020,2023, we recorded an income tax benefitprovision of $0.7$22.6 million. The effective tax rate was (1.2%)35.2% for 2023 and is based upon the estimated taxable income for the year endingended December 31, 20202023 and the composition of income in different jurisdictions. The difference in effective tax rates between 2023 and 2022 was primarily due to a loss on extinguishment of debt and a debt discount basis difference, partially offset by increased benefits from business tax credits and nontaxable contingent consideration. Our effective tax rate for 20202023 was lower
48
higher than the U.S. statutory rate of 21% primarily due to windfall benefits on stock option exercises and the vesting of stock units, an increase ina debt discount basis difference partially offset by business tax credits and tax benefits relatednontaxable contingent consideration.
Non-GAAP Financial Measures
In addition to a change in U.S. tax law.
We include this financial information because we believe these measures provide a more accurate comparison of our financial results between periods andthat more accurately reflectreflects how management reviews its financial results.results and measures the performance of our ongoing operations for the periods in which such changes incurred. We excluded the impact of certain acquisitionacquisition-related items and items related itemsto the issuance of our 2023 Notes and 2019 Notes because we believe that the resulting charges do not accurately reflect the performance of our ongoing operations for the period in which such charges are incurred.
Non-GAAP
Non-GAAP
For the Years Ended December 31, | ||||||||
2020 | 2019 | |||||||
(Amounts in thousands) | ||||||||
GAAP income from operations | $ | 69,823 | $ | 36,083 | ||||
Non-GAAP adjustments to income from operations: | ||||||||
Acquisition and integration costs | 11,465 | 12,508 | ||||||
Inventory step-up charges | 734 | 1,483 | ||||||
Intangible amortization | 16,032 | 13,441 | ||||||
Non-GAAP adjusted income from operations | $ | 98,054 | $ | 63,515 | ||||
|
| For the Years Ended December 31, |
| |||||
|
| 2023 |
|
| 2022 |
| ||
|
| (Amounts in thousands) |
| |||||
GAAP income from operations |
| $ | 54,576 |
|
| $ | 224,670 |
|
Non-GAAP adjustments to income from operations: |
|
|
|
|
|
| ||
Inventory step-up charges |
|
| 1,238 |
|
|
| — |
|
Acquisition and integration costs |
|
| 5,861 |
|
|
| 9,253 |
|
Restructuring costs(1) |
|
| 32,200 |
|
|
| — |
|
Contingent consideration |
|
| (30,569 | ) |
|
| (28,729 | ) |
Intangible amortization |
|
| 30,981 |
|
|
| 27,016 |
|
Non-GAAP adjusted income from operations |
| $ | 94,287 |
|
| $ | 232,210 |
|
|
|
|
|
|
|
| ||
Non-GAAP
Non-GAAP
49
net income and fully diluted earnings per share in accordance with GAAP to20202023 and 2019:
For the Years Ended December 31, | ||||||||||||||||
2020 | 2019 | |||||||||||||||
Amount | Fully Diluted Earnings per Share* | Amount | Fully Diluted Earnings per Share* | |||||||||||||
(Amounts in thousands, except per share data) | ||||||||||||||||
GAAP net income | $ | 59,926 | $ | 1.11 | $ | 21,411 | $ | 0.44 | ||||||||
Non-GAAP adjustments to net income: | ||||||||||||||||
Acquisition and integration costs | 10,479 | 0.19 | 13,008 | 0.26 | ||||||||||||
Inventory step-up charges | 734 | 0.01 | 1,483 | 0.03 | ||||||||||||
Intangible amortization | 16,032 | 0.30 | 13,441 | 0.27 | ||||||||||||
Loss on extinguishment of debt | — | — | 5,650 | 0.11 | ||||||||||||
Non-cash interest expense | 10,970 | 0.20 | 7,536 | 0.15 | ||||||||||||
Tax effect of intangible amortization and acquisition costs | (9,050 | ) | (0.17 | ) | (10,003 | ) | (0.20 | ) | ||||||||
Non-GAAP adjusted net income | $ | 89,091 | $ | 1.65 | $ | 52,526 | $ | 1.07 | ||||||||
|
| For the Years Ended December 31, |
| |||||||||||||
|
| 2023 |
|
| 2022 |
| ||||||||||
|
|
|
|
| Fully |
|
|
|
|
| Fully |
| ||||
|
|
|
|
| Earnings |
|
|
|
|
| Earnings |
| ||||
|
| Amount |
|
| Share* |
|
| Amount |
|
| Share* |
| ||||
|
| (Amounts in thousands, except per share data) |
| |||||||||||||
GAAP net income |
| $ | 41,577 |
|
| $ | 0.74 |
|
| $ | 185,959 |
|
| $ | 3.24 |
|
Non-GAAP adjustments to net income: |
|
|
|
|
|
|
|
|
|
|
|
| ||||
Inventory step-up charges |
|
| 1,238 |
|
|
| 0.02 |
|
|
| — |
|
|
| — |
|
Acquisition and integration costs |
|
| 5,861 |
|
|
| 0.10 |
|
|
| 9,514 |
|
|
| 0.17 |
|
Restructuring costs(1) |
|
| 32,200 |
|
|
| 0.57 |
|
|
| — |
|
|
| — |
|
Contingent consideration |
|
| (30,569 | ) |
|
| (0.54 | ) |
|
| (28,729 | ) |
|
| (0.50 | ) |
Intangible amortization |
|
| 30,981 |
|
|
| 0.55 |
|
|
| 27,016 |
|
|
| 0.47 |
|
Loss on extinguishment of debt |
|
| 12,676 |
|
|
| 0.22 |
|
|
| — |
|
|
| — |
|
Non-cash interest expense |
|
| 620 |
|
|
| 0.01 |
|
|
| — |
|
|
| — |
|
Amortization of debt issuance costs(2) |
|
| 8,075 |
|
|
| 0.14 |
|
|
| 1,815 |
|
|
| 0.03 |
|
Foreign currency impact of certain intercompany loans(4) |
|
| (7,743 | ) |
|
| (0.14 | ) |
|
|
|
|
|
| ||
Tax effect of non-GAAP charges |
|
| 3,485 |
|
|
| 0.06 |
|
|
| (7,002 | ) |
|
| (0.12 | ) |
Non-GAAP adjusted net income |
| $ | 98,401 |
|
| $ | 1.75 |
|
| $ | 188,573 |
|
| $ | 3.28 |
|
|
|
|
|
|
|
|
|
|
|
|
|
| ||||
* Note that earnings per share amounts may not add due to rounding.
Adjusted EBITDA
Adjusted EBITDA is measured by taking net income as reported in accordance with GAAP, excluding investment income, interest expense, taxes,amortization of debt issuance costs, income tax provision, depreciation and intangible amortization, and excludinginventory step-up charges, acquisition and integration costs, inventorystep-upcharges and loss on extinguishment of debtrestructuring costs, contingent consideration fair value adjustments booked through our consolidated statements of comprehensive income.income, loss on extinguishment of debt and foreign currency impact of certain intercompany loans. The following is a reconciliation of net income in accordance with GAAP to adjusted EBITDA for years ended December 31, 20202023 and 2019:
|
| For the Years Ended December 31, |
|
| |||||
|
| 2023 |
|
| 2022 |
|
| ||
|
| (Amounts in thousands) |
|
| |||||
GAAP net income |
| $ | 41,577 |
|
| $ | 185,959 |
|
|
Non-GAAP EBITDA adjustments to net income: |
|
|
|
|
|
|
| ||
Investment income |
|
| (24,135 | ) |
|
| (6,978 | ) |
|
Interest expense |
|
| 1,951 |
|
|
| 1,162 |
|
|
Amortization of debt issuance costs |
|
| 8,075 |
|
|
| 1,815 |
|
|
Income tax provision |
|
| 22,555 |
|
|
| 33,181 |
|
|
Depreciation |
|
| 36,994 |
|
|
| 23,859 |
|
|
Intangible amortization |
|
| 31,091 |
|
|
| 27,126 |
|
|
EBITDA |
|
| 118,108 |
|
|
| 266,124 |
|
|
Other non-GAAP adjustments: |
|
|
|
|
|
|
| ||
Inventory step-up charges |
|
| 1,238 |
|
|
| — |
|
|
Acquisition and integration costs |
|
| 5,861 |
|
|
| 9,514 |
|
|
Restructuring costs(1)(3) |
|
| 28,384 |
|
|
| — |
|
|
Contingent consideration |
|
| (30,569 | ) |
|
| (28,729 | ) |
|
Loss on extinguishment of debt |
|
| 12,676 |
|
|
| — |
|
|
Foreign currency impact of certain intercompany loans(4) |
|
| (7,743 | ) |
|
| — |
|
|
Adjusted EBITDA |
| $ | 127,955 |
|
| $ | 246,909 |
|
|
|
|
|
|
|
|
|
| ||
For the Years Ended December 31, | ||||||||
2020 | 2019 | |||||||
(Amounts in thousands) | ||||||||
GAAP net income | $ | 59,926 | $ | 21,411 | ||||
Non-GAAP EBITDA adjustments to net income: | ||||||||
Investment income | (1,741 | ) | (5,324 | ) | ||||
Interest expense | 12,133 | 9,292 | ||||||
Tax (benefit) provision | (709 | ) | 4,740 | |||||
Depreciation | 10,888 | 7,317 | ||||||
Intangible amortization | 16,143 | 13,551 | ||||||
EBITDA | 96,640 | 50,987 | ||||||
Other non-GAAP adjustments: | ||||||||
Acquisition and integration costs | 10,479 | 13,008 | ||||||
Loss on extinguishment of debt | — | 5,650 | ||||||
Inventory step-up charges | 734 | 1,483 | ||||||
Adjusted EBITDA | $ | 107,853 | $ | 71,128 | ||||
50
Liquidity and Capital Resources
We have financed our operations primarily through revenues derived from product sales, the issuance of the 2016 Notes in May 2016, and our 2019 Notes (defined below) in July 2019, the 2023 Notes in December 2023 and the issuance of common stock in our December 2020, July 2019 and May 2019 public offerings. Our revenue for the foreseeable future will primarily be limited to our bioprocessing product revenue.
At December 31, 2020,2023, we had cash and cash equivalents of $717.3$751.3 million compared to cash and cash equivalents of $528.4$523.5 million at December 31, 2019.2022. There were no restrictions on cash as of December 31, 2020.
On December 8, 2020, the Company completed a public offering in which 1,725,000 shares of its common stock, including the underwriters’ full exercise of an option to purchase up to an additional 225,000 shares, were sold to the public at a price of $181.00 per share. The total proceeds receivedMarch 10, 2023, Silicon Valley Bank (“SVB”) was closed by the CompanyCalifornia Department of Financial Protection and Innovation, which appointed the Federal Deposit Insurance Corporation (“FDIC”) as receiver. Subsequently, the U.S. Treasury, Federal Reserve and FDIC announced that SVB depositors would have access to all of their money. We have a banking relationship with SVB and hold cash, cash equivalents and marketable securities of $0.1 million as of December 31, 2023 in SVB depository accounts to cover short-term operational payments. While we have not experienced any losses in such accounts, the recent failure of SVB caused us to utilize our accounts at other financial institutions in order to mitigate potential operational risks stemming from this offering, netthe temporary inability to access funds in our SVB operating accounts. As a result of underwriting discountsbank failures, such as SVB, our access to funding sources in amounts adequate to finance or capitalize our current and commissionsprojected future business operations could be significantly impaired and other estimated offering expenses payable bycould negatively impact the Company, were approximately $297.8 million.
In 2020,2023, we acquired threetwo companies for an aggregate of $175.0$186.6 million in cash, net of cash acquired.
On July 19, 2019, the Company completed a public offering in which 1,587,000 shares of its common stock, including the underwriters’ full exercise of an option to purchase an additional 207,000 shares, were sold to the public at a price of $87.00 per share for $131.1 million in net proceeds to the Company, after deducting underwriting discounts and commissions and other estimated offering expenses payable by the Company (the “July Stock Offering”).
Proceeds from the Subscription Transactions amounted to $276.1 million after debt issuance costs of $14.0 million. The exchange resulted in $6.2 million of the Company’sdebt issuance costs related to the modified notes to be recorded to amortization of debt issuance costs in our 2023 consolidated statement of comprehensive income under the rules of modification accounting. The remaining debt issuance costs of $7.8 million as well as $0.7 million of unamortized costs carried over from the 2019 Notes at the exchange date, were capitalized within long-term debt (as a contra-liability) in our consolidated balance sheets as of December 31, 2023 and will be amortized as an adjustment to amortization of debt issuance costs over the five-year term of the 2023 Notes in our consolidated statements of comprehensive income asincome. The 2023 Notes are senior, unsecured obligations of December 31, 2019.
51
Prior to the close of business on the business day immediately preceding September 15, 2028, the 2023 Notes will be convertible at the option of the holders of 2023 Notes only upon the satisfaction of specified conditions and during certain periods into cash up to their principal amount, and into cash, shares of itsthe Company's common stock includingor a combination of cash and the underwriters’ full exerciseCompany's common stock, at the Company's election, for the conversion value above the principal amount, if any. Thereafter until the close of an option to purchase up to an additional 410,156
During the fourth quarter of 2020,2023, the closing price of the Company’sour common stock exceeded 130% of the conversion price of the 2019 Notes for more than 20 trading days of the last 30 consecutive trading days of the quarter. As a result, the 2019 Notes are convertible at the option of the holders of the 2019 Notes during the first quarter of 2021 per2024, the First Supplemental Indenture underlyingquarter immediately following the quarter when the conditions are met, as stated in the terms of the 2019 Notes. TheThese conditions have been met each quarter since the third quarter of 2020. As a result, as of the date of this filing and prior to the Exchange Transaction, we received requests to convert $0.2 million aggregate principal amount of the 2019 Notes and all but $0.1 million of the requests have been settled as of December 31, 2023. The remaining conversions will settle in the first quarter of 2024. The conversions resulted in the issuance of a face valuenominal number of $287.5 million and a carrying valueshares of $243.7 million. The Company expectsour common stock to continue meeting these terms and has reclassifiedthe note holders. Because the 2019 Notes mature within one year of the report date, we classify the carrying value of the 2019 Notes from long-term liabilities toof $69.5 million as current liabilities on the Company’sour consolidated balance sheet as ofsheets at December 31, 2020. As2023.
In 2023, our Board authorized the repurchase of up to $25.0 million of our common stock concurrent with the issuance of the 2023 Notes. The authorization does not obligate us to acquire a specific number of shares during any period and does not have an expiration date, of this filing, the Company received a request to convert $1,000 aggregate principal amount of 2019 Notes and we intend to pay or deliver, as the casebut it may be modified, suspended, or discontinued at any time at the settlement amount to be determined – paying the amount in excessdiscretion of our Board. In December 2023, we used $14.4 million of cash of the aggregate principal portionproceeds from the issuance of the converted notes in2023 Notes to repurchase and retire 92,090 shares of our common stock.
In 2023, we had lease arrangements for certain equipment and facilities including corporate and manufacturing sites. As of December 31, 2023, the Company had fixed lease payment obligations of $132.2 million, with $5.6 million payable within 12 months. See Note 6, “Leases,” for additional information.
In 2023, we had other purchase obligations primarily consisting of purchase commitments with certain vendors and open purchase orders for the procurement of raw materials for manufacturing. As of December 31, 2023, the Company had other purchase obligations of $34.3 million, payable within 12 months.
Cash flows
For the Years Ended December 31, | FY20 vs FY19 $ Change | FY19 vs FY18 $ Change | ||||||||||||||||||
2020 | 2019 | 2018 | ||||||||||||||||||
(Amounts in thousands) | ||||||||||||||||||||
Cash provided by (used in): | ||||||||||||||||||||
Operating activities | $ | 62,625 | $ | 67,216 | $ | 32,770 | $ | (4,591 | ) | $ | 34,446 | |||||||||
Investing activities | (201,385 | ) | (205,308 | ) | (14,037 | ) | 3,923 | (191,271 | ) | |||||||||||
Financing activities | 305,916 | 484,867 | 3,407 | (178,951 | ) | 481,460 | ||||||||||||||
Effect of exchange rate changes on cash, cash equivalents and restricted cash | 12,729 | (3,190 | ) | (2,077 | ) | 15,919 | (1,113 | ) | ||||||||||||
Net increase in cash, cash equivalents and restricted cash | $ | 179,885 | $ | 343,585 | $ | 20,063 | $ | (163,700 | ) | $ | 323,522 | |||||||||
|
| For the Years Ended December 31, |
|
| 2023 vs 2022 |
| ||||||
|
| 2023 |
|
| 2022 |
|
| $ Change |
| |||
|
| (Amounts in thousands) |
| |||||||||
Cash provided by (used in): |
|
|
|
|
|
|
|
|
| |||
Operating activities |
| $ | 113,918 |
|
| $ | 172,083 |
|
| $ | (58,165 | ) |
Investing activities |
|
| (123,275 | ) |
|
| (233,236 | ) |
|
| 109,961 |
|
Financing activities |
|
| 248,961 |
|
|
| (13,337 | ) |
|
| 262,298 |
|
Effect of exchange rate changes on cash, cash |
|
| (11,739 | ) |
|
| (5,866 | ) |
|
| (5,873 | ) |
Net increase (decrease) in cash, cash equivalents |
| $ | 227,865 |
|
| $ | (80,356 | ) |
| $ | 308,221 |
|
|
|
|
|
|
|
|
|
|
| |||
Operating activities
For 2020,2023, our operating activities provided cash of $62.6$113.9 million reflecting net income of $59.9$41.6 million and$51.3$81.0 million primarily related to amortization of inventory step-up charges, depreciation, intangible amortization, amortization of debt discount and issuance costs, contingent consideration fair value adjustments, deferred income taxes, stock-based compensation charges and loss on extinguishment of debt. A decrease in inventory provided $41.0 million of which $23.6 million was related to the Restructuring Plan. An increase in prepaid expenses, primarily related to prepaid taxes and insurance as well as subscriptions, consumed $13.0 million. A decrease in accounts payable and accrued expenses consumed $37.7 million and was due to
52
the timing of payments to vendors as well as the payment of employee bonuses related to 2022 during 2023. The remaining cash provided by operating activities resulted from favorable changes in various other working capital accounts.
For 2022, our operating activities provided cash of $172.1 million reflecting net income of $186.0 million and non-cash charges totaling $49.9 million primarily related to depreciation, amortization,non-cashinterest expense, contingent consideration adjustments, amortization of debt issuance costs, deferred income taxes and stock-based compensation charges. An increase in accounts receivable consumed $21.0$3.6 million of cash and was primarily driven by the 35.5%total revenues andrevenue in 2022, as compared to 2021. Additionally, we had an increase in inventory manufactured of $29.3$57.2 million to support expected continued growthincreases in future revenues. In addition, $4.9 million was consumed for increases in prepaid expenses for annual software and network contracts, as well as the renewal of the Company’s global insurance policies. These were offset by an increase in accountsrevenue. Accounts payable and accrued liabilities of $3.5 million due primarily to increased inventory purchases to support customer orders andyear-endtax adjustments, offset by payment of acquisition-related bonuses for C Technologies during the second quarter of 2020. The remaining cash source of operating activities resulted from favorable changes in various other working capital accounts.
Investing activities
Our investing activities consumed $201.4$123.3 million of cash during 2020. We used $175.0in 2023, primarily due to $186.6 million in cash (net of cash received) used for the EMT, NMS2023 acquisitions of Metenova and ARTeSYN Acquisitions.FlexBiosys, in the aggregate. Capital expenditures consumed $26.3$39.0 million in 2023, as we continue to increase our manufacturing capacity worldwide. Of these expenditures, $3.9$2.8 million represented capitalized costs related to oursoftware.
Our investing activities consumed $205.3$233.2 million of cash during 2019. We used $182.22022, mainly due to $88.3 million of capital expenditures in cash (net of cash received) for the C Technologies Acquisition on May 31, 2019. Capital expenditures consumed $23.2 million2022 as we continuecontinued to increase our manufacturing capacity worldwide. Of these expenditures, $4.7$3.5 million represented capitalized costs related to oursoftware.
Financing activities
In 2020,2023, cash provided by financing activities of $305.9$249.0 million included $297.8$290.1 million of proceeds from the issuance of our common stock resulting from our public offerings completedthe 2023 Notes in December 2020. Proceeds2023 and proceeds from stock option exercises during 20202023 were $8.2$1.1 million.
Our financing activities consumed $13.3 million of cash in 2022, which included cash disbursed in relation to shares withheld to cover employee income tax due upon the vesting and release of restricted stock units of $17.0 million. This was partially offset by proceeds of $278.5 million. Proceedsreceived from stock option exercises during the period of $3.7 million.
Working capital increased by $359.0 million to $952.9 million at December 31, 2023 from $593.9 million at December 31, 2022 due to various changes noted above, primarily the exchange of $217.7 million in aggregate principal of the 2019 were $1.2 million. Offsetting these activities was $115.0 million of cash utilized by the CompanyNotes in July 2019 to settle the 2016 Notes.
Effect of exchange rate changes on cash, cash equivalents and restricted cash
The effect of exchange rate changes on cash during 20202023 is a result of the strengthening of the Swedish krona against the U.S. dollar by 12% and3%, the strengthening of the Euro against the U.S. dollar by 9%3% and the strengthening of the British pound against the U.S. dollar by 5%.
Off-Balance
We do not have any special purpose entities or
Total | Less than one year | One to three years | Three to five years | Over five years | ||||||||||||||||
(Amounts in thousands) | ||||||||||||||||||||
Convertible senior notes (1) | $ | 287,500 | $ | 287,500 | $ | — | $ | — | $ | — | ||||||||||
Interest payments related to convertible senior notes | 1,078 | 1,078 | — | — | — | |||||||||||||||
Operating lease obligations | 44,840 | 7,196 | 12,252 | 9,865 | 15,527 | |||||||||||||||
Purchase obligations (2) | 55,253 | 55,253 | — | — | — | |||||||||||||||
Total | $ | 388,671 | $ | 351,027 | $ | 12,252 | $ | 9,865 | $ | 15,527 | ||||||||||
Capital Requirements
Our future capital requirements will depend on many factors, including the following:
53
Absent acquisitions of additional products, product candidates or intellectual property, we believe our current cash balances are adequate to meet our cash needs for at least the next 24 months. We expect operating expenses in 20212024 to increase as we continue to expand our bioprocessing business. We expect to incur continued spending related to the development and expansion of our bioprocessing product lines and expansion of our commercial capabilities for the foreseeable future. Our future capital requirements may include, but are not limited to, purchases of property, plant and equipment, the acquisition of additional bioprocessing products and technologies to complement our existing manufacturing capabilities, and continued investment in our intellectual property portfolio.
We plan to continue to invest in our bioprocessing business and in key research and developmentR&D activities associated with the development of new bioprocessing products. We actively evaluate various strategic transactions on an ongoing basis, including licensing or acquiring complementary products, technologies or businesses that would complement our existing portfolio. We continue to seek to acquire such potential assets that may offer us the best opportunity to create value for our shareholders. In order to acquire such assets, we may need to seek additional financing to fund these investments. If our available cash balances and anticipated cash flow from operations are insufficient to satisfy our liquidity requirements, including because of any suchfor example, due to acquisition-related financing needs or lower demand for our products, among potential other events, we may seek to sell common or preferred equity or convertible debt securities, enter into a credit facility or another form of third-party funding, or seek other debt funding. The sale of equity and convertible debt securities may result in dilution to our stockholders,shareholders, and those securities may have rights senior to those of our common shares. If we raise additional funds through the issuance of preferred stock, convertible debt securities or other debt financing, these securities or other debt could contain covenants that would restrict our operations. Any other third-party funding arrangement could require us to relinquish valuable rights. We may require additional capital beyond our currently anticipated amounts. Additional capital may not be available on reasonable terms, if at all.
Net Operating Loss Carryforwards
At December 31, 2020,2023, we had federal net operating loss carryforwards of $6.4$31.1 million, remaining.state net operating loss carryforwards of $1.5 million, and foreign net operating loss carryforwards of $4.9 million. The state net operating loss carryforwards will expire at various dates through 2043, while the federal and foreign net operating loss carryforwards have unlimited carryforward periods and do not expire. We had federal and state business tax credits carryforwards of $9.4$5.0 million available to reduce future federal and state income taxes, if any.taxes. The business tax credits carryforwards will continue to expire at various dates through December 2039.2043. Net operating loss carryforwards and available tax credits are subject to review and possible adjustment by the Internal Revenue Service, state and foreign jurisdictions and may be limited in the event of certain changes in the ownership interest of significant stockholders.
54
Foreign Earnings
As of December 31, 2020, the Company has2023, we have accumulated undistributed earnings generated by our foreign subsidiaries of approximately $113.1$212.4 million. Because $58.0$5.7 million of such earnings have previously been subject to the2017 Tax Cuts and Jobs Act enacted in December 2017, any additional taxes due with respect to such earnings or the excess of the amount for financial reporting over the tax basis of our foreign investments would generally be limited to foreign and state taxes. At December 31, 2020,2023, we have not provided for taxes on outside basis differences of our foreign subsidiaries as it is not practicable and we have the ability and intent to indefinitely reinvest the undistributed earnings of our foreign subsidiaries, and there are no needs for such earnings in the United States that would contradict our plan to indefinitely reinvest.
Effects of Inflation
Our assets are primarily monetary, consisting of cash and cash equivalents.equivalents and marketable securities. Because of their liquidity, these assets are not directly affected by inflation. Since we intend to retain and continue to use our equipment, furniture, fixtures and office equipment, computer hardware and software and leasehold
ITEM 7A. QUANTITATIVE AND QUALITATIVE DISCLOSURES ABOUT MARKET RISK
We are exposed to market risk in the ordinary course of our business. Market risk represents the risk of loss that may impact our financial position due to adverse changes in financial market prices and rates. Our market risk exposure is primarily a result of fluctuations in interest rates and foreign currency exchange rates.
Interest Rate Risk
We have historically held investments in commercial paper, U.S. Governmenttreasury and agencygovernment securities as well as corporate bonds and other debt securities. As a result, we have been exposed to potential loss from market risks that may occur as a result of changes in interest rates, changes in credit quality of the issuer or otherwise. We do not have any such investments as of December 31, 2020.2023. Our investment portfolio consists of cash and cash equivalents (cash and money market funds) that total $751.3 million on the consolidated balance sheets as of December 31, 2023. Our cash equivalent investments (money market funds) have short-term maturity periods that dampen the impact of market or interest rate risk. As a result, a hypothetical 100 basis point increase in interest rates would have no effect on our cash position as of December 31, 2020.
We generally placemanage our marketable security investmentsinvestment portfolio in high quality credit instruments, as specified inaccordance with our investment policy guidelines. We believe thator approval by the conservative natureBoard of our investments mitigates our interest rate exposure, andDirectors. The primary objectives of our investment policy limits the amountare to preserve principal, maintain a high degree of liquidity to meet operating and other needs, and obtain competitive returns subject to prevailing market conditions without significantly increasing risk. To achieve this objective, we maintain our credit exposure to any one issue, issuer (with the exceptionportfolio of U.S. agency obligations) and type of instrument. We do not expect any material loss from our marketable security investments and therefore believe that our potential interest rate exposure is limited.
Foreign Exchange Risk
The reporting currency of the Company is U.S. dollars, and the functional currency of each of our foreign subsidiaries is its respective local currency. Our foreign currency exposures include the Swedish krona, Euro, British pound, Chinese yuan, Japanese yen, Singapore dollar, South Korean won and Indian rupee; of these, the primary foreign currency exposures are the Swedish kronor,krona, Euro and British pound.Chinese yuan. Exchange gains or losses resulting from the translation between the transactional currency and the functional currency are included in net income. Fluctuations in exchange rates may adversely affect our results of operations, financial position and cash flows. We currently do not seek to hedge this exposure to fluctuations in exchange rates.
Although a majority of our contracts are denominated in U.S. dollars, 30%38.5% and 29%38.2% of total revenues during 2020 and 2019, respectively, were denominated in foreign currencies while 7%during 2023 and 17% of our costs and expenses during 2020 and 2019, respectively, were denominated in foreign currencies, primarily operating expenses associated with cost of revenue, sales and marketing and general and administrative. In addition, 22% and 16% of our consolidated tangible assets were subject to foreign currency exchange fluctuations as of each of December 31, 2020 and 2019, respectively, while 6% and 5% of our consolidated liabilities were exposed to foreign currency exchange fluctuations as of each of December 31, 2020 and 2019,2022, respectively.
ITEM 8. FINANCIAL STATEMENTS AND SUPPLEMENTARY DATA
Financial statements and supplementary data required by Item 8 are set forth at the pages indicated in Item 15(a) below and are incorporated herein by reference.
55
ITEM 9. CHANGES IN AND DISAGREEMENTS WITH ACCOUNTANTS ON ACCOUNTING AND FINANCIAL DISCLOSURE.
None.
ITEM 9A. CONTROLS AND PROCEDURES
(a) Disclosure Controls and Procedures.
The Company’s management, with the participation of our principal executive officer and principal financial officer, has evaluated the effectiveness of the Company’s disclosure controls and procedures (as defined inthe end of such period,December 31, 2023, the Company’s disclosure controls and procedures were not effective at the reasonable assurance level.
(b) Report of Management on Internal Control Over Financial Reporting.
Management of the Company is responsible for establishing and maintaining adequate internal control over financial reporting. Internal control over financial reporting is defined in
Management assessed the effectiveness of the Company’s internal control over financial reporting as of December 31, 2020.2023. In making this assessment, management used the criteria established in
Because of its inherent limitations, internal control over financial reporting may not prevent or detect misstatements. Projections of any evaluation of effectiveness to future periods are subject to the risks that controls may become inadequate because of changes in conditions, or that the degree of compliance with the policies or procedures may deteriorate.
We acquired FlexBiosys Inc. (“FlexBiosys”) on April 17, 2023 and Metenova Holding AB ("Metenova") on October 2, 2023. The financial results of each of these acquisitions are included in our audited consolidated financial statements as of December 31, 2023. The Company's consolidated total assets as of December 31, 2023 includes $43.7 million and $197.2 million from the FlexBiosys and Metenova businesses, respectively. The Company's consolidated revenue for the year ended December 31, 2023 includes $2.5 million and $5.0 million from the FlexBiosys and Metenova businesses, respectively. As these acquisitions occurred during 2023, the scope of our assessment of our internal control over financial reporting does not include these acquisitions. These exclusions are in accordance with the Security and Exchange Commission's general guidance that an assessment of a recently acquired business may be omitted from our scope in the year of such acquisition.
In connection with our initiative to integrate and enhance our global information technology systems and business processes, we continued the phased implementation of a new enterprise resource planning (“ERP”) system. The Company is implementing the ERP system in phases and will continue until all current and future subsidiaries are using it. The fifth phase of implementation was
56
completed during the second quarter of 2023. As a result of this implementation, we modified certain existing internal control over financial reporting as well as implemented new controls and procedures related to the new ERP system as of December 31, 2023.
In conjunction with management’s assessment of internal control over financial reporting in the fourth quarter of 2023, management identified a material weakness in the operation of our controls over the deferred income tax accounting for complex and non-routine transactions. Specifically, management did not have adequate supervision and review controls over the complex accounting for deferred income tax on the exchange of our outstanding 0.375% Convertible Senior Notes due 2024 and the issuance of 1.00% Convertible Senior Notes due 2028, including work performed by external advisors and the internal review of such transaction and related analyses. This material weakness did not result in an error in any of our previously issued consolidated financial statements including the consolidated financial statements as of and for the year ended December 31, 2023. Based on this material weakness, the Company’s management concluded that at December 31, 2023, the Company’s internal control over financial reporting was not effective.
Income tax accounting related to non-routine transactions
Following identification of the material weakness, and as part of our commitment to strengthen our internal control over financial reporting, we are implementing remedial actions under the oversight of the Audit Committee of our Board to address these deficiencies. On highly-technical, non-routine and complex accounting transactions, we will continue to engage nationally recognized third-party advisors with the requisite skills and technical expertise to assist us in assessing, performing and reviewing such transactions; however we will:
We will continue to monitor the design and operating effectiveness of these and other processes, procedures and controls and make any further changes management determines appropriate.
Our CEO and CFO have certified that, based on their knowledge, our consolidated financial statements and other financial information included in this Annual Report on Form 10-K (“Form 10-K”), fairly present, in all material respects, our financial condition, results of operations and cash flows as of, and for, the periods presented in this Form 10-K.
Ernst & Young LLP, the independent registered public accounting firm that audited our consolidated financial statements included in this Form 10-K, has issued an unqualified opinion on our consolidated financial statements and has issued an attestation report on our internal control over financial reporting as of December 31, 2023.
Changes in Internal Control Over Financial Reporting
Except for the material weakness described above, there has been no change in our internal control over financial reporting as defined in Rules 13a-15(f) and 15d-15(f) that occurred during the quarter ended December 31, 2023 that have materially affected, or are reasonably likely to materially affect, our internal control over financial reporting. Consolidated financial statements reflected in our current Form 10-K are accurately stated.
(c) Attestation Report of the Independent Registered Public Accounting Firm.
57
REPORT OF INDEPENDENT REGISTERED PUBLIC ACCOUNTING FIRM
To the Stockholders and the Board of Directors of Repligen Corporation:
Opinion on Internal Control overOver Financial Reporting
We have audited Repligen Corporation’s internal control over financial reporting as of December 31, 2020,2023, based on criteria established in Internal Control – Control—Integrated Framework issued by the Committee of Sponsoring Organizations of the Treadway Commission (2013 framework) (the COSO criteria). In our opinion, because of the effect of the material weakness described below on the achievement of the objectives of the control criteria, Repligen Corporation (the Company) has not maintained in all material respects, effective internal control over financial reporting as of December 31, 2020,2023, based on the COSO criteria.
As indicated in the accompanying Management’s Report of Management on Internal Control Over Financial Reporting, management’s assessment of and conclusion on the effectiveness of internal control over financial reporting did not include the internal controls of Engineered Molding Technology LLC (“EMT”),Non-MetallicSolutions, Inc. (“NMS”Metenova Holding AB ("Metenova") and ARTeSYN Biosolutions Holdings Ireland Limited (“ARTeSYN”FlexBiosys Inc. ("FlexBiosys"), which areis included in the 20202023 consolidated financial statements of the Company and constituted $31.9 million, $16.8$197.2 million and $226.1$43.7 million of total assets, respectively, as of December 31, 2020,2023 and $3.7 million, $0.6$5.0 million and $2.0$2.5 million of revenues, respectively, for the year then ended. Our audit of internal control over financial reporting of the Company also did not include an evaluation of the internal control over financial reporting of EMT, NMSMetenova and FlexBiosys.
A material weakness is a deficiency, or ARTeSYN.
We also have audited, in accordance with the standards of the Public Company Accounting Oversight Board (United States) (PCAOB), the consolidated balance sheets of the Company as of December 31, 20202023 and 2019,2022, the related consolidated statements of comprehensive income, stockholders’stockholders' equity and cash flows for each of the three years in the period ended December 31, 2020,2023, and the related notesnotes. This material weakness was considered in determining the nature, timing and extent of audit tests applied in our audit of the 2023 consolidated financial statements, and this report does not affect our report dated February 24, 202122, 2024, which expressed an unqualified opinion thereon.
Basis for Opinion
The Company’s management is responsible for maintaining effective internal control over financial reporting and for its assessment of the effectiveness of internal control over financial reporting included in the accompanying Report of Management on Internal Control Over Financial Reporting. Our responsibility is to express an opinion on the Company’s internal control over financial reporting based on our audit. We are a public accounting firm registered with the PCAOB and are required to be independent with respect to the Company in accordance with the U.S. federal securities laws and the applicable rules and regulations of the Securities and Exchange Commission and the PCAOB.
We conducted our audit in accordance with the standards of the PCAOB. Those standards require that we plan and perform the audit to obtain reasonable assurance about whether effective internal control over financial reporting was maintained in all material respects.
Our audit included obtaining an understanding of internal control over financial reporting, assessing the risk that a material weakness exists, testing and evaluating the design and operating effectiveness of internal control based on the assessed risk, and performing such other procedures as we considered necessary in the circumstances. We believe that our audit provides a reasonable basis for our opinion.
Definition and Limitations of Internal Control Over Financial Reporting
A company’s internal control over financial reporting is a process designed to provide reasonable assurance regarding the reliability of financial reporting and the preparation of financial statements for external purposes in accordance with generally accepted accounting principles. A company’s internal
58
accordance with generally accepted accounting principles, and that receipts and expenditures of the company are being made only in accordance with authorizations of management and directors of the company; and (3) provide reasonable assurance regarding prevention or timely detection of unauthorized acquisition, use, or disposition of the company’s assets that could have a material effect on the financial statements.
Because of its inherent limitations, internal control over financial reporting may not prevent or detect misstatements. Also, projections of any evaluation of effectiveness to future periods are subject to the risk that controls may become inadequate because of changes in conditions, or that the degree of compliance with the policies or procedures may deteriorate.
/s/ Ernst & Young LLP
Boston, Massachusetts
February 24, 2021
(d) Changes in Internal Control Over Financial Reporting
There have been no changes in our internal control over financial reporting identified in connection with the evaluation required by paragraph (d) of Securities Exchange Act Rule20202023 that have materially affected, or are reasonably likely to materially affect, our internal control over financial reporting.
ITEM 9B. OTHER INFORMATION
Rule 10b5-1 Trading Plans
During the fourth quarter of 2023, Tony J. Hunt, Chief Executive Officer, adopted a trading plan intended to satisfy Rule 10b5-1(c) under the Securities Exchange Act of 1934 ("Exchange Act") on November 9, 2023 to sell up to 78,216 shares of our common stock between March 8, 2024 and November 15, 2024, the date this plan expires. The trading plan will cease upon the earlier of November 15, 2024 or the sale of all shares subject to the trading plan.
During the fourth quarter of 2023, none of our other directors or officers (as defined in Rule 16a-1(f) of the Exchange Act) adopted, modified, or terminated a Rule 10b5-1 trading arrangement.
ITEM 9C. DISCLOSURE REGARDING FOREIGN JURISDICTIONS THAT PREVENT INSPECTIONS
Not applicable.
59
PART III
Pursuant to General Instructions G to Form20212024 Annual Meeting of Stockholders.
60
PART IV
ITEM 15. EXHIBITS AND FINANCIAL STATEMENT SCHEDULES
The following documents are filed as part of this Annual Report on Form10-K:
(a) (1)
The financial statements required by this item are submitted in a separate section beginning on page 6967 of this report, as follows:
Page | ||||
68 | ||||
71 | ||||
72 | ||||
73 | ||||
74 | ||||
75 | ||||
(a) (2)
None.
(a) (3)
The Exhibits which are filed as part of this Form
61
EXHIBIT INDEX
Exhibit Number | Document Description | |
3.1 | ||
| Restated Certificate of Incorporation dated June 30, 1992, as amended September 17, 1999 (filed as Exhibit 3.1 to Repligen Corporation’s Quarterly Report on Form 10-Q for the quarter ended September 30, 1999 and incorporated herein by reference). | ||
3.2 | ||
3.3 | ||
3.4 | ||
4.1 | ||
4.2 | ||
62
10.9* | ||
10.10* | ||
10.11* | ||
10.12* | ||
10.13 | ||
10.14* | ||
19.1 | ||
21.1+ | ||
23.1+ | ||
Consent of Ernst & Young LLP, Independent Registered Accounting Firm. | ||
24.1+ | ||
31.1+ | ||
31.2+ | ||
32.1+ | ||
| Certification Pursuant to 18 U.S.C. Section 1350, as adopted pursuant to Section 906 of the Sarbanes-Oxley Act of 2002. | ||
97.1 | ||
101.INS | Inline XBRL Instance | |
101.SCH | ||
Inline XBRL Taxonomy Extension Schema | ||
104 | ||
Cover | ||
# Confidential treatment obtained as to certain portions.
* Management contract or compensatory plan or arrangement.
+ Filed electronically herewith.
63
The exhibits listed above are not contained in the copy of the Annual Report on Form20212024 Annual Meeting, the Registrant will furnish that person without charge a copy of any exhibits listed above. Requests should be addressed to Repligen Corporation, 41 Seyon Street, Waltham, MA 02453.
ITEM 16. 10-K SUMMARY
We may voluntarily include a summary of information required by Annual Report on Form
64
SIGNATURES
Pursuant to the requirements of Section 13 or 15(d) of the Securities Exchange Act of 1934, the registrant has duly caused this report to be signed on its behalf by the undersigned, thereunto duly authorized.
REPLIGEN CORPORATION | |||||||
Date: February 22, 2024 | By: | /S/ TONY J. HUNT | |||||
Tony J. Hunt Chief Executive Officer | |||||||
65
POWER OF ATTORNEY
KNOW ALL PERSONS BY THESE PRESENTS, that each person whose signature appears below hereby makes, constitutes and appoints Tony J. Hunt and JonJason K. SnodgresGarland with full power to act without the other, his true and lawful
Pursuant to the requirements of the Securities Exchange Act of 1934, this report has been signed below by the following persons on behalf of the registrant and in the capacities and on the dates indicated.
Signature | Title | Date | ||
/S/ TONY J. HUNT Tony J. Hunt | Chief Executive Officer and Director (Principal executive officer) | February | ||
/S/ J Jason K. | Chief Financial Officer (Principal financial and accounting officer) | February | ||
/S/ KAREN DAWES Karen Dawes | Chairperson of the Board | February | ||
/S/ NICOLASM. BARTHELEMY Nicolas M. Barthelemy | Director | February | ||
/S/ CARRIE EGLINTON MANNER Carrie Eglinton Manner | Director | February | ||
/ Konstantin Konstantinov | Director | February | ||
/S/ MARTIN D. MADAUS Martin D. Madaus | Director | February 22, 2024 | ||
/S/ ROHIN MHATRE Rohin Mhatre | Director | February 22, 2024 | ||
/S/ GLENN P. MUIR Glenn P. Muir | Director | February | ||
66
INDEX TO FINANCIAL STATEMENTS
Page | ||||
68 | ||||
71 | ||||
72 | ||||
73 | ||||
74 | ||||
75 | ||||
67
REPORT OF INDEPENDENT REGISTERED PUBLIC ACCOUNTING FIRM
To the Stockholders and the Board of Directors of Repligen Corporation:
Opinion on the Financial Statements
We have audited the accompanying consolidated balance sheets of Repligen Corporation (the Company) as of December 31, 20202023 and 2019, and2022, the related consolidated statements of comprehensive income, stockholders’stockholders' equity and cash flows for each of the three years in the period ended December 31, 2020,2023, and the related notes (collectively referred to as the “consolidated financial statements”). In our opinion, the consolidated financial statements present fairly, in all material respects, the financial position of the Company at December 31, 20202023 and 2019,2022, and the results of its operations and its cash flows for each of the three years in the period ended December 31, 2020,2023, in conformity with U.S. generally accepted accounting principles.
We also have audited, in accordance with the standards of the Public Company Accounting Oversight Board (United States) (PCAOB), the Company’s internal control over financial reporting as of December 31, 2020,2023, based on criteria established in Internal Control-IntegratedControl—Integrated Framework issued by the Committee of the Sponsoring Organizations of the Treadway Commission (2013 framework), and our report dated February 24, 202122, 2024 expressed an unqualifiedadverse opinion thereon.
Adoption of ASU No. 2020-06
As discussed in Note 2 to the consolidated financial statements, the Company changed its method for accounting for convertible debt in 2022 due to the adoption of ASU No. 2020-06, Debt - Debt with Conversion and Other Options (Subtopic 470-20).
Basis for Opinion
These financial statements are the responsibility of the Company‘sCompany's management. Our responsibility is to express an opinion on the Company‘sCompany's financial statements based on our audits. We are a public accounting firm registered with the PCAOB and are required to be independent with respect to the Company in accordance with the USU.S. federal securities laws and the applicable rules and regulations of the Securities and Exchange Commission and the PCAOB.
We conducted our audits in accordance with the standards of the PCAOB. Those standards require that we plan and perform the audit to obtain reasonable assurance about whether the financial statements are free of material misstatement, whether due to error or fraud. Our audits included performing procedures to assess the risks of material misstatement of the financial statements, whether due to error or fraud, and performing procedures that respond to those risks. Such procedures includeincluded examining, on a test basis, evidence regarding the amounts and disclosures in the financial statements. Our audits also included evaluating the accounting principles used and significant estimates made by management, as well as evaluating the overall presentation of the financial statements. We believe that our audits provide a reasonable basis for our opinion.
Critical Audit Matter
The critical audit matters communicated below are matters arising from the current period audit of the financial statements that were communicated or required to be communicated to the audit committee and that: (1) relate to accounts or disclosures that are material to the financial statements and (2) involved our especially challenging, subjective or complex judgments. The communication of critical audit matters does not alter in any way our opinion on the consolidated financial, taken as a whole, and we are not, by communicating the critical audit matters below, providing separate opinions on the critical audit matters or on the accounts or disclosures to which they relate.
Accounting for acquisitions | ||
Description of the Matter | As disclosed in Note | |
68
Auditing the | ||
How We Addressed the Matter in Our Audit | We tested the | |
To test the estimated fair value of the customer relationship and developed technology intangible assets, we performed audit procedures that included, among others, evaluating the | ||
Accounting for convertible notes | ||
Description of the Matter | As disclosed in Note 14 to the consolidated financial statements, during 2023, the Company issued $600.0 million aggregate principal amount of 1.00% Convertible Senior Notes due in 2028 (the “2023 Notes”). The Company privately negotiated exchange and subscription agreements (the “Exchange and Subscription Agreements”) with a limited number of holders of its outstanding 2019 Notes and certain other qualified institutional buyers. Pursuant to the Exchange and Subscription Agreements, the Company exchanged $217.7 million of its 2019 Notes for $309.9 million aggregate principal of the 2023 Notes (the “Exchange Transaction”) and issued $290.1 million aggregate principal amount of the 2023 Notes in a private placement to accredited institutional buyers (the “Subscription Transactions”) for $290.1 million in cash. The Company evaluated the Exchange Transaction for extinguishment or modification accounting and recorded an extinguishment loss of $12.7 million and an aggregate debt discount of $82.1 million related to the settlement of the Exchange Transaction. | |
Auditing the accounting treatment for the 2023 Notes and the Exchange Transaction involved especially challenging and complex auditor judgment and required team members with specialized knowledge and skills in accounting and valuation in order to evaluate the Company’s accounting assessment, and the determination of the related extinguishment loss upon settlement of the Exchange Transaction. | ||
How We Addressed the Matter in Our Audit | We obtained an understanding, evaluated the design and tested the operating effectiveness of the Company’s controls over the issuance of the 2023 Notes and the accounting for the Exchange Transaction, including the valuation of the conversion feature used in the extinguishment test and incorporated into the accounting assessment for the Exchange Transaction to determine the extinguishment loss and debt discount recorded. | |
Our testing of the Company’s accounting for the issuance of the 2023 Notes and Exchange Transaction included, among other procedures, inspection of the underlying Exchange and Subscription Agreements and testing management’s application of the relevant accounting guidance. To test the Exchange Transaction, we evaluated the Company’s extinguishment accounting assessment, including the Company’s determination of the change in fair value of the conversion feature associated with the Exchange Transaction, which included testing the | ||
69
appropriateness of the methodology and underlying assumptions used to determine such fair value. We involved our valuation professionals to assist in our evaluation of the valuation methodology used by the Company and significant assumptions included in the fair value estimate. Also, we tested the Company’s key inputs into the calculation of the extinguishment loss and evaluated the appropriateness of the Company’s disclosures. |
/s/ Ernst & Young LLP
We have served as the Company’s auditor since 2002
Boston, Massachusetts
February 24, 2021
70
REPLIGEN CORPORATION
CONSOLIDATED BALANCE SHEETS
(Amounts in thousands, except share data)
December 31, 2020 | December 31, 2019 | |||||||
Assets | ||||||||
Current assets: | ||||||||
Cash and cash equivalents | $ | 717,292 | $ | 528,392 | ||||
Restricted cash | — | 9,015 | ||||||
Accounts receivable, net of reserves of $762 and $525 at December 31, 2020 and December 31, 2019, respectively | 71,257 | 43,068 | ||||||
Royalties and other receivables | 132 | 148 | ||||||
Unbilled receivables | — | 456 | ||||||
Inventories, net | 95,025 | 54,832 | ||||||
Prepaid expenses and other current assets | 18,676 | 5,917 | ||||||
Total current assets | 902,382 | 641,828 | ||||||
Property, plant and equipment, net | 66,870 | 48,455 | ||||||
Intangible assets, net | 287,100 | 212,552 | ||||||
Goodwill | 618,305 | 468,413 | ||||||
Deferred tax assets | 2,481 | 2,920 | ||||||
Operating lease right of use assets | 25,176 | 25,707 | ||||||
Other assets | 573 | 238 | ||||||
Total assets | $ | 1,902,887 | $ | 1,400,113 | ||||
Liabilities and Stockholders’ Equity | ||||||||
Current liabilities: | ||||||||
Accounts payable | $ | 16,880 | $ | 11,425 | ||||
Operating lease liability | 5,254 | 3,557 | ||||||
Accrued liabilities | 53,085 | 33,331 | ||||||
Convertible senior notes, current portion, net | 243,737 | — | ||||||
Total current liabilities | 318,956 | 48,313 | ||||||
Convertible senior notes, net | — | 232,767 | ||||||
Deferred tax liabilities | 27,032 | 29,944 | ||||||
Operating lease liability, long-term | 26,425 | 26,995 | ||||||
Other liabilities, long-term | 1,324 | 2,326 | ||||||
Total liabilities | 373,737 | 340,345 | ||||||
Commitments and contingencies (Note 11) | 0 | 0 | ||||||
Stockholders’ equity: | ||||||||
Preferred stock, $0.01 par value, 5,000,000 shares authorized, 0 shares issued or outstanding | 0— | 0— | ||||||
Common stock, $0.01 par value; 80,000,000 shares authorized; 54,760,837 shares at December 31, 2020 and 52,078,258 shares at December 31, 2019 issued and outstanding | 548 | 521 | ||||||
Additional paid-in capital | 1,460,748 | 1,068,431 | ||||||
Accumulated other comprehensive income (loss) | 2,085 | (15,027 | ) | |||||
Accumulated earnings | 65,769 | 5,843 | ||||||
Total stockholders’ equity | 1,529,150 | 1,059,768 | ||||||
Total liabilities and stockholders’ equity | $ | 1,902,887 | $ | 1,400,113 | ||||
|
| December 31, |
|
| December 31, |
| ||
|
| 2023 |
|
| 2022 |
| ||
ASSETS |
|
|
|
|
|
| ||
Current assets: |
|
|
|
|
|
| ||
Cash and cash equivalents |
| $ | 751,323 |
|
| $ | 523,458 |
|
Marketable securities held to maturity |
|
| — |
|
|
| 100,299 |
|
Accounts receivable, net of reserves of $2,122 and $1,365 at |
|
| 124,161 |
|
|
| 116,247 |
|
Inventories, net |
|
| 202,321 |
|
|
| 238,277 |
|
Prepaid expenses and other current assets |
|
| 33,238 |
|
|
| 19,837 |
|
Total current assets |
|
| 1,111,043 |
|
|
| 998,118 |
|
Noncurrent assets: |
|
|
|
|
|
| ||
Property, plant and equipment, net |
|
| 207,440 |
|
|
| 190,673 |
|
Intangible assets, net |
|
| 400,486 |
|
|
| 353,676 |
|
Goodwill |
|
| 987,120 |
|
|
| 855,513 |
|
Deferred tax assets |
|
| 1,530 |
|
|
| 840 |
|
Operating lease right of use assets |
|
| 115,515 |
|
|
| 125,023 |
|
Other noncurrent assets |
|
| 1,277 |
|
|
| 815 |
|
Total noncurrent assets |
|
| 1,713,368 |
|
|
| 1,526,540 |
|
Total assets |
| $ | 2,824,411 |
|
| $ | 2,524,658 |
|
LIABILITIES AND STOCKHOLDERS' EQUITY |
|
|
|
|
|
| ||
Current liabilities: |
|
|
|
|
|
| ||
Accounts payable |
| $ | 19,563 |
|
| $ | 27,554 |
|
Operating lease liability |
|
| 5,631 |
|
|
| 6,957 |
|
Current contingent consideration |
|
| 12,983 |
|
|
| 13,950 |
|
Accrued liabilities |
|
| 50,533 |
|
|
| 71,120 |
|
Convertible Senior Notes due 2024, net |
|
| 69,452 |
|
|
| 284,615 |
|
Total current liabilities |
|
| 158,162 |
|
|
| 404,196 |
|
Noncurrent liabilities: |
|
|
|
|
|
| ||
Convertible Senior Notes due 2028, net |
|
| 510,143 |
|
|
| — |
|
Deferred tax liabilities |
|
| 40,466 |
|
|
| 23,000 |
|
Noncurrent operating lease liability |
|
| 126,578 |
|
|
| 131,389 |
|
Noncurrent contingent consideration |
|
| 14,070 |
|
|
| 51,559 |
|
Other noncurrent liabilities |
|
| 3,789 |
|
|
| 3,814 |
|
Total noncurrent liabilities |
|
| 695,046 |
|
|
| 209,762 |
|
Total liabilities |
|
| 853,208 |
|
|
| 613,958 |
|
Commitments and contingencies (Note 13) |
|
|
|
|
|
| ||
Stockholders' equity: |
|
|
|
|
|
| ||
Preferred stock, $0.01 par value, 5,000,000 shares authorized, no shares |
|
| — |
|
|
| — |
|
Common stock, $0.01 par value; 80,000,000 shares authorized; 55,766,078 |
|
| 558 |
|
|
| 556 |
|
Additional paid-in capital |
|
| 1,569,227 |
|
|
| 1,547,266 |
|
Accumulated other comprehensive loss |
|
| (37,431 | ) |
|
| (34,394 | ) |
Accumulated earnings |
|
| 438,849 |
|
|
| 397,272 |
|
Total stockholders’ equity |
|
| 1,971,203 |
|
|
| 1,910,700 |
|
Total liabilities and stockholders’ equity |
| $ | 2,824,411 |
|
| $ | 2,524,658 |
|
|
|
|
|
|
| |||
The accompanying notes are an integral part of these consolidated financial statements.
71
REPLIGEN CORPORATION
CONSOLIDATED STATEMENTS OF COMPREHENSIVE INCOME
(Amounts in thousands, except per share data)
For the Years Ended December 31, | ||||||||||||
2020 | 2019 | 2018 | ||||||||||
Revenue: | ||||||||||||
Products | $ | 366,136 | $ | 270,097 | $ | 193,891 | ||||||
Royalty and other revenue | 124 | 148 | 141 | |||||||||
Total revenue | 366,260 | 270,245 | 194,032 | |||||||||
Costs and operating expenses: | ||||||||||||
Cost of product revenue | 156,634 | 119,099 | 86,531 | |||||||||
Research and development | 20,182 | 19,450 | 15,821 | |||||||||
Selling, general and administrative | 119,621 | 95,613 | 65,692 | |||||||||
Total costs and operating expenses | 296,437 | 234,162 | 168,044 | |||||||||
Income from operations | 69,823 | 36,083 | 25,988 | |||||||||
Other (expenses) income: | ||||||||||||
Investment income | 1,741 | 5,324 | 1,895 | |||||||||
Loss on extinguishment of debt | — | (5,650 | ) | — | ||||||||
Interest expense | (12,133 | ) | (9,292 | ) | (6,709 | ) | ||||||
Other (expenses) income | (214 | ) | (314 | ) | 262 | |||||||
Other expenses, net | (10,606 | ) | (9,932 | ) | (4,552 | ) | ||||||
Income before income taxes | 59,217 | 26,151 | 21,436 | |||||||||
Income tax (benefit) provision | (709 | ) | 4,740 | 4,819 | ||||||||
Net income | $ | 59,926 | $ | 21,411 | $ | 16,617 | ||||||
Earnings per share: | ||||||||||||
Basic | $ | 1.14 | $ | 0.44 | $ | 0.38 | ||||||
Diluted | $ | 1.11 | $ | 0.44 | $ | 0.37 | ||||||
Weighted average common shares outstanding: | ||||||||||||
Basic | 52,554 | 48,343 | 43,767 | |||||||||
Diluted | 53,892 | 49,206 | 45,471 | |||||||||
Net income | $ | 59,926 | $ | 21,411 | $ | 16,617 | ||||||
Other comprehensive income (loss): | ||||||||||||
Foreign currency translation adjustment | 17,112 | (3,134 | ) | (5,530 | ) | |||||||
Comprehensive income | $ | 77,038 | $ | 18,277 | $ | 11,087 | ||||||
|
| For the Years Ended December 31, |
| |||||||||
|
| 2023 |
|
| 2022 |
|
| 2021 |
| |||
Revenue: |
|
|
|
|
|
|
|
|
| |||
Products |
| $ | 638,381 |
|
| $ | 801,183 |
|
| $ | 670,319 |
|
Royalty and other revenue |
|
| 383 |
|
|
| 353 |
|
|
| 215 |
|
Total revenue |
|
| 638,764 |
|
|
| 801,536 |
|
|
| 670,534 |
|
Costs and operating expenses: |
|
|
|
|
|
|
|
|
| |||
Cost of product revenue |
|
| 353,922 |
|
|
| 345,830 |
|
|
| 279,280 |
|
Research and development |
|
| 42,722 |
|
|
| 43,936 |
|
|
| 34,274 |
|
Selling, general and administrative |
|
| 218,113 |
|
|
| 215,829 |
|
|
| 183,866 |
|
Contingent consideration |
|
| (30,569 | ) |
|
| (28,729 | ) |
|
| 5,865 |
|
Total costs and operating expenses |
|
| 584,188 |
|
|
| 576,866 |
|
|
| 503,285 |
|
Income from operations |
|
| 54,576 |
|
|
| 224,670 |
|
|
| 167,249 |
|
Other income (expenses): |
|
|
|
|
|
|
|
|
| |||
Investment income |
|
| 24,135 |
|
|
| 6,978 |
|
|
| 176 |
|
Interest expense |
|
| (1,951 | ) |
|
| (1,162 | ) |
|
| (11,278 | ) |
Loss on extinguishment of debt |
|
| (12,676 | ) |
|
| — |
|
|
| — |
|
Amortization of debt issuance costs |
|
| (8,075 | ) |
|
| (1,815 | ) |
|
| (1,436 | ) |
Other income (expenses) |
|
| 8,123 |
|
|
| (9,531 | ) |
|
| (1,168 | ) |
Other income (expenses), net |
|
| 9,556 |
|
|
| (5,530 | ) |
|
| (13,706 | ) |
Income before income taxes |
|
| 64,132 |
|
|
| 219,140 |
|
|
| 153,543 |
|
Income tax provision |
|
| 22,555 |
|
|
| 33,181 |
|
|
| 25,252 |
|
Net income |
| $ | 41,577 |
|
| $ | 185,959 |
|
| $ | 128,291 |
|
Earnings per share: |
|
|
|
|
|
|
|
|
| |||
Basic |
| $ | 0.75 |
|
| $ | 3.35 |
|
| $ | 2.33 |
|
Diluted |
| $ | 0.74 |
|
| $ | 3.24 |
|
| $ | 2.24 |
|
Weighted average common shares outstanding: |
|
|
|
|
|
|
|
|
| |||
Basic |
|
| 55,720 |
|
|
| 55,460 |
|
|
| 55,015 |
|
Diluted |
|
| 56,377 |
|
|
| 57,455 |
|
|
| 57,264 |
|
|
|
|
|
|
|
|
|
|
| |||
Net income |
| $ | 41,577 |
|
| $ | 185,959 |
|
| $ | 128,291 |
|
Other comprehensive income (loss): |
|
|
|
|
|
|
|
|
| |||
Foreign currency translation adjustment |
|
| (3,037 | ) |
|
| (17,508 | ) |
|
| (18,971 | ) |
Comprehensive income |
| $ | 38,540 |
|
| $ | 168,451 |
|
| $ | 109,320 |
|
The accompanying notes are an integral part of these consolidated financial statements.
72
REPLIGEN CORPORATION
CONSOLIDATED STATEMENTS OF STOCKHOLDERS’ EQUITY
(Amounts in thousands, except share data)
Common Stock | Additional Paid-In Capital | Accumulated Other Comprehensive Income (Loss) | Accumulated Earnings/ (Deficit) | Total Stockholders’ Equity | ||||||||||||||||||||
Number of Shares(#) | Par Value | |||||||||||||||||||||||
Balance at December 31, 2017 | 43,587,079 | $ | 436 | $ | 628,983 | $ | (6,363 | ) | $ | (31,508 | ) | $ | 591,548 | |||||||||||
Net income | — | — | — | — | 16,617 | 16,617 | ||||||||||||||||||
Issuance of common stock for debt conversion | 2 | 0 | 0 | — | — | 0 | ||||||||||||||||||
Exercise of stock options and vesting of stock units | 330,297 | 3 | 3,415 | — | — | 3,418 | ||||||||||||||||||
Stock-based compensation expense | — | — | 10,192 | — | — | 10,192 | ||||||||||||||||||
Cumulative effect of accounting changes | — | — | — | — | (677 | ) | (677 | ) | ||||||||||||||||
Translation adjustment | — | — | — | (5,530 | ) | — | (5,530 | ) | ||||||||||||||||
Balance at December 31, 2018 | 43,917,378 | $ | 439 | $ | 642,590 | $ | (11,893 | ) | $ | (15,568 | ) | $ | 615,568 | |||||||||||
Net income | — | — | — | — | 21,411 | 21,411 | ||||||||||||||||||
Issuance of common stock for debt conversion | 2,316,229 | 23 | 198,734 | — | — | 198,757 | ||||||||||||||||||
Reduction of equity component from debt conversion, net of tax | — | — | (200,079 | ) | — | — | (200,079 | ) | ||||||||||||||||
Exercise of stock options and vesting of stock units | 339,329 | 3 | 1,164 | — | — | 1,167 | ||||||||||||||||||
Issuance of common stock pursuant to the acquisition of C Technologies, Inc. | 779,221 | 8 | 53,930 | — | — | 53,938 | ||||||||||||||||||
Tax withholding on vesting of restricted stock | (5,430 | ) | (0 | ) | (490 | ) | — | — | (490 | ) | ||||||||||||||
Equity component of 0.375% senior convertible notes, net of tax | — | — | 39,070 | — | — | 39,070 | ||||||||||||||||||
Proceeds from issuance of common stock, net of issuance costs of $18,607 | 4,731,531 | 48 | 320,665 | — | — | 320,713 | ||||||||||||||||||
Stock-based compensation expense | — | — | 12,847 | — | — | 12,847 | ||||||||||||||||||
Translation adjustment | — | — | — | (3,134 | ) | — | (3,134 | ) | ||||||||||||||||
Balance at December 31, 2019 | 52,078,258 | $ | 521 | $ | 1,068,431 | $ | (15,027 | ) | $ | 5,843 | $ | 1,059,768 | ||||||||||||
Net income | — | — | — | — | 59,926 | 59,926 | ||||||||||||||||||
Exercise of stock options and vesting of stock units | 584,589 | 6 | 8,134 | — | — | 8,140 | ||||||||||||||||||
Issuance of common stock pursuant to the acquisition of ARTeSYN Biosolutions | 372,990 | 4 | 69,418 | — | — | 69,422 | ||||||||||||||||||
Proceeds from issuance of common stock, net of issuance costs of $0.4 million | 1,725,000 | 17 | 297,758 | — | — | 297,775 | ||||||||||||||||||
Stock-based compensation expense | — | — | 17,007 | — | — | 17,007 | ||||||||||||||||||
Translation adjustment | — | — | — | 17,112 | — | 17,112 | ||||||||||||||||||
Balance at December 31, 2020 | 54,760,837 | $ | 548 | $ | 1,460,748 | $ | 2,085 | $ | 65,769 | $ | 1,529,150 | |||||||||||||
|
| Common Stock |
|
|
|
|
|
|
|
|
|
|
|
|
| |||||||||
|
| Number of |
|
| Par |
|
| Additional |
|
| Accumulated |
|
| Accumulated |
|
| Total |
| ||||||
Balance at December 31, 2020 |
|
| 54,760,837 |
|
| $ | 548 |
|
| $ | 1,460,748 |
|
| $ | 2,085 |
|
| $ | 65,769 |
|
| $ | 1,529,150 |
|
Net income |
|
| — |
|
|
| — |
|
|
| — |
|
|
| — |
|
|
| 128,291 |
|
|
| 128,291 |
|
Issuance of common stock for debt |
|
| 7 |
|
|
| 0 |
|
|
| 2 |
|
|
| — |
|
|
| — |
|
|
| 2 |
|
Exercise of stock options and vesting |
|
| 300,721 |
|
|
| 3 |
|
|
| 3,876 |
|
|
| — |
|
|
| — |
|
|
| 3,879 |
|
Issuance of common stock pursuant to the acquisition |
|
| 271,096 |
|
|
| 2 |
|
|
| 82,966 |
|
|
| — |
|
|
| — |
|
|
| 82,968 |
|
Tax withholding on vesting of |
|
| (11,204 | ) |
|
| (0 | ) |
|
| (2,897 | ) |
|
| — |
|
|
| — |
|
|
| (2,897 | ) |
Stock-based compensation expense |
|
| — |
|
|
| — |
|
|
| 27,500 |
|
|
| — |
|
|
| — |
|
|
| 27,500 |
|
True-up of costs related to the December 2020 |
|
| — |
|
|
| — |
|
|
| 145 |
|
|
| — |
|
|
| — |
|
|
| 145 |
|
Translation adjustment |
|
| — |
|
|
| — |
|
|
| — |
|
|
| (18,971 | ) |
|
| — |
|
|
| (18,971 | ) |
Balance at December 31, 2021 |
|
| 55,321,457 |
|
| $ | 553 |
|
| $ | 1,572,340 |
|
| $ | (16,886 | ) |
| $ | 194,060 |
|
| $ | 1,750,067 |
|
Net income |
|
| — |
|
|
| — |
|
|
| — |
|
|
| — |
|
|
| 185,959 |
|
|
| 185,959 |
|
Issuance of common stock for debt |
|
| 21 |
|
|
| 1 |
|
|
| (7 | ) |
|
| — |
|
|
| — |
|
|
| (6 | ) |
Exercise of stock options and vesting |
|
| 326,192 |
|
|
| 3 |
|
|
| 3,704 |
|
|
| — |
|
|
| — |
|
|
| 3,707 |
|
Tax withholding on vesting of |
|
| (89,972 | ) |
|
| (1 | ) |
|
| (17,017 | ) |
|
| — |
|
|
| — |
|
|
| (17,018 | ) |
Stock-based compensation expense |
|
| — |
|
|
| — |
|
|
| 27,316 |
|
|
| — |
|
|
| — |
|
|
| 27,316 |
|
Impact of the adoption of ASU 2020-06 |
|
| — |
|
|
| — |
|
|
| (39,070 | ) |
|
| — |
|
|
| 17,253 |
|
|
| (21,817 | ) |
Translation adjustment |
|
| — |
|
|
| — |
|
|
| — |
|
|
| (17,508 | ) |
|
| — |
|
|
| (17,508 | ) |
Balance at December 31, 2022 |
|
| 55,557,698 |
|
| $ | 556 |
|
| $ | 1,547,266 |
|
| $ | (34,394 | ) |
| $ | 397,272 |
|
| $ | 1,910,700 |
|
Net income |
|
| — |
|
|
| — |
|
|
| — |
|
|
| — |
|
|
| 41,577 |
|
|
| 41,577 |
|
Issuance of common stock for debt |
|
| 8 |
|
|
| 0 |
|
|
| (13 | ) |
|
| — |
|
|
| — |
|
|
| (13 | ) |
Exercise of stock options and vesting |
|
| 251,886 |
|
|
| 3 |
|
|
| 1,073 |
|
|
| — |
|
|
| — |
|
|
| 1,076 |
|
Repurchase of common stock |
|
| (92,090 | ) |
|
| (1 | ) |
|
| (14,385 | ) |
|
| — |
|
|
| — |
|
|
| (14,386 | ) |
Tax withholding on vesting of |
|
| (77,759 | ) |
|
| (1 | ) |
|
| (13,226 | ) |
|
| — |
|
|
| — |
|
|
| (13,227 | ) |
Issuance of common stock pursuant to the |
|
| 31,415 |
|
|
| 0 |
|
|
| 5,465 |
|
|
| — |
|
|
| — |
|
|
| 5,465 |
|
Issuance of common stock pursuant to the |
|
| 52,299 |
|
|
| 1 |
|
|
| 8,103 |
|
|
| — |
|
|
| — |
|
|
| 8,104 |
|
Issuance of common stock pursuant to the Avitide, |
|
| 42,621 |
|
|
| 0 |
|
|
| 7,229 |
|
|
| — |
|
|
| — |
|
|
| 7,229 |
|
Stock-based compensation expense |
|
| — |
|
|
| — |
|
|
| 25,575 |
|
|
| — |
|
|
| — |
|
|
| 25,575 |
|
Convertible note modification |
|
| — |
|
|
| — |
|
|
| 2,791 |
|
|
| — |
|
|
| — |
|
|
| 2,791 |
|
Deferred tax impact on conversion feature |
|
| — |
|
|
| — |
|
|
| (651 | ) |
|
| — |
|
|
| — |
|
|
| (651 | ) |
Translation adjustment |
|
| — |
|
|
| — |
|
|
| — |
|
|
| (3,037 | ) |
|
| — |
|
|
| (3,037 | ) |
Balance at December 31, 2023 |
|
| 55,766,078 |
|
| $ | 558 |
|
| $ | 1,569,227 |
|
| $ | (37,431 | ) |
| $ | 438,849 |
|
| $ | 1,971,203 |
|
|
|
|
|
|
|
|
|
|
|
|
|
|
|
|
|
|
|
| ||||||
The accompanying notes are an integral part of these consolidated financial statements.
73
REPLIGEN CORPORATION
CONSOLIDATED STATEMENTS OF CASH FLOWS
(Amounts in thousands)
For the Years Ended December 31, | ||||||||||||
2020 | 2019 | 2018 | ||||||||||
Cash flows from operating activities: | ||||||||||||
Net income | $ | 59,926 | $ | 21,411 | $ | 16,617 | ||||||
Adjustments to reconcile net income to net cash provided by operating activities: | ||||||||||||
Depreciation and amortization | 27,067 | 20,868 | 15,778 | |||||||||
Amortization of debt discount and issuance costs | 10,970 | 7,536 | 4,248 | |||||||||
Stock-based compensation expense | 17,007 | 12,847 | 10,192 | |||||||||
Deferred income taxes, net | (3,992 | ) | (624 | ) | 71 | |||||||
Loss on extinguishment of debt | — | 5,650 | — | |||||||||
Other | 267 | 663 | (3 | ) | ||||||||
Changes in operating assets and liabilities, excluding impact of acquisitions: | ||||||||||||
Accounts receivable | (21,020 | ) | (7,726 | ) | (6,101 | ) | ||||||
Royalties and other receivables | 128 | (104 | ) | 7 | ||||||||
Unbilled receivables | 456 | 2,146 | (2,602 | ) | ||||||||
Inventories | (29,260 | ) | (9,314 | ) | (4,042 | ) | ||||||
Prepaid expenses and other assets | (4,870 | ) | (595 | ) | (1,769 | ) | ||||||
Operating lease right of use assets | 3,583 | (4,662 | ) | — | ||||||||
Other assets | (281 | ) | (66 | ) | — | |||||||
Accounts payable | 2,462 | 662 | 2,266 | |||||||||
Accrued expenses | 1,037 | 13,096 | (1,398 | ) | ||||||||
Operating lease liability | (1,964 | ) | 5,447 | — | ||||||||
Long-term liabilities | 1,109 | (19 | ) | (494 | ) | |||||||
Total cash provided by operating activities | 62,625 | 67,216 | 32,770 | |||||||||
Cash flows from investing activities: | ||||||||||||
Additions to capitalized software costs | (3,889 | ) | (4,650 | ) | (2,147 | ) | ||||||
Developed technology intangible asset payment | — | — | (1,255 | ) | ||||||||
Acquisitions, net of cash acquired | (175,041 | ) | (182,154 | ) | — | |||||||
Purchases of property, plant and equipment | (22,455 | ) | (18,504 | ) | (10,635 | ) | ||||||
Total cash used in investing activities | (201,385 | ) | (205,308 | ) | (14,037 | ) | ||||||
Cash flows from financing activities: | ||||||||||||
Proceeds from issuance of senior convertible notes, net of issuance costs | — | 278,466 | — | |||||||||
Proceeds from issuance of common stock, net of issuance costs | 297,775 | 320,713 | — | |||||||||
Exercise of stock options | 8,151 | 1,167 | 3,418 | |||||||||
Repayment of senior convertible notes | — | (114,989 | ) | (11 | ) | |||||||
Payment of tax withholding obligation on vesting of restricted stock | (10 | ) | (490 | ) | — | |||||||
Total cash provided by financing activities | 305,916 | 484,867 | 3,407 | |||||||||
Effect of exchange rate changes on cash, cash equivalents and restricted cash | 12,729 | (3,190 | ) | (2,077 | ) | |||||||
Net increase in cash, cash equivalents and restricted cash | 179,885 | 343,585 | 20,063 | |||||||||
Cash, cash equivalents and restricted cash, beginning of period | 537,407 | 193,822 | 173,759 | |||||||||
Cash, cash equivalents and restricted cash, end of period | $ | 717,292 | $ | 537,407 | $ | 193,822 | ||||||
Supplemental disclosure of cash flow information: | ||||||||||||
Income taxes paid | $ | 10,279 | $ | 6,505 | $ | 4,046 | ||||||
Interest paid | $ | 1,066 | $ | 1,484 | $ | 2,444 | ||||||
Supplemental disclosure of non-cash investing and financing activities: | ||||||||||||
Assets acquired under operating leases | $ | 3,349 | $ | 8,663 | $ | — | ||||||
Fair value of 372,990 shares of common stock issued for acquisition of ARTeSYN Biosolutions Holdings Ireland Limited | $ | 69,422 | $ | — | $ | — | ||||||
Fair value of 2,316,229 shares of common stock issued for conversion of convertible notes | $ | — | $ | 198,757 | $ | — | ||||||
Fair value of common stock issued for acquisition of C Technologies, Inc. | $ | — | $ | 53,938 | $ | — | ||||||
Non-cash effect of adoption of ASU2016-16 | $ | — | $ | — | $ | 5,609 | ||||||
Property, plant and equipment related to lease incentives | $ | — | $ | — | $ | 2,270 | ||||||
|
| For the Years Ended December 31, |
| |||||||||
|
| 2023 |
|
| 2022 |
|
| 2021 |
| |||
Cash flows from operating activities: |
|
|
|
|
|
|
|
|
| |||
Net income |
| $ | 41,577 |
|
| $ | 185,959 |
|
| $ | 128,291 |
|
Adjustments to reconcile net income to net cash provided by operating activities: |
|
|
|
|
|
|
|
|
| |||
Inventory step-up charges |
|
| 1,238 |
|
|
| — |
|
|
| 2,130 |
|
Depreciation and amortization |
|
| 68,085 |
|
|
| 50,985 |
|
|
| 38,447 |
|
Amortization of debt discount and issuance costs |
|
| 2,448 |
|
|
| 1,815 |
|
|
| 11,530 |
|
Stock-based compensation |
|
| 25,575 |
|
|
| 27,316 |
|
|
| 27,500 |
|
Deferred income taxes, net |
|
| 2,317 |
|
|
| (1,352 | ) |
|
| 6,517 |
|
Contingent consideration |
|
| (30,569 | ) |
|
| (28,729 | ) |
|
| 5,865 |
|
Non-cash interest income |
|
| (2,023 | ) |
|
| — |
|
|
| — |
|
Loss on extinguishment of debt |
|
| 12,676 |
|
|
| — |
|
|
| — |
|
Other |
|
| 1,231 |
|
|
| (100 | ) |
|
| 864 |
|
Changes in operating assets and liabilities, excluding impact of acquisitions: |
|
|
|
|
|
|
|
|
| |||
Accounts receivable |
|
| (3,312 | ) |
|
| (3,596 | ) |
|
| (46,523 | ) |
Inventories |
|
| 40,973 |
|
|
| (57,204 | ) |
|
| (89,781 | ) |
Prepaid expenses and other assets |
|
| (13,030 | ) |
|
| 2,396 |
|
|
| (10,192 | ) |
Operating lease right of use assets |
|
| 14,059 |
|
|
| (24,549 | ) |
|
| (4,315 | ) |
Other assets |
|
| (461 | ) |
|
| (231 | ) |
|
| 430 |
|
Accounts payable |
|
| (9,803 | ) |
|
| (8,197 | ) |
|
| 19,523 |
|
Accrued expenses |
|
| (27,921 | ) |
| (2,019 | ) |
| 23,196 |
| ||
Operating lease liability |
|
| (9,229 | ) |
|
| 28,623 |
|
|
| 6,958 |
|
Long-term liabilities |
|
| 87 |
|
|
| 966 |
|
|
| (1,424 | ) |
Total cash provided by operating activities |
|
| 113,918 |
|
|
| 172,083 |
|
|
| 119,016 |
|
Cash flows from investing activities: |
|
|
|
|
|
|
|
|
| |||
Purchase of marketable securities held to maturity |
|
| — |
|
|
| (100,000 | ) |
|
| — |
|
Redemption of marketable securities |
|
| 102,323 |
|
|
| — |
|
|
| — |
|
Additions to capitalized software costs |
|
| (2,766 | ) |
|
| (3,512 | ) |
|
| (4,187 | ) |
Acquisitions, net of cash acquired |
|
| (186,642 | ) |
|
| — |
|
|
| (149,893 | ) |
Purchases of property, plant and equipment |
|
| (36,222 | ) |
|
| (84,834 | ) |
|
| (67,089 | ) |
Purchase of intellectual property |
|
| — |
|
|
| (45,000 | ) |
|
| — |
|
Other investing activities |
|
| 32 |
|
|
| 110 |
|
|
| — |
|
Total cash used in investing activities |
|
| (123,275 | ) |
|
| (233,236 | ) |
|
| (221,169 | ) |
Cash flows from financing activities: |
|
|
|
|
|
|
|
|
| |||
Repurchase of common stock |
|
| (14,386 | ) |
|
| — |
|
|
| — |
|
Proceeds from issuance of 2023 Convertible Senior Notes |
|
| 290,094 |
|
|
| — |
|
|
| — |
|
Proceeds from exercise of stock options |
|
| 1,076 |
|
|
| 3,707 |
|
|
| 3,879 |
|
Payment of debt issuance costs |
|
| (7,253 | ) |
|
| — |
|
|
| — |
|
Payment of tax withholding obligation on vesting of restricted stock |
|
| (13,227 | ) |
|
| (17,018 | ) |
|
| (2,897 | ) |
Payment of earnout consideration |
|
| (7,298 | ) |
|
| — |
|
|
| — |
|
Other financing activities |
|
| (45 | ) |
|
| (26 | ) |
|
| (21 | ) |
Total cash provided by (used in) financing activities |
|
| 248,961 |
|
|
| (13,337 | ) |
|
| 961 |
|
Effect of exchange rate changes on cash and cash equivalents |
|
| (11,739 | ) |
|
| (5,866 | ) |
|
| (12,286 | ) |
Net increase (decrease) in cash and cash equivalents |
|
| 227,865 |
|
|
| (80,356 | ) |
|
| (113,478 | ) |
Cash and cash equivalents, beginning of period |
|
| 523,458 |
|
|
| 603,814 |
|
|
| 717,292 |
|
Cash and cash equivalents, end of period |
| $ | 751,323 |
|
| $ | 523,458 |
|
| $ | 603,814 |
|
Supplemental disclosure of cash flow information: |
|
|
|
|
|
|
|
|
| |||
Income taxes paid |
| $ | 26,963 |
|
| $ | 34,365 |
|
| $ | 16,515 |
|
Interest paid |
| $ | 988 |
|
| $ | 1,033 |
|
| $ | 1,066 |
|
Supplemental disclosure of non-cash investing and financing activities: |
|
|
|
|
|
|
|
|
| |||
Assets acquired under operating leases |
| $ | 4,335 |
|
| $ | 29,126 |
|
| $ | 85,312 |
|
Fair value of shares of common stock issued for acquisitions |
| $ | 13,569 |
|
| $ | — |
|
| $ | 82,968 |
|
Fair value of shares of common stock issued for contingent consideration earnouts |
| $ | 7,229 |
|
| $ | — |
|
| $ | — |
|
Acquisition date fair value of contingent consideration earnouts |
| $ | 6,640 |
|
| $ | — |
|
| $ | 88,373 |
|
Issuance of 2023 Notes in exchange of 2019 Notes |
| $ | 42,179 |
|
| $ | — |
|
| $ | — |
|
Extinguished 2019 Notes |
| $ | 29,634 |
|
| $ | — |
|
| $ | — |
|
The accompanying notes are an integral part of these consolidated financial statements.
74
REPLIGEN CORPORATION
NOTES TO CONSOLIDATED FINANCIAL STATEMENTS
Repligen Corporation (NASDAQ:RGEN) is a global life sciences company that develops and commercializes highly innovative bioprocessing technologies and systems that increase efficiencies and flexibility in the process of manufacturing biological drugs. The Company’s franchises include Filtration (XCell ATF™systems, TangenX™SIUS™flat sheet cassettes, Spectrum®Hollow Fibers, KrosFlo®Systemsfiltration, chromatography, process analytics and ProConnex®single-useflow path assemblies)proteins. See Part I, Item 1. “Business - Our Products”, Chromatography (OPUS®Columns, chromatography resins, ELISA kits), Process Analytics (SoloVPE®and FlowVPE®), and Proteins (Protein A affinity ligands and cell culture growth factors).of this report for additional information related to the Company's products. The Company’s bioprocessing products are sold to major life sciences companies, biopharmaceutical development companies and contract manufacturing organizations worldwide. The Company operates under one reportable segment. The Company’s chief operating decision maker (“CODM”), its Chief Executive Officer (“CEO”), reviews financial information presented on a consolidated basis for purposes of allocating resources and evaluating financial performance. See Note 2,
A majority of our 15 key19 manufacturing sites are located in the United States (California, Massachusetts, New Hampshire, New Jersey, New York and New York)Texas). Outside the United States, we have manufacturing sites in Estonia, France, Germany, Ireland, the Netherlands and Sweden.
The Company is subject to a number of risks typically associated with companies in the biotechnology industry. These risks principally include the Company’s dependence on key customers, development by the Company or its competitors of new technological innovations, dependence on key personnel, protection of proprietary technology, compliance with the FDAU.S. Food and Drug Association and other governmental regulations and approval requirements, as well as the ability to grow the Company’s business and obtain adequate funding to finance this growth.
Use of Estimates
The preparation of financial statements in conformity with accounting principles generally accepted in the United States (“GAAP”) requires management to make estimates and assumptions that affect the reported amounts of assets and liabilities and disclosure of contingent assets and liabilities at the date of the financial statements and the reported amounts of revenues and expenses during the reporting periods.
Significant estimates and assumptions by management affect the Company’s revenue recognition for multiple element arrangements, allowance for credit losses, the net realizable value of inventory, valuations and purchase price allocations related to business combinations, expected future cash flows including growth rates, discount rates, terminal values and other assumptions and estimates used to evaluate the recoverability of long-lived assets,contingent consideration, estimated fair values of intangible assets and goodwill, amortization methods and periods, warranty reserves, certain accrued expenses, estimates related to the fair value of the conversion features of the convertible notes for purposes of assessing whether debt extinguishment or modification accounting applies to the Company’s debt exchange, stock-based compensation, tax reserves and recoverability of the Company’s net deferred tax assets and related valuation allowance.
Although the Company regularly assesses these estimates, actual results could differ materially from these estimates. Changes in estimates are recorded in the period in which they become known. The Company bases its estimates on historical experience and various other assumptions that it believes to be reasonable under the circumstances.
Basis of Presentation
The consolidated financial statements include the accounts of the Company and its wholly-owned subsidiaries, Repligen Sweden AB, Repligen GmbH, Spectrum®LifeSciences LLC and its subsidiaries (“Spectrum”), C Technologies, Inc. (“C Technologies”), Engineered Molding Technology LLC (“EMT”),Non-MetallicSolutions, Inc. (“NMS”), ARTeSYN Biosolutions Holdings Ireland Limited (“ARTeSYN”) and Repligen Singapore Pte. Ltd.subsidiaries. All significant intercompany accounts and transactions have been eliminated in consolidation. Certain prior year balances have changed to reflect current year presentation.
75
Foreign Currency
The Company translates the assets and liabilities of its foreign subsidiary at rates in effect at the end of the reporting period. Revenues and expenses are translated at average rates in effect during the reporting period. Translation adjustments includinginclude adjustments related to the Company’s various intercompany loanloans with Repligen Sweden AB and Repligen Sweden AB’s intercompany loan with Repligen GmbH,foreign subsidiaries. Intercompany loans determined to be permanent are remeasured at each period end and included in accumulated other comprehensive loss.loss on the consolidated balance sheets. Intercompany loans with foreign subsidiaries determined to be repayable are remeasured at each period end and included in other income (expenses) on the consolidated statements of comprehensive income.
Revenue Recognition
The Company generates revenue from the sale of bioprocessing products, equipment devices, and related consumables used with these equipment devices to customers in the life sciences and biopharmaceutical industries. Under Accounting Standard Codification No. (“ASC”) 606, “Revenue from Contracts with Customers,” revenue is recognized when, or as, obligations under the terms of a contract are satisfied, which occurs when control of the promised products or services is transferred to customers. Revenue is measured as the amount of consideration the Company expects to receive in exchange for transferring products or services to a customer (“transaction price”). To the extent the transaction price includes variable consideration, the Company estimates the amount of variable consideration that should be included in the transaction price utilizing the expected value method or the most likely amount method, depending on the facts and circumstances relative to the contract. Variable consideration is included in the transaction price if, in the Company’s judgment, it is probable that a significant future reversal of cumulative revenue under the contract will not occur. Estimates of variable consideration and determination of whether to include estimated amounts in the transaction price are based largely on an assessment of the Company’s anticipated performance and all information (historical, current and forecasted) that is reasonably available. Sales, value add, and other taxes collected on behalf of third parties are excluded from revenue.
When determining the transaction price of a contract, an adjustment is made if payment from a customer occurs either significantly before or significantly after performance, resulting in a significant financing component. Applying the practical expedient in paragraph 606-10-32-18, the Company does not assess whether a significant financing component exists if the period between when the Company performs its obligations under the contract and when the customer pays is one year or less. None of the Company’s contracts contained a significant financing component as of December 31, 2023.
Contracts with customers may contain multiple performance obligations. For such arrangements, the transaction price is allocated to each performance obligation based on the estimated relative standalone selling prices of the promised products or services underlying each performance obligation. The Company determines standalone selling prices based on the price at which the performance obligation is sold separately. If the standalone selling price is not observable through past transactions, the Company estimates the standalone selling price taking into account available information such as market conditions and internally approved pricing guidelines related to the performance obligations.
The Company recognizes product revenue under the terms of each customer agreement upon transfer of control to the customer, which occurs at a point in time.
Shipping and handling fees are recorded as a component of product revenue, with the associated costs recorded as a component of cost of product revenue.
Risks and Uncertainties
The Company evaluates its operations periodically to determine if any risks and uncertainties exist that could impact its operations in the near term. The Company does not believe that there are any significant risks that have not already been disclosed in the consolidated financial statements. A loss of certain suppliers could temporarily disrupt operations, although alternate sources of supply exist for these items. The Company has mitigated these risks by working closely with key suppliers, identifying alternate sources and developing contingency plans.
76
Cash, Cash Equivalents and Restricted Cash
Cash and cash equivalents include cash on hand and on deposit. Highly liquid investments in money market mutual funds with an original maturity of three months or less are classified as cash equivalents. All cash equivalents are carried at cost, which approximates fair value. Restricted cash represents cash that is restricted as to withdrawal or usage. There was no restriction on the Company’s cash balance as of December 31, 2023 and 2022.
The Company’s cash, cash equivalents and restricted cash total as presented in the Company’s consolidated statements of cash flows for the years ended December 31, 2023, 2022 and 2021 was $751.3 million, $523.5 million and $603.8 million, respectively.
Investment Securities
We classify our investment securities in one of three categories: held to maturity, trading, or available for sale. Our investment portfolio at December 31, 2022 consisted of an investment in U.S. treasury bills classified as held to maturity which was included in the Company's consolidated balance sheets under marketable securities held to maturity. These marketable securities matured in June 2023 and there are no comparable investments as of December 31, 2023. Securities that we have the positive intent and ability to hold to maturity are classified as held to maturity and stated at amortized cost in the consolidated balance sheets. Management determines the appropriate classification of securities at the time of purchase based upon management's intent with regards to such investment and reevaluates such designation as of each balance sheet date. The Company's investment policy requires that it only invest in high-rated securities and limit its exposure to any single-user. There were no realized or unrealized gains or losses on investments recorded as of December 31, 2023, 2022 and 2021.
The Company classifies marketable securities as short-term when they have remaining contractual maturities of one year or less from the balance sheet date. The Company periodically assesses its marketable securities, if any, for impairment or credit losses.
Fair Value Measurement
In determining the fair value of its assets and liabilities, the Company uses various valuation approaches. The Company employs a hierarchy for inputs used in measuring fair value that maximizes the use of observable inputs and minimizes the use of unobservable inputs by requiring that observable inputs be used when available. Observable inputs are inputs that market participants would use in pricing the asset or liability based on market data obtained from sources independent of the Company. Unobservable inputs are inputs that reflect the Company’s assumptions about the inputs that market participants would use in pricing the asset or liability and are developed based on the best information available in the circumstances. The fair value hierarchy is broken down into three levels based on the source of inputs as follows:
Level 1 – | Valuations based on unadjusted quoted prices in active markets for identical assets or liabilities that the Company has the ability to access. |
Level 2 – | Valuations based on quoted prices for similar assets or liabilities in active markets, quoted prices for identical or similar assets or liabilities. |
Level 3 – | Valuations based on inputs that are unobservable and significant to the overall fair value measurement. |
The availability of observable inputs can vary among the various types of financial assets and liabilities. To the extent that the valuation is based on models or inputs that are less observable or unobservable in the market, the determination of fair value requires more judgment. In certain cases, the inputs used to measure fair value may fall into different levels of the fair value hierarchy. In such cases, for financial statement disclosure purposes, the level in the fair value hierarchy within which the fair value measurement is categorized is based on the lowest level input that is significant to the overall fair value measurement.
77
Allowance for credit losses
We establish an allowance for credit losses through a review of several factors, including historical collection experience, current aging status of the customer accounts, and current financial condition of our customers. Losses are charged against the allowance when the customer accounts are determined to be uncollectible.
Inventories
Inventories relate to the Company’s bioprocessing business. The Company values inventory at cost or, if lower, net realizable value, using the first-in, first-out method. The Company reviews its inventories at least quarterly and records a provision for excess and obsolete inventory based on its estimates of expected sales volume, production capacity and expiration dates of raw materials, work-in-process and finished products. The Company writes down inventory that has become obsolete, inventory that has a cost basis in excess of its expected net realizable value, and inventory in excess of expected requirements to cost of product revenue. Manufacturing of bioprocessing finished goods is done to order and tested for quality specifications prior to shipment.
A change in the estimated timing or amount of demand for the Company’s products could result in additional provisions for excess inventory quantities on hand. Any significant unanticipated changes in demand or unexpected quality failures could have a significant impact on the value of inventory and reported operating results. During all periods presented in the accompanying consolidated financial statements, there have been no material adjustments related to a revised estimate of inventory valuations.
Work-in-process and finished products inventories consist of material, labor, outside processing costs and manufacturing overhead.
Lease Accounting
The Company adopted Accounting Standards Update No. (“ASU”) 2016-02, “Leases (Topic 842)” (“ASC 842”) as of January 1, 2019. Under ASC 842, the Company determines whether the arrangement contains a lease at the inception of an arrangement. If a lease is identified in an arrangement, the Company recognizes a right-of-use asset and liability on its consolidated balance sheets and determines whether the lease should be classified as a finance or operating lease. The Company does not recognize assets or liabilities for leases with lease terms of less than 12 months.
A lease qualifies as a finance lease if any of the following criteria are met at the inception of the lease: (i) there is a transfer of ownership of the leased asset to the Company by the end of the lease term, (ii) the Company holds an option to purchase the leased asset that it is reasonably certain to exercise, (iii) the lease term is for a major part of the remaining economic life of the leased asset, (iv) the present value of the sum of lease payments equals or exceeds substantially all of the fair value of the leased asset, or (v) the nature of the leased asset is specialized to the point that it is expected to provide the lessor no alternative use at the end of the lease term. All other leases are recorded as operating leases.
Finance and operating lease assets and liabilities are recognized at the lease commencement date based on the present value of the lease payments over the lease term using the discount rate implicit in the lease. If the rate implicit is not readily determinable, the Company utilizes its incremental borrowing rate at the lease commencement date. Operating lease assets are further adjusted for prepaid or accrued lease payments. Operating lease payments are expensed using the straight-line method as an operating expense over the lease term. Finance lease assets are amortized to depreciation expense using the straight-line method over the shorter of the useful life of the related asset or the lease term. Finance lease payments are bifurcated into (i) a portion that is recorded as imputed interest expense and (ii) a portion that reduces the finance liability associated with the lease.
The Company does not separate lease and non-lease components when determining which lease payments to include in the calculation of its lease assets and liabilities. Variable lease payments are expensed as incurred. If a lease includes an option to extend or terminate the lease, the Company reflects the option in the lease term if it is reasonably certain it will exercise the option.
Finance leases are recorded in property, plant and equipment, net, other current liabilities and long-term finance lease liabilities and operating leases are recorded in operating lease right of use assets, operating lease liability and operating lease liability, long-term on the Company’s consolidated balance sheets.
78
Certain of the Company’s operating leases where the Company is the lessee provide for minimum annual payments that increase over the life of the lease. Some of these leases include obligations to pay for other services, such as operations and maintenance. For leases of property, the Company accounts for these other services as a component of the lease. The aggregate minimum annual payments are expensed on the straight-line basis beginning when the Company takes possession of the property and extending over the term of the related lease, including renewal options when the exercise of the option is reasonably certain as an economic penalty may be incurred if the option is not exercised. The Company also accounts in its straight-line computation for the effect of any “rental holidays.”
Operating lease assets represent the Company’s right to use an underlying asset for the lease term and lease liabilities represent the Company’s obligation to make lease payments arising from the lease. Operating lease assets and liabilities are recognized at the lease commencement date based on the estimated present value of the fixed lease payments, reduced by landlord incentives using a discount rate based on similarly secured borrowings available to the Company. Most of the leases do not provide implicit interest rates and therefore the Company determines the discount rate based on its incremental borrowing rate. The incremental borrowing rate for the Company’s leases is determined based on lease term and currency in which the lease payments are made.
Accrued Liabilities
The Company estimates accrued liabilities by identifying services performed on the Company’s behalf, estimating the level of service performed and determining the associated cost incurred for such service as of each balance sheet date. For example, the Company would accrue for professional and consulting fees incurred with law firms, audit and accounting service providers and other third-party consultants. These expenses are determined by either requesting those service providers to estimate unbilled services at each reporting date for services incurred or tracking costs incurred by service providers under fixed fee arrangements.
The Company has processes in place to estimate the appropriate amounts to record for accrued liabilities, which principally involve the applicable personnel reviewing the services provided. In the event that the Company does not identify certain costs that have begun to be incurred or the Company under or over-estimates the level of services performed or the costs of such services, the reported expenses for that period may be too low or too high. The date on which certain services commence, the level of services performed on or before a given date, and the cost of such services often require the exercise of judgment. The Company makes these judgments based upon the facts and circumstances known at the date of the consolidated financial statements.
Income Taxes
Deferred taxes are determined based on the difference between the consolidated financial statements and tax basis of assets and liabilities using enacted tax rates in effect in the years in which the differences are expected to reverse. Valuation allowances are provided, if, based upon the weight of available evidence, it is more likely than not that some or all of the deferred tax assets will not be realized. The Company accounts for uncertain tax positions using a “more-likely-than-not” threshold for recognizing and resolving uncertain tax positions. The evaluation of uncertain tax positions is based on factors including, but not limited to, changes in tax law, the measurement of tax positions taken or expected to be taken in tax returns, the effective settlement of matters subject to audit, new audit activity and changes in facts or circumstances related to a tax position. The Company evaluates this tax position on a quarterly basis. The Company also accrues for potential interest and penalties related to unrecognized tax benefits in income tax expense. The Company is subject to a territorial tax system under the Tax Cuts and Jobs Act enacted in December 2017, in which the Company is required to provide for tax on Global Intangible Low-Taxed Income (“GILTI”) earned by certain foreign subsidiaries. The Company has adopted an accounting policy to provide for the tax expense related to GILTI in the year the tax is incurred as a period expense.
79
Property, Plant & Equipment
Property, plant & equipment is recorded at cost less allowances for depreciation. Depreciation is calculated using the straight-line method over the estimated useful life of the asset as follows:
Classification | Estimated Useful Life | |
Buildings | Thirty years | |
Leasehold improvements | Shorter of the term of the lease or estimated useful life | |
Equipment | Three to twelve years | |
Furniture, fixtures and office equipment | Three to eight years | |
Computer hardware and software | Three to seven years or estimated useful life | |
Vehicles | Five years |
Upon disposal of property, plant & equipment, the cost of the asset and the accumulated depreciation are removed from the accounts and the resulting gain or loss is reflected in our results of operations. Fully depreciated assets are not removed from the accounts until they are physically disposed of.
Certain systems development costs related to the purchase, development and installation of computer software developed or obtained for internal use are capitalized and depreciated over the estimated useful life of the related project. Costs incurred prior to the development stage, as well as maintenance, training costs, and general and administrative expenses are expensed as incurred.
Earnings Per Share
The Company reports earnings per share (“EPS”) in accordance with ASC 260, "Earnings Per Share," which establishes standards for computing and presenting EPS. Basic EPS is computed by dividing net income available to common shareholders by the weighted average number of common shares outstanding during the period. Diluted EPS is computed by dividing net income available to common shareholders by the weighted-average number of common shares and dilutive common share equivalents outstanding during the period. Potential common share equivalents consist of restricted stock awards (including performance stock units) and the incremental common shares issuable upon the exercise of stock options and warrants. Under the treasury stock method, unexercised “in-the-money” stock options are assumed to be exercised at the beginning of the period or at issuance, if later. The assumed proceeds are then used to purchase common shares at the average market price during the period. In periods when the Company has a net loss, stock awards are excluded from the calculation of earnings per share as their inclusion would have an antidilutive effect.
80
A reconciliation of basic and diluted weighted average share outstanding is as follows:
|
| For the Years Ended December 31, |
| |||||||||
|
| 2023 |
|
| 2022 |
|
| 2021 |
| |||
|
| (Amounts in thousands, except per share data) |
| |||||||||
Numerator: |
|
|
|
|
|
|
|
|
| |||
Net income |
| $ | 41,577 |
|
| $ | 185,959 |
|
| $ | 128,291 |
|
Effect of dilutive securities: |
|
|
|
|
|
|
|
|
| |||
Charges associated with convertible debt instruments, net of tax |
|
| — |
|
|
| 387 |
|
|
| — |
|
Numerator for diluted earnings per share - net income available to common stockholders after the effect of dilutive securities |
| $ | 41,577 |
|
| $ | 186,346 |
|
| $ | 128,291 |
|
|
|
|
|
|
|
|
|
|
| |||
Denominator: |
|
|
|
|
|
|
|
|
| |||
Weighted average shares used in computing net income per |
|
| 55,720 |
|
|
| 55,460 |
|
|
| 55,015 |
|
Effect of dilutive shares: |
|
|
|
|
|
|
|
|
| |||
Options and stock units |
|
| 457 |
|
|
| 608 |
|
|
| 915 |
|
Convertible senior notes(1) |
|
| 181 |
|
|
| 1,360 |
|
|
| 1,253 |
|
Contingent consideration |
|
| 8 |
|
|
| 11 |
|
|
| — |
|
Dilutive effect of unvested performance stock units |
|
| 11 |
|
|
| 16 |
|
|
| 81 |
|
Dilutive potential common shares |
|
| 657 |
|
|
| 1,995 |
|
|
| 2,249 |
|
Denominator for diluted earnings per share - adjusted weighted average shares used in computing net income per share - diluted |
|
| 56,377 |
|
|
| 57,455 |
|
|
| 57,264 |
|
|
|
|
|
|
|
|
|
| ||||
Earnings per share: |
|
|
|
|
|
|
|
|
| |||
Basic |
| $ | 0.75 |
|
| $ | 3.35 |
|
| $ | 2.33 |
|
Diluted |
| $ | 0.74 |
|
| $ | 3.24 |
|
| $ | 2.24 |
|
|
|
|
|
|
|
|
|
|
| |||
For the years ended December 31, 2023, 2022 and 2021, 306,849 shares, 177,318 shares and 68,968 shares, respectively, of the Company’s common stock were excluded from the calculation of diluted earnings per share because they would have had an anti-dilutive effect for years presented.
In July 2019, the Company issued $287.5 million aggregate principal amount of its 2019 Notes. As provided by the terms of the indenture underlying the 2019 Notes, prior to March 4, 2022, conversion of the 2019 Notes could have been settled in cash, shares of the Company’s common stock or a combination thereof, at the Company’s election. On March 4, 2022, we entered into the Second Supplemental Indenture for the 2019 Notes, which irrevocably elected to settle the conversion of the 2019 Notes using a combination of cash and shares of the Company's common stock, settling the par value of the 2019 Notes in cash and any excess conversion premium in shares. On December 14, 2023, the Company exchanged, in a privately negotiated exchange, $309.9 million principal amount of 2023 Notes for $217.7 million principal amount of 2019 Notes and issued $290.1 million aggregate principal amount of 2023 Notes for $290.1 million in cash. Following the close of the Exchange Transaction, $69.7 million in aggregate principal amount of 2019 Notes remains outstanding with terms unchanged.
As provided by the terms of the Second Supplemental Indenture underlying the 2019 Notes, the Company irrevocably elected to settle the conversion obligation for the 2019 Notes in a combination of cash and shares of the Company's common stock. This means the Company will settle the par value of the 2019 Notes in cash and any excess conversion premium in shares. As mentioned in Note 14, “Convertible Senior Notes,” the Company adopted ASU 2020-06 effective January 1, 2022. Under ASU 2020-06, the Company is required to reflect the dilutive effect of the convertible securities by application of the “if-converted” method, which means the denominator of the EPS calculation would include the total number of shares assuming the 2019 Notes had been fully converted at the beginning of the period. Prior to March 4, 2022, the Company had the choice to settle the
81
conversion of the 2019 Notes in cash, stock or a combination of the two. Therefore, from January 1, 2022 (the date the Company adopted ASU 2020-06) to March 4, 2022, the Company included 3,474,429 shares in the denominator of the EPS calculation, applying the if converted method. Subsequent to March 4, 2022, after the Second Supplemental Indenture became effective, the Company irrevocably elected to settle the conversion obligation for the 2019 Notes in a combination of cash and shares of the Company's common stock, and from March 5, 2022 forward, only the excess premium will be settled with shares. Under the if-converted method of calculating dilutive shares, the Company was also required to exclude amortization of debt issuance costs and interest charges applicable to the convertible debt from the numerator of the dilutive EPS calculation for the period from January 1, 2022 to March 4, 2022, as if the interest on convertible debt was never recognized for that period. As a result, the Company excluded interest charges of $0.4 million (net of tax) from the numerator and included 1,359,957 shares in the calculation of diluted earnings as the dilutive effect of the conversion premium for the year ended December 31, 2022. There were no comparable amounts included in 2023 or 2021.
Prior to the adoption of ASU 2020-06, the Company applied the provisions of ASC 260, “Earnings Per Share,” subsection 10-45-44, to determine the diluted weighted average shares outstanding as it related to the conversion spread on its convertible notes. Accordingly, the par value of the 2019 Notes was not included in the calculation of diluted EPS, but the dilutive effect of the conversion premium was considered in the calculation of diluted EPS using the treasury stock method. The dilutive impact of the 2019 Notes was based on the difference between the Company’s current period average stock price and the conversion price of the convertible notes, provided there is a premium. Pursuant to this accounting standard, there was no dilution from the accreted principal of the 2019 Notes.
Segment Reporting
Operating segments are components of an enterprise that engage in business activities for which discrete financial information is available and regularly reviewed by the CODM in deciding how to allocate resources and assess performance. Our CEO has been identified as our CODM.
The Company views its operations, makes decisions regarding how to allocate resources and manages its business as one reportable segment and one reporting unit. As a result, the financial information disclosed herein represents all of the material financial information related to the Company.
The following table represents product revenues by product line:
|
| For the Years Ended December 31, |
| |||||
|
| 2023(1) |
|
| 2022 |
| ||
|
| (Amounts in thousands) |
| |||||
Filtration products |
| $ | 347,781 |
|
| $ | 495,930 |
|
Chromatography products |
|
| 126,629 |
|
|
| 131,680 |
|
Process analytics products |
|
| 56,820 |
|
|
| 53,512 |
|
Proteins products |
|
| 103,463 |
|
|
| 114,320 |
|
Other |
|
| 3,688 |
|
|
| 5,741 |
|
Total product revenue |
| $ | 638,381 |
|
| $ | 801,183 |
|
|
|
|
|
|
|
| ||
Revenue from filtration products includes the XCell ATF® systems and consumables as well as the KrosFlo® and SIUS® filtration products. Revenue from chromatography products includes the OPUS® chromatography pre-packed columns, chromatography resins and ELISA test kits. Revenue from process analytics products includes the SoloVPE®, FlowVPE® RPM® and FlowVPX® devices. Revenue from protein products includes the Protein A affinity ligands and cell culture growth factors. Other revenue primarily consists of revenue from the sale of operating room products to hospitals as well as freight revenue.
82
The following table represents the Company’s total revenue by our country of domicile (the United States) and other countries where our major subsidiaries are domiciled for the periods presented (based on the location of the customer):
|
| For the Years Ended December 31, |
| |||||||||
|
| 2023 |
|
| 2022 |
|
| 2021 |
| |||
Revenue by customers' geographic locations: |
|
|
|
|
|
|
|
|
| |||
North America |
|
| 44 | % |
|
| 43 | % |
|
| 41 | % |
Europe |
|
| 37 | % |
|
| 37 | % |
|
| 40 | % |
APAC/Other |
|
| 19 | % |
|
| 20 | % |
|
| 19 | % |
Total revenue |
|
| 100 | % |
|
| 100 | % |
|
| 100 | % |
The following table represents the Company’s total assets by our country of domicile (the United States) and other countries where our major subsidiaries are domiciled for the periods presented:
|
| December 31, |
| |||||
|
| 2023 |
|
| 2022 |
| ||
|
| (Amounts in thousands) |
| |||||
Total assets by geographic locations: |
|
|
|
|
|
| ||
North America |
| $ | 2,371,208 |
|
| $ | 2,209,244 |
|
Europe |
|
| 426,034 |
|
|
| 287,543 |
|
APAC |
|
| 27,169 |
|
|
| 27,871 |
|
Total assets by geographic location |
| $ | 2,824,411 |
|
| $ | 2,524,658 |
|
The following table represents the Company’s long-lived assets by our country of domicile (the United States) and other countries where our major subsidiaries are domiciled for the periods presented:
|
| December 31, |
| |||||
|
| 2023 |
|
| 2022 |
| ||
|
| (Amounts in thousands) |
| |||||
Long-lived assets by geographic locations: |
|
|
|
|
|
| ||
North America |
| $ | 278,033 |
|
| $ | 275,151 |
|
Europe |
|
| 43,280 |
|
|
| 38,541 |
|
APAC |
|
| 2,919 |
|
|
| 2,819 |
|
Total long-lived assets by geographic location |
| $ | 324,232 |
|
| $ | 316,511 |
|
Concentrations of Credit Risk and Significant Customers
Financial instruments that subject the Company to significant concentrations of credit risk primarily consist of cash and cash equivalents, marketable securities and accounts receivable. Per the Company’s investment policy, cash equivalents and marketable securities are invested in financial instruments with high credit ratings, limit its credit exposure to any one issuer (with the exception of U.S. treasury obligations) and type of instrument is limited. At December 31, 2023, the Company had no investments associated with foreign exchange contracts, options contracts or other foreign hedging arrangements.
Concentration of credit risk with respect to accounts receivable is limited to customers to whom the Company makes significant sales. While a reserve for the potential write-off of accounts receivable is maintained, the Company has not written off any significant accounts to date. To control credit risk, the Company performs regular credit evaluations of its customers’ financial condition.
There was no revenue from customers that represented 10% or more of the Company's total revenue for the year ended December 31, 2023 or 2022. Revenue from Pfizer Inc. accounted for 10% of total revenue for the year ended December 31, 2021.
No accounts receivable balance from a specific customer represented 10% or more of the Company's total trade accounts receivable at December 31, 2023. Significant accounts receivable balances representing 10% or more of the Company’s total
83
trade accounts receivable balances at December 31, 2022 came from our accounts receivable balance outstanding with Purolite, an Ecolab Inc. company (“Purolite”), which was 12.7% of the Company's total trade accounts receivable balance.
Business Combinations, Goodwill and Intangible Assets
Business Combinations
Total consideration transferred for acquisitions is allocated to the tangible and intangible assets acquired and liabilities assumed, if any, based on their fair values at the dates of acquisition. This purchase price allocation process requires management to make significant estimates and assumptions with respect to intangible assets and deferred revenue. The fair value of identifiable intangible assets is based on detailed valuations that use information and assumptions determined by management. Any excess of purchase price over the fair value of the net tangible and intangible assets acquired is allocated to goodwill. While the Company uses its best estimates and assumptions to accurately value assets acquired and liabilities assumed at the acquisition date as well as any contingent consideration, where applicable, the Company’s estimates are inherently uncertain and subject to refinement. As a result, during the measurement period, which may be up to one year from the acquisition date, the Company records adjustments to the assets acquired and liabilities assumed with the corresponding offset to goodwill. Upon conclusion of the measurement period or final determination of the values of assets acquired or liabilities assumed, whichever comes first, any subsequent adjustments are recorded to the Company’s consolidated statements of comprehensive income. Any excess of the fair value of the net tangible and intangible assets acquired over the purchase price is recognized in the consolidated statements of comprehensive income. The fair value of contingent consideration includes estimates and judgments made by management regarding the probability that future contingent payments will be made and the extent of royalties to be earned in excess of the defined minimum royalties. Management updates these estimates and the related fair value of contingent consideration at each reporting period. These changes in the fair value of contingent consideration are recorded to contingent consideration in the Company’s consolidated statements of comprehensive income. For the years ended December 31, 2023 and 2022, we recorded a decrease of $(30.6) million and $(28.7) million, respectively, to the estimated contingent consideration obligation, primarily related to the acquisition of Avitide (the “Avitide Acquisition”).
The Company uses the income approach to determine the fair value of certain identifiable intangible assets including customer relationships and developed technology. This approach determines fair value by estimating after-tax cash flows attributable to these assets over their respective useful lives and then discounting these after-tax cash flows back to a present value. The Company bases its assumptions on estimates of future cash flows, expected growth rates, expected trends in technology, etc. Discount rates used to arrive at a present value as of the date of acquisition are based on the time value of money and certain industry-specific risk factors. The Company believes the estimated purchased customer relationships, developed technologies, trademark/tradename, patents, non-compete agreements and in-process research and development amounts so determined represent the fair value at the date of acquisition, and do not exceed the amount a third-party would pay for such assets.
Goodwill
Goodwill is not amortized and is tested for impairment at least annually at the reporting unit level. The Company operates as one reporting unit as of the goodwill impairment measurement date of December 31, 2023. During the qualitative assessment of the Company’s one reporting unit during the 2023 goodwill impairment testing, it was determined that it was not more likely than not that its fair value was less than its carrying amount. As such, a quantitative impairment assessment was not required as of December 31, 2023. If an event occurs or circumstances change that would more likely than not reduce the fair value of its reporting unit below its carrying value, the Company will evaluate its goodwill for impairment between annual tests. There was no impairment to goodwill and therefore no impairment charge recorded for the years ended December 31, 2023, 2022 and 2021.
The Company has historically tested for impairment on its goodwill annually as of its measurement date of December 31st pursuant to company policy. Subsequent to the 2023 annual impairment test, the Company voluntarily changed its annual impairment assessment date from December 31st to October 1st, the first day of the Company's fourth quarter, beginning on October 1, 2024. The change is being made to better align the annual impairment assessment date with the Company's annual planning and budgeting process as well as long-term planning and forecasting process. The Company has determined this voluntary change in accounting principle is preferable and will not impact its consolidated financial statements nor is it being done to accelerate, avoid or trigger an impairment charge. This change is not going to be applied retrospectively as it is
84
impracticable to do so because retrospective application would require application of significant estimates and assumptions with the use of hindsight. Accordingly, the change will be applied prospectively.
Intangible Assets
Intangible assets with a definite life are amortized over their useful lives using the straight-line method and the amortization expense is recorded within cost of product revenue, research and development (“R&D”) and selling, general and administrative expense in the consolidated statements of comprehensive income. Intangible assets and their related useful lives are reviewed at least annually to determine if any adverse conditions existed that would indicate the carrying value of these assets may not be recoverable. More frequent impairment assessments are conducted if certain conditions exist, including a change in the competitive landscape, any internal decisions to pursue new or different technology strategies, a loss of a significant customer, or a significant change in the marketplace, including changes in the prices paid for the Company’s products or changes in the size of the market for the Company’s products. If impairment indicators are present, the Company determines whether the underlying intangible asset is recoverable through estimated future undiscounted cash flows. If the asset is not found to be recoverable, it is written down to the estimated fair value of the asset based on the sum of the future discounted cash flows expected to result from the use and disposition of the asset. If the estimate of an intangible asset’s remaining useful life is changed, the remaining carrying amount of the intangible asset is amortized prospectively over the revised remaining useful life. The Company continues to believe that its definite-lived intangible assets are recoverable at December 31, 2023.
Indefinite-lived intangible assets are reviewed for impairment at least annually. There has been no impairment of our intangible assets for the periods presented.
Stock Based Compensation
The Company measures stock-based compensation cost at the grant date based on the estimated fair value of the award and recognizes it as an expense over the employee’s requisite service period on a straight-line basis. The Company records the expense for share-based awards subject to performance-based milestone vesting over the remaining service period when management determines that achievement of the milestone is probable. Management evaluates whether the achievement of a performance-based milestone is probable as of the reporting date. The Company has no awards that are subject to market conditions. The Company recognizes stock-based compensation expense based upon options that are ultimately expected to vest, and accordingly, such compensation expense has been adjusted by an amount of estimated forfeitures.
The Company uses the Black-Scholes option pricing model to calculate the fair value of share-based awards on the grant date. The following assumptions are used in calculating the fair value of share-based awards:
Expected term – The expected term of options granted represents the period of time for which the options are expected to be outstanding. For purposes of estimating the expected term, the Company has aggregated all individual option awards into one group as the Company does not expect substantial differences in exercise behavior among its employees.
Expected volatility – The expected volatility is a measure of the amount by which the Company’s stock price is expected to fluctuate during the expected term of options granted. The Company determines the expected volatility based primarily upon the historical volatility of the Company’s common stock over a period commensurate with the option’s expected term.
Risk-free interest rate – The risk-free interest rate is the implied yield available on U.S. treasury zero-coupon issues with a remaining term equal to the option’s expected term on the grant date.
Expected dividend yield – The Company has never declared or paid any cash dividends on any of its capital stock and does not expect to do so in the foreseeable future. Accordingly, the Company uses an expected dividend yield of zero to calculate the grant-date fair value of a stock option.
Estimated forfeiture rates – The Company has applied, based on an analysis of its historical forfeitures, annual forfeiture rates of 8% for awards granted to non-executive level employees, 3% for awards granted to executive level employees and 0% for awards granted to non-employee members of the Board of Directors (“Board”) to all unvested stock options as of December 31, 2023.
85
The Company reevaluates this analysis periodically and adjusts these estimated forfeiture rates as necessary. Ultimately, the Company will only recognize an expense for those shares that vest.
Advertising Costs
The Company expenses advertising costs as they are incurred. Advertising expense for the years ended December 31, 2023, 2022 and 2021 was $0.8 million, $0.6 million and $0.6 million, respectively.
Recent Accounting Standards Updates
We consider the applicability and impact of all ASUs and other accounting guidance on the Company’s consolidated financial statements. Updates not listed below were assessed and determined to be either not applicable or are expected to have minimal impact on the Company’s consolidated financial position or results of operations. Recently issued accounting guidance that we feel may be applicable to the Company are as follows:
Recently Issued Accounting Guidance – Adopted During the Fiscal Year
In July 2023, the U.S. Securities and Exchange Commission (the “SEC”) adopted the final rule under SEC Release No. 33-11216, “Cybersecurity Risk Management, Strategy, Governance, and Incident Disclosure,” requiring current reporting about material cybersecurity incidents and annual disclosures on management’s processes for assessing, identifying, and managing material cybersecurity risks, the material impacts of cybersecurity threats and previous cybersecurity incidents, the Board's oversight of cybersecurity risks, and management’s role and expertise in assessing and managing material cybersecurity risks. SEC Release No. 33-11216 was effective for us during the third quarter of 2023. The adoption of this guidance did not have a material impact on the Company’s consolidated financial statements and disclosures.
In December 2022, the SEC adopted the final rule under SEC Release No. 33-11138, "Insider Trading Arrangements and Related Disclosures," which requires new disclosures regarding insider trading policies and procedures, the use of Rule 10b5-1 plans by directors and officers, and stock option grants issued in close proximity to the release of material nonpublic information. SEC Release No. 33-11138 was effective for us for our second quarter of 2023, and did not have a material impact on our consolidated financial statements and disclosures.
Recently Issued Accounting Guidance – Not Yet Adopted
In December 2023, the Financial Accounting Standards Board (“FASB”) issued ASU 2023-09, “Income Taxes (Topic 740) - Improvements to Income Tax Disclosures.” ASU 2023-09 enhances the transparency and decision usefulness of income tax disclosures by requiring consistent categories and greater disaggregation of information in the rate reconciliation and income taxes paid disaggregated by jurisdiction. ASU 2023-09 will be effective for the Company in its income tax disclosure included in its 2025 Annual Report on Form 10-K and will be applied on a prospective basis. However, retrospective application is permitted. Early adoption is also permitted. Besides a change in income tax disclosures, the Company does not expect the adoption of ASU 2023-09 to have a material impact on its consolidated financial statements.
In November 2023, the FASB issued ASU 2023-07, “Segment Reporting (Topic 820) - Improvements to Reportable Segment Disclosures.” ASU 2023-07 will improve reportable segment disclosure requirements, primarily through enhanced annual and interim disclosures about significant segment expenses that are regularly provided to the CODM. The disclosure required under ASU 2023-07 are also required for public entities with a single reportable segment. ASU 2023-07 will be effective for the Company for annual periods beginning on January 1, 2024 and interim periods beginning on January 1, 2025. The amendments of this guidance apply retrospectively to all prior periods presented in the consolidated financial statements. Early adoption is
86
permitted. Besides presentation in the segment footnote for its interim reporting, the Company does not expect the adoption of ASU 2023-07 to have a material impact on its consolidated financial statements.
Cash, Cash Equivalents and Marketable Securities Held to Maturity
The following table summarizes the Company's cash, cash equivalents and marketable securities held to maturity as of December 31, 2023:
|
| As of December 31, 2023 |
| |||||||||||||
|
| Amortized |
|
| Gross |
|
| Gross |
|
| Estimated |
| ||||
Cash and cash equivalents: |
|
|
|
|
|
|
|
|
|
|
|
| ||||
Cash and money market funds |
| $ | 751,323 |
|
| $ | — |
|
| $ | — |
|
| $ | 751,323 |
|
Total cash and cash equivalents |
| $ | 751,323 |
|
| $ | — |
|
| $ | — |
|
| $ | 751,323 |
|
|
|
|
|
|
|
|
|
|
|
|
|
| ||||
|
| As of December 31, 2022 |
| |||||||||||||
|
| Amortized |
|
| Gross |
|
| Gross |
|
| Estimated |
| ||||
Cash and cash equivalents: |
|
|
|
|
|
|
|
|
|
|
|
| ||||
Cash and money market funds |
| $ | 523,458 |
|
| $ | — |
|
| $ | — |
|
| $ | 523,458 |
|
Total cash and cash equivalents |
|
| 523,458 |
|
|
| — |
|
|
| — |
|
|
| 523,458 |
|
Marketable securities held to maturity: |
|
|
|
|
|
|
|
|
|
|
|
| ||||
U.S. treasury bills - short-term |
|
| 100,299 |
|
|
| 24 |
|
|
| — |
|
|
| 100,323 |
|
Total cash, cash equivalents and marketable securities |
| $ | 623,757 |
|
| $ | 24 |
|
| $ | — |
|
| $ | 623,781 |
|
|
|
|
|
|
|
|
|
|
|
|
|
| ||||
During the fourth quarter of 2022, the Company purchased $100.0 million of 6-month U.S. treasury bills with the positive intent and ability to hold them until maturity. Therefore, the Company classified this investment as held to maturity and stated it at amortized cost on the consolidated balance sheets. There is no comparable investment as of December 31, 2023.
The amortized cost and fair value of the Company's held to maturity securities by contractual maturity at December 31, 2022 are summarized below. There were no comparable investments as of December 31, 2023:
|
| December 31, 2022 |
|
| |||||
|
| Amortized |
|
| Estimated |
|
| ||
Maturity of one year or less |
| $ | 100,299 |
|
| $ | 100,323 |
|
|
Total |
| $ | 100,299 |
|
| $ | 100,323 |
|
|
87
Fair Value Measured on a Recurring Basis
Financial assets and financial liabilities measured at fair value on a recurring basis consist of the following as of December 31, 2023 and 2022:
|
| As of December 31, 2023 |
| |||||||||||||
|
| Level 1 |
|
| Level 2 |
|
| Level 3 |
|
| Total |
| ||||
Assets: |
|
|
|
|
|
|
|
|
|
|
|
| ||||
Money market accounts |
| $ | 658,574 |
|
| $ | — |
|
| $ | — |
|
| $ | 658,574 |
|
Liabilities: |
|
|
|
|
|
|
|
|
|
|
|
| ||||
Short-term contingent consideration |
| $ | — |
|
| $ | — |
|
| $ | 12,983 |
|
| $ | 12,983 |
|
Long-term contingent consideration |
| $ | — |
|
| $ | — |
|
| $ | 14,070 |
|
| $ | 14,070 |
|
|
|
|
|
|
|
|
|
|
|
|
|
| ||||
|
| As of December 31, 2022 |
| |||||||||||||
|
| Level 1 |
|
| Level 2 |
|
| Level 3 |
|
| Total |
| ||||
Assets: |
|
|
|
|
|
|
|
|
|
|
|
| ||||
Money market accounts |
| $ | 343,929 |
|
| $ | — |
|
| $ | — |
|
| $ | 343,929 |
|
Liabilities: |
|
|
|
|
|
|
|
|
|
|
|
| ||||
Short-term contingent consideration |
| $ | — |
|
| $ | — |
|
| $ | 13,950 |
|
| $ | 13,950 |
|
Long-term contingent consideration |
| $ | — |
|
| $ | — |
|
| $ | 51,559 |
|
| $ | 51,559 |
|
Contingent Consideration – Earnout
As of December 31, 2023, the maximum amount of future contingent consideration (undiscounted) that the Company could be required to pay in connection with each of the completed acquisitions is; $125.0 million over a three-year earnout period for Avitide, which was acquired in September 2021 and for which the earnout periods run from January 1, 2022 through December 31, 2024; $42.0 million over a two-year earnout period for FlexBiosys, which was acquired in April 2023 and for which the earnout periods run from January 1, 2023 through December 31, 2024; and approximately $10 million over a one-year earnout period for Metenova, which was acquired in October 2023 and for which the earnout period runs from January 1, 2024 through December 31, 2024. See Note 4, “Acquisitions” to this report for more information on the contingent consideration earnouts.
During 2023, expected results and change in market inputs used to calculate the discount rate, resulted in a decrease in amounts reported as of December 31, 2023. A reconciliation of the change in fair value of contingent consideration – earnout is included in the following table (amounts in thousands):
Balance at December 31, 2022 |
| $ | 65,509 |
|
Acquisition date fair value of contingent consideration earnouts |
|
| 6,640 |
|
Payment of contingent consideration earnouts |
|
| (14,527 | ) |
Decrease in fair value of contingent consideration earnouts |
|
| (30,569 | ) |
Balance at December 31, 2023 |
| $ | 27,053 |
|
88
The recurring Level 3 fair value measurement of our contingent consideration – earnout that we expect to be required to settle our 2023, 2024 and 2025 contingent consideration obligation for Avitide, FlexBiosys and Metenova include the following significant unobservable inputs (amounts in thousands, except percent data):
Contingent Consideration Earnout |
| Fair Value as of |
|
| Valuation Technique |
| Unobservable Input |
| Range |
| Weighted Average(1) | ||
|
|
|
|
|
|
|
| Probability of |
|
|
|
| |
|
|
|
|
|
|
|
| Success |
| 100% |
| 100% | |
Commercialization-based payments |
| $ |
| 20,094 |
|
| Monte Carlo |
| Earnout Discount Rate |
| 5.8%-5.9% |
| 5.9% |
|
|
|
|
|
|
|
|
|
|
|
|
| |
|
|
|
|
|
|
|
| Volatility |
| 12.5%-24.6% |
| 21.9% | |
|
|
|
|
|
|
|
|
|
|
|
|
| |
Revenue and Volume- |
| $ |
| 1,454 |
|
| Monte Carlo |
| Revenue & Volume |
| 2.5%-9.3% |
| 8.3% |
|
|
|
|
|
|
|
| Earnout Discount Rate |
| 5.8%-7.2% |
| 6.1% | |
|
|
|
|
|
|
|
| Probability of |
| 100% |
| 100% | |
Manufacturing line expansions |
| $ |
| 5,505 |
|
| Probability-weighted present value |
| Earnout Discount Rate |
| 6.1%-6.4% |
| 6.3% |
The Company estimates the fair value of the contingent consideration earnouts using a Monte Carlo simulation. Changes in the projected performance of the acquired business could result in a higher or lower contingent consideration obligation in the future.
Fair Value Measured on a Nonrecurring Basis
During 2023, there were no re-measurements to fair value of financial assets and liabilities that are measured at fair value on a nonrecurring basis.
Convertible Senior Notes
In July 2019, the Company issued $287.5 million aggregate principal amount of the 2019 Notes. Interest is payable semi-annually in arrears on January 15 and July 15 of each year. The 2019 Notes will mature on July 15, 2024, unless earlier converted or repurchased in accordance with their terms. At December 31, 2023 and 2022, subsequent to the adoption of ASU 2020-06, the carrying value of the 2019 Notes was $69.5 million and $284.6 million, respectively, net of unamortized debt issuance costs and the fair value of the 2019 Notes was $109.8 million and $452.0 million, respectively. The fair value of the 2019 Notes is a Level 1 valuation and was determined based on the most recent trade activity of the 2019 Notes as of December 31, 2023 and 2022. The 2019 Notes are discussed in more detail in Note 14, “Convertible Senior Notes,” to these consolidated financial statements.
On December 14, 2023, the Company issued $600.0 million aggregate principal amount of its 2023 Notes in a private placement pursuant to separate, privately negotiated exchange and subscription agreements (the “Exchange and Subscription Agreements”) with a limited number of holders of its outstanding 2019 Notes and certain other qualified institutional buyers pursuant to Rule 144A under the Securities Act of 1933, as amended (“Securities Act”). Pursuant to the Exchange and Subscription Agreements, the Company exchanged $217.7 million of its 2019 Notes for $309.9 million aggregate principal amount of the 2023 Notes (the “Exchange Transaction”) and issued $290.1 million aggregate principal amount of the 2023 Notes (the “Subscription Transactions”) for $290.1 million in cash. At December 31, 2023, the carrying value of the 2023 Notes was $510.1 million, net of unamortized debt issuance costs, and the fair value of the 2023 Notes was $596.0 million. The fair value of the 2023 Notes is a Level 1 valuation and was determined based on the most recent trade activity of the 2023 Notes as of December 31, 2023. The 2023 Notes are discussed in more detail in Note 14, “Convertible Senior Notes,” to these consolidated financial statements.
89
2023 Acquisitions
Metenova Holding AB
On October 2, 2023, the Company's subsidiary, Repligen Sweden AB acquired Metenova from the former shareholders of Metenova (the “Metenova Seller”) pursuant to a Share Sale and Purchase Agreement (the “Share Purchase Agreement”), dated as of September 23, 2023 (such acquisition, the “Metenova Acquisition”), by and among Repligen Sweden AB, the Metenova Seller, and the Company, in its capacity as guarantor of the obligations of Repligen Sweden AB under the Share Purchase Agreement.
Metenova, which is headquartered in Molndal, Sweden, offers magnetic mixing and drive train technologies that are widely used by global biopharmaceutical companies and contract development and manufacturing organizations. The Metenova Acquisition further strengthens our fluid management portfolio with these products.
Consideration Transferred
The Company accounted for the Metenova Acquisition as a purchase of business under ASC 805, “Business Combinations,” and the Company engaged a third-party valuation firm to assist with the valuation of Metenova. Under the Share Purchase Agreement, all outstanding equity interests of Metenova were acquired for consideration with a value totaling $172.6 million. The Metenova Acquisition was funded through payment of $164.5 million in cash, the issuance of 52,299 unregistered shares of the Company's common stock totaling $8.1 million and contingent consideration with an immaterial fair value.
Under the acquisition method of accounting, the assets acquired and liabilities assumed of Metenova were recorded as of the acquisition date, at their respective fair values, and consolidated with those of the Company. The fair value of the net liabilities acquired is estimated to be $2.0 million, the fair value of the intangible assets acquired is estimated to be $58.8 million and the residual goodwill is estimated to be $115.8 million. The estimated consideration and preliminary purchase price information has been prepared using a preliminary valuation. Acquisition-related costs are not included as a component of consideration transferred but are expensed in the periods in which costs are incurred. The Company has incurred $3.5 million of transaction and integration costs associated with the Metenova Acquisition from the date of acquisition to December 31, 2023. The transaction costs are included in operating expenses in the consolidated statements of comprehensive income in 2023.
Fair Value of Net Assets Acquired
The preliminary allocation of purchase price is based on the fair value of assets acquired and liabilities assumed as of the acquisition date. As of December 31, 2023, the purchase accounting for this acquisition had not been finalized. As additional information becomes available, the Company may further revise its preliminary purchase price allocation during the remainder of the measurement period. Besides tax implications of the purchase price allocation, the final allocation may result in changes to other assets and liabilities.
The components and estimated allocation of the purchase price consist of the following (amounts in thousands):
90
Cash and cash equivalents |
| $ | 5,768 |
|
Accounts receivable |
|
| 3,730 |
|
Inventory |
|
| 4,421 |
|
Prepaid expenses and other current assets |
|
| 470 |
|
Property and equipment |
|
| 433 |
|
Operating lease right of use asset |
|
| 615 |
|
Customer relationships |
|
| 12,659 |
|
Developed technology |
|
| 44,377 |
|
Trademark and tradename |
|
| 939 |
|
Non-competition agreements |
|
| 787 |
|
Goodwill |
|
| 115,778 |
|
Accounts payable |
|
| (1,432 | ) |
Accrued liabilities |
|
| (2,934 | ) |
Operating lease liability |
|
| (275 | ) |
Deferred tax liability, long-term |
|
| (12,481 | ) |
Operating lease liability, long-term |
|
| (255 | ) |
Fair value of net assets acquired |
| $ | 172,600 |
|
|
|
|
| |
Acquired Goodwill
The goodwill of $115.8 million represents future economic benefits expected to arise from anticipated synergies from the integration of Metenova into the Company. These synergies include operating efficiencies and strategic benefits projected to be achieved as a result of the Metenova Acquisition. Substantially all of the goodwill recorded is expected to be nondeductible for income tax purposes.
Intangible Assets
The following table sets forth the components of the identified intangible assets associated with the Metenova Acquisition and their estimated useful lives:
|
| Useful life |
| Fair Value |
| |
|
|
|
| (Amounts in thousands) |
| |
|
|
|
|
| ||
Customer relationships |
| 15 years |
| $ | 12,659 |
|
Developed technology |
| 15 years |
|
| 44,377 |
|
Trademark and tradename |
| 15 years |
|
| 939 |
|
Non-competition agreements |
| 2 years |
|
| 787 |
|
|
|
| $ | 58,762 |
| |
FlexBiosys, Inc.
On April 17, 2023, the Company completed its acquisition of all of the outstanding equity interests in FlexBiosys, pursuant to an Equity Purchase Agreement with FlexBiosys, TSAP Holdings Inc. (“NJ Seller”), Gayle Tarry and Stanley Tarry, as individuals (collectively with NJ Seller, the “FlexBiosys Sellers”), and Stanley Tarry, in his capacity as the representative of the FlexBiosys Sellers (the “FlexBiosys Acquisition”).
FlexBiosys, which is headquartered in Branchburg, New Jersey, offers expert design and custom manufacturing of single-use bioprocessing products and a comprehensive range of products that include bioprocessing bags, bottles, and tubing assemblies. These products will complement and expand our fluid management portfolio of offerings.
Consideration transferred
The FlexBiosys Acquisition was accounted for as a purchase of a business under ASC 805, “Business Combinations,” and the Company engaged a third-party valuation firm to assist with the valuation of FlexBiosys. Under the terms of the EPA, all outstanding equity interests of FlexBiosys were acquired for consideration with a value totaling $41.0 million. The FlexBiosys Acquisition was funded through payment of $29.0 million in cash, which includes $6.3 million deposited in escrow for future payments, the issuance of 31,415 unregistered shares of the Company's common stock totaling $5.4 million and contingent consideration with fair value of approximately $6.6 million.
91
Under the acquisition method of accounting, the assets acquired and liabilities assumed of FlexBiosys were recorded as of the acquisition date, at their respective fair values, and consolidated with those of the Company. The fair value of the net assets acquired is estimated to be $14.1 million, the fair value of the intangible assets acquired is estimated to be $12.6 million and the residual goodwill is estimated to be $14.3 million. The estimated consideration and preliminary purchase price information has been prepared using a preliminary valuation. Acquisition-related costs are not included as a component of consideration transferred but are expensed in the periods in which costs are incurred. The Company has incurred $1.1 million of transaction and integration costs associated with the FlexBiosys Acquisition from the date of acquisition to December 31, 2023 with $0.2 million of the transaction and integration costs incurred during the three months ended December 31, 2023. The transaction costs are included in operating expenses in the consolidated statements of comprehensive income in 2023.
Fair Value of Net Assets Acquired
The preliminary allocation of purchase price is based on the fair value of assets acquired and liabilities assumed as of the acquisition date. As of December 31, 2023, the purchase accounting for this acquisition had not been finalized. As additional information becomes available, the Company may further revise its preliminary purchase price allocation during the remainder of the measurement period, which ends on April 17, 2024. The final allocation may result in changes to other assets and liabilities.
The components and estimated allocation of the purchase price consist of the following (amounts in thousands):
Cash and cash equivalents |
| $ | 1,090 |
|
Accounts receivable |
|
| 683 |
|
Inventory |
|
| 667 |
|
Prepaid expenses and other current assets |
|
| 35 |
|
Property and equipment |
|
| 12,034 |
|
Operating lease right of use asset |
|
| 3,537 |
|
Customer relationships |
|
| 2,530 |
|
Developed technology |
|
| 9,860 |
|
Trademark and tradename |
|
| 30 |
|
Non-competition agreements |
|
| 220 |
|
Goodwill |
|
| 14,321 |
|
Other long-term assets |
|
| 10 |
|
Accounts payable |
|
| (136 | ) |
Accrued liabilities |
|
| (314 | ) |
Operating lease liability |
|
| (39 | ) |
Operating lease liability, long-term |
|
| (3,498 | ) |
Fair value of net assets acquired |
| $ | 41,030 |
|
|
|
|
| |
During 2023, the Company recorded an immaterial net working capital adjustment related to the FlexBiosys Acquisition, which is included in goodwill in the table above.
Acquired Goodwill
The goodwill of $14.3 million represents future economic benefits expected to arise from anticipated synergies from the integration of FlexBiosys into the Company. These synergies include operating efficiencies and strategic benefits projected to be achieved as a result of the FlexBiosys Acquisition. Substantially all of the goodwill recorded is expected to be deductible for income tax purposes.
Intangible Assets
The following table sets forth the components of the identified intangible assets associated with the FlexBiosys Acquisition and their estimated useful lives:
92
|
| Useful life |
| Fair Value |
| |
|
|
|
| (Amounts in thousands) |
| |
|
|
|
|
| ||
Customer relationships |
| 12 years |
| $ | 2,530 |
|
Developed technology |
| 16 years |
|
| 9,860 |
|
Trademark and tradename |
| 4 years |
|
| 30 |
|
Non-competition agreements |
| 5 years |
|
| 220 |
|
|
|
| $ | 12,640 |
| |
2021 Acquisitions
BioFlex Solutions LLC and Newton T&M Corp.
On November 29, 2021, the Company entered into an Equity Purchase Agreement with BioFlex (“BioFlex EPA”), NTM and each of Ralph Meola and Jason Nisler, to acquire 100% of the outstanding securities of BioFlex and NTM (collectively, the “NTM Acquisition”). The transaction closed on December 16, 2021.
NTM, which is headquartered in Newton, New Jersey, is the parent company of BioFlex and focuses on manufacturing of products, while BioFlex, also headquartered in Newton, New Jersey, commercializes branded products to biotech customers. The NTM Acquisition complements and expands our filtration offering paths as the industry migrates to single-use flow paths solutions for monoclonal antibody (“mAb”), vaccine and cell and gene therapy (“C>”) applications, with a focus on single-use fluid management components, including single-use clamps, adapters, end caps and hose assemblies. The NTM Acquisition streamlines and increases control over many components in our single-use supply chain which ultimately should drive reduced lead-times for Repligen customers in the coming years.
Consideration Transferred
The NTM Acquisition was accounted for as a purchase of businesses under ASC 805, “Business Combinations” and the Company engaged a third-party valuation firm to assist with the valuation of the business acquired. Under the terms of the BioFlex EPA, all outstanding shares of capital stock of BioFlex were acquired for consideration with a value totaling $31.6 million, which includes $3.0 million deposited into an escrow against which the Company may make claims for indemnification.
Under the acquisition method of accounting, the assets acquired and liabilities assumed of BioFlex were recorded as of the acquisition date, at their respective fair values, and consolidated with those of the Company. The fair value of the net assets acquired is $4.6 million, the fair value of the intangible assets acquired is $17.2 million, and the residual goodwill is $9.8 million. Acquisition-related costs are not included as a component of consideration transferred but are expensed in the periods in which costs are incurred. The Company incurred $3.0 million of transaction and integration costs associated with the NTM Acquisition from the date of acquisition to December 31, 2022, with $2.7 million of transaction and integration costs incurred in 2022 and $0.3 million incurred in 2021. The transaction and integration costs are included in operating expenses in the consolidated statements of comprehensive income for the periods ended December 31, 2022 and 2021.
Fair Value of Net Assets Acquired
The allocation of purchase price is based on the fair value of assets acquired and liabilities assumed as of the acquisition date, based on the final valuation. The Company has made appropriate adjustments to the purchase price allocation during the measurement period, which ended December 16, 2022.
93
The components and estimated allocation of the purchase price consist of the following (amounts in thousands):
Cash and cash equivalents |
| $ | 2,870 |
|
Accounts receivable |
|
| 1,408 |
|
Inventory |
|
| 741 |
|
Prepaid expenses and other current assets |
|
| 126 |
|
Property and equipment |
|
| 34 |
|
Operating lease right of use asset |
|
| 1,034 |
|
Customer relationships |
|
| 13,240 |
|
Developed technology |
|
| 3,540 |
|
Trademark and tradename |
|
| 310 |
|
Non-competition agreements |
|
| 60 |
|
Goodwill |
|
| 9,834 |
|
Long term deferred tax asset |
|
| 81 |
|
Accounts payable |
|
| (224 | ) |
Accrued liabilities |
|
| (450 | ) |
Operating lease liability |
|
| (1,030 | ) |
Operating lease liability, long-term |
|
| (3 | ) |
Fair value of net assets acquired |
| $ | 31,571 |
|
During 2022, the Company recorded net working capital adjustments of approximately $0.3 million related to pre-acquisition liabilities, which are included in goodwill and accrued liabilities in the table above.
Acquired Goodwill
The goodwill of $9.8 million represents future economic benefits expected to arise from anticipated synergies from the integration of BioFlex and NTM into the Company. These synergies include certain operating efficiencies and strategic benefits projected to be achieved as a result of the NTM Acquisition. Substantially all of the goodwill recorded is expected to be deductible for income tax purposes.
Intangible Assets
The following table sets forth the components of the identified intangible assets associated with the NTM Acquisition and their estimated useful lives:
|
| Useful life |
| Fair Value |
| |
|
|
|
| (Amounts in thousands) |
| |
|
|
|
|
| ||
Customer relationships |
| 10 years |
| $ | 13,240 |
|
Developed technology |
| 11 years |
|
| 3,540 |
|
Trademark and tradename |
| 15 years |
|
| 310 |
|
Non-competition agreements |
| 3 years |
|
| 60 |
|
|
|
| $ | 17,150 |
| |
Avitide, Inc.
On September 16, 2021, the Company entered into an Agreement and Plan of Merger and Reorganization (“Avitide Merger Agreement”) with Avalon Merger Sub, Inc., a Delaware corporation and a wholly owned direct subsidiary of the Company, Avalon Merger Sub LLC, a Delaware limited liability company and a wholly owned direct subsidiary of the Company, Avitide, a Delaware corporation, and Shareholder Representative Services LLC, a Colorado limited liability company, solely in its capacity as the representative, agent and attorney-in-fact of Avitide's securityholders to purchase Avitide. The transaction closed on September 20, 2021, and on the terms set forth in the Avitide Merger Agreement.
Avitide, which is headquartered in Lebanon, New Hampshire, offers diverse libraries and leading technology in affinity ligand discovery and development resulting in best-in-class ligand discovery and development lead-times. The acquisition gives the
94
Company a new platform for affinity resin development, including C>, and advances and expands the Company’s proteins and chromatography franchises to address the unique purification needs of gene therapies and other emerging modalities.
Consideration Transferred
The Avitide Acquisition was accounted for as a purchase of a business under ASC 805, “Business Combinations” and the Company engaged a third-party valuation firm to assist with the valuation of the business acquired. Under the terms of the Avitide Merger Agreement, all outstanding shares of capital stock of Avitide were cancelled and converted into the right to receive merger consideration with a value totaling up to $275.0 million, which consisted of upfront payments in aggregate of $150.0 million ($149.4 million, net of cash acquired) and up to an additional $125.0 million (undiscounted) in contingent consideration earnout payments if certain performance targets are achieved. Total consideration paid also included $0.8 million deposited into an escrow account against which the Company may make claims for indemnification. The Avitide Acquisition was funded through payment of $75.0 million in cash, the issuance of 271,096 unregistered shares of the Company’s common stock totaling $83.0 million and contingent consideration with fair value of approximately $88.4 million.
Under the acquisition method of accounting, the assets acquired and liabilities assumed of Avitide were recorded as of the acquisition date, at their respective fair values, and consolidated with those of the Company. The fair value of the net assets acquired is $2.1 million, fair value of the intangible assets acquired is $46.7 million, and the residual goodwill is $197.5 million. The Company has incurred $5.6 million of transaction and integration costs associated with the Avitide Acquisition from the date of acquisition to December 31, 2022, with $3.0 million of transaction and integration costs incurred in 2022 and $2.6 million in 2021. The transaction costs are included in operating expenses in the consolidated statements of comprehensive income for the periods ended December 31, 2022 and 2021.
The preparation of the valuation required the use of significant assumptions and estimates. Critical estimates included, but were not limited to, future expected cash flows, including projected revenues and expenses, and the applicable discount rates. These estimates were based on assumptions that the Company believes to be reasonable. However, actual results may differ from these estimates.
Total consideration transferred is as follows (amounts in thousands):
Cash consideration |
| $ | 74,962 |
|
Equity consideration |
|
| 82,968 |
|
Contingent consideration - earnout |
|
| 88,373 |
|
Fair value of net assets acquired |
| $ | 246,303 |
|
|
|
|
| |
Fair Value of Net Assets Acquired
The allocation of purchase price is based on the fair value of assets acquired and liabilities assumed as of the acquisition date, based on the final valuation of Avitide. The Company has made appropriate adjustments to the purchase price allocation during the measurement period, which ended on September 20, 2022.
95
The components and estimated allocation of the purchase price consist of the following (amounts in thousands):
Cash and cash equivalents |
| $ | 572 |
|
Accounts receivable |
|
| 228 |
|
Inventory |
|
| 332 |
|
Prepaid expenses and other current assets |
|
| 114 |
|
Property and equipment |
|
| 1,862 |
|
Operating lease right of use asset |
|
| 3,648 |
|
Customer relationships |
|
| 24,580 |
|
Developed technology |
|
| 20,650 |
|
Trademark and tradename |
|
| 1,210 |
|
Non-competition agreements |
|
| 210 |
|
Goodwill |
|
| 197,476 |
|
Long term deferred tax asset |
|
| 1,525 |
|
Accounts payable |
|
| (215 | ) |
Accrued liabilities |
|
| (2,183 | ) |
Operating lease liability |
|
| (698 | ) |
Operating lease liability, long-term |
|
| (2,950 | ) |
Other liabilities |
|
| (58 | ) |
Fair value of net assets acquired |
| $ | 246,303 |
|
Acquired Goodwill
The goodwill of $197.5 million represents future economic benefits expected to arise from anticipated synergies from the integration of Avitide. These synergies include certain cost savings, operating efficiencies and other strategic benefits projected to be achieved as a result of the Avitide Acquisition. Substantially all of the goodwill recorded is expected to be nondeductible for income tax purposes. During 2022, the Company recorded adjustments to goodwill of $1.8 million related to a change in estimated tax benefits associated with the net operating loss carryforward filed on the Avitide pre-acquisition tax return. The offset of these adjustments is included in long term deferred tax asset in the table above.
Intangible Assets
The following table sets forth the components of the identified intangible assets associated with the Avitide Acquisition and their estimated useful lives:
|
| Useful life |
| Fair Value |
| |
|
|
|
| (Amounts in thousands) |
| |
|
|
|
|
| ||
Customer relationships |
| 13 years |
| $ | 24,580 |
|
Developed technology |
| 15 years |
|
| 20,650 |
|
Trademark and tradename |
| 18 years |
|
| 1,210 |
|
Non-competition agreements |
| 3 years |
|
| 210 |
|
|
|
| $ | 46,650 |
| |
Polymem S.A.
On June 22, 2021, the Company entered into a Stock Purchase Agreement with Polymem, a company organized under the laws of France, and Jean-Michel Espenan and Franc Saux, acting together jointly and severally as the representatives of the sellers pursuant to which Repligen acquired all of the outstanding common stock of Polymem for $47.0 million in cash. The transaction closed on July 1, 2021 (the “Polymem Acquisition.”).
Polymem, which is headquartered in, Toulouse, France, is a manufacturer of hollow fiber (“HF”) membranes, membrane modules and systems for industrial and bioprocessing applications. Polymem products will complement and expand the Company’s portfolio of HF systems and consumables. The acquisition substantially increases Repligen’s membrane and module manufacturing capacity and establishes a world-class center of excellence in Europe to address the accelerating global demand for these innovative products.
96
Consideration Transferred
The Company accounted for the Polymem Acquisition as a purchase of a business under ASC 805 and the Company engaged a third-party valuation firm to assist with the valuation of the business acquired. Payment for the transaction was denominated in Euros but is reflected here in U.S. dollars for presentation purposes based on an exchange rate of 0.8437 as of July 1, 2021, the date of acquisition. Total consideration paid was $47.0 million, which included $4.3 million deposited into an escrow account against which the Company may make claims for indemnification.
Under the acquisition method of accounting, the assets acquired and liabilities assumed of Polymem were recorded as of the acquisition date, at their respective fair values, and consolidated with those of the Company. The fair value of the net assets acquired is $2.2 million, the fair value of the intangible assets acquired is $9.1 million, and the residual goodwill is $35.7 million. Acquisition-related costs are not included as a component of consideration transferred but are expensed in the periods in which costs are incurred. The Company incurred $8.2 million of transaction and integration costs associated with the Polymem Acquisition from the date of acquisition to December 31, 2022, with $5.1 million incurred in 2022 and $3.1 million incurred from the date of acquisition to December 31, 2021. The transaction costs are included in operating expenses in the consolidated statements of comprehensive income for the periods ended December 31, 2022 and 2021.
Fair Value of Net Assets Acquired
The allocation of purchase price is based on the fair value of assets acquired and liabilities assumed as of the acquisition date, based on the final valuation of Polymem. The Company has made appropriate adjustments to the purchase price allocation during the measurement period, which ended on July 1, 2022.
The components and final allocation of the purchase price consist of the following (amounts in thousands):
Cash and cash equivalents |
| $ | 353 |
|
Net working capital (excluding cash and inventory |
|
| 414 |
|
Inventory step-up |
|
| 543 |
|
Operating lease right of use assets |
|
| 1,424 |
|
Property and equipment |
|
| 3,145 |
|
Other assets |
|
| 41 |
|
Developed technology |
|
| 8,274 |
|
Trademark and tradenames |
|
| 510 |
|
Non-compete agreements |
|
| 312 |
|
Goodwill |
|
| 35,680 |
|
Operating lease liability |
|
| (1,253 | ) |
Long term deferred tax liability |
|
| (2,327 | ) |
Other long-term liabilities |
|
| (143 | ) |
Fair value of net assets acquired |
| $ | 46,973 |
|
Acquired Goodwill
The goodwill of $35.7 million represents future economic benefits expected to arise from anticipated synergies from the integration of Polymem. These synergies include certain operating efficiencies and strategic benefits projected to be achieved as a result of the Polymem Acquisition. Substantially all of the goodwill recorded is expected to be nondeductible for income tax purposes.
97
Intangible Assets
The following table sets forth the components of the identified intangible assets associated with the Polymem Acquisition and their estimated useful lives:
|
| Useful life |
| Fair Value |
| |
|
|
|
| (Amounts in thousands) |
| |
Developed technology |
| 13 years |
| $ | 8,274 |
|
Trademark and tradename |
| 14 years |
|
| 510 |
|
Non-competition agreements |
| 5 years |
|
| 312 |
|
|
|
|
| $ | 9,096 |
|
In July 2023, the Board authorized the Company's management team to undertake restructuring activities to simplify and streamline our organization and strengthen the overall effectiveness of our operations. In addition to the initial streamlining and re-balancing efforts contemplated in July, the Company is undertaking further restructuring activities (collectively, the “Restructuring Plan”) which include consolidating a portion of our manufacturing operations between certain U.S. locations, discontinuing the sale of certain product SKUs, and evaluating the fair value of finished goods and raw materials, mostly secured during the 2020-2022 COVID-19 pandemic period (the “COVID-19 Period”) to meet increasing demand during a challenging supply chain environment in the industry.
The Company recorded pre-tax costs of $32.2 million in 2023 related to the Restructuring Plan and expects the Restructuring Plan to be completed by the end of the third quarter of 2024. Of the $32.2 million in pre-tax costs in 2023, $27.6 million is non-cash, relating primarily to inventory adjustments to record inventory at net realizable value and accelerated depreciation on equipment related to the shutdown of manufacturing facilities and production lines, the remaining costs are cash expenses, primarily related to severance and employee-related costs.
The following table summarizes the charges related to restructuring activities by type of cost:
|
| For the Year Ended December 31, 2023 |
| |||||||||||||||||
|
| Severance & Employee-Related Costs |
|
| Inventory Adjustments |
|
| Accelerated Depreciation |
|
| Facility and Other Exit Costs |
|
| Total |
| |||||
|
| (Amounts in thousands) |
| |||||||||||||||||
Cost of product revenue |
| $ | 2,077 |
|
| $ | 23,588 |
|
| $ | 3,788 |
|
| $ | 933 |
|
| $ | 30,386 |
|
Research and development |
|
| 116 |
|
|
| — |
|
|
| — |
|
|
| — |
|
|
| 116 |
|
Selling, general and administrative |
|
| 1,532 |
|
|
| — |
|
|
| 28 |
|
|
| 138 |
|
|
| 1,698 |
|
|
| $ | 3,725 |
|
| $ | 23,588 |
|
| $ | 3,816 |
|
| $ | 1,071 |
|
| $ | 32,200 |
|
|
|
|
|
|
|
|
|
|
|
|
|
|
|
|
| |||||
Severance and employee-related costs under the Restructuring Plan are associated with actual headcount reductions. Costs incurred include cash severance and non-cash severance, including other termination benefits. Severance and other termination benefit packages are based on established benefit arrangements or local statutory requirements and we recognized the contractual component of these benefits when payment was probable and could be reasonably estimated.
The inventory adjustments include the impact of the Company discontinuing the sale of certain product SKUs and the impact of having proactively secured materials during the COVID-19 Period to meet accelerated demand during a challenging supply chain environment in the industry. Where demand has reduced, finished goods and raw materials, whose value exceeded the projected requirements to be used before reaching their expiration date, were written down to their realizable value. The Restructuring Plan also includes the closing of manufacturing facilities and production lines, which included inventory that could not be repurposed.
Non-cash charges for accelerated depreciation were recognized on long-lived assets that were taken out of service before the end of their normal service due to the shutdown of manufacturing facilities and production lines, in which case depreciation estimates were revised to reflect the use of the assets over their shortened useful life.
98
The restructuring accrual is included in accrued liabilities on the condensed consolidated balance sheets as of December 31, 2023 and the balance has been paid as of that date. Activity related to the Restructuring Plan for 2023 was as follows (amounts in thousands):
|
| Restructuring Costs |
|
| Amounts Paid in 2023 |
|
| Non-Cash Restructuring Items |
|
| Restructuring Liability |
| ||||
|
|
|
|
|
|
|
|
|
|
|
|
| ||||
Severance & employee-related costs |
| $ | 3,725 |
|
| $ | (3,044 | ) |
| $ | (217 | ) |
| $ | 464 |
|
Inventory adjustments |
|
| 23,588 |
|
|
| — |
|
|
| (23,588 | ) |
|
| — |
|
Accelerated depreciation |
|
| 3,816 |
|
|
| — |
|
|
| (3,816 | ) |
|
| — |
|
Facility exit and other exit costs |
|
| 1,071 |
|
|
| (1,061 | ) |
|
| (10 | ) |
|
| — |
|
Total |
| $ | 32,200 |
|
| $ | (4,105 | ) |
| $ | (27,631 | ) |
| $ | 464 |
|
|
|
|
|
|
|
|
|
|
|
|
|
| ||||
The Company is a lessee under leases of manufacturing facilities, office spaces, machinery, certain office equipment and vehicles. A majority of the Company’s leases are operating leases with remaining lease terms between one month and 13 years. Finance leases are immaterial to the Company’s consolidated financial statements. The Company determines if an arrangement qualifies as a lease and what type of lease it is at inception. The Company elected the package of practical expedients permitted under the transition guidance within the new lease standard, which among other things, allowed it to continue to account for existing leases based on the historical lease classification. The Company also elected the practical expedients to combine lease and non-lease components and to exclude right of use assets and lease liabilities for leases with an initial term of 12 months or less from the balance sheet.
Some of the lease agreements the Company enters into include Company options to either extend and/or early terminate the lease, the costs of which are included in the Company’s operating lease liabilities to the extent that such options are reasonably certain of being exercised. Leases with renewal options allow the Company to extend the lease term typically between 1 and 5 years per option, some of its leases have multiple options to extend. When determining if a renewal option is reasonably certain of being exercised, the Company considers several economic factors, including but not limited to, the significance of leasehold improvements incurred on the property, whether the asset is difficult to replace, underlying contractual obligations, or specific characteristics unique to that particular lease that would make it reasonably certain that the Company would exercise such options.
As of December 31, 2023 and 2022, operating lease right of use assets were $115.5 million and $125.0 million, respectively and operating lease liabilities were $132.2 million and $138.3 million, respectively. The addition of FlexBiosys and Metenova in 2023 added 43,833 square feet to our leased properties and as a result of that and the expansion in Toulouse, France, the operating right of use asset balance increased $4.0 million in 2023, as compared to 2022. However, the consolidated right of use assets balance decreased due to the normal amortization of existing leases during 2023.
The maturities of the Company’s operating lease liabilities as of December 31, 2023 are as follows (amounts in thousands):
As of December 31, 2023 |
| Amount |
| |
2024 |
| $ | 22,585 |
|
2025 |
|
| 25,645 |
|
2026 |
|
| 25,406 |
|
2027 |
|
| 23,944 |
|
2028 |
|
| 24,382 |
|
2029 and thereafter |
|
| 79,435 |
|
Total future minimum lease payments(1) |
|
| 201,397 |
|
Less lease incentives |
|
| (9,765 | ) |
Less amount of lease payment representing interest |
|
| (32,595 | ) |
Total operating lease liabilities |
| $ | 159,037 |
|
99
Total operating lease liabilities included on the Company’s consolidated balance sheets are as follows (amounts in thousands):
|
| December 31, |
| |||||
|
| 2023 |
|
| 2022 |
| ||
Operating lease liability |
| $ | 5,631 |
|
| $ | 6,957 |
|
Operating lease liability, long-term |
|
| 126,578 |
|
|
| 131,389 |
|
Minimum operating lease payments |
| $ | 132,209 |
|
| $ | 138,346 |
|
|
|
|
|
|
|
| ||
Lease expense for these leases is recognized on a straight-line basis over the lease term, with variable lease payments recognized in the period those payments are incurred. For the years ended December 31, 2023, 2022 and 2021, total lease cost is comprised of the following:
|
| For the Years Ended December 31, |
| |||||||||
Lease Cost |
| 2023 |
|
| 2022 |
|
| 2021 |
| |||
|
| (Amounts in thousands) |
| |||||||||
Operating lease cost |
| $ | 20,981 |
|
| $ | 17,833 |
|
| $ | 9,838 |
|
Variable operating lease cost |
|
| 4,075 |
|
|
| 11,317 |
|
|
| 7,118 |
|
Lease cost |
| $ | 25,056 |
|
| $ | 29,150 |
|
| $ | 16,956 |
|
|
|
|
|
|
|
|
|
|
| |||
The following information represents supplemental disclosure for the consolidated statements of cash flows related to operating leases (amounts in thousands):
|
| For the Years Ended December 31, |
| |||||||||
|
| 2023 |
|
| 2022 |
|
| 2021 |
| |||
Operating lease cost |
| $ | (17,862 | ) |
| $ | (13,757 | ) |
| $ | (8,863 | ) |
Most of the leases do not provide implicit interest rates and therefore the Company determines the discount rate based on its incremental borrowing rate. The incremental borrowing rate for the Company’s leases is determined based on lease term and currency in which the lease payments are made.
The weighted average remaining lease term and the weighted average discount rate used to measure the Company’s operating lease liabilities as of December 31, 2023, were:
Weighted average remaining lease term (years) | 7.74 | |||
Weighted average discount rate | 4.13 | % |
100
For the Years Ended December 31, | ||||||||||||
2020 | 2019 | 2018 | ||||||||||
(Amounts in thousands) | ||||||||||||
Cash and cash equivalents | $ | 717,292 | $ | 528,392 | $ | 193,822 | ||||||
Restricted cash | — | 9,015 | — | |||||||||
Total cash, cash equivalents, and restricted cash | $ | 717,292 | $ | 537,407 | $ | 193,822 | ||||||
| ||
For the Years Ended December 31, | ||||||||||||
2020 | 2019 | 2018 | ||||||||||
(Amounts in thousands, except per share data) | ||||||||||||
Net income | $ | 59,926 | $ | 21,411 | $ | 16,617 | ||||||
Weighted average shares used in computing net income per share - basic | 52,554 | 48,343 | 43,767 | |||||||||
Effect of dilutive shares: | ||||||||||||
Options and stock units | 971 | 864 | 581 | |||||||||
Convertible senior notes | 367 | — | 1,123 | |||||||||
Dilutive potential common shares | 1,338 | 864 | 1,704 | |||||||||
Weighted average shares used in computing net income per share - diluted | 53,892 | 49,206 | 45,471 | |||||||||
Earnings per share: | ||||||||||||
Basic | $ | 1.14 | $ | 0.44 | $ | 0.38 | ||||||
Diluted | $ | 1.11 | $ | 0.44 | $ | 0.37 | ||||||
For the Years Ended December 31, | ||||||||||||
2020 (1) | 2019 (2) | 2018 | ||||||||||
(Amounts in thousands) | ||||||||||||
Filtration products | $ | 174,896 | $ | 119,534 | $ | 90,586 | ||||||
Chromatography products | 73,551 | 64,635 | 45,326 | |||||||||
Process analytics products | 33,346 | 16,405 | — | |||||||||
Proteins products | 80,732 | 65,124 | 54,375 | |||||||||
Other | 3,611 | 4,399 | 3,604 | |||||||||
Total product revenue | $ | 366,136 | $ | 270,097 | $ | 193,891 | ||||||
For the Years Ended December 31, | ||||||||||||
2020 | 2019 | 2018 | ||||||||||
Revenue by customers’ geographic locations: | ||||||||||||
North America | 48 | % | 51 | % | 48 | % | ||||||
Europe | 38 | % | 37 | % | 40 | % | ||||||
APAC/Other | 14 | % | 12 | % | 12 | % | ||||||
Total revenue | 100 | % | 100 | % | 100 | % | ||||||
December 31, | ||||||||
2020 | 2019 | |||||||
(Amounts in thousands) | ||||||||
Total assets by geographic locations: | ||||||||
North America | $ | 1,697,149 | $ | 1,260,217 | ||||
Europe | 188,698 | 133,599 | ||||||
APAC | 17,040 | 6,297 | ||||||
Total assets by geographic location | $ | 1,902,887 | $ | 1,400,113 | ||||
December 31, | ||||||||
2020 | 2019 | |||||||
(Amounts in thousands) | ||||||||
Long-lived assets by geographic locations: | ||||||||
North America | $ | 78,429 | $ | 66,756 | ||||
Europe | 12,918 | 6,775 | ||||||
APAC | 1,272 | 869 | ||||||
Total long-lived assets by geographic location | $ | 92,619 | $ | 74,400 | ||||
For the Years Ended December 31, | ||||||||||||
2020 | 2019 | 2018 | ||||||||||
MilliporeSigma | 11 | % | 13 | % | 15 | % | ||||||
Cytiva (formerly GE Healthcare) | N/A | 12 | % | 15 | % | |||||||
Cash consideration | $ | 130,713 | ||
Equity consideration | 69,422 | |||
Contingent consideration | 1,548 | |||
Settlement of preexisting liabilities | 2,310 | |||
Fair value of net assets acquired | $ | 203,993 | ||
Cash and cash equivalents | $ | 2,982 | ||
Accounts receivable | 4,811 | |||
Inventory | 8,592 | |||
Prepaid expenses and other current assets | 5,561 | |||
Property and equipment | 1,836 | |||
Operating lease right of use asset | 1,611 | |||
Other noncurrent assets | 26 | |||
Customer relationships | 38,400 | |||
Developed technology | 27,060 | |||
Trademark and tradename | 1,630 | |||
Non-competition agreements | 300 | |||
Goodwill | 128,658 | |||
Accounts payable | (2,161 | ) | ||
Accrued liabilities | (8,856 | ) | ||
Deferred revenue | (3,583 | ) | ||
Deferred tax liabilities, net | (1,240 | ) | ||
Notes payable | (24 | ) | ||
Operating lease liability | (417 | ) | ||
Operating lease liability, long-term | (1,193 | ) | ||
Fair value of net assets acquired | $ | 203,993 | ||
Useful life | Fair Value | |||||||
(Amounts in thousands) | ||||||||
Customer relationships | 17 years | $ | 38,400 | |||||
Developed technology | 15 years | 27,060 | ||||||
Trademark and tradename | 21 years | 1,630 | ||||||
Non-competition agreements | 3 years | 300 | ||||||
| $ | 67,390 | |||||||
Cash and cash equivalents | $ | 1,163 | ||
Accounts receivable | 415 | |||
Inventory | 334 | |||
Prepaid expenses and other current assets | 13 | |||
Property and equipment | 73 | |||
Operating lease right of use asset | 194 | |||
Customer relationships | 6,370 | |||
Developed technology | 1,810 | |||
Trademark and tradename | 190 | |||
Non-competition agreements | 90 | |||
Goodwill | 6,784 | |||
Deferred tax assets | 24 | |||
Accounts payable | (96 | ) | ||
Accrued liabilities | (999 | ) | ||
Operating lease liability | (136 | ) | ||
Operating lease liability, long-term | (59 | ) | ||
Fair value of net assets acquired | $ | 16,170 | ||
Useful life | Fair Value | |||||||
(Amounts in thousands) | ||||||||
Customer relationships | 14 years | $ | 6,370 | |||||
Developed technology | 12 years | 1,810 | ||||||
Trademark and tradename | 15 years | 190 | ||||||
Non-competition agreements | 3 years | 90 | ||||||
| $ | 8,460 | |||||||
Cash and cash equivalents | $ | 69 | ||
Accounts receivable | 1,057 | |||
Inventory | 449 | |||
Prepaid expenses and other current assets | 7 | |||
Property and equipment | 472 | |||
Operating lease right of use assets | 1,050 | |||
Customer relationships | 11,080 | |||
Developed technology | 2,910 | |||
Trademark and tradename | 320 | |||
Non-compete agreements | 50 | |||
Goodwill | 12,585 | |||
Accounts payable | (283 | ) | ||
Accrued liabilities | (202 | ) | ||
Operating lease liability | (211 | ) | ||
Operating lease liability, long-term | (839 | ) | ||
Fair value of net assets acquired | $ | 28,514 | ||
Useful life | Fair Value | |||||||
(Amounts in thousands) | ||||||||
Customer relationships | 14 years | $ | 11,080 | |||||
Developed technology | 11 years | 2,910 | ||||||
Trademark and tradename | 14 years | 320 | ||||||
Non-competition agreements | 3 years | 50 | ||||||
| $ | 14,360 | |||||||
Cash and cash equivalents | $ | 3,795 | ||
Restricted cash | 26,933 | |||
Accounts receivable | 3,044 | |||
Inventory | 3,783 | |||
Prepaid expenses and other current assets | 93 | |||
Fixed assets | 40 | |||
Operating lease right of use asset | 3,836 | |||
Customer relationships | 59,680 | |||
Developed technology | 28,920 | |||
Trademark and tradename | 1,570 | |||
Non-competition agreements | 660 | |||
Goodwill | 142,314 | |||
Deferred taxes | 895 | |||
Accounts payable | (436 | ) | ||
Accrued liabilities | (2,767 | ) | ||
Accrued bonus | (26,928 | ) | ||
Deferred revenue | (1,709 | ) | ||
Operating lease liability | (51 | ) | ||
Operating lease liability, long-term | (3,785 | ) | ||
Fair value of net assets acquired | $ | 239,887 | ||
December 31, | ||||||||
2019 | 2018 | |||||||
Total revenue | $ | 279,434 | $ | 217,739 | ||||
Net income | $ | 23,394 | $ | 21,195 | ||||
Earnings per share: | ||||||||
Basic | $ | 0.48 | $ | 0.44 | ||||
Diluted | $ | 0.48 | $ | 0.43 | ||||
As of December 31, 2020 | Amount | |||
2021 | $ | 7,007 | ||
2022 | 5,732 | |||
2023 | 4,614 | |||
2024 | 4,162 | |||
2025 | 3,653 | |||
2026 and thereafter | 12,949 | |||
Total future minimum lease payments | 38,117 | |||
Less: amount of lease payment representing interest | 6,438 | |||
Total operating lease liabilities | $ | 31,679 | ||
December 31, | ||||||||
2020 | 2019 | |||||||
Operating lease liability | $ | 5,254 | $ | 3,557 | ||||
Operating lease liability, long-term | 26,425 | 26,995 | ||||||
Minimum operating lease payments | $ | 31,679 | $ | 30,552 | ||||
For the Years Ended December 31, | ||||||||
Lease Cost | 2020 | 2019 | ||||||
(Amounts in thousands) | ||||||||
Operating lease cost | $ | 5,645 | $ | 4,480 | ||||
Variable operating lease cost | 2,033 | 1,480 | ||||||
Lease cost | $ | 7,678 | $ | 5,960 | ||||
For the Years Ended December 31, | ||||||||
2020 | 2019 | |||||||
Operating lease cost | $ | (5,647 | ) | $ | (4,004 | ) | ||
Disaggregation of Revenue
Revenue for the years ended December 31, 2020, 20192023, 2022 and 20182021 was as follows (amounts in thousands, except percentages):follows:
|
| For the Years Ended December 31, |
|
|
| |||||
|
| 2023 |
|
| 2022 |
|
|
| ||
|
| (Amounts in thousands) |
|
|
| |||||
Product revenue |
| $ | 638,381 |
|
| $ | 801,183 |
|
|
|
Royalty and other income |
|
| 383 |
|
|
| 353 |
|
|
|
Total revenue |
| $ | 638,764 |
|
| $ | 801,536 |
|
|
|
For the Years Ended December 31, | ||||||||||||
2020 | 2019 | 2018 | ||||||||||
(Amounts in thousands) | ||||||||||||
Product revenue | $ | 366,136 | $ | 270,097 | $ | 193,891 | ||||||
Royalty and other income | 124 | 148 | 141 | |||||||||
Total revenue | $ | 366,260 | $ | 270,245 | $ | 194,032 | ||||||
When disaggregating revenue, the Company considered all of the economic factors that may affect its revenues. Because all of its revenues are from bioprocessing customers, there are no differences in the nature, timing and uncertainty of the Company’s revenues and cash flows from any of its product lines. However, given that the Company’s revenues are generated in different geographic regions, factors such as regulatory and geopolitical factors within those regions could impact the nature, timing and uncertainty of the Company’s revenues and cash flows. In addition, a significant portion of the Company’s revenues are generated from two customers; therefore, economic factors specific to these two customers could impact the nature, timing and uncertainty of the Company’s revenues and cash flows.
Disaggregated revenue from contracts with customers by geographic region can be found in Note 2.,
There was no revenue from significant customers that represent 10%represented 10% or more of the Company’sCompany's total revenue is as follows (amounts in thousands):
For the Years Ended December 31, | ||||||||||||
2020 | 2019 | 2018 | ||||||||||
MilliporeSigma | $ | 39,511 | $ | 36,190 | $ | 29,843 | ||||||
Cytiva (formerly GE Healthcare) | N/A | $ | 31,441 | $ | 29,616 | |||||||
Filtration Products
The Company’s filtration products generate revenue through the sale of KrosFlo®hollow fiber TFF and ARTeSYN tangential flow filtration (“TFF”) systems, TangenXhollow fiber HF filters, membranes and modules, XCell ATF®single-useflow path Flow Path assemblies and custom silicone-based,EMT,Metenova, FlexBiosys, BioFlex, Polymem, ARTeSYN Biosolutions Holdings Ireland Limited, NMS and ARTeSYN, threeEMT, seven acquisitions completed insince 2020.
The Company’s KrosFlo and ARTeSYN systems are used in the filtration, isolation, purification and concentration of biologics and diagnostic products. TFF is a rapid and efficient method for separation and purification of biomolecules that is widely used in laboratory, process development and process scale applications in biopharmaceutical manufacturing. Sales of large-scale systems generally include components and
The Company’s TangenX flat sheetFS cassettes (SIUS,®, SIUS Gammaflat sheetFS cassettes is generally recognized at a point in time upon transfer of control of the customer.
The Company’s other filtration product offerings are not highly interdependent of one another and are therefore considered distinct products that represent separate performance obligations. Revenue on these products is generally recognized at a point in time upon transfer of control to the customer. The Company invoices the customer for the installation and training services in an
101
amount that directly corresponds with the value to the customer of the Company’s performance to date; therefore, revenue recognized is based on the amount billable to the customer in accordance with the practical expedient under ASC
The Company also markets the XCell ATF system, acontrollers, which are technologically advanced filtration devicedevices used in upstream processes to continuously remove cellular metabolic waste products during the course of a fermentation run, freeing healthy cells to continue producing the biologic drug of interest. XCell ATF systemscontrollers are typically include a filtration system andsold with consumables (i.e., tubing sets, metal stands) as well as training and installation services at the request of the customer. The filtration systemcontrollers and consumables are considered distinct products and therefore represent separate performance obligations. First time purchasers of the systemscontrollers typically purchase a controller that is shipped with the tubing set(s) and metal stand(s). The controller is not considered distinct as it is a proprietary product that is highly interdependent with the filtration system; therefore, the controller is combined with the filtration system and accounted for as a single performance obligation. The training and installation services do not significantly modify or customize the XCell ATF systemcontrollers and therefore represent a distinct performance obligation. XCell ATF system product revenue related to the filtration system (including the controller if applicable)controllers and consumables is generally recognized at a point in time upon transfer of control to the customer. XCell ATF system service revenue related to training and installation services is generally recognized over time, as the customer simultaneously receives and consumes the benefits as the Company performs. The Company invoices the customer for the installation and training services in an amount that directly corresponds with the value to the customer of the Company’s performance to date; therefore, revenue recognized is based on the amount billable to the customer in accordance with the practical expedient under ASC606-10-55-18.
Chromatography Products
The Company’s chromatography products include a number of products used in the downstream purification and quality control of biological drugs. The majority of chromatography revenue relates to the OPUS® In either scenario, the OPUS column and resin are not interdependent of one another and are therefore considered distinct products that represent separate performance obligations. Chromatography product revenue is generally recognized at a point in time upon transfer of control to the customer.
Process Analytics Products
The Process Analyticsprocess analytics franchise generates revenue primarily through the sale of the SoloVPE and FlowVPE Slope SpectroscopyFlowVPX slope spectroscopy systems, consumables and service. These products complement and support the Company’s existing Filtration, Chromatographyfiltration, chromatography and Proteinsproteins franchises as they allowmonitoring.
Protein Products
The Company’s Proteinprotein franchise generates revenue primarily through the sale of Protein A affinity ligands and growth factors. Protein A ligands are an essential component of Protein A chromatography resins (media) used in the purification of virtually all mAb-based drugs on the market or in development. The Company manufactures multiple forms of Protein A ligands under long-term supply agreements with major life sciences companies, who in turn sell their Protein A chromatography media to end users (biopharmaceutical manufacturers). The Company also manufactures growth factors for sale under long-term supply agreements with certain life sciences companies as well as for direct sales to its customers. Each protein product is considered distinct and therefore represents a separate performance obligation. Protein product revenue is generally recognized at a point in time upon transfer of control to the customer.
In 2021, the Company completed the Avitide Acquisition and added its diverse libraries and leading technology in affinity ligand discovery and development to its proteins franchise. The acquisition gives the Company a new platform for affinity resin development, including C>, and advances and expands the Company’s proteins and chromatography franchises to address the unique purification needs of gene therapies and other emerging modalities.
Other Products
The Company’s other products include operating room products sold to hospitals. Other product revenue is generally recognized at a point in time upon transfer of control to the customer.
Transaction Price Allocated to Future Performance Obligations
Remaining performance obligations represent the transaction price of contracts for which work has not been performed or has been partially performed. The Company’s future performance obligations relate primarily to the installation and training of
102
certain of its systems sold to customers. These performance obligations are completed within one year of receipt of a purchase order from its customers. Accordingly, the Company has elected to not disclose the value of these unsatisfied performance obligations as provided under ASC
Contract Balances from Contracts with Customers
The following table provides information about receivables and deferred revenue from contracts with customers as of December 31, 20202023 (amounts in thousands):
|
| December 31, |
|
| December 31, |
| ||
|
| 2023 |
|
| 2022 |
| ||
Balances from contracts with customers only: |
|
|
|
|
|
| ||
Accounts receivable |
| $ | 124,161 |
|
| $ | 116,247 |
|
Deferred revenue (included in accrued liabilities and |
| $ | 10,755 |
|
| $ | 19,631 |
|
Revenue recognized during periods presented relating to: |
|
|
|
|
|
| ||
The beginning deferred revenue balance |
| $ | 18,751 |
|
| $ | 13,390 |
|
2020 | 2019 | |||||||
Balances from contracts with customers only: | ||||||||
Accounts receivable | $ | 71,257 | $ | 43,068 | ||||
Deferred revenue (included in accrued liabilities in the consolidated balance sheets) | $ | 15,318 | $ | 5,005 | ||||
Revenue recognized during years presented relating to: | ||||||||
The beginning deferred revenue balance | $ | 3,361 | $ | 833 | ||||
Changes in pricing related to products or services satisfied in previous periods | — | — | ||||||
The timing of revenue recognition, billings and cash collections results in the accounts receivable and deferred revenue balances on the Company’s consolidated balance sheets.
A contract asset is created when the Company satisfies a performance obligation by transferring a promised good to the customer. Contract assets may represent conditional or unconditional rights to consideration. The right is conditional and recorded as a contract asset if the Company must first satisfy another performance obligation in the contract before it is entitled to payment from the customer. Contract assets are transferred to billed receivables once the right becomes unconditional. If the Company has the unconditional right to receive consideration from the customer, the contract asset is accounted for as a billed receivable and presented separately from other contract assets. A right is unconditional if nothing other than the passage of time is required before payment of that consideration is due.
When consideration is received, or such consideration is unconditionally due, from a customer prior to transferring goods or services to the customer under the terms of a contract, a contract liability is recorded. Contract liabilities are recognized as revenue after control of the products or services is transferred to the customer and all revenue recognition criteria have been met.
Costs to Obtain or Fulfill a Customer Contract
The Company’s sales commission structure is based on achieving revenue targets. The commissions are driven by revenue derived from customer purchase orders which are short term in nature.
Applying the practical expedient in paragraphstatementstatements of comprehensive income. When shipping and handling costs are incurred after a customer obtains control of the products, the Company accounts for these as costs to fulfill the promise and not as a separate performance obligation.
| 8. |
The Company is exposed to credit losses primarily through sales of products and services. The Company’s expected loss allowance methodology for accounts receivable is developed using historical collection experience, current and future economic and market conditions and a review of the current status of customers’customers' trade accounts receivable. Customers are pooled based on sharing specific risk factors, including geographic location. Due to the short-term nature of such receivables, the estimated accounts receivable that may not be collected is based on aging of the accounts receivable balances.
Customers are assessed for credit worthiness upfront through a credit review, which includes assessment based on the Company’s analysis of their financial statements when a credit rating is not available. The Company evaluates contract terms and conditions,
103
country and political risk, and may require prepayment to mitigate risk of loss. Specific allowance amounts are established to record the appropriate provision for customers that have a higher probability of default. The Company monitors changes to the receivables balance on a timely basis, and balances are written off as they are determined to be uncollectableuncollectible after all collection efforts have been exhausted. Estimates of potential credit losses are used to determine the allowance. It is based on assessment of anticipated payment and all other historical, current and future information that is reasonably available.
The accounts receivable balance on the Company’s consolidated balance sheetsheets as of December 31, 20202023 was $71.3$124.2 million, net of $0.8$2.1 million of allowances. The following table provides a roll-forward of the allowance for credit losses in 20202023 and 2022 that is deducted from the amortized cost basis of accounts receivable to present the net amount expected to be collected (amounts in thousands):
|
| For the Years Ended December 31, |
| |||||
|
| 2023 |
|
| 2022 |
| ||
Balance of allowance for credit losses, beginning of period |
| $ | (1,365 | ) |
| $ | (1,417 | ) |
Current period change for write-offs |
|
| 82 |
|
|
| 126 |
|
Current period change for expected credit losses |
|
| (839 | ) |
|
| (74 | ) |
Balance of allowance for credit losses, end of period |
| $ | (2,122 | ) |
| $ | (1,365 | ) |
|
|
|
|
|
|
| ||
2020 | ||||
Balance at January 1, 2020 | $ | (525 | ) | |
Current period change for expected credit losses | (133 | ) | ||
Balance at March 31, 2020 | $ | (658 | ) | |
Current period change for write-offs | 37 | |||
Current period change for expected credit losses | 83 | |||
Balance at June 30, 2020 | $ | (538 | ) | |
Current period change for expected credit losses | (83 | ) | ||
Balance at September 30, 2020 | $ | (621 | ) | |
Current period change for write-offs | 65 | |||
Current period change for expected credit losses | (206 | ) | ||
Balance at December 31, 2020 | $ | (762 | ) | |
Goodwill
Goodwill represents the difference between the purchase price and the estimated fair value of identifiable assets acquired and liabilities assumed. Goodwill acquired in a business combination and determined to have an indefinite useful life is not amortized, but instead is tested for impairment at least annually in accordance with ASC 350. The following table represents the changes in the carrying value of goodwill for the years ended December 31, 20202023 and 20192022 (amounts in thousands):
Balance as of December 31, 2021 |
| $ | 860,362 |
|
Measurement period adjustment - BioFlex |
|
| (346 | ) |
Measurement period adjustment - Avitide |
|
| (1,768 | ) |
Cumulative translation adjustment |
|
| (2,735 | ) |
Balance as of December 31, 2022 |
| $ | 855,513 |
|
Acquisition of FlexBiosys, Inc. |
|
| 14,321 |
|
Acquisition of Metenova Holding AB |
|
| 115,778 |
|
Cumulative translation adjustment |
|
| 1,508 |
|
Balance as of December 31, 2023 |
| $ | 987,120 |
|
During each of the fourth quarters of 2020, 20192023, 2022 and 2018,2021, the Company completed its annual impairment assessments and concluded that goodwill was not impaired in any of those years.
Intangible Assets
Intangible assets with a definitive life are amortized over their useful lives using the straight-line method, and the amortization expense is recorded within cost of product revenue and selling, general and administrative expense in the Company’s consolidated statements of comprehensive income. Intangible assets and their related useful lives are reviewed at least annually to determine if any adverse conditions existexisted that would indicate the carrying value of these assets may not be recoverable. More frequent impairment assessments are conducted if certain conditions exist, including a change in the competitive landscape, any internal decisions to pursue new or different technology strategies, a loss of a significant customer, or a significant change in the marketplace, including changes in the prices paid for the Company’s products or changes in the size of the market for the Company’s products. If impairment indicators are present, the Company determines whether the underlying intangible asset is recoverable through estimated future undiscounted cash flows. If the asset is not found to be recoverable, it is written down to the estimated fair value of the asset based on the sum of the future discounted cash flows expected to result from the use and disposition of the asset. If the estimate of an intangible asset’s remaining useful life is changed, the remaining carrying amount of
104
the intangible asset is amortized prospectively over the revised remaining useful life. The Company continues to believe that its definite-lived intangible assets are recoverable at December 31, 2020.
Indefinite-lived intangible assets are tested for impairment at least annually. There has been no impairment of our intangible assets for the periods presented.
Intangible assets, net consisted of the following at December 31, 2020:
December 31, 2020 | ||||||||||||||||
Gross Carrying Value | Accumulated Amortization | Net Carrying Value | Weighted Average Useful Life (in years) | |||||||||||||
(Amounts in thousands) | ||||||||||||||||
Finite-lived intangible assets: | ||||||||||||||||
Technology - developed | $ | 114,217 | $ | (14,444 | ) | $ | 99,773 | 17 | ||||||||
Patents | 240 | (240 | ) | — | 8 | |||||||||||
Customer relationships | 217,790 | (37,333 | ) | 180,457 | 16 | |||||||||||
Trademarks | 5,893 | (541 | ) | 5,352 | 20 | |||||||||||
Other intangibles | 2,142 | (1,324 | ) | 818 | 3 | |||||||||||
Total finite-lived intangible assets | 340,282 | (53,882 | ) | 286,400 | 16 | |||||||||||
Indefinite-lived intangible asset: | ||||||||||||||||
Trademarks | 700 | — | 700 | — | ||||||||||||
Total intangible assets | $ | 340,982 | $ | (53,882 | ) | $ | 287,100 | |||||||||
|
| December 31, 2023 |
| |||||||||||||
|
| Gross |
|
| Accumulated |
|
| Net |
|
| Weighted |
| ||||
|
| (Amounts in thousands) |
|
|
|
| ||||||||||
Finite-lived intangible assets: |
|
|
|
|
|
|
|
|
|
|
|
| ||||
Technology - developed |
| $ | 249,594 |
|
| $ | (44,162 | ) |
| $ | 205,432 |
|
|
| 16 |
|
Patents |
|
| 240 |
|
|
| (240 | ) |
|
| — |
|
|
| 8 |
|
Customer relationships |
|
| 269,949 |
|
|
| (83,963 | ) |
|
| 185,986 |
|
|
| 15 |
|
Trademarks |
|
| 8,757 |
|
|
| (1,789 | ) |
|
| 6,968 |
|
|
| 19 |
|
Other intangibles |
|
| 3,914 |
|
|
| (2,514 | ) |
|
| 1,400 |
|
|
| 3 |
|
Total finite-lived intangible assets |
|
| 532,454 |
|
|
| (132,668 | ) |
|
| 399,786 |
|
|
| 15 |
|
Indefinite-lived intangible asset: |
|
|
|
|
|
|
|
|
|
|
|
| ||||
Trademarks |
|
| 700 |
|
|
| — |
|
|
| 700 |
|
|
| — |
|
Total intangible assets |
| $ | 533,154 |
|
| $ | (132,668 | ) |
| $ | 400,486 |
|
|
|
| |
Intangible assets consisted of the following at December 31, 2019:2022:
|
| December 31, 2022 |
| |||||||||||||
|
| Gross |
|
| Accumulated |
|
| Net |
|
| Weighted |
| ||||
|
| (Amounts in thousands) |
|
|
|
| ||||||||||
Finite-lived intangible assets: |
|
|
|
|
|
|
|
|
|
|
|
| ||||
Technology - developed |
| $ | 190,463 |
|
| $ | (30,992 | ) |
| $ | 159,471 |
|
|
| 16 |
|
Patents |
|
| 240 |
|
|
| (240 | ) |
|
| — |
|
|
| 8 |
|
Customer relationships |
|
| 252,934 |
|
|
| (66,559 | ) |
|
| 186,375 |
|
|
| 15 |
|
Trademarks |
|
| 7,682 |
|
|
| (1,319 | ) |
|
| 6,363 |
|
|
| 19 |
|
Other intangibles |
|
| 2,811 |
|
|
| (2,044 | ) |
|
| 767 |
|
|
| 4 |
|
Total finite-lived intangible assets |
|
| 454,130 |
|
|
| (101,154 | ) |
|
| 352,976 |
|
|
| 16 |
|
Indefinite-lived intangible asset: |
|
|
|
|
|
|
|
|
|
|
|
| ||||
Trademarks |
|
| 700 |
|
|
| — |
|
|
| 700 |
|
|
| — |
|
Total intangible assets |
| $ | 454,830 |
|
| $ | (101,154 | ) |
| $ | 353,676 |
|
|
|
| |
December 31, 2019 | ||||||||||||||||
Gross Carrying Value | Accumulated Amortization | Net Carrying Value | Weighted Average Useful Life (in years) | |||||||||||||
(Amounts in thousands) | ||||||||||||||||
Finite-lived intangible assets: | ||||||||||||||||
Technology - developed | $ | 82,169 | $ | (9,669 | ) | $ | 72,500 | 19 | ||||||||
Patents | 240 | (240 | ) | — | 8 | |||||||||||
Customer relationships | 160,825 | (25,642 | ) | 135,183 | 15 | |||||||||||
Trademarks | 3,752 | (333 | ) | 3,419 | 20 | |||||||||||
Other intangibles | 1,697 | (947 | ) | 750 | 3 | |||||||||||
Total finite-lived intangible assets | 248,683 | (36,831 | ) | 211,852 | 16 | |||||||||||
Indefinite-lived intangible asset: | ||||||||||||||||
Trademarks | 700 | — | 700 | — | ||||||||||||
Total intangible assets | $ | 249,383 | $ | (36,831 | ) | $ | 212,552 | |||||||||
105
Amortization expense for finite-lived intangible assets was $16.1$31.1 million, $13.6$27.1 million and $10.6$22.1 million for the years ended December 31, 2020, 20192023, 2022 and 2018,2021, respectively. As of December 31, 2020,2023, the Company expects to record the following amortization expense (amounts in thousands):
|
| Estimated |
| |
|
| Amortization |
| |
For the Years Ended December 31, |
| Expense |
| |
2024 |
| $ | 34,314 |
|
2025 |
|
| 33,879 |
|
2026 |
|
| 33,524 |
|
2027 |
|
| 33,421 |
|
2028 |
|
| 32,689 |
|
2029 and thereafter |
|
| 231,959 |
|
Total |
| $ | 399,786 |
|
For the Years Ended December 31, | Estimated Amortization Expense | |||
2021 | $ | 20,767 | ||
2022 | 20,765 | |||
2023 | 20,648 | |||
2024 | 20,080 | |||
2025 | 19,813 | |||
2026 and thereafter | 184,327 | |||
Total | $ | 286,400 | ||
Inventories, net
Inventories, net consists of the following:
|
| December 31, |
| |||||
|
| 2023 |
|
| 2022 |
| ||
|
| (Amounts in thousands) |
| |||||
Raw materials |
| $ | 123,598 |
|
| $ | 149,438 |
|
Work-in-process |
|
| 4,492 |
|
|
| 6,183 |
|
Finished products |
|
| 74,231 |
|
|
| 82,656 |
|
Total inventories, net |
| $ | 202,321 |
|
| $ | 238,277 |
|
|
|
|
|
|
|
| ||
December 31, | ||||||||
2020 | 2019 | |||||||
(Amounts in thousands) | ||||||||
Raw materials | $ | 48,746 | $ | 29,328 | ||||
Work-in-process | 8,084 | 8,360 | ||||||
Finished products | 38,195 | 17,144 | ||||||
Total inventories, net | $ | 95,025 | $ | 54,832 | ||||
Prepaid Expenses and Other Current Assets
Prepaid expenses and other current assets consist of the following:
|
| December 31, |
| |||||
|
| 2023 |
|
| 2022 |
| ||
|
| (Amounts in thousands) |
| |||||
Equipment maintenance and services |
| $ | 6,605 |
|
| $ | 7,135 |
|
Prepaid income taxes |
|
| 10,229 |
|
|
| 519 |
|
Prepaid insurance |
|
| 3,087 |
|
|
| 1,909 |
|
Other |
|
| 13,317 |
|
|
| 10,274 |
|
Total prepaid expenses and other current assets |
| $ | 33,238 |
|
| $ | 19,837 |
|
|
|
|
|
|
|
| ||
106
December 31, | ||||||||
2020 | 2019 | |||||||
(Amounts in thousands) | ||||||||
Equipment maintenance and services | $ | 4,601 | $ | 1,662 | ||||
Prepaid income taxes | 2,649 | 2,719 | ||||||
Prepaid insurance | 1,936 | 80 | ||||||
Other | 9,490 | 1,456 | ||||||
Total prepaid expenses and other current assets | $ | 18,676 | $ | 5,917 | ||||
Property, Plant and Equipment
Property, plant and equipment consist of the following:
|
| December 31, |
| |||||
|
| 2023 |
|
| 2022 |
| ||
|
| (Amounts in thousands) |
| |||||
Land |
| $ | 992 |
|
| $ | 1,003 |
|
Buildings |
|
| 1,667 |
|
|
| 1,599 |
|
Leasehold improvements |
|
| 126,663 |
|
|
| 115,672 |
|
Equipment |
|
| 114,606 |
|
|
| 94,613 |
|
Furniture, fixtures and office equipment |
|
| 9,077 |
|
|
| 8,307 |
|
Computer hardware and software |
|
| 35,528 |
|
|
| 29,813 |
|
Construction in progress |
|
| 47,086 |
|
|
| 31,553 |
|
Other |
|
| 544 |
|
|
| 420 |
|
Total property, plant and equipment |
|
| 336,163 |
|
|
| 282,980 |
|
Less - Accumulated depreciation |
|
| (128,723 | ) |
|
| (92,307 | ) |
Total property, plant and equipment, net |
| $ | 207,440 |
|
| $ | 190,673 |
|
December 31, | ||||||||
2020 | 2019 | |||||||
(Amounts in thousands) | ||||||||
Land | $ | 1,023 | $ | 1,023 | ||||
Buildings | 1,007 | 764 | ||||||
Leasehold improvements | 31,331 | 23,905 | ||||||
Equipment | 43,072 | 36,257 | ||||||
Furniture, fixtures and office equipment | 8,714 | 6,312 | ||||||
Computer hardware and software | 15,397 | 8,810 | ||||||
Construction in progress | 14,927 | 6,707 | ||||||
Other | 455 | 56 | ||||||
Total property, plant and equipment | 115,926 | 83,834 | ||||||
Less - Accumulated depreciation | (49,056 | ) | (35,379 | ) | ||||
Total property, plant and equipment, net | $ | 66,870 | $ | 48,455 | ||||
Depreciation expense totaled $10.9$37.0 million, $7.3$23.9 million and $5.2$16.4 million in the fiscal years ended December 31, 2020, 20192023, 2022 and 2018,2021, respectively.
Accrued Liabilities
Accrued liabilities consist of the following:
|
| December 31, |
| |||||
|
| 2023 |
|
| 2022 |
| ||
|
| (Amounts in thousands) |
| |||||
Employee compensation |
| $ | 16,660 |
|
| $ | 33,522 |
|
Deferred revenue |
|
| 10,287 |
|
|
| 19,283 |
|
Income taxes payable |
|
| 6,814 |
|
|
| 2,459 |
|
Other |
|
| 16,772 |
|
|
| 15,856 |
|
Total accrued liabilities |
| $ | 50,533 |
|
| $ | 71,120 |
|
December 31, | ||||||||
2020 | 2019 | |||||||
(Amounts in thousands) | ||||||||
Employee compensation | $ | 20,288 | $ | 19,850 | ||||
Income taxes payable | 1,423 | 3,874 | ||||||
Royalty and license fees | 466 | 123 | ||||||
Warranties | 1,576 | 1,500 | ||||||
Professional fees | 1,425 | 1,081 | ||||||
Deferred revenue | 15,318 | 5,005 | ||||||
Other | 12,589 | 1,898 | ||||||
Total accrued liabilities | $ | 53,085 | $ | 33,331 | ||||
The components of income before income taxes are as follows:
|
| For the Years Ended December 31, |
| |||||||||
|
| 2023 |
|
| 2022 |
|
| 2021 |
| |||
|
| (Amounts in thousands) |
| |||||||||
Domestic |
| $ | (17,601 | ) |
| $ | 153,446 |
|
| $ | 81,984 |
|
Foreign |
|
| 81,733 |
|
|
| 65,694 |
|
|
| 71,559 |
|
Income before income taxes |
| $ | 64,132 |
|
| $ | 219,140 |
|
| $ | 153,543 |
|
|
|
|
|
|
|
|
|
|
| |||
For the Years Ended December 31, | ||||||||||||
2020 | 2019 | 2018 | ||||||||||
(Amounts in thousands) | ||||||||||||
Domestic | $ | 27,545 | $ | (5,432 | ) | $ | (73 | ) | ||||
Foreign | 31,672 | 31,583 | 21,509 | |||||||||
Income before income taxes | $ | 59,217 | $ | 26,151 | $ | 21,436 | ||||||
107
The components of the income tax provision are as follows:
|
| For the Years Ended December 31, |
| |||||||||
|
| 2023 |
|
| 2022 |
|
| 2021 |
| |||
|
| (Amounts in thousands) |
| |||||||||
Components of the income tax provision: |
|
|
|
|
|
|
|
|
| |||
Current |
| $ | 20,238 |
|
| $ | 34,800 |
|
| $ | 20,166 |
|
Deferred |
|
| 2,317 |
|
|
| (1,619 | ) |
|
| 5,086 |
|
Total |
| $ | 22,555 |
|
| $ | 33,181 |
|
| $ | 25,252 |
|
Jurisdictional components of the income tax provision: |
|
|
|
|
|
|
|
|
| |||
Federal |
| $ | 3,512 |
|
| $ | 17,662 |
|
| $ | 8,321 |
|
State |
|
| 142 |
|
|
| 1,381 |
|
|
| 1,251 |
|
Foreign |
|
| 18,901 |
|
|
| 14,138 |
|
|
| 15,680 |
|
Total |
| $ | 22,555 |
|
| $ | 33,181 |
|
| $ | 25,252 |
|
|
|
|
|
|
|
|
|
|
| |||
For the Years Ended December 31, | ||||||||||||
2020 | 2019 | 2018 | ||||||||||
(Amounts in thousands) | ||||||||||||
Components of the income tax (benefit) provision: | ||||||||||||
Current | $ | 5,193 | $ | 8,290 | $ | 4,354 | ||||||
Deferred | (5,902 | ) | (5,287 | ) | 465 | |||||||
Equity | — | 1,737 | — | |||||||||
Total | $ | (709 | ) | $ | 4,740 | $ | 4,819 | |||||
Jurisdictional components of the income tax (benefit) provision: | ||||||||||||
Federal | $ | (4,741 | ) | $ | (965 | ) | $ | (393 | ) | |||
State | (3,011 | ) | (1,764 | ) | 718 | |||||||
Foreign | 7,043 | 7,469 | 4,494 | |||||||||
Total | $ | (709 | ) | $ | 4,740 | $ | 4,819 | |||||
At December 31, 2020,2023, the
The components of deferred income taxes are as follows:
|
| December 31, |
| |||||
|
| 2023 |
|
| 2022 |
| ||
|
| (Amounts in thousands) |
| |||||
Deferred tax assets: |
|
|
|
|
|
| ||
Stock-based compensation expense |
| $ | 5,120 |
|
| $ | 5,323 |
|
Operating leases |
|
| 30,727 |
|
|
| 31,564 |
|
Capitalized research and development |
|
| 17,568 |
|
|
| 9,102 |
|
Inventory |
|
| 10,131 |
|
|
| 5,983 |
|
Net operating loss carryforwards |
|
| 7,578 |
|
|
| 9,808 |
|
Business tax credit carryforwards |
|
| 4,697 |
|
|
| 2,639 |
|
Other |
|
| 5,314 |
|
|
| 4,440 |
|
Total deferred tax assets |
|
| 81,135 |
|
|
| 68,859 |
|
Less: valuation allowance |
|
| (20 | ) |
|
| (19 | ) |
Net deferred tax assets |
|
| 81,115 |
|
|
| 68,840 |
|
Deferred tax liabilities: |
|
|
|
|
|
| ||
Fixed assets |
|
| (17,716 | ) |
|
| (18,965 | ) |
Acquired intangible assets |
|
| (56,956 | ) |
|
| (43,549 | ) |
Operating lease right of use assets |
|
| (26,373 | ) |
|
| (28,486 | ) |
Debt discount |
|
| (19,006 | ) |
|
| — |
|
Total deferred tax liabilities |
|
| (120,051 | ) |
|
| (91,000 | ) |
Total net deferred tax liabilities |
| $ | (38,936 | ) |
| $ | (22,160 | ) |
December 31, | ||||||||
2020 | 2019 | |||||||
(Amounts in thousands) | ||||||||
Deferred tax assets: | ||||||||
Temporary timing differences: | ||||||||
Stock-based compensation expense | $ | 3,320 | $ | 2,922 | ||||
Operating leases | 7,257 | 7,295 | ||||||
Accrued bonus | 25 | 1,379 | ||||||
Other | 5,749 | 4,994 | ||||||
Total temporary timing differences | 16,351 | 16,590 | ||||||
Net operating loss carryforwards | 1,539 | 221 | ||||||
Tax business credits carryforwards | 5,553 | 924 | ||||||
Total deferred tax assets | 23,443 | 17,735 | ||||||
Less: valuation allowance | (727 | ) | (6 | ) | ||||
Net deferred tax assets | 22,716 | 17,729 | ||||||
Deferred tax liabilities: | ||||||||
Goodwill | (1,487 | ) | (1,288 | ) | ||||
Fixed assets | (4,233 | ) | (1,650 | ) | ||||
Acquired intangible assets | (27,152 | ) | (24,605 | ) | ||||
Operating lease right of use assets | (5,744 | ) | (6,144 | ) | ||||
Conversion option on convertible notes | (8,651 | ) | (11,066 | ) | ||||
Total deferred tax liabilities | (47,267 | ) | (44,753 | ) | ||||
Total net deferred tax liabilities | $ | (24,551 | ) | $ | (27,024 | ) | ||
The net change in the total valuation allowance for the year ended December 31, 20202019$0.7 millionapproximately $1,000 and a decrease of $0.1approximately $0.7 million, respectively.
108
The reconciliation of the federal statutory rate to the effective income tax rate for the years ended December 31, 2020, 20192023, 2022 and 20182021 is as follows:
|
| For the Years Ended December 31, |
| |||||||||||||||||||||
|
| 2023 |
|
| 2022 |
|
| 2021 |
| |||||||||||||||
|
| Amount |
|
| % |
|
| Amount |
|
| % |
|
| Amount |
|
| % |
| ||||||
|
| (Amounts in thousands, except percentages) |
| |||||||||||||||||||||
Income before income taxes |
| $ | 64,132 |
|
|
|
|
| $ | 219,140 |
|
|
|
|
| $ | 153,543 |
|
|
|
| |||
Expected tax at statutory rate |
|
| 13,469 |
|
|
| 21.0 | % |
|
| 46,020 |
|
|
| 21.0 | % |
|
| 32,247 |
|
|
| 21.0 | % |
Adjustments due to: |
|
|
|
|
|
|
|
|
|
|
|
|
|
|
|
|
|
| ||||||
Difference between U.S. and foreign tax |
|
| 1,084 |
|
|
| 1.7 | % |
|
| 1,024 |
|
|
| 0.5 | % |
|
| 530 |
|
|
| 0.3 | % |
State income taxes |
|
| 1,387 |
|
|
| 2.2 | % |
|
| 3,509 |
|
|
| 1.6 | % |
|
| 1,462 |
|
|
| 1.0 | % |
Business tax credits |
|
| (4,522 | ) |
|
| (7.1 | %) |
|
| (5,139 | ) |
|
| (2.3 | %) |
|
| (2,239 | ) |
|
| (1.5 | %) |
Stock-based compensation expense |
|
| (2,461 | ) |
|
| (3.8 | %) |
|
| (5,638 | ) |
|
| (2.6 | %) |
|
| (9,049 | ) |
|
| (5.9 | %) |
U.S. taxation of foreign earnings |
|
| 343 |
|
|
| 0.5 | % |
|
| 83 |
|
|
| 0.0 | % |
|
| 30 |
|
|
| 0.0 | % |
Foreign-derived intangible income |
|
| (88 | ) |
|
| (0.1 | %) |
|
| (5,042 | ) |
|
| (2.3 | %) |
|
| (2,547 | ) |
|
| (1.7 | %) |
Executive compensation |
|
| 3,084 |
|
|
| 4.8 | % |
|
| 5,441 |
|
|
| 2.5 | % |
|
| 3,397 |
|
|
| 2.2 | % |
Contingent consideration |
|
| (6,412 | ) |
|
| (10.0 | %) |
|
| (6,033 | ) |
|
| (2.8 | %) |
|
| 1,232 |
|
|
| 0.8 | % |
Loss on extinguishment of debt |
|
| 2,634 |
|
|
| 4.1 | % |
|
| — |
|
|
| 0.0 | % |
|
| — |
|
|
| 0.0 | % |
Debt discount |
|
| 16,650 |
|
|
| 26.0 | % |
|
| — |
|
|
| 0.0 | % |
|
| — |
|
|
| 0.0 | % |
Foreign exchange loss |
|
| (2,288 | ) |
|
| (3.6 | %) |
|
| — |
|
|
| 0.0 | % |
|
| — |
|
|
| 0.0 | % |
Uncertain tax provisions |
|
| 165 |
|
|
| 0.3 | % |
|
| 234 |
|
|
| 0.1 | % |
|
| (443 | ) |
|
| (0.3 | %) |
Change in valuation allowance |
|
| — |
|
|
| 0.0 | % |
|
| (688 | ) |
|
| (0.3 | %) |
|
| (48 | ) |
|
| (0.0 | %) |
Return to provision adjustments |
|
| (1,255 | ) |
|
| (2.0 | %) |
|
| (498 | ) |
|
| (0.2 | %) |
|
| (50 | ) |
|
| (0.0 | %) |
Other |
|
| 765 |
|
|
| 1.2 | % |
|
| (92 | ) |
|
| (0.0 | %) |
|
| 730 |
|
|
| 0.5 | % |
Income tax provision |
| $ | 22,555 |
|
|
| 35.2 | % |
| $ | 33,181 |
|
|
| 15.1 | % |
| $ | 25,252 |
|
|
| 16.4 | % |
For the Years Ended December 31, | ||||||||||||||||||||||||
2020 | 2019 | 2018 | ||||||||||||||||||||||
Amount | % | Amount | % | Amount | % | |||||||||||||||||||
(Amounts in thousands, except percentages) | ||||||||||||||||||||||||
Income before income taxes | $ | 59,217 | $ | 26,151 | $ | 21,436 | ||||||||||||||||||
Expected tax at statutory rate | 12,436 | 21.0 | % | 5,492 | 21.0 | % | 4,502 | 21.0 | % | |||||||||||||||
Adjustments due to: | ||||||||||||||||||||||||
Difference between U.S. and foreign tax | 618 | 1.0 | % | 436 | 1.7 | % | 345 | 1.6 | % | |||||||||||||||
State income and franchise tax | 133 | 0.2 | % | (179 | ) | (0.7 | %) | 91 | 0.4 | % | ||||||||||||||
Business tax credits | (4,660 | ) | (7.9 | %) | (2,746 | ) | (10.5 | %) | (1,760 | ) | (8.2 | %) | ||||||||||||
Permanent differences: | ||||||||||||||||||||||||
Stock-based compensation expense | (9,243 | ) | (15.6 | %) | (1,877 | ) | (7.2 | %) | (1,213 | ) | (5.7 | %) | ||||||||||||
U.S. taxation of foreign earnings | 51 | 0.1 | % | 2,227 | 8.5 | % | 2,190 | 10.2 | % | |||||||||||||||
Executive compensation | 1,401 | 2.4 | % | 841 | 3.2 | % | 367 | 1.7 | % | |||||||||||||||
Other | 896 | 1.5 | % | 92 | 0.4 | % | 97 | 0.5 | % | |||||||||||||||
Change in U.S. federal tax rates | (2,192 | ) | (3.7 | %) | — | 0.0 | % | — | 0.0 | % | ||||||||||||||
Change in U.S. state tax rates | (708 | ) | (1.2 | %) | — | 0.0 | % | 748 | 3.5 | % | ||||||||||||||
Change in Netherlands tax rate | 250 | 0.4 | % | (193 | ) | (0.7 | %) | (388 | ) | (1.8 | %) | |||||||||||||
Transition tax | — | 0.0 | % | — | 0.0 | % | (1,338 | ) | (6.2 | %) | ||||||||||||||
Uncertain tax provisions | (168 | ) | (0.3 | %) | 1,069 | 4.1 | % | 1,021 | 4.8 | % | ||||||||||||||
Change in valuation allowance | (12 | ) | (0.0 | %) | (125 | ) | (0.5 | %) | 125 | 0.6 | % | |||||||||||||
Return to provision adjustments | (89 | ) | (0.2 | %) | (79 | ) | (0.3 | %) | 33 | 0.2 | % | |||||||||||||
Other | 578 | 1.0 | % | (218 | ) | (0.8 | %) | (1 | ) | (0.1 | %) | |||||||||||||
Income tax provision | $ | (709 | ) | (1.2 | %) | $ | 4,740 | 18.1 | % | $ | 4,819 | 22.5 | % | |||||||||||
The Company’s tax returns are subject to examination by federal, state and foreign tax authorities. The Company’s two major tax jurisdictions are subject to examination for the following periods:
Jurisdiction | Fiscal Years Subject | |||
United States - federal and state | 2019-2023 | |||
Sweden | 2018-2023 |
The following is a tabular reconciliation of the total amounts of unrecognized tax benefits:
|
| For the Years Ended December 31, |
| |||||
|
| 2023 |
|
| 2022 |
| ||
|
| (Amounts in thousands) |
| |||||
Balance of gross unrecognized tax benefits, beginning of period |
| $ | 2,996 |
|
| $ | 2,786 |
|
Gross amounts of increases in unrecognized tax benefits as a result |
|
| 178 |
|
|
| 146 |
|
Gross amounts of increases in unrecognized tax benefits as a result |
|
| 53 |
|
|
| 64 |
|
Gross amounts of decreases due to release |
|
| (88 | ) |
|
| — |
|
Balance of gross unrecognized tax benefits, end of period |
| $ | 3,139 |
|
| $ | 2,996 |
|
|
|
|
|
|
|
| ||
For the Years Ended December 31, | ||||||||
2020 | 2019 | |||||||
(Amounts in thousands) | ||||||||
Balance of gross unrecognized tax benefits, beginning of period | $ | 3,422 | $ | 2,852 | ||||
Gross amounts of increases in unrecognized tax benefits as a result of tax positions taken in the current period | 154 | 602 | ||||||
Gross amounts of decreases in unrecognized tax benefits as a result of tax positions taken in the prior period | (337 | ) | (16 | ) | ||||
Gross amounts of decrease due to release | (39 | ) | (16 | ) | ||||
Balance of gross unrecognized tax benefits, end of period | $ | 3,200 | $ | 3,422 | ||||
Included in the balance of unrecognized tax benefits as of December 31, 20202023, are $3.1$3.1 million of tax benefits that, if recognized, would affect the effective tax rate. The Company classifies interest and penalties related to income taxes as components of its income tax provision. The amountIn 2023, a net expense of approximately $15,000, was recorded to the income tax provision related to interest and penalties recordedwhile in the accompanying consolidated statements2022, a net expense of comprehensive incomeapproximately $24,000 was approximately $17,000, $5,000 and $1,000 for the years ended December 31, 2020, 2019 and 2018, respectively.recorded. The amount of interest and penalties recorded in the accompanying consolidated balance sheets was approximately $58,000$67,000 and $41,000$52,000 as of December 31, 20202023 and 2019,2022, respectively. TheIn the next twelve months, it is reasonably possible the Company does not anticipate the amount ofwill reduce its gross unrecognized tax benefits, excluding interest by up to $1.1 million due to expiring statutes of limitations.
In 2021, the Organization of Economic Co-operation and Development announced an Inclusive Framework on Base Erosion and Profit Sharing with the goal of achieving consensus around substantial changes to international tax policies, including the implementation of a minimum global effective tax rate of 15%. We continue to evaluate the impacts of enacted legislation and
109
pending legislation in the tax jurisdictions in which we operate. While various countries have implemented the legislation as of January 1, 2024, we do not expect a resulting material change over the next twelve months.
As of December 31, 2020,2023, the Company has accumulated undistributed earnings generated by its foreign subsidiaries of approximately $113.1$212.4 million. Because $58.0$5.7 million of such earnings have previously been subject to the2017 Tax Cuts and Jobs Act enacted in December 2017, any additional taxes due with respect to such earnings or the excess of the amount for financial reporting over the tax basis of the Company’sour foreign investments would generally be limited to foreign and state
Share Repurchases
In December 2023, the Board authorized and approved a stock repurchase of Assets Other Than Inventory,”
Stock Option and Incentive Plans
At the Company’s 2018 Annual Meeting of Stockholders held on May 16, 2018, the Company’s shareholders approved the 2018 Stock Option and Incentive Plan (the “2018 Plan”). Under the 2018 Plan the number of shares of the Company’s common stock that are reserved and available for issuance shall be 2,778,000 plus the number of shares of common stock available for issuance under the Company’s Amended and Restated 2012 Stock Option and Incentive Plan (the “2012 Plan”). The shares of common stock underlying any awards under the 2018 Plan 2012 Plan and the Second Amended and Restated 2001 Repligen Corporation Stock Plan (the “2001 Plan,” and together with the 2018 Plan and 2012 Plan the “Plans”) that are forfeited, canceled or otherwise terminated (other than by exercise) shall be added back to the shares of stock available for issuance under the 2018 Plan. At December 31, 2020, 2,306,9432023, 1,671,408 shares were available for future grants under the 2018 Plan.
Stock Issued for Earnout Payment
In May 2023, the Company issued 42,621 shares of its common stock to former securityholders of Avitide to satisfy the contingent consideration obligation established under the Agreement and Plan of Merger and Reorganization (the “Avitide Agreement”) which the Company entered into as part of the Avitide Acquisition. See Note 4, “Acquisitions” above for additional information on the Avitide Acquisition and the contingent consideration. The shares represent 50% of the earnout consideration earned in the First Earnout Year (as defined in the Avitide Agreement).
110
Stock-Based Compensation
The Company recorded stock-based compensation expense of $17.0$25.6 million, $12.8$27.3 million and $10.2$27.5 million for the years ended December 31, 2020, 20192023, 2022 and 2018,2021, respectively, for share-based awards granted under the Plans. The following table presents stock-based compensation expense in the Company’s consolidated statements of comprehensive income:
|
| For the Years Ended December 31, |
| |||||||||
|
| 2023 |
|
| 2022 |
|
| 2021 |
| |||
|
| (Amounts in thousands) |
| |||||||||
Cost of product revenue |
| $ | 1,933 |
|
| $ | 2,525 |
|
| $ | 2,021 |
|
Research and development |
|
| 2,855 |
|
|
| 2,622 |
|
|
| 2,856 |
|
Selling, general and administrative |
|
| 20,787 |
|
|
| 22,169 |
|
|
| 22,623 |
|
Total stock-based compensation |
| $ | 25,575 |
|
| $ | 27,316 |
|
| $ | 27,500 |
|
For the Years Ended December 31, | ||||||||||||
2020 | 2019 | 2018 | ||||||||||
(Amounts in thousands) | ||||||||||||
Cost of product revenue | $ | 1,929 | $ | 1,368 | $ | 1,019 | ||||||
Research and development | 1,534 | 1,373 | 917 | |||||||||
Selling, general and administrative | 13,544 | 10,106 | 8,256 | |||||||||
Total stock-based compensation | $ | 17,007 | $ | 12,847 | $ | 10,192 | ||||||
Stock Options granted under the Plans have a maximum term of ten years from the date of grant and generally, the exercise price of the stock options equals the fair market value of the Company’s common stock on the date of grant. At December 31, 2020, options to purchase 696,711 shares and 665,540 stock units were outstanding under the Plans.
The Company uses the Black-Scholes option pricing model to calculate the fair value of stock option awards on the grant date, and the Company uses the value of the common stock as of the grant date to value RSUs. The Company measures stock-based compensation costs of stock options at the grant date based on the estimated fair value of the award. The Company recognizes expense on awards with service-based vesting over the employee’s requisite service period on a straight-line basis. The Company recognizes stock-based compensation expense for options that are ultimately expected to vest, and accordingly, such compensation expense has issued performancebeen adjusted for estimated forfeitures.
The fair value of stock option awards granted during the years ended December 31, 2023, 2022 and 2021 were calculated using the following estimated assumptions:
|
| For the Years Ended December 31, | ||||
|
| 2023 |
| 2022 |
| 2021 |
Expected term (in years) |
| 5.14-6.5 |
| 5.5-6.5 |
| 5.5-6.5 |
Expected volatility (range) |
| 44.78-46.58% |
| 41.44-43.96% |
| 44.57-45.27% |
Risk-free interest rate |
| 3.56-4.71% |
| 1.86-4.07% |
| 0.77-1.07% |
Expected dividend yield |
| 0% |
| 0% |
| 0% |
Information regarding option activity for the year ended December 31, 2023, under the Plans is summarized below:
|
| Shares |
|
| Weighted |
|
| Weighted- |
|
| Aggregate |
| ||||
Options outstanding at December 31, 2022 |
|
| 609,965 |
|
| $ | 71.74 |
|
|
|
|
|
|
| ||
Granted |
|
| 90,305 |
|
| $ | 168.22 |
|
|
|
|
|
|
| ||
Exercised |
|
| (40,211 | ) |
| $ | 26.76 |
|
|
|
|
|
|
| ||
Forfeited/expired/cancelled |
|
| (10,929 | ) |
| $ | 189.46 |
|
|
|
|
|
|
| ||
Options outstanding at December 31, 2023 |
|
| 649,130 |
|
| $ | 85.97 |
|
|
|
|
|
|
| ||
Options exercisable at December 31, 2023 |
|
| 364,443 |
|
| $ | 65.53 |
|
|
|
|
|
|
| ||
Vested and expected to vest at December 31, 2023(1) |
|
| 635,834 |
|
| $ | 85.49 |
|
|
| 5.59 |
|
| $ | 61,888 |
|
The aggregate intrinsic value in the table above represents the total pre-tax intrinsic value (the difference between the closing price of the common stock on December 29, 2023, the last business day of 2023, of $179.80 per share and the exercise price of each in-the-money option) that would have been received by the option holders had all option holders exercised their options on
111
December 31, 2023. The aggregate intrinsic value of stock options exercised during the years ended December 31, 2023, 2022 and 2021 was $5.8 million, $14.1 million and $20.3 million, respectively.
The weighted average grant date fair value of options granted during the years ended December 31, 2023, 2022 and 2021 was $84.37, $87.40 and $88.01, respectively. The total fair value of stock options that vested during the years ended December 31, 2023, 2022 and 2021 was $4.7 million, $3.1 million and $3.0 million, respectively.
Stock Units
The fair value of stock units to certain employees which are tied tois calculated using the achievementclosing price of certainthe Company’s common stock on the date of grant. The Company financial goal metrics andrecognizes expense on awards with service-based vesting over the passage of time. Finally, during 2020, the Company implementedemployee's requisite service period on a program that issued performance stock units to certain employees set to vest upon the achievement of individual goals and the passage of time.straight-line basis. The Company recognizes expense on performance-based awards over the vesting period based on the probability that the performance metrics will be achieved. The Company recognizes stock-based compensation expense for options that are ultimately expected to vest, and accordingly, such compensation expense has been adjusted for estimated forfeitures.
For the Years Ended December 31, | ||||||
2020 | 2019 | 2018 | ||||
Expected term (in years) | 5.5-6.5 | 5.5-6.5 | 5.5-7.5 | |||
Expected volatility (range) | 45.14 – 50.87% | 45.14 – 50.87% | 45.14 – 50.87% | |||
Risk-free interest rate | 0.34 – 1.15% | 1.55 – 2.56% | 2.63 – 2.96% | |||
Expected dividend yield | 0% | 0% | 0% | |||
Shares | Weighted average exercise price | Weighted- Average Remaining Contractual Term (in Years) | Aggregate Intrinsic Value (in Thousands) | |||||||||||||
Options outstanding at December 31, 2019 | 957,559 | $ | 30.81 | |||||||||||||
Granted | 79,698 | $ | 115.81 | |||||||||||||
Exercised | (340,546 | ) | $ | 23.95 | ||||||||||||
Forfeited/expired/cancelled | — | $ | — | |||||||||||||
Options outstanding at December 31, 2020 | 696,711 | $ | 43.88 | 6.90 | $ | 102,958 | ||||||||||
Options exercisable at December 31, 2020 | 311,988 | $ | 31.75 | 5.91 | $ | 49,879 | ||||||||||
Vested and expected to vest at December 31, 2020 (1) | 667,220 | 6.86 | $ | 99,096 | ||||||||||||
|
| Shares |
|
| Weighted Average |
|
| ||
Unvested at December 31, 2022 |
|
| 531,034 |
|
| $ | 142.57 |
|
|
Awarded |
|
| 212,338 |
|
| $ | 170.03 |
|
|
Vested |
|
| (195,672 | ) |
| $ | 124.58 |
|
|
Forfeited/cancelled |
|
| (73,380 | ) |
| $ | 177.81 |
|
|
Unvested at December 31, 2023 |
|
| 474,320 |
|
| $ | 155.59 |
|
|
Vested and expected to vest at December 31, 2023(1) |
|
| 413,249 |
|
| $ | 152.74 |
|
|
Shares | Weighted- Average Remaining Contractual Term (in Years) | Aggregate Intrinsic Value (in Thousands) | ||||||||||
Unvested at December 31, 2019 | 734,984 | |||||||||||
Awarded | 207,788 | |||||||||||
Vested | (244,648 | ) | ||||||||||
Forfeited/expired/cancelled | (32,584 | ) | ||||||||||
Unvested at December 31, 2020 | 665,540 | 3.32 | $ | 127,904 | ||||||||
Vested and expected to vest at December 31, 2020 (1) | 650,047 | 3.01 | $ | 124,568 | ||||||||
Represents the number of vested stock units as of |
The aggregate intrinsic value of stock units vested during the years ended December 31, 2020, 20192023, 2022 and 20182021 was $28.3$35.7 million, $17.5$43.9 million and $6.2$46.5 million, respectively.
As of December 31, 2020,2023, there was $46.7$63.8 million of total unrecognized compensation cost related to unvested share-based awards. This cost is expected to be recognized over a weighted average remaining requisite service period of 3.552.84 years. The Company expects 1,853,0282,185,873 unvested options and stock units to vest over the next five years.
License Agreement
On September 19, 2022, the Company entered into a 15-year exclusive License Agreement (the “Daylight Agreement”) with DRS Daylight Solutions, Inc. (“Daylight”), giving the Company exclusive license and Researchcommercialization rights to use certain technology and intellectual property subject to conditions set forth in the Daylight Agreement. The Company agreed to pay Daylight (i) an initial, one-time, non-refundable, non-creditable upfront cash payment and (ii) certain quarterly royalty payments.
Pursuant to the Daylight Agreement, the Company obtains the exclusive, non-transferrable, right and license to use specifically in the field of bioprocessing, the Daylight intellectual property called Culpeo® QCL-IR Liquid Analyzer (“Culpeo”), which is a compact, intelligent spectrometer that uses the power of quantum cascade lasers to analyze and identify chemicals. Under the Daylight Agreement, the Company assumes responsibility for the commercialization and sale of Culpeo, in addition to the ability
112
to incorporate the intellectual property into optimized products over the term of the Daylight Agreement. Daylight will continue to sell the products in the specified fields of Aerospace and Defense.
Collaboration Agreements
The Company licenses certain technologies that are, or may be, incorporated into its technology under several agreements and also has entered into several clinical research agreements that require the Company to fund certain research projects. Generally, the license agreements require the Company to pay annual maintenance fees and royalties on product sales once a product has been established using the technologies. Research and developmentR&D expenses associated with license agreements were immaterial amounts for the years ended December 31, 2020, 20192023, 2022 and 2018.
In June 2018, the Company secured an agreement with Navigo Proteins GmbH (“Navigo”) for the exclusivehas agreed to supplysupplying the first of these ligands,™A,®, exclusively to Purolite, Life Sciences (“Purolite”), who will pairis pairing the Company’s high-performance ligand with Purolite’s agarose jetting base bead technology used in their Jetted A50 Protein A resin product. WeThe Company also signed a long-term supply agreement with Purolite forA and other potential additional affinity ligands that may advance from the Company’s Navigo collaboration. In September 2020, the Company and Navigo successfully completed co-development of an affinity ligand targeting the SARS-CoV-2 spike protein, to be utilized in the purification of vaccines for the COVID-19 pandemic, including emerging variants of the SARS-CoV-2 coronavirus. The Company has proceeded with scaling up and manufacturing this ligand and the development and validation of the related affinity chromatography resin, which is marketed by the Company. In September 2021, the Company and Navigo successfully completed co-development of a novel affinity ligand that addresses aggregation issues associated with pH sensitive antibodies and Fc-fusion proteins. The Company is manufacturing and supplying this ligand, NGL-Impact® HipH, to Purolite. The Navigo and Purolite agreements are supportive of the Company’s strategy to secure and reinforce the Company’s proteins business.The Company made royalty payments to Navigo of $0.9$3.8 million, $2.6 million and $1.0$2.3 million in the years ended December 31, 20202023, 2022 and 2019,2021, respectively, in connection with this program, which are recorded to research and development expenses in the Company’s consolidated statements of comprehensive income.
Purchase Orders, Supply Agreements and Other Contractual Obligations
In the normal course of business, the Company has entered into purchase orders and other agreements with manufacturers, distributors and others. Outstanding obligations at December 31, 20202023 of $55.3$34.3 million are expected to be completed within one year.
Legal Proceedings
From time to time, in the normal course of its operations, the Company is subject to litigation matters and claims relating to employee relations, business practices and patent infringement. Litigation can be expensive and disruptive to normal business operations. Moreover, the results of complex legal proceedings are difficult to predict, and the Company’s view of these matters may change in the future as the litigation and events related thereto unfold. The Company expenses legal fees as incurred. The Company records a provision for contingent losses when it is both probable that a liability has been incurred and the amount of the loss can be reasonably estimated. An unfavorable outcome to any legal matter, if material, could have an adverse effect on the Company’s operations or its financial results.
113
The carrying value of the Company’s convertible senior notes is as follows:
|
|
|
|
|
|
| ||
|
| December 31, |
|
| December 31, |
| ||
|
| (Amounts in thousands) |
| |||||
0.375% Convertible Senior Notes due 2024: |
|
|
|
|
|
| ||
Principal amount |
| $ | 69,700 |
|
| $ | 287,470 |
|
Unamortized debt issuance costs |
|
| (248 | ) |
|
| (2,855 | ) |
Carrying amount - Convertible Senior Notes due 2024, net |
| $ | 69,452 |
|
| $ | 284,615 |
|
1.00% Convertible Senior Notes due 2028: |
|
|
|
|
|
| ||
Principal amount |
| $ | 600,000 |
|
| $ | — |
|
Unamortized debt discount |
|
| (81,457 | ) |
|
| — |
|
Unamortized debt issuance costs |
|
| (8,400 | ) |
|
| — |
|
Carrying amount - Convertible Senior Notes due 2028, net |
| $ | 510,143 |
|
| $ | — |
|
1.00% Convertible Senior Notes due 2028
On December 14, 2023, the Company issued $600.0 million aggregate principal amount of its 2023 Notes in the Exchange and Subscription Agreements with a limited number of holders of its outstanding 2019 Notes and certain other qualified institutional buyers pursuant to Rule 144A under the Securities Act. Pursuant to the Exchange and Subscription Agreements, the Company exchanged $217.7 million of its 2019 Notes, which were cancelled upon exchange, for $309.9 million aggregate principal amount of the 2023 Notes (the “Exchange Transaction”) and issued $290.1 million aggregate principal amount of the 2023 Notes in a private placement to accredited institutional buyers (the “Subscription Transactions”) for $290.1 million in cash.
The Company evaluated the Exchange Transaction and determined approximately $29.6 million of the $217.7 million principal of the exchanged 2019 Notes should be accounted for as extinguishments of debt and approximately $188.1 million should be accounted for as modification of debt. As a result, we recognized a $12.7 million loss on extinguishment of debt in our consolidated statements of comprehensive income for the year ended December 31, 2023, inclusive of $0.1 million of unamortized debt issuance costs. Under modification accounting, the carrying amount of the modified 2019 Notes was reduced by $2.8 million, with a corresponding increase to additional paid-in capital, to account for the increase in the fair value of the embedded conversion option, representing a debt discount of the modified 2019 Notes. The aggregate debt discount of $82.1 million, comprised of $79.3 million increase in principal of the modified 2019 Notes and a $2.8 million increase in the fair value of the embedded conversion option, is as a direct reduction from the carrying value of the convertible debt on our consolidated balance sheets. This amount will be accreted into interest expense in the consolidated statements of comprehensive income using the effective interest method over the term of the 2023 Notes.
Proceeds from the Subscription Transactions were $276.1 million, net of debt issuance costs of $14.0 million. The Exchange Transaction resulted in $6.2 million of the debt issuance costs related to the modified 2019 Notes, which were expensed as incurred in accordance with modification accounting, and $7.8 million of deferred debt issuance costs related to the 2023 Notes, which were recorded as a direct deduction to the carrying value of the 2023 Notes on the Company’s consolidated balance sheets. The Company will amortize the $7.8 million of debt issuance costs of the 2023 Notes into amortization of debt issuance costs in the Company’s consolidated statements of comprehensive income over the remaining term of the 2023 Notes. The carrying value of the 2023 Notes of $510.1 million is included in long-term debt on the Company's consolidated balance sheets as of December 31, 2023.
The Company used $14.4 million of the proceeds from the Subscription Transactions to repurchase shares of its common stock from certain purchasers of the 2023 Notes. See Note 12, “Stockholders’ Equity - Share Repurchases” for additional information related to this repurchase. The Company will also use a portion of the proceeds to finance in part, the settlement upon conversion or repurchase of the remaining 2019 Notes at or prior to maturity. The remainder of the proceeds will be used for working capital
114
December 31, | ||||||||
2020 | 2019 | |||||||
(Amounts in thousands) | ||||||||
0.375% convertible senior notes due 2024: | ||||||||
Convertible senior notes, current portion: | ||||||||
Principal amount | $ | 287,500 | $ | — | ||||
Unamortized debt discount | (38,317 | ) | — | |||||
Unamortized debt issuance costs | (5,446 | ) | — | |||||
Total convertible senior notes, current portion | 243,737 | — | ||||||
Convertible senior notes: | ||||||||
Principal amount | — | 287,500 | ||||||
Unamortized debt discount | — | (47,921 | ) | |||||
Unamortized debt issuance costs | — | (6,812 | ) | |||||
Total convertible senior notes | $ | 243,737 | $ | 232,767 | ||||
and general corporate purposes, including to fund possible acquisitions of, or investments in, complementary businesses, products, services and technologies.
The 2023 Notes are senior, unsecured obligations of the Company, and bear interest at a rate of 1.00% per year. Interest is payable semi-annually in arrears on each June 15 and December 15, commencing on June 15, 2024. The 2023 Notes will mature on December 15, 2028, unless earlier redeemed, repurchased or converted. The initial conversion rate for the 2023 Notes is 4.9247 shares of the Company's common stock per $1,000 principal amount of 2023 Notes, which is equivalent to an initial conversion price of $203.06 per share and represents a 30% premium over the last reported sale price of $156.20 per share on December 6, 2023, the date on which the 2023 Notes were priced. Prior to the close of business on the business day immediately preceding September 15, 2028, the 2023 Notes will be convertible at the options of the holders of 2023 Notes only upon the satisfaction of specified conditions and during certain periods into cash up to their principal amount, and into cash, shares of the Company's common stock or a combination thereof, at the Company's election, for the conversion value above the principal amount, if any. Thereafter until the close of business on the second scheduled trading day immediately preceding the maturity date, the 2023 Notes will be convertible at the option of the holders of 2023 Notes at any time regardless of these conditions. The Company may redeem for cash, all or a portion of the 2023 Notes, at its option, on or after December 18, 2026 and prior to the 21st scheduled trading day immediately preceding the maturity date at a redemption price of 100% of the principal amount of the 2023 Notes to be redeemed, plus accrued and unpaid interest to, but excluding the redemption date, if certain conditions are met in accordance to the indenture governing the 2023 Notes (the “2023 Notes Indenture”).
If the Company undergoes a “fundamental change” (as defined in the 2023 Notes Indenture), the holders of the 2023 Notes may require the Company to repurchase for cash all or part of their 2023 Notes at a purchase price equal to 100% of the principal amount of the 2023 Notes to be repurchased, plus accrued and unpaid interest, if any, up to, but excluding, the fundamental change repurchase date. In addition, if certain “make-whole fundamental changes” (as defined in 2023 Notes Indenture) occur or the Company calls all or a portion of the 2023 Notes for redemption, the Company will, in certain circumstances, increase the conversion rate for any 2023 Notes converted in connection with such make-whole fundamental change or any 2023 Notes called for redemption that are converted during the related redemption period.
Interest expense recognized on the 2023 Notes in 2023 was $0.2 million and $0.6 million for the contractual coupon interest and accretion of the debt discount, respectively. Amortization of debt issuance costs recorded in 2023 related to the 2023 Notes was $6.3 million, which includes the $6.2 million of debt issuance costs recorded under modification accounting mentioned above and $0.1 million amortization of debt issuance costs related to the capitalized portion of the costs. The effective interest rate on the 2023 Notes is 4.39%, which included the interest on the 2023 Notes and amortization of the debt discount and issuance costs. As of December 31, 2023, the carrying value of the 2023 Notes was $510.1 million and the fair value of the principal was $596.0 million. The fair value of the 2023 Notes was determined based on the most recent trade activity of the 2023 Notes as of December 31, 2023.
The 2023 Notes Indenture contains customary terms and events of default. If an event of default (other than certain events of bankruptcy, insolvency or reorganization involving the Company) occurs and is continuing, the holders of at least 25% in aggregate principal amount of the outstanding 2023 Notes may declare 100% of the principal of, and any accrued and unpaid interest on, all of the 2023 Notes to be due and payable. Upon the occurrence of certain events of bankruptcy, insolvency or reorganization involving the Company, 100% of the principal of and accrued and unpaid interest, if any, on all of the 2023 Notes will become due and payable automatically. Notwithstanding the foregoing, the 2023 Notes provide that, to the extent the Company elects and for up to 365 days, the sole remedy for an event of default relating to certain failures by the Company to comply with certain reporting covenants consist exclusively of the right to receive additional interest on the 2023 Notes. The Company is not aware of any events of default that would allow holders to declare the principal of, and any accrued and unpaid interest on, all of the 2023 Notes to be due and payable.
0.375% Convertible Senior Notes due 2024
The Company issued $287.5$287.5 million aggregate principal amount of 0.375% Convertible Seniorthe 2019 Notes due 2024 (“on July 19, 2019 Notes”),in a transaction which includesincluded the underwriters’ exercise in full of an option to purchase an additional $37.5$37.5 million aggregate principal amount of 2019 Notes (the “Notes Offering”). The net proceeds of the Notes Offering, after deducting underwriting discounts and
115
commissions and other related offering expenses payable by the Company, were approximately $278.5$278.5 million.
The 2019 Notes are senior, unsecured obligations of the Company, and bear interest at a rate of 0.375%0.375% per year. Interest is payable semi-annually in arrears on January 15 and July 15 of each year, beginning on January 15, 2020.2020. The remaining 2019 Notes will mature onJuly 15, 2024, unless earlier repurchased or converted in accordance with their terms. The initial conversion rate for the 2019 Notes is 8.6749 shares of the Company’s common stock per $1,000$1,000 principal amount of 2019 Notes (which is equivalent to an initial conversion price of approximately $115.28$115.28 per share). Prior to the close of business on the business day immediately preceding April 15, 2024, the 2019 Notes will be convertible at the option of the holders of 2019 Notes only upon the satisfaction of specified conditions and during certain periods. Thereafter until the close of business on the second scheduled trading day immediately preceding the maturity date, the remaining 2019 Notes will be convertible at the options of the holders of 2019 Notes at any time regardless of these conditions. ConversionPrior to March 4, 2022, conversion of the 2019 Notes will becould have been settled in cash, shares of the Company’s common stock or a combination thereof, at the Company’s election. On March 4, 2022, the Company entered into the Second Supplemental Indenture for the 2019 Notes, which irrevocably elected to settle the conversion of the 2019 Notes using a combination of cash and the Company’s common stock, settling the par value of the 2019 Notes in cash and any excess conversion premium in shares. The 2019 Notes are not redeemable by the Company prior to maturity.
Holders of 2019 Notes may require the Company to repurchase their 2019 Notes upon the occurrence of a fundamental change prior to maturity at a repurchase price equal to 100%100% of the principal amount thereof, plus accrued and unpaid interest to, but excluding, the date of repurchase. In connection with certain corporate events, the Company will, under certain circumstances, increase the conversion rate for holders of 2019 Notes who elect to convert their 2019 Notes in connection with such corporate events.
During the fourth quarter of 2020,2023, the closing price of the Company’s common stock exceeded 130%130% of the conversion price of the 2019 Notes for more than 20 trading days of the last 30 consecutive trading
Prior to the adoption of the date of this filing,ASU 2020-06, the Company received requests to convert $3,000 aggregate principal amount of 2019 Notes which we intend to pay or deliver, as the case may be, the settlement amount to be determined – paying the amount in excess of the aggregate principal portion of the converted notes in shares of our common stock. These conversions will be settled during the first quarter of 2021.
In accounting for the transaction costs related to the issuance of the 2019 Notes, the Company allocated the total costs incurred to the liability and equity components of the 2019 Notes using the same proportions as the initial carrying value of the 2019 Notes. Transaction costs related to the liability component were $7.4$7.4 million and are being amortized to interest expense using the effective interest method over the five-year term of the 2019 Notes. Transaction costs attributable to the equity component were $1.6 $1.6
116
million and are netted with the equity component of the 2019 Notes in stockholders’stockholders' equity of the Company’sCompany's consolidated balance sheet at December 31, 2020.
Effective January 1, 2022, the Company adopted ASU 2020-06. After adoption, the Company now accounts for the 2019 Notes, in 2020 was $1.1 million, $9.6 million and $1.4 millionany convertible debt issued going forward, as a single liability measured at amortized cost. As the equity component is no longer required to be split into a separate component, the Company recorded a net adjustment for the contractualinitial $50.4 million that was allocated to additional paid-in capital and $22.9 million of life-to-date interest expense recorded as amortization of debt discount. Additionally, the net deferred tax liability recorded for the 2019 Notes was reversed. The principal amount of the liability over its carrying amount is amortized to interest expense over the five-year term of the 2019 Notes. Since the 2019 Notes are classified as a single liability, there is no debt discount required to be amortized in 2022.
Contractual coupon interest expense related to the accretion of the debt discount2019 Notes was $1.0 million in 2023 and the Company recorded $1.8 million of amortization of the debt issuance costs respectively.related to the 2019 Notes as well. The effective interest rate on the 2019 Notes is 5.1%1.02%, which included the interest on the 2019 Notes and amortization of the debt discount and debt issuance costs. As of December 31, 2020,2023, the carrying value of the 2019 Notes was $243.7$69.5 million and the fair value of the principal was $501.0$109.8 million. The fair value of the 2019 Notes was determined based on the most recent trade activity of the 2019 Notes as of December 31, 2020.
The indenture governing the 2019 Notes agreement contains customary terms and events of default. If an event of default (other than certain events of bankruptcy, insolvency or reorganization involving the Company) occurs and is continuing, the holders of at least 25%25% in aggregate principal amount of the outstanding 2019 Notes may declare 100%100% of the principal of, and any accrued and unpaid interest on, all of the 2019 Notes to be due and payable. Upon the occurrence of certain events of bankruptcy, insolvency or reorganization involving the Company, 100%100% of the principal of and accrued and unpaid interest, if any, on all of the 2019 Notes will become due and payable automatically. Notwithstanding the foregoing, the 2019 Notes provide that, to the extent the Company elects and for up to 270360 days, the sole remedy for an event of default relating to certain failures by the Company to comply with certain reporting covenants consist exclusively of the right to receive additional interest on the 2019 Notes. The Company is not aware of any events of default, current events or market conditions that would allow holders to call or convertdeclare the 2019 Notes asprincipal of, December 31, 2020.
Foreign Currency Translation Adjustment | ||||
Balance as of December 31, 2018 | $ | (11,893 | ) | |
Other comprehensive loss | (3,134 | ) | ||
Balance as of December 31, 2019 | (15,027 | ) | ||
Other comprehensive income | 17,112 | |||
Balance as of December 31, 2020 | $ | 2,085 | ||
In the United States, the Repligen Corporation 401(k) Savings and Retirement Plan (the “401(k) Plan”) is a qualified defined contribution plan in accordance with Section 401(k) of the Internal Revenue Code.
In Sweden, the Company contributes to a government-mandated occupational pension plan that is a qualified defined contribution plan. All employees in Sweden are eligible for this pension plan. The Company pays premiums to a third-party occupational pension specialist who administers the pension plan. These premiums are based on various factors including each employee’s age, salary, employment history and selected benefits in the pension plan. When an employee terminates or retires, these premium payments cease for that employee and the Company has no further pension-related obligations for that employee. The Company contributed $0.6$1.0 million, $1.1 million and $1.0 million, respectively to the defined contribution plan for each of the years ended December 31, 2020, 20192023, 2022 and 2018.
Certain facilities leased by Spectrum a company the Company acquired in 2017,LifeSciences LLC (“Spectrum”) are owned by the Roy Eddleman the former owner of Spectrum.Living Trust (the “Trust”). As of December 31, 2020, Mr. Eddleman2023, the Trust owned greater than 5%5% of the Company’sCompany's outstanding shares andshares. Therefore, the Company considers himthe Trust to be a related party. The lease amounts paid to this shareholderthe Trust prior to the public offering were negotiated in connection with the Spectrum Acquisition.acquisition of Spectrum. The Company incurred rent expense related to these leases totaling $0.7$0.7 million for the yearyears ended December 31, 2020 related to these leases.
117
For the Years Ended December 31, 2020 | ||||||||||||||||
Q1 | Q2 | Q3 | Q4 | |||||||||||||
(Amounts in thousands, except per share data) | ||||||||||||||||
Revenue | $ | 76,090 | $ | 87,462 | $ | 94,060 | $ | 108,648 | ||||||||
Gross profit | 44,108 | 50,599 | 54,434 | 60,485 | ||||||||||||
Operating expenses | 64,184 | 67,925 | 73,099 | 91,229 | ||||||||||||
Net income | 9,815 | 15,861 | 14,552 | 19,698 | ||||||||||||
Earnings per share: | ||||||||||||||||
Basic | $ | 0.19 | $ | 0.30 | $ | 0.28 | $ | 0.37 | ||||||||
Diluted | $ | 0.18 | $ | 0.30 | $ | 0.27 | $ | 0.36 | ||||||||
For the Years Ended December 31, 2019 | ||||||||||||||||
Q1 | Q2 | Q3 | Q4 | |||||||||||||
(Amounts in thousands, except per share data) | ||||||||||||||||
Revenue | $ | 60,634 | $ | 70,692 | $ | 69,445 | $ | 69,474 | ||||||||
Gross profit | 33,789 | 39,984 | 38,020 | 39,353 | ||||||||||||
Operating expenses | 49,463 | 59,638 | 61,481 | 63,580 | ||||||||||||
Net income | 8,053 | 8,095 | 1,659 | 3,604 | ||||||||||||
Earnings per share: | ||||||||||||||||
Basic | $ | 0.18 | $ | 0.17 | $ | 0.03 | $ | 0.07 | ||||||||
Diluted | $ | 0.17 | $ | 0.17 | $ | 0.03 | $ | 0.07 | ||||||||