Our earliest market focus was on telecommunications infrastructure, which uses a standard DC distribution voltage of 48V (nominally 48V to 54V), the highest distribution voltage that meets Safety
Our product portfolio also includes families of“front-end”
Reflecting our strategy, we categorize our offerings as either Advanced Products or Brick Products, generally based on design, performance, and form factor considerations, as well as the range of evolving applications for which the respective categories are appropriate. The Advanced Products category consists of our most innovative products, which are used to implement our proprietary distribution architecture, FPA, a highly differentiated approach to power distribution that enables flexible, rapid power system design using individual components optimized to perform a specific function. The Brick Products category largely consists of integrated power converters (i.e., “bricks”), incorporating multiple conversion stages, used in conventional power systems architectures including CPA, DPA, and IBA.
Given the growth profiles and performance requirements of the market segments served with Advanced Products and Brick Products, our strategy involves a transition in organizational focus, emphasizing investment in Advanced Products design and manufacturing, targeting high growth market segments with a
Our Products
Reflecting our Power Component Design Methodology, we offer a comprehensive range of modular building blocks enabling rapid design of a power system specific to a customer’s precise needs. Based on design, performance, and form factor considerations, as well as the range of evolving applications for which the products are appropriate, we categorize our product portfolios as either Advanced Products or Brick Products. We also sell a range of electrical and mechanical accessories for use with our products.
We continue to invest in the research and development of power system technologies and product concepts addressing two accelerating trends, the first toward higher required conversion efficiencies, and the second toward more and diverse
FPA, which is focused on, but not limited to, 48V DC distribution solutions, increases power system conversion efficiency, density, and power delivery performance by “factorizing” (i.e., separating) the power conversion process into individual components, reducing the design limitations and thermal management challenges, and scaling trade-offs associated with conventional architectures for DC voltage distribution. All such architectures follow a sequence whereby a DC voltage is first transformed, or reduced, and that lower voltage subsequently conducted (i.e., “bussed”) across the circuit to the “load” (i.e., the point of use), where the voltage is regulated and lowered once more, to the required operating voltage of the load. In a FPA implementation, the sequence is reversed. Regulation occurs first, and the regulation module can be placed in the optimal position for space utilization and thermal management. A regulated voltage approaching 48V is bussed across the circuit to the transformation module, which performs what we refer to as current multiplication, adjacent to the load. Bussing high voltage minimizes the current levels across the circuit, thereby minimizing the potential for distribution losses and reducing the volume of the conduit (e.g., the copper wire). Placing the relatively low noise, low heat current multiplication module adjacent to the load further minimizes the potential for distribution losses associated with bussing a low operating voltage to the load and reduces the potential influence of the power system on the performance of the load.
A typical FPA implementation for delivering 48V DC from a server backplane to a 1.0V microprocessor would consist of three modules: a PRM™(Pre-RegulatorVTM™(VoltageVTM™ (Voltage Transformation Module) current multiplier, and a proprietary communications controller. In contrast, a commodity IBA design for delivering 48V DC from a server backplane to a 1.0V microprocessor requires an additional conversion stage, to reduce 48V to 12V, and, at the point of load, a voltage regulation module (i.e., a “VRM” consisting of multiple switching regulators, each representing a phase and consisting of two switching transistors, one or more capacitors, and an inductor, with the transistors switched by pulse width modulation controller). For a 200W two stage, multiphase application, a 12V commodity IBA implementation would require an intermediate bus converter, to reduce 48V to 12V, and a VRM solution consisting of parallel phases (i.e., multiple switching regulators) to reduce and regulate the current for use at 1.0V by the microprocessor. Such a commodity IBA implementation requires a significantly higher component count, consumes more motherboard area, requires more copper conduit, generates more heat due to switching and distribution losses, offers inferior dynamic response, and can be meaningfully less efficient than a 48V FPA implementation.
The advantages of FPA over legacy power distribution architectures are most evident in high performance computing applications. Our“Power-on-Package”(Modular (Modular Current Multiplier) units, providing high performance current multiplication.ASIC, with superior transient response and unmatched power density.
We are unaware of any competitive solution for AI acceleration offering the power system performance and density of
5
Our latest innovation for powering processors is vertical power delivery, which involves mounting our highest-performance solutions on the underside of the motherboard, opposite the GPU or AI ASIC, thereby enabling a further reduction in distribution losses at the load, yielding higher efficiency and unprecedented power density. Vertically-mounting the solution allows unrestricted access to microprocessor input/output I/O pins on the top side of the motherboard, thereby improving I/O speed and memory access, which are a priority for GPUs and AI ASICs in AI applications. We are incontinue the final development stages of our vertical power delivery solutions and expect to be shipping releasedshipped prototype products to customersa certain customer in 2021.
Our proprietary technologies enable us to offer a range of Advanced Products, in various package formats across functional families, applicable to other market segments and power distribution architectures other than FPA. Within computing, these market segments include AC to DC voltage conversion and DC voltage distribution in server racks and high voltage conversion across datacenter infrastructure. We also offer Advanced Product power system solutions for aerospace and aviation (e.g., for use in satellites, unmanned aerial vehicles, and various airframes, including battery-powered aircraft, for which small size, light weight, and design flexibility are advantageous); defense electronics (e.g., for use in airborne, seaborne, or field communications and radar, for which reliability in harsh environments is a priority); industrialfactory automation, instrumentation, and test equipment (e.g., for use in robotics and semiconductor testing, for which high power levels and precision performance are required); solid state lighting (e.g., for use in large scale displays and signage, for which, again, small size, light weight, and design flexibility are advantageous); telecommunications and networking infrastructure (e.g., for use in high-throughput data distribution and pole-mounted small-cell base stations); and vehicles (e.g., in autonomous driving applications, electric vehicles, and hybrid electric vehicles).
Annual revenue associated with the sale of Advanced Products was approximately 35.8%55.3%, 28.6%61.0%, and 35.9%47.4% of the Company’s consolidated revenue for the years ended December 31, 2020, 2019,2023, 2022, and 2018,2021, respectively. Sales of Advanced Products recovered in 2020, reflecting the resumption of orders from both AI system vendors and hyperscalers, as the market segment recovered from an unexpected and sustained period of low demand across the computing market that began in 2018 and continued through 2019. This low demand was caused by the buildup of excess inventory levels at contract manufacturers during the second half of 2018 and planning uncertainty associated with the ongoing trade dispute between China and the U.S., the two largest geographic markets we serve. Despite the impact of theCOVID-19pandemic, the data center market has experienced relatively less disruption than other market segments we serve, as the rapid expansion of cloud-based computing andAI-drivenapplications drove sustained demand for our solutions through 2020.
We anticipate the percentage of periodic revenue associated with the sale of Advanced Products will increase in the future, given our strategic and organizational focus and the relatively higher expected growth of the market segments we serve.
Brick Products
Brick-format converters provide the integrated transformation, rectification, isolation, regulation, filtering, and/or input protection necessary to power and protect loads, across a range of conventional power architectures. We offer a wide range of brick-format
We also integrate these converters and components into complete power systems representing standard or customcustomers’customers' power needs. We refer to such standard products as our
We market our standard Brick Products emphasizing “mass customization,” using highly automated, efficient, domestic manufacturing to serve customers with product design and performance requirements, across a wide range of worldwide market segments, which could not be met by high-volume oriented competitors. We focus on distributed power implementations, for which our brick-format products are well-suited, in market segments such as aerospace and defense electronics, industrial automation, industrial equipment, instrumentation and test equipment, and transportation (e.g., rail)rail and heavy equipment applications). Our customers range from independent manufacturers of highly specialized electronic devices to larger original equipment manufacturers (“OEMs”) and their contract manufacturers. Some of our Brick Product lines have been in production for over a decade, reflecting the maturity of the markets we serve, the long-established relationships we have with many customers, and the long-standing suitability of our products to demanding applications.
Annual revenue associated with the sale of Brick Products, representing the sum of sales to third-parties of the products previously sold under the former Brick Business Unit operating segment during periods prior to the second quarter of 2019, inclusive of such sales of our Vicor Custom Power and VJCL subsidiaries, was approximately 64.2%44.7%, 71.4%39.0%, and 64.1%52.6% of the Company’s consolidated revenue for the years ended December 31, 2020, 2019,2023, 2022, and 2018,2021, respectively.
The applications in which our Advanced Products and Brick Products are used are typically in the higher-performance, higher-power segments of the market segments we serve. With our Advanced Product lines, our customers are concentrated in the data center and hyperscaler segments of enterprise computing, in which our products are used for voltage distributionpower delivery on server motherboards, in server racks, and across datacenter infrastructure, although we also targetserve applications in aerospace and aviation, defense electronics, industrialsatellites, factory automation, instrumentation, test equipment, solid state lighting,transportation, telecommunications and networking infrastructure, and vehicles (notably in the autonomous driving, electric vehicle, and hybrid vehicle niches of the vehicle segment). With our Brick Product lines, we serve customers concentrated in aerospace and defense electronics, industrial automation, industrial equipment, instrumentation and test equipment, and transportation (notably in rail and heavy equipment applications). With our strategic emphasis on larger, high-volume customers, we expect to experience a greater concentration of sales among relatively fewer customers.
As of December 31, 2020,2023, the Company’s order backlog was approximately $147,550,000,$160,805,000, compared to $104,164,000$304,392,000 as of December 31, 2019.2022. Backlog, as presented here, consists of orders for products for which shipment is scheduled within the following 12 months, subject to our scheduling and cancellation policies.
Over the course of 2023, the supply picture for the global semiconductor industry generally improved and acceptance of an order and our shipment of the product have increased, largely as a consequence of theCOVID-19pandemic. Although demand visibility and supply chain conditions across the global electronics industry stabilized in 2019, the rapid onset of theCOVID-19pandemic duringresult we were able to increase raw material inventory. We generally maintained quoted lead time for delivery to customers at 26 – 32 weeks depending on product family. In the first quarter of 2020 caused widespread delays in production and delivery. In response, during the second quarter2023, we increased prices for most products as part of 2020, we extended our quoted lead times for delivery to customers to beyond 20 weeks. Since the second quarter of 2020, our supply chain has been stable, with limited instances of delays or interruptions. However, until the pandemic is substantially contained worldwide and supply chain uncertainties are further reduced, we intend to maintain these quoted lead times.
A portion of our revenue in any quarter is, and will continue to be, derived from “turns” volume, representing either orders booked and shipped in the same quarter or orders for which customers have requested accelerated delivery from a later quarter to the current quarter. This volume generally has been associated with orders for Brick Products. OverIn 2023, our order backlog declined as a result of working down both current and overdue backlog while the past three years, the volume of orders booked and shipped within a quarter has declined steadily, reflecting lengthened delivery lead times across the electronics industry. However, over the
Competition and Market Characteristics
The competitive characteristics of the markets we serve with Advanced Products and Brick Products can differ significantly. For example, in the higher-performance segments of computing we serve, our Advanced Products most often compete with solutions offered by large integrated device manufacturers (“IDMs”), which offer integrated circuits (“ICs”) and semiconductor-based modules. These IDMs generally offer far broader product portfolios, possess far greater global manufacturing and support resources, and have the ability to aggressively price their products to defend market share. Accordingly, Advanced Products are positioned as highly differentiated alternatives to commodity solutions for customers seeking high levels of performance. The customers we serve with Advanced Products typically on a direct basis, are in market segments generally characterized by an emphasis on product performance differentiation, a compelling TCO, relatively extended and highly competitive design cycles, and product life cycles of generally less than three years. In contrast, the Brick Products competitive landscape is relatively fragmented, with large-scale, low-cost global suppliers of commodity solutions and many smaller manufacturers focused on specialized products or narrowly defined market segments or geographies. The market segments we serve with Brick Products, typically through sales representatives and distribution partners, generally are characterized by relatively short design cycles, relatively long (i.e., greater than three years) product life cycles, and, given the maturity of many market segments and applications, degrees of commoditization and price competition. As such, Brick Products are positioned with an emphasis on mass customization, through which we offer products with specific features and performance profiles typically not available from catalog-oriented competitors.
The size and growth characteristics of the markets we serve with Advanced Products and Brick Products also can differ significantly, and the range and quality of market data is problematic, making summary statements about these markets challenging. We believe our Advanced Products generally compete with power modules and power ICs developed and manufactured by IDMs and other fabless vendors of power semiconductors. We believe our Brick Products generally compete with similarly integrated switching power supply products developed and manufactured by large global competitors and a fragmented group of small regional competitors. The switching power supply market can be segmented by product type (i.e.,
For 2020,2023, exports to China and Hong Kong exceeded $93,000,000,were approximately $71,554,000, representing approximately 31.4%17.7% of total revenue and an approximately 60.4% increase4.8% decrease over the 2019 total.2022 total of approximately $75,194,000. We believe this increased
7
decreased volume was primarily associated with the stimulus spending of the Chinese government, although we also believe an unquantifiable amount ofa softer market in this volume may have been associated with accelerated purchasing by customers anticipating further deterioration of the trade relationship between China and the U.S. Our belief is based on input fromregion driving lower demand for our distribution partners in China, as well as the mix of products exported over the past three years, reflecting the transfer by our OEM customers for Advanced Products (and their contract manufacturers) of the majority of production programs from China and Hong Kong to other countries in order to avoid inbound and outbound tariffs. Exports to China and Hong Kong peaked at approximately $109,000,000 in 2018, but that figure included approximately $50,000,000 of exports of Advanced Products to OEM customers and their contract manufacturers. As stated, the majority of the programs associated with this amount have been transferred to other countries.products. Current exports to China and Hong Kong are heavily oriented toward Brick Products for industrial and rail applications, as well as certain aerospace and defense electronics applications permitted under U.S. export control regulations (our products are designated EAR99 commodities under the Export Administration Regulations of the U.S. Department of Commerce and are not subject to export licenses).
Despite our minor share in the overall merchant market and the competitive presence of numerous, far larger vendors in the market segments we serve with both Advanced Products and Brick Products, we believe we maintain an advantageous competitive position in those market segments. Notably, we believe we have the largest share of 48V power distribution opportunities within the segments of the computing market segments we serve.based on our differentiated technology. However, there are numerous competitors across these market segments that have significantly greater engineering, financial, manufacturing, and marketing and sales resources, as well as longer operating histories and longer customer relationships than we do.
Marketing and Sales
We reach and serve customers through several sales channels: a direct sales force; a network of independent sales representative organizations in North America and South America; independent, authorizedFutureAvnet Electronics, Incorporated, and Mouser Electronics, Inc. In order to provide greater focus to our account base in 2023, we discontinued use of independent sales representatives in North America. All sales channels are supported by regional TSCs, each offering application engineering and sales support for our channel partners. Domestic TSCs are located in: Andover, Massachusetts; Lombard, Illinois; and Santa Clara, California. International TSCs are located in: Beijing, China; Hong Kong, China; Shanghai, China; Shenzhen, China; Munich, Germany; Bangalore, India; Milan, Italy; Tokyo, Japan; Seoul, South Korea; Taipei, Taiwan (Republic of China); and Camberley, United Kingdom. Customers do not place purchase orders with TSCs, but do so directly with the Company or with our channel partners. In Japan, customers place purchase orders with authorized distributors or, for certain custom products, VJCL.
We generally sell our products on the basis of our standard terms and conditions, and we most commonly warrant our products for a period of two years. Effective January 1, 2017, we extended theThe warranty period tois three years for a range of H Grade, M Grade, and MI Familyproducts sold after that date. In a limited number of circumstances, we have entered into supply contracts with certain high-volume customers calling for extended warranty terms. With our distribution partners, we also enter into contracts providing for our product warranties to transfer to the end customer upon final sale of our product(s) by the distributor.
Because of the technically complex nature of our products and the applications they address, we maintain an extensive staff of Field Applications Engineers to support our own sales and customer support activities, as well as those of our channel partners. Field Application Engineers, based in our TSCs, provide direct technical support worldwide by reviewing new applications and technical matters with our channel partners in support of existing and potential customers. Product Line Engineers,Development Engineering is located in our Andover headquarters, where our Product Development Engineers support the Field Application Engineers assigned to all of our TSCs.
Our direct sales force focuses on higher-volume opportunities involving Advanced Products with global OEMs (and the Original Design Manufacturers (“ODMs”) and contract manufacturers serving these OEMs). Because of the high level of product differentiation and the increasing complexity and challenges of customer requirements, we have experienced, and may continue to experience, extended design cycles before production orders are received.
OurPowerBenchTMis a the Power System Designer workspace of tools and references allowingallow engineers to select, architect, and implement power systems using our products. Our highly differentiated
As stated, our strategy involves maintaining high levels of customer engagement and support for design and engineering, which has resulted in significant expansion of our sales and application engineering infrastructure over historical levels, notably across Asia.engineering. We incurred approximately $43,396,000, $43,387,000,$52,938,000, $49,708,000, and $42,533,000$46,602,000 in marketing and sales expenses in 2020, 2019,2023, 2022, and 2018,2021, respectively, representing approximately 14.6%13.1%, 16.5%12.5%, and 14.6%13.0% of revenues in 2020, 2019,2023, 2022, and 2018,2021, respectively.
8
Manufacturing, Quality Assurance, and Supply Chain Management
Our manufacturing facility, consisting of approximately 230,000320,000 square feet, is located in Andover, Massachusetts, where we are headquartered. In this facility, we manufacture Brick Products, with the exception of custom products produced by our Vicor Custom Power and VJCL subsidiaries, and Advanced Products, with the exception of certain products manufactured, packaged, and tested by third party wafer foundries and packaging contractors in the United States and Asia.
Our primary manufacturing processes involve steps common to automated assembly of electronics devices. We also have developed and employ proprietary manufacturing processes that contribute to the differentiated performance of our devices, including the innovative metal finishingelectroplating of our SM ChiPplaninitially planned on taking occupancy of the addition in the first half of 2021, but due to takea variety of factors including the effect of the global pandemic, we took occupancy of this addition during the first half of 2021.
We partnered with a highly-specialized third-party developer of metal finishingelectroplating processes and equipment, which performsperformed certain elements of our proprietary manufacturing process using equipment designed by the developer. In 2019 and 2020, we entered into service and equipment purchase agreements with this partner. While commodity electroplating services are available from numerous alternate providers, we entered into these agreements due to the level of our collaboration to date with the partner in the refinement of certain proprietary processes we employ and our joint commitment to environmentally sound manufacturing minimizing toxic waste. Approximatelyone-halfof the addition to our manufacturing facility will be allocated to installation of highly-automated equipment scheduled to be delivered by the partner, beginning the first half of 2021, which will enable the vertical integration of all manufacturing process steps forSM-ChiPmodules. We expect thepre-productionqualification of this installed equipment will begin late during the first half of 2021, with production volumes to follow later in the year. We have relied on this partner’s services to meet our requirements forto date,until 2023, when we completed the plating line and we expect to do so throughbrought the production process in-house. The initial planned installation dates for this equipment in 2021 after which we expect to have fully-operational production capabilities on site.
Product quality and reliability are critical to our success and, as such, we emphasize quality and reliability in our design and manufacturing activities. We follow industry best practices in manufacturing and are compliant with ISO 9001 certification standards (as set forth by the International Organization for Standardization). Our quality assurance practices include rigorous testing and, as necessary,
Components and materials used in our products are purchased from a variety of domestic and international vendors. Generally,In 2023, there was a general loosening of the global electronicssemiconductor supply chain, recovered during 2020 fromeven as the impactsupply of theCOVID-19
Certain Advanced Products and semiconductor devices used in our production are manufactured by a limited number of wafer foundries, with packaging and test services provided by a limited number of third parties. We rely on these wafer foundries and packaging and test providers for supply continuity of these critical semiconductor devices. DuringWhile prior to 2023 there had been supply constraints across a number of these suppliers, in 2023 we were generally able, with the fourth quarterexception of 2020 anda limited number of constraints on certain components, to date in the first quarter of 2021, the semiconductor test and packaging segment of the global electronicsdrive sufficient supply chain has experienced well-publicized capacity constraints, and,so as a result, we recently have experienced unpredicted delays in receipt of certain semiconductor components from our packaging and test vendors. To date, these delays have not had a material impact on our ability to meet customer delivery requirements. In response to current schedule uncertainties, we are seeking alternate providers of packaging and test services and may further increase inventory levels for these semiconductor components, when possible. Should these capacity constraints continue or worsen and we are unable to obtain the necessary volumes of required semiconductor components, we may not be able to meet delivery commitments for certain customers and may not be able to reduce delivery lead times foroverdue backlog during the foreseeable future.
To date, we have not experienced material delays or reduced raw material availability as a result of trade disputes between the U.S. and China, including the imposition in 2018 of import tariffs under the provisions of Section 301 of the Trade Act of 1974 (19 U.S.C. § 2411) (“Section 301 Tariffs”) on certain Chinese goods imported into the United States. For the year ended December 31, 2020,2023, costs associated with tariffs totaled approximately $7,259,000 an increase$7,985,000, a decrease of 37%21.7% over the $5,280,000$10,201,000 in costs incurred for the year ended December 31, 2019.2022. For the year ended December 31, 2021, costs associated with tariffs totaled approximately $6,678,000. We continue to assess the impact of these costs and are actively evaluating alternative sources of raw materials. We also have filed “duty drawback” applications with U.S. Customs and Border Protection for the recovery of tariffs paid on raw materials used to produce products we subsequently exported. At this time,We recovered $6,954,000, $229,000 and $10,000 for the years ended December 31, 2023, 2022 and 2021, respectively, however, we are not able to estimate the amount or timing of such recovery or the timing thereof.
Intellectual Property
Our competitive positioning has been, and will continue to be, supported by our long-standing commitment to research and development of power distribution architectures, power conversion technologies, advanced packaging and manufacturing, and innovative approaches to solving customer problems. Our research and development activities have resulted in important domestic and foreign patents protecting our products and enabling technologies, as well as proprietary trade secrets associated
9
with our use of certain components and materials of our own design and proprietary manufacturing, packaging, and testing processes. We incurred approximately $50,916,000, $46,588,000,$67,857,000, $60,594,000, and $44,286,000$53,114,000 in research and development expenses in 2020, 2019,2023, 2022, and 2018,2021, respectively, representing approximately 17.2%16.8%, 17.7%15.2%, and 15.2%14.8% of revenues in 2020, 2019,2023, 2022, and 2018,2021, respectively.
We believe our intellectual property affords advantages by building fundamental and multilayered barriers to competitive encroachment upon key features and performance benefits of our principal product families. Our patents cover the fundamental switching topologies used to achieve the performance attributes of our converter product lines; converter array architectures; product packaging design; product construction; high frequency magnetic structures; and automated equipment and methods for circuit and product assembly.
As of December 31, 2020,2023, in the United States, we have been issued 117 total patents. These128 patents havehaving expirations scheduled between 20212024 and 2038. We also2040 and have filed a number of patent applications which are still pending, many of which are expected to issue as patents in the United States and certain countries of Europe and Asia, including applications that would extend the life of current patents.2024. We have vigorously protected our rights under these patents and will continue to do so. Although we believe patents are an effective way of protecting our technology, there can be no assurances our patents will prove to be enforceable in any given jurisdiction.
In addition to generating revenue from product sales, we seek to license our intellectual property. In granting licenses, we generally retain the right to use our patented technologies and manufacture and sell our products in all licensed geographic areas and fields of use. Revenues from licensing arrangements have not exceeded 10% of our consolidated revenues in any of the last three fiscal years.
Human Capital Management
High-caliber employees are important to achieving Vicor’s mission of providing the highest performance power solutions to meet the requirements of the most demanding applications. In order to maintain leadership in power systems design in a highly competitive employment market, attracting and retaining the best team worldwide is critical. Accordingly, we offer compelling compensation and benefits, foster a culture of innovation in which employees are empowered to do (and are rewarded for) their best work, and seek to establish Vicor as a meaningful contributor to the communities in which we operate, further strengthening the bonds between employees and the Company.
As of December 31, 2020,2023, we had 1,0491,063 full-time employees, of which 940968 were in the U.S. and 10995 were in our international locations. As of December 31, 2023, we also had 25 part-time temporary employees. None of our employees are represented by a labor union or covered by a collective bargaining agreement.
We recruit from colleges and universities, with a focus on specific engineering disciplines. In collaboration with certain universities, we maintain a student“Co-Op”substantial percentagenumber of participants receiving offers of full-time employment.
Our compensation program is designed to attract and reward talented individuals who possess the skills necessary to support our business objectives, assist in the achievement of our strategic goals, and create long-term value for our stockholders. We provide employees with compensation packages that include a competitive base salary or wage rate and benefits such as life and health (medical, dental, and vision) insurance, supplemental insurance, paid time off, paid parental leave, and a 401(k) plan (with Company match). Generally (and subject to local laws), new employees are awarded
We emphasize and encourage employee development and training. To empower employees to reach their potential, we provide a range of development programs and opportunities, including
We seek to support the communities in which we operate and believe this commitment contributes to our efforts to attract and retain employees. We support our employees in volunteer initiatives. We also partner with a range ofMethuen,Andover, MA, a local advocacy agency, in providing enriching employment opportunities for adults participating in that agency’s programs.individuals with disabilities.
10
For more information on our employee and community initiatives, please see our Corporate Social Responsibility webpage at
Available Information
We maintain a website with the address www.vicorpower.com and make available free of charge through this website our Annual Reports on
While our website sets forth extensive information, including information regarding our products and the applications in which they may be used, such information is not a part of, nor incorporated by reference into, this Annual Report on
ITEM 1A. RISK FACTORS
This Annual Report on
Operational Risks
Our future operating results are difficult to predict and are subject to fluctuations.
Our operating results, including revenues, gross margins, operating expenses, and net income (loss), have fluctuated on a quarterly and annual basis. Our strategic focus on higher volume opportunities with OEMs, ODMs, and contract manufacturers has caused the actions of a relative few such customers to disproportionately influence our operating results. Unanticipated delays in purchase orders from, and shipments to, certain large customers have resulted in lower than expected revenue. Similarly, our strategic focus on the development of market-leading technologies and manufacturing processes, often implemented in proprietary semiconductor circuitry, materials, and packaging, has exposed the Company to the risks and costs of delays in such development and the use of a relatively few number of suppliers of proprietary circuits and materials or providers of proprietary services.
Despite recent profitability trends, we cannot predict if we will maintain sustained profitability. Our future operating results may be materially influenced by a number of factors, many of which are beyond our control, including:
11
As a result of these and other factors, we cannot assure you we will not experience significant fluctuations in future operating results on a quarterly or annual basis. In addition, if our operating results do not meet the expectations of investors, the market price of our Common Stock may decline.
Global economic and political uncertainties, notably those associated with trade policy, could materially and adversely affect our business and consolidated operating results.
For the years ended December 31, 2020, 2019,2023, 2022, and 2018,2021, revenues from sales outside the United States were 64.4%63.1%, 53.7%67.6%, and 62.0%67.0%, respectively, of our total revenues. Net sales torevenues from customers in China and Hong Kong, our largest international market, accounted for approximately 31.4%17.7% in 2020,2023, approximately 22.1%18.8% in 2019,2022, and approximately 37.4%27.5% in 2018, respectively,2021 of total net sales.revenues. We expect international sales, notably in Asia, will continue to be a significant component of total sales, since many of the OEMs and ODMs we target as customers are domiciled offshore, and such customers increasingly utilize offshore contract manufacturers, and rely upon those contract manufacturers to place orders directly with us. We also expect international revenue from our distributors to continue to increase.
To date, we have not experienced material delays or reduced raw material availability as a result of trade disputes between the U.S. and China, including the imposition in 2018 of import tariffs under the provisions of Section 301 of the Trade Act of 1974 (19 U.S.C. § 2411) (“Section 301 Tariffs”) on certain Chinese goods imported into the United States. However, the costs of Section 301 Tariffs have had a material impact on our profitability. For the year ended December 31, 2020,2023, Section 301 Tariffs totaled approximately $7,259,000, an increase$7,985,000, a decrease of 37%21.7% over the $5,280,000$10,201,000 incurred for 2019.2022. For 2020the year ended December 31, 2021, costs associated with tariffs totaled approximately $6,678,000. For 2023, 2022 and 2019,2021, Section 301 Tariffs totaled approximately 2.4%2.0%, 2.6% and 2.0%1.9%, respectively, of annual revenue, representing a material reduction in our gross profit margin as a percentage of annual revenue.
We continue to evaluate alternative sources of raw materials, and in late 2020,2021, 2022, and 2023 we qualified2021,2024, given the ongoing transition to
We also have filed “duty drawback” applications with U.S. Customs and Border Protection for the recovery of Section 301 Tariffs paid on raw materials and components used to produce products we subsequently exported. At this time, we have received no such recovery, andWe recovered $6,954,000 for the year ended December 31, 2023, however, we are not able to estimate the amount or timing of any recovery or the timing thereof.additional recoveries, and there can be no assurance that there will be any additional recoveries.
12
In 2019, China implemented reciprocal inbound tariffs of up to 25% on products exported from the U.S., including all of our products. We do not believe these tariffs, incurred by our Chinese and Hong Kong distributors, have had a material impact on the unit volume or dollar value of our exports to China, which we attribute to the differentiated performance of our products in market segments in which we have an established presence. However, we cannot predict the long-term influence of these tariffs on our competitive position in China, especially in light of the increased pressure by the Chinese government on Chinese manufacturers to meet the “China 2025” mandate for targeted development of Chinese technology sectors. Under this mandate, domestic technology vendors are explicitly favored over foreign vendors such as Vicor. We believe we experienced reduced demand in certain segments (e.g., rail), notably in 2019, reflecting the significant role of state-owned enterprises in those segments. We regularly assess the competitive position and profitability of certain product lines sold in China and Hong Kong, and may choose to reduce our product offerings if competitive conditions and reduced profitability so warrant.
Uncertain macroeconomic conditions, extended trade disputes, and the relative strength of the U.S. Dollar may reduce our Brick Product categories, increased risk of excess and obsolete inventories, increased risk in the collectability of our accounts receivable from our customers, increased risk in potential reserves for doubtful accounts and write-offs of accounts receivable, and higher operating costs as a percentage of revenues.
In October 2022, the U.S. Government instituted export controls of certain semiconductor technologies to China, and subsequent to that action, the U.S. Department of Commerce added certain China-based companies to its entity list, which precludes shipment of semiconductor products to these companies without a license. These restrictions could cause a reduction in demand for our products from contract manufacturing customers that manufacture for high performance compute OEMs, as well as a reduction in exports to customers on the entity list. We cannot be certain what the ultimate impact of these export controls will be on our business, financial condition, and results of operations.
Our operating results recently have been influenced by a limited number of customers, and our future results may be similarly influenced.
Since the introduction of our Advanced Products, the Company has derived the majority of its revenue from Advanced Products in any given year from either one customer or a limited number of customers, whether through sales directly to the customer(s) or indirectly to the customers’ contract manufacturers. This concentration of revenue is a reflection of the relatively early stage of adoption of the Advanced Products and the associated technologies and power system architectures, and our targeting of market leading innovators as initial customers.
Our current sales and marketing efforts are focused primarily on accelerating the adoption of Advanced Products by a diversified customer base, across a number of identified market segments. While we believe we have been successful to date in diversifying our Advanced Products customer base beyond early adopters, we cannot assure you our strategy will be successful and further diversification of customers will be achieved.
We may not be able to procure necessary key components or raw materials, or we may purchase excess raw material inventory or unusable inventory, which increases the risk of reserve charges to reduce the value of any inventory deemed excess or obsolete, thereby reducing our profitability.
The power systems industry, and the electronics industry as a whole, can be subject to pronounced, lengthy business cycles and otherwise subject to sudden and sharp changes in demand. Our success, in part, is dependent on our ability to forecast and procure inventories of components and materials to match production schedules and customer delivery requirements. Many of our products require raw materials supplied by a limited number of vendors and, in some instances, a single vendor. During certain periods, key components or materials required to build our products may become unavailable in the timeframe required for us to meet our customers’ needs. Our inability to secure sufficient raw materials to manufacture products for our customers has reduced, in the past, our revenue and profitability and could do so again.
We may choose, and have chosen, to mitigate our inventory risks by increasing the levels of inventory for certain components and materials. Such increased inventory levels may increase the potential risk for excess or obsolete inventories, should our forecasts fail to materialize or if there are negative factors impacting our customers’ end markets, leading to order cancellation. If we identify excess inventory or determine certain inventory is obsolete (i.e., unusable), we likely will record
13
additional inventory reserves (i.e., expenses representing the
We rely on third-party vendors and subcontractors for supply of components, assemblies, and services and, therefore, cannot control the availability or quality of such components, assemblies, and services.
We depend on third-party vendors and subcontractors to supply components, assemblies, and services used to manufacture our products, some of which are supplied by a single vendor. We have experienced shortages of certain semiconductor components and delays in service delivery, have incurred additional and unexpected costs to address the shortages and delays, and have experienced our own delays in production and shipping.
If suppliers or subcontractors cannot provide their products or services on time or to our specifications, we may not be able to meet the demand for our products and our delivery times may be negatively affected. In addition, we cannot directly control the quality of the products and services provided by third parties. In order to expand revenue, we likely will need to identify and qualify new suppliers and subcontractors to supplant or replace existing suppliers and subcontractors, which may be a time-consuming and expensive process. In addition, any qualification of new suppliers may require customers of our products utilizing products and services from new suppliers and service providers to undergo a
Extended interruption of production at our manufacturing facility in Andover, Massachusetts, or a failure to achieve anticipated efficiencies could materially reduce our revenue, increase our costs, and, potentially, negatively impact our customers.
The majority of our power components and power systems, whether for direct sale to customers or for sale to our subsidiaries for incorporation into their respective products, are manufactured in our Andover facility.
Substantial damage to our existing manufacturing facility due to fire, natural disaster, power loss, or other events, including disruptive events associated with our ongoing expansion of the facility, could interrupt manufacturing, contributing to lengthy shipment delays that could have a negative impact on customers and, in turn, our customer relationships. While we have never experienced any meaningful interruption of manufacturing in our history, any prolonged inability to utilize all or a significant portion of our Andover facility could have a material adverse effect on our results of operations.
We have been making and will continue to make capital investments for the expansion of manufacturing capacity for the production of Advanced Products at our Andover facility. Based onIn 2023, as part of the expansion of our extended long-term volume forecast,Andover facility, we anticipate additional capacity will be required to meet expected customer requirements. Duringbrought in-house the second quarter of 2020, we began construction of an approximately 90,000 square feet,two-storyaddition to our existing plant, and that construction continues on schedule.
Disruption of our information technology infrastructure could adversely affect our business.
We depend heavily on our computing and communications infrastructure to achieve our business objectives, particularly for our financial and operational record keeping, our computer-integrated manufacturing processes controlling all aspects of our operations in our manufacturing facility in Andover, Massachusetts, our public website, and our email communications. We also rely on trusted third parties to provide certain infrastructure support services to us. If we or a third party service provider encounter a problem that impairs this infrastructure, the resulting disruption could impede the accuracy and timeliness of our financial reporting processes, and our ability to record or process customer orders, manufacture, and ship in a timely manner, or otherwise carry on business in the normal course. Our image and reputation also could be negatively affected by such circumstances. Additionally, we could incur material liabilities associated with the harm such impairment and disruption of our infrastructure may have on third parties including those associated with the unintentional release of confidential information and/and or sensitive data. While we carry business interruption insurance to offset financial losses from such an interruption, and cyber-risk insurance to address potential liabilities from such circumstances, such insurance may be insufficient to compensate us for the potentially significant costs or liabilities incurred. Any such events, if prolonged, could have a material and adverse effect on our operating results and financial condition.
14
On December 24, 2019, elements of our network were compromised by a form of malware referred to as “ransomware.” In close collaboration with our service provider, we had restored computing and network functions to full operational status by the afternoon of December 27, 2019. Subsequent analysis by management and the forensic specialists we retained allowed us to conclude the incident had no material impact on our operations, financial condition and performance, or the integrity of our financial reporting systems. In response to the vulnerabilities identified, we have substantially enhanced network and file security through expanded and improved system monitoring, network and file access procedures, user training, and emergency response protocols. However, even with our expanded commitment to continuous improvement of the security of our information technology infrastructure, we can offer no assurance that we will be successful in detecting or preventing network security incidents and associated disruptions in the future.
Our systems are designed to protect us from network security incidents and associated disruptions. However, as evidenced by the ransomware incident described above, we remain vulnerable to computer viruses and related software-based challenges to the integrity of our systems, unauthorized or illegal
The Company provides confidential information to third party business partners and/or receives confidential information from third party business partners in certain circumstances, when doing so is necessary to conduct business, particularly with departments of agencies of the U.S. Government. While we employ confidentiality agreements to protect other sensitive information (i.e., information not considered CUI)controlled unclassified information), our own security measures or those of our third party service providers may not be sufficient to protect such information in the event the computing infrastructure of these third party business partners is compromised. Security incidents involving our computing and communications infrastructure or that of a third party business partner or service provider could result in the misappropriation or unauthorized release of confidential information belonging to us or to our employees, partners, customers or suppliers, which could result in an interruption to our operations, result in a violation of privacy or other laws, expose us to a risk of litigation, or damage our reputation, any of which could have a material and adverse effect on our operating results and financial condition. Our network segmented NIST
We may face legal claims and litigation from product warranty or other claims that could be costly to resolve.
We have in the past and may in the future encounter legal action from customers, vendors, or others concerning product warranty or other claims. We generally offer aEffective January 1, 2017, we extended theThe warranty period tois three years for a range of H Grade, M Grade and MI Familyproducts sold after that date. In a limited number of circumstances, we have entered into supply contracts with certain high-volume customers calling for extended warranty terms. With our distribution partners, we also enter into contracts providing for our product warranties to transfer to the end customer upon final sale of our product(s) by the distributor.
We invest significant resources in the testing of our products; however, if any of our products contain defects, we may be required to incur additional development and remediation costs, pursuant to our warranty policies. These issues may divert our technical and other resources from other product development efforts and could result in claims against us by our customers or others, including liability for costs associated with product
Our ability to successfully implement our business strategy may be limited if we do not retain our key personnel and attract and retain skilled and experienced personnel.
Our success depends on our ability to retain the services of our executive officers. The loss of one or more members of senior management could materially adversely influence our business and financial results. In particular, we are dependent on the services of Dr. Vinciarelli, our founder, Chairman of the Board, Chief Executive Officer, and President. The loss of the services of Dr. Vinciarelli could have a material adverse effect on our development of new products and on our business and results of operations. On February 24, 2021, James A. Simms notified us of his decision to resign from his positions as our Corporate Vice President, Chief Financial Officer, Treasurer, and Secretary effective June 30, 2021. We have initiated a search for a new Chief Financial Officer. Such leadership transitions can be inherently difficult to manage and may result in a loss of institutional knowledge and cause disruptions to our business. If we cannot effectively manage leadership transitions and management changes, it could make it more difficult to successfully operate our business and pursue our business goals. In addition, our research and development and marketing and sales activities depend on highly skilled engineers and other personnel with technical skills, who are in high demand and are difficult to replace. Our continued operations and growth depend on our ability to attract and retain skilled and experienced personnel in a very competitive employment market. If we are unable to attract and retain such employees, our ability to successfully implement our business strategy may be harmed. The labor market for skilled and unskilled workers has been very tight over the past year, and at times we have experienced longer than normal times in recruiting necessary resources, and have had to increase compensation to attract and retain employees.
15
Our operations could be affected by the complex laws, rules and regulations to which our business is subject, and political and other actions may adversely impact our business.
We are subject to laws and regulations domestically and worldwide, affecting our operations in areas including, but not limited to, intellectual property ownership and infringement; taxes; import and export requirements and tariffs; anti-corruption; business acquisitions; foreign exchange controls and cash repatriation restrictions; data privacy requirements; employment; product regulations; cybersecurity; environmental, health, and safety requirements; and climate change. Compliance with such requirements can be onerous and expensive and may impact our business operations negatively. Should any of these laws, rules and regulations be amended or expanded, or new ones enacted, we could incur materially greater compliance costs and/or restrictions on our ability to manufacture our products and operate our business.
Government actions, including trade protection and national security policies of U.S. and foreign government bodies, such as tariffs, import or export regulations, including deemed export restrictions, trade and economic sanctions, decrees, quotas or other trade barriers and restrictions could affect our ability or the ability of our customers and end users to sell products in certain countries and thereby have a material adverse effect on our business, revenue and results of operations. For example, in 2022, the U.S. government imposed additional export controls on certain advanced computing semiconductor chips (chips, advanced computing chips, integrated circuits (“ICs”)), certain semiconductor manufacturing items and transactions for certain IC end use, including supercomputer end uses. Furthermore, the U.S. government has continued to expand, the number of foreign entities on the Entity List (a restricted party list that imposes additional licensing requirements on shipments to listed parties). These recent export controls are, in part, intended to restrict the ability of the People’s Republic of China to obtain advanced computing chips, develop and maintain supercomputers, and manufacture advanced semiconductors. The implementation, interpretation and impact on our business of these rules and other regulatory actions taken by the U.S. government is uncertain and evolving, and these rules, other regulatory actions or changes, and other actions taken by the governments of either the U.S. or China, or both, that have occurred and may occur in the future could materially and adversely affect our business, revenue and results of operations.
While we have policies and procedures in place to ensure compliance with sanctions and trade restrictions and other applicable laws, our employees, contractors, partners, and agents may take actions in violation of such policies and applicable law, for which we may be ultimately held responsible. Intentional and unintentional violations of these laws can result in fines and penalties; criminal sanctions against us, our officers, or our employees; prohibitions on the conduct of our business; and damage to our reputation, any of which could have a material and adverse impact on our business, operating results and financial condition.
Global economic uncertainty associated with the COVID-19 pandemic could materially and adversely affect our business and consolidated operating results.
While the COVID-19 pandemic is for the most part behind us, with limited incidents at Vicor in 2023, there is a continued risk that the virus will return and we are not able to predict the impact a further outbreak could have on our business, financial condition or results of operations.
Trading conditions in China (inclusive of Hong Kong) had deteriorated through 2019 due to macroeconomic and trade-related uncertainties. At the beginning of 2020, trading conditions were significantly further affected by the COVID-19 pandemic, with much of the country’s manufacturing disrupted for January and February 2020. By late March 2020, after aggressive measures to contain the coronavirus, the Chinese government quickly implemented economic stimulus measures, and we experienced a rapid recovery of demand from China and Hong Kong. This demand was sustained through the first part of 2021 before subsiding in late 2021. As addressed in our discussion herein of market characteristics, exports to China and Hong Kong for 2023 totaled approximately $71,554,000, representing approximately 17.7% of total revenue for the year, and a reduction from the prior year. It is not possible for us to predict whether this market will rebound as the Chinese government has eliminated their zero-COVID policy.
Our customers, business partners, and suppliers have been and may continue to be adversely affected by the COVID-19 pandemic, which also may contribute to a negative influence on our future financial and operational performance.
Competitive Risks
We compete with many companies possessing far greater resources.
Some of our competitors have far greater financial, manufacturing, technical, and sales and marketing resources than we possess or have access to. Our Brick Products compete with those products offered by domestic and foreign manufacturers of integrated power supplies and related power conversion components. With our Advanced Product lines, we compete with global IDMs and fabless developers of semiconductor-based power management modules and power
16
management ICs. These competitors have far larger organizations and broader semiconductor-based product lines. Competition is generally based on product performance, design flexibility (i.e., ease of use), product price, and product availability, but with the relative importance of these factors varying among products, markets, and customers.
Existing or new competitors may develop products or technologies that more effectively address the demands of our customers and markets with enhanced performance, features and functionality, or lower cost. Larger competitors frequently seek to maintain market share and protect customer relationships through heavily-discounted pricing, which we may not be able to match. If we fail to develop and commercialize leading-edge technologies and products that are cost effective and maintain high standards of quality, and introduce them to the market on a timely basis, our competitive position and results of operations could be materially adversely affected.
Our future success depends upon our ability to develop and market differentiated, leading-edge power conversion products for larger customers, potentially contributing to lengthy product development and sales cycles that may result in significant expenditures before revenues are generated. Our future operating results are dependent on the growth in such customers’ businesses and on our ability to profitably develop and deliver products meeting customer requirements.
The power system industry and the industries in which many of our customers operate are characterized by intense competition, rapid technological change, quickened product obsolescence, and price erosion for mature
Our future success depends substantially upon further customer acceptance of our innovative Advanced Products notablyincluding ourin AIfor the computing market and other high-performance applications. Advanced Products supporting the electrification of automobiles.As we have been in the early stages of market penetration for these and other Advanced Products, we have experienced lengthy periods during which we have focused our product development efforts on the specific requirements of a limited number of large customers, followed by further periods of delay before meaningful purchase orders are received. These lengthy development and sales cycle times increase the possibility a customer may decide to cancel or change product plans, which could reduce or eliminate our sales to that customer. As a result, we may incur significant product development expenses, as well as significant sales and marketing expenses, before we generate the related revenues for these products. Furthermore, we may never generate the anticipated revenues from a product after incurring such expenses if our customer cancels or changes its product plans.
In 2023, we continued our expansion of a dedicated sales effort to penetrate the automotive market with our Advanced Products, notably in the electrification of passenger automobiles. Our Power Component Design Methodology provides conversion solutions for 800V, 400V, and 48V within advanced electric vehicles. The automotive market is dominated by relatively few global OEMs and “tiers” of well-established suppliers. Penetrating this market will be challenging and we may not be successful in doing so.
We continue to shiftfocus our to focus on larger opportunities with global OEMs, ODMs, and contract manufacturers. Our growth is therefore dependent on: the pace at which these OEMs and ODMs develop their own new products; the acceptance of our Advanced Products by these OEMs and ODMs; and the success of the customers’ products incorporating our Advanced Products. If we fail to anticipate changes in our customers’ businesses and their changing product needs or do not successfully identify and enter new markets, our results of operations and financial position could be negatively impacted.
We cannot offer any assurance the markets we currently serve will grow in the future, our Advanced Products or Brick Products will meet respective market requirements, or we can maintain adequate gross margins or operating profits in these markets.
We may be unable to adequately protect our proprietary rights, which may limit our ability to compete effectively.
We operate in an industry in which the ability to compete depends on the development or acquisition of proprietary technologies that must be protected to preserve the exclusive use of such technologies. We devote substantial resources to establish and protect our patents and proprietary rights, and we rely on patent and intellectual property law to protect such rights. This protection, however, may not prevent competitors from independently developing products similar or superior to our products. We may be unable to protect or enforce current patents, may rely on unpatented technology that competitors could restrict or replicate, or may be unable to acquire patents in the future, all of which may have a material adverse effect on our competitive position. In addition, the intellectual property laws of foreign countries may not protect our rights to the same extent as those
We face intellectual property infringement claims that could be disruptive to operations and costly to resolve and may encounter similar infringement claims in the future.
The power supply industry is characterized by vigorous protection and pursuit of intellectual property rights. We have in the past received and may in the future receive communications from third parties asserting that our products or manufacturing processes infringe on a third party’s patent or other intellectual property rights. Such assertions, if publicly disclosed, have in the past inhibited and may in the future inhibit the willingness of potential customers to purchase certain of our products. In the event a third party makes a valid intellectual property claim against us and a license is not available to us on commercially reasonable terms, or at all, we could be forced to either redesign or stop production of products incorporating that technology, and our business, financial condition and operating results could be materially and adversely affected. In addition, litigation may be necessary to defend us against claims of infringement, and this litigation could be costly, extend over a lengthy period of time, and divert the attention of key personnel. An adverse outcome in these types of matters could have a material adverse impact on our business, operating results and financial condition.
Please see Note 17 —15 – Commitments and Contingencies, to the Consolidated Financial Statements for information regarding current litigation related to our intellectual property.
Any expenses or liability resulting from the outcome of litigation could adversely influence our operating results and financial condition.
From time to time, we may be subject to claims or litigation, including intellectual property litigation as described elsewhere in this Annual Report on Form
The outcomes of legal proceedings and claims brought against us are subject to significant uncertainty. An estimated loss from a loss contingency such as a legal proceeding or claim is accrued by a charge to income if it is considered probable an asset has been impaired or a liability has been incurred and the amount of the loss can be reasonably estimated. Disclosure of a contingency is required if there is at least a reasonable possibility that a loss has been incurred. In determining whether a loss should be accrued, we evaluate, among other factors, the degree of probability of an unfavorable outcome and the ability to make a reasonable estimate of the amount of loss. Changes in these factors could materially impact our financial statements. As of December 31, 2020,
Please see Note 15 – Commitments and Contingencies, to the Consolidated Financial Statements for information regarding current litigation related to our evaluation led us to conclude no accrual of a loss contingency was warranted.
Regulatory Risks
If we fail to maintain an effective system of internal controls over financial reporting or discover material weaknesses in our internal controls over financial reporting, we may not be able to report our financial results accurately or timely or detect fraud, which could have a material adverse effect on our business.
An effective internal control environment is necessary for us to produce reliable financial reports and is an important part of our effort to prevent financial fraud. Section 404 of the Sarbanes-Oxley Act of 2002 (“SOX”) requires our
18
management to report on, and our independent registered public accounting firm to attest to, the effectiveness of our internal control over financial reporting.
We have an ongoing program to perform the system and process evaluation and testing necessary to comply with the requirements of SOX and to continuously improve and, when necessary, remediate internal controls over financial reporting.
While management evaluates the effectiveness of our internal controls on a regular basis, these controls may not always be effective. There are inherent limitations on the effectiveness of internal controls, including collusion, management override, and failure in human judgment. In addition, control procedures are designed to reduce rather than eliminate business risks. In the event our Chief Executive Officer or Chief Financial Officer, our certifying officers under SOX, or our independent registered public accounting firm determines our internal controls over financial reporting are not effective as defined under Section 404, we may be unable to produce reliable financial reports or prevent fraud, which could materially harm our business. In addition, we may be subject to sanctions or investigation by government authorities or self-regulatory organizations, such as the SEC, the Financial Industry Regulatory Authority, or The NASDAQ Stock Market LLC. Any such actions could affect investor perceptions of the Company and result in an adverse reaction in the financial markets due to a loss of confidence in the reliability of our financial statements, which could cause the market price of our Common Stock to decline or limit our access to capital.
Risks Related to Share Value
The price of our Common Stock has been volatile and may fluctuate in the future.
Because of the factors set forth above and below, among others, the trading price of our Common Stock has fluctuated and may continue to fluctuate significantly:
In the past, we have declared and paid cash dividends on our Common Stock. The payment of dividends is based on the periodic determination by our Board of Directors that we have adequate capital to fund anticipated operating requirements and that excess cash is available for distribution to stockholders via a dividend. We have no formal policy regarding dividends and, as such, investors cannot make assumptions regarding the possibility of future dividend payments nor the amounts and timing thereof. As of December 31, 2020,2023, we have no plans to declare or pay a cash dividend.
The ownership of our Common Stock is concentrated between Dr. Vinciarelli and a limited number of institutional investors. As of December 31, 2020,2023, Dr. Vinciarelli was the beneficial owner of 10,014,4549,592,017 shares of our Common Stock, plus 155,977430,743 shares which Dr. Vinciarelli has the right to acquire upon exercise of options to purchase Common Stock within 60 days of December 31, 2020.2023. He also holds 11,023,648 shares of our unregistered Class B Common Stock (which may only be sold or transferred after required conversion, on a49.6%47.6% of our total issued and outstanding shares of capital stock. Accordingly, the market float for our Common Stock and average daily trading volumes are relatively small, which may negatively impact investors’ ability to buy or sell shares of our Common Stock in a timely manner.
19
Dr. Vinciarelli owns 93.8% of the issued and outstanding shares of our Class B Common Stock, which possess 10 votes per share. Dr. Estia J. Eichten, a member of our Board of Directors, owns the majority of the balance of the Class B Common Stock issued and outstanding. As such, Dr. Vinciarelli, controlling in aggregate 80.4%79.8% of our outstanding voting securities, has effective control of our governance.
ITEM 1B. UNRESOLVED STAFF COMMENTS
None.
ITEM 1C. CYBERSECURITY
Our Company has a dedicated team of technology professionals who consistently monitor risks related to cybersecurity. Our Corporate Vice President and Chief Information Officer, as well as our Chief Information Security Officer (“CISO”) are responsible for managing our information technology (“IT”) security program. Our CISO is a Certified Information Systems Security Professional (CISSP), holds a Masters Degree in Computer Information Systems, and has over 20 years of relevant expertise in assessing and managing cybersecurity risks. Their teams are responsible for leading an enterprise-wide cyber resilience strategy, policy, standards, architecture, and processes. To identify and address potential information security risks, we use a defense-in-depth methodology that employs multiple, redundant defensive measures and outlines actions to take in the event of a security control failure or vulnerability exploitation. To protect the Company from cybersecurity threats, we utilize a combination of internal resources and external consultants and providers. These consultants and providers provide services such as penetration testing, incident response, and third-party assessments. In addition, we use a combination of both proprietary and commercial solutions to proactively manage and mitigate threats to our IT environment and these processes have been integrated into the Company’s overall risk management system.
Our CISO oversees security, including the corporate IT environment, our public cloud presence, and security standards that are used as a framework for managing security across our Company. Our CISO is also responsible for security awareness, administering our corporate security training, and sponsoring our cybersecurity policy and standards. Our cybersecurity plan is reviewed annually, and our Audit Committee has delegated to the Executive Security Incident Response Team which is made up of our Chief Financial Officer, a Board member and senior management representatives in the legal, IT and finance functions, oversight of our cybersecurity program. The Executive Security Incident Response Team receives regular updates directly from our CISO and Vicor product security experts from various business and operational areas. We maintain various security certifications across the Company, and part of our compliance program includes processes to oversee and identify material risks from cybersecurity threats and include the use of third-party service providers to perform regular audits to ensure our security management program remains current.
Our objective for managing information security and cybersecurity risk is to avoid or minimize the impacts of both internal and external threat events and other efforts to penetrate or otherwise compromise the confidentiality, integrity, or availability of our systems. We work to achieve this objective by hardening networks and systems against attack, and by diligently managing visibility and monitoring controls within our data and communications environment to recognize events and respond appropriately.
To keep the Executive Security Incident Response Team apprised of the continually shifting landscape, the CISO typically provides quarterly updates to the Executive Security Incident Response Team on information security and cybersecurity matters. The Executive Security Incident Response Team maintains oversight of the efforts made to maximize information security and cybersecurity efforts. Potential concerns related to information security and cybersecurity will be escalated to the Board of Directors and Audit Committee, as appropriate.
Our cybersecurity infrastructure undergoes external audits. These efforts demonstrate our commitment to maintaining the highest level of cybersecurity protection. Our external third-party providers also evaluate and rank our cybersecurity maturity and coverage as part of their services. To stay informed about emerging threats, we regularly consult with external providers and other sources such as government publications and notices.
Cybersecurity threats, including as a result of any previous cybersecurity incidents, have not materially affected and are not reasonably likely to materially affect the Company, including its business strategy, results of operations or financial condition. Notwithstanding the extensive approach we take to cybersecurity, we may not be successful in preventing or mitigating a cybersecurity incident that could have a material adverse effect on us. While Vicor Corporation maintains
20
cybersecurity insurance, the costs related to cybersecurity threats or disruptions may not be fully insured. See Item 1A. “Risk Factors” for a discussion of cybersecurity risks.
ITEM 2. PROPERTIES
Our corporate headquarters building in Andover, Massachusetts, which we own, provides approximately 90,000 square feet of office space for our sales, marketing, engineering, and administrative personnel. We also own a building of approximately 230,000320,000 square feet (which includes the 90,000 square foot expansion described below) in Andover, Massachusetts, which houses all Massachusetts manufacturing activities.
Current capital investments are focused on the expansion of manufacturing capacity for the production of Advanced Products at our Andover facility. Based on our long-term forecast of production levels, we anticipate substantial additional capacity will be required to meet expected requirements beyond 2023. During 2020, we began construction of a that is intended to expand the Advanced Products production area by approximately 90,000 square feet. Construction is proceeding on schedule,Completion of the construction and we expectproduction had been delayed from 2021 to take2023. We took occupancy laterof this year. We also are proceeding withaddition during the evaluationfirst half of alternative projects for2022 and the additioncompletion of another, larger manufacturing facility to be focused on Advanced Products for automotive applications, should we anticipate the need based on our forecasts for capacity beyondinstallation of advanced plating operations was completed in 2023.
We own a single-story industrial building of approximately 31,000 square feet in Sunnyvale, California, which we leasehave leased on a long-term basis to a corporate tenant, which has occupied the building beginning insince June 2016.
All other domestic and foreign facilities are leased from third-party lessors on arms’ length terms. We believe our owned and leased facilities are adequate for our foreseeable needs.
ITEM 3. LEGAL PROCEEDINGS
See Note 17 —15 – Commitments and Contingencies, to the Consolidated Financial Statements for a complete description of the Company’s legal proceedings.
ITEM 4. MINE SAFETY DISCLOSURES
Not Applicable.
21
PART II
ITEM 5. MARKET FOR REGISTRANT’S COMMON EQUITY, RELATED STOCKHOLDERMATTERS AND ISSUER PURCHASES OF EQUITY SECURITIES
Our Common Stock is listed on The NASDAQ Stock Market LLC, under the trading symbol “VICR.” Shares of our Class B Common Stock are not registered with the Securities and Exchange Commission, are not listed on any exchange nor traded on any market, and are subject to transfer restrictions under our Restated Certificate of Incorporation, as amended.
As of February 16, 2021,2024, there were 11696 holders of record of our Common Stock and 1312 holders of record of our Class B Common Stock. These numbers do not reflect persons or entities that hold their shares in nominee or “street name” through various brokerage firms.
We have no formal policy regarding dividends and, as such, investors cannot make assumptions regarding the possibility of future dividend payments nor the amounts and timing thereof. As of December 31, 2023, we have no plans to declare or pay a cash dividend in the foreseeable future.
Issuer Purchases of Equity Securities
In November 2000, our Board of Directors authorized the repurchase of up to $30,000,000 of our Common Stock (the “November 2000 Plan”). The November 2000 Plan authorizes us to make such repurchases from time to time in the open market or through privately negotiated transactions. The timing and amounts of Common Stock repurchases are at the discretion of management based on its view of economic and financial market conditions.
of Shares Purchased | per Share | Shares November 2000 Plan | Dollar Value of Shares Authorized For Purchase Pursuant to November 2000 Plan | |||||||||||||
Month of |
| Total |
|
| Average Price |
|
| Total Number of |
|
| Remaining Dollar |
| ||||
October 1 - 31, 2023 |
|
| — |
|
| $ | — |
|
|
| — |
|
| $ | 8,541,000 |
|
November 1 - 30, 2023 |
|
| — |
|
| $ | — |
|
|
| — |
|
| $ | 8,541,000 |
|
December 1 - 31, 2023 |
|
| — |
|
| $ | — |
|
|
| — |
|
| $ | 8,541,000 |
|
Total |
|
| — |
|
| $ | — |
|
|
| — |
|
| $ | 8,541,000 |
|
Stockholder Return Performance Graph
The graph set forth below presents the cumulative, five-year stockholder return for each of (i) the Company’s Common Stock, (ii) the Standard & Poor’s 500 Index (“S&P 500 Index”), a value-weighted index made up of 500 of the largest, by market capitalization, listed companies, and(iii) the Standard & Poor’s SmallCap 600 Index (“S&P SmallCap 600 Index”), a value-weighted index of 600 listed companies with market capitalizations between $200,000,000$750,000,000 and $1,000,000,000.
The graph assumes an investment of $100 on December 31, 2015,2018, in each of our Common Stock, the S&P 500 Index, and the S&P SmallCap 600 Index, and the S&P MidCap 400 Index, and assumes reinvestment of all dividends. The historical information set forth below is not necessarily indicative of future performance.
22
Comparison of Five Year Cumulative Return
Among Vicor Corporation, S&P 500 Index,
S&P SmallCap 600 Index,
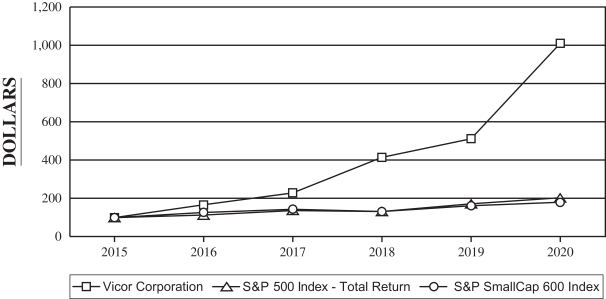
2015 | 2016 | 2017 | 2018 | 2019 | 2020 | |||||||||||||||||
Vicor Corporation | $100.00 | $ | 165.57 | $ | 229.17 | $ | 414.36 | $ | 512.28 | $ | 1,011.18 | |||||||||||
S&P 500 Index | $100.00 | $ | 111.96 | $ | 136.40 | $ | 130.42 | $ | 171.49 | $ | 203.04 | |||||||||||
S&P SmallCap 600 Index | $100.00 | $ | 126.56 | $ | 143.30 | $ | 131.15 | $ | 161.03 | $ | 179.20 | |||||||||||

|
| 2018 |
|
| 2019 |
|
| 2020 |
|
| 2021 |
|
| 2022 |
|
| 2023 |
| ||||||
Vicor Corporation |
| $ | 100.00 |
|
| $ | 123.63 |
|
| $ | 244.03 |
|
| $ | 336.01 |
|
| $ | 142.22 |
|
| $ | 118.89 |
|
S&P 500 Index |
| $ | 100.00 |
|
| $ | 131.49 |
|
| $ | 155.68 |
|
| $ | 200.37 |
|
| $ | 164.08 |
|
| $ | 207.21 |
|
S&P SmallCap 600 Index |
| $ | 100.00 |
|
| $ | 122.78 |
|
| $ | 136.64 |
|
| $ | 173.29 |
|
| $ | 145.39 |
|
| $ | 168.73 |
|
S&P MidCap 400 Index |
| $ | 100.00 |
|
| $ | 126.20 |
|
| $ | 143.44 |
|
| $ | 178.95 |
|
| $ | 155.58 |
|
| $ | 181.15 |
|
Our equity plan information required by this item is incorporated by reference to the information in Part III, Item 12 of this Annual Report on Form 10-K.
ITEM 6. [RESERVED]
23
Year Ended December 31, | ||||||||||||||||||||
Statement of Operations Data | 2020 | 2019 | 2018 | 2017 | 2016 | |||||||||||||||
(In thousands, except per share data) | ||||||||||||||||||||
Net revenues | $ | 296,576 | $ | 262,977 | $ | 291,220 | $ | 227,830 | $ | 200,280 | ||||||||||
Income (loss) from operations | 17,368 | 13,821 | 32,059 | (1,360 | ) | (6,314 | ) | |||||||||||||
Consolidated net income (loss) | 17,922 | 14,109 | 31,846 | 258 | (6,261 | ) | ||||||||||||||
Net income (loss) attributable to noncontrolling interest | 12 | 11 | 121 | 91 | (14 | ) | ||||||||||||||
Net income (loss) attributable to Vicor Corporation | 17,910 | 14,098 | 31,725 | 167 | (6,247 | ) | ||||||||||||||
Net income (loss) per share — basic attributable to Vicor Corporation | 0.42 | 0.35 | 0.80 | 0.00 | (0.16 | ) | ||||||||||||||
Net income (loss) per share — diluted attributable to Vicor Corporation | 0.41 | 0.34 | 0.78 | 0.00 | (0.16 | ) | ||||||||||||||
Weighted average shares — basic | 42,186 | 40,330 | 39,872 | 39,228 | 38,842 | |||||||||||||||
Weighted average shares — diluted | 43,869 | 41,677 | 40,729 | 39,933 | 38,842 | |||||||||||||||
As of December 31, | ||||||||||||||||||||
Balance Sheet Data | 2020 | 2019 | 2018 | 2017 | 2016 | |||||||||||||||
(In thousands) | ||||||||||||||||||||
Working capital | $ | 276,419 | $ | 149,136 | $ | 129,062 | $ | 90,796 | $ | 89,545 | ||||||||||
Total assets | 396,239 | 240,727 | 221,068 | 165,724 | 154,067 | |||||||||||||||
Total liabilities | 45,084 | 34,857 | 36,978 | 29,305 | 23,050 | |||||||||||||||
Total equity | 351,155 | 205,870 | 184,090 | 136,419 | 131,017 | |||||||||||||||
ITEM 7. MANAGEMENT’S DISCUSSION AND ANALYSIS OF FINANCIAL CONDITION ANDRESULTS OF OPERATIONS
Overview
A discussion regarding our results of operations for the year ended December 31, 2019,2022, compared to the year ended December 31, 2018,2021, was included in the Company’s Annual Report on Form2019,2022, on pages36-382020.
We design, develop, manufacture, and market modular power components and power systems for converting electrical power for use in electrically-powered devices. Our competitive position is supported by innovations in product design and achievements in product performance, largely enabled by our focus on the research and development of advanced technologies and processes, often implemented in proprietary semiconductor circuitry, materials, and packaging. Many of our products incorporate patented or proprietary implementations of high-frequency switching topologies enabling power system solutions that are more efficient and much smaller than conventional alternatives. Our strategy emphasizes demonstrable product differentiation and a value proposition based on competitively superior solution performance, advantageous design flexibility, and a compelling total cost of ownership. While we offer a wide range of alternating current (“AC”) and direct
Based on design, performance, and form factor considerations, as well as the range of evolving applications for which our products are appropriate, we categorize our product portfolios as either “Advanced Products” or “Brick Products.” The Advanced Products category consists of our more recently introduced products, which are largely used to implement our proprietary Factorized Power Architecture™
The Brick Products category largely consists of our broad and well-established families of integrated power converters, incorporating multiple conversion stages, used in conventional power systems architectures. Given the growth profiles of the markets we serve with our Advanced Products line and our Brick Products line, our strategy involves a transition in organizational focus, emphasizing investment in our Advanced Products line and targeting high growth market segments with a
The applications in which our Advanced Products and Brick Products are used are typically in the higher-performance, higher-power segments of the market segments we serve. With our Advanced Products, we generally serve large Original Equipment Manufacturers (“OEMs”), Original Design Manufacturers (“ODMs”), and their contract manufacturers, with sales currently concentrated in the data center and hyperscaler segments of enterprise computing, in which our products are used for voltage distributionpower delivery on server motherboards, in server racks, and across datacenter infrastructure. We have established a leadership position in the emerging market segment for powering high-performance processors used for acceleration of applications associated with artificial intelligence (“AI”). Our customers in the AI market segment include the leading innovators in processor and accelerator design, as well as early adopters in cloud computing and high performance computing. We also targetserve applications in aerospace and aviation, defense electronics, industrialsatellites, factory automation, instrumentation, test equipment, solid state lighting,transportation, telecommunications and networking infrastructure, and vehicles (notably in the autonomous driving, electric vehicle, and hybrid vehicle niches of the vehicle segment). With our Brick Products, we generally serve a fragmented base of large and small customers, concentrated in aerospace and defense electronics, industrial automation, industrial equipment, instrumentation and test equipment, and transportation (notably in rail and heavy equipment applications). With our strategic emphasis on larger, high-volume customers, we expect to experience over time a greater concentration of sales among relatively fewer customers.
Our quarterly consolidated operating results can be difficult to forecast and have been subject to significant fluctuations. We plan our production and inventory levels based on management’s estimates of customer demand, customer forecasts, and other information sources. Customer forecasts, particularly those of OEM, ODM, and contract manufacturing customers to which we supply Advanced Products in high volumes, are subject to scheduling changes on short notice, contributing to operating inefficiencies and excess costs. In addition, external factors such as supply chain uncertainties, which are often associated with the cyclicality of the electronics industry, regional macroeconomic and trade-related circumstances, and
24
process steps that are essential in the production of some of our Advanced Products, and those relating, for example, to the procurement of raw material, have in the past negatively impacted and may in the future negatively impact our operating results. We have taken steps to mitigate the impact of supply chain disruptions by, among other things and in varying degrees, moving outsourced manufacturing steps in-house to the Company, ordering supplies with extended lead times, paying higher prices for certain supplies or outsourced production, and expediting deliveries at a cost premium. The resulting impact of the steps taken to mitigate supply chain disruptions have, to varying degrees and at different times, reduced our revenue, gross margin, operating profit and cash flow and may continue to do so in the future. While we continue to make progress in moving outsourced manufacturing steps in-house to the Company, we are still experiencing long lead times on certain raw material components, and uncertainty of output from our outsourced manufacturing supplier. Our quarterly gross margin as a percentage of net revenues may vary, depending on production volumes, average selling prices, average unit costs, the mix of products sold during that quarter, and the level of importation of raw materials subject to tariffs. Our quarterly operating margin as a percentage of net revenues also may vary with changes in revenue and product level profitability, but our operating costs are largely associated with compensation and related employee costs, which are not subject to sudden or significant changes.
2023 Financial Highlights
The following table sets forth certain items of selected consolidated financial information as a percentage of net revenues for the years shown, ended December 31.31, 2023, 2022, and 2021. This table and the subsequent discussion should be read in conjunction with the selected financial data and the Consolidated Financial Statements and related footnotesnotes contained elsewhere in this report.
Year Ended December 31, | ||||||||||||
2020 | 2019 | 2018 | ||||||||||
Net revenues | 100.0 | % | 100.0 | % | 100.0 | % | ||||||
Gross margin | 44.3 | % | 46.8 | % | 47.7 | % | ||||||
Selling, general and administrative expenses | 21.3 | % | 23.8 | % | 21.4 | % | ||||||
Research and development expenses | 17.2 | % | 17.7 | % | 15.2 | % | ||||||
Income before income taxes | 6.2 | % | 5.7 | % | 11.3 | % | ||||||
|
| Year Ended December 31, |
| |||||||||
|
| 2023 |
|
| 2022 |
|
| 2021 |
| |||
Net revenues |
|
| 100.0 | % |
|
| 100.0 | % |
|
| 100.0 | % |
Gross margin |
|
| 50.6 | % |
|
| 45.2 | % |
|
| 49.6 | % |
Selling, general and administrative expenses |
|
| 21.2 | % |
|
| 21.6 | % |
|
| 19.3 | % |
Research and development expenses |
|
| 16.8 | % |
|
| 15.2 | % |
|
| 14.8 | % |
Income before income taxes |
|
| 14.9 | % |
|
| 7.2 | % |
|
| 15.8 | % |
Critical Accounting Policies and Estimates
Management’s Discussion and Analysis of Financial Condition and Results of Operations is based upon our Consolidated Financial Statements, which have been prepared in accordance with accounting principles generally accepted in
25
the United States (“U.S. GAAP”). The preparation of these financial statements requires management to make estimates and assumptions that affect the reported amounts of assets, liabilities, revenues, expenses, and related disclosures of contingent assets and liabilities. On an ongoing basis, we evaluate our estimates and assumptions, and our associated judgments, including those related to inventories, income taxes, contingencies, and litigation. We base our estimates, assumptions, and judgments on historical experience, knowledge of current conditions, and on various other factors we believe to be reasonable under the circumstances, the results of which form the basis for making judgments about the carrying value of assets and liabilities that are not readily apparent from other sources. Actual results may differ from these estimates under different assumptions or conditions. We also have other policies we consider key accounting policies (See Note 2 to the Consolidated Financial Statements —— Recently Adopted Accounting Standards
Inventories
We employ a variety of methodologies to evaluate inventory that is estimated to be excess, obsolete or unmarketable, in order to write down that inventory to net realizable value. Our estimation process for assessing
Evaluation of the Realizability of Deferred Tax Assets
Significant management judgment is required in determining whether deferred tax assets will be realized in full or in part. We assess the need for a valuation allowance on a quarterly basis. We record a valuation allowance to reduce our deferred tax assets to the amount we believe is more likely than not to be realized. In assessing the need for a valuation allowance, we consider all positive and negative evidence, including scheduled reversals of deferred tax liabilities, projected future taxable income, tax planning strategies, and past financial performance. WhileDespite recent positive operating results, as a result of increases in bookings, caused the Company to be in a cumulative income position as of December 31, 2020, the Company faces uncertainties in forecasting its operating results due to the continued impact of theCOVID-19pandemic on the Company’svendor supply chain,and factory capacity constraints, certain process issues with the production of Advanced Products and the unpredictability in certain markets.markets, product transitions, new program introductions and adoption times of new technology offerings. This operating uncertainty also makes it difficult to predict the availability and utilization of tax benefits over the next several years. As a result, management has concluded, at this time,as of December 31, 2023, it is more likely than not the Company’s net domestic deferred tax assets will not be realized, and a full valuation allowance against all net domestic deferred tax assets is still warranted as of December 31, 2020.2023. The valuation allowance against these deferred tax assets may require adjustment in the future based on changes in the mix of temporary differences, changes in tax laws, and operating performance. If the positive quarterly earnings and increases in bookingsoperating results continue, and the Company’s concerns about industry uncertainty and world events, including the impact of theCOVID-19pandemic on the Company’s supply chain,and factory capacity constraints, program adoption and process issues with the production of Advanced Products are resolved, and the amount of tax benefits the Company is able to utilize to the point that the Company believes future taxable income can be more reliably forecasted, the Company may release all or a portion of the valuation allowance in the near-term. Certain state tax credits, though, will likely never be released by the valuation allowance. If and when the Company determines the valuation allowance should be released (i.e., reduced), the adjustment would result in a tax benefit reported in that period’s Consolidated Statements of Operations, the effect of which would be an increase in reported net income.
The amount of any such tax benefit associated with release of our valuation allowance in a particular quarter may be material.
New Accounting Pronouncements
From time to time, new accounting pronouncements are issued by the Financial Accounting Standards Board (“FASB”) that we adopt as of the specified effective date. Unless otherwise discussed, we believe the impact of recently issued accounting standards will not have a material impact on our future financial condition and results of operations. See Note 2 ——
26
Other new pronouncements issued but not effective until after December 31, 20202023 are not expected to have a material impact on our consolidated financial statements.
Year ended December 31, 20202023 compared to Year ended December 31, 2019
Consolidated net revenues for 20202023 were $296,576,000,$405,059,000, an increase of $33,599,000,$5,980,000, or 12.8%1.5%, as compared to $262,977,000$399,079,000 for 2019.
Net revenues, by product line, for the years ended December 31 were as follows (dollars in thousands):
Increase | ||||||||||||||||
2020 | 2019 | $ | % | |||||||||||||
Brick Products | $ | 190,256 | $ | 187,896 | $ | 2,360 | 1.3 | % | ||||||||
Advanced Products | 106,320 | 75,081 | 31,239 | 41.6 | % | |||||||||||
Total | $ | 296,576 | $ | 262,977 | $ | 33,599 | 12.8 | % | ||||||||
|
|
|
|
|
|
|
| Increase (decrease) |
| |||||||
|
| 2023 |
|
| 2022 |
|
| $ |
|
| % |
| ||||
Advanced Products |
| $ | 223,893 |
|
| $ | 243,321 |
|
| $ | (19,428 | ) |
|
| (8.0 | )% |
Brick Products |
|
| 181,166 |
|
|
| 155,758 |
|
|
| 25,408 |
|
|
| 16.3 | % |
Total |
| $ | 405,059 |
|
| $ | 399,079 |
|
| $ | 5,980 |
|
|
| 1.5 | % |
The decrease in net revenues for Advanced Products was primarily due to manufacturing constraints, customer demand and schedule delays. The increase in net revenues for Brick Products was primarily due to an overall 28.6% increase in bookingsfavorable market conditions and pricing, and available capacity for the year ended December 31, 2020, compared to the year ended December 31, 2019, principally due to an increase of 80.9% in new orders for Advancedmanufacturing Brick Products.
Gross margin for 20202023 increased $8,481,000,$24,370,000, or 6.9%13.5%, to $131,447,000$204,929,000 from $122,966,000$180,559,000 in 2019.2022. Gross margin as a percentage of net revenues decreasedincreased to 44.3%50.6% in 20202023 from 46.8%45.2% in 2019. Despite higher net revenues2022. The increase in gross margin dollars and gross margin dollarspercentage was primarily due to higher sales volume, improved sales mix, and certain reductions in supply chain costs, including a reduction of $9,950,000 in outsourced manufacturing costs partially offset by incremental costs of bringing production in-house for certain Advanced Products, and a reduction of freight-in and tariff spending of $12,747,000 (net of approximately $6,954,000 in duty drawback recovery of previously paid tariffs in the yeartwelve months ended December 31, 2020, gross margin as a percentage of net revenues decreased as compared to2023 and $229,000 in duty drawback recovery in the yeartwelve months ended December 31, 2019, primarily due to an unfavorable change in product mix (i.e., a higher percentage of lower margin products were produced and shipped during the year ended December 31, 2020), a negative influence from production inefficiencies and cost variances associated with initial production volumes of new products, certain supply chain constraints associated with theCOVID-19pandemic, and higher tariff charges.
Selling, general, and administrative expenses were $63,163,000$85,714,000 for 2020, an increase2023, a decrease of $606,000,$550,000, or 1.0%0.6%, as compared to $62,557,000$86,264,000 for 2019.2022. As a percentage of net revenues, selling, general, and administrative expenses decreased to 21.3%21.2% in 20202023 from 23.8%21.6% in 2019, primarily due to the increase in net revenues.
The components of the $606,000 increase$550,000 decrease in selling, general, and administrative expenses were as follows (dollars in thousands):
|
| Increase (decrease) |
| ||||||||
Legal fees |
| $ | (6,000 | ) |
|
| (41.9 | )% |
| (1 | ) |
Travel expense |
|
| 303 |
|
|
| 13.8 | % |
| (2 | ) |
Depreciation and amortization |
|
| 348 |
|
|
| 8.1 | % |
| (3 | ) |
Advertising expenses |
|
| 605 |
|
|
| 14.0 | % |
| (4 | ) |
Commissions |
|
| 792 |
|
|
| 27.4 | % |
| (5 | ) |
Outside services |
|
| 1,253 |
|
|
| 46.5 | % |
| (6 | ) |
Compensation |
|
| 1,592 |
|
|
| 3.4 | % |
| (7 | ) |
Other, net |
|
| 557 |
|
|
| 7.0 | % |
|
| |
|
| $ | (550 | ) |
|
| (0.6 | )% |
|
| |
Increase (decrease) | ||||||||
Compensation | $ | 3,153 | 8.2 | %(1) | ||||
Depreciation and amortization | 318 | 11.3 | %(2) | |||||
Legal fees | 231 | 14.5 | %(3) | |||||
Facilities allocations | (137 | ) | (8.3 | )% | ||||
Outside services | (191 | ) | (8.7 | )%(4) | ||||
Advertising expenses | (281 | ) | (8.5 | )%(5) | ||||
Commissions | (326 | ) | (9.1 | )%(6) | ||||
Travel expense | (1,973 | ) | (63.3 | )%(7) | ||||
Other, net | (188 | ) | (3.2 | )% | ||||
| $ | 606 | 1.0 | % | |||||
27
(5) Increase primarily attributable to an increase in net revenues subject to commissions. |
Research and development expenses increased $4,328,000,$7,263,000, or 9.3%12.0%, to $50,916,000$67,857,000 in 20202023 from $46,588,000$60,594,000 in 2019.2022. As a percentage of net revenues, research and development expenses decreasedincreased to 17.2%16.8% in 20202023 from 17.7%15.2% in 2019, primarily due to the increase in net revenues.
The components of the $4,328,000$7,263,000 increase in research and development expenses were as follows (dollars in thousands):
|
| Increase (decrease) |
| ||||||||
Project and pre-production materials |
| $ | 3,632 |
|
|
| 42.3 | % |
| (1 | ) |
Compensation |
|
| 2,685 |
|
|
| 6.6 | % |
| (2 | ) |
Depreciation and amortization |
|
| 352 |
|
|
| 14.5 | % |
| (3 | ) |
Computer and software expense |
|
| 331 |
|
|
| 31.1 | % |
| (4 | ) |
Outside services |
|
| 291 |
|
|
| 42.0 | % |
| (5 | ) |
Deferred costs |
|
| (231 | ) |
|
| (63.2 | )% |
| (6 | ) |
Other, net |
|
| 203 |
|
|
| 2.8 | % |
|
| |
|
| $ | 7,263 |
|
|
| 12.0 | % |
|
| |
Increase (decrease) | ||||||||
Compensation | $ | 2,613 | 7.9 | %(1) | ||||
Deferred costs | 1,004 | 57.6 | %(2) | |||||
Project and pre-production materials | 789 | 11.3 | %(3) | |||||
Computer expense | 170 | 33.3 | % | |||||
Depreciation and amortization | 164 | 9.1 | % | |||||
Overhead absorption | (296 | ) | (33.1 | )%(4) | ||||
Other, net | (116 | ) | (1.7 | )% | ||||
| $4,328 | 9.3% | |||||||
(5) Increase primarily attributable to an increase in the use of consultants. |
Litigation-contingency expense was $6,500,000 for 2022, which related to the SynQor litigation, as compared to $0 for 2023. See Note 15 to the Consolidated Financial Statements for additional information.
The significant changes in the components of “Other"Other income (expense), net”net" for the years ended December 31 were as follows (in thousands):
|
|
|
|
|
|
|
| Increase |
| |||
|
| 2023 |
|
| 2022 |
|
| (decrease) |
| |||
Interest income, net |
| $ | 8,217 |
|
| $ | 1,313 |
|
| $ | 6,904 |
|
Rental income, net |
|
| 792 |
|
|
| 792 |
|
|
| — |
|
Foreign currency losses, net |
|
| (161 | ) |
|
| (653 | ) |
|
| 492 |
|
Other, net |
|
| 38 |
|
|
| 34 |
|
|
| 4 |
|
|
| $ | 8,886 |
|
| $ | 1,486 |
|
| $ | 7,400 |
|
2020 | 2019 | Increase (decrease) | ||||||||||
Rental income | $ | 792 | $ | 792 | $ | — | ||||||
Foreign currency gains (losses), net | 181 | (108 | ) | 289 | ||||||||
Interest income | 95 | 300 | (205 | ) | ||||||||
Gain on disposal of equipment | 13 | 38 | (25 | ) | ||||||||
Credit gains on available-for-sale | 4 | 4 | — | |||||||||
Other | 8 | 40 | (32 | ) | ||||||||
| $ | 1,093 | $ | 1,066 | $ | 27 | |||||||
28
Our exposure to market risk fluctuations in foreign currency exchange rates relates to the operations of VJCL,Vicor Japan Company, Ltd. ("VJCL"), for which the functional currency is the Japanese Yen, and all other subsidiaries in Europe and Asia, for which the functional currency is the U.S. Dollar. These other subsidiaries in Europe and Asia experienced more favorable foreign currency exchange rate fluctuations in 20202023 compared to 2019. Interest2022. In 2023, interest income, decreasednet increased due to a decrease inhigher interest rates.
Income before income taxes was $18,461,000$60,244,000 in 2020,2023, as compared to $14,887,000$28,687,000 in 2019.
The provision for income taxes and the effective income tax rate for the years ended December 31 were as follows (dollars in thousands):
2020 | 2019 | |||||||
Provision for income taxes | $ | 539 | $ | 778 | ||||
Effective income tax rate | 2.9 | % | 5.2 | % | ||||
|
| 2023 |
|
| 2022 |
| ||
Provision for income taxes |
| $ | 6,644 |
|
| $ | 3,261 |
|
Effective income tax rate |
|
| 11.0 | % |
|
| 11.4 | % |
The effective tax rates were lower than the statutory tax rates for the year ended December 31, 20202023 and 20192022 primarily due to the Company’s full valuation allowance position against domestic deferred tax assets.assets during both years. The provision for income taxes for the years ended December 31, 20202023 and 20192022 included estimated federal, state and foreign income taxes and estimated state taxes in jurisdictions in which the Company does not have sufficient net operating loss carryforwards.
See Note 1614 to the Consolidated Financial Statements for disclosure regarding our current assessment of the valuation allowance against all domestic deferred tax assets, and the possible release (i.e., reduction) of the allowance in the future.
We reported net income for the year ended December 31, 20202023 of $17,910,000,$53,595,000, or $0.41$1.19 per diluted share, as compared to $14,098,000,$25,446,000, or $0.34$0.57 per diluted share, for the year ended December 31, 2019.
Liquidity and Capital Resources
At December 31, 2020,2023, we had $161,742,000$242,219,000 in cash and cash equivalents and $50,166,000 of highly liquid short-term investments.equivalents. The ratio of current assets to current liabilities was 7.8:9.5:1 at December 31, 2020,2023, as compared to 6.0:5.6:1 at December 31, 2019.2022. Net working capital increased $127,283,000$78,142,000 to $276,419,000$376,197,000 at December 31, 20202023 from $149,136,000$298,055,000 at December 31, 2019.
The primary working capital changes were due to the following (in thousands):
Increase (decrease) | ||||
Cash and cash equivalents | $ | 77,074 | ||
Short-term investments | 50,166 | |||
Accounts receivable | 2,884 | |||
Inventories | 8,082 | |||
Other current assets | (340 | ) | ||
Accounts payable | (5,116 | ) | ||
Accrued compensation and benefits | (3,684 | ) | ||
Accrued expenses | 66 | |||
Sales allowances | 144 | |||
Short-term lease liabilities | (109 | ) | ||
Income taxes payable | (82 | ) | ||
Short-term deferred revenue and customer prepayments | (1,802 | ) | ||
| $ | 127,283 | |||
|
| Increase |
| |
Cash and cash equivalents |
| $ | 51,608 |
|
Accounts receivable |
|
| (12,798 | ) |
Inventories |
|
| 5,169 |
|
Other current assets |
|
| 13,783 |
|
Accounts payable |
|
| 10,107 |
|
Accrued compensation and benefits |
|
| (369 | ) |
Accrued expenses |
|
| 3,511 |
|
Sales allowances |
|
| (1,821 | ) |
Short-term lease liabilities |
|
| (414 | ) |
Income taxes payable |
|
| (674 | ) |
Short-term deferred revenue and customer prepayments |
|
| 10,040 |
|
|
| $ | 78,142 |
|
The primary sources of cash for the year ended December 31, 2020 were: (i) approximately $109,681,000 of cash received in the form of net proceeds from the completion of the public offering of our Common Stock in June 2020, (ii) $34,547,0002023 were $74,528,000 of cash generated through operating activities,from operations and (iii) $11,585,000$10,602,000 of cash received in connection with the exercise of options to purchase our Common Stock awarded under our stock option plans and the issuance of Common Stock under our 2017 Employee Stock Purchase Plan. The primary usesuse of cash during the year ended December 31, 2020 were $50,166,0002023 was $33,452,000 for the purchase of short-term investmentsmachinery and $28,653,000 for the purchaseequipment and internal-use software.
29
In November 2000, our Board of Directors authorized the repurchase of up to $30,000,000 of Common Stock (the “November 2000 Plan”). The November 2000 Plan authorizes us to make such repurchases from time to time in the open market or through privately negotiated transactions. The timing of such repurchases and the number of shares purchased in each transaction are at the discretion of management based on its view of economic and financial market conditions. We did not repurchase shares of Common Stock under the November 2000 Plan during the year ended December 31, 2020.2023. As of December 31, 2020,2023, we had approximately $8,541,000 remaining for share purchasesrepurchases under the November 2000 Plan.
As of December 31, 2020,2023, we had nooff-balancesheet arrangements.
Payments Due by Period | ||||||||||||||||||||
Contractual Obligations | Total | Less than 1 Year | Years 2 & 3 | Years 4 & 5 | More Than 5 Years | |||||||||||||||
Operating lease obligations (1) | $ | 4,919 | $ | 1,740 | $ | 2,199 | $ | 980 | $ | — | ||||||||||
We do not consider the impact of inflation and changing prices on our business activities or fluctuations in the exchange rates for foreign currency transactions to have been significant during the last three fiscal years.
Item 7A.
We are exposed to a variety of market risks, including changes in interest rates affecting the return on our cash and cash equivalents, short-term investments and fluctuations in foreign currency exchange rates. As our cash and cash equivalents and short-term investments consist principally of cash accounts, money market securities and U.S. Treasury securities, which are short-term in nature, we believe our exposure to market risk on interest rate fluctuations for these investments is not significant. As of December 31, 2020,2023, our long-term investment portfolio, recorded on our Consolidated Balance Sheet as “Long-term investment, net”, consisted of a single auction rate security with a par value of $3,000,000, purchased through and held in custody by a broker-dealer affiliate of Bank of America, N.A., that has experienced failed auctions (the “Failed Auction Security”) since February 2008. While the Failed Auction Security is Aaa/AA+ rated by major credit rating agencies,
We estimate our annual interest income would change by approximately $30,000 in 20202023 for each 100 basis point increase or decrease in interest rates.
Our exposure to market risk for fluctuations in foreign currency exchange rates relates primarily to the operations of VJCL, for which the functional currency is the Japanese Yen, and changes in the relative value of the Yen to the U.S. Dollar. Relative to our Yen exposure as of December 31, 2020,2023, we estimate a 10% unfavorable movement in the value of the Yen relative to the U.S. Dollar would increase our foreign currency loss by approximately $96,000.$48,000. The functional currency of all other subsidiaries in Europe and other subsidiaries in Asia is the U.S. Dollar. While we believe risk to fluctuations in foreign currency rates for these subsidiaries is generally not significant, they can be subject to substantial currency changes, and therefore foreign exchange exposures.
30
ITEM 8. FINANCIAL STATEMENTS AND SUPPLEMENTARY DATA
INDEX
Page | ||||
FINANCIAL STATEMENTS | ||||
32 | ||||
34 | ||||
35 | ||||
36 | ||||
37 | ||||
38 | ||||
39 | ||||
63 | ||||
31
Report of Independent Registered Public Accounting Firm
To the Stockholders and Board of Directors
Vicor Corporation:
Opinion on the Consolidated Financial Statements
We have audited the accompanying consolidated balance sheets of Vicor Corporation and subsidiaries (the Company) as of December 31, 20202023 and 2019,2022, the related consolidated statements of operations, comprehensive income, equity, and cash flows and equity for each of the years in the three-year period ended December 31, 2020,2023, and the related notes and financial statement schedule listed in Item 15(a)(2) (collectively, the consolidated financial statements). In our opinion, the consolidated financial statements present fairly, in all material respects, the financial position of the Company as of December 31, 20202023 and 2019,2022, and the results of its operations and its cash flows for each of the years in the three-year period ended December 31, 2020,2023, in conformity with U.S. generally accepted accounting principles.
We also have audited, in accordance with the standards of the Public Company Accounting Oversight Board (United States) (PCAOB), the Company’s internal control over financial reporting as of December 31, 2020,2023, based on criteria established inMarch 1, 2021February 28, 2024 expressed an unqualified opinion on the effectiveness of the Company’s internal control over financial reporting.
Basis for Opinion
These consolidated financial statements are the responsibility of the Company’s management. Our responsibility is to express an opinion on these consolidated financial statements based on our audits. We are a public accounting firm registered with the PCAOB and are required to be independent with respect to the Company in accordance with the U.S. federal securities laws and the applicable rules and regulations of the Securities and Exchange Commission and the PCAOB.
We conducted our audits in accordance with the standards of the PCAOB. Those standards require that we plan and perform the audit to obtain reasonable assurance about whether the consolidated financial statements are free of material misstatement, whether due to error or fraud. Our audits included performing procedures to assess the risks of material misstatement of the consolidated financial statements, whether due to error or fraud, and performing procedures that respond to those risks. Such procedures included examining, on a test basis, evidence regarding the amounts and disclosures in the consolidated financial statements. Our audits also included evaluating the accounting principles used and significant estimates made by management, as well as evaluating the overall presentation of the consolidated financial statements. We believe that our audits provide a reasonable basis for our opinion.
Critical Audit Matters
The critical audit matters communicated below are matters arising from the current period audit of the consolidated financial statements that were communicated or required to be communicated to the audit committee and that: (1) relate to accounts or disclosures that are material to the consolidated financial statements and (2) involved our especially challenging, subjective, or complex judgments. The communication of critical audit matters does not alter in any way our opinion on the consolidated financial statements, taken as a whole, and we are not, by communicating the critical audit matters below, providing separate opinions on the critical audit matters or on the accounts or disclosures to which they relate.
Realizability of raw materials inventory
As discussed in Note 2 to the consolidated financial statements, the Company values inventories at the lower of cost, determined usingforecastedexpected future usage,utility, which was derived based on
We identified the evaluation of the realizability of certain raw materials inventory to be a critical audit matter. Subjective auditor judgmentjudgement was required as a result of uncertainty in market conditions used to estimate forecasted future usage and
32
the long lead times to acquire raw materials within the global electronics supply chain. Changes in forecasted future usage could have a significant impact on the realizability of raw materials inventory.
The following are the primary procedures we performed to address this critical audit matter. We evaluated the design and tested the operating effectiveness of certain internal controls related to the critical audit matter. This included controls related to the Company’s process to develop its forecast of usage, including estimates of the projected demand based on historical usage and the potential impact of market conditions. We evaluated the Company’s estimate of the realizability of raw materials by:
Realizability of domestic deferred tax assets
As discussed in Note 1614 to the consolidated financial statements, the Company had a valuation allowance of $37.9$52.3 million against all domestic deferred tax assets, net of deferred tax liabilities, for which realization cannot be considered more likely than not. In assessing the need for a valuation allowance, the Company considers all positive and negative evidence, including scheduled reversals of deferred tax liabilities, projected future taxable income, tax planning strategies, and past financial performance.
We identified the evaluation of the realizability of the domestic deferred tax assets as a critical audit matter due to the subjectivity involved in assessing the recoverability of those deferred tax assets. Subjective auditor judgmentjudgement was required to evaluate the uncertainty inherent in estimating the Company’s ability to generate sufficient domestic taxable income exclusive of reversing temporary differences of the appropriate character in the future.
The following are the primary procedures we performed to address this critical audit matter. We evaluated the design and tested the operating effectiveness of certain internal controls related to the Company’s income tax process, including a control related to the assessment of the realizability of deferred tax assets and the application of relevant tax regulations. To assess the Company’s ability to forecast its financial performance used to determine future domestic taxable income, we compared the Company’s previous forecasts to actual results, and evaluated the Company’s consideration of the customer orders as well as the impact of industry and global economic conditions through inquiry with operational personnel and inspection of third-party publications. We involved federal and state income tax professionals with specialized skills and knowledge, who assisted in assessing the Company’s application of the relevant tax regulations and evaluating the realizability of deferred tax assets
/s/ KPMG LLP
We have served as the Company’s auditor since 2013.
Boston, Massachusetts
February 28, 2024
33
VICOR CORPORATION
Consolidated Balance Sheets
December 31, 20202023 and 2019
(In thousands, except per share data)
2020 | 2019 | |||||||
ASSETS | ||||||||
Current assets: | ||||||||
Cash and cash equivalents | $ | 161,742 | $ | 84,668 | ||||
Short-term investments | 50,166 | — | ||||||
Accounts receivable, less allowance of $82 in 2020 and $59 in 2019 | 40,999 | 38,115 | ||||||
Inventories, net | 57,269 | 49,187 | ||||||
Other current assets | 6,756 | 7,096 | ||||||
Total current assets | 316,932 | 179,066 | ||||||
Long-term deferred tax assets | 226 | 205 | ||||||
Long-term investment, net | 2,517 | 2,510 | ||||||
Property, plant and equipment, net | 74,843 | 56,952 | ||||||
Other assets | 1,721 | 1,994 | ||||||
Total assets | $ | 396,239 | $ | 240,727 | ||||
LIABILITIES AND EQUITY | ||||||||
Current liabilities: | ||||||||
Accounts payable | $ | 14,121 | $ | 9,005 | ||||
Accrued compensation and benefits | 14,094 | 10,410 | ||||||
Accrued expenses | 2,624 | 2,690 | ||||||
Sales allowances | 597 | 741 | ||||||
Short-term lease liabilities | 1,629 | 1,520 | ||||||
Income taxes payable | 139 | 57 | ||||||
Short-term deferred revenue and customer prepayments | 7,309 | 5,507 | ||||||
Total current liabilities | 40,513 | 29,930 | ||||||
Long-term deferred revenue | 733 | 1,054 | ||||||
Contingent consideration obligations | 227 | 451 | ||||||
Long-term income taxes payable | 643 | 567 | ||||||
Long-term lease liabilities | 2,968 | 2,855 | ||||||
Total liabilities | 45,084 | 34,857 | ||||||
Commitments and contingencies (Note 17) | 0 | 0 | ||||||
Equity: | ||||||||
Vicor Corporation stockholders’ equity: | ||||||||
Class B Common Stock: 10 votes per share, $.01 par value, 14,000,000 shares authorized, 11,758,218 shares issued and outstanding in 2020 and 2019 | 118 | 118 | ||||||
Common Stock: 1vote per share, $.01 par value, 62,000,000 shares authorized 43,204,671 shares issued and 31,569,865 shares outstanding in 2020; 40,403,058 shares issued and 28,768,252 shares outstanding in 2019 | 433 | 405 | ||||||
Additional paid-in capital | 328,392 | 201,251 | ||||||
Retained earnings | 161,008 | 143,098 | ||||||
Accumulated other comprehensive loss | (204 | ) | (383 | ) | ||||
Treasury stock at cost: 11,634,806 shares in 2020 and 2019 | (138,927 | ) | (138,927 | ) | ||||
Total Vicor Corporation stockholders’ equity | 350,820 | 205,562 | ||||||
Noncontrolling interest | 335 | 308 | ||||||
Total equity | 351,155 | 205,870 | ||||||
Total liabilities and equity | $ | 396,239 | $ | 240,727 | ||||
|
| 2023 |
|
| 2022 |
| ||
ASSETS |
|
|
|
|
|
| ||
Current assets: |
|
|
|
|
|
| ||
Cash and cash equivalents |
| $ | 242,219 |
|
| $ | 190,611 |
|
Accounts receivable, less allowance of $130 in 2023 and $87 in 2022 |
|
| 52,631 |
|
|
| 65,429 |
|
Inventories |
|
| 106,579 |
|
|
| 101,410 |
|
Other current assets |
|
| 18,937 |
|
|
| 5,154 |
|
Total current assets |
|
| 420,366 |
|
|
| 362,604 |
|
Deferred tax assets |
|
| 296 |
|
|
| 280 |
|
Long-term investment, net |
|
| 2,530 |
|
|
| 2,622 |
|
Property, plant and equipment, net |
|
| 157,689 |
|
|
| 166,009 |
|
Other assets |
|
| 14,006 |
|
|
| 5,386 |
|
Total assets |
| $ | 594,887 |
|
| $ | 536,901 |
|
LIABILITIES AND EQUITY |
|
|
|
|
|
| ||
Current liabilities: |
|
|
|
|
|
| ||
Accounts payable |
| $ | 12,100 |
|
| $ | 22,207 |
|
Accrued compensation and benefits |
|
| 11,227 |
|
|
| 10,849 |
|
Accrued litigation |
|
| 6,500 |
|
|
| 6,500 |
|
Accrued expenses |
|
| 5,093 |
|
|
| 8,613 |
|
Sales allowances |
|
| 3,482 |
|
|
| 1,661 |
|
Short-term lease liabilities |
|
| 1,864 |
|
|
| 1,450 |
|
Income taxes payable |
|
| 746 |
|
|
| 72 |
|
Short-term deferred revenue and customer prepayments |
|
| 3,157 |
|
|
| 13,197 |
|
Total current liabilities |
|
| 44,169 |
|
|
| 64,549 |
|
Long-term deferred revenue |
|
| 1,020 |
|
|
| 145 |
|
Long-term income taxes payable |
|
| 2,228 |
|
|
| 862 |
|
Long-term lease liabilities |
|
| 6,364 |
|
|
| 7,009 |
|
Total liabilities |
|
| 53,781 |
|
|
| 72,565 |
|
Commitments and contingencies (Note 15) |
|
|
|
|
|
| ||
Equity: |
|
|
|
|
|
| ||
Vicor Corporation stockholders’ equity: |
|
|
|
|
|
| ||
Class B Common Stock: 10 votes per share, $.01 par value, 14,000,000 shares |
|
| 118 |
|
|
| 118 |
|
Common Stock: 1 vote per share, $.01 par value, 62,000,000 shares |
|
| 445 |
|
|
| 441 |
|
Additional paid-in capital |
|
| 383,832 |
|
|
| 360,365 |
|
Retained earnings |
|
| 296,674 |
|
|
| 243,079 |
|
Accumulated other comprehensive loss |
|
| (1,273 | ) |
|
| (988 | ) |
Treasury stock at cost: 11,634,806 shares in 2023 and 2022 |
|
| (138,927 | ) |
|
| (138,927 | ) |
Total Vicor Corporation stockholders’ equity |
|
| 540,869 |
|
|
| 464,088 |
|
Noncontrolling interest |
|
| 237 |
|
|
| 248 |
|
Total equity |
|
| 541,106 |
|
|
| 464,336 |
|
Total liabilities and equity |
| $ | 594,887 |
|
| $ | 536,901 |
|
See accompanying notes.
34
VICOR CORPORATION
Consolidated Statements of OPERATIONS
Years Ended December 31, 2020, 20192023, 2022 and 2018
(In thousands, except per share amounts)
2020 | 2019 | 2018 | ||||||||||
Net revenues | $ | 296,576 | $ | 262,977 | $ | 291,220 | ||||||
Cost of revenues | 165,129 | 140,011 | 152,249 | |||||||||
Gross margin | 131,447 | 122,966 | 138,971 | |||||||||
Operating expenses: | ||||||||||||
Selling, general and administrative | 63,163 | 62,557 | 62,224 | |||||||||
Research and development | 50,916 | 46,588 | 44,286 | |||||||||
Severance and other charges | — | — | 402 | |||||||||
Total operating expenses | 114,079 | 109,145 | 106,912 | |||||||||
Income from operations | 17,368 | 13,821 | 32,059 | |||||||||
Other income (expense), net: | ||||||||||||
Total unrealized gains (losses) on available-for-sale | 7 | (16 | ) | 1 | ||||||||
Portion of losses (gains) recognized in other comprehensive income (loss) | (3 | ) | 20 | 6 | ||||||||
Net credit gains recognized in earnings | 4 | 4 | 7 | |||||||||
Other income (expense), net | 1,089 | 1,062 | 867 | |||||||||
Total other income (expense), net | 1,093 | 1,066 | 874 | |||||||||
Income before income taxes | 18,461 | 14,887 | 32,933 | |||||||||
Less: Provision for income taxes | 539 | 778 | 1,087 | |||||||||
Consolidated net income | 17,922 | 14,109 | 31,846 | |||||||||
Less: Net income attributable to noncontrolling interest | 12 | 11 | 121 | |||||||||
Net income attributable to Vicor Corporation | $ | 17,910 | $ | 14,098 | $ | 31,725 | ||||||
Net income per common share attributable to Vicor Corporation: | ||||||||||||
Basic | $ | 0.42 | $ | 0.35 | $ | 0.80 | ||||||
Diluted | $ | 0.41 | $ | 0.34 | $ | 0.78 | ||||||
Shares used to compute net income per common share attributable to Vicor Corporation: | ||||||||||||
Basic | 42,186 | 40,330 | 39,872 | |||||||||
Diluted | 43,869 | 41,677 | 40,729 | |||||||||
|
| 2023 |
|
| 2022 |
|
| 2021 |
| |||
Net revenues |
| $ | 405,059 |
|
| $ | 399,079 |
|
| $ | 359,364 |
|
Cost of revenues |
|
| 200,130 |
|
|
| 218,520 |
|
|
| 181,164 |
|
Gross margin |
|
| 204,929 |
|
|
| 180,559 |
|
|
| 178,200 |
|
Operating expenses: |
|
|
|
|
|
|
|
|
| |||
Selling, general and administrative |
|
| 85,714 |
|
|
| 86,264 |
|
|
| 69,484 |
|
Research and development |
|
| 67,857 |
|
|
| 60,594 |
|
|
| 53,114 |
|
Litigation-contingency expense |
|
| — |
|
|
| 6,500 |
|
|
| — |
|
Total operating expenses |
|
| 153,571 |
|
|
| 153,358 |
|
|
| 122,598 |
|
Income from operations |
|
| 51,358 |
|
|
| 27,201 |
|
|
| 55,602 |
|
Other income (expense), net: |
|
|
|
|
|
|
|
|
| |||
Total unrealized (losses) gains on available-for-sale |
|
|
|
|
|
|
|
|
| |||
securities, net |
|
| (92 | ) |
|
| (17 | ) |
|
| 122 |
|
Portion of losses (gains) recognized in other |
|
|
|
|
|
|
|
|
| |||
comprehensive income |
|
| 92 |
|
|
| 20 |
|
|
| (118 | ) |
Net credit gains recognized in earnings |
|
| — |
|
|
| 3 |
|
|
| 4 |
|
Other income (expense), net |
|
| 8,886 |
|
|
| 1,483 |
|
|
| 1,199 |
|
Total other income (expense), net |
|
| 8,886 |
|
|
| 1,486 |
|
|
| 1,203 |
|
Income before income taxes |
|
| 60,244 |
|
|
| 28,687 |
|
|
| 56,805 |
|
Less: Provision for income taxes |
|
| 6,644 |
|
|
| 3,261 |
|
|
| 176 |
|
Consolidated net income |
|
| 53,600 |
|
|
| 25,426 |
|
|
| 56,629 |
|
Less: Net income (loss) attributable to |
|
|
|
|
|
|
|
|
| |||
noncontrolling interest |
|
| 5 |
|
|
| (20 | ) |
|
| 4 |
|
Net income attributable to Vicor Corporation |
| $ | 53,595 |
|
| $ | 25,446 |
|
| $ | 56,625 |
|
|
|
|
|
|
|
|
|
|
| |||
Net income per common share attributable to |
|
|
|
|
|
|
|
|
| |||
Vicor Corporation: |
|
|
|
|
|
|
|
|
| |||
Basic |
| $ | 1.21 |
|
| $ | 0.58 |
|
| $ | 1.30 |
|
Diluted |
| $ | 1.19 |
|
| $ | 0.57 |
|
| $ | 1.26 |
|
Shares used to compute net income per common share |
|
|
|
|
|
|
|
|
| |||
attributable to Vicor Corporation: |
|
|
|
|
|
|
|
|
| |||
Basic |
|
| 44,320 |
|
|
| 44,005 |
|
|
| 43,651 |
|
Diluted |
|
| 45,004 |
|
|
| 44,894 |
|
|
| 44,966 |
|
See accompanying notes.
35
VICOR CORPORATION
Consolidated Statements of COMPREHENSIVE INCOME
Years Ended December 31, 2020, 20192023, 2022 and 2018
(In thousands)
|
| 2023 |
|
| 2022 |
|
| 2021 |
| |||
Consolidated net income |
| $ | 53,600 |
|
| $ | 25,426 |
|
| $ | 56,629 |
|
Foreign currency translation losses, net of |
|
|
|
|
|
|
|
| ||||
tax benefit (1) |
|
| (209 | ) |
|
| (519 | ) |
|
| (425 | ) |
Unrealized (losses) gains on available-for-sale |
|
|
|
|
|
|
|
|
| |||
securities, net of tax (1) |
|
| (92 | ) |
|
| 821 |
|
|
| (732 | ) |
Other comprehensive (loss) income |
|
| (301 | ) |
|
| 302 |
|
|
| (1,157 | ) |
Consolidated comprehensive income |
|
| 53,299 |
|
|
| 25,728 |
|
|
| 55,472 |
|
Less: Comprehensive loss attributable to |
|
|
|
|
|
|
|
|
| |||
noncontrolling interest |
|
| (11 | ) |
|
| (58 | ) |
|
| (29 | ) |
Comprehensive income attributable to |
|
|
|
|
|
|
|
|
| |||
Vicor Corporation |
| $ | 53,310 |
|
| $ | 25,786 |
|
| $ | 55,501 |
|
2020 | 2019 | 2018 | ||||||||||
Consolidated net income | $ | 17,922 | $ | 14,109 | $ | 31,846 | ||||||
Foreign currency translation gains, net of tax benefit (1) | 200 | 33 | 98 | |||||||||
Unrealized losses on available-for-sale | (6 | ) | (20 | ) | (6 | ) | ||||||
Other comprehensive income | 194 | 13 | 92 | |||||||||
Consolidated comprehensive income | 18,116 | 14,122 | 31,938 | |||||||||
Less: Comprehensive income attributable to noncontrolling interest | 27 | 13 | 129 | |||||||||
Comprehensive income attributable to Vicor Corporation | $ | 18,089 | $ | 14,109 | $ | 31,809 | ||||||
See accompanying notes.
36
VICOR CORPORATION
Consolidated Statements of Cash Flows
Years Ended December 31, 2020, 20192023, 2022 and 2018
(In thousands)
2020 | 2019 | 2018 | ||||||||||
Operating activities: | ||||||||||||
Consolidated net income | $ | 17,922 | $ | 14,109 | $ | 31,846 | ||||||
| Adjustments to reconcile consolidated net income to net cash provided by operating activities: | ||||||||||||
Depreciation and amortization | 11,056 | 10,334 | 9,254 | |||||||||
Stock-based compensation expense | 5,883 | 3,036 | 3,396 | |||||||||
(Decrease) increase in long-term deferred revenue | (321 | ) | 822 | (71 | ) | |||||||
Increase in long-term income taxes payable | 76 | 329 | 43 | |||||||||
Deferred income taxes | (21 | ) | 60 | (55 | ) | |||||||
Increase in other long-term liabilities | — | — | 9 | |||||||||
Gain on disposal of equipment | (13 | ) | (38 | ) | (57 | ) | ||||||
Provision (recovery) for doubtful accounts | 23 | (144 | ) | 65 | ||||||||
Credit gain on available-for-sale | (4 | ) | (4 | ) | (7 | ) | ||||||
Increase in contingent consideration obligations | — | 280 | — | |||||||||
Change in current assets and liabilities, net | (54 | ) | (6,576 | ) | (8,252 | ) | ||||||
Net cash provided by operating activities | 34,547 | 22,208 | 36,171 | |||||||||
Investing activities: | ||||||||||||
Purchases of short-term investments | (50,166 | ) | — | — | ||||||||
Additions to property, plant and equipment | (28,653 | ) | (12,485 | ) | (18,211 | ) | ||||||
Proceeds from sale of equipment | 13 | 38 | 57 | |||||||||
Decrease (increase) in other assets | 182 | (35 | ) | (85 | ) | |||||||
Net cash used for investing activities | (78,624 | ) | (12,482 | ) | (18,239 | ) | ||||||
Financing activities: | ||||||||||||
| Proceeds from public offering of Common Stock | 109,681 | — | — | |||||||||
| Proceeds from employee stock plans | 11,585 | 4,742 | 8,656 | |||||||||
Payment of contingent consideration obligations | (224 | ) | (237 | ) | (270 | ) | ||||||
Noncontrolling interest dividend paid | — | (139 | ) | — | ||||||||
Net cash provided by financing activities | 121,042 | 4,366 | 8,386 | |||||||||
Effect of foreign exchange rates on cash | 109 | 19 | 9 | |||||||||
Net increase in cash and cash equivalents | 77,074 | 14,111 | 26,327 | |||||||||
Cash and cash equivalents at beginning of year | 84,668 | 70,557 | 44,230 | |||||||||
Cash and cash equivalents at end of year | $ | 161,742 | $ | 84,668 | $ | 70,557 | ||||||
| Change in current assets and liabilities: | ||||||||||||
Accounts receivable | $ | (2,816 | ) | $ | 5,714 | $ | (8,834 | ) | ||||
Inventories, net | (8,049 | ) | (1,812 | ) | (10,827 | ) | ||||||
Other current assets | 369 | (2,895 | ) | 176 | ||||||||
Accounts payable and accrued liabilities | 8,668 | (7,339 | ) | 7,450 | ||||||||
Accrued severance and other charges | — | (234 | ) | 234 | ||||||||
Short-term lease payable | 34 | 12 | — | |||||||||
Income taxes payable | 82 | (653 | ) | 410 | ||||||||
Deferred revenue | 1,658 | 631 | 3,139 | |||||||||
Change in current assets and liabilities, net | $ | (54 | ) | $ | (6,576 | ) | $ | (8,252 | ) | |||
Supplemental disclosures: | ||||||||||||
Cash paid during the year for income taxes, net of refunds | $ | 79 | $ | 2,194 | $ | 743 | ||||||
|
| 2023 |
|
| 2022 |
|
| 2021 |
| |||
Operating activities: |
|
|
|
|
|
|
|
|
| |||
Consolidated net income |
| $ | 53,600 |
|
| $ | 25,426 |
|
| $ | 56,629 |
|
Adjustments to reconcile consolidated net income |
|
|
|
|
|
|
|
|
| |||
Depreciation and amortization |
|
| 17,240 |
|
|
| 13,776 |
|
|
| 11,705 |
|
Stock-based compensation expense |
|
| 12,869 |
|
|
| 10,264 |
|
|
| 7,035 |
|
Provision for doubtful accounts |
|
| 43 |
|
|
| 5 |
|
|
| — |
|
Deferred income taxes |
|
| (34 | ) |
|
| (72 | ) |
|
| 18 |
|
Litigation-contingency expense |
|
| — |
|
|
| 6,500 |
|
|
| — |
|
Amortization of bond premium |
|
| — |
|
|
| 1,056 |
|
|
| — |
|
Credit gain on available-for-sale securities |
|
| — |
|
|
| (3 | ) |
|
| (4 | ) |
Increase (decrease) in long-term deferred revenue |
|
| 875 |
|
|
| (268 | ) |
|
| (320 | ) |
Increase in other assets |
|
| (192 | ) |
|
| (692 | ) |
|
| (43 | ) |
Increase (decrease) in long-term income taxes payable |
|
| 1,366 |
|
|
| 293 |
|
|
| (74 | ) |
Decrease in contingent consideration obligations |
|
| — |
|
|
| — |
|
|
| (74 | ) |
Change in current assets and liabilities, net |
|
| (11,239 | ) |
|
| (33,346 | ) |
|
| (20,428 | ) |
Net cash provided by operating activities |
|
| 74,528 |
|
|
| 22,939 |
|
|
| 54,444 |
|
Investing activities: |
|
|
|
|
|
|
|
|
| |||
Purchases of short-term investments |
|
| — |
|
|
| — |
|
|
| (70,900 | ) |
Additions to property, plant and equipment and internal-use |
|
| (33,452 | ) |
|
| (63,966 | ) |
|
| (47,761 | ) |
Sales and maturities of short-term investments |
|
| — |
|
|
| 45,000 |
|
|
| 75,000 |
|
Net cash used for investing activities |
|
| (33,452 | ) |
|
| (18,966 | ) |
|
| (43,661 | ) |
Financing activities: |
|
|
|
|
|
|
|
|
| |||
Proceeds from employee stock plans |
|
| 10,602 |
|
|
| 4,439 |
|
|
| 10,243 |
|
Payment of contingent consideration obligations |
|
| — |
|
|
| — |
|
|
| (153 | ) |
Net cash provided by financing activities |
|
| 10,602 |
|
|
| 4,439 |
|
|
| 10,090 |
|
Effect of foreign exchange rates on cash |
|
| (70 | ) |
|
| (219 | ) |
|
| (197 | ) |
Net increase in cash and cash equivalents |
|
| 51,608 |
|
|
| 8,193 |
|
|
| 20,676 |
|
Cash and cash equivalents at beginning of year |
|
| 190,611 |
|
|
| 182,418 |
|
|
| 161,742 |
|
Cash and cash equivalents at end of year |
| $ | 242,219 |
|
| $ | 190,611 |
|
| $ | 182,418 |
|
Change in current assets and liabilities: |
|
|
|
|
|
|
|
|
| |||
Accounts receivable |
| $ | 12,640 |
|
| $ | (10,586 | ) |
| $ | (14,301 | ) |
Inventories |
|
| (5,236 | ) |
|
| (34,204 | ) |
|
| (10,134 | ) |
Other current assets |
|
| (539 | ) |
|
| 1,547 |
|
|
| 10 |
|
Accounts payable and accrued liabilities |
|
| (11,151 | ) |
|
| 4,399 |
|
|
| 2,503 |
|
Accrued severance and other charges |
|
| 9 |
|
|
| (93 | ) |
|
| 93 |
|
Short-term lease liabilities |
|
| 583 |
|
|
| 103 |
|
|
| 4 |
|
Income taxes payable |
|
| 674 |
|
|
| 6 |
|
|
| (73 | ) |
Deferred revenue and customer prepayments |
|
| (8,219 | ) |
|
| 5,482 |
|
|
| 1,470 |
|
Change in current assets and liabilities, net |
| $ | (11,239 | ) |
| $ | (33,346 | ) |
| $ | (20,428 | ) |
Supplemental disclosures: |
|
|
|
|
|
|
|
|
| |||
Cash paid during the year for income taxes, net of refunds |
| $ | 4,151 |
|
| $ | 1,263 |
|
| $ | 645 |
|
Purchases of property, plant and equipment and internal-use software incurred but not yet paid |
| $ | 2,168 |
|
| $ | 4,194 |
|
| $ | 4,803 |
|
See accompanying notes.
37
VICOR CORPORATION
CONSOLIDATED STATEMENTS OF EQUITY
Years Ended December 31, 2020, 20192023, 2022 and 2018
(In thousands)
Class B Common Stock | Common Stock | Additional Paid-In Capital | Retained Earnings | Accumulated Other Comprehensive Income (Loss) | Treasury Stock | Total Vicor Corporation Stockholders’ Equity | Noncontrolling Interest | Total Equity | ||||||||||||||||||||||||||||
Balance on December 31, 2017 | $ | 118 | $ | 401 | $ | 181,395 | $ | 93,605 | $ | (478 | ) | $ | (138,927 | ) | $ | 136,114 | $ | 305 | $ | 136,419 | ||||||||||||||||
Issuance of Common Stock under employee stock plans | 7 | 8,649 | 8,656 | 8,656 | ||||||||||||||||||||||||||||||||
Stock-based compensation expense | 3,396 | 3,396 | 3,396 | |||||||||||||||||||||||||||||||||
Cumulative effect of adoption of new accounting principle (Topic 606) | 3,670 | 3,670 | 3,670 | |||||||||||||||||||||||||||||||||
Other | (6 | ) | 17 | 11 | 11 | |||||||||||||||||||||||||||||||
Components of comprehensive income, net of ta x | ||||||||||||||||||||||||||||||||||||
Net income | 31,725 | 31,725 | 121 | 31,846 | ||||||||||||||||||||||||||||||||
Other comprehensive income | 84 | 84 | 8 | 92 | ||||||||||||||||||||||||||||||||
Total comprehensive income | 31,809 | 129 | 31,938 | |||||||||||||||||||||||||||||||||
Balance on December 31, 2018 | 118 | 402 | 193,457 | 129,000 | (394 | ) | (138,927 | ) | 183,656 | 434 | 184,090 | |||||||||||||||||||||||||
Issuance of Common Stock under employee stock plans | 3 | 4,739 | 4,742 | 4,742 | ||||||||||||||||||||||||||||||||
Stock-based compensation expense | 3,036 | 3,036 | 3,036 | |||||||||||||||||||||||||||||||||
Noncontrolling interest dividend paid | — | (139 | ) | (139 | ) | |||||||||||||||||||||||||||||||
Other | 19 | 19 | 19 | |||||||||||||||||||||||||||||||||
Components of comprehensive income, net of tax | ||||||||||||||||||||||||||||||||||||
Net income | 14,098 | 14,098 | 11 | 14,109 | ||||||||||||||||||||||||||||||||
Other comprehensive income | 11 | 11 | 2 | 13 | ||||||||||||||||||||||||||||||||
Total comprehensive income | 14,109 | 13 | 14,122 | |||||||||||||||||||||||||||||||||
Balance on December 31, 2019 | 118 | 405 | 201,251 | 143,098 | (383 | ) | (138,927 | ) | 205,562 | 308 | 205,870 | |||||||||||||||||||||||||
Issuance of Common Stock under employee stock plans | 10 | 11,575 | 11,585 | 11,585 | ||||||||||||||||||||||||||||||||
Issuance of Common Stock in public offering, net (See Note 1 0 ) | 18 | 109,663 | 109,681 | 109,681 | ||||||||||||||||||||||||||||||||
Stock-based compensation expense | 5,883 | 5,883 | 5,883 | |||||||||||||||||||||||||||||||||
Other | 20 | 20 | 20 | |||||||||||||||||||||||||||||||||
Components of comprehensive income, net of tax | ||||||||||||||||||||||||||||||||||||
Net income | 17,910 | 17,910 | 12 | 17,922 | ||||||||||||||||||||||||||||||||
Other comprehensive income | 179 | 179 | 15 | 194 | ||||||||||||||||||||||||||||||||
Total comprehensive income | 18,089 | 27 | 18,116 | |||||||||||||||||||||||||||||||||
Balance on December 31, 2020 | $ | 118 | $ | 433 | $ | 328,392 | $ | 161,008 | $ | (204 | ) | $ | (138,927 | ) | $ | 350,820 | $ | 335 | $ | 351,155 | ||||||||||||||||
|
|
|
|
|
|
|
|
|
|
|
|
|
|
|
|
|
|
|
| Total |
|
|
|
|
|
|
| |||||||||
|
|
|
|
|
|
|
|
|
|
|
|
|
| Accumulated |
|
|
|
|
| Vicor |
|
|
|
|
|
|
| |||||||||
|
| Class B |
|
|
|
|
| Additional |
|
|
|
|
| Other |
|
|
|
|
| Corporation |
|
|
|
|
|
|
| |||||||||
|
| Common |
|
| Common |
|
| Paid-In |
|
| Retained |
|
| Comprehensive |
|
| Treasury |
|
| Stockholders’ |
|
| Noncontrolling |
|
| Total |
| |||||||||
|
| Stock |
|
| Stock |
|
| Capital |
|
| Earnings |
|
| Income (Loss) |
|
| Stock |
|
| Equity |
|
| Interest |
|
| Equity |
| |||||||||
Balance on December 31, 2020 |
| $ | 118 |
|
| $ | 433 |
|
| $ | 328,392 |
|
| $ | 161,008 |
|
| $ | (204 | ) |
| $ | (138,927 | ) |
| $ | 350,820 |
|
| $ | 335 |
|
| $ | 351,155 |
|
Issuance of Common Stock under employee stock plans |
|
|
|
|
| 6 |
|
|
| 10,237 |
|
|
|
|
|
|
|
|
|
|
|
| 10,243 |
|
|
|
|
|
| 10,243 |
| |||||
Stock-based compensation expense |
|
|
|
|
|
|
|
| 7,035 |
|
|
|
|
|
|
|
|
|
|
|
| 7,035 |
|
|
|
|
|
| 7,035 |
| ||||||
Components of comprehensive income, net of tax |
|
|
|
|
|
|
|
|
|
|
|
|
|
|
|
|
|
|
|
|
|
|
|
|
|
|
| |||||||||
Net income |
|
|
|
|
|
|
|
|
|
|
| 56,625 |
|
|
|
|
|
|
|
|
| 56,625 |
|
|
| 4 |
|
|
| 56,629 |
| |||||
Other comprehensive loss |
|
|
|
|
|
|
|
|
|
|
|
|
|
| (1,124 | ) |
|
|
|
|
| (1,124 | ) |
|
| (33 | ) |
|
| (1,157 | ) | |||||
Total comprehensive income (loss) |
|
|
|
|
|
|
|
|
|
|
|
|
|
|
|
|
|
|
|
| 55,501 |
|
|
| (29 | ) |
|
| 55,472 |
| ||||||
Balance on December 31, 2021 |
|
| 118 |
|
|
| 439 |
|
|
| 345,664 |
|
|
| 217,633 |
|
|
| (1,328 | ) |
|
| (138,927 | ) |
|
| 423,599 |
|
|
| 306 |
|
|
| 423,905 |
|
Issuance of Common Stock under employee stock plans |
|
|
|
|
| 2 |
|
|
| 4,437 |
|
|
|
|
|
|
|
|
|
|
|
| 4,439 |
|
|
|
|
|
| 4,439 |
| |||||
Stock-based compensation expense |
|
|
|
|
|
|
|
| 10,264 |
|
|
|
|
|
|
|
|
|
|
|
| 10,264 |
|
|
|
|
|
| 10,264 |
| ||||||
Components of comprehensive income, net of tax |
|
|
|
|
|
|
|
|
|
|
|
|
|
|
|
|
|
|
|
|
|
|
|
|
|
|
| |||||||||
Net income (loss) |
|
|
|
|
|
|
|
|
|
|
| 25,446 |
|
|
|
|
|
|
|
|
| 25,446 |
|
|
| (20 | ) |
|
| 25,426 |
| |||||
Other comprehensive income (loss) |
|
|
|
|
|
|
|
|
|
|
|
|
|
| 340 |
|
|
|
|
|
| 340 |
|
|
| (38 | ) |
|
| 302 |
| |||||
Total comprehensive income (loss) |
|
|
|
|
|
|
|
|
|
|
|
|
|
|
|
|
|
|
|
| 25,786 |
|
|
| (58 | ) |
|
| 25,728 |
| ||||||
Balance on December 31, 2022 |
|
| 118 |
|
|
| 441 |
|
|
| 360,365 |
|
|
| 243,079 |
|
|
| (988 | ) |
|
| (138,927 | ) |
|
| 464,088 |
|
|
| 248 |
|
|
| 464,336 |
|
Issuance of Common Stock under employee stock plans |
|
|
|
|
| 4 |
|
|
| 10,598 |
|
|
|
|
|
|
|
|
|
|
|
| 10,602 |
|
|
|
|
|
| 10,602 |
| |||||
Stock-based compensation expense |
|
|
|
|
|
|
|
| 12,869 |
|
|
|
|
|
|
|
|
|
|
|
| 12,869 |
|
|
|
|
|
| 12,869 |
| ||||||
Components of comprehensive income, net of tax |
|
|
|
|
|
|
|
|
|
|
|
|
|
|
|
|
|
|
|
|
|
|
|
|
|
|
| |||||||||
Net income |
|
|
|
|
|
|
|
|
|
|
| 53,595 |
|
|
|
|
|
|
|
|
| 53,595 |
|
|
| 5 |
|
|
| 53,600 |
| |||||
Other comprehensive loss |
|
|
|
|
|
|
|
|
|
|
|
|
|
| (285 | ) |
|
|
|
|
| (285 | ) |
|
| (16 | ) |
|
| (301 | ) | |||||
Total comprehensive income (loss) |
|
|
|
|
|
|
|
|
|
|
|
|
|
|
|
|
|
|
|
| 53,310 |
|
|
| (11 | ) |
|
| 53,299 |
| ||||||
Balance on December 31, 2023 |
| $ | 118 |
|
| $ | 445 |
|
| $ | 383,832 |
|
| $ | 296,674 |
|
| $ | (1,273 | ) |
| $ | (138,927 | ) |
| $ | 540,869 |
|
| $ | 237 |
|
| $ | 541,106 |
|
See accompanying notes.
38
Vicor Corporation (the “Company” or “Vicor”) designs, develops, manufactures, and markets modular power components and power systems for converting electrical power. The Company also licenses certain rights to its technology in return for recurring royalties. The principal markets for the Company’s power converters and systems are large original equipment manufacturers (“OEMs”), original design manufacturers (“ODMs”) and their contract manufacturers, and smaller, lower volume users, which are broadly distributed across several major market areas.
Principles of consolidation
The Consolidated Financial Statements include the accounts of the Company and its subsidiaries. All intercompany transactions and balances have been eliminated upon consolidation.
Use of estimates
The preparation of financial statements in conformity with accounting principles generally accepted in the United States (“U.S. GAAP”) requires management to make estimates and assumptions that affect the reported amounts of assets and liabilities and disclosure of contingencies at the date of the financial statements and the reported amounts of revenue and expenses during the reporting period. Such estimates and assumptions relate to the useful lives of fixed assets and identified intangible assets, recoverability of long-lived assets, fair value of short-term and long-term investments, allowances for doubtful accounts, potential excess, obsolete or unmarketable inventory, potential reserves relating to litigation matters, accrued liabilities, accrued taxes, deferred tax valuation allowances, assumptions pertaining to share-based payments, and other reserves. Actual results could differ from those based on these estimates and assumptions, and such differences may be material to the financial statements.
Foreign currency translation
The financial statements of Vicor Japan Company, Ltd. (“VJCL”("VJCL"), a majority-owned subsidiary, for which the functional currency is the Japanese Yen, have been translated into U.S. Dollars using the exchange rate in effect at the balance sheet date for balance sheet amounts and the average exchange rates in effect during the year for income statement amounts. The gains and losses resulting from the changes in exchange rates from year to year have been reported in other comprehensive income.
Transaction gains and losses resulting from the remeasurement of foreign currency denominated assets and liabilities of the Company’s foreign subsidiaries where the functional currency is the U.S. Dollar are included in other income (expense), net. Foreign currency gains (losses)losses included in other income (expense), net were approximately $181,000, $(108,000)$(161,000), $(653,000), and $$(336,000) in 2023, 2022, and 2021, respectively.
Investments
The Company’s principal sources of liquidity are its existing balances of cash, and cash equivalents, and short-term investments, as well as cash generated from operations. Consistent with the guidelines of the Company’s investment policy, the Company can invest, and has historically invested, its cash balances in demand deposit accounts, money market funds, government debt securities, and auction rate securities meeting certain quality criteria.
Cash and Cash Equivalents
Cash and cash equivalents are highly liquid investments with insignificant interest rate risk and maturities of 90 days or less at the time of acquisition. Cash and cash equivalents include funds held in disbursement (i.e., checking) and money market accounts, certificates of deposit, and debt securities with maturities of less than three months at the time of purchase. Cash and cash equivalents are valued at cost, approximating market value. The Company’s money market securities are purchased and redeemed at par value. Their estimated fair value is equal to their cost, and, due to the nature of the securities and their classification as cash equivalents, there are no unrealized gains or losses recorded at the balance sheet dates.
39
Table of Contents
VICOR CORPORATION
Notes to Consolidated Financial Statements
Short-term Investments
The Company’s short-term investments, consisting of obligations of the U.S. Treasury, are debt securities with original maturities greater than three months but less than one year at the time of purchase.
Long-term Investment
The Company’s long-term investment is an auction rate debt security with a maturity of greater than one year and is subject to credit, liquidity, market, and interest rate risk.
Available-For-Sale
Certain of the cash and cash equivalents, all of the short-term investments and the long-term investment are classified as
The Company periodically evaluates the long-term investment to determine if impairment is required, whether an impairment is other than temporary, and the measurement of an impairment loss. The Company considers a variety of impairment indicators such as, but not limited to, a significant deterioration in the earnings performance, credit rating, or asset quality of the investment.
The amortized cost of the debt securities are adjusted for amortization of premiums and accretion of discounts to maturity, the net amount of which, along with interest and realized gains and losses, is included in “Other income (expense), net” in the Consolidated Statements of Operations.
Fair value measurements
The Company accounts for certain financial assets at fair value, defined as the price that would be received to sell an asset or paid to transfer a liability (i.e., an exit price) in the principal or most advantageous market for the asset or liability in an orderly transaction between market participants on the measurement date. As such, fair value is a market-based measurement that should be determined based on assumptions that market participants would use in pricing an asset or liability. A three-level hierarchy is used to show the extent and level of judgment used to estimate fair value measurements:
Level 1 | Inputs used to measure fair value are unadjusted quoted prices available in active markets for the identical assets or liabilities as of the reporting date. | ||
Level 2 | Inputs used to measure fair value, other than quoted prices included in Level 1, are either directly or indirectly observable as of the reporting date through correlation with market data, including quoted prices for similar assets and liabilities in active markets and quoted prices in inactive markets. Level 2 also includes assets and liabilities valued using models or other pricing methodologies that do not require significant judgment since the input assumptions used in the models, such as interest rates and volatility factors, are corroborated by readily observable data from actively quoted markets for substantially the full term of the financial instrument. | ||
Level 3 | Inputs used to measure fair value are unobservable inputs supported by little or no market activity and reflect the use of significant management judgment. These values are generally determined using pricing models for which the assumptions utilize management’s estimates of market participant assumptions. |
The carrying amounts of cash and cash equivalents, short-term investments, accounts receivable, and accounts payable approximate fair value because of the short maturities of these financial instruments.
40
Table of Contents
VICOR CORPORATION
Notes to Consolidated Financial Statements
Inventories
Inventories are valued at the lower of cost (determined using the
Inventory estimated to be excess, obsolete, or unmarketable is written down to net realizable value. The Company’s estimation process for assessing net realizable value is based upon management’s estimate of expected future utility which is derived based on backlog, historical consumption and expected market conditions. If the Company’s estimated demand and/or market expectations were to change or if product sales were to decline, the Company’s estimation process may cause larger inventory reserves to be recorded, resulting in larger charges to cost of revenues.
Government Grants
The Company accounts for government assistance that is not subject to the scope of Accounting Standards Codification ("ASC") 740, Income Taxes using a grant accounting model, by analogy to International Accounting Standards 20, Accounting for Government Grants and Disclosure of Government Assistance, and recognize such grants when we have reasonable assurance that we will comply with the grant’s conditions and that the grant will be received. Government grants whose primary condition is the purchase, construction, or acquisition of a long-lived asset are considered asset-based grants and are recognized as a reduction to such asset’s cost basis, which reduces future depreciation. Other government grants not related to long-lived assets are considered income-based grants, which are initially recognized as “Government grants receivable” and are also recognized as a reduction to the related cost of activities that generated the benefit. Proceeds received from asset based grants are presented as cash inflows from investing activities on the consolidated statements of cash flows, whereas proceeds received from income based grants are presented as cash inflows from operating activities.
Concentrations of risk
Financial instruments potentially subjecting the Company to significant concentrations of credit risk consist principally of cash and cash equivalents and short-term investments, of which a significant portion are held by three financial institutions, its long-term investment, and trade accounts receivable. The Company maintains cash and cash equivalents, short-term investments and certain other financial instruments with high credit
The Company’s products are sold worldwide to customers ranging from smaller, independent manufacturers of highly specialized electronic devices, to larger OEMs, ODMs and their contract manufacturers. See Note 19,
41
reflection of the relatively early stage of adoption of the technologies, architectures and products offered in the Advanced Products line, and the Company’s strategy of targeting market leading innovators as initial customers for its Advanced Products. Concentrations of credit risk with respect to trade accounts receivable are limited due to the number of entities comprising the Company’s customer base.
Components and materials used in the Company’s products are purchased from a variety of vendors. While most of the components are available from multiple sources, some key components for certain Advanced Products, in particular, are supplied by single vendors. In instances of single source items, the Company maintains levels of inventories management considers appropriate to enable meeting the delivery requirements of customers. If suppliers or subcontractors cannot provide their products or services on time or to the required specifications, the Company may not be able to meet the demand for its products and its delivery times may be negatively affected.
Long-lived assets
The Company reviews property, plant and equipment and finite-lived intangible assets for impairment whenever events or changes in circumstances indicate the carrying value of such assets may not be recoverable. Management determines whether the carrying value of an asset or asset group is recoverable based on comparison to the undiscounted expected future cash flows the assets are expected to generate over their remaining economic lives. If an asset value is not recoverable, the impairment loss is equal to the amount by
Intangible assets
Patents
Values assigned to patents are amortized using the straight-line method over periods ranging from three to
Internally Developed Software
We capitalize internal and external costs related to developing, modifying or obtaining software for internal use, incurred during the application development stage in accordance with Accounting Standards Codification 350-40, Internal-Use Software. Costs related to software upgrades and enhancements are capitalized if it is determined that these upgrades or enhancements provide additional functionality to the software. The capitalized software is amortized using the straight-line method over the estimated useful life of the software. As of December 31, 2023 and 2022, we had $11,712,000 and $3,202,000, respectively, of capitalized internal-use software costs which have not been amortized as the software has not yet been placed in service.
Product warranties
The Company generally offers amilitary grade products. The Company is party to a limited number of supply agreements with certain customers contractually committing the Company to warranty and indemnification requirements exceeding those to which the Company has been exposed in the past. The Company provides for the estimated cost of product warranties at the time product revenue is recognized. Factors influencing the Company’s warranty reserves include the number of units sold, historical and anticipated rates of warranty returns, and the cost per return. The Company periodically assesses the adequacy of warranty reserves and adjusts the amounts as necessary. Warranty obligations are included in “Accrued expenses”"Accrued expenses" in the accompanying Consolidated Balance Sheets.
Revenue recognition
Revenue is recognized when control of the promised goods or services is transferred to a customer, in an amount that reflects the consideration the Company expects to be entitled to in exchange for those goods or services. Sales, value add, and other taxes collected concurrent with revenue producing activities are excluded from revenue. The expected costs associated
42
with product warranties continue to be recognized at the time product revenue is recognized. Shipping and handling costs associated with outbound freight after control over a product has transferred to a customer are accounted for as a fulfillment cost and are included in cost of revenues.
The Company’s primary source of net revenue comes from the sale of products, which are modular power components and power systems for converting, regulating and controlling electric current. The principal customers for the Company’s power converters and systems are large OEMs, ODMs and the original design manufacturers and contract manufacturers serving them, and smaller, lower volume users, which are broadly distributed across several major market areas. The Company recognizes revenue for product sales at a point in time following the transfer of control of such products to the customer, including sales to stocking distributors, which typically occurs upon shipment or delivery, depending on the terms of the underlying contract. The Company establishes sales allowances on shipments to stocking distributors for estimated future product returns including distributor returns and price adjustment credits, primarily based upon historical and anticipated rates of product returns and allowances.
Certain contracts with customers contain multiple performance obligations, which typically may include a combination of
The Company licenses its intellectual property under right to use licenses, in which royalties due to the Company are based upon a percentage of the licensee’s sales. The Company utilizes the exception under the revenue recognition guidance for the recognition of sales- or usage-based royalties, in which the royalties are not recognized until the later of when 1) the customer’s subsequent sales or usages occur, or 2) the performance obligation to which some or all of the sales- or usage-based royalty has been allocated is satisfied or partially satisfied.
Accounts receivable includes amounts billed and currently due from customers. The amounts due are stated at their estimated realizable value. The Company’s payment terms vary by the type and location of its customers and the products or services offered, although terms generally include a requirement of payment within 30 to 60 days. The Company maintains allowances for doubtful accounts for estimated losses resulting from the inability of its customers to make required payments, based on assessments of customers’ credit-risk profiles and payment histories. If the financial condition of the Company’s customers were to deteriorate, resulting in an impairment of their ability to make payments, additional allowances may be required. The Company does not require collateral from its customers, although there have been circumstances when the Company has required cash in advance (i.e., a partial down-payment) to facilitate orders in excess of a customer’s established credit limit. To date, such amounts have not been material.
The Company records deferred revenue, which represents a contract liability, when cash payments are received or due in advance of performance under a contract with a customer. During the years ended December 31, 20202023 and 2019,2022, the Company recognized revenue of approximately $3,550,000$7,568,000 and $76,000,$5,328,000, respectively, thatwhich was included in deferred revenue at the beginning of the respective period.
The Company applies the practical expedient for the incremental costs of obtaining a contract for sales commissions, which are expensed when incurred because the amortization period is generally less than one year. These costs are included in selling, general and administrative expenses.
The Company also applies another practical expedient and does not disclose the value of unsatisfied performance obligations for contracts with an original expected length of one year or less.
Advertising expense
The cost of advertising is expensed as incurred. The Company incurred approximately $2,637,000, $2,749,000,$3,730,000, $3,786,000, and $2,610,000
43
$2,994,000 in advertising costs during 2020, 2019,2023, 2022, and 2018,2021, respectively.
Legal Costs
Legal costs in connection with litigation are expensed as incurred.
Stock-based compensation
The Company uses the Black-Scholes option-pricing model to calculate the fair value of stock option awards, whether they possess time-based vesting provisions or performance-based vesting provisions, and
Income taxes
Deferred tax assets and liabilities are determined based on the differences between the financial reporting and tax bases of assets and liabilities and are measured using the enacted income tax rates and laws expected to be in effect when the temporary differences are expected to reverse. Deferred tax assets are reduced by a valuation allowance if management determines it is more likely than not that some portion or all of the deferred tax assets will not be realized. All deferred tax assets and liabilities are classified as noncurrent.
The Company follows a“more-likely-than-not”“more-likely-than-not”
Net income per common share
The Company computes basic net income per share using the weighted average number of common shares outstanding and diluted net income per share using the weighted average number of common shares outstanding plus the effect of outstanding dilutive stock options, if any. The following table sets forth the computation of basic and diluted net income per share for the years ended December 31 (in thousands, except per share amounts):
|
| 2023 |
|
| 2022 |
|
| 2021 |
| |||
Numerator: |
|
|
|
|
|
|
|
|
| |||
Net income attributable to Vicor Corporation |
| $ | 53,595 |
|
| $ | 25,446 |
|
| $ | 56,625 |
|
Denominator: |
|
|
|
|
|
|
|
|
| |||
Denominator for basic net income per share- |
|
| 44,320 |
|
|
| 44,005 |
|
|
| 43,651 |
|
Effect of dilutive securities: |
|
|
|
|
|
|
|
|
| |||
Employee stock options (2) |
|
| 684 |
|
|
| 889 |
|
|
| 1,315 |
|
Denominator for diluted net income per share- |
|
| 45,004 |
|
|
| 44,894 |
|
|
| 44,966 |
|
Basic net income per share |
| $ | 1.21 |
|
| $ | 0.58 |
|
| $ | 1.30 |
|
Diluted net income per share |
| $ | 1.19 |
|
| $ | 0.57 |
|
| $ | 1.26 |
|
2020 | 2019 | 2018 | ||||||||||
Numerator: | ||||||||||||
Net income attributable to Vicor Corporation | $ | 17,910 | $ | 14,098 | $ | 31,725 | ||||||
Denominator: | ||||||||||||
Denominator for basic net income per share-weighted average shares (1) | 42,186 | 40,330 | 39,872 | |||||||||
Effect of dilutive securities: | ||||||||||||
Employee stock options (2) | 1,683 | 1,347 | 857 | |||||||||
Denominator for diluted net income per share-adjusted weighted-average shares and assumed conversions (3) | 43,869 | 41,677 | 40,729 | |||||||||
Basic net income per share | $ | 0.42 | $ | 0.35 | $ | 0.80 | ||||||
Diluted net income per share | $ | 0.41 | $ | 0.34 | $ | 0.78 | ||||||
44
VICOR CORPORATION
Notes to Consolidated Financial Statements
Comprehensive income (loss)
The components of comprehensive income (loss) include, in addition to consolidated net income, (loss), unrealized gains and losses on investments, net of tax and foreign currency translation adjustments related to VJCL, net of tax.
Impact of recently issued accounting standards
On November 27, 2023, the FASBFinancial Accounting Standards Board (“FASB”) issued guidance designedAccounting Standards (“ASU”) No. 2023-07, Segment Reporting (Topic 280): Improvements to simplify the accounting for income taxes by eliminating certain exceptions to the general principles in Topic 740,Income Taxesalso improve consistent applicationrequires additional disclosures of and simplify U.S. GAAP for other areas of Topic 740 by clarifying and amending existing guidance.segment expenses. This new guidance will beASU is effective for the Company for itsannual periods in fiscal yearyears beginning after December 15, 2020, with early2023, and interim periods thereafter. Early adoption is permitted. The Company has not yet determined the impact of this new guidance will have on its consolidated financial statements and disclosures
In June 2016, theDecember 2023, FASB issued ASU No. 2023-09, Income Taxes (Topic 740): Improvements to Income Tax Disclosures, which focuses on the rate reconciliation and income taxes paid. ASU No. 2023-09 requires a public business entity (PBE) to disclose, on an annual basis, a tabular rate reconciliation using both percentages and currency amounts, broken out into specified categories with certain reconciling items further broken out by nature and jurisdiction to the extent those items exceed a specified threshold. In addition, all entities are required to disclose income taxes paid, net of refunds received disaggregated by federal, state/local, and foreign and by jurisdiction if the amount is at least 5% of total income tax payments, net of refunds received. For PBEs, the new guidance which will require measurement and recognition of expected credit losses on certain types of financial instruments. It also modifies the impairment model foravailable-for-saledebt securities and provides for a simplified accounting model for purchased financial assets with credit deterioration since their origination. The new guidancestandard is effective for interim and annual reporting periods beginning after December 15, 2019,2024, with early adoption permitted. It is requiredAn entity may apply the amendments in this ASU prospectively by providing the revised disclosures for the period ending December 31, 2025 and continuing to be applied on a modified-retrospective approach with certain elements being adopted prospectively.provide the pre-ASU disclosures for the prior periods, or may apply the amendments retrospectively by providing the revised disclosures for all period presented. The Company adopted the new guidance as of January 1, 2020. The adoption did not have a materialexpects this ASU to impact ondisclosures with no impact to the Company’s consolidated financial statements and disclosures.
Other new pronouncements issued but not effective until after December 31, 20202023 are not expected to have a material impact on the Company’s consolidated financial statements.
Inventories as of December 31 were as follows (in thousands):
|
| 2023 |
|
| 2022 |
| ||
Raw materials |
| $ | 88,716 |
|
| $ | 82,181 |
|
Work-in-process |
|
| 10,525 |
|
|
| 10,456 |
|
Finished goods |
|
| 7,338 |
|
|
| 8,773 |
|
|
| $ | 106,579 |
|
| $ | 101,410 |
|
2020 | 2019 | |||||||
Raw materials | $ | 42,556 | $ | 35,901 | ||||
Work-in-process | 7,424 | 5,184 | ||||||
Finished goods | 7,289 | 8,102 | ||||||
| $ | 57,269 | $ | 49,187 | |||||
As of December 31, 2020 the Company held $50,166,000
45
of default. Through December 31, 2020,2023, the Company has continued to receive interest payments on the Failed Auction Security in accordance with the terms of its indenture. Management believes the Company ultimately should be able to liquidate the Failed Auction Security without significant loss primarily due to the overall quality of the issue held and the collateral securing the substantial majority of the underlying obligation. Changes in the estimated fair value of the Failed Auction Security have not been significant in the past three years. However, current conditions in the auction rate securities market have led management to conclude the recovery period for the Failed Auction Security exceeds 12 months.months. As a result, the Company continued to classify the Failed Auction Security as long-term as of December 31, 2020.
December 31, 2020 | ||||||||||||
Cash and Cash Equivalents | Short-Term Investments | Long-Term Investments | ||||||||||
Measured at fair value: | ||||||||||||
Available-for-sale | ||||||||||||
Money Market Funds | $ | 69,493 | $ | — | $ | — | ||||||
| U.S. Treasury Obligations | 19,998 | 50,166 | — | |||||||||
Failed Auction Security | — | — | 2,517 | |||||||||
Total | 89,491 | 50,166 | 2,517 | |||||||||
Other measurement basis: | ||||||||||||
Cash on hand | 72,251 | — | — | |||||||||
Total | $ | 161,742 | $ | 50,166 | $ | 2,517 | ||||||
December 31, 2019 | ||||||||||||
Cash and Cash Equivalents | Short-Term Investments | Long-Term Investments | ||||||||||
Measured at fair value: | ||||||||||||
Available-for-sale | ||||||||||||
Money Market Funds | $ | 9,630 | $ | — | $ | — | ||||||
Failed Auction Security | — | — | 2,510 | |||||||||
Total | 9,630 | — | 2,510 | |||||||||
Other measurement basis: | ||||||||||||
Cash on hand | 75,038 | — | — | |||||||||
Total | $ | 84,668 | $ | — | $ | 2,510 | ||||||
December 31, 2020 | Cost | Gross Unrealized Gains | Gross Unrealized Losses | Estimated Fair Value | ||||||||||||
| U.S. Treasury Obligations | $ | 70,172 | $ | — | $ | 8 | $ | 70,164 | ||||||||
Failed Auction Security | 3,000 | — | 483 | 2,517 | ||||||||||||
December 31, 2019 | ||||||||||||||||
Failed Auction Security | $ | 3,000 | $ | — | $ | 490 | $ | 2,510 | ||||||||
U.S. Treasury Obligations: | ||||||||
Cost | Estimated Fair Value | |||||||
Maturities greater than three months but less than one year | $ | 50,174 | $ | 50,166 | ||||
| Maturities less than three months | 19,998 | 19,998 | ||||||
| $ | 70,172 | $ | 70,164 | |||||
Failed Auction Security: | ||||||||
Cost | Estimated Fair Value | |||||||
| Due in twenty to forty years | $ | 3,000 | $ | 2,517 | ||||
2020 | 2019 | 2018 | ||||||||||
Balance at the beginning of the period | $ | 37 | $ | 41 | $ | 48 | ||||||
Reductions in the amount related to credit gain for which other-than-temporary impairment was not previously recognized | (4 | ) | (4 | ) | (7 | ) | ||||||
Balance at the end of the period | $ | 33 | $ | 37 | $ | 41 | ||||||
At this time, the Company has no intent to sell the Failed Auction Security and does not believe it is more likely than not the Company will be required to sell the security. If current market conditions deteriorate further, the Company may be required to record additional unrealized losses. If the credit rating of the security deteriorates, the Company may be required to adjust the carrying value of the investment through impairment charges recorded in the Consolidated Statement of Operations, and any such impairment adjustments may be material.
Details of our investments are as follows (in thousands):
|
| December 31, 2023 |
| |||||
|
| Cash and Cash |
|
| Long-Term |
| ||
Measured at fair value: |
| Equivalents |
|
| Investment |
| ||
Available-for-sale debt securities: |
|
|
|
|
|
| ||
Money Market Funds |
| $ | 209,489 |
|
| $ | — |
|
Failed Auction Security |
|
| — |
|
|
| 2,530 |
|
Total |
|
| 209,489 |
|
|
| 2,530 |
|
|
|
|
|
|
| |||
Other measurement basis: |
|
|
|
|
|
| ||
Cash on hand |
|
| 32,730 |
|
|
| — |
|
Total |
| $ | 242,219 |
|
| $ | 2,530 |
|
|
| December 31, 2022 |
| |||||
|
| Cash and Cash |
|
| Long-Term |
| ||
Measured at fair value: |
| Equivalents |
|
| Investment |
| ||
Available-for-sale debt securities: |
|
|
|
|
|
| ||
Money Market Funds |
| $ | 143,274 |
|
| $ | — |
|
Failed Auction Security |
|
| — |
|
|
| 2,622 |
|
Total |
|
| 143,274 |
|
|
| 2,622 |
|
Other measurement basis: |
|
|
|
|
|
| ||
Cash on hand |
|
| 47,337 |
|
|
| — |
|
Total |
| $ | 190,611 |
|
| $ | 2,622 |
|
The following is a summary of the Company’s ability to access cash available-for-sale securities (in thousands):
|
|
|
|
| Gross |
|
| Gross |
|
| Estimated |
| ||||
|
|
|
|
| Unrealized |
|
| Unrealized |
|
| Fair |
| ||||
December 31, 2023 |
| Cost |
|
| Gains |
|
| Losses |
|
| Value |
| ||||
Failed Auction Security |
| $ | 3,000 |
|
| $ | — |
|
| $ | 470 |
|
| $ | 2,530 |
|
|
|
|
|
|
|
|
|
|
|
|
|
| ||||
December 31, 2022 |
|
|
|
|
|
|
|
|
|
|
|
| ||||
Failed Auction Security |
| $ | 3,000 |
|
| $ | — |
|
| $ | 378 |
|
| $ | 2,622 |
|
As of December 31, 2023and cash equivalents, its short-term investments, and its expected operating cash flows, management does not anticipate the current lack of liquidity associated with the2022, the Failed Auction Security held will affecthad been in an unrealized loss position for greater than 12 months.
46
The amortized cost and estimated fair value of the Company’s ability to execute its current operating plan.available-for-sale securities on December 31, 2023, by type and contractual maturities, are shown below (in thousands):
Failed Auction Security:
|
|
|
|
| Estimated |
| ||
|
| Cost |
|
| Fair Value |
| ||
Due in nineteen years |
| $ | 3,000 |
|
| $ | 2,530 |
|
The Company accounts for certain financial assets at fair value, defined as the price that would be received to sell an asset or paid to transfer a liability (i.e., an exit price) in the principal or most advantageous market for the asset or liability in an orderly transaction between market participants on the measurement date. As such, fair value is a market-based measurement that should be determined based on assumptions market participants would use in pricing an asset or liability. A three-level hierarchy is used to show the extent and level of judgment used to estimate fair value measurements.
Assets and liabilities measured at fair value on a recurring basis included the following as of December 31, 20202023 (in thousands):
Using | ||||||||||||||||
Quoted Prices in Active Markets (Level 1) | Significant Other Observable Inputs (Level 2) | Significant Unobservable Inputs (Level 3) | Total Fair Value as of December 31, 2020 | |||||||||||||
Cash equivalents: | ||||||||||||||||
Money market funds | $ | 69,493 | $ | — | $ | — | $ | 69,493 | ||||||||
| U.S. Treasury Obligations | 19,998 | — | — | 19,998 | ||||||||||||
Short-term investments: | ||||||||||||||||
| U.S. Treasury Obligations | 50,166 | — | — | 50,166 | ||||||||||||
Long-term investments: | �� | |||||||||||||||
Failed Auction Security | — | — | 2,517 | 2,517 | ||||||||||||
Liabilities: | ||||||||||||||||
Contingent consideration obligations | — | — | (227 | ) | (227 | ) | ||||||||||
|
| Using |
|
|
|
| ||||||||||
|
|
|
|
| Significant |
|
|
|
|
|
|
| ||||
|
| Quoted Prices |
|
| Other |
|
| Significant |
|
|
|
| ||||
|
| in Active |
|
| Observable |
|
| Unobservable |
|
| Total Fair |
| ||||
|
| Markets |
|
| Inputs |
|
| Inputs |
|
| Value as of |
| ||||
|
| (Level 1) |
|
| (Level 2) |
|
| (Level 3) |
|
| December 31, 2023 |
| ||||
Cash equivalents: |
|
|
|
|
|
|
|
|
|
|
|
| ||||
Money market funds |
| $ | 209,489 |
|
| $ | — |
|
| $ | — |
|
| $ | 209,489 |
|
Long-term investment: |
|
|
|
|
|
|
|
|
|
|
|
| ||||
Failed Auction Security |
|
| — |
|
|
| — |
|
|
| 2,530 |
|
|
| 2,530 |
|
Assets measured at fair value on a recurring basis included the following as of December 31, 20192022 (in thousands):
|
| Using |
|
|
|
| ||||||||||
|
|
|
|
| Significant |
|
|
|
|
|
|
| ||||
|
| Quoted Prices |
|
| Other |
|
| Significant |
|
|
|
| ||||
|
| in Active |
|
| Observable |
|
| Unobservable |
|
| Total Fair |
| ||||
|
| Markets |
|
| Inputs |
|
| Inputs |
|
| Value as of |
| ||||
|
| (Level 1) |
|
| (Level 2) |
|
| (Level 3) |
|
| December 31, 2022 |
| ||||
Cash equivalents: |
|
|
|
|
|
|
|
|
|
|
|
| ||||
Money market funds |
| $ | 143,274 |
|
| $ | — |
|
| $ | — |
|
| $ | 143,274 |
|
Long-term investment: |
|
|
|
|
|
|
|
|
|
|
|
| ||||
Failed Auction Security |
|
| — |
|
|
| — |
|
|
| 2,622 |
|
|
| 2,622 |
|
Using | ||||||||||||||||
Quoted Prices in Active Markets (Level 1) | Significant Other Observable Inputs (Level 2) | Significant Unobservable Inputs (Level 3) | Total Fair Value as of December 31, 2019 | |||||||||||||
Cash equivalents: | ||||||||||||||||
Money market funds | $ | 9,630 | $ | — | $ | — | $ | 9,630 | ||||||||
Long-term investments: | ||||||||||||||||
Failed Auction Security | — | — | 2,510 | 2,510 | ||||||||||||
Liabilities: | ||||||||||||||||
Contingent consideration obligations | — | — | (451 | ) | (451 | ) | ||||||||||
three
Fair Value | Valuation Technique | Unobservable Input | Weighted Average | |||||||||
Failed Auction Security | $ | 2,517 | Discounted cash flow | Cumulative probability of earning the maximum rate until maturity | 0.14 | % | ||||||
| Cumulative probability of principal return prior to maturity | 93.62 | % | ||||||||||
| Cumulative probability of default | 6.23 | % | ||||||||||
| Liquidity risk premium | 5.00 | % | ||||||||||
| Recovery rate in default | 40.00 | % | ||||||||||
Balance at the beginning of the period |
| $ | 2,622 |
|
Loss included in Other comprehensive income |
|
| (92 | ) |
Balance at the end of the period |
| $ | 2,530 |
|
Balance at the beginning of the period | $ | 2,510 | ||
Credit gain on available-for-sale | 4 | |||
Gain included in Other comprehensive income | 3 | |||
Balance at the end of the period | $ | 2,517 | ||
Management utilized a probability weighted discounted using the Company’s estimated cost of capital.
Balance at the beginning of the period | $ | 451 | ||
Payments | (224 | ) | ||
Balance at the end of the period | $ | 227 | ||
47
Property, plant and equipment are stated at cost and are depreciated and amortized over a period of three to 39 years generally under the straight-line method for financial reporting purposes and accelerated methods for income tax purposes.
Property, plant and equipment as of December 31 were as follows (in thousands):
|
| 2023 |
|
| 2022 |
| ||
Land |
| $ | 3,600 |
|
| $ | 3,600 |
|
Buildings and improvements |
|
| 82,861 |
|
|
| 73,520 |
|
Machinery and equipment |
|
| 282,084 |
|
|
| 271,021 |
|
Furniture and fixtures |
|
| 14,346 |
|
|
| 15,297 |
|
Construction in-progress and deposits |
|
| 17,723 |
|
|
| 52,937 |
|
|
| 400,614 |
|
|
| 416,375 |
| |
Accumulated depreciation and amortization |
|
| (250,315 | ) |
|
| (258,570 | ) |
Right of use asset - net |
|
| 7,390 |
|
|
| 8,204 |
|
Net balance |
| $ | 157,689 |
|
| $ | 166,009 |
|
2020 | 2019 | |||||||
Land | $ | 3,600 | $ | 3,600 | ||||
Buildings and improvements | 45,905 | 45,791 | ||||||
Machinery and equipment | 233,635 | 220,405 | ||||||
Furniture and fixtures | 8,429 | 8,231 | ||||||
Construction in-progress and deposits | 17,987 | 4,362 | ||||||
| 309,556 | 282,389 | |||||||
Accumulated depreciation and amortization | (239,162 | ) | (229,698 | ) | ||||
Right of use asset — net | 4,449 | 4,261 | ||||||
Net balance | $ | 74,843 | $ | 56,952 | ||||
Depreciation expense for the years ended December 31, 2020, 20192023, 2022 and 20182021 was approximately $10,950,000, $10,226,000,$17,174,000, $13,701,000, and $9,135,0002020,2023, the Company had approximately $13,141,000$15,014,000 of capital expenditure commitments.
On August 9, 2022, Congress enacted a 25 percent tax credit for investment in semiconductor manufacturing to incentivize domestic semiconductor production. The Advanced Manufacturing Investment Tax Credit ("ITC") was enacted as part of the Creating Helpful Incentives to Produce Semiconductors Act in response to supply chain disruptions.
The Company has undergone a study of its 2023 capital expenditures to determine which additions would qualify under the ITC guidance and which would not. The Company believes that it does comply with the grant conditions supported by the study and that the grant will be received based on meeting these conditions.
The Company recorded in the year ended December 31, 2023 an Other current asset for the associated value of the ITC credit receivable of $13,248,000, with a corresponding offset to the Property, plant and equipment line item on its Consolidated Balance Sheet. The Company expects to receive the ITC credit in the form of a cash refund shortly after filing its 2023 tax return.
Patent costs, which are included in Other assets in the accompanying Consolidated Balance Sheets, as of December 31 were as follows (in thousands):
|
| 2023 |
|
| 2022 |
| ||
Patent costs |
| $ | 900 |
|
| $ | 1,030 |
|
Accumulated amortization |
|
| (708 | ) |
|
| (772 | ) |
| $ | 192 |
|
| $ | 258 |
| |
2020 | 2019 | |||||||
Patent costs | $ | 1,859 | $ | 1,992 | ||||
Accumulated amortization | (1,434 | ) | (1,483 | ) | ||||
| $ | 425 | $ | 509 | |||||
Definite lived intangible assets, such as patent rights, are amortized and tested for impairment if a triggering event occurs.
As of December 31, 2023 and 2022, we had $11,712,000 and $3,202,000, respectively, of capitalized internal-use software costs which have not been amortized as the software has not yet been placed in service.
Amortization expense was approximately $106,000, $108,000$66,000, $75,000 and $119,000$96,000 in 2020, 20192023, 2022, and 2018,2021, respectively. The estimated future amortization expense from patent assets held as of December 31, 2020, is projected to be $96,000, $64,000, $54,000, $46,000 and $33,000, in fiscal years 2021, 2022, 2023, 2024, and 2025, respectively.
48
Product warranty activity for the years ended December 31 was as follows (in thousands):
|
| 2023 |
|
| 2022 |
|
| 2021 |
| |||
Balance at the beginning of the period |
| $ | 497 |
|
| $ | 292 |
|
| $ | 308 |
|
Accruals for warranties for products sold in the period |
|
| 1,353 |
|
|
| 376 |
|
|
| 158 |
|
Fulfillment of warranty obligations |
|
| (815 | ) |
|
| (131 | ) |
|
| (151 | ) |
Revisions of estimated obligations |
|
| (1 | ) |
|
| (40 | ) |
|
| (23 | ) |
Balance at the end of the period |
| $ | 1,034 |
|
| $ | 497 |
|
| $ | 292 |
|
2020 | 2019 | 2018 | ||||||||||
Balance at the beginning of the period | $ | 372 | $ | 268 | $ | 290 | ||||||
Accruals for warranties for products sold in the period | 366 | 250 | 173 | |||||||||
Fulfillment of warranty obligations | (398 | ) | (140 | ) | (117 | ) | ||||||
Revisions of estimated obligations | (32 | ) | (6 | ) | (78 | ) | ||||||
Balance at the end of the period | $ | 308 | $ | 372 | $ | 268 | ||||||
Each share of Common Stock entitles the holder thereof to one vote on all matters submitted to the stockholders.
Each share of Class B Common Stock entitles the holder thereof to ten votes on all such matters.
Shares of Class B Common Stock are not transferable by a stockholder except to or among the stockholder’s spouse, certain of the stockholder’s relatives, and certain other defined transferees. Class B Common Stock is not listed or traded on any exchange or in any market. Class B Common Stock is convertible at the option of the holder thereof at any time and without cost to the stockholder into shares of Common Stock on a
In November 2000, the Board of Directors of the Company authorized the repurchase of up to $30,000,000$30,000,000 of the Company’s Common Stock (the “November 2000 Plan”). The plan authorizes the Company to make repurchases from time to time in the open market or through privately negotiated transactions. The timing of this program and the amount of the stock that may be repurchased is at the discretion of management based on its view of economic and financial market conditions. There were 0no repurchases under the November 2000 Plan in 2020, 2019,2023, 2022, and 2018.2021. On December 31, 2020,2023, the Company had approximately $8,541,000$8,541,000 available for share repurchases under the November 2000 Plan.
Dividends are declared at the discretion of the Company’s Board of Directors and depend on actual cash from operations, the Company’s financial condition and capital requirements and any other factors the Company’s Board of Directors may consider relevant at the time. Common Stock and Class B Common Stock participate in dividends and earnings equally.
On December 31, 2020, 2019,2023, 2022, and 2018, 2021, there were 21,852,334, 20,895,747,20,703,238, 21,080,950, and 21,233,659,21,268,027, respectively, shares of Vicor Common Stock reserved for issuance upon exercise of Vicor stock options, upon conversion of Class B Common Stock and under the ESPP.
10. REVENUES
The following tables present the Company’s net revenues disaggregated by geography based on the location of the customer, by product line (in thousands):
|
| Year Ended December 31, 2023 |
| |||||||||
|
| Brick |
|
| Advanced |
|
| Total |
| |||
United States |
| $ | 82,400 |
|
| $ | 67,056 |
|
| $ | 149,456 |
|
Europe |
|
| 31,792 |
|
|
| 27,950 |
|
|
| 59,742 |
|
Asia Pacific |
|
| 63,631 |
|
|
| 128,636 |
|
|
| 192,267 |
|
All other |
|
| 3,343 |
|
|
| 251 |
|
|
| 3,594 |
|
|
| $ | 181,166 |
|
| $ | 223,893 |
|
| $ | 405,059 |
|
Twelve Months Ended December 31, 2020 | ||||||||||||
Brick Products | Advanced Products | Total | ||||||||||
United States | $ | 80,065 | $ | 25,493 | $ | 105,558 | ||||||
Europe | 23,491 | 6,641 | 30,132 | |||||||||
Asia Pacific | 83,985 | 73,899 | 157,884 | |||||||||
All other | 2,715 | 287 | 3,002 | |||||||||
| $ | 190,256 | $ | 106,320 | $ | 296,576 | |||||||
Twelve Months Ended December 31, 2019 | ||||||||||||
Brick Products | Advanced Products | Total | ||||||||||
United States | $ | 98,822 | $ | 22,806 | $ | 121,628 | ||||||
Europe | 22,172 | 5,090 | 27,262 | |||||||||
Asia Pacific | 62,720 | 46,107 | 108,827 | |||||||||
All other | 4,182 | 1,078 | 5,260 | |||||||||
| $ | 187,896 | $ | 75,081 | $ | 262,977 | |||||||
Twelve Months Ended December 31, 2018 | ||||||||||||
Brick Products | Advanced Products | Total | ||||||||||
United States | $ | 77,995 | $ | 32,784 | $ | 110,779 | ||||||
Europe | 23,484 | 4,205 | 27,689 | |||||||||
Asia Pacific | 80,097 | 66,981 | 147,078 | |||||||||
All other | 5,128 | 546 | 5,674 | |||||||||
| $ | 186,704 | $ | 104,516 | $ | 291,220 | |||||||
49
VICOR CORPORATION
Notes to Consolidated Financial Statements
|
| Year Ended December 31, 2022 |
| |||||||||
|
| Brick |
|
| Advanced |
|
| Total |
| |||
United States |
| $ | 76,306 |
|
| $ | 53,116 |
|
| $ | 129,422 |
|
Europe |
|
| 27,856 |
|
|
| 10,522 |
|
|
| 38,378 |
|
Asia Pacific |
|
| 49,076 |
|
|
| 179,259 |
|
|
| 228,335 |
|
All other |
|
| 2,520 |
|
|
| 424 |
|
|
| 2,944 |
|
|
| $ | 155,758 |
|
| $ | 243,321 |
|
| $ | 399,079 |
|
|
| Year Ended December 31, 2021 |
| |||||||||
|
| Brick |
|
| Advanced |
|
| Total |
| |||
United States |
| $ | 74,280 |
|
| $ | 44,360 |
|
| $ | 118,640 |
|
Europe |
|
| 32,762 |
|
|
| 5,145 |
|
|
| 37,907 |
|
Asia Pacific |
|
| 80,344 |
|
|
| 120,459 |
|
|
| 200,803 |
|
All other |
|
| 1,758 |
|
|
| 256 |
|
|
| 2,014 |
|
|
| $ | 189,144 |
|
| $ | 170,220 |
|
| $ | 359,364 |
|
The following tables present the Company’s net revenues disaggregated by the category of revenue, by product line (in thousands):
|
| Year Ended December 31, 2023 |
| |||||||||
|
| Brick |
|
| Advanced |
|
| Total |
| |||
Direct customers, contract manufacturers and non-stocking |
| $ | 113,448 |
|
| $ | 163,549 |
|
| $ | 276,997 |
|
Stocking distributors, net of sales allowances |
|
| 66,544 |
|
|
| 29,893 |
|
|
| 96,437 |
|
Non-recurring engineering |
|
| 1,174 |
|
|
| 13,421 |
|
|
| 14,595 |
|
Royalties |
|
| — |
|
|
| 15,872 |
|
|
| 15,872 |
|
Other |
|
| — |
|
|
| 1,158 |
|
|
| 1,158 |
|
|
| $ | 181,166 |
|
| $ | 223,893 |
|
| $ | 405,059 |
|
|
| Year Ended December 31, 2022 |
| |||||||||
|
| Brick |
|
| Advanced |
|
| Total |
| |||
Direct customers, contract manufacturers and non-stocking |
| $ | 102,905 |
|
| $ | 216,685 |
|
| $ | 319,590 |
|
Stocking distributors, net of sales allowances |
|
| 51,819 |
|
|
| 13,831 |
|
|
| 65,650 |
|
Non-recurring engineering |
|
| 1,034 |
|
|
| 9,933 |
|
|
| 10,967 |
|
Royalties |
|
| — |
|
|
| 2,801 |
|
|
| 2,801 |
|
Other |
|
| — |
|
|
| 71 |
|
|
| 71 |
|
|
| $ | 155,758 |
|
| $ | 243,321 |
|
| $ | 399,079 |
|
|
| Year Ended December 31, 2021 |
| |||||||||
|
| Brick |
|
| Advanced |
|
| Total |
| |||
Direct customers, contract manufacturers and |
| $ | 139,099 |
|
| $ | 144,180 |
|
| $ | 283,279 |
|
Stocking distributors, net of sales allowances |
|
| 49,359 |
|
|
| 14,123 |
|
|
| 63,482 |
|
Non-recurring engineering |
|
| 686 |
|
|
| 10,027 |
|
|
| 10,713 |
|
Royalties |
|
| — |
|
|
| 1,819 |
|
|
| 1,819 |
|
Other |
|
| — |
|
|
| 71 |
|
|
| 71 |
|
|
| $ | 189,144 |
|
| $ | 170,220 |
|
| $ | 359,364 |
|
50
Twelve Months Ended December 31, 2020 | ||||||||||||
Brick Products | Advanced Products | Total | ||||||||||
Direct customers, contract manufacturers and non-stocking distributors | $ | 160,004 | $ | 91,405 | $ | 251,409 | ||||||
Stocking distributors, net of sales allowances | 29,411 | 8,510 | 37,921 | |||||||||
Non-recurring engineering | 841 | 6,181 | 7,022 | |||||||||
Royalties | — | 152 | 152 | |||||||||
Other | — | 72 | 72 | |||||||||
| $ | 190,256 | $ | 106,320 | $ | 296,576 | |||||||
Twelve Months Ended December 31, 2019 | ||||||||||||
Brick Products | Advanced Products | Total | ||||||||||
Direct customers, contract manufacturers and non-stocking distributors | $ | 159,135 | $ | 63,567 | $ | 222,702 | ||||||
Stocking distributors, net of sales allowances | 27,797 | 9,802 | 37,599 | |||||||||
Non-recurring engineering | 843 | 1,614 | 2,457 | |||||||||
Royalties | 121 | 24 | 145 | |||||||||
Other | — | 74 | 74 | |||||||||
| $ | 187,896 | $ | 75,081 | $ | 262,977 | |||||||
Twelve Months Ended December 31, 2018 | ||||||||||||
Brick Products | Advanced Products | Total | ||||||||||
Direct customers, contract manufacturers and non-stocking distributors | $ | 163,206 | $ | 91,579 | $ | 254,785 | ||||||
Stocking distributors, net of sales allowances | 22,362 | 9,370 | 31,732 | |||||||||
Non-recurring engineering | 1,066 | 3,356 | 4,422 | |||||||||
Royalties | 70 | 140 | 210 | |||||||||
Other | — | 71 | 71 | |||||||||
| $ | 186,704 | $ | 104,516 | $ | 291,220 | |||||||
The following table presents the changes in certain contract assets and (liabilities) (in thousands):
|
| December 31, 2023 |
|
| December 31, 2022 |
|
| Change |
| |||
Short-term deferred revenue and customer prepayments |
| $ | (3,157 | ) |
| $ | (13,197 | ) |
| $ | 10,040 |
|
Long-term deferred revenue |
|
| (1,020 | ) |
|
| (145 | ) |
|
| (875 | ) |
Deferred expenses |
|
| — |
|
|
| 577 |
|
|
| (577 | ) |
Sales allowances |
|
| (3,482 | ) |
|
| (1,661 | ) |
|
| (1,821 | ) |
December 31, 2020 | December 31, 2019 | Change | ||||||||||
Accounts receivable | $ | 40,999 | $ | 38,115 | $ | 2,884 | ||||||
Short-term deferred revenue and customer prepayments | (7,309 | ) | (5,507 | ) | (1,802 | ) | ||||||
Long-term deferred revenue | (733 | ) | (1,054 | ) | 321 | |||||||
Deferred expenses | 1,650 | 1,897 | (247 | ) | ||||||||
Sales allowances | (597 | ) | (741 | ) | 144 | |||||||
Deferred expenses are included in Other current assets, in the accompanying Consolidated Balance Sheets.
2020 | 2019 | 2018 | ||||||||||
United States | $ | 105,558 | $ | 121,628 | $ | 110,779 | ||||||
Europe | 30,132 | 27,262 | 27,689 | |||||||||
Asia Pacific | 157,884 | 108,827 | 147,078 | |||||||||
All other | 3,002 | 5,260 | 5,674 | |||||||||
| $ | 296,576 | $ | 262,977 | $ | 291,220 | |||||||
During 2020, 2019,2023, 2022, and 2018, 12021, one customer accounted for approximately 18.5%10.7%, 12.7%12.4%, and 13.4%14.9% of net revenues, respectively, which included net revenues from both business product lines in each of the three years.
Net revenues from customers in Taiwan accounted for approximately 14.6% of total net revenues in 2023, 26.4% in 2022 and 16.1% in 2021, respectively.
Net revenues from customers in China (including Hong Kong), the Company’s largest international market, accounted for approximately 31.4%17.7% of total net revenues in 2020, 22.1%2023, 18.8% in 20192022 and 37.4%27.5% in 2018,2021, respectively.
Vicor currently grants options for the purchase of Common Stock (i.e., “stock options”) under the following equity compensation plans that are stockholder-approved:
Amended and Restated 2000 Stock Option and Incentive Plan, as amended and restated (the “2000 Plan”)
Vicor Corporation 2017 Employee Stock Purchase Plan (the “Plan” or the “ESPP”)
51
VICOR CORPORATION
Notes to Consolidated Financial Statements
Stock-based compensation expense for the years ended December 31 was a privately held, majority-owned subsidiaryas follows (in thousands):
|
| 2023 |
|
| 2022 |
|
| 2021 |
| |||
Cost of revenues |
| $ | 2,429 |
|
| $ | 1,648 |
|
| $ | 1,000 |
|
Selling, general and administrative |
|
| 6,829 |
|
|
| 5,735 |
|
|
| 3,873 |
|
Research and development |
|
| 3,611 |
|
|
| 2,881 |
|
|
| 2,162 |
|
Total stock-based compensation |
| $ | 12,869 |
|
| $ | 10,264 |
|
| $ | 7,035 |
|
Compensation expense by type of 2023 2022 2021 Stock options $ 11,585 $ 9,093 $ 6,122 ESPP 1,284 1,171 913 Total stock-based compensation $ 12,869 $ 10,264 $ 7,035 Vicor until June 28, 2019, at which date itaward for the years ended December 31 was merged with and into Vicor, and its separate corporate existence ceased (see Note 18). Until that time, VI Chip could grant stock options under theVI Chip Corporation Amended and Restated 2007 Stock Option and Incentive Planas follows (in thousands):(the “2007 VI Chip Plan”), that had been approved by its Board of Directors. All awards thereunder were approved by the Compensation Committee of the Company’s Board of Directors. To effect the merger, holders of VI Chip Common Stock and VI Chip stock options received an equivalent value of Vicor Common Stock and Vicor stock options, respectively, pursuant (with respect to the stock options) to the assumption of the 2007 VI Chip Plan, and options outstanding thereunder, by Vicor. No additional awards will be granted under the assumed and restated 2007 VI Chip Plan.
All time-based (i.e.,atwith an exercise price equal to or greater than the market price for Vicor Common Stock at the date of the grant. All time-based (i.e.,non-performance-based)options for the purchase of VI Chip Common Stock and Picor Common Stock prior to the mergers and assumptions of the 2007 VI Chip Plan and of the 2001 Picor Plan, respectively, had been granted at an exercise price equal to or greater than the estimated fair market value of the respective share price, based on valuation methodologies consistent with U.S. GAAP and the requirements of Section 409A of the Internal Revenue Code, as amended (the “Code”).
2020 | 2019 | 2018 | ||||||||||
Cost of revenues | $ | 934 | $ | 342 | $ | 237 | ||||||
Selling, general and administrative | 3,164 | 1,979 | 2,517 | |||||||||
Research and development | 1,785 | 715 | 642 | |||||||||
Total stock-based compensation | $ | 5,883 | $ | 3,036 | $ | 3,396 | ||||||
2020 | 2019 | 2018 | ||||||||||
Stock options | $ | 4,982 | $ | 2,072 | $ | 2,649 | ||||||
ESPP | 901 | 964 | 747 | |||||||||
Total stock-based compensation | $ | 5,883 | $ | 3,036 | $ | 3,396 | ||||||
|
| 2023 |
|
| 2022 |
|
| 2021 |
| |||
Risk-free interest rate |
|
| 3.7 | % |
|
| 2.8 | % |
|
| 0.8 | % |
Expected dividend yield |
|
| — |
|
|
| — |
|
|
| — |
|
Expected volatility |
|
| 54 | % |
|
| 51 | % |
|
| 49 | % |
Expected term (years) |
|
| 4.2 |
|
|
| 4.4 |
|
|
| 4.9 |
|
2020 | 2019 | 2018 | ||||||||||
Risk-free interest rate | 0.5 | % | 1.8 | % | 2.9 | % | ||||||
Expected dividend yield | — | — | — | |||||||||
Expected volatility | 48 | % | 42 | % | 44 | % | ||||||
Expected lives (years) | 6.1 | 6.3 | 6.4 | |||||||||
Risk-free interest rate:
The Company uses the yield on
Expected dividend yield:
The Company determines the expected dividend yield by annualizing the most recent prior cash dividends declared by the Company’s Board of Directors, if any, and dividing that result by the closing stock price on the date of that dividend declaration. Dividends are not paid on options.
Expected volatility:
Vicor uses historical volatility to estimate the grant-date fair value of the options, using the expected term for the period over which to calculate the volatility (see below). The Company does not expect its future volatility to differ from its historical volatility. The computation of the Company’s volatility is based on a simple average calculation of monthly volatilities over the expected term.
Expected term:
The Company uses historical employee exercise and option expiration data to estimate the expected term assumption for the Black-Scholes grant-date valuation. The Company believes this historical data is currently the best estimate of the expected term of options, and all groups of the Company’s employees exhibit similar exercise behavior.
Forfeiture rate:
The amount of stock-based compensation recognized during a period is based on the value of the portion of the awards
52
that are ultimately expected to vest. Forfeitures are estimated at the time of grant and revised, if necessary, in subsequent periods if actual forfeitures differ from those estimates. The term “forfeitures” is distinct from “cancellations” or “expirations” and represents only the unvested portion of the surrendered option. The forfeiture analysis is
Based on an analysis of historical forfeitures, the Company applied an annual forfeiture rate of 5.25%
A summary of the activity under the 2000 Plan as of December 31, 20202023 and changes during the year then ended, is presented below (in thousands except for share and weighted-average data):
|
| Options |
|
| Weighted- |
|
| Weighted- |
|
| Aggregate |
| ||||
|
|
|
|
|
|
|
|
|
|
|
| |||||
Outstanding on December 31, 2022 |
|
| 2,024,664 |
|
| $ | 41.48 |
|
|
|
|
|
|
| ||
Granted |
|
| 918,161 |
|
| $ | 42.76 |
|
|
|
|
|
|
| ||
Forfeited and expired |
|
| (79,500 | ) |
| $ | 53.67 |
|
|
|
|
|
|
| ||
Exercised |
|
| (308,083 | ) |
| $ | 25.31 |
|
|
|
|
|
|
| ||
Outstanding on December 31, 2023 |
|
| 2,555,242 |
|
| $ | 43.51 |
|
|
| 3.90 |
|
| $ | 27,948 |
|
Exercisable on December 31, 2023 |
|
| 973,894 |
|
| $ | 27.39 |
|
|
| 2.10 |
|
| $ | 24,781 |
|
Vested or expected to vest as of December 31, |
|
| 2,404,726 |
|
| $ | 43.04 |
|
|
| 3.79 |
|
| $ | 27,619 |
|
Options Outstanding | Weighted- Average Exercise Price | Weighted- Average Remaining Contractual Life in Years | Aggregate Intrinsic Value | |||||||||||||
Outstanding on December 31, 2019 | 2,687,896 | $ | 10.81 | |||||||||||||
Granted | 354,075 | $ | 68.34 | |||||||||||||
Forfeited and expired | (69,987 | ) | $ | 23.77 | ||||||||||||
Exercised | (948,507 | ) | $ | 9.62 | ||||||||||||
Outstanding on December 31, 2020 | 2,023,477 | $ | 20.98 | 4.87 | $ | 144,153 | ||||||||||
Exercisable on December 31, 2020 | 924,964 | $ | 9.05 | 3.41 | $ | 76,932 | ||||||||||
Vested or expected to vest as of December 31, 2020(1) | 1,947,127 | $ | 20.22 | 4.79 | $ | 140,186 | ||||||||||
As of December 31, 20192022 and 20182021, the Company had options exercisable for 1,475,9471,046,092 and 888,257776,559 shares, respectively, for which the weighted average exercise prices were $8.74$18.26 and $8.93,$11.63, respectively.
During the years ended December 31, 2020, 2019,2023, 2022, and 2018,2021, the total intrinsic value of Vicor options exercised (i.e., the difference between the market price at exercise and the price paid by the employee to exercise the options) was approximately $50,410,000, $6,636,000,$14,396,000, $7,252,000, and $22,938,000,$56,933,000, respectively. The total amount of cash received by the Company from options exercised in 2020, 2019,2023, 2022, and 2018,2021 was $9,127,000, $2,437,000,$7,798,000, $1,634,000, and $6,782,000,$7,616,000, respectively. The total grant-date fair value of stock options granted during the years ended December 31, 2020, 2019,2023, 2022, and 20182021 was approximately $10,847,000, $1,657,000,$17,957,000, $15,087,000, and $2,921,000,$10,506,000, respectively.
As of December��December 31, 2020,2023, there was approximately $9,758,000$23,179,000 of total unrecognized compensation cost related to unvestednon-performancebased awards for Vicor. That cost is expected to be recognized over a weighted-average period of 1.62.1 years for those awards. The expense will be recognized as follows: $4,656,000 in 2021, $2,741,000 in 2022, $1,396,000 in 2023, $682,000$11,028,000 in 2024, $6,730,000 in 2025, $3,638,000 in 2026, $1,473,000 in 2027, and $283,000$310,000 in 2025.
The weighted-average fair value of Vicor options granted was $30.63, $14.30,$19.56, $26.53, and $17.46,$39.27, in 2020, 2019,2023, 2022, and 2018,2021, respectively.
401(k) Plan
The Company sponsors a savings plan available to all domestic employees, which qualifies under Section 401(k) of the Code. Employees may contribute to the plan in amounts representing from 1%1% to 80%80% of their
53
statutory limitations. The Company matches employee contributions to the plan at a rate of 50%, up to the first 3%6% of an employee’s compensation. The Company’s matching contributions currently vest at a rate of 20%20% per year, based upon years of service. The Company’s contributions to the plan were approximately $1,031,000, $1,001,000,$2,317,000, $2,211,000, and $976,000$1,593,000 in 2020, 2019,2023, 2022, and 2018,2021, respectively.
Stock Bonus Plan
Under the Company’s 1985 Stock Bonus Plan, as amended, shares of Common Stock may be awarded to employees from time to time as determined by the Board of Directors. On December 31, 2020, 2023, 109,964 shares were available for further award. All shares awarded to employees under this plan have vested. No further awards are contemplated under this plan at the present time.
Substantially all of the Company’s leases are classified as operating leases. The majority of the Company’s leases are for office and manufacturing space, along with several automobiles and certain equipment. Leases with initial terms of less than twelve months are not recorded on the balance sheet. Expense for these leases is recognized on a straight-line basis over the lease term. The Company’s leases have remaining terms of less than one year to just over six years.11 years. The majority of the Company’s leases do not have options to renew, although several have renewal terms to extend the lease for one five-year term, and one lease contains two five-year renewal options. None of the renewal options are included in determining the term of the lease, used for calculating the associated lease liabilities. None of the Company’s leases include variable payments, residual value guarantees or restrictive covenants. A number of the Company’s leases for office and manufacturing space include provisionprovisions for common area maintenance (“CAM”). The Company accounts for CAM separately from lease payments, and therefore costs for CAM are not included in the determination of lease liabilities. The Company is a party to one arrangement as the lessor, for its facility located in Sunnyvale, California, with a third party. The lessee under this lease has one option to renew the lease for a term of five years.
As of December 31, 2020,2023, the balance of right of use (“ROU”) assets was approximately $4,449,000,$7,390,000, and the balances of short-term and long-term lease liabilities were approximately $1,629,000$1,864,000 and $2,968,000,$6,364,000, respectively. For the year ended December 31, 2020,2023, the Company recorded operating lease cost, including short-term lease cost, of approximately $1,943,000$2,138,000 ($1,870,0002,130,000 in 2019)2022). The ROU assets are included in “Property, plant and equipment, net” in the accompanying Consolidated Balance Sheets.
The maturities of the Company’s lease liabilities are as follows (in thousands):
2024 |
| $ | 1,959 |
|
2025 |
|
| 1,821 |
|
2026 |
|
| 1,208 |
|
2027 |
|
| 837 |
|
2028 and beyond |
|
| 3,881 |
|
Total lease payments |
| $ | 9,706 |
|
Less: Imputed interest |
|
| 1,478 |
|
Present value of lease liabilities |
| $ | 8,228 |
|
2021 | $ | 1,740 | ||
2022 | 1,316 | |||
2023 | 883 | |||
2024 | 663 | |||
2025 | 317 | |||
Total lease payments | $ | 4,919 | ||
Less: Imputed interest | 322 | |||
Present value of lease liabilities | $ | 4,597 | ||
As of December 31, 2020,2023, the weighted-average remaining lease term was 3.46.8 years and the weighted-average discount rate was 3.00%4.22% for the Company’s operating leases. The Company developed the discount rates used based on a London Interbank OfferedSecured Overnight Financing Rate (“LIBOR”SOFR”) over a term approximating the term of the related lease, plus an additional interest factor, which was generally 1.375%1.25%.
For the years ended December 31, 20202023 and December 31, 2019,2022, the Company paid approximately
54
VICOR CORPORATION
Notes to Consolidated Financial Statements
The maturities of the lease payments to be received by the Company under the lease agreement for its leased facility in California are as follows (in thousands):
|
|
|
| |
2024 |
| $ | 402 |
|
Total lease payments to be received |
| $ | 402 |
|
2021 | $ | 901 | ||
2022 | 928 | |||
2023 | 955 | |||
2024 | 402 | |||
Total lease payments to be received | $ | 3,186 | ||
The Company recorded net lease income under this lease of approximately
The major changes in the components of Other income (expense), net for the years ended December 31 were as follows (in thousands):
|
| 2023 |
|
| 2022 |
|
| 2021 |
| |||
Interest income, net |
| $ | 8,217 |
|
| $ | 1,313 |
|
| $ | 930 |
|
Rental income, net |
| 792 |
|
| 792 |
|
| 792 |
| |||
Foreign currency losses, net |
|
| (161 | ) |
|
| (653 | ) |
|
| (336 | ) |
Other, net |
| 38 |
|
| 34 |
|
|
| (183 | ) | ||
| $ | 8,886 |
|
| $ | 1,486 |
|
| $ | 1,203 |
| |
In 2022, “Interest income, net” includes an immaterial error correction of $834,000 related to the amortization of bond premiums on available-for-sale securities.
2020 | 2019 | 2018 | ||||||||||
Rental income, net | $ | 792 | $ | 792 | $ | 792 | ||||||
Foreign currency gains (losses), net | 181 | (108 | ) | (260 | ) | |||||||
Interest income | 95 | 300 | 257 | |||||||||
Gain on disposal of equipment | 13 | 38 | 57 | |||||||||
Credit gains on available-for-sale | 4 | 4 | 7 | |||||||||
Other | 8 | 40 | 21 | |||||||||
| �� | ||||||||||||
| $ | 1,093 | $ | 1,066 | $ | 874 | |||||||
The tax provision includes estimated federal, state and foreign income taxes on the Company’s
The reconciliation of the federal statutory rate on the income (loss) before income taxes to the effective income tax rate for the years ended December 31 is as follows:
|
| 2023 |
|
| 2022 |
|
| 2021 |
| |||
Statutory federal tax rate |
|
| 21.0 | % |
|
| 21.0 | % |
|
| 21.0 | % |
State income taxes, net of federal income tax benefit |
|
| (0.6 | ) |
|
| (2.4 | ) |
|
| (4.2 | ) |
Increase in valuation allowance |
|
| 7.4 |
|
|
| 14.5 |
|
|
| 9.2 |
|
Permanent items |
|
| (8.5 | ) |
|
| (13.8 | ) |
|
| (17.9 | ) |
Tax credits |
|
| (5.9 | ) |
|
| (9.9 | ) |
|
| (5.7 | ) |
Provision vs. tax return differences |
|
| (1.9 | ) |
|
| 2.1 |
|
|
| (2.0 | ) |
Foreign rate differential and deferred items |
|
| 0.1 |
|
|
| (0.2 | ) |
|
| — |
|
Other |
|
| (0.6 | ) |
|
| 0.1 |
|
|
| (0.1 | ) |
|
| 11.0 | % |
|
| 11.4 | % |
|
| 0.3 | % | |
2020 | 2019 | 2018 | ||||||||||
Statutory federal tax rate | 21.0 | % | 21.0 | % | 21.0 | % | ||||||
State income taxes, net of federal income tax benefit | (0.5 | ) | (8.1 | ) | 3.6 | |||||||
Increase (decrease) in valuation allowance | 41.2 | 2.2 | (9.1 | ) | ||||||||
Permanent items | (48.7 | ) | (3.9 | ) | (5.9 | ) | ||||||
Tax credits | (11.2 | ) | (15.6 | ) | (5.5 | ) | ||||||
Provision vs. tax return differences | 0.7 | 9.0 | (1.7 | ) | ||||||||
Foreign rate differential and deferred items | 0.1 | 0.6 | 0.7 | |||||||||
Change in tax reserves | — | — | 0.1 | |||||||||
Other | 0.3 | — | 0.1 | |||||||||
| 2.9% | 5.2% | 3.3% | ||||||||||
In 2020, the Company was in a taxable loss position which generated a net operating loss carryforward, primarily due to tax deductions on 2020 exercises of stock-based compensation of approximately $49,500,000.
For financial reporting purposes, income before income taxes for the years ended December 31 include the following components (in thousands):
55
|
| 2023 |
|
| 2022 |
|
| 2021 |
| |||
Domestic |
| $ | 59,528 |
|
| $ | 29,157 |
|
| $ | 56,620 |
|
Foreign |
|
| 716 |
|
|
| (470 | ) |
|
| 185 |
|
|
| $ | 60,244 |
|
| $ | 28,687 |
|
| $ | 56,805 |
|
2020 | 2019 | 2018 | ||||||||||
Domestic | $ | 17,688 | $ | 13,493 | $ | 31,455 | ||||||
Foreign | 773 | 1,394 | 1,478 | |||||||||
| $ | 18,461 | $ | 14,887 | $ | 32,933 | |||||||
Significant components of the provision (benefit) for income taxes for the years ended December 31 are as follows (in thousands):
|
| 2023 |
|
| 2022 |
|
| 2021 |
| |||
Current: |
|
|
|
|
|
|
|
|
| |||
Federal |
| $ | 4,814 |
|
| $ | 2,105 |
|
| $ | 1 |
|
State |
|
| 1,655 |
|
|
| 955 |
|
|
| (14 | ) |
Foreign |
|
| 209 |
|
|
| 298 |
|
|
| 171 |
|
|
| 6,678 |
|
|
| 3,358 |
|
|
| 158 |
| |
Deferred: |
|
|
|
|
|
|
|
|
| |||
Foreign |
|
| (34 | ) |
|
| (97 | ) |
|
| 18 |
|
|
| (34 | ) |
|
| (97 | ) |
|
| 18 |
| |
| $ | 6,644 |
|
| $ | 3,261 |
|
| $ | 176 |
| |
2020 | 2019 | 2018 | ||||||||||
Current: | ||||||||||||
Federal | $ | 215 | $ | — | $ | — | ||||||
State | 93 | 268 | 231 | |||||||||
Foreign | 252 | 450 | 911 | |||||||||
| 560 | 718 | 1,142 | ||||||||||
Deferred: | ||||||||||||
Foreign | (21 | ) | 60 | (55 | ) | |||||||
| (21 | ) | 60 | (55 | ) | ||||||||
| $ | 539 | $ | 778 | $ | 1,087 | |||||||
Significant components of the Company’s deferred tax assets and liabilities as of December 31 were as follows (in thousands):
|
| 2023 |
|
| 2022 |
| ||
Deferred tax assets: |
|
|
|
|
|
| ||
Research and development tax credit carryforwards |
| $ | 29,619 |
|
| $ | 33,764 |
|
Stock-based compensation |
|
| 5,709 |
|
|
| 3,940 |
|
Inventory reserves |
|
| 3,363 |
|
|
| 2,303 |
|
Investment tax credit carryforwards |
|
| 2,659 |
|
|
| 2,461 |
|
UNICAP |
|
| 1,139 |
|
|
| 1,118 |
|
Vacation accrual |
|
| 1,319 |
|
|
| 1,248 |
|
Lease liabilities |
|
| 1,388 |
|
|
| 1,422 |
|
Capitalized research and development |
|
| 22,621 |
|
|
| 12,142 |
|
Other |
|
| 3,235 |
|
|
| 2,893 |
|
Total deferred tax assets |
|
| 71,052 |
|
|
| 61,291 |
|
Less: Valuation allowance for deferred tax assets |
|
| (52,291 | ) |
|
| (47,413 | ) |
Net deferred tax assets |
|
| 18,761 |
|
|
| 13,878 |
|
Deferred tax liabilities: |
|
|
|
|
|
| ||
Depreciation |
|
| (16,139 | ) |
|
| (11,396 | ) |
ROU assets |
|
| (1,201 | ) |
|
| (1,362 | ) |
Prepaid expenses |
|
| (1,048 | ) |
|
| (751 | ) |
Other |
|
| (77 | ) |
|
| (89 | ) |
Total deferred tax liabilities |
|
| (18,465 | ) |
|
| (13,598 | ) |
Net deferred tax assets (liabilities) |
| $ | 296 |
|
| $ | 280 |
|
2020 | 2019 | |||||||
Deferred tax assets: | ||||||||
Research and development tax credit carryforwards | $ | 29,046 | $ | 27,607 | ||||
Net operating loss carryforwards | 5,923 | 328 | ||||||
Inventory reserves | 2,282 | 1,522 | ||||||
Investment tax credit carryforwards | 1,927 | 2,102 | ||||||
Stock-based compensation | 1,796 | 1,587 | ||||||
Vacation accrual | 1,349 | 1,280 | ||||||
UNICAP | 1,336 | 351 | ||||||
Accrued payroll tax deferral | 764 | — | ||||||
Lease liabilities | 518 | 679 | ||||||
Other | 1,197 | 1,708 | ||||||
Total deferred tax assets | 46,138 | 37,164 | ||||||
Less: Valuation allowance for deferred tax assets | (37,856 | ) | (30,363 | ) | ||||
Net deferred tax assets | 8,282 | 6,801 | ||||||
Deferred tax liabilities: | ||||||||
Depreciation | (6,809 | ) | (5,296 | ) | ||||
Prepaid expenses | (616 | ) | (552 | ) | ||||
ROU assets | (490 | ) | (653 | ) | ||||
Other | (141 | ) | (95 | ) | ||||
Total deferred tax liabilities | (8,056 | ) | (6,596 | ) | ||||
Net deferred tax assets (liabilities) | $ | 226 | $ | 205 | ||||
As of December 31, 2020,2023, the Company hashad a valuation allowance of approximately $37,856,000 WhileDespite recent positive operating results, as a result of increases in bookings, caused the Company to be in a cumulative income position as of December 31, 2020, the Company faces uncertainties in forecasting its operating results due to the continued impact of the COVID-19 pandemic on the Company’svendor supply chain,and factory capacity constraints, certain process issues with the production of Advanced Products, and the unpredictability in certain markets.markets, product transitions, new program introductions and adoption times of new technology offerings. This operating uncertainty also makes it difficult to predict the availability and utilization of tax benefits over the next
56
as of December 31, 2023, it is more likely than not the Company’s net domestic deferred tax assets will not be realized, and a full valuation allowance against all net domestic deferred tax assets is still warranted as of December 31, 2020.2023. The valuation allowance against these deferred tax assets may require adjustment in the future based on changes in the mix of temporary differences, changes in tax laws, and operating performance. If the positive quarterly earnings and increases in bookingsoperating results continue and the Company’s concerns about industry uncertainty and world events, including the impact of theCOVID-19pandemic on the Company’s supply chain,and factory capacity constraints, program adoption and process issues with the production of Advanced Products are resolved, and the amount of tax benefits the Company is able to utilize to the point that the Company believes future taxable income can be more reliably forecasted, the Company may release all or a portion of the valuation allowance in the near-term. Certain state tax credits, though, will likely never be released by the valuation allowance. If and when the Company determines the valuation allowance should be released (i.e., reduced), the adjustment would result in a tax benefit reported in that period’s Consolidated Statements of Operations, the effect of which would be an increase in reported net income.
As of December 31, 2023, the Company had no federal net operating loss carryforwards available, and had state net operating losses of approximately $41,000, which will begin to expire in 2030. The stateCompany has federal and federalstate research and development tax credit carryforwards of approximately $11,344,000$15,546,000 and $19,423,000, respectively,$21,201,000, which will begin to expire beginning in 2020 for state purposes2039 and in 2025 for federal purposes. The Company has federal net operating loss carryforwards generated after 2017 of approximately $24,990,000, which have an indefinite carryforward period and certain state operating loss carryforwards of approximately $10,241,000, which expire beginning in 2024.
A reconciliation of the beginning and ending amount of unrecognized tax benefits is as follows (in thousands):
|
| 2023 |
|
| 2022 |
|
| 2021 |
| |||
Balance on January 1 |
| $ | 3,474 |
|
| $ | 3,246 |
|
| $ | 2,297 |
|
Additions based on tax positions related to the current year |
|
| 650 |
|
|
| 319 |
|
|
| 625 |
|
Additions (reductions) for tax positions of prior years |
|
| 86 |
|
|
| (54 | ) |
|
| 393 |
|
Lapse of statute |
|
| (26 | ) |
|
| (37 | ) |
|
| (69 | ) |
Balance on December 31 |
| $ | 4,184 |
|
| $ | 3,474 |
|
| $ | 3,246 |
|
2020 | 2019 | 2018 | ||||||||||
Balance on January 1 | $ | 2,070 | $ | 1,462 | $ | 1,104 | ||||||
Additions based on tax positions related to the current year | 244 | 571 | 245 | |||||||||
| (Reductions) additions for tax positions of prior years | (13 | ) | 43 | 120 | ||||||||
Lapse of statute | (4 | ) | (6 | ) | (7 | ) | ||||||
Balance on December 31 | $ | 2,297 | $ | 2,070 | $ | 1,462 | ||||||
The Company has reviewed the tax positions taken, or to be taken, in its tax returns for all tax years currently open to examination by a taxing authority. The total amount of unrecognized tax benefits, that is the aggregate tax effect of differences between tax return positions and the benefits recognized in the Company’s financial statements, as of December 31, 2020, 2019,2023, 2022, and 20182021 of $2,297,000, $2,070,000,$4,184,000, $3,474,000, and $1,462,000,$3,246,000, respectively, if recognized, may decrease the Company’s income tax provision and effective tax rate. None of the unrecognized tax benefits as of December 31, 2020,2023 are expected to significantly change during the next twelve months.
The Company recognizes accrued interest and penalties, if any, related to unrecognized tax benefits as a component of income tax expense. During the years ended December 31, 2020, 2019,2023, 2022, and 2018,2021, the Company recognized approximately $17,000, $7,000,$23,000, $17,000, and $7,000,$19,000, respectively, in net interest expense. As of December 31, 20202023 and 2019,2022, the Company had accrued approximately $58,000$67,000 and $41,000,$52,000, respectively, for the potential payment of interest.
The Company files income tax returns in the United States and various foreign tax jurisdictions. These tax returns are generally open to examination by the relevant tax authorities from three to seven years from the date they are filed. The tax filings relating to the Company’s federal and state taxes are currently open to examination for tax years 20172019 through 20192022 and 20112015 through 2019,2022, respectively. In addition, the Company generated
The Company was informed in September 2021 by the Internal Revenue Service of their intention to examine the Company’s 2019 Federal income tax return. The IRS is in the process of closing the examination of the 2019 tax year with no material adjustments. There are no income taxother audits or examinations or audits currently in process.
At December 31, 2023, the Company had approximately $15,014,000 of cancelable and non-cancelable capital expenditure commitments, principally for manufacturing equipment.
57
The Company is the defendant in a patent infringement lawsuit originally filed on January 28, 2011 by SynQor, Inc. (“SynQor”) in the U.S. District Court (the “District Court”) for the Eastern District of Texas (the “Texas Action”).Texas. The complaint, as amended, allegesalleged that the Company’s products, including but not limited to, unregulated bus converters used in intermediate bus architecture power supply systems infringeinfringed SynQor’s U.S. patent numbers 7,072,190, 7,272,021, 7,564,702, and 8,023,290 (“the ‘190 patent”, “the ‘021 patent”, “the ‘702 patent”, and “the ‘290 patent”, respectively). SynQor’s complaint sought an injunction against further infringementrespectively, and an award of unspecified compensatory and enhanced damages, interest, costs and attorney fees.collectively the “SynQor Patents”). The Company has denied that its products infringe any of the SynQor patents, and has asserted that the SynQor patents are invalid and/or unenforceable. The Company has also asserted counterclaims seeking damages fromagainst SynQor for deceptive trade practicesalleging unfair competition and tortious interference with prospective economic advantage arising from SynQor’s attempted enforcement of its patents against the Company.
A trial in the previous IPRx of the ‘702 patent. On August 6, 2018, the Company filed a similar request with the USPTO for EPRx ofDistrict Court began on October 17, 2022 on the asserted claims of the ‘190 patent basedand the ‘702 patent, as well as on different prior art references than had been at issue in the previous IPRx ofCompany’s Counterclaims. The District Court dismissed the Company’s Counterclaims on October 25, 2022. On October 26, 2022, the jury returned a verdict on SynQor’s patent infringement claims, finding that the Company willfully infringed the ‘702 patent, but did not infringe the ‘190 patent. The jury awarded SynQor damages in the amount of $6,500,000 for infringement of the ‘702 patent. All of the SynQor Patents expired in 2018.
On December 18, 2020, the PTAB issued rulings upholding the validity of the asserted claims23, 2022, SynQor filed in the EPRx proceedingsDistrict Court (a) a motion for bothjudgment as a matter of law that the ‘702 and ‘190 patents. Accordingly, both of those proceedings are now terminated.
In accordance with applicable accounting standards, the Company cannotrecorded a litigation related accrual of $6,500,000 in the third quarter of 2022 as its estimate based on the amount of possible loss or range of possible loss at this time.
In addition, to the SynQor matter, the Company is involved in certain other litigation and claims incidental to the conduct of its business.business, both as a defendant and a plaintiff. While the outcome of such other lawsuits and claims against the Company cannot be predicted with certainty, management does not expect any currentsuch litigation or claims will have a material adverse impact on the Company’s financial position or results of operations.
58
ITEM 9. Changes in and Disagreements with a transition in organizational focus, emphasizing investment in Advanced Products, targeting high growth market segments with alow-mix,high-volume operational model, while maintaining a profitable business in mature market segments the Company serves with Brick Products with ahigh-mix,low-volumeoperational model. Dr. VinciarelliAccountants on Accounting and management began to make incremental changes in management practicesFinancial Disclosure
None.
ITEM 9A. Controls and organizational structure based on a management plan established in 2018 for the definitive reconfiguration of the three business units into one business focused on the Advanced Products and Brick Products product line categorizations, including three significant changes: the merger of Picor with and into Vicor, which was completed on May 25, 2018; the reconfiguration of the Company’s internal reporting systems, which was completed on December 31, 2018; and the merger of VI Chip with and into Vicor, which was completed on June 28, 2019. Our CODM now determines the allocation of resources of the Company based upon the two product groupings, which constitute one segment. Both product lines are built in the Company’s manufacturing facility in Andover, Massachusetts employing similar processing and production techniques, and are supported by the same sales and marketing organizations. As such, the Company has conformed the segment reporting to the new reporting structure utilized by the CODM. Accordingly, three-segment information for prior periods has not been presented, to conform with the new presentation.
First | Second | Third | Fourth | Total | ||||||||||||||||
2020: | ||||||||||||||||||||
Net revenues | $ | 63,401 | $ | 70,761 | $ | 78,112 | $ | 84,302 | $ | 296,576 | ||||||||||
Gross margin | 27,331 | 30,318 | 33,347 | 40,451 | 131,447 | |||||||||||||||
Consolidated net (loss) income | (1,731 | ) | 2,672 | 5,786 | 11,195 | 17,922 | ||||||||||||||
Net income attributable to noncontrolling interest | 4 | 5 | 1 | 2 | 12 | |||||||||||||||
Net (loss) income attributable to Vicor Corporation | (1,735 | ) | 2,667 | 5,785 | 11,193 | 17,910 | ||||||||||||||
Net (loss) income per share attributable to Vicor Corporation: | ||||||||||||||||||||
Basic | (0.04 | ) | 0.06 | 0.13 | 0.26 | 0.42 | ||||||||||||||
Diluted | (0.04 | ) | 0.06 | 0.13 | 0.25 | 0.41 | ||||||||||||||
First | Second | Third | Fourth | Total | ||||||||||||||||
2019: | ||||||||||||||||||||
Net revenues | $ | 65,725 | $ | 63,355 | $ | 70,772 | $ | 63,125 | $ | 262,977 | ||||||||||
Gross margin | 31,086 | 29,117 | 33,002 | 29,761 | 122,966 | |||||||||||||||
Consolidated net income | 4,306 | 2,556 | 5,932 | 1,315 | 14,109 | |||||||||||||||
Net income (loss) attributable to noncontrolling interest | 20 | (7 | ) | (5 | ) | 3 | 11 | |||||||||||||
Net income attributable to Vicor Corporation | 4,286 | 2,563 | 5,937 | 1,312 | 14,098 | |||||||||||||||
Net income per share attributable to Vicor Corporation: | ||||||||||||||||||||
Basic | 0.11 | 0.06 | 0.15 | 0.03 | 0.35 | |||||||||||||||
Diluted | 0.10 | 0.06 | 0.14 | 0.03 | 0.34 | |||||||||||||||
Attached as exhibits to this Annual Report onCEOChief Executive Officer ("CEO") and Chief Financial Officer (“CFO”), which are required in accordance with
(a) Evaluation of disclosure controls and procedures
As required by“disclosure"disclosure controls and procedures,”" as defined inCommission’sCommission's rules and forms. Disclosure controls and procedures include, without limitation, controls and procedures designed to ensure that information required to be disclosed by a company in the reports that it files or submits under the Exchange Act is accumulated and communicated to the Company’sCompany's management, including its principal executive and principal financial officers, as appropriate to allow timely decisions regarding required disclosure. We recognize any controls and procedures, no matter how well designed and operated, can provide only reasonable assurance of achieving their objectives and we necessarily apply our judgment in evaluating the cost-benefit relationship of possible controls and procedures. Based on the evaluation of the Company’s disclosure controls and procedures as of December 31, 2020,2023, the CEO and CFO concluded, as of such date, the Company’s disclosure controls and procedures were effective at the reasonable assurance level.
(b) Management’sManagement's Report on Internal Control Over Financial Reporting
Our management is responsible for establishing and maintaining adequate internal control over financial reporting to provide reasonable assurance regarding the reliability of our financial reporting and the preparation of financial statements for external purposes in accordance with generally accepted accounting principles. Internal control over financial reporting includes those policies and procedures: (a) pertaining to the maintenance of records that in reasonable detail accurately and fairly reflect the transactions and dispositions of our assets; (b) providing reasonable assurance that transactions are recorded as necessary to permit preparation of financial statements in accordance with generally accepted accounting principles, and that receipts and expenditures are being made only in accordance with authorizations of our management and Board of Directors; and (c) providing reasonable assurance regarding prevention or timely detection of unauthorized acquisition, use, or disposition of our assets that could have a material effect on our financial statements.
Management assessed our internal control over financial reporting as of December 31, 2020,2023, the end of our fiscal year. Management based its assessment on criteria established in
Based on our assessment, management has concluded that our internal control over financial reporting was effective as of December 31, 2020.
The effectiveness of our internal control over financial reporting as of December 31, 20202023 has been audited by KPMG LLP, our independent registered public accounting firm, as stated in their report which is included immediately below.
59
Report of Independent Registered Public Accounting Firm
To the Stockholders and Board of Directors
Opinion on Internal Control Over Financial Reporting
We have audited Vicor Corporation and subsidiaries’subsidiaries' (the Company) internal control over financial reporting as of December 31, 2020,2023, based on criteria established in2020,2023, based on criteria established in
We also have audited, in accordance with the standards of the Public Company Accounting Oversight Board (United States) (PCAOB), the consolidated balance sheets of the Company as of December 31, 20202023 and 2019,2022, the related consolidated statements of operations, comprehensive income, equity, and cash flows and equity for each of the years in the three-year period ended December 31, 2020,2023, and the related notes and financial statement schedule listed in Item 15(a)(2) (collectively, the consolidated financial statements), and our report dated March 1, 2021February 28, 2024 expressed an unqualified opinion on those consolidated financial statements.
Basis for Opinion
The Company’s management is responsible for maintaining effective internal control over financial reporting and for its assessment of the effectiveness of internal control over financial reporting, included in the accompanying Management’sManagement's Report on Internal Control Over Financial Reporting. Our responsibility is to express an opinion on the Company’s internal control over financial reporting based on our audit. We are a public accounting firm registered with the PCAOB and are required to be independent with respect to the Company in accordance with the U.S. federal securities laws and the applicable rules and regulations of the Securities and Exchange Commission and the PCAOB.
We conducted our audit in accordance with the standards of the PCAOB. Those standards require that we plan and perform the audit to obtain reasonable assurance about whether effective internal control over financial reporting was maintained in all material respects. Our audit of internal control over financial reporting included obtaining an understanding of internal control over financial reporting, assessing the risk that a material weakness exists, and testing and evaluating the design and operating effectiveness of internal control based on the assessed risk. Our audit also included performing such other procedures as we considered necessary in the circumstances. We believe that our audit provides a reasonable basis for our opinion.
Definition and Limitations of Internal Control Over Financial Reporting
A company’s internal control over financial reporting is a process designed to provide reasonable assurance regarding the reliability of financial reporting and the preparation of financial statements for external purposes in accordance with generally accepted accounting principles. A company’s internal control over financial reporting includes those policies and procedures that (1) pertain to the maintenance of records that, in reasonable detail, accurately and fairly reflect the transactions and dispositions of the assets of the company; (2) provide reasonable assurance that transactions are recorded as necessary to permit preparation of financial statements in accordance with generally accepted accounting principles, and that receipts and expenditures of the company are being made only in accordance with authorizations of management and directors of the company; and (3) provide reasonable assurance regarding prevention or timely detection of unauthorized acquisition, use, or disposition of the company’s assets that could have a material effect on the financial statements.
Because of its inherent limitations, internal control over financial reporting may not prevent or detect misstatements. Also, projections of any evaluation of effectiveness to future periods are subject to the risk that controls may become inadequate because of changes in conditions, or that the degree of compliance with the policies or procedures may deteriorate.
/s/ KPMG LLP
Boston, Massachusetts
February 28, 2024
60
(c) Inherent Limitations on Effectiveness of Controls
The Company’s management, including the CEO and CFO, does not expect that our disclosure controls or our internal control over financial reporting will prevent or detect all errors and all fraud. A control system, no matter how well designed and operated, can provide only reasonable, not absolute, assurance that the control system’s objectives will be met. The design of a control system must reflect the fact that there are resource constraints, and the benefits of controls must be considered relative to their costs. Further, because of the inherent limitations in all control systems, no evaluation of controls can provide absolute assurance that misstatements due to error or fraud will not occur or that all control issues and instances of fraud, if any, within the Company have been detected. These inherent limitations include the realities that judgments in decision-making can be faulty and that breakdowns can occur because of simple error or mistake. Controls can also be circumvented by the individual acts of some persons, by collusion of two or more people, or by management override of the controls. The design of any system of controls is based in part on certain assumptions about the likelihood of future events, and there can be no assurance that any design will succeed in achieving its stated goals under all potential future conditions. Projections of any evaluation of controls effectiveness to future periods are subject to risks. Over time, controls may become inadequate because of changes in conditions or deterioration in the degree of compliance with policies or procedures.
(d) Changes in Internal Control Over Financial Reporting
There was no change in our internal control over financial reporting that occurred during the fiscal quarter ended December 31, 2020,2023, that has materially affected, or is reasonably likely to materially affect, the Company’s internal control over financial reporting.
ITEM 9b. other information
(b) During the three months ended December 31, 2023, no director or Section 16 officer of the Company adopted or terminated a “Rule 10b5-1 trading arrangement” or “non-Rule 10b5-1 trading arrangement,” as each term is defined in Item 408(a) of Regulation S-K.
ITEM 9C. Disclosure Regarding Foreign Jurisdictions that Prevent Inspections
Not applicable.
61
Part III
ITEM 10. Directors, executive officers and corporate governance
Incorporated by reference from the Company’s Definitive Proxy Statement for its 20212024 annual meeting of stockholders.
ITEM 11. Executive Compensation
Incorporated by reference from the Company’s Definitive Proxy Statement for its 20212024 annual meeting of stockholders.
ITEM 12. security ownership of certain beneficial owners and management and related stockholder matters
Incorporated by reference from the Company’s Definitive Proxy Statement for its 20212024 annual meeting of stockholders.
ITEM 13. Certain relationships and related transactions and director independence
Incorporated by reference from the Company’s Definitive Proxy Statement for its 20212024 annual meeting of stockholders.
ITEM 14. Principal accountant fees and services
Incorporated by reference from the Company’s Definitive Proxy Statement for its 20212024 annual meeting of stockholders.
62
Part IV
ITEM 15.
(a) (1)
See index in Item 8.
(a) (2)
Schedule II Valuation and Qualifying Accounts
All other schedules for which provision is made in the applicable accounting regulation of the Securities and Exchange Commission are not required under the related instructions or are inapplicable, and therefore have been omitted.
(b)
63
101.CAL** | Inline XBRL Taxonomy Extension Calculation Linkbase Document. | |
101.DEF** | Inline XBRL Taxonomy Extension Definition Linkbase Document. | |
101.LAB** | Inline XBRL Taxonomy Extension Label Linkbase Document. | |
101.PRE** | Inline XBRL Taxonomy Extension Presentation Linkbase Document. | |
104 | Cover Page Interactive Data File (formatted as Inline XBRL and contained in Exhibit 101) |
* Indicates a management contract or compensatory plan or arrangement required to be filled pursuant to Item 15(b) of Form 10-K.
** Filed with this Annual Report on Form 10-K for the year ended December 31, 2023 are the following documents formatted in iXBRL (Inline Extensible Business Reporting Language): (i) the Consolidated Balance Sheets for the years ended December 31, 2023 and 2022; (ii) the Consolidated Statements of Operations for the years ended December 31, 2023, 2022 and 2021; (iii) the Consolidated Statements of Comprehensive Income for the years ended December 31, 2023, 2022 and 2021; (iv) the Consolidated Statements of Cash Flows for the years ended December 31, 2023, 2022 and 2021; (v) the Consolidated Statements of Equity for the years ended December 31, 2023, 2022 and 2021; (vi) the Notes to Consolidated Financial Statements; and (vii) the information included in Part II, Item 9B(b).
(1)Item 16. Form 10-K Summary
None.
64
VICOR CORPORATION
SCHEDULE II
VALUATION AND QUALIFYING ACCOUNTS
Years ended December 31, 2020, 20192023, 2022 and 20182021
|
|
|
|
| Charge |
|
|
|
|
|
|
| ||||
|
|
|
|
| (Recovery) |
|
|
|
|
|
|
| ||||
|
| Balance at |
|
| to Costs and |
|
| Other Charges, |
|
| Balance at |
| ||||
Description |
| Beginning of Period |
|
| Expenses |
|
| Deductions (1) |
|
| End of Period |
| ||||
Allowance for doubtful accounts: |
|
|
|
|
|
|
|
|
|
|
|
| ||||
Year ended: |
|
|
|
|
|
|
|
|
|
|
|
| ||||
December 31, 2023 |
| $ | 87,000 |
|
| $ | 43,000 |
|
| $ | — |
|
| $ | 130,000 |
|
December 31, 2022 |
|
| 82,000 |
|
|
| 5,000 |
|
|
| — |
|
|
| 87,000 |
|
December 31, 2021 |
|
| 82,000 |
|
|
| — |
|
|
| — |
|
|
| 82,000 |
|
Description | Balance at Beginning of Period | Charge (Recovery)to Costs and Expenses | Other Charges, Deductions (1) | Balance at End of Period | ||||||||||||
Allowance for doubtful accounts: | ||||||||||||||||
Year ended: | ||||||||||||||||
December 31, 2020 | $ | 59,000 | $ | 23,000 | $ | — | $ | 82,000 | ||||||||
December 31, 2019 | 224,000 | (144,000 | ) | (21,000 | ) | 59,000 | ||||||||||
December 31, 2018 | 159,000 | 65,000 | — | 224,000 | ||||||||||||
65
SIGNATURES
Pursuant to the requirements of Section 13 or 15(d) of the Securities Exchange Act of 1934, the Registrant has duly caused this report to be signed on its behalf by the undersigned, thereunto duly authorized.
Vicor Corporation | ||||
By: | /s/ James | |||
James | ||||
Vice President, Chief Financial Officer | ||||
Date: February 28, 2024 | ||||
Pursuant to the requirements of the Securities Exchange Act of 1934, this report has been signed below by the following persons on behalf of the registrant in the capacities and on the dates indicated.
Signature | Title | Date | ||
/s/ Patrizio Vinciarelli | President, Chief Executive Officer and Chairman of the Board (Principal Executive Officer) | February 28, 2024 | ||
Patrizio Vinciarelli | ||||
/s/ James | Chief Financial Officer, and Director (Principal Financial Officer and Principal Accounting Officer) | February 28, 2024 | ||
James F. Schmidt | ||||
/s/ Estia J. Eichten | Director | February 28, 2024 | ||
Estia J. Eichten | ||||
/s/ Michael S. McNamara | Director | February 28, 2024 | ||
Michael S. McNamara | ||||
/s/ Samuel J. Anderson | Director | February 28, 2024 | ||
Samuel J. Anderson | ||||
/s/ Claudio Tuozzolo | Director | February 28, 2024 | ||
Claudio Tuozzolo | ||||
/s/ Jason L. Carlson | Director | February 28, 2024 | ||
Jason L. Carlson | ||||
/s/ Philip D. Davies | Director | February 28, 2024 | ||
Philip D. Davies | ||||
/s/ Andrew T. D’Amico | Director | February 28, 2024 | ||
Andrew T. D’Amico | ||||
/s/ M. Michael Ansour | Director | February 28, 2024 | ||
M. Michael Ansour | ||||
/s/ Zmira Lavie | Director | February 28, 2024 | ||
Zmira Lavie | ||||
/s/ John Shen | Director | February 28, 2024 | ||
John Shen |
66