WASHINGTON, D.C. 20549
FORM 10-K
☑
ANNUAL REPORT PURSUANT TO SECTION 13 OR 15(d) OF
THE SECURITIES EXCHANGE ACT OF 1934
For the fiscal year ended December 31, 20212023
or
☐
TRANSITION REPORT PURSUANT TO SECTION 13 OR 15(d) OF
THE SECURITIES EXCHANGE ACT OF 1934
For the transition period from to
Commission file number
0-12014
IMPERIAL OIL LIMITED
(Exact name of registrant as specified in its charter)
| Canada | 98-0017682 | ||||||||||||||||
( incorporation or organization) | (I.R.S. Employer Identification No.) | ||||||||||||||||
505 | |||||||||||||||||
(Address of principal executive offices) | (Postal Code) | ||||||||||||||||
1-800-567-3776
(Registrant’s telephone number, including area code)
Securities registered pursuant to Section 12(b) of the Act:
| Title of each class | Trading symbol | Name of each exchange on which registered | ||||||||
| None | None | |||||||||
Securities registered pursuant to Section 12(g) of the Act:
Common Shares (without par value)
(Title of Class)
Indicate by check mark if the registrant is a well-known seasoned issuer (as defined in Rule 405 of the Securities Act). Yes ☑ No ☐
Indicate by check mark if the registrant is not required to file reports pursuant to Section 13 or Section 15(d) of the Securities Exchange Act of 1934.
Indicate by check mark whether the registrant (1) has filed all reports required to be filed by Section 13 or 15(d) of the Securities Exchange Act of 1934 during the preceding 12 months (or for such shorter period that the registrant was required to file such reports), and (2) has been subject to such filing requirements for the past 90 days. Yes✓ No...... ☑ No ☐
Indicate by check mark whether the registrant has submitted electronically every Interactive Data File required to be submitted pursuant to Rule 405 of Regulation(§ (§ 232.405 of this chapter) during the preceding 12 months (or for such shorter period that the registrant was required to submit and post such files). Yes✓ No...... ☑ No ☐
S-T
Indicate by check mark whether the registrant is a large accelerated filer, an accelerated filer, a
non-accelerated
filer, a smaller reporting company, or an emerging growth company. See the definitions of “large accelerated filer”, “accelerated filer”, “smaller reporting company” and “emerging growth company” in Rule12b-2
of the Securities Exchange Act of 1934.| Large accelerated filer | ☑ | Accelerated filer | ☐ | Non-accelerated filer | ☐ | Smaller reporting | |||||||||||||||||||||||
| ☐ | Emerging growth | ||||||||||||||||||||||||||||
| ☐ | |||||||||||||||||||||||||||||
If an emerging growth company, indicate by check mark if the registrant has elected not to use the extended transition period for complying with any new or revised financial accounting standards provided pursuant to Section 13(a) of the Exchange Act……
Act ☐Indicate by check mark whether the registrant has filed a report on and attestation to its management’s assessment of the effectiveness of its internal control over financial reporting under Section 404(b) of the Sarbanes-Oxley Act (15 U.S.C. 7262(b)) by the registered public accounting firm that prepared or issued its audit report.✓ ☑
If securities are registered pursuant to Section 12(b) of the Act, indicate by check mark whether the financial statements of the registrant included in the filing reflect the correction of an error to previously issued financial statements. ☐
Indicate by check mark whether any of those error corrections are restatements that required a recovery analysis of incentive-based compensation received by any of the registrant’s executive officers during the relevant recovery period pursuant to §240.10D-1(b). ☐
Indicate by check mark whether the registrant is a shell company (as defined in Rule 12
b-2
of the Securities Exchange Act of 1934). As of the last business day of the 20212023 second fiscal quarter, the aggregate market value of the voting stock held by $8,092,185,812$12,036,565,437 based upon the reported last sale price of such stock on the Toronto Stock Exchange on that date.
non-affiliates
of the registrant was CanadianThe number of common shares outstanding, as of February 15, 2022,2024, was 669,143,714.
535,836,803.1
Table of contents | Page | |||||||||||
Item 1. | Business | |||||||||||
| Upstream | ||||||||||||
| Present activities | ||||||||||||
| Downstream | ||||||||||||
| Transportation | ||||||||||||
| Refining | ||||||||||||
| Distribution | ||||||||||||
| Marketing | ||||||||||||
| Chemical | ||||||||||||
| Delivery commitments | ||||||||||||
| Human capital resources | ||||||||||||
| Competition | ||||||||||||
| Government regulations | ||||||||||||
Item 1A. | Risk factors | |||||||||||
Item 1B. | ||||||||||||
Item | Cybersecurity | |||||||||||
Item | Properties | |||||||||||
| Item 3. | Legal proceedings | |||||||||||
| Item 4. | ||||||||||||
| PART II | ||||||||||||
| Item 5. | ||||||||||||
Item 7. | ||||||||||||
Item 7A. | ||||||||||||
Item 8. | ||||||||||||
Item 9. | ||||||||||||
Item 9A. | ||||||||||||
Item 9B. | Other information | |||||||||||
Item 9C. | ||||||||||||
| PART III | ||||||||||||
| Item 10. | ||||||||||||
Item 11. | Executive compensation | |||||||||||
Item 12. | ||||||||||||
Item 13. | ||||||||||||
Item 14. | ||||||||||||
| PART IV | ||||||||||||
| Item 15. | ||||||||||||
| Item 16. | Form 10-K summary | |||||||||||
| SIGNATURES | ||||||||||||
| Financial section | ||||||||||||
| Proxy information section | ||||||||||||
All dollar amounts set forth in this report are in Canadian dollars, except where otherwise indicated. Note that numbers may not add due to rounding.
2
Forward-looking statements
Statements of future events or conditions in this report, including projections, targets, expectations, estimates, and business plans are forward-looking statements. Similarly, discussion of roadmaps or future plans related to carbon capture, transportation and storage, biofuel, hydrogen, and other future plans to reduce emissions and emission intensity of the company, its affiliates and third parties are dependent on future market factors, such as continued technological progress, policy support and timely rule-making and permitting, and represent forward-looking statements. Forward-looking statements can be identified by words such as believe, anticipate, intend, propose, plan, goal, seek, project, predict, target, estimate, expect, strategy, outlook, schedule, future, continue, likely, may, should, will and similar references to future periods. Forward-looking statements in this report include, but are not limited to, references to estimates, development, timing and recovery of reserves; the improvement of recovery through experimental operations; the development drilling program at Cold Lake; the timing, cost, efficiency and production of the Aspen projectLeming SAGD and expansion projectGrand Rapids Phase 1 projects at Cold Lake;Lake, and associated emissions intensity reductions; the evaluation and pace of the Aspen project; the timing, pace and results from the EBRT field pilot; the continued evaluation of other oil sands leases and unconventional assets; the company’s intention to market its interest in XTO Energy Canada, and operations continuing as normal throughout marketing process and if it does not result in a sale; the upstream focus on key oil sands assets;leases; future activities with respect to Beaufort Sea licences; the ability for autonomous operations at Kearl to continue capturing productivity improvements, reducing cost and enhancing safety; the impact of the Kearl Boiler Flue Gas heat recovery unit and potential further investment in this technology; the ability to capture additional synergieson reducing greenhouse gas emissions; reduced greenhouse gas emissions from the operatorship transitionLASER technology at Syncrude;Cold Lake; the ability of rail infrastructure to mitigate pipeline capacity constraints; human capital resources strategy and impact; the measures required to comply with environmental regulations; anticipated capital exploration and operating expenditures, including with respect to environmental protection; the structure and effectiveness of the cybersecurity program; continued evaluation of the company’s share purchase program; being well positioned to participate in futuresubstantial investments to develop Canadian energy supplies and reduce commodity price risk; the company’s long-term business outlook including demand, supply and energy mix and pathways related to greenhouse gas emissions; the impact of participation in the Pathways alliance; Imperial’s Scopecompany-wide net-zero goal by 2050 (Scope 1 and 2 net zero goal by 20502) and the company’s greenhouse gas emissions intensity goalsgoal for 2023 and 2030 for its oil sands operations; the impact of participation in the Oil Sands Pathways to Net Zero alliance; market uncertainty and the extent of ongoing effects of theCOVID-19pandemic on economic activity andglobal events affecting supply and demand; the impact of measures implemented by the company in response to COVID-19;demand, including inflation, and uncertainty in global economic recovery, and the company’s ability to mitigate related cost impacts; segment growth, competitive strategiesimpacts in all price environments; upstream focus on optimization within existing assets, cost reduction opportunities and benefits from an integrated business model;productivity enhancements; the ability of the company’s current investment strategy of value and select volume growth to deliver robust returns and support long term growth; continued evaluation of opportunities such as rail shipments and pace of the Aspen project; segment growth, competitive strategies and benefits from an integrated business model; the impact of Downstream strategies and competitive position; the timing, production and emissions reductions from the renewable diesel facility at Strathcona; potential impacts from environmental risks, carbon policy, climate related regulations and biofuels mandates; Chemical competitive position and the benefits to the Chemical business from integration with the Sarnia refinery and relationship with ExxonMobil; capital structure and financial strength as a competitive advantage, for risk mitigation and meeting funding requirements; expected full year capital expenditures of about $1.4$1.7 billion for 2022;2024; earnings sensitivities; risks associated with use of derivative instruments; the impact of any pending litigation, accounting standards and unrecognized tax benefits; the effectiveness of the company’s compensation plan in long term performance and mitigating risk; standardized measures of discounted future cash flows; anticipated productivitythe effectiveness of the company's corporate governance practices, including with respect to risk management and greenhouse gas emissions intensity benefits fromoversight; and the LASER project at Cold Lake; theprogress and impact of the Sarnia products pipeline;various initiatives including with E3 Lithium and plans to construct ausing renewable diesel facility at Strathcona, including timing of a final investment decision.Kearl.
Forward-looking statements are based on the company’s current expectations, estimates, projections and assumptions at the time the statements are made. Actual future financial and operating results, including expectations and assumptions concerning future energy demand, supply and mix; commodity prices and foreign exchange rates and general market conditions;rates; production rates, growth and mix across various assets; production life, resource recoveries and reservoir performance; project plans, timing, costs, technical evaluations and capacities, and the company’s ability to effectively execute on these plans and operate its assets; production life, resource recoveriesassets, including its investment in the renewable diesel complex at Strathcona, the Leming, Grand Rapids and reservoir performance; plans to mitigate climate riskLASER projects at Cold Lake, and the resilience of company strategy to a range of pathways for society’s energy transition;autonomous operations at Kearl; the adoption and impact of new facilities or technologies on capital efficiency, production and reductions to greenhouse gasGHG emissions intensity, including but not limited to next generation technologies using solvents to replace energy intensive steam at Cold Lake, the EBRT project, boiler flue gas technology at Kearl, Strathcona’sStrathcona renewable diesel, complex and support for and advancement of carbon capture and storage including in connection with hydrogen for the renewable diesel project, recovery technologies and efficiency projects, and any changes in the scope, terms, or costs of such projects; the amount and timing of emissions reductions; that any required support from policymakers and other stakeholders for various new technologies such as carbon capture and storage will be provided; for renewable diesel, the availability and cost of locally-sourced and grown feedstock and the supply of renewable diesel to British Columbia in connection with its low-carbon fuel legislation; the amount and timing of emissions reductions, including the impact of lower carbon fuels; performance of third party service providers;
3
receipt of regulatory and third party approvals in a timely manner, especially with respect to large scale emissions reduction projects; applicable laws and government policies, including taxation, restrictions in response to COVID-19 and with respect to climate change, GHG emissions reductions and greenhouse gas emissions reductions; receipt of regulatory approvals; performance of third-party service providers;low carbon fuels; refinery utilization and product sales; the ability to offset any ongoing inflationary pressures; cash generation, financing sources and capital structure, such as dividends and shareholder returns, including the timing and amounts of share repurchases; capital and environmental expenditures; evolutionprogression of COVID-19 and its impacts on Imperial’s ability to operate its assets; capital and environmental expenditures; the capture of efficiencies within and between business lines and the company’s ability to effectively execute on its business continuity plansmaintain near-term cost reductions as ongoing efficiencies; and pandemic response activitiesgeneral market conditions could differ materially depending on a number of factors.
These factors include global, regional or local changes in supply and demand for oil, natural gas, petroleum and petrochemical products, feedstocks and other market orfactors, economic conditions and seasonal fluctuations and resulting demand, price, differential and margin impacts; transportation for accessing markets; political or regulatory events, including changes in law or government policy, applicable royalty rates, and tax laws and actions in response toCOVID-19;environmental risks inherent in oil and gas activities;including taxes on share repurchases; environmental regulation, including climate change and greenhouse gas regulation and changes to such regulation; environmental risks inherent in oil and gas activities; government policies supporting lower carbon investment opportunities; failure, delay or delay ofuncertainty regarding supportive policy and market development for the adoption of emerging lower emissionlower-emission energy technologies;technologies and other technologies that support emissions reductions; the receipt, in a timely manner, of regulatory and third-party approvals;approvals, including for new technologies that will help the company meet its lower emissions goals; third-party opposition to company and service provider operations, projects and infrastructure; availability and allocation of capital; availability and performance of third-party service providers, including in light of restrictions related toCOVID-19;providers; unanticipated technical or operational difficulties; management effectiveness and disaster response preparedness, including business continuity plans in response toCOVID-19;commercial negotiations;preparedness; project management and schedules and timely completion of projects; transportation for accessing markets; commercial negotiations; unexpected technological developments; the results of research programs and new technologies, including with respect to greenhouse gas emissions, and the ability to bring new technologies to commercial scale on a cost-competitive basis;basis, and the competitiveness of alternative energy and other emission reduction technologies; reservoir analysis and performance; the ability to develop or acquire additional reserves; operational hazards and risks; cybersecurity incidents; currency exchange rates; the occurrence, pace, rate of regionalrecovery and global economic recoveryeffects of public health crises, including the responses from the COVID-19 pandemic and the occurrence and severity of future outbreaks and variants;governments; general economic conditions, including inflation and the occurrence and duration of economic recessions;recessions or downturns; and other factors discussed in Item"Item 1A “Risk factors”Risk factors" and Item"Item 7 “Management’sManagement’s discussion and analysis of financial condition and results of operations”operations" in this annual report on Form 10-K.
Forward-looking statements are not guarantees of future performance and involve a number of risks and uncertainties, some that are similar to other oil and gas companies and some that are unique to Imperial Oil Limited. Imperial Oil Limited’sImperial’s actual results may differ materially from those expressed or implied by its forward-looking statements and readers are cautioned not to place undue reliance on them. Imperial Oil Limited undertakes no obligation to update any forward-looking statements contained herein, except as required by applicable law.
Forward-looking and other statements regarding Imperial's environmental, social and other sustainability efforts and aspirations are not an indication that these statements are material to investors or require disclosure in the company's filings with securities regulators. In addition, historical, current and forward-looking environmental, social and sustainability-related statements may be based on standards for measuring progress that are still developing, internal controls and processes that continue to evolve, and assumptions that are subject to change in the future, including future rule-making.
Energy demand models are forward-looking by nature and aim to replicate system dynamics of the global energy system, requiring simplifications. The reference to any scenario in this report, including any potential net-zero scenarios, does not imply Imperial views any particular scenario as likely to occur. In addition, energy demand scenarios require assumptions on a variety of parameters. As such, the outcome of any given scenario using an energy demand model comes with a high degree of uncertainty. For example, the IEA describes its NZE scenario as extremely challenging, requiring unprecedented innovation, unprecedented international cooperation and sustained support and participation from consumers. Third-party scenarios discussed in this report reflect the modeling assumptions and outputs of their respective authors, not Imperial, and their use by Imperial is not an endorsement by the company of their underlying assumptions, likelihood or probability. Investment decisions are made on the basis of Imperial’s separate planning process, but may be secondarily tested for robustness or resiliency against different assumptions, including against various scenarios.process. Any use of the modeling of a third-party organization within this report does not constitute or imply an endorsement by Imperial of any or all of the positions or activities of such organization.
Actions needed to advance the company’s 2030 greenhouse gas emission-reductions plans are incorporated into its medium-term business plans, which are updated annually. The reference case for planning beyond 2030 is based on the ExxonMobil’s Global Outlook (the Outlook) research and publication. The Outlook is reflective of the existing global policy environment and an assumption of increasing policy stringency and technology improvement to 2050. However, the Outlook does not attempt to project the degree of required future policy and
4
technology advancement and deployment for the world or the company, to meet net zero by 2050. As future policies and technology advancements emerge, they will be incorporated into the Outlook, and the Company’s business plans will be updated accordingly. References to projects or opportunities may not reflect investment decisions made by the company. Individual projects or opportunities may advance based on a number of factors, including availability of supportive policy, permitting, technological advancement for cost-effective abatement, insights from the company planning process, and alignment with partners and other stakeholders. Capital investment guidance in lower-emission investments is based on our corporate plan; however, actual investment levels will be subject to the availability of the opportunity set, public policy support, and focused on returns.
The term “project” as used in this report can refer to a variety of different activities and does not necessarily have the same meaning as in any government payment transparency reports.
PART I
Item 1. Business
Imperial Oil Limited was incorporated under the laws of Canada in 1880 and was continued under the(the “CBCA” (the "CBCA") by certificate of continuance dated April 24, 1978. The head and principal office of the company is located at 505 Quarry Park Boulevard S.E., Calgary, Alberta, Canada T2C 5N1. Exxon Mobil Corporation (“ExxonMobil”("ExxonMobil") owns approximately 69.6 percent of the outstanding shares of the company. In this report, unless the context otherwise indicates, reference to the “company”"company" or “Imperial”"Imperial" includes Imperial Oil Limited and its subsidiaries, and reference to ExxonMobil includes Exxon Mobil Corporation and its affiliates, as appropriate.
Canada Business Corporations Act
The company is one of Canada’s largest integrated oil companies. It is active in all phases of the petroleum industry in Canada, including the exploration for, and production and sale of, crude oil and natural gas. In Canada, it is a major producer of crude oil, the largest petroleum refiner, a leading marketer of petroleum products, and a major producer of petrochemicals. The company also pursues lower-emission business opportunities including carbon capture and storage, hydrogen and biofuels.lower-emission fuels.
The company’s operations are conducted in three main segments: Upstream, Downstream and Chemical. Upstream operations include the exploration for, and production of, crude oil, natural gas, synthetic crude oil and bitumen. Downstream operations consist of the transportation and refining of crude oil, blending of refined products and the distribution and marketing of those products. Chemical operations consist of the manufacturing and marketing of various petrochemicals.
Operating data and financial information about the company’s business segments are contained in this report under the following: “Management’s"Management’s discussion and analysis of financial condition and results of operations”operations" and the “Financial section”"Financial section" under note 2 to the consolidated financial statements: “Business segments”"Business segments".
Upstream
Disclosure of reserves
Summary of oil and gas reserves at
year-end
The table below summarizes the net proved reserves for the company, as at December 31, 2021,2023, as detailed in the “Supplemental"Supplemental information on oil and gas exploration and production activities” part ofactivities" in the “Financial section”, starting on page 42"Financial section" of this report.
All of the company’s reported reserves are located in Canada. The company has reported proved reserves based on the average of theprice for each month during the lastendingended December 31. Natural gas is converted to an20212023 that would cause a significant change in the estimated proved reserves as of that date.
first-day-of-the-month
12-month
period oil-equivalent
basis at six million cubic feet per one thousand barrels. No major discovery or other favourable or adverse event has occurred since December 31, Liquids (a) | Natural gas | Synthetic crude oil | Bitumen | Total oil-equivalent basis | |||||||||||||
millions of barrels | billions of cubic feet | millions of barrels | millions of barrels | millions of barrels | |||||||||||||
| Net proved reserves: | |||||||||||||||||
| Developed | — | 53 | 242 | 1,706 | 1,957 | ||||||||||||
| Undeveloped | — | 8 | 112 | 105 | 218 | ||||||||||||
| Total net proved | — | 61 | 354 | 1,811 | 2,175 | ||||||||||||
(a)Liquids include crude oil, condensate and natural gas liquids (NGLs). NGL proved reserves are not material and are therefore included under liquids. | |||||||||||||||||
| Liquids (a) | Natural gas | Synthetic oil | Bitumen | Total oil-equivalent basis | ||||||||||||||||
| millions of barrels | billions of cubic feet | millions of barrels | millions of barrels | millions of barrels | ||||||||||||||||
Net proved reserves: | ||||||||||||||||||||
Developed | 14 | 205 | 326 | 1,957 | 2,331 | |||||||||||||||
Undeveloped | 2 | 76 | 112 | 259 | 386 | |||||||||||||||
Total net proved | 16 | 281 | 438 | 2,216 | 2,717 | |||||||||||||||
The estimation of proved reserve volumes, which is based on the requirement of reasonable certainty, is an ongoing process based on rigorous technical evaluations, commercial and market assessments, detailed analysis of well information such as flow rates and reservoir pressures, and development and production costs, and other factors. Furthermore, the company only records proved reserves for projects which have received significant funding commitments by management made toward the development of the reserves. Although the company is reasonably certain that proved reserves will be produced, the timing and amount recovered can be affected by a number of factors, including completion and optimization of development projects, reservoir performance, regulatory approvals, government policies, consumer preferences, changes in the amount and timing of capital investments, royalty frameworks and significant changes in oil and gas price levels. In addition, proved reserves could be affected by an extended period of low prices which could reduce the level of the company’s capital spending and also impact its partners’ capacity to fund their share of joint projects.
Technologies used in establishing proved reserves estimates
Imperial’s proved reserves in 20212023 were based on estimates generated through the integration of available and appropriate geological, engineering and production data, utilizing well established technologies that have been demonstrated in the field to yield repeatable and consistent results.
Data used in these integrated assessments included information obtained directly from the subsurface via wellbores, such as well logs, reservoir core samples, fluid samples, static and dynamic pressure information, production test data, and surveillance and performance information. The data utilized also included subsurface information obtained through indirect measurements, including seismic data, calibrated with available well control information. The tools used to interpret the data included seismic processing software, reservoir modeling and simulation software, and data analysis packages.
In some circumstances, where appropriate analog reservoirs were available, reservoir parameters from these analogs were used to increase the quality of and confidence in the reserves estimates.
7
Preparation of reserves estimates
Imperial has a dedicated reserves management group that is separate from the base operating organization. Primary responsibilities of this group include oversight of the reserves estimation process for compliance with the U.S. Securities and Exchange Commission rules and regulations, review of annual changes in reserves estimates and the reporting of Imperial’sthe company’s proved reserves. This group also maintains the official reserves estimates for Imperial’s proved reserves. In addition, this group provides training to personnel involved in the reserve estimation and reporting processes within Imperial.
The reserves management group maintains a central database containing the company’s official reserves estimates. Appropriate controls, including limitations on database access and update capabilities, are in place to ensure data integrity within this central database. An annual review of the system’s controls is performed by internal audit. Key components of the reserves estimation process include technical evaluations, commercial and market assessments, analysis of well and field performance, and long standinglong-standing approval guidelines. No changes may be made to reserves estimates in the central database, including the addition of any new initial reserves estimates or subsequent revisions, unless those changes have been thoroughly reviewed and evaluated by duly authorized personnel within the base operating organization. In addition, changes to reserves estimates that exceed certain thresholds require further review and endorsement by the operating organization and the reserves management group, culminating in reviews with and approval by senior management and the company’s board of directors.
The internal qualified reserves evaluator is a professional geoscientist registered in Alberta, Canada and has 1921 years of petroleum industry experience, including 1012 years of reserves related experience. The position provides leadership to the internal reserves management group and is responsible for filing a reserves report with the Canadian securities regulatory authorities. The company’s internal reserves evaluation staff consists of 2518 persons with an average of 1114 years of relevant technical experience in evaluating reserves, of whom 2217 persons are qualified reserves evaluators for purposes of Canadian securities regulatory requirements. The company’s internal reserves evaluation management team is made up of 1315 persons with an average of 119 years of relevant experience in evaluating and managing the evaluation of reserves.
Proved undeveloped reserves
As at December 31, 2021,2023, approximately 1410 percent of the company’s proved reserves were proved undeveloped reflecting volumes of 386218 millionLake, and the Montney and Duvernay unconventional assets.Lake. This compared to 138240 million2020.2022. The increasedecrease of 24822 millionincludes an increaseis mainly attributed to the migration of 262 million oil-equivalent barrels at Cold Lake an increase of 6 millionoil-equivalentbarrels at the Montney and Duvernay unconventional assets, partially offset by a decrease of 20 millionoil-equivalentbarrels at Syncrude. Conversion of proved undeveloped reserves intoto proved developed was 34 millionoil-equivalentbarrels during 2021, associated with Cold Lakereserves following infill development drilling and the Montney and Duvernay unconventional assets.start-up of the Grand Rapids Phase 1 project.
oil-equivalent
barrels. Proved undeveloped reserves are associated with Syncrude, Kearl and Cold oil-equivalent
barrels of proved undeveloped reserves reported at the end of oil-equivalent
barrels of proved undeveloped reserves One of the company’s requirements to report resources as proved reserves is that management has made significant funding commitments towards the development of the reserves. The company has a disciplined investment strategy and many major fields require a long lead-time in order to be developed. The company made investments of about $124$391 million during the year to progress the development of proved undeveloped reserves at Cold Lake, SyncrudeKearl and the Montney and Duvernay unconventional assets.Syncrude. These investments represented about 2035 percent of the $632$1,108 million in total reported Upstream capital and exploration expenditures.
8
Oil and gas production, production prices and production costs
Reference is made to the portion of the “Financial section”"Financial section" entitled “Management’s"Management’s discussion and analysis of financial condition and results of operations” on page 48operations" of this report for a narrative discussion on the material changes.
Average daily production of oil
The company’s average daily oil production by final products sold during the three years ended December 31, 20212023 was as follows. All reported production volumes were from Canada.
| thousands of barrels per day (a) | 2023 | 2022 | 2021 | |||||||||||
| Bitumen: | ||||||||||||||
| Kearl: | - gross (b) | 191 | 172 | 186 | ||||||||||
- net (c) | 177 | 157 | 178 | |||||||||||
| Cold Lake: | - gross (b) | 135 | 144 | 140 | ||||||||||
- net (c) | 106 | 106 | 114 | |||||||||||
| Total bitumen: | - gross (b) | 326 | 316 | 326 | ||||||||||
- net (c) | 283 | 263 | 292 | |||||||||||
Synthetic crude oil (d): | - gross (b) | 76 | 77 | 71 | ||||||||||
- net (c) | 67 | 63 | 62 | |||||||||||
Liquids (e): | - gross (b) | 5 | 9 | 11 | ||||||||||
- net (c) | 5 | 9 | 10 | |||||||||||
| Total: | - gross (b) | 407 | 402 | 408 | ||||||||||
- net (c) | 355 | 335 | 364 | |||||||||||
(a)Volume per day metrics are calculated by dividing the volume for the period by the number of calendar days in the period. (b)Gross production is the company’s share of production (excluding purchases) before deduction of the mineral owners’ or governments’ share or both. (c)Net production is gross production less the mineral owners’ or governments’ share or both. (d)The company’s synthetic crude oil production volumes were from the company’s share of production volumes in the Syncrude joint venture and include immaterial amounts of bitumen and other products exported to the operator's facilities using an existing interconnect pipeline. (e)Liquids include crude oil, condensate and NGLs. | ||||||||||||||
thousands of barrels per day (a) | 2021 | 2020 | 2019 | |||||||||||
Bitumen: | ||||||||||||||
Kearl: | - gross (b) | 186 | 158 | 145 | ||||||||||
- net (c) | 178 | 155 | 140 | |||||||||||
Cold Lake: | - gross (b) | 140 | 132 | 140 | ||||||||||
- net (c) | 114 | 124 | 114 | |||||||||||
Total bitumen: | - gross (b) | 326 | 290 | 285 | ||||||||||
- net (c) | 292 | 279 | 254 | |||||||||||
Synthetic oil (d) : | - gross (b) | 71 | 69 | 73 | ||||||||||
- net (c) | 62 | 68 | 65 | |||||||||||
Liquids (e) : | - gross (b) | 11 | 13 | 16 | ||||||||||
- net (c) | 10 | 12 | 14 | |||||||||||
Total: | - gross (b) | 408 | 372 | 374 | ||||||||||
- net (c) | 364 | 359 | 333 | |||||||||||
Average daily production and production available for sale of natural gas
The company’s average daily production and production available for sale of natural gas during the three years ended December 31, 20212023 are set forth below. All reported production volumes were from Canada. All gas volumes in this reportCanada and are calculated at a pressure base of 14.73 pounds per square inch absolute at 60 degrees Fahrenheit. Reference is made to the portion of the “Financial section”"Financial section" entitled “Management’s"Management’s discussion and analysis of financial condition and results of operations” on page 48operations" of this report for a narrative discussion on the material changes.
| millions of cubic feet per day (a) | 2023 | 2022 | 2021 | ||||||||
Gross production (b) (c) | 33 | 85 | 120 | ||||||||
Net production (c) (d) (e) | 32 | 83 | 115 | ||||||||
Net production available for sale (f) | 11 | 50 | 81 | ||||||||
(a)Volume per day metrics are calculated by dividing the volume for the period by the number of calendar days in the period. (b)Gross production is the company’s share of production (excluding purchases) before deduction of the mineral owners’ or governments’ share or both. (c)Production of natural gas includes amounts used for internal consumption with the exception of the amounts reinjected. (d)Net production is gross production less the mineral owners’ or governments’ share or both. (e)Net production reported in the above table is consistent with production quantities in the net proved reserves disclosure. (f)Includes sales of the company’s share of net production and excludes amounts used for internal consumption. | |||||||||||
millions of cubic feet per day (a) | 2021 | 2020 | 2019 | |||||||||
Gross production (b) (c) | 120 | 154 | 145 | |||||||||
Net production (c) (d) (e) | 115 | 150 | 144 | |||||||||
Net production available for sale (f) | 81 | 115 | 108 |
9
Total average daily
oil-equivalent
basis productionThe company’s total average daily production expressed in an
oil-equivalent
basis is set forth below, with natural gas converted to anoil-equivalent
basis at six million cubic feet per one thousand barrels.| thousands of barrels per day (a) | 2023 | 2022 | 2021 | ||||||||
| Total production oil-equivalent basis: | |||||||||||
–gross (b) | 413 | 416 | 428 | ||||||||
–net (c) | 360 | 349 | 383 | ||||||||
(a)Volume per day metrics are calculated by dividing the volume for the period by the number of calendar days in the period. (b)Gross production is the company’s share of production (excluding purchases) before deduction of the mineral owners’ or governments’ share or both. (c)Net production is gross production less the mineral owners’ or governments’ share or both. | |||||||||||
thousands of barrels per day (a) | 2021 | 2020 | 2019 | |||||||||
Total production oil-equivalent basis: | ||||||||||||
- gross (b) | 428 | 398 | 398 | |||||||||
- net (c) | 383 | 384 | 357 |
Average unit sales price
The company’s average unit sales price and average unit production costs by product type for the three years ended December 31, 20212023 were as follows.
| Canadian dollars per barrel | 2023 | 2022 | 2021 | ||||||||
| Bitumen | 67.42 | 84.67 | 57.91 | ||||||||
| Synthetic crude oil | 105.57 | 125.46 | 81.61 | ||||||||
Liquids (a) | 59.30 | 93.77 | 59.41 | ||||||||
| Canadian dollars per thousand cubic feet | |||||||||||
| Natural gas | 2.58 | 5.69 | 3.83 | ||||||||
(a)Liquids include crude oil, condensate and NGLs. | |||||||||||
Canadian dollars per barrel | 2021 | 2020 | 2019 | |||||||||
Bitumen | 57.91 | 25.69 | 50.02 | |||||||||
Synthetic oil | 81.61 | 49.76 | 74.47 | |||||||||
Liquids (a) | 59.41 | 27.40 | 42.91 | |||||||||
Canadian dollars per thousand cubic feet | ||||||||||||
Natural gas | 3.83 | 1.90 | 2.05 |
In 2021,2023, Imperial's average Canadian dollar realization for bitumen decreased generally in line with Western Canada Select (WCS). The company's average Canadian dollar realizations for synthetic crude oil decreased generally in line with West Texas Intermediate (WTI), adjusted for changes in exchange rates and transportation costs and reflect a premium over WTI driven by supply and demand.
In 2022, Imperial’s average Canadian dollar realizationsrealization for bitumen increased generally in line with Western Canada Select (WCS). The company’s average Canadian dollar realizations for synthetic crude oil increased generally in line with West Texas Intermediate (WTI), adjusted for changes in exchange rates and transportation costs.
costs and reflect a premium over WTI driven by supply and demand.Average unit production costs
| Canadian dollars per barrel | 2023 | 2022 | 2021 | ||||||||
| Bitumen | 32.41 | 39.05 | 29.06 | ||||||||
| Synthetic crude oil | 62.57 | 68.00 | 61.97 | ||||||||
Total oil-equivalent basis (a) | 38.51 | 44.02 | 34.32 | ||||||||
(a)Includes liquids, bitumen, synthetic crude oil and natural gas. | |||||||||||
Canadian dollars per barrel | 2021 | 2020 | 2019 | |||||||||
Bitumen | 29.06 | 25.73 | 31.53 | |||||||||
Synthetic oil | 61.97 | 45.51 | 54.44 | |||||||||
Total oil-equivalent basis(a) | 34.32 | 28.73 | 34.82 |
In 2021,2023, bitumen unit production costs were higher,decreased, primarily driven by higherlower energy costs.
In 2020,2023, synthetic crude oil unit production costs were lower,decreased, primarily driven by cost saving activities in response tohigher net production.
In 2022, bitumen unit production costs increased, primarily driven by higher energy costs.
In 2022, synthetic crude oil unit production costs increased, primarily driven by higher energy costs.
10
Drilling and other exploratory and development activities
The company has been involved in the exploration for and development of crude oil and natural gas in Canada only.
Wells drilled
The following table sets forth the net exploratory and development wells that were drilled or participated in by the company during the three years ended December 31, 2021.
2023.wells | 2021 | 2020 | 2019 | |||||||||
Net productive exploratory | - | - | - | |||||||||
Net dry exploratory | - | - | - | |||||||||
Net productive development | 13 | 29 | 28 | |||||||||
Net dry development | - | - | - | |||||||||
Total | 13 | 29 | 28 |
| wells | 2023 | 2022 | 2021 | ||||||||
| Net productive exploratory | — | — | — | ||||||||
| Net dry exploratory | — | — | — | ||||||||
| Net productive development | 32 | 24 | 13 | ||||||||
| Net dry development | — | — | — | ||||||||
| Total | 32 | 24 | 13 | ||||||||
In 2021,2023, wells drilled to add productive capacity include 1232 development wells at Cold Lake and 1 well associated with the Montney and Duvernay unconventional assets.Lake.
In 2020,2022, wells drilled to add productive capacity include 2824 development wells at Cold Lake and 1 well associated withLake.
Wells drilling
At December 31, 2023, the Montney and Duvernay unconventional assets.
| 2023 | ||||||||
| Wells | Gross | Net | ||||||
| Total | 11 | 11 | ||||||
2021 | ||||||||
Wells | Gross | Net | ||||||
Total | 16 | 7 |
Exploratory and development activities regarding oil and gas resources
Cold Lake
To maintain production at Cold Lake, capital expenditures for additional production wells and associated facilities are required periodically. In 2021,2023, additional wells were drilled on existing phases.phases, as well as development drilling to add productive capacity. In 2022,2024, a development drilling program is planned within the approved development area to add productive capacity.
Additionally, in 2022, the company approved the budget for the Leming Steam-Assisted Gravity Drainage (SAGD) project that will re-develop the original pilot area of the Cold Lake field, with development activities having commenced in 2023 and start-up planned in 2025.In August 2018, Imperial received regulatory approval from the Alberta Energy Regulator for an expansion project at Cold Lake to develop the Grand Rapids interval using Solvent Assisted - Steam Assisted Gravity Drainage (SA-SAGD)technology, capable of producing 50,000 barrels per day before royalties. The company is developing the Grand Rapids reservoir through capital-efficient investments that make use of available steam capacity from existing plants, with the initial phase of Grand Rapids development planned as an extension from the Nabiye plant. In April 2022, the Grand Rapids Phase 1 (GRP1) project was approved by the company's board with a forecasted average production of 15,000 barrels per day before royalties. The initial steam injection phase started in December 2023 and is expected to last until the end of the first quarter of 2024, with production ramping up over the following months.
The company also conducts experimental pilot operations to improve recovery of bitumen from wells by means of new drilling, production or recovery techniques.
11
Aspen Cold Lake expansion and other in-situ oil sands activities
In October 2018, the company received regulatory approval for the Aspen solvent-assisted, steam-assisted gravity drainage(SA-SAGD)SA-SAGD project from the Alberta Energy Regulator. Development was proposed to occur in two phases, each producing about 75,000 barrels per day, before royalties. The first phase of the project was approved by the company’s board, and appropriated for $2.6 billion. Construction began late in the fourth quarter of 2018. In March 2019, the company slowed the pace of development given market uncertainty stemming from the Government of Alberta’s temporary mandatory production curtailment regulations and other industry competitiveness challenges. Although the Government of Alberta repealed the regulatory authority for imposing temporary production curtailments at the end of 2021, major investment remains on hold.hold due to continued market uncertainty. Aspen’s project pace will continue to be evaluated and remains an important opportunity for Imperial. The Enhanced Bitumen Recovery Technology (EBRT) field pilot on the Aspen lease received funding approval in 2023, with development work underway for pilot startup by 2027. The pilot will test technology that has the potential to deliver higher bitumen production rates and lower greenhouse gas emissions as compared to industry average SAGD operations.
Work progresses on technical and technology evaluations to support potential Clarke Creek, Corner, Clyden and Chard
in-situ
development regulatory applications.The company also has interests in other oil sands leases in the Athabasca region of northern Alberta. Evaluation wells completed on these leased areas established the presence of bitumen. The company continues to evaluate these leases to determine their potential for future development.
Beaufort Sea
The company holds a 25 percent interest in two exploration licences in the Beaufort Sea. In 2016, the Federal Government of Canada declared Arctic waters off limits to new offshore oil and gas licences for five years subject to review at the end of that period. Existing licences were not impacted. In June 2019, the Federal Government approved selective changes to theto prohibit and freeze the existing licences throughlicences. In 2023, the completion of the Beaufort Sea Regional Environmental Assessment(BR-SEA)review. In 2021, theWestern Arctic - Tariuq (Offshore) Accord was signed and prohibition was extended untilto December 31, 2022, during which time the2028. The Federal Government will continueplans to consult with stakeholders as partco-develop a climate and marine science-based review of theBR-SEAreview to address regional social, environmental, economic and spill response impacts of natural resource development in the Arctic. moratorium. The company continues to hold the licences while maintaining community engagement and participation in theBR-SEA process.process.
Canada Petroleum Resources Act
Exploratory and development activities regarding oil and gas resources extracted by mining methods
The company continues to evaluate other undeveloped, mineable oil sands acreage in the Athabasca region.
12
Present activities
Review of principal ongoing activities
Kearl
Kearl is a joint venture established to recover shallow deposits of oil sands using
open-pit
mining methods to extract the crude bitumen, which is processed through extraction and froth treatment trains. The company holds a 70.96 percent participating interest in the joint venture and ExxonMobil Canada Properties holds the other 29.04 percent. The product, a blend of bitumen and diluent, is typically shipped to the company’s refineries, Exxon Mobil Corporation refineries and to other third parties. Diluent is natural gas condensate or other light hydrocarbons added to the crude bitumen to facilitate transportation by pipeline and rail.During 2021,2023, the company’s share of Kearl’s net bitumen production was about 178,000177,000 barrels per day and gross production was about 186,000191,000 barrels per day.
Total gross production for Kearl was about 263,000270,000 barrels per day (186,000(191,000 barrels Imperial’s share), setting a new record for Kearl and continuing multi-year improvements in reliability, costs and performance. Total gross production increased about 41,000up 28,000 barrels per day (28,000(19,000 barrels Imperial’sImperial's share) compared to 2020, which was2022, as a result of improved reliability, plant capacity utilization, and mine equipment productivity.
In 2023, Kearl completed its multiyear program to convert its 81 haul trucks to autonomous operation. Imperial is now one of the asset’s previous annual production record. Increased production was primarily driven bylargest autonomous mine fleet operators in the absence of prior year production balancing with market demands, supported byworld and continues to capture productivity improvements while also reducing costs and further enhancing operational safety.
In 2023, the supplemental crushers and other reliability improvements. Kearl also eliminatedcompany successfully completed its fall turnaround and transitionedmultiyear program to a single annual turnaround, one year ahead of schedule.
Cold Lake
Cold Lake is an
in-situ
heavy oil bitumen operation. The product, a blend of bitumen and diluent, is typically shipped to the company’s refineries, Exxon Mobil Corporation refineries and to other third parties.Cold Lake continues to utilize its commercial application of improved reliability,Liquid Addition to Steam for Enhanced Recovery (LASER), with the technology now being applied to approximately 15 percent of production, optimizations,resulting in reduced greenhouse gas emissions compared to traditional Cyclic Steam Stimulation (CSS) technology.
Grand Rapids Phase 1 (GRP1) will be the first SA-SAGD project in the industry and recent capital-efficient infill drilling.
is expected to reduce greenhouse gas emissions intensity by up to 40 percent compared to existing CSS technology. The initial steam injection phase started in December 2023 and is expected to last until the end of the first quarter of 2024, with production ramping up over the following months.Syncrude
Syncrude is a joint venture established to recover shallow deposits of oil sands using
open-pit
mining methods to extract crude bitumen, and then upgrade it to produce a high-quality, light (32 degrees API), sweet, synthetic crude oil. The company holds a 25 percent participating interest in the joint venture. The produced synthetic crude oil is typically shipped to the company’s refineries, Exxon Mobil Corporation refineries and to other third parties.In 2021,2023, the company’s share of Syncrude’s net production of synthetic crude oilproduction was about 62,00067,000 barrels per day andday. The gross production was about 71,00076,000 barrels per day.
The Province of Alberta, in its capacity as lessor of Kearl, Cold Lake, and Syncrude oil sands leases, is entitled to a royalty on production. Royalties are subject to the oil sands royalty regulations which are based upon a sliding scale determined largely by the price of crude oil.
13
Oil and gas properties, wells, operations and acreage
Production wells
The company’s production of liquids, bitumen and natural gas is derived from wells located exclusively in Canada. The total number of wells capable of production, in which the company had interests at December 31, 20212023 and December 31, 2020,2022, is set forthdisclosed in the following table. The statistics in the table are determined in part from information received from other operators.
The total number of wells decreased in 2023 primarily due to the shut-in of multiple non-economical wells.Year ended December 31, 2021 | Year ended December 31, 2020 | |||||||||||||||||||||||||||||||
| Crude oil | Natural gas | Crude oil | Natural gas | |||||||||||||||||||||||||||||
wells | Gross (a | ) | Net (b | ) | Gross (a | ) | Net (b | ) | Gross (a | ) | Net (b | ) | Gross (a | ) | Net (b) | |||||||||||||||||
Total (c) | 4,557 | 4,509 | 2,729 | 885 | 4,660 | 4,610 | 2,767 | 898 | ||||||||||||||||||||||||
| Year ended December 31, 2023 | Year ended December 31, 2022 | |||||||||||||||||||||||||
| Crude oil | Natural gas | Crude oil | Natural gas | |||||||||||||||||||||||
| wells | Gross (a) | Net (b) | Gross (a) | Net (b) | Gross (a) | Net (b) | Gross (a) | Net (b) | ||||||||||||||||||
Total (c) | 4,084 | 4,080 | 2,411 | 770 | 4,277 | 4,264 | 2,419 | 774 | ||||||||||||||||||
(a)Gross wells are wells in which the company owns a working interest. (b)Net wells are the sum of the fractional working interest owned by the company in gross wells, rounded to the nearest whole number. (c)Multiple completion wells are permanently equipped to produce separately from two or more distinctly different geological formations. At year-end 2023, the company had an interest in 12 gross wells with multiple completions (2022 - 12 gross wells). | ||||||||||||||||||||||||||
Land holdings
At December 31, 20212023 and December 31, 2020,2022, the company held the following oil and gas rights, and bitumen and synthetic crude oil leases, all of which are located in Canada, specifically in the western provinces, in the Canada lands and in the Atlantic offshore.
| Developed | Undeveloped | Total | ||||||||||||||||||||||||
thousands of acres | 2021 | 2020 | 2021 | 2020 | 2021 | 2020 | ||||||||||||||||||||
Western provinces (a): | ||||||||||||||||||||||||||
Liquids and gas | - gross (b) | 1,059 | 1,043 | 621 | 697 | 1,680 | 1,740 | |||||||||||||||||||
- net (c) | 517 | 510 | 350 | 388 | 867 | 898 | ||||||||||||||||||||
Bitumen | - gross (b) | 196 | 197 | 584 | 594 | 780 | 791 | |||||||||||||||||||
- net (c) | 182 | 182 | 255 | 265 | 437 | 447 | ||||||||||||||||||||
Synthetic oil | - gross (b) | 119 | 119 | 100 | 100 | 219 | 219 | |||||||||||||||||||
- net (c) | 30 | 30 | 25 | 25 | 55 | 55 | ||||||||||||||||||||
Canada lands (d) : | ||||||||||||||||||||||||||
Liquids and gas | - gross (b) | 2 | 2 | 1,803 | 1,803 | 1,805 | 1,805 | |||||||||||||||||||
- net (c) | 2 | 2 | 495 | 495 | 497 | 497 | ||||||||||||||||||||
Atlantic offshore: | ||||||||||||||||||||||||||
Liquids and gas | - gross (b) | 65 | 65 | 267 | 267 | 332 | 332 | |||||||||||||||||||
- net (c) | 6 | 6 | 36 | 36 | 42 | 42 | ||||||||||||||||||||
Total (e) : | - gross (b) | 1,441 | 1,426 | 3,375 | 3,461 | 4,816 | 4,887 | |||||||||||||||||||
- net (c) | 737 | 730 | 1,161 | 1,209 | 1,898 | 1,939 | ||||||||||||||||||||
| Developed | Undeveloped | Total | |||||||||||||||||||||
| thousands of acres | 2023 | 2022 | 2023 | 2022 | 2023 | 2022 | |||||||||||||||||
Western provinces (a): | |||||||||||||||||||||||
| Liquids and gas | - gross (b) | 422 | 441 | 185 | 185 | 607 | 626 | ||||||||||||||||
- net (c) | 253 | 260 | 135 | 135 | 388 | 395 | |||||||||||||||||
| Bitumen | - gross (b) | 196 | 196 | 584 | 584 | 780 | 780 | ||||||||||||||||
- net (c) | 182 | 182 | 255 | 255 | 437 | 437 | |||||||||||||||||
| Synthetic crude oil | - gross (b) | 119 | 119 | 100 | 100 | 219 | 219 | ||||||||||||||||
- net (c) | 30 | 30 | 25 | 25 | 55 | 55 | |||||||||||||||||
Canada lands (d): | |||||||||||||||||||||||
| Liquids and gas | - gross (b) | 2 | 2 | 1,803 | 1,803 | 1,805 | 1,805 | ||||||||||||||||
- net (c) | 2 | 2 | 496 | 495 | 498 | 497 | |||||||||||||||||
| Atlantic offshore: | |||||||||||||||||||||||
| Liquids and gas | - gross (b) | 65 | 65 | 146 | 146 | 211 | 211 | ||||||||||||||||
- net (c) | 6 | 6 | 22 | 22 | 28 | 28 | |||||||||||||||||
Total (e): | - gross (b) | 804 | 823 | 2,818 | 2,818 | 3,622 | 3,641 | ||||||||||||||||
- net (c) | 473 | 480 | 933 | 932 | 1,406 | 1,412 | |||||||||||||||||
(a)Western provinces include British Columbia and Alberta. (b)Gross acres include the interests of others. (c)Net acres exclude the interests of others. (d)Canada lands include the Arctic Islands, Beaufort Sea / Mackenzie Delta, and other Northwest Territories. (e)Certain land holdings are subject to modification under agreements whereby others may earn interests in the company’s holdings by performing certain exploratory work (farm-out) and whereby the company may earn interests in others’ holdings by performing certain exploratory work (farm-in). | |||||||||||||||||||||||
14
Western provinces
The company’s bitumen leases include about 161,000 net acres of oil sands leases near Cold Lake and an area of about 34,000 net acres at Kearl. The company also has about 68,000 net acres of undeveloped, mineable oil sands acreage in the Athabasca region. In addition, the company has interests in other bitumen oil sands leases in the Athabasca areas totalling about 173,000 net acres, which include about 62,000 net acres of oil sands leases in the Clyden area, about 34,000 net acres of oil sands leases in the Aspen area, about 30,000 net acres of oil sands leases in the Corner area, about 29,000 net acres in the Clarke Creek area and about 18,000 net acres in the Chard area. The 173,000 net acres are suitable for
in-situ
recovery techniques.The company’s share of Syncrude joint venture leases covering about 55,000 net acres accounts for the entire synthetic crude oil acreage.
Oil sands leases have an exploration period of 15 years and are continued beyond that point by payment of escalating rentals or by production. The majority of the acreage in Cold Lake, Kearl and Syncrude is continued by production.
The company holds interests in an additional 867,000388,000 net acres of developed and undeveloped land in the western provinces related to crude oil and natural gas, including about 369,000 net acres associated with the company’s unconventional portfolio in Alberta. These interests include lands that are part of Imperial’s recent announcement to market its interest in XTO Energy Canada jointly with ExxonMobil Canada. XTO Energy Canada assets include 568,000 net acres in the Montney shale, 85,000 net acres in the Duvernay shale and additional acreage in other areas of Alberta; Imperial owns a 50 percent interest in XTO Energy Canada. This is consistent with Imperial’s strategy to focus its upstream resources and efforts on its key oil sands assets.gas.
Crude oil and natural gas leases and licences from the western provinces have exploration periods ranging from two2 to 15 years and are continued beyond that point by proven production capability.
Canada lands
Land holdings in Canada lands primarily include exploration licence (EL) acreage in the Beaufort Sea of about 252,000 net acres and significant discovery licence (SDL) acreage in the Mackenzie Delta and Beaufort Sea areas of about 183,000 net acres.
Exploration licences on Canada lands have a finite term. If a significant discovery is made, a SDL may be granted that holds the acreage under the SDL indefinitely, subject to certain conditions.
The company’s net acreage in Canada lands is either continued by production or held through ELs and SDLs.
Atlantic offshore
Exploration licences on Atlantic offshore have a finite term. The Atlantic offshore acreage is continued by production licences or held by SDLs.
15
Downstream
Supply and trading
The company supplements its own production of crude oil, condensate and petroleum products with substantial purchases from a number of other sources at negotiated market prices, in addition to undertaking trading activities. Purchases and sales are made under both spot and term contracts from domestic and foreign sources, including ExxonMobil.
Transportation
Refining
The company owns and operates three refineries, which process predominantly Canadian crude oil. The company purchases finished products to supplement its refinery production.
The approximate average daily volumes of refinery throughput and utilization during the three years ended December 31, 2021,2023, and the daily rated capacities of the refineries as at December 31, 2021,2023, were as follows.
Refinery throughput (a) | Rated capacities (b) | |||||||||||||
| Year ended December 31 | at December 31 | |||||||||||||
| thousands of barrels per day | 2023 | 2022 | 2021 | 2023 | ||||||||||
| Strathcona, Alberta | 186 | 195 | 172 | 197 | ||||||||||
| Sarnia, Ontario | 110 | 113 | 106 | 123 | ||||||||||
| Nanticoke, Ontario | 111 | 110 | 101 | 113 | ||||||||||
| Total | 407 | 418 | 379 | 433 | ||||||||||
Utilization of refinery capacity (percent) | 94 | 98 | 89 | |||||||||||
(a)Refinery throughput is the volume of crude oil and feedstocks that is processed in the refinery atmospheric distillation units. (b)Refining capacity data is based on 100 percent of rated refinery process unit stream-day capacities to process inputs to atmospheric distillation units under normal operating conditions, less the impact of shutdowns for regular repair and maintenance activities, averaged over an extended period of time. | ||||||||||||||
2023
| Refinery throughput (a) | Rated capacities (b) | |||||||||||||||
| Year ended December 31 | at December 31 | |||||||||||||||
thousands of barrels per day | 2021 | 2020 | 2019 | 2021 | ||||||||||||
Strathcona, Alberta | 172 | 170 | 183 | 196 | ||||||||||||
Sarnia, Ontario | 106 | 86 | 86 | 119 | ||||||||||||
Nanticoke, Ontario | 101 | 84 | 84 | 113 | ||||||||||||
Total | 379 | 340 | 353 | 428 | ||||||||||||
Utilization of refinery capacity (percent) | 89 | 80 | 83 | |||||||||||||
Lower refinery throughput in 2023 primarily reflects the impact of planned turnaround activities at Strathcona and Sarnia refineries.
Improved refinery throughput in 20212022 was primarily reflects reduced impacts associated with theCOVID-19pandemic, partially offset by a planned turnaround at Strathcona.
Distribution
The company maintains a nationwide distribution system to move petroleum products to market by pipeline, tanker, rail and road transport. The company owns and operates fuel terminals across the country, as well as natural gas liquids and products pipelines in Alberta, Manitoba and Ontario and has interests in the capital stock of two products pipeline companies.
16
Marketing
The company markets petroleum products throughout Canada under well-known brand names, most notably Esso and Mobil, to all types of customers.
The approximate daily volumes of net petroleum products (excluding purchases / sales contracts with the same counterparty) sold during the three years ended December 31, 2021,2023, are set out in the following table.
thousands of barrels per day | 2021 | 2020 | 2019 | |||||||||
Gasolines | 224 | 215 | 249 | |||||||||
Heating, diesel and jet fuels | 160 | 146 | 167 | |||||||||
| Lube oils and other products | ||||||||||||
Heavy fuel oils | 27 | 20 | 21 | |||||||||
Lube oils and other products | 45 | 40 | 38 | |||||||||
Net petroleum product sales | 456 | 421 | 475 | |||||||||
In 2021,2023, lower petroleum product sales were primarily driven by lower wholesale customer volume.
In 2022, improved petroleum product sales primarily reflects reduced impacts associated with theCOVID-19pandemic.increased demand.
Chemical
The company’s Chemical operations manufacture and market benzene, aromatic and aliphatic solvents, plasticizer intermediates, polyethylene resin, and polyethylene resin.markets refinery grade propylene. Its petrochemical and polyethylene manufacturing operations are located in Sarnia, Ontario, adjacent to the company’s petroleum refinery.
The company’s total petrochemical sales volumes during the three years ended December 31, 2021,2023, were as follows.
| thousands of tonnes | 2023 | 2022 | 2021 | ||||||||
| Total petrochemical sales | 820 | 842 | 831 | ||||||||
thousands of tonnes | 2021 | 2020 | 2019 | |||||||||
Total petrochemical sales | 831 | 749 | 732 |
In 2021,2023, sales volumes decreased primarily due to planned maintenance activities.
In 2022, sales volumes increased primarily due to higher sales of intermediatespropylene and aromatics.polyethylene, partially offset by lower intermediates.
17
Delivery commitments
The company has no material commitments to provide a fixed and determinable quantity of Contentsoil or gas under existing contracts and agreements.
Human capital resources
Imperial operates in a complex, competitive and changing business environment where decisions and risks play out over time horizons that are often decades in length. This long-term orientation underpins the company’s philosophy on talent development.
Talent development begins with recruiting exceptional candidates and continues with individually planned experiences and training designed to facilitate broad development and a deep understanding of ourthe company's business across the business cycle. The company’s compensation is market competitive, long-term oriented, and highly differentiated by individual performance. In addition, benefits and workplace programs support the company’s talent management approach, and are designed to attract and retain employees for a long-term career. Overall, this multifaceted approach has resulted in strong employee retention.
Imperial views diversity as an opportunity. The company encourages and respects diversity of thought, ideas, and perspective in its workforce. The company considers diversity through all stages of employment including recruitment, training and development of its employees. Imperial’sThe company’s goal is to reflect the mix and diversity of the communities where it operates, and it continues to focus on diverse representation at all levels of the organization.
The number of regular employees was about 5,4005,300 at the end of 2023 (2022 - 5,300, 2021 (2020 - 5,800, 2019 - 6,000)5,400). Regular employees are defined as active executive, management, professional, technical, administrative, and wage employees who work full-time or part-time for the company and are covered by the company’s benefit plans and programs.
Competition
The Canadian energy and petrochemical industries are highly competitive. Competition exists in the search for and development of new sources of supply, the construction and operation of crude oil, natural gas and refined products pipelines and facilities and the refining, distribution and marketing of petroleum products and chemicals. The energy and petrochemical industries also compete with other industries in supplying the energy, fuel and chemical needs of both industrial and individual consumers. Certain industry participants, including Imperial, are expanding investments in lower-emission energy and emission-reduction services and technologies.
18
Government regulations
Petroleum, natural gas and oil sands rights
Most of the company’s petroleum, natural gas and oil sands rights were acquired from governments, either federal or provincial. These rights, in the form of leases or licences, are generally acquired for cash or work commitments. A lease or licence entitles the holder to explore for petroleum, natural gas and / or oil sands on the leased lands for a specified period.
In western provinces, the lease holder can produce the petroleum or natural gas discovered on the leased lands and retains the rights based on continued production. Oil sands leases are retained by meeting the minimum level of evaluation, payment of rentals, or by production.
The holder of a licence relating to Canada lands and the Atlantic offshore can apply for a SDL if a discovery is made. If granted, the SDL holds the lands indefinitely subject to certain conditions. The holder may then apply for a production licence in order to produce petroleum or natural gas from the licenced land.
Project approval
Approvals and licences from relevant provincial or federal
governmental or regulatory bodies are required for the company to carry out, or make modifications to, its oil and gas activities. The project approval process for major projects can involve, among other things, environmental assessments (including relevant mitigation measures), stakeholder and Indigenous consultation and input regarding project concerns, and public hearings. Approval may be subject to various conditions and commitments arising through these processes.
Canada's Impact Assessment Act
net-zero
greenhouse gas emissions by 2050), reliance on strategic and regional assessments and adjusted regulatory review timelines. In October 2023, the Supreme Court of Canada ruled that the new federal assessment scheme was unconstitutional in part. Legislative and regulatory amendments have yet to be made to address this decision. The impact of this legislation and its expected amendments is not fully apparent, but it may impact the cost, manner, duration and ability to advance large energy projects and project expansions.Environmental protection
The company regards protecting the environment in connection with its various operations as a priority. The company is subject to extensive environmental regulations in Canada that apply to all phases of exploration, development, operation, and final closure. These requirements cover the management and monitoring of potential environmental impacts during active operations, including practices for land disturbance, wildlife protection, specifications for equipment operation and material storage and limitations on discharges to the environment. It also includes conducting environmental surveys and collecting continuous operational measurements and sampling to confirm that environmental practices are adequately protecting the environment. These regulations also specify the actions and requirements for final reclamation, abandonment and closure of facilities. The company works in cooperation with government agencies, industry associations and communities to address existing, and to anticipate potential, environmental protection issues. The company also maintains extensive operating procedures, processes and emergency response plans to address environmental risks at its operations.
As discussed in Item"Item 1A. “RiskRisk factors” in this report, compliance with existing and potential future government regulations, including environmental regulations, may have material effects on the capital expenditures, earnings, and competitive position of the company. Imperial takes new and ongoing measures throughout its operations each year to prevent and minimize the impact of its operations on air, land and water. These include significant investments in refining infrastructure and technology to manufacture clean fuels, continued evaluation and implementation of new technologies to reduce greenhouse gas emissions, adherence to federal and provincial greenhouse gas emissions reduction and reporting programs, enhanced water and land management, and expenditures for asset retirement obligations. In the past five years, the company has made capital and operating expenditures of about $3.7$5.6 billion on environmental protection and facilities. In 2021,2023, the company’s environmental capital and operating expenditures totalled approximately $1.1$1.7 billion, which was spent primarily on activities to protect the air, land and water, including remediation projects. Capital and operatingEnvironmental expenditures relating to environmental protection are expected to be about $1.0increase to approximately $1.9 billion in 2022.
2024, with capital expenditures expected19
Crude oil
Production
The maximum allowable gross production of crude oil from wells in Canada is subject to limitations by various regulatory authorities on the basis of engineering and conservation principles.
Additionally, the Government of Alberta has in the past used temporary mandatory production curtailment regulations to impose production limits on large producers in Alberta. Mandatory production curtailments wereAlberta, such as those implemented in January 2019 and eliminatedrepealed in December 2020. By the end of 2021, the regulatory authority to impose curtailments was repealed.2021.
Exports
Export contracts of more than one year for light crude oil and petroleum products and two years for heavy crude oil (including bitumen) require the prior approval of the Canada Energy Regulator (CER) and the Government of Canada. Export contracts of less than one year for light crude oil and petroleum products and two years for heavy crude oil (including bitumen) require an order from the CER.
Natural gas
Production
The maximum allowable gross production of natural gas from wells in Canada is subject to limitations by various regulatory authorities. These limitations are to ensure oil recovery is not adversely impacted by accelerated gas production practices. These limitations do not impact gas reserves, only the timing of production of the reserves and did not have a significant impact on Imperial’s 20212023 gas production rates.
Exports
The Government of Canada has the authority to regulate the export price for natural gas. Exports of natural gas from Canada require approval by the CER and the Government of Canada. The Government of Canada allows the export of natural gas by CER order without volume limitation for terms not exceeding 24 months.
Royalties
The Government of Canada and the provinces in which the company produces crude oil and natural gas impose royalties on production from lands where they own the mineral rights. Some producing provinces also receive revenue by imposing taxes on production from lands where they do not own the mineral rights.
Different royalties are imposed by the Government of Canada and each of the producing provinces. Royalties imposed on crude oil, natural gas and natural gas liquids vary depending on a number of parameters, including well production volumes, selling prices and recovery methods. For information with respect to royalties for Kearl, Cold Lake and Syncrude, see “Upstream”"Upstream" section entitled “Present activities”"Present activities" under Item 1 on page 13.
1.Investment Canada Act
Therequires Government of Canada approval, in certain cases, of the acquisition of control of a Canadian business by an entity that is not controlled by Canadians. The acquisition of natural resource properties may, in certain circumstances, be considered a transaction that constitutes an acquisition of control of a Canadian business requiring Government of Canada approval.
Investment Canada Act
The Act also requires notification of the establishment of new unrelated businesses in Canada by entities not controlled by Canadians, but does not require Government of Canada approval except when the new business is related to Canada’s cultural heritage or national identity. The Government of Canada is also authorized to take any measures that it considers advisable to protect national security, including the outright prohibition of a foreign investment in Canada.
By virtue of the majority stock ownership of the company by ExxonMobil, the company is considered to be an entity which is not controlled by Canadians.
20
Competition Act
The Competition Bureau seeks to ensure that Canadian businesses and consumers prosper in a competitive and innovative marketplace. The Competition Bureau is responsible for the administration and enforcement of the(the (the Act). A merger transaction, whether or not notifiable, is subject to examination by the Commissioner of the Competition Bureau to determine whether the merger will have, or is likely to have, the effect of preventing or lessening substantially competition in a definable market. The assessment of the competitive effects of a merger is made with reference to the factors identified under the Act.
Competition Act
An Advance Ruling Certificate (ARC) may be issued by the Commissioner to a party or parties to a proposed merger transaction who want to be assured that the transaction will not give rise to proceedings under section 92 of the Act. An ARC may be issued when the Commissioner is satisfied that there would not be sufficient grounds on which to apply to the Competition Tribunal for an order against a proposed merger. The issuance of an ARC is discretionary. An ARC cannot be issued for a transaction that has been completed, nor does an ARC ensure approval of the transaction by any agency other than the Competition Bureau.
The company online
The company’s websitecontains a variety of corporate and investor information free of charge, including the company’s annual report on Form
www.imperialoil.ca
10-K,
quarterly reports on Form10-Q
and current reports on Form8-K
and amendments to these reports. These reports are made available as soon as reasonably practicable after they are filed or furnished to the SEC. The SEC’s website, www.sec.gov, contains reports, proxy and information statements, interactive data files, and other information regarding issuers that are submitted and posted electronically with the SEC.21
Item 1A. Risk factors |
Imperial’s financial and operating results are subject to a variety of risks inherent in oil, gas and petrochemical businesses, and the pursuit of lower-emission business opportunities. Many of these risk factors are not within Imperial’s control and could adversely affect Imperial’s business, financial and operating results, or financial position. These risk factors include:
Supply and demand
The oil, gas, fuels and petrochemical businesses are fundamentally commodity businesses. This means the company’s operations and earnings may be significantly affected by changes in oil, natural gas and petrochemical prices, and by changes in margins on refined products and petrochemicals. Crude oil, natural gas, petrochemical and petroleum product prices and margins depend on local, regional, and global events or conditions that affect supply and demand for the relevant commodity or product. Commodity prices have been volatile, and the company expects that volatility to continue. Any material decline in crude oil prices could have a material adverse effect on Imperial’sthe company’s Upstream operations, financial position, proved reserves and the amount spent to develop reserves. On the other hand, a material increase in crude oil prices could have a material adverse effect on Imperial’sthe company's Downstream margins, depending on the market conditions for refined products.
The company's pursuit of lower-emission business opportunities including carbon capture and storage, hydrogen, and lower-emission fuels also depends on the growth and development of markets for those products and services, including implementation of supportive government policies and developments in technology to enable those products and services to be provided on a cost-effective basis at commercial scale. See "Climate change, energy transition and greenhouse gas restrictions" in this Item 1A. The company may also be impacted by changes in other commodities the company utilizes, such as prices and availability of feedstocks for lower-emission fuels including renewable diesel.Economic conditions
The demand for energy and petrochemicals is generally linked closely with broad-based economic activities and levels of prosperity. The occurrence of recessions or other periods of low or negative economic growth will typically have a direct adverse impact on the company’s results. Other factors that affect general economic conditions such as changes in population growth rates, government regulation or austerity programs, trade tariffs or broader breakdowns in global trade, security or public health issues and responses, the inability to access debt markets due to rating, banking, or legal constraints, liquidity crises, other events or conditions that impair the functioning of financial markets and institutions also pose risks to the company.
Other demand-related factors
Factors that may affect the demand for crude oil, gas, fuels and petrochemicals, and therefore could impact Imperial’sthe company’s results include technological improvements in energy efficiency; seasonal weather patterns, which affect the demand for ourthe company's products, including lower demand for gasoline, impacting Downstream results in the winter; increased competitiveness of, or government policy support for, alternative energy sources; new product quality regulations; technological changes or consumer preferences that alter fuel choices, such as technological advances in energy storage or other critical areas that make wind, and solar, hydrogen, nuclear or other alternatives more competitive for power generation; changes in consumer preferences for the company’s products, including consumer demand for alternative fueled or electric transportation or alternatives to plastic products; broad-based changes in personal income levels, interest rates and inflation; and security or public health issues and responses such as epidemics and pandemics. Market factors may also result in losses from commodity derivatives and other instruments used to hedge price exposures or for trading purposes. See also “Climate"Climate change, energy transition and greenhouse gas restrictions”restrictions" below.
22
Other supply-related factors
Commodity prices and margins also vary depending on a number of factors affecting supply. For example, increased supply from the development of new oil and gas supply sources and technologies to enhance recovery from existing sources tends to reduce commodity prices to the extent such supply increases are not offset by commensurate growth in demand. Similarly, increases in industry refining or petrochemical manufacturing capacity relative to demand tend to reduce margins on affected products. Crude oil, gas and petrochemical supply levels can also be affected by factors that reduce available supplies, such as the level of and adherence by participating countries or others to production quotas established by OPEC or “OPEC+”"OPEC+" and other agreements among sovereigns,sovereigns; government policies that restrict oil and gas production or exports, or increase associated costs, including actions intended to reduce greenhouse gas emissions and previous Government of Alberta curtailment regulations,regulations; the occurrence of wars or hostile actions, including disruption of land or sea transportation routes; natural disasters,disasters; trade tariffs or broader breakdowns in global trade,trade; disruptions in competitors’ operations, oroperations; and unexpected pipeline or rail constraints that may disrupt and have in the past disrupted supplies. For example, Russia's military action in Ukraine has impacted global crude oil and gas supply levels and prices, and continues to contribute to a volatile commodity environment, the duration of which is uncertain. Technological change can also alter the relative costs for competitors to find, produce, and refine oil and gas and to manufacture petrochemicals.
Canadian-specific market factors
The market price for western Canadian heavy crude oil is typically lower than light and medium grades of oil, principally due to the higher transportation and refining costs. Western Canadian crude oil may also be subject to limits on transportation capacity to markets. Future crude price differentials between western Canadian crude oil relative to prices in the U.S. Gulf Coast are uncertain and changes in the heavy or light crude oil differentials could have a material adverse effect on the company’s business. IncreasedIn the past, increased differentials in 2018 alsohave led the Government of Alberta to enact temporary mandatory production curtailment regulations in 2019. These regulations enabled the government to imposethat imposed production limits on large producers in Alberta such as Imperial. Mandatory production curtailment was eliminated in December 2020 andAlthough the regulatory authority to impose curtailments was repealed at the end of 2021; however,2021, the use of similar curtailment regulations in the future could have an adverse effect on the company’s business. A significant portion of the company’s production is bitumen, which is blended with diluent for transportation and marketability of heavy crude oil. Increases to diluent prices, relative to heavy crude oil prices, could also have an adverse effect on the company’s business.
Other market factors
Market factors may also result in losses from commodity derivatives and other instruments used to hedge price exposures or for trading purposes. Imperial’s future business results, including cash flows and financing needs, may also be affected by the occurrence, severity, pace and rate of recovery of future public health epidemics or pandemics, the responsive actions taken by governments and others, and the resulting effects on regional and global markets and economies. If the company’s mitigation and response efforts prove insufficient, then large outbreaks of epidemics, pandemics or other health crises at operating sites, particularly in remote locations and where work camps are utilized, could materially impact the company’s personnel and its operations, reducing productivity and increasing costs.
Government and political factors
Imperial’s results can be adversely impacted by political, legal or regulatory developments affecting operations and markets. Changes in government policy or regulations, changes in law or interpretation of settled law, challenges to legislative jurisdiction between different levels of government, third-party opposition to company or infrastructure projects, and duration of regulatory reviews could impact Imperial’sthe company’s existing operations and planned projects. This includes actions by policy-makers,policy makers, regulators or other actors to delay or deny necessary licences and permits, or restrict the availability of oil and gas leases or the operation of third-party infrastructure that the company relies on, such as pipelines to transport the company’s upstream production to market or that supply feedstock to the company’s refineries. Additionally, changes in environmental regulations, assessment processes or other laws (including but not limited to in respect of climate change and greenhouse gas emissions), regulatory interpretations that exclude or disfavour the company's products under government policies or programs intended to support new or developing markets or technologies or that are otherwise not technology-neutral, and increasing and expanding stakeholder consultation (includingwith stakeholders and Indigenous stakeholders),communities, may increase the cost of compliance or reduce or delay available business opportunities and adversely impact the company’s results.
Other government and political factors that could adversely affect the company’s financial results include increases in taxes or government royalty rates (including retroactive claims)claims or punitive taxes on oil, gas and petrochemical operations) and changes in trade policies and agreements. Changes in taxation policy, such as
23
the Government of Canada's proposed tax on repurchases of equity effective from January 1, 2024, could impact the company’s financial results and ability to return surplus cash to shareholders. Further, the adoption of regulations mandating efficiency standards, and the use of alternative fuels or uncompetitive fuel components could affect the company’s operations. Many governments are providing tax advantages and other subsidies to support alternative energy sources or are mandating the use of specific fuels or technologies. Governments are also introducing bans on certain technologies that could impact demand for products, such as the Government of Canada’s intentionregulations to bangradually reduce the saleproportion of permitted sales of new internal combustion engine cars and light trucks from 2026-2034 and ban such sales beginning in 2035. Governments and others are also promoting research into new technologies to reduce the cost and increase the scalability of alternative energy sources, and the success of these initiatives may decrease demand for the company’s products. Actions by policy makers, regulators or others may require changes in the company’s business or strategy that could result in reduced returns.
Governments may establish regulations with respect to the control of the company’s production, such as when increased price differentials in 2018 led the Government of Alberta to imposeAlberta's temporary mandatory production curtailment regulations that were in effect from 2019 through 2021, as discussed in the “Supply"Supply and demand”demand" section above. Government intervention in free markets may introduce unintended consequences such as market volatility and uncertainty, misallocation of resources, and erosion of investor confidence.
Environmental risks
All phases of the Upstream, Downstream and Chemical businesses are subject to environmental regulation pursuant to a variety of Canadian federal, provincial, territorial and municipal laws and regulations, as well as international conventions (collectively, “environmental legislation”"environmental legislation").
Environmental legislation imposes, among other things, restrictions, liabilities and obligations in connection with the generation, handling, storage, transportation, treatment and disposal of hazardous substances and waste and in connection with spills, releases and emissions of various substances into the environment. As well, environmental regulations are imposed on the qualities and compositions of the products sold and imported, and include those aimed at reducing consumption or addressing environmental concerns with certain end products. Changes to these requirements could adversely affect the company’s results by impacting commodity prices, increasing costs and reducing revenues.
Environmental legislation also requires that wells, facility sites and other properties associated with the company’s operations be operated, maintained, monitored, abandoned and reclaimed to the satisfaction of applicable regulatory authorities. This includes the requirement for specific approvals for many areas of interaction with the environment, such as land use, air quality, water use, biodiversity protection and waste, including mine tailings management. The failure to operate as anticipated and adhere to conditions, the delay or denial of approvals and changes to conditions or regulations could impact the company’s ability to operate its projects and facilities and adversely affect the company’s results.
Regulation of air, water and land
The implementation of, and compliance with, policies and regulations related to air, water and land, such as Alberta’s Lower Athabasca Regional Plan and Wetland Policy applicable to the company’s oil sands assets, could restrict development in current and future areas of operation. Of note, the first of two court cases brought against the government by Indigenous groups regarding the assessment of cumulative impacts and infringement on exercise of treaty rights in Alberta is scheduled to be heard in 2024. These cases may inform future government decisions and policies regarding land use planning and resource development, and could impact the requirements or willingness to grant regulatory licenses or approvals. The company also depends on water obtained under licences for withdrawal, storage, reuse and discharge in both its Upstream and Downstream businesses, including future projects and expansions. Water use may be limited by regulatory requirements, seasonal fluctuations, regional drought, competing demands, environmental sensitivities, increasingly stringent water management standards, and changes to conditions or availability of licences, which may restrict and adversely affect the company’s operations. Additionally, a number of air quality regulations and frameworks are being developed or have been implemented at the federal and provincial levels, including sulphur dioxide limits for refineries in Ontario, and when implemented could impact existing and planned operations and projects through increased capital and operating expenses including retrofits to existing equipment, and could adversely impact the company’s operations and financial results.
24
Regulation of wildlife
Federal and provincial legislation aimed at protecting sensitive, threatened or endangered wildlife, such as woodland caribou and species of migratory birds, may also increase restoration and offset costs and impact the company’s projects. If it is determined that such wildlife and their habitat are not sufficiently protected, governments or other parties may take actions to limit the pace or ability to develop in areas of Imperial’s current and future projects.
Regulation of oil sands
The company’s mining operations are subject to tailings management regulations that establish approval, monitoring, reporting and performance criteria for tailings ponds and management plans. A failure or perceived failure to satisfy the requirements or if the company’s tailings management operations do not operate in the manner anticipated by the company or third parties such as the events relating to the environmental protection order at the company’s Kearl operations in 2023 could impact the company's ability to operate its assets, and such impact could be material. Further, the absence or evolving nature of policies and regulations for the timing and closure of tailings ponds, including the approved technologies and methods for closure (such as the use of end pit lakes and water capped tailings), and dam safety directives, regulations, guides and abandonment requirements could have a material impact on conditions for approvals and ultimate mine closure costs. Additionally, successful management and closure requires the release of water to the environment, and although an Alberta water release policy and federal oil sands effluent regulations are being developed, the timing and impact of these regulations is uncertain and the absence of effective regulation could negatively impact the company’s operations and financial results.
Environmental assessments
In addition, certain types of operations, including exploration and development projects and significant changes to certain existing projects, may require the submission and approval of environmental impact assessments. In 2019, theThe Government of Canada implemented a newCanada's environmental assessment framework under the, which expands assessment considerations beyond the environment to include social, health, economic, and gender-based impacts and the impact on Canada’s climate change commitments (including a requirement under the Strategic Assessment for Climate Change to provide a credible plan for the project to deliverprojects.projects and project expansions.
Impact Assessment Act
net-zero
greenhouse gas emissions by 2050). It also includes a reliance on strategic and regional assessments and adjusted regulatory review timelines. In October 2023, the Supreme Court of Canada ruled that the new federal assessment scheme was unconstitutional in part. Legislative and regulatory amendments have yet to be made to address this decision. The impact of this legislation and its expected amendments is not fully apparent, but it may impact the cost, manner, duration and ability to advance large energy Compliance costs
Compliance with environmental legislation can require significant expenditures and failure to comply with environmental legislation may result in the cessation of operations, imposition of fines and penalties, and liability for
clean-up
costs and damages.The costs of complying with environmental legislation in the future could have a material adverse effect on the company’s financial condition or results of operations. The company anticipates that changes in environmental legislation may require, among other things, reductions in emissions from its operations to the air and water and may result in increased capital expenditures. Changes in environmental legislation (including, but not limited to, application of regulations related to air, water, land, biodiversity and waste, such as mine tailings and the production or use of new or recycled plastics) may increase the cost of operation or compliance or reduce or delay available business opportunities. Future changes in environmental legislation and the enforcement of regulations could occur and result in stricter standards and enforcement, larger fines, penalties and liability, and increased capital expenditures and operating costs, which could have a material adverse effect on the company’s financial condition or results of operations.
Risk Management
There are operational risks inherent in oil and gas exploration and production activities, as well as the potential to incur substantial financial liabilities, if the company does not manage those risks effectively. Environmental hazards and risks, including severe weather, drought, forest fires and geological events, may impact the company’s operational performance, such asperformance. For example, the company's oil sands operations were particularly affected by extreme cold weather that makes mining operations more difficult.in 2022 and wildfires in 2016. The ability to insure risks is limited by the capacity of the applicable insurance markets, which may not be sufficient to cover the likely cost of a major adverse operating event. Accordingly, the company’s primary focus is on prevention, including through its rigorous operations integrity management system. The company’s future results will depend on the continued effectiveness of these efforts.
25
Climate change, energy transition and greenhouse gas restrictions
Net-zero scenarios
Driven by concern over the risks of climate change, the provinces and the Government of Canada have adopted or have revised regulatory frameworks to reduce greenhouse gas emissions including emissions from the production and use of oil and gas and their products.products as well as the use or support for different emission-reduction technologies. These actions are being taken both independently by national and regional governments and within the framework of United Nations Conference of the Parties’ summits under which Canada has endorsed objectives to reduce the atmospheric concentration of CO2carbon dioxide (CO2) over the coming decades, with an ambition ultimately to achieve “net zero.”"net zero". Net zero means that emissions of greenhouse gases from human activities would be balanced by actions that remove such gases from the atmosphere. Expectations for transition of the world’s energy system to lower emissionlower-emission sources, and ultimately net zero, derive from hypothetical scenarios that reflect many assumptions about the future and reflect substantial uncertainties. The company’s actions with respect to the energy transition, including its announced ambition,goal, ultimately, to achieve net zero with respect tocompany-wide net-zero emissions (Scope 1 and 2) from its upstream oil sands operations,operated assets with continued technology development and policy support, carries risks that the transition, including underlying technologies, policies, and markets as discussed in more detail below, will not be available or develop at the pace or in the manner expectedestimated by currentscenarios.
net-zero scenarios. The success of Imperial's strategy for the energy transition will also depend on its ability to recognize key signposts of changes in the global energy system on a timely basis, and the corresponding ability to direct investment to the technologies and businesses, at the appropriate stage of development, to best capitalize on the company's competitive strengths. Imperial’s results may be impacted if the implementation pace and uncertainty of policy reduces the global competitiveness of the Canadian oil and gas industry and the company’s crude oil and refined products.
Greenhouse gas restrictions
Government actions intended to reduce greenhouse gas emissions include adoption of carbon emissions pricing, cap and trade regimes, carbon taxes, emissions limits, increased mileage and other efficiency standards, low carbon fuels standards, mandates for sales of electrical vehicles and incentives or mandates for renewable energy. The Government of Canada has updated its nationally determined contribution (NDC) under the Paris Agreement on climate change, to reduce greenhouse gas emissions economy-wide by 40 to 45 percent below 2005 levels by 2030, a substantial increase in ambition beyond its original NDC. To implement these goals, the Government of Canada uses a number of policy tools including the(GGPPA), which sets a federal backstop carbon price Canada-wide through a carbon levy applied to fossil fuels ($50 per tonne CO2CO2 equivalent emissions starting in 2022 and increasing by $15 per tonne annually to $170 per tonne in 2030), and an output-based pricing system for large industrial emitters. Under the GGPPA, provinces are required to either adopt the GGPPA, or obtain equivalency by adopting a price-based system (with a minimum of the federal carbon pricing) or a cap and trade system. Further, in 2021 the Government of Canada enacted legislation to formalize Canada’s target to achieveFor 2022, underUnder the Canadian
Greenhouse Gas Pollution Pricing Act
net-zero
emissions by 2050 and establish interim emissions reductions targets at five year intervals. Net-Zero
Emissions Accountability Act, the Government of Canada is required to develop an emissions reduction plan for 2030 consistent with achievingnet-zero
emissions by 2050.The Government of Alberta has obtained federal equivalency for its Technology Innovation and Emissions Reduction Regulation (TIER) that came into effect in 2020 and applies to facilities with CO2CO2 emissions in excess of 100,000 tonnes per year. TIER is designed to reduce emissions by putting a price on nominally 10 percent of a facility’s emissions in 2020,2020. This percentage of priced emissions increased nominally to 11 percent in 2021 and 12 percent in 2022, with the oil sands mining and upgrading facilities increasing to 17 percent in 2021 and 18 percent in 2022. These percentages increase by 12 percent per year.year for 2023 to 2028 (inclusive), followed by an increase of 4 percent in 2029 and 2030 for the oil sands sector. Further, the Albertasets a limit of 100 megatonnes of CO2CO2 per year of emissions in the oil sands sector, but oil sands emissions remain below the limit and it is not yet possible to predict the impact of this act on the company’s future oil sands operations in Alberta. With respect to other provinces, with Ontario cancelling the cap and trade program in 2018, the company’s operations in Ontario were subject to theobtained federal carbon levy and output based pricing system through 2021. Starting in 2022, Ontario has received equivalency for its Emissions Performance System, which putsput a price on 8 percent of a facility’s emissions.emissions in 2022. The price increased by 2.4 percent in 2023 and will increase by 1.5 percent per year starting in 2024. British Columbia has carbon pricing in place for all industrial emissions, with pricing expected to align withthat matches the federal carbon pricing inschedule since 2022. Increases in carbon pricing could adversely impact the company’s operations and financial results unless the company can adapt its operations.operations through technological innovation and investment in a cost-effective manner or meet compliance through offset credits or other mechanisms.
Oil Sands Emissions Limit Act
There are also various low carbon fuel standards being developed or already applicable to the company’s products. TheIn 2022, the Government of Canada is finalizing draft regulations forfinalized the Clean Fuel Regulations, which will require the reduction
26
in carbon intensity of liquid transportation fuels supplied in Canada starting in December 2022.July 2023. The regulations build upon the existing federal renewable fuels regulations that require fuel producers and importerssuppliers to have a specified amountreduce the carbon intensity of renewable fuel in gasoline and diesel.diesel by reducing the GHG emissions within the fossil fuel life cycle, blending in low carbon intensity renewables or fuel switching away from fossil fuels. Similarly, British Columbia introduced a Low Carbon Fuel Standard in 2013, which increased to a 10 percent carbon intensity reduction requirement in 2020. TheBeginning in 2023, the British Columbia government has announced its intention to reducefurther increased the carbon intensity reductions to a total of fuels by a further 2030 percent by 2030.2030 (compared to the 2010 baseline). Compliance can be achieved by either blending renewable fuels with low carbon intensity or by purchasing credits.
Canada's Impact Assessment Act
International accords and underlying regional and national regulations covering climate change and greenhouse gas emissions continue to evolve with uncertain timing and outcome, making it difficult to predict their business impact. Such laws and policies could make Imperial’s products more expensive and less competitive, reduce or delay available business opportunities, reduce demand for hydrocarbons, and shift hydrocarbon demand toward lower greenhouse gas emission energy sources. Current and pending greenhouse gas regulations or policies may also increase compliance and abatement costs including taxes and levies, increase abandonment and reclamation obligations and impact decommissioning timelines, lengthen project evaluation and implementation times, impact reserves evaluations and affect operations. Increased costs may not be recoverable in the market place, could negatively affect ourthe company's returns and could reduce the global competitiveness of the company’s crude oil, natural gas and refined products. Governments may also impose restrictions on production of, or emissions from, oil and gas to the extent they view such measures as a viable approach for pursuing national and global energy and climate policies. For example, in December 2023, the Government of Canada announced its intentionpublished a regulatory framework to pursue a cap on greenhouse gas emissionemissions from upstream oil and gas activities by 2030. Concern over the risks of climate change may lead governments to make laws applicable to the energy industry progressively more stringent over time. Political and other actors and their agents are also increasingly seeking to advance climate change objectives indirectly, such as by seeking to reduce the availability or increase the cost of financing and investment in the oil and gas sectorsector. These actions include delaying or blocking needed infrastructure, utilizing shareholder governance mechanisms against companies or their shareholders or financial institutions in an effort to deter investments in oil and gas activities, and taking other actions intended to promote changes in business strategy for oil and gas companies.
Technology and lower-emission solutions
Achieving societal ambitions to reduce greenhouse gas emissions and ultimately achieve net zeronet-zero will require new technologies to reduce the cost and increase the scalability of alternative energy sources as well as technologies such as carbon captureCarbon Capture and sequestrationStorage (CCS). CCS technologies, focused initially on capturing and sequestering CO2CO2 emissions from high-intensity industrial activities, can assist in meeting society’s objective to mitigate atmospheric greenhouse gas levels while also helping ensure the availability of the reliable and affordable energy the world requires. The company’s future results and ability to succeed through the energy transition while helping meet Canada's emission-reduction goals and meet its own net-zero and emission reduction goals will depend in part on the success of these research and collaboration efforts andefforts. It will also rely on the company’s ability to adapt and apply the strengths of its current business model to providing the energy products of the future in a cost-competitive manner.
Policy and market development
The scale of the world’s energy system means that, in addition to developments in technology discussed above, a successful energy transition will require appropriate support from governments and private participants throughout the global economy. The company’s ability to develop and deploy CCS and other lower emissionlower-emission energy technologies at commercial scale will depend in part on the continued development of supportive government policies and markets. Failure or delay of these policies or markets to materialize or be maintained could adversely impact these investments. Policy and other actions that result in restricting the availability of hydrocarbon products without commensurate reduction in demand may have unpredictable adverse effects, including increased commodity price volatility; periods of significantly higher commodity prices and resulting inflationary pressures; and local or regional energy shortages. Such effects in turn may depress economic
27
growth or lead to rapid or conflicting shifts in policy by different actors, with resulting adverse effects on the company’s business.
In addition, the existence of supportive policies in any jurisdiction is not a guarantee that those policies will continue in the future. The company's operations and planned projects that have been developed with regard to current or anticipated policies may become uneconomic or otherwise adversely impacted if such policies change or are not adopted as anticipated. See also the discussion of “Supply"Supply and demand”demand", “Government"Government and political factors”,factors" and “Management effectiveness”"Management effectiveness" in this Item 1A.
Currency
Prices for commodities produced by the company are commonly benchmarked in U.S. dollars. The majority of Imperial’s sales and purchases are related to these industry U.S. dollar benchmarks. As the company records and reports its financial results in Canadian dollars, to the extent that the value of the Canadian dollar strengthens, the company’s reported earnings will be negatively affected. The company does not currently make use of derivative instruments to offset exposures associated with foreign currency.
Other business risks
Imperial is reliant on a number of key chemicals, catalysts and third-party service providers, including input and output commodity transportation (pipelines, rail, trucking, marine) and utilities providing services, including electricity and water, to various company operations. The lack of availability, capacity or proximity, with respect to pipeline facilities and railcars, could negatively impact Imperial’sthe company’s ability to produce at capacity levels. Transportation disruptions, including those caused by events unrelated to the company’s operations, could adversely affect the company’s price realizations, refining operations and sales volumes. This includes outages of key third-party infrastructure, such as pipelines servicing the company’s oil sands assets or pipelines supplying feedstock to its refineries, which could impact the company’s ability to operate its assets or limit the ability to deliver production and products to market. A third-party utilities outage could have an adverse impact on the company’s operations and ability to produce.
The company also enters into contractual relationships with suppliers, partners and other counterparties to procure and sell goods and services, and the company’s operations, market position and financial condition may be adversely impacted if these counterparties do not fulfil their obligations. ImperialThe company may also be adversely affected by the outcome of litigation resulting from its operations or by government enforcement proceedings alleging
non-compliance
with applicable laws or regulations. Litigation is subject to uncertainty and success is not guaranteed, and the company may incur significant expenses and devote significant resources in defending litigation.Operational and other factors
In addition to external economic and political factors, Imperial’s future business results also depend on the company’s ability to manage successfully those factors that are at least in part within its control.control, including its capital allocation into existing and new businesses. The extent to which Imperialthe company manages these factors will impact its performance relative to competition. For projects in which the company is not the operator such as Syncrude, Imperial depends on the management effectiveness of one or more co-venturers whom the company does not control.
Project management
The nature of the company’s Upstream, Downstream and Chemical businesses depend on complex, long-term, and capital intensive projects that require a high degree of project management expertise to maximize efficiency. This includes development, engineering, construction, commissioning and ongoing operational
28
activities and expertise. The company’s results are affected by its ability to develop and operate projects and facilities as planned, and by events or conditions that affect the advancement, operation, cost or results of such projects or facilities. These risks include the company’s ability to obtain the necessary environmental and other regulatory approvals; changes in regulations; the ability to negotiate successfully with joint venturers, partners, governments, suppliers, customers and others; the ability to model and optimize reservoir performance; changes in resources and operating costs including the availability and cost of materials, equipment and qualified personnel; the ability to qualify for certain incentives available under supportive government policies for emerging markets and technologies; the impact of general economic, business and market conditions; and the company’s ability to prevent, to the extent possible, and respond effectively to unforeseen technical difficulties that could delay project
start-up
or cause unscheduled downtime.Operational efficiency
An important component of Imperial’s competitive performance, especially given the commodity basedcommodity-based nature of Imperial’sthe company’s business, is the ability to operate efficiently, including the company’s ability to manage expenses and improve production yields on an ongoing basis. This requires continuous management focus, including technological integration and improvements, cost control, productivity enhancements and regular reappraisal of the company’s asset portfolio. The company’s operations and results also depend on key personnel and subject matter expertise, the recruitment, development and retention of high caliber employees, and the availability of skilled labour.
Research and development and technical change
Imperial relies upon the research and development organizations of the company and ExxonMobil, with whom the company conducts shared research. Innovation and technology are important to maintain the company’s competitive position, especially in light of the technological nature of Imperial’s business and the need for continuous efficiency improvement.
The company’s research and development organizations must be able to adapt to a changing market and policy environment, including developing technologies to help reduce greenhouse gas emissions intensity. To remain competitive, the company must also continuously adapt and capture the benefits of new technologies including growing the company’s capabilities to utilize digital data technologies to gain new business insights. There are risks associated with projects that rely on new technology, including that the results of implementing the new technology may differ from simulated, piloted or expected results. The failure to develop and adopt new technology may have an adverse impact on the company’s operations, ability to meet regulatory requirements and operational commitments and targets (including environmental sustainability and reduction of greenhouse gas emissions), and financial results.
Safety, business controls and environmental risk management
The scope and nature of the company’s operations present a variety of significant hazards and risks, including operational hazards and risks such as explosions, fires, pipeline ruptures and crude oil spills. Imperial’s operations are also subject to the additional hazards of pollution, releases of toxic gas and environmental hazards and risks, suchincluding severe weather (such as severeextreme cold weather events that impacted the company's oil sands operations in early 2022), drought, forest fires and geological events. The company’s results depend on management’s ability to minimize these inherent risks, to effectively control business activities and to minimize the potential for human error. ImperialThe company applies rigorous management systems, including a combined program of effective operations integrity management, ongoing upgrades, key equipment replacements, and comprehensive inspection and surveillance. The company also maintains a disciplined framework of internal controls and applies a controls management system for monitoring compliance with this framework. The company’s upstream and downstream operations may experience loss of production, slowdowns or shutdowns and increased costs due to the failure of interdependent systems, and substantial liabilities and other adverse impacts could result if the company’s management systems and controls do not function as intended.
Cybersecurity
non-technological
measures such as threat information sharing with governmental and industry groups; annual internal training and awareness campaigns including routine testing of employee awareness via mock threats; and an emphasis on resiliency including business response and recovery. See "Item 1C. Cybersecurity" for information on the company's program for managing cybersecurity risks.29
The company has limited ability to influence third parties, including the company's partners, suppliers, service providers (including providers of cloud-based services for the company's data or applications) and customers, to implement strong cybersecurity controls, and the company is exposed to potential harm from cybersecurity events that may affect their operations. During 2023, the company responded to several cyber-attacks on suppliers and joint venture partners, none of which caused a material impact to Imperial. The company’s response included giving technical assistance, loaning equipment, and taking additional defensive measures.
If the measures the company is taking to protect against cybersecurity disruptions prove to be insufficient or if the company’s proprietary data is otherwise not protected, the company, as well as its customers, employees or third parties, could be adversely affected. The company is exposed to potential harm from cybersecurity events that may affect the operations of third parties, including our partners, suppliers, service providers (including providers of cloud-based services for our data or applications), and customers. Cybersecurity disruptions could cause physical harm to people or the environment; damage or destroy assets; compromise business systems; result in proprietary information being altered, lost or stolen; result in employee, customer or third-party information being compromised; or otherwise disrupt the company’s business operations. ImperialThe company could incur significant costs to remedy the effects of a major cybersecurity disruption, in addition to costs in connection with resulting regulatory actions, litigation or reputational harm.
Preparedness
The company’s operations have been and in the future may be disrupted by severe weather events, natural disasters, human error, and similar events. The company's facilities are designed, engineered, constructed, and operated to withstand a variety of extreme climatic and other conditions, with safety factors built in to cover a number of uncertainties, including those associated with permafrost stability, temperature extremes, extreme rainfall events, earthquakes and other events. The company's consideration of changing weather conditions and inclusion of safety factors in design covers the engineering uncertainties that climate change and other events may potentially introduce. Imperial’s ability to mitigate the adverse impacts of these events depends in part upon the effectiveness of its robust facility engineering, rigorous disaster preparedness and response, planning, as well asand business continuity planning.
Reputation
Imperial’s reputation is an important corporate asset. Factors that could have an impact on the company’s reputation includinginclude an operating incident or significant cybersecurity disruption; changes in consumer views concerning the company’s products; a perception by the public that the company is not being fully transparent in the sharing of information regarding its operations that is or may be relevant to community decision-making; actions taken by the company's business partners; a perception by investors or others that insufficient progress is being made with respect to the company’s ambition in the energy transition, or that pursuit of this ambition may result in allocation of capital to investments with reduced returns; and other adverse events such as those described in this Item 1A. Negative impacts on Imperial’s reputation could, in turn, make it more difficult for the company to compete successfully for new opportunities, obtain necessary regulatory approvals, obtain financing, and attract talent, or they could reduce consumer demand for the company’s branded products. Imperial’s reputation may also be harmed by events which negatively affect the image of the industry as a whole, including public and investor perception of Alberta oil sands in relation to greenhouse gas emissions, Indigenous rights and environmental impact.
Reserves
The company’s future production and cash flows from bitumen, synthetic crude oil, liquids and natural gas reserves are highly dependent upon the company’s success in exploiting its current reserves. To maintain production and cash flows over the long term, the company must replace produced reserves, which can be accomplished through exploration discovery of new resources, appraisal and investments in developing discovered resources, or acquisition of reserves. To the extent cash flows from operations are insufficient to fund capital expenditures and external sources of capital become limited or unavailable, the company’s ability to make the necessary capital investments to maintain and grow oil and natural gas reserves will be adversely impacted. In addition, the company may be unable to find and develop or acquire additional reserves to replace oil and natural gas production at acceptable costs.
Estimates of economically recoverable oil and natural gas reserves and future net cash flows involve many uncertainties, including factors beyond the company’s control. Key factors with uncertainty include: geological and engineering estimates, including that additional information obtained through seismic and drilling programs, reservoir analysis and production and operational history may result in revisions to reserves; the assumed effects of regulation or changes to regulation by government agencies, including royalty frameworks and environmental regulations (such as the regulation of greenhouse gas emissions, including accelerated timelines and emission reduction stringency to meet government goals, which could impose significant compliance costs on the company, require new technology, or impact the economic viability of certain projects); future commodity
30
prices, where low commodity prices may affect reserves development; abandonment and reclamation costs, including reclamation and tailings requirements for mining operations; and operating costs. Actual production, revenues, taxes and royalties, development costs, abandonment and reclamation costs, and operating expenditures, with respect to reserves, will likely vary from such estimates, and such variances could be material.
Item 1B. Unresolved staff comments
None.
Item 1C. Cybersecurity
Imperial recognizes the importance of cybersecurity in achieving its business objectives, safeguarding its assets, and managing its daily operations. Accordingly, the company integrates cybersecurity risks into its overall enterprise risk management system. The board of directors oversees the company’s risk management approach and structure, which includes an annual review of the company’s cybersecurity program.
The company’s cybersecurity program is managed by the Canada IT Manager, with support from cross-functional teams led by information technology (IT) and operational technology cybersecurity operations managers in the company and in Exxon Mobil Corporation and its affiliates (collectively, Cybersecurity Operations Managers). The Cybersecurity Operations Managers are responsible for the day-to-day management and effective functioning of the cybersecurity program, including the prevention, detection, investigation, and response to cybersecurity threats and incidents. The Cybersecurity Operations Managers collectively have many years of experience in cybersecurity operations.
IT management provides updates to the company’s senior management throughout the year, covering, as appropriate, the company’s cybersecurity strategy, initiatives, key security metrics, penetration testing and benchmarking learnings, and business response plans, as well as the evolving cybersecurity threat landscape.
The company’s cybersecurity program includes multi-layered technological capabilities designed to prevent and detect cybersecurity disruptions and leverages industry standard frameworks, including the National Institute of Standards and Technology Cybersecurity Framework. The cybersecurity program incorporates an incident response plan to engage cross-functionally and report cybersecurity incidents to appropriate levels of management based on potential impact. The company conducts annual cybersecurity awareness training and routinely tests cybersecurity awareness and business preparedness for response and recovery, which are developed based on real-world threats. In addition, IT management exchanges threat information with governmental and industry groups and proactively engages independent, third-party cybersecurity experts to test, evaluate and recommend improvements on the effectiveness and resiliency of its cybersecurity program through penetration testing, breach assessments, regular cybersecurity incident drill testing, threat information sharing, and industry benchmarking. The company takes a risk-based approach with respect to its third-party service providers, tailoring processes according to the nature and sensitivity of the data or systems accessed by such third-party service providers and performing additional risk screenings and procedures, as appropriate.
As of the date of this report, the company has not identified any risks from known cybersecurity threats, including as a result of any prior cybersecurity incidents, that have materially affected, or are reasonably likely to materially affect, the company including its business strategy, results of operations, or financial condition.
While the company believes its cybersecurity program to be appropriate for managing constantly evolving cybersecurity risks, no program can fully protect against all possible adverse events. For additional information on these risks and potential consequences if the measures the company is taking prove to be insufficient or if the company's proprietary data is otherwise not protected, see “Item 1A. Risk factors: Operational and other factors - Cybersecurity” in this report.
Item 2. Properties |
Reference is made to Item 1 above.
Item 3. Legal proceedings |
Refer to the relevant portions of note 9. Litigation"Litigation and other contingenciescontingencies" of the “Financial section”"Financial section" of this report for additional information on legal proceedings.
Imperial has elected to use a US $1 million threshold for disclosing environmental proceedings.
Item 4. Mine safety disclosures |
Not applicable.
PART II
Item 5. Market for registrant’s common equity, related stockholder matters and issuer purchases of equity securities |
Market information
The company’s common shares are listed and trade on the Toronto Stock Exchange in Canada, and have unlisted trading privileges and trade on the NYSE American LLC in the United States. The symbol for the company’s common shares on these exchanges is IMO.
As of February 15, 20222024 there were9,826 9,026holders of record of common shares of the company.
Information for security holders outside Canada
Cash dividends paid to shareholders resident in countries with which Canada has an income tax convention are usually subject to a Canadian
non-resident
withholding tax of 15 percent, but may vary from one tax convention to another.The withholding tax is reduced to 5 percent on dividends paid to a corporation resident in the U.S. that owns at least 10 percent of the voting shares of the company.
The company is a qualified foreign corporation for purposes of the reduced U.S. capital gains tax rates, which are applicable to dividends paid by U.S. domestic corporations and qualified foreign corporations.
There is no Canadian tax on gains from selling shares or debt instruments owned by
non-residents
not carrying on business in Canada, as long as the shareholder does not, in any given 60 month period, own 25 percent or more of the shares of the company.Canada has approved several positions with respect to the(“MLI”("MLI")which may impact the taxability of dividends and capital gains in Canada if the shareholder’s country of residence has also approved these same positions of the MLI.
Multilateral Convention to Implement Tax Treaty
Related Measures to Prevent Base Erosion and Profit Shifting
,
Securities authorized for issuance under equity compensation plans
Sections of the company’s management proxy circular are contained in the “Proxy"Proxy information section”section", starting on page 111.112. The company’s management proxy circular is prepared in accordance with Canadian securities regulations.
Reference is made to the section under the “Company"Company executives and executive compensation”compensation":
•Entitled "Performance graph" within the "Compensation discussion and analysis" section on page 169 of this report; and
•Entitled "Equity compensation plan information", within the "Compensation discussion and analysis", on page 182 of this report.
Issuer purchases of equity securities
| Total number of shares purchased | Average price paid per share (Canadian dollars) | Total number of shares purchased as part of publicly announced plans or programs | Maximum number of shares that may yet be purchased under the plans or programs (a) | Total number of shares purchased | Average price paid per share (Canadian dollars) | Total number of shares purchased as part of publicly announced plans or programs | Maximum number of shares that may yet be purchased under the plans or programs (a) (b) | ||||||||||||||||||||||||||
October 2021 | |||||||||||||||||||||||||||||||||
| October 2023 | October 2023 | ||||||||||||||||||||||||||||||||
(October 1 - October 31) | 2,846,704 | 42.70 | 2,846,704 | 23,627,643 | (October 1 - October 31) | 11,722,035 | 81.72 | 11,722,035 | — | ||||||||||||||||||||||||
November 2021 | |||||||||||||||||||||||||||||||||
| November 2023 | November 2023 | ||||||||||||||||||||||||||||||||
(November 1 - November 30) | 7,089,309 | 43.49 | 7,089,309 | 16,538,334 | (November 1 - November 30) | — | |||||||||||||||||||||||||||
December 2021 | |||||||||||||||||||||||||||||||||
| December 2023 | December 2023 | ||||||||||||||||||||||||||||||||
(December 1 - December 31) | 7,602,184 | 43.63 | 7,602,184 | 8,936,150 | (December 1 - December 31) | 19,108,280 | 78.50 | 19,108,280 | — | ||||||||||||||||||||||||
(a)On June 27, 2023, the company announced by news release that it had received final approval from the Toronto Stock Exchange for a new normal course issuer bid to continue its existing share purchase program. The program enabled the company to purchase up to a maximum of 29,207,635 common shares during the period June 29, 2023 to June 28, 2024. This maximum included shares purchased under the normal course issuer bid and from Exxon Mobil Corporation concurrent with, but outside of, the normal course issuer bid. As in the past, Exxon Mobil Corporation advised the company that it intended to participate to maintain its ownership percentage at approximately 69.6 percent. Imperial accelerated share purchases under the normal course issuer bid program, and the program completed on October 19, 2023 as a result of the company purchasing the maximum allowable number of shares under the program. (b)On November 3, 2023, the company commenced a substantial issuer bid pursuant to which it offered to purchase for cancellation up to $1.5 billion of its common shares through a modified Dutch auction and proportionate tender offer. The substantial issuer bid was completed on December 13, 2023, with the company taking up and paying for 19,108,280 common shares at a price of $78.50 per share, for an aggregate purchase of $1.5 billion and 3.4 percent of Imperial’s issued and outstanding shares at the close of business on October 30, 2023. This included 13,299,349 shares purchased from Exxon Mobil Corporation by way of a proportionate tender to maintain its ownership percentage at approximately 69.6 percent. | (a)On June 27, 2023, the company announced by news release that it had received final approval from the Toronto Stock Exchange for a new normal course issuer bid to continue its existing share purchase program. The program enabled the company to purchase up to a maximum of 29,207,635 common shares during the period June 29, 2023 to June 28, 2024. This maximum included shares purchased under the normal course issuer bid and from Exxon Mobil Corporation concurrent with, but outside of, the normal course issuer bid. As in the past, Exxon Mobil Corporation advised the company that it intended to participate to maintain its ownership percentage at approximately 69.6 percent. Imperial accelerated share purchases under the normal course issuer bid program, and the program completed on October 19, 2023 as a result of the company purchasing the maximum allowable number of shares under the program. (b)On November 3, 2023, the company commenced a substantial issuer bid pursuant to which it offered to purchase for cancellation up to $1.5 billion of its common shares through a modified Dutch auction and proportionate tender offer. The substantial issuer bid was completed on December 13, 2023, with the company taking up and paying for 19,108,280 common shares at a price of $78.50 per share, for an aggregate purchase of $1.5 billion and 3.4 percent of Imperial’s issued and outstanding shares at the close of business on October 30, 2023. This included 13,299,349 shares purchased from Exxon Mobil Corporation by way of a proportionate tender to maintain its ownership percentage at approximately 69.6 percent. | ||||||||||||||||||||||||||||||||
Purchase plans may be modified at any time without prior notice.
Reference is made to the section entitled “Market risks”"Management’s discussion and analysis of financial condition and results of operations" in the “Financial section”"Financial section", starting on page 49 of this report.
Item 7A. Quantitative and qualitative disclosures about market risk
Reference is made to the section entitled "Market risks" in the "Financial section", starting on page 6364 of this report. All statements other than historical information incorporated in this Item 7A are forward-looking statements. The actual impact of future market changes could differ materially due to, among other things, factors discussed in this report.
Item 8. Financial statements and supplementary data
Reference is made to the table of contents in the “Financial section”"Financial section" on page 4243 of this report:
•Consolidated financial statements, together with the report thereon of PricewaterhouseCoopers LLP (PCAOB ID: 271), Calgary, Canada dated February 28, 2024, beginning with the section entitled "Report of Independent Registered Public Accounting Firm" on page 72 and continuing through note 18, "Divestment activities" on page 107;
•"Supplemental information on oil and gas exploration and production activities" (unaudited) starting on page 108.
Item 9. Changes in and disagreements with accountants on accounting and financial disclosure
None.
Item 9A. Controls and procedures |
As indicated in the certifications in Exhibit 31 of this report, the company’s principal executive officer and principal financial officer have evaluated the company’s disclosure controls and procedures as of December 31, 2021.2023. Based on that evaluation, these officers have concluded that the company’s disclosure controls and procedures are effective in ensuring that information required to be disclosed by the company in the reports that it files or submits under the Securities Exchange Act of 1934, as amended, is accumulated and communicated to them in a manner that allows for timely decisions regarding required disclosures and are effective in ensuring that such information is recorded, processed, summarized and reported within the time periods specified in the SEC’s rules and forms.
Reference is made to page 71 of this report for “Management’s"Management’s report on internal control over financial reporting”reporting" and page 72 for the “Report"Report of independent registered public accounting firm”Independent Registered Public Accounting Firm" on the company’s internal control over financial reporting as of December 31, 2021.2023.
There has not been any change in the company’s internal control over financial reporting during the last fiscal quarter that has materially affected, or is reasonably likely to materially affect, the company’s internal control over financial reporting.
During the three months ended December 31, 2023, none of the company's directors or officers adopted or terminated a "Rule 10b5-1 trading arrangement" or "non-Rule 10b5-1 trading arrangement," as each term is defined in Item 408(a) of Regulation S-K.
Item 9C. Disclosure regarding foreign jurisdiction that prevents inspections |
Not applicable.
PART III
Item 10. Directors, executive officers and corporate governance
Sections of the company’s management proxy circular are contained in the “Proxy"Proxy information section”section", starting on page 111.112. The company’s management proxy circular is prepared in accordance with Canadian securities regulations.
The company currently has seven directors. The articles of the company require that the board have between five and fifteen directors. Each director is elected to hold office until the close of the next annual meeting. Each of the seven individuals listed in the section entitled “Nominees"Nominees for director”director" on pages 112113 to 115117 of this report have been nominated for election at the annual meeting of shareholders to be held May 3, 2022.April 30, 2024. All of the nominees, with the exception of N.A. Hansen, are now directors and have been since the dates indicated. M.R. Crocker is a current director and has chosen not to stand for re-election. K.T. Hoeg, J.M. Mintz and D.S. Sutherland retired from the board on May 2, 2023 as they reached the company's mandatory retirement age for directors.
Reference is made to the section under “Nominees"Nominees for director”director":
Reference is made to the sections under “Corporate"Corporate governance disclosure”disclosure":
•"Other public company directorships of our board members and nominees", on page 127 of this report.
•The table entitled "Audit committee" under "Board and committee structure", on page 137 of this report;
Reference is made to the sections under “Company"Company executives and executive compensation”compensation":
•"Named executive officers of the company" and "Other executive officers of the company", on pages 156 to 157 of this report.
Item 11. Executive compensation
Sections of the company’s management proxy circular are contained in the “Proxy"Proxy information section”section", starting on page 111.112. The company’s management proxy circular is prepared in accordance with Canadian securities regulations.
Reference is made to the sections under “Corporate"Corporate governance disclosure”disclosure":
•"Share ownership guidelines of independent directors and chairman, president and chief executive officer", on page 149 of this report.
Reference is made to the following sections under “Company"Company executives and executive compensation”compensation":
Item 12. Security ownership of Contentscertain beneficial owners and management and related stockholder matters
Sections of the company’s management proxy circular are contained in the “Proxy"Proxy information section”section", starting on page 111.112. The company’s management proxy circular is prepared in accordance with Canadian securities regulations.
Reference is made to the section under “Company"Company executives and executive compensation”compensation" entitled “Equity"Equity compensation plan information”information", within the “Compensation"Compensation discussion and analysis”analysis" section, on page 176182 of this report.
Reference is made to the section under “Corporate"Corporate governance disclosure”disclosure" entitled “Largest shareholder”"Largest shareholder", on page 149154 of this report.
Reference is also made to the security ownership information for directors and executive officers of the company under the preceding Items 10 and 11. The compensation of the directors and executive officers of the company for the year-endedyear ended December 31, 20212023 is described in the sections under “Nominees"Nominees for director”director" starting on page 112, “Director compensation”113, "Director compensation" starting on page 137141 and “Company"Company executives and executive compensation”compensation" starting on page 151.156. The following table shows the number of Imperial Oil Limited and Exxon Mobil Corporation common shares owned and restricted stock units held by each named executive officer, and the incumbent directors and executive officers as a group, as of February 15, 2022.
2024.| Imperial Oil Limited | Exxon Mobil Corporation | |||||||||||||
| Named executive officer | Common shares (a) | Restricted stock units (b) | Common shares (a) | Restricted stock units (b) | ||||||||||
| B.W. Corson | — | 410,400 | 129,044 | 59,700 | ||||||||||
| D.E. Lyons | — | 114,400 | 10,780 | 4,800 | ||||||||||
| S.P. Younger | — | 66,100 | 11,025 | 10,300 | ||||||||||
| B.A. Jolly | 13,498 | 76,300 | — | — | ||||||||||
| S.L. Evers | 2,922 | 39,600 | — | — | ||||||||||
Incumbent directors and executive officers as a group (16 people) | 40,921 | 853,450 | 175,823 | 225,123 | ||||||||||
(a)No common shares are beneficially owned by reason of exercisable options. None of these individuals owns more than 0.01 percent of the outstanding shares of Imperial Oil Limited or Exxon Mobil Corporation. The directors and officers as a group own less than 0.01 percent of the outstanding shares of Imperial Oil Limited, and less than 0.01 percent of the outstanding shares of Exxon Mobil Corporation. Information not being within the knowledge of the company has been provided by the directors and the executive officers individually. (b)Restricted stock units do not carry voting rights prior to the issuance of shares on settlement of the awards. | ||||||||||||||
Imperial Oil Limited | Exxon Mobil Corporation | |||||||||||||||
| Named executive officer | Common shares (a) | Restricted stock units (b) | Common shares (a) | Restricted stock units (b) | ||||||||||||
B.W. Corson | - | 234,600 | 114,686 | 88,000 | ||||||||||||
D.E. Lyons | - | 78,000 | 10,046 | 14,400 | ||||||||||||
S.P. Younger | - | 32,400 | 9,457 | 19,900 | ||||||||||||
B.A. Jolly | 31,361 | 68,600 | - | - | ||||||||||||
J.R. Wetmore | 14,939 | 56,900 | - | - | ||||||||||||
Incumbent directors and executive officers as a group (17 people) | 130,655 | 649,550 | 160,390 | 240,200 | ||||||||||||
Item 13. Certain relationships and related transactions, and director independence
Sections of the company’s management proxy circular are contained in the “Proxy"Proxy information section”section", starting on page 111.112. The company’s management proxy circular is prepared in accordance with Canadian securities regulations.
Reference is made to the section under “Corporate"Corporate governance disclosure”disclosure" entitled “Independence"Independence of our board members and nominees”nominees", on page 121123 of this report.
Reference is made to the section under “Corporate"Corporate governance disclosure”disclosure" entitled “Transactions"Transactions with Exxon Mobil Corporation”Corporation", on page 149154 of this report.
As an employee of Exxon Mobil Corporation, M.R. Crocker is deemed apublic policysafety and corporate responsibilitysustainability committee, nominations and corporate governance committee and community collaboration and engagementfinance committee under the relevant standards. AsMr. Crocker has chosen not to stand for re-election. Director nominee N.A. Hansen is an employee of Exxon Mobil Corporation and if elected will also be deemed a non-independent director. As employees of Exxon Mobil Corporation, M.R. Crocker is, and N.A. Hansen will be, independent of the company’s management and is able to assist these committees by reflecting the perspective of the company’s shareholders.
non-independent
member of the board of directors and the executive resources committee, 38
Item 14. Principal accountant fees and services
Auditor information
The audit committee of the board of directors recommends that PricewaterhouseCoopers LLP (PwC) be reappointed as the auditor of the company until the close of the next annual meeting. PwC has been the auditor of the company for more than five years and are located in Calgary, Alberta. PwC is a participating audit firm with the Canadian Public Accountability Board.Board and the Public Company Accounting Oversight Board (United States) (PCAOB).
Auditor fees
The aggregate fees of PwC for professional services rendered for the audit of the company’s financial statements and other services for the fiscal years ended December 31, 20212023 and December 31, 20202022 were as follows:
| thousands of Canadian dollars | 2023 | 2022 | ||||||
| Audit fees | 2,200 | 2,190 | ||||||
| Audit-related fees | 97 | 92 | ||||||
| Tax fees | — | — | ||||||
| All other fees | — | — | ||||||
| Total fees | 2,297 | 2,282 | ||||||
thousands of Canadian dollars | 2021 | 2020 | ||||||
Audit fees | 1,890 | 1,910 | ||||||
Audit-related fees | 92 | 92 | ||||||
Tax fees | - | - | ||||||
All other fees | - | - | ||||||
Total fees | 1,982 | 2,002 | ||||||
Audit fees included the audit of the company’s annual financial statements, internal control over financial reporting, and a review of the first three quarterly financial statements in 2021.2023. Audit-related fees consisted of other assurance services including the audit of the company’s retirement plan and royalty statement audits for oil and gas producing entities. The company did not engage the auditor for any other services.
The audit committee formally and annually evaluates the performance of the external auditor, recommends the external auditor to be appointed by the shareholders, recommends their remuneration and oversees their work. The audit committee also approves the proposed current year audit program of the external auditor, assesses the results of the program after the end of the program period and approves in advance any
non-audit
services to be performed by the external auditor after considering the effect of such services on their independence.All of the services rendered by the auditor to the company were approved by the audit committee.
Auditor independence
The audit committee continuallyperiodically discusses with PwC their independence from the company and from management. PwC have confirmed that they are independent with respect to the company within the meaning of the Rules of Professional Conduct of the Chartered Professional Accountants of Alberta, the Public Company Accounting Oversight Board (United States) (PCAOB)PCAOB and the rules of the U.S. Securities and Exchange Commission.SEC. The company has concluded that the auditor’s independence has been maintained.
PART IV
Item 15. Exhibits, financial statement schedules
Reference is made to the table“Financial section” "Financial section" on page 4243 of this report.
of contents in the
The following exhibits, numbered in accordance with Item 601 of Regulation
S-K,
are filed as part of this report:| (3) | Restated certificate and articles of incorporation of the company (Incorporated herein by reference to Exhibit (3.1) to the company’s Form 8-K filed on May 3, 2006 (File No. 0-12014)). | ||||||||||
| By-laws of the company (Incorporated herein by reference to Exhibit (3)(ii) to the company’s Quarterly Report on Form 10-Q for the quarter ended March 31, 2003 (File No. 0-12014)). | |||||||||||
| (4) | Description of capital stock. (Incorporated herein by reference to Exhibit (4)(vi) of the company’s Annual Report on Form 10-K for the year ended December 31, 2019 (File No. 0-12014)). | ||||||||||
| (10) | (ii) | (1) | Alberta Cold Lake Transition Agreement, effective January 1, 2000, relating to the royalties payable in respect of the Cold Lake production project and terminating the Alberta Cold Lake Crown Agreement dated June 25, 1984. (Incorporated herein by reference to Exhibit (10)(ii)(20) of the company’s Annual Report on Form 10-K for the year ended December 31, 2001 (File No. 0-12014)). | ||||||||
| Syncrude Bitumen Royalty Option Agreement, dated November 18, 2008, setting out the terms of the exercise by the Syncrude Joint Venture owners of the option contained in the existing Crown Agreement to convert to a royalty payable on the value of bitumen, effective January 1, 2009 (Incorporated herein by reference to Exhibit 1.01(10)(ii)(2) of the company’s Form 8-K filed on November 19, 2008 (File No. 0-12014)). | |||||||||||
| (iii)(A) | (1) | Form of Letter relating to Supplemental Retirement Income (Incorporated herein by reference to Exhibit (10)(c)(3) of the company’s Annual Report on Form 10-K for the year ended December 31, 1980 (File No. 2-9259)). | |||||||||
| (2) | Deferred Share Unit Plan for Nonemployee Directors. (Incorporated herein by reference to Exhibit (10)(iii)(A)(6) of the company’s Annual Report on Form 10-K for the year ended December 31, 1998 (File No. 0-12014)). | ||||||||||
| Amended Restricted Stock Unit Plan with respect to Restricted Stock Units granted in 2016 and subsequent years, as amended effective October 26, 2016 (Incorporated herein by reference to Exhibit 9.01(c)[10(iii)(A)(1)] of the company’s Form 8-K filed on October 31, 2016 (File No. 0-12014)). | |||||||||||
| Amended Restricted Stock Unit Plan with respect to Restricted Stock Units granted in 2020 and subsequent years, as amended effective November 24, 2020 (Incorporated herein by reference to Exhibit (10)(iii)(A)(6) of the company’s Annual Report on Form 10-K for the year ended December 31, 2020 (File No. 0-12014)). | |||||||||||
| Amended Restricted Stock Unit Plan with respect to Restricted Stock Units granted in 2022 and subsequent years, as amended effective November 29, 2022 (Incorporated herein by reference to Exhibit (10)(iii)(A)(7) of the company's Annual Report on Form 10-K for the year ended December 31, 2022 (File No. 0-12014)). | |||||||||||
| Amended Short Term Incentive Program, as amended effective December 1, 2023. | |||||||||||
| (21) | Imperial Oil Resources Limited is incorporated in Alberta, Canada and Canada Imperial Oil Limited is incorporated in Canada, and both are wholly-owned subsidiaries of the company. The names of all other subsidiaries of the company are omitted because, considered in the aggregate as a single subsidiary, they would not constitute a significant subsidiary as of December 31, 2023. | ||||||||||
40
| (3) | (i) | Restated certificate and articles of incorporation of the company (Incorporated herein by reference to Exhibit (3.1) to the company’s Form 8-K filed on May 3, 2006 (FileNo. 0-12014)). | ||||
| (ii) | By-laws of the company (Incorporated herein by reference to Exhibit (3)(ii) to the company’s Quarterly Report onForm 10-Q for the quarter ended March 31, 2003 (FileNo. 0-12014)). | |||||
| (4) | (vi) | Description of capital stock. (Incorporated herein by reference to Exhibit (4)(vi) of the company’s Annual Report on Form 10-K for the year ended December 31, 2019 (FileNo. 0-12014)). | ||||
| (10) | (ii) | (1) | Alberta Cold Lake Transition Agreement, effective January 1, 2000, relating to the royalties payable in respect of the Cold Lake production project and terminating the Alberta Cold Lake Crown Agreement dated June 25, 1984. (Incorporated herein by reference to Exhibit (10)(ii)(20) of the company’s Annual Report on Form 10-K for the year ended December 31, 2001 (FileNo. 0-12014)). | |||
| (2) | Syncrude Bitumen Royalty Option Agreement, dated November 18, 2008, setting out the terms of the exercise by the Syncrude Joint Venture owners of the option contained in the existing Crown Agreement to convert to a royalty payable on the value of bitumen, effective January 1, 2009 (Incorporated herein by reference to Exhibit 1.01(10)(ii)(2) of the company’s Form 8-K filed on November 19, 2008 (FileNo. 0-12014)). | |||||
(iii)(A) | (1) | Form of Letter relating to Supplemental Retirement Income (Incorporated herein by reference to Exhibit (10)(c)(3) of the company’s Annual Report on Form 10-K for the year ended December 31, 1980 (FileNo. 2-9259)). | ||||
| (2) | Deferred Share Unit Plan for Nonemployee Directors. (Incorporated herein by reference to Exhibit (10)(iii)(A)(6) of the company’s Annual Report on Form 10-K for the year ended December 31, 1998 (FileNo. 0-12014)). | |||||
| (3) | Amended Restricted Stock Unit Plan with respect to Restricted Stock Units granted in 2011 and subsequent years, as amended effective November 14, 2011 (Incorporated herein by reference to Exhibit 9.01(c)[10(iii)(A)(1)] of the company’s Form 8-K filed on February 23, 2012 (FileNo. 0-12014)). | |||||
| (4) | Amended Restricted Stock Unit Plan with respect to Restricted Stock Units granted in 2016 and subsequent years, as amended effective October 26, 2016 (Incorporated herein by reference to Exhibit 9.01(c)[10(iii)(A)(1)] of the company’s Form 8-K filed on October 31, 2016 (FileNo. 0-12014)). | |||||
| (5) | Amended Short Term Incentive Program with respect to awards granted in 2016 and subsequent years, as amended effective October 26, 2016 (Incorporated herein by reference to Exhibit 9.01(c)[10(iii)(A)(1)] of the company’s Form 8-K filed on October 31, 2016 (FileNo. 0-12014)). | |||||
| (6) | Amended Restricted Stock Unit Plan with respect to Restricted Stock Units granted in 2020 and subsequent years, as amended effective November 24, 2020 (Incorporated herein by reference to Exhibit (10)(iii)(A)(6) of the company’s Annual Report on Form 10-K for the year ended December 31, 2020 (File No. 0-12014)). | |||||
| (21) | Imperial Oil Resources Limited is incorporated in Alberta, Canada and Canada Imperial Oil Limited is incorporated in Canada, and both are wholly-owned subsidiaries of the company. The names of all other subsidiaries of the company are omitted because, considered in the aggregate as a single subsidiary, they would not constitute a significant subsidiary as of December 31, 2021. | |||||
Certification by principal executive officer of Periodic Financial Report pursuant to Rule 13a-14(a). | ||||||
Certification by principal financial officer of Periodic Financial Report pursuant to Rule 13a-14(a). | ||||||
| Certification by principal executive officer of Periodic Financial Report pursuant to Rule 13a-14(a). | |||||||||||||
| Certification by principal financial officer of Periodic Financial Report pursuant to Rule 13a-14(a). | |||||||||||||
Certification by chief executive officer of Periodic Financial Report pursuant to Rule 13a-14(b) and 18 U.S.C. Section 1350. | |||||||||||||
Certification by chief financial officer of Periodic Financial Report pursuant to Rule 13a-14(b) and 18 U.S.C. Section 1350. | |||||||||||||
| SEC Rule 10D-1 Policy for the Recovery of Erroneously Awarded Compensation effective December 1, 2023. | |||||||||||||
| (101) | Interactive Data Files (formatted as Inline XBRL). | ||||||||||||
| (104) | Cover Page Interactive Data File (formatted as Inline XBRL and contained in Exhibit 101). | ||||||||||||
Copies of Exhibits may be acquired upon written request of any shareholder to the vice president, investor relations, Imperial Oil Limited, 505 Quarry Park Boulevard S.E., Calgary, Alberta T2C 5N1, and payment of processing and mailing costs.
Item 16. Form
10-K
summaryNot applicable.
SIGNATURES
Pursuant to the requirements of Section 13 or 15(d) of the Securities Exchange Act of 1934, the registrant has duly caused this report to be signed on its behalf on February 23, 202228, 2024 by the undersigned, thereunto duly authorized.
Imperial Oil Limited | ||||||||
by_____/s/ Bradley W. Corson | ||||||||
| (Bradley W. Corson) | ||||||||
| Chairman, president and chief executive officer | ||||||||
Pursuant to the requirements of the Securities Exchange Act of 1934, this report has been signed below on February 23, 202228, 2024 by the following persons on behalf of the registrant and in the capacities indicated.
| Signature | Title | |||||
/s/ Bradley W. Corson | Chairman, president and chief executive officer and director (Principal executive officer) | |||||
(Bradley W. Corson) | ||||||
/s/ Daniel E. Lyons | Senior vice-president, finance and administration, and controller | |||||
| (Principal financial officer and principal accounting officer) | ||||||
/s/ David W. Cornhill | Director | |||||
(David W. Cornhill) | ||||||
/s/ Matthew R. Crocker | Director | |||||
(Matthew R. Crocker) | ||||||
| /s/ Sharon R. Driscoll | Director | |||||
| (Sharon R. Driscoll) | ||||||
| /s/ John N. Floren | Director | |||||
(John N. Floren) | ||||||
| /s/ | Director | |||||
/s/ Miranda C. Hubbs | Director | |||||
(Miranda C. Hubbs) | ||||||
Financial section
Table of contents | Page | |||||||
| Management’s report on internal control over financial reporting | ||||||||
| Independent Registered Public Accounting Firm | ||||||||
| 2. Business segments | ||||||||
| 18. Divestment activities | ||||||||
| Supplemental information on oil and gas exploration and production activities (unaudited) | ||||||||
Financial information (U.S. GAAP)
| millions of Canadian dollars | 2023 | 2022 | 2021 | ||||||||
| Revenues | 50,702 | 59,413 | 37,508 | ||||||||
| Net income (loss): | |||||||||||
| Upstream | 2,512 | 3,645 | 1,395 | ||||||||
| Downstream | 2,301 | 3,622 | 895 | ||||||||
| Chemical | 164 | 204 | 361 | ||||||||
| Corporate and other | (88) | (131) | (172) | ||||||||
| Net income (loss) | 4,889 | 7,340 | 2,479 | ||||||||
| Cash and cash equivalents at year-end | 864 | 3,749 | 2,153 | ||||||||
| Total assets at year-end | 41,199 | 43,524 | 40,782 | ||||||||
| Long-term debt at year-end | 4,011 | 4,033 | 5,054 | ||||||||
| Total debt at year-end | 4,132 | 4,155 | 5,176 | ||||||||
| Other long-term obligations at year-end | 3,851 | 3,467 | 3,897 | ||||||||
| Shareholders’ equity at year-end | 22,222 | 22,413 | 21,735 | ||||||||
| Cash flow from operating activities | 3,734 | 10,482 | 5,476 | ||||||||
Per share information (Canadian dollars) | |||||||||||
| Net income (loss) per common share - basic | 8.51 | 11.47 | 3.48 | ||||||||
| Net income (loss) per common share - diluted | 8.49 | 11.44 | 3.48 | ||||||||
| Dividends per common share - declared | 1.94 | 1.46 | 1.03 | ||||||||
millions of Canadian dollars | 2021 | 2020 | 2019 | |||||||||
Revenues | 37,508 | 22,284 | 34,002 | |||||||||
Net income (loss): | ||||||||||||
Upstream | 1,395 | (2,318 | ) | 1,348 | ||||||||
Downstream | 895 | 553 | 961 | |||||||||
Chemical | 361 | 78 | 108 | |||||||||
Corporate and other | (172 | ) | (170 | ) | (217 | ) | ||||||
Net income (loss) | 2,479 | (1,857 | ) | 2,200 | ||||||||
Cash and cash equivalents at year-end | 2,153 | 771 | 1,718 | |||||||||
Total assets at year-end | 40,782 | 38,031 | 42,187 | |||||||||
Long-term debt at year-end | 5,054 | 4,957 | 4,961 | |||||||||
Total debt at year-end | 5,176 | 5,184 | 5,190 | |||||||||
Other long-term obligations at year-end | 3,897 | 4,100 | 3,637 | |||||||||
Shareholders’ equity at year-end | 21,735 | 21,418 | 24,276 | |||||||||
Cash flow from operating activities | 5,476 | 798 | 4,429 | |||||||||
Per share information (Canadian dollars) | ||||||||||||
Net income (loss) per common share - basic | 3.48 | (2.53 | ) | 2.88 | ||||||||
Net income (loss) per common share - diluted | 3.48 | (2.53 | ) | 2.88 | ||||||||
Dividends per common share - declared | 1.03 | 0.88 | 0.85 | |||||||||
Frequently used terms
Listed below are definitions of several of Imperial’sthe company’s key business and financial performance measures. The definitions are provided to facilitate understanding of the terms and how they are calculated. TheseCertain measures included in this document are not prescribed by U.S. Generally Accepted Accounting Principles (GAAP). These measures constitute“non-GAAP "non-GAAP financial measures”measures" under Securities and Exchange Commission Regulation G and “specifiedItem 10(e) of Regulation S-K, and "specified financial measures”measures" under National Instrument
52-112
Non-GAAP
and Other Financial Measures Disclosureof the Canadian Securities Administrators.Reconciliation of these non-GAAP financial measures to the most comparable GAAP financial measure, and other information required by these regulations, have been provided.
Non-GAAP
financial measures and specified financial measures are not standardized financial measures under GAAP and do not have a standardized definition. As such, these measures may not be directly comparable to measures presented by other companies, and should not be considered a substitute for GAAP financial measures.Capital employed
Capital employed is a
non-GAAP
financial measure that is a measurement of net investment. When viewed from the perspective of how capital is used by the business, it includes the company’s property, plant and equipment and other assets, less liabilities, excluding both short-term and long-term debt. When viewed from the perspective of the sources of capital employed in total for the company, it includes total debt and equity. The most directly comparable financial measure that is disclosed in the financial statements is total assets within the company’s Consolidated balance sheet. Both of these views include the company’s share of amounts applicable to equity companies, which the company believes should be included to provide a more comprehensive measurement of capital employed.Reconciliation of capital employed
| millions of Canadian dollars | 2023 | 2022 | 2021 | |||||||||||
| From the Consolidated balance sheet | ||||||||||||||
| Business uses: asset and liability perspective | ||||||||||||||
| Total assets | 41,199 | 43,524 | 40,782 | |||||||||||
| Less: | Total current liabilities excluding notes and loans payable | (6,482) | (8,776) | (5,432) | ||||||||||
| Total long-term liabilities excluding long-term debt | (8,363) | (8,180) | (8,439) | |||||||||||
| Add: | Imperial’s share of equity company debt | 21 | 25 | 20 | ||||||||||
| Total capital employed | 26,375 | 26,593 | 26,931 | |||||||||||
| Total company sources: Debt and equity perspective | ||||||||||||||
| Notes and loans payable | 121 | 122 | 122 | |||||||||||
| Long-term debt | 4,011 | 4,033 | 5,054 | |||||||||||
| Shareholders’ equity | 22,222 | 22,413 | 21,735 | |||||||||||
| Add: | Imperial’s share of equity company debt | 21 | 25 | 20 | ||||||||||
| Total capital employed | 26,375 | 26,593 | 26,931 | |||||||||||
| millions of Canadian dollars | 2021 | 2020 | 2019 | |||||||||||
From the Consolidated balance sheet | ||||||||||||||
Business uses: asset and liability perspective | ||||||||||||||
Total assets | 40,782 | 38,031 | 42,187 | |||||||||||
Less: | Total current liabilities excluding notes and loans payable | (5,432 | ) | (3,153 | ) | (4,366 | ) | |||||||
| Total long-term liabilities excluding long-term debt | (8,439 | ) | (8,276 | ) | (8,355 | ) | ||||||||
Add: Imperial’s share of equity company debt | 20 | 26 | 24 | |||||||||||
Total capital employed | 26,931 | 26,628 | 29,490 | |||||||||||
Total company sources: Debt and equity perspective | ||||||||||||||
Notes and loans payable | 122 | 227 | 229 | |||||||||||
Long-term debt | 5,054 | 4,957 | 4,961 | |||||||||||
Shareholders’ equity | 21,735 | 21,418 | 24,276 | |||||||||||
Add: Imperial’s share of equity company debt | 20 | 26 | 24 | |||||||||||
Total capital employed | 26,931 | 26,628 | 29,490 | |||||||||||
Return on average capital employed (ROCE)
ROCE is aamounts). Segment net income includes Imperial’s share of segment net income of equity companies, consistent with the definition used for capital employed, and excludes the cost of financing. Capital employed is a
non-GAAP
ratio. From the perspective of the business segments, ROCE is annual business segment net income divided by average business segment capital employed (an average of the beginning andend-of-year
non-GAAP
financial measure and is disclosed and reconciled above. The company’s total ROCE is net income excluding theafter-tax
cost of financing divided by total average capital employed. The company has consistently applied its ROCE definition for many years and views it as one of the best measures of historical capital productivity in a capital-intensive, long-term industry. Additional measures, which are more cash flow based, are used to make investment decisions.Components of return on average capital employed
| millions of Canadian dollars | 2023 | 2022 | 2021 | ||||||||
| From the Consolidated statement of income | |||||||||||
| Net income (loss) | 4,889 | 7,340 | 2,479 | ||||||||
| Financing (after-tax) including Imperial’s share of equity companies | 66 | 55 | 40 | ||||||||
| Net income (loss) excluding financing | 4,955 | 7,395 | 2,519 | ||||||||
| Average capital employed | 26,484 | 26,762 | 26,780 | ||||||||
Return on average capital employed (percent) – corporate total | 18.7 | 27.6 | 9.4 | ||||||||
| millions of Canadian dollars | 2021 | 2020 | 2019 | |||||||||
From the Consolidated statement of income | ||||||||||||
Net income (loss) | 2,479 | (1,857 | ) | 2,200 | ||||||||
Financing (after-tax) including Imperial’s share of equity companies | 40 | 52 | 66 | |||||||||
Net income (loss) excluding financing | 2,519 | (1,805 | ) | 2,266 | ||||||||
Average capital employed | 26,780 | 28,059 | 29,591 | |||||||||
Return on average capital employed (percent) – corporate total | 9.4 | (6.4 | ) | 7.7 | ||||||||
Cash flows from operating activities and asset sales
Cash flows from operating activities and asset sales is a
non-GAAP
financial measure that is the sum of the net cash provided by operating activities and proceeds from asset sales reported in the Consolidated statement of cash flows. This cash flow reflects the total sources of cash both from operating the company’s assets and from the divesting of assets. The most directly comparable financial measure that is disclosed in the financial statements is cash flows from (used in) operating activities within the company’s Consolidated statement of cash flows. The company employs a long-standing and regular disciplined review process to ensure that assets are contributing to the company’s strategic objectives. Assets are divested when they no longer meet these objectives or are worth considerably more to others. Because of the regular nature of this activity, the company believes it is useful for investors to consider sales proceeds together with cash provided by operating activities when evaluating cash available for investment in the business and financing activities, including shareholder distributions.Reconciliation of cash flows from (used in) operating activities and asset sales
| millions of Canadian dollars | 2023 | 2022 | 2021 | ||||||||
| From the Consolidated statement of cash flows | |||||||||||
| Cash flows from (used in) operating activities | 3,734 | 10,482 | 5,476 | ||||||||
| Proceeds from asset sales | 86 | 904 | 81 | ||||||||
| Total cash flows from (used in) operating activities and asset sales | 3,820 | 11,386 | 5,557 | ||||||||
millions of Canadian dollars | 2021 | 2020 | 2019 | |||||||||
From the Consolidated statement of cash flows | ||||||||||||
Cash flows from operating activities | 5,476 | 798 | 4,429 | |||||||||
Proceeds from asset sales | 81 | 82 | 82 | |||||||||
Total cash flows from operating activities and asset sales | 5,557 | 880 | 4,511 | |||||||||
Operating costs
Operating costs is a
non-GAAP
financial measure that are the costs during the period to produce, manufacture, and otherwise prepare the company’s products for sale – including energy costs, staffing and maintenance costs. It excludes the cost of raw materials, taxes and interest expense and are on abefore-tax
basis. The most directly comparable financial measure that is disclosed in the financial statements is total expenses within the company’s Consolidated statement of income. While the company is responsible for all revenue and expense elements of net income, operating costs represent the expenses most directly under the company’s control and therefore, are useful in evaluating the company’s performance.Reconciliation of operating costs
| millions of Canadian dollars | 2023 | 2022 | 2021 | ||||||||
| From the Consolidated statement of income | |||||||||||
| Total expenses | 44,600 | 50,186 | 34,307 | ||||||||
| Less: | |||||||||||
| Purchases of crude oil and products | 32,399 | 37,742 | 23,174 | ||||||||
| Federal excise tax and fuel charge | 2,402 | 2,179 | 1,928 | ||||||||
| Financing | 69 | 60 | 54 | ||||||||
| Subtotal | 34,870 | 39,981 | 25,156 | ||||||||
| Imperial's share of equity company expenses | 76 | 71 | 61 | ||||||||
| Total operating costs | 9,806 | 10,276 | 9,212 | ||||||||
Components of operating costs
| millions of Canadian dollars | 2023 | 2022 | 2021 | ||||||||
| From the Consolidated statement of income | |||||||||||
| Production and manufacturing | 6,879 | 7,404 | 6,316 | ||||||||
| Selling and general | 857 | 882 | 784 | ||||||||
| Depreciation and depletion | 1,907 | 1,897 | 1,977 | ||||||||
| Non-service pension and postretirement benefit | 82 | 17 | 42 | ||||||||
| Exploration | 5 | 5 | 32 | ||||||||
| Subtotal | 9,730 | 10,205 | 9,151 | ||||||||
| Imperial's share of equity company expenses | 76 | 71 | 61 | ||||||||
| Total operating costs | 9,806 | 10,276 | 9,212 | ||||||||
| millions of Canadian dollars | 2021 | 2020 | 2019 | |||||||||
From the Consolidated statement of income | ||||||||||||
Total expenses | 34,307 | 24,796 | 32,055 | |||||||||
Less: | ||||||||||||
Purchases of crude oil and products | 23,174 | 13,293 | 20,946 | |||||||||
Federal excise tax and fuel charge | 1,928 | 1,736 | 1,808 | |||||||||
Financing | 54 | 64 | 93 | |||||||||
Subtotal | 25,156 | 15,093 | 22,847 | |||||||||
Imperial’s share of equity company expenses | 61 | 64 | 76 | |||||||||
Total operating costs | 9,212 | 9,767 | 9,284 | |||||||||
Components of operating costs | ||||||||||||
| millions of Canadian dollars | 2021 | 2020 | 2019 | |||||||||
From the Consolidated statement of income | ||||||||||||
Production and manufacturing | 6,316 | 5,535 | 6,520 | |||||||||
Selling and general | 784 | 741 | 900 | |||||||||
Depreciation and depletion (includes impairments) | 1,977 | 3,293 | 1,598 | |||||||||
Non-service pension and postretirement benefit | 42 | 121 | 143 | |||||||||
Exploration | 32 | 13 | 47 | |||||||||
Subtotal | 9,151 | 9,703 | 9,208 | |||||||||
Imperial’s share of equity company expenses | 61 | 64 | 76 | |||||||||
Total operating costs | 9,212 | 9,767 | 9,284 | |||||||||
Net income (loss) excluding identified items
Net income (loss) excluding identified items is anet"Net income (loss)" within the company’s Consolidated statement of income. Management uses these figures to improve comparability of the underlying business across multiple periods by isolating and removing significant
non-GAAP
financial measure that is total net income (loss) excluding individually significantnon-operational
events with an absolute corporate total earnings impact of at least $100 million in a given quarter. The net income (loss) impact of an identified item for an individual segment in a given quarter may be less than $100 million when the item impacts several segments or several periods. The most directly comparable financial measure that is disclosed in the financial statements is non-operational
events from business results. The company believes this view provides investors increased transparency into business results and trends, and provides investors with a view of the business as seen through the eyes of management. Net income (loss) excluding identified items is not meant to be viewed in isolation or as a substitute for net income (loss) as prepared in accordance with U.S. GAAP. All identified items are presented on anafter-tax
basis.Reconciliation of net income (loss) excluding identified items
| millions of Canadian dollars | 2023 | 2022 | 2021 | ||||||||
| From the Consolidated statement of income | |||||||||||
| Net income (loss) (U.S. GAAP) | 4,889 | 7,340 | 2,479 | ||||||||
| Less identified items included in Net income (loss) | |||||||||||
| Gain/(loss) on sale of assets | — | 208 | — | ||||||||
| Subtotal of identified items | — | 208 | — | ||||||||
| Net income (loss) excluding identified items | 4,889 | 7,132 | 2,479 | ||||||||
| millions of Canadian dollars | 2021 | 2020 | 2019 | |||||||||
From the Consolidated statement of income | ||||||||||||
Net income (loss) (U.S. GAAP) | 2,479 | (1,857 | ) | 2,200 | ||||||||
Less identified items included in Net income (loss) | ||||||||||||
Impairments | - | (1,171 | ) | - | ||||||||
Tax adjustments | - | - | 662 | |||||||||
Subtotal of identified items | - | (1,171 | ) | 662 | ||||||||
Net income (loss) excluding identified items | 2,479 | (686 | ) | 1,538 | ||||||||
Management’s discussion and analysis of financial condition and results of operations
Overview
The following discussion and analysis of Imperial’sthe company’s financial results, as well as the accompanying financial statements and related notes to consolidated financial statements to which they refer, are the responsibility of the management of Imperial Oil Limited.
The company’s accounting and financial reporting fairly reflect its integrated business model involving exploration for, and production of, crude oil and natural gas,gas; manufacture, trade, transport and sale of crude oil, natural gas, petroleum products, petrochemicals and a variety of specialty products.
products; and pursuit of lower-emission business opportunities including carbon capture and storage, and lower-emission fuels.Imperial, with its resource base, financial strength, disciplined investment approach and technology portfolio, is well-positioned to participate in substantial investments to develop new Canadian energy supplies. The company’s operatingreportable segments are Upstream, Downstream, Chemicals, and Corporate and other. The company’s integrated business model generally reduces the company’s risk from changes in commodity prices. While commodity prices depend on supply and demand and may be volatile on a short-term basis, Imperial’sthe company’s investment decisions are grounded on fundamentals reflected in its long-term business outlook, and use a disciplined approach in selecting and pursuing the most attractive investment opportunities. The corporateannual company plan is a fundamental annual management process that is the basis for setting operating and capital objectives, in addition to providingestablishes the economic assumptions used for investment evaluation purposes. Theevaluating investments and sets operating and capital objectives. ExxonMobil's Global Outlook (the Outlook), developed annually, is the foundation for the energy supplyplan assumptions. Price ranges for crude oil, including price differentials, refinery and demandchemical margins, volumes, operating costs including greenhouse gas emissions pricing, and foreign currency exchange rates are part of the company plan assumptions supporting the corporate plan is ExxonMobil’sOutlookforEnergy, and corporatedeveloped annually. Company plan volume projections are based on individual field production profiles, which are also updated at least annually. Price ranges for crude oil, natural gas, including price differentials, refinery and chemical margins, volumes and operating costs including greenhouse gas emission prices and foreign currency exchange rates are based on corporate plan assumptions developed annually and are utilized for investment evaluation purposes. Major investment opportunities are evaluated over a range of potential market conditions. OnceAll major investments are made, a reappraisal process is completedreappraised to ensure relevant lessons arewe learn from our investment decisions, and the development and execution of the project. Lessons learned and improvements are incorporated into future projects.
The term “project”"project" as used in this report can refer to a variety of different activities and does not necessarily have the same meaning as in any government payment transparency reports.
Business environment
Long-term business outlook
The “Long-term"Long-term business outlook”outlook" is based on Exxon Mobil Corporation’s(the (the Outlook), which combined with the near-term pathways, is used to help inform the company’s long-term business strategies and investment plans.
Global Outlook for Energy
The company’s business planning is underpinned by a deep understanding of long-term energymarket fundamentals. These fundamentals include energy supply and demand trends; the scale and variety of energy needs worldwide; capability, practicality and affordability of energy alternatives, includingsupportiverelevant government policies. The Outlook considers these fundamentals to form the basis for the company’s long-term business planning, investment decisions, and research programs. The Outlook reflects the company’s view of global energy demand and supply through 2050. It is a projection based on current trends in technology, government policies, consumer preferences, geopolitics, and economic development. In addition,
low-carbon
solutions; greenhouse gas emission-reduction technologies; and The Outlook uses projections and scenarios from reputable third parties such as the Outlook considers a range of scenarios - including remote scenarios - to help inform perspective ofInternational Energy Agency (IEA) and the future and enhance strategic thinking over time.Intergovernmental Panel on Climate Change (IPCC). Included in the range of these scenarios areare: the Intergovernmental PanelIPCC likely below 2°C scenarios and three scenarios from the IEA; IEA Stated Policies Scenario (STEPS), which reflects a sector-by-sector assessment of current policy in place or announced by governments; IEA Announced Pledges Scenario (APS), which reflects aspirational government targets met on Climate Change Lower 2°Ctime and the International Energy Agency’sin full; and IEA Net Zero Emissions (IEA NZE) by 2050 scenario. To effectively evaluate the pace of change, ExxonMobil uses many scenarios to help identify signposts to provide leading indicators of future developments and allow for timely adjustments to the Outlook. The IEA describesScenario (NZE), which the IEA NZEdescribes as extremely challenging, requiring all stakeholders – governments, businesses, investors and citizens – to take action this year and every year after so that the goal does not slip out of reach. The scenario assumes unprecedented and sustained energy efficiency gains, innovation and technology transfer, lower-emission investments, and globally coordinated greenhouse gas reduction policy. The IEA acknowledgesacknowledging that society is not currently on the IEA NZE pathway. No single transition pathway can be reasonably predicted, given the wide range of uncertainties. Key unknowns include yet-to-be-developed government policies, market conditions, and advances in technology that may influence the cost, pace, and potential availability of certain pathways. Scenarios that employ a full complement of technology options are likely to provide the most economically efficient pathways.
Using the company's own experts and third-party sources, the company monitors a variety of signposts that may indicate a potential shift in the energy transition. For example, the regional pace of the transition could be influenced by the cost of new technologies compared to existing or alternative energy sources.
By 2050, the world’s population is projected atto be around 9.7 billion people, or about 2 billion more than in 2019.2021. Coincident with this population increase, the company expectsOutlook projects worldwide economic growth to average close toapproximately 2.5 percent per year, with economic output growing by around 125110 percent by 2050 compared to 2019.2021. As economies and populations grow, and as living standards improve for billions of people, the need for energy is expected to continue to rise. Even with significant efficiency gains, global energy demand is projected to rise by almost 15 percent from 20192021 to 2050. This increase in energy demand is expected to be driven by developing countries (i.e., those that are not member nations of the Organization for Economic Co-operation and Development (OECD)).
As expanding prosperity drives global energy demand higher, increasing use of energy-efficient technologies and practices, as well as lower-emission products, will continue to help significantly reduce energy consumption and CO2 emissions per unit of economic output over time. Substantial efficiency gains are likely in all key aspects of the world’s economy through 2050, affecting energy requirements for power generation, transportation, industrial applications, and residential and commercial needs.
Under the Outlook, global electricity demand is expected to increase almost 75about 80 percent from 20192021 to 2050, with developing countries likely to account for about 80over 75 percent of the increase. Consistent with this projection, power generation is expected to remain the largest and fastest growing major segment of global primary energy demand, supported by a wide variety of energy sources. The share of coal-fired generation is expected to decline substantially and approachto approximately 15 percent of the world’s electricity in 2050, versus nearlyapproximately 35 percent in 2019,2021, in part as a result ofdue to policies to improve air quality as well as reduce greenhouse gas emissions to address risks related to climate change. From 20192021 to 2050, the amount of electricity supplied using natural gas, nuclear power, and renewables is likelyexpected to more than double, accounting for the entire growth in electricity supplies and offsetting the reduction of coal. Electricity from wind and solar is expected to increase more than 600550 percent, helping total renewables (including other sources, i.e.e.g., hydropower) to account for aboutover 80 percent of the increase in electricity supplies worldwide through 2050. Total renewables are expected to reach about 50 percent of global electricity supplies by 2050. Natural gas and nuclear are also expected to increase shares over the period to 2050, reaching more than 25be about 20 percent and about 10 percent, respectively, of global electricity supplies respectively, by 2050. Supplies of electricity by energy type will reflect
50
significant differences across regions reflecting a wide range of factors, including the cost and availability of various energy supplies and policy developments.
Almost half of the world’s energy use is dedicated to industrial activity. As the global middle class continues to grow, demand for durable products, appliances, and consumable goods will increase. Industry uses energy products both as a fuel and as a feedstock for chemicals, asphalt, lubricants, waxes, and other specialty products. The Outlook anticipates technology advances, as well as the increasing shift toward cleaner forms of energy, such as electricity and natural gas, with coal declining. Demand for oil will continue to grow as a feedstock for industry.
As populations grow and prosperity rises, more energy will be needed to power homes, offices, schools, shopping centers, hospitals, etc. Combined residential and commercial energy demand is projected to rise by around 15 percent through 2050. Led by the growing economies of developing nations, average worldwide household electricity use will rise about 75 percent between 2021 and 2050.
Liquid fuels provide the largest share of global energy supplies today reflecting broad-based availability, affordability, ease of transportation, and fitness as a practical solution to meet a wide variety of needs. By 2050, global demand for liquid fuels is projected to grow to approximately 114110 million1415 percent from 2019.2021. Thetraditional conventional sources; these supplies will remain important, and significant development activity is expected to offset much of the natural declines from these fields. At the same time, a variety of emerging supply sources –- including tight oil, deepwater, oil sands, natural gas liquids, and biofuels –- are expected to grow to help meet rising demand. The world’s resource base is sufficient to meet projected demand through 2050 as technology advances continue to expand the availability of economic and lower-carbon supply options. However, timelyTimely investments will remain critical to meeting global needs with reliable and affordable supplies.
oil-equivalent
barrels per day, an increase of about non-OECD
share of global liquid fuels demand is expected to increase to nearly 70 percent by 2050, as liquid fuels demand in the OECD is expected to decline by more than 20 percent. Much of the global liquid fuels demand today is met by crude production from Natural gas is a lower-emission, versatile and practical fuel for a wide variety of applications, and itapplications. It is expected to grow the most of any primary energy type from 20192021 to 2050, meeting about 5540 percent of global energy demand growth. Global natural gas demand is expected to rise nearly 3525 percent from 20192021 to 2050, with moregreater than half75 percent of that increase coming from the Asia Pacific region. Significant growth in supplies of unconventional gas –- the natural gas found in shale and other tight rock formations –- will help meet these needs. In total, about 50 percent of the growth in natural gas supplies is expected to become from unconventional sources. At the same time, conventionally-produced natural gas is likely to remain the cornerstone of global supply, meeting more than40 percenttwo thirds of the increase in global demand growth, with much of this supply expected to help meet rising demand in Asia Pacific.
around two-thirds
of worldwide demand in 2050. Liquefied natural gas (LNG) trade will expand significantly, meeting about The world’s energy mix is highly diverse and will remain so through 2050. Oil is expected to remaincontinue as the largest source of energy with its share remaining close to 30 percent in 2050. Coal is currentlyand natural gas are the secondnext largest sourcesources of energy but it is expected to lose that position to natural gas intoday, with the next few years. The share of natural gas is expectedgrowing to reach more than 25 percent by 2050, while the share of coal falls to about half that.that of natural gas. Nuclear power is projected to grow, significantly, as many nations are likely to expand nuclear capacity to address rising electricity needs as well as energy security and environmental issues. Total renewable energy is expected to exceed 20 percent of global energy by 2050, with other renewables (e.g., biomass, hydro and geothermalhydropower, geothermal) contributing a combined share of more than 10 percent. Total energy supplied from wind solar and biofuelssolar is expected to increase rapidly, growing over 420500 percent from 20192021 to 2050, when they are projected to be aboutaround 10 percent of the world energy mix.
Decarbonization of industrial activities will require a suite of nascent or future lower-carbon technologies and supporting policies. Lower-emission fuels, hydrogen-based fuels, and carbon capture and storage are three key
51
lower-carbon solutions needed to support a lower-emission future, in addition to wind and solar. Along with electrification, lower-emission fuels are expected to play an important role in decarbonization of the transportation sector, particularly in hard-to-decarbonize areas, such as aviation. Low-carbon hydrogen will be a key enabler replacing traditional furnace fuel to decarbonize the industrial sector. Hydrogen and hydrogen-based fuels like ammonia are also expected to make inroads into commercial transportation as technology improves to lower its cost and policy develops to support the needed infrastructure development. Carbon capture and storage on its own, or in combination with hydrogen production, is among the few proven technologies that could enable CO2 emission reductions from high-emitting and hard-to-decarbonize sectors such as power generation and heavy industries, including manufacturing, refining, and petrochemicals.
To meet this projected demand under the Outlook and the IEA's STEPS, the company anticipates that the world’s available oil and gas resource base will grow, not only from new discoveries, but also from increases in previously discovered fields. Technology will underpin these increases. The investments to develop and supply resources to meet global demand through 2050 will be significant. This reflects a fundamental aspect of thesignificant and would be needed to meet even rapidly declining demand for oil and natural gas business as the International Energy Agency (IEA) describesenvisioned in itsWorld Energy Outlook 2021.aggressive decarbonization scenarios.
International accords and underlying regional and national regulations covering greenhouse gas emissions continue to evolve with uncertain timing and outcome, making it difficult to predict their business impact. Imperial’sThe company’s estimates of potential costs related to greenhouse gas emissions align with applicable provincial and federal regulations. Additionally, Imperialthe company uses ExxonMobil’sas a foundation for estimating energy supply and demand requirements from various energy sources and uses, and thetakes into account policies established to reduce energy related greenhouse gas emissions. The climate accord reached at the 2015 Conference of the Parties (COP 21) in Paris set many new goals, and many related policies are still emerging. Thereflects an environment with increasingly stringent climate policies and is consistent with the successful achievement of the global aggregation of Nationally Determined Contributions (NDCs), submitted by the nations that are signatories to the Paris Agreement, as available at the end of 2020, which were submitted by signatories to2022. The Outlook assumes success of these NDCs, despite the 2023 United Nations Framework Convention on Climate Change (UNFCCC) 2015 Paris Agreement.Environment Programme (UNEP) Emissions Gap Report projecting that the G20 members will fall short of their NDCs. Theseeks to identify potential impacts of climate related government policies, which often target specific sectors. It estimates potential impactsFor purposes of these policies on consumer energy demand by using various assumptions and tools – including, depending on the sector, and as applicable, use ofOutlook, a proxy cost on energy-related CO2 emissions is assumed, based on regional considerations and relative levels of carbon or assessment of targeted policies (i.e., automotive fuel economy standards). Aseconomic development, and by 2050, reaches up to $150 USD per metric ton for OECD nations and up to $100 USD per metric ton for non-OECD nations. China and other leading non-OECD nations are expected to trail OECD policy initiatives. Nevertheless, as people and nations look for ways to reduce risks of global climate change, they will continue to need practical solutions that do not jeopardize the affordability or reliability of the energy they need. The company continues to monitor the updates to the NDCs that nations have provided around COP 2628 in GlasgowDubai in November 20212023, as well as other policy developments in light of net zeronet-zero ambitions recently formulated by some nations, including Canada.
the Outlook for Energy
Outlook for Energy
Outlook for Energy
Outlook for Energy
The information provided in the “Long-term business outlook”Outlook includes ExxonMobil's internal estimates and projections based upon ExxonMobil’s internal data and analyses, as well as publicly available information from external sources including the International Energy Agency.
Progress reducing emissions
Practical solutions to the world’s energy and climate challenges will benefit from market competition in addition to well-informed, well-designed and transparent policy approaches that carefully weigh costs and benefits. Such policies are likely to help manage the risks of climate change while also enabling societies to pursue other high priority goals around the world – including clean air and water, access to reliable and affordable energy, and economic progress for all people. The company encourages sound policy solutions that reduce climate-related risks across the economy at the lowest societal cost. All practical and economically viable energy sources will need to be pursued to continue meeting global energy demand, recognizing the scale and variety of worldwide energy needs, as well as the importance of expanding access to modern energy to promote better standards of living for billions of people.
As part of the company’s efforts to provide solutions that lower the greenhouse gas emissions intensity of its operations and provide lower life-cycle emissions products to customers, the company has announced a company-wide goal to achieve net zero emissions (Scope 1 and 2) by 2050 in its operated assets through collaboration with government and industry partners. Successful technology development and supportive fiscal
52
and regulatory frameworks will be needed to achieve this goal. This work builds on the company’s previously announced net-zero goal for operated oil sands as part of the Pathways Alliance initiative, as well as the company’s emission intensity reduction goal of 30 percent by 2030 for operated oil sands facilities when compared to 2016 levels. The company plans to achieve its net zero goal by applying oil sands recovery technologies that use less steam, implementing carbon capture and storage and implementing efficiency projects including the use of lower carbon fuels at its operations.
Energy markets began to closely monitor industrynormalize in 2023, down from their 2022 highs. During the first half of 2023, the price of crude oil declined, impacted by higher inventory levels. In the second half, crude oil prices increased modestly from strong demand, and global economic conditions amid this uneven global recovery fromongoing actions by OPEC+ oil producers to limit supply. In addition, theCOVID-19pandemic which has brought unprecedented uncertainties Canadian WTI/WCS spread began to near-term economic outlooks, including recovery fromweaken in theCOVID-19pandemic. fourth quarter, but remained in line with 2022 on an annual basis. Throughout 2023, strong demand for gasoline and distillate combined with low inventories kept refining margins strong, but short of 2022 levels on an annual basis. In the fourth quarter, refining margins dropped due to higher inventory and lower seasonal demand.
The general rate of inflation in Canada and across many other major countries experienced a brief declinepeaked in 2022, rising from already elevated levels in 2021, due to additional impacts on energy and other commodities from the Russia-Ukraine conflict. Inflation moderated in 2023 as major central banks tightened monetary policy aggressively and global GDP growth slowed. In Canada, it currently remains higher than the Bank of Canada's inflation target. Meanwhile, there are significant variations across OECD and non-OECD in the initial stagepace of theCOVID-19pandemic. However inflation rates increasedchange in 2021 across major economies, with some regions experiencing multi-decade highs, largely reflecting overall imbalances between supply and demand recoveries from the pandemic. The underlying factors include, but are not limited to, global supply chain disruptions, shipping bottlenecks, labor market constraints and side effects from monetary and fiscal expansions. The global economic recovery remains uneven with significant uncertainty. Prices for services and materials continue to evolve in response to fast-changing commodity markets, industry activities, as well as government policies, impacting operating and capital costs.inflation. The company closely monitors market trends and works to mitigate both operating and capital cost impacts in all price environments through its economies of scale in global procurement, efficient project management practices, and general productivity improvements.environments.
Business results
Consolidated
millions of Canadian dollars | 2021 | 2020 | 2019 | |||||||||
Net income (loss) (U.S. GAAP) | 2,479 | (1,857 | ) | 2,200 | ||||||||
Identified items included in Net income (loss) (a) | ||||||||||||
Impairments | - | (1,171 | ) | - | ||||||||
Tax adjustments | - | - | 662 | |||||||||
Subtotal of identified items | - | (1,171 | ) | 662 | ||||||||
Net income (loss) excluding identified items (a) | 2,479 | (686 | ) | 1,538 | ||||||||
| millions of Canadian dollars | 2023 | 2022 | 2021 | ||||||||
Net income (loss) (U.S. GAAP) | 4,889 | 7,340 | 2,479 | ||||||||
Identified items1 included in Net income (loss) | |||||||||||
| Gain/(loss) on sale of assets | — | 208 | — | ||||||||
Subtotal of identified items1 | — | 208 | — | ||||||||
Net income (loss) excluding identified items1 | 4,889 | 7,132 | 2,479 | ||||||||
Net income in 20212023 was $2,479$4,889 million, or $3.48$8.49 per share on a diluted basis, compared to a net loss of $1,857$7,340 million, or $2.53$11.44 per share in 2020. Prior year results2022.
2022
Net income in 2022 was $7,340 million, or $11.44 per share on a diluted basis, up from $2,479 million, or $3.48 per share in 2021. Results include unfavourablefavourable identified items
1
of $1,171$208 million after tax, related to the company’s decision to no longer develop a significant portiongain on the sale of its unconventional portfolio.
interests in XTO Energy Canada.1 non-GAAP | financial measure reconciliation. | ||||||||||||||
53
Upstream
Overview
value-add,
long-term growth opportunities within the context of the factors described in in-situ
oil sands project, as economically justified.Key events
Upstream assetassets demonstrated strong operational performance met or exceeded expectations in 2021.2023. The company continued to benefit from its actions implemented in 2020prior years to reducemanage the cost structure and improve the reliability of its assets, enabling the Upstream to capture significant value and take advantage of the improving business environment throughout 2021.
value.Upstream delivered its highestfull-year production in over 30 years, supported by Kearl achieving record annual totalaveraged 413,000 gross production of about 263,000oil-equivalent barrels per day (186,000 barrels Imperial’s share). The company adjusted its planned maintenance and turnaround activity atday.
At Kearl, eliminating its fall turnaround and transitioned to a single annual turnaround, one year ahead of schedule.
At Cold Lake, annual production optimization and reliability enhancements.averaged 135,000 gross oil-equivalent barrels per day.
At Syncrude, annual production averaged 76,000 gross oil-equivalent barrels per day.
As described in more detail in Item"Item 1A. “Risk factors”Risk factors", environmental risks and climate related regulations andCOVID-19could have negative impacts on the upstream business.
54
Results of operations
millions of Canadian dollars


Price – HigherLower bitumen realizations increased net income by about $3,640 million,were primarily driven by averagelower marker prices. Average bitumen realizations increasingdecreased by $32.22$17.25 per barrel, generally in line with WCS, and synthetic crude oil realizations increasingdecreased by $31.85$19.89 per barrel.
barrel, generally in line with WTI.Volumes – HigherLower volumes were primarily driven by steam cycle timing at Cold Lake, and the absence of XTO Energy Canada production, balancing with market demands that occurred in 2020 increased net incomepartially offset by about $550 million.
improved reliability, plant capacity utilization, and mine equipment productivity at Kearl.Royalty – HigherLower royalties decreased net income by about $680 million,were primarily driven by higherweakened commodity prices.
Identified itemsof $1,171 million related to the company’s decision to no longer develop a significant portioncompany's gain on the sale of its unconventional portfolio.interests in XTO Energy Canada.
Items1
– Prior year results included unfavourablefavourable identified items
1
Other – All other items decreased net income by $968 million, primarily driven by higher operating expenses of about $720 million, unfavourable foreign exchange impacts of about $230 million and lower Canada Emergency Wage Subsidy received by the company compared to prior year of about $60 million, which includes Imperial’s proportionate share of a joint venture.

2022 Net income (loss) factor analysis
millions of Canadian dollars

Price – Higher realizations were generally in line with increases in marker prices, driven primarily by increased demand. Average bitumen realizations increased by $26.76 per barrel, generally in line with WCS, and synthetic crude oil realizations increased by $43.85 per barrel.
Volumes – Lower volumes were primarily the Canada Emergency Wage Subsidy receivedresult of downtime at Kearl in the first half of the year, partly offset by higher production at Syncrude and Cold Lake.
Royalty – Higher royalties primarily driven by improved commodity prices.
Identified items1 – Results include favourable identified items1 related to the company which includes Imperial’s proportionate sharecompany's gain on the sale of a joint venture.
interests in XTO Energy Canada.Other – Higher operating expenses of about $500 million, primarily from higher energy prices, partially offset by favourable foreign exchange impacts of about $270 million, and higher electricity sales at Cold Lake of about $60 million due to increased prices.
1 non-GAAP | financial measure reconciliation. | ||||||||||||||
Marker prices and average realizations
| Canadian dollars, unless otherwise noted | 2023 | 2022 | 2021 | ||||||||
West Texas Intermediate (US$ per barrel) | 77.60 | 94.36 | 68.05 | ||||||||
Western Canada Select (US$ per barrel) | 58.97 | 76.28 | 54.96 | ||||||||
WTI/WCS Spread (US$ per barrel) | 18.63 | 18.08 | 13.09 | ||||||||
Bitumen (per barrel) | 67.42 | 84.67 | 57.91 | ||||||||
Synthetic crude oil (per barrel) | 105.57 | 125.46 | 81.61 | ||||||||
Conventional crude oil (per barrel) | 59.30 | 97.45 | 59.84 | ||||||||
Natural gas liquids (per barrel) | — | 64.92 | 35.87 | ||||||||
Natural gas (per thousand cubic feet) | 2.58 | 5.69 | 3.83 | ||||||||
Average foreign exchange rate (US$) | 0.74 | 0.77 | 0.80 | ||||||||
Canadian dollars, unless otherwise noted | 2021 | 2020 | 2019 | |||||||||
West Texas Intermediate (US$) (per barrel) | 68.05 | 39.26 | 57.03 | |||||||||
Western Canada Select (US$) (per barrel) | 54.96 | 26.87 | 44.29 | |||||||||
WTI/WCS Spread (US$) (per barrel) | 13.09 | 12.39 | 12.74 | |||||||||
Bitumen (per barrel) | 57.91 | 25.69 | 50.02 | |||||||||
Synthetic oil (per barrel) | 81.61 | 49.76 | 74.47 | |||||||||
Conventional crude oil (per barrel) | 59.84 | 29.34 | 51.81 | |||||||||
Natural gas liquids (per barrel) | 35.87 | 13.85 | �� | 22.83 | ||||||||
Natural gas (per thousand cubic feet) | 3.83 | 1.90 | 2.05 | |||||||||
Average foreign exchange rate (US$) | 0.80 | 0.75 | 0.75 |
| thousands of barrels per day | 2023 | 2022 | 2021 | |||||||||||||||||
| gross | net | gross | net | gross | net | |||||||||||||||
| Bitumen | 326 | 283 | 316 | 263 | 326 | 292 | ||||||||||||||
Synthetic crude oil (b) | 76 | 67 | 77 | 63 | 71 | 62 | ||||||||||||||
| Conventional crude oil | 5 | 5 | 8 | 8 | 10 | 9 | ||||||||||||||
| Total crude oil production | 407 | 355 | 401 | 334 | 407 | 363 | ||||||||||||||
| NGLs available for sale | — | — | 1 | 1 | 1 | 1 | ||||||||||||||
| Total crude oil and NGL production | 407 | 355 | 402 | 335 | 408 | 364 | ||||||||||||||
Bitumen sales, including diluent (c) | 442 | 424 | 451 | |||||||||||||||||
NGL sales (d) | — | 1 | — | |||||||||||||||||
Natural gas - production and production available for bitumen increased in 2021, generally in line with Western Canada Select. The company’s average Canadian dollar realizations for synthetic crude increase generally in line with West Texas Intermediate, adjusted for changes in exchange rates and transportation costs.
sale (a)| millions of cubic feet per day | 2023 | 2022 | 2021 | |||||||||||||||||
| gross | net | gross | net | gross | net | |||||||||||||||
Production (e) (f) | 33 | 32 | 85 | 83 | 120 | 115 | ||||||||||||||
Production available for sale (g) | 11 | 50 | 81 | |||||||||||||||||
(a)Volume per day metrics are calculated by dividing the volume for the period by the number of calendar days in the period. Gross production is the company’s share of production (excluding purchases) before deduction of the mineral owners’ or governments’ share or both. (b)The company’s synthetic crude oil production volumes were from the company’s share of production volumes in the Syncrude joint venture and include immaterial amounts of bitumen and other products exported to the operator's facilities using an existing interconnect pipeline. (c)Diluent is natural gas condensate or other light hydrocarbons added to crude bitumen to facilitate transportation to market by pipeline and rail. (d)2021 NGL sales round to 0. (e)Gross production of natural gas includes amounts used for internal consumption with the exception of the amounts re-injected. (f)Net production is gross production less the mineral owners’ or governments’ share or both. Net production reported in the above table is consistent with production quantities in the net proved reserves disclosure. (g)Includes sales of the company’s share of net production and excludes amounts used for internal consumption. | ||||||||||||||||||||
Crude oil and natural gas liquids (NGL) - production and sales (a) | ||||||||||||||||||||||||
| thousands of barrels per day | 2021 | 2020 | 2019 | |||||||||||||||||||||
gross | net | gross | net | gross | net | |||||||||||||||||||
Bitumen | 326 | 292 | 290 | 279 | 285 | 254 | ||||||||||||||||||
Synthetic oil (b) | 71 | 62 | 69 | 68 | 73 | 65 | ||||||||||||||||||
Conventional crude oil | 10 | 9 | 11 | 10 | 14 | 13 | ||||||||||||||||||
Total crude oil production | 407 | 363 | 370 | 357 | 372 | 332 | ||||||||||||||||||
NGLs available for sale | 1 | 1 | 2 | 2 | 2 | 1 | ||||||||||||||||||
Total crude oil and NGL production | 408 | 364 | 372 | 359 | 374 | 333 | ||||||||||||||||||
Bitumen sales, including diluent (c) | 451 | 401 | 387 | |||||||||||||||||||||
NGL sales (d) | - | 2 | 6 | |||||||||||||||||||||
Natural gas - production and production available for sale (a) | ||||||||||||||||||||||||
| millions of cubic feet per day | 2021 | 2020 | 2019 | |||||||||||||||||||||
gross | net | gross | net | gross | net | |||||||||||||||||||
Production (e) (f) | 120 | 115 | 154 | 150 | 145 | 144 | ||||||||||||||||||
Production available for sale (g) | 81 | 115 | 108 | |||||||||||||||||||||
Higher bitumen production atwas mainly attributable to Kearl, wasand primarily driven by the absence of prior year production balancing with market demands.
improved reliability, plant capacity utilization, and mine equipment productivity.Downstream
Overview
Key events
In January 2023, theCOVID-19 company fully funded the Strathcona renewable diesel project, the largest such facility in Canada, located at Strathcona refinery. The facility will use low-carbon hydrogen, locally sourced and grown feedstocks and the company's own proprietary catalyst to produce more than one billion litres of renewable diesel annually, and could help reduce greenhouse gas emissions. Facility construction commenced during the year, and the project remains on-plan with renewable diesel production expected to begin in 2025.pandemic.
As described in more detail in Item"Item 1A. “Risk factors”Risk factors", proposed carbon policy and other climate related regulations, as well as continued biofuels mandates, could have negative impacts on the downstreamDownstream business.
Results of operations
millions of Canadian dollars

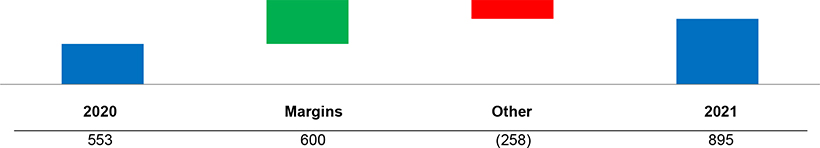
Margins – HigherLower margins increased net income by about $600 million, reflecting improved product demand.
primarily reflect weaker market conditions.Other – All other items decreased net incomeHigher turnaround impacts of about $340 million, associated with the planned turnaround activities at the Strathcona and Sarnia refineries, partially offset by $258 million, primarily driven by unfavourablefavourable foreign exchange impacts of about $150$210 million, and an unfavourable inventory adjustmentimproved volumes of $74about $50 million,2, partially offset by and lower operating expenses of about $50 million.
million, primarily due to lower energy prices.millions of Canadian dollars


Margins – Results were negatively impacted by lowerHigher margins primarily reflect improved market conditions.
Other – Lower turnaround impacts of about $710 million.
Refinery utilization
| thousands of barrels per day (a) | 2023 | 2022 | 2021 | ||||||||
Total refinery throughput (b) | 407 | 418 | 379 | ||||||||
Rated capacity at December 31 (c) | 433 | 433 | 428 | ||||||||
Utilization of total refinery capacity (percent) | 94 | 98 | 89 | ||||||||
(a)Volume per day metrics are calculated by dividing the volume for the period by the number of calendar days in the period. (b)Refinery throughput is the volume of crude oil and feedstocks that is processed in the refinery atmospheric distillation units. (c)Refining capacity data is based on 100 percent of rated refinery process unit stream-day capacities to process inputs to atmospheric distillation units under normal operating conditions, less the impact of shutdowns for regular repair and maintenance activities, averaged over an extended period of time. | |||||||||||
2023
Lower refinery throughput in 2023 reflects the impact of planned turnaround impacts of about $190 million primarily related to reduced turnaround activity in the current yearactivities at Strathcona and improved reliability of about $180 million primarily due to the absence of the Sarnia fractionation tower incident which occurred in April 2019. These items were partially offset by lower sales volumes of about $290 million.
refineries.Refinery utilization | ||||||||||||
| thousands of barrels per day (a) | 2021 | 2020 | 2019 | |||||||||
Total refinery throughput (b) | 379 | 340 | 353 | |||||||||
Rated capacity at December 31 (c) | 428 | 428 | 423 | |||||||||
Utilization of total refinery capacity (percent) | 89 | 80 | 83 | |||||||||
Improved refinery throughput in 20212022 was primarily reflectsdriven by increased demand and reduced impacts associated with theCOVID-19pandemic, partially offset by a planned turnaround at Strathcona.activity.
| thousands of barrels per day (a) | 2023 | 2022 | 2021 | ||||||||
| Gasolines | 228 | 229 | 224 | ||||||||
| Heating, diesel and jet fuels | 176 | 176 | 160 | ||||||||
| Lube oils and other products | 43 | 47 | 45 | ||||||||
| Heavy fuel oils | 24 | 23 | 27 | ||||||||
| Net petroleum product sales | 471 | 475 | 456 | ||||||||
(a)Volume per day metrics are calculated by dividing the volume for the period by the number of calendar days in the period. | |||||||||||
2023
Lower throughput waspetroleum product sales in 2023 were primarily driven by reduced demand due to theCOVID-19pandemic, partially offset by lower refinery turnaround activity and reliability events, including impacts from the Sarnia fractionation tower incident which occurred in April 2019.wholesale customer volume.
Petroleum product sales | ||||||||||||
| thousands of barrels per day (a) | 2021 | 2020 | 2019 | |||||||||
Gasolines | 224 | 215 | 249 | |||||||||
Heating, diesel and jet fuels | 160 | 146 | 167 | |||||||||
Heavy fuel oils | 27 | 20 | 21 | |||||||||
Lube oils and other products | 45 | 40 | 38 | |||||||||
Net petroleum product sales | 456 | 421 | 475 | |||||||||
(a) Volume per day metrics are calculated by dividing the volume for the period by the number of calendar days in the period. | ||||||||||||
Improved petroleum product sales in 20212022 primarily reflects reduced impacts associated with theincreased demand.
Chemical
Overview
North America continued to benefit from abundant supplies of natural gas and gas liquids, providing both low cost energy and feedstock for steam crackers.
Key events
In 2021, results benefited from robust industry demand and strong reliability.
2023, margins were adversely impacted by increased supply of polyethylene. Sales volumes decreased primarily due to planned maintenance activities.Results of operations
millions of Canadian dollars

2022 Net income (loss) factor analysis
millions of Canadian dollars


Margins – ImprovedLower margins increased net income by about $250 million, primarily due to strongerreflect weaker industry polyethylene margins.
Sales
| thousands of tonnes | 2023 | 2022 | 2021 | ||||||||
| Total petrochemical sales | 820 | 842 | 831 | ||||||||

Sales | ||||||||||||
| thousands of tonnes | 2021 | 2020 | 2019 | |||||||||
Polymers and basic chemicals | 599 | 574 | 575 | |||||||||
Intermediate and others | 232 | 175 | 157 | |||||||||
Total petrochemical sales | 831 | 749 | 732 | |||||||||
Corporate and other
| millions of Canadian dollars | 2023 | 2022 | 2021 | ||||||||
| Net income (loss) | (88) | (131) | (172) | ||||||||
| millions of Canadian dollars | 2021 | 2020 | 2019 | |||||||||
Net income (loss) | (172 | ) | (170 | ) | (217 | ) | ||||||
Liquidity and capital resources
Sources and uses of cash
The company issues long-term debt from time to time and maintains a commercial paper program. However, internally generated funds cover the majority of its financial requirements. Cash that may be temporarily surplus to the company’s immediate needs is carefully managed through counterparty quality and investment guidelines to ensure that it is secure and readily available to meet the company’s cash requirements and to optimize returns.
Cash flows from operating activities are highly dependent on crude oil and natural gas prices, as well as petroleum and chemical product margins. In addition, to provide for cash flow in future periods, the company needs to continually find and develop new resources, and continue to develop and apply new technologies to existing fields in order to maintain or increase production.
The company’s financial strength enables it to make large, long-term capital expenditures. Imperial’sThe company’s portfolio of development opportunities and the complementary nature of its business segments help mitigate the overall risks for the company and its cash flows. Further, due to its financial strength, debt capacity and portfolio of opportunities, the risk associated with delay of any single project would not have a significant impact on the company’s liquidity or ability to generate sufficient cash flows for its operations and fixed commitments.
Funding of registered retirement plans complies with federal and provincial pension regulations, and the company makes contributions to the plans based on an independent actuarial valuation completed at least once every three years depending on funding status. The most recent valuation of the company’s registered retirement plans was completed as at December 31, 2019.2022. The company contributed $164$148 million to the registered retirement plans in 2021.2023. Future funding requirements are not expected to affect the company’s existing capital investment plans or its ability to pursue new investment opportunities.
| millions of Canadian dollars | 2023 | 2022 | 2021 | ||||||||
| Cash flows from (used in): | |||||||||||
| Operating activities | 3,734 | 10,482 | 5,476 | ||||||||
| Investing activities | (1,694) | (618) | (1,012) | ||||||||
| Financing activities | (4,925) | (8,268) | (3,082) | ||||||||
| Increase (decrease) in cash and cash equivalents | (2,885) | 1,596 | 1,382 | ||||||||
| Cash and cash equivalents at end of year | 864 | 3,749 | 2,153 | ||||||||
| millions of Canadian dollars | 2021 | 2020 | 2019 | |||||||||
Cash provided by (used in) | ||||||||||||
Operating activities | 5,476 | 798 | 4,429 | |||||||||
Investing activities | (1,012 | ) | (802 | ) | (1,704 | ) | ||||||
Financing activities | (3,082 | ) | (943 | ) | (1,995 | ) | ||||||
Increase (decrease) in cash and cash equivalents | 1,382 | (947 | ) | 730 | ||||||||
Cash and cash equivalents at end of year | 2,153 | 771 | 1,718 | |||||||||
Cash flowflows from operating activities
2023
2022
Cash flow generated from operating activities primarily reflects higher Upstream realizations, improved Downstream margins, and stronger Downstream margins.
Cash flow fromflows used in investing activities
Cash flows used in
2022
60
Cash flow fromflows used in financing activities
At the end of 2021,2023, total debt outstanding was $5,176$4,132 million, compared with $5,184$4,155 million at the end of 2020.2022.
During the fourth quarter of 2023, the company extended the maturity dates of its two existing $250 million committed lines of credit to November 2024 and November 2025, respectively.
The company has not drawn on any of its outstanding $500 million of available credit facilities.
2022
At the end of 2022, total debt outstanding was $4,155 million, compared with $5,176 million at the end of 2021.
During the third quarter of 2022, the company decreased its long-term debt by $1 billion by partially repaying an existing facility with an affiliated company of ExxonMobil.
During the second quarter of 2021,2022, the company reduced its existing $500 million committed long-term line of credit to $250 million and extended the maturity date to June 30, 2023. Subsequently in the fourth quarter of two of its short-term lines2022, this committed long-term line of credit totalling $750 million, to May 2023, these facilities are now long-term.was cancelled in full. The company also extended one of its $300$250 million committed short-term linelong-term lines of credit to June 2022.30, 2024.
In November 2021,2022, the company extended the maturity date of an existing $250 million committed short-term line of credit to November 2022.
2023.The company has not drawn on these facilities.
Share repurchases | ||||||||||||
| millions of Canadian dollars, unless noted | 2021 | 2020 | 2019 | |||||||||
Share repurchases | 2,245 | 274 | 1,373 | |||||||||
Number of shares purchased (millions) (a) | 56.0 | 9.8 | 38.7 | |||||||||
| millions of Canadian dollars, unless noted | 2023 | 2022 | 2021 | ||||||||
Share repurchases (a) | 3,800 | 6,395 | 2,245 | ||||||||
Number of shares purchased (millions) (a) | 48.3 | 93.9 | 56.0 | ||||||||
(a)Share repurchases were made under the company's normal course issuer bid program for the periods disclosed. Substantial issuer bids were undertaken and commenced on May 6, 2022 (expired on June 10, 2022), November 4, 2022 (expired on December 9, 2022), and November 3, 2023 (expired on December 8, 2023). Includes shares purchased from Exxon Mobil Corporation concurrent with, but outside of, the normal course issuer bid, and by way of a proportionate tender under the company's substantial issuer bids. | |||||||||||
2023
On June 23, 202127, 2023, the company announced that it had received final approval from the Toronto Stock Exchange for a new normal course issuer bid and willto continue its then existing share purchase program. The program enablesenabled the company to purchase up to a maximum of 35,583,67129,207,635 common shares during the period June 29, 20212023 to June 28, 2022.
2024. The program completed on October 19, 2023 as a result of the company purchasing the maximum allowable number of shares under the program.2022
On June 27, 2022, the company announced that it intended to accelerate purchases underhad received final approval from the Toronto Stock Exchange for a new normal course issuer bid,bid. The program enabled the company to purchase up to a maximum of 31,833,809 common shares during the period June 29, 2022 to June 28, 2023. The program was subsequently completed on January 31,October 21, 2022 as a result of the company purchasing the maximum allowable number of shares under the program.
Dividends | ||||||||||||
| millions of Canadian dollars, unless noted | 2021 | 2020 | 2019 | |||||||||
Dividends paid | 706 | 649 | 631 | |||||||||
Per share dividend paid (dollars) | 0.98 | 0.88 | 0.82 | |||||||||
61
On May 6, 2022, the company commenced a substantial issuer bid pursuant to which it offered to purchase for cancellation up to $2.5 billion of its common shares through a modified Dutch auction and proportionate tender offer. The substantial issuer bid was completed on June 15, 2022, with the company taking up and paying for 32,467,532 common shares at a price of $77.00 per share, for an aggregate purchase of $2.5 billion and 4.9 percent of Imperial’s issued and outstanding shares at the close of business on May 2, 2022. This included 22,597,379 shares purchased from Exxon Mobil Corporation by way of a proportionate tender to maintain its ownership percentage at approximately 69.6 percent.
On November 4, 2022, the company commenced a substantial issuer bid pursuant to which it offered to purchase for cancellation up to $1.5 billion of its common shares through a modified Dutch auction and proportionate tender offer. The substantial issuer bid was completed on December 14, 2022, with the company taking up and paying for 20,689,655 common shares at a price of $72.50 per share, for an aggregate purchase of $1.5 billion and 3.4 percent of Imperial's issued and outstanding shares at the close of business on October 31, 2022. This included 14,399,985 shares purchased from Exxon Mobil Corporation by way of a proportionate tender to maintain its ownership percentage at approximately 69.6 percent.
Dividends
| millions of Canadian dollars, unless noted | 2023 | 2022 | 2021 | ||||||||
| Dividends paid | 1,103 | 851 | 706 | ||||||||
Per share dividend paid (dollars) | 1.88 | 1.29 | 0.98 | ||||||||
Financial strength
The table below shows Imperial’sthe company’s consolidatedratio. The data demonstrates the company’s creditworthiness:
debt-to-capital
| percent | ||||||||||||
| At December 31 | 2021 | 2020 | 2019 | |||||||||
Debt to capital (a) | 19 | 19 | 18 | |||||||||
| percent | |||||||||||
| At December 31 | 2023 | 2022 | 2021 | ||||||||
Debt to capital (a) | 16 | 16 | 19 | ||||||||
(a)Debt, defined as the sum of “Notes and loans payable” and “Long-term debt” on the Consolidated balance sheet, divided by capital, defined as the sum of debt and “Total shareholders’ equity” on the Consolidated balance sheet. | |||||||||||
Debt-related interest incurred in 2021,2023, before capitalization of interest, was $63$203 million, compared with $102up from $111 million in 2020.2022. The average effectiveweighted-average interest rate on the company’s debt was 1.24.9 percent in 2021, compared with 2.02023, up from 2.2 percent in 2020.2022.
The company’s financial strength represents a competitive advantage of strategic importance providing it the opportunity to readily access capital markets across a range of market conditions and enables the company to take on large, long-term capital commitments in the pursuit of maximizing shareholder value.
Contractual obligations
The company has contractual obligations involving commitments to third parties that impact its liquidity and capital resource needs. These contractual obligations are primarily for leases, debt, asset retirement obligations, pension and other postretirement benefits, other long-term obligations, and firm capital commitments. Further information on this topic can be found in notes 4, 5, 13 and 14 to the consolidated financial statements.
Other long-term purchase agreements are commitments that arenon-cancelable, non-cancellable, or cancelablecancellable only under certain conditions, as well as long-term commitments, other than unconditional purchase obligations. They include primarily transportation services agreements, raw material supply and community benefits agreements. The total obligation at2021 2023 was $8.7$11.8 billion, of which $697$728 million is due in 2022,2024, and $746$1,131 million is due in 2023. At March 31, 2021, due to the termination of transportation services agreements related to a third-party pipeline project, other long-term purchase agreements decreased by approximately $2.9 billion. The majority of these commitments related to years 2026 and beyond.2025.
year-end
Litigation and other contingencies
As discusseddiscussed in note 9 to thethe consolidated financial statements, on page 98, a variety of claims have been made against Imperial and its subsidiaries. Based on a consideration of all relevant facts and circumstances, the company does not believe the ultimate outcome of any currently pending lawsuits against the company will have a material adverse effect on the company’s operations, financial condition, or financial statements taken as a whole.
Additionally, as discussed in note 9, Imperial was contingently liable at December 31, 2021,2023, for guarantees relating to performance under contracts. These guarantees do not have a material effect on the company’s operations, financial condition, or financial statements taken as a whole.
There are no events or uncertainties beyond those already included in reported financial information that would indicate a material change in future operating results or financial condition.
Capital and exploration expenditures
Capital and exploration expenditures represent the combined total of additions at cost to property, plant and equipment, additions to finance leases, additional investments and acquisitions; exploration expenses on aImperial’sthe company’s management is responsible for all investments and elements of net income, particular focus is placed on managing the controllable aspects of this group of expenditures.
before-tax
basis from the Consolidated statement of income; and the company’s share of similar costs for equity companies. Capital and exploration expenditures exclude the purchase of carbon emission credits. While | millions of Canadian dollars | 2021 | 2020 | ||||||
Upstream (a) | 632 | 561 | ||||||
Downstream | 476 | 251 | ||||||
Chemical | 8 | 21 | ||||||
Corporate and other | 24 | 41 | ||||||
Total | 1,140 | 874 | ||||||
| millions of Canadian dollars | 2023 | 2022 | ||||||
Upstream (a) | 1,108 | 1,128 | ||||||
| Downstream | 472 | 295 | ||||||
| Chemical | 23 | 10 | ||||||
| Corporate and other | 175 | 57 | ||||||
| Total | 1,778 | 1,490 | ||||||
(a)Exploration expenses included. | ||||||||
For the Upstream segment, capital and exploration expenditures were primarily related to sustaining activity in support of the company’sin-situand oil sands and in-situ assets.
For the Downstream segment, capital expenditures were primarily for enhancingprogressing the company’s distribution networkStrathcona renewable diesel facility as well as other refinery and distribution projects to improve environmental performance, reliability, feedstock flexibility,and energy efficiency and environmental performance.efficiency.
Total capital and exploration expenditures are expected to be approximately $1.4$1.7 billion in 2022.2024.
Expected capital and exploration expenditures for 20222024 includes firm capital commitments of $290$686 million for the construction and purchase of fixed assets and other permanent investments. An additional $354$65 million of firm capital commitments have been made for years 20232025 and beyond.
Actual spending could vary depending on the progress of individual projects.
Market risks
Crude oil, natural gas, petroleum product and chemical prices have fluctuated in response to changing market forces. The impacts of these price fluctuations on earnings from Upstream, Downstream and Chemical operations have varied.
In the competitive downstream and chemical environments, earnings are primarily determined by margin capture rather than absolute price levels on products sold. Refining margins are a function of the difference between what a refiner pays for its raw materials (primarily crude oil) and the market prices for the range of products produced. These prices, in turn, depend on global and regional supply / demand balances, inventory levels, refinery operations, import / export balances and weather.
Industry crude oil and natural gas commodity prices and petroleum and chemical product prices are commonly benchmarked in U.S. dollars. The majority of Imperial’sthe company’s sales and purchases are related to these industry U.S. dollar benchmarks. As the company records and reports its financial results in Canadian dollars, to the extent that the Canadian / U.S. dollar exchange rate fluctuates, the company’s earnings will be affected.
The company’s potential exposure to commodity price and margin, and Canadian / U.S. dollar exchange rate fluctuations is summarized in the earnings sensitivities table, which shows the estimated annual effect, under current conditions, on the company’s
after-tax
net income. For any given period, the extent of actual benefit or detriment will be dependent on the price movements of individual types of crude oil and products, production and sales volumes, transportation capacity, costs and egress methods, and other factors. Accordingly, changes in benchmark prices for crude oil and crude oil differentials, and other factors listed in the table following, only provide broad indicators of changes in the earnings experienced in any particular period.Earnings sensitivities
(a)millions of Canadian dollars, after-tax | ||||||||||||||
One dollar (U.S.) per barrel increase (decrease) in crude oil prices | + (-) | 105 | ||||||||||||
One dollar (U.S.) per barrel increase (decrease) in refining 2-1-1 | + (-) | 140 | ||||||||||||
One cent decrease (increase) in the value of the Canadian dollar versus the U.S. dollar | + (-) | 170 | ||||||||||||
| (a) | Each sensitivity calculation shows the annual impact on net income resulting from a change in one factor, after tax and royalties, and holding all other factors constant. These sensitivities have been updated to reflect current market conditions. They may not apply proportionately to larger fluctuations. |
(b) |
The 2-1-1 |
The demand for crude oil, natural gas, petroleum products and petrochemical products are generally linked closely with economic growth. The occurrence of recessions or other periods of low or negative economic growth such as impacts due to theCOVID-19pandemic, will typically have a direct adverse impact on the company’s financial results. Although price levels of crude oil and natural gas may rise and fall significantly over the short to medium-term due to global economic conditions, political events, decisions by OPEC, governments and other factors, industry economics over the long-term will continue to be driven by market supply and demand. Accordingly, theThe company evaluates the viability of its major investments over a range of prices.prices, including estimated greenhouse gas emission costs.
64
The global energy markets can give rise to extended periods in which market conditions are adverse to one or more of the company’s businesses. Such conditions, along with the capital-intensive nature of the industry and very long lead times associated with many of the company’s projects, underscore the importance of maintaining a strong financial position. Management views the company’s financial strength as a competitive advantage.
In general, segment results are not dependent on the ability to sell and / or purchase products to / from other segments. Where such intersegment sales take place, they are the result of efficiencies and competitive advantages from integrated business segments and refinery and chemical complexes. The company’s intersegment sales include crude oil produced by the Upstream and sold to the Downstream, as well as sales between refineries and the chemical plant related to raw materials, feedstocks and finished products. All intersegment sales are at market based prices. Refer to note 2 for additional information on intersegment revenue.
The company has an active asset management program in which underperformingnonstrategic assets are either improved to acceptable levels or considered for divestment. The asset management program includes a disciplined, regular review to ensure that assets are contributing to the company’s strategic objectives.
Risk management
The company’s size, strong capital structure and the complementary nature of the Upstream, Downstream and Chemical businesses reduceits business segments reduces the company’s enterprise-wide risk from changes in commodity prices and currency exchange rates. In addition, the company may use commodity-based contracts, including derivatives, to manage commodity price risk and to generate returns from trading. The company’s derivatives are not accounted for under hedge accounting. Credit risk associated with the company’s derivative position is mitigated by several factors, including the use of derivative clearing exchanges and the quality of and financial limits placed on derivative counterparties. No material market or credit risks to the company’s financial position, results of operations or liquidity exist as a result of the derivatives described in notenote 6 on page 95.. The company maintains a system of controls that includes the authorization, reporting and monitoring of derivative activity.
Critical accounting estimates
The company’s financial statements have been prepared in accordance with United States Generally Accepted Accounting Principles (U.S. GAAP). U.S. GAAP requires management to make estimates and judgments that affect the reported amounts of assets, liabilities, revenues and expenses, and the disclosure of contingent assets and liabilities. The company’s accounting and financial reporting fairly reflect its business model involving exploration for, and production of, crude oil and natural gas; manufacture, trade, transport and sale of crude oil, natural gas, petroleum products, petrochemicals and a variety of specialty products; and pursuit of lower-emission business opportunities, including carbon capture and storage, hydrogen and biofuels. Imperiallower-emission fuels. The company does not use financing structures for the purpose of altering accounting outcomes or removing debt from the balance sheet. The company’s significant accounting policies are summarized in note 1 to thethe consolidated financial statements on page 80.
statements.Oil and natural gas reserves
Evaluations of oil and natural gas reserves are important to the effective management of upstream assets. They are an integral part of investment decisions about oil and gas properties such as whether development should proceed.
The estimation of proved reserve volumes, which is based on the requirement of reasonable certainty, is an ongoing process based on rigorous technical evaluations, commercial and market assessments, detailed analysis of well information such as flow rates and reservoir pressures, and development and production costs, and other factors. The estimation of proved reserves is controlled by the company through long-standing approval guidelines. Reserves changes are made within a well-established, disciplined process driven by qualified geoscience and engineering professionals, assisted by the reserves management group which has significant technical experience, culminating in reviews with and approval by senior management and the company’s board of directors. Notably, the company does not use specific quantitative reserves targets to determine compensation. Key features of the reserves estimation process are covered in “Disclosure"Disclosure of reserves”reserves" in Item 1.
Oil and natural gas reserves include both proved and unproved reserves.
•Proved oil and natural gas reserves are determined in accordance with U.S. Securities and Exchange Commission (SEC) requirements. Proved reserves are those quantities of oil and natural gas which, by analysis of geoscience and engineering data, can be estimated with reasonable certainty to be economically producible under existing economic and operating conditions and government regulations. Proved reserves are determined using the average of first-day-of-the-month oil and natural gas prices during the reporting year.
Proved reserves can be further subdivided into developed and undeveloped reserves. Proved developed reserves include amounts which are expected to be recovered through existing wells, and facilities, or mining activities with existing equipment and operating methods. Proved undeveloped reserves include amounts expected to be recovered from new wells, on undrilled proved acreageexisting wells, facilities, or from existing wellsmining activities, where a relatively major capital expenditure is required for completion.required. Proved undeveloped reserves are recognized only ifwhen a development plan has been adopted indicating that the reserves are scheduled to be drilleddeveloped within five years, unless specific circumstances support a longer period of time.
The company is reasonably certain that proved reserves will be produced. However, the timing and amount recovered can be affected by a number of factors including completion and optimization of development projects, reservoir performance, regulatory approvals, government policies, consumer preferences, royalty frameworks and significant changes in oil and natural gas price levels.
•Unproved reserves are quantities of oil and natural gas with less than reasonable certainty of recoverability and include probable reserves. Probable reserves are reserves that, together with proved reserves, are as likely as not to be recovered.
Revisions in previously estimated volumes of proved reserves for existing fields can occur due to the evaluation oroil and natural gas prices and / or costs that are used in the estimation of reserves. Revisions can also result from significant changes in either development strategy or production equipment /and facility capacity.
re-evaluation
of already available geologic, reservoir or production data; new geologic, reservoir or production data; or changes in the average offirst-day-of-the-month
In 2021, upward revisions of proved bitumen reserves were a result of improved prices. The 1.7 billion barrels of bitumen at Kearl and 0.5 billion barrels of bitumen at Cold Lake qualified as proved reserves under the U.S. Securities and Exchange CommissionSEC definition of proved reserves. Upward revisions to proved synthetic crude oil reserves were a result of improved prices. Changes to the liquids and natural gas proved reserves were the result of updated development plans and divestments at the Montney and Duvernay unconventional assets.
In 2022, downward revisions of proved bitumen reserves were driven by a decrease of 0.2 billion barrels at Kearl as a result of higher royalty obligations associated with pricing, and a decrease of 0.2 billion barrels at Cold Lake due to an updated development plan. An increase to the bitumen reserves of 0.1 billion barrels is associated with extensions at Cold Lake for the Grand Rapids Phase 1 SA-SAGD and Leming SAGD projects. Downward revisions to proved synthetic crude oil reserves were a result of mine development plan updates and higher royalty obligations at Syncrude associated with pricing. Changes to the liquids and natural gas proved reserves were primarily a result of the sale of the company’s interest in the Montney and Duvernay unconventional assets.
In 2023, upward revisions of proved bitumen of 0.1 billion barrels were driven by lower royalty obligations associated with lower pricing and minor technical revisions at Cold Lake and Kearl. A slight increase in proved reserves for synthetic crude oil is associated with lower royalty obligations associated with pricing. Conventional proved liquids reserves decreased to zero under existing pricing and operating conditions.
Under the terms of certain contractual arrangements or government royalty regimes, lower prices can also increase proved reserves attributable to Imperial.the company. The company’s operating decisions and its outlook for future production volumes are not impacted by proved reserves as disclosed under the U.S. Securities and Exchange Commission (SEC)SEC definition.
Unit-of-production
Oil and natural gas reserve volumes are used as the basis to calculatedepreciation rates for most upstream assets. Depreciation is calculated by taking the ratio of asset cost to total proved reserves or proved developed reserves applied to actual production. The volumes produced and asset cost are known, while proved reserves are based on estimates that are subject to some variability.
unit-of-production
In the event that themethod does not result in an equitable allocation of cost over the economic life of an upstream asset, an alternative method is used. The straight-line method is used in limited situations where the expected life of the asset does not reasonably correlate with that of the underlying reserves. For example, certain assets used in the production of oil and natural gas have a shorter life than the reserves, and as such, the company uses straight-line depreciation to ensure the asset is fully depreciated by the end of its useful life.
unit-of-production
To the extent that proved reserves for a property are substantiallymethod based on reserves determined at the most recent SEC price which results in a more meaningful quantity of proved reserves, appropriately adjusted for production and technical changes. This approach was applied in 2021, with the corresponding effect on depreciation expense being immaterial compared to prior periods. For 2022, all properties have sufficient reserves at current SEC prices which will enable equitable allocation of cost over the economic lives of the Upstream assets.
de-booked
and that property continues to produce such that the resulting depreciation charge does not result in an equitable allocation of cost over the expected life, assets will be depreciated using aunit-of-production
Impact of oil and gas reserves and prices and margins on testing for impairment
The company tests assets or groups of assets for recoverability on an ongoing basis whenever events or changes in circumstances indicate that the carrying amounts may not be recoverable. The company has a robust process to monitor for indicators of potential impairment across its asset groups throughout the year. This process is aligned with the requirements ofandand relies, in part, on the company’s planning and budgeting cycle.
ASC 360
ASC 932
Because the lifespans of the vast majority of the company’s major assets are measured in decades, the future cash flows of these assets are predominantly based on long-term oil and natural gas commodity prices, industry margins, and development and production costs. Significant reductions in the company’s view of oil or natural gas commodity prices or margin ranges, especially the longer-term prices and margins, and changes in the development plans, including decisions to defer, reduce or eliminate planned capital spending, can be an indicator of potential impairment. Other events or changes in circumstances, including indicators outlined incan be indicators of potential impairment as well.
ASC 360
67
In general, Imperialthe company does not view temporarily low prices or margins as an indication of impairment. Management believes that prices over the long term must be sufficient to generate investments in energy supply to meet global demand. Although prices will occasionally drop significantly, industry prices over the long term will continue to be driven by market supply and demand fundamentals. On the supply side, industry production from mature fields is declining. This is being offset by investments to generate production from new discoveries, field developments, and technology and efficiency advancements. OPECOPEC+ investment activities and production policies also have an impact on world oil supplies. The demand side is largely a function of general economic activities, alternative energy sources and levels of prosperity. During the lifespan of its major assets, the company expects that oil and gas prices and industry margins will experience significant volatility, and consequently,volatility. Consequently, these assets will experience periods of higher earnings and periods of lower earnings, or even losses. In assessing whether events or changes in circumstances indicate the carrying value of an asset may not be recoverable, the company considers recent periods of operating losses in the context of its longer-term view of prices and margins.
The annual planning and budgeting process, known as the company plan, is the mechanism by which resources (capital, operating expenses and people) are allocated across the company. The foundation for the energy supply and demand assumptions supporting the company plan begins with Exxon Mobil Corporation’s(the (the Outlook), which contains demand and supply projections based on its assessment of current trends in technology, government policies, consumer preferences, geopolitics, economic development, and economic development.other factors.
Corporation's Global Outlook for Energy
Reflective of the existing global policy environment, the Outlook does not attempt to project the degree of required future policy and technology advancement and deployment for the world or the company, to meet net-zeronet zero by 2050. As future policies and technology advancements emerge, they will be incorporated into the Outlook, and consequently, the company’s business plans will be updated accordingly.
If events or changes in circumstances indicate that the carrying value of an asset may not be recoverable, the company estimates the future undiscounted cash flows of the affected properties to judge the recoverability of carrying amounts. In performing this assessment, assets are grouped at the lowest level for which there are identifiable cash flows that are largely independent of the cash flows of other groups of assets. Cash flows used in recoverability assessments are based on the assumptions developed in the company plan, which is reviewed and approved by the board of directors, and are consistent with the criteria management uses to evaluate investment opportunities. These evaluations make use of the company’s assumptions of future capital allocations, crude oil and natural gas commodity prices including price differentials, refining and chemical margins, volumes, development and operating costs, including greenhouse gas emissions prices, and foreign currency exchange rates. Volumes are based on projected field and facility production profiles, throughput, or sales. Management’s estimate of upstream production volumes used for projected cash flows makes use of proved reserve quantities and may include risk-adjusted unproved reserve quantities. The greenhouse gas emission prices reflect existing or anticipated policy actions of applicable provincial and federal governments. While third-party scenarios such as theInternational Energy Agency Net Zero Emissions by 2050, may be used to test the resiliency of company’s businesses or strategies, they are not used as a basis for developing future cash flows for impairment assessments.
Fair value of impaired assets
An asset group is impaired if its estimated future undiscounted cash flows are less than the asset group’s carrying value. Impairments are measured by the amount by whichexcess of the carrying value exceedsover fair value. The assessment of fair value is based on the views of a likely market participant. The principal parameters used to establish fair value include estimates of acreage values and flowing production metrics from comparable market transactions, market-based estimates of historical cash flow multiples, and discounted cash flows. Inputs and assumptions used in discounted cash flow models include estimates of future production volumes, throughput and product sales volumes, commodity prices which(which are consistent with the average of third-party industry experts and government agencies,agencies), refining and chemical margins, drilling and development costs, operating costs, and discount rates which are reflective of the characteristics of the asset group.
Other impairment estimates
Unproved properties are assessed periodically to determine whether they have been impaired. Significant unproved properties are assessed for impairment individually, and valuation allowances against the capitalized costs are recorded based on the company’s future development plans, the estimated economic chance of success and the length of time that the company expects to hold the properties. Properties that are not individually significant are aggregated by groups and amortized based on development risk and average holding period.
68
Long-lived assets that are held for sale are evaluated for possible impairment by comparing the carrying value of the asset with its fair value less the cost to sell. If the net book value exceeds the fair value less cost to sell, the assets are considered impaired and adjusted to the lower value. Judgment is required to determine if assets are held for sale, and to determine the fair value less cost to sell.
Investments inaccounted for by the equity companiesmethod are assessed for possible impairment when events or changes in circumstances indicate that the carrying value of an investment may not be recoverable. Examples of key indicators include a history of operating losses, negative earnings and cash flow outlook, significant downward revisions to oil and gas reserves, and the financial condition and prospects for the investee’s business segment or geographic region. If the decline in value of the investment is other than temporary, the carrying value of the investment is written down to fair value. In the absence of market prices for the investment, discounted cash flows are used to assess fair value, which requires significant judgment.
Recent impairments
Factors which could put further assets at risk of impairment in the future include reductions in the company’s price or margin outlooks, changes in the allocation of capital or development plans, reduced long-term demand for the company’s products and operating cost increases which exceed the pace of efficiencies or the pace of oil and natural gas price increases.increases or margins. However, due to the inherent difficulty in predicting future commodity prices or margins, and the relationship between industry prices and costs, it is not practicable to reasonably estimate the existence or range of any potential future impairment charges related to the company’s long-lived assets.
Supplemental information regarding oil and gas results of operations, capitalized costs and reserves is provided following the notes to consolidated financial statements.
Pension benefits
The company’s pension plan is managed in compliance with the requirements of governmental authorities and meets funding levels as determined by independent third-party actuaries. Pension accounting requires explicit assumptions regarding, among others, the discount rate for the benefit obligations, the expected rate of return on plan assets and the long-term rate of future compensation increases. All pension assumptions are reviewed annually by senior management. These assumptions are adjusted only as appropriate to reflect long-term changes in market rates and outlook. The long-term expected rate of return on plan assets of 4.54.8 percent used in 2021,2023 compares to actual returns of 8.55.7 percent and 7.36.1 percent achieved over the last2021.2023. If different assumptions are used, the obligation and expense could increase or decrease as a result. As an indication of the company’s potential exposure to changes in the critical assumptions such as the expected rate of return on plan assets and the discount rate for measuring the pension plan benefits obligation, a reduction of 1 percent in the discount rate would increase the benefits obligation by approximately $1.8$1 billion. Similarly, a reduction of 1 percent in the long-term rate of return on plan assets would increase the annual pension expense by approximately $95$75 million before tax. At Imperial,the company, differences between actual returns on plan assets and the long-term expected returns are not recorded in pension expense in the year the differences occur. Such differences are deferred, along with other actuarial gains and losses, and are amortized into pension expense over the expected average remaining service life of employees. Employee benefits expense represented about 1 percent of total expenses in 2021.2023.
10-
and20-year
periods respectively, ending December 31, 69
Asset retirement obligations
The company is subject to retirement obligations for certain assets. The fair values of these obligations are recorded as liabilities on a discounted basis, which is typically at the time the assets are installed. In the estimation of fair value, the company uses assumptions and judgments regarding such factors as the existence of a legal obligation for an asset retirement obligation; technical assessments of the assets; estimated amounts and timing of settlements; discount rates; and inflation rates. The obligations are initially measured at fair value and discounted to present value.
Suspended exploratory well costs
The company continues capitalization of exploratory well costs when it has found a sufficient quantity of reserves to justify its completion as a producing well and the company is making sufficient progress assessing the reserves and the economic and operating viability of the project. Exploratory well costs not meeting these criteria are charged to expense. Assessing whether the company is making sufficient progress on a project requires careful consideration of the facts and circumstances. The facts and circumstances that support continued capitalization of suspended wells atstatements on page 104.statements.
year-end
are disclosed in note 15 to the consolidated financial Tax contingencies
The operations of the company are complex, and related tax interpretations, regulations and legislation are continually changing. Significant management judgment is required in the accounting for income tax contingencies and tax disputes because the outcomes are often difficult to predict.
The benefits of uncertain tax positions that the company has taken or expects to take in its income tax returns are recognized in the financial statements if management concludes that it is more likely than not that the position will be sustained with the tax authorities. For a position that is likely to be sustained, the benefit recognized in the financial statements is measured at the largest amount that is greater than 50 percent likely of being realized. Significant management judgment is required in the accounting for income tax contingencies and tax disputes because the outcomes are often difficult to predict. The company’s unrecognized tax benefits and a description of open tax years are summarized in note 3 to the consolidated financial statements.
70
Management’s report on internal control over financial reporting
Management, including the company’s chief executive officer and principal accounting officer and principal financial officer, is responsible for establishing and maintaining adequate internal control over the company’s financial reporting. Management conducted an evaluation of the effectiveness of internal control over financial reporting based on criteria established in issued by the Committee of Sponsoring Organizations of the Treadway Commission. Based on this evaluation, management concluded that Imperial Oil Limited’s internal control over financial reporting was effective as of December 31, 2021.2023.
Internal Control – Integrated Framework (2013)
PricewaterhouseCoopers LLP, an independent registered public accounting firm, audited the effectiveness of the company’s internal control over financial reporting as of December 31, 2021,2023, as stated in their report which is included herein.
| /s/ Bradley W. Corson | ||
| Bradley W. Corson | ||
Chairman, president and chief executive officer | ||
(Principal executive officer) | ||
| /s/ Daniel E. Lyons | ||
| Daniel E. Lyons | ||
Senior vice-president, finance and administration, and controller | ||
(Principal accounting officer and principal financial officer) | ||
| February | ||
71
Report of Independent Registered Public Accounting Firm
To the Board of Directors and Shareholders of Imperial Oil Limited
Opinions on the Financial Statements and Internal Control over Financial Reporting
We have audited the accompanying consolidated balance sheets of Imperial Oil Limited and its subsidiaries (together, the Company) as of December 31, 20212023 and 2020,2022, and the related consolidated statements of income, comprehensive income, shareholders’ equity and cash flows for each of the three years in the period ended December 31, 2021,2023, including the related notes (collectively referred to as the consolidated financial statements). We also have audited the Company’s internal control over financial reporting as of December 31, 2021,2023, based on criteria established in(2013) issued by the Committee of Sponsoring Organizations of the Treadway Commission (COSO).
Internal Control – Integrated Framework
In our opinion, the consolidated financial statements referred to above present fairly, in all material respects, the financial position of the Company as of December 31, 20212023 and 2020,2022, and the results of its operations and its cash flows for each of the three years in the period ended December 31, 20212023 in conformity with accounting principles generally accepted in the United States of America. Also in our opinion, the Company maintained, in all material respects, effective internal control over financial reporting as of December 31, 2021,2023, based on criteria established in(2013) issued by the COSO.
Internal Control – Integrated Framework
Basis for Opinions
The Company’s management is responsible for these consolidated financial statements, for maintaining effective internal control over financial reporting, and for its assessment of the effectiveness of internal control over financial reporting, included in the accompanying Management’s report on internal control over financial reporting. Our responsibility is to express opinions on the Company’s consolidated financial statements and on the Company’s internal control over financial reporting based on our audits. We are a public accounting firm registered with the Public Company Accounting Oversight Board (United States) (PCAOB) and are required to be independent with respect to the Company in accordance with the U.S. federal securities laws and the applicable rules and regulations of the Securities and Exchange Commission and the PCAOB.
We conducted our audits in accordance with the standards of the PCAOB. Those standards require that we plan and perform the audits to obtain reasonable assurance about whether the consolidated financial statements are free of material misstatement, whether due to error or fraud, and whether effective internal control over financial reporting was maintained in all material respects.
Our audits of the consolidated financial statements included performing procedures to assess the risks of material misstatement of the consolidated financial statements, whether due to error or fraud, and performing procedures that respond to those risks. Such procedures included examining, on a test basis, evidence regarding the amounts and disclosures in the consolidated financial statements. Our audits also included evaluating the accounting principles used and significant estimates made by management, as well as evaluating the overall presentation of the consolidated financial statements. Our audit of internal control over financial reporting included obtaining an understanding of internal control over financial reporting, assessing the risk that a material weakness exists, and testing and evaluating the design and operating effectiveness of internal control based on the assessed risk. Our audits also included performing such other procedures as we considered necessary in the circumstances. We believe that our audits provide a reasonable basis for our opinions.
72
Definition and Limitations of Internal Control over Financial Reporting
A company’s internal control over financial reporting is a process designed to provide reasonable assurance regarding the reliability of financial reporting and the preparation of financial statements for external purposes in accordance with generally accepted accounting principles. A company’s internal control over financial reporting includes those policies and procedures that (i) pertain to the maintenance of records that, in reasonable detail, accurately and fairly reflect the transactions and dispositions of the assets of the company; (ii) provide reasonable assurance that transactions are recorded as necessary to permit preparation of financial statements in accordance with generally accepted accounting principles, and that receipts and expenditures of the company are being made only in accordance with authorizations of management and directors of the company; and (iii) provide reasonable assurance regarding prevention or timely detection of unauthorized acquisition, use, or disposition of the company’s assets that could have a material effect on the financial statements.
Because of its inherent limitations, internal control over financial reporting may not prevent or detect misstatements. Also, projections of any evaluation of effectiveness to future periods are subject to the risk that controls may become inadequate because of changes in conditions, or that the degree of compliance with the policies or procedures may deteriorate.
Critical Audit Matters
The critical audit matter communicated below is a matter arising from the current period audit of the consolidated financial statements that was communicated or required to be communicated to the audit committee and that (i) relates to accounts or disclosures that are material to the consolidated financial statements and (ii) involved our especially challenging, subjective, or complex judgments. The communication of critical audit matters does not alter in any way our opinion on the consolidated financial statements, taken as a whole, and we are not, by communicating the critical audit matter below, providing a separate opinion on the critical audit matter or on the accounts or disclosures to which it relates.
The Impact of Proved Developed Oil and Natural Gas Reserves on Upstream Property, Plant and Equipment, Net
As described in Notes 1 and 2 to the consolidated financial statements, the Company’s consolidated upstream property, plant and equipment (PP&E), net balance was $27,811$26,840 million as of December 31, 2021,2023, and the related depreciation and depletion expense for the year ended December 31, 20212023 was $1,775$1,680 million. Management uses the successful efforts method to account for its exploration and production activities. Costs incurred to purchase, lease or otherwise acquire a property (whether unproved or proved) are capitalized when incurred. As disclosed by management, proved oil and natural gas reserve volumes are used as the basis to calculatedepreciation rates for most upstream assets.well-established,well established, disciplined process driven by qualified geoscience and engineering professionals, assisted by the reserves management group (together, “management’s specialists”)management’s specialists).
unit-of-production
The estimation of proved oil and natural gas reserve volumes is an ongoing process based on technical evaluations, commercial and market assessments, detailed analysis of well information such as flow rates and reservoir pressures, and development and production costs, among other factors. As further disclosed by management, reserves changes are made within a
The principal considerations for our determination that performing procedures relating to the impact of proved developed oil and natural gas reserves on upstream PP&E, net is a critical audit matter are (i) the significant judgment by management, including the use of management’s specialists, when developing the estimates of proved developed oil and natural gas reserve volumes, which in turn led toand (ii) a high degree of auditor judgment, subjectivity, and effort in performing procedures and evaluating the audit evidence related to the data, methods, and assumptions used by management and its specialists in developing the estimates of proved developed oil and natural gas reserve volumes and the assumptions related to development and production costs, as applicable.
volumes.73
Addressing the matter involved performing procedures and evaluating audit evidence in connection with forming our overall opinion on the consolidated financial statements. These procedures included testing the effectiveness of controls relating to management’smanagement's estimates of proved developed oil and natural gas reserve volumes. The work of management’smanagement's specialists was used in performing the procedures to evaluate the reasonableness of estimates ofthe proved developed oil and natural gas reserve volumes. As a basis for using this work, management’s specialists’management's specialists' qualifications were understood and the Company’sCompany's relationship with management’smanagement's specialists was assessed. The procedures performed, also included evaluation ofi) evaluating the methods and assumptions used by management’smanagement's specialists, tests of the data used by management’s specialists, and an evaluation of management’s specialists’ findings. These procedures also included, among others,ii) testing the completeness and accuracy of the data used by management's specialists related to future developmenthistorical production volumes, and production costs. Additionally, these procedures includediii) evaluating whether the assumptionsmanagement's specialists' findings related to developmentestimated future production volumes by comparing the estimate to relevant historical and production costs were reasonable considering the past performance of the Company and its business and strategic plan,current period information, as applicable.
/s/PricewaterhouseCoopers LLP
Chartered Professional Accountants
Calgary, Canada
February 23, 202228, 2024
We have served as the Company’s auditor since 19341934.
74
Consolidated statement of income (U.S. GAAP)
| millions of Canadian dollars | |||||||||||
| For the years ended December 31 | 2023 | 2022 | 2021 | ||||||||
| Revenues and other income | |||||||||||
Revenues (a) | 50,702 | 59,413 | 37,508 | ||||||||
Investment and other income (note 8, 18) | 267 | 257 | 82 | ||||||||
| Total revenues and other income | 50,969 | 59,670 | 37,590 | ||||||||
| Expenses | |||||||||||
Exploration (note 15) | 5 | 5 | 32 | ||||||||
Purchases of crude oil and products (b) | 32,399 | 37,742 | 23,174 | ||||||||
Production and manufacturing (c) | 6,879 | 7,404 | 6,316 | ||||||||
Selling and general (c) | 857 | 882 | 784 | ||||||||
| Federal excise tax and fuel charge | 2,402 | 2,179 | 1,928 | ||||||||
| Depreciation and depletion | 1,907 | 1,897 | 1,977 | ||||||||
| Non-service pension and postretirement benefit | 82 | 17 | 42 | ||||||||
Financing (d) (note 12) | 69 | 60 | 54 | ||||||||
| Total expenses | 44,600 | 50,186 | 34,307 | ||||||||
| Income (loss) before income taxes | 6,369 | 9,484 | 3,283 | ||||||||
Income taxes (note 3) | 1,480 | 2,144 | 804 | ||||||||
| Net income (loss) | 4,889 | 7,340 | 2,479 | ||||||||
Per share information (Canadian dollars) | |||||||||||
Net income (loss) per common share - basic (note 10) | 8.51 | 11.47 | 3.48 | ||||||||
Net income (loss) per common share - diluted (note 10) | 8.49 | 11.44 | 3.48 | ||||||||
| (a) Amounts from related parties included in revenues (note 16). | 13,544 | 17,042 | 8,777 | ||||||||
(b) Amounts to related parties included in purchases of crude oil and products (note 16). | 4,125 | 3,795 | 2,737 | ||||||||
(c) Amounts to related parties included in production and manufacturing, and selling and general expenses (note 16). | 473 | 460 | 420 | ||||||||
| (d) Amounts to related parties included in financing (note 16). | 169 | 78 | 28 | ||||||||
| The information in the notes to consolidated financial statements is an integral part of these statements. | |||||||||||
75
| millions of Canadian dollars | ||||||||||||||
For the years ended December 31 | 2021 | 2020 | 2019 | |||||||||||
Revenues and other income | ||||||||||||||
Revenues (a) | 37,508 | 22,284 | 34,002 | |||||||||||
Investment and other income (note 8) | 82 | 104 | 99 | |||||||||||
Total revenues and other income | 37,590 | 22,388 | 34,101 | |||||||||||
Expenses | ||||||||||||||
Exploration (note 15) | 32 | 13 | 47 | |||||||||||
Purchases of crude oil and products (b) | 23,174 | 13,293 | 20,946 | |||||||||||
Production and manufacturing (c) (note 11) | 6,316 | 5,535 | 6,520 | |||||||||||
Selling and general (c) | 784 | 741 | 900 | |||||||||||
Federal excise tax and fuel charge | �� | 1,928 | 1,736 | 1,808 | ||||||||||
Depreciation and depletion (includes impairments) (note 2, 11) | 1,977 | 3,293 | 1,598 | |||||||||||
Non-service pension and postretirement benefit | 42 | 121 | 143 | |||||||||||
Financing (d) (note 12) | 54 | 64 | 93 | |||||||||||
Total expenses | 34,307 | 24,796 | 32,055 | |||||||||||
Income (loss) before income taxes | 3,283 | (2,408 | ) | 2,046 | ||||||||||
Income taxes (note 3) | 804 | (551 | ) | (154 | ) | |||||||||
Net income (loss) | 2,479 | (1,857 | ) | 2,200 | ||||||||||
Per share information (Canadian dollars) | ||||||||||||||
Net income (loss) per common share - basic (note 10) | 3.48 | (2.53 | ) | 2.88 | ||||||||||
Net income (loss) per common share - diluted (note 10) | 3.48 | (2.53 | ) | 2.88 | ||||||||||
(a) | Amounts from related parties included in revenues, (note 16). | 8,777 | 5,107 | 8,569 | ||||||||||
(b) | Amounts to related parties included in purchases of crude oil and products, (note 16). | 2,737 | 2,484 | 3,305 | ||||||||||
(c) | Amounts to related parties included in production and manufacturing, and selling and general expenses, (note 16). | 420 | 579 | 628 | ||||||||||
(d) | Amounts to related parties included in financing, (note 16). | 28 | 61 | 98 | ||||||||||
Consolidated statement of comprehensive income (U.S. GAAP)
| millions of Canadian dollars | |||||||||||
| For the years ended December 31 | 2023 | 2022 | 2021 | ||||||||
| Net income (loss) | 4,889 | 7,340 | 2,479 | ||||||||
| Other comprehensive income (loss), net of income taxes | |||||||||||
| Postretirement benefits liability adjustment (excluding amortization) | (206) | 582 | 679 | ||||||||
| Amortization of postretirement benefits liability adjustment included in net benefit costs | 41 | 83 | 133 | ||||||||
| Total other comprehensive income (loss) | (165) | 665 | 812 | ||||||||
| Comprehensive income (loss) | 4,724 | 8,005 | 3,291 | ||||||||
| The information in the notes to consolidated financial statements is an integral part of these statements. | |||||||||||
76
Consolidated balance sheet (U.S. GAAP)
| millions of Canadian dollars | ||||||||
| At December 31 | 2023 | 2022 | ||||||
| Assets | ||||||||
| Current assets | ||||||||
| Cash and cash equivalents | 864 | 3,749 | ||||||
Accounts receivable - net (a) | 4,482 | 4,719 | ||||||
Inventories of crude oil and products (note 11) | 1,944 | 1,514 | ||||||
| Materials, supplies and prepaid expenses | 1,008 | 754 | ||||||
| Total current assets | 8,298 | 10,736 | ||||||
Investments and long-term receivables (b) | 1,062 | 893 | ||||||
| Property, plant and equipment, | ||||||||
less accumulated depreciation and depletion (note 18) | 30,835 | 30,506 | ||||||
| Goodwill | 166 | 166 | ||||||
| Other assets, including intangibles - net | 838 | 1,223 | ||||||
| Total assets | 41,199 | 43,524 | ||||||
| Liabilities | ||||||||
| Current liabilities | ||||||||
Notes and loans payable (note 12) | 121 | 122 | ||||||
Accounts payable and accrued liabilities (a) (note 11) | 6,231 | 6,194 | ||||||
| Income taxes payable | 251 | 2,582 | ||||||
| Total current liabilities | 6,603 | 8,898 | ||||||
Long-term debt (c) (note 14) | 4,011 | 4,033 | ||||||
Other long-term obligations (note 5) | 3,851 | 3,467 | ||||||
Deferred income tax liabilities (note 3) | 4,512 | 4,713 | ||||||
| Total liabilities | 18,977 | 21,111 | ||||||
Commitments and contingent liabilities (note 9) | ||||||||
| Shareholders’ equity | ||||||||
Common shares at stated value (d) (note 10) | 992 | 1,079 | ||||||
| Earnings reinvested | 21,907 | 21,846 | ||||||
Accumulated other comprehensive income (loss) (note 17) | (677) | (512) | ||||||
| Total shareholders’ equity | 22,222 | 22,413 | ||||||
| Total liabilities and shareholders’ equity | 41,199 | 43,524 | ||||||
| (a) Accounts receivable - net included net amounts receivable from related parties (note 16). | 1,048 | 1,108 | ||||||
| (b) Investments and long-term receivables included amounts from related parties (note 16). | 283 | 288 | ||||||
| (c) Long-term debt included amounts to related parties (note 16). | 3,447 | 3,447 | ||||||
| (d) Number of common shares authorized (millions) (note 10). | 1,100 | 1,100 | ||||||
| Number of common shares outstanding (millions) (note 10). | 536 | 584 | ||||||
| The information in the notes to consolidated financial statements is an integral part of these statements. | ||||||||
Approved by the directors.
| /s/ Bradley W. Corson | /s/ Daniel E. Lyons | ||||
| Bradley W. Corson | Daniel E. Lyons | ||||
| Chairman, president and | Senior vice-president | ||||
| chief executive officer | finance and administration, and controller | ||||
77
Consolidated statement of shareholders’ equity (U.S. GAAP)
| millions of Canadian dollars | |||||||||||
| At December 31 | 2023 | 2022 | 2021 | ||||||||
Common shares at stated value (note 10) | |||||||||||
| At beginning of year | 1,079 | 1,252 | 1,357 | ||||||||
| Share purchases at stated value | (87) | (173) | (105) | ||||||||
| At end of year | 992 | 1,079 | 1,252 | ||||||||
| Earnings reinvested | |||||||||||
| At beginning of year | 21,846 | 21,660 | 22,050 | ||||||||
| Net income (loss) for the year | 4,889 | 7,340 | 2,479 | ||||||||
| Share purchases in excess of stated value | (3,713) | (6,222) | (2,140) | ||||||||
| Dividends declared | (1,115) | (932) | (729) | ||||||||
| At end of year | 21,907 | 21,846 | 21,660 | ||||||||
Accumulated other comprehensive income (loss) (note 17) | |||||||||||
| At beginning of year | (512) | (1,177) | (1,989) | ||||||||
| Other comprehensive income (loss) | (165) | 665 | 812 | ||||||||
| At end of year | (677) | (512) | (1,177) | ||||||||
| Shareholders’ equity at end of year | 22,222 | 22,413 | 21,735 | ||||||||
| The information in the notes to consolidated financial statements is an integral part of these statements. | |||||||||||
78
Consolidated statement of cash flows (U.S. GAAP)
| millions of Canadian dollars | |||||||||||
| For the years ended December 31 | 2023 | 2022 | 2021 | ||||||||
| Operating activities | |||||||||||
| Net income (loss) | 4,889 | 7,340 | 2,479 | ||||||||
| Adjustments for non-cash items: | |||||||||||
| Depreciation and depletion | 1,907 | 1,897 | 1,977 | ||||||||
(Gain) loss on asset sales (note 8, 18) | (73) | (158) | (49) | ||||||||
| Deferred income taxes and other | (85) | (77) | 91 | ||||||||
| Changes in operating assets and liabilities: | |||||||||||
| Accounts receivable | 237 | (862) | (1,950) | ||||||||
| Inventories, materials, supplies and prepaid expenses | (688) | (477) | 45 | ||||||||
| Income taxes payable | (2,331) | 1,876 | 248 | ||||||||
| Accounts payable and accrued liabilities | 81 | 948 | 2,020 | ||||||||
All other items - net (b) | (203) | (5) | 615 | ||||||||
| Cash flows from (used in) operating activities | 3,734 | 10,482 | 5,476 | ||||||||
| Investing activities | |||||||||||
| Additions to property, plant and equipment | (1,785) | (1,526) | (1,108) | ||||||||
Proceeds from asset sales (note 8, 18) | 86 | 904 | 81 | ||||||||
| Additional investments | — | (6) | — | ||||||||
| Loans to equity companies - net | 5 | 10 | 15 | ||||||||
| Cash flows from (used in) investing activities | (1,694) | (618) | (1,012) | ||||||||
| Financing activities | |||||||||||
Short-term debt - net (note 12) | — | — | (111) | ||||||||
Long-term debt - reduction (note 14) | — | (1,000) | — | ||||||||
Finance lease obligations - reduction (note 14) | (22) | (22) | (20) | ||||||||
| Dividends paid | (1,103) | (851) | (706) | ||||||||
Common shares purchased (note 10) | (3,800) | (6,395) | (2,245) | ||||||||
| Cash flows from (used in) financing activities | (4,925) | (8,268) | (3,082) | ||||||||
| Increase (decrease) in cash and cash equivalents | (2,885) | 1,596 | 1,382 | ||||||||
| Cash and cash equivalents at beginning of year | 3,749 | 2,153 | 771 | ||||||||
Cash and cash equivalents at end of year (a) | 864 | 3,749 | 2,153 | ||||||||
| (a) Cash is composed of cash in bank and cash equivalents at cost. Cash equivalents are all highly liquid securities with maturity of three months or less. | |||||||||||
| (b) Included contributions to registered pension plans. | (148) | (174) | (164) | ||||||||
| Income taxes (paid) refunded. | (4,153) | (374) | 58 | ||||||||
| Interest (paid), net of capitalization. | (69) | (60) | (43) | ||||||||
The information in the notes to consolidated financial statements is an integral part of these statements.
| millions of Canadian dollars | ||||||||||||
For the years ended December 31 | 2021 | 2020 | 2019 | |||||||||
Net income (loss) | 2,479 | (1,857 | ) | 2,200 | ||||||||
Other comprehensive income (loss), net of income taxes | ||||||||||||
Postretirement benefits liability adjustment (excluding amortization) | 679 | (212 | ) | (505 | ) | |||||||
Amortization of postretirement benefits liability adjustment included in net periodic benefit costs | 133 | 134 | 111 | |||||||||
Total other comprehensive income (loss) | 812 | (78 | ) | (394 | ) | |||||||
Comprehensive income (loss) | 3,291 | (1,935 | ) | 1,806 | ||||||||
| millions of Canadian dollars | ||||||||
| At December 31 | 2021 | 2020 | ||||||
Assets | ||||||||
Current assets | ||||||||
Cash | 2,153 | 771 | ||||||
Accounts receivable - net (a) | 3,869 | 1,919 | ||||||
Inventories of crude oil and products (note 11) | 1,102 | 1,161 | ||||||
Materials, supplies and prepaid expenses | 689 | 673 | ||||||
Total current assets | 7,813 | 4,524 | ||||||
Investments and long-term receivables (b) | 757 | 781 | ||||||
Property, plant and equipment, | ||||||||
less accumulated depreciation and depletion | 31,240 | 32,034 | ||||||
Goodwill (note 11) | 166 | 166 | ||||||
Other assets, including intangibles - net | 806 | 526 | ||||||
Total assets | 40,782 | 38,031 | ||||||
Liabilities | ||||||||
Current liabilities | ||||||||
Notes and loans payable (c) (note 12) | 122 | 227 | ||||||
Accounts payable and accrued liabilities (a) (note 11) | 5,184 | 3,153 | ||||||
Income taxes payable | 248 | 0 | ||||||
Total current liabilities | 5,554 | 3,380 | ||||||
Long-term debt (d) (note 14) | 5,054 | 4,957 | ||||||
Other long-term obligations (note 5) | 3,897 | 4,100 | ||||||
Deferred income tax liabilities (note 3) | 4,542 | 4,176 | ||||||
Total liabilities | 19,047 | 16,613 | ||||||
Commitments and contingent liabilities (note 9) | 0 | 0 | ||||||
Shareholders’ equity | ||||||||
Common shares at stated value (e) (note 10) | 1,252 | 1,357 | ||||||
Earnings reinvested | 21,660 | 22,050 | ||||||
Accumulated other comprehensive income (loss) (note 17) | (1,177 | ) | (1,989 | ) | ||||
Total shareholders’ equity | 21,735 | 21,418 | ||||||
Total liabilities and shareholders’ equity | 40,782 | 38,031 | ||||||
| millions of Canadian dollars | ||||||||||||
| At December 31 | 2021 | 2020 | 2019 | |||||||||
Common shares at stated value (note 10) | ||||||||||||
At beginning of year | 1,357 | 1,375 | 1,446 | |||||||||
Share purchases at stated value | (105) | (18) | (71) | |||||||||
At end of year | 1,252 | 1,357 | 1,375 | |||||||||
Earnings reinvested | ||||||||||||
At beginning of year | 22,050 | 24,812 | 24,560 | |||||||||
Net income (loss) for the year | 2,479 | (1,857) | 2,200 | |||||||||
Share purchases in excess of stated value | (2,140) | (256) | (1,302) | |||||||||
Dividends declared | (729) | (647) | (646) | |||||||||
Cumulative effect of accounting change | 0 | (2) | 0 | |||||||||
At end of year | 21,660 | 22,050 | 24,812 | |||||||||
Accumulated other comprehensive income (loss) (note 17) | ||||||||||||
At beginning of year | (1,989) | (1,911) | (1,517) | |||||||||
Other comprehensive income (loss) | 812 | (78) | (394) | |||||||||
At end of year | (1,177) | (1,989) | (1,911) | |||||||||
Shareholders’ equity at end of year | 21,735 | 21,418 | 24,276 | |||||||||
| millions of Canadian dollars | ||||||||||||
| Inflow (outflow) | ||||||||||||
| For the years ended December 31 | 2021 | 2020 | 2019 | |||||||||
Operating activities | ||||||||||||
Net income (loss) | 2,479 | (1,857 | ) | 2,200 | ||||||||
Adjustments for non-cash items: | ||||||||||||
Depreciation and depletion (includes impairments) (note 2) | 1,977 | 3,273 | 1,598 | |||||||||
Impairment of intangible assets (note 11) | - | 20 | 0 | |||||||||
(Gain) loss on asset sales (note 8) | (49 | ) | (35 | ) | (46 | ) | ||||||
Deferred income taxes and other | 91 | (521 | ) | (237 | ) | |||||||
Changes in operating assets and liabilities: | ||||||||||||
Accounts receivable | (1,950 | ) | 780 | (170 | ) | |||||||
Inventories, materials, supplies and prepaid expenses | 45 | 78 | (74 | ) | ||||||||
Income taxes payable | 248 | (106 | ) | 41 | ||||||||
Accounts payable and accrued liabilities | 2,020 | (1,087 | ) | 1,010 | ||||||||
All other items - net (b) | 615 | 253 | 107 | |||||||||
Cash flows from (used in) operating activities | 5,476 | 798 | 4,429 | |||||||||
Investing activities | ||||||||||||
Additions to property, plant and equipment | (1,108 | ) | (868 | ) | (1,636 | ) | ||||||
Proceeds from asset sales (note 8) | 81 | 82 | 82 | |||||||||
Loans to equity companies - net | 15 | (16 | ) | (150 | ) | |||||||
Cash flows from (used in) investing activities | (1,012 | ) | (802 | ) | (1,704 | ) | ||||||
Financing activities | ||||||||||||
Short-term debt - net (note 12) | (111 | ) | 0 | 36 | ||||||||
Reduction in finance lease obligations (note 14) | (20 | ) | (20 | ) | (27 | ) | ||||||
Dividends paid | (706 | ) | (649 | ) | (631 | ) | ||||||
Common shares purchased (note 10) | (2,245 | ) | (274 | ) | (1,373 | ) | ||||||
Cash flows from (used in) financing activities | (3,082 | ) | (943 | ) | (1,995 | ) | ||||||
Increase (decrease) in cash | 1,382 | (947 | ) | 730 | ||||||||
Cash at beginning of year | 771 | 1,718 | 988 | |||||||||
Cash at end of year (a) | 2,153 | 771 | 1,718 | |||||||||
(a) Cash is composed of cash in bank and cash equivalents at cost. Cash equivalents are all highly liquid securities with maturity of three months or less when purchased. | ||||||||||||
(b) Included contributions to registered pension plans. | (164 | ) | (195 | ) | (211 | ) | ||||||
Income taxes (paid) refunded. | 58 | (42 | ) | 145 | ||||||||
Interest (paid), net of capitalization. | (43 | ) | (62 | ) | (91 | ) | ||||||
79
Notes to consolidated financial statements
The accompanying consolidated financial statements and the supporting and supplemental material are the responsibility of the management of Imperial Oil Limited.
The company’s principal business involves exploration for, and production of, crude oil and natural gas; manufacture, trade, transport and sale of crude oil, natural gas, petroleum products, petrochemicals and a variety of specialty products; and pursuit of lower-emission business opportunities including carbon capture and storage, and biofuels.lower-emission fuels.
The consolidated financial statements have been prepared in accordance with United States Generally Accepted Accounting Principles (U.S. GAAP), which requires management to make estimates and judgments that affect the reported amounts of assets, liabilities, revenues and expenses, and the disclosure of contingent assets and liabilities. Actual results could differ from these estimates. Prior years’ data have been reclassified in certain cases to conform to the 20212023 presentation basis. All amounts are in Canadian dollars unless otherwise indicated.
1. Summary of significant accounting policies
Principles of consolidation
The consolidated financial statements include the accounts of subsidiaries the company controls. Intercompany accounts and transactions are eliminated. Subsidiaries include those companies in which Imperial has both an equity interest and the continuing ability to unilaterally determine strategic, operating, investing and financing policies. Imperial Oil Resources Limited and Canada Imperial Oil Limited are significant subsidiaries included in the consolidated financial statements and are wholly owned by Imperial Oil Limited. The consolidated financial statements also include the company’s share of the undivided interest in certain upstream assets, liabilities, revenues and expenses, including i
Revenues
Revenue is recognized at the amount the company expects to receive when the customer has taken control, which is typically when title transfers and the customer has assumed the risks and rewards of ownership. The prices of certain sales are based on price indices that are sometimes not available until the next period. In such cases, estimated realizations are accrued when the sale is recognized, and are finalized when final information is available. Such adjustments to revenue from performance obligations satisfied in previous periods are not significant. Payment for revenue transactions is typically due within 30 days.
Revenues include amounts billed to customers for shipping and handling. Shipping and handling costs incurred up to the point of final storage prior to delivery to a customer are included in “Purchases of crude oil and products” in the Consolidated statement of income. Delivery costs from final storage to customer are recorded as a marketing expense in “Selling and general” expenses. The company does not enter into ongoing arrangements whereby it is required to repurchase its products, nor does the company provide the customer with a right of return.
Future volume delivery obligations that are unsatisfied at the end of the period are expected to be fulfilled through ordinary production or purchases. These performance obligations are based on market prices at the time of the transaction and are fully constrained due to market price volatility.
Purchases and sales of inventory with the same counterparty that are entered into in contemplation of one another are combined and recorded as exchanges measured at the book value of the item sold.
80
"Revenues" and “Accounts"Accounts receivable - net” primarily arisenet" include revenue and receivables both within the scope of ASC 606Revenue from contractsContracts with customers.Customers, and those outside the scope of ASC 606. Long-term receivables are primarily fromnon-customers. receivables outside the scope of ASC 606. Contract assets are mainly from marketing assistance programs and are not significant. Contract liabilities are mainly customer prepayments loyalty programs and accruals of expected volume discounts, and are not significant.
Consumer taxes
Taxes levied on the consumer and collected by the company are excluded from the Consolidated statement of income. These are primarily provincial taxes on motor fuels, the federal goods and services tax and the federal / provincial harmonized sales tax.
Derivative instruments
Recognition and classification of the gain or loss that results from adjusting a derivative to fair value depends on the purpose for the derivative. The gains and losses resulting from changes in the fair value of derivatives are recorded under “Revenues”"Revenues" or “Purchases"Purchases of crude oil and products”products" in the Consolidated statement of income.
Fair value
Fair value is the price that would be received to sell an asset or paid to transfer a liability in an orderly transaction between market participants. Hierarchy levels 1, 2 and 3 are terms for the priority of inputs to valuation techniques used to measure fair value. Hierarchy level 1 inputs are quoted prices in active markets for identical assets or liabilities. Hierarchy level 2 inputs are inputs other than quoted prices included within level 1 that are directly or indirectly observable for the asset or liability. Hierarchy level 3 inputs are inputs that are not observable in the market.
Inventories
Inventories are recorded at the lower of current market value or cost. The cost of crude oil and products is determined primarily using the
last-in,
first-out
(LIFO) method. LIFO was selected over the alternativefirst-in,
first-out
and average cost methods because it provides a better matching of current costs with the revenues generated in the period.Inventory costs include expenditures and other charges (including depreciation), directly orand indirectly incurred in bringing the inventory to its existing condition and location. Selling and general expenses are reported as period costs and excluded from inventory costs. Inventories of materials and supplies are valued at cost or less.
Investments
The company’s interests in the underlying net assets of affiliates it does not control, but over which it exercises significant influence, are accounted for using the equity method. They are recorded at the original cost of the investment plus Imperial’sthe company’s share of earnings since the investment was made, less dividends received. Imperial’sThe company’s share of theinvestmentinvestments of the same issuer. Dividends from these investments are included in “Investment and other income”.
after-tax
earnings of these investments is included in “Investment and other income” in the Consolidated statement of income. Investments in equity securities, other than consolidated subsidiaries and equity method investments, are measured at fair value, with changes in the fair value recognized in net income. The company uses a modified approach for equity securities that do not have a readily determinable fair value. This modified approach measures investments at cost minus impairment, if any, plus or minus changes resulting from observable price changes in orderly transactions in similar These investments represent interests inImperialThe company does not invest in these investments in order to remove liabilities from its balance sheet.
non-publicly
traded pipeline companies and a rail loading joint venture that facilitate the sale and purchase of liquids in the conduct of company operations. Other parties who also have an equity interest in these investments share in the risks and rewards according to their percentage of ownership. 81
Property, plant and equipment
Cost basis
field-by-field
Interest costs incurred to finance expenditures during the construction phase of projects are capitalized as part of the historical cost of acquiring the constructed assets. The project construction phase commences with the development of the detailed engineering design and ends when the constructed assets are ready for their intended use. Capitalized interest costs are included in property, plant and equipment and are depreciated over the service life of the related assets.
Maintenance and repair costs, including planned major maintenance, are expensed as incurred. Improvements that increase or prolong the service life or capacity of an asset are capitalized.
Depreciation, depletion and amortization
Depreciation, depletion and amortization are primarily determined under either themethod or the straight-line method, which is based on estimated asset service life taking obsolescence into consideration. Depreciation and depletion for assets associated with producing properties begin at the time when production commences on a regular basis. Depreciation for other assets begins when the asset is in place and ready for its intended use. Assets under construction are not depreciated or depleted.
unit-of-production
Acquisition costs of proved properties are amortized using amethod, computed on the basis of total proved oil and natural gas reserve volumes. Capitalized exploratory drilling and development costs associated with productive depletable extractive properties are amortized using therates based on the amount of proved developed reserves of oil and gas that are estimated to be recoverable from existing facilities using current operating methods. Under themethod, oil and natural gas volumes are considered produced once they have been measured through meters at custody transfer or sales transaction points at the outlet valve on the lease or field storage tank. In the event that themethod does not result in an equitable allocation of cost over the economic life of an upstream asset, an alternative method is used. The straight-line method is used in limited situations where the expected life of the asset does not reasonably correlate with that of the underlying reserves. For example, certain assets used in the production of oil and natural gas have a shorter life than the reserves, and as such, the company uses straight-line depreciation to ensure the asset is fully depreciated by the end of its useful life. Investments in mining heavy equipment and certain ore processing plant assets at oil sands mining properties are depreciated on a straight-line basis over a maximum of 15 years and 50 years respectively. Depreciation of other plant and equipment is calculated using the straight-line method, based on the estimated service life of the asset.
unit-of-production
unit-of-production
unit-of-production
unit-of-production
To the extent that proved reserves for a property are substantiallymethod based on reserves determined at the most recent SEC price which results in a more meaningful quantity of proved reserves, appropriately adjusted for production and technical changes. This approach was applied in 2021, with the corresponding effect on depreciation expense being immaterial compared to prior periods. For 2022, all properties have sufficient reserves at current SEC prices which will enable equitable allocation of cost over the economic lives of the Upstream assets.
de-booked
and that property continues to produce such that the resulting depreciation charge does not result in an equitable allocation of cost over the expected life, assets will be depreciated using aunit-of-production
Investments in refinery and chemical process manufacturing equipment are generally depreciated on a straight-line basis over a
25-year
life. Maintenance and repairs, including planned major maintenance, are expensed as incurred. Major renewals and improvements are capitalized and the assets replaced are retired.82
Impairment assessment
The company tests assets or groups of assets for recoverability on an ongoing basis whenever events or changes in circumstances indicate that the carrying amounts may not be recoverable.
Among the events or changes in circumstances which could indicate that the carrying value of an asset or asset group may not be recoverable are the following:
•a significant decrease in the market price of a long-lived asset;
•a significant adverse change in the extent or manner in which an asset is being used or in its physical condition including a significant decrease in current and projected reserve volumes;
•a significant adverse change in legal factors or in the business climate that could affect the value, including an adverse action or assessment by a regulator;
•an accumulation of project costs significantly in excess of the amount originally expected;
•a current-period operating loss combined with a history and forecast of operating or cash flow losses; and
•a current expectation that, more likely than not, a long-lived asset will be sold or otherwise disposed of significantly before the end of its previously estimated useful life.
The company has a robust process to monitor for indicators of potential impairment across its asset groups throughout the year. This process is aligned with the requirements ofandand relies, in part, on the company’s planning and budgeting cycle. Asset valuation analysis, profitability reviews and other periodic control processes assist the company in assessing whether events or changes in circumstances indicate the carrying amounts of any of its assets may not be recoverable.
ASC 360
ASC 932
Because the lifespans of the vast majority of the company’s major assets are measured in decades, the future cash flows of these assets are predominantly based on long-term oil and natural gas commodity prices, industry margins, and development and production costs. Significant reductions in the company’s view of oil or natural gas commodity prices or margin ranges, especially the longer-term prices and margins, and changes in the development plans, including decisions to defer, reduce or eliminate planned capital spending, can be an indicator of potential impairment. Other events or changes in circumstances, including indicators outlined incan be indicators of potential impairment as well.
ASC 360
In general, Imperialthe company does not view temporarily low prices or margins as an indication of impairment. Management believes that prices over the long term must be sufficient to generate investments in energy supply to meet global demand. Although prices will occasionally drop significantly, industry prices over the long term will continue to be driven by market supply and demand fundamentals. On the supply side, industry production from mature fields is declining. This is being offset by investments to generate production from new discoveries, field developments, and technology and efficiency advancements. OPECOPEC+ investment activities and production policies also have an impact on world oil supplies. The demand side is largely a function of general economic activities, alternative energy sources and levels of prosperity. During the lifespan of its major assets, the company expects that oil and gas prices and industry margins will experience significant volatility, and consequently,volatility. Consequently, these assets will experience periods of higher earnings and periods of lower earnings, or even losses. In assessing whether events or changes in circumstances indicate the carrying value of an asset may not be recoverable, the company considers recent periods of operating losses in the context of its longer-term view of prices and margins.
In the Upstream, the standardized measure of discounted cash flows included in the “Supplemental information on oil and gas exploration and production activities” is required to use prices based on the average ofprices in the year. These prices represent discrete points in time and could be higher or lower than the company’s price assumptions which are used for impairment assessments. The company believes the standardized measure does not provide a reliable estimate of the expected future cash flows to be obtained from the development and production of its oil and gas properties or of the value of its oil and gas reserves and therefore does not consider it relevant in determining whether events or changes in circumstances indicate the need for an impairment assessment.
first-day-of-month
83
The annual planning and budgeting process, known as the company plan, is the mechanism by which resources (capital, operating expenses and people) are allocated across the company. The foundation for the energy supply and demand assumptions supporting the company plan begins with Exxon Mobil Corporation’s(the Outlook), which contains demand and supply projections based on its assessment of current trends in technology, government policies, consumer preferences, geopolitics, economic development, and economic development.other factors.
Global Outlook for Energy
Reflective of the existing global policy environment, the Outlook does not attempt to project the degree of required future policy and technology advancement and deployment for the world or the company, to meet net-zeronet zero by 2050. As future policies and technology advancements emerge, they will be incorporated into the Outlook, and consequently, the company’s business plans will be updated accordingly.
If events or changes in circumstances indicate that the carrying value of an asset may not be recoverable, the company estimates the future undiscounted cash flows of the affected properties to judge the recoverability of carrying amounts. In performing this assessment, assets are grouped at the lowest level for which there are identifiable cash flows that are largely independent of the cash flows of other groups of assets. Cash flows used in recoverability assessments are based on the assumptions developed in the company plan, which is reviewed and approved by the board of directors, and are consistent with the criteria management uses to evaluate investment opportunities. These evaluations make use of the company’s assumptions of future capital allocations, crude oil and natural gas commodity prices including price differentials, refining and chemical margins, volumes, development and operating costs, including greenhouse gas emissions prices, and foreign currency exchange rates. Volumes are based on projected field and facility production profiles, throughput, or sales. Management’s estimate of upstream production volumes used for projected cash flows makes use of proved reserve quantities and may include risk-adjusted unproved reserve quantities. The greenhouse gas emission prices reflect existing or anticipated policy actions of applicable provincial and federal governments.
Fair value of impaired assets
An asset group is impaired if its estimated future undiscounted cash flows are less than the asset group’s carrying value. Impairments are measured by the amount by whichexcess of the carrying value exceedsover fair value. The assessment of fair value is based on the views of a likely market participant. The principal parameters used to establish fair value include estimates of acreage values and flowing production metrics from comparable market transactions, market-based estimates of historical cash flow multiples, and discounted cash flows. Inputs and assumptions used in discounted cash flow models include estimates of future production volumes, throughput and product sales volumes, commodity prices which(which are consistent with the average of third-party industry experts and government agencies,agencies), refining and chemical margins, drilling and development costs, operating costs, and discount rates which are reflective of the characteristics of the asset group.
Other impairment estimates
Unproved properties are assessed periodically to determine whether they have been impaired. Significant unproved properties are assessed for impairment individually, and valuation allowances against the capitalized costs are recorded based on the company’s future development plans, the estimated economic chance of success and the length of time that the company expects to hold the properties. Properties that are not individually significant are aggregated by groups and amortized based on development risk and average holding period.
Long-lived assets that are held for sale are evaluated for possible impairment by comparing the carrying value of the asset with its fair value less the cost to sell. If the net book value exceeds the fair value less cost to sell, the assets are considered impaired and adjusted to the lower value. Gains on sales of proved and unproved properties are only recognized when there is neither uncertainty about the recovery of costs applicable to any interest retained nor any substantial obligation for future performance by the company. Losses on properties sold are recognized when incurred or when the properties are held for sale and the fair value of the properties is less than the carrying value.
84
Asset retirement obligations and other environmental liabilities
The company incurs retirement obligations for certain assets. The fair values of these obligations are recorded as liabilities on a discounted basis, which is typically at the time the assets are installed. In the estimation of fair value, the company uses assumptions and judgments regarding such factors as the existence of a legal obligation for an asset retirement obligation, technical assessments of the assets, estimated amounts and timing of settlements, discount rates and inflation rates. Asset retirement obligations incurred in the current period were levelLevel 3 fair value measurements. The costs associated with these liabilities are capitalized as part of the related assets and depreciated as the reserves are produced. Over time, the liabilities are accreted for the change in their present value.
Asset retirement obligations for downstream and chemical facilities generally become firm at the time the facilities are permanently shut down and dismantled. These obligations may include the costs of asset disposal and additional soil remediation. However, these sites generally have indeterminate lives based on plans for continued operations, and as such, the fair value of the conditional legal obligations cannot be measured, since it is impossible to estimate the future settlement dates of such obligations. Note 5 to the consolidated financial statements provides a three-year continuity table detailing the changes in asset retirement obligations.
The company accrues environmental liabilities when it is probable that obligations have been incurred and the amount can be reasonably estimated. Provisions for environmental liabilities are determined based on engineering estimated costs, taking into account the anticipated method and extent of remediation consistent with legal requirements, current technology and the possible use of the location. These provisions are not reduced by possible recoveries from third parties and projected cash expenditures are not discounted.
Foreign-currency translation
Monetary assets and liabilities in foreign currencies have been translated at the rates of exchange prevailing on December 31. Any exchange gains or losses are recognized in income.
85
2. Business segments
The company operates its business in Canada. TheCanada, and its reportable segments are Upstream, Downstream and Chemical functions best define the operating segments of the business that are reported separately.Chemical. The factors used to identify these reportable segments are based on the nature of the operations that are undertaken by each segment and the structure of the company’s internal organization. The Upstream segment is organized and operates to explore for and ultimately produce crude oil and its equivalent, and natural gas. The Downstream segment is organized and operates to refine crude oil into petroleum products and to distribute and market these products. The Chemical segment is organized and operates to manufacture and market hydrocarbon-based chemicals and chemical products. The above segmentation has been the long-standing practice of the company and is broadly understood across the petroleum and petrochemical industries.
Corporate and other includes assets and liabilities that do not specifically relate to business segments – primarily cash, capitalized interest costs, short-term borrowings, long-term debt and liabilities associated with incentive compensation, pension and other postretirement benefit liabilities. Net earnings effects under Corporate and other activities primarily include debt-related financing, corporate governance costs,
non-service
pension and postretirement benefit costs, share-based incentive compensation expenses and interest income.Segment accounting policies are the same as those described in the summarynote 1, "Summary of significant accounting policies.policies". Upstream, Downstream and Chemical expenses include amounts allocated from Corporate and other activities. The allocation is based on proportional segment expenses. Transfers of assets between segments are recorded at book amounts. Intersegment sales are made essentially at prevailing market prices. Assets and liabilities that are not identifiable by segment are allocated.
86
| Upstream | Downstream | Chemical | ||||||||||||||||||||||||||||||||||
| millions of Canadian dollars | 2021 | 2020 | 2019 | 2021 | 2020 | 2019 | 2021 | 2020 | 2019 | |||||||||||||||||||||||||||
Revenues and other income | ||||||||||||||||||||||||||||||||||||
| Revenues (a) | 5,863 | 6,263 | 9,479 | 30,207 | 15,178 | 23,591 | 1,438 | 843 | 932 | |||||||||||||||||||||||||||
| Intersegment sales (b) | 9,956 | 2,527 | 3,763 | 4,520 | 1,480 | 1,597 | 319 | 165 | 229 | |||||||||||||||||||||||||||
| Investment and other income (note 8) | 12 | 7 | 17 | 59 | 78 | 47 | 1 | - | - | |||||||||||||||||||||||||||
15,831 | 8,797 | 13,259 | 34,786 | 16,736 | 25,235 | 1,758 | 1,008 | 1,161 | ||||||||||||||||||||||||||||
Expenses | ||||||||||||||||||||||||||||||||||||
| Exploration (note 15) | 32 | 13 | 47 | 0 | - | - | 0 | - | - | |||||||||||||||||||||||||||
| Purchases of crude oil and products (b) (note 11) | 7,492 | 4,834 | 6,528 | 29,505 | 12,047 | 19,332 | 966 | 579 | 667 | |||||||||||||||||||||||||||
| Production and manufacturing (note 11) | 4,661 | 3,852 | 4,440 | 1,445 | 1,468 | 1,829 | 210 | 215 | 251 | |||||||||||||||||||||||||||
| Selling and general | 0 | - | - | 572 | 619 | 774 | 90 | 92 | 86 | |||||||||||||||||||||||||||
| Federal excise tax and fuel charge | 0 | - | - | 1,928 | 1,736 | 1,808 | 0 | - | - | |||||||||||||||||||||||||||
| Depreciation and depletion (c) (note 11) | 1,775 | 3,084 | 1,374 | 158 | 166 | 186 | 18 | 19 | 16 | |||||||||||||||||||||||||||
Non-service pension and postretirement benefit | 0 | - | - | 0 | - | - | 0 | - | - | |||||||||||||||||||||||||||
| Financing (note 12) | 15 | 3 | 3 | 0 | - | - | 0 | - | - | |||||||||||||||||||||||||||
Total expenses | 13,975 | 11,786 | 12,392 | 33,608 | 16,036 | 23,929 | 1,284 | 905 | 1,020 | |||||||||||||||||||||||||||
Income (loss) before income taxes (note 11) | 1,856 | (2,989 | ) | 867 | 1,178 | 700 | 1,306 | 474 | 103 | 141 | ||||||||||||||||||||||||||
Income tax expense (benefit) (d) (note 3) | 461 | (671 | ) | (481 | ) | 283 | 147 | 345 | 113 | 25 | 33 | |||||||||||||||||||||||||
Net income (loss) (note 11) | 1,395 | (2,318 | ) | 1,348 | 895 | 553 | 961 | 361 | 78 | 108 | ||||||||||||||||||||||||||
Cash flows from (used in) operating activities (b) | 4,913 | 286 | 2,423 | 179 | 470 | 1,965 | 421 | 114 | 172 | |||||||||||||||||||||||||||
Capital and exploration expenditures (e) | 632 | 561 | 1,248 | 476 | 251 | 484 | 8 | 21 | 34 | |||||||||||||||||||||||||||
Property, plant and equipment | ||||||||||||||||||||||||||||||||||||
| Cost | 48,200 | 47,693 | 47,050 | 6,772 | 6,321 | 6,123 | 984 | 975 | 954 | |||||||||||||||||||||||||||
| Accumulated depreciation and depletion | (20,389 | ) | (18,786 | ) | (15,889 | ) | (4,096 | ) | (3,962 | ) | (3,830 | ) | (721 | ) | (699 | ) | (680 | ) | ||||||||||||||||||
Net property, plant and equipment (f) | 27,811 | 28,907 | 31,161 | 2,676 | 2,359 | 2,293 | 263 | 276 | 274 | |||||||||||||||||||||||||||
Total assets (b) (g) (h) | 29,416 | 31,835 | 34,554 | 7,945 | 4,554 | 5,179 | 474 | 408 | 416 | |||||||||||||||||||||||||||
| Corporate and other | Eliminations | Consolidated | ||||||||||||||||||||||||||||||||||
| millions of Canadian dollars | 2021 | 2020 | 2019 | 2021 | 2020 | 2019 | 2021 | 2020 | 2019 | |||||||||||||||||||||||||||
Revenues and other income | ||||||||||||||||||||||||||||||||||||
| Revenues (a) | 0 | - | - | 0 | - | - | 37,508 | 22,284 | 34,002 | |||||||||||||||||||||||||||
| Intersegment sales (b) | 0 | - | - | (14,795 | ) | (4,172 | ) | (5,589 | ) | 0 | - | - | ||||||||||||||||||||||||
| Investment and other income (note 8) | 10 | 19 | 35 | 0 | - | - | 82 | 104 | 99 | |||||||||||||||||||||||||||
10 | 19 | 35 | (14,795 | ) | (4,172 | ) | (5,589 | ) | 37,590 | 22,388 | 34,101 | |||||||||||||||||||||||||
Expenses | ||||||||||||||||||||||||||||||||||||
| Exploration (note 15) | 0 | - | - | 0 | - | - | 32 | 13 | 47 | |||||||||||||||||||||||||||
| Purchases of crude oil and products (b) (note 11) | 0 | - | - | (14,789 | ) | (4,167 | ) | (5,581 | ) | 23,174 | 13,293 | 20,946 | ||||||||||||||||||||||||
| Production and manufacturing (note 11) | 0 | - | - | 0 | - | - | 6,316 | 5,535 | 6,520 | |||||||||||||||||||||||||||
| Selling and general | 128 | 35 | 48 | (6 | ) | (5 | ) | (8 | ) | 784 | 741 | 900 | ||||||||||||||||||||||||
| Federal excise tax and fuel charge | 0 | - | - | 0 | - | - | 1,928 | 1,736 | 1,808 | |||||||||||||||||||||||||||
| Depreciation and depletion (c) (note 11) | 26 | 24 | 22 | 0 | - | - | 1,977 | 3,293 | 1,598 | |||||||||||||||||||||||||||
Non-service pension and postretirement benefit | 42 | 121 | 143 | 0 | - | - | 42 | 121 | 143 | |||||||||||||||||||||||||||
| Financing (note 12) | 39 | 61 | 90 | 0 | - | - | 54 | 64 | 93 | |||||||||||||||||||||||||||
Total expenses | 235 | 241 | 303 | (14,795 | ) | (4,172 | ) | (5,589 | ) | 34,307 | 24,796 | 32,055 | ||||||||||||||||||||||||
Income (loss) before income taxes (note 11) | (225 | ) | (222 | ) | (268 | ) | 0 | - | - | 3,283 | (2,408 | ) | 2,046 | |||||||||||||||||||||||
Income tax expense (benefit) (d) (note 3) | (53 | ) | (52 | ) | (51 | ) | 0 | - | - | 804 | (551 | ) | (154 | ) | ||||||||||||||||||||||
Net income (loss) (note 11) | (172 | ) | (170 | ) | (217 | ) | 0 | - | - | 2,479 | (1,857 | ) | 2,200 | |||||||||||||||||||||||
Cash flows from (used in) operating activities (b) | (47 | ) | (64 | ) | (124 | ) | 10 | (8 | ) | (7 | ) | 5,476 | 798 | 4,429 | ||||||||||||||||||||||
Capital and exploration expenditures (e) | 24 | 41 | 48 | 0 | - | - | 1,140 | 874 | 1,814 | |||||||||||||||||||||||||||
Property, plant and equipment | ||||||||||||||||||||||||||||||||||||
| Cost | 806 | 782 | 741 | 0 | - | - | 56,762 | 55,771 | 54,868 | |||||||||||||||||||||||||||
| Accumulated depreciation and depletion | (316 | ) | (290 | ) | (266 | ) | 0 | - | - | (25,522 | ) | (23,737 | ) | (20,665 | ) | |||||||||||||||||||||
Net property, plant and equipment (f) | 490 | 492 | 475 | 0 | - | - | 31,240 | 32,034 | 34,203 | |||||||||||||||||||||||||||
Total assets (b) (g) (h) | 3,196 | 1,632 | 2,536 | (249 | ) | (398 | ) | (498 | ) | 40,782 | 38,031 | 42,187 | ||||||||||||||||||||||||
| Upstream | Downstream | Chemical | ||||||||||||||||||||||||||||||
| millions of Canadian dollars | 2023 | 2022 | 2021 | 2023 | 2022 | 2021 | 2023 | 2022 | 2021 | |||||||||||||||||||||||
| Revenues and other income | ||||||||||||||||||||||||||||||||
Revenues (a) (b) | 222 | 494 | 5,863 | 49,241 | 57,466 | 30,207 | 1,239 | 1,453 | 1,438 | |||||||||||||||||||||||
Intersegment sales (c) | 16,274 | 19,135 | 9,956 | 6,509 | 7,476 | 4,520 | 342 | 523 | 319 | |||||||||||||||||||||||
Investment and other income (note 8, 18) | 16 | 135 | 12 | 108 | 43 | 59 | — | — | 1 | |||||||||||||||||||||||
| 16,512 | 19,764 | 15,831 | 55,858 | 64,985 | 34,786 | 1,581 | 1,976 | 1,758 | ||||||||||||||||||||||||
| Expenses | ||||||||||||||||||||||||||||||||
Exploration (note 15) | 5 | 5 | 32 | — | — | — | — | — | — | |||||||||||||||||||||||
Purchases of crude oil and products (c) (note 11) | 6,636 | 7,971 | 7,492 | 47,886 | 55,569 | 29,505 | 997 | 1,330 | 966 | |||||||||||||||||||||||
| Production and manufacturing | 4,917 | 5,491 | 4,661 | 1,702 | 1,640 | 1,445 | 260 | 273 | 210 | |||||||||||||||||||||||
| Selling and general | — | — | — | 693 | 653 | 572 | 89 | 85 | 90 | |||||||||||||||||||||||
| Federal excise tax and fuel charge | — | — | — | 2,399 | 2,177 | 1,928 | 3 | 2 | — | |||||||||||||||||||||||
| Depreciation and depletion | 1,680 | 1,673 | 1,775 | 183 | 179 | 158 | 15 | 18 | 18 | |||||||||||||||||||||||
| Non-service pension and postretirement benefit | — | — | — | — | — | — | — | — | — | |||||||||||||||||||||||
Financing (note 12) | 7 | 5 | 15 | — | 1 | — | — | — | — | |||||||||||||||||||||||
| Total expenses | 13,245 | 15,145 | 13,975 | 52,863 | 60,219 | 33,608 | 1,364 | 1,708 | 1,284 | |||||||||||||||||||||||
Income (loss) before income taxes (note 11) | 3,267 | 4,619 | 1,856 | 2,995 | 4,766 | 1,178 | 217 | 268 | 474 | |||||||||||||||||||||||
Income tax expense (benefit) (note 3) | 755 | 974 | 461 | 694 | 1,144 | 283 | 53 | 64 | 113 | |||||||||||||||||||||||
Net income (loss) (c) (note 11) | 2,512 | 3,645 | 1,395 | 2,301 | 3,622 | 895 | 164 | 204 | 361 | |||||||||||||||||||||||
Cash flows from (used in) operating activities (c) | 3,100 | 5,834 | 4,913 | 608 | 4,415 | 179 | 53 | 276 | 421 | |||||||||||||||||||||||
Capital and exploration expenditures (d) | 1,108 | 1,128 | 632 | 472 | 295 | 476 | 23 | 10 | 8 | |||||||||||||||||||||||
| Property, plant and equipment | ||||||||||||||||||||||||||||||||
| Cost | 46,776 | 45,784 | 48,200 | 7,368 | 6,926 | 6,772 | 1,018 | 995 | 984 | |||||||||||||||||||||||
| Accumulated depreciation and depletion | (19,936) | (18,835) | (20,389) | (4,301) | (4,143) | (4,096) | (757) | (741) | (721) | |||||||||||||||||||||||
Net property, plant and equipment (e) | 26,840 | 26,949 | 27,811 | 3,067 | 2,783 | 2,676 | 261 | 254 | 263 | |||||||||||||||||||||||
Total assets (c) | 28,718 | 28,830 | 29,416 | 10,114 | 9,277 | 7,945 | 475 | 491 | 474 | |||||||||||||||||||||||
| Corporate and other | Eliminations | Consolidated | ||||||||||||||||||||||||||||||||||||
| millions of Canadian dollars | 2023 | 2022 | 2021 | 2023 | 2022 | 2021 | 2023 | 2022 | 2021 | |||||||||||||||||||||||||||||
| Revenues and other income | ||||||||||||||||||||||||||||||||||||||
Revenues (a) (b) | — | — | — | — | — | — | 50,702 | 59,413 | 37,508 | |||||||||||||||||||||||||||||
Intersegment sales (c) | — | — | — | (23,125) | (27,134) | (14,795) | — | — | — | |||||||||||||||||||||||||||||
Investment and other income (note 8, 18) | 143 | 79 | 10 | — | — | — | 267 | 257 | 82 | |||||||||||||||||||||||||||||
| 143 | 79 | 10 | (23,125) | (27,134) | (14,795) | 50,969 | 59,670 | 37,590 | ||||||||||||||||||||||||||||||
| Expenses | ||||||||||||||||||||||||||||||||||||||
Exploration (note 15) | — | — | — | — | — | — | 5 | 5 | 32 | |||||||||||||||||||||||||||||
Purchases of crude oil and products (c) (note 11) | — | — | — | (23,120) | (27,128) | (14,789) | 32,399 | 37,742 | 23,174 | |||||||||||||||||||||||||||||
| Production and manufacturing | — | — | — | — | — | — | 6,879 | 7,404 | 6,316 | |||||||||||||||||||||||||||||
| Selling and general | 80 | 150 | 128 | (5) | (6) | (6) | 857 | 882 | 784 | |||||||||||||||||||||||||||||
| Federal excise tax and fuel charge | — | — | — | — | — | — | 2,402 | 2,179 | 1,928 | |||||||||||||||||||||||||||||
| Depreciation and depletion | 29 | 27 | 26 | — | — | — | 1,907 | 1,897 | 1,977 | |||||||||||||||||||||||||||||
| Non-service pension and postretirement benefit | 82 | 17 | 42 | — | — | — | 82 | 17 | 42 | |||||||||||||||||||||||||||||
Financing (note 12) | 62 | 54 | 39 | — | — | — | 69 | 60 | 54 | |||||||||||||||||||||||||||||
| Total expenses | 253 | 248 | 235 | (23,125) | (27,134) | (14,795) | 44,600 | 50,186 | 34,307 | |||||||||||||||||||||||||||||
Income (loss) before income taxes (note 11) | (110) | (169) | (225) | — | — | — | 6,369 | 9,484 | 3,283 | |||||||||||||||||||||||||||||
Income tax expense (benefit) (note 3) | (22) | (38) | (53) | — | — | — | 1,480 | 2,144 | 804 | |||||||||||||||||||||||||||||
Net income (loss) (c) (note 11) | (88) | (131) | (172) | — | — | — | 4,889 | 7,340 | 2,479 | |||||||||||||||||||||||||||||
Cash flows from (used in) operating activities (c) | (37) | (59) | (47) | 10 | 16 | 10 | 3,734 | 10,482 | 5,476 | |||||||||||||||||||||||||||||
Capital and exploration expenditures (d) | 175 | 57 | 24 | — | — | — | 1,778 | 1,490 | 1,140 | |||||||||||||||||||||||||||||
| Property, plant and equipment | ||||||||||||||||||||||||||||||||||||||
| Cost | 1,038 | 863 | 806 | — | — | — | 56,200 | 54,568 | 56,762 | |||||||||||||||||||||||||||||
| Accumulated depreciation and depletion | (371) | (343) | (316) | — | — | — | (25,365) | (24,062) | (25,522) | |||||||||||||||||||||||||||||
Net property, plant and equipment (e) | 667 | 520 | 490 | — | — | — | 30,835 | 30,506 | 31,240 | |||||||||||||||||||||||||||||
Total assets (c) | 2,366 | 5,312 | 3,196 | (474) | (386) | (249) | 41,199 | 43,524 | 40,782 | |||||||||||||||||||||||||||||
87
(a)Includes export sales to the United States of Contents$8,982 million (2022 - $12,394 million, 2021 - $7,228 million).
(b)Revenues include both revenue within the scope of ASC 606 and outside the scope of ASC 606. Trade receivables in "Accounts receivable – net" reported on the Consolidated balance sheet include both receivables within the scope of ASC 606 and outside the scope of ASC 606. Revenue and receivables outside the scope of ASC 606 primarily relate to physically settled commodity contracts accounted for as derivatives. Contractual terms, credit quality and type of customer are generally similar between contracts within the scope of ASC 606 and those outside it.
(c)In 2021, the Downstream segment acquired a portion of Upstream crude inventory for $444 million. There was no earnings impact and the effects of this transaction have been eliminated for consolidation purposes. (d)Capital and exploration expenditures (CAPEX) include exploration expenses, additions to property, plant and equipment, additions to finance leases, additional investments and acquisitions and the company’s share of similar costs for equity companies. CAPEX excludes the purchase of carbon emission credits. (e)Includes property, plant and equipment under construction of $3,251 million (2022 - $2,676 million, 2021 - $2,348 million). | |||||||||||||||||||||||||||||||||||||||||||||||||||||||||||||||||||||||||
3. Income taxes
| millions of Canadian dollars | 2023 | 2022 | 2021 | ||||||||
| Current income tax expense (benefit) | 1,556 | 2,228 | 711 | ||||||||
Deferred income tax expense (benefit) | (76) | (84) | 93 | ||||||||
| Total income tax expense (benefit) | 1,480 | 2,144 | 804 | ||||||||
Statutory corporate tax rate (percent) | 24.1 | 24.1 | 24.0 | ||||||||
| Increase (decrease) resulting from: | |||||||||||
Other (a) | (0.9) | (1.5) | 0.5 | ||||||||
Effective income tax rate (percent) | 23.2 | 22.6 | 24.5 | ||||||||
(a)Other primarily relates to prior year adjustments, disposals, investment tax credits and re-assessments. In 2022, the company's sale of its interests in XTO Energy Canada decreased the effective income tax rate by 1.3 percent.
millions of Canadian dollars | 2021 | 2020 | 2019 | |||||||||
Current income tax expense (benefit) (a) | 711 | (27 | ) | 140 | ||||||||
Deferred income tax expense (benefit) (a) | 93 | (524 | ) | (294 | ) | |||||||
Total income tax expense (benefit) (a) | 804 | (551 | ) | (154 | ) | |||||||
Statutory corporate tax rate (percent) | 24.0 | 25.0 | 26.0 | |||||||||
Increase (decrease) resulting from: | ||||||||||||
Enacted tax rate change (a) | 0 | 0.1 | (31.9 | ) | ||||||||
Other (b) | 0.5 | (2.2 | ) | (1.6 | ) | |||||||
Effective income tax rate (percent) | 24.5 | 22.9 | (7.5 | ) |
Deferred income taxes are based on differences between the accounting and tax values of assets and liabilities. These differences in value are
re-measured
at eachyear-end
using the tax rates and tax laws expected to apply when those differences are realized or settled in the future. Components of deferred income tax liabilities and assets as at December 31 were:| millions of Canadian dollars | 2023 | 2022 | 2021 | ||||||||
| Depreciation and amortization | 5,366 | 5,388 | 5,284 | ||||||||
| Successful drilling and land acquisitions | 237 | 236 | 331 | ||||||||
| Pension and benefits | (168) | (105) | (303) | ||||||||
| Asset retirement obligation | (655) | (529) | (418) | ||||||||
| Capitalized interest | 155 | 127 | 120 | ||||||||
| LIFO inventory valuation | (406) | (454) | (413) | ||||||||
| Tax loss carryforwards | (69) | (84) | (42) | ||||||||
| Valuation allowance | 69 | 73 | — | ||||||||
| Other | (60) | (53) | (101) | ||||||||
| Net deferred income tax liabilities | 4,469 | 4,599 | 4,458 | ||||||||
millions of Canadian dollars | 2021 | 2020 | 2019 | |||||||||
Depreciation and amortization | 5,284 | 5,319 | 5,164 | |||||||||
Successful drilling and land acquisitions | 331 | 363 | 750 | |||||||||
Pension and benefits | (303 | ) | (534 | ) | (469 | ) | ||||||
Asset retirement obligation | (418 | ) | (403 | ) | (336 | ) | ||||||
Capitalized interest | 120 | 120 | 117 | |||||||||
LIFO inventory valuation | (413 | ) | (150 | ) | (276 | ) | ||||||
Tax loss carryforwards | (42 | ) | (460 | ) | (141 | ) | ||||||
Other | (101 | ) | (154 | ) | (161 | ) | ||||||
Net deferred income tax liabilities | 4,458 | 4,101 | 4,648 |
88
Unrecognized tax benefits
Unrecognized tax benefits reflect the difference between positions taken or expected to be taken on income tax returns and the amounts recognized in the financial statements.
The following table summarizes the movement in unrecognized tax benefits:
| millions of Canadian dollars | 2023 | 2022 | 2021 | ||||||||
| Balance as of January 1 | 60 | 47 | 36 | ||||||||
| Additions based on current year’s tax position | 7 | 12 | 16 | ||||||||
| Additions for prior years’ tax positions | — | 10 | — | ||||||||
| Settlements with tax authorities | (20) | (9) | (5) | ||||||||
| Balance as of December 31 | 47 | 60 | 47 | ||||||||
millions of Canadian dollars | 2021 | 2020 | 2019 | |||||||||
Balance as of January 1 | 36 | 35 | 36 | |||||||||
Additions based on current year’s tax position | 16 | 2 | - | |||||||||
Additions for prior years’ tax positions | 0 | - | 1 | |||||||||
Settlements with tax authorities | (5 | ) | (1 | ) | (2 | ) | ||||||
Balance as of December 31 | 47 | 36 | 35 |
The unrecognized tax benefit balances shown above are predominatelypredominantly related to tax positions that would reduce the company’s effective tax rate if the positions are favourably resolved. Unfavourable resolution of these tax positions generally would not increase the effective tax rate. The 2021, 20202023, 2022 and 20192021 changes in unrecognized tax benefits did not have a material effect on the company’s net income or cash flow. The company’s tax filings from 20172018 to 20212023 are subject to examination by the tax authorities. Tax filings from 20072009 to 20162017 have open objections and therefore are also subject to examination by the tax authorities. The Canada Revenue Agency has made certain adjustments to the company’s filings. Management has evaluated these adjustments and is formally disputing those matters to which the company disagrees. Many of these outstanding matters will not be resolved until after 2022.2024. The impact on unrecognized tax benefits and the company’s effective income tax rate from these matters is not expected to be material.
Resolution of the related tax positions could take many years to complete. It is difficult to predict the timing of resolution for tax positions since such timing is not entirely within the control of the company.
The company classifies interest on income tax related balances as interest expense or interest income and classifies tax related penalties as operating expense.
Unrecognized tax benefits are not classified as future commitments because the company does not expect there will be any cash impact from the final settlements as sufficient funds have been deposited with the Canada Revenue Agency.
4. Employee retirement benefits
Retirement benefits, which cover almost all retired employees and their surviving spouses, include pension income and certain health care and life insurance benefits. They are met through funded registered retirement plans and through unfunded supplementary benefits that are paid directly to recipients.
Pension income benefits consist mainly of company-paid defined benefit plans that are based on years of service and final average earnings. The company shares in the cost of health care and life insurance benefits. The company’s benefit obligations are based on the projected benefit method of valuation that includes employee service to date and present compensation levels, as well as a projection of salaries to retirement.
The expense and obligations for both funded and unfunded benefits are determined in accordance with accepted actuarial practices and U.S. GAAP. The process for determining retirement-income expense and related obligations includes making certain long-term assumptions regarding the discount rate, rate of return on plan assets and rate of compensation increases. The obligation and pension expense can vary significantly with changes in the assumptions used to estimate the obligation and the expected return on plan assets.
89
The benefit obligations and plan assets associated with the company’s defined benefit plans are measured on December 31.
| Pension benefits | Other postretirement benefits | ||||||||||||||||
| 2023 | 2022 | 2023 | 2022 | ||||||||||||||
Assumptions used to determine benefit obligations at December 31 (percent) | |||||||||||||||||
| Discount rate | 4.60 | 5.10 | 4.60 | 5.10 | |||||||||||||
| Long-term rate of compensation increase | 4.00 | 4.00 | 4.00 | 4.00 | |||||||||||||
| millions of Canadian dollars | |||||||||||||||||
| Change in benefit obligation | |||||||||||||||||
| Benefit obligation at January 1 | 7,374 | 9,850 | 589 | 818 | |||||||||||||
| Service cost | 162 | 280 | 12 | 23 | |||||||||||||
| Interest cost | 373 | 295 | 28 | 24 | |||||||||||||
Actuarial loss (gain) (a) | 514 | (2,528) | (14) | (248) | |||||||||||||
| Amendments | 184 | — | — | — | |||||||||||||
Benefits paid (b) | (453) | (523) | (34) | (28) | |||||||||||||
| Benefit obligation at December 31 | 8,154 | 7,374 | 581 | 589 | |||||||||||||
| Accumulated benefit obligation at December 31 | 7,449 | 6,820 | |||||||||||||||
(a)Actuarial loss (gain) primarily driven by changes in the year-end discount rate and salary experience. (b)Benefit payments for funded and unfunded plans. | |||||||||||||||||
| Pension benefits | Other postretirement benefits | |||||||||||||||||||
2021 | 2020 | 2021 | 2020 | |||||||||||||||||
| Assumptions used to determine benefit obligations at December 31 (percent) | ||||||||||||||||||||
Discount rate | 3.00 | 2.50 | 3.00 | 2.50 | ||||||||||||||||
Long-term rate of compensation increase | 4.00 | 4.00 | 4.00 | 4.00 | ||||||||||||||||
millions of Canadian dollars | ||||||||||||||||||||
Change in benefit obligation | ||||||||||||||||||||
Benefit obligation at January 1 | 10,716 | 9,786 | 873 | 693 | ||||||||||||||||
Service cost | 324 | 305 | 28 | 24 | ||||||||||||||||
Interest cost | 271 | 308 | 22 | 24 | ||||||||||||||||
Actuarial loss (gain) (a) | (925 | ) | 811 | (83 | ) | 152 | ||||||||||||||
Benefits paid (b) | (536 | ) | (494 | ) | (22 | ) | (20 | ) | ||||||||||||
Benefit obligation at December 31 | 9,850 | 10,716 | 818 | 873 | ||||||||||||||||
Accumulated benefit obligation at December 31 | 8,885 | 9,619 | ||||||||||||||||||
The discount rate for the purpose of calculating20222024 and gradually decline to 3.57 percent by 20402043 and beyond.
year-end
postretirement benefits plan obligation is determined by using the Canadian Institute of Actuaries recommended spot yield curve for high-quality, long-term Canadian corporate bonds with an average maturity (or duration) approximating that of the liabilities. For the measurement of the accumulated postretirement benefit obligation, the assumed health care cost trend rates start with 5.80 percent in | Pension benefits | Other postretirement benefits | ||||||||||||||||
| millions of Canadian dollars | 2023 | 2022 | 2023 | 2022 | |||||||||||||
| Change in plan assets | |||||||||||||||||
| Fair value at January 1 | 7,541 | 9,440 | |||||||||||||||
| Actual return (loss) gain | 785 | (1,594) | |||||||||||||||
| Company contributions | 148 | 174 | |||||||||||||||
Benefits paid (a) | (420) | (479) | |||||||||||||||
| Fair value at December 31 | 8,054 | 7,541 | |||||||||||||||
| Plan assets in excess of (less than) projected benefit obligation at December 31 | |||||||||||||||||
| Funded plans | 335 | 543 | |||||||||||||||
| Unfunded plans | (435) | (376) | (581) | (589) | |||||||||||||
Total (b) | (100) | 167 | (581) | (589) | |||||||||||||
(a)Benefit payments for funded plans only. (b)Fair value of assets less projected benefit obligation shown above. | |||||||||||||||||
| Pension benefits | Other postretirement benefits | |||||||||||||||||||
millions of Canadian dollars | 2021 | 2020 | 2021 | 2020 | ||||||||||||||||
Change in plan assets | ||||||||||||||||||||
Fair value at January 1 | 9,426 | 8,599 | ||||||||||||||||||
Actual return on plan assets | 319 | 1,073 | ||||||||||||||||||
Company contributions | 164 | 195 | ||||||||||||||||||
Benefits paid (a) | (469 | ) | (441 | ) | ||||||||||||||||
Fair value at December 31 | 9,440 | 9,426 | ||||||||||||||||||
Plan assets in excess of (less than) projected benefit obligation at December 31 | ||||||||||||||||||||
Funded plans | 89 | (641 | ) | |||||||||||||||||
Unfunded plans | (499 | ) | (649 | ) | (818 | ) | (873 | ) | ||||||||||||
Total (b) | (410 | ) | (1,290 | ) | (818 | ) | (873 | ) | ||||||||||||
Funding of registered retirement plans complies with federal and provincial pension regulations, and the company makes contributions to the plans based on an independent actuarial valuation. In accordance with authoritative guidance relating to the accounting for defined pension and other postretirement benefits plans, the overfunded or underfunded status of the company’s defined benefit postretirement plans was recorded as an asset or liability in the Consolidated balance sheet, and the changes in that funded status in the year in which the changes occurred was recognized through other comprehensive income.
90
| Pension benefits | Other postretirement benefits | ||||||||||||||||
| millions of Canadian dollars | 2023 | 2022 | 2023 | 2022 | |||||||||||||
Amounts recorded in the Consolidated balance sheet consist of: | |||||||||||||||||
| Other assets, including intangibles - net | 335 | 543 | — | — | |||||||||||||
| Current liabilities | (34) | (35) | (28) | (28) | |||||||||||||
| Other long-term obligations | (401) | (341) | (553) | (561) | |||||||||||||
| Total recorded | (100) | 167 | (581) | (589) | |||||||||||||
| Amounts recorded in accumulated other comprehensive income consist of: | |||||||||||||||||
| Net actuarial loss (gain) | 724 | 666 | (89) | (84) | |||||||||||||
| Prior service cost | 400 | 235 | — | — | |||||||||||||
| Total recorded in accumulated other comprehensive income, before-tax | 1,124 | 901 | (89) | (84) | |||||||||||||
| Pension benefits | Other postretirement benefits | |||||||||||||||||||
millions of Canadian dollars | 2021 | 2020 | 2021 | 2020 | ||||||||||||||||
Amounts recorded in the Consolidated balance sheet consist of: | ||||||||||||||||||||
| Other assets, including intangibles - net | 190 | - | - | - | ||||||||||||||||
Current liabilities | (26 | ) | (27 | ) | (30 | ) | (31 | ) | ||||||||||||
Other long-term obligations | (574 | ) | (1,263 | ) | (788 | ) | (842 | ) | ||||||||||||
Total recorded | (410 | ) | (1,290 | ) | (818 | ) | (873 | ) | ||||||||||||
Amounts recorded in accumulated other comprehensive income consist of: | ||||||||||||||||||||
Net actuarial loss (gain) | 1,272 | 2,232 | 173 | 272 | ||||||||||||||||
Prior service cost | 252 | 269 | 0 | 0 | ||||||||||||||||
Total recorded in accumulated other comprehensive income, before-tax | 1,524 | 2,501 | 173 | 272 | ||||||||||||||||
The company establishes the long-term expected rate of return on plan assets by developing a forward-looking long-term return assumption for each assetasset class, taking into account factors such as the expected real return for the specific asset class and inflation. A single, long-term rate of return is then calculated as the weighted average of the target asset allocation percentages and the long-term return assumption for each asset class. The 20212023 long-term expected return of 4.54.8 percent used in the calculations of pension expense compares to an actual rate of return of 8.55.7 percent and 7.36.1 percent over the last2021.2023.
10-
and20-year
periods respectively, ending December 31, | Pension benefits | Other postretirement benefits | ||||||||||||||||||||||
| 2023 | 2022 | 2021 | 2023 | 2022 | 2021 | ||||||||||||||||||
Assumptions used to determine net periodic benefit cost for years ended December 31 (percent) | |||||||||||||||||||||||
| Discount rate | 5.10 | 3.00 | 2.50 | 5.10 | 3.00 | 2.50 | |||||||||||||||||
| Long-term rate of return on funded assets | 4.80 | 4.30 | 4.50 | — | — | — | |||||||||||||||||
| Long-term rate of compensation increase | 4.00 | 4.00 | 4.00 | 4.00 | 4.00 | 4.00 | |||||||||||||||||
| millions of Canadian dollars | |||||||||||||||||||||||
| Components of net periodic benefit cost | |||||||||||||||||||||||
| Service cost | 162 | 280 | 324 | 12 | 23 | 28 | |||||||||||||||||
| Interest cost | 373 | 295 | 271 | 28 | 24 | 22 | |||||||||||||||||
| Expected return on plan assets | (373) | (412) | (427) | — | — | — | |||||||||||||||||
| Amortization of prior service cost | 19 | 17 | 17 | — | — | — | |||||||||||||||||
| Amortization of actuarial loss (gain) | 44 | 84 | 143 | (9) | 9 | 16 | |||||||||||||||||
| Net periodic benefit cost | 225 | 264 | 328 | 31 | 56 | 66 | |||||||||||||||||
| Changes in amounts recorded in accumulated other comprehensive income | |||||||||||||||||||||||
| Net actuarial loss (gain) | 102 | (522) | (817) | (14) | (248) | (83) | |||||||||||||||||
| Amortization of net actuarial (loss) gain included in net periodic benefit cost | (44) | (84) | (143) | 9 | (9) | (16) | |||||||||||||||||
| Prior service cost | 184 | — | — | — | — | — | |||||||||||||||||
| Amortization of prior service cost included in net periodic benefit cost | (19) | (17) | (17) | — | — | — | |||||||||||||||||
| Total recorded in other comprehensive income | 223 | (623) | (977) | (5) | (257) | (99) | |||||||||||||||||
| Total recorded in net periodic benefit cost and other comprehensive income, before-tax | 448 | (359) | (649) | 26 | (201) | (33) | |||||||||||||||||
| Pension benefits | Other postretirement benefits | |||||||||||||||||||||||||||
2021 | 2020 | 2019 | 2021 | 2020 | 2019 | |||||||||||||||||||||||
Assumptions used to determine net periodic benefit cost for years ended December 31 (percent) | ||||||||||||||||||||||||||||
Discount rate | 2.50 | 3.10 | 3.90 | 2.50 | 3.10 | 3.90 | ||||||||||||||||||||||
Long-term rate of return on funded assets | 4.50 | 4.50 | 4.50 | 0 | - | - | ||||||||||||||||||||||
Long-term rate of compensation increase | 4.00 | 4.50 | 4.50 | 4.00 | 4.50 | 4.50 | ||||||||||||||||||||||
millions of Canadian dollars | ||||||||||||||||||||||||||||
Components of net periodic benefit cost | ||||||||||||||||||||||||||||
Service cost | 324 | 305 | 228 | 28 | 24 | 16 | ||||||||||||||||||||||
Interest cost | 271 | 308 | 324 | 22 | 24 | 20 | ||||||||||||||||||||||
Expected return on plan assets | (427 | ) | (391 | ) | (349 | ) | 0 | - | - | |||||||||||||||||||
Amortization of prior service cost | 17 | 14 | - | 0 | - | - | ||||||||||||||||||||||
Amortization of actuarial loss (gain) | 143 | 153 | 149 | 16 | 13 | (1 | ) | |||||||||||||||||||||
Net periodic benefit cost | 328 | 389 | 352 | 66 | 61 | 35 | ||||||||||||||||||||||
Changes in amounts recorded in accumulated other comprehensive income | ||||||||||||||||||||||||||||
Net actuarial loss (gain) | (817 | ) | 129 | 288 | (83 | ) | 152 | 99 | ||||||||||||||||||||
Amortization of net actuarial (loss) gain included in net periodic benefit cost | (143 | ) | (153 | ) | (149 | ) | (16 | ) | (13 | ) | 1 | |||||||||||||||||
Prior service cost | 0 | - | 283 | 0 | - | - | ||||||||||||||||||||||
Amortization of prior service cost included in net periodic benefit cost | (17 | ) | (14 | ) | - | 0 | - | - | ||||||||||||||||||||
Total recorded in other comprehensive income | (977 | ) | (38 | ) | 422 | (99 | ) | 139 | 100 | |||||||||||||||||||
Total recorded in net periodic benefit cost and other comprehensive income, before-tax | (649 | ) | 351 | 774 | (33 | ) | 200 | 135 | ||||||||||||||||||||
Costs for defined contribution plans, primarily the employee savings plan, were $47$44 million in 2023 (2022 - $43 million, 2021
91
A summary of the change in accumulated other comprehensive income is shown in the table below:
| Total pension and other postretirement benefits | |||||||||||
| millions of Canadian dollars | 2023 | 2022 | 2021 | ||||||||
| (Charge) credit to other comprehensive income, before-tax | (218) | 880 | 1,076 | ||||||||
| Deferred income tax (charge) credit (note 17) | 53 | (215) | (264) | ||||||||
| (Charge) credit to other comprehensive income, after-tax | (165) | 665 | 812 | ||||||||
| Total pension and other postretirement benefits | ||||||||||||
millions of Canadian dollars | 2021 | 2020 | 2019 | |||||||||
(Charge) credit to other comprehensive income, before-tax | 1,076 | (101 | ) | (522 | ) | |||||||
Deferred income tax (charge) credit (note 17) | (264 | ) | 23 | 128 | ||||||||
(Charge) credit to other comprehensive income, after-tax | 812 | (78 | ) | (394 | ) | |||||||
The company’s investment strategy for pension plan assets reflects a long-term view, a careful assessment of the risks inherent in various asset classesplan assets and liabilities and broad diversification to reduce the risk of the portfolio. Consistent with the long-term nature of the liability, theThe pension plan assets are primarily invested in passive globalmarket-cap-weightedindexed equity and domestic indexed bondfixed income index funds to diversify risk while minimizing costs. The balance of the plan assets isfixed income funds are largely invested in high-qualityinvestment grade corporate and government debt securities with interest rate sensitivity designed to approximate the interest rate sensitivity of planliabilities. liabilities. The preferred target asset allocation for the pension plan assets is reviewed periodically and set based on considerations such as risk, diversification liquidity and credit quality of investment.liquidity. The target asset allocation for equity securities is 30 percent with the remainder in fixed-income securities.
The fair value measurement levels are accounting terms that refer to different methods of valuing assets. The terms do not represent the relative risk or credit quality of an investment.
The 20212023 fair value of the pension plan assets, including the level within the fair value hierarchy, is shown in the table below:
| Fair value measurements at December 31, 2023, using: | |||||||||||||||||
| millions of Canadian dollars | Total | Level 1 | Level 2 | Level 3 | Net Asset Value | ||||||||||||
| Asset class | |||||||||||||||||
| Equity securities | |||||||||||||||||
| Canadian | — | — | |||||||||||||||
| Non-Canadian | 2,347 | 2,347 | |||||||||||||||
| Debt securities - Canadian | |||||||||||||||||
| Corporate | 1,193 | 1,193 | |||||||||||||||
| Government | 4,251 | 4,251 | |||||||||||||||
| Asset backed | — | — | |||||||||||||||
| Other | 5 | 5 | |||||||||||||||
| Equities – Venture capital | 124 | 124 | |||||||||||||||
| Real Estate | 93 | 93 | |||||||||||||||
| Cash | 41 | 7 | 34 | ||||||||||||||
| Total plan assets at fair value | 8,054 | 7 | 8,047 | ||||||||||||||
92
| Fair value measurements at December 31, 2021, using: | ||||||||||||||||||||
millions of Canadian dollars | Total | Level 1 | Level 2 | Level 3 | Net Asset Value | |||||||||||||||
Asset class | ||||||||||||||||||||
Equity securities | ||||||||||||||||||||
Canadian | 247 | 247 | ||||||||||||||||||
Non-Canadian | 2,539 | 2,539 | ||||||||||||||||||
Debt securities - Canadian | ||||||||||||||||||||
Corporate | 1,496 | 1,496 | ||||||||||||||||||
Government | 4,865 | 4,865 | ||||||||||||||||||
Asset backed | 1 | 1 | ||||||||||||||||||
Equities – Venture capital | 249 | 249 | ||||||||||||||||||
Cash | 43 | 36 | 7 | |||||||||||||||||
Total plan assets at fair value | 9,440 | 36 | 9,404 | |||||||||||||||||
| Fair value measurements at December 31, 2022, using: | |||||||||||||||||
| millions of Canadian dollars | Total | Level 1 | Level 2 | Level 3 | Net Asset Value | ||||||||||||
| Asset class | |||||||||||||||||
| Equity securities | |||||||||||||||||
| Canadian | 96 | 96 | |||||||||||||||
| Non-Canadian | 2,215 | 2,215 | |||||||||||||||
| Debt securities - Canadian | |||||||||||||||||
| Corporate | 1,156 | 1,156 | |||||||||||||||
| Government | 3,842 | 3,842 | |||||||||||||||
| Asset backed | 2 | 2 | |||||||||||||||
| Equities – Venture capital | 199 | 199 | |||||||||||||||
| Cash | 31 | 10 | 21 | ||||||||||||||
| Total plan assets at fair value | 7,541 | 10 | 7,531 | ||||||||||||||
The 2020 fair value of the pension plan assets, including the level within the fair value hierarchy, is shown in the table below: | ||||||||||||||||||||
| Fair value measurements at December 31, 2020, using: | ||||||||||||||||||||
| millions of Canadian dollars | Total | Level 1 | Level 2 | Level 3 | Net Asset Value | |||||||||||||||
Asset class | ||||||||||||||||||||
Equity securities | ||||||||||||||||||||
Canadian | 222 | 222 | ||||||||||||||||||
Non-Canadian | 2,690 | 2,690 | ||||||||||||||||||
Debt securities - Canadian | ||||||||||||||||||||
Corporate | 1,426 | 1,426 | ||||||||||||||||||
Government | 4,825 | 4,825 | ||||||||||||||||||
Asset backed | - | - | ||||||||||||||||||
Equities – Venture capital | 214 | 214 | ||||||||||||||||||
Cash | 49 | 41 | 8 | |||||||||||||||||
Total plan assets at fair value | 9,426 | 41 | 9,385 | |||||||||||||||||
A summary of pension plans with accumulated benefit obligation and projected benefit obligation in excess of plan assets is shown in the table below:
| Pension benefits | ||||||||
| millions of Canadian dollars | 2023 | 2022 | ||||||
For funded pension plans with projected benefit obligation in excess of plan assets: (a) | ||||||||
| Projected benefit obligation | — | — | ||||||
| Fair value of plan assets | — | — | ||||||
| Projected benefit obligation less fair value of plan assets | — | — | ||||||
| For unfunded pension plans covered by book reserves: | ||||||||
| Projected benefit obligation | 435 | 376 | ||||||
| Accumulated benefit obligation | 395 | 353 | ||||||
(a)In 2023 and 2022, the fair value of plan assets exceeded the projected benefit obligation for both the company sponsored plan and its proportionate share of a joint venture sponsored plan. | ||||||||
| Pension benefits | ||||||||
millions of Canadian dollars | 2021 | 2020 | ||||||
For funded pension plans with accumulated benefit obligation in excess of plan assets: (a) | ||||||||
Accumulated benefit obligation | 0 | 1,034 | ||||||
Fair value of plan assets | 0 | 954 | ||||||
Accumulated benefit obligation less fair value of plan assets | 0 | 80 | ||||||
For funded pension plans with projected benefit obligation in excess of plan assets: (b) | ||||||||
| Projected benefit obligation | 1,132 | 10,067 | ||||||
Fair value of plan assets | 1,031 | 9,426 | ||||||
Projected benefit obligation less fair value of plan assets | 101 | 641 | ||||||
For unfunded plans covered by book reserves: | ||||||||
Projected benefit obligation | 499 | 649 | ||||||
Accumulated benefit obligation | 461 | 565 | ||||||
Cash flows
Benefit payments expected in:
millions of Canadian dollars | Pension benefits | Other postretirement benefits | millions of Canadian dollars | Pension benefits | Other postretirement benefits | |||||||||||
2022 | 460 | 30 | ||||||||||||||
2023 | 460 | 31 | ||||||||||||||
2024 | 460 | 31 | ||||||||||||||
2025 | 460 | 32 | ||||||||||||||
2026 | 460 | 33 | ||||||||||||||
2027 - 2031 | 2,295 | 173 | ||||||||||||||
| 2027 | ||||||||||||||||
| 2028 | ||||||||||||||||
| 2029 - 2033 | ||||||||||||||||
In 2022,2024, the company expects to make cash contributions of about $204$150 million to its pension plans.
5. Other long-term obligations
| millions of Canadian dollars | 2021 | 2020 | ||||||
Employee retirement benefits (a) (note 4) | 1,362 | 2,105 | ||||||
Asset retirement obligations and other environmental liabilities (b) (c) | 1,713 | 1,676 | ||||||
Share-based incentive compensation liabilities (note 7) | 79 | 45 | ||||||
Operating lease liability (note 13) | 147 | 95 | ||||||
Other obligations | 596 | 179 | ||||||
| Total other long-term obligations | 3,897 | 4,100 | ||||||
| millions of Canadian dollars | 2021 | 2020 | 2019 | |||||||||
Balance as at January 1 | 1,674 | 1,400 | 1,417 | |||||||||
Additions (deductions) | 6 | 265 | (23 | ) | ||||||||
Accretion | 99 | 82 | 80 | |||||||||
Settlement | (58 | ) | (73 | ) | (74 | ) | ||||||
Balance as at December 31 | 1,721 | 1,674 | 1,400 | |||||||||
| millions of Canadian dollars | 2023 | 2022 | ||||||
Employee retirement benefits (a) (note 4) | 954 | 902 | ||||||
Asset retirement obligations and other environmental liabilities (b) (c) | 2,564 | 2,150 | ||||||
Share-based incentive compensation liabilities (note 7) | 90 | 101 | ||||||
Operating lease liability (note 13) | 111 | 151 | ||||||
| Other obligations | 132 | 163 | ||||||
| Total other long-term obligations | 3,851 | 3,467 | ||||||
(a)Total recorded employee retirement benefits obligations also included $62 million in current liabilities (2022 – $63 million). (b)Total asset retirement obligations and other environmental liabilities also included $235 million in current liabilities (2022 – $116 million). (c)For 2023, the asset retirement obligations were discounted at 6 percent (2022 - 6 percent). Asset retirement obligations incurred in the current period were level 3 fair value measurements. | ||||||||
The following table summarizes the activity in the liability for asset retirement obligations:
| millions of Canadian dollars | 2023 | 2022 | 2021 | |||||||||||
| Balance as at January 1 | 2,178 | 1,721 | 1,674 | |||||||||||
| Additions (deductions) | 471 | 415 | 6 | |||||||||||
| Accretion | 132 | 101 | 99 | |||||||||||
| Settlement | (78) | (59) | (58) | |||||||||||
| Balance as at December 31 | 2,703 | 2,178 | 1,721 | |||||||||||
Estimated cash payments for asset retirement obligations are $77$169 million in 20222024 and $64$162 million in 2023.
2025.6. Financial and derivative instruments
Financial instruments
The fair value of the company’s financial instruments is determined by reference to various market data and other appropriate valuation techniques. There are no material differences between the fair value of the company’s financial instruments and the recorded carrying value. At December 31, 20212023 and December 31, 2020,2022, the fair value of long-term debt ($4,4473,447 million, excluding finance lease obligations) was primarily a level 2 measurement.
Derivative instruments
The company’s size, strong capital structure and the complementary nature of the Upstream, Downstream and Chemical businessesits business segments reduce the company’s enterprise-wide risk from changes in commodity prices, currency rates and currency exchangeinterest rates. In addition, the company uses commodity-based contracts, including derivative instrumentsderivatives, to manage commodity price risk and for trading purposes.to generate returns from trading. Commodity contracts held for trading purposes are presented in the Consolidated statement of income on a net basis in the line “Revenues”"Revenues" and in the Consolidated statement of cash flows in "Cash flows from (used in) operating activities". The company doescompany’s commodity derivatives are not designate derivative instruments as aaccounted for under hedge for hedge accounting purposes.accounting.
Credit risk associated with the company’s derivative position is mitigated by several factors, including the use of derivative clearing exchanges and the quality of and financial limits placed on derivative counterparties. The company maintains a system of controls that includes the authorization, reporting and monitoring of derivative activity.
At December 31, the net notional long / (short) position of derivative instruments was:
thousands of barrels | 2021 | 2020 | ||||||||||||||
Crude | 7,390 | (800) | Crude | (4,450) | 1,800 | |||||||||||
Products | (560) | (390) | ||||||||||||||
Realized and unrealized gain or (loss) on derivative instruments recognized in the Consolidated statement of income is included in the following lines on a
before-tax
basis:millions of Canadian dollars | 2021 | 2020 | 2019 | |||
Revenues | (46) | (13) | (3) | |||
Purchases of crude oil and products | (33) | (21) | (7) | |||
Total | (79) | (34) | (10) |
| millions of Canadian dollars | 2023 | 2022 | 2021 | ||||||||
| Revenues | (5) | 148 | (46) | ||||||||
| Purchases of crude oil and products | — | — | (33) | ||||||||
| Total | (5) | 148 | (79) | ||||||||
The estimated fair value of derivative instruments, and the related hierarchy level for the fair value measurement iswere as follows:
At December 31, 2023 millions of Canadian dollars | |||||||||||||||||||||||
| Fair value | Effect of counterparty netting | Effect of collateral netting | Net carrying value | ||||||||||||||||||||
| Level 1 | Level 2 | Level 3 | Total | ||||||||||||||||||||
| Assets | |||||||||||||||||||||||
Derivative assets (a) | 28 | 18 | — | 46 | (16) | (12) | 18 | ||||||||||||||||
| Liabilities | |||||||||||||||||||||||
Derivative liabilities (b) | 16 | 31 | — | 47 | (16) | — | 31 | ||||||||||||||||
(a)Included in the Consolidated balance sheet line: “Materials, supplies and prepaid expenses”, “Accounts receivable - net” and “Other assets, including intangibles - net”. (b)Included in the Consolidated balance sheet line: “Accounts payable and accrued liabilities” and “Other long-term obligations”. | |||||||||||||||||||||||
95
At December 31, 2021 millions of Canadian dollars | ||||||||||||||||||||||||||||
| Fair value | Effect of counterparty netting | Effect of collateral netting | Net carrying value | |||||||||||||||||||||||||
| Level 1 | Level 2 | Level 3 | Total | |||||||||||||||||||||||||
Assets | ||||||||||||||||||||||||||||
Derivative assets (a) | 24 | 17 | 0 | 41 | (31 | ) | 0 | 10 | ||||||||||||||||||||
Liabilities | ||||||||||||||||||||||||||||
Derivative liabilities (b) | 31 | 12 | 0 | 43 | (31 | ) | (7 | ) | 5 | |||||||||||||||||||
At December 31, 2022 millions of Canadian dollars | |||||||||||||||||||||||
| Fair value | Effect of counterparty netting | Effect of collateral netting | Net carrying value | ||||||||||||||||||||
| Level 1 | Level 2 | Level 3 | Total | ||||||||||||||||||||
| Assets | |||||||||||||||||||||||
Derivative assets (a) | 17 | 32 | — | 49 | (27) | — | 22 | ||||||||||||||||
| Liabilities | |||||||||||||||||||||||
Derivative liabilities (b) | 21 | 20 | — | 41 | (27) | (4) | 10 | ||||||||||||||||
(a)Included in the Consolidated balance sheet line: “Materials, supplies and prepaid expenses”, “Accounts receivable - net” and “Other assets, including intangibles - net”. (b)Included in the Consolidated balance sheet line: “Accounts payable and accrued liabilities” and “Other long-term obligations”. | |||||||||||||||||||||||
| At December 31, 2020 | ||||||||||||||||||||||||||||
| millions of Canadian dollars | ||||||||||||||||||||||||||||
| Fair value | Effect of counterparty netting | Effect of collateral netting | Net carrying value | |||||||||||||||||||||||||
| Level 1 | Level 2 | Level 3 | Total | |||||||||||||||||||||||||
Assets | ||||||||||||||||||||||||||||
Derivative assets (a) | 2 | - | - | 2 | (2 | ) | - | - | ||||||||||||||||||||
Liabilities | ||||||||||||||||||||||||||||
Derivative liabilities (b) | 12 | - | - | 12 | (2 | ) | (10 | ) | - | |||||||||||||||||||
At December 31, 20212023, and December 31, 2020,2022, the company had $6$24 million and $5$14 million, respectively, of collateral under a master netting arrangement not offset against the derivatives on the Consolidated balance sheet in “Accounts"Accounts receivable - net”net", primarily related to initial margin requirements.
7. Share-based incentive compensation programs
Share-based incentive compensation programs are designed to retain selected employees, reward them for high performance and promote individual contribution to sustained improvement in the company’s future business performance and shareholder value over the long-term. The nonemployee directors also participate in share-based incentive compensation programs.
Restricted stock units and deferred share units
Under the restricted stock unit plan, each unit entitles the recipient to the conditional right to receive from the company, upon vesting, an amount equal to the value of one common share of the company, based on the five-day average of the closing price of the company’s common shares on the Toronto Stock Exchange on and immediately prior to the vesting dates. For the majority of the units, fifty50 percent of the units vest on the third anniversary of the grant date, and the remainder vest on the seventh anniversary of the grant date. Some management, professional, and technical participants will receive awards granted that vest 100 percent after three years. The company may also issue units to the chairman, president and chief executive officer where 50 percent of the units vest on the fifth anniversary of the grant date and the remainder vest on the tenth anniversary of the grant date, except that for awards granted prior to 2021,2020, the vesting of the tenth anniversary portion is delayed until retirement if later than 10 years.
The deferred share unit plan is made available to nonemployee directors. The nonemployee directors can elect to receive all or part of their eligible directors’ fees in units. The number of units granted is determined at the end of each calendar quarter by dividing the dollar amount of the nonemployee director’s fees for that calendar quarter elected to be received as deferred share units by the average closing price of the company’s shares for the five consecutive trading days (“("average closing price”price") immediately prior to the last day of the calendar quarter. Additional units are granted to represent dividends on unexercised units, and are calculated by dividing the cash dividend payable on the company’s shares by the average closing price immediately prior to the payment date for that dividend and multiplying the resulting number by the number of deferred share units held by the recipient, as adjusted for any share splits. Deferred share units cannot be exercised until after termination of service as a director, including termination due to death, and must be exercised in their entirety in one election no later than December 31 of the year following the year of termination of service. On the exercise date, the cash value to be received for the units is determined based on the company’s average closing price immediately prior to the date of exercise, as adjusted for any share splits.
All units require settlement by cash payments with the following exceptions. The restricted stock unit program provides that, for units granted to Canadian residents, the recipient may receive one common share of the company per unit or elect to receive the cash payment for the units that vest on the seventh year anniversary of the grant date. For units where 50 percent vest on the fifth anniversary of the grant date and the remainder vest on the tenth anniversary of grant, the recipient may receive one common share of the company per unit or elect to receive cash payment for all that vest.
The company accounts for all units by using the fair-value-based method. The fair value of awards in the form of restricted stock and deferred share units is the market price of the company’s stock. Under this method, compensation expense related to the units of these programs is measured each reporting period based on the company’s current stock price and is recorded in the Consolidated statement of income over the requisite service period of each award.
The following table summarizes information about these units for the year ended December 31, 2021:
| Restricted stock units | Deferred share units | |||||||
Outstanding at January 1, 2021 | 4,463,320 | 147,405 | ||||||
Granted | 681,520 | 19,260 | ||||||
Vested / Exercised | (1,021,865 | ) | 0 | |||||
Forfeited and cancelled | (172,360 | ) | 0 | |||||
Outstanding at December 31, 2021 | 3,950,615 | 166,665 | ||||||
2023:
| Restricted stock units | Deferred share units | |||||||
| Outstanding at January 1, 2023 | 4,036,355 | 179,884 | ||||||
| Granted | 949,520 | 12,219 | ||||||
| Vested / Exercised | (651,175) | (154,781) | ||||||
| Forfeited and cancelled | (421,390) | — | ||||||
| Outstanding at December 31, 2023 | 3,913,310 | 37,322 | ||||||
97
In 2021,2023, the before-tax compensation expense charged against income for these programs the restricted stock units and deferred share units was $96$52 million (2020(2022 - $2$103 million, benefit, 20192021 - $34 million expense)$89 million). Income tax expense associated withbenefit recognized in income related to this compensation programsexpense for the year was $23$13 million (2020(2022 - $0$25 million, 20192021 - $9 million benefit)$22 million). Cash payments of $52$68 million were made for these programsrelated to this compensation expense in 2023 (2022 - $65 million, 2021 (2020 - $33 million, 2019 - $50$48 million).
As of December 31, 2021,2023, there was $80$169 million of total before-tax unrecognized compensation expense related to non-vested restricted stock units based on the company’s share price at the end of the current reporting period. The weighted averageweighted-average vesting period of non-vested restricted stock units is 4.04.1 years. All units under the deferred share programs have vested as of December 31, 2021.
2023.8. Investment and other income
Investment and other income includes gains and losses on asset sales as follows:
| millions of Canadian dollars | 2023 | 2022 | 2021 | ||||||||
| Proceeds from asset sales | 86 | 904 | 81 | ||||||||
| Book value of asset sales | 13 | 746 | 32 | ||||||||
| Gain (loss) on asset sales, before tax (a) | 73 | 158 | 49 | ||||||||
| Gain (loss) on asset sales, after tax (a) | 63 | 241 | 43 | ||||||||
(a)2022 included a gain of $116 million ($208 million, after tax) from the sale of interests in XTO Energy Canada, which included the removal of a deferred tax liability. | |||||||||||
| millions of Canadian dollars | 2021 | 2020 | 2019 | |||||||||
Proceeds from asset sales | 81 | 82 | 82 | |||||||||
Book value of asset sales | 32 | 47 | 36 | |||||||||
Gain (loss) on asset sales, before-tax | 49 | 35 | 46 | |||||||||
Gain (loss) on asset sales, after-tax | 43 | 32 | 42 | |||||||||
9. Litigation and other contingencies
A variety of claims have been made against Imperialthe company and its subsidiaries in a number of lawsuits.
Management has regular litigation reviews, including updates from corporate and outside counsel to assess the need for accounting recognition or disclosure of these contingencies. The company accrues an undiscounted liability for those contingencies where the incurrence of a loss is probable and the amount can be reasonably estimated. If a range of amounts can be reasonably estimated and no amount within the range is a better estimate than any other amount, then the minimum of the range is accrued. The company does not record liabilities when the likelihood that the liability has been incurred is probable but the amount cannot be reasonably estimated or when the liability is believed to be only reasonably possible or remote. For contingencies where an unfavourable outcome is reasonably possible and which are significant, the company discloses the nature of the contingency and, where feasible, an estimate of the possible loss. For purposes of the company’s contingency disclosures, “significant”"significant" includes material matters, as well as other matters which management believes should be disclosed. Based on a consideration of all relevant facts and circumstances, the company does not believe the ultimate outcome of any currently pending lawsuits against the company will have a material adverse effect on the company’s operations, financial condition, or financial statements taken as a whole.
Additionally, the company has other commitments arising in the normal course of business for operating and capital needs, all of which are expected to be fulfilled with no adverse consequences material to the company’s operations or financial condition. Unconditional purchase obligations, as defined by accounting standards, are those long-term commitments that are non-cancelablenon-cancellable or cancelablecancellable only under certain conditions and that third parties have used to secure financing for the facilities that will provide the contracted goods and services. The company has 0tnot entered into any unconditional purchase obligations.
As a result of the completed sale of Imperial’sthe remaining company-owned Esso retail sites, the company was contingently liable at December 31, 2021,2023, for guarantees relating to performance under contracts of other third-party obligations totalling $21$13 million (2020(2022 - $26$17 million).
10. Common shares
| At December 31 | ||||||||
| thousands of shares | 2023 | 2022 | ||||||
| Authorized | 1,100,000 | 1,100,000 | ||||||
| Outstanding | 535,837 | 584,153 | ||||||
At December 31 thousands of shares | ||||||||
2021 | 2020 | |||||||
Authorized | 1,100,000 | 1,100,000 | ||||||
Common shares outstanding | 678,080 | 734,077 | ||||||
The most recent 12-month normal course issuer bid program came into effect June 29, 2021,2023, under which Imperial continued its existing share purchase program. The program enabled the company to purchase up to a maximum of 35,583,67129,207,635 common shares (5 percent of the total shares on June 15, 2021)2023) which included shares purchased under the normal course issuer bid and from Exxon Mobil Corporation concurrent with, but outside of the normal course issuer bid. As in the past, Exxon Mobil Corporation advised the company that it intended to participate to maintain its ownership percentage at approximately 69.6 percent. Subsequent to December 31, 2021, theThe program completed on January 31, 2022October 19, 2023 as a result of the company purchasing the maximum allowable number of shares under the program.
On November 3, 2023, the company commenced a substantial issuer bid pursuant to which it offered to purchase for cancellation up to $1.5 billion of its common shares through a modified Dutch auction and proportionate tender offer. The substantial issuer bid was completed on December 13, 2023, with the company taking up and paying for19,108,280 common shares at a price of $78.50 per share, for an aggregate purchase of $1.5 billion and 3.4 percent of Imperial’s issued and outstanding shares at the close of business on October 30, 2023. This included13,299,349 shares purchased from Exxon Mobil Corporation by way of a proportionate tender to maintain its ownership percentage at approximately 69.6 percent.
The excess of the purchase cost over the stated value of shares purchased has been recorded as a distribution of earnings reinvested.
The company’s common share activities are summarized below:
| Thousands of shares | Millions of dollars | |||||||
| Balance as at January 1, 2021 | 734,077 | 1,357 | ||||||
| Issued under employee share-based awards | 7 | — | ||||||
| Purchases at stated value | (56,004) | (105) | ||||||
| Balance as at December 31, 2021 | 678,080 | 1,252 | ||||||
| Issued under employee share-based awards | — | — | ||||||
| Purchases at stated value | (93,927) | (173) | ||||||
| Balance as at December 31, 2022 | 584,153 | 1,079 | ||||||
| Issued under employee share-based awards | — | — | ||||||
| Purchases at stated value | (48,316) | (87) | ||||||
| Balance as at December 31, 2023 | 535,837 | 992 | ||||||
99
| Thousands of shares | Millions of dollars | |||||||
Balance as at January 1, 2019 | 782,565 | 1,446 | ||||||
Issued under employee share-based awards | 1 | 0 | ||||||
Purchases at stated value | (38,664 | ) | (71 | ) | ||||
Balance as at December 31, 2019 | 743,902 | 1,375 | ||||||
Issued under employee share-based awards | 7 | - | ||||||
Purchases at stated value | (9,832 | ) | (18 | ) | ||||
Balance as at December 31, 2020 | 734,077 | 1,357 | ||||||
Issued under employee share-based awards | 7 | 0 | ||||||
Purchases at stated value | (56,004 | ) | (105 | ) | ||||
Balance as at December 31, 2021 | 678,080 | 1,252 | ||||||
The following table provides the calculation of basic and diluted earnings per common share and the dividends declared by the company on its outstanding common shares:
| 2023 | 2022 | 2021 | |||||||||
| Net income (loss) per common share – basic | |||||||||||
Net income (loss) (millions of Canadian dollars) | 4,889 | 7,340 | 2,479 | ||||||||
Weighted-average number of common shares outstanding (millions of shares) | 574.8 | 640.2 | 711.6 | ||||||||
Net income (loss) per common share (dollars) | 8.51 | 11.47 | 3.48 | ||||||||
| Net income (loss) per common share – diluted | |||||||||||
Net income (loss) (millions of Canadian dollars) | 4,889 | 7,340 | 2,479 | ||||||||
Weighted-average number of common shares outstanding (millions of shares) | 574.8 | 640.2 | 711.6 | ||||||||
Effect of employee share-based awards (millions of shares) | 1.1 | 1.3 | 1.6 | ||||||||
Weighted-average number of common shares outstanding, assuming dilution (millions of shares) | 575.9 | 641.5 | 713.2 | ||||||||
Net income (loss) per common share (dollars) | 8.49 | 11.44 | 3.48 | ||||||||
Dividends per common share – declared (dollars) | 1.94 | 1.46 | 1.03 | ||||||||
2021 | 2020 | 2019 | ||||||||||
Net income (loss) per common share – basic | ||||||||||||
Net income (loss) (millions of Canadian dollars) | 2,479 | (1,857 | ) | 2,200 | ||||||||
Weighted average number of common shares outstanding (millions of shares) | 711.6 | 735.3 | 762.7 | |||||||||
Net income (loss) per common share (dollars) | 3.48 | (2.53 | ) | 2.88 | ||||||||
Net income (loss) per common share – diluted | ||||||||||||
Net income (loss) (millions of Canadian dollars) | 2,479 | (1,857 | ) | 2,200 | ||||||||
Weighted average number of common shares outstanding (millions of shares) | 711.6 | 735.3 | 762.7 | |||||||||
Effect of employee share-based awards (millions of shares) (a) | 1.6 | - | 2.3 | |||||||||
Weighted average number of common shares outstanding, assuming dilution (millions of shares) | 713.2 | 735.3 | 765.0 | |||||||||
Net income (loss) per common share (dollars) | 3.48 | (2.53 | ) | 2.88 | ||||||||
Dividends per common share – declared (dollars) | 1.03 | 0.88 | 0.85 | |||||||||
11. Miscellaneous financial information
LIFO inventory
In 2021,2023, net income included an after-tax lossgain of $13$5 million (2020(2022 – $19$62 million loss, 2019gain, 2021 – $22$13 million loss) attributable to the effect of changes in last-in, first-out (LIFO) inventories. The replacement cost of inventories was estimated to exceed their LIFO carrying values at December 31, 20212023 by about $1.8$2.2 billion (2020(2022 – $0.8$2.0 billion). Inventories of crude oil and products at year-end consisted of the following:
| millions of Canadian dollars | 2023 | 2022 | ||||||
| Crude oil | 979 | 809 | ||||||
| Petroleum products | 579 | 471 | ||||||
| Chemical products | 66 | 76 | ||||||
| Other | 320 | 158 | ||||||
| Total | 1,944 | 1,514 | ||||||
| millions of Canadian dollars | 2021 | 2020 | ||||||
Crude oil | 674 | 630 | ||||||
Petroleum products | 310 | 403 | ||||||
Chemical products | 73 | 55 | ||||||
Other | 45 | 73 | ||||||
Total | 1,102 | 1,161 | ||||||
In 2021, the company recorded an unfavourable $74 million ($82
million, before tax) inventory adjustment (including the proportionate share of LIFO changes) related to reconciliations of additives and products inventory at equity and third-party terminals.terminals. The out-of-period impact of $57 million ($63 million, before tax) occurred over a number of years, and has been resolved.
The company has determined that the adjustment iswas not material to the consolidated financial statements for the year ended December 31, 2021, or any of the prior periods related to the adjustment. Accordingly, comparative periods presented in the consolidated financial statements have not been restated.
Research and development
Research expenditures are mainly spent on developing technologies to improve bitumen recovery, reduce costs and reduce the environmental impact of upstream operations, including technologies to reduce greenhouse gas emissions intensity, supporting environmental and process improvements in the refineries, as well as accessing ExxonMobil’s research worldwide.
Research expenditures are mainly spent on developing technologies to improve bitumen recovery, reduce costs and reduce the environmental impact of upstream operations, including technologies to reduce greenhouse gas emissions intensity, supporting environmental and process improvements in the refineries, as well as accessing ExxonMobil’s research worldwide.
The company has scientific research agreements with affiliates of ExxonMobil, which provide for technical and engineering work to be performed by all parties, the exchange of technical information and the assignment and licencinglicensing of patents, and patent rights. These agreements provide mutual access to scientific and operating data related to nearly every phase of the petroleum and petrochemical operations of the parties.
Net research and development costs charged to expenses in 2023 were $84 million (2022 – $74 million, 2021 were– $89 million (2020 – $105 million, 2019 – $133 million). These costs are included in expenses due to the uncertainty of future benefits.
Accounts payable and accrued liabilities
“Accounts payable and accrued liabilities” included accrued taxes other than income taxes of$415$455 million at December 31, 2021
“Accounts payable and accrued liabilities” included accrued taxes other than income taxes of
In 2022, the company prospectively adopted the Financial Accounting Standards Board’s standard, Government Assistance (Topic 832).
The standard requires the annual disclosure of certain types of government assistance not otherwise covered by authoritative accounting guidance. The company has received subsidies as partreceives allowances from governments in the form of the Government of Canada’s COVID-19 Economic Response Plan, which included the company’s proportionate share of a joint venture. It was recognizedemission credits as a reduction to expense (2020 – $155 million before tax)result of performing better than facility level expectations for emission targets and was includedrecords these at a nominal amount in the Consolidated statement of income, primarily as part of “Production and manufacturing”.
company’s financial results.
12. Financing and additional notes and loans payable information
| millions of Canadian dollars | 2023 | 2022 | 2021 | ||||||||
Debt-related interest (a) | 203 | 111 | 63 | ||||||||
| Capitalized interest | (141) | (57) | (24) | ||||||||
| Net interest expense | 62 | 54 | 39 | ||||||||
| Other interest | 7 | 6 | 15 | ||||||||
Total financing (b) | 69 | 60 | 54 | ||||||||
(a)Includes related party interest with ExxonMobil. (b)The weighted-average interest rate on short-term borrowings in 2023 was 4.9 percent (2022 – 2.0 percent, 2021 – 0.2 percent) and on long-term borrowings, with ExxonMobil, in 2023 was 4.9 percent (2022 – 1.9 percent, 2021 – 0.6 percent). | |||||||||||
| millions of Canadian dollars | 2021 | 2020 | 2019 | |||||||||
Debt-related interest (a) | 63 | 102 | 138 | |||||||||
Capitalized interest | (24 | ) | (41 | ) | (48 | ) | ||||||
Net interest expense | 39 | 61 | 90 | |||||||||
Other interest | 15 | 3 | 3 | |||||||||
Total financing (b) | 54 | 64 | 93 | |||||||||
During the secondfourth quarter of 2021,2023, the company extended the maturity date of twodates of its short-term lines of credit, totalling $750 million, to May 2023, these facilities are now long-term. The company also extended its $300 million committed short-term line of credit to June 2022. In November 2021, the company extended the maturity date of antwo existing $250 million committed short-term linelines of credit to November 2022. 2024 and November 2025 respectively.
The company has 0tnot drawn on theseany of its outstanding $500 million of available credit facilities.
In 2021, the company repaid the $111 million outstanding balance and terminated the non-interest bearing, revolving demand loan under an arrangement with an affiliate company of ExxonMobil.
13. Leases
The company generally purchases the property, plant and equipment used in operations, but there are situations where assets are leased, primarily storage tanks, rail cars, marine vessels and transportation facilities. Right of use assets and lease liabilities are established on the balance sheet for leases with an expected term greater than one year, by discounting the amounts fixed in the lease agreement for the duration of the lease which is reasonably certain, considering the probability of exercising any early termination and extension options. The portion of the fixed payment related to service costs for tankers and finance leases is excluded from the calculation of right of use assets and lease liabilities. Usually, assets are leased only for a portion of their useful lives and are accounted for as operating leases. In limited situations, assets are leased for nearly all of their useful lives and are accounted for as finance leases. In general, leases are capitalized using the company’s incremental borrowing rate.
Variable payments under these lease agreements are not significant. Residual value guarantees, restrictions, or covenants related to leases, and transactions with related parties are also not significant. The company’s activities as a lessor are not material.
The table below summarizes the total lease cost incurred:
| 2023 | 2022 | 2021 | ||||||||||||||||||
| millions of Canadian dollars | Operating leases | Finance leases | Operating leases | Finance leases | Operating leases | Finance leases | ||||||||||||||
| Operating lease cost | 114 | 119 | 123 | |||||||||||||||||
| Short-term and other (net of sublease rental income) | 30 | 40 | 19 | |||||||||||||||||
| Amortization of right of use assets | 19 | 19 | 17 | |||||||||||||||||
| Interest on lease liabilities | 29 | 30 | 33 | |||||||||||||||||
| Total lease cost | 144 | 48 | 159 | 49 | 142 | 50 | ||||||||||||||
2021 | 2020 | 2019 | ||||||||||||||||||||||
| millions of Canadian dollars | Operating leases | Finance leases | Operating leases | Finance leases | Operating leases | Finance leases | ||||||||||||||||||
Operating lease cost | 123 | 157 | 151 | |||||||||||||||||||||
Short-term and other (net of sublease rental income) | 19 | 40 | 76 | |||||||||||||||||||||
Amortization of right of use assets | 17 | 29 | 55 | |||||||||||||||||||||
Interest on lease liabilities | 33 | 38 | 40 | |||||||||||||||||||||
Total lease cost | 142 | 50 | 197 | 67 | 227 | 95 | ||||||||||||||||||
The following table summarizes the amounts related to operating leases and finance leases recorded on the Consolidated balance sheet, weighted averageweighted-average remaining lease term and weighted averageweighted-average discount rates applied at December 31:
2021 | 2020 | 2023 | 2022 | |||||||||||||||||||||||||||
| millions of Canadian dollars | Operating leases | Finance leases (a) | Operating leases | Finance leases | ||||||||||||||||||||||||||
| millions of Canadian dollars | ||||||||||||||||||||||||||||||
| millions of Canadian dollars | Operating leases | Finance leases | Operating leases | Finance leases | ||||||||||||||||||||||||||
Right of use assets | Right of use assets | |||||||||||||||||||||||||||||
Included in Other assets, including intangibles - net | 245 | 188 | ||||||||||||||||||||||||||||
| Included in Property, plant and equipment, less | ||||||||||||||||||||||||||||||
| Included in Property, plant and equipment, less | ||||||||||||||||||||||||||||||
Included in Property, plant and equipment, less | 637 | 532 | ||||||||||||||||||||||||||||
accumulated depreciation and depletion | accumulated depreciation and depletion | |||||||||||||||||||||||||||||
Total right of use assets | 245 | 637 | 188 | 532 | ||||||||||||||||||||||||||
Lease liability due within one year | ||||||||||||||||||||||||||||||
| Lease liability due within one year | ||||||||||||||||||||||||||||||
| Lease liability due within one year | ||||||||||||||||||||||||||||||
Included in Accounts payable and accrued liabilities | 102 | 0 | 97 | - | ||||||||||||||||||||||||||
Included in Notes and loans payable | 22 | 16 | ||||||||||||||||||||||||||||
Long-term lease liability | ||||||||||||||||||||||||||||||
| Long-term lease liability | Long-term lease liability | |||||||||||||||||||||||||||||
Included in Other long-term obligations | 147 | 0 | 95 | - | ||||||||||||||||||||||||||
Included in Long-term debt | 607 | 510 | ||||||||||||||||||||||||||||
Total lease liability | 249 | 629 | 192 | 526 | ||||||||||||||||||||||||||
Weighted average remaining lease term (years) | 4 | 38 | 4 | 38 | ||||||||||||||||||||||||||
Weighted average discount rate (percent) | 1.2 | 4.8 | 2.5 | 7.3 | ||||||||||||||||||||||||||
Weighted-average remaining lease term (years) | ||||||||||||||||||||||||||||||
Weighted-average remaining lease term (years) | ||||||||||||||||||||||||||||||
Weighted-average remaining lease term (years) | 6 | 36 | 5 | 37 | ||||||||||||||||||||||||||
Weighted-average discount rate (percent) | Weighted-average discount rate (percent) | 1.9 | 4.7 | 1.1 | 4.7 | |||||||||||||||||||||||||
103
The maturity analysis of the company’s lease liabilities as at December 31 are summarized below:
| 2023 | ||||||||
| millions of Canadian dollars | Operating leases | Finance leases | ||||||
| Maturity analysis of lease liabilities | ||||||||
| 2024 | 90 | 49 | ||||||
| 2025 | 38 | 46 | ||||||
| 2026 | 16 | 44 | ||||||
| 2027 | 10 | 43 | ||||||
| 2028 | 9 | 42 | ||||||
| 2029 and beyond | 46 | 858 | ||||||
| Total lease payments | 209 | 1,082 | ||||||
| Discount to present value | (11) | (497) | ||||||
| Total lease liability | 198 | 585 | ||||||
2021 | ||||||||
| millions of Canadian dollars | Operating leases | Finance leases | ||||||
Maturity analysis of lease liabilities | ||||||||
2022 | 104 | 52 | ||||||
2023 | 65 | 50 | ||||||
2024 | 44 | 49 | ||||||
2025 | 6 | 46 | ||||||
2026 | 5 | 44 | ||||||
2027 and beyond | 36 | 942 | ||||||
Total lease payments | 260 | 1,183 | ||||||
Discount to present value | (11 | ) | (554 | ) | ||||
Total lease liability | 249 | 629 | ||||||
In addition to the operating lease liabilities in the table immediately above, at December 31, 2021,2023, additional undiscounted commitments for leases not yet commenced totalled $5$54 million (2020(2022 - $27$14 million).
Estimated cash payments for operating and finance leases not yet commenced are $
$1 million in both 20222024 and 2023.$48 million in 2025.
The table below summarizes the cash paid for amounts included in the measurement of lease liabilities and the right of use assets obtained in exchange for new lease liabilities:
| 2023 | 2022 | 2021 | ||||||||||||||||||
| millions of Canadian dollars | Operating leases | Finance leases | Operating leases | Finance leases | Operating leases | Finance leases | ||||||||||||||
| Cash paid for amounts included in the measurement of lease liabilities | ||||||||||||||||||||
| Cash flows from operating activities | 56 | — | 121 | — | 122 | — | ||||||||||||||
| Cash flows from financing activities | 22 | 22 | 20 | |||||||||||||||||
| Non-cash right of use assets recorded for lease liabilities | ||||||||||||||||||||
| In exchange for lease liabilities during the year | 61 | — | 117 | — | 176 | 123 | ||||||||||||||
2021 | 2020 | 2019 | ||||||||||||||||||||||
| millions of Canadian dollars | Operating leases | Finance leases | Operating leases | Finance leases | Operating leases | Finance leases | ||||||||||||||||||
Cash paid for amounts included in the measurement of lease liabilities | ||||||||||||||||||||||||
Cash flows from operating activities | 122 | 0 | 136 | 15 | 147 | 45 | ||||||||||||||||||
Cash flows from financing activities | 20 | 20 | 27 | |||||||||||||||||||||
Non-cash right of use assets recorded for lease liabilities | ||||||||||||||||||||||||
For January 1 adoption of Leases (Topic 842) | 298 | |||||||||||||||||||||||
In exchange for lease liabilities during the year | 176 | 123 | 63 | 14 | 104 | - | ||||||||||||||||||
14. Long-term debt
| At December 31 | ||||||||
| millions of Canadian dollars | 2023 | 2022 | ||||||
Long-term debt (a) (b) | 3,447 | 3,447 | ||||||
Finance leases (c) | 564 | 586 | ||||||
| Total long-term debt | 4,011 | 4,033 | ||||||
(a)Borrowed under an existing agreement with an affiliated company of ExxonMobil that provides for a long-term, variable-rate, Canadian dollar loan from ExxonMobil to the company of up to $7.75 billion at interest equivalent to Canadian market rates. The agreement is effective until June 30, 2025, cancellable if ExxonMobil provides at least 370 days advance written notice. (b)During the third quarter of 2022, the company decreased its long-term debt by $1 billion, partially repaying an existing facility with an affiliated company of ExxonMobil. (c)Finance leases are primarily associated with transportation facilities and services agreements. The average imputed interest rate was 4.7 percent in 2023 (2022 – 4.7 percent). Total finance lease obligations also include $21 million in current liabilities (2022 - $22 million). Principal payments on finance leases of approximately $18 million on average per year are due in each of the next four years after December 31, 2024. | ||||||||
At December 31 | ||||||||||||
millions of Canadian dollars | 2021 | 2020 | ||||||||||
Long-term debt (a) | 4,447 | 4,447 | ||||||||||
Finance leases (b) | 607 | 510 | ||||||||||
Total long-term debt | 5,054 | 4,957 |
15. Accounting for suspended exploratory well costs
The company continues capitalization of exploratory well costs when the well has found a sufficient quantity of reserves to justify its completion as a producing well and the company is making sufficient progress assessing the reserves and the economic and operating viability of the project. The term “project” as used in this report can refer to a variety of different activities and does not necessarily have the same meaning as in any government payment transparency reports. At December 31, 2021 theThe company had 0capitalizedno capitalized suspended exploratory well costs (2020 - $0 million, 2019 - $0 million).as at December 31, 2023, 2022 and 2021.
Exploration activity often involves drilling multiple wells, over a number of years, to fully evaluate a project. At December 31, 2021 theThe company had 0projectsno projects with exploratory wells costs capitalized (2020 - 0, 2019 - 0).
as at December 31, 2023, 2022 and 2021.16. Transactions with related parties
Revenues and expenses of the company also include the results of transactions with affiliated companies of ExxonMobil in the normal course of operations. These were conducted on terms comparable to those which would have been conducted with unrelated parties and primarily consisted of the purchase and sale of crude oil, natural gas, petroleum and chemical products, as well as technical, engineering and research and development costs. Transactions with ExxonMobil also included amounts paid and received in connection with the company’s participation in a number of upstream activities conducted jointly in Canada.
In addition, the company has existing agreements with ExxonMobil:
a)To provide computer and customer support services to the company and to share common business and operational support services that allow the companies to consolidate duplicate work and systems;
b)To operate certain western Canada production properties owned by ExxonMobil, as well as provide for the delivery of management, business and technical services to ExxonMobil in Canada. These agreements are designed to provide organizational efficiencies and to reduce costs. No separate legal entities were created from these arrangements. Separate books of account continue to be maintained for the company and ExxonMobil. The company and ExxonMobil retain ownership of their respective assets, and there is no impact on operations or reserves;
c)To provide for the option of equal participation in new upstream opportunities; and
d)To enter into derivative agreements on each other’s behalf.
The company had an existing agreement with ExxonMobil to provide for the delivery of management, business and technical services to Syncrude Canada Ltd. by ExxonMobil, which was terminated in connection with the transfer of operatorship of Syncrude on September 30, 2021.
Certain charges from ExxonMobil have been capitalized; they are not material in the aggregate.
The amounts of purchases and revenues by Imperial in 2021,2023, with ExxonMobil, were $2,669$4,026 million and $8,777$13,544 million respectively
(2020$2,424$3,719 million and $5,101$17,042 million respectively).
(2020
As at December 31, 2021,2023, the company had an outstanding long-term loansloan of $4,447$3,447 million (2020(2022 – $4,447$3,447 million) and short-term loans of
$0 million (2020 – $111 million)$28 $169 million
(2020$61$78 million).
$0 million (2020 – $111 million)
from ExxonMobil (see note 14, Long-term debt, on page 104"Long-term debt", and note 12, Financing"Financing and additional notes
information, on page 101information" for further details). The amount of financing costs with ExxonMobil were
(2020
Imperial has other related party transactions not detailed above in note 16, as they are not significant.
17. Other comprehensive income (loss) information
Changes in accumulated other comprehensive income (loss):
| millions of Canadian dollars | 2023 | 2022 | 2021 | ||||||||
| Balance at January 1 | (512) | (1,177) | (1,989) | ||||||||
| Postretirement benefits liability adjustment: | |||||||||||
| Current period change excluding amounts reclassified from accumulated other comprehensive income | (206) | 582 | 679 | ||||||||
| Amounts reclassified from accumulated other comprehensive income | 41 | 83 | 133 | ||||||||
| Balance at December 31 | (677) | (512) | (1,177) | ||||||||
| millions of Canadian dollars | 2021 | 2020 | 2019 | |||||||||
Balance at January 1 | (1,989 | ) | (1,911 | ) | (1,517 | ) | ||||||
Postretirement benefits liability adjustment: | ||||||||||||
| Current period change excluding amounts reclassified from accumulated other comprehensive income | 679 | (212 | ) | (505 | ) | |||||||
Amounts reclassified from accumulated other comprehensive income | 133 | 134 | 111 | |||||||||
Balance at December 31 | (1,177 | ) | (1,989 | ) | (1,911 | ) | ||||||
Amounts reclassified out of accumulated other comprehensive income (loss) - before-tax income (expense):
| millions of Canadian dollars | 2021 | 2020 | 2019 | ||||||||||||||||||||
Amortization of postretirement benefits liability adjustment included in net periodic benefit cost (a) | (176 | ) | (180 | ) | (148 | ) | |||||||||||||||||
Amortization of postretirement benefits liability adjustment included in net benefit cost (a) | |||||||||||||||||||||||
| (a) This accumulated other comprehensive income component is included in the computation of net periodic benefit cost (note 4). | (a) This accumulated other comprehensive income component is included in the computation of net periodic benefit cost (note 4). | ||||||||||||||||||||||
Income tax expense (credit) for components of other comprehensive income (loss):
| millions of Canadian dollars | 2023 | 2022 | 2021 | ||||||||
| Postretirement benefits liability adjustments: | |||||||||||
| Postretirement benefits liability adjustment (excluding amortization) | (66) | 188 | 221 | ||||||||
| Amortization of postretirement benefits liability adjustment included in net benefit cost | 13 | 27 | 43 | ||||||||
| Total | (53) | 215 | 264 | ||||||||
18. Divestment activities
| millions of Canadian dollars | 2021 | 2020 | 2019 | |||||||||
Postretirement benefits liability adjustments: | ||||||||||||
Postretirement benefits liability adjustment (excluding amortization) | 221 | (69 | ) | (165 | ) | |||||||
Amortization of postretirement benefits liability adjustment included in net periodic benefit cost | 43 | 46 | 37 | |||||||||
Total | 264 | (23 | ) | (128 | ) | |||||||
Jointly with ExxonMobil Canada, Imperial signed an agreement in the second quarter of 2022 with Whitecap Resources Inc.for the sale of its interests in XTO Energy Canada which included assets in the Montney and Duvernay areas of central Alberta,for total cash consideration of approximately $1.9 billion ($0.9 billion Imperial's share). The transaction closed on August 31, 2022 and the company recognized a gain of approximately $0.2 billion, after tax. Imperial’s total assets associated with this transaction included about $0.9 billion (about $0.8 billion of property, plant and equipment) and about $0.2 billion total liabilities in the Upstream segment.
Supplemental information on oil and gas exploration and production activities
The information on pages 107108 to 108109 excludes items not related to oil and natural gas extraction, such as administrative and general expenses, pipeline operations, gas plant processing fees and gains or losses on asset sales. The company’s 25 percent interest in proved synthetic crude oil reserves in the Syncrude joint-venture is included as part of the company’s total proved oil and gas reserves and in the calculation of the standardized measure of discounted future cash flows, in accordance with U.S. Securities and Exchange Commission (SEC) and U.S. Financial Accounting Standards Board rules. Results of operations, costs incurred in property acquisitions, exploration and development activities, and capitalized costs include the company’s share of Kearl, Syncrude and other unproved mineable acreages in the following tables.
Results of operations
millions of Canadian dollars | 2021 | 2020 | 2019 | |||||||||
Sales to customers (a) | 5,081 | 2,066 | 3,927 | |||||||||
Intersegment sales (a) (b) | 3,037 | 1,777 | 2,627 | |||||||||
8,118 | 3,843 | 6,554 | ||||||||||
Production expenses | 4,728 | 3,977 | 4,467 | |||||||||
Exploration expenses | 32 | 13 | 47 | |||||||||
Depreciation and depletion (includes impairments) | 1,579 | 2,857 | 1,266 | |||||||||
Income taxes | 457 | (678 | ) | (487 | ) | |||||||
Results of operations | 1,322 | (2,326 | ) | 1,261 |
| millions of Canadian dollars | 2023 | 2022 | 2021 | ||||||||
| Revenue | |||||||||||
Sales to third parties (a) | 6,420 | 7,154 | 5,081 | ||||||||
Transfers (a) (b) | 3,220 | 4,182 | 3,037 | ||||||||
| 9,640 | 11,336 | 8,118 | |||||||||
| Production expenses | 5,015 | 5,521 | 4,728 | ||||||||
| Exploration expenses | 5 | 5 | 32 | ||||||||
| Depreciation and depletion | 1,475 | 1,467 | 1,579 | ||||||||
| Income taxes | 733 | 1,030 | 457 | ||||||||
| Results of operations | 2,412 | 3,313 | 1,322 | ||||||||
The amounts reported as costs incurred in property acquisitions, exploration and development activities include both capitalized costs and costs charged to expense during the year. Costs incurred also include new asset retirement obligations established in the current year, as well as increases or decreases to the asset retirement obligation resulting from changes in cost estimates or abandonment date.
Costs incurred in property acquisitions, exploration and development activities
| millions of Canadian dollars | 2023 | 2022 | 2021 | ||||||||
Property costs (c) | |||||||||||
| Proved | — | — | — | ||||||||
| Unproved | — | — | — | ||||||||
| Exploration costs | 5 | 5 | 32 | ||||||||
| Development costs | 1,580 | 1,602 | 576 | ||||||||
| Total costs incurred in property acquisitions, exploration and development activities | 1,585 | 1,607 | 608 | ||||||||
(a)Sales to third parties or transfers do not include the sale of natural gas and natural gas liquids purchased for resale, as well as royalty payments or diluent costs. These items are reported gross in note 2 in “Revenues”, “Intersegment sales” and in “Purchases of crude oil and products”. (b)Sales of crude oil to consolidated affiliates are at market value, using posted field prices. Sales of natural gas liquids to consolidated affiliates are at prices estimated to be obtainable in a competitive, arm’s-length transaction. (c)“Property costs” are payments for rights to explore for petroleum and natural gas and for purchased reserves (acquired tangible and intangible assets such as gas plants, production facilities and producing-well costs are included under “producing assets”). “Proved” represents areas where successful drilling has delineated a field capable of production. “Unproved” represents all other areas. | |||||||||||
| millions of Canadian dollars | 2021 | 2020 | 2019 | |||||||||
Property costs (c) | ||||||||||||
Proved | - | - | - | |||||||||
Unproved | - | - | 2 | |||||||||
Exploration costs | 32 | 13 | 47 | |||||||||
Development costs | 576 | 816 | 1,176 | |||||||||
Total costs incurred in property acquisitions, exploration and development activities | 608 | 829 | 1,225 | |||||||||
Capitalized costs
| millions of Canadian dollars | 2023 | 2022 | ||||||
Property costs (a) | ||||||||
| Proved | 1,840 | 1,840 | ||||||
| Unproved | 493 | 493 | ||||||
| Producing assets | 39,759 | 39,075 | ||||||
| Incomplete construction | 2,683 | 2,375 | ||||||
| Total capitalized cost | 44,775 | 43,783 | ||||||
| Accumulated depreciation and depletion | (19,568) | (18,512) | ||||||
| Net capitalized costs | 25,207 | 25,271 | ||||||
(a)“Property costs” are payments for rights to explore for petroleum and natural gas and for purchased reserves (acquired tangible and intangible assets such as gas plants, production facilities and producing-well costs are included under “producing assets”). “Proved” represents areas where successful drilling has delineated a field capable of production. “Unproved” represents all other areas. | ||||||||
| millions of Canadian dollars | 2021 | 2020 | ||||||
Property costs (a) | ||||||||
Proved | 2,045 | 2,070 | ||||||
Unproved | 2,468 | 2,462 | ||||||
Producing assets | 39,926 | 39,785 | ||||||
Incomplete construction | 1,762 | 1,518 | ||||||
Total capitalized cost | 46,201 | 45,835 | ||||||
Accumulated depreciation and depletion | (20,112 | ) | (18,551 | ) | ||||
Net capitalized costs | 26,089 | 27,284 | ||||||
Standardized measure of discounted future cash flows
As required by the U.S. Financial Accounting Standards Board, the standardized measure of discounted future net cash flows is computed by applying first-day-of-the-month average prices, year-end costs and legislated tax rates, and a discount factor of 10 percent to net proved reserves. The standardized measure includes costs for future dismantlement, abandonment and remediation obligations. The company believes the standardized measure does not provide a reliable estimate of the company’s expected future cash flows to be obtained from the development and production of its oil and gas properties or of the value of its proved oil and gas reserves. The standardized measure is prepared on the basis of certain prescribed assumptions, including first-day-of-the-month average prices, which represent discrete points in time and therefore may cause significant variability in cash flows from year to year as prices change.
Standardized measure of discounted future net cash flows related to proved oil and gas reserves
| millions of Canadian dollars | 2023 | 2022 | 2021 | ||||||||
| Future cash flows | 158,347 | 198,923 | 161,577 | ||||||||
| Future production costs | (101,640) | (104,765) | (101,580) | ||||||||
| Future development costs | (24,074) | (23,392) | (21,903) | ||||||||
| Future income taxes | (7,016) | (16,872) | (8,192) | ||||||||
| Future net cash flows | 25,617 | 53,894 | 29,902 | ||||||||
| Annual discount of 10 percent for estimated timing of cash flows | (11,615) | (28,340) | (15,732) | ||||||||
| Discounted future cash flows | 14,002 | 25,554 | 14,170 | ||||||||
| millions of Canadian dollars | 2021 | 2020 | 2019 | |||||||||
Future cash flows | 161,577 | 23,911 | 166,801 | |||||||||
Future production costs | (101,580 | ) | (18,787 | ) | (127,911 | ) | ||||||
Future development costs | (21,903 | ) | (6,096 | ) | (24,759 | ) | ||||||
Future income taxes | (8,192 | ) | (155 | ) | (3,960 | ) | ||||||
Future net cash flows | 29,902 | (1,127 | ) | 10,171 | ||||||||
Annual discount of 10 percent for estimated timing of cash flows | (15,732 | ) | 1,065 | (4,660 | ) | |||||||
Discounted future cash flows | 14,170 | (62 | ) | 5,511 | ||||||||
Changes in standardized measure of discounted future net cash flows related to proved oil and gas reserves
| millions of Canadian dollars | 2023 | 2022 | 2021 | ||||||||
| Balance at beginning of year | 25,554 | 14,170 | (62) | ||||||||
| Changes resulting from: | |||||||||||
| Sales and transfers of oil and gas produced, net of production costs | (4,918) | (6,113) | (3,841) | ||||||||
Net changes in prices, development costs and production costs (a) | (16,908) | 23,215 | 7,681 | ||||||||
Extensions, discoveries, additions and improved recovery, less related costs | 58 | 664 | 52 | ||||||||
| Development costs incurred during the year | 1,182 | 1,160 | 650 | ||||||||
| Revisions of previous quantity estimates | 2,146 | (4,431) | 13,482 | ||||||||
| Accretion of discount | 2,535 | 1,439 | 24 | ||||||||
| Net change in income taxes | 4,353 | (4,550) | (3,816) | ||||||||
| Net change | (11,552) | 11,384 | 14,232 | ||||||||
| Balance at end of year | 14,002 | 25,554 | 14,170 | ||||||||
(a)SEC rules require the company’s reserves to be calculated on the basis of average first-day-of-the-month oil and natural gas prices during the reporting year. Future net cash flows are determined based on the net proved reserves as outlined in the “Net proved reserves table”. | |||||||||||
| millions of Canadian dollars | 2021 | 2020 | 2019 | |||||||||
Balance at beginning of year | (62 | ) | 5,511 | 8,734 | ||||||||
Changes resulting from: | ||||||||||||
Sales and transfers of oil and gas produced, net of production costs | (3,841 | ) | (447 | ) | (2,441 | ) | ||||||
Net changes in prices, development costs and production costs (a) | 7,681 | (8,661 | ) | (3,117 | ) | |||||||
Extensions, discoveries, additions and improved recovery, less related costs | 52 | 114 | 169 | |||||||||
Development costs incurred during the year | 650 | 563 | 1,016 | |||||||||
Revisions of previous quantity estimates | 13,482 | 459 | (168 | ) | ||||||||
Accretion of discount | 24 | 623 | 643 | |||||||||
Net change in income taxes | (3,816 | ) | 1,776 | 675 | ||||||||
Net change | 14,232 | (5,573 | ) | (3,223 | ) | |||||||
Balance at end of year | 14,170 | (62 | ) | 5,511 | ||||||||
Net proved reserves (a)
| Liquids (b) | Natural gas | Synthetic oil | Bitumen | Total oil-equivalent basis (c) | ||||||||||||||||
| millions of barrels | billions of cubic feet | millions of barrels | millions of barrels | millions of barrels | ||||||||||||||||
Beginning of year 2019 | 62 | 639 | 466 | 3,166 | 3,800 | |||||||||||||||
Revisions | (20 | ) | (33 | ) | (27 | ) | (134 | ) | (187 | ) | ||||||||||
Improved recovery | - | - | - | - | - | |||||||||||||||
(Sale) purchase of reserves in place | - | (24 | ) | - | - | (4 | ) | |||||||||||||
Discoveries and extensions | 4 | 51 | - | - | 13 | |||||||||||||||
Production | (5 | ) | (52 | ) | (24 | ) | (93 | ) | (130 | ) | ||||||||||
End of year 2019 | 41 | 581 | 415 | 2,939 | 3,492 | |||||||||||||||
Revisions | (29 | ) | (348 | ) | (79 | ) | (2,757 | ) | (2,923 | ) | ||||||||||
Improved recovery | - | - | - | - | - | |||||||||||||||
(Sale) purchase of reserves in place | - | (10 | ) | - | - | (2 | ) | |||||||||||||
Discoveries and extensions | - | - | 133 | 1 | 134 | |||||||||||||||
Production | (5 | ) | (55 | ) | (25 | ) | (102 | ) | (141 | ) | ||||||||||
End of year 2020 | 7 | 168 | 444 | 81 | 560 | |||||||||||||||
Revisions | 13 | 165 | 17 | 2,239 | 2,297 | |||||||||||||||
Improved recovery | - | - | - | 2 | 2 | |||||||||||||||
(Sale) purchase of reserves in place | - | (10 | ) | - | - | (2 | ) | |||||||||||||
Discoveries and extensions | - | - | - | - | - | |||||||||||||||
Production | (4 | ) | (42 | ) | (23 | ) | (106 | ) | (140 | ) | ||||||||||
End of year 2021 | 16 | 281 | 438 | 2,216 | 2,717 | |||||||||||||||
Net proved developed reserves included above, as of | ||||||||||||||||||||
January 1, 2019 | 24 | 273 | 466 | 2,861 | 3,396 | |||||||||||||||
December 31, 2019 | 22 | 291 | 415 | 2,609 | 3,095 | |||||||||||||||
December 31, 2020 | 7 | 167 | 311 | 76 | 422 | |||||||||||||||
December 31, 2021 | 14 | 205 | 326 | 1,957 | 2,331 | |||||||||||||||
Net proved undeveloped reserves included above, as of | ||||||||||||||||||||
January 1, 2019 | 38 | 366 | - | 305 | 404 | |||||||||||||||
December 31, 2019 | 19 | 290 | - | 330 | 397 | |||||||||||||||
December 31, 2020 | - | 1 | 133 | 5 | 138 | |||||||||||||||
December 31, 2021 | 2 | 76 | 112 | 259 | 386 | |||||||||||||||
Liquids (b) | Natural gas | Synthetic crude oil | Bitumen | Total oil-equivalent basis (c) | |||||||||||||
millions of barrels | billions of cubic feet | millions of barrels | millions of barrels | millions of barrels | |||||||||||||
| Beginning of year 2021 | 7 | 168 | 444 | 81 | 560 | ||||||||||||
| Revisions | 13 | 165 | 17 | 2,239 | 2,297 | ||||||||||||
| Improved recovery | — | — | — | 2 | 2 | ||||||||||||
| (Sale) purchase of reserves in place | — | (10) | — | — | (2) | ||||||||||||
| Discoveries and extensions | — | — | — | — | — | ||||||||||||
| Production | (4) | (42) | (23) | (106) | (140) | ||||||||||||
| End of year 2021 | 16 | 281 | 438 | 2,216 | 2,717 | ||||||||||||
| Revisions | — | (41) | (62) | (363) | (432) | ||||||||||||
| Improved recovery | — | — | — | — | — | ||||||||||||
| (Sale) purchase of reserves in place | (9) | (141) | — | — | (32) | ||||||||||||
| Discoveries and extensions | — | 2 | — | 67 | 67 | ||||||||||||
| Production | (3) | (29) | (23) | (96) | (127) | ||||||||||||
| End of year 2022 | 4 | 72 | 353 | 1,824 | 2,193 | ||||||||||||
| Revisions | (2) | 2 | 26 | 90 | 114 | ||||||||||||
| Improved recovery | — | — | — | — | — | ||||||||||||
| (Sale) purchase of reserves in place | — | (1) | — | — | — | ||||||||||||
| Discoveries and extensions | — | — | — | — | — | ||||||||||||
| Production | (2) | (12) | (25) | (103) | (132) | ||||||||||||
| End of year 2023 | — | 61 | 354 | 1,811 | 2,175 | ||||||||||||
| Net proved developed reserves included above, as of | |||||||||||||||||
| January 1, 2021 | 7 | 167 | 311 | 76 | 422 | ||||||||||||
| December 31, 2021 | 14 | 205 | 326 | 1,957 | 2,331 | ||||||||||||
| December 31, 2022 | 4 | 60 | 248 | 1,691 | 1,953 | ||||||||||||
| December 31, 2023 | — | 53 | 242 | 1,706 | 1,957 | ||||||||||||
| Net proved undeveloped reserves included above, as of | |||||||||||||||||
| January 1, 2021 | — | 1 | 133 | 5 | 138 | ||||||||||||
| December 31, 2021 | 2 | 76 | 112 | 259 | 386 | ||||||||||||
| December 31, 2022 | — | 12 | 105 | 133 | 240 | ||||||||||||
| December 31, 2023 | — | 8 | 112 | 105 | 218 | ||||||||||||
(a)Net reserves are the company’s share of reserves after deducting the shares of mineral owners or governments or both. All reported reserves are located in Canada. Reserves of natural gas are calculated at a pressure of 14.73 pounds per square inch at 60°F. (b)Liquids include crude, condensate and natural gas liquids (NGLs). NGL proved reserves are not material and are therefore included under liquids. (c)Gas converted to oil-equivalent at six million cubic feet per one thousand barrels. | |||||||||||||||||
The information above describes changes during the years and balances of proved oil and gas reserves at year-end 2019, 20202021, 2022 and 2021.2023. The definitions used are in accordance with the U.S. Securities and Exchange Commission’sSEC Rule 4-10 (a) of Regulation S-X.
Proved oil and natural gas reserves are those quantities of oil and gas, which, by analysis of geoscience and engineering data, can be estimated with reasonable certainty to be economically producible – from a given date forward, from known reservoirs, and under existing economic conditions, operating methods and government regulations – prior to the time at which contracts providing the right to operate expire. In some cases, substantial new investments in additional wells and other facilities will be required to recover these proved reserves.
110
In accordance with SEC rules, the year-end reserves volumes, as well as the reserves change categories shown in the proved reserves tables are required to be calculated on the basis of average prices during the 12-month period prior to the ending date of the period covered by the report, determined as an unweighted arithmetic average of the first-day-of-the-month price for each month within such period. These reserves quantities were also used in calculating unit-of-production depreciation rates and in calculating the standardized measure of discounted net cash flow.
Revisions in previously estimated volumes of proved reserves for existing fields can occur due to the evaluation or re-evaluation of already available geologic, reservoir or production data; new geologic, reservoir or production data; or changes in the average of first-day-of-the-month oil and natural gas prices and / or costs that are used in the estimation of reserves. Revisions can also result from significant changes in either development strategy or production equipment /and facility capacity.
In 2021, upward revisions of proved bitumen reserves were a result of improved prices. The 1.7 billion barrels of bitumen at Kearl and 0.5 billion barrels of bitumen at Cold Lake qualified as proved reserves under the U.S. Securities and Exchange CommissionSEC definition of proved reserves. Upward revisions to proved synthetic crude oil reserves were a result of improved prices. Changes to the liquids and natural gas proved reserves were the result of updated development plans and divestments at the Montney and Duvernay unconventional assets.
In 2022, downward revisions of proved bitumen reserves were driven by a decrease of 0.2 billion barrels at Kearl as a result of higher royalty obligations associated with pricing, and a decrease of 0.2 billion barrels at Cold Lake due to an updated development plan. An increase to the bitumen reserves of 0.1 billion barrels is associated with extensions at Cold Lake for the Grand Rapids Phase 1 SA-SAGD and Leming SAGD projects. Downward revisions to proved synthetic crude oil reserves were a result of mine development plan updates and higher royalty obligations at Syncrude associated with pricing. Changes to the liquids and natural gas proved reserves were primarily a result of the sale of the company’s interest in the Montney and Duvernay unconventional assets.
In 2023, upward revisions of proved bitumen of 0.1 billion barrels were driven by lower royalty obligations associated with lower pricing and minor technical revisions at Cold Lake and Kearl. A slight increase in proved reserves for synthetic crude oil is associated with lower royalty obligations associated with pricing. Conventional proved liquids reserves decreased to zero under existing pricing and operating conditions.
Under the terms of certain contractual arrangements or government royalty regimes, lower prices can also increase proved reserves attributable to Imperial.the company. The company’s operating decisions and its outlook for future production volumes are not impacted by proved reserves as disclosed under the U.S. Securities and Exchange Commission (SEC)SEC definition.
Net proved reserves are determined by deducting the estimated future share of mineral owners or governments or both. For liquids and natural gas, net proved reserves are based on estimated future royalty rates as of the date the estimate is made incorporating the applicable governments’ oil and gas royalty regimes. For bitumen, net proved reserves are based on the company’s best estimate of average royalty rates over the remaining life of each of the Cold Lake and Kearl fields, and they incorporate the Alberta government’s oil sands royalty regime. For synthetic crude oil, net proved reserves are based on the company’s best estimate of average royalty rates over the remaining life of the project, and they incorporate the Alberta government’s oil sands royalty regime. In all cases, actual future royalty rates may vary with production, price and costs.
Net proved developed reserves are those volumes that are expected to be recovered through existing wells, and facilities, or mining activities with existing equipment and operating methods or in which the cost of the required equipment is relatively minor compared to the cost of a new well or facility. Net proved undeveloped reserves are those volumes that are expected to be recovered as a result of future investments to drill new wells, to recomplete existing wells and / or to install facilities to collect and deliver the production from existing and future wells, and facilities.facilities, or mining activities.
| Proxy information section | ||||||||
| Table of contents | Page | |||||||
| Nominees for director | ||||||||
| Director nominee tables | ||||||||
| 2023 | ||||||||
| nominees | ||||||||
| Executive summary | ||||||||
| design | ||||||||
| Determining compensation | ||||||||
| Other compensation elements | ||||||||
| Risk and governance | ||||||||
| Executive compensation tables | ||||||||
| Appendix | ||||||||
| Appendix A – Board of director and committee charters | ||||||||
112
Nominees for director
The director nominee tables on the following pages provide information on the seven nominees proposed for election to the board of directors of the company. All of the nominees, with the exception of N.A. Hansen, are now directors and have been since the dates indicated. M.R. Crocker is a current director and has chosen not to stand for re-election. Mr. Hansen is not currently a director and is being nominated for election as a director for the first time.
Included in these tables is information relating to the director nominees’ biographies, independence status, expertise, standing committee memberships, attendance, public board memberships and shareholdings in the company. The information is as of February 15, 2022,2024, the effective date of this circular, unless otherwise indicated.
For more information on our director nominees, please see the Statement of corporate governance practice starting on page 118.
section.Director nominee tables
 |
Imperial Oil Limited Ownership and Value of Equity (a) (b) (c) (d) | ||||||||||||||||||||||||||||||
| DAVID W. CORNHILL | DAVID W. CORNHILL | |||||||||||||||||||||||||||||
IMO Common Shares (% of class) | IMO Deferred Share Units (DSU) | Total Vested Equity Holdings (Common + DSU) | Restricted Stock Units (RSU) | Total Holdings * (Common + DSU + RSU) |  | Mr. Cornhill is a director of AltaGas Ltd., and is the chairman of the board of directors of TriSummit Utilities Inc. (formerly AltaGas Canada Inc.), a privately owned corporation. Mr. Cornhill is a founding shareholder of AltaGas (and its predecessors). He was chief executive officer of AltaGas from 1994 to 2016 and served as interim co-chief executive officer from July to December 2018. Prior to forming AltaGas, Mr. Cornhill served in various capacities with Alberta and Southern Gas Co. Ltd, including vice-president, finance and administration, treasurer and president and chief operating officer. Mr. Cornhill is an experienced leader in the business community and is a strong supporter of communities and community collaboration, investment and enhancement. He is a member of the Ivey Advisory Board at Western University. Mr. Cornhill holds a BSc (Hons.) degree and a MBA degree from Western University, and he was awarded an honorary Doctor of Laws degree by the University in 2015. | ||||||||||||||||||||||||
Holdings as at February 15, 2022 (#) | 12,500 (<0.01%) | 10,953 | 23,453 | 14,900 | 38,353 | |||||||||||||||||||||||||
Total market value as at February 15, 2022 ($) | 697,500 | 611,177 | 1,308,677 | 831,420 | 2,140,097 | |||||||||||||||||||||||||
Calgary, Alberta, Canada Age: 70 Nonemployee director (independent) Director since: November 29, 2017 Skills and experience: Leadership of large organizations, Operations/technical, Project management, Strategy development, Environment and sustainability, Audit committee financial expert, Financial expertise, Executive compensation, Risk management | Calgary, Alberta, Canada Age: 70 Nonemployee director (independent) Director since: November 29, 2017 Skills and experience: Leadership of large organizations, Operations/technical, Project management, Strategy development, Environment and sustainability, Audit committee financial expert, Financial expertise, Executive compensation, Risk management | Board and Standing Committee Membership | Attendance in 2023 | Voting Results of Last Annual Meeting | ||||||||||||||||||||||||||
| Audit | 5 of 5 (100%) | Votes For: | 477,220,521 (90.28%) | |||||||||||||||||||||||||||
| Executive resources | 8 of 8 (100%) | Votes against: | 51,359,878 (9.72%) | |||||||||||||||||||||||||||
| Safety and sustainability | 5 of 5 (100%) | Total Votes: | 528,580,399 | |||||||||||||||||||||||||||
| Imperial Oil Limited Ownership and Value of Equity (a) (b) (c) (d) | ||||||||||||||||||||||||||||||
| IMO Common Shares (% of class) | IMO Deferred Share Units (DSU) | Total Vested Equity Holdings (Common + DSU) | Restricted Stock Units (RSU) | Total Holdings* (Common + DSU + RSU) | ||||||||||||||||||||||||||
| Holdings as at February 15, 2024 (#) | 12,500 | 15,217 | 27,717 | 18,700 | 46,417 | |||||||||||||||||||||||||
| (<0.01%) | (<0.01%) | 15,217 | ||||||||||||||||||||||||||||
| Total market value as at February 15, 2024 ($) | Total market value as at February 15, 2024 ($) | 1,016,250 | 2,253,392 | 1,520,310 | 3,773,702 | |||||||||||||||||||||||||
Year over year change (#) | 0 | 2,769 | 2,769 | 3,300 | 6,069 | Year over year change (#) | 0 | 1,909 | 1,909 | 1,800 | 3,709 | |||||||||||||||||||
| *Meets the necessary share ownership requirements | *Meets the necessary share ownership requirements | |||||||||||||||||||||||||||||
| Public Company Directorships in the Past Five Years* | Public Company Directorships in the Past Five Years* | Other Positions in the Past Five Years (position, date office held and status of employer) | ||||||||||||||||||||||||||||
–AltaGas Ltd. (2010 - present) –AltaGas Canada Inc. (2018 - 2020) *no public board interlocks | –AltaGas Ltd. (2010 - present) –AltaGas Canada Inc. (2018 - 2020) *no public board interlocks | –AltaGas Ltd., Chairman of the board (1994 - 2019) | ||||||||||||||||||||||||||||
Attendance 2021 | ||||||
| BRADLEY W. CORSON | ||||||||||||||||||||
 | Mr. Corson was appointed as president and a director of Imperial Oil Limited on September 17, 2019, and assumed the additional roles of chairman and chief executive officer on January 1, 2020. Mr. Corson has worked for Exxon Mobil Corporation and its predecessor companies since 1983 in various upstream and downstream assignments, with responsibilities in the United States, Hong Kong and London. In his previous position, Mr. Corson was vice-president of Exxon Mobil Corporation and president of ExxonMobil Upstream Ventures, a division of Exxon Mobil Corporation. | |||||||||||||||||||
Calgary, Alberta, Canada Age: 62 Non-independent director Director since: September 17, 2019 Skills and experience: Leadership of large organizations, Operations/technical, Project management, Global experience, Strategy development, Environment and sustainability, Financial expertise, Government relations, Executive compensation, Risk management | Board and Standing Committee Membership | Attendance in 2023 | Voting Results of Last Annual Meeting | |||||||||||||||||
Board (Chair) | 8 of 8 (100%) | Votes For: | 522,575,825 (98.86%) | |||||||||||||||||
| Votes Against: | 6,004,574 (1.14%) | |||||||||||||||||||
| Total Votes: | 528,580,399 | |||||||||||||||||||
| Imperial Oil Limited Ownership and Value of Equity (a) (b) (c) (d) | ||||||||||||||||||||
| IMO Common Shares (% of class) | IMO Deferred Share Units (DSU) | Total Vested Equity Holdings (Common + DSU) | Restricted Stock Units (RSU) | Total Holdings* (Common + DSU + RSU) | ||||||||||||||||
| Holdings as at February 15, 2024 (#) | 0 | 0 | 0 | 410,400 | 410,400 | |||||||||||||||
| Total market value as at February 15, 2024 ($) | 0 | 0 | 0 | 33,365,520 | 33,365,520 | |||||||||||||||
| Year over year change (#) | 0 | 0 | 0 | 86,800 | 86,800 | |||||||||||||||
| *Meets the necessary share ownership requirements | ||||||||||||||||||||
| Public Company Directorships in the Past Five Years* | Other Positions in the Past Five Years (position, date office held and status of employer) | |||||||||||||||||||
–None *no public board interlocks | –President, Imperial Oil Limited (2019 – present) –President, ExxonMobil Upstream Ventures (2015 – 2019) (Affiliate) | |||||||||||||||||||
| SHARON R. DRISCOLL | ||||||||||||||||||||
 | Ms. Driscoll is currently an independent director of Empire Company Limited and also serves as a director of Gildan Activewear Inc. Prior to her retirement in 2023, Ms. Driscoll held executive positions at RB Global Incorporated, including chief financial officer, co-chief executive officer and executive vice-president and advisor to the chief executive officer. Prior to joining RB Global, Ms. Driscoll served as the executive vice-president and chief financial officer for Katz Group Canada Ltd. from 2013 to 2015 and was the senior vice-president and chief financial officer at Sears Canada Inc. from 2008 to 2013. Ms. Driscoll is a Chartered Professional Accountant and has a Bachelor of Commerce (Honours) degree from Queen’s University. | |||||||||||||||||||
Vancouver, British Columbia, Canada Age: 62 Nonemployee director (independent) Director since: May 2, 2023 Skills and experience: Leadership of large organizations, Project management, Global experience, Strategy development, Environment and sustainability, Audit committee financial expert, Financial expertise, Executive compensation, Risk management | Board and Standing Committee Membership | Attendance in 2023 | Voting Results of Last Annual Meeting | |||||||||||||||||
| Board | 4 of 4 (100%) | |||||||||||||||||||
Audit (Chair) | 2 of 2 (100%) | Votes For: | 526,032,840 (99.52%) | |||||||||||||||||
| Executive resources | 5 of 5 (100%) | Votes against: | 2,547,559 (0.48%) | |||||||||||||||||
| Safety and sustainability | 4 of 4 (100%) | Total Votes: | 528,580,399 | |||||||||||||||||
| Nominations and corporate governance | 3 of 3 (100%) | |||||||||||||||||||
| Finance | 5 of 5 (100%) | |||||||||||||||||||
| Imperial Oil Limited Ownership and Value of Equity (a) (b) (c) (d) | ||||||||||||||||||||
| IMO Common Shares (% of class) | IMO Deferred Share Units (DSU) | Total Vested Equity Holdings (Common + DSU) | Restricted Stock Units (RSU) | Total Holdings* (Common + DSU + RSU) | ||||||||||||||||
| Holdings as at February 15, 2024 (#) | 0 | 1,122 | 1,122 | 3,300 | 4,422 | |||||||||||||||
| Total market value as at February 15, 2024 ($) | 0 | 91,219 | 91,219 | 268,290 | 359,509 | |||||||||||||||
| Year over year change (#) | 0 | 1,122 | 1,122 | 3,300 | 4,422 | |||||||||||||||
| *Has 5 years from date of appointment to meet the necessary share ownership requirements | ||||||||||||||||||||
| Public Company Directorships in the Past Five Years* | Other Positions in the Past Five Years (position, date office held and status of employer) | |||||||||||||||||||
–Gildan Activewear Ltd. (2023 - Present) –Empire Company Limited (2018 – Present) *no public board interlocks | –RB Global (formerly Ritchie Bros. Auctioneers Incorporated) Executive vice-president and advisor to CEO (2022 – 2023) –RB Global (formerly Ritchie Bros. Auctioneers Incorporated), Chief financial officer (2015 - 2022) –RB Global (formerly Ritchie Bros. Auctioneers Incorporated), Chief financial officer and Co-chief executive officer (2019) | |||||||||||||||||||
114
| JOHN N. FLOREN | ||||||||||||||||||||
 | Mr. Floren is the former president and chief executive officer of Methanex Corporation, and prior to that appointment held the positions of senior vice-president, global marketing and logistics and regional director, marketing and logistics, North America. Mr. Floren was an employee of Methanex for approximately 22 years and has worked in the chemical industry for over 37 years. He currently serves as a director of West Fraser Timber Co. Ltd. Mr. Floren holds a Bachelor of Arts in Economics from the University of Manitoba and attended the Harvard Business School’s Program for Management Development, the International Executive Program at INSEAD and completed the Directors Education Program at the Institute of Corporate Directors. | |||||||||||||||||||
Oakville, Ontario, Canada Age: 65 Nonemployee director (independent) Director since: May 2, 2023 Skills and experience: Leadership of large organizations, Operations/technical Project management, Global experience, Strategy development, Environment and sustainability, Financial expertise, Government relations Information technology/Cybersecurity oversight Executive compensation, Risk management | Board and Standing Committee Membership | Attendance in 2023 | Voting Results of Last Annual Meeting | |||||||||||||||||
| Board | 4 of 4 (100%) | |||||||||||||||||||
| Audit | 2 of 2 (100%) | Votes For: | 528,279,988 (99.94%) | |||||||||||||||||
| Executive resources | 5 of 5 (100%) | Votes against: | 300,411 (0.06%) | |||||||||||||||||
Safety and sustainability (Chair) | 4 of 4 (100%) | Total Votes: | 528,580,399 | |||||||||||||||||
| Nominations and corporate governance | 3 of 3 (100%) | |||||||||||||||||||
| Finance | 5 of 5 (100%) | |||||||||||||||||||
| Imperial Oil Limited Ownership and Value of Equity (a) (b) (c) (d) | ||||||||||||||||||||
| IMO Common Shares (% of class) | IMO Deferred Share Units (DSU) | Total Vested Equity Holdings (Common + DSU) | Restricted Stock Units (RSU) | Total Holdings* (Common + DSU + RSU) | ||||||||||||||||
| Holdings as at February 15, 2024 (#) | 0 | 1,122 | 1,122 | 3,300 | 4,422 | |||||||||||||||
| Total market value as at February 15, 2024 ($) | 0 | 91,219 | 91,219 | 268,290 | 359,509 | |||||||||||||||
| Year over year change (#) | 0 | 1,122 | 1,122 | 3,300 | 4,422 | |||||||||||||||
| *Has 5 years from date of appointment to meet the necessary share ownership requirements | ||||||||||||||||||||
| Public Company Directorships in the Past Five Years* | Other Positions in the Past Five Years (position, date office held and status of employer) | |||||||||||||||||||
–West Fraser Timber Co. Ltd. (2016 – present) –Methanex Corporation (2013 – 2022) *no public board interlocks | –Methanex Corporation, President and chief executive officer (2013 – 2022) | |||||||||||||||||||
| GARY J. GOLDBERG | ||||||||||||||||||||
 | Mr. Goldberg has more than 40 years of global experience in the mining industry, including in executive, operational and strategic roles, and currently serves as a non-executive director of BHP Group Limited. Mr. Goldberg served as the chief executive officer of Newmont Corporation from 2013 to 2019, and prior to that, was president and chief executive officer of Rio Tinto Minerals. Mr. Goldberg was also a non-executive director of Port Waratah Coal Services Limited and Rio Tinto Zimbabwe, and served as vice-chair of the World Gold Council, treasurer of the International Council on Mining and Metals, and chair of the National Mining Association in the United States. | |||||||||||||||||||
Breckenridge, Colorado, United States of America Age: 65 Nonemployee director (independent) Director since: May 2, 2023 Skills and experience: Leadership of large organizations, Operations/technical, Project management, Global experience, Strategy development, Environment and sustainability, Financial expertise, Government relations, Executive compensation, Risk management | Board and Standing Committee Membership | Attendance in 2023 | Voting Results of Last Annual Meeting | |||||||||||||||||
| Board | 4 of 4 (100%) | |||||||||||||||||||
| Audit | 2 of 2 (100%) | Votes For: | 528,282,636 (99.94%) | |||||||||||||||||
Executive resources (Chair) | 5 of 5 (100%) | Votes against: | 297,763 (0.06%) | |||||||||||||||||
| Safety and sustainability | 4 of 4 (100%) | Total Votes: | 528,580,399 | |||||||||||||||||
| Nominations and corporate governance | 3 of 3 (100%) | |||||||||||||||||||
| Finance | 5 of 5 (100%) | |||||||||||||||||||
| Imperial Oil Limited Ownership and Value of Equity (a) (b) (c) (d) | ||||||||||||||||||||
| IMO Common Shares (% of class) | IMO Deferred Share Units (DSU) | Total Vested Equity Holdings (Common + DSU) | Restricted Stock Units (RSU) | Total Holdings* (Common + DSU + RSU) | ||||||||||||||||
| Holdings as at February 15, 2024 (#) | 0 | 1,122 | 1,122 | 3,300 | 4,422 | |||||||||||||||
| Total market value as at February 15, 2024 ($) | 0 | 91,219 | 91,219 | 268,290 | 359,509 | |||||||||||||||
| Year over year change (#) | 0 | 1,122 | 1,122 | 3,300 | 4,422 | |||||||||||||||
| *Has 5 years from date of appointment to meet the necessary share ownership requirements | ||||||||||||||||||||
| Public Company Directorships in the Past Five Years* | Other Positions in the Past Five Years (position, date office held and status of employer) | |||||||||||||||||||
–BHP Group Limited (2020 – present) –Newmont Corporation (previously Newmont Mining Corporation) (2013 – 2019) *no public board interlocks | –Newmont Corporation, Executive advisor (2019 – 2020) –Newmont Corporation, Chief executive officer (2013 – 2019) | |||||||||||||||||||
115
| NEIL A. HANSEN | ||||||||||||||||||||
 | Mr. Hansen is currently senior vice-president, energy products, for ExxonMobil Product Solutions Company and has held that position since April, 2022. He is responsible for the global fuels and aromatics value chains. Mr. Hansen has 24 years of financial and commercial experience across ExxonMobil's Upstream and Downstream businesses in the Americas, Europe, and Asia Pacific regions. Prior to his current position, Mr. Hansen was vice-president, fuels for Europe, Africa and Middle East based in Belgium and prior to that was vice-president investor relations and corporate secretary at ExxonMobil. | |||||||||||||||||||
The Woodlands, Texas, United States of America Age: 49 Non-independent director Director since: Not currently a member of the board; first nomination for election as director Skills and experience: Leadership of large organizations, Project management, Global experience, Strategy development, Environment and sustainability, Financial expertise, Government relations, Executive compensation, Risk management | Board and Standing Committee Membership | Attendance in 2023 | Voting Results of Last Annual Meeting | |||||||||||||||||
| Not currently a member of the board or any of its committees | None | Votes For: | n/a | |||||||||||||||||
| Votes against: | n/a | |||||||||||||||||||
| Total Votes: | n/a | |||||||||||||||||||
| Imperial Oil Limited Ownership and Value of Equity (a) (b) (c) (d) | ||||||||||||||||||||
| IMO Common Shares (% of class) | IMO Deferred Share Units (DSU) | Total Vested Equity Holdings (Common + DSU) | Restricted Stock Units (RSU) | Total Holdings* (Common + DSU + RSU) | ||||||||||||||||
| Holdings as at February 15, 2024 (#) | 0 | 0 | 0 | 0 | 0 | |||||||||||||||
| Total market value as at February 15, 2024 ($) | 0 | 0 | 0 | 0 | 0 | |||||||||||||||
| Year over year change (#) | 0 | 0 | 0 | 0 | 0 | |||||||||||||||
| * No share ownership guidelines apply | ||||||||||||||||||||
| Public Company Directorships in the Past Five Years* | Other Positions in the Past Five Years (position, date office held and status of employer) | |||||||||||||||||||
–None *no public board interlocks | –Senior vice-president, energy products, Exxon Mobil Product Solutions Company, (2022 – present) (Affiliate) –Vice-president, fuels, ExxonMobil Fuels & Lubricants Company, (2020 – 2022) (Affiliate) –Vice-president, investor relations and corporate secretary, Exxon Mobil Corporation (2018 – 2020) (Affiliate) | |||||||||||||||||||
| MIRANDA C. HUBBS | ||||||||||||||||||||
 | Ms. Hubbs is currently an independent director of Nutrien Ltd. and also serves as a director of PSP Investments (Public Sector Pension Investment Board), Canadian Investment Regulatory Organization (CIRO) and serves as Chair of the board of the Canadian Red Cross. Prior to retirement in 2011, Ms. Hubbs was executive vice- president and managing director of McLean Budden, one of Canada’s leading investment managers. Ms. Hubbs holds a BSc from Western University and an MBA from Schulich School of Business at York University and is a CFA charterholder. Ms. Hubbs serves on the ICD Climate Strategy Advisory Board and the Global Risk Institute Sustainable Finance Advisory Committee, holds the Fundamentals of Sustainability Accounting credential from the Sustainability Accounting Standards Board, and has received her CERT Certificate in Cybersecurity Oversight issued by the Software Engineering Institute at Carnegie Mellon University. | |||||||||||||||||||
Toronto, Ontario, Canada Age: 57 Nonemployee director (independent) Director since: July 26, 2018 Skills and experience: Global experience, Strategy development, Environment and sustainability, Audit committee financial expert, Financial expertise, Information technology/Cybersecurity oversight Executive compensation, Risk management | Board and Standing Committee Membership | Attendance in 2023 | Voting Results of Last Annual Meeting | |||||||||||||||||
| Board | 8 of 8 (100%) | |||||||||||||||||||
| Audit | 5 of 5 (100%) | Votes For: | 515,973,536 (97.62%) | |||||||||||||||||
| Executive resources | 7 of 8 (88%) | Votes against: | 12,601,009 (2.38%) | |||||||||||||||||
| Safety and sustainability | 5 of 5 (100%) | Total Votes: | 528,574,545 | |||||||||||||||||
Nominations and corporate governance (Chair) | 5 of 6 (83%) | |||||||||||||||||||
| Finance | 5 of 5 (100%) | |||||||||||||||||||
| Imperial Oil Limited Ownership and Value of Equity (a) (b) (c) (d) | ||||||||||||||||||||
| IMO Common Shares (% of class) | IMO Deferred Share Units (DSU) | Total Vested Equity Holdings (Common + DSU) | Restricted Stock Units (RSU) | Total Holdings* (Common + DSU + RSU) | ||||||||||||||||
| Holdings as at February 15, 2024 (#) | 0 | 18,736 | 18,736 | 17,400 | 36,136 | |||||||||||||||
| Total market value as at February 15, 2024 ($) | 0 | 1,523,237 | 1,523,237 | 1,414,620 | 2,937,857 | |||||||||||||||
| Year over year change (#) | 0 | 2,001 | 2,001 | 1,800 | 3,801 | |||||||||||||||
| *Meets the necessary share ownership requirements | ||||||||||||||||||||
| Public Company Directorships in the Past Five Years* | Other Positions in the Past Five Years (position, date office held and status of employer) | |||||||||||||||||||
–Nutrien Ltd. (2018 – present) *no public board interlocks | –None | |||||||||||||||||||
116
 | ||
IMO Common Shares (% of class) | IMO Deferred Share Units (DSU) | Total Vested Equity Holdings (Common + DSU) | Restricted Stock Units (RSU) | Total Holdings * (Common + DSU + RSU) | ||||||
Holdings as at February 15, 2022 (#) | 0 | 0 | 0 | 234,600 | 234,600 | |||||
Total market value as at February 15, 2022 ($) | 0 | 0 | 0 | 13,090,680 | 13,090,680 | |||||
Year over year change (#) | 0 | 0 | 0 | 78,200 | 78,200 |
 | ||
Imperial Oil Limited Ownership and Value of Equity (a) (b) (c) (d) | ||||||||||
IMO Common Shares (% of class) | IMO Deferred Share Units (DSU) | Total Vested Equity Holdings (Common + DSU) | Restricted Stock Units (RSU) | Total Holdings * (Common + DSU + RSU) | ||||||
Holdings as at February 15, 2022 (#) | 0 | 0 | 0 | 0 | 0 | |||||
Total market value as at February 15, 2022 ($) | 0 | 0 | 0 | 0 | 0 | |||||
Year over year change (#) | 0 | 0 | 0 | 0 | 0 | |||||
 | ||
Imperial Oil Limited Ownership and Value of Equity (a) (b) (c) (d) | ||||||||||
IMO Common Shares (% of class) | IMO Deferred Share Units (DSU) | Total Vested Equity Holdings (Common + DSU) | Restricted Stock Units (RSU) | Total Holdings * (Common + DSU + RSU) | ||||||
Holdings as at February 15, 2022 (#) | 0 | 51,161 | 51,161 | 17,200 | 68,361 | |||||
Total market value as at February 15, 2022 ($) | 0 | 2,854,784 | 2,854,784 | 959,760 | 3,814,544 | |||||
Year over year change (#) | 0 | 4,448 | 4,448 | 1,000 | 5,448 | |||||
Attendance 2021 | Years* | |||||
 | ||
Imperial Oil Limited Ownership and Value of Equity (a) (b) (c) (d) | ||||||||||
IMO Common Shares (% of class) | IMO Deferred Share Units (DSU) | Total Vested Equity Holdings (Common + DSU) | Restricted Stock Units (RSU) | Total Holdings * (Common + DSU + RSU) | ||||||
Holdings as at February 15, 2022 (#) | 0 | 14,383 | 14,383 | 12,300 | 26,683 | |||||
Total market value as at February 15, 2022 ($) | 0 | 802,571 | 802,571 | 686,340 | 1,488,911 | |||||
Year over year change (#) | 0 | 3,470 | 3,470 | 3,300 | 6,770 | |||||
Attendance 2021 | Years* | |||||
 | ||
Imperial Oil Limited Ownership and Value of Equity (a) (b) (c) (d) | ||||||||||
IMO Common Shares (% of class) | IMO Deferred Share Units (DSU) | Total Vested Equity Holdings (Common + DSU) | Restricted Stock Units (RSU) | Total Holdings * (Common + DSU + RSU) | ||||||
Holdings as at February 15, 2022 (#) | 1,000 (<0.01%) | 46,530 | 47,530 | 17,200 | 64,730 | |||||
Total market value as at February 15, 2022 ($) | 55,800 | 2,596,374 | 2,652,174 | 959,760 | 3,611,934 | |||||
Year over year change (#) | 0 | 4,325 | 4,325 | 1,000 | 5,325 | |||||
 | ||
Imperial Oil Limited Ownership and Value of Equity (a) (b) (c) (d) | ||||||||||
IMO Common Shares (% of class) | IMO Deferred Share Units (DSU) | Total Vested Equity Holdings (Common + DSU) | Restricted Stock Units (RSU) | Total Holdings * (Common + DSU + RSU) | ||||||
Holdings as at February 15, 2022 (#) | 55,000 (<0.01%) | 43,636 | 98,636 | 17,200 | 115,836 | |||||
Total market value as at February 15, 2022 ($) | 3,069,000 | 2,434,889 | 5,503,889 | 959,760 �� | 6,463,649 | |||||
Year over year change (#) | 0 | 4,248 | 4,248 | 1,000 | 5,248 | |||||
(a)The information includes the beneficial ownership of common shares of Imperial Oil Limited, which information not being within the knowledge of the company has been provided by the nominees individually.
(b)The company’s plan for restricted stock units for nonemployee directors is described on page 144. The company’s plan for deferred share units for nonemployee directors is described on page 143. The company’s plan for restricted stock units for selected employees is described on page 164.
(c)The numbers for the company’s restricted stock units represent the total of the outstanding restricted stock units received in 2017 through 2023 and deferred share units received since directors’ appointment.
(d)The value for Imperial Oil Limited common shares, deferred share units and restricted stock units is based on the closing price for Imperial Oil Limited common shares on the Toronto Stock Exchange of $81.30 on February 15, 2024.
Director and nominee holdings in Exxon Mobil Corporation (a)
Director | XOM Common Shares (#) | XOM Restricted Stock (#) (b) | Total Common Shares and Restricted Stock (#) | Total Market Value of Common Shares and Restricted Stock ($) (c) | ||||
B.W. Corson | 114,686 | 88,000 | 202,686 | 20,140,312 | ||||
M.R. Crocker | 15,938 | 102,250 | 118,188 | 11,743,994 | ||||
D.S. Sutherland | 5,730 | - | 5,730 | 569,373 | ||||
| Director | XOM Common Shares (#) | XOM Restricted Stock (#) (b) | Total Common Shares and Restricted Stock (#) | Total Market Value of Common Shares and Restricted Stock ($) (c) | ||||||||||
| B.W. Corson | 129,044 | 59,700 | 188,744 | 26,417,156 | ||||||||||
M.R. Crocker (d) | 22,433 | 149,000 | 171,433 | 23,994,258 | ||||||||||
| N.A. Hansen | — | 155,800 | 155,800 | 21,806,218 | ||||||||||
(a)Holdings as at February 15, 2024. The information includes the beneficial ownership of common shares of Exxon Mobil Corporation, which information not being within the knowledge of the company has been provided by the nominees and directors individually. None of these individuals own more than 0.01 percent of the outstanding shares of Exxon Mobil Corporation. D.W. Cornhill, S.R. Driscoll, J.N. Floren, G.J. Goldberg and M.C. Hubbs do not own common shares or hold restricted stock of Exxon Mobil Corporation.
(b)The numbers for Exxon Mobil Corporation restricted stock include outstanding restricted stock and restricted stock units granted under its restricted stock plan which is similar to the company’s restricted stock unit plan.
(c)The value for Exxon Mobil Corporation common shares and restricted stock is based on the closing price for Exxon Mobil Corporation common shares on the New York Stock Exchange of $103.73 U.S., which is converted to Canadian dollars at the daily rate of exchange of $1.3493 provided by the Bank of Canada for February 15, 2024. (d)M.R. Crocker is a current director and has chosen not to stand for re-election. Mr. Crocker does not hold any Imperial Oil Limited common shares, restricted stock units or deferred share units. |
Majority voting policy
In 2022, amendments to the Canada Business Corporations Act came into force implementing majority voting requirements for uncontested director elections. These amendments provide for the election of a director only if the number of “for” votes represents a majority of the votes cast both “for” and “against” the director. Following the implementation of these amendments, the company’s existing majority voting policy was rendered redundant and was revoked by the board.
117
Corporate governance disclosure
| Table of contents | |||||
| Corporate governance disclosure | |||||
| 2023 Corporate governance highlights | |||||
| Corporate governance at a glance | |||||
| Statement of corporate governance practice | |||||
| Composition of our board nominees | |||||
| Tenure of our board nominees | |||||
| Skills and experience of our board members and nominees | |||||
| Independence of our board members and nominees | |||||
| Committee membership of our board | |||||
| Number of meetings | |||||
| Attendance of our board members in 2023 | |||||
| Other public company directorships of our board members and nominees | |||||
| Interlocking directorships of our board nominees | |||||
| Director qualification and selection process | |||||
| Director orientation, education and development | |||||
| Board performance assessment | |||||
| Board and committee structure | |||||
| Director compensation | |||||
| Director compensation table | |||||
| Outstanding share-based awards and option-based awards for directors | |||||
| Incentive plan awards for directors - Value vested or earned during the year | |||||
| Share ownership guidelines of independent directors and chairman, president and chief executive officer | |||||
| Ethical business conduct | |||||
| Restrictions on insider trading | |||||
| Diversity | |||||
| Shareholder engagement | |||||
| Largest shareholder | |||||
| Transactions with Exxon Mobil Corporation | |||||
| 2023 Corporate governance highlights | ||||||||||||||
•Five of seven of our directors and our director nominees are independent and meet the criteria for independence set by Canadian securities regulators, the SEC and the NYSE American LLC.
•The company delivered extensive orientation programs to better align with the Canadian Coalition for Good Governance’s policy, “Governance Differences of Equity Controlled Corporations”, in 2012,S.R. Driscoll, J.N. Floren and G.J. Goldberg upon their election to the board for the first time in 2023.
•The directors are highly qualified with diversity of gender, background, experience and skill.
•The company’s independent directors have significant stock ownership requirements, all of which have been met (S.R. Driscoll, J.N. Floren and G.J. Goldberg were each elected to the board on May 2, 2023 and are expected to meet the share ownership guidelines within five years from the date of their appointment). The independent directors collectively have nearly $7.8 million in shareholdings in the company.
•The independent directors regularly meet in executive sessions without management present.
•Shares of the company passed a resolution adopting a majority voting policy. Asare listed on the TSX and trade on the NYSE American LLC and our corporate governance practices comply with applicable policies and practices of each exchange.
•97% average vote in favour for the election of our directors at the 2023 annual meeting.
•Two of seven or 29% of the datedirector nominees, and 10 of this circular, Exxon Mobil Corporation holds 69.6 percent23 or 43% of the company’s shares. If Exxon Mobil Corporation’s shareholdings were ever to fall below 50 percent, the company’s policy provides that for anynon-contestedelection of directors, any director nominee who receives a greater number of votes “withheld” from his or her election than votes “for” in such election shall tender his or her resignation. Within 90 days after certificationexecutive officers of the election results, the board of directors will decide, through a process managed by the nominationscompany and corporate governance committee and excluding the nominee in question, whether to accept the resignation. Absent a compelling reason for the director to remain on the board, the board shall accept the resignation. The board will promptly disclose its decision and, if applicable, the reasons for rejecting the tendered resignation.major subsidiaries, are women.
Corporate governance at a glance | |||||||
| Controlled company | Yes | ||||||
Size of board | 7 | ||||||
Number of independent directors | 5 | ||||||
Women on board | 2 | ||||||
Average attendance of directors at board and committee meetings | |||||||
| Lead director | Yes | ||||||
In camera sessions of independent directors at every board meeting | Yes | ||||||
Independent status of audit committee | 100% | ||||||
Audit committee members financially literate | All | ||||||
Independent status of executive resources committee | 83% | ||||||
Independent status of nominations and corporate governance committee | 83% | ||||||
Majority of independent directors on all committees | Yes | ||||||
Individual director elections | Yes | ||||||
Average tenure of director nominees (approximate) | |||||||
Average age of director nominees (approximate) | |||||||
Mandatory retirement age | 72 years | ||||||
Separate board chair and CEO | No | ||||||
Number of board interlocks | None | ||||||
No director serves on more than two boards of another reporting issuer | Yes | ||||||
Share ownership requirements for independent directors | Yes | ||||||
Share ownership requirements for chairman and chief executive officer | Yes | ||||||
Board orientation and education program | Yes | ||||||
Code of business conduct and ethics | Yes | ||||||
Board and committee charters | Yes | ||||||
Position descriptions for the chairman and chief executive officer, lead director and the chair of each committee | Yes | ||||||
Skills matrix for directors | Yes | ||||||
Annual board evaluation process | Yes | ||||||
Annual advisory vote on executive compensation | No | ||||||
| Dual-class shares | No | ||||||
Change of control agreements | No | ||||||
Statement of corporate governance practice
The company continually reviews its governance practices and monitors regulatory changes. | ||
This section provides information pertaining to our board, the committees of the board, ethics, diversity and shareholder engagement. The company is committed to high corporate governance standards and best practices. The company’s corporate governance policies and practices comply with and in most cases exceed the requirements of(NI(NP(NI
National Instrument
52-110
Audit Committees (NI 52-110),
National Policy
58-201
Corporate Governance Guidelines (NP 58-201)
andNational Instrument
58-101
Disclosure of Corporate Governance Practices (NI 58-101).
The company’s common shares trade on the Toronto Stock Exchange and the NYSE American LLC and our corporate governance practices reflect the standards of these exchanges. In accordance with NYSE American LLC requirements fornon-U.S.
companies, the company is in compliance with NYSE American standards in all significant respects except as described on the company’s website atwww.imperialoil.ca.
Composition of our board nominees


More information on diversity, including on the board and among executive officers of the company, can be found at page 146.151.
Tenure of our board nominees
The board charter provides that incumbent directors will not beK.T. Hoeg and D.S. Sutherland have reached the company’s mandatory retirement age for directors in 2022. However, the ongoingCOVID-19pandemic has given rise to a rapidly evolving business environment, has created new challenges in relation to health, safety, and operational integrity, and has impacted the timing and progress of the board’s director recruitment process. Given these exceptional circumstances, the board recognizes the value of stability and continuity as these challenges continue to evolve. Therefore, at the request of the chairman and in accordance with the board charter, the nominations and corporate governance committee supported, and the board approved, Ms. Hoeg and Mr. Sutherland’s nomination forre-electionfor one further year. Following the annual meeting of shareholders, the company will continue its director recruitment process and any announcements of new directors will be made as they are available.
re-nominated
if they have attained the age of 72, except under exceptional circumstances and at the request of the chairman. The company does not have term limits for independent directors because it values the comprehensive knowledge of the company that long serving directors possess and independent directors are expected to remain qualified to serve for a minimum of five years.
The following chart shows the current years of service of the nominees for the board of directors and the year they would normally be expected to retire from the board.
Name of director nominee | Years of service on the board | Year of expected retirement from the board for independent directors | ||||||||
| D.W. Cornhill | 6 years | 2026 | ||||||||
| B.W. Corson | 4 years | |||||||||
| S.R. Driscoll | 1 year | |||||||||
| J.N. Floren | 1 year | 2031 | ||||||||
| G.J. Goldberg | 1 year | 2031 | ||||||||
| — | ||||||||||
M.C. Hubbs | 2039 | |||||||||
(a)N.A. Hansen is being nominated for election as a director at the annual meeting of shareholders and is not currently a director.
Skills and experience of our board members and nominees
Our directors and nominees bring a wide range of skills, diversity and experience. | ||
The current directors and director nominees collectively have the experience and expertise required to ensure effective oversight, stewardship and governance of the company. The key areas of experience and skills for each of the nominees for election as directors can also be found in each of the nomineesdirector nominee tables on pages 112113 through 115117 of this circular.
The table below sets out the diverse skill set required of the board and identifies the particular experience, qualifications, attributes, and skills of each director and nominee that led the board to conclude that such person should serve as a director of the company.
D.W. Cornhill | B.W. Cornhill Corson | M.R. Crocker (a) | S.R. Corson | J.N. Floren | G.J. Crocker | N.A. Hansen (b) | M.C. Hoeg | Mintz | Sutherland | |||||||||||||||||||||||||
Leadership of large organizations | ü | ü | ü | ü | ||||||||||||||||||||||||||||||
Operations / technical | ü | ü | ü | ü | ||||||||||||||||||||||||||||||
| Project management | ü | ü | ü | ü | ü | ü | ü | |||||||||||||||||||||||||||
| Global experience | ü | ü | ü | ü | ü | ü | ü | |||||||||||||||||||||||||||
| Strategy development | ü | ü | ü | ü | ü | ü | ü | ü | ||||||||||||||||||||||||||
Environment and sustainability | ü | ü | ü | ü | ||||||||||||||||||||||||||||||
Audit committee financial expert | ü | ü | ||||||||||||||||||||||||||||||||
| Financial expertise | ü | ü | ü | ü | ü | ü | ü | ü | ||||||||||||||||||||||||||
| ü | ü | ü | ||||||||||||||||||||||||||||||||
Information technology / cybersecurity oversight | ü | ü | ||||||||||||||||||||||||||||||||
| Executive compensation | ü | ü | ü | ü | ü | ü | ü | ü | ||||||||||||||||||||||||||
Risk management | ü | ü | ü | ü | ||||||||||||||||||||||||||||||
(a)M.R. Crocker is a current director and has chosen not to stand for re-election at the annual meeting of shareholders.
(b)N.A. Hansen is not currently a director and is being nominated for election as a director at the annual meeting of shareholders.
Independence of our board members and nominees
Five out of seven of the director nominees are independent. | ||
The board is currently composed of seven directors, allsix of whom will be standing forMay 3, 2022.April 30, 2024. M.R. Crocker is a current director and has chosen not to stand for re-election. N.A. Hansen is not currently a director and is being nominated for election as a director. The majority of the board and nominees (five out of seven) are independent. The independent directors and nominees are not employees of the company.
re-election
at the annual meeting of shareholders on The board determines independence on the basis of the standards specified by(NIthe U.S. Securities and Exchange Commission rules and the listing standards of the NYSE American LLC. The board has reviewed relevant relationships between the company and each nonemployee director and director nominee to determine compliance with these standards.
National Instrument
52-110
Audit Committees52-110)
,
Based on the directors’ responses to an annual questionnaire, the board determined that none of the independent directors has any interest, business or other relationship that could or could reasonably be perceived to constitute a material relationship with the company. B.W. Corson is a director and chairman, president and chief executive officer of the company and not considered to be independent. The board believes that Mr. Corson’s extensive knowledge of the business of the company and Exxon Mobil Corporation is beneficial to the other directors and his participation enhances the effectiveness of the board.
M.R. Crocker is also ahistheir employment, can be viewed as independent of the company’s management and that histheir ability to reflect the perspective of the company’s shareholders enhances the effectiveness of the board.
non-independent
director as he is an employee of Exxon Mobil Corporation. Mr. Crocker has chosen not to stand for re-election at the annual meeting of shareholders. Director nominee, N.A. Hansen, holds the position of senior vice-president, energy products at ExxonMobil Product Solutions Company, a division of Exxon Mobil Corporation, and if elected will also be a non-independent director. The company believes that Mr. Crocker and Mr. Hansen, although deemednon-independent
under the relevant standards by virtue of Name of director (a) and/or nominee | Management | Independent | Not independent | independent | Reason for non-independent status | |||||||||||||||
D.W. Cornhill | ü | |||||||||||||||||||
B.W. Corson | ü | ü | B.W. Corson is a director and chairman, president and chief executive officer of Imperial Oil Limited. | |||||||||||||||||
M.R. Crocker (a) | ü | M.R. Crocker is an employee of Exxon Mobil Corporation. | ||||||||||||||||||
| S.R. Driscoll | ü | |||||||||||||||||||
| J.N. Floren | ü | |||||||||||||||||||
| G.J. Goldberg | ü | |||||||||||||||||||
N.A. Hansen (b) | ü | N.A. Hansen is an employee of Exxon Mobil Corporation. | ||||||||||||||||||
M.C. Hubbs | ü | |||||||||||||||||||
(a)M.R. Crocker is a current director and has chosen not to stand for re-election at the annual meeting of shareholders.
(b)N.A. Hansen is not currently a director and is being nominated for election as a director at the annual meeting of shareholders.
Committee membership of our board
Each standing committee is chaired by a different independent director and all of the independent directors are members of each committee. | ||
The chart below shows the company’s current standing committee memberships and the chair of each committee.
| Director | Nominations and corporate governance committee | Audit committee (b) | Safety and sustainabilitycommittee (d) | Executive resources committee | Finance committee (d) | |||||||||||||||||||||
D.W. Cornhill (c) | ü | ü | ü | ü | ü Chair | |||||||||||||||||||||
| — | and corporate governance committee | — | committee (b) | and corporate responsibility committee | resources committee | collaboration and engagement committee | ||||||||||||||||||||
| — | ||||||||||||||||||||||||||
| ü | ü | |||||||||||||||||||||||||
| ü | ||||||||||||||||||||||||||
| ü | Chair | ü | ||||||||||||||||||||||||
| ü | ||||||||||||||||||||||||||
| ü | ü | Chair | ü | |||||||||||||||||||||||
| G.J. Goldberg | ü | ü | ü | ü Chair | ||||||||||||||||||||||
| ü | ||||||||||||||||||||||||||
M.C. Hubbs (c) | ||||||||||||||||||||||||||
ü | ü | ü | ü | ü | ||||||||||||
(a)Not independent directors. M.R. Crocker is a current director and has chosen not to stand for re-election.
(b)All members of the audit committee are independent and financially literate within the meaning of National Instrument 52-110 Audit Committees and the listing standards of the NYSE American LLC.
(c)Audit committee financial experts under U.S. regulatory requirements.
(d)In May 2023, the board of directors approved the creation of the finance committee, and dissolved the community collaboration and engagement committee with the ongoing responsibilities of this committee being assumed by the safety and sustainability committee. There were no meetings of the community collaboration and engagement committee in 2023 prior to its dissolution.
In addition to its standing committees, the board may establish ad hoc committees or special committees from time to time. On September 30, 2021, aOne special committee of independent directors was createdestablished in September, 2022 and remained active during 2023 for the purposes of considering certain matters. The special committee iswas chaired by D.W. Cornhillconsists consisted of the five independent directors. The special committee was dissolved in February, 2024.
and
124
Number of meetings
The chart below shows the number of board and standing committee meetings held in 2021.2023. This includes seven regular meetings and threeone additional special meetingsmeeting of the board. Due to public health recommendations and restrictions related toCOVID-19and for the health and safety of our directors and employees, all meetings in 2021 were conducted virtually. More information on the board’s activities in relation toCOVID-19can be found in the Risk oversight section starting on page 129.
Meetings of the board and standing committees in 2021:2023:

(a)In February 2023, the public policy and corporate responsibility committee was changed to the safety and sustainability committee.
(b)In May 2023, the board of directors approved the creation of the finance committee, and dissolved the community collaboration and engagement committee with the ongoing responsibilities of this committee being assumed by the safety and sustainability committee. There were no meetings of the community collaboration and engagement committee in 2023 prior to its dissolution.
Board 10 | ||||||||
| Audit committee | Executive resources committee | Public policy and corporate responsibility committee | Nominations and corporate governance committee | Community collaboration and engagement committee | ||||
5 | 6 | 3 | 7 | 1 | ||||
Attendance of our board members in 2021
The following chart provides a summary of the attendance record of each of the directors in 2021.2023. The attendance record of each director nominee is also set out in his or hertheir biographical information on pages 112 through 115.within the nominee section. The attendance chart also provides an overall view of the attendance per standing committee. Senior management directors and other members of management periodically attend standing committee meetings at the request of the committee chair.
Director | Board | Audit committee | Executive resources committee | Safety and sustainability committee (a)(b) | Nominations and corporate governance committee | Finance committee (b) | Annual meeting | Total | Percentage by director | ||||||||||||||||||||
| D.W. Cornhill | 8 of 8 | 5 of 5 | 8 of 8 | 5 of 5 | 6 of 6 | 5 of 5 (chair) | 1 of 1 | 38 of 38 | 100% | ||||||||||||||||||||
| B.W. Corson | 8 of 8 (chair) | — | — | — | — | — | 1 of 1 | 9 of 9 | 100% | ||||||||||||||||||||
| M.R. Crocker | 8 of 8 | — | 8 of 8 | 5 of 5 | 6 of 6 | 5 of 5 | 1 of 1 | 33 of 33 | 100% | ||||||||||||||||||||
S.R. Driscoll (c) | 4 of 4 | 2 of 2 (chair) | 5 of 5 | 4 of 4 | 3 of 3 | 5 of 5 | 1 of 1 | 24 of 24 | 100% | ||||||||||||||||||||
J.N. Floren (c) | 4 of 4 | 2 of 2 | 5 of 5 | 4 of 4 (chair) | 3 of 3 | 5 of 5 | 1 of 1 | 24 of 24 | 100% | ||||||||||||||||||||
G.J. Goldberg (c) | 4 of 4 | 2 of 2 | 5 of 5 (chair) | 4 of 4 | 3 of 3 | 5 of 5 | 1 of 1 | 24 of 24 | 100% | ||||||||||||||||||||
K.T. Hoeg (d) | 3 of 3 | 3 of 3 | 3 of 3 | 1 of 1 | 3 of 3 | — | 1 of 1 | 14 of 14 | 100% | ||||||||||||||||||||
| M.C. Hubbs | 8 of 8 | 5 of 5 | 7 of 8 | 5 of 5 | 5 of 6 (chair) | 5 of 5 | 1 of 1 | 36 of 38 | 95% | ||||||||||||||||||||
J.M. Mintz (d) | 3 of 3 | 3 of 3 | 3 of 3 | 1 of 1 | 3 of 3 | — | 1 of 1 | 14 of 14 | 100% | ||||||||||||||||||||
D.S. Sutherland (d) | 2 of 3 | 2 of 3 | 2 of 3 | 1 of 1 | 2 of 3 | — | 1 of 1 | 10 of 14 | 71% | ||||||||||||||||||||
Percentage by committee | 98% | 96% | 96% | 100% | 94% | 100% | 100% | 226 of 232 | Overall attendance 97% | ||||||||||||||||||||
(a)In February 2023, the public policy and corporate responsibility committee was changed to the safety and sustainability committee.
(b)In May 2023, the board of directors approved the creation of the finance committee, and dissolved the community collaboration and engagement committee with the ongoing responsibilities of this committee being assumed by the safety and sustainability committee. There were no meetings of the community collaboration and engagement committee in 2023 prior to its dissolution.
(c)S.R. Driscoll, J.N. Floren and G.J. Goldberg were elected to the board and its committees on May 2, 2023.
(d)K.T. Hoeg, J.M. Mintz and D.S. Sutherland retired from the board and its committees on May 2, 2023. Prior to retirement, K.T. Hoeg was the chair of the audit committee, J.M. Mintz was the chair of the safety and sustainability committee, and D.S. Sutherland was the chair of the executive resources committee.
Director | Board | Audit committee | Executive resources committee | Public policy and corporate responsibility committee | Nominations and corporate governance committee | Community collaboration and engagement committee | Annual meeting | Total | Percentage by director | |||||||||||||||||||||||||
D.C. Brownell (a) | 4 of 4 | - | 3 of 3 | 1 of 1 | 2 of 2 | - | 1 of 1 | 11 of 11 | 100% | |||||||||||||||||||||||||
D.W. Cornhill | 10 of 10 | 5 of 5 | 6 of 6 | 3 of 3 | 7 of 7 (chair) | 1 of 1 | 1 of 1 | 33 of 33 | 100% | |||||||||||||||||||||||||
B.W. Corson | 10 of 10 (chair) | - | - | - | - | 1 of 1 | 1 of 1 | 12 of 12 | 100% | |||||||||||||||||||||||||
M.R. Crocker (b) | 6 of 6 | - | 3 of 3 | 2 of 2 | 5 of 5 | 1 of 1 | - | 17 of 17 | 100% | |||||||||||||||||||||||||
K.T. Hoeg | 10 of 10 | 5 of 5 (chair) | 6 of 6 | 3 of 3 | 7 of 7 | 1 of 1 | 1 of 1 | 33 of 33 | 100% | |||||||||||||||||||||||||
M.C. Hubbs | 10 of 10 | 5 of 5 | 6 of 6 | 3 of 3 | 7 of 7 | 1 of 1 (chair) | 1 of 1 | 33 of 33 | 100% | |||||||||||||||||||||||||
J.M. Mintz | 10 of 10 | 5 of 5 | 6 of 6 | 3 of 3 (chair) | 7 of 7 | 1 of 1 | 1 of 1 | 33 of 33 | 100% | |||||||||||||||||||||||||
D.S. Sutherland | 10 of 10 | 5 of 5 | 6 of 6 (chair) | 3 of 3 | 7 of 7 | 1 of 1 | 1 of 1 | 33 of 33 | 100% | |||||||||||||||||||||||||
Percentage by committee | 100% | 100% | 100% | 100% | 100% | 100% | 100% | 205 of 205 | Overall attendance 100% | |||||||||||||||||||||||||
Other public company directorships of our board members and nominees
No director or nominee serves on more than two boards of another reporting issuer. | ||
The following table shows which directors and nominees serve on the boards of other reporting issuers and the committee memberships in those companies.
Name of director | Other reporting issuers of which director or nominee is also a director | Type of company | Stock symbol: Exchange | symbol: Exchange | Committee appointments | ||||||||||||||
| D.W. Cornhill | AltaGas Ltd. | Diversified energy company | ALA:TSX | Environment, health and safety committee | |||||||||||||||
| B.W. Corson | — | — | — | — | |||||||||||||||
| — | — | ||||||||||||||||||
| S.R. Driscoll | Empire Company Limited | Food retailing | EMP.A:TSX | ||||||||||||||||
| Audit committee | |||||||||||||||||||
| (chair), Nominating committee, and Corporate governance and social responsibility committee | |||||||||||||||||||
| Gildan Activewear Inc. | Apparel and Luxury | GIL:TSX | Audit and finance committee, Compensation and human resources committee | ||||||||||||||||
| J.N. Floren | West Fraser Timber Co. Ltd | Basic Materials- Forest Products | WFG:TSX | Health, safety and environment committee (chair), Human resources and compensation committee, and Governance and nominating committee | |||||||||||||||
| G.J. Goldberg | BHP Group Limited | Basic Materials- Other industrial Metals and mining | BHP:ASX | Sustainability committee (chair) and Nominations and governance committee | |||||||||||||||
N.A. Hansen (b) | — | — | — | — | |||||||||||||||
| M.C. Hubbs | Nutrien Ltd. | Fertilizer manufacturing | NTR:TSX, NYSE | Human resources and compensation committee and Safety and sustainability committee (chair) | |||||||||||||||
Steel Corporation | |||||||||||||||||||
(a)M.R. Crocker is a current director and has chosen not to stand for re-election at the annual meeting of shareholders.
(b)N.A. Hansen is not currently a director and is being nominated for election as a director at the annual meeting of shareholders.
Interlocking directorships of our board membersnominees
As of the date of this proxy circular, there are no interlocking public company directorships among the directors listed in this circular.
nominees.Director qualification and selection process
The nominations and corporate governance committee is responsible for identifying and recommending new candidates for board nomination. The committee identifies candidates from a number of sources, including executive search firms and referrals from existing directors. The process for selection is described in paragraph 1011 (a) of the Board of Directors Charter found in Appendix A of this circular. The committee will consider potential future candidates as required.
In considering the qualifications of potential nominees for election as directors, the nominations and corporate governance committee considers the work experience and other areas of expertise of the potential nominees, with the objective of providing for diversity among the nonemployee directors. The following key criteria are considered to be relevant to the work of the board of directors and its committees:
Work experience
•Experience in leadership of businesses or other large organizations (Leadership of large organizations)
•Operations/technical experience (Operations / technical)
•Project management experience (Project management)
•Experience in working in a global work environment (Global experience)
•Experience in development of business strategy (Strategy development)
•Experience with environmental, health, community relations and/or safety policy, practices and management (Environment and sustainability)
Other expertise
•Audit committee financial expert (also see the financial expert section in the audit committee table starting on page 137)
•Expertise in financial matters (Financial expertise)
•Expertise in managing relations with government (Government relations)
•Expertise in information technology and cybersecurity oversight (Information technology / cybersecurity oversight)
•Expertise in executive compensation policies and practices (Executive compensation)
•Expertise in oversight of risk management policies and practices (Risk management)
The nominations and corporate governance committee may consider the following additional factors in assessing potential nominees:
•possessing expertise in any of the following areas: law, science, marketing, administration, social/political environment or community and civic affairs;
•individual competencies in business and other areas of endeavour in contributing to the collective experience of the directors; and
•providing diversity of age, regional association, gender and other diversity elements (including Aboriginal peoples, persons with disabilities and members of visible minorities).
The nominations and corporate governance committee assesses the work experience and other expertise each existing director possesses and whether the candidate is able to fill any gaps in such experience, expertise and diversity of age, regional association, gender and other diversity elements. More detailed information on diversity of the board, including in connection with the director recruitment process that was completed in 2023, can be found at page 151. Consideration is also given to whether candidates possess the ability to contribute to the broad range of issues with which the board and its committees must deal, are able to devote the necessary amount of time to prepare for and attend board and committee meetings and are free of any potential legal impediment or conflict of interest.
Candidates are expected to remain qualified to serve for a minimum of five years and independent directors are expected to achieve ownership of no less than 16,500 common shares, deferred share units and restricted share units within five years of becoming an independent director.
When the committee is recommending candidates for1011 (b) of the Board of Directors Charter found in Appendix A of this circular. Candidates for
re-nomination,
it assesses such candidates against the criteria forre-nomination
as set out in paragraph re-nomination
are expected not to change their principal position, the thrust of their involvement or their regional association in a way that would significantly detract from their value as a director of the corporation. They are also expected to continue to be compatible with the criteria that led to their selection as nominees. Under exceptional circumstances, the nominations andcorporate governance committee, on the request of the chairman, may continue to support the nomination of a director who has attained the mandatory retirement age.
128
Director orientation, education and development
The company regularly provides in-depth presentations to the directors on relevantand emerging issues and encourages continuing education opportunities. | ||
The corporate secretary organizes an orientation program for all new directors. In a series of meetings over several days, new directors are briefed by staff and functional managers on all significant areas of the company’s operations, industry specific topics, risk oversight and regulatory issues. New directors are also briefed on significant company policies, organizational structure, security, information technology management and on critical planning and reserves processes. They also receive key governance and disclosure documents and a comprehensive board manual which contains a record of historical information about the company,
by-laws,
company policies, the charters of the board and its committees, other relevant company business information, information on directors’ duties and additional board related activities and calendars. Shortly after their election to the board, S.R. Driscoll, J.N. Floren and G.J. Goldberg completed an extensive orientation program with the company’s corporate secretary and senior managers of various departments. Each new director participated in comprehensive onboarding sessions, including in-depth reviews of the company’s history, culture, practices, businesses and operations, risk framework, and ethics and other foundational policies, and in-depth reviews of legal and regulatory requirements, the Canadian climate framework, the company's emissions profile, emissions-related targets and plans for achieving such targets, and energy industry dynamics in general. With N.A. Hansen being nominated for election for the first time this year, the corporate secretary plans to provide an orientation shortly after his election to the board.Board and committee members participate in continuing education and maintain oversight over company operations through regular presentations by management, which focus on providing and discussing moreDue to public health recommendations and restrictions related toCOVID-19,aThese site visit was not possible in 2021. The board continued to engage with management on pandemic specific topics such as response and mitigation plans and actions, health and safety initiatives, site-specific issues and strategic financialvisits help directors better understand the strengths and business actions in responseopportunities unique to various operations and markets across the country, and enhance the board’s perspective of the integrated nature of the company’s business. In 2023, the board visited the Calgary research centre ("CRC"), the Kearl site and the Strathcona refinery, for a tour of the facilities and discussions specific to the pandemic. More information onoperations and research at CRC, Strathcona and Kearl, including reviewing the board’s activitiesmitigations and community engagement in relation torespect of the Kearl environmental protection order.
in-depth
information about key aspects of the business. Subject to exceptional circumstances, each year the board has an extended meeting that focuses on a particular area of the company’s operations and includes a visit to one or more of the company’s operating sites or a site of relevance. Throughout 2023, one way in the Risk oversight section starting on page 129.
129
With strong market conditions and business performance throughout the year, the board focused on strategic direction, operational priorities, capital allocation and prioritizing shareholder returns. This included reviews and approval of renewal and acceleration of the company's normal course issuer bid and the completion of one substantial issuer bid during the year.
The board also maintained oversight over the company’s various environmental, social and governance initiatives throughout the year, including considering and discussing the publication of the company’s advancing climate solutions and sustainability reports and reviewing the company's surplus site management process. There was a continued focus by the board on the company’s progress with emissions reduction initiatives, including the company’s continued participation in the Oil Sands Pathways to Net Zero initiative and setting and tracking emissions reduction goals. The board also undertook reviews of disclosure and emissions performance, safety performance, Canada climate policy updates and a review of the company's regulatory compliance framework and management system. Please see the Risk oversight section for more information on the board’s role in relation to the environment.
Members of ExxonMobil’s management also provide reviews of various aspects of ExxonMobil’s global business. In 2021,2023, the directors received a presentationconsidered presentations on ExxonMobil’s global internal audit process and strategy, cybersecurity, update, as well as an overview of ExxonMobil’s researchcorporate strategy, and development efforts.
its Global Outlook.The board members are canvassed as to whether there are any additional topics relevant to the board or to a specific committee that they would like to see addressed, and management schedules presentations covering these areas.areas for discussion. In addition, at every meeting the board receives an extensive update from the chairman, president and chief executive officer on business environment trends, relevant geopolitical activities, federal government priorities, key provincial issues and competitor activities, as appropriate.
Directors are encouraged to participate in other continuing education programs and events to ensure their skills and knowledge remain current.
In 2023, one or more directors participated in continuing education provided by third parties pertaining to, among other things, board oversight of climate change and the energy transition, corporate disclosures, corporate governance and ethics, risk management, cybersecurity, artificial intelligence and internal audit. Furthermore, the board recognizes the importance of the company's relationships with Indigenous communities and acknowledges the calls to action of the Truth and Reconciliation Commission of Canada, and all of the independent directors have completed the "4 Seasons of Reconciliation" course provided by the Indigenous Continuing Education Centre of the First Nations University of Canada.Board performance assessment
The board and its committees, as well as the performance of the directors, are assessed on an annual basis. For 2021,2023, the directors engaged in a performance assessment with the chairman, president and chief executive officer, which includes discussion and evaluation of the board and each committee’s effectiveness in various areas. The chairman, president and chief executive officer also meets regularly with directors individually to discuss any outstanding issues. The nominations and corporate governance committee discuss a summary of these assessment outcomes in the first quarter of each year.
Beginning in 2024, the lead director and the chairman, president and chief executive officer will together lead the annual performance evaluation of the board. More information about the new lead director position can be found in the section that follows, under the heading “Board and committee structure — Leadership structure”.Board and committee structure
Leadership structure
The company has chosen to combine the positions of chairman, president and chief executive officer. The board believes the interests of all shareholders are best served at the present time through a leadership model with a combined chairman and chief executive officer position. position and an independent lead director selected by and from the independent directors.
130
Through more than 3840 years of experience with ExxonMobil and Imperial, the current chief executive officer possesses an
in-depth
knowledge of the evolving energy industry supply and demand fundamentals and the array of challenges to be faced by the company. The board believes that the extensive experience and other insights put the chief executive officer in the best position to provide broad leadership for the board as it considers strategy and exercises its fiduciary responsibilities. Further, the board has demonstrated its commitment and ability to provide independent oversight of management.In February 2024, the board established a lead director position to further enhance independent board leadership. D.W. Cornhill was appointed lead director. Prior to the formation of the lead director position, D.W. Cornhill provided leadership for the independent directors in his capacity as chair of the executive sessions of the board. It is normally expected that the same director will serve as lead director for a minimum of two years. The duties and responsibilities of the lead director include:
•provides feedback to the chairman;
•chairs meetings of the board in the absence of the chairman;
•reviews and approves the schedule and agenda for all board and committee meetings and reviews associated materials distributed to the directors;
•advises the chairman as to the quality, quantity and timeliness of information flows;
•working together with the chairman, oversees the annual performance evaluation of the board; and
•working together with the chair of the executive resources committee, oversees the annual performance review of the chief executive officer.
Compensation for the lead director is determined by the board on the recommendation of the nominations and corporate governance committee and will be reviewed annually. Presently, the board has established the compensation for acting as lead director at $45,000 per year. The position description of the lead director is fully described in paragraph 8 of the Board of Directors Charter attached as Appendix A.
Independent director executive sessions
The executive sessions of the board are in camera meetings of the independent directors and are held in conjunction with every board meeting. These meetings are held in the absence of management. The independent directors held teneight executive sessions in 2021.2023. Following the establishment of the lead director position in 2024, the executive sessions of the board are chaired by the lead director. The purposes of the executive sessions of the board include the following:following and are more fully described in paragraph 10 of the Board of Directors Charter attached as Appendix A:
•raising substantive issues that are more appropriately discussed in the absence of management;
•discussing the need to communicate to the chairman of the board any matter of concern raised by any committee or director;
•addressing issues raised but not resolved at meetings of the board and assessing any follow-up needs with the chairman of the board;
•discussing the quality, quantity, and timeliness of the flow of information from management that is necessary for the independent directors to effectively and responsibly perform their duties, and advising the chairman of the board of any changes required; and
•seeking feedback about board processes.
In camera sessions of the board committees
Various committees also regularly hold in camera sessions without management present. The audit committee regularly holds private sessions of the committee members as well as private meetings of the committee with each of the external auditor, the internal auditor and senior management as part of every regularly scheduled committee meeting.
131
Committee structure
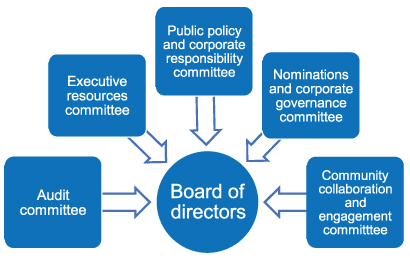


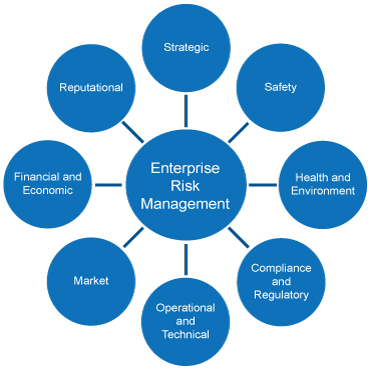


![Chris Leyerzapf 255[1].jpg](/files/10-K/0000049938-24-000010/imo-20231231_g32.jpg)