Technology and Infrastructure
Our technology platform combines internally developed, third-party and open-source software. This combination allows for rapid development and release of high-performance technology solutions in a cost-effective and scalable manner. Our websites mobile applications and supporting services, as well as our development and test environments, are hosted across industry-standard cloud providers such as Amazon Web Services and Google Cloud Platform. We use content delivery network solutions for fast, local access to our products. We use network, website, service and hardware-level monitoring, coupled with remote-content monitoring, to maintain a high level of uptime and availability for our systems with high-performance delivery.
Our Customers
Our insurance provider customers include insurance carriers and third-party insurance agents. Insurance carriers write auto, home and renters, and life insurance policies for consumers directly and through agents. Our marketplace consists of an extensive network of national and regional carriers as well as technology-enabled start-ups. Our two largest customers together accounted for 27% of our total revenue for the year ended December 31, 2023. We plan to continue to grow both the number of carriers participating in our marketplace and the level of participation from each carrier. Insurance agents deliver auto, home and renters, and life insurance to consumers on behalf of one or more carriers. As of December 31, 2023, we had approximately 6,500 enrolled insurance agencies on our platform. We are focused on further penetrating the large base of more than 100,000 insurance agencies in the United States.
6
Sales and Marketing
Our sales and marketing efforts are designed to increase engagement by both consumersinsurance providers and insurance providersconsumers and enhance their awareness of our company. Our marketing spend across channels is fundamentally algorithmic and performance based. Over time, we believe we will increase our brand equity and recognition as we serve more ad impressions. Additionally, we have built an efficient, consultative sales and customer success organization, which sells our marketplace referrals to insurance carriers and agencies and engages directly with consumers to sell life and health insurance policies.
Carrier sales and marketing.
Agent sales and marketing.
Competition
We face competition to attract consumers to our websites and mobile applications, as well as for insurance provider advertising and marketing spend.
Competition for insurance provider advertising and marketing spend. We compete for insurance providers’ advertising and marketing spend with other internet sites, performance marketers and online marketing service providers. We also compete with offline media, such as television, radio and direct mail. We believe we compete favorably on the basis of the scale and quality of our consumer referrals, our seamless handoff capability, our ability to align consumers with our providers’ preferences and business strategies and the targeting capabilities of our platform.
Competition for consumers.
Employees and Human Capital Resources
Our company culture is data-driven, entrepreneurial, diverse and innovative. As of DecemberJanuary 31, 2021,2024, we had 674384 employees, of which 671381 were full-time.
Our human capital is integral to our future success. For that reason, our human capital resources objectives include attracting, retaining, developing and motivating a diverse team of highly skilled employees at all levels. We value our employees and provide them with competitive cash compensation as well as opportunities for equity ownership. The principal purposes of our equity incentive plans are to attract, retain and motivate employees, consultants and directors through the granting of stock-based compensation awards in ways that encourage long-term retention and are aligned with the interests of our stockholders. We value our employees and regularly benchmark total rewards we provide, such as short- and long-term compensation, 401(k) contributions, health, welfare and quality of life benefits, paid time off and personal leave, against our industry peers to ensure we remain competitive and attractive to potential new hires. In addition, we regularly conduct employee surveys to gauge employee engagement and solicit feedback and enhance our understanding of the views of our employees, work environment and culture. The results from engagement surveys are used to implement programs and processes designed to enhance employee engagement and improve the employee experience.
7
Regulation
Various aspects of our business are, may become, or may be viewed by regulators from time to time as subject, directly or indirectly, to U.S. federal, state, and foreign laws and regulations. We are affected bysubject to laws and regulations that apply to businesses in general, such as those relating to worker classification, employment, payments, worker confidentiality obligations, consumer protection and the insurance industry, as well as to businesses operating on the internet and through mobile applications. This includes a continually expanding and evolving range of laws, regulations and standards that address financial services, information security, data protection, privacy and data collection, among other things. Wetaxation. As an online business, we are also subject to laws and regulations governing the internet, such as those relating to intellectual property ownership and infringement, trade secrets, the distribution of electronic communications, search engines, consumer privacy, and internet tracking technologies, and could be affected by potential changes to laws and regulations that affect the growth, popularity, or use of the internet, including with respect to net neutrality and taxation on the use of the internet or e-commerce transactions.
Because we work with consumer information and other data and engage in marketing and advertising activities conducted byvia telephone, email, mobile devices and text messages, we are also subject to laws and regulations that address privacy, data protection and collection, storing, sharing, use, disclosure, retention, security, protection transfer and other processing of personal information and other data, including the Internet, includingCalifornia Consumer Privacy Act, or CCPA, the California Privacy Rights Act, or CPRA, and other state privacy laws, the Controlling the Assault of Non-Solicited Pornography and Marketing Act, or CAN-SPAM Act, and the Telephone Consumer Protection Act of 1991, or TCPA. The burdens imposed by these and other laws and regulations currently in effect or that may be enacted, or new interpretation of existing laws and regulations, may require us to modify our data processing practices and policies and to incur substantial costs in order to comply. We take a variety of technical and organizational security measures and other measures to protect our data, including data pertaining to our consumers, employees, and business partners. Despite measures we put in place, we may be unable to anticipate or prevent unauthorized access to such data.
A substantial majority of the Telemarketing Sales Rule, the Controlling the Assault ofNon-SolicitedPornography and Marketing Act of 2003, the Health Insurance Portability and Accountability Act, and similar state laws. In addition,insurance carriers using our platform are P&C insurance carriers. As a result, we are a licensedaffected by laws and regulations relating to the insurance producer. Insuranceindustry, which is highly regulated byheavily regulated. While it is difficult to determine the statesimpact of potential reforms on our future business, it is possible that such changes in which we do business,industry regulation could affect our operations and we are required to comply with and maintain various licenses and approvals.demand for our platform. Because the laws and regulations governing insurance, financial services,the internet, privacy, data security, marketing, and marketinginsurance are constantly evolving and striving to keep pace with innovations in technology and media, it is possible that we may need to materially alter the way we conduct some parts of our business activities or be prohibited from conducting such activities altogether at some point in the future.
Intellectual Property
We seek to protect our intellectual property through a combination of copyrights, trademarks, service marks, domain names, trade secret laws, confidentiality procedures and contractual restrictions.
We have a number of registered and unregistered trademarks. We own federal registrations for trademarks including EVERQUOTE, as well as multiple pending applications. We will pursue additional trademark registrations to the extent we believe doing so would be beneficial to our competitive position.
We are the registered holder of a variety of domestic and international domain names that include “EverQuote” and similar variations.
In addition to relying on the protection provided by these intellectual property rights, we enter into confidentiality and proprietary rights agreements with our employees, consultants, contractors and business partners. Our employees and contractors are also subject to invention assignment agreements. We further control the use of our proprietary technology and intellectual property through provisions in both our general and specific terms of use on our website.
Our Corporate Information
We were incorporated in Delaware on August 1, 2008, under the name AdHarmonics, Inc., and changed our name to EverQuote, Inc. on November 17, 2014. Our principal executive offices are located at 210 Broadway, Cambridge, Massachusetts 02139, and our telephone number at that address is
8
Available Information
Our Internetinternet address is www.everquote.com. Our Annual Reports on
9
ITEM 1A. RISK FACTORS
Investing in our Class A common stock involves a high degree of risk. Certain factors may have a material adverse effect on our business, financial condition and results of operation. You should carefully consider the risks and uncertainties described below, together with all of the other information included in this Annual Report on
Risks Related to Our Business and Industry
Our business is dependenthighly subject to business cycles and risks related to the property and casualty insurance industries, and specifically automotive insurance. Adverse conditions in the insurance markets, as well as the general economy, could have a material adverse effect on our business, financial condition, and results of operations.
Because a substantial majority of the referrals made through our marketplace are for automotive insurance, our financial prospects depend significantly on the larger automotive industry ecosystem. Revenue from automotive insurance providers accounted for 79% and 80% of our total revenue for 2023 and 2022, respectively. Market cycles in the automotive insurance industry have been, and are expected to continue to be, unpredictable due to a variety of adverse conditions in the insurance industry that have been widely reported, such as deteriorating underwriting performance, a rise in claims, inflation, and inadequate policy premiums. Carriers may continue to decrease the amount of money they spend with us, which may occur rapidly and without warning, and for time periods that can be difficult to predict accurately. For example, in January 2023, we saw a major carrier return to higher spending patterns, but subsequently reduce customer acquisition spending starting in the second quarter of 2023 due to higher than expected claims losses. Customer reductions in marketing and advertising spend have materially and adversely affected our operating results, and we are not able to accurately predict the timing or extent of our recovery from these reductions. We will likely experience similar insurance industry cycles in the future, which could materially and adversely affect our business, financial condition, operating results, cash flows, and prospects.
We depend on relationships with insurance providersprovider customers with no long-term contractualminimum financial commitments. If insurance providers stop purchasing consumer referrals from us, decrease the amount they are willing toA reduction in spend per referral,by our customers, a loss of customers, lower advertising yields, or if we are unableour inability to establish and maintain new relationships with insurance providers could materially harm our business, results of operations and financial condition could be materially adversely affected.
A substantial majority of our revenue is derived from sales of qualified consumer inquiries sold as referrals in various ways, such as clicks, data and calls, to insurance providers, includingprovider customers, which includes both insurance carriers and agents. We generate revenue from carriers and agents that directly purchase referrals from us. We also generate revenue from carriers that make subsidy payments to us to offset their agents’ costs in buying referrals. Our relationships with insurance providersthose customers are dependent on our ability to deliver quality referrals at attractive volumes and prices. If insurance providers are not able to acquire their preferred referrals in our marketplace, they may stop buying referrals from us or may decrease the amount
The majority of our insurance providers are short-term agreements, and insurance providersprovider customers can stop participating in our marketplace or reduce or terminate their marketing spend with us at any time without notice. Furthermore, our agreements with no notice.these customers do not require them to spend any minimum amount. As a result, we cannot guarantee that insurance providers will continue to work with us, or, if they do, the number of referrals theywhat their advertising volume, pricing or total spend will purchase from us, the price they will pay per referral or their total spendbe with us. For example, we are currently experiencing, and expect to continue to experience, a decrease in autoexperienced significantly decreased insurance carrierprovider marketing spend which we believe is due to challenges in the auto insurance industry.2023. In addition, we may not be able to attract new insurance providers to our marketplace or increase the amount of revenue we earn from insurance providers over time.
Our carrier customers who make subsidy payments made by carriers to us on behalf of their agents. Our insurance carrier customers often provide subsidies for the benefit of agents to offset agents’ costs in connection with selling insurance policies from our referrals. Our carrier customers have no obligation to provide such subsidies and may reduce the amount of suchthese subsidies or cease providing them at any time. For example, one of our largest carrier customers discontinued payment of subsidies to us during the fourth quarter of 2023. This carrier resumed payment of certain subsidies in 2024, but there is no assurance that the carrier will continue to make these or any subsidy payments. If our carrier customers were to reduce the amounts of or cease providing such subsidies on behalf of their agents, our insurance agent customers may terminate or reduce the extent of their relationships with us. Because our insurance provider customers can stop buying from us,If agents decide to terminate or spend lessreduce their relationships with us at any time and our insurance carrier customers may cease providing subsidies to our insurance agent customers at any time, our business, results of operations and financial condition could be materially adversely affected with little to no notice.
10
We currently compete with numerous other online marketing companies, and we expect that competition will intensify. Some of these existing competitors may have more capital or complementary products or services than we do, and they may leverage their greater capital or diversification ingenerated a manner that adversely affects our competitive position. In addition, other newcomers, including major search engines and content aggregators, may be able to leverage their existing products and services to our disadvantage. We may be forced to expend significant resources to remain competitive with current and potential competitors. If any of our competitors are more successful than we are at attracting and retaining consumers, or if we are unable to effectively convert visits into consumers quote requests, our business, financial condition and results of operations could be materially adversely affected.
Revenue from our two largest insurance carrier customers was 27% and 22%32% in the aggregate of our revenue for the years ended December 31, 20212023 and 2020,2022, respectively. This customer made purchases from us under short-term agreements and may decrease or cease doing business with us at any time with no notice. As a result, weWe have no assurances that this customerthese carrier customers will continue to purchase from us at itstheir historical levels or at all. We have in fact experienced significant decreased levels of purchasing from both of these customers in 2023, including a decrease in subsidies by one of these carrier customers. If this customer were toeither or both of these two customers further reduce itstheir level of purchases from us or discontinue itstheir relationships with us, the loss could have a material adverse effect on our results of operations in both the short and long term.
We depend on third-party media sources, such as third-party publishers, including strategic partners, for a significant portion of our visitors. Any decline in the supply of media available through these third-party publishers’ websitespublishers for any reason, or increase in the price of this mediatheir prices could cause our revenue to decline or our cost to reachattract visitors to increase.
Our success depends on our ability to attract visitors to our websites or marketplace and solicit inquiries for insurance products and services that we monetize as referrals to our insurance provider customers. A significant portion of our revenue is attributable to visitor traffic originating from third-party publishers (including strategic partners).publishers. In many instances, third-party publishers can change the media inventory they make available to us, at any time in ways that could impact our results of operations. In addition, third-party publishers may place significant restrictions on our offerings. These restrictions may prohibit advertisements from specific clientscustomers or specific industries or restrict the use of certain creative content or formats. If a third-party publisher decides not to make its media channel or inventory available to us, or decides to demand a higher cost forrevenue share or places significant restrictions on the use of such inventory, we may not be able to find media inventory from other websites that satisfies our requirements in a timely and cost-effective manner. Consolidation of internet advertising networks and third-party publishers could eventually lead to a concentration of desirable inventory on websites or networks owned by a small number of individuals or entities, which could limit the supply or impact the pricing of inventory available to us. Additionally, third-party publishers may use advertising creatives that do not meet our compliance guidelines or that of our insurance provider customers, which could result in loss of revenue and reputational harm. As a result,If we may not be ableare unable to acquire media inventory that meets our insurance provider’scustomers’ performance, price and quality requirements, in which case our revenue couldwould decline or our operating costs couldwould increase.
We depend on internet search engines, display advertising, social media, online advertising and other sources to attract visitors to our website or marketplace, or to our third-party publishers’ websites. Changes in the health insurance marketsearch engine algorithms, including Google’s plans to phase out third-party cookies in Chrome, or in the variety, quality and affordabilityincreased usage of the insurance products offered by our insurance carrier partners could harm our business, operating results, financial condition and prospects.
We rely on internet search engines, display advertising, fees. If we are unable to maintain our current pricing structure due to competitive pressures, our revenue would likely be reduced and our financial results would be adversely affected.
If one or more of the search engines or other online sources on which we rely for purchased listings or visitor traffic modifies or terminates its relationship with us, our expenses could rise and we could lose visitor traffic to our websites. Visitor traffic to our websites and the volume of quote requests generated by visitor traffic varies and can decline from to adhere to or successfully implement appropriate processestime, and proceduresa decrease in response to existing regulations and changing regulatory requirements could result in significant legal and monetary liability, including fines and penalties, or damagetraffic to our reputation in the marketplace,or our third-party publishers’ websites, for any of whichreason, could have a material adverse effect on our business, financial condition and results of operations. Additionally, even if we are successful in generating such traffic, we may not be able to convert these visits into inquiries.
11
Limitations restricting our ability to market to users or collect and use data derived from user activities resulting from consumer-adopted technologies, service provider decisions, government regulation, or otherwise could significantly diminish the agents invalue of our marketplace are affiliated withservices and have an adverse effect on our ability to generate revenue.
Limitations restricting our ability to market to users via telephone calls, text messages and emails by service providers could harm our ability to deliver advertising. For example, if email service providers, or ESPs, categorize our emails as “promotional,” then these emails may be directed to an alternate and less readily accessible section of a limited number of insurance carriers.consumer’s inbox. In the event oneESPs materially limit or morehalt the delivery of these carriers no longer supports,our emails, or advises against, acquiring referralsif we fail to deliver emails to consumers in a manner compatible with ESPs’ email handling or authentication technologies, our marketplace,ability to contact consumers through email could be significantly restricted. In addition, if we are placed on “spam” lists or lists of entities that have been involved in sending unwanted, unsolicited emails, or if internet service providers prioritize or provide superior access to our competitors’ content, our business and results of operations may be adversely affected. Interruptions, failures or defects in our data collection systems, as well as data privacy and security concerns and regulatory changes or enforcement actions affecting our or our data partners’ ability to collect user data, could also limit our ability to analyze data from, and thereby optimize, our clients’ marketing campaigns. If our access to data is limited in the future, we may be unable to provide effective technologies and services to clients and we may lose clients and revenue.
Additionally, increased adoption of call blocking technology may prevent us from reaching consumers that have expressed an interest in getting insurance information. Moreover, telephone carriers and communication platforms have themselves placed restrictions on our ability to call or send text messages to our consumers. Increased government regulation may also restrict our ability to call or text consumers. For example, the Federal Communications Commission, or FCC, recently published a regulation, currently scheduled to take effect on July 24, 2024, that would require mobile wireless providers to block text messages from telephone numbers flagged by the FCC for allegedly sending unlawful text messages. If calls or text messages to our consumers are blocked, or if insurance providers obtaining data referrals have their calls or text messages blocked due to these call blocking technologies or restrictions, we may see a significant decrease in referrals, the value of our referrals and the number of data and call referrals we are able to sell to insurance providers, which could materially adversely impact our business.
If the way cookies are used or shared, or the use or transfer of cookies is restricted by third parties outside of our control or becomes subject to unfavorable legislation or regulation, our ability to develop and provide certain products or services could be affected.
When a user visits our websites, we use technologies, including “cookies,” to collect information such as the user’s IP address. We also have relationships with data partners that collect and provide us with user data. We access and analyze this information in order to determine the effectiveness of a marketing campaign and to determine how to modify the campaign for optimization. The use of cookies is the subject of litigation, regulatory scrutiny and industry self-regulatory activities, including the consideration of “do-not-track” technologies, guidelines and substitutes to cookies. With respect to industry self-regulatory activities, the leading web browsing companies have started or announced their intent to block or phase out third-party cookies from their web browsers, as discussed above in “—We depend on internet search engines, display advertising, social media, online advertising and other sources . . . .” Additionally, users are able to block or delete cookies from their browser. Periodically, certain of our customers and third-party publishers seek to prohibit or limit our collection or use of data derived from the use of cookies.
Our business could be materially and adversely affected by a cybersecurity breach or other attack involving our computer systems or our third-party service providers.
Cybersecurity incidents are increasing in frequency and evolving in nature and include, but are not limited to, installation of malicious software, ransomware, viruses, phishing attacks, denial of service or other attacks, breach by intentional or negligent conduct on the part of employees or third-party service providers including third-party publishers, unauthorized access to data and other electronic security breaches. Additionally, increased risks of cyberattacks or data breaches may result from the use of artificial intelligence, or AI, to launch more automated, targeted and coordinated attacks. Concerns about security increase when we transmit information (including personal data) electronically. Electronic transmissions can be subject to attack, interception, loss or corruption. In addition, computer viruses and malware can be distributed and spread rapidly over the internet and could infiltrate our systems or those of our buyers, sellers and third-party service providers. Although we are not aware of any material information security incidents to date, we have detected common types of attempts to access our information systems and data without authorization, such as phishing. Unauthorized access to our systems or those of our third-party service providers could in the future lead to disruptions in systems, accidental or unauthorized access to or disclosure, loss, destruction, disablement or encryption of, use or misuse of or modification of confidential or otherwise protected information (including personal data) and the corruption of data.
12
Any damage or failure that causes an interruption in our operations could have an adverse effect on our business, financial condition, operating results, cash flows and prospects. In addition, our operations are dependent upon our ability to protect the computer systems and network infrastructure that we utilize against damage from cybersecurity attacks by sophisticated third parties with substantial computing resources and capabilities and other disruptive problems caused by the internet or other users. Such disruptions could jeopardize the security of information stored in and transmitted through our computer systems and network infrastructure, which may result in significant liability and damage our reputation.
We take efforts to protect our systems and data, including establishing internal processes and implementing physical, administrative and technical safeguards designed to provide multiple layers of security, and contract with third-party service providers to take similar steps. However, it is difficult or impossible to defend against every risk being posed by changing technologies as well as criminals’ intent to commit cyber-crime, and these efforts may not be successful in preventing, detecting or stopping attacks. The increasing sophistication and resources of cyber criminals and other non-state threat actors and increased actions by nation-state actors make keeping up with new threats difficult and could result in a breach of security. Controls employed by our information technology department and our partners and third-party service providers, including cloud vendors, could prove inadequate. A breach of our security that results in unauthorized access to our data could expose us to a disruption or challenges relating to our daily operations, as well as to data loss, litigation, damages, fines and penalties, significant increases in compliance costs and reputational damage, any of which could have a material and adverse effect on our business, financial condition, operating results, cash flows and prospects.
To the extent our systems rely on our third-party service providers, through either a connection to, or an integration with, those third parties’ systems, the risk of cybersecurity attacks and loss, corruption, or unauthorized publication of our information or the confidential information of consumers and employees may increase. Third-party risks may include insufficient security measures, data location uncertainty, and the possibility of data storage in inappropriate jurisdictions where laws or security measures may be inadequate. Although we generally have agreements relating to cybersecurity and data privacy in place with our third-party service providers, they are limited in nature and we cannot assure you that such agreements will prevent the accidental or unauthorized access to or disclosure, loss, destruction, disablement or encryption of, use or misuse of or modification of data (including personal data) or enable us to obtain adequate or any reimbursement from our partners or third-party service providers in the event we should suffer any such incidents.
Any or all of the issues identified above could adversely affect our ability to attract or maintain relationships with customers or third-party publishers and could cause them to cancel their contracts with us or subject us to governmental or third-party lawsuits, investigations, regulatory fines or other actions or liability, thereby harming our business, financial condition, operating results, cash flows and prospects. Any accidental or unauthorized access to or disclosure, loss, destruction, disablement or encryption of, use or misuse of or modification of data, cybersecurity breach or other security incident that we or our partners could experience or the perception that one has occurred or may occur, could harm our reputation, reduce the demand for our products and services and disrupt normal business operations. In addition, such events may require us to spend material resources to investigate or remediate issues and to prevent future security incidents, expose us to uninsured liability, increase our risk of regulatory scrutiny, expose us to legal liabilities, including litigation, regulatory enforcement, indemnity obligations or damages for contract breach, and cause us to incur significant costs, any of which could materially adversely affect our business, financial condition and results of operations. Moreover, there could be public announcements regarding any such incidents and any steps we take to respond to or remediate such incidents, and if securities analysts or investors perceive these announcements to be negative, it could have a substantial adverse effect on the price of our Class A common stock. These risks may increase as we continue to grow and collect, process, store, and transmit increasingly large amounts of data. Although we are not aware of any material information security breaches to date, we have detected common types of attempts to attack our information systems and data.
We may use AI in our business, and challenges with properly managing its use could result in reputational harm, competitive harm, and legal liability, and adversely affect our results of operations.
We may incorporate AI solutions into our platform, product offerings, services and features, and these applications may become important in our operations over time. Our competitors or other third parties may incorporate AI into their products more quickly or more successfully than we do, which could impair our ability to compete effectively and adversely affect our results of operations. Additionally, if the content, analyses, or recommendations that AI applications assist in producing are or are alleged to be deficient, inaccurate or biased, our business, financial condition and results of operations may be adversely affected. The use of AI applications has resulted in, and may in the future result in, cybersecurity incidents that implicate the personal data of end users of such applications. Any such cybersecurity incidents related to our use of AI applications could adversely affect our reputation and results of operations. AI also presents emerging ethical issues and if our use of AI becomes controversial or harms our insurance provider customers, third-party publishers or consumers, we may experience brand or reputational harm, competitive harm or legal liability. The rapid evolution of AI, including potential government regulation of AI, may require significant resources to develop, test and maintain our platform, offerings, services and features to help us implement AI ethically in order to minimize unintended, harmful impact. Additionally, we may be harmed by the potential release of confidential or proprietary information as a result of the use of AI-based software by employees, vendors, suppliers, contractors, consultants or other third-parties. Further, uncertainties exist in case law
13
and regulations regarding intellectual property ownership and license rights, including copyright, of AI output, creating risks with respect to both the ability to adequately protect intellectual property underlying AI systems and software as well as inadvertent infringement. Any of these potential risks could result in a material and adverse effect on our business, financial condition, operating results, cash flows and prospects.
If we fail to continually enhance and adapt our products and services to keep pace with rapidly changing technologies and industry standards, we may not remain competitive and could lose customers or traffic to our websites, which could materially adversely affect our business and financial condition, operating results, cash flows and prospects.
The online media and marketing industry is characterized by rapidly changing standards, evolving technologies, frequent new or enhanced product and service introductions and shifting user and insurance provider customer demands. Our success depends on our continued innovation to make our marketplace and websites useful for users, insurance provider customers and third-party providers. The introduction of new technologies and services embodying new technologies and the emergence of new industry standards and practices could render our existing technologies and services obsolete and unmarketable or require unanticipated investments in technology. We continually make enhancements and other modifications to our proprietary technologies as well as our product and service offerings. Those changes may contain design or performance defects that are not readily apparent. Expanded category offerings may experience issues as we launch new products and services. If our proprietary technologies or our new or enhanced products and services fail to achieve their intended purpose or are less effective than technologies or products and services used by our competitors, our business could be materially adversely affected.
If we fail to compete effectively against companies engaged in digital customer acquisition, including competitors and other technology companies, we could lose customers and our revenue may decline.
We compete for insurance provider customers’ advertising and marketing budgets and visitor traffic. Our principal competitors in this space include technology companies engaged in digital customer acquisition for insurance providers, as well as other companies including: direct distribution companies focused on insurance products; industry-specific portals or customer acquisition companies with insurance-focused research online destinations; online marketing or media services providers; major internet portals and search engine companies with online advertising platforms; and supply partners with their own sales forces that sell their referrals directly to insurance providers. Finding, developing, and retaining high quality referrals on a substantialcost-effective basis is challenging because competition for web traffic among technology companies engaged in digital customer acquisition, websites, and search engines, as well as competition with traditional media companies, has resulted and may continue to result in significant increases in web traffic costs, declining margins and reduction in revenue.
This industry is highly competitive and we expect this competition to continue to increase in the future, both from existing and new competitors that provide competing platforms or technology. We compete on the basis of a number of factors, including return on investment, technology and customer service. Finding, developing and retaining high quality consumer referrals on a cost-effective basis is challenging because competition for web traffic among technology companies engaged in digital customer acquisition, websites, and search engines, as well as competition with traditional media companies, has resulted and may continue to result in significant increases in web traffic costs, declining margins and reduction in revenue. In addition, if we expand the scope of our services or served markets, we may compete with a greater number of technology companies, websites, buyers and traditional media companies across an increasing range of different services, including in vertical markets where competitors may have advantages in expertise, brand recognition and other areas. Internet search companies with brand recognition have significant numbers of direct sales personnel and web traffic that provide a significant competitive advantage and have a significant impact on pricing for consumer referrals or web traffic. Some of these agentscompanies may offer or develop more vertically targeted products that match consumers with products and services or match referrals with buyers and, thus, compete with us more directly. The trend toward consolidation in online marketing may also affect pricing and availability of web traffic inventory. Many of our marketplace, which could harm ourcurrent and potential competitors also have other competitive advantages over us, such as longer operating histories, greater brand results of operationsrecognition, larger or more diverse client bases, greater access to web traffic more generally, and overall business.
Our business depends on our ability to maintain and improve the technology infrastructure necessary to send marketing emails and operate our websites, and any significant disruption in service on our email network infrastructure or websites could result in a loss of consumers, which could harm our business, brand, operating results and financial condition.
Our brand, reputation and ability to attract consumers and insurance providers depend on the reliable performance of our technology infrastructure and content delivery. We use emails to attract consumers to our marketplace. Our systems may not be adequately designed with the necessary reliability and redundancy to avoid performance delays or outages that could be prolonged and harmful to our business. If our websites are unavailable when users attempt to access them, or if they do not load as quickly as expected, users may not return as often in the future, or at all. As our user base and the amount of information shared on our websites and mobile applications continue to grow, we will need an increasing amount of network capacity and computing power. We have spent and expect to continue to spend substantial amounts on data centers and equipment and related network infrastructure and services to handle the traffic on our websites and mobile applications and to help shorten the length of or prevent system interruptions. The operation of these systems is expensive and complex and we could
14
experience operational failures. Interruptions, delays or failures in these systems, whether due to earthquakes, adverse weather conditions, other natural disasters, power loss, computer viruses, cybersecurity
Substantially all of the communications, network and computer hardware used to operate our websites and mobile applications are located in the United States in Amazon Web Services and Google Cloud Platform data centers. Although we believe our systems are fully redundant, there may be exceptions for certain hardware. In addition, we do not own or control the operation of these facilities. Our systems and operations are vulnerable to damage or interruption from fire, flood, power loss, telecommunications failure, terrorist attacks, acts of war, electronic
Problems faced by our third-party web hosting providers could adversely affect the experience of users of our marketplace. Our third-party web hosting providers could close their facilities without adequate notice. Any financial difficulties, up to and including bankruptcy, faced by our third-party web hosting providers or any of the service providers with whom they contract may have adverse effects on our business, the nature and extent of which are difficult to predict. If our third-party web hosting providers are unable to keep up with our growing capacity needs, our business could be harmed.
Any errors, defects, disruptions or other performance or reliability problems with our network operations could cause interruptions in access to our marketplace as well as delays and additional expense in arranging new facilities and services and could harm our reputation, business, operating results and financial condition. Although we carry business interruption insurance, it may not be sufficient to compensate us for the potentially significant losses, including the potential harm to the future growth of our business that may result from interruptions in our service as a result of system failures.
We believe our success depends on the efforts and talents of our executives and employees. Our future success depends on our continuing ability to attract, develop, motivate and retain highly qualified and skilled employees. Qualified individuals are in high demand, and we may incur significant costs to attract and retain them. Experienced information technology personnel,professionals, who are critical to the success of our business, are in particularly high demand.demand, including employees with AI expertise or experience using AI tools. Competition for their talents is intense, and retaining such individuals can be difficult. The loss of any of our executive officers or key employees could materially adversely affect our ability to execute our business plan and strategy, and we may not be able to find adequate replacements on a timely basis, or at all. Our executive officers and other
Our operating results willmay be impacted by factors that impact our estimate of the constrained lifetime value of commissions per policy.
We recognize commission revenue based on the latest estimated constrained lifetime value, or constrained LTV, for each product. Constrained LTVs are impacted by a number of factors, which include, but are not limited to, carrier mix, policy duration and conversion rates of paying policies. These factors impact historical trends and changes in those factors or in historical trends will affect our constrained LTV estimates in future periods and therefore could adversely affect our revenue and financial results in those future periods. As a result, adverse changes in the assumptions we make or constraints we apply or the assumptions we make in computing expected lifetime values, such as increased cancellation rates or lower renewal rates, would harm our business, operating results, financial condition and prospects.
15
Additionally, if customer cancellation rates exceed our expectations or renewal rates are less than expected, we may not receive the commission revenue we have projected to receive, despite our having incurred and recorded the cost to sell the policy. Any adverse impact on cancellation or renewal rates could lead to our receipt
We are subject to a number of risks related to the credit card and debit card payments we accept.
We accept payments through credit and debit card transactions. For credit and debit card payments, we pay interchange and other fees, which may increase over time. An increase in those fees may require us to increase the prices we charge and would increase our operating expenses, either of which could harm our business, financial condition and results of operations.
We currently rely exclusively on one third-party vendor to provide payment processing services, including the processing of payments from credit cards and debit cards, and our business would be disrupted if this vendor becomes unwilling or unable to provide these services to us and we are unable to find a suitable replacement on a timely basis. If we or our processing vendor failsfail to maintain adequate systems for the authorization and processing of credit card transactions, it could cause one or more of the major credit card companies to disallow our continued use of their payment products. In addition, if these systems fail to work properly and, as a result, we do not charge our customers’ credit cards on a timely basis or at all, our business, revenue, results of operations and financial condition could be harmed.
We are also subject to payment card association operating rules, certification requirements and rules governing electronic funds transfers, which could change or be reinterpreted to make it more difficult for us to comply. We are required to comply with payment card industry security standards. Failing to comply with those standards may violate payment card association operating rules, federal and state laws and regulations, and the terms of our contracts with payment processors. Any failure to comply fully also may subject us to fines, penalties, damages and civil liability, and may result in the loss of our ability to accept credit and debit card payments. Further, there is no guarantee that such compliance will prevent illegal or improper use of our payment systems or the theft, loss or misuse of data pertaining to credit and debit cards, card holders and transactions.
If we raise additional funds through further issuances of equity or convertible debt securities, our existing stockholders could suffer significant dilution, and any new equity securities we issue could have rights, preferences and privileges superior to those of holders of our Class A common stock. If we are unable to obtain adequate financing or financing on terms satisfactory to us, when we require it, our ability to continue to pursue our business objectives and to respond to business opportunities, challenges or unforeseen circumstances could be significantly limited, and our business, operating results, financial condition and prospects could be materially adversely affected.
We have $25.0 million available for borrowing under our revolving line of credit with Western Alliance Bank, and in the future we could incur indebtedness beyond our revolving line of credit.
Borrowing onunder our revolving line of credit or otherwise, combined with our other financial obligations and contractual commitments, could have significant adverse consequences, including:
In addition, any indebtedness we incur under our current revolving line of credit will bear interest at a variable rate, which would make us vulnerable to increases in the market rate of interest. If the market rate of interest increases substantially, we would have to pay additional interest, which would reduce cash available for our other business needs. We intend to satisfy any future debt service obligations with our existing cash and cash equivalents. Under our loan and security agreementAmended Loan Agreement with Western Alliance Bank, our failure to make payments when due or comply with specified covenants, as well as the occurrence of an event that would reasonably be expected to have a material adverse effect on our business, operations, assets or financial condition, is an event of default. If an event of default occurs and the lender accelerates any indebtedness then outstanding, we may need to seek additional financing, which may not be available on acceptable terms, in a timely manner or at all. In such event, we may not be able to make accelerated payments, and the lender could seek to enforce security interests in the collateral securing such indebtedness, which includes substantially all of our assets. In addition, the covenants under our existing debt instruments, the pledge of our assets as
16
collateral and the negative pledge with respect to our intellectual property could limit our ability to obtain additional debt financing.financing on acceptable terms or at all. Any of these events could have a material adverse effect on our results of operations or financial condition.
Risks related to Laws and Regulation
Negative changes in the regulatory environment, including with respect to the insurance industry, telemarketing restrictions and data privacy requirements, have had in the past, and may in the future have, a material and adverse impact on our revenue, business and growth.
We are subject to regulation regarding the insurance industry.
The insurance industry in the United States is heavily regulated. The insurance regulatory framework addresses, among other things: granting licenses to companies and agents to transact particular business activities; and regulating trade, marketing, compensation and claims practices. The cost of compliance with such regulations or any non-compliance could impose material costs on us and our partners and could subject us to claims, government enforcement actions, civil and criminal liability or other remedies, including suspension of business operations, which could negatively affect our or their business, marketing practices and budgets, and could have a material and adverse effect on our business, financial condition, operating results, cash flows and prospects.
In addition to the insurance regulatory framework, we and our third-party publishers are subject to many other laws and requirements, including federal, state and local laws and regulations regarding commercial email, telemarketing, search engines, internet tracking technologies, direct marketing, data privacy and security, pricing, sweepstakes, promotions, intellectual property ownership and infringement, trade secrets, export of encryption technology, acceptable content and quality of goods, and taxation, among others. Each of our customer verticals is also subject to various laws and regulations, and our marketing activities on behalf of our customers are regulated. Many of these laws and regulations are frequently changing and can be subject to various interpretations and emphasis, and the extent and evolution of future government regulation is uncertain. Keeping our business in compliance with or bringing our business into compliance with new laws and regulations, therefore, may be costly, affect our revenue and harm our financial results.
We are subject to regulation regarding data privacy and security.
We believe increased regulation may continue to occur in the area of data privacy and security, and laws and regulations applying to the solicitation, collection, retention, deletion, sharing, use and other processing of personal information. At the U.S. federal level, we are subject to the laws and regulations promulgated under the authority of the Federal Trade Commission, which regulates unfair or deceptive acts or practices (including with respect to data privacy and security).
We are or may in the future become subject to state data privacy laws including, but not limited to, the California Consumer Privacy Act of 2018, as amended by the California Privacy Rights Act of 2020, or collectively, the CCPA. The CCPA requires covered businesses to, among other things, provide disclosures to California residents about their data collection, use, sharing and processing practices and, with limited business exceptions, the CCPA affords such individuals various rights with respect to their personal information, including to request deletion of personal information collected about them and to opt-out of certain personal information selling and sharing practices. A number of other states have enacted, or are considering enacting, broad data privacy laws. In addition, laws in all 50 U.S. states require businesses to provide notice under certain circumstances to consumers whose sensitive personal information has been disclosed as a result of a data breach.
Foreign laws and regulations such as the United Kingdom General Data Protection Regulation, or UK GDPR, may also apply to our Northern Ireland operations and employees. The UK GDPR includes a range of compliance obligations and penalties for non-compliance that are significant.
Additionally, we are and in the future may become, subject to various other obligations relating to data privacy and security, including industry standards, external and internal policies, contracts and other obligations, and other potential laws and regulations including those relating to cybersecurity and the use of AI in products or services by federal and state regulators, as well as the adoption of industry guiding principles for cybersecurity and the use of AI, such as by the National Association of Insurance Commissioners, or NAIC. Existing and new data privacy and security laws and regulations could affect, and may result in significant expenditures to ensure, our ability to store, use, share and otherwise process personal information in accordance with applicable laws and regulations. The cost of compliance with new or existing regulations could impose significant costs on our business, which could materially adversely affect our business, financial condition or results of operations.
17
We are subject to regulation regarding telemarketing and robotexting marketing campaigns.
In connection with our telemarketing campaigns to generate traffic for our customers, we are subject to various state and federal laws regulating telemarketing communications (including SMS or text messaging), including the TCPA, which requires prior express written consent for certain types of telemarketing calls. Our efforts to comply with the TCPA have not had a material impact on traffic conversion rates. However, depending on future traffic and product mix, it could potentially have a material effect on our revenue and profitability, including increasing our and our customers’ exposure to enforcement actions and litigation. TCPA regulations have resulted in an increase in individual and class action litigation against marketing companies for alleged TCPA violations. TCPA violations can result in significant financial penalties, including penalties or criminal fines imposed by the FCC or fines of up to $1,500 per violation imposed through private litigation or by state authorities. Additionally, we generate inquiries from users that provide a phone number, and a significant amount of revenue comes from calls made by our internal call centers as well as, in some cases, by third-party publishers’ call centers. We also purchase a portion of inquiry data from third-party publishers, including our verified partner network, and cannot guarantee that these third parties will comply with applicable laws and regulations. Any failure by us or the third-party publishers on which we rely for telemarketing, email marketing, and other performance marketing activities to adhere to or successfully implement appropriate processes and procedures in response to existing laws and regulations and changing regulatory requirements could result in legal and monetary liability, significant fines and penalties, or damage to our reputation in the marketplace, any of which could have a material adverse effect on our business, financial condition and results of operations. Furthermore, our customers may make business decisions based on their own experiences with the TCPA regardless of our products and the changes we implemented to comply with the new regulations. These decisions may negatively affect our revenue or profitability.
Changes in regulations, or the regulatory environment, applicable to us or our media sources, third party publishers or customers could also have a material adverse effect on our business. For example, on January 26, 2024, the FCC published regulations furthering what it has characterized as its “multi-pronged approach to unwanted and illegal calls.” New rules were adopted concerning so-called “robotexting,” which include requirements for blocking texts from “red flagged” numbers, codifying Do-Not-Call rules for text messages, and encouraging an opt-in approach for mobile carrier delivery of email-to-text messages. The new rules also close what the Commission refers to as the “lead generator loophole” by requiring “one-to-one consent” for calls or texts subject to the TCPA prohibition on calls or texts made using an automatic telephone dialing system or pre-recorded/artificial voice messages to wireless or residential numbers absent consent or an emergency purpose. Under the new rule, a separate consent must be obtained from a consumer for each seller to make calls or send texts covered by the wireless or residential number prohibition. As part of its adoption of the new lead generator provision, the Commission also further tightened consent requirements for all telemarketing calls and texts to wireless or residential numbers subject to the wireless or residential number prohibition. The new rules could have a material adverse impact on our media sources and our customers due to increased costs, technological compliance challenges and additional legal risks, including potential liabilities or claims relating to compliance. Decreased participation in online advertising by our media sources or customers as a result of the proposed rules could have a material adverse impact on our business, results of operation and financial condition, as it may reduce the availability to us of qualified inquiries. Additionally, the FCC’s new rules, and other future changes in laws may increase our compliance costs, and any failure by us or our media sources or customers to comply with such laws may subject us to significant liabilities.
We are subject to regulation regarding email marketing campaigns.
In connection with our email campaigns to generate traffic for our customers, we are subject to various state and federal laws regulating commercial email communications, including the federal CAN-SPAM Act. If we or any of our third-party publishers fail to comply with any provisions of these laws or regulations, we could be subject to regulatory investigation, enforcement actions and litigation, as well as indemnification obligations with respect to our customers. Any negative outcomes from such regulatory actions or litigation, including monetary penalties or damages, could have a material adverse effect on our financial condition, results of operation and reputation.
We may become subject to litigation, audit or investigation, which could result in financial liability, fines and penalties, restrictions on our operations or reputational damage.
Violations or alleged violations of laws and regulations, or any such obligations, by us, our third-party publishers, our customers or our third-party service providers on which we rely to process personal information on our behalf, could result in enforcement actions, litigation, damages, fines, criminal prosecution, unfavorable publicity, and restrictions on our ability to operate, any of which could have a material adverse effect on our business, financial condition and results of operations. In addition, new laws or regulations (including amendments thereof or changes in enforcement of existing laws or regulations applicable to us or our customers) could affect the activities or strategies of us or our customers and, therefore, lead to reductions in their level of business with us or otherwise impact our business. We may also become subject to audits, inquiries, investigations, claims of non-compliance or lawsuits by federal and state governmental agencies, regulatory agencies, attorneys general and other governmental or regulatory bodies, any of whom may allege violations of legal and regulatory requirements. For our dispositioned assets or businesses, we retain certain liabilities or obligations in connection with our pre-closing actions or omissions, contractual or otherwise. If any audits, inquiries, investigations,
18
claims of non-compliance and lawsuits by federal and state governmental agencies, regulatory agencies, attorneys general and other governmental or regulatory bodies are unfavorable to us, we may be required to pay monetary fines or penalties or have restrictions placed on our business, which could materially adversely affect our business, financial condition, results of operations and cash flows.
Risks Related to Our Intellectual Property
We may not be able to adequately protect our intellectual property rights.
Our business depends on our intellectual property, the protection of which is crucial to the success of our business. We rely on a combination of trademark, trade secret and copyright law and contractual restrictions to protect our intellectual property. In addition, we attempt to protect our intellectual property, technology and confidential information by requiring our employees and consultants to enter into confidentiality and assignment
We may not be able to discover or determine the extent of any unauthorized use or infringement or violation of our intellectual property or proprietary rights. Third parties also may take actions that diminish the value of our proprietary rights or our reputation. The protection of our intellectual property may require the expenditure of significant financial and managerial resources. Litigation may be necessary in the future to enforce our intellectual property rights, to protect our trade secrets, to determine the validity and scope of the proprietary rights of others or to defend against claims of infringement or invalidity. Such litigation could be costly, time-consuming and distracting to management, result in a diversion of resources, the impairment or loss of portions of our intellectual property and could materially adversely affect our business, financial condition and operating results. Furthermore, our efforts to enforce our intellectual property rights may be met with defenses, counterclaims and countersuits attacking the validity and enforceability of our intellectual property rights. These stepsrights, or may be inadequate to protect our intellectual property. We will not be able to protect our intellectual property if we are unable to enforce our rights or if we do not detect unauthorized use of our intellectual property. Despite our precautions, it may be possible for unauthorized third parties to use information that we regard as proprietary to create product offerings that compete with ours. We also cannot be certain that others will not independently develop or otherwise acquire equivalent or superior technology or other intellectual property rights, which could materially adversely affect our business, financial condition and operating results.
Competitors may adopt service names similar to ours, thereby harming our ability to build brand identity and possibly leading to user confusion. In addition, there could be potential trade name or trademark infringement claims brought by owners of other registered trademarks or trademarks that incorporate variations of the term “EverQuote.” We currently hold the “everquote.com” internet domain name as well as various other related domain names. The regulation of domain names in the United States is subject to change. Regulatory bodies could
We currently operategenerate revenue only in the United States. To the extent that we determine to expand our business internationally, we will encounter additional risks, including different, uncertain or more stringent laws relating to intellectual property rights and protection.
We may in the future be subject to intellectual property disputes, which are costly to defend and could harm our business and operating results.
From time to time we have faced and may continue to face allegations or claims that we have infringed the trademarks, copyrights, patents and other intellectual property rights of third parties, including from our
Even if these matters do not result in litigation or are resolved in our favor or without significant cash settlements, these matters, and the time and resources necessary to litigate or resolve them, could harm our business, our operating results and our reputation.
19
As our business expands, we may be subject to intellectual property claims against us with increasing frequency, scope and magnitude. We may also be obligated to indemnify affiliates or other partners who are accused of violating third parties’ intellectual property rights by virtue of those affiliates or partners’ agreements with us, and this could increase our costs in defending such claims and our damages. For example, many of our agreements with insurance providers and other partners require us to indemnify these entities against third-party intellectual property infringement claims. Furthermore, such insurance providers and partners may discontinue their relationship with us either as a result of injunctions or otherwise. The occurrence of these results could harm our brand or materially adversely affect our business, financial position and operating results.
Confidentiality agreements with employees and others may not adequately prevent disclosure of trade secrets and other proprietary information.
In order to protect our technologies and processes, we rely in part on confidentiality agreements with our employees, independent contractors and other advisors. These agreements may not effectively prevent disclosure of confidential information, including trade secrets, and may not provide an adequate remedy in the event of unauthorized disclosure of confidential information. In addition, others may independently discover our trade secrets and proprietary information, and in such cases we may not be able to assert our trade secret rights against such parties. To the extent that our employees, contractors or other third parties with whom we do business use intellectual property owned by others in their work for us, disputes may arise as to the rights to related
Our use of “open source” software could adversely affect our ability to protect our proprietary software and subject us to possible litigation.
We use open source software in connection with our software development. From time to time, companies that use open source software have faced claims challenging the use of open source software and/or compliance with open source license terms. We could be subject to suits by parties claiming ownership of what we believe to be open source software,
Taxing authorities may assert that we should have collected or in the future should collect sales, use, value added or similar taxes, and we could be subject to liability with respect to past or future sales, which could adversely affect our operating results.
We do not collect sales, use, value added or similar taxes in jurisdictions in which we have sales, and we believe that such taxes are not applicable, either because we do not have the requisite amount of contacts with the state for the state to be able to impose these taxes or our products and services are not subject to these taxes. Sales, use, value added and similar tax laws and rates vary greatly by jurisdiction. Certain jurisdictions in which we do not collect such taxes may assert that such taxes are applicable, which could result in tax assessments, penalties and interest, to usstatestate’s tax assessor’s office
Risks Related to Our Class A Common Stock
An active trading market for our Class A common stock may not be sustained.
In 2023, the average trading volume of our Class A common stock began trading on the Nasdaq Global Market on June 28, 2018.was 381,450 and, as of January 31, 2024, our market capitalization was $432.3 million. Given the limited trading history of our Class A common stock,volume and market capitalization, there is a risk that an active trading market for our shares may not be sustained, which could put downward pressure on the market price of our Class A common stock and thereby affect the ability of our stockholders to sell their shares at attractive prices, at the times that they would like to sell them, or at all.
20
The market price of our Class A common stock has been and may continue to be volatile, which could result in substantial losses for investors and could subject us to securities class action litigation.
The market price of our Class A common stock has been and could continue to be subject to significant fluctuations. For example, our Class A common stock traded within a range of a high price of $63.44 per share and a low price of $4.05 per share for the period beginning June 28, 2018, our first day of trading on the Nasdaq Global Market, through December 31, 2021.2023. Some of the factors that may cause the market price of our Class A common stock to fluctuate include:
In addition, equity markets in general, and the equities of technology companies in particular, have experienced and may experience in the future, extreme price and volume fluctuations due to, among other factors, the actions of market participants or other actions outside of our control, including general market volatility caused by theCOVID-19pandemic.control. Such price and volume fluctuations may adversely affect the market price of our common stock for reasons unrelated to our business or operating results.
In the past, following periods of volatility in the market price of a company’s securities, securities class action litigation has often been brought against that company. For example, we were subject to a class action lawsuit alleging federal securities law violations in connection with our IPO. Because of the past and potential future volatility of our stock price, we may become the target of additional securities litigation in the future. Securities litigation could result in substantial costs and divert management’s attention and resources from our business.
The dual-class structure of our common stock has the effect of concentrating voting control with the holders of our Class B common stock, including our directors, executive officers and Link Ventures and other significant stockholders, who collectively held in the aggregate approximately 78% of the voting power of our capital stock as of February 23, 2022; and Link Ventures, directly or through a voting agreement, together with Cogo Labs,
Our Class B common stock has 10 votes per share, and our Class A common stock has one vote per share. Our directors, executive officers and holders of more than 10% of our common stock, and their respective affiliates, held in the aggregate approximately 78%72% of the voting power of our capital stock as of February 23, 2022;January 31, 2024; and Link Ventures, directly or through a voting agreement, pursuant to which Tomas Revesz and the heirs and estate of Seth Birnbaum are obligated to vote on all matters presented to our stockholders all voting capital stock held by them in the manner directed by Link Ventures, together with Cogo Labs, held in the aggregate approximately 77%71% of the voting power of our capital stock as of that date. Because
21
Future transfers by holders of Class B common stock will generally result in those shares converting to Class A common stock, subject to limited exceptions, such as certain transfers to trusts and individual retirement accounts. In addition, all shares of Class B common stock will be required to convert to Class A common stock upon the election of a majority by voting power of the outstanding Class B common stock. The conversion of Class B common stock to Class A common stock will have the effect, over time, of increasing the relative voting power of those holders of Class B common stock who retain their shares.
Our status as a “controlled company” could make our Class A common stock less attractive to some investors or otherwise harm our stock price.
More than 50% of our voting power is held by entities affiliated with Link Ventures. As a result, we are a “controlled company” under the rules of the Nasdaq Stock Market. Under these rules, a company of which more than 50% of the voting power is held by an individual, a group or another company is a “controlled company” and, as such, will be exempt from certain corporate governance requirements, including requirements that:
We have availed ourselves of certain of these exemptions and, for so long as we qualify as a “controlled company,” we will maintain the option to utilize from time to time some or all of these exemptions. For example, we do not have a nominations committee, and director nominees might not be selected or recommended for the board’s selection by a qualifying nominations committee or by independent directors constituting a majority of
A significant portion of our total outstanding shares may be sold into the public market in the near future, which could cause the market price of our Class A common stock to drop significantly, even if our business is doing well.
We could sell a significant number of shares of our Class A common stock in the public market could occurto raise additional capital or for other corporate purposes without stockholder approval at any time. TheseIn addition, the Board of Directors could designate and sell a class of preferred stock with preferential rights over the Class A common stock with respect to dividends or other distributions. We are filing a universal shelf registration statement on Form S-3 with the SEC concurrently with the filing of this Annual Report on Form 10-K, which when declared effective, will register for sale up to $150.0 million of any combination of our common stock, preferred stock, debt securities, warrants, rights or units from time to time and at prices and on terms that we may determine. Any sales under our universal shelf registration statement, or the market perception that the holders of a large number of shares intend to sell shares, could reduce the market price of our Class A common stock.
In addition to our outstanding Class A common stock, as of DecemberJanuary 31, 2021,2024, there were 884,1111,896,102 shares of Class A common stock subject to outstanding options, 655,462390,748 shares of either Class A common stock or Class B common stock subject to outstanding options, 2,798,7612,060,934 shares of Class A common stock subject to outstanding restricted stock unit awards, or RSUs, and an additional 1,730,2181,816,303 shares of Class A common stock reserved for future issuance under our equity incentive plan. Because we have registered 14,451,36717,578,382 shares of our Class A common stock and Class B common stock that may be issued under our equity incentive plans pursuant to registration statements
Moreover, holders of a significant number of shares of our Class A common stock and Class B common stock as of DecemberJanuary 31, 2021,2024, have rights, subject to certain conditions, to require us to file registration statements covering their shares or to include their shares in registration statements that we may file for ourselves or other stockholders. Upon registration, such shares would be able to be freely sold in the public market.
22
Anti-takeover provisions in our restated certificate of incorporation and our amended and restated bylaws, as well as provisions of Delaware law, might discourage, delay or prevent a change in control of our company or changes in our management and, therefore, depress the trading price of our Class A common stock.
Our restated certificate of incorporation and amended and restated bylaws and Delaware law contain provisions that may discourage, delay or prevent a merger, acquisition or other change in control that stockholders may consider favorable, including transactions in which you might otherwise receive a premium for your shares of our Class A common stock. These provisions may also prevent or delay attempts by our stockholders to replace or remove our management or directors. Our corporate governance documents include provisions:
As a Delaware corporation, we are also subject to provisions of Delaware law, including Section 203 of the Delaware General Corporation Law, which limits the ability of stockholders holding shares representing more than 15% of the voting power of our outstanding voting stock from engaging in certain business combinations with us.us, unless the interested stockholder attained such status with the approval of our board of directors or unless the business combination is approved in a prescribed manner. Any provision of our restated certificate of incorporation or amended and restated bylaws or Delaware law that has the effect of delaying or deterring a change in control could limit the opportunity for our stockholders to receive a premium for their shares of our Class A common stock, and could also affect the price that some investors are willing to pay for our Class A common stock.
The existence of the foregoing provisions and anti-takeover measures could limit the price that investors might be willing to pay in the future for shares of our Class A common stock. They could also deter potential acquirers of our company, thereby reducing the likelihood that you could receive a premium for your Class A common stock in an acquisition.
Our restated certificate provides that the Court of Chancery of the State of Delaware is the sole and exclusive forum for substantially all disputes between us and our stockholders. Our restated certificate further provides that the federal district courts of the United States of America are the sole and exclusive forum for the resolution of any complaint asserting a cause of action arising under the Securities Act. These choice of forum provisions could limit the ability of stockholders to obtain a favorable judicial forum for disputes with us or our directors, officers or employees.
Our restated certificate of incorporation provides that the Court of Chancery of the State of Delaware (or, if the Court of Chancery of the State of Delaware does not have jurisdiction, the federal district court for the District of Delaware) shall, to the fullest extent permitted by law, be the sole and exclusive forum for (1) any derivative action or proceeding brought on behalf of our company, (2) any action asserting a claim of breach of fiduciary duty owed by any director, officer or other employee or stockholder of our company to us or our stockholders, (3) any action asserting a claim arising pursuant to any provision of the Delaware General Corporation Law or as to which the Delaware General Corporation Law confers jurisdiction on the Court of Chancery or (4) any action asserting a claim governed by the internal affairs doctrine. Our restated certificate of incorporation further provides that, unless we consent in writing to the selection of an alternative forum, the federal district courts of the United States of America shall, to the fullest extent permitted by law, be the sole and exclusive forum for the resolution of any complaint asserting a cause of action arising under the Securities Act of 1933, as amended, or the Securities Act. In, No. 346, 2019 (Del. Mar. 18, 2020), the Delaware Supreme Court, reversing the Delaware Court of Chancery, held that such federal forum selection provisions are “facially valid” under Delaware law, although there is uncertainty as to whether courts in other states will enforce these provisions and we may incur additional costs of litigation should such enforceability be challenged. NeitherAlthough some courts have disagreed, at least one federal circuit court of these choiceappeals has ruled that a bylaw provision requiring all derivative actions be brought in Delaware state court was enforceable with respect to claims under Section 14(a) of forum provisions would affect suits brought to enforce any liability or duty created by the Securities Exchange Act of 1934, as amended, or the Exchange Act, or the rules and regulations thereunder, jurisdiction over which is exclusively vested by statute in U.S. federal courts, or any other claim for which U.S. federal courts have exclusive jurisdiction.Act. These choice of forum provisions may limit a stockholder’s ability to bring a claim in a judicial forum that it finds favorable for disputes with us or our directors, officers or other employees, which may discourage such lawsuits against us and our directors, officers and other employees. Alternatively, if a court were to find the choice of forum provisions contained in our certificate of incorporation to be inapplicable or unenforceable in an
23
action, we may incur additional costs associated with resolving such action in other jurisdictions, which could materially adversely affect our business, financial condition and operating results.
ITEM 1B. UNRESOLVED STAFF COMMENTS
None.
ITEM 1C. CYBERSECURITY
Identifying and assessing cybersecurity risk is integrated into our resources, divert management’s attention and affect our ability to attract and retain qualified board members.
Our systems periodically experience directed attacks intended to lead to interruptions and delays in our service and operations as well as loss, misuse or theft of personal information (of third parties, employees, and our members) and other data, confidential information or intellectual property. However, to date these incidents have already hired additional employees to comply with these requirements, we may need to hire even more employees in the future, which will increase our costs and expenses.
The Chief Information Officer, or CIO, leads our information security organization responsible for overseeing EverQuote’s information security program. Our CIO has over 30 years of industry experience managing risks or advising on cybersecurity matters. Team members who support our information security program have relevant educational and industry experience, including holding similar positions at large technology companies. The teams provide regular reports to remedysenior management and other relevant teams on various cybersecurity threats, assessments and findings.
The Board oversees our enterprise risk management processes directly and through its Audit Committee. The Audit Committee of the material weaknesses described above, or any future material weaknesses inBoard oversees our internal control over financial reporting that may be identified, or to implement or maintaincybersecurity risk and receives regular reports from our CIO on various cybersecurity matters, including risk assessments, mitigation strategies, areas of emerging risks, incidents and industry trends, and other effective control systems requiredareas of public companies, could also restrict our future access to the capital markets.
ITEM 2. PROPERTIES
Our principal executive offices are located in Cambridge, Massachusetts, where we lease approximately 32,000 square feet of space pursuant to a lease that expires in September 2024.2024, a portion of which we have subleased. We also lease approximately 13,000 square feet of office space in Evansville, Indiana pursuant to a lease that expires in August 2030, approximately 10,000 square feet of office space in Austin, Texas pursuant to a lease that expires in April 2025, and approximately 10,000 square feet of office space in San Antonio, Texas pursuant to a lease that expires in September 2025. The offices in Indiana and Texas are used in connection with our DTC agency. We believe that our current facilities are adequate to meet our immediate needs.
ITEM 3. LEGAL PROCEEDINGS
Information with respect to legal proceedings and this item is included in Note 13 of the Notes to Consolidated Financial Statements contained in Part II, Item 8 of this Annual Report on Form
24
ITEM 4. MINE SAFETY DISCLOSURES
Not applicable.
PART II
ITEM 5.MARKET FOR REGISTRANT’S COMMON EQUITY, RELATED STOCKHOLDER MATTERS AND ISSUER PURCHASES OF EQUITY SECURITIES
Certain Information Regarding the Trading of Our Common Stock
Our Class A common stock trades under the symbol “EVER” on the Nasdaq Global Market and has been publicly traded since June 28, 2018. Prior to this time, there was no public market for our Class A common stock. Our Class B common stock is not listed or traded on any stock exchange.
Holders of Our Common Stock
As of February 11, 2022,January 31, 2024, there were approximately 1312 holders of record of shares of our Class A common stock and 83 holders of record of shares of our Class B common stock. These amounts do not include stockholders for whom shares are held in “nominee” or “street” name.
Recent Sales of Unregistered Equity Securities
There were no shares of equity securities sold or issued, or options granted, by us during the year ended December 31, 20212023 that were not registered under the Securities Act of 1933, as amended, or the Securities Act, and that were not previously reported in a Quarterly Report on Form
Issuer Purchases of Equity Securities
We did not purchase any of our registered equity securities during the period from October 1, 20212023 to December 31, 2021.
Dividends
We have never declared or paid cash dividends on our capital stock. We anticipate that we will retain all of our future earnings to finance the operation of our business and do not anticipate declaring or paying any cash
25
Stock Performance Graph
The following performance graph shall not be deemed “filed”"filed" for purposes of Section 18 of the Exchange Act or incorporated by reference into any filings under the Securities Act or the Exchange Act, except as otherwise expressly set forth by specific reference in such filing.
Set forth below is a line graph, for the five-year period from June 28,December 31, 2018 (the first date on which shares of our Class A common stock were publicly traded) through December 31, 2021,2023, comparing the cumulative total stockholder return of $100 invested (assuming that all dividends were reinvested) in (1) our Class A common stock, (2) all companies listed on the Nasdaq Composite Index and (3) the Research Development Group, or RDG, Internet Composite Index. Returns over the indicated periods should not be considered indicative of future stock prices or stockholder returns.

ITEM 6.RESERVED
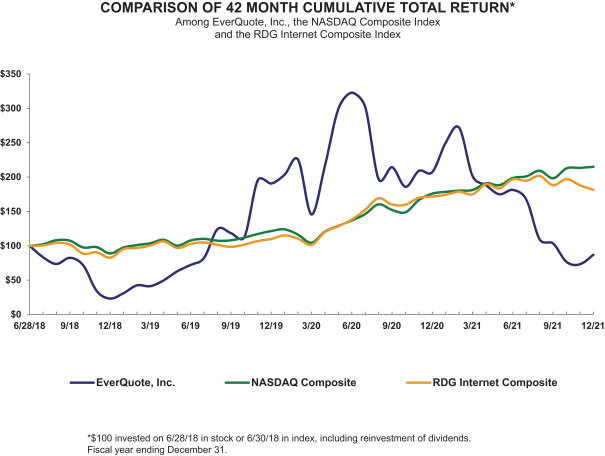
26
ITEM 7. MANAGEMENT’S DISCUSSION AND ANALYSIS OF FINANCIAL CONDITION AND RESULTS OF OPERATIONS
The following discussion and analysis of our financial condition and results of operations should be read in conjunction with our consolidated financial statements and related notes appearing in Part II, Item 8 of this Annual Report on Form
Overview
We operate a leading online marketplace for insurance shopping, connecting consumers with insurance providers. Our mission is to empower insurance shoppers to better protect life’s most important assets—their family, property,provider customers, which includes both carriers and future.agents. Our vision is to become the largest online source of insurance policies by using data, technology and technologyknowledgeable advisors to make insurance simpler, more affordable and personalized, ultimately reducing cost and risk.personalized. Our results-driven marketplace, powered by our proprietary data and technology platform, is reshaping the insurance shopping experience for consumers and improving the way insurance providers attract and connect with consumers shopping for insurance.
We operate a marketplace to connect insurance product is often challenging for consumers, who face limited online options, complex, variable and opaque pricing, and myriad coverage configurations. We present consumers with a single starting point for a comprehensive and cost-effective insurance shopping experience. Our marketplace reduces the time consumers spend searching across multiple sites by delivering broader and more relevant results than consumers may find on their own. Our direct to consumer, or DTC, agents bind policies for consumers, further streamlining the consumer shopping experience. Our service is free for consumers, and we derive our revenue from sales of consumer referrals to insurance providers and directly from commissions on sales of policies.
Since 2011, our core mission has been to make finding insurance easy and more personal, saving consumers and insurance providers time and money. We are working to build the largest and most trusted online insurance marketplace in the world.United States. In pursuing this goal, we have consistently innovated through our disruptive data driven approach. Highlights of our history of innovation include:
In June 2023, we committed to exiting our health insurance vertical, an area that would have required significant capital investment and scale to effectively compete amid an increasingly unpredictable regulatory environment, to increase focus on core verticals, and implemented a workforce reduction plan, or the Reduction Plan, to improve operating efficiency. The Reduction Plan included the elimination of 175 employees, or approximately 28%, of our workforce. We expect these reductions to produce cost savings in non-marketing operating expenses of over 15% from periods prior to the Reduction Plan. During the year ended December 31, 2023, we incurred $4.0 million in severance charges in connection with the workforce reduction, consisting of cash expenditures for employee separation costs of $2.7 million, of which $2.1 million were paid by December 31, 2023, and non-cash charges for the modification of certain equity awards of $1.3 million. During the year ended December 31, 2023, we recorded a credit of $0.2 million to restructuring and other charges related to estimated severance payments that were not made.
27
On August 1, 2023, we sold all of the issued and outstanding membership interests of our former subsidiary, Eversurance LLC, for cash consideration of $13.2 million to MyPlanAdvocate Insurance Solutions Inc. There were no employees of Eversurance LLC at the time of the sale. The assets sold consisted of commissions receivable of $30.8 million, which were expected to be collected over the next seven years, net intangible assets of $1.0 million and other net assets of $0.4 million, including our Evansville, Indiana office lease. We incurred $0.4 million of transaction costs in connection with the sale. Accordingly, we recognized a loss on sale of $19.4 million during the year ended December 31, 2023. We also recorded an impairment charge on our right-of-use asset for our Cambridge, Massachusetts office lease of $0.4 million during the year ended December 31, 2023 in connection with subleases we entered into with two third parties for a portion of the office space. We refer to the exit of our health insurance vertical and the Reduction Plan as our recent restructuring, which we completed by September 30, 2023.
In the years ended December 31, 2021, 20202023, 2022 and 2019,2021, our total revenue was $418.5$287.9 million, $346.9$404.1 million and $248.8$418.5 million, respectively, representing year-over-year growthdecreases of 20.6%28.8% and 39.4%,3.4% from 2022 to 2023 and 2021 to 2022, respectively. We had net losses of $19.4$51.3 million, $11.2$24.4 million and $7.1$19.4 million for the years ended December 31, 2021, 20202023, 2022 and 2019,2021, respectively, and had $14.6$0.5 million, $18.4$5.9 million and $8.3$14.6 million in adjusted EBITDA for these same periods, respectively. See the section titled“— “—Non-GAAP Financial
Factors Affecting Our Performance
We believe that our performance and future growth depend on a number of factors that present significant opportunities for us but also pose risks and challenges, including those discussed below and in the section titled “Risk Factors.”
Auto insurance industry risk
For the year ended December 31, 2023, we derived 79% of our revenue from auto insurance providers and our financial results depend on the performance of the auto insurance industry. For example, in 2016, the U.S. commercialThe auto insurance industry has experienced its worstdeteriorated underwriting performance due to a rise in 15claims, inflation, and inadequate policy premiums. This deteriorated underwriting performance has caused our insurance carrier customers to reduce spending on new customer acquisition, which has had a negative impact on the pricing and demand for consumer referrals in our marketplace during 2022 and 2023.
Furthermore, total revenue from our two largest insurance carrier customers was 27% and 32% of our revenue for the years withended December 31, 2023 and 2022, respectively. In January 2023, we saw one of our major carrier customers return to higher loss ratios that were drivenspending patterns, but subsequently reduce customer acquisition spending starting in the second quarter of 2023 and continuing throughout the remainder of 2023 due to higher than expected claims losses. The state of the auto insurance market remains volatile and while we believe we have started to see some improvement in spending patterns, a recovery could be prolonged by both adversefurther cost inflation, increased claim severity and frequency, trends. As a result, our auto insurance carrier customers reduced marketing spend and cost per sale targets the following year, ultimately impacting our revenue growth in the auto insurance vertical in 2017. More recently, and specifically starting in the third quarter of 2021, the auto
Expanding consumer traffic
Our success depends in part on the growth of our consumer traffic, as measured by quote requests.traffic. We have historically increased consumer traffic to our marketplace by expanding existing advertising channels and adding new channels such as by engaging with consumers through our verified partner network. WeOver the long term, we plan to continue to increase consumer traffic by leveraging the features and growing the data assets of our platform. WhileHowever, we planhave decreased advertising spend in response to increaselower demand for consumer traffic over the long term,referrals and we also have the ability to further decrease advertising which would likely resultspend in a decrease in quote requests from consumers targeted by such advertising, if we believethe future when the revenue associated with such consumer traffic does not result in incremental profit to our business. We have also increased the number of quote requests acquired from our verified partner network. While we plan to continue to increase the number of quote requests we acquire from our verified partner network, our profitability will be impacted by our ability to acquire quote requests in significant volume, at prices that are attractive, and that represent high-intent shoppers thatfor which insurance providers will purchase referrals for will impact our profitability.
Increasing the number of insurance providers and their respective spend in our marketplace
Our success also depends on our ability to retain and grow our insurance provider network. WeHistorically, we have generally expanded both the number of insurance providers and the spend per provider on our platform. While not a factor in our historical increases in revenue per quote request, we believeRecently, we have an opportunity to increase the number of referrals per quote request while increasing the bind rate per quote request, which would allow us to increase our revenue at low incremental cost.
28
Regulation
Our revenue and earnings may fluctuate from time to time as a result of reducedchanges to federal, state, and industry-based laws and regulations, or changes to standards concerning the enforcement thereof. Our business could be affected directly because we operate websites, conduct telephonic and email marketing, spend fromand collect, store, share, and use consumer information and other data. Our business also could be affected indirectly if our auto insurance carrier customers.
Key Business Metrics
We regularly review a number of metrics, including GAAP operating results and the key metrics listed below, to evaluate our business, measure our performance, identify trends affecting our business, formulate financial projections, and make operating and strategic decisions. Some of these metrics are
Adjusted EBITDA
We define Adjusted EBITDA as net income (loss), adjusted to exclude: stock-based compensation expense, depreciation and amortization expense, restructuring and other charges, acquisition-related costs, legal settlement expense, the provision for (benefit from) income taxes. Adjusted EBITDA is a non-GAAP financial measure that we present in this Annual Report on Form 10-K to supplement the financial information we present on a GAAP basis. We monitor and present Adjusted EBITDA because it is a key measure used by our management and board of directors to understand and evaluate our operating performance, to establish budgets and to develop operational goals for managing our business. Adjusted EBITDA should not be considered in isolation from, or as an alternative to, measures prepared in accordance with GAAP. Adjusted EBITDA should be considered together with other operating and financial performance measures presented in accordance with GAAP. Also, Adjusted EBITDA may not necessarily be comparable to similarly titled measures presented by other companies. For further explanation of the uses and limitations of this measure and a reconciliation of Adjusted EBITDA to the most directly comparable GAAP measure, net income (loss), please see “—Non GAAPNon-GAAP Financial Measure”.
Variable Marketing Margin
We define variable marketing margin, or VMM, as revenue, as reported in our consolidated statements of operations and comprehensive loss, less advertising costs (a component of sales and marketing expense, as reported in our consolidated statements of operations and comprehensive loss). We use VMM to measure the efficiency of individual advertising and consumer acquisition sources and to make
Key Components of Our Results of Operations
Revenue
We generate our revenue primarily by sellingfrom consumer inquiries sold as referrals to insurance provider customers, consisting of carriers and agents, as well as to indirect distributors. To simplify the quoting process for the consumer and improve performance for the provider, we are able to provide consumer-submitted quote request data along with each referral. We recognize revenue from consumer referrals at the time of delivery. We support three secure consumer referral formats:
29
We also generate less than 10% of our revenue from commission feescommissions paid to us by insurance carriers for the sale of policies primarilyin our automotive insurance vertical, and prior to our exit from health, in our health and automotive verticals.insurance vertical. Commission revenue is recognized upon satisfaction of our performance obligation, which we consider to be submission of the policy application to the insurance carrier. We recognize revenue based on our constrained estimate of commission payments we expect to receive over the lifetime of the policies sold, which we refer to as constrained lifetime values, or constrained LTVs, of commission payments. Commission revenue is recognized upon satisfactionrepresented less than 10% of our performance obligation, which we consider to be submission oftotal revenue for the policy application.
For the periods presented, our total revenue consisted of revenue generated fromwithin our automotive and other insurance verticals, which includes home and renters, life and health insurance verticals as follows:
Year Ended December 31, | ||||||||||||
2021 | 2020 | 2019 | ||||||||||
| (in thousands) | ||||||||||||
Automotive | $ | 330,928 | $ | 283,236 | $ | 212,300 | ||||||
Other | 87,587 | 63,699 | 36,511 | |||||||||
Total Revenue | $ | 418,515 | $ | 346,935 | $ | 248,811 | ||||||
|
| Year Ended December 31, |
| |||||||||
|
| 2023 |
|
| 2022 |
|
| 2021 |
| |||
|
| (in thousands) |
| |||||||||
Automotive |
| $ | 227,505 |
|
| $ | 324,417 |
|
| $ | 330,928 |
|
Home and Renters |
|
| 40,889 |
|
|
| 31,909 |
|
|
| 37,548 |
|
Other |
|
| 19,527 |
|
|
| 47,801 |
|
|
| 50,039 |
|
Total Revenue |
| $ | 287,921 |
|
| $ | 404,127 |
|
| $ | 418,515 |
|
We expect a modestan overall increase in revenue in 20222024, including in our automotive and home and renters verticals, as we anticipate increasesincreased spending from our carrier partners. We expect revenue from our other insurance vertical to further decrease in commission revenue to be mostly offset by decreases in referral revenue in our automotive vertical2024 as a result of challenges inour exit from the automotivehealth insurance industry described above. We expect revenue to fluctuate from quarter to quarter and, in particular, for our commission revenue to be impacted by the open enrollment period and annual enrollment period in our health vertical.
Cost and Operating Expenses
Our cost and operating expenses consist of cost of revenue, sales and marketing, research and development, and general and administrative expenses.
We allocate certain overhead expenses, such as rent, utilities, office supplies and depreciation and amortization of general office assets, to cost of revenue and operating expense categories based on headcount. As a result, an overhead expense allocation is reflected in cost of revenue, sales and each operating expense category.marketing, research and development and general and administrative expenses. Personnel-related costs included in cost of revenue and each operating expense categorycategories include wages, fringe benefit costs and stock-based compensation expense.
Cost of Revenue
Cost of revenue is comprised primarily of the costs of operating our marketplace and delivering consumer referrals to our customers. These costs consist primarily of technology service costs including hosting, software, data services, and third-party call center costs. In addition, cost of revenue includes depreciation and amortization of our platform technology assets and personnel-related costs.
Sales and Marketing
Sales and marketing expenses consistexpense consists primarily of advertising and marketing expenditures as well as personnel-related costs for employees engaged in sales, marketing, data analytics and consumer acquisition functions and amortization of sales and marketing-related intangible assets. Advertising expenditures consist of variable costs that are related to attracting consumers to our marketplace, generating consumer quote requests, including the cost of quote requests we acquire from our verified partner network, and promoting our marketplace to carriers and agents. Advertising costs are expensed as incurred. Marketing costs consist primarily of content and creative development, public relations, memberships, and event costs. In order to continue to grow our business and brand awareness, we expect that we will continue to commit substantial resources to our sales and marketing efforts. We expect our sales and marketing expense will increase as we expect increased carrier spend for referrals, which will impact our advertising expenditures, though we expect personnel-related costs to decrease in the near term, both2024 from 2023 as a percentageresult of revenue andthe Reduction Plan implemented in absolute dollars, especially as we continue to expand our DTC agency. In the longer term, we expect sales and marketing expense to decrease as a percentage of revenue due to efficiencies of scale and improvements in our marketplace technology.
Research and Development
Research and development expenses consistexpense consists primarily of personnel-related costs for software development and product management. We have focused our research and development efforts on improving ease of use and functionality of our existing marketplace platform and developing new offerings and internal tools. We primarily expense research and development costs. Direct development costs related to software enhancements that add functionality are capitalized and amortized as a component of cost of revenue. We expect that research and development expensesexpense will increaseremain relatively flat in 2024 as we continuecompared to enhance and expand our platform technology.2023.
30
General and Administrative
General and administrative expenses consistexpense consists of personnel-related costs and related expenses for executive, finance, legal, human resources, technical support and administrative personnel as well as the costs associated with professional fees for external legal, accounting and other consulting services, insurance premiums and payment processing and billing costs. We expect that general and administrative expensesexpense will decrease in 2024 from 2023, partially as a result of the Reduction Plan implemented in June 2023.
Restructuring and Other Charges
Restructuring and other charges includes costs related to increase as we continue to incur the costsrecent restructuring and our exit of compliance associated with being a publicly traded company, including legal, audit,the health insurance vertical. We completed this restructuring and consulting fees.
Acquisition-related
Acquisition-related costs include expenses associated with third-party professional services we utilize for the evaluation and execution of acquisitions as well as changes in the fair value of our contingent consideration liabilities recorded as the result of our acquisitions of Eversurance and PolicyFuel, acquisitions.
Other Income (Expense)
Other income (expense) consists of interest income and other income (expense). Interest income consists of interest earned on invested cash balances. Other income (expense) consists of miscellaneous income (expense) unrelated to our core operations.
Income Taxes
Income tax expense is based on our estimate of taxable income, applicable income tax benefits for therates, net losses we have incurred in the years ended December 31, 2021 and 2020 or for our research and development tax credits, generated, as we believe, based upon the weight of available evidence, that it is more likely than not that all of our net operating loss carryforwards and tax credits will not be realized. As of December 31, 2021, we had federal net operating loss carryforwards of $104.1 million, which may be available to offset future taxable income, of which $9.0 million of the total net operating loss carryforwards expire at various dates beginningcarrybacks, changes in 2029, while the remaining $95.1 million do not expire but are limited in their usage to an annual deduction equal to 80% of annual taxable income. As of December 31, 2021, we had state net operating loss carryforwards of $87.5 million, which may be available to offset future taxable income and expire at various dates beginning in 2027. As of December 31, 2021, we also had federal and state research and development tax credit carryforwards of $5.1 million and $3.1 million, respectively, which may be available to reduce future tax liabilities and expire at various dates beginning in 2030 and 2029, respectively. During the year ended December 31, 2021, we released $2.5 million of our valuation allowance related to the netestimates and deferred tax liability recorded as a result of the PolicyFuel acquisition. We maintain a valuation allowance on our overall net deferred tax asset as it is deemed more likely than not the net deferred tax asset will not be realized.
Non-GAAP Financial
To supplement our consolidated financial statements presented in accordance with GAAP and to provide investors with additional information regarding our financial results, we present in this Annual Report on
Adjusted EBITDA
We use adjusted EBITDA to evaluate our operating performance and trends and make planning decisions. We believe adjusted EBITDA helps identify underlying trends in our business that could otherwise be masked by the effect of the expenses that we exclude in the calculation of adjusted EBITDA. Accordingly, we believe that adjusted EBITDA provides useful information to investors and others in understanding and evaluating our operating results, enhancing the overall understanding of our past performance and future prospects.
Adjusted EBITDA is not prepared in accordance with GAAP and should not be considered in isolation of, or as an alternative to, measures prepared in accordance with GAAP. There are a number of limitations related to the use of adjusted EBITDA rather than net income (loss), which is the most directly comparable financial measure calculated and presented in accordance with GAAP. Some of these limitations are:
31
In addition, other companies may use other measures to evaluate their performance, all of which could reduce the usefulness of adjusted EBITDA as a tool for comparison.
The following table reconciles adjusted EBITDA to net income (loss), the most directly comparable financial measures calculated and presented in accordance with GAAP.
Reconciliation of Net Loss to Adjusted EBITDA:
|
| Year Ended December 31, |
| |||||||||
|
| 2023 |
|
| 2022 |
|
| 2021 |
| |||
|
| (in thousands) |
| |||||||||
Net loss |
| $ | (51,287 | ) |
| $ | (24,416 | ) |
| $ | (19,434 | ) |
Stock-based compensation |
|
| 22,808 |
|
|
| 28,986 |
|
|
| 30,020 |
|
Depreciation and amortization |
|
| 6,196 |
|
|
| 5,848 |
|
|
| 5,072 |
|
Restructuring and other charges |
|
| 23,568 |
|
|
| — |
|
|
| — |
|
Acquisition-related costs |
|
| (150 | ) |
|
| (4,135 | ) |
|
| 1,065 |
|
Severance under a plan |
|
| — |
|
|
| — |
|
|
| 440 |
|
Interest income |
|
| (1,251 | ) |
|
| (349 | ) |
|
| (37 | ) |
Income taxes |
|
| 577 |
|
|
| — |
|
|
| (2,510 | ) |
Adjusted EBITDA |
| $ | 461 |
|
| $ | 5,934 |
|
| $ | 14,616 |
|
32
Year Ended December 31, | ||||||||||||
2021 | 2020 | 2019 | ||||||||||
| (in thousands) | ||||||||||||
Net loss | $ | (19,434 | ) | $ | (11,202 | ) | $ | (7,117 | ) | |||
Stock-based compensation | 30,020 | 24,179 | 12,721 | |||||||||
Depreciation and amortization | 5,072 | 3,350 | 2,186 | |||||||||
Acquisition-related costs | 1,065 | 2,258 | — | |||||||||
Legal settlement | — | — | 1,227 | |||||||||
Severance under a plan | 440 | — | — | |||||||||
Interest income | (37 | ) | (189 | ) | (669 | ) | ||||||
Benefit from income taxes | (2,510 | ) | — | — | ||||||||
Adjusted EBITDA | $ | 14,616 | $ | 18,396 | $ | 8,348 | ||||||
Results of Operations
The following tables set forth our results of operations for the periods shown:
|
| Year Ended December 31, |
| |||||||||
|
| 2023 |
|
| 2022 |
|
| 2021 |
| |||
|
| (in thousands) |
| |||||||||
Statement of Operations Data: |
|
|
|
|
|
|
|
|
| |||
Revenue(1) |
| $ | 287,921 |
|
| $ | 404,127 |
|
| $ | 418,515 |
|
Cost and operating expenses(2): |
|
|
|
|
|
|
|
|
| |||
Cost of revenue |
|
| 22,455 |
|
|
| 23,980 |
|
|
| 23,949 |
|
Sales and marketing |
|
| 240,131 |
|
|
| 349,255 |
|
|
| 354,990 |
|
Research and development |
|
| 27,591 |
|
|
| 31,713 |
|
|
| 35,732 |
|
General and administrative |
|
| 26,301 |
|
|
| 28,102 |
|
|
| 24,703 |
|
Restructuring and other charges |
|
| 23,568 |
|
|
| — |
|
|
| — |
|
Acquisition-related costs |
|
| (150 | ) |
|
| (4,135 | ) |
|
| 1,065 |
|
Total cost and operating expenses |
|
| 339,896 |
|
|
| 428,915 |
|
|
| 440,439 |
|
Loss from operations |
|
| (51,975 | ) |
|
| (24,788 | ) |
|
| (21,924 | ) |
Other income (expense): |
|
|
|
|
|
|
|
|
| |||
Interest income |
|
| 1,251 |
|
|
| 349 |
|
|
| 37 |
|
Other income (expense), net |
|
| 14 |
|
|
| 23 |
|
|
| (57 | ) |
Total other income (expense), net |
|
| 1,265 |
|
|
| 372 |
|
|
| (20 | ) |
Loss before income taxes |
|
| (50,710 | ) |
|
| (24,416 | ) |
|
| (21,944 | ) |
Income tax (expense) benefit |
|
| (577 | ) |
|
| — |
|
|
| 2,510 |
|
Net loss |
| $ | (51,287 | ) |
| $ | (24,416 | ) |
| $ | (19,434 | ) |
Other Financial and Operational Data: |
|
|
|
|
|
|
|
|
| |||
Variable marketing margin |
| $ | 100,282 |
|
| $ | 128,258 |
|
| $ | 129,553 |
|
Adjusted EBITDA(3) |
| $ | 461 |
|
| $ | 5,934 |
|
| $ | 14,616 |
|
|
| Year Ended December 31, |
| |||||||||
|
| 2023 |
|
| 2022 |
|
| 2021 |
| |||
Direct channels |
|
| 81 | % |
|
| 86 | % |
|
| 90 | % |
Indirect channels |
|
| 19 | % |
|
| 14 | % |
|
| 10 | % |
|
| 100 | % |
|
| 100 | % |
|
| 100 | % | |
Year Ended December 31, | ||||||||||||
2021 | 2020 | 2019 | ||||||||||
| (in thousands) | ||||||||||||
Statement of Operations Data: | ||||||||||||
Revenue(1) | $ | 418,515 | $ | 346,935 | $ | 248,811 | ||||||
Cost and operating expenses(2): | ||||||||||||
Cost of revenue | 23,949 | 21,373 | 15,903 | |||||||||
Sales and marketing | 354,990 | 284,880 | 202,689 | |||||||||
Research and development | 35,732 | 29,662 | 20,214 | |||||||||
General and administrative | 24,703 | 20,444 | 16,827 | |||||||||
Acquisition-related costs | 1,065 | 2,258 | — | |||||||||
Legal settlement | — | — | 1,227 | |||||||||
Total cost and operating expenses | 440,439 | 358,617 | 256,860 | |||||||||
Loss from operations | (21,924 | ) | (11,682 | ) | (8,049 | ) | ||||||
Other income (expense): | ||||||||||||
Interest income | 37 | 189 | 669 | |||||||||
Other income (expense), net | (57 | ) | 291 | 263 | ||||||||
Total other income (expense), net | (20 | ) | 480 | 932 | ||||||||
Loss before income taxes | (21,944 | ) | (11,202 | ) | (7,117 | ) | ||||||
Benefit from income taxes | 2,510 | — | — | |||||||||
Net loss | $ | (19,434 | ) | $ | (11,202 | ) | $ | (7,117 | ) | |||
Other Financial and Operational Data: | ||||||||||||
Quote requests | 30,270 | 27,013 | 20,011 | |||||||||
Variable marketing margin | $ | 129,553 | $ | 108,642 | $ | 73,316 | ||||||
Adjusted EBITDA(3) | $ | 14,616 | $ | 18,396 | $ | 8,348 | ||||||
|
| Year Ended December 31, |
| |||||||||
|
| 2023 |
|
| 2022 |
|
| 2021 |
| |||
|
| (in thousands) |
| |||||||||
Cost of revenue |
| $ | 219 |
|
| $ | 281 |
|
| $ | 363 |
|
Sales and marketing |
|
| 8,667 |
|
|
| 11,018 |
|
|
| 12,405 |
|
Research and development |
|
| 8,053 |
|
|
| 10,328 |
|
|
| 9,551 |
|
General and administrative |
|
| 5,869 |
|
|
| 7,359 |
|
|
| 7,701 |
|
Restructuring and other charges |
|
| 1,288 |
|
|
| — |
|
|
| — |
|
| $ | 24,096 |
|
| $ | 28,986 |
|
| $ | 30,020 |
| |
33
Year Ended December 31, | ||||||||||||
2021 | 2020 | 2019 | ||||||||||
Direct channels | 90 | % | 92 | % | 94 | % | ||||||
Indirect channels | 10 | % | 8 | % | 6 | % | ||||||
| 100 | % | 100 | % | 100 | % | |||||||
Year Ended December 31, | ||||||||||||
2021 | 2020 | 2019 | ||||||||||
| (in thousands) | ||||||||||||
Cost of revenue | $ | 363 | $ | 361 | $ | 193 | ||||||
Sales and marketing | 12,405 | 10,246 | 3,805 | |||||||||
Research and development | 9,551 | 7,751 | 3,967 | |||||||||
General and administrative | 7,701 | 5,821 | 4,756 | |||||||||
| $ | 30,020 | $ | 24,179 | $ | 12,721 | |||||||
(3) See “—Non-GAAP Financial Measure” for information regarding our use of adjusted EBITDA as a non-GAAP financial measure and a reconciliation of adjusted EBITDA to its comparable GAAP financial measure.
Comparison of the Years Ended December 31, 20212023 and 2020
Year Ended December 31, | Change | |||||||||||||||
2021 | 2020 | Amount | % | |||||||||||||
| (dollars in thousands) | ||||||||||||||||
Revenue | $ | 418,515 | $ | 346,935 | $ | 71,580 | 20.6 | % | ||||||||
Revenue
|
| Year Ended December 31, |
|
| Change |
| ||||||||||
|
| 2023 |
|
| 2022 |
|
| Amount |
|
| % |
| ||||
|
| (dollars in thousands) |
| |||||||||||||
Revenue |
| $ | 287,921 |
|
| $ | 404,127 |
|
| $ | (116,206 | ) |
|
| -28.8 | % |
Revenue increaseddecreased by $71.6$116.2 million from $346.9$404.1 million for the year ended December 31, 20202022 to $418.5$287.9 million for the year ended December 31, 2021.2023. The increasedecrease in revenue was due to increasesa decrease of $47.7$96.9 million in our automotive insurance vertical and $23.9a decrease of $28.3 million in our other insurance verticals, partially offset by an increase in revenue from our home and renters insurance vertical of $9.0 million. The decrease in revenue from our automotive and other insurance marketplace verticals, respectively. The increase in revenue from our automotive vertical was primarily due to an increasea decrease in the volumecarrier spend for referrals of quote requests resulting$83.3 million, including a decrease in subsidies from increased advertising to attract consumersone of our larger carrier customers, and to an increasea decrease in commission revenue of $4.7$13.6 million. The increasedecrease in revenue from our other marketplaceinsurance verticals was primarily due to an increase of $14.9 milliona decrease in commission revenue of $18.7 million and a decrease in carrier spend for referrals of $9.6 million, both due primarily into our exit from health vertical, and an increase in revenue per quote request as a result of increased demand for consumer referrals by our insurance providers.
Cost of Revenue
Year Ended December 31, | Change | |||||||||||||||
2021 | 2020 | Amount | % | |||||||||||||
| (dollars in thousands) | ||||||||||||||||
Cost of revenue | $ | 23,949 | $ | 21,373 | $ | 2,576 | 12.1 | % | ||||||||
Percentage of revenue | 5.7 | % | 6.2 | % | ||||||||||||
|
| Year Ended December 31, |
|
| Change |
| ||||||||||
|
| 2023 |
|
| 2022 |
|
| Amount |
|
| % |
| ||||
|
| (dollars in thousands) |
| |||||||||||||
Cost of revenue |
| $ | 22,455 |
|
| $ | 23,980 |
|
| $ | (1,525 | ) |
|
| -6.4 | % |
Percentage of revenue |
|
| 7.8 | % |
|
| 5.9 | % |
|
|
|
|
|
| ||
Cost of revenue increased by $2.6 milliondecreased from $21.4$24.0 million for the year ended December 31, 20202022 to $23.9$22.5 million for the year ended December 31, 2021.2023. Cost of revenue increaseddecreased primarily due primarily to increaseda decrease in third-party call center costs of $2.5$3.1 million which were primarilyas a result of shifting call referrals from third-party call centers to employees and a decrease in calls related to our health insurance vertical. Hosting costs also decreased by $0.9 million. These decreases were partially offset by increased volumepersonnel-related costs of $1.4 million due to the shift of call referrals. Amortizationreferrals from third-party call centers to employees and an increase in depreciation expense of capitalized software costs increased by $0.4 million.
Sales and Marketing
Year Ended December 31, | Change | |||||||||||||||
2021 | 2020 | Amount | % | |||||||||||||
| (dollars in thousands) | ||||||||||||||||
Sales and marketing expense | $ | 354,990 | $ | 284,880 | $ | 70,110 | 24.6 | % | ||||||||
Percentage of revenue | 84.8 | % | 82.1 | % | ||||||||||||
|
| Year Ended December 31, |
|
| Change |
| ||||||||||
|
| 2023 |
|
| 2022 |
|
| Amount |
|
| % |
| ||||
|
| (dollars in thousands) |
| |||||||||||||
Sales and marketing expense |
| $ | 240,131 |
|
| $ | 349,255 |
|
| $ | (109,124 | ) |
|
| -31.2 | % |
Percentage of revenue |
|
| 83.4 | % |
|
| 86.4 | % |
|
|
|
|
|
| ||
Sales and marketing expenses increaseddecreased by $70.1$109.1 million from $284.9$349.3 million for the year ended December 31, 20202022 to $355.0$240.1 million for the year ended December 31, 2021.2023. The increasedecrease in sales and marketing expense was primarily due to an increasea decrease in advertising expenditurescosts of $50.7$88.2 million due to a decrease in carrier spend. Sales and an increasemarketing expenses also decreased due to our exit from the health insurance vertical, including decreases in personnel-related costs and office and occupancy costs of $16.2 million. The increase$15.7 million and $1.0 million, respectively, and decreases in personnel-related costs was primarilydepreciation and amortization expense and agent license fees of $0.7 million and $0.6 million, respectively. Technology services also decreased by $1.1 million and agent marketing decreased by $0.5 million due to an increase in headcount, a significant portion of which was in DTC agency. Personnel-related costs for the year ended December 31, 2021 included severance costs of $0.4 million. Personnel-related costs for the years ended December 31, 2021lower usage and 2020 included stock-based compensation expense of $12.4 million and $10.2 million, respectively.
Research and Development
|
| Year Ended December 31, |
|
| Change |
| ||||||||||
|
| 2023 |
|
| 2022 |
|
| Amount |
|
| % |
| ||||
|
| (dollars in thousands) |
| |||||||||||||
Research and development expense |
| $ | 27,591 |
|
| $ | 31,713 |
|
| $ | (4,122 | ) |
|
| -13.0 | % |
Percentage of revenue |
|
| 9.6 | % |
|
| 7.8 | % |
|
|
|
|
|
| ||
34
Year Ended December 31, | Change | |||||||||||||||
2021 | 2020 | Amount | % | |||||||||||||
| (dollars in thousands) | ||||||||||||||||
Research and development expense | $ | 35,732 | $ | 29,662 | $ | 6,070 | 20.5 | % | ||||||||
Percentage of revenue | 8.5 | % | 8.5 | % | ||||||||||||
Research and development expenses increaseddecreased by $6.1$4.1 million from $29.7$31.7 million for the year ended December 31, 20202022 to $35.7$27.6 million for the year ended December 31, 2021.2023. The increasedecrease in research and development expense was primarily due to an increasea decrease in personnel-related costs of $4.7costs.
General and Administrative
|
| Year Ended December 31, |
|
| Change |
| ||||||||||
|
| 2023 |
|
| 2022 |
|
| Amount |
|
| % |
| ||||
|
| (dollars in thousands) |
| |||||||||||||
General and administrative expense |
| $ | 26,301 |
|
| $ | 28,102 |
|
| $ | (1,801 | ) |
|
| -6.4 | % |
Percentage of revenue |
|
| 9.1 | % |
|
| 7.0 | % |
|
|
|
|
|
| ||
General and administrative expenses decreased by $1.8 million as a result of our continued hiring of research and development employees and a shift towards hiring more senior personnel, to further develop and enhance our marketplace websites and technology. Personnel-related costs for the years ended December 31, 2021 and 2020 included stock-based compensation expense of $9.6 million and $7.8 million, respectively. Technical service costs also increased by $1.3from $28.1 million for the year ended December 31, 2021 as compared2022 to the year ended December 31, 2020.
Year Ended December 31, | Change | |||||||||||||||
2021 | 2020 | Amount | % | |||||||||||||
| (dollars in thousands) | ||||||||||||||||
General and administrative expense | $ | 24,703 | $ | 20,444 | $ | 4,259 | 20.8 | % | ||||||||
Percentage of revenue | 5.9 | % | 5.9 | % | ||||||||||||
Restructuring and Other Charges
Restructuring and other charges of $23.6 million for the yearsyear ended December 31, 20212023 consisted of costs related to the Reduction Plan implemented in June 2023. Restructuring and 2020other charges primarily included stock-based compensation expensethe loss on the sale of $7.7health insurance vertical assets of $19.4 million and $5.8an asset impairment charge of $0.4 million respectively.
Acquisition-related Costs
Acquisition-related costs for the years ended December 31, 20212023 and 20202022 were $1.1$(0.2) million and $2.3$(4.1) million, respectively, and includedrespectively. We recorded these credits to acquisition-related costs for third-party professional services we utilizedthe years ended December 31, 2023 and 2022 for the evaluation and execution of our completed acquisitions of $0.9 million and $0.5 million, respectively. Acquisition-related costs also included the changedecreases in the fair value of our contingent consideration liabilities recorded as the resultliabilities. The decreases in fair value were related to our future revenue forecasts and to a lesser extent, changes in market value of our acquisitions, which were comprisedClass A common stock.
Other Income (Expense)
Other income (expense) included interest income of expenses of $0.2$1.3 million and $1.8$0.3 million for the years ended December 31, 20212023 and 2020,2022, respectively.
Income Taxes
Income tax expense of $0.3$0.6 million for the year ended December 31, 2020. The sublease2023 consisted of foreign and state income expense. We did not record income tax expense for the year ended in 2020.
Year Ended December 31, | Change | |||||||||||||||
2021 | 2020 | Amount | % | |||||||||||||
| (in thousands except percentages) | ||||||||||||||||
Quote requests | 30,270 | 27,013 | 3,257 | 12.1 | % | |||||||||||
Variable Marketing Margin
|
| Year Ended December 31, |
|
| Change |
| ||||||||||
|
| 2023 |
|
| 2022 |
|
| Amount |
|
| % |
| ||||
|
| (dollars in thousands) |
| |||||||||||||
Revenue |
| $ | 287,921 |
|
| $ | 404,127 |
|
| $ | (116,206 | ) |
|
| -28.8 | % |
Less: total advertising expense (a |
|
| 187,639 |
|
|
| 275,869 |
|
|
|
|
|
|
| ||
Variable marketing margin |
| $ | 100,282 |
|
| $ | 128,258 |
|
| $ | (27,976 | ) |
|
| -21.8 | % |
Percentage of revenue |
|
| 34.8 | % |
|
| 31.7 | % |
|
|
|
|
|
| ||
35
Year Ended December 31, | Change | |||||||||||||||
2021 | 2020 | Amount | % | |||||||||||||
| (dollars in thousands) | ||||||||||||||||
Revenue | $ | 418,515 | $ | 346,935 | $ | 71,580 | 20.6 | % | ||||||||
Less: total advertising expense (a component of sales and marketing expense) | 288,962 | 238,293 | ||||||||||||||
Variable marketing margin | $ | 129,553 | $ | 108,642 | $ | 20,911 | 19.2 | % | ||||||||
Percentage of revenue | 31.0 | % | 31.3 | % | ||||||||||||
The increasedecrease in variable marketing margin was due primarily to increased quote requests and growth in our commissions revenue.
Comparison of the Years Ended December 31, 20202022 and 2019
For a discussion of our results of operations for the year ended December 31, 20202022 as compared to the year ended December 31, 2019,
Liquidity and Capital Resources
Our principal sources of liquidity wereare cash and cash equivalents of $34.9$38.0 million as of December 31, 2023 and availability ofup to $25.0 million of availability under our revolving line of credit. In Februarycredit pursuant to the 2023 Amended Loan Agreement (defined as the Amended and Restated Loan and Security Agreement, dated as of August 7, 2020 between us and Western Alliance Bank, as Lender, as amended by the Loan and Security Modification Agreement dated as of July 15, 2022, we completed a private placementas amended by the Loan and Security Modification Agreement dated as of sharesAugust 1, 2023, as amended by the Loan and Security Modification Agreement, dated as of Class A common stock resulting in proceedson August 7, 2023).
Pursuant to us of $15.0 million.
Borrowings are collateralized by substantially all of our assets and property. Additionally,Under the 2023 Amended Loan Agreement, we are subject under our revolving line of credithave agreed to certain affirmative and negative covenants to which we will remain subject until maturity. TheseThe covenants include limitations on our ability to incur additional indebtedness and engage in certain fundamental business transactions, such as mergers or acquisitions of other businesses. As of December 31, 2021, we were in compliance with these covenants. In addition, under the 2023 Amended Loan Agreement and through the maturity date, we are required to maintain a minimum asset coverageAdjusted Quick Ratio of 1.10 to 1.00 defined as the ratio of 1.5 to 1 calculated as(1) the sum of unrestricted cash and qualifiedcash equivalents held at the Lender plus (y) net accounts receivable divided byreflected on our balance sheet to (2) current liabilities, including all borrowings outstanding under the 2023 Amended Loan Agreement, but excluding the current portion of deferred revenue (in each case determined in accordance with GAAP). At any time the Adjusted Quick Ratio is less than 1.30 to 1.00 the Lender shall have the ability to use our cash receipts to repay outstanding obligations until such time as the Adjusted Quick Ratio is equal to or greater than 1.30 to 1.00 for two consecutive months. As of December 31, 2023, we were in compliance with these covenants and we had no amounts outstanding under the revolving line of credit. Events
In addition, we are filing a universal shelf registration statement on Form S-3 with the SEC concurrently with the filing of defaultthis Annual Report on Form 10-K, which when declared effective, will register for sale up to $150.0 million of any combination of our common stock, preferred stock, debt securities, warrants, rights or units from time to time and at prices and on terms that we may determine. The net proceeds of any securities we sell under our revolving linethis registration statement may be used for general corporate purposes, including among other possible uses, the acquisition of credit include failurecompanies or businesses, repayment and refinancing of debt, working capital and capital expenditures. At this time we have no plans to make payments when due, insolvency events, failure to comply with covenants and material adverse events with respect to us. In the event of a default, the lender may declare all borrowings immediately due and payable.
Since our inception, we have incurred operating losses and may continue to incur losses in the foreseeable future. We anticipate that our operating expenses and capital expenditures will increase substantially in the near term as we continue to expand our DTC agency, hire additional employees and improve our technology and infrastructure capabilities. Additionally, a significant portion of the commission revenue we record will be collected over a multi-year time frame as policyholders renew their policies, and we are paid commissions on those renewals. As of December 31, 2021, $13.4 million of our $22.7 million commissions receivable contract asset was classified as long term. We believe our existing cash and cash equivalents will be sufficient to fund our operating expenses and capital expenditure requirements for at least the next 12 months, without considering the borrowing availability under our revolving line of credit. Our future capital requirements may vary materially from those currently planned and will depend on many factors, including our rate of revenue, growth, the timing and extent of spending on business initiatives, purchases of capital equipment to support our growth, the expansion of sales and marketing activities, impact to our business from our recent restructuring, expansion of our business through acquisitions or our investments in complementary offerings, technologies or businesses, market acceptance of our platform and overall economic conditions. If we do not achieve our revenue goals as planned, we believe that we can reduce our operating costs. If we need additional funds and are unable to obtain funding on a timely basis, we may need to significantly curtail our operations in an effort to provide sufficient funds to continue our operations, which could adversely affect our business prospects.
36
Cash Flows
The following table shows a summary of our cash flows:
Year Ended December 31, | ||||||||||||
2021 | 2020 | 2019 | ||||||||||
| (in thousands) | ||||||||||||
Net cash provided by operating activities | $ | 7,189 | $ | 10,668 | $ | 4,413 | ||||||
Net cash used in investing activities | (18,817 | ) | (18,752 | ) | (2,975 | ) | ||||||
Net cash provided by financing activities | 3,615 | 4,907 | 2,982 | |||||||||
Effect of exchange rate changes on cash, cash equivalents and restricted cash | (6 | ) | (7 | ) | — | |||||||
Net increase (decrease) in cash, cash equivalents and restricted cash | $ | (8,019 | ) | $ | (3,184 | ) | $ | 4,420 | ||||
|
| Year Ended December 31, |
| |||||||||
|
| 2023 |
|
| 2022 |
|
| 2021 |
| |||
|
| (in thousands) |
| |||||||||
Net cash provided by (used in) operating activities |
| $ | (2,828 | ) |
| $ | (15,791 | ) |
| $ | 7,189 |
|
Net cash provided by (used in) investing activities |
|
| 9,354 |
|
|
| (4,290 | ) |
|
| (18,817 | ) |
Net cash provided by financing activities |
|
| 577 |
|
|
| 15,842 |
|
|
| 3,615 |
|
Effect of exchange rate changes on cash, |
|
| 18 |
|
|
| (27 | ) |
|
| (6 | ) |
Net increase (decrease) in cash, cash equivalents |
| $ | 7,121 |
|
| $ | (4,266 | ) |
| $ | (8,019 | ) |
Operating activities
Operating activities provided $7.2used $2.8 million and $10.7$15.8 million of cash during the years ended December 31, 20212023 and 2020,2022, respectively. Cash providedused by operating activities in the year ended December 31, 2021 primarily2023 resulted from the offset of netnon-cashcharges of $32.8 million to our net loss of $19.4$51.3 million partially offset byand net cash used by changes in our operating assets and liabilities of $6.1$1.7 million, partially offset by net non-cash charges of $50.1 million, which included a loss on sale of health assets of $19.4 million. Net cash used by changes in our operating assets and liabilities consisted primarily of a $10.9 million and $3.6 million increase in other assets and prepaid expenses and other current assets, respectively, and a $1.3$15.0 million decrease in accounts payable and accrued expenses and other current liabilities. These amounts wereliabilities, partially offset by a $10.5an $8.2 million decrease in accounts receivable. receivable, a $4.2 million decrease in commissions receivable and a $1.0 million decrease in prepaid expenses and other current assets.
Cash providedused by operating activities in 2020 primarilythe year ended December 31, 2022 resulted from the offset of netnon-cashcharges of $29.4 million to our net loss of $11.2$24.4 million and net cash used by changes in our operating assets and liabilities of $7.5$22.8 million, partially offset by net non-cash charges of $31.4 million. Net cash used by changes in our operating assets and liabilities consisted primarily of a $14.0$24.2 million increase in accountscommissions receivable, partially offset by an aggregate $5.3a $2.1 million increase in prepaid expenses and other current assets and a $1.3 million decrease in accounts payable and accrued expenses and other current liabilities, andpartially offset by a $0.8$5.4 million increasedecrease in other long-term liabilities.
Changes in accounts receivable, prepaid expenses and other current assets and accounts payable and accrued expenses and other current liabilities were generally due to growthlevel of activity in our business and timing of customer and vendor invoicing and payments. The change in other long-term liabilities in 2020 was primarily due to the deferred payment of employer tax remittances. Collection of commissions receivable which are included in prepaid expenses and other current assets and other assets depends upon the timing of our receipt of commission payments from insurance carriers. A significant portion of our commissions receivable asset is classified as long term.
Investing activities
Net cash used inprovided by investing activities
Financing activities
During the years ended December 31, 20212023 and 2020,2022, net cash provided by financing activities was $3.6$0.6 million and $4.9$15.8 million, respectively, andrespectively. Net cash provided by financing activities during the year ended December 31, 2023 consisted of proceeds received from the exercise of common stock options, partially offset by tax withholding payments relating to net share settlements. Net cash provided by financing activities during the year ended December 31, 2022 consisted primarily of $15.0 million of proceeds from the issuance and sale of shares of common stock in a private placement with Recognition Capital, LLC, an entity which is owned and controlled by David Blundin, Chairman of the Board of Directors and co-founder of the Company, and $0.9 million from the exercise of common stock options.
For a discussion of our cash flows for the year ended December 31, 2019,2020.2022.
37
Contractual Obligations and Commitments
Our cash flows are dependent on a number of factors in addition to our operational expenditures, including our contractual and other obligations. As a result, our liquidity and capital resources in future periods should be analyzed in conjunction with such factors.
We lease office space in Cambridge, Massachusetts under aat various other locations undernon-cancelableoperating leasesin Austin, Texas pursuant to a lease that expire at varying dates through 2030.expires in April 2025. As of December 31, 2021,2023, we were obligated to make total minimum lease payments of $8.9$2.2 million under such leases, of which $3.0$2.1 million is payable in 2022.
We have outstanding agreements with various vendors for hosting and other technical services. We believe that we will be able to fund these obligations through our existing cash and cash equivalents.
Critical Accounting Policies and Significant Judgments and Estimates
Our consolidated financial statements are prepared in accordance with GAAP. The preparation of our consolidated financial statements and related disclosures requires us to make estimates and judgments that affect the reported amounts of assets, liabilities, revenue, costs and expenses, and the disclosure of contingent assets and liabilities in our consolidated financial statements. We base our estimates on historical experience, known trends and events, and various other factors that we believe are reasonable under the circumstances, the results of which form the basis for making judgments about the carrying values of assets and liabilities that are not readily apparent from other sources. We evaluate our estimates and assumptions on an ongoing basis. Our actual results may differ from these estimates under different assumptions or conditions.
While our significant accounting policies are described in more detail in Note 2 to our audited consolidated financial statements, appearing in Part II, of Item 8 of this Annual Report on Form
Revenue Recognition
We derive our revenue primarily by selling consumer referrals to our insurance provider customers, including insurance carriers, agents and indirect distributors. We also generate revenue from commission fees for the sale of policies, primarily in our automotive insurance vertical, and prior to our exit from health, in our health insurance vertical. To determine revenue recognition for arrangements that we determine are within the scope of ASC 606 Revenue from Contracts with Customers, or ASC 606, we perform the following five steps: (i) identify the contract(s) with a customer; (ii) identify the performance obligations in the contract; (iii) determine the transaction price; (iv) allocate the transaction price to the performance obligations in the contract; and (v) recognize revenue when (or as) we satisfy a performance obligation.
We only apply the five-step model to contracts when collectibility of the consideration to which we are entitled in exchange for the goods or services we transfer to the customer is determined to be probable. Amounts are recorded as accounts receivable when our right to consideration is unconditional. We do not assess whether a contract has a significant financing component if the expectation at contract inception is that the period between payment by the customer and the transfer of the promised goods or services to the customer will be one year or less.
Referral Revenue
We recognize referral revenue when we satisfy our performance obligations by delivering the referrals to our customers in an amount that reflects the consideration to which we expect to be entitled in exchange for those referrals.
Commission Revenue
Our commission revenue consists of the constrained LTVs of commission payments that we expect to receive in our automotive insurance vertical, and prior to our exit from health, that we expected to receive in our health insurance vertical on the sale of insurance policies to consumers and renewals of such policies. Commission revenue is recognized upon satisfaction of our performance obligation. We consider our performance obligation related to commissions for both the initial policy sale and future renewals of the policy to be satisfied upon submission of the policy application. Therefore, a significant portion of the commission revenue we record upon satisfaction of our performance obligation is paid by our insurance provider customer over a multi-year time frame as policyholders renew and pay the insurance provider for their policies. The current portion of commissions receivable consists of estimated commissions on new policies sold and estimated renewal commissions on policies expected to be renewed within one year, while the non-current portion of commissions receivable are commissions for estimated renewals expected to be renewed beyond one year. Commission revenue represented less than 10% of total revenue for the year ended December 31, 2023.
38
Commission revenue from auto insurance carriers consists of constrained LTVs of commission payments we expect to receive for selling an insurance policy based on the effective date of the policy. Our estimate of constrained LTVs is based on an analysis of historical commission payment trends for relevant policies to establish an expected lifetime value and incorporates management’s judgment in interpreting those trends to calculate LTVs and to apply constraints to such LTVs. The most significant factor impacting historical trends is average policy duration. We apply a constraint to our estimated LTVs to only recognize the amount of variable consideration that we believe is probable that we will be entitled to receive and will not be subject to a significant revenue reversal in the future. To the extent that commission payment trends change or the underlying factors impacting commission payments change, our estimate of constrained LTVs could be materially impacted. To the extent we make changes to our estimates of constrained LTVs, we recognize any material impact of the change to commission revenue in the reporting period in which the change is made, including revisions of estimated lifetime commissions either below or in excess of previously estimated constrained LTVs recognized as an adjustment to revenue and the related contract asset. We recognize revenue for new policies by applying the latest estimated constrained LTV for that product. We had commissions receivable of $12.0 million as of December 31, 2023, of which $4.3 million was classified as current.
Goodwill and Acquired Intangible Assets
We record goodwill when consideration paid in a business acquisition exceeds the value of the net assets acquired. Our estimates of fair value are based upon assumptions believed to be reasonable at that time but that are inherently uncertain and unpredictable. Assumptions may be incomplete or inaccurate, and unanticipated events or circumstances may occur, which may affect the accuracy or validity of such assumptions, estimates or actual results. During the measurement period, which extends no later than one year from the acquisition date, we may record certain adjustments to the carrying value of the assets acquired and liabilities assumed with the corresponding offset to goodwill. After the measurement period, all adjustments are recorded in the consolidated statements of operations and comprehensive loss as operating expenses or income. Our preliminary estimate of the fair value of specifically identifiable assets acquired and liabilities assumed as of the date of acquisition of PolicyFuel is subject to change upon finalizing our valuation analysis. We expect to finalize our fair value estimates in the first half of 2022.
Goodwill is not amortized, but rather is tested for impairment annually in the fourth quarter, or more frequently if facts and circumstances warrant a review, such as significant underperformance of the business in relation to expectations, significant negative industry or economic trends and significant changes or planned changes in the use of the assets. We have determined that there is a single reporting unit for the purpose of conducting our goodwill impairment assessment. We assess both the existence of potential impairment and the amount of impairment loss by comparing the fair value of the reporting unit with its carrying amount, including goodwill. Intangible assets are recorded at their estimated fair values at the date of acquisition. We amortize acquired intangible assets over their estimated useful lives based on the pattern of consumption of the economic benefits or, if that pattern cannot be readily determined, on a straight-line basis. To date, we have not recorded any impairments of goodwill or acquired intangible assets.
Valuation of Contingent Consideration
In connection with our acquisitions of Eversurance and PolicyFuel we agreed to issue shares of Class A common stock to the former owners upon the achievement of certain revenue targets. Achievement of revenue targets that will result in the issuance of a variable number of shares of Class A common stock are accounted for as a liability. We estimated the fair value of the shares of Class A common stock issuable upon achievement of the targets as of the acquisition date. We remeasure the fair value of the shares of Class A common stock issuable at each subsequent reporting date until the liability is fully settled. We use Monte Carlo simulation models in our estimates. The estimated fair value of the contingent consideration is based upon available information and
We used a Monte Carlo simulation model in our estimates of the fair value of the contingent consideration related to the PolicyFuel acquisition that will be settled over the nextbased on achievement at varying levels of three years.annual targets. The most significant assumptions and estimates utilized in the model include forecasted revenue (an acquisition specific input) and the market value of our Class A common stock (an observable input). Other assumptions utilized in the model include equity volatility, revenue volatility and discount rate. We issued 62,671 shares of our Class A common stock in December 2022 to settle the first milestone related to the PolicyFuel contingent consideration. The fair value of our contingent consideration liability for the PolicyFuel shares for the second and third milestones was $3.8 million as of the date of acquisition and $5.3 millionzero as of December 31, 2021. The increase in the fair value of the contingent consideration liability for the PolicyFuel shares was primarily due to a change in estimate of forecasted revenue, partially offset by the decrease in the market value of our Class A common stock during the period. A hypothetical change of 10% in our estimate of the number of shares of our Class A common stock to be released upon achievement of the revenue targets, assuming no change to the market value of Class A common stock, would change the fair value of our estimated liability as of December 31, 2021 by $0.4 million. A hypothetical change of 10% in the market value of our Class A common stock, assuming no change to the estimated number of shares to be released upon achievement of the revenue targets, would change the fair value of our estimated liability as of December 31, 2021 by $0.3 million.
Stock-Based Compensation
We measure stock options and other stock-based awards granted to employees,non-employeesreceived.received, which is generally the vesting period of the respective award.
39
We estimate the fair value of stock options with service-based vesting or performance-based vesting granted to employees,non-employeesBlack-Scholes option-pricingBlack Scholes option pricing model, which uses as inputs the fair value of our common stock and assumptions we make for the volatility of our common stock, the expected term of our common stock options, the risk-free interest rate for a period that approximates the expected term of our common stock options, and our expected dividend yield. We measure stock options with
Recently Issued Accounting Pronouncements
A description of recently issued accounting pronouncements that may potentially impact our financial position and results of operations is disclosed in Note 2 to our audited consolidated financial statements appearing in Part II, Item 8 of this Annual Report on Form
ITEM 7A. QUANTITATIVE AND QUALITATIVE DISCLOSURES ABOUT MARKET RISK
We have a credit agreement that provides us with a revolving line of credit of up to $25.0 million. Borrowings bear interest at a floating rate of the greater of 3.25% or the prime rate.interest. As of December 31, 2021,2023, we had no outstanding borrowings under our revolving line of credit facility and therefore no material exposure to fluctuations in interest rates.
We contract with vendors in foreign countries and we have foreign subsidiaries. As such, we have exposure to adverse changes in exchange rates of foreign currencies associated with our foreign transactions and our foreign subsidiaries. We believe this exposure to be immaterial. We do not hedge against this exposure to fluctuations in exchange rates.
40
ITEM 8. CONSOLIDATED FINANCIAL STATEMENTS AND SUPPLEMENTARY DATA
EVERQUOTE, INC.
Index to Consolidated Financial Statements
Page(s) | ||
42 | ||
44 | ||
45 | ||
46 | ||
47 | ||
48 |
41
Report of Independent Registered Public Accounting Firm
To the
Opinions on the Financial Statements and Internal Control over Financial Reporting
We have audited the accompanying consolidated balance sheets of EverQuote, Inc. and its subsidiaries (the “Company”) as of December 31, 20212023 and 2020,2022, and the related consolidated statements of operations and comprehensive loss, of stockholders’ equity and of cash flows for each of the three years in the period ended December 31, 2021,2023, including the related notes (collectively referred to as the “consolidated financial statements”). We also have audited the Company’sCompany's internal control over financial reporting as of December 31, 2021,2023, based on criteria established inControl—Control - Integrated Framework
In our opinion, the consolidated financial statements referred to above present fairly, in all material respects, the financial position of the Company as of December 31, 20212023 and 2020,2022, and the results of its operations and its cash flows for each of the three years in the period ended December 31, 20212023 in conformity with accounting principles generally accepted in the United States of America. Also in our opinion, the Company did not maintain,maintained, in all material respects, effective internal control over financial reporting as of December 31, 2021,2023, based on criteria established in—COSO because material weaknesses in internal control over financial reporting existed as of that date as the Company did not design and maintain (i) user access controls to ensure appropriate segregation of duties and that adequately restrict user and privileged access to certain revenue-related financial applications, programs, and data to appropriate company personnel; (ii) program change management controls for certain revenue-related financial applications to ensure that information technology (IT) program and data changes affecting financial IT applications and underlying accounting records are identified, tested, authorized and implemented appropriately; and (iii) controls over the completeness and accuracy of data relevant to certain automated revenue calculations.
Basis for Opinions
The Company’sCompany's management is responsible for these consolidated financial statements, for maintaining effective internal control over financial reporting, and for its assessment of the effectiveness of internal control over financial reporting, included in management’s report referred to above.Management’s Report on Internal Control over Financial Reporting appearing under Item 9A. Our responsibility is to express opinions on the Company’s consolidated financial statements and on the Company’sCompany's internal control over financial reporting based on our audits. We are a public accounting firm registered with the Public Company Accounting Oversight Board (United States) (PCAOB) and are required to be independent with respect to the Company in accordance with the U.S. federal securities laws and the applicable rules and regulations of the Securities and Exchange Commission and the PCAOB.
We conducted our audits in accordance with the standards of the PCAOB. Those standards require that we plan and perform the audits to obtain reasonable assurance about whether the consolidated financial statements are free of material misstatement, whether due to error or fraud, and whether effective internal control over financial reporting was maintained in all material respects.
Our audits of the consolidated financial statements included performing procedures to assess the risks of material misstatement of the consolidated financial statements, whether due to error or fraud, and performing procedures that respond to those risks. Such procedures included examining, on a test basis, evidence regarding the amounts and disclosures in the consolidated financial statements. Our audits also included evaluating the accounting principles used and significant estimates made by management, as well as evaluating the overall presentation of the consolidated financial statements. Our audit of internal control over financial reporting included obtaining an understanding of internal control over financial reporting, assessing the risk that a material weakness exists, and testing and evaluating the design and operating effectiveness of internal control based on the assessed risk. Our audits also included performing such other procedures as we considered necessary in the circumstances. We believe that our audits provide a reasonable basis for our opinions.
Definition and Limitations of Internal Control over Financial Reporting
A company’s internal control over financial reporting is a process designed to provide reasonable assurance regarding the reliability of financial reporting and the preparation of financial statements for external purposes in accordance with generally accepted accounting principles. A company’s internal control over financial reporting includes those policies and procedures that (i) pertain to the maintenance of records that, in reasonable detail, accurately and fairly reflect the transactions and dispositions of the assets of the company; (ii) provide reasonable assurance that transactions are recorded as necessary to permit preparation of financial statements in accordance with generally accepted accounting principles, and that receipts and expenditures of the company are being made only in accordance with authorizations of management and directors of the company; and (iii) provide reasonable assurance regarding prevention or timely detection of unauthorized acquisition, use, or disposition of the company’s assets that could have a material effect on the financial statements.
Because of its inherent limitations, internal control over financial reporting may not prevent or detect misstatements. Also, projections of any evaluation of effectiveness to future periods are subject to the risk that controls may become inadequate because of changes in conditions, or that the degree of compliance with the policies or procedures may deteriorate.
42
Critical Audit Matters
The critical audit matter communicated below is a matter arising from the current period audit of the consolidated financial statements that was communicated or required to be communicated to the audit committee and that (i) relates to accounts or disclosures that are material to the consolidated financial statements and (ii) involved our especially challenging, subjective, or complex judgments. The communication of critical audit matters does not alter in any way our opinion on the consolidated financial statements, taken as a whole, and we are not, by communicating the critical audit matter below, providing a separate opinion on the critical audit matter or on the accounts or disclosures to which it relates.
Revenue Recognition – Valuation of Contingent Consideration and Customer Relationships Intangible Asset
As described in Notes 3 and 4Note 2 to the consolidated financial statements, the Company completedderives its acquisitionrevenue primarily by selling consumer referrals to its insurance provider customers, including insurance carriers, agents and indirect distributors. Revenue from certain referrals makes up the majority of Policy Fuel, LLC andtotal revenue of $287.9 million. The Company recognizes referral revenue when it satisfies its Affiliated Entities (PolicyFuel) on August 13, 2021. The purchase consideration of $20.0 million reflected a cash payment of $16.0 million, net of cash acquired, settlement ofperformance obligations by delivering the referrals to its customers in an outstanding receivable from PolicyFuel of $0.2 million, and contingent consideration of $3.8 million, representingamount that reflects the estimated fair value as of the acquisition date of Class A common stock issuable to the former owners of PolicyFuel upon achievement of certain revenue targets over the next three years. The former owners of PolicyFuel are eligible to receive shares of Class A common stock upon the achievement (at varying levels) of each of three twelve-month revenue targets. As achievement of each of the three twelve-month targets will result in the issuance of a variable number of shares of Class A common stock, management has recorded the fair value of this contingent consideration within accrued expenses and other current liabilities (first annual target) and within other long-term liabilities (second and third annual targets). As of December 31, 2021, management estimated the fair value of the contingent consideration to which it expects to be $5.3 million, and as a result recorded a $1.5 million charge to acquisition-related costsentitled in exchange for the increase in fair value subsequent to the acquisition date. Management estimated the fair value of the contingent consideration as of the acquisition date, and remeasures the fair value of the contingent consideration at each subsequent reporting date until the liability is fully settled, using a Monte Carlo simulation model. Management’s significant assumptions and estimates utilized in the model include the forecasted revenue, equity volatility, revenue volatility, and discount rate. Additionally, as part of the preliminary allocation of the purchase price for PolicyFuel, management recorded $6.6 million for the customer relationships intangible asset at fair value using the income approach. Management’s significant assumptions and estimates utilized in the model include the revenue and earnings growth rates, royalty rates, and the discount rate.
The principal considerationsconsideration for our determination that performing procedures relating to the valuation of contingent consideration and the customer relationships intangible asset in the PolicyFuel acquisitionrevenue recognition from certain referrals is a critical audit matter are (i)is a high degree of auditor judgment and subjectivity in applying procedures relating to the fair value of the contingent consideration and the customer relationships intangible asset due to the significant judgment by management when determining the fair values, (ii) the significant audit effort in evaluating management’s significant assumptionsperforming procedures related to the forecastedCompany’s revenue equity volatility, and revenue volatility for the contingent consideration, and the revenue and earnings growth rates, royalty rates, and discount rate for the customer relationships intangible asset, and (iii) the audit effort involved the use of professionals with specialized skill and knowledge.
Addressing the matter involved performing procedures and evaluating audit evidence in connection with forming our overall opinion on the consolidated financial statements. These procedures included testing the effectiveness of controls relating to the acquisition accounting, including controls over management’s determination of the fair value of the contingent consideration, the customer relationships intangible asset, and changes in the fair value of the contingent consideration at subsequent reporting dates.referral revenue recognition process. These procedures also included, among others (i) readingevaluating revenue from certain referral transactions by testing the purchase agreement,issuance and settlement of invoices and credit memos; (ii) tracing transactions not settled to a detailed listing of accounts receivable; (iii) confirming a sample of outstanding customer invoice balances at year end and, where applicable, obtaining and inspecting source documents, such as subsequent cash receipts, invoices, and other supporting documentation for confirmations not returned; and (iv) testing the completeness and accuracy of the underlying data used in the valuation models, and (iii) evaluating the appropriateness of the valuation models and reasonableness of the significant assumptions usedprovided by management related to the forecasted revenue, equity volatility, and revenue volatility for the contingent consideration as of the acquisition date and December 31, 2021, and the revenue and earnings growth rates, royalty rates, and discount rate for the customer relationships intangible asset. Evaluating the reasonableness of the forecasted revenue used in the determination of the fair value of the contingent consideration involved considering the consistency with external economic and market data. Evaluating the reasonableness of the revenue and earnings growth rates used in the determination of the fair value of the customer relationships intangible asset involved considering the consistency with historical data as well as consistency with external economic and market data. Professionals with specialized skill and knowledge were used to assist in the evaluation of the appropriateness of the Monte Carlo simulation model for the contingent consideration and the income approach for the customer relationships intangible asset, as well as evaluating the
/s/
Boston, Massachusetts
February 25, 2022
We have served as the Company’s auditor since 2014.
43
EVERQUOTE, INC.
CONSOLIDATED BALANCE SHEETS
(In thousands, except share and per share amounts)
December 31, | ||||||||
2021 | 2020 | |||||||
Assets | ||||||||
Current assets: | ||||||||
Cash and cash equivalents | $ | 34,851 | $ | 42,870 | ||||
Accounts receivable, net | 35,659 | 46,079 | ||||||
Prepaid expenses and other current assets | 14,184 | 8,452 | ||||||
Total current assets | 84,694 | 97,401 | ||||||
Property and equipment, net | 5,796 | 6,173 | ||||||
Goodwill | 21,501 | 9,794 | ||||||
Acquired intangible assets, net | 10,229 | 3,366 | ||||||
Operating lease right-of-use | 7,291 | 9,621 | ||||||
Other assets | 14,096 | 2,695 | ||||||
Total assets | $ | 143,607 | $ | 129,050 | ||||
Liabilities and Stockholders’ Equity | ||||||||
Current liabilities: | ||||||||
Accounts payable | $ | 29,599 | $ | 32,964 | ||||
Accrued expenses and other current liabilities | 13,015 | 9,421 | ||||||
Deferred revenue | 2,096 | 1,869 | ||||||
Operating lease liabilities | 2,696 | 2,593 | ||||||
Total current liabilities | 47,406 | 46,847 | ||||||
Operating lease liabilities, net of current portion | 5,531 | 8,093 | ||||||
Other long-term liabilities | 5,545 | 3,128 | ||||||
Total liabilities | 58,482 | 58,068 | ||||||
Commitments and contingencies (Note 13) | 0 | 0 | ||||||
Stockholders’ equity: | ||||||||
Preferred stock, $0.001 par value; 10,000,000 shares authorized; 0 shares issued and outstanding | 0— | 0— | ||||||
Class A common stock, $0.001 par value; 220,000,000 shares authorized; 23,544,995 shares and 20,784,065 shares issued and outstanding at December 31, 2021 and 2020, respectively | 24 | 21 | ||||||
Class B common stock, $0.001 par value; 30,000,000 shares authorized; 6,407,678 shares and 7,429,502 shares issued and outstanding at December 31, 2021 and 2020, respectively | 6 | 7 | ||||||
Additional paid-in capital | 222,730 | 189,172 | ||||||
Accumulated other comprehensive income (loss) | 10 | (7 | ) | |||||
Accumulated deficit | (137,645 | ) | (118,211 | ) | ||||
Total stockholders’ equity | 85,125 | 70,982 | ||||||
Total liabilities and stockholders’ equity | $ | 143,607 | $ | 129,050 | ||||
|
| December 31, |
| |||||
|
| 2023 |
|
| 2022 |
| ||
Assets |
|
|
|
|
|
| ||
Current assets: |
|
|
|
|
|
| ||
Cash and cash equivalents |
| $ | 37,956 |
|
| $ | 30,835 |
|
Accounts receivable, net |
|
| 21,181 |
|
|
| 29,604 |
|
Commissions receivable, current portion |
|
| 4,349 |
|
|
| 13,530 |
|
Prepaid expenses and other current assets |
|
| 5,755 |
|
|
| 7,005 |
|
Total current assets |
|
| 69,241 |
|
|
| 80,974 |
|
Property and equipment, net |
|
| 5,719 |
|
|
| 6,460 |
|
Goodwill |
|
| 21,501 |
|
|
| 21,501 |
|
Acquired intangible assets, net |
|
| 5,188 |
|
|
| 7,955 |
|
Operating lease right-of-use assets |
|
| 1,617 |
|
|
| 5,769 |
|
Commissions receivable, non-current portion |
|
| 7,630 |
|
|
| 33,410 |
|
Other assets |
|
| 29 |
|
|
| 450 |
|
Total assets |
| $ | 110,925 |
|
| $ | 156,519 |
|
Liabilities and Stockholders' Equity |
|
|
|
|
|
| ||
Current liabilities: |
|
|
|
|
|
| ||
Accounts payable |
| $ | 17,202 |
|
| $ | 30,680 |
|
Accrued expenses and other current liabilities |
|
| 8,784 |
|
|
| 9,924 |
|
Deferred revenue |
|
| 1,872 |
|
|
| 1,867 |
|
Operating lease liabilities |
|
| 2,090 |
|
|
| 2,936 |
|
Total current liabilities |
|
| 29,948 |
|
|
| 45,407 |
|
Operating lease liabilities, net of current portion |
|
| 70 |
|
|
| 3,501 |
|
Other long-term liabilities |
|
| — |
|
|
| 125 |
|
Total liabilities |
|
| 30,018 |
|
|
| 49,033 |
|
Commitments and contingencies (Note 13) |
|
|
|
|
|
| ||
Stockholders' equity: |
|
|
|
|
|
| ||
Preferred stock, $0.001 par value; 10,000,000 shares authorized; |
|
| — |
|
|
| — |
|
Class A common stock, $0.001 par value; 220,000,000 shares authorized; |
|
| 29 |
|
|
| 26 |
|
Class B common stock, $0.001 par value; 30,000,000 shares authorized; |
|
| 6 |
|
|
| 6 |
|
Additional paid-in capital |
|
| 294,191 |
|
|
| 269,521 |
|
Accumulated other comprehensive income (loss) |
|
| 29 |
|
|
| (6 | ) |
Accumulated deficit |
|
| (213,348 | ) |
|
| (162,061 | ) |
Total stockholders' equity |
|
| 80,907 |
|
|
| 107,486 |
|
Total liabilities and stockholders' equity |
| $ | 110,925 |
|
| $ | 156,519 |
|
The accompanying notes are an integral part of these consolidated financial statements.
44
EVERQUOTE, INC.
CONSOLIDATED STATEMENTS OF OPERATIONS AND COMPREHENSIVE LOSS
(In thousands, except per share amounts)
Year Ended December 31, | ||||||||||||
2021 | 2020 | 2019 | ||||||||||
Revenue | $ | 418,515 | $ | 346,935 | $ | 248,811 | ||||||
Cost and operating expenses: | ||||||||||||
Cost of revenue | 23,949 | 21,373 | 15,903 | |||||||||
Sales and marketing | 354,990 | 284,880 | 202,689 | |||||||||
Research and development | 35,732 | 29,662 | 20,214 | |||||||||
General and administrative | 24,703 | 20,444 | 16,827 | |||||||||
Acquisition-related costs | 1,065 | 2,258 | — | |||||||||
Legal settlement | — | — | 1,227 | |||||||||
Total cost and operating expenses | 440,439 | 358,617 | 256,860 | |||||||||
Loss from operations | (21,924 | ) | (11,682 | ) | (8,049 | ) | ||||||
Other income (expense): | ||||||||||||
Interest income | 37 | 189 | 669 | |||||||||
Other income (expense), net | (57 | ) | 291 | 263 | ||||||||
Total other income (expense), net | (20 | ) | 480 | 932 | ||||||||
Loss before income taxes | (21,944 | ) | (11,202 | ) | (7,117 | ) | ||||||
Benefit from income taxes | 2,510 | — | — | |||||||||
Net loss | $ | (19,434 | ) | $ | (11,202 | ) | $ | (7,117 | ) | |||
Net loss per share, basic and diluted | $ | (0.67 | ) | $ | (0.41 | ) | $ | (0.28 | ) | |||
Weighted average common shares outstanding, basic and diluted | 29,088 | 27,329 | 25,759 | |||||||||
Comprehensive loss: | ||||||||||||
Net loss | $ | (19,434 | ) | $ | (11,202 | ) | $ | (7,117 | ) | |||
Other comprehensive loss: | ||||||||||||
Foreign currency translation adjustment | 17 | (7 | ) | — | ||||||||
Comprehensive loss | $ | (19,417 | ) | $ | (11,209 | ) | $ | (7,117 | ) | |||
|
|
| Year Ended December 31, |
| |||||||||
|
|
| 2023 |
|
| 2022 |
|
| 2021 |
| |||
Revenue |
|
| $ | 287,921 |
|
| $ | 404,127 |
|
| $ | 418,515 |
|
Cost and operating expenses: |
|
|
|
|
|
|
|
|
|
| |||
Cost of revenue |
|
|
| 22,455 |
|
|
| 23,980 |
|
|
| 23,949 |
|
Sales and marketing |
|
|
| 240,131 |
|
|
| 349,255 |
|
|
| 354,990 |
|
Research and development |
|
|
| 27,591 |
|
|
| 31,713 |
|
|
| 35,732 |
|
General and administrative |
|
|
| 26,301 |
|
|
| 28,102 |
|
|
| 24,703 |
|
Restructuring and other charges |
|
|
| 23,568 |
|
|
| — |
|
|
| — |
|
Acquisition-related costs |
|
|
| (150 | ) |
|
| (4,135 | ) |
|
| 1,065 |
|
Total cost and operating expenses |
|
|
| 339,896 |
|
|
| 428,915 |
|
|
| 440,439 |
|
Loss from operations |
|
|
| (51,975 | ) |
|
| (24,788 | ) |
|
| (21,924 | ) |
Other income (expense): |
|
|
|
|
|
|
|
|
|
| |||
Interest income |
|
|
| 1,251 |
|
|
| 349 |
|
|
| 37 |
|
Other income (expense), net |
|
|
| 14 |
|
|
| 23 |
|
|
| (57 | ) |
Total other income (expense), net |
|
|
| 1,265 |
|
|
| 372 |
|
|
| (20 | ) |
Loss before income taxes |
|
|
| (50,710 | ) |
|
| (24,416 | ) |
|
| (21,944 | ) |
Income tax (expense) benefit |
|
|
| (577 | ) |
|
| — |
|
|
| 2,510 |
|
Net loss |
|
| $ | (51,287 | ) |
| $ | (24,416 | ) |
| $ | (19,434 | ) |
Net loss per share, basic and diluted |
|
| $ | (1.54 | ) |
| $ | (0.77 | ) |
| $ | (0.67 | ) |
Weighted average common shares outstanding, |
|
|
| 33,350 |
|
|
| 31,613 |
|
|
| 29,088 |
|
|
|
|
|
|
|
|
|
|
|
| |||
Comprehensive loss: |
|
|
|
|
|
|
|
|
|
| |||
Net loss |
|
| $ | (51,287 | ) |
| $ | (24,416 | ) |
| $ | (19,434 | ) |
Other comprehensive income (loss): |
|
|
|
|
|
|
|
|
|
| |||
Foreign currency translation adjustment |
|
|
| 35 |
|
|
| (16 | ) |
|
| 17 |
|
Comprehensive loss |
|
| $ | (51,252 | ) |
| $ | (24,432 | ) |
| $ | (19,417 | ) |
The accompanying notes are an integral part of these consolidated financial statements.
45
EVERQUOTE, INC.
CONSOLIDATED STATEMENTS OF STOCKHOLDERS’ EQUITY
(in thousands, except share amounts)
Accumulated Other Comprehensive Income (Loss) | ||||||||||||||||||||||||||||||||
Class A | Class B | Additional Paid-in Capital | Total Stockholders’ Equity | |||||||||||||||||||||||||||||
Common Stock | Common Stock | Accumulated Deficit | ||||||||||||||||||||||||||||||
Shares | Amount | Shares | Amount | |||||||||||||||||||||||||||||
Balances at December 31, 2018 | 7,528,741 | $ | 8 | 17,696,414 | $ | 18 | $ | 143,050 | $ | — | $ | (99,892 | ) | $ | 43,184 | |||||||||||||||||
Issuance of common stock upon exercise of stock options | 645,920 | 1 | — | — | 2,981 | — | — | 2,982 | ||||||||||||||||||||||||
Vesting of restricted stock units | 567,100 | — | — | — | — | — | — | — | ||||||||||||||||||||||||
Stock-based compensation expense | — | — | — | — | 12,721 | — | — | 12,721 | ||||||||||||||||||||||||
Transfer of Class B common stock to Class A common stock | 5,894,073 | 6 | (5,894,073 | ) | (6 | ) | — | — | — | — | ||||||||||||||||||||||
Net loss | — | — | — | — | — | — | (7,117 | ) | (7,117 | ) | ||||||||||||||||||||||
Balances at December 31, 2019 | 14,635,834 | 15 | 11,802,341 | 12 | 158,752 | — | (107,009 | ) | 51,770 | |||||||||||||||||||||||
Contingent consideration to be settled in Class A common stock | — | — | — | — | 1,335 | — | — | 1,335 | ||||||||||||||||||||||||
Issuance of common stock upon exercise of stock options | 776,914 | 1 | — | — | 4,906 | — | — | 4,907 | ||||||||||||||||||||||||
Vesting of restricted stock units | 998,478 | — | — | — | — | — | — | — | ||||||||||||||||||||||||
Stock-based compensation expense | — | — | — | — | 24,179 | — | — | 24,179 | ||||||||||||||||||||||||
Transfer of Class B common stock to Class A common stock | 4,372,839 | 5 | (4,372,839 | ) | (5 | ) | — | — | — | — | ||||||||||||||||||||||
Foreign currency translation adjustment | — | — | — | — | — | (7 | ) | — | (7 | ) | ||||||||||||||||||||||
Net loss | — | — | — | — | — | — | (11,202 | ) | (11,202 | ) | ||||||||||||||||||||||
Balances at December 31, 2020 | 20,784,065 | 21 | 7,429,502 | 7 | 189,172 | (7 | ) | (118,211 | ) | 70,982 | ||||||||||||||||||||||
Issuance of common stock to settle contingent consideration liability | 39,168 | — | — | — | — | — | — | — | ||||||||||||||||||||||||
Issuance of common stock upon exercise of stock options | 572,429 | 1 | — | — | 3,614 | — | — | 3,615 | ||||||||||||||||||||||||
Vesting of restricted stock units | 1,127,509 | 1 | — | — | — | — | — | 1 | ||||||||||||||||||||||||
Stock-based compensation expense | — | — | — | — | 29,944 | — | — | 29,944 | ||||||||||||||||||||||||
Transfer of Class B common stock to Class A common stock | 1,021,824 | 1 | (1,021,824 | ) | (1 | ) | — | — | — | — | ||||||||||||||||||||||
Foreign currency translation adjustment | — | — | — | — | — | 17 | — | 17 | ||||||||||||||||||||||||
Net loss | — | — | — | — | — | — | (19,434 | ) | (19,434 | ) | ||||||||||||||||||||||
Balances at December 31, 2021 | 23,544,995 | $ | 24 | 6,407,678 | $ | 6 | $ | 222,730 | $ | 10 | $ | (137,645 | ) | $ | 85,125 | |||||||||||||||||
|
|
|
|
|
|
|
|
|
|
|
|
|
|
|
|
| Accumulated |
|
|
|
|
|
|
| ||||||||
|
| Class A |
|
| Class B |
|
| Additional |
|
| Other |
|
|
|
|
| Total |
| ||||||||||||||
|
| Common Stock |
|
| Common Stock |
|
| Paid-in |
|
| Comprehensive |
|
| Accumulated |
|
| Stockholders’ |
| ||||||||||||||
|
| Shares |
|
| Amount |
|
| Shares |
|
| Amount |
|
| Capital |
|
| Income (Loss) |
|
| Deficit |
|
| Equity |
| ||||||||
Balances at December 31, 2020 |
|
| 20,784,065 |
|
| $ | 21 |
|
|
| 7,429,502 |
|
| $ | 7 |
|
| $ | 189,172 |
|
| $ | (7 | ) |
| $ | (118,211 | ) |
| $ | 70,982 |
|
Issuance of common stock to settle |
|
| 39,168 |
|
|
| — |
|
|
| — |
|
|
| — |
|
|
| — |
|
|
| — |
|
|
| — |
|
|
| — |
|
Issuance of common stock upon |
|
| 572,429 |
|
|
| 1 |
|
|
| — |
|
|
| — |
|
|
| 3,614 |
|
|
| — |
|
|
| — |
|
|
| 3,615 |
|
Vesting of restricted stock units |
|
| 1,127,509 |
|
|
| 1 |
|
|
| — |
|
|
| — |
|
|
| — |
|
|
| — |
|
|
| — |
|
|
| 1 |
|
Stock-based compensation expense |
|
| — |
|
|
| — |
|
|
| — |
|
|
| — |
|
|
| 29,944 |
|
|
| — |
|
|
| — |
|
|
| 29,944 |
|
Transfer of Class B common stock |
|
| 1,021,824 |
|
|
| 1 |
|
|
| (1,021,824 | ) |
|
| (1 | ) |
|
| — |
|
|
| — |
|
|
| — |
|
|
| — |
|
Foreign currency translation adjustment |
|
| — |
|
|
| — |
|
|
| — |
|
|
| — |
|
|
| — |
|
|
| 17 |
|
|
| — |
|
|
| 17 |
|
Net loss |
|
| — |
|
|
| — |
|
|
| — |
|
|
| — |
|
|
| — |
|
|
| — |
|
|
| (19,434 | ) |
|
| (19,434 | ) |
Balances at December 31, 2021 |
|
| 23,544,995 |
|
|
| 24 |
|
|
| 6,407,678 |
|
|
| 6 |
|
|
| 222,730 |
|
|
| 10 |
|
|
| (137,645 | ) |
|
| 85,125 |
|
Private placement of common stock |
|
| 1,004,016 |
|
|
| 1 |
|
|
| — |
|
|
| — |
|
|
| 14,999 |
|
|
| — |
|
|
| — |
|
|
| 15,000 |
|
Issuance of common stock to settle |
|
| 58,754 |
|
|
| — |
|
|
| — |
|
|
| — |
|
|
| 830 |
|
|
| — |
|
|
| — |
|
|
| 830 |
|
Issuance of common stock to settle |
|
| 62,671 |
|
|
| — |
|
|
| — |
|
|
| — |
|
|
| 1,059 |
|
|
| — |
|
|
| — |
|
|
| 1,059 |
|
Issuance of common stock upon |
|
| 138,816 |
|
|
| 1 |
|
|
| — |
|
|
| — |
|
|
| 941 |
|
|
| — |
|
|
| — |
|
|
| 942 |
|
Net issuance of common stock upon |
|
| 1,370,724 |
|
|
| — |
|
|
| — |
|
|
| — |
|
|
| 64 |
|
|
| — |
|
|
| — |
|
|
| 64 |
|
Stock-based compensation expense |
|
| — |
|
|
| — |
|
|
| — |
|
|
| — |
|
|
| 28,898 |
|
|
| — |
|
|
| — |
|
|
| 28,898 |
|
Transfer of Class B common stock |
|
| 267,904 |
|
|
| — |
|
|
| (267,904 | ) |
|
| — |
|
|
| — |
|
|
| — |
|
|
| — |
|
|
| — |
|
Foreign currency translation adjustment |
|
| — |
|
|
| — |
|
|
| — |
|
|
| — |
|
|
| — |
|
|
| (16 | ) |
|
| — |
|
|
| (16 | ) |
Net loss |
|
| — |
|
|
| — |
|
|
| — |
|
|
| — |
|
|
| — |
|
|
| — |
|
|
| (24,416 | ) |
|
| (24,416 | ) |
Balances at December 31, 2022 |
|
| 26,447,880 |
|
|
| 26 |
|
|
| 6,139,774 |
|
|
| 6 |
|
|
| 269,521 |
|
|
| (6 | ) |
|
| (162,061 | ) |
|
| 107,486 |
|
Issuance of common stock upon |
|
| 174,777 |
|
|
| — |
|
|
| — |
|
|
| — |
|
|
| 979 |
|
|
| — |
|
|
| — |
|
|
| 979 |
|
Net issuance of common stock upon |
|
| 1,416,086 |
|
|
| 3 |
|
|
| — |
|
|
| — |
|
|
| (405 | ) |
|
| — |
|
|
| — |
|
|
| (402 | ) |
Stock-based compensation expense |
|
| — |
|
|
| — |
|
|
| — |
|
|
| — |
|
|
| 24,096 |
|
|
| — |
|
|
| — |
|
|
| 24,096 |
|
Transfer of Class B common stock |
|
| 535,496 |
|
|
| — |
|
|
| (535,496 | ) |
|
| — |
|
|
| — |
|
|
| — |
|
|
| — |
|
|
| — |
|
Foreign currency translation adjustment |
|
| — |
|
|
| — |
|
|
| — |
|
|
| — |
|
|
| — |
|
|
| 35 |
|
|
| — |
|
|
| 35 |
|
Net loss |
|
| — |
|
|
| — |
|
|
| — |
|
|
| — |
|
|
| — |
|
|
| — |
|
|
| (51,287 | ) |
|
| (51,287 | ) |
Balances at December 31, 2023 |
|
| 28,574,239 |
|
| $ | 29 |
|
|
| 5,604,278 |
|
| $ | 6 |
|
| $ | 294,191 |
|
| $ | 29 |
|
| $ | (213,348 | ) |
| $ | 80,907 |
|
The accompanying notes are an integral part of these consolidated financial statements.
46
EVERQUOTE, INC.
CONSOLIDATED STATEMENTS OF CASH FLOWS
(in thousands)
Year Ended December 31, | ||||||||||||
2021 | 2020 | 2019 | ||||||||||
Cash flows from operating activities: | ||||||||||||
Net loss | $ | (19,434 | ) | $ | (11,202 | ) | $ | (7,117 | ) | |||
Adjustments to reconcile net loss to net cash provided by operating activities: | ||||||||||||
Depreciation and amortization expense | 5,072 | 3,350 | 2,186 | |||||||||
Loss on disposal of property and equipment | — | — | 98 | |||||||||
Stock-based compensation expense | 30,020 | 24,179 | 12,721 | |||||||||
Change in fair value of contingent consideration | 196 | 1,778 | — | |||||||||
Deferred taxes | (2,510 | ) | — | — | ||||||||
Provision for (recovery of) bad debt | (41 | ) | 105 | 478 | ||||||||
Unrealized foreign currency transaction losses | 24 | — | — | |||||||||
Changes in operating assets and liabilities, net of effects from acquisitions: | ||||||||||||
Accounts receivable | 10,511 | (13,970 | ) | (15,232 | ) | |||||||
Prepaid expenses and other current assets | (3,642 | ) | 623 | (5,609 | ) | |||||||
Operating lease right-of-use | 2,710 | 2,076 | — | |||||||||
Other assets | (10,894 | ) | (554 | ) | (1 | ) | ||||||
Accounts payable | (3,968 | ) | 9,301 | 6,837 | ||||||||
Accrued expenses and other current liabilities | 2,692 | (3,968 | ) | 10,126 | ||||||||
Deferred revenue | 227 | 368 | 61 | |||||||||
Operating lease liabilities | (2,840 | ) | (2,233 | ) | — | |||||||
Other long-term liabilities | (934 | ) | 815 | (135 | ) | |||||||
Net cash provided by operating activities | 7,189 | 10,668 | 4,413 | |||||||||
Cash flows from investing activities: | ||||||||||||
Acquisition of property and equipment, including costs capitalized for development of internal-use software | (2,862 | ) | (3,822 | ) | (2,975 | ) | ||||||
Acquisition of business | (15,955 | ) | (14,930 | ) | — | |||||||
Net cash used in investing activities | (18,817 | ) | (18,752 | ) | (2,975 | ) | ||||||
Cash flows from financing activities: | ||||||||||||
Proceeds from exercise of stock options | 3,615 | 4,907 | 2,982 | |||||||||
Net cash provided by financing activities | 3,615 | 4,907 | 2,982 | |||||||||
Effect of exchange rate changes on cash, cash equivalents and restricted cash | (6 | ) | (7 | ) | — | |||||||
Net increase (decrease) in cash, cash equivalents and restricted cash | (8,019 | ) | (3,184 | ) | 4,420 | |||||||
Cash, cash equivalents and restricted cash at beginning of period | 43,120 | 46,304 | 41,884 | |||||||||
Cash, cash equivalents and restricted cash at end of period | $ | 35,101 | $ | 43,120 | $ | 46,304 | ||||||
Supplemental disclosure of noncash investing and financing information: | ||||||||||||
Acquisition of property and equipment included in accounts payable | $ | 100 | $ | — | $ | — | ||||||
Fair value of contingent consideration in connection with acquisition included in stockholders’ equity | $ | — | $ | 1,335 | $ | — | ||||||
Fair value of contingent consideration in connection with acquisition included in other long-term liabilities | $ | 3,784 | $ | 416 | $ | — | ||||||
Operating lease liabilities arising from obtaining right-of-use | $ | 383 | $ | 541 | $ | — | ||||||
Reconciliation of cash, cash equivalents and restricted cash: | ||||||||||||
Cash and cash equivalents | $ | 34,851 | $ | 42,870 | $ | 46,054 | ||||||
Restricted cash (included in other assets) | 250 | 250 | 250 | |||||||||
Total cash, cash equivalents and restricted cash shown in the statement of cash flows | $ | 35,101 | $ | 43,120 | $ | 46,304 | ||||||
|
| Year Ended December 31, |
| |||||||||
|
| 2023 |
|
| 2022 |
|
| 2021 |
| |||
Cash flows from operating activities: |
|
|
|
|
|
|
|
|
| |||
Net loss |
| $ | (51,287 | ) |
| $ | (24,416 | ) |
| $ | (19,434 | ) |
Adjustments to reconcile net loss to net cash provided by |
|
|
|
|
|
|
|
|
| |||
Depreciation and amortization expense |
|
| 6,196 |
|
|
| 5,848 |
|
|
| 5,072 |
|
Stock-based compensation expense |
|
| 24,096 |
|
|
| 28,986 |
|
|
| 30,020 |
|
Loss on sale of health assets |
|
| 19,388 |
|
|
| — |
|
|
| — |
|
Impairment of right-of-use asset |
|
| 384 |
|
|
| — |
|
|
| — |
|
Change in fair value of contingent consideration liabilities |
|
| (150 | ) |
|
| (4,135 | ) |
|
| 196 |
|
Deferred taxes |
|
| — |
|
|
| — |
|
|
| (2,510 | ) |
Provision for (recovery of) bad debt |
|
| 204 |
|
|
| 693 |
|
|
| (41 | ) |
Unrealized foreign currency transaction (gains) losses |
|
| 21 |
|
|
| (9 | ) |
|
| 24 |
|
Changes in operating assets and liabilities, net of effects from acquisition: |
|
|
|
|
|
|
|
|
| |||
Accounts receivable |
|
| 8,219 |
|
|
| 5,362 |
|
|
| 10,511 |
|
Prepaid expenses and other current assets |
|
| 962 |
|
|
| (2,111 | ) |
|
| 1,801 |
|
Commissions receivable, current and non-current |
|
| 4,176 |
|
|
| (24,240 | ) |
|
| (16,871 | ) |
Operating lease right-of-use assets |
|
| 2,497 |
|
|
| 2,613 |
|
|
| 2,710 |
|
Other assets |
|
| 421 |
|
|
| (19 | ) |
|
| 534 |
|
Accounts payable |
|
| (13,411 | ) |
|
| 1,124 |
|
|
| (3,968 | ) |
Accrued expenses and other current liabilities |
|
| (1,543 | ) |
|
| (2,375 | ) |
|
| 2,692 |
|
Deferred revenue |
|
| 5 |
|
|
| (229 | ) |
|
| 227 |
|
Operating lease liabilities |
|
| (3,006 | ) |
|
| (2,883 | ) |
|
| (2,840 | ) |
Other long-term liabilities |
|
| — |
|
|
| — |
|
|
| (934 | ) |
Net cash provided by (used in) operating activities |
|
| (2,828 | ) |
|
| (15,791 | ) |
|
| 7,189 |
|
Cash flows from investing activities: |
|
|
|
|
|
|
|
|
| |||
Acquisition of property and equipment, including costs capitalized |
|
| (3,840 | ) |
|
| (4,290 | ) |
|
| (2,862 | ) |
Proceeds from sale of health assets |
|
| 13,194 |
|
|
| — |
|
|
| — |
|
Acquisition of business |
|
| — |
|
|
| — |
|
|
| (15,955 | ) |
Net cash provided by (used in) investing activities |
|
| 9,354 |
|
|
| (4,290 | ) |
|
| (18,817 | ) |
Cash flows from financing activities: |
|
|
|
|
|
|
|
|
| |||
Proceeds from exercise of stock options |
|
| 979 |
|
|
| 942 |
|
|
| 3,615 |
|
Proceeds from private placement of common stock |
|
| — |
|
|
| 15,000 |
|
|
| — |
|
Tax withholding payments related to net share settlement |
|
| (402 | ) |
|
| (100 | ) |
|
| — |
|
Net cash provided by financing activities |
|
| 577 |
|
|
| 15,842 |
|
|
| 3,615 |
|
Effect of exchange rate changes on cash, cash equivalents and restricted cash |
|
| 18 |
|
|
| (27 | ) |
|
| (6 | ) |
Net increase (decrease) in cash, cash equivalents and restricted cash |
|
| 7,121 |
|
|
| (4,266 | ) |
|
| (8,019 | ) |
Cash, cash equivalents and restricted cash at beginning of period |
|
| 30,835 |
|
|
| 35,101 |
|
|
| 43,120 |
|
Cash, cash equivalents and restricted cash at end of period |
| $ | 37,956 |
|
| $ | 30,835 |
|
| $ | 35,101 |
|
Supplemental disclosure of noncash investing and |
|
|
|
|
|
|
|
|
| |||
Acquisition of property and equipment included in accounts payable |
| $ | 25 |
|
| $ | 60 |
|
| $ | 100 |
|
Fair value of contingent consideration in connection with acquisition |
| $ | — |
|
| $ | — |
|
| $ | 3,784 |
|
Issuance of Class A common stock to settle contingent consideration liabilities |
| $ | — |
|
| $ | 1,889 |
|
| $ | — |
|
Issuance of Class A common stock in settlement of stock-based |
| $ | — |
|
| $ | 164 |
|
| $ | — |
|
Operating lease liabilities arising from obtaining right-of-use assets |
| $ | — |
|
| $ | 1,096 |
|
| $ | 383 |
|
Reconciliation of cash, cash equivalents and restricted cash: |
|
|
|
|
|
|
|
|
| |||
Cash and cash equivalents |
| $ | 37,956 |
|
| $ | 30,835 |
|
| $ | 34,851 |
|
Restricted cash (included in other assets) |
|
| — |
|
|
| — |
|
|
| 250 |
|
Total cash, cash equivalents and restricted cash shown in the statement |
| $ | 37,956 |
|
| $ | 30,835 |
|
| $ | 35,101 |
|
The accompanying notes are an integral part of these consolidated financial statements.
47
EVERQUOTE, INC.
NOTES TO CONSOLIDATED FINANCIAL STATEMENTS
1. Nature of the Business and Basis of Presentation
EverQuote, Inc. (the “Company”) was incorporated in the state of Delaware in 2008. Through its internet websites, the Company operates an online marketplace for consumers shopping for auto, home and renters life and healthlife insurance. The Company generates revenue primarily by selling consumer referrals to insurance provider customers, consisting of carriers and agents, and indirect distributors in the United States. The Company also generates revenue from commission fees paid by insurance provider customers for insurance policies it sells to consumers.
The Company is subject to a number of risks and uncertainties common to companies in similar industries and stages of development including, but not limited to, rapid technological changes, competition from substitute products and services from larger companies, protection of proprietary technology, customer concentration, patent litigation, the need to obtain additional financing to support growth and dependence on third parties and key individuals.
The accompanying consolidated financial statements have been prepared on the basis of continuity of operations, realization of assets and the satisfaction of liabilities and commitments in the ordinary course of business. Since inception, the Company has incurred operating losses, including a net loss of $19.4$51.3 million for the year ended December 31, 2021.2023. As of December 31, 2021,2023, the Company had an accumulated deficit of $137.6
The Company’s consolidated financial statements have been prepared in conformity with accounting principles generally accepted in the United States of America (“GAAP”). Any reference in these notes to applicable guidance is meant to refer to the authoritative GAAP as found in the Accounting Standards Codification (“ASC”) and Accounting Standards Update (“ASU”) of the Financial Accounting Standards Board (“FASB”). The accompanying consolidated financial statements include the accounts of the Company and its wholly-owned subsidiaries. All intercompany accounts and transactions have been eliminated in consolidation.
2. Summary of Significant Accounting Policies
Use of Estimates
The preparation of financial statements in conformity with GAAP requires management to make estimates and assumptions that affect the reported amounts of assets and liabilities, the disclosure of contingent assets and liabilities at the date of the consolidated financial statements and the reported amounts of revenue and expenses during the reporting periods. Significant estimates and assumptions reflected in these consolidated financial statements include, but are not limited to, revenue recognition and collectabilitythe valuation of accounts receivable,and commissions receivables, the expensing and capitalization of website and software development costs, the valuation of goodwill and acquired intangible assets, commissions receivable, the valuation of contingent consideration liabilities, the valuation of stock-based awards and income taxes. The Company bases its estimates on historical experience, known trends and other market-specific or other relevant factors that it believes to be reasonable under the circumstances. On an ongoing basis, management evaluates its estimates, as there are changes in circumstances, facts and experience. Changes in estimates are recorded in periods in which they become known. Actual results may differ from those estimates or assumptions. Due to theCOVID-19pandemic, there has been uncertainty and disruption in the global economy and financial markets. The Company is not aware of any specific event or circumstance that would require an update to its estimates or judgments or a revision of the carrying value of its assets or liabilities as of the date of issuance of these consolidated financial statements. These estimates may change, as new events occur and additional information is obtained. Actualobtained and actual results could differ materially from these estimates under different assumptions or conditions.
Cash Equivalents
The Company considers all highly liquid investments with original maturities of three months or less at the date of purchase to be cash equivalents.
Concentrations of Credit Risk and of Significant Customers
Financial instruments that potentially expose the Company to concentrations of credit risk consist primarily of cash and cash equivalents and accounts and commissions receivable. The Company maintains its cash and cash equivalents at accredited financial institutions. The Company does not believe that it is subject to unusual credit risk beyond the normal credit risk associated with commercial banking relationships.
48
The Company sells its consumer referrals to insurance provider customers, consisting of carriers and agents, and indirect distributors in the United States. For the yearsyear ended December 31, 2023, one customer represented 18% of total revenue. For the year ended December 31, 2022, two customers represented 21% and 11%, respectively, of total revenue. For the year ended December 31, 2021, 2020 and 2019, 1one customer represented 16%, 22% and 21%, respectively,16% of total revenue. As of December 31, 2021, 12023, one customer accounted for 12%42% of the total accounts and commissions receivable balance. As of December 31, 2020, 12022, one customer accounted for 10%23% of the total accounts and commissions receivable balance.
Accounts Receivable
The Company provides credit to customers in the ordinary course of business and believes its credit policies are prudent and reflect industry practices and business risk. The Company monitors economic conditions to identify facts or circumstances that may indicate that its receivables are at risk of collection. The Company provides reserves against accounts receivable for estimated losses, if any, that may result from a customer’s inability to pay based on the composition of its accounts receivable, current economic conditions, and historical credit loss activity. Amounts determined to be uncollectible are charged or2021,2023 and 2022, the Company’s allowance for credit losses was less than $ million. As of million and $0.7 million, respectively. During the year ended December 31, 2020,2023, the Company’s allowance for credit losses was $0.1 million.Company wrote off $0.9 million of uncollectible accounts. During the years ended December 31, 20212022 and 2020,2021, the Company wrote off an insignificant amount of uncollectible accounts. During the year ended December 31, 2019, the Company wrote off $0.5 million of uncollectible accounts.
Revenue Recognition
The Company derives its revenue primarily by selling consumer referrals to its insurance provider customers, including insurance carriers, agents and indirect distributors. The Company also generates less than
The Company only applies the five-step model to contracts when collectabilitycollectibility of the consideration to which the Company is entitled in exchange for the goods or services it transfers to the customer is determined to be probable. Amounts are recorded as accounts receivable when the Company’s right to consideration is unconditional. The Company does not assess whether a contract has a significant financing component if the expectation at contract inception is that the period between payment by the customer and the transfer of the promised goods or services to the customer will be one year or less.
Referral Revenue
The Company recognizes referral revenue when it satisfies its performance obligations by delivering the referrals to its customers in an amount that reflects the consideration to which it expects to be entitled in exchange for those referrals.
Commission Revenue
The Company’s commission revenue is primarily comprised of commissions from health insurance carriers and, to a lesser extent, auto insurance carriers. Commission revenue is comprisedconsists of the estimated constrained lifetime values (the “constrained LTVs”) of commission payments that the Company expects to receive for selling anin its automotive insurance policy.vertical, and prior to its exit from health, that it expected to receive in its health insurance vertical on the sale of insurance policies to consumers and renewals of such policies. Commission revenue is recognized upon satisfaction of the Company’s performance obligation. The Company considers its performance obligation related to commissions for both the initial policy sale and future renewals of the policy to be satisfied upon submission of the policy application. Therefore, a significant portion of the commission revenue the Company records upon satisfaction of its performance obligation is paid by the Company’s insurance provider customer over a multi-year time frame as policyholders renew and pay the insurance provider for their policies. The current portion of commissions receivable consists of estimated commissions on new policies sold and estimated renewal commissions on policies expected to be renewed within one year, while the non-current portion of commissions receivable are commissions for estimated renewals expected to be renewed beyond one year. Commission revenue representsrepresented less than
49
Table of policies by product type and the application submission date of the relevant policy, which are referred to as “cohorts.” The Company’s estimate of constrained LTVs is based on an analysis of historical commission payment trends for relevant policies to establish an expected lifetime value and incorporates management’s judgment in interpreting those trends to calculate LTVs and to apply constraints to such LTVs. Significant factors impacting historical trends include carrier mix, average policy duration and conversion rates of paying policies.Contents
Commission revenue from auto insurance carriers is comprisedconsists of constrained LTVs of commission payments the Company expects to receive for selling an insurance policy based on the effective date of the policy. The Company’s estimate of constrained LTVs is based on an analysis of historical commission payment trends for relevant policies to establish an expected lifetime value and incorporates management’s judgment in interpreting those trends to calculate LTVs and to apply constraints to such LTVs. The most significant factor impacting historical trends
Prior to the Company's exit from the health insurance vertical, the Company estimated commission revenue for each health insurance product by using a portfolio approach to a group of policies by product type and the application submission date of the relevant policy, which were referred to as “cohorts.”
Disaggregated Revenue
The Company presents disaggregated revenue from contracts with customers by distribution channel, as the distribution channel impacts the nature and amount of the Company’s revenue, and by vertical market segment.
Total revenue is comprised of revenue from the following distribution channels:
Year Ended December 31, | ||||||||||||
2021 | 2020 | 2019 | ||||||||||
Direct channels | 90 | % | 92 | % | 94 | % | ||||||
Indirect channels | 10 | % | 8 | % | 6 | % | ||||||
| 100 | % | 100 | % | 100 | % | |||||||
|
| Year Ended December 31, |
| |||||||||
|
| 2023 |
|
| 2022 |
|
| 2021 |
| |||
Direct channels |
|
| 81 | % |
|
| 86 | % |
|
| 90 | % |
Indirect channels |
|
| 19 | % |
|
| 14 | % |
|
| 10 | % |
|
| 100 | % |
|
| 100 | % |
|
| 100 | % | |
Total revenue is comprised of revenue from the following insurance verticals (in thousands):
|
| Year Ended December 31, |
| |||||||||
|
| 2023 |
|
| 2022 |
|
| 2021 |
| |||
Automotive |
| $ | 227,505 |
|
| $ | 324,417 |
|
| $ | 330,928 |
|
Home and renters |
|
| 40,889 |
|
|
| 31,909 |
|
|
| 37,548 |
|
Other |
|
| 19,527 |
|
|
| 47,801 |
|
|
| 50,039 |
|
Total Revenue |
| $ | 287,921 |
|
| $ | 404,127 |
|
| $ | 418,515 |
|
Year Ended December 31, | ||||||||||||
2021 | 2020 | 2019 | ||||||||||
Automotive | $ | 330,928 | $ | 283,236 | $ | 212,300 | ||||||
Other | 87,587 | 63,699 | 36,511 | |||||||||
Total Revenue | $ | 418,515 | $ | 346,935 | $ | 248,811 | ||||||
The Company has elected to apply theless.less. At December 31, 20212023 and 2020,2022, the Company had not capitalized any costs to obtain any of its contracts.
Deferred Revenue
Amounts received for referrals prior to satisfying the revenue recognition criteria are recorded as deferred revenue in the accompanying balance sheets. Amounts expected to be recognized as revenue within 12 months of the balance sheet date are classified as current deferred revenue. Deferred revenue was $2.1 million and $1.9$1.9 million as of December 31, 20212023 and 2020,2022, respectively. During the year ended December 31, 2021,2023, the Company recognized revenue of $1.4$1.3 million that was included in the contract liability balance (deferred revenue) at December 31, 2020.2022. The Company recognizes deferred revenue by first allocating from the beginning deferred revenue balance to the extent that the beginning deferred revenue balance exceeds the revenue to be recognized. Billings during the period are added to the deferred revenue balance to be recognized in future periods.
50
Commissions Receivable
Commissions receivable are contract assets that represent estimated variable consideration for commissions to be received from insurance carriers for performance obligations that have been satisfied. The current portion of commissions receivable (included within prepaid expenses and other current assets) are estimated commissions expected to be received within one year, while the(included within other assets(non-current))
December 31, | ||||||||
2021 | 2020 | |||||||
Commissions receivable, current portion (included in prepaid expenses and other current assets) | $ | 9,285 | $ | 3,842 | ||||
Commissions receivable, non-current portion (included in other assets) | 13,415 | 1,987 | ||||||
| $ | 22,700 | $ | 5,829 | |||||
The Company assesses impairment for uncollectible consideration when information available indicates it is probable that an asset has been impaired. There were no impairments recorded during the years ended December 31, 2021, 20202023, 2022 or 2019.
While the Company is exposed to credit losses due to the
Goodwill and Acquired Intangible Assets
The Company records goodwill when consideration paid in a business acquisition exceeds the value of the net assets acquired. The Company’s estimates of fair value are based upon assumptions believed to be reasonable at that time but that are inherently uncertain and unpredictable. Assumptions may be incomplete or inaccurate, and unanticipated events or circumstances may occur, which may affect the accuracy or validity of such assumptions, estimates or actual results. During the measurement period, which extends no later than one year from the acquisition date, the Company may record certain adjustments to the carrying value of the assets acquired and liabilities assumed with the corresponding offset to goodwill. After the measurement period, all adjustments are recorded in the consolidated statements of operations and comprehensive loss as operating expenses or income.
Goodwill is not amortized, but rather is tested for impairment annually in the fourth quarter, or more frequently if facts and circumstances warrant a review, such as significant underperformance of the business in relation to expectations, significant negative industry or economic trends and significant changes or planned changes in the use of the assets. The Company assesses both the existence of potential impairment and the amount of impairment loss by comparing the fair value of the reporting unit with its carrying amount, including goodwill. Intangible assets are recorded at their estimated fair values at the date of acquisition. The Company amortizes acquired intangible assets over their estimated useful lives based on the pattern of consumption of the economic benefits or, if that pattern cannot be readily determined, on a straight-line basis.
Valuation of Contingent Consideration
The Company’s two acquisitions in 2021 and 2020 provided for shares of Class A common stock to be issued to former owners of the purchased entities upon the achievement of certain revenue targets (see Note 3). Achievement of revenue targets that will result in the issuance of a variable number of shares of Class A common stock are accounted for as a liability. The Company estimates the fair value of the shares of Class A common stock issuable upon achievement of the targets as of the acquisition date. The Company remeasures the fair value of the shares of Class A common stock issuable at each subsequent reporting date until the liability is fully settled. The Company uses Monte Carlo simulation models in its estimates. The estimated fair value of the contingent consideration is based upon available information and certain assumptions, known at the time of its estimates, which management believes are reasonable. Significant assumptions and estimates utilized in the model include the forecasted revenue, revenue volatility and discount rate. The fair value of the liability at each reporting date is comprised of the estimated number of Class A common stock to be earned multiplied by the market value of the Company’s Class A common stock as of the reporting date.
Deferred Financing Costs
The Company capitalizes lender, legal and other third-party fees that are directly associated with obtaining access to capital under credit facilities. Deferred financing costs incurred in connection with obtaining access to capital are recorded in prepaid expenses and other current assets and are amortized over the availability period or term of the credit facility. Deferred financing costs related to a recognized debt liability are recorded as a direct reduction of the carrying amount of the debt liability and amortized to interest expense on an effective interest basis over the repayment term.
Property and Equipment
Property and equipment are stated at cost less accumulated depreciation and amortization. Depreciation and amortization expense is recognized using the straight-line method over the estimated useful life of each asset as follows:
Estimated Useful Life | ||
Computer equipment | 3 years | |
Software | 3 years | |
Furniture and fixtures | 5 years | |
Leasehold improvements | Shorter of lease term or estimated useful life | |
51
Upon retirement or sale, the cost of assets disposed of and the related accumulated depreciation and amortization are removed from the accounts and any resulting gain or loss is included in loss from operations on the statements of operations and comprehensive loss. Expenditures for repairs and maintenance are charged to expense as incurred.
Leases
The Company accountedaccounts for leases under ASC 840, Leases (“ASC 840”). Effective January 1, 2020, the Company adopted ASC Topic 842, Leases (“ASC 842”), using the modified retrospective approach with no restatement of prior periods or cumulative adjustment to accumulated deficit. Therefore, for the year ended December 31, 2019, the Company’s financial statements continue to be presented in accordance with ASC 840, the accounting standard originally in effect for such period. As of and for the years ended December 31, 2021 and 2020, the Company’s consolidated financial statements are presented in accordance with ASC 842.
In addition to rent, the leases may require the Company to pay additional costs, such as utilities, maintenance and other operating costs, which are generally referred to
Impairment of Long-Lived Assets
Long-lived assets consist primarily of property and equipment,notnot record any impairment losses on long-lived assets during the years ended December 31, 2021, 20202022 or 2019.
Fair Value Measurements
Fair value is defined as the exchange price that would be received for an asset or paid to transfer a liability (an exit price) in the principal or most advantageous market for the asset or liability in an orderly transaction between market participants on the measurement date. Valuation techniques used to measure fair value must maximize the use of observable inputs and minimize the use of unobservable inputs. Financial assets and liabilities carried at fair value are to be classified and disclosed in one of the following three levels of the fair value hierarchy, of which the first two are considered observable and the last is considered unobservable:
The Company’s cash equivalents and contingent consideration liabilities are carried at fair value, determined according to the fair value hierarchy described above (see Note 4). The carrying values of the Company’s accounts receivable, accounts payable and accrued expenses and other current liabilities approximate their fair values due to the short-term nature of these assets and liabilities. Commissions receivable are recorded at constrained lifetime values.
52
Segment Information
The Company manages its operations as a single segment for the purposes of assessing performance and making operating decisions. The Company operates an online marketplace for consumers shopping for auto, home and renters and life insurance quotes and health insurance quotes.
Research and Development
Research and development expenses consist primarily of personnel-related expenses (wages, fringe benefit costs and stock-based compensation expense) for product management and software development. Research and development costs are expensed as incurred, except for certain costs which are capitalized in connection with the development of the Company’s website and
Costs incurred in the preliminary and post-implementation stages of development are expensed as incurred. Once an application has reached the development stage, internal costs, if direct and incremental, are capitalized
Advertising Expense
Advertising expense consists of variable costs that are related to attracting consumers to the Company’s marketplace and generating consumer quote requests, including through its verified partner network, and promoting its marketplace to insurance carriers and agents. The Company expenses advertising costs as incurred and such costs are included in sales and marketing expense in the accompanying statements of operations and comprehensive loss. During the years ended December 31, 2021, 20202023, 2022 and 2019,2021, advertising expense totaled $289.0$187.6 million, $238.3$275.9 million and $175.5$289.0 million, respectively.
Stock-Based Compensation
The Company measures compensation expense for stock options with service-based vesting or performance-based vesting granted to employees,non-employeesBlack-Scholesoption-pricingstraight-lineservice-basedgraded-vestingservice-basedperformance-basedreceived.
The Company classifies stock-based compensation expense in its statements of operations and comprehensive loss in the same manner in which the award recipient’s payroll costs are classified or in which the award recipient’s service payments are classified.
Foreign Currency Translation
The functional currency of the Company’s foreign subsidiaries is the currency of the local country. Assets and liabilities of the Company’s foreign subsidiaries are translated into U.S. dollars using the
53
Comprehensive Loss
Comprehensive loss includes net loss as well as other changes in stockholders’ equity that result from transactions and economic events other than those with stockholders. The Company’s only element of other comprehensive loss is foreign currency translation adjustments.
Net Income (Loss) per Share
Basic net income (loss) per common share is computed by dividing the net income (loss) by the weighted average number of shares of common stock outstanding for the period. Diluted net income (loss) per common share is computed by dividing net income (loss) by the weighted average number of common shares outstanding for the period, including potential dilutive common shares assuming the dilutive effect of outstanding stock options and unvested restricted stock units. For periods in which the Company reported a net loss, diluted net loss per common share is the same as basic net loss per common share, since dilutive common shares are not assumed to have been issued if their effect is anti-dilutive.
The Company has two classes of common stock outstanding: Class A common stock and Class B common stock. As more fully described in Note 9, the rights of the holders of Class A and Class B common stock are identical, except with respect to voting and conversion. Each share of Class B common stock is convertible into one share of Class A common stock at the option of the holder at any time. The Company allocates undistributed earnings attributable to common stock between the common stock classes on a
The Company excluded the following potential common shares, presented based on amounts outstanding at each period end, from the computation of diluted net loss per share attributable to common stockholders for the periods indicated because including them would have had an anti-dilutive effect:
|
| December 31, |
| |||||||||
|
| 2023 |
|
| 2022 |
|
| 2021 |
| |||
Options to purchase common stock |
|
| 2,319,725 |
|
|
| 2,072,238 |
|
|
| 1,539,573 |
|
Unvested restricted stock units |
|
| 2,086,007 |
|
|
| 2,511,930 |
|
|
| 2,798,761 |
|
|
| 4,405,732 |
|
|
| 4,584,168 |
|
|
| 4,338,334 |
| |
December 31, | ||||||||||||
2021 | 2020 | 2019 | ||||||||||
Options to purchase common stock | 1,539,573 | 2,188,919 | 2,827,868 | |||||||||
Unvested restricted stock units | 2,798,761 | 3,142,220 | 3,367,846 | |||||||||
| 4,338,334 | 5,331,139 | 6,195,714 | ||||||||||
The table above does not include shares issuable upon settlement of contingent consideration for the Company’s two acquisitions (see Note 3). Such shares are also not included in the Company’s calculation of basic or diluted net loss per common share.
Income Taxes
The Company accounts for income taxes using the asset and liability method, which requires the recognition of deferred tax assets and liabilities for the expected future tax consequences of events that have been recognized in the consolidated financial statements or in the Company’s tax returns. Deferred tax assets and liabilities are determined on the basis of the differences between the financial statements and tax basis of assets and liabilities using enacted tax rates in effect for the year in which the differences are expected to reverse. Changes in deferred tax assets and liabilities are recorded in the provision for income taxes. The Company assesses the likelihood that its deferred tax assets will be recovered from future taxable income and, to the extent it believes, based upon the weight of available evidence, that it is more likely than not that all or a portion of the deferred tax assets will not be realized, a valuation allowance is established through a charge to income tax expense. Potential for recovery of deferred tax assets is evaluated by estimating the future taxable profits expected and considering prudent and feasible tax planning strategies.
The Company accounts for uncertainty in income taxes recognized in the consolidated financial statements by applying a
54
Recently AdoptedIssued Accounting Pronouncements
In December 2019,June 2022, the FASB issued ASU2019-12,Income Taxes - Simplifying2022-03, Fair Value Measurement of Equity Securities Subject to Contractual Sale Restrictions (Topic 820), which clarifies that a contractual restriction on the Accounting for Income Taxes (Topic 740).sale of an equity security is not considered part of the unit of account of the equity security and, therefore, is not considered in measuring fair value. The amendmentsguidance also clarifies that an entity cannot, as a separate unit of account, recognize and measure a contractual sale restriction. The guidance includes disclosure requirements including the fair value of equity securities subject to contractual sale restrictions included in this update simplify the accounting for income taxes by removing certain exceptions tobalance sheet, the general principles as well as clarifyingnature and amending existing guidance to improve consistent application.remaining duration of the restriction and circumstances that could cause a lapse in the restriction. The amendments in this update are effective for fiscal years, and interim periods within those fiscal years, beginning after December 15, 2020, with early adoption permitted. Depending on the amendment, adoption may be applied on the retrospective, modified retrospective or prospective basis. The Company adopted this guidance on a prospective basis as of January 1, 2021 and the adoption had no impact on the Company’s financial position, results of operations or cash flows.
In November 2023, the FASB issued ASU 2023-07, Segment Reporting (Topic 280): Improvements to Reportable Segment Disclosures, which requires public entities to disclose information about their reportable segments’ significant expenses and other segment items on an interim and annual basis. Public entities with a single reportable segment are required to apply the disclosure requirements in ASU 2023-07, as well as all existing segment disclosures and reconciliation requirements in ASC 280 on an interim and annual basis. ASU 2023-07 is effective for fiscal years beginning after the effective date.December 15, 2023, and for interim periods within fiscal years beginning after December 15, 2024, with early adoption permitted. The Company is currently assessing the impact of the adoption of this guidance on its consolidated financial statements.
In December 2023, the FASB issued ASU 2023-09, Income Taxes (Topic 740): Improvements to Income Tax Disclosures, which requires public entities, on an annual basis, to provide disclosure of specific categories in the rate reconciliation, as well as disclosure of income taxes paid disaggregated by jurisdiction. ASU 2023-09 is effective for fiscal years beginning after December 15, 2024, with early adoption permitted. The Company is currently assessing the impact of the adoption of this guidance on its consolidated financial statements.
3. Acquisitions
PolicyFuel
On August
Eversurance
On September
55
4. Fair Value of Financial Instruments
The following tables present the Company’s fair value hierarchy for its assets and liabilities which are measured at fair value on a recurring basis as of December 31, 20212023 and December 31, 20202022 (in thousands):
|
| Fair Value Measurements at December 31, 2023 Using: |
| |||||||||||||
|
| Level 1 |
|
| Level 2 |
|
| Level 3 |
|
| Total |
| ||||
Assets: |
|
|
|
|
|
|
|
|
|
|
|
| ||||
Cash equivalents: |
|
|
|
|
|
|
|
|
|
|
|
| ||||
Money market funds |
| $ | 3,210 |
|
| $ | — |
|
| $ | — |
|
| $ | 3,210 |
|
|
| Fair Value Measurements at December 31, 2022 Using: |
| |||||||||||||
|
| Level 1 |
|
| Level 2 |
|
| Level 3 |
|
| Total |
| ||||
Assets: |
|
|
|
|
|
|
|
|
|
|
|
| ||||
Cash equivalents: |
|
|
|
|
|
|
|
|
|
|
|
| ||||
Money market funds |
| $ | 15,812 |
|
| $ | — |
|
| $ | — |
|
| $ | 15,812 |
|
Liabilities: |
|
|
|
|
|
|
|
|
|
|
|
| ||||
Contingent consideration liability associated with acquisition |
|
| — |
|
|
| — |
|
|
| 25 |
|
|
| 25 |
|
Contingent consideration liability associated with acquisition |
|
| — |
|
|
| — |
|
|
| 125 |
|
|
| 125 |
|
| $ | — |
|
| $ | — |
|
| $ | 150 |
|
| $ | 150 |
| |
Fair Value Measurements at December 31, 2021 Using: | ||||||||||||||||
Level 1 | Level 2 | Level 3 | Total | |||||||||||||
Assets: | ||||||||||||||||
Cash equivalents: | ||||||||||||||||
Money market funds | $ | 20,502 | $ | 0 | $ | 0 | $ | 20,502 | ||||||||
Liabilities: | ||||||||||||||||
Contingent consideration liability associated with acquisition of Eversurance included in other long-term liabilities | $ | 0 | $ | 0 | $ | 920 | $ | 920 | ||||||||
Contingent consideration liability associated with acquisition of PolicyFuel included in accrued expense and other current liabilities | 0 | 0 | 629 | 629 | ||||||||||||
Contingent consideration liability associated with acquisition of PolicyFuel included in other long-term liabilities | 0 | 0 | 4,625 | 4,625 | ||||||||||||
| 0 | $ | 0 | $ | 6,174 | $ | 6,174 | ||||||||||
Fair Value Measurements at December 31, 2020 Using: | ||||||||||||||||
Level 1 | Level 2 | Level 3 | Total | |||||||||||||
Assets: | ||||||||||||||||
Cash equivalents: | ||||||||||||||||
Money market funds | $ | 15,777 | $ | 0 | $ | 0 | $ | 15,777 | ||||||||
Liabilities: | ||||||||||||||||
Contingent consideration liability associated with acquisition of Eversurance included in other long-term liabilities | $ | 0 | $ | 0 | $ | 2,194 | $ | 2,194 | ||||||||
There
Money market
Contingent consideration
The Company
The Company estimated the fair value of the contingent consideration liability related to the Eversurance acquisition in 2020 (see Note 3) using probability of achievement of the revenue target (acquisition specific input) and the market value of the Company’s Class A common stock (observable input). Shares of Class A common stock were issued in December 2022 to settle the third and final milestone at which time the fair value of the contingent consideration liability was reclassified to stockholders' equity.
56
The following table provides a roll-forward of the aggregate fair values of the Company’s contingent consideration liabilities for which fair value is determined by Level 3 inputs (in thousands):
|
| Contingent |
| |
|
| Consideration |
| |
|
| Liabilities |
| |
Fair value at December 31, 2021 |
| $ | 6,174 |
|
Change in fair value of contingent consideration related |
|
| (90 | ) |
Contingent consideration related to Eversurance acquisition |
|
| (830 | ) |
Change in fair value of contingent consideration related |
|
| (4,045 | ) |
Contingent consideration related to PolicyFuel acquisition |
|
| (1,059 | ) |
Fair value at December 31, 2022 |
|
| 150 |
|
Change in fair value of contingent consideration related |
|
| (150 | ) |
Fair value at December 31, 2023 |
| $ | — |
|
to Eversurance acquisition | ||||
5. Goodwill and Acquired Intangible Assets
Goodwill
There were no changes to goodwill for the year endedas of December 31, 2021 were as follows (in thousands):
| Balance January 1, 2021 | $ | 9,794 | ||
| Final adjustment to Eversurance purchase price allocation | 175 | |||
| Goodwill resulting from PolicyFuel acquisition | 11,532 | |||
| Balance December 31, 2021 | $ | 21,501 | ||
Acquired intangible assets consisted of the following (in thousands):
|
|
|
|
| December 31, 2023 |
| ||||||||||
|
| Weighted Average Useful Life |
|
| Gross Amount |
|
| Accumulated Amortization |
|
| Carrying Value |
| ||||
|
| (in years) |
|
|
|
|
|
|
|
|
|
| ||||
Customer relationships |
|
| 9.0 |
|
| $ | 6,600 |
|
| $ | (1,748 | ) |
| $ | 4,852 |
|
Developed technology |
|
| 3.0 |
|
|
| 1,700 |
|
|
| (1,364 | ) |
|
| 336 |
|
Other identifiable intangible assets |
|
| 2.0 |
|
|
| 300 |
|
|
| (300 | ) |
|
| — |
|
|
|
|
|
| $ | 8,600 |
|
| $ | (3,412 | ) |
| $ | 5,188 |
| |
|
|
|
|
| December 31, 2022 |
| ||||||||||
|
| Weighted Average Useful Life |
|
| Gross Amount |
|
| Accumulated Amortization |
|
| Carrying Value |
| ||||
|
| (in years) |
|
|
|
|
|
|
|
|
|
| ||||
Customer relationships |
|
| 7.6 |
|
| $ | 10,200 |
|
| $ | (3,353 | ) |
| $ | 6,847 |
|
Developed technology |
|
| 3.0 |
|
|
| 1,700 |
|
|
| (786 | ) |
|
| 914 |
|
Other identifiable intangible assets |
|
| 2.8 |
|
|
| 570 |
|
|
| (376 | ) |
|
| 194 |
|
|
|
|
|
| $ | 12,470 |
|
| $ | (4,515 | ) |
| $ | 7,955 |
| |
December 31, 2021 | ||||||||||||||||
Weighted Average Useful Life | Gross Amount | Accumulated Amortization | Carrying Value | |||||||||||||
(in years) | ||||||||||||||||
Customer relationships | 7.6 | $ | 10,200 | $ | (1,830 | ) | $ | 8,370 | ||||||||
Developed technology | 3 | 1,700 | (217 | ) | 1,483 | |||||||||||
Other identifiable intangible assets | 2.8 | 570 | (194 | ) | 376 | |||||||||||
| $ | 12,470 | $ | (2,241 | ) | $ | 10,229 | ||||||||||
December 31, 2020 | ||||||||||||||||
Weighted Average Useful Life | Gross Amount | Accumulated Amortization | Carrying Value | |||||||||||||
(in years) | ||||||||||||||||
Customer relationships | 5 | $ | 3,600 | $ | (464 | ) | $ | 3,136 | ||||||||
Other identifiable intangible assets | 3.7 | 270 | (40 | ) | 230 | |||||||||||
| $ | 3,870 | $ | (504 | ) | $ | 3,366 | ||||||||||
In August 2023, the Company sold Eversurance LLC, which included health-related intangible assets with a gross amount of $3.9 million, accumulated amortization of $2.9 million and a carrying value of $1.0 million (see Note 16). Amortization expense for intangible assets for the years ended December 31, 2023, 2022 and 2021 2020 and 2019 was $1.7$1.8 million, $0.5$2.3 million and less than $0.1$1.7 million, respectively.
57
Future amortization
Year Ending December 31, |
|
|
| |
2024 |
| $ | 1,261 |
|
2025 |
|
| 651 |
|
2026 |
|
| 685 |
|
2027 |
|
| 708 |
|
2028 |
|
| 697 |
|
Thereafter |
|
| 1,186 |
|
| $ | 5,188 |
| |
Year Ending December 31, | ||||
2022 | $ | 2,277 | ||
2023 | 2,001 | |||
2024 | 1,715 | |||
2025 | 960 | |||
2026 | 685 | |||
Thereafter | 2,591 | |||
| $ | 10,229 | |||
6. Property and Equipment, Net
Property and equipment, net consisted of the following (in thousands):
|
| December 31, |
| |||||
|
| 2023 |
|
| 2022 |
| ||
Computer equipment |
| $ | 2,256 |
|
| $ | 2,822 |
|
Software |
|
| 15,915 |
|
|
| 14,733 |
|
Furniture and fixtures |
|
| 1,021 |
|
|
| 1,221 |
|
Leasehold improvements |
|
| 862 |
|
|
| 975 |
|
|
| 20,054 |
|
|
| 19,751 |
| |
Less: Accumulated depreciation and amortization |
|
| (14,335 | ) |
|
| (13,291 | ) |
| $ | 5,719 |
|
| $ | 6,460 |
| |
December 31, | ||||||||
2021 | 2020 | |||||||
Computer equipment | $ | 2,755 | $ | 2,183 | ||||
Software | 12,888 | 11,113 | ||||||
Furniture and fixtures | 1,127 | 1,127 | ||||||
Leasehold improvements | 906 | 921 | ||||||
| 17,676 | 15,344 | |||||||
Less: Accumulated depreciation and amortization | (11,880 | ) | (9,171 | ) | ||||
| $ | 5,796 | $ | 6,173 | |||||
Depreciation and amortization expense was $3.3$4.4 million, $2.8$3.6 million and $2.2$3.3 million for the years ended December 31, 2021, 20202023, 2022 and 2019,2021, respectively. The Company capitalized costs associated with the development of internal use software of $2.2$3.6 million, $3.0$3.6 million and $2.7$2.2 million included in the Software line
7. Accrued Expenses and Other Current Liabilities
Accrued expenses and other current liabilities consisted of the following (in thousands):
|
| December 31, |
| |||||
|
| 2023 |
|
| 2022 |
| ||
Accrued employee compensation and benefits |
| $ | 5,188 |
|
| $ | 4,254 |
|
Accrued advertising expenses |
|
| 2,285 |
|
|
| 3,970 |
|
Other current liabilities |
|
| 1,311 |
|
| 1,700 |
| |
|
| $ | 8,784 |
| $ | 9,924 |
| |
December 31, | ||||||||
2021 | 2020 | |||||||
Accrued employee compensation and benefits | $ | 4,115 | $ | 4,105 | ||||
Accrued advertising expenses | 5,669 | 2,596 | ||||||
Other current liabilities | 3,231 | 2,720 | ||||||
| $ | 13,015 | $ | 9,421 | |||||
8. Loan and Security Agreement
On July 15, 2022, the Company has available borrowings of $
58
Pursuant to the 2023 Loan Amendment the minimum asset coverage ratio, fixed charge coverage ratio and leverage ratio covenants were eliminated and replaced with an adjusted quick ratio covenant. As of the Company’s assetseffective date of the 2023 Loan Amendment and property.
Pursuant to the 2023 Amended Loan Agreement, borrowings under the revolving line of credit cannot exceed 85% of eligible accounts receivable balances, bear interest at the greater of 7.0% or the prime rate as published in The Wall Street Journal and mature on July 15, 2025. In addition,
9. Equity
Each share of December 31, 2021, the Company was in compliance with these covenants. Events which would meet the criteria of a default under the 2020 Loan Agreement include failure to make payments when due, insolvency events, failure to comply with covenants or material adverse events with respect to the Company.
Holders of both classes of common stock are entitled to receive dividends, when and if declared by the board of directors.
Each share of Class B common stock is convertible into one share of Class A common stock at the option of the holder at any time. Automatic conversion shall occur upon the occurrence of a transfer of such share of Class B common stock or at the date and time, or the occurrence of an event, specified by a vote or written consent of the holders of a majority of the voting power of the then outstanding shares of Class B common stock. A transfer is described as a sale, assignment, transfer, conveyance, hypothecation or disposition of such
During
During the year ended December 31, 2022, the Company sold 1,004,016 shares of Class A common stock at a purchase price of $14.94 per share for gross proceeds of $15.0 million in a private placement to a related party (see Note 15).
10. Stock-Based Compensation
2008 and 2018 Plans
The Company has outstanding awards under its 2008 Stock Incentive Plan, as amended (the “2008 Plan”), but is no longer granting awards under this plan. Shares of common stock issued upon exercise of stock options granted prior to September 8, 2017 will be issued as either Class A common stock or Class B common stock. Shares of common stock issued upon exercise of stock options granted after September 8, 2017 will be issued as Class A common stock.
59
The Company’s
Options
Stock Option Valuation
The fair value of thesestock option grants waswith service-based or performance-based vesting conditions is estimated on the date of grant using a Monte Carlo simulationthe Black Scholes option pricing model. Assumptions and estimates utilized inThe volatility has been determined using the model includeCompany’s traded stock price to estimate expected volatility. The expected term of the Company’s stock options has been determined utilizing the “simplified” method for awards that qualify as “plain-vanilla” options. The risk-free interest rate is determined by reference to the U.S. Treasury yield curve in effect at the time of grant of the award for time periods approximately equal to the expected term of the award. Expected dividend yield expected stock volatilityis based on the fact that the Company has never paid cash dividends and the estimated perioddoes not expect to achievement of the performance and market condition.
|
| Year Ended December 31, |
| |||||
|
| 2023 |
|
| 2022 |
| ||
Risk-free interest rate |
|
| 4.0 | % |
|
| 3.2 | % |
Expected volatility |
|
| 78.4 | % |
|
| 78.1 | % |
Expected dividend yield |
|
| — |
|
|
| — |
|
Expected term (in years) |
|
| 5.8 |
|
|
| 6.1 |
|
The aggregate grant date fair value of thesestock options granted during the years ended December 31, 2023 and 2022 was $8.1 million. As the Company has deemed achievement of the performance condition to be probable, the Company is recognizing stock-based compensation for these awards over the estimated service period using the graded-vesting method.
60
Stock Option Activity
The following table summarizes the Company’s option activity since December 31, 2020:2022:
|
|
|
|
|
|
|
| Weighted |
|
|
|
| ||||
|
|
|
|
| Weighted |
|
| Average |
|
|
|
| ||||
|
|
|
|
| Average |
|
| Remaining |
|
| Aggregate |
| ||||
|
|
|
|
| Exercise |
|
| Contractual |
|
| Intrinsic |
| ||||
|
| Number of Shares |
|
| Price |
|
| Term |
|
| Value |
| ||||
|
|
|
|
|
|
|
| (in years) |
|
| (in thousands) |
| ||||
Outstanding as of December 31, 2022 |
|
| 2,072,238 |
|
| $ | 13.40 |
|
|
| 5.88 |
|
| $ | 10,986 |
|
Granted |
|
| 585,295 |
|
|
| 10.88 |
|
|
|
|
|
|
| ||
Exercised |
|
| (174,777 | ) |
|
| 5.60 |
|
|
|
|
|
|
| ||
Forfeited |
|
| (163,031 | ) |
|
| 9.44 |
|
|
|
|
|
|
| ||
Outstanding as of December 31, 2023 |
|
| 2,319,725 |
|
| $ | 13.63 |
|
|
| 6.01 |
|
| $ | 6,939 |
|
Vested and expected to vest as of |
|
| 2,164,672 |
|
| $ | 14.00 |
|
|
| 5.82 |
|
| $ | 6,315 |
|
Options exercisable as of December 31, 2023 |
|
| 1,227,541 |
|
| $ | 9.08 |
|
|
| 4.12 |
|
| $ | 4,418 |
|
Weighted | ||||||||||||||||
Weighted | Average | |||||||||||||||
Average | Remaining | Aggregate | ||||||||||||||
Exercise | Contractual | Intrinsic | ||||||||||||||
Number of Shares | Price | Term | Value | |||||||||||||
(in years) | (in thousands) | |||||||||||||||
Outstanding as of December 31, 2020 | 2,188,919 | $ | 12.01 | 5.72 | $ | 57,538 | ||||||||||
Granted | 0 | 0 | ||||||||||||||
Exercised | (572,429 | ) | 6.32 | |||||||||||||
Forfeited | (76,917 | ) | 7.20 | |||||||||||||
Outstanding as of December 31, 2021 | 1,539,573 | $ | 14.37 | 5.36 | $ | 9,820 | ||||||||||
Vested and expected to vest as of December 31, 2021 | 1,523,410 | $ | 14.44 | 5.36 | $ | 9,694 | ||||||||||
Options exercisable as of December 31, 2021 | 1,126,220 | $ | 7.78 | 4.70 | $ | 8,876 | ||||||||||
As of December
The aggregate
The aggregate
Restricted Stock Units
The Company
The following table
|
|
|
|
| Weighted Average |
| ||
|
| Number of Shares |
|
| Grant-Date Fair Value |
| ||
Unvested balance December 31, 2022 |
|
| 2,511,930 |
|
| $ | 17.48 |
|
Granted |
|
| 1,787,552 |
|
|
| 9.63 |
|
Vested |
|
| (1,449,756 | ) |
|
| 16.28 |
|
Forfeited |
|
| (763,719 | ) |
|
| 15.55 |
|
Unvested balance December 31, 2023 |
|
| 2,086,007 |
|
| $ | 12.29 |
|
Weighted Average | ||||||||
Number of Shares | Grant-Date Fair Value | |||||||
Unvested balance December 31, 2020 | 3,142,220 | $ | 25.29 | |||||
| Granted | 1,774,545 | 26.26 | ||||||
| Vested | (1,127,509 | ) | 26.00 | |||||
| Forfeited | (990,495 | ) | 30.06 | |||||
Unvested balance December 31, 2021 | 2,798,761 | $ | 23.93 | |||||
Inducement Awards
In connection
61
Stock-Based Compensation
The Company recorded stock-based compensation expense in the following expense categories of its statements of operations and comprehensive loss (in thousands):
|
| Year Ended December 31, |
| |||||||||
|
| 2023 |
|
| 2022 |
|
| 2021 |
| |||
Cost of revenue |
| $ | 219 |
|
| $ | 281 |
|
| $ | 363 |
|
Sales and marketing |
|
| 8,667 |
|
|
| 11,018 |
|
|
| 12,405 |
|
Research and development |
|
| 8,053 |
|
|
| 10,328 |
|
|
| 9,551 |
|
General and administrative |
|
| 5,869 |
|
|
| 7,359 |
|
|
| 7,701 |
|
Restructuring and other charges |
|
| 1,288 |
|
|
| — |
|
|
| — |
|
| $ | 24,096 |
|
| $ | 28,986 |
|
| $ | 30,020 |
| |
Year Ended December 31, | ||||||||||||
2021 | 2020 | 2019 | ||||||||||
Cost of revenue | $ | 363 | $ | 361 | $ | 193 | ||||||
Sales and marketing | 12,405 | 10,246 | 3,805 | |||||||||
Research and development | 9,551 | 7,751 | 3,967 | |||||||||
General and administrative | 7,701 | 5,821 | 4,756 | |||||||||
| $ | 30,020 | $ | 24,179 | $ | 12,721 | |||||||
As of December
11. Income Taxes
The Company has 0tnot recorded income tax benefits for the net operating losses incurred or the research and development tax credits generated, in the years ended December 31, 2021, 2020 or 2019, as the Company believed, based upon the weight of available evidence, that it is more likely than not that all of its net operating loss and tax credit carryforwards will not be realized. The Company’s income tax expense for the year ended December 31, 2023 related to foreign operations haveand state income taxes. The Company did not been significant and therefore,record income tax expense for the Company has 0t provided for any foreign taxes.year ended December 31, 2022, as taxable income was offset by net operating loss carryforwards. During the year ended December 31, 2021, the Company released $2.5$2.5 million of its valuation allowance related to the net deferred tax liability recorded as a result of the PolicyFuel acquisition. The Company maintains a valuation allowance on its overall net deferred tax asset as it is deemed more likely than not the net deferred tax asset will not be realized.
A reconciliation of the U.S. federal statutory income tax rate to the Company’s effective income tax rate is as follows:
|
| Year Ended December 31, |
|
| |||||||||
|
| 2023 |
|
| 2022 |
|
| 2021 |
|
| |||
Federal statutory income tax rate |
|
| 21.0 |
| % |
| 21.0 |
| % |
| 21.0 |
| % |
State taxes, net of federal benefit |
|
| 6.9 |
|
|
| 7.3 |
|
|
| 5.2 |
|
|
Federal and state research and development tax credits |
|
| (0.3 | ) |
|
| 2.3 |
|
|
| 5.6 |
|
|
Nondeductible items |
|
| (0.3 | ) |
|
| 2.8 |
|
|
| (2.0 | ) |
|
Stock-based compensation |
|
| (5.8 | ) |
|
| (16.0 | ) |
|
| 10.9 |
|
|
Deferred taxes on acquisition |
|
| — |
|
|
| 2.5 |
|
|
| 11.4 |
|
|
Other |
|
| 1.4 |
|
|
| — |
|
|
| 0.4 |
|
|
Change in valuation allowance |
|
| (24.0 | ) |
|
| (19.9 | ) |
|
| (41.1 | ) |
|
Effective income tax rate |
|
| (1.1 | ) | % |
| — |
| % |
| 11.4 |
| % |
Year Ended December 31, | ||||||||||||
2021 | 2020 | 2019 | ||||||||||
Federal statutory income tax rate | 21.0 | % | 21.0 | % | 21.0 | % | ||||||
State taxes, net of federal benefit | 5.2 | 4.2 | 5.5 | |||||||||
Federal and state research and development tax credits | 5.6 | 12.4 | 19.4 | |||||||||
Nondeductible items | (2.0 | ) | (0.7 | ) | (1.6 | ) | ||||||
Stock-based compensation | 10.9 | 97.2 | 13.3 | |||||||||
Deferred taxes on acquisition | 11.4 | 0 | 0 | |||||||||
Other | 0.4 | 2.2 | (0.9 | ) | ||||||||
Change in valuation allowance | (41.1 | ) | (136.3 | ) | (56.7 | ) | ||||||
Effective income tax rate | 11.4 | % | 0 | % | 0 | % | ||||||
62
Net deferred tax assets as of December 31, 20212023 and 20202022 consisted of the following (in thousands):
|
| December 31, |
| |||||
|
| 2023 |
|
| 2022 |
| ||
Deferred tax assets: |
|
|
|
|
|
| ||
Net operating loss carryforwards |
| $ | 30,638 |
| $ | 24,621 |
| |
Capitalized research and development |
|
| 11,793 |
|
| 7,186 |
| |
Research and development tax credit carryforwards |
|
| 9,183 |
|
| 7,950 |
| |
Accrued expenses and other current liabilities |
|
| 388 |
|
| 307 |
| |
Property and equipment |
|
| 293 |
|
| 271 |
| |
Intangible assets |
|
| 233 |
|
|
| — |
|
Stock-based compensation |
|
| 2,233 |
|
| 2,593 |
| |
Operating lease liability |
|
| 573 |
|
|
| 1,706 |
|
Other |
|
| 238 |
|
| 156 |
| |
Total deferred tax assets |
|
| 55,572 |
|
|
| 44,790 |
|
Valuation allowance |
|
| (53,948 | ) |
|
| (41,755 | ) |
Net deferred tax assets |
|
| 1,624 |
|
|
| 3,035 |
|
Deferred tax liabilities: |
|
|
|
|
|
| ||
Capitalized software development costs |
|
| (1,195 | ) |
|
| (1,313 | ) |
Operating lease right-of-use assets |
|
| (429 | ) |
|
| (1,529 | ) |
Intangible assets |
|
| — |
|
|
| (193 | ) |
Total deferred tax liabilities |
|
| (1,624 | ) |
|
| (3,035 | ) |
Net deferred tax assets and liabilities |
| $ | — |
|
| $ | — |
|
December 31, | ||||||||
2021 | 2020 | |||||||
Deferred tax assets: | ||||||||
| Net operating loss carryforwards | $ | 27,364 | $ | 19,197 | ||||
| Research and development tax credit carryforwards | 7,559 | 6,470 | ||||||
| Accrued expenses and other current liabilities | 280 | 566 | ||||||
| Intangible assets | 0 | 1,598 | ||||||
| Property and equipment | 225 | 220 | ||||||
| Stock-based compensation | 2,896 | 3,092 | ||||||
| Operating lease liability | 2,167 | 2,829 | ||||||
| Other | 0 | 221 | ||||||
| Total deferred tax assets | 40,491 | 34,193 | ||||||
Valuation allowance | (36,921 | ) | (30,558 | ) | ||||
| Net deferred tax assets | 3,570 | 3,635 | ||||||
| Deferred tax liabilities: | ||||||||
| Capitalized software development costs | (1,095 | ) | (1,088 | ) | ||||
Operating lease right-of-use | (1,911 | ) | (2,547 | ) | ||||
| Intangible assets | (528 | ) | 0 | |||||
| Other | (36 | ) | 0 | |||||
| Deferred tax liabilities | (3,570 | ) | (3,635 | ) | ||||
Net deferred tax assets and liabilities | $ | 0 | $ | 0 | ||||
As of December 31, 2021,2023, the Company had
Utilization of the U.S. federal and state net operating loss carryforwards and research and development tax credit carryforwards may be subject to a substantial annual limitation under Section
The Company has evaluated the positive and negative evidence bearing upon its ability to realize the deferred tax assets, which are comprised primarily of net operating loss carryforwards and research and
63
The changeincrease in the valuation allowance for deferred tax assets during the yearsyear ended December 31, 2021, 20202023 related primarily to increases in net operating losses and 2019capitalized research and development costs. The increase in the valuation allowance for deferred tax assets during the year ended December 31, 2022 related primarily to capitalized research and development costs due to the new requirement to capitalize research and development costs under IRC Section 174, partially offset by a decrease in net operating loss carryforwards that were used to offset taxable income. The Company generated taxable income for the year ended December 31, 2022 due to the requirement to capitalize research and development costs. The increase in the valuation allowance for deferred tax assets during the year ended December 31, 2021 related primarily to an increase in net operating loss carryforwards and research and development tax credit carryforwards and stock-based compensation expense.
|
| Year Ended December 31, |
| |||||||||
|
| 2023 |
|
| 2022 |
|
| 2021 |
| |||
Valuation allowance as of beginning of year |
| $ | 41,755 |
|
| $ | 36,921 |
|
| $ | 30,558 |
|
Decreases recorded to accumulated deficit |
|
| — |
|
|
| — |
|
|
| (159 | ) |
Decreases recorded as a benefit to income tax provision |
|
| — |
|
|
| — |
|
|
| (2,510 | ) |
Increases recorded to tax provision |
|
| 12,193 |
|
|
| 4,834 |
|
|
| 9,032 |
|
Valuation allowance as of end of year |
| $ | 53,948 |
|
| $ | 41,755 |
|
| $ | 36,921 |
|
Year Ended December 31, | ||||||||||||
2021 | 2020 | 2019 | ||||||||||
Valuation allowance as of beginning of year | $ | 30,558 | $ | 15,292 | $ | 11,257 | ||||||
| Decreases recorded to accumulated deficit | (159 | ) | 0 | 0 | ||||||||
| Decreases recorded as a benefit to income tax provision | (2,510 | ) | 0 | 0 | ||||||||
Increases recorded to tax provision | 9,032 | 15,266 | 4,035 | |||||||||
Valuation allowance as of end of year | $ | 36,921 | $ | 30,558 | $ | 15,292 | ||||||
The Company assesses
The Company files
12. Leases
The Company
As of December
The components of lease cost under ASC 842 were as follows (in thousands):
|
| Year Ended December 31, |
| |||||||||
|
| 2023 |
|
| 2022 |
|
| 2021 |
| |||
Operating lease cost |
| $ | 2,682 |
|
| $ | 2,896 |
|
| $ | 3,174 |
|
Short-term lease cost |
|
| 318 |
|
|
| 269 |
|
|
| 39 |
|
Variable lease cost |
|
| 546 |
|
|
| 676 |
|
|
| 596 |
|
|
| $ | 3,546 |
|
| $ | 3,841 |
|
| $ | 3,809 |
|
64
Year Ended December 31, | ||||||||
2021 | 2020 | |||||||
Operating lease cost | $ | 3,174 | $ | 2,590 | ||||
Short-term lease cost | 39 | 0 | ||||||
Variable lease cost | 596 | 387 | ||||||
| $ | 3,809 | $ | 2,977 | |||||
Supplemental disclosure of cash flow information related to leases was as follows (in thousands):
|
| Year Ended December 31, |
| |||||||||
|
| 2023 |
|
| 2022 |
|
| 2021 |
| |||
Cash paid for amounts included in the measurement |
| $ | 3,190 |
|
| $ | 3,194 |
|
| $ | 3,271 |
|
Operating lease liabilities arising from obtaining |
| $ | — |
|
| $ | 1,096 |
|
| $ | 383 |
|
Year Ended December 31, | ||||||||
2021 | 2020 | |||||||
Cash paid for amounts included in the measurement of operating lease liabilities | $ | 3,271 | $ | 2,747 | ||||
Operating lease liabilities arising from obtaining right-of-use | $ | 383 | $ | 541 | ||||
The weighted-average remaining lease term and discount rate were as follows:
|
| December 31, |
| |||||
|
| 2023 |
|
| 2022 |
| ||
|
|
|
|
|
|
| ||
Weighted-average remaining lease term - operating leases (in years) |
|
| 0.8 |
|
|
| 2.93 |
|
Weighted-average discount rate - operating leases |
|
| 4.74 | % |
|
| 4.59 | % |
December 31, | ||||||||
2021 | 2020 | |||||||
Weighted-average remaining lease term - operating leases (in years) | 3.60 | 4.44 | ||||||
Weighted-average discount rate - operating leases | 4.62 | % | 4.67 | % | ||||
Because the interest rate implicit in the lease was not readily determinable, the Company’sCompany's incremental borrowing rate was used to calculate the present value of the leases. In determining its incremental borrowing rate, the Company considered its credit quality and assessed interest rates available in the market for similar borrowings, adjusted for the impact of collateral over the term of the lease.
Future annual lease payments under the Company’s leases as of December 31, 20212023 were as follows (in thousands):
Years ending December 31, |
|
|
|
|
| |
2024 |
|
|
| $ | 2,128 |
|
2025 |
|
|
|
| 70 |
|
Total future minimum lease payments |
|
|
|
| 2,198 |
|
Less: imputed interest |
|
|
|
| (38 | ) |
Total operating lease liabilities |
|
|
| $ | 2,160 |
|
Years ending December 31, | ||||
2022 | $ | 3,007 | ||
2023 | 2,785 | |||
2024 | 2,099 | |||
2025 | 177 | |||
2026 | 177 | |||
Thereafter | 649 | |||
Total future minimum lease payments | 8,894 | |||
Less: imputed interest | (667 | ) | ||
Total operating lease liabilities | $ | 8,227 | ||
Total operating lease liabilities and their classificationin the table above are classified on the consolidated balance(in as follows (in thousands):
|
|
|
| December 31, 2023 |
| |
Current operating lease liabilities |
|
|
| $ | 2,090 |
|
Operating lease liabilities, net of current portion |
|
|
|
| 70 |
|
Total operating lease liabilities |
|
|
| $ | 2,160 |
|
December 31, 2021 | ||||
Current operating lease liabilities | $ | 2,696 | ||
Operating lease liabilities, net of current portion | 5,531 | |||
Total operating lease liabilities | $ | 8,227 | ||
13. Commitments and Contingencies
Leases
The Company’sCompany's commitments under its leases are described in Note 12.
Indemnification Agreements
In the normal course of business, the Company may provide indemnification of varying scope and terms to third parties and enters into commitments and guarantees (“Agreements”) under which it may be required to make payments. The duration of these Agreements varies, and in certain cases, is indefinite. Furthermore, many of these Agreements do not limit the Company’s maximum potential payment exposure.
In addition, the Company has entered into indemnification agreements with members of its board of directors and executive officers that will require the Company, among other things, to indemnify them against certain liabilities that may arise by reason of their status or service as directors or officers.
Through December 31, 2021,2023, the Company has not incurred any material costs as a result of such indemnifications. The Company does not believe that the outcome of any claims under indemnification arrangements will have a material effect on its financial position, results of operations or cash flows, and it has not accrued any liabilities related to such obligations in its consolidated financial statements as of December 31, 20212023 and 2020.2022.
65
Legal Proceedings and Other Contingencies
The Company is from time to time subject to various other legal proceedings and claims, either asserted or unasserted, which arise in the ordinary course of its business. While the outcome of these other claims cannot be predicted with certainty, management does not believe that the outcome of any of these other legal matters will have a material adverse effect on the Company’s consolidated results of operations or financial condition.
14. Retirement Plan
The Company has established a defined-contribution plan under Section 401(k) of the Internal Revenue Code (the “401(k) Plan”). The 401(k) Plan covers all employees who meet defined minimum age and service requirements, and allows participants to defer a portion of their annual compensation on a
15. Related Party Transactions
The Company has, in the ordinary course of business, entered into arrangements with other companies who have shareholders in common with the Company. Pursuant to these arrangements, related-party affiliates receive payments for providing website visitor referrals and to a lesser extent a small amount of office space.referrals. During the years ended December 31, 2021, 20202023, 2022 and 2019,2021, the Company recorded expense of $
On February 23, 2022, the Company sold 1,004,016 shares of Class A common stock at a purchase price of 16. Restructuring and Other Charges In June 2023, the Company committed to exiting its health insurance vertical to increase focus on core verticals and implemented a workforce reduction plan (the “Reduction Plan”) to improve operating efficiency. The Reduction Plan included the elimination of 175 employees, or approximately 28%, of the Company’s workforce. During the year ended December 31, 2023, the Company incurred $4.0 million in severance charges in connection with the workforce reduction, consisting of cash expenditures for employee separation costs of $2.7 million that are expected to be paid through August 2024, and non-cash charges for the modification of certain equity awards of $1.3 million. During the year ended December 31, 2023, the Company recorded a credit of $0.2 million to restructuring and other charges in the accompanying consolidated statements of operations and comprehensive loss related to estimated severance payments that were not made. In August 2023, the Company sold assets related to its health insurance vertical comprised of all of the issued and outstanding membership interests of Eversurance LLC, a former subsidiary of the Company, to MyPlanAdvocate Insurance Solutions Inc. for cash consideration of $13.2 million. There were no employees of Eversurance LLC at the time of the sale. The assets sold consisted of commissions receivable of $30.8 million, which were expected to be collected over the next seven years, net intangible assets of $1.0 million and other net assets of $0.4 million, including the Company’s Evansville, Indiana office lease. The Company incurred $0.4 million of transaction costs in connection with the sale. Accordingly, the Company recognized a loss on sale of assets of $19.4 million during the year ended December 31, 2023, which amount is included in restructuring and other charges in the accompanying consolidated statements of operations and comprehensive loss. The Company also recorded an impairment charge on the right-of-use asset related to its Cambridge, Massachusetts office lease of $0.4 million during the year ended December 31, 2023 in connection with the Company entering into subleases with two third parties for a portion of the office space. The exit of the health insurance vertical and the Reduction Plan are referred to as the Company's recent restructuring, which was completed by September 30, 2023. 66 The Company’s restructuring and other charges and balance of its restructuring liability, which was included in accrued employee compensation and benefits, consisted of the following (in thousands): Year Ended December 31, 2023 Employee Separation Non-cash Loss on Sale of Asset Payments Compensation Health Assets Impairments Total Accrued Balance at December 31, 2022 $ — $ — $ — $ — $ — Expense 2,709 1,288 19,388 384 23,769 Payments (2,142 ) — — — (2,142 ) Adjustments (201 ) — — — (201 ) Non-cash — (1,288 ) (19,388 ) (384 ) (21,060 ) Accrued Balance at December 31, 2023 $ 366 $ — $ — $ — $ 366 67$14.94$14.94 per share for gross proceeds of $15.0
ITEM 9. CHANGES IN AND DISAGREEMENTS WITH ACCOUNTANTS ON ACCOUNTING AND FINANCIAL DISCLOSURE
None.
ITEM 9A. CONTROLS AND PROCEDURES
Evaluation of Disclosure Controls and Procedures
Our management, with the participation of our Chief Executive Officer and Chief Financial Officer (our principal executive officer and principal financial officer, respectively), evaluated the effectiveness of our disclosure controls and procedures as of December 31, 2021.2023. The term “disclosure controls and procedures,” as defined in Rules
Management recognizes that any controls and procedures, no matter how well designed and operated, can provide only reasonable assurance of achieving their objectives and our management necessarily applies its judgment in evaluating the cost-benefit relationship of possible controls and procedures. Based on the evaluation of our disclosure controls and procedures as of December 31, 2021,2023, our Chief Executive Officer and Chief Financial Officer concluded that, as of such date, our disclosure controls and procedures were notare effective due toat the material weaknesses described below.
Internal Control over Financial Reporting
Management’s Report on Internal Control over Financial Reporting
Our management is responsible for establishing and maintaining adequate internal control over financial reporting as defined in Rules 13a-15(f) and 15d-15(f) under the Exchange Act. Our internal control over financial reporting is a process designed to provide reasonable assurance regarding the reliability of financial reporting and the preparation of financial statements for external purposes in accordance with generally accepted accounting principles. Because of its inherent limitations, internal control over financial reporting may not prevent or detect misstatements.
Our management has assessed the effectiveness of our internal control over financial reporting as of December 31, 2021.2023. In making this assessment, management used the criteria described in
The effectiveness of our internal control over financial reporting as of December 31, 2021,2023 has been audited by PricewaterhouseCoopers LLP, an independent registered public accounting firm, as stated in their report which is included herein.
Changes in Internal Control Over Financial Reporting
No changes in our internal control over financial reporting (as defined in Rules20212023 that have materially affected, or are reasonably likely to materially affect, our internal control over financial reporting.
68
ITEM 9B. OTHER INFORMATION
Rule 10b5-1 Trading Plans
The adoption or termination of contracts, instructions or written plans for the purchase or sale of our securities by our Section 16 officers and directors for the three months ended December 31, 2023, each of which is intended to satisfy the affirmative defense conditions of Rule 10b5-1(c) under the Exchange Act (“Rule 10b5-1 Plan”), were as follows:
Name (Title) | Action Taken | Type of Trading Arrangement | Nature of Trading | Duration of Trading | Aggregate Number |
Jayme Mendal | Termination | Rule 10b5-1 trading arrangement | Sale | Until May 31, 2024, or such earlier date upon which all transactions are completed or expire without execution | Up to 157,280 shares |
Jayme Mendal | Adoption | Rule 10b5-1 trading arrangement | Sale | Until March 19, 2025, or such earlier date upon which all transactions are completed or expire without execution | Up to 73,000 shares |
Joseph Sanborn | Adoption | Rule 10b5-1 trading arrangement | Sale | Until June 13, 2024, or such earlier date upon which all transactions are completed or expire without execution | Up to 8,051 shares |
David Brainard | Modification | Rule 10b5-1 trading arrangement | Sale | Until December 13, 2024, or such earlier date upon which all transactions are completed or expire without execution | Indeterminable(1) |
(1) Mr. Brainard’s Rule 10b5-1 Trading Plan provides for the (i) sale of up to 7,073 shares of common stock and (ii) sale of an indeterminable number of shares of common stock from the settlement of restricted stock units (“RSUs”). The shares of common stock in clause (ii) is unknown as the number will vary based on the extent to which vesting conditions of the RSUs are satisfied, the market price of the Company’s common stock at the time of settlement and the amount of shares that would otherwise be issuable on each settlement date of a covered RSU that are sold or withheld in an amount sufficient to satisfy applicable tax withholding obligations.
ITEM 9C. DISCLOSURE REGARDING FOREIGN JURISDICTIONS THAT PREVENT INSPECTIONS
Not applicable.
PART III
ITEM 10. DIRECTORS, EXECUTIVE OFFICERS AND CORPORATE GOVERNANCE
The information required by this Item 10 will be included in our definitive proxy statement to be filed with the SEC with respect to our 20222024 Annual Meeting of Stockholders and is incorporated herein by reference.
Our board of directors has adopted a Code of Business Conduct and Ethics applicable to all officers, directors and employees, including our principal executive officer, principal financial officer, principal accounting officer or controller, or persons performing similar functions. A copy of the code is available at the Investors section of our website, located at investors.everquote.com, under “Corporate Governance—Governance Documents.” We intend to make all required disclosures regarding any amendments to, or waivers from, any provisions of the code at the same location of our website.
ITEM 11. EXECUTIVE COMPENSATION
The information required by this Item 11 will be included under the headings “Directors, Executive Officers and Corporate Governance—Compensation Committee Interlocks and Insider Participation”, “Executive Compensation” and “Director Compensation” in our definitive proxy statement to be filed with the SEC with respect to our 20222024 Annual Meeting of Stockholders and is incorporated herein by reference.
69
ITEM 12. SECURITY OWNERSHIP OF CERTAIN BENEFICIAL OWNERS AND MANAGEMENT AND RELATED STOCKHOLDER MATTERS
The information required by this Item 12 will be included in our definitive proxy statement to be filed with the SEC with respect to our 20222024 Annual Meeting of Stockholders and is incorporated herein by reference.
The information required by this Item 13 will be included in our definitive proxy statement to be filed with the SEC with respect to our 20222024 Annual Meeting of Stockholders and is incorporated herein by reference.
ITEM 14. PRINCIPAL ACCOUNTING FEES AND SERVICES
The information required by this Item 14 will be included in our definitive proxy statement to be filed with the SEC with respect to our 20222024 Annual Meeting of Stockholders and is incorporated herein by reference.
70
PART IV
ITEM 15. EXHIBITS, FINANCIAL STATEMENT SCHEDULES
(a) 1.
For a list of the financial statements included herein, see Index to Consolidated Financial Statements in this Annual Report on Form
Financial statement schedules have been omitted because they are either not required or not applicable or the information is included in the consolidated financial statements or the notes thereto.
See the Exhibit Index in Item 15(b) below.
(b) Exhibit Index. |
Exhibit Number | Description | |
2.1 | ||
3.1 | ||
3.2 | ||
4.1 | ||
4.2 | ||
9.1 | ||
10.1 | ||
10.2# | ||
10.3# | ||
10.4# | ||
10.5# | ||
10.6# |
10.7# | ||
10.8# | ||
10.9# |
71
Exhibit Number | Description | |
10.10 | ||
10.11 | ||
10.12 | ||
10.13# | ||
10.14# | ||
10.15# | ||
10.16 | ||
10.17# | ||
10.18# | ||
10.19 | ||
10.20 | ||
10.21 | ||
10.22 | ||
21.1 | ||
23.1 | Consent of PricewaterhouseCoopers LLP, independent registered public accounting firm | |
31.1 | ||
31.2 | ||
32.1† | ||
32.2† | ||
97.1 |
| |
101.INS | Inline XBRL Instance Document - the instance document does not appear in the Interactive Data File because its XBRL tags are embedded within the Inline XBRL document |
101.SCH | ||
Inline XBRL Taxonomy Extension Schema | ||
104 | ||
Cover Page Interactive Data File (formatted as Inline XBRL and contained in Exhibit 101) |
72
# Indicates management contract or compensation plan.
† The certifications attached as Exhibits 32.1 and 32.2 that accompany this Annual Report on Form 10-K, are not deemed filed with the Securities and Exchange Commission and are not to be incorporated by reference into any filing of EverQuote, Inc. under the Securities Act of 1933, as amended, or the Securities Exchange Act of 1934, as amended, whether made before or after the date of this Annual Report on Form 10-K, irrespective of any general incorporation language contained in such filing.
ITEM 16. FORM 10-K SUMMARY
None.
73
SIGNATURES
Pursuant to the requirements of Section 13 or 15(d) of the Securities Exchange Act of 1934, the registrant has duly caused this report to be signed on its behalf by the undersigned, thereunto duly authorized.
February 27, 2024 | EVERQUOTE, INC. | ||||||
By: | /s/ Jayme Mendal | ||||||
Jayme Mendal | |||||||
Chief Executive Officer and President | |||||||
Pursuant to the requirements of the Securities Exchange Act of 1934, as amended, this Report has been signed below by the following persons on behalf of the Registrant in the capacities and on the dates indicated.
Signature | Title | Date | ||
/s/ Jayme Mendal Jayme Mendal | Chief Executive Officer and President and Director (Principal Executive Officer) | February | ||
/s/ Joseph Sanborn | Chief Financial Officer and Treasurer (Principal Financial | February | ||
/s/ Jon Ayotte Jon Ayotte | Chief Accounting Officer (Principal Accounting Officer) | February 27, 2024 | ||
/s/ David Blundin David Blundin | Chairman of the Board of Directors | February | ||
/s/ Sanju Bansal Sanju Bansal | Director | February | ||
/s/ Paul Deninger Paul Deninger | Director | February | ||
/s/ George Neble George Neble | Director | February | ||
/s/ John Shields John Shields | Director | February | ||
/s/ Mira Wilczek Mira Wilczek | Director | February | ||
74