| Line of Business | Product / Service | Product / service description | Primary pricing method | |||||||||||||||||
IoT Connectivity 73% and 66% of revenue for the years ended 2023 and 2022, respectively | IoT Connectivity as a Service (CaaS) | •IoT Connectivity services offered through our IoT platform ‘KORE One’™ •Our connectivity solutions allow devices to seamlessly and securely connect anywhere in the world across any network connected to the Internet, which we call our multiple devices, multiple locations, multiple carriers CaaS multi-value proposition | Per subscriber per month for lifetime of device (7-10 years and growing) Multi-year contracts with automatic renewals | |||||||||||||||||
IoT Connectivity Enablement as a Service (CEaaS) Not currently provided in the United States | • IoT Connectivity Management Platform as a Service (or individual KORE One engine) • Cellular Core Network as a Service (Cloud Native Evolved Packet Core “EPC”) | |||||||||||||||||||
IoT Solutions 27% and 34% of revenue for the years ended 2023 and 2022, respectively | IoT Device Management Services | • Outsourced platform-enabled services (e.g., logistics, configuration, device management) •Sourcing of third-party devices globally, device design and selection services | Upfront fee per device or per device per month | |||||||||||||||||
| IoT Security Location Based Services (LBS) | •KORE’s SecurityPro® SaaS platform • KORE’s PositionLogic® SaaS platform and LBS APIs | Per subscriber per month | ||||||||||||||||||
Customers
Our customers operate in a wide variety of sectors, including healthcare, fleet and vehicle management, asset management, communication services, and industrial/manufacturing. KORE’s largestNo single customer comprising approximately 21% and 16%accounted for more than 10% of KORE’sour total revenue for the yearsyear ended December 31, 2021 and 2020, respectively, is2023. One customer, a large multinational medical device and health care company.
Key Partners
revenue, respectively | Multi-year contracts with automatic renewals | |||||
Enablement as a Service (CEaaS) | ||||||
Management Services | ||||||
Based Services (LBS) | ||||||
KORE’s Competition and Differentiators
•For IoT Connectivity services: telecom carriers such as T-Mobile and Vodafone; and Mobile Virtual Network Operators such as Aeris and Wireless Logic.
•For IoT Solutions and Analytics: device management services providers such as Velocitor Solutions and Futura Mobility; fleet management SaaS providers such as Fleetmatics and GPS Trackit; and analytics services providers such as Galooli and Intellisite.
5
vertical knowledge and experience (, in Connected Health through the U.S. Food and Drug Administration (“FDA”)FDA Facilities Registration, ISO 9001/13485 certification and HIPAA compliance), itsour breadth of solutions and analytics services, and 3,300+ connectivity-only customers that provide cross-selling opportunities of additional IoT managed services.
e.g.
Intellectual Property
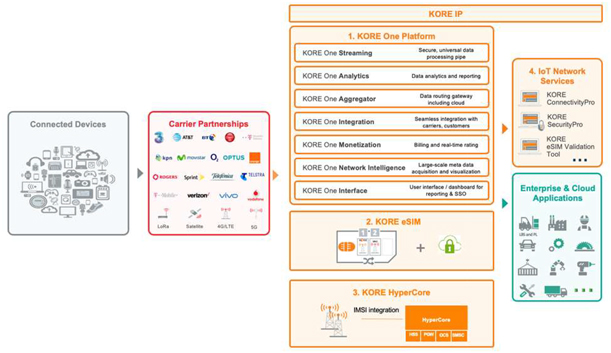
Connectivity and IOT Solutions. The KORE One Platform was built using a microservices-based proprietary architecture and consists of seven (7) keyopen, modular, and scalable engines.
KORE has developed its eSIM which helps in providing(OmniSIM and SuperSim): Our eSIM can provide global and local connectivity usingon a single eSIMSIM, which can be remotely updated with a preferred carrier profile over“over the air,air” or OTA.remotely. The key pieces of intellectual property in this portfolio include KORE’sour eSIM profile, eSIM Validation Tool, and itsour APIs.
Cloud Native HyperCore (Cellular Network as a Service): Any cellular network is comprised of a Radio Access Network (“RAN”), fiber optic backhaul, and a “core network”, the functions of which constitute the “brains” of thisthe network (including switching, authentication, etc.). Cloud Native Evolved Packet Core “EPC”HyperCore provides KOREus as well as some of itsour customers with a cellular “core network” (built on top of a cellular carrier’s RAN and backhaul from a cellular carrier). KORE’sOur intellectual property consists of both a traditional and a cloud-native core network component.
IoT Network and Application Services
•ConnectivityPro: IoT Connectivity Management Platform that provides an array of global IoT Connectivity services such as provisioning connectivity, provisioning users, rating and charging, distribution management, eSIM orchestration, diagnostics, and support.
Apart from the intellectual property listed above, KORE maintainswe maintain one active patent, several trademarks and ownership of domain and website names, all of which we consider our intellectual property.
Employees
Government Regulations and Compliance
HIPAA,
Several jurisdictions have passed laws in this area, and other jurisdictions are considering imposing additional restrictions. These laws continue to develop and may be inconsistent from jurisdiction to jurisdiction. Any entities covered by HIPAA (including entities such as KORE which track health-related data) are required by the HIPAA Privacy Rule to protect and prevent the unauthorized disclosure of patient health information known as protected health information. HIPAA also requires that covered entities comply with the HIPAA Security Rule which requires, among other things that, all covered entities (i) ensure the confidentiality, integrity and availability of all electronicelectronically protected health information; (ii) detect and safeguard against anticipated threats to the security of the information; (iii) protect against anticipated impermissible uses or disclosures; and (iv) certify compliance by their workforce.
For information regarding our oversight and management of cybersecurity and related risks, see Part I, Item 1C, “Cybersecurity”.
6
Available Information
We file electronically with the SEC our annual reports on Form We announce material
10-K,
quarterly reports on Form10-Q,
current reports on Form8-K,
proxy statements and other information. Our SEC filings are available to the public over the Internet at the SEC’s website at http://www.sec.gov. We make available on our website at www.korewireless.com, free of charge, copies of these reports and any amendments as soon as reasonably practicable after filing or furnishing them with the SEC.The information contained on the websites referenced in this Annual Report on Form 10-K is not incorporated by reference into this filing. Further, the Company’s references to website URLs are intended to be inactive textual references only.
ITEM 1A. RISK FACTORS
An investment in our common stock or other securities involves significant risks. Before making a decision to invest in our common stock or other securities, you should carefully consider the following risks in addition to the public about us, our products and services and other matters through a variety of means, including our website, the investor relations section of our website, press releases, filings with the SEC, and public conference calls,information contained in order to achieve broad distribution of information to the public. We encourage investors and others to review the information we make publicthis Annual Report on Form 10-K. The risks discussed in these locations, as such information could be deemed to be material information.
Summary Risk Factors
We are subject to a number of risks that, if realized, could materially and adversely affect our business, financial condition, liquidity, results
of operations and prospects and our ability to make distributions to our stockholders. Some of our more significant challenges and risks
include, but are not limited to, the following, which are described in greater detail below:
•We face risks related to compliance with laws and regulations, including, without limitation, compliance with the SEC rules and regulations and tax law compliance in various jurisdictions, and failure to comply with these various laws and regulations could result in incurrence of substantial costs or otherwise materially and adversely affect us;
•We are heavily indebted, which subjects us to an increased risk of loss;
•Our significant stockholders and their respective affiliates have significant influence over us and their actions might not be in your best interest as a stockholder;
•The price of our common stock is highly volatile, and investment in our common stock therefore carries increased risk;
•If we are unable to successfully integrate the businesses we have acquired, or any future business acquisitions, our results of operations could be materially and adversely affected;
•The 5G market may take longer to materialize than we expect or, if it does materialize rapidly, we may not be able to meet the development schedule and other customer demands;
•Our development and investments in new technologies, may not generate operating income or contribute to future results of operations that meet our expectations;
•If we are unable to support customers with low latency and/or high throughput IoT use cases, our revenue growth and profitability will be harmed;
•If we are unable to effectively manage our increasingly diverse and complex businesses and operations, our ability to generate growth and revenue from new or existing customers may be adversely affected;
•The loss of our largest customers could significantly and materially adversely impact our revenue and profitability;
•Our products are highly technical and may contain undetected errors, product defects, security vulnerabilities, or software errors;
•If there are interruptions or performance problems associated with the network infrastructure used to provide our services, our customers may experience service outages, which may impact our reputation and future sales;
•Our inability to adapt to rapid technological change in our markets could impair our ability to remain competitive and adversely affect our results of operations;
•The market for the products and services that we offer is rapidly evolving and highly competitive. We may be unable to compete effectively;
•If we are unable to protect our intellectual property and proprietary rights, our competitive position and business could be harmed;
•Failure to maintain the security of our information and technology networks, including information relating to our customers and employees, could adversely affect us;
•Our internal and customer-facing systems, and systems of third parties they rely upon, may be subject to cybersecurity breaches, disruptions, or delays;
•We are subject to evolving privacy laws that are subject to potentially differing interpretations in the United States as well as other jurisdictions that can adversely impact our business and require that we incur substantial costs;
•Our technology contains third-party open-source software components and failure to comply with the terms of the underlying open-source software licenses could restrict our ability to provide our platform;
•We face risks inherent in conducting business internationally, including compliance with international as well as U.S. laws and regulations that apply to our international operations;
7
•We may be subject to legal proceedings and litigation, including intellectual property and privacy disputes, which are costly to defend and could materially harm our business, financial condition and results of operations;
•Our management has identified internal control deficiencies that have resulted in material weaknesses in our internal control over financial reporting and disclosure controls and procedures;
•Our future capital needs are uncertain, and we may need to raise additional funds in the future, but may not be able to raise such additional funds on acceptable terms or at all; and
•We have a history of losses and may not be able to achieve or sustain profitability in the future.
The above list is not exhaustive, and we face additional challenges and risks. Please carefully consider all of the information in this Annual Report on Form 10-K, including the matters set forth below in this Part I, Item 1A.
Risks Related to Our Business and Industry
Our actual operating results may differ significantly from any guidance provided.
Our guidance, including forward-looking statements, is prepared by management and is qualified by, and subject to, a number of assumptions and estimates that, while presented with numerical specificity, are inherently subject to significant business, economic and competitive uncertainties and contingencies. Many of these uncertainties and contingencies are beyond our control and are based upon specific assumptions with respect to future business decisions, some of which will change. We generally state possible outcomes as high and low ranges which are intended to provide a sensitivity analysis as variables are changed but are not intended to represent that actual results could not fall outside of the suggested ranges.
Guidance is necessarily speculative in nature, and it can be expected that some or all of the assumptions of the guidance furnished by us will not materialize or will vary significantly from actual results. In particular, guidance relating to the anticipated results of operations of an acquired business is inherently more speculative in nature than other guidance as management will, necessarily, be less familiar with the business, procedures, and operations of the acquired business. Similarly, guidance offered in periods of extreme uncertainty such as geopolitical tensions is inherently more speculative in nature than guidance offered in periods of relative stability. Accordingly, any guidance with respect to our projected financial performance is necessarily only an estimate of what management believes is realizable as of the date the guidance is given. Actual results will vary from the guidance and the variations may be material. Investors should also recognize that the reliability of any forecasted financial data will diminish the further into the future that the data is forecasted.
Actual operating results may be different from our guidance, and such differences may be adverse and material. In light of the foregoing, investors are urged to put the guidance in context and not to place undue reliance on it. In addition, the market price of our common stock may reflect various market assumptions as to the accuracy of our guidance. If our actual results of operations fall below the expectations of investors or securities analysts, the price of our common stock could decline substantially.
Our quarterly results of operations have fluctuated and are likely to continue to fluctuate. As a result, we may fail to meet the expectations of investors or securities analysts, potentially causing our stock price to decline.
Our quarterly operating results, including the levels of our revenue, costs of revenue, exclusive of depreciation and amortization, net loss before income taxes and cash flows, may fluctuate as a result of a variety of factors, including adverse macroeconomic conditions, the product mix that we sell, the relative sales related to our platforms and solutions and other factors which are outside of our control. If our quarterly revenue or results of operations fall below the expectations of investors or securities analysts, the price of our common stock could decline substantially. Fluctuations in our results of operations may be due to a number of factors, including:
•the portion of our revenue attributable to IoT Connectivity and IoT Services, including hardware and other sales;
•our ability to manage the businesses we have acquired, and to integrate and manage any future acquisitions of businesses;
•fluctuations in demand, including due to seasonality or broader economic factors, for our platforms and solutions;
•changes in pricing by us in response to competitive pricing actions;
•the ability of our hardware vendors to continue to manufacture high-quality products and to supply sufficient components and products to meet our demands;
•the timing and success of introductions of new solutions, products or upgrades by us or our competitors and the entrance of new competitors;
•changes in our business and pricing policies or those of our competitors;
•our ability to control costs, including our operating expenses and the costs of the hardware we purchase;
•changes in U.S. trade policies, including new or potential tariffs or penalties on imported products;
•competition, including entry into the industry by new competitors and new offerings by existing competitors;
•issues related to introductions of new or improved products such as supply chain disruptions or shortages of prior generation products or short-term decreased demand for next-generation products;
•perceived or actual problems with the security, privacy, integrity, reliability, quality or compatibility of our solutions, including those related to security breaches in our systems, our subscribers’ systems, unscheduled downtime, or outages;
•the amount and timing of expenditures, including those related to expanding our operations (including through acquisitions), increasing research and development, introducing new solutions or paying litigation expenses;
8
•the ability to effectively manage growth within existing and new markets domestically and abroad;
•changes in the payment terms for our platforms and solutions;
•collectability of receivables due from customers and other third parties;
•the strength of regional, national and global economies; and
•the impact of natural disasters such as earthquakes, hurricanes, fires, power outages, floods, epidemics, pandemics and public health crises, and other catastrophic events or man-made problems such as terrorism, civil unrest and actual or threatened armed conflict, or global or regional economic, political, and social conditions.
We have a history of operating losses and may not be able to achieve or sustain profitability in the future.
We have a history of operating losses, and we may not achieve or maintain profitability in the future. We are not certain whether or when we will be able to achieve or sustain profitability in the future. Additionally, expenses may increase in future periods if we continue to invest in growth, which could negatively affect our future results of operations if our revenue does not increase commensurate with our expenses. Any failure to increase our revenue as we invest in our business, or to manage our costs, could prevent us from achieving or maintaining profitability or positive cash flow. If we are unable to successfully address these risks and challenges, our business, financial condition, results of operations, and prospects could be materially adversely affected.
We have historically grown by acquisition. Investment in new business strategies and acquisitions could result in operating difficulties, dilution of our common stock, and other consequences that could harm our business, financial condition, and operating results.
New business strategies and acquisitions are important elements of our strategy and use of capital. We are likely to continue to evaluate and enter into discussions regarding a wide array of such potential strategic transactions, which could create unforeseen operating difficulties and expenditures. Some of these areas where we face risk include:
•Diversion of management time and focus from operating our business to challenges related to acquisitions and other strategic transactions;
•Failure to successfully integrate the acquired operations, technologies, services and personnel (including cultural integration and retention of employees) and further develop the acquired business and technology;
•Implementation or remediation of controls, procedures, and policies at the acquired company;
•Integration of the acquired company's accounting and administrative systems, and the coordination of product, engineering, and sales and marketing functions;
•Transition of operations, users, and customers onto our existing platforms;
•In the case of foreign acquisitions, the need to integrate operations across different cultures and languages and to address the particular economic, currency, political, and regulatory risks associated with specific countries;
•Failure to accomplish commercial, strategic or financial objectives with respect to investments;
•Failure to realize the value of investment due to lack of liquidity;
•Liability for activities of the acquired company before the acquisition, including patent and trademark infringement claims, data privacy and security issues, violations of laws, commercial disputes, tax liabilities, warranty claims, product liabilities, and other known and unknown liabilities; and
•Litigation or other claims in connection with the acquired company, including claims from terminated employees, customers, former stockholders, or other third parties.
Our failure to address these risks or other problems encountered in connection with our past or future acquisitions and other strategic transactions could cause us to fail to realize their anticipated benefits, incur unanticipated liabilities, and harm our business generally.
Our acquisitions and other strategic transactions could also result in dilutive issuance of our equity securities, the incurrence of debt, contingent liabilities, amortization expenses, or impairment of goodwill and/or long lived-assets, and restructuring charges. Also, the anticipated benefits or value of our acquisitions and other strategic transactions may not materialize. Further, market reaction to an acquisition may not be as we anticipate. Any or all of the foregoing could materially harm our financial condition and operating results, and / or cause our stock price to decline substantially.
As a public company, we must maintain internal control over financial reporting. We have identified material weaknesses in our internal control over financial reporting. If remediation of such material weaknesses is not effective, or if we fail to develop and maintain proper and effective internal control over financial reporting and disclosure controls and procedures, our ability to produce timely and accurate financial statements, comply with applicable laws and regulations, or access the capital markets could be impaired.
As a public company, our management is responsible for designing, implementing, and actively evaluating our internal control over financial reporting in a manner that meets the standards of publicly traded companies required by Section 404(a) of the Sarbanes-Oxley Act.
The process of designing and implementing effective internal control over financial reporting is a continuous effort that requires us to anticipate and react to changes in our business and the economic and regulatory environments and to expend significant resources to maintain internal control over financial reporting that are adequate to satisfy our reporting obligations as a public company. The rules governing the standards that must be met for our management to assess our internal control over financial reporting are complex and require significant documentation,
9
testing, and remediation. Testing and maintaining our internal control over financial reporting and remediating material weaknesses may divert our management’s attention from other matters that are important to our business.
We have identified material weaknesses in our internal control over financial reporting as defined in Rule 13a-15(f) under the Exchange Act, which are disclosed in Item 9A, “Controls and Procedures”. A material weakness is defined as a deficiency, or combination of deficiencies, in internal control over financial reporting, such that there is a reasonable possibility that a material misstatement of our annual or interim financial statements will not be prevented or detected on a timely basis. For a detailed discussion regarding the material weaknesses identified as well as management’s remediation plans, see Part II, Item 9A, “Control and Procedures” in this Annual Report on Form 10-K. If we are unable to accomplish our remediation objectives in a timely and effective fashion, our ability to comply with the financial reporting requirements and other rules that apply to public companies could be impaired. We may not remediate our material weaknesses in a timely and effective manner. Furthermore, new material weaknesses may arise in the future. If our remediation measures are insufficient to address the material weaknesses, or if additional material weaknesses in our internal control are discovered or occur in the future, our financial statements may contain material misstatements and we could be required to restate our financial results.
If we fail to develop and maintain proper and effective internal control over financial reporting, or remediate our current material weaknesses in a timely fashion, our ability to produce timely and accurate financial statements, comply with applicable laws and regulations, or access capital markets could be impaired, and could also cause us to fail to meet our reporting obligations and cause stockholders to lose confidence in our financial results, which could materially and adversely affect us.
Further, there are inherent limitations in the effectiveness of any control system, including the potential for human error and the possible circumvention or overriding of controls and procedures. Additionally, judgments in decision-making can be faulty and breakdowns can occur because of a simple error or mistake. An effective control system can provide only reasonable, not absolute, assurance that the control objectives of the system are adequately met. Finally, projections of any evaluation or assessment of effectiveness of a control system to future periods are subject to the risks that, over time, controls may become inadequate because of changes in an entity’s operating environment or deterioration in the degree of compliance with policies or procedures.
Our senior management team may have limited experience with the complexities of managing a publicly traded company.
Since becoming a public company in 2021, we have been required, on an ongoing basis, to comply with various laws, regulations and requirements, including the requirements of the Exchange Act, related regulations of the SEC, and continued listing requirements of the NYSE, along with certain extremely technical and complex accounting requirements of GAAP, and reports required under these laws, regulations, and requirements, which must be communicated to the market on a timely basis. Our senior management team may have limited experience with these laws, regulations, and requirements, and a failure to timely identify any potential for noncompliance with the foregoing may result in a material adverse event, and have significant consequences to our stockholders.
Risks Related to Our Products and Technology
The 5G market may take longer to materialize than we expect or, if it does materialize rapidly, we may not be able to meet the development schedule and other customer demands.
Our growth depends in part on our ability to extend our technologies and products into new and expanded areas, including 5G. Our development and investments in these new technologies may not generate operating income or contribute to future results of operations that meet our expectations.
We continue to invest significant resources toward advancements primarily in support ofFCC, FAA,Federal Communications Commission, Federal Aviation Administration, the wireless telecommunications industry, and the aviation industry are working on solutions to
4G-
and5G-based
technologies. We also invest in new and expanded product areas by utilizing our existing technical and business expertise and through acquisitions or other strategic transactions. Our future growth depends on our ability to develop leading and cost-effective technologies and products for these new and expanded areas and developing technologies. In particular, our growth depends significantly on our ability to develop and commercialize products using 5G technologies. In January 2022, several major U.S. wireless carriers had to temporarily delay the deployment of new wireless facilities that were meant to facilitate the evolution of their wireless networks to 5G technology in response to concerns of the aviation industry that those 5G facilities could interfere with equipment used for aviation and could impede aviation safety. Although the 10
alleviate those concerns, the timing for resolution is unclear, and such uncertainty could further impact the amount of and timing of 5G network investment. To the extent the 5G rollout is further delayed due to interference with existing technologies, or adoption of 5G is slowed as a result of such concerns, we may incur significant costs and asset impairments, which could adversely affect our business, financial condition, and results of operations.
If we are unable to support customers with low latency and/or high throughput IoT use cases, our revenue growth and profitability will be harmed
As wireless networks have evolved to support higher speeds, IoT devices have included more advanced capabilities such as video, real-time event logging, edge computecomputing services (where computing is completed on or near the site of the sensor), and voice controls. As a result, customers have developed IoT applications that consume more network resources and require much lower network latency. In order to support these new customers and the increasing number of 5G use cases, we must continue to make significant investments in network capacity, infrastructure, and edge virtualization solutions. The timely deployment of higher capacity infrastructure and edge virtualization to support high throughput, low latency IoT applications is critical to keeping and attracting key customers, the failure of which could adversely affect our business, financial condition, and results of operations.
Our products are highly technical and may contain undetected errors, product defects, security vulnerabilities, or software errors.
Our products and solutions, including our software products, are highly technical and complex and, when deployed, may contain errors, defects, or security vulnerabilities including but not limited to vulnerabilities resulting from the use of third-party hardware and software. We must develop our products quickly to keep pace with the rapidly changing market, and we have a history of frequently introducing new products. Products and services as sophisticated as ours could contain undetected errors or defects, especially when first introduced or when new models or versions are released. Such occurrences could result in damage to our reputation, lost revenue, diverted development resources, increased customer service and support costs, warranty claims, and litigation.
We warrant that our products will be free of defectdefects for various periods of time, depending on the product. In addition, certain of our contracts include epidemic failure clauses. If invoked, these clauses may entitle the customer to return or obtain credits for products and inventory, or to cancel outstanding purchase orders even if the products themselves are not defective.
Errors, viruses, or bugs may be present in software or hardware that we acquire or license from third parties and incorporate into our products or in third partythird-party software or hardware that our customers use in conjunction with our products. Our customers’ proprietary software and network firewall protections may corrupt data from our products and create difficulties in implementing our solutions. Changes to third partythird-party software or hardware that our customers use in conjunction with our software could also render our applications inoperable. Any errors, defects, or security vulnerabilities in our products or any defects in, or compatibility issues with, any third-party hardware or software or customers’ network environments discovered after commercial release could result in loss of revenue or delay in revenue recognition, loss of customers, theft of trade secrets, data or intellectual property and increased service and warranty cost, any of which could adversely affect our business, financial condition, and results of operations.
Undiscovered vulnerabilities in our products alone or in combination with third partythird-party hardware or software could expose them to hackers or other unscrupulous third parties who develop and deploy viruses, and other malicious software programs that could attack our products. Actual or perceived security vulnerabilities in our products could harm our reputation and lead some customers to return products, to reduce or delay future purchases, or use competitive products.
If there are interruptions, outages, or performance degradation problems associated with the network infrastructure used to provide our services, customers may experience service outages, thiswhich may impact our reputation and future sales
Our continued success depends, in part, on our ability to provide highly available services to our customers. The majority of our current and future customers expect to use our services 24 hours a day, seven days a week, without interruption or degradation of performance. Since a large majority of customer network traffic routes through hardware managed by us, any outage or performance problem that occurs within this infrastructure could impair the ability of our customers to transmit wireless data traffic to our destination servers, which could negatively impact the customers’ IoT devices or solutions. Potential outages and performance problems may occur due to a variety of factors, including hardware failure, equipment configuration changes, capacity constraints, human error and the introduction of new functionality. Additionally, we depend on services from various third parties to support IoT networks and platforms. If a third party experiences a service outage, a product defect or bug, or performance degradation, such failures could interrupt customers’ ability to use our services, which could also negatively affect their perception of our service reliability. Our services are hosted in our third partythird-party data centers and any outages in these centers from any source including catastrophic events such as terrorist attack, flood,attacks, floods, power failure, earthquake,failures, earthquakes, etc. can impact the availability of our services, which could adversely affect our business, financial condition, and results of operations.
Our internal and customer-facing systems, and systems of third parties we rely upon, may be subject to cybersecurity breaches, disruptions, ransom attacks or delays.
A cybersecurity incident in our own systems or the systems of our third-party providers may compromise the confidentiality, integrity, or availability of our own internal data, the availability of our products, and websites designed to support our customers or our customer data.
11
Computer hackers, ransom attacks, foreign governments, or cyber terrorists may attempt to or succeed in penetrating our network security and our website. The recent discovery of wide-scale cybersecurity intrusions into U.S. government and private company computer networks by alleged Russian state actors underscores the ongoing threat posed by sophisticated and foreign state-sponsored attacks. The frequency of ransomware and malware attacks has also been increasing over time. Unauthorized access and theft to our proprietary business information or customer data or rendering them unusable for our use through encryption, may be accomplished through
break-ins,
sabotage, theft of IoT data streams and transmissions, breach of our secure networkby an unauthorized party, computer viruses, computerattacks, employee theft or misuse, ransomware attacks, breach of the security of the networks of our third-party providers, or other misconduct. Additionally, outside parties may attempt to fraudulently induce employees or users to disclose sensitive or confidential information in order to gain access to data.
denial-of-service
Despite our efforts to maintain the security and integrity of our systems, it is impossible to eliminate this risk. Because the techniques used by computer hackers who may attempt to penetrate and sabotage our network security or our website change frequently, they may take advantage of weaknesses in third-party technology or standards of which we are unaware or that we do not control and may not be recognized until long after they have been launched against a target. We may be unable to anticipate or counter these techniques. It is also possible that unauthorized access to customer data or confidential information may be obtained through inadequate use of security controls by customers, vendors, or business partners. Efforts to prevent hackers from disrupting our service or otherwise accessing our systems are expensive to develop, implement, and maintain. Such efforts require ongoing monitoring and updating as technologies change and efforts to overcome security measures become more sophisticated and may limit the functionality of, or otherwise adversely impact our service offering and systems. A cybersecurity incident affecting our systems may also result in the theft of our intellectual property, proprietary data, or trade secrets, which would compromisepotentially compromising our competitive position, reputation, and operating results. We also may be required to notify regulators about any actual or perceived personal data breachbreach(es) (including the EUEuropean Union Lead Data Protection Authority) as well as the individualsindividual(s) who are affected by the incident within strict time periods.
The systems we rely upon also remain vulnerable to damage or interruption from a number of other factors, including access to the internet, the failure of our network or software systems, or significant variability in visitor traffic on our product websites, earthquakes, floods, fires, power loss, telecommunication failures, computer viruses, human error, and similar events or disruptions. Some of our systems are not fully redundant, and our disaster recovery planning is not sufficient for all eventualities. Our systems are also subject to intentional acts of vandalism. Despite any precautions we may take, the occurrence of a natural disaster, a decision by any of our third-party hosting providers to close a facility we use without adequate notice for financial or other reasons, or other unanticipated problems at our hosting facilities could cause system interruptions and delays, and result in loss of critical data and lengthy interruptions in our services.
We rely on our information systems and those of third parties for activities such as processing customer orders, delivery of products, hosting and providing services and support to our customers, billing and tracking our customers, hosting and managing our customer data, and otherwise running our business. Any disruptions or unexpected incompatibilities in our information systems and those of the third parties upon whomwhich we rely could have a significant impact on our business.
An increasing portion of our revenue comes from subscription solutions and other hosted services in which we store, retrieve, communicate, and manage data that is critical to our customers’ business systems. Disruption of our systems that support these services and solutions could cause disruptions in our customers’ systems and in the businesses that rely on these systems. Any such disruptions could harm our reputation, create liabilities tofor our customers, hurt demand for our services and solutions, and adversely impact our business, financial condition, and results of operations.
We may become involved in litigation that could materially adversely affect our business, financial condition, results of operations, and prospects.
We may become a party to litigation and disputes related to our intellectual property, business practices, regulatory compliance, products, or platform. While we intend to vigorously defend these lawsuits, litigation can be costly and time-consuming, divert the attention of management and key personnel from our business operations, and dissuade prospective customers from subscribing to our products. We may need to settle litigation and disputes on terms that are unfavorable to us, or we may be subject to an unfavorable judgment that may not be reversible upon appeal. The terms of any settlement or judgment may require us to cease some or all of our operations or pay substantial amounts to the other party. In addition, our customer agreements include provisions requiring us to indemnify our customers against liabilities if our products infringe a third-party’sthird party’s intellectual property rights, and we have negotiated other specific indemnities with certain customers, in each case, which could require us to make payments to such customers. During the course of any litigation or dispute, we may make announcements regarding the results of hearings and motions and other interim developments. If securities analysts and investors consider these announcements negative, our stock price may decline. With respect to any intellectual property rights claim, we may have to seek a license to continue practices found to be in violation of third-party rights, which may not be available on reasonable terms and may significantly increase our operating expenses. A license to continue such practices may not be available to us, and we may be required to develop alternative non-infringing technology or practices or discontinue our practices. The development of alternative, non-infringing technology or practices could require significant effort and expenses.expense. Any of the above could materially adversely affect our business, financial condition, and results of operations.
Risks Related to Customers and Demand for Our Solutions
Our inability to adapt to rapid technological change in our markets could impair our ability to remain competitive and adversely affect ourthe results of operations.
12
All of the markets in which we operate are characterized by rapid technological change, frequent introductions of new products, services and solutions, and evolving customer demands. In addition, we are affected by changes in the many industries related to the products or services we offer, including Connectivity services and IoT Solutions offered to our Connected Health, Fleet Management, Communication Services, Asset managementManagement and industrialIndustrial verticals. As the technologies used in each of these industries evolves,evolve, we will face new integration and competition challenges. For example, eSIM and eUICC standards may evolve and the Companywe will have to evolve itsour technology to such standards. If we are unable to adapt to rapid technological change, it could adversely affect our business, financial condition, and results of operations and our ability to remain competitive.
Additionally, the deployment of 5G network technology is subject to a variety of risks, including those related to equipment and spectrum availability, unexpected costs, and regulatory permitting requirements that could cause deployment delays or network performance issues. These issues could result in significant costs or reduce the anticipated benefits of the enhancements to our networks. If our services or solutions fail to gain acceptance in the marketplace, or if costs associated with the implementation and introduction of these services or solutions materially increase, our ability to retain and attract customers could be adversely affected.
We may not be able to retain and increase sales to our existing customers, which could negatively impact our financial results.
We generally seek to license our platform and solutions pursuant to customer subscriptions. However, our customers have no obligation to maintain the subscription and can often terminate with30-days’ 30 days’ notice. We also actively seek to sell additional solutions to our existing customers. If our efforts to satisfy our existing customers are not successful, we may not be able to retain them or sell additional functionality to them and, as a result, our revenue and ability to grow could be adversely affected. Customers may choose not to renew their subscriptions for many reasons, including the belief that our service is not required for their business needs or is otherwise not cost-effective, a desire to reduce discretionary spending or a belief that our competitors’ services provide better value. Additionally, our customers may not renew for reasons entirely out of our control, such as the dissolution of their business or an economic downturn in their industry. A significant increase in our churn rate would have an adverse effect on our business, financial condition, and operating results.
A part of our growth strategy is to sell additional new features and solutions to our existing customers. Our ability to sell new features to customers will depend in significant part on our ability to anticipate industry evolution, practices and standards and to continue to enhance existing solutions or introduce or acquire new solutions on a timely basis to keep pace with technological developments both within our industry and in related industries, and to remain compliant with any regulations mandated by federal agencies or state-mandated or foreign government regulations as they pertain to our customers. However, we may prove unsuccessful either in developing new features or in expanding the third-party software and products with which our solutions integrate. In addition, the success of any enhancement or new feature depends on several factors, including the timely completion, introduction and market acceptance of the enhancement or feature. Any new solutions we develop or acquire might not be introduced in a timely or cost-effective manner and might not achieve the broad market acceptance necessary to generate significant revenue. If any of our competitors implement new technologies before we are able to implement them or better anticipate the innovation and integration opportunities in related industries, those competitors may be able to provide more effective or cheaperless expensive solutions than ours.
The marketability of our products may suffer if wireless telecommunications operators do not deliver acceptable wireless services.
The success of our business depends, in part, on the capacity, affordability, reliability, and prevalence of wireless data networks provided by wireless telecommunications operators and on which our products and solutions operate.
Currently, various wireless telecommunications operators, either individually or jointly with us, sell our products in connection with the sale of their wireless data services to their customers. Growth in demand for wireless data access may be limited if, for example, wireless telecommunications operators cease or materially curtail operations, fail to offer services that customers consider valuable at acceptable prices, change the terms of trade to us including offering us meaningful volume discounts without unduly high volume commitments, fail to maintain sufficient capacity to meet the demand for wireless data access, delay the expansion of their wireless networks and services, fail to offer and maintain reliable wireless network services or fail to market their services effectively. Lack of demand for wireless data access could adversely affect our business, financial condition, and results of operations
Reduction in regulation in certain markets may adversely impact demand for certain of our solutions by reducing the necessity for, or desirability of, our solutions.
Regulatory compliance and reporting are driven by legislation and requirements, which are often subject to change, from regulatory authorities in nearly every jurisdiction globally. For example, in the United States, fleet operators can face numerous complex regulatory requirements, including mandatory Compliance, Safety and Accountability driver safety scoring, hours of service, compliance and fuel tax reporting. TheA reduction in regulation in certain markets may adversely impact demand for certain of our solutions, which could materially and adversely affect our business, financial condition and results of operations. Conversely, an increase in regulation could increase KORE’sour cost of providing services, which could adversely affect our business, financial condition, and results of operations.
Our future success and competitive position are dependent upon our proprietary technology. Despite our efforts to protect our intellectual property, unauthorized parties may attempt to copy or otherwise obtain our software or develop software with the same functionality or to obtain and use information that we regard as proprietary. Others may develop technologies that are similar or superior to our technology or duplicate our technology. In addition, effective copyright, patent, and trade secret protection may be unavailable, limited, or not applied for in certain countries. The steps taken by us to protect our technology might not prevent the misappropriation of such technology.
The value of our products relies substantially on our technical innovation in fields in which there are many current patent filings. Third parties may claim that we or our customers (some of whom are indemnified by us) are infringing their intellectual property rights. For example, individuals and groups may purchase intellectual property assets for the purpose of asserting claims of infringement and attempting to extract settlements from us or our customers. The number of these claims has increased in recent years. As new patents are issued or are brought to our attention by the holders of such patents,customers, and it may be necessary for us to secure a license from such patent holders, redesign our products, or withdraw products from the market. In addition, the legal costs and engineering time required to safeguard intellectual property or to defend against litigation could become a significant expense ofto operations. Any such litigation could require us to incur substantial costs and divert significant valuable resources, including the efforts of our technical and management personnel, which couldpotentially adversely affectaffecting our business, financial condition, and results of operations.
If we are unable to protect our intellectual property and proprietary rights, our competitive position and our business could be harmed.
We rely on a combination of intellectual property laws, trade secrets, confidentiality procedures, and contractual provisions to protect our intellectual property and proprietary rights. Monitoring unauthorized use of our intellectual property is difficult and costly. The steps we have taken to protect our proprietary rights may not be adequate to prevent misappropriation of our intellectual property. We may not be able to detect unauthorized use of, or take appropriate steps to enforce, our intellectual property rights. Our competitors may also independently develop similar technology. In addition, the laws of many countries do not protect our proprietary rights to as great an extent as do the laws of the United States. Any failure by us to meaningfully protect our intellectual property could result in competitors offering products that incorporate our most technologically advanced features, which could seriously reducepotentially reducing demand for our products and solutions. In addition, we may in the future need to initiate infringement claims or litigation. Litigation,
whether we are a plaintiff or a defendant, can be expensive, time consuming, and may divert the efforts of our technical staff and managerial personnel, which could adversely affectaffecting our business, financial condition, and results of operations, whether or not such litigation results in a determination favorable to us.
An assertion by a third partythird-party that we are infringing on its intellectual property could subject us to costly and time-consuming litigation or expensive licenses and our business could be harmed.
The technology industries involving mobile data communications,telecommunications, IoT devices, software, and services are characterized by the existence of a large number of patents, copyrights, trademarks, and trade secrets and by frequent litigation based on allegations of infringement or other violations of intellectual property rights. Much of this litigation involves patent holding companies or other adverse patent owners who have no relevant product revenue of their own, and against whom our own patent portfolio may provide little or no deterrence. One or more patent infringement lawsuits fromevery year in the ordinary course of business.
non-practicing
entities may be brought against us or our subsidiaries We cannot assure you that we or our subsidiaries willmay not prevail in any current or future intellectual property infringement or other litigation given the complex technical issues and inherent uncertainties in such litigation. Defending such claims, regardless of their merit, could be time-consumingtime consuming and distracting to management, result in costly litigation or settlement, cause development delays, or require us or our subsidiaries to enter into royalty or licensing agreements. In addition, we or our subsidiaries could be obligated to indemnify our customers against third parties’ claims of intellectual property infringement based on our products or solutions. If our products or solutions violate any third-party intellectual property rights, we could be required to withdraw them from the market, re-develop them or seek to obtain licenses from third parties, which might not be available on reasonable terms or at all. Any efforts to re-develop our products or solutions, obtain licenses from third parties on favorable terms or license a substitute technology might not be successful and, in any case, might substantially increase our costs and harm our business, financial condition, and operating results. Withdrawal of any of our products or solutions from the market could harm our business, financial condition, and operating results.
In addition, we incorporate open-source software into our products and solutions. Given the nature of open-source software, third parties might assert copyright and other intellectual property infringement claims against us based on our use of certain open-source software programs. The terms of many open-source licenses to which we are subject have not been interpreted by U.S. courts or courts of other jurisdictions, and there is a risk that those licenses could be construed in a manner that imposes unanticipated conditions or restrictions on our ability to commercialize our products and solutions. In that event, we could be required to seek licenses from third parties in order to continue offering our products and solutions, to
re-develop
our solutions, to discontinue sales of our solutions, or to release our proprietary software source code under the terms of an open-source license, any of which could adversely affect our business, financial condition, and results of operations.Risks Related to Competition
The market for the products and services that we offer is rapidly evolving and highly competitive. We may be unable to compete effectively.
14
The market for the products and services that we offer is rapidly evolving and highly competitive. Our products compete with a variety of solutions, including other subscription-based IoT platforms and solutions. We expect competition to continue to increase and intensify, especially in the 5G market. Many of our competitors or potential competitors have significantly greater financial, technical, operational, and marketing resources than we do. These competitors, for example, may be able to respond more rapidly or more effectively than we can to new or emerging technologies, changes in customer requirements, supplier-related developments, or a shift in the business landscape. They also may devote greater or more effective resources than we do to the development, manufacture, promotion, sale, and post-sale support of their respective products and services.
Many of our current and potential competitors have more extensive customer bases and broader customer, supplier, and other industry relationships that they can leverage to establish competitive dealings with many of our current and potential customers. Some of these companies also have more established and larger customer support organizations than we do. In addition, these companies may adopt more aggressive pricing policies or offer more attractive terms to customers than they currently do, or than we are able to do. They may bundle their competitive products with broader product offerings and may introduce new products, services and enhancements. Current and potential competitors might merge or otherwise establish cooperative relationships among themselves or with third parties to enhance their products, services, or market position. In addition, at any time any given customer or supplier of ours could elect to enter our then existingthen-existing line of business and thereafter compete with us, whether directly or indirectly. As a result, it is possible that new competitors or new or otherwise enhanced relationships among existing competitors may emerge and rapidly acquire significant market share to the detriment of our business.
We expect our competitors to continue to improve the features and performance of their current products and to introduce new products, services, and technologies which, if successful, could reduce our sales and the market acceptance of our products, generate increased price competition, and make our products obsolete. For our products to remain competitive, we must, among other things, continue to invest significant resources (financial, human, and otherwise) in, among other things, research and development, sales and marketing, and customer support. We cannot be sure that we willmay not have or will continue to have sufficient resources to make these investments or thatinvestments. Also, we willmay not be able to make the technological advances in the marketplace, meet changing customer requirements, achieve market acceptance and respond to our competitors’ products. If we are unable to compete effectively, it could adversely affect our business, financial condition, and results of operations.
key personnel. We may not be able to maintain and expand our business if we lose members of our senior management team or other key personnel or are not able to hire, retain, and manage additional qualified personnel.
Our success in the future depends in part on the continued contribution of our executive,senior management team and technical, engineering, sales, marketing, operations, and administrative personnel. Recruiting and retaining skilled personnel in the industries in which we operate, including engineers and other technical staff, and skilled sales and marketing personnel, is highly competitive. In addition, in the event that we acquire another business or company, the success of anyan acquisition willmay depend in part on our retention and integration of key personnel from the acquired company or business.
Although we may enter into employment agreements with members of our senior management team and other key personnel, these arrangements do not prevent any of our management or key personnel from leaving us. If one or more of our senior management team or other key personnel is unable or unwilling to continue in their present positions, we may not be able to replace them easily or at all, and other senior management may be required to divert their attention from other aspects of the Company.business. If we lose any of these individuals or are not able to attract or retain qualified personnel in the future, or if we experience delays in hiring required personnel, particularly qualifiedincluding technical, engineering, sales, marketing, operations, and salesadministrative personnel, we may not be able to maintain and expand our business.
Risks Related to Developing and Delivering Our Solutions
We are dependent on telecommunications carriers to provide our IoT Connectivity Services and a disruption in one or more of these relationships could significantly adversely impact our business
Our IoT Connectivity services are built on top of cellular connectivity provided by large telecommunications carriers and while we have a large number of carrier relationships, there is a significant concentration of revenue derived from connectivity built on top of cellular networks provided by our top three carrier relationships, are approximately 41% ofas these three carriers dominate the business for the year ended December 31, 2021. U.S. telecommunications carrier market.
Our inability to keep anon-going ongoing contractual relationship with our existing or desired future telecommunications carrier partners or to maintain favorable terms of trade with them including competitive pricing, reasonable or no volume commitments, payment terms, access to the latest cellular and network technologies including
5G, eSIMs, and eUICC, could adversely affect our ability to sell our connectivity services to customers. KORE’sOur contracts with large telecommunications carriers are not long term,long-term, and so are subject to frequent renegotiation. The outcome of any renegotiation cannot be guaranteed. Additional consolidation of carriers could further reduce our bargaining power in negotiations with carriers, which could adversely affectaffecting our business, financial condition, and results of operations.
15
We are dependent on a limited number of suppliers for certain critical components toof our solutions; a disruption in our supply chain could adversely affect our revenue and results of operations.
Our current reliance on a limited group of suppliers involves risks, including a potential inability to obtain an adequate supply of required products or components to meet customers’ IoT Solutions delivery requirements, a risk that we may accumulate excess inventories if we inaccurately forecast demand for our products, reduced control over pricing and delivery schedules, discontinuation of or increased prices for certain components, and economic conditions that may adversely impact the viability of our suppliers and contract manufacturers. Any disruption in our supply chain could reduce our revenue and adversely impact our financial results. Such a disruption could occur as a result of any number of events, including, but not limited to, increases in wages that drive up prices or labor stoppages, the imposition of regulations, quotas or embargoes on components, a scarcity of, or significant increase in the price of, required electronic components for our products, trade restrictions, tariffs or duties, fluctuations in currency exchange rates, transportation failures affecting the supply chain and shipment of materials and finished goods, third partythird-party interference in the integrity of the products sourced through the supply chain, the unavailability of raw materials, severe weather conditions, natural disasters, civil unrest, military conflicts, geopolitical developments, war or terrorism, including the ongoing conflictconflicts in Ukraine and the Middle East, regional or global pandemics, like COVID-19, and disruptions in utility and other services. In recent months global supply chains have been disrupted by COVID-19 and other factors, resulting in shortages of a number of goods, including chips necessary to produce a wide variety of devices. To the extent we are unable to obtain adequate supplies of chips, this could impact our brand as well as our results of operations. Any inability to obtain adequate deliveries or any other circumstance that would require us to seek alternative sources of supply or to manufacture, assemble, and test such components internally could significantly delay our ability to ship our products, which could damage relationships with current and prospective customers, and could harm our reputation and brand and could adversely affect our business, financial condition, and results of operations.
Natural disasters, civil unrest, public health crises such as theCOVID-19pandemic,and pandemics, political crises, climate change, and other catastrophic events or other events outside of our control could damage our facilities or the facilities of third parties on which we depend and could impact consumer spending.
If any of our facilities or the facilities of our third-party service providers including for example our telecommunications carrier partners, other suppliers of products that are components of our IoT Solutions, or our data center providers, or our other partners isare affected by natural disasters, such as earthquakes, tsunamis, wildfires, power shortages, floods, civil unrest, public health crises (such as pandemics and epidemics), political crises (such as terrorism, war, political instability or other conflict), climate change, or other events outside our control, including a cyberattack, our critical business or IT systems could be destroyed or disrupted and our ability to conduct normal business operations and our revenue, financial condition, and operating results could be adversely affected. For example, the COVID-19 pandemic has impacted, and may continue to have an impact on our operations, including the implementation of various containment measures, such as government-imposed shelter-in-place orders, quarantines, national or regional lockdowns, travel restrictions and other public health safety measures. Specifically, in response to the spread of COVID-19, and in accordance with direction from government authorities, we have, for example, limited the number of such personnel that can be present at our facilities at any one time, mandated the usage of face masks in our facilities, limited the maximum numbers of people allowed in rooms at one time and requested that many of our personnel work remotely. Our business also may be impacted by changes in the severity of the COVID-19 pandemic at different times in the various cities and regions
Our solutions integrate with third-party technologies and if our solutions become incompatible with these technologies, our solutions would lose functionality and our customer acquisition and retention could be adversely affected.
Our solutions integrate with third-party software and devices to allow our solutions to perform key functions. Errors, viruses or bugs may be present in third-party software that our customers use in conjunction with our solutions. Changes to third-party software that our customers use in conjunction with our solutions could also render our solutions inoperable. Customers may conclude that our software is the cause of these errors, bugs or viruses and terminate their subscriptions. The inability to easily integrate with, or any defects in, any third-party software could result in increased costs, or in delays in software releases or updates to our products until such issues have been resolved, which could adversely affect onaffecting our business, financial condition, results of operations, and future prospects and could damagedamaging our reputation.
Any significant disruption in service on our websites or in our computer systems could damage our reputation and result in a loss of customers, which would harmharming our business and operating results.
Our brand, reputation, and ability to attract, retain, and serve our customers are dependent upon the reliable performance of our services and our customers’ ability to access our solutions at all times. Our customers rely on our solutions to make operating decisions related to their businesses, as well as to measure, store and analyze valuable data regarding their businesses. Our solutions are vulnerable to interruption and our data centers are vulnerable to damage or interruption from human error, intentional bad acts, computer viruses or hackers, earthquakes, hurricanes, floods, fires, war, terrorist attacks, power losses, hardware failures, systems failures, telecommunications failures, and similar events, any of which could limit our customers’ ability to access our solutions. Prolonged delays or unforeseen difficulties in connection with adding capacity or upgrading our network architecture may cause our service quality to suffer. Any event that significantly disrupts our service or exposes our data to misuse could damage our reputation and harm our business, financial condition and results of operations, including reducing our revenue, causing us to issue credits to customers, subjecting us to potential liability, increasing our churn rates, or increasing our cost of acquiring new customers.
Risks Related to International Operations
We face risks inherent in conducting business internationally, including compliance with international and U.S. laws and regulations that apply to our international operations
We operate in many parts of the world that have experienced significant governmental corruption to some degree and, in certain circumstances, strict compliance with anti-bribery laws may conflict with local customs and practices. These laws and regulations include data privacy requirements, labor relations laws, tax laws, anti-competition regulations, import and trade restrictions, export control laws, and laws that prohibit corrupt payments to governmental officials or certain payments or remunerations to customers, including the U.S. Foreign Corrupt Practices Act (“FCPA”FCPA”), the U.K. Bribery Act, and other anti-corruption laws that have recently been the subject of a substantial increase in
16
global enforcement. Many of our products are subject to U.S. export law restrictions that limit the destinations and types of customers to which our products may be sold or that require an export license in connection with sales outside the United States. Given the high level of complexity of these laws, there is a risk that some provisions may be inadvertently or intentionally breached, for example through fraudulent or negligent behavior of individual employees, our failure to comply with certain formal documentation requirements or otherwise. Also, we may be held liable for actions taken by our local partners. Violations of these laws and regulations could result in fines, criminal sanctions against us, our officers or our employees, and prohibitions or conditions on the conduct of our business. Any such violations could include prohibitions or conditions on our ability to offer our products in one or more countries and could materially damage our reputation, our brand, our international expansion efforts, our ability to attract and retain employees, and our business, financial condition and results of operations.
The FCPA and other anti-corruption laws and regulations (“Anti-Corruption Laws”) prohibit corrupt payments by our employees, vendors or agents. From time to time, we may receive inquiries from authoritiesprimary service KORE provides in the United States and elsewhere about our business activities outsideis mobile broadband Internet connectivity. Historically, the FCC has recognized that broadband internet access services are “information services” subject to limited regulation. In 2015, the FCC issued a “network
neutrality” decision that declared mass-market mobile broadband Internet access to be a commercial mobile radio service subject to certain “telecommunications service” regulations under Title II of the United StatesCommunications Act of 1934. These regulations have the potential to limit the ways that mobile broadband Internet service providers can structure business arrangements and our compliance with Anti-Corruption Laws. While we devote substantial resources to our global compliance programsmanage networks, and have implemented policies, training and internal controls designed to reduce the risk of corrupt payments, our employees, vendors or agents may violate our policies.
In 2017, the FCC voted to return broadband internet access service to its prior classification as “information services.” In 2023 the FCC announced its intention to consider rules aimed at subjecting mass market mobile broadband internet service to regulation under Title II again. KORE’s services are not directly implicated by these rulings because KORE does not provide “mass market” Internet access. However, by virtue of operations. Operations outsideallowing all customers to access any point of the United StatesInternet, KORE’s Connectivity services are closely analogous to the services mentioned in the FCC’s open internet orders, which creates the possibility that the FCC may be affected by changesbegin regulating KORE’s services in trade protection laws, policies and measures, and other regulatory requirements affecting trade and investment.
As a result of our international operations, we are subject to foreign tax regulations. Suchthe FCC’s activities, it is unclear at this time how mobile broadband Internet services will be regulated in the future, and the potential impact those regulations may have on our IoT Connectivity and Services. In addition, while the FCC has not be clear, not consistently appliedsought to specifically regulate the manner in which broadband internet service providers manage network traffic, the FCC has nonetheless continued to adopt other forms of regulation over such services, which in the future may affect our operations and subject us to sudden change, particularly with regard to international transfer pricing. Our earnings could be reduced by the uncertain and changing nature of such tax regulations.
We are subject to evolving privacy laws in the United States and other jurisdictions that are subject to potentially differing interpretations and which could adversely impact our business and require that we incur substantial costs
Existing privacy-related laws and regulations in the United States and other countries are evolving and are subject to potentially differing interpretations, and various U.S. federal and state or other international legislative and regulatory bodies may expand or enact laws regarding privacy and data security-related matters. For example, the EU-U.S. Privacy Shield, a basis for data transfers from the EUEuropean Union to the U.S., was invalidated by the European Court of Justice, and we expect that the international transfer of personal data will present ongoing compliance challenges and complicate our business transactions and operations. Brexit, the United Kingdom’s withdrawal from the European Union, could also lead to further legislative and regulatory changes with regard to personal data transfers between the two territories. New privacy laws have come into effect in Brazil and New Zealand in 2020, and revisions of privacy laws are currently pending in countries like Canada and China. Some countries are considering or have passed legislation that requires local storage and processing of data, including geospatial data.
In addition, in June 2018, California enacted the California Consumer Privacy Act (the “CCPA”“CCPA”), which took effect in January 2020 and has been amended by the California Privacy Rights Act (the “CPRA”“CPRA”), which passed via ballot initiative in November 2020 and will fully taketook effect in January 2023. The CCPA and CPRA, among other things, givesgive California residents expanded rights to access and delete their personal information, opt out of certain personal information sharing, and receive detailed information about how their personal information is used. Other states and the U.S. Congress have introduced data privacy legislation that may impact our business. Data privacy legislation, amendments and revisions to existing data privacy legislation, and other developments impacting data privacy and data protection may require us to modify our data processing practices and policies, increase the complexity of providing our products and services, and cause us to incur substantial costs in an effort to comply. Failure to comply may lead to significant fines and business interruption and could adversely affect our business, financial condition and results of operations.
We generally conduct our international operations through wholly-owned subsidiaries and report our taxable income in various jurisdictions worldwide based on our business operations in those jurisdictions. Our corporate structure and associated transfer pricing policies contemplate the business flows and future growth into the international markets and consider the functions, risks and assets of the various entities involved in the intercompany transactions. The amount of taxes we pay in different jurisdictions will depend to a significant degree on the application of the tax laws of the various jurisdictions to our international business activities, changes in tax rates, new or revised tax laws or interpretations of existing tax laws and policies and our ability to operate our business in a manner consistent with our corporate structure and intercompany arrangements, any or all of which could result in additional tax liabilities or increases in, or in the volatility of, our effective tax rate.
The taxing authorities of the jurisdictions in which we operate may challenge our methodologies for pricing intercompany transactions, which are required to be computed on an arm’s-length basis pursuant to the intercompany arrangements or disagree with our determinations as to the
17
income and expenses attributable to specific jurisdictions. If such a challenge or disagreement were to occur, and our position was not sustained, we could be required to pay additional taxes, interest and penalties, which could result in one-time tax charges, higher effective tax rates, reduced cash flows and lower overall profitability of our operations; in addition, it is uncertain whether any such adverse effects could be mitigated by corresponding adjustments in other jurisdictions with respect to the items affected. Our productsfinancial statements could fail to reflect adequate reserves to cover such a contingency.
Further changes in the tax laws of foreign jurisdictions could arise, including as a result of the base erosion and solutions enableprofit-shifting project undertaken by the Organization for Economic Co-operation and Development (the “OECD”). The OECD, which represents a coalition of member countries, has issued recommendations that, in some cases, make substantial changes to numerous long-standing tax positions and principles; many of these changes have been adopted or are under active consideration by OECD members and/or other countries.
Recent changes to the U.S. tax laws impact the tax treatment of foreign earnings by, among other things, creating limits on the ability of taxpayers to claim and utilize foreign tax credits, imposing minimum effective rates of current tax on certain classes of foreign income, and imposing additional taxes in connection with specified payments to related foreign recipients, among other items. Due to our existing international business activities, which we anticipate expanding, any additional guidance such as U.S Treasury regulations and administrative interpretations may increase our worldwide effective tax rate and adversely affect our financial condition and operating results.
We are also subject to the examination of our tax returns by the U.S. Internal Revenue Service (the “IRS”), and other tax authorities. The final determination of tax audits and any related disputes could be materially different from our historical income tax provisions and accruals and could have an adverse effect on our financial statements for the period or periods for which the applicable final determinations are made.
Taxing authorities may successfully assert that we should have collected or in the future should collect sales and use, value added or similar taxes, and we could be subject to liability with respect to past or future sales, potentially adversely affecting our operating results.
Sales and use, value added, and similar tax laws and rates vary greatly by jurisdiction. Certain jurisdictions in which we have not historically collected such taxes may assert that such taxes are applicable, which could result in tax assessments, penalties and interest, to us or our end-customers for the past amounts, and we may be required to collect such taxes in the future. If we are unsuccessful in collecting such taxes from our end customers, we could be held liable for such costs. Such tax assessments, penalties and interest, or future requirements, could be material and may adversely affect our financial condition and operating results.
Risks Related to Our Indebtedness
We have incurred substantial indebtedness that may decrease our business flexibility, access to capital, and/or increase our borrowing costs, and we may still incur substantially more debt, which may materially and adversely affect our operations and financial results.
Our indebtedness is significant and may:
•limit our ability to obtain additional financing to fund future working capital, capital expenditures, business opportunities, acquisitions, or other general corporate requirements;
•require a portion of our cash flows to be dedicated to debt service payments instead of other purposes, thereby reducing the amount of cash flows available for working capital, capital expenditures, business opportunities, acquisitions and other general corporate purposes;
•increase our vulnerability to adverse changes in general economic, industry and competitive conditions;
•expose us to collect, manage and store a wide rangethe risk of data, suchincreased interest rates as data related to vehicle tracking and fleet management, including vehicle location and fuel usage, speed and mileage. Somethe majority of the data we collect or use in our business isborrowings are subject to data privacy laws, which are complexvariable rates of interest;
•place us at a competitive disadvantage compared to our less leveraged competitors; and
•increase our cost of doing business. The U.S. federal government and various state governments have adopted or proposed limitations on the collection, distribution and use of personal information. Many foreign jurisdictions, including the European Union and the United Kingdom, have adopted legislation (including directives or regulations)borrowing.
In addition, our long-term debt may contain restrictive covenants that increase or change the requirements governing data collection and storagelimit our ability to engage in these jurisdictions. We marketactivities that may be in our products in over 50 countries, and accordingly, we are subject to many different, and potentially conflicting, privacy laws. If our privacy or data security measures fail to comply, or are perceived to faillong-term best interest. Our failure to comply with current or future laws and regulations, we may be subject to litigation, regulatory investigations or other liabilities.
If our cash flows and capital resources are insufficient to fund our debt service obligations, we could face substantial liquidity problems and may be forced to reduce or delay investments and capital expenditures, or sell assets, seek additional capital or restructure or refinance our indebtedness, and such refinancing may not be on attractive terms, if available at all. Our ability to restructure or refinance our debt will depend on, among other things, the condition of the capital markets and our financial condition at such times. Any refinancing of our debt could be at higher interest rates and may require us to comply with more onerous covenants, which could further restrict our business operations. In addition, any failure to make payments of interest and principal on our outstanding indebtedness on a timely basis would likely result in a reduction of our credit rating, potentially harming our ability to incur additional indebtedness and our financial condition. In the absence of such cash flows and resources, we could face substantial liquidity problems and might be required to dispose of material assets or operations to meet our debt service and other obligations.
We may require additional capital to support our business, and this capital might not be available on acceptable terms, if at all.
18
We intend to continue to make investments to support our business financial condition, and resultsmay require additional funds. In particular, we may seek additional funds to develop new products and enhance our platform and existing products, expand our operations, including our sales and marketing organizations and our presence outside of operations.
Risks Related to our Common Stock
The price of our securities may be volatile.
The trading price of our securities may fluctuate substantially and may be lower than the price at which you purchase such securities. This may be especially true for companies like ours with a small public float. The trading price of our securities may be volatile and subject to wide fluctuations due to a variety of factors, including:
•the success of competitive services or technologies;
•developments related to our existing or any future collaborations;
•regulatory or legal developments in the United States and other countries;
•developments or disputes concerning our intellectual property or other proprietary rights;
•the recruitment or departure of key personnel;
•actual or anticipated changes in estimates as to financial results, development timelines or recommendations by securities analysts;
•variations in our financial results or those of companies that are perceived to be similar to us;
•general economic, industry and market conditions; and
•the other factors described in this “Risk Factors” section.
These market and industry factors may materially reduce the market price of our common stocksecurities regardless of our operating performance.
Future resalesissuances of shares of our common stock or other securities convertible into or exercisable for shares of our common stock could cause the market value of shares of our common stock to decline and could result in dilution of your shares.
A substantial number of warrants and Backstop Notes are outstanding, each of which are convertible into or exercisable for shares of our common stock.
Sales of substantial amounts of shares of our common stock, issuances of common stock upon the conversion or exercise of warrants or Backstop Notes, issuances of other classes of stock, or further issuances of preferred stock could cause the market price of shares of our common stock to decrease significantly. We cannot predict the effect, if any, of future sales of shares of our common stock, or the availability of shares of our common stock for future sales, on the value of shares of our common stock. Sales of substantial amounts of shares of our common stock, or the perception that such sales could occur, may adversely affect prevailing market prices for shares of our common stock.
We have received a delisting notice from the NYSE and are subject to continuing compliance monitoring by the NYSE. If we do not regain compliance with, and continue to meet, the NYSE continued listing standards, our common stock may be delisted.
Our common stock is currently listed for trading on the NYSE, and the continued listing of our common stock on the NYSE is subject to our compliance with applicable listing standards. On September 5, 2023 we were notified by the NYSE that, as of August 30, 2023, we had failed to meet the NYSE’s minimum average share price requirement. We have submitted a plan to the NYSE regarding regaining our compliance with this requirement. If we are unable to regain and maintain compliance with the NYSE criteria for continued listing, our common stock may be delisted. Delisting may have an adverse effect on the liquidity of our common stock and, as a result, the market price for our common stock might decline.
In the case of a delisting, we and our stockholders could face significant material adverse consequences including:
•a limited availability of market quotations for our securities;
•a determination that our common stock is a “penny stock,” which will require brokers trading in our common stock to adhere to more stringent rules, generally resulting in a reduced level of trading activity in the secondary trading market for our common stock;
•a limited amount of analyst coverage; and
•a decreased ability to issue additional securities or obtain additional financing in the future.
19
Risks Related to Our Corporate Governance
Certain significant stockholders of ours have significant influence over us and our Board, and their actions might not be in your best interest as a stockholder.
Certain significant stockholders of ours together own approximately 38% of our outstanding common stock as of December 31, 2023. We entered into an Amended and Restated Investor Rights Agreement dated November 15, 2023 (the “Amended Investor Rights Agreement”) with these stockholders and an investor (Searchlight) who controls our Series A-1 Preferred Stock, $0.0001 par value per share (the “Series A-1 Preferred Stock”), and as of December 31, 2023 beneficially owned 13% of our outstanding common stock underlying 12,024,711 warrants exercisable for nominal consideration or on a cashless basis. The Amended Investor Rights Agreement provides these parties with, among other things, Board nomination rights. As a result of this arrangement, these stockholders have significant influence over us.
Any influence exerted by these significant stockholders over our business and affairs might not be consistent with your best interests as a stockholder and may result in their interests not being aligned with the interests of other stockholders. In addition, the control and influence provided to these significant stockholders may have the effect of delaying, deferring, or preventing a transaction or change in control of us, which might involve a premium price for shares of our common stock or otherwise not be in your best interest as a stockholder.
General Risk Factors
Downturns in general economic and market conditions and reductions in spending may reduce demand for our platforms and solutions, which could harm our revenue, results of operations and cash flows.
Our revenue, results of operations and cash flows depend on the overall demand for our platforms and solutions. Negative macroeconomic conditions in the general economy both in the United States and abroad, inflation, changes in gross domestic product growth, financial and credit market fluctuations, energy costs, international trade relations, geopolitical tensions, the availability and cost of credit, interest rate volatility and the global housing and mortgage markets could cause a decrease in consumer discretionary spending and business investment and diminish growth expectations in the U.S. economy and abroad. A broadening or protracted extension of any economic downturn could have a material adverse impact on our business revenue, results of operations, and cash flows.
The obligations associated with being a public company require significant resources and attention from our senior management team.
As a public company with listed common stock, we are required to comply with various laws, regulations and requirements, including the requirements of the Exchange Act, certain corporate governance provisions of the Sarbanes-Oxley Act, related regulations of the SEC and requirements of the NYSE. The Exchange Act requires that we file annual, quarterly and current reports with respect to our business and financial condition. The Sarbanes-Oxley Act requires, among other things, that we establish and maintain effective internal control over financial reporting. While Section 404 of the Sarbanes-Oxley Act requires, among other things, that we assess the effectiveness of our internal control structure and procedures for financial reporting on an annual basis, for as long as we are a non-accelerated filer or an Emerging Growth Company, the registered public accounting firm that issues an audit report on our financial statements will not be required to attest to or report on the effectiveness of our internal control over financial reporting pursuant to Section 404(b) of the Sarbanes-Oxley Act. An independent assessment of the effectiveness of our internal controls could detect problems that our management's assessment might not. We cannot be certain if the scaled SEC reporting options available to Smaller Reporting Companies or the delay in implementing new accounting standards available to us as an Emerging Growth Company will make our common stock less attractive to investors, possibly making the market price of our common stock decline and the trading volume more volatile.
Future sales of our common stock that are currently restricted from sale by federal securities laws or lock-up agreements may cause the market price of our securities to drop significantly, even if our business is doing well.
In the future, we may attempt to increase our capital resources by making offerings of debt securities or additional offerings of equity securities. Upon bankruptcy or liquidation, holders of our debt securities, our Series A-1 preferred stock and other preferred stock, if issued, and lenders with respect to other borrowings will receive a distribution of our available assets prior to the holders of shares of our common stock. Our Series A-1 preferred stock does, and additional preferred stock could, have been subject to securities class action litigation. We may be the target of this type of litigation in the future. Securities litigation against us could result in substantial costs and divert management’s attention from other business concerns, which could seriously harm our business.
20
payments or both that could limit our ability to pay a dividend or other distribution to the holders of shares of our common stock. Because our decision to issue securities in any future offering will depend on market conditions and other factors beyond our control, we cannot predict or estimate the amount, timing or nature of our future offerings. Thus, holders of shares of our common stock bear the risk of our future offerings reducing the market price of shares of our common stock and diluting their stock holdings in us.
Reports published by analysts, including projections in those reports that differ from our actual results, could adversely affect the price and trading volume of our common stock.
Securities research analysts may establish and publish their own periodic projections for us. These projections may vary widely and may not accurately predict the results we actually achieve. Our share price may decline if itsour actual results do not match the projections of these securities research analysts. Similarly, if one or more of the analysts who write reports on or downgradesand downgrade our stock or publishespublish inaccurate or unfavorable research about our business, our share price could decline. If one or more of these analysts ceasescease coverage of us or failsfail to publish reports on us regularly, our securities price or trading volume could decline.
ITEM 1B. UNRESOLVED STAFF COMMENTS
None.
ITEM 1C. CYBERSECURITY
We recognize the critical importance of maintaining the safety and security of our systems and data and have a process for overseeing and managing cybersecurity and related risks, which is supported by both management and our Board.
Our cybersecurity functions are led by our Chief Technology Officer (“CTO”), who reports to our Chief Executive Officer. Our Senior Director - Global Security (“SDGS”), under the direction of the CTO, is responsible for overseeing our cybersecurity management program and the protection and defense of our networks and systems. The SDGS manages a team of cybersecurity professionals with broad experience and expertise, including in cybersecurity threat assessments and detection, mitigation technologies, cybersecurity training, incident response, cyber forensics, insider threats and regulatory compliance.
Our Board is responsible for overseeing our enterprise risk management activities in general, and each of our Board committees assists the Board in its role of risk oversight. The full Board receives an update on the Company’s risk management process and the risk trends related to cybersecurity at least annually from the CTO. The audit committee of the Board (the “Audit Committee”) specifically assists the Board in its oversight of risks related to cybersecurity. To help ensure effective oversight, the Audit Committee receives an update on cybersecurity from the CTO on an as-needed basis.
Our approach to cybersecurity risk management includes the following key elements:
Internal Audit Program – We operate an internal audit program. On an annual basis, our internal audit team conducts an overall business risk assessment, which includes an evaluation of cybersecurity risks. Included in this evaluation is a report on our cybersecurity posture and related matters that is presented to the leaders of the relevant business teams, who are responsible for prioritizing and addressing the risks identified.
Internal training and awareness – We provide training to our employees to help identify, avoid, and mitigate the risk from cybersecurity threats. Our employees are required to complete required cybersecurity awareness training upon hiring and also participate annually in required cybersecurity awareness training, unless on a leave of absence.
Vendor risk management program – We have implemented processes to identify and manage risks from cybersecurity threats associated with our use of third-party service providers. Our vendor risk management program establishes governance, processes and tools for managing various risks related to third-party service providers, including information security and supplier-related risks. As a condition of working with KORE, suppliers who access sensitive business or customer information are expected to meet certain information security requirements.
As of December 31, 2023, we have not identified risks from cybersecurity threats, including as a result of any previous cybersecurity incidents, that have materially affected or are reasonably likely to materially affect us, including our business strategy, results of operations or financial condition. We are committed to investing in cybersecurity and to enhancing our internal controls and processes, which are designed to help protect our systems and information. For more information regarding the risks we face from cybersecurity threats, please see Part I, Item 1A, — “Risk Factors”.
ITEM 2. PROPERTIES
Our corporate headquarters is in leased office space located in Atlanta, Georgia. We also lease other properties throughout North America and in various locations outside North America. We do not intend to pay cash dividends for the foreseeable future.
ITEM 3. LEGAL PROCEEDINGS
From time to time, the Company is involvedwe are subject to various legal proceedings, lawsuits, disputes and claims arising in litigation arising out of the ordinary course of our business. There are noAlthough the outcome of these and other claims cannot be predicted with certainty, management does not believe that the ultimate resolution of these matters will have a material legal proceedings, other than ordinary routine litigation incidental to the business, to which the Companyadverse effect on our financial condition or anyresults of the Company’s subsidiaries are a party or of which any of the Company or the Company’s subsidiaries’ property is subject.
ITEM 4. MINE SAFETY DISCLOSURES
Not applicable.
PART II.
ITEM 5. MARKET FOR REGISTRANT’S COMMON EQUITY, RELATED STOCKHOLDER MATTERS AND ISSUER PURCHASES OF EQUITY SECURITIES
Market Information for Common Equity
Our common stock has beenis listed on the New York Stock Exchange under the symbol “KORE” since October 1, 2021. Prior to that date, there was no public trading market for our common stock.
Holders of Record
As of March 28, 2022,April 9, 2024, there were approximately 76.283.2 million shares of our common stock outstanding and 8.9 million warrants to purchase our common stock outstanding, with 79 and 249 holders of record of our common stock and warrants, respectively.stock. The actual number of stockholders is greater than this number of record holders and includes stockholders who are beneficial owners but whose shares are held in “street name” accounts by brokers and other nominees.
We have not paid any cash dividends on our common stock to date. The payment of cash dividends in the future will be dependent upon our revenue and earnings, if any, capital requirements and general financial condition. The payment of any cash dividends will be within the discretion of our board of directors. Our ability to declare dividends may beis limited by the terms of financing or other agreements entered into by us or our subsidiaries from time to time.
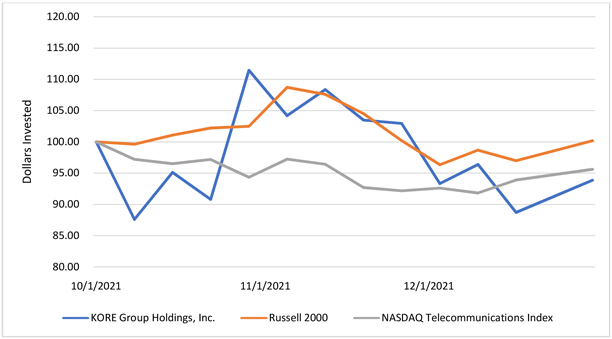
Issuer Purchases of Equity Securities
The following table sets forth information with respect to our repurchases of common stock in each month of the fourth quarter of 2023:
| Period | Total Number of Shares Purchased (1) | Average Price Paid per Share | Total Number of Shares Purchased as Part of Publicly Announced Programs | Approximate Dollar Value of Shares that May Yet Be Purchased Under the Program | ||||||||||||||||||||||
| October 1, 2023 - October 31, 2023 | — | $ | — | — | $ | — | ||||||||||||||||||||
| November 1, 2023 - November 30, 2023 | — | $ | — | — | $ | — | ||||||||||||||||||||
| December 1, 2023 - December 31, 2023 | 5,001,255 | $ | 0.57 | — | $ | — | ||||||||||||||||||||
(1) As previously disclosed, on December 13, 2023, we purchased 5 million shares of our common stock from Twilio, Inc. (“Twilio”) at the price of $0.5713 per share, which was equal to the volume weighted average purchase price per share of the common stock on the NYSE for the 10 consecutive trading days ending on December 8, 2023. This purchase was not made pursuant to a publicly announced share repurchase program. These shares of common stock have been retained by us as treasury stock.
On December 13, 2023, 1,255 shares of common stock were surrendered by an employee vesting in RSUs, in order to pay for applicable tax withholding. Under the Incentive Plan, participants may surrender shares as payment of applicable tax withholding on the vesting of equity awards. Shares so surrendered by participants in the Incentive Plan are repurchased pursuant to the terms of the Incentive Plan and applicable award agreement and not pursuant to publicly announced share repurchase programs. These shares of common stock have been cancelled.
ITEM 6. [RESERVED]
23
ITEM 7. MANAGEMENT’S DISCUSSION AND ANALYSIS OF FINANCIAL CONDITION AND RESULTS OF OPERATIONS
The following discussion and analysis of the financial condition and results of operations of KORE Group Holdings, Inc. should be read togetherin conjunction with our audited consolidated financial statements asand related notes and other financial information appearing elsewhere in this Annual Report on Form 10-K. In addition to historical information, the following discussion and other parts of and for the years ended December 31, 2021 and 2020. A detailed discussion comparing our results of operations for the years ended December 31, 2020 and 2019 can be found in “KORE’s Management’s Discussion and Analysis of Financial Condition and Results of Operations,” of ourthis Annual Report on FormS-4Registration Statement filed on August 11, 2021. This discussion may 10-K contain forward-looking statements based upon current expectationsinformation that involveinvolves risks and uncertainties. Our actual results maycould differ materially from those projected in theseanticipated by this forward-looking statements as a result of variousinformation due to the factors including those set forthdiscussed under “Risk Factors”.Factors,” “Special Note Regarding Forward-Looking Statements,” and elsewhere in this Annual Report on Form 10-K. Unless the context otherwise requires, all references in this section to “the Company” “KORE,” “us,” “our”“our,” “ours,” or “we” refer to Maple Holdings, Inc. prior to the Business Combination, and to KORE Group Holdings, Inc. following the consummation of the Business Combination on September 30, 2021.
Overview
Trends and Recent Developments
Overall macroeconomic environment and its effect on us
The overall U.S. economy seemed to fare well in 2023, as the globe, over different networkseconomy expanded despite persistently elevated inflation and protocols is a highly complex undertaking.
Recent developments in our business
In addition, the Company entered into an Investment Agreement on November 9, 2023, as amended on December 13, 2023 (the “Investment Agreement”), with Searchlight, whereby the Company agreed to issue and sell to Searchlight (i) shares of Series A-1 Preferred Stock and (ii) a Service”warrant (the “Original Warrant”) to purchase shares of common stock with an exercise price of $0.01 per share (as may be adjusted in accordance with the Original Warrant), in a private placement for an aggregate purchase price of $150 million. The foregoing private placement closed on November 15, 2023 (the “First Closing”), and the Company issued to Searchlight an aggregate of 150,000 shares of the Series A-1 Preferred Stock and an Original Warrant to purchase up to an aggregate of 11,800,000 shares of common stock (as may be adjusted in accordance with the Original Warrant). The Original Warrant was amended and restated in connection with the Second Closing (as defined below).
Pursuant to the IoT Connectivity Services product portfolio.
Results of this filing, COVID-19 has not had a significant negative impact on the Company’s results of operations, as evidenced by factors such as continued revenue growth and a decrease in the Company’s bad debt expenseOperations for the year endedYears Ended December 31, 2021 as compared to the year ended December 31, 2020.
2023 and 2022:Revenue
We derive revenue from:
Revenue arising from IoT Connectivity and IoT Solutions.
per-subscriber
basis.| For the Year Ended | Year-over-Year Increase / (Decrease) | ||||||||||||||||||||||
| ($ in thousands) | December 31, 2023 | December 31, 2022 | $ | % | |||||||||||||||||||
| Services | $ | 212,645 | $ | 188,985 | $ | 23,660 | 13 | % | |||||||||||||||
| Products | 63,965 | 79,462 | (15,497) | (20) | % | ||||||||||||||||||
| Total Revenue | $ | 276,610 | $ | 268,447 | $ | 8,163 | 3 | % | |||||||||||||||
Products revenue decreased by approximately $15.5 million, driven primarily by reduced demand from our largest customers for the year ended December 31, 2023, as they applied greater emphasis on inventory management and order fulfillment. In addition, products revenue for the year ended December 31, 2022 included a significant LTE transition project that did not repeat for the year ended December 31, 2023.
The table below sets forth the details of revenue disaggregated as arising from IoT Connectivity and IoT Solutions for the years ended December 31, 2023 and 2022:
| For the Year Ended | Year-over-Year Increase / (Decrease) | ||||||||||||||||||||||
| ($ in thousands) | December 31, 2023 | December 31, 2022 | $ | % | |||||||||||||||||||
| IoT Connectivity | $ | 202,393 | $ | 175,942 | $ | 26,451 | 15 | % | |||||||||||||||
| IoT Solutions | 74,217 | 92,505 | (18,288) | (20) | % | ||||||||||||||||||
| Total Revenue | $ | 276,610 | $ | 268,447 | $ | 8,163 | 3 | % | |||||||||||||||
IoT Connectivity revenue increased by approximately $26.5 million, which was primarily driven by the acquisition of Twilio’s IoT business, which generated the majority of theincrease. Additional revenue growth was driven by SIM transfers from key strategic customers, organic growth in existing customers as a result of net new activations, and increased connectivity consumption. These increases were partially offset by customer churn.
Our total number of connections increased from 15.0 million connections on December 31, 2022 to 18.5 million connections on December 31, 2023, primarily due to the acquisition of Twilio’s IoT business.
IoT Solutions revenue declined by approximately $18.3 million primarily due to reduced demand from our largest customers in the current year as these customers applied greater emphasis on inventory management and order fulfillment, as well as the conclusion of a significant LTE transition project that was completed during the year ended December 31, 2022.
Cost of revenue, consists primarilyexclusive of costsdepreciation and amortization
The cost of revenue associated with IoT Connectivity and those associated with IoT Solutions. IoT Connectivity costs include carrier costs, network operations, technology licenses, and other costs such as shipping a SIM.SIMs. The cost of revenue associated with IoT Solution costsSolutions include the cost of devices, shipping costs, warehouse lease and related facilities expenses, and personnel costs. Totalcost. The total cost of revenue excludes depreciation and amortization.
The table below sets forth our cost of revenue, exclusive of depreciation and amortization, for the years ended December 31, 2023 and 2022, disaggregated by “cost of services” and “cost of products”:
| For the Year Ended | Year-over-Year Increase / (Decrease) | ||||||||||||||||||||||
| ($ in thousands) | December 31, 2023 | December 31, 2022 | $ | % | |||||||||||||||||||
| Cost of services | $ | 82,547 | $ | 67,268 | $ | 15,279 | 23 | % | |||||||||||||||
| Cost of products | 46,016 | 61,886 | (15,870) | (26) | % | ||||||||||||||||||
| Total cost of revenue | $ | 128,563 | $ | 129,154 | $ | (591) | — | % | |||||||||||||||
| For the Year Ended | |||||||||||
| December 31, 2023 | December 31, 2022 | ||||||||||
| Cost of services | 61.2 | % | 64.4 | % | |||||||
| Cost of products | 28.1 | % | 22.1 | % | |||||||
| Overall blended rate | 53.5 | % | 51.9 | % | |||||||
Cost of services increased by $15.3 million for the year ended December 31, 2023, compared to the year ended December 31, 2022, primarily due to additional carrier costs related to the operationacquisition of the Twilio IoT business, along with SIM transfers and increased connectivity consumption across multiple carriers.
During the year ended December 31, 2023, the “cost of services” percentage of our business which are generallydecreased 3.2% compared to the year ended December 31, 2022 due to the inclusion of the lower margin services from the acquisition of Twilio’s IoT business.
Cost of products decreased by $15.9 million for the year ended December 31, 2023, compared to the year ended December 31, 2022 due to lower sales volume from existing IoT Solutions customers.
During the year ended December 31, 2023 the “cost of products” percentage of our products business increased 6.0% compared to the year ended December 31, 2022, primarily driven by the volume mix of hardware devices supplied to one of our largest customers. In 2022, the volume of hardware devices supplied to that customer were higher than usual due to their LTE transition project. Margins for the hardware devices associated with this one-time project were lower due to the decrease in volume in 2023.
The table below sets forth our cost of revenue, exclusive of depreciation and amortization, for the years ended December 31, 2023 and 2022, disaggregated by “cost of IoT Connectivity” and “cost of IoT Solutions”:
| For the Year Ended | Year-over-Year Increase / (Decrease) | ||||||||||||||||||||||
| ($ in thousands) | December 31, 2023 | December 31, 2022 | $ | % | |||||||||||||||||||
| Cost of IoT Connectivity | $ | 77,263 | $ | 63,051 | $ | 14,212 | 23 | % | |||||||||||||||
| Cost of IoT Solutions | 51,300 | 66,103 | (14,803) | (22) | % | ||||||||||||||||||
| Total cost of revenue | $ | 128,563 | $ | 129,154 | $ | (591) | — | % | |||||||||||||||
The table below sets forth our revenue less our cost of revenue, excluding depreciation and amortization, as a percentage of revenue, based upon the categories of revenue and associated costs disaggregated by “cost of IoT Connectivity” and “cost of IoT Solutions”:
| For the Year Ended | |||||||||||
| December 31, 2023 | December 31, 2022 | ||||||||||
| Cost of IoT Connectivity | 61.8 | % | 64.2 | % | |||||||
| Cost of IoT Solutions | 30.9 | % | 28.5 | % | |||||||
| Overall blended rate | 53.5 | % | 51.9 | % | |||||||
The cost of IoT Connectivity increased by $14.2 million for the year ended December 31, 2023, compared to the year ended December 31, 2022, primarily due to additional carrier costs driven by the acquisition of Twilio’s IoT business along with growth in connections across multiple carriers.
26
During the year ended December 31, 2023, the cost of IoT Connectivity as a percentage decreased 2.4% compared to December 31, 2022. The decrease in the cost of IoT Connectivity as a percentage was primarily due to the inclusion of the lower margin IoT Connectivity revenue from the acquisition of Twilio’s IoT business.
The cost of IoT Solutionsdecreased by $14.8 million for the year ended December 31, 2023, compared to the year ended December 31, 2022, primarily due to decreased costs associated with lower IoT Solutions revenue from existing customers.
During the year ended December 31, 2023, the cost of IoT Solutions as a percentage increased 2.4% as compared to December 31, 2022, primarily driven by the mix of hardware compared to services included as part ofin IoT Solutions revenue.
Selling, general, and administrative expenses
The following table sets forth the Company’s selling, general, and administrative expenses incurred during the years ended December 31, 2023 and 2022:
| For the Year Ended | Year-over-Year Increase / (Decrease) | ||||||||||||||||||||||
| ($ in thousands) | December 31, 2023 | December 31, 2022 | $ | % | |||||||||||||||||||
| Selling, general, and administrative expenses | $ | 129,816 | $ | 109,492 | $ | 20,324 | 19 | % | |||||||||||||||
Selling, general, and administrative (“SG&A”) expenses relate primarily to expenses for general management, sales and marketing, finance, audit, legal fees, and other general operating expenses. The increase in SG&A expenses for the year ended December 31, 2023 compared to the year ended December 31, 2022 was primarily driven by an increase in salaries and benefits including additional headcount from the acquisition of Twilio’s IoT business, higher license and subscription costs, along with one-time professional fees associated with our debt refinancing.
Selling, general, and administrative expenses incurred with affiliate
The following table sets forth the Company’s sales, general, and administrative expenses incurred with affiliate during the years ended December 31, 2023 and 2022:
| For the Year Ended | Year-over-Year Increase / (Decrease) | ||||||||||||||||||||||
| ($ in thousands) | December 31, 2023 | December 31, 2022 | $ | % | |||||||||||||||||||
| Selling, general, and administrative expenses incurred with affiliate | $ | 372 | $ | 2,600 | $ | (2,228) | (86) | % | |||||||||||||||
Selling, general, and administrative (“SG&A”) expenses incurred with affiliate relate primarily to expenses for technical assistance services, rent, and professional services incurred between one of our wholly-owned subsidiaries and two companies controlled by a key member of our subsidiary’s management team. The decrease in SG&A expenses incurred with affiliate for the year ended December 31, 2023 compared to the year ended December 31, 2022 was primarily due to the termination of the technical assistance services agreement on February 14, 2023 and the termination of theoffice lease and professional services agreement on June 29, 2023.
Non-GAAP Financial Measures
In conjunction with net income (loss) calculated in accordance with GAAP, we also use EBITDA and Adjusted EBITDA to evaluate our ongoing operations and for internal planning and forecasting purposes. Non-GAAP financial information is presented for supplemental informational purposes only, should not be considered in isolation or as a substitute for financial information presented in accordance with GAAP, and may be different from similarly-titled non-GAAP measures used by other companies. We also incur significant charges forbelieve that along with our GAAP financial information, our non-GAAP financial information when taken collectively and evaluated appropriately, is helpful to investors in assessing our operating performance.
EBITDA and Adjusted EBITDA
EBITDA is defined as net income (loss) before interest expense, income tax expense or benefit, and depreciation and amortization of our intangible assets (including intangible assets we acquired or developed),amortization.
Adjusted EBITDA is defined as EBITDA adjusted for certain unusual and other acquired intellectual property, as well as our fixed assets which supportsignificant items and removes the deployment of our IoT Connectivity servicesvolatility associated with non-cash items and IoT Solutions services. We also incur engineeringoperational income and expenses developing and supporting the operation of our communications systems and the early stage engineering work on new products and services that are not yet determinedexpected to be technologically feasible.ongoing. Such adjustments include goodwill impairment charges, changes in the fair value of certain of our warrants required by GAAP to be accounted for at fair value, gains or losses on debt extinguishment, “transformation expenses” as defined below, acquisition costs, integration-related restructuring costs, stock-based compensation, and foreign currency gains and losses.
27
The following table sets forth a reconciliation of net loss to EBITDA and Adjusted EBITDA for the years ended December 31, 2023 and 2022:
| For the Year Ended December 31, | |||||||||||
| (in thousands) | 2023 | 2022 | |||||||||
| Net loss | $ | (167,042) | $ | (106,200) | |||||||
| Income tax benefit | (4,158) | (10,417) | |||||||||
| Interest expense, net | 42,680 | 31,371 | |||||||||
| Depreciation and amortization | 58,363 | 54,499 | |||||||||
| EBITDA | $ | (70,157) | $ | (30,747) | |||||||
| Goodwill impairment loss | 78,257 | 58,074 | |||||||||
| Loss on debt extinguishment | 2,584 | — | |||||||||
| Change in fair value of warrant liability | 6,436 | (254) | |||||||||
| Transformation expenses | 6,624 | 8,302 | |||||||||
| Acquisition costs | 1,776 | 1,400 | |||||||||
| Integration-related restructuring costs | 16,532 | 14,814 | |||||||||
| Stock-based compensation | 11,251 | 10,296 | |||||||||
| Foreign currency (gain) loss | (182) | 4 | |||||||||
Other (1) | 2,429 | 946 | |||||||||
| Adjusted EBITDA | $ | 55,550 | $ | 62,835 | |||||||
(1) “Other” adjustments are comprised of adjustments for certain indirect or non-income based taxes.
Transformation expenses are related to the implementation of our strategic transformation plan and include the costs of a re-write of our core technology platform, expenses incurred to design certain new IoT Solutions, and “go-to-market” capabilities. These expenses were completed in 2023.
Acquisition and integration-related restructuring costs for the years ended December 31, 2023 and 2022 are costs associated with legal, accounting diligence, quality of earnings, valuation, and search expenses related to acquisitions.
In 2023 these costs included the acquisition of the Twilio IoT business, and in 2022 these costs included the acquisition of 100% of the outstanding share capital of Business Mobility Partners, Inc. and Simon IoT LLC. In addition to the costs associated with the acquisitions are costs related to the integration of these acquisitions, including but not limited to professional service costs related to systems integrations and migrations, data migration, and finance process integrations. These costs also include any identified duplicative costs that will eventually be eliminated or are expected to be eliminated twelve months from the acquisition date. Finally, these costs also include discrete costs related to employee severance or retention bonuses attributed to acquisitions or restructuring activities.
Key Operational Metrics
are Total Number of Connections,
Total Number of Connections and Average Connections
Total Number of Connections constitutes the total of all KOREour IoT Connectivity services connections, including both CaaS and CEaaS connections,(explained below) but excluding certain connections where mobile carriers license KORE’sour subscription management platform from KORE. us.
CaaS is a mobile connectivity service that allows customers to connect to the Internet over the networks of multiple wireless carriers while only interfacing with KORE, generally used by enterprise customers such as large medical device manufacturers or other IoT software and solutions providers. Our CaaS solutions are intended to allow customers to connect their devices seamlessly and securely anywhere in the world across any Internet-connected network, which may entail multiple devices, multiple locations, and multiple carriers.
CEaaS offers infrastructure software and services generally to communication service providers who provide IoT cellular services to a broad market. The infrastructure software and services offered to such providers are cellular Core Network as a Service, including Cloud Native Evolved Packet Core, Connectivity Management Platform as a Service, and Private Networking as a Service.
28
Total Number of Connections includeincludes the contribution of eSIMs and is the principal measure used by management to assess the performancegrowth of the business on a periodic basis.
| December 31, 2023 | December 31, 2022 | |||||||||||||
| Total Number of Connections at Period End | 18.5 | million | 15.0 | million | ||||||||||
| Average Connections Count for the Period | 17.3 | million | 15.2 | million | ||||||||||
Period-end and average connections as of December 31, 2023, include an increase of approximately 3.3 million and 1.8 million, respectively, related to the acquisition of Twilio’s IoT business.
Dollar Based Net Expansion Rate)Rate (“DBNER”)
DBNER tracks the combined effect of cross-sales of IoT Solutions to KORE’s existing customers, its customer retention and the growth of its existing business. KORE calculates DBNER by dividing the revenue for a given period (“given period”) from existing
go-forward
customers by the revenue from the same customers for the same period measured one year prior (“base period”).The revenue included in the current period excludes revenue from (i) customers that are non go-forward“non-go-forward” customers, meaning customers that have either communicated to KORE before the last day of the current period their intention not to provide future business to KORE or customers that KORE has determined are transitioning away from KORE based on a sustained multi-year time period of declines in revenue and (ii) new customers that started generating revenue after the end of the base period. For example, to calculate our DBNER for the trailing 12 months ended December 31, 2021, we divide (i) revenue, for the trailing 12 months ended December 31, 2021, from go-forward customers that started generating revenue on or before December 31, 2020 by (ii) revenue, for the trailing 12 months
It is often difficult to ascertain which customers should be deemed not to be go-forward customers for purposes of calculating DBNER. Customers are not required to give notice of their intention to transition off of the KORE platform, and as discussed above in “Information about KORE—Customer and Key Partners”, a customer’s exit from the KORE platform can take months or longer, and total connections of any particular customer can at any time increase or decrease for any number of reasons, including pricing, customer satisfaction or product fit – fit—accordingly, a decrease in total connections may not indicate that a customer is intending to exit the KORE platform, particularly if that decrease is not sustained over a period of several quarters. DBNER would be lower if it were calculated using revenue from non go-forwardnon-go-forward customers.
DBNER is used by management as a measure of growth atof KORE’s existing customers (i.e., “same store” growth). and as a measure of customer retention, from a revenue perspective. It is not intended to capture the effect of either new customer wins or the declines from non go-forwardnon-go-forward customers on KORE’s total revenue growth. This is because DBNER excludes new customers whichwho started generating revenue after the base period and also excludes any customers whichwho are non go-forwardnon-go-forward customers on the last day of the current period. Revenue increases from new customer wins, and a decline in revenue from non go-forwardnon-go-forward customers are also important factors in assessing KORE’s revenue growth, but these factors are independent of DBNER.
Years Ended December 31, | Change 2021 | |||||||||||||||
2021 | 2020 | $ | % | |||||||||||||
Services | $ | 187,962 | $ | 172,845 | $ | 15,117 | 9 | % | ||||||||
Products | 60,255 | 40,915 | 19,340 | 47 | % | |||||||||||
Total Revenue | $ | 248,217 | $ | 213,760 | $ | 34,457 | 16 | % | ||||||||
Years Ended December 31, | Change 2021 | |||||||||||||||
2021 | 2020 | $ | % | |||||||||||||
IoT Connectivity | $ | 168,804 | $ | 158,748 | $ | 10,056 | 6 | % | ||||||||
IoT Solutions | 79,413 | 55,012 | 24,401 | 44 | % | |||||||||||
Total Revenue | $ | 248,217 | $ | 213,760 | $ | 34,457 | 16 | % | ||||||||
December 31, | ||||||||
2021 | 2020 | |||||||
Period End Connections | 14.6 million | 11.8 million | ||||||
Average Connections Count for the Period | 13.4 million | 10.7 million | ||||||
Years Ended December 31, | Change 2021 | |||||||||||||||
2021 | 2020 | $ | % | |||||||||||||
Cost of services | $ | 69,867 | $ | 64,520 | $ | 5,347 | 8 | % | ||||||||
Cost of products | 52,357 | 33,410 | 18,947 | 57 | % | |||||||||||
Total cost of revenue | $ | 122,224 | $ | 97,930 | $ | 24,294 | 25 | % | ||||||||
Years Ended | ||||||||
December 31, | ||||||||
Gross margin rate | 2021 | 2020 | ||||||
Cost of services | 62.8 | % | 62.7 | % | ||||
Cost of products | 13.1 | % | 18.3 | % | ||||
Total gross margins | 50.8 | % | 54.2 | % | ||||
Total Contract Value (“TCV”)
TCV represents our estimated value of a revenue opportunity. TCV for an IoT Connectivity opportunity is calculated by multiplying by 40 the estimated revenue expected to be generated during the twelfth month of production. TCV for an IoT Solutions opportunity is either the actual total expected revenue opportunity, or if it is a longer-term “programmatically recurring revenue” program, calculated for the first 36 months of the delivery period. TCV is used by management as a measure of the revenue opportunity of KORE’s sales funnel, which we define as opportunities our sales team is actively pursuing, potentially leading to future revenue.
As of December 31, 2023, our sales funnel included over 1,600 opportunities with an estimated potential TCV of over $545 million. As of December 31, 2022, our sales funnel included over 1,400 opportunities with an estimated potential TCV of over $434 million.
Years Ended | ||||||||||||||||
December 31, | Change 2021 | |||||||||||||||
Cost of revenue | 2021 | 2020 | $ | % | ||||||||||||
Cost of IoT Connectivity | $ | 66,567 | $ | 63,706 | $ | 2,861 | 4 | % | ||||||||
Cost of IoT Solutions | 55,657 | 34,224 | 21,433 | 63 | % | |||||||||||
Total cost of revenue | $ | 122,224 | $ | 97,930 | $ | 24,294 | 25 | % | ||||||||
Years Ended | ||||||||
Gross margin rate | 2021 | 2020 | ||||||
IoT Connectivity | 60.6 | % | 59.9 | % | ||||
IoT Solutions | 29.9 | % | 37.8 | % | ||||
Total gross margins | 50.8 | % | 54.2 | % | ||||
Years Ended | ||||||||||||||||
December 31, | Change 2021 | |||||||||||||||
2021 | 2020 | $ | % | |||||||||||||
Selling, general, and administrative | $ | 91,733 | $ | 72,883 | $ | 18,850 | 26 | % | ||||||||
Years Ended | ||||||||||||||||
December 31, | Change 2021 | |||||||||||||||
2021 | 2020 | $ | % | |||||||||||||
Depreciation and amortization | $ | 50,414 | $ | 52,488 | $ | (2,074 | ) | (4 | )% | |||||||
Years Ended | ||||||||||||||||
December 31, | Change 2021 | |||||||||||||||
2021 | 2020 | $ | % | |||||||||||||
Interest expense, including amortization of deferred financing costs, net | $ | 23,260 | $ | 23,493 | $ | (233 | ) | (1 | )% | |||||||
Change in fair value of warrant liability | (5,267 | ) | 7,485 | (12,752 | ) | (170 | )% | |||||||||
Total Other (Income) Expense | $ | 17,993 | $ | 30,978 | $ | (12,985 | ) | (42 | )% | |||||||
December 31, | Change 2021 | |||||||||||||||
2021 | 2020 | $ | % | |||||||||||||
Income tax benefit | $ | (9,694 | ) | $ | (5,318 | ) | $ | (4,376 | ) | 82 | % | |||||
EBITDA is defined as net income (loss) before interest expense, income tax expense or benefit, and depreciation and amortization.
27
| For the Year Ended December 31, | |||||||||||
| (in thousands) | 2023 | 2022 | |||||||||
| Net loss | $ | (167,042) | $ | (106,200) | |||||||
| Income tax benefit | (4,158) | (10,417) | |||||||||
| Interest expense, net | 42,680 | 31,371 | |||||||||
| Depreciation and amortization | 58,363 | 54,499 | |||||||||
| EBITDA | $ | (70,157) | $ | (30,747) | |||||||
| Goodwill impairment loss | 78,257 | 58,074 | |||||||||
| Loss on debt extinguishment | 2,584 | — | |||||||||
| Change in fair value of warrant liability | 6,436 | (254) | |||||||||
| Transformation expenses | 6,624 | 8,302 | |||||||||
| Acquisition costs | 1,776 | 1,400 | |||||||||
| Integration-related restructuring costs | 16,532 | 14,814 | |||||||||
| Stock-based compensation | 11,251 | 10,296 | |||||||||
| Foreign currency (gain) loss | (182) | 4 | |||||||||
Other (1) | 2,429 | 946 | |||||||||
| Adjusted EBITDA | $ | 55,550 | $ | 62,835 | |||||||
(1) “Other” adjustments are comprised of adjustments for certain indirect or non-income based taxes.
Transformation expenses are related to the implementation of our strategic transformation plan and include the costs of a re-write of our core technology equipment, software licenses,platform, expenses incurred to design certain new IoT Solutions, and internally developed software.
In 2023 these costs included the Company drewacquisition of the Twilio IoT business, and repaid $25.0 millionin 2022 these costs included the acquisition of 100% of the outstanding share capital of Business Mobility Partners, Inc. and Simon IoT LLC. In addition to the costs associated with the acquisitions are costs related to the integration of these acquisitions, including but not limited to professional service costs related to systems integrations and migrations, data migration, and finance process integrations. These costs also include any identified duplicative costs that will eventually be eliminated or are expected to be eliminated twelve months from the acquisition date. Finally, these costs also include discrete costs related to employee severance or retention bonuses attributed to acquisitions or restructuring activities.
Key Operational Metrics
We review a number of operational metrics to measure our performance, identify trends affecting our business, prepare financial projections, and make strategic decisions. The operational metrics identified by management as key operational metrics are Total Number of Connections, Average Connections, Dollar-Based Net Expansion Rate, and Total Contract Value.
Total Number of Connections and Average Connections
Total Number of Connections constitutes the total of all our IoT Connectivity services connections, including both CaaS and CEaaS (explained below) but excluding certain connections where mobile carriers license our subscription management platform from us.
CaaS is a mobile connectivity service that allows customers to connect to the Internet over the networks of multiple wireless carriers while only interfacing with KORE, generally used by enterprise customers such as large medical device manufacturers or other IoT software and solutions providers. Our CaaS solutions are intended to allow customers to connect their devices seamlessly and securely anywhere in the world across any Internet-connected network, which may entail multiple devices, multiple locations, and multiple carriers.
CEaaS offers infrastructure software and services generally to communication service providers who provide IoT cellular services to a broad market. The infrastructure software and services offered to such providers are cellular Core Network as a Service, including Cloud Native Evolved Packet Core, Connectivity Management Platform as a Service, and Private Networking as a Service.
28
Total Number of Connections includes the contribution of eSIMs and is the principal measure used by management to assess the growth of the business on its revolving credit facility. Duringa periodic basis, on a SIM and / or device-based perspective. The table below sets forth our Total Number of Connections at Period End and Average Connections Count as of and for the yearyears ended December 31, 2020,2023 and 2022:
| December 31, 2023 | December 31, 2022 | |||||||||||||
| Total Number of Connections at Period End | 18.5 | million | 15.0 | million | ||||||||||
| Average Connections Count for the Period | 17.3 | million | 15.2 | million | ||||||||||
Period-end and average connections as of December 31, 2023, include an increase of approximately 3.3 million and 1.8 million, respectively, related to the Company repaid $8.3 millionacquisition of Twilio’s IoT business.
Dollar Based Net Expansion Rate (“DBNER”)
DBNER tracks the combined effect of cross-sales of IoT Solutions to KORE’s existing customers, its customer retention and the growth of its revolving credit facility.
The revenue included in the current period excludes revenue from (i) customers that are “non-go-forward” customers, meaning customers that have either communicated to KORE before the last day of the current period their intention not to provide future business to KORE or customers that KORE has determined are transitioning away from KORE based on a sustained multi-year time period of declines in revenue and (ii) new customers that started generating revenue after the end of the base period. For the purposes of calculating DBNER, if KORE acquires a company during the given period or the base period, then the revenue of a customer before the acquisition but during either the given period or the base period is included in the calculation. For example, to calculate our DBNER for the trailing 12 months ended December 31, 2023, we divide (i) revenue, for the trailing 12 months ended December 31, 2023, from go-forward customers that started generating revenue on or before December 31, 2022, by (ii) revenue, for the trailing 12 months ended December 31, 2022, from the same cohort of customers.
It is often difficult to ascertain which customers should be deemed not to be go-forward customers for purposes of calculating DBNER. Customers are not required to give notice of their intention to transition off of the KORE platform, and a customer’s exit from the KORE platform can take months or longer, and total connections of any particular customer can at any time increase or decrease for any number of reasons, including pricing, customer satisfaction or product fit—accordingly, a decrease in total connections may not indicate that a customer is intending to exit the KORE platform, particularly if that decrease is not sustained over a period of several quarters. DBNER would be lower if it were calculated using revenue from non-go-forward customers.
DBNER is used by management as a measure of growth of KORE’s existing customers (i.e., “same store” growth) and as a measure of customer retention, from a revenue perspective. It is not intended to capture the effect of either new customer wins or the declines from non-go-forward customers on KORE’s total revenue growth. This is because DBNER excludes new customers who started generating revenue after the base period and also excludes any customers who are non-go-forward customers on the last day of the current period. Revenue increases from new customer wins, and a decline in revenue from non-go-forward customers are also important factors in assessing KORE’s revenue growth, but these factors are independent of DBNER.
KORE’s DBNER was 96% for the twelve months ended December 31, 2023, as compared to 92% for the twelve months ended December 31, 2022. This increase was primarily due to increased connectivity consumption. Excluding a customer that exceeded 10% of revenues in 2022 but not 2023, DBNER was 101% for the twelve months ended December 31, 2023 as compared to 103% for the twelve months ended December 31, 2022.
Total Contract Value (“TCV”)
TCV represents our estimated value of a revenue opportunity. TCV for an IoT Connectivity opportunity is calculated by multiplying by 40 the estimated revenue expected to be generated during the twelfth month of production. TCV for an IoT Solutions opportunity is either the actual total expected revenue opportunity, or if it is a longer-term “programmatically recurring revenue” program, calculated for the first 36 months of the delivery period. TCV is used by management as a measure of the revenue opportunity of KORE’s sales funnel, which we define as opportunities our sales team is actively pursuing, potentially leading to future revenue.
As of December 31, 2023, our sales funnel included over 1,600 opportunities with an estimated potential TCV of over $545 million. As of December 31, 2022, our sales funnel included over 1,400 opportunities with an estimated potential TCV of over $434 million.
EBITDA and Adjusted EBITDA
Adjusted EBITDA is defined as EBITDA adjusted for certain unusual and other significant items and removes the volatility associated with non-cash items and operational income and expenses that management views as distorting the operating results from periodare not expected to period.be ongoing. Such adjustments may include goodwill impairment charges, changes in the fair value of certain of our warrants required by GAAP to be accounted for at fair value, gains or losses on debt extinguishment, “transformation expenses” as defined below, acquisition costs, integration-related restructuring costs, stock-based compensation, integration and acquisition-related charges, tangible and intangible asset impairment charges, certain contingent liability reversals, transformation, and foreign currency transaction gains and losses. EBITDA and Adjusted EBITDA are intended as supplemental measures of our performance that are neither required by, nor presented in accordance with, GAAP. We believe that the use of EBITDA and Adjusted EBITDA provides an additional tool for investors to use in evaluating ongoing operating results and trends and in comparing the Company’s financial measures with those of comparable companies, which may present similar non-GAAP financial measures to investors. However, you should be aware that when evaluating EBITDA and Adjusted EBITDA we may incur future expenses similar to those excluded when calculating these measures. In addition, our presentation of these measures should not be construed as an inference that our future results will be unaffected by unusual or non-recurring items. Our computation of Adjusted EBITDA may not be comparable to other similarly titled measures computed by other companies, because all companies may not calculate Adjusted EBITDA in the same fashion.
The following table sets forth a substitute for performance measures calculated in accordance with GAAP. We compensate for these limitations by relying primarily on our GAAP results and using EBITDA and Adjusted EBITDA on a supplemental basis. You should review the reconciliation of net loss to EBITDA and Adjusted EBITDA below and not rely on any single financial measure to evaluate our business.
For the Years Ended December 31, | ||||||||
2021 | 2020 | |||||||
Net loss | $ | (24,453 | ) | $ | (35,201 | ) | ||
Income tax expense (benefit) | (9,694 | ) | (5,318 | ) | ||||
Interest expense | 23,260 | 23,493 | ||||||
Depreciation and amortization | 50,414 | 52,488 | ||||||
EBITDA | 39,527 | 35,462 | ||||||
Change in Fair value of warrant liabilities (non-cash) | (5,267 | ) | 7,485 | |||||
Transformation expenses | 8,937 | 7,354 | ||||||
Acquisition and integration-related restructuring costs | 11,287 | 5,709 | ||||||
Stock-based compensation (non-cash) | 4,564 | 1,161 | ||||||
Other income tax liability reversal (non-cash) | — | 80 | ||||||
Foreign currency loss (non-cash) | 344 | 233 | ||||||
Other | 478 | 335 | ||||||
Adjusted EBITDA | $ | 59,870 | $ | 57,819 | ||||
| For the Year Ended December 31, | |||||||||||
| (in thousands) | 2023 | 2022 | |||||||||
| Net loss | $ | (167,042) | $ | (106,200) | |||||||
| Income tax benefit | (4,158) | (10,417) | |||||||||
| Interest expense, net | 42,680 | 31,371 | |||||||||
| Depreciation and amortization | 58,363 | 54,499 | |||||||||
| EBITDA | $ | (70,157) | $ | (30,747) | |||||||
| Goodwill impairment loss | 78,257 | 58,074 | |||||||||
| Loss on debt extinguishment | 2,584 | — | |||||||||
| Change in fair value of warrant liability | 6,436 | (254) | |||||||||
| Transformation expenses | 6,624 | 8,302 | |||||||||
| Acquisition costs | 1,776 | 1,400 | |||||||||
| Integration-related restructuring costs | 16,532 | 14,814 | |||||||||
| Stock-based compensation | 11,251 | 10,296 | |||||||||
| Foreign currency (gain) loss | (182) | 4 | |||||||||
Other (1) | 2,429 | 946 | |||||||||
| Adjusted EBITDA | $ | 55,550 | $ | 62,835 | |||||||
(1) “Other” adjustments are comprised of adjustments for certain indirect or non-income based taxes.
Transformation expenses are related to the implementation of our strategic transformation plan whichand include the costs of a re-write of our core technology platform, expenses incurred to design certain new IoT Solutions, and “go-to-market” capabilities.
These expenses were completed in 2023.Acquisition and integration-related restructuring costs for the years ended December 31, 20212023 and 2020 relate to2022 are costs associated with legal, accounting advisory,diligence, quality of earnings, valuation, and other professional servicessearch expenses related to acquisitions.
In 2023 these costs included the acquisition of the Twilio IoT business, and in 2022 these costs included the acquisition of 100% of the outstanding share capital of Business Mobility Partners, Inc. and Simon IoT LLC. In addition to the costs associated with the Integron Acquisition and Integron’s integration into KORE, certain synergies related to our acquisitions certainone-timeseveranceare costs associated with our transformation, and accounting and advisory fees related to the Business Combination.integration of these acquisitions, including but not limited to professional service costs related to systems integrations and migrations, data migration, and finance process integrations. These costs also include any identified duplicative costs that will eventually be eliminated or are expected to be eliminated twelve months from the acquisition date. Finally, these costs also include discrete costs related to employee severance or retention bonuses attributed to acquisitions or restructuring activities.
Key Operational Metrics
We review a number of operational metrics to measure our performance, identify trends affecting our business, prepare financial projections, and make strategic decisions. The Business Combinationoperational metrics identified by management as key operational metrics are Total Number of Connections, Average Connections, Dollar-Based Net Expansion Rate, and Total Contract Value.
Total Number of Connections and Average Connections
Total Number of Connections constitutes the total of all our IoT Connectivity services connections, including both CaaS and CEaaS (explained below) but excluding certain connections where mobile carriers license our subscription management platform from us.
CaaS is a mobile connectivity service that allows customers to connect to the Internet over the networks of multiple wireless carriers while only interfacing with KORE, generally used by enterprise customers such as large medical device manufacturers or other IoT software and solutions providers. Our CaaS solutions are intended to allow customers to connect their devices seamlessly and securely anywhere in the world across any Internet-connected network, which may entail multiple devices, multiple locations, and multiple carriers.
CEaaS offers infrastructure software and services generally to communication service providers who provide IoT cellular services to a broad market. The infrastructure software and services offered to such providers are cellular Core Network as a Service, including Cloud Native Evolved Packet Core, Connectivity Management Platform as a Service, and Private Networking as a Service.
28
Total Number of Connections includes the contribution of eSIMs and is the primary driverprincipal measure used by management to assess the growth of the business on a periodic basis, on a SIM and / or device-based perspective. The table below sets forth our Total Number of Connections at Period End and Average Connections Count as of and for the years ended December 31, 2023 and 2022:
| December 31, 2023 | December 31, 2022 | |||||||||||||
| Total Number of Connections at Period End | 18.5 | million | 15.0 | million | ||||||||||
| Average Connections Count for the Period | 17.3 | million | 15.2 | million | ||||||||||
Period-end and average connections as of December 31, 2023, include an increase of approximately 3.3 million and 1.8 million, respectively, related to the acquisition of Twilio’s IoT business.
Dollar Based Net Expansion Rate (“DBNER”)
DBNER tracks the combined effect of cross-sales of IoT Solutions to KORE’s existing customers, its customer retention and the growth of its existing business. KORE calculates DBNER by dividing the revenue for a given period (“given period”) from existing go-forward customers by the revenue from the same customers for the same period measured one year prior (“base period”).
The revenue included in the current period excludes revenue from (i) customers that are “non-go-forward” customers, meaning customers that have either communicated to KORE before the last day of the current period their intention not to provide future business to KORE or customers that KORE has determined are transitioning away from KORE based on a sustained multi-year time period of declines in revenue and (ii) new customers that started generating revenue after the end of the base period. For the purposes of calculating DBNER, if KORE acquires a company during the given period or the base period, then the revenue of a customer before the acquisition but during either the given period or the base period is included in the calculation. For example, to calculate our DBNER for the trailing 12 months ended December 31, 2023, we divide (i) revenue, for the trailing 12 months ended December 31, 2023, from go-forward customers that started generating revenue on or before December 31, 2022, by (ii) revenue, for the trailing 12 months ended December 31, 2022, from the same cohort of customers.
It is often difficult to ascertain which customers should be deemed not to be go-forward customers for purposes of calculating DBNER. Customers are not required to give notice of their intention to transition off of the KORE platform, and integration-related restructuring costsa customer’s exit from the KORE platform can take months or longer, and total connections of any particular customer can at any time increase or decrease for any number of reasons, including pricing, customer satisfaction or product fit—accordingly, a decrease in total connections may not indicate that a customer is intending to exit the KORE platform, particularly if that decrease is not sustained over a period of several quarters. DBNER would be lower if it were calculated using revenue from non-go-forward customers.
DBNER is used by management as a measure of growth of KORE’s existing customers (i.e., “same store” growth) and as a measure of customer retention, from a revenue perspective. It is not intended to capture the effect of either new customer wins or the declines from non-go-forward customers on KORE’s total revenue growth. This is because DBNER excludes new customers who started generating revenue after the base period and also excludes any customers who are non-go-forward customers on the last day of the current period. Revenue increases from new customer wins, and a decline in revenue from non-go-forward customers are also important factors in assessing KORE’s revenue growth, but these factors are independent of DBNER.
KORE’s DBNER was 96% for the twelve months ended December 31, 2023, as compared to 92% for the twelve months ended December 31, 2022. This increase was primarily due to increased connectivity consumption. Excluding a customer that exceeded 10% of revenues in 2022 but not 2023, DBNER was 101% for the twelve months ended December 31, 2023 as compared to 103% for the twelve months ended December 31, 2022.
Total Contract Value (“TCV”)
TCV represents our estimated value of a revenue opportunity. TCV for an IoT Connectivity opportunity is calculated by multiplying by 40 the estimated revenue expected to be generated during the twelfth month of production. TCV for an IoT Solutions opportunity is either the actual total expected revenue opportunity, or if it is a longer-term “programmatically recurring revenue” program, calculated for the first 36 months of the delivery period. TCV is used by management as a measure of the revenue opportunity of KORE’s sales funnel, which we define as opportunities our sales team is actively pursuing, potentially leading to future revenue.
As of December 31, 2023, our sales funnel included over period.1,600 opportunities with an estimated potential TCV of over $545 million. As of December 31, 2022, our sales funnel included over 1,400 opportunities with an estimated potential TCV of over $434 million.
Liquidity and Capital Resources
Overview
Liquidity is a measurement of our ability to meet potential cash requirements, including ongoing commitments to repay borrowings, fund our acquisitions and operating costs, and satisfy other general business needs. Our liquidity requirements have historically arisen from our working capital needs, obligations to make scheduled payments of interest and principal on our indebtedness, and capital expenditures to facilitate the growth and expansion of the business via acquisitions. Going forward, we may also utilize other types of borrowings, including bank credit facilities and lines of credit, among others. We may also seek to raise additional capital through public or private offerings of equity, equity-related, or debt securities, depending upon market conditions. The use of any particular source of capital and funds will depend on market conditions, the availability of these sources, and any acquisition or expansion opportunities available to us.
We believe these identified sources of financing will be adequate for purposes of meeting our short‑term (within one year) and our longer‑term liquidity needs. We cannot predict with certainty the specific transactions we will undertake to generate sufficient liquidity to meet our obligations as they come due. We will adjust our plans as appropriate in response to changes in our expectations and any potential changes in market conditions.
Summary and Description of Financing Arrangements
The table below sets forth a summary of the Company’s outstanding long-term debt as of December 31, 2023 and 2022:
| December 31, | |||||||||||
| (in thousands) | 2023 | 2022 | |||||||||
| Term Loan - Whitehorse | $ | 185,000 | N/A | ||||||||
| Term Loan – UBS | N/A | 302,654 | |||||||||
| Backstop Notes | 120,000 | 120,000 | |||||||||
| Other borrowings | 561 | 2,754 | |||||||||
| Total | $ | 305,561 | $ | 425,408 | |||||||
| Less: current portion of long-term debt | (2,411) | (5,345) | |||||||||
| Less: debt issuance costs, net of accumulated amortization of $0.8 million and $8.5 million, respectively | (2,911) | (6,153) | |||||||||
| Less: original issue discount | (4,130) | N/A | |||||||||
| Total Long-term debt and other borrowings, net | $ | 296,109 | $ | 413,910 | |||||||
Term Loan and Revolving Credit Facility — WhiteHorse Capital Management, LLC (“WhiteHorse”)
On November 9, 2023, the Company only with respect to certain limited sections thereof, and certain subsidiaries of the Company entered into a credit agreement with WhiteHorse that consisted of a senior secured term loan of $185.0 million (“Term Loan”) as well as a senior secured revolving credit facility of $25.0 million (the “Revolving Credit Facility” and, together with the Term Loan, the “Credit Facilities”). Borrowings under the Term Loan and the Revolving Credit Facility bear interest at a rate at the Company’s option of either (1) Term SOFR for a specified interest period (at the Company’s option) of one to three months plus an applicable margin of up to 6.50% or (2) a base rate plus an applicable margin of up to 5.50%. The Term SOFR rate is subject to a “floor” of 1.0%. The applicable margins for Term SOFR rate and base rate borrowings are each subject to a reduction to 6.25% and 6.00% if the Company maintains a first lien net leverage ratio of less than 2.25:1.00 and greater than or equal to 1.75:1.00 and less than 1.75:1.00, respectively. Interest is paid on the last business day of each quarterly interest period except at maturity. The credit agreement became effective on November 15, 2023.
Principal payments of approximately $0.5 million are due on the last business day of each quarter. The maturity date of the Credit Facilities is November 15, 2028.
The Credit Facilities are secured by substantially all of the Company’s subsidiaries’ assets. The Term Loan agreement restricts cash dividends and other distributions from the Company’s subsidiaries to the Company and also restricts the Company’s ability to pay cash dividends to its shareholders, and contains customary financial covenants related to maximum total debt to Adjusted EBITDA ratio and a first lien debt to Adjusted EBITDA ratio.
As of December 31, 2023, there were no amounts outstanding on the Revolving Credit Facility.
On December 21, 2018, the Company entered into a credit agreement with UBS (as from time to time amended and supplemented) that consisted of a term loan of $315.0 million (the “Term Loan — UBS”), maturity date December 21, 2024, as well as a senior secured revolving credit facility of $30.0 million.
On November 15, 2023, the Company fully repaid the Term Loan — UBS and there were no amounts drawn or outstanding on the senior secured revolving credit facility with UBS.
Backstop Notes
On September 30, 2021, a subsidiary of the Company issued the first tranche of the Backstop Notes, consisting of $95.1 million in senior unsecured exchangeable notes due 2028 to a lender and its affiliates. On October 28, 2021, the Company’s subsidiary issued a second and final tranche of Backstop Notes in the amount of $24.9 million. The Backstop Notes are guaranteed by the Company and are due September 30, 2028.
The Backstop Notes were issued at par and bear interest at a rate of 5.50% per annum which is paid semi-annually on March 30 and September 30 of each year. The Backstop Notes are exchangeable into common stock of the Company at $12.50 per share (the “Base Exchange Rate”) at any time at the option of the lender. At the Base Exchange Rate, the Notes are exchangeable for approximately 9.6 million shares of the Company’s common stock. The Base Exchange Rate may be adjusted for certain dilutive events or change in control events as defined by the Indenture (the “Adjusted Exchange Rate”). After September 30, 2023, if the Company’s shares are trading at a defined premium to the Base Exchange Rate or applicable Adjusted Exchange Rate, the Company may redeem the Backstop Notes for cash, equivalents areforce an exchange into shares of its common stock at an amount per share based on a time-value make whole table, or settle with a combination of cash and its common stock.
The Backstop Notes were issued pursuant to an indenture which contains financial instruments that are potentially subjectcovenants related to concentrations of credit risk. the Company’s maximum total debt to Adjusted EBITDA ratio.
Other borrowings
The Company’s cash“other borrowings” as set forth on the foregoing table regarding the Company’s long-term debt related solely to a premium finance agreement entered into on August 3, 2022, to purchase a Directors and cash equivalents are deposited in accountsOfficers insurance policy with a two-year policy term. The original amount borrowed was approximately $3.6 million at large financial institutions,a fixed rate of 4.6% per annum, amortized over twenty months. The premium finance agreement requires 20 fixed monthly principal and amounts may exceed federally insured limits. The Company believes it is not exposedinterest payments of approximately $0.2 million per month from August 15, 2022 to significant credit riskMarch 15, 2024.
This borrowing was classified as short-term as of December 31, 2023, as the remaining principal balance was then due towithin the financial strength of the depository institutions in which the cash and cash equivalents are held.
Mandatorily Redeemable Preferred Stock
The Company has authorized 35,000,000 shares of preferred stock, and has issued to a single investor (Searchlight) who is currently the sole holder of 152,857 shares of Series A-1 preferred stock, which is mandatorily redeemable for cash payable to the holder on November 15, 2033. The number of issued and outstanding shares are currently the same. The Series A-1 preferred stock has a liquidation preference of $1,000 per share. No amounts are redeemable during the five years subsequent to December 31, 2023.
The following table sets forth the changes in shares of Series A-1 preferred stock during the year ended December 31, 2023:
| ($ in thousands) | Shares | Carrying amount | |||||||||
| Preferred stock, beginning of year | — | — | |||||||||
| Preferred stock issued November 15, 2023 | 150,000 | $ | 150,000 | ||||||||
| Preferred stock issued December 13, 2023 | 2,857 | 2,857 | |||||||||
Preferred stock issuance costs (1) | N/A | (6,087) | |||||||||
Allocation of proceeds to preferred stock (2) | N/A | (5,327) | |||||||||
| Preferred stock, end of year | 152,857 | $ | 141,443 | ||||||||
The Series A-1 preferred stock accrues dividends at a rate of 13% per year, compounded and payable quarterly, though cash payment of dividends must be declared by the Board, and are otherwise accrued.
31
Cash Flows
| For the Year Ended December 31, | |||||||||||
| (in thousands) | 2023 | 2022 | |||||||||
| Net cash (used in) provided by operating activities | $ | (6,419) | $ | 16,356 | |||||||
| Net cash used in investing activities | $ | (20,230) | $ | (62,547) | |||||||
| Net cash provided by (used in) financing activities | $ | 18,906 | $ | (4,694) | |||||||
Cash flows from operating activities
For the year ended December 31, 2023, cash used in operating activities was $6.4 million. Our operating cash flows decreased from 2022 primarily due to an increase in our net loss, along with timing of accounts payable and receivable.
Cash flows from investing activities
Cash used in investing activities for the year ended December 31, 2023 was primarily used for investments in property and equipment and internally developed software, while 2022 included a non-recurring cash expenditure for a business acquisition.
Cash flows from financing activities
Cash provided by financing activities for the year ended December 31, 2023, was generated primarily from the refinancing of the Company’s Term Loan — UBS with proceeds from the Term Loan — WhiteHorse and the issuance of the mandatorily redeemable Series A-1 Preferred Stock to Searchlight. During 2022, cash used in financing activities was primarily due to payment on the Term Loan — UBS.
Cash Availability
We have the ability to defer cash payment of interest due on the Series A-1 preferred stock, and plan to defer such payments in the near term in order to preserve cash for other purposes.
Purchase Commitments
We had a total of $45.4$58.9 million of purchase and lease commitments payable that arewere not recorded as liabilities on theour consolidated balance sheet as of December 31, 2021. Additionally, the Company has a $0.4 million standby letter2023.
Significant Issuance and Repurchase of credit and bank guaranteesEquity Securities during 2023
On June 1, 2023, we issued 10,000,000 shares of our common stock to Twilio as purchase consideration for its IoT Business, half of which we repurchased from Twilio on December 31, 2021. The Company has no other financial instruments or commitments withoff-balance-sheetrisk of loss.
13, 2023.Critical Accounting Policies and Estimates
Management discusses the ongoing development and selection of the critical accounting policies and estimates as wellset forth below with the Audit Committee of our Board of Directors. For a discussion of the Company’s significant accounting policies, see Note 2 — Summary of Significant Accounting Policies, in the notes to consolidated financial statements in Part II, Item 8.
Goodwill
Goodwill is the largest asset on our consolidated balance sheets, and has arisen over time as we have acquired other companies. Goodwill is the residual asset value of an acquired business — an intangible asset that is created when a company is purchased in excess of the fair market value of its net assets. The calculation of goodwill is often an inherently subjective process, as the reported expenses incurred duringdetermination of an acquired company’s net assets (as further described below, in “Business Combinations”) involves estimation of various factors, such as useful lives, selection of discount rates, calculation of weighted-average cost of capital, determination of the reporting periods. Our estimates are based on our historical experiencecompany’s peer group for comparable purposes, and on various other factors that we believe are reasonable underinvolve significant judgment. Although management often engages third party experts to perform such calculations, management is responsible for the circumstances, the resultsultimate conclusions reached in any valuation report.
32
Goodwill is not amortized, but is tested for impairment both on a routine annual basis for making judgments aboutand also when an indicator of impairment is deemed to have occurred. An impairment charge is a permanent reduction to the carrying value of assetsan asset and liabilitiescannot be reversed.
Determining if an indicator of impairment to goodwill has occurred involves considerable judgement. During both the third quarter of 2023 and the fourth quarter of 2022, we experienced (among other qualitative indicators described in Part II, Item 8, Notes to the Consolidated Financial Statements, Note 8 — Goodwill and Other Intangible Assets) declines in our stock price and market capitalization that, arein management’s opinion, represented at each time, a possible indicator of impairment as the observed declines were both significant and sustained, and thus, impairment testing was deemed to be indicated.
In testing goodwill for impairment, the underlying assumptions and factors subject to sensitivity included the Company’s internal forecasts of its future results including projected revenue growth rates, cash flows, and its weighted average cost of capital, discount rates, and market factors such as earnings multiples from comparable publicly traded companies.
In the third quarter of 2023, we recorded a goodwill impairment loss of $78.3 million, and in the fourth quarter of 2022 we recorded a goodwill impairment loss of $58.1 million. There can be no assurance that goodwill will not readily apparent from other sources.
Accounting for Business Combinations
We account for acquired businesses using the acquisition method of accounting, which requires that assets acquired and liabilities assumed be recorded at their respective fair values on the date of acquisition. We assign fair value of the consideration paid to the underlying net assets of the acquired business based on their respective fair values. Any excess of the purchase price over the estimated fair valuesvalue of the net assets acquired is recorded to goodwill. as goodwill, as discussed above.
Intangible assets are amortized over the expected life of the asset. We recognize acquisition-related expenses and restructuring costs separately from the business combination and expense as incurred. All changes in accounting for deferred tax asset valuation allowances and acquired income tax uncertainties after the measurement period are recognized as a component of provision for income taxes. We make significant assumptions and estimates in determining the preliminary estimated purchase price and the preliminary allocation of the estimated purchase in the consolidated financial statements. These preliminary estimates and assumptions are subject to change as we finalize the valuations. The final valuations may change significantly from the preliminary estimates. Fair value determinations and useful life estimates are based on, among other factors, estimates of expected future cash flows from revenue of the intangible assets acquired, estimates of appropriate discount rates used to calculate the present value of expected future cash flows, estimated useful lives of the intangible assets acquired, customer attrition rates, future changes in technology and brand awareness, and other factors.
Although we believe the assumptions and estimates we have made have been reasonable and appropriate, they are based, in part, on historical experience, information obtained from the management of the acquired companies and future expectations. For these and other reasons, actual results may vary significantly from estimated results. During the preliminary purchase price measurement period, which may be up to one year from the business combination date, we will record adjustments to the provisional amounts recognized at the acquisition date to reflect new information obtained about facts and circumstances that existed as of the acquisition date, with a corresponding offset to goodwill. After the preliminary purchase price measurement period, we will record adjustments to assets acquired or liabilities assumed subsequent to the purchase price measurement period in our operating results in the period in which the adjustments were determined.
Internal Use Software
Capitalized internal use computer software, net of accumulated amortization, was $25.2$35.8 million and $23.2$29.9 million as of December 31, 20212023 and 2020,2022, respectively, and wasis included in intangible assets.
assets on our consolidated balance sheets.Income Taxes
This estimation process involves assessing various factors, including but not limited to:
•Interpretation of tax laws in numerous jurisdictions: The interpretation and liability method. Under this method,application of tax laws, regulations, and rulings issued by various taxing authorities in numerous jurisdictions can be complex and subject to differing interpretations, and although our operations are located primarily in North America, we must comply with tax laws everywhere we operate.
•Deferred tax assets and liabilities: The recognition and measurement of deferred tax assets and liabilities are recognized forinvolve estimating the future tax consequences of temporary differences between the carrying amountsfinancial reporting and tax bases of assets and liabilities using enacted rates. The effect of a change inliabilities. This requires us to make assumptions about future taxable income, tax rates, on deferred taxes is recognized in income inand the period that includes the enactment date.
33
•Uncertain tax positions: We recognizemay be subject to tax audits which could result in adjustments to our estimations of tax liabilities. We must assess the financial statement effectlikelihood of anvarious outcomes for uncertain income tax position when it is more likely than not,positions and determine the appropriate amount of tax reserves to record based on the technical merits, thatprobability of settlement.
•Valuation allowances: We must evaluate the position will be sustained upon examination. Recognized income tax positions are measured at the largest amount that is greater than 50% likely to be realized. A valuation allowance is recorded to reduce deferred income tax assets to an amount, which in the opinionrealizability of management is more likely than not to be realized.
Given the determination of the valuation allowance. In the event that actual resultsinherent uncertainty and complexity surrounding income tax matters, our estimates may differ from these estimates or we adjust our estimates in the future, we may need to adjust our valuation allowance,actual tax liabilities and benefits realized, which could materially impact our financial positioncondition and results of operations.
certain defined products and services. Products and services that may be defined as taxable in one jurisdiction may not be defined as taxable in another jurisdiction. Given the diverse regulatory environments and varying tax rates across different jurisdictions, we are required to make significant judgments and estimates in determining our liabilities for indirect taxes. Key considerations include:
•Estimating a range where contingent liabilities that are deemed to be “more likely than not” or “probable” exist: We may encounter uncertainties regarding the application of indirect tax laws and regulations. We must assess the likelihood of unfavorable outcomes for any uncertain indirect tax positions and determine the appropriate amount of contingent loss reserves to record based on the probability of settlement.
•Compliance and reporting requirements: We are responsible for complying with various indirect tax filing and reporting obligations. Even inadvertent non-compliance may result in penalties and interest charges, which are a part of an initial liability estimate, when a liability is determined to be “probable,” even if a jurisdiction later waives penalties in situations where mitigation may exist, such as by us entering into a “voluntary disclosure arrangement” with a jurisdiction. Further, in situations where a “reseller certificate” may be a mitigating factor, we must properly prepare, perfect, and maintain such certificates.
Given the board is authorizedcomplexity and subjectivity involved in these matters, our estimates may differ from the actual tax liabilities incurred, which could materially impact our financial statements. We continuously monitor changes in indirect tax laws and regulations and reassess our estimates as new information becomes available to grant stock options to eligible employees,ensure compliance and directors of the Company and the 2021 Incentive Award Plan (“2021 Plan”), under which the board is authorized to grant stock options and restricted stock units. See “Note 14—Stock Based Compensation”accuracy in our accompanying consolidated financial statements for informationreporting. Future regulatory developments may require adjustments to our estimates, which could have a material impact on the Planour financial condition and related stock options.
Revenue Recognition
We usederive revenue primarily from the Black-Scholes valuationsales of our products and services, disaggregated for analysis into the categories of IoT Connectivity and IoT Solutions.
We must make significant estimates and assumptions as we follow the revenue accounting model of ASC 606, to estimate(i) identify the fair valuecontract(s) with a customer; (ii) identify the performance obligations in the contract; (iii) determine the transaction price; (iv) allocate the transaction price to the performance obligations in the contract; and (v) recognize revenue when (or as) we satisfy a performance obligation.
The significant estimates and assumptions are discussed in detail in Part II, Item 8 - Financial Statements, Note 2 — Summary of each option award on the date of grant, which uses assumptions for expected volatility, expected dividends, expected term,Significant Accounting Policies and the risk-free interest rate. We expense the fair value of the option awards on a straight-line basis over the requisite service period and have elected to account for forfeitures as they occur.
Recent accounting pronouncements
See Note 2 — Summary of Significant Accounting Policies to the accompanying consolidated financial statements in Part II, Item 8, for more information about recent accounting pronouncements, the timing of their adoption, and our assessment, to the extent we have made one, of their potential impact on our financial condition and our results of operations.
As an EGC, the JOBS Act allows us to delay adoption of new or revised accounting pronouncements applicable to public companies until such pronouncements are applicable to private companies. We have elected to use this extended transition period under the JOBS Act until such time that we are no longer considered to be an EGC.
ITEM 7A. QUANTITATIVE AND QUALITATIVE DISCLOSURES ABOUT MARKET RISK
34
As a smaller reporting company, we are not required to provide this information.
ITEM 8. FINANCIAL STATEMENTS AND SUPPLEMENTARY DATA
INDEX TO CONSOLIDATED FINANCIAL
STATEMENTS
Report of Independent Registered Public Accounting Firm
Shareholders and Board of Directors
KORE Group Holdings, Inc.
Atlanta, Georgia
Opinion on the Consolidated Financial Statements
We have audited the accompanying consolidated balance sheets of KORE Group Holdings, Inc. (the “Company”) as of December 31, 20212023 and 2020,2022, the related consolidated statements of operations and comprehensive loss, temporary equity andchanges in stockholders’ equity, and cash flows for each of the three years in the periodthen ended, December 31, 2021, and the related notes and schedule (collectively referred to as the “consolidated financial statements”). In our opinion, the consolidated financial statements present fairly, in all material respects, the financial position of the Company at December 31, 20212023 and 2020,2022, and the results of its operations and its cash flows for each of the three years in the periodthen ended December 31, 2021in conformity with accounting principles generally accepted in the United States of America.
,
Basis for Opinion
These consolidated financial statements are the responsibility of the Company’s management. Our responsibility is to express an opinion on the Company’s consolidated financial statements based on our audits. We are a public accounting firm registered with the Public Company Accounting Oversight Board (United States) (“PCAOB”) and are required to be independent with respect to the Company in accordance with the U.S. federal securities laws and the applicable rules and regulations of the Securities and Exchange Commission and the PCAOB.
We conducted our audits in accordance with the standards of the PCAOB. Those standards require that we plan and perform the audit to obtain reasonable assurance about whether the consolidated financial statements are free of material misstatement, whether due to error or fraud. The Company is not required to have, nor were we engaged to perform, an audit of its internal control over financial reporting. As part of our audits, we are required to obtain an understanding of internal control over financial reporting but not for the purpose of expressing an opinion on the effectiveness of the Company’s internal control over financial reporting. Accordingly, we express no such opinion.
Our audits included performing procedures to assess the risks of material misstatement of the consolidated financial statements, whether due to error or fraud, and performing procedures that respond to those risks. Such procedures included examining, on a test basis, evidence regarding the amounts and disclosures in the consolidated financial statements. Our audits also included evaluating the accounting principles used and significant estimates made by management, as well as evaluating the overall presentation of the consolidated financial statements. We believe that our audits provide a reasonable basis for our opinion.
/s/ BDO USA, LLP
We have served as the Company’s auditor since 2019.
Atlanta, Georgia
April 15, 2024
KORE Group Holdings, Inc. and Subsidiaries
Consolidated Balance Sheets
(In thousands, USD, except share and per share amounts)
December 31, | December 31, | |||||||
2021 | 2020 | |||||||
Assets | ||||||||
Current assets | ||||||||
Cash and cash equivalents | $ | 85,976 | $ | 10,321 | ||||
Accounts receivable, net of allowances for credits and doubtful accounts of $1,800 and $2,804, at December 31, 2021, and 2020, respectively | 51,304 | 40,661 | ||||||
Inventories, net | 15,470 | 5,842 | ||||||
Income taxes receivable | 954 | 0 | ||||||
Prepaid expenses and other receivables | 7,448 | 5,429 | ||||||
Total current assets | 161,152 | 62,253 | ||||||
Non-current assets | ||||||||
Restricted cash | 367 | 372 | ||||||
Property and equipment, net | 12,240 | 13,709 | ||||||
Intangibles assets, net | 203,474 | 240,203 | ||||||
Goodwill | 381,962 | 382,749 | ||||||
Deferred tax assets | 0 | 122 | ||||||
Other long-term assets | 407 | 611 | ||||||
Total assets | $ | 759,602 | $ | 700,019 | ||||
Liabilities, temporary equity and stockholders’ equity | ||||||||
Current liabilities | ||||||||
Accounts payable | $ | 16,004 | $ | 22,978 | ||||
Accrued liabilities | 21,311 | 17,209 | ||||||
Income taxes payable | 467 | 244 | ||||||
Current portion of capital lease obligations | 191 | 856 | ||||||
Deferred revenue | 6,889 | 7,772 | ||||||
Current portion of long-term debt and other borrowings, net | 3,326 | 3,161 | ||||||
Total current liabilities | 48,188 | 52,220 | ||||||
Non-current liabilities | ||||||||
Deferred tax liabilities | 36,722 | 42,840 | ||||||
Due to related parties | 0 | 1,615 | ||||||
Warrant liability | 286 | 15,944 | ||||||
Capital lease obligations | 264 | 508 | ||||||
Long-term debt and other borrowings, net | 399,115 | 298,404 | ||||||
Other long-term liabilities | 2,884 | 4,377 | ||||||
Total liabilities | $ | 487,459 | $ | 415,908 | ||||
Commitments and contingencies (note 1 1 ) | ||||||||
| December 31, | |||||||||||
| 2023 | 2022 | ||||||||||
| ASSETS | |||||||||||
| Current assets: | |||||||||||
| Cash | $ | 27,137 | $ | 34,645 | |||||||
| Accounts receivable, net | 52,413 | 44,538 | |||||||||
| Inventories, net | 8,215 | 10,051 | |||||||||
| Prepaid expenses and other current assets | 14,222 | 13,986 | |||||||||
| Total current assets | 101,987 | 103,220 | |||||||||
| Noncurrent assets: | |||||||||||
| Restricted cash | 300 | 362 | |||||||||
| Property and equipment, net | 10,956 | 11,899 | |||||||||
| Intangible assets, net | 167,587 | 192,504 | |||||||||
| Goodwill | 294,974 | 369,706 | |||||||||
| Operating lease right-of-use assets | 9,367 | 10,019 | |||||||||
| Other non-current assets | 1,813 | 971 | |||||||||
| Total assets | $ | 586,984 | $ | 688,681 | |||||||
| LIABILITIES AND STOCKHOLDERS’ EQUITY | |||||||||||
| Current liabilities: | |||||||||||
| Accounts payable | $ | 23,983 | $ | 17,835 | |||||||
| Accrued liabilities | 23,421 | 16,000 | |||||||||
| Accrued interest due to affiliate | 2,530 | — | |||||||||
| Current portion of operating lease liabilities | 1,446 | 1,811 | |||||||||
| Deferred revenue | 9,044 | 7,817 | |||||||||
| Current portion of long-term debt and other borrowings, net | 2,411 | 5,345 | |||||||||
| Warrant liabilities to affiliates | 11,664 | 33 | |||||||||
| Total current liabilities | 74,499 | 48,841 | |||||||||
| Noncurrent liabilities: | |||||||||||
| Operating lease liabilities | 9,446 | 9,275 | |||||||||
| Long-term debt and other borrowings, net | 296,109 | 413,910 | |||||||||
| Deferred income tax liabilities, net | 13,795 | 25,193 | |||||||||
| Mandatorily redeemable preferred stock due to affiliate, net | 141,594 | — | |||||||||
| Other liabilities | 14,568 | 10,790 | |||||||||
| Total liabilities | 550,011 | 508,009 | |||||||||
| Commitments and Contingencies | |||||||||||
| Stockholders’ equity: | |||||||||||
| Common stock, voting; par value $0.0001 per share; 315,000,000 shares authorized; 87,382,647 shares issued and 82,382,647 outstanding as of December 31, 2023, and 76,292,241 shares issued and outstanding as of December 31, 2022 | 8 | 8 | |||||||||
| Additional paid in capital | 461,069 | 435,292 | |||||||||
| Accumulated other comprehensive loss | (6,070) | (6,390) | |||||||||
| Accumulated deficit | (415,280) | (248,238) | |||||||||
| Treasury stock, at cost, 5,000,000 shares | (2,754) | — | |||||||||
| Total stockholders’ equity | 36,973 | 180,672 | |||||||||
| Total liabilities and stockholders’ equity | $ | 586,984 | $ | 688,681 | |||||||
See accompanying notes to consolidated financial statements.
KORE Group Holdings, Inc.
Consolidated Statements of Operations and SubsidiariesComprehensive Loss
(In thousands, USD, except share and per share amounts)
| For the Year Ended December 31, | ||||||||||||||
| 2023 | 2022 | |||||||||||||
| Revenues | ||||||||||||||
| Services | $ | 212,645 | $ | 188,985 | ||||||||||
| Products | 63,965 | 79,462 | ||||||||||||
| Total revenue | 276,610 | 268,447 | ||||||||||||
| Cost of revenue | ||||||||||||||
| Services | 82,547 | 67,268 | ||||||||||||
| Products | 46,016 | 61,886 | ||||||||||||
| Total cost of revenue (exclusive of depreciation and amortization shown separately below) | 128,563 | 129,154 | ||||||||||||
| Operating expenses | ||||||||||||||
| Selling, general, and administrative expenses | 129,816 | 109,492 | ||||||||||||
| Selling, general, and administrative expenses incurred with affiliate | 372 | 2,600 | ||||||||||||
| Depreciation and amortization | 58,363 | 54,499 | ||||||||||||
| Goodwill impairment | 78,257 | 58,074 | ||||||||||||
| Total operating expenses | 266,808 | 224,665 | ||||||||||||
| Operating loss | (118,761) | (85,372) | ||||||||||||
| Other expense (income) | ||||||||||||||
| Interest expense, including amortization of deferred financing costs | 40,625 | 31,835 | ||||||||||||
| Interest expense incurred with affiliate, including amortization of deferred financing costs | 2,607 | — | ||||||||||||
| Interest income | (552) | (464) | ||||||||||||
| Change in fair value of warrant liabilities to affiliates | 6,436 | (254) | ||||||||||||
| Loss on extinguishment of debt | 2,584 | — | ||||||||||||
| Other expense, net | 739 | 128 | ||||||||||||
| Loss before income taxes | (171,200) | (116,617) | ||||||||||||
| Income tax benefit | (4,158) | (10,417) | ||||||||||||
| Net loss | $ | (167,042) | $ | (106,200) | ||||||||||
| Loss per share: | ||||||||||||||
| Basic and diluted | $ | (1.99) | $ | (1.40) | ||||||||||
| Weighted average shares outstanding: | ||||||||||||||
| Basic and diluted | 83,808,227 | 75,710,904 | ||||||||||||
| Comprehensive loss | ||||||||||||||
| Net loss | $ | (167,042) | $ | (106,200) | ||||||||||
| Other comprehensive loss: | ||||||||||||||
| Foreign currency translation adjustment | 320 | (2,927) | ||||||||||||
| Comprehensive loss | $ | (166,722) | $ | (109,127) | ||||||||||
December 31, | December 31, | |||||||
2021 | 2020 | |||||||
Temporary equity | ||||||||
Series A Preferred Stock; par value $1,000 per share; NaN authorized, issued and outstanding at December 31, 2021; 7,765,229 shares authorized, and 7,756,158 shares issued and outstanding at December 31, 2020 | $ | — | $ | 77,562 | ||||
Series A-1 Preferred Stock; par value $1,000 per share; NaN authorized, issued and outstanding at December 31, 2021; 10,480,538 shares authorized, 7,862,107 shares issued and outstanding at December 31, 2020 | — | 78,621 | ||||||
Series B Preferred Stock; par value $1,000 per share; NaN authorized, issued and outstanding at December 31, 2021; 9,090,975 shares authorized, 9,090,975 shares issued and outstanding at December 31, 2020 | — | 90,910 | ||||||
Series C Convertible Preferred Stock; par value $1,000 per share; NaN authorized, issued and outstanding at December 31, 2021; 6,872,894 shares authorized, 2,566,186 shares issued and outstanding at December 31, | — | 16,802 | ||||||
Total temporary equity | $ | — | $ | 263,895 | ||||
Stockholders’ equity | ||||||||
Common stock, voting; par value $0.0001 per share; 315,000,000 shares authorized, 72,027,743 shares issued and outstanding at December 31, 2021; 55,659,643 shares authorized, 30,281,520 shares issued and outstanding at December 31, 2020 | $ | 7 | $ | 3 | ||||
Additional paid-in capital | 413,646 | 135,616 | ||||||
Accumulated other comprehensive loss | (3,331 | ) | (1,677 | ) | ||||
Accumulated deficit | (138,179 | ) | (113,726 | ) | ||||
Total stockholders’ equity | 272,143 | 20,216 | ||||||
Total liabilities, temporary equity and stockholders’ equity | $ | 759,602 | $ | 700,019 | ||||
See accompanying notes to consolidated financial statements.
KORE Group Holdings, Inc. and Subsidiaries
Consolidated Statements of OperationsChanges in Stockholders’ Equity
(In thousands, USD, except share and per share amounts)
| For the Year Ended December 31, | |||||||||||
| 2023 | 2022 | ||||||||||
| Par value of common stock | |||||||||||
| Balance, beginning of year | $ | 8 | $ | 7 | |||||||
| Common stock issued pursuant to acquisition | — | 1 | |||||||||
| Balance, end of year | 8 | 8 | |||||||||
| Additional paid-in capital | |||||||||||
| Balance, beginning of year | 435,292 | 401,702 | |||||||||
| Common stock issued pursuant to acquisition | 14,700 | 23,294 | |||||||||
| Stock-based compensation expense | 11,251 | 10,296 | |||||||||
| Stock awards cancelled for employee tax withholdings | (405) | — | |||||||||
| Private offering and merger financing refund | 231 | — | |||||||||
| Balance, end of year | 461,069 | 435,292 | |||||||||
| Accumulated other comprehensive loss | |||||||||||
| Balance, beginning of year | (6,390) | (3,463) | |||||||||
| Foreign currency translation adjustment | 320 | (2,927) | |||||||||
| Balance, end of year | (6,070) | (6,390) | |||||||||
| Accumulated deficit | |||||||||||
| Balance, beginning of year | (248,238) | (142,038) | |||||||||
| Net loss | (167,042) | (106,200) | |||||||||
| Balance, end of year | (415,280) | (248,238) | |||||||||
| Treasury stock, at cost | |||||||||||
| Balance, beginning of year | — | — | |||||||||
| Purchase of treasury stock | (2,754) | — | |||||||||
| Balance, end of year | (2,754) | — | |||||||||
| Total Stockholders’ Equity | $ | 36,973 | $ | 180,672 | |||||||
For the years ended | December 31, | December 31, | December 31, | |||||||||
2021 | 2020 | 2019 | ||||||||||
Revenue | ||||||||||||
Services | $ | 187,962 | $ | 172,845 | $ | 159,425 | ||||||
Products | 60,255 | 40,915 | 9,727 | |||||||||
Total revenue | 248,217 | 213,760 | 169,152 | |||||||||
Cost of revenue | ||||||||||||
Cost of services | 69,867 | 64,520 | 57,621 | |||||||||
Cost of products | 52,357 | 33,410 | 6,044 | |||||||||
Total cost of revenue (exclusive of depreciation and amortization shown separately below) | 122,224 | 97,930 | 63,665 | |||||||||
Operating expenses | ||||||||||||
Selling, general and administrative | 91,733 | 72,883 | 65,298 | |||||||||
Depreciation and amortization | 50,414 | 52,488 | 48,131 | |||||||||
Intangible asset impairment loss | 0 | 0 | 3,892 | |||||||||
Total operating expenses | 142,147 | 125,371 | 117,321 | |||||||||
Operating loss | (16,154 | ) | (9,541 | ) | (11,834 | ) | ||||||
Interest expense, including amortization of deferred financing costs, net | 23,260 | 23,493 | 24,785 | |||||||||
Change in fair value of warrant liability | (5,267 | ) | 7,485 | (235 | ) | |||||||
Loss before income taxes | (34,147 | ) | (40,519 | ) | (36,384 | ) | ||||||
Income tax expense (benefit) | ||||||||||||
Current | 177 | 1,051 | (1,450 | ) | ||||||||
Deferred | (9,871 | ) | (6,369 | ) | (11,491 | ) | ||||||
Total income tax benefit | (9,694 | ) | (5,318 | ) | (12,941 | ) | ||||||
Net loss attributable to the Company | $ | (24,453 | ) | $ | (35,201 | ) | $ | (23,443 | ) | |||
Loss per share: | ||||||||||||
Basic | $ | (1.03 | ) | $ | (1.96 | ) | $ | (1.45 | ) | |||
Diluted | $ | (1.03 | ) | $ | (1.96 | ) | $ | (1.45 | ) | |||
Weighted average shares outstanding (in Number): | ||||||||||||
Basic | 41,933,050 | 31,650,173 | 31,169,435 | |||||||||
Diluted | 41,933,050 | 31,650,173 | 31,169,435 | |||||||||
See accompanying notes to consolidated financial statements.
40
KORE Group Holdings, Inc. and Subsidiaries
For the years ended | December 31, 2021 | December 31, 2020 | December 31, 2019 | |||||||||
Net loss | $ | (24,453 | ) | $ | (35,201 | ) | $ | (23,443 | ) | |||
Other comprehensive income (loss): | ||||||||||||
Foreign currency translation adjustment | (1,654 | ) | 2,116 | 517 | ||||||||
Comprehensive loss | $ | (26,107 | ) | $ | (33,085 | ) | $ | (22,926 | ) | |||
Series A Preferred Stock | Series A-1 Preferred Stock | Series B Preferred Stock | Series C Convertible Preferred Stock | Total Temporary Equity | Common Stock | Additional paid-in capital | Accumulated Other Comprehensive Income (Loss) | Accumulated Deficit | Total Stockholders’ Equity | |||||||||||||||||||||||||||||||||||||||||||||||||||
Temporary Equity | ||||||||||||||||||||||||||||||||||||||||||||||||||||||||||||
Shares | Amount | Shares | Amount | Shares | Amount | Shares | Amount | Amount | Shares | Amount | Amount | Amount | Amount | Amount | ||||||||||||||||||||||||||||||||||||||||||||||
Balance at December 31, 2018 (as previously reported) | 42,750 | $ | 60,270 | 60,013 | $ | 61,444 | 57,000 | $ | 76,832 | 16,802 | $ | 16,802 | $ | 215,348 | 213,756 | $ | 2 | $ | 174,601 | $ | (4,310 | ) | $ | (55,082 | ) | $ | 115,211 | |||||||||||||||||||||||||||||||||
Conversion of Stock | 5,984,277 | — | 6,084,419 | — | 7,626,175 | — | 2,549,384 | — | — | 29,530,231 | 1 | (1 | ) | — | — | — | ||||||||||||||||||||||||||||||||||||||||||||
Balance at December 31, 2018, effect of reverse recapitalization | 6,027,027 | $ | 60,270 | 6,144,432 | $ | 61,444 | 7,683,175 | $ | 76,832 | 2,566,186 | $ | 16,802 | $ | 215,348 | 29,743,987 | $ | 3 | $ | 174,600 | $ | (4,310 | ) | $ | (55,082 | ) | $ | 115,211 | |||||||||||||||||||||||||||||||||
Issuance of stock | — | — | — | — | — | — | — | — | — | 573,016 | — | 7,000 | — | — | 7,000 | |||||||||||||||||||||||||||||||||||||||||||||
Repurchase and cancellation of stock | — | — | — | — | — | — | — | — | — | (7,653 | ) | — | (80 | ) | — | — | (80 | ) | ||||||||||||||||||||||||||||||||||||||||||
Accrued dividends payable | 808,976 | 8,090 | 805,092 | 8,051 | 550,599 | 5,506 | — | — | 21,647 | — | — | (21,647 | ) | — | — | (21,647 | ) | |||||||||||||||||||||||||||||||||||||||||||
Foreign currency translation adjustment | — | — | — | — | — | — | — | — | — | — | — | — | 517 | — | 517 | |||||||||||||||||||||||||||||||||||||||||||||
Share-based compensation | — | — | — | — | — | — | — | — | — | — | — | 1,682 | — | — | 1,682 | |||||||||||||||||||||||||||||||||||||||||||||
Net loss | — | — | — | — | — | — | — | — | — | — | — | — | — | (23,443 | ) | (23,443 | ) | |||||||||||||||||||||||||||||||||||||||||||
Balance at December 31, 2019 | 6,836,003 | $ | 68,360 | 6,949,524 | $ | 69,495 | 8,233,774 | $ | 82,338 | 2,566,186 | $ | 16,802 | $ | 236,995 | 30,309,350 | $ | 3 | $ | 161,555 | $ | (3,793 | ) | $ | (78,525 | ) | $ | 79,240 | |||||||||||||||||||||||||||||||||
Repurchase and cancellation of stock | — | — | — | — | — | — | — | — | — | (27,830 | ) | — | (200 | ) | — | — | (200 | ) | ||||||||||||||||||||||||||||||||||||||||||
Accrued dividends payable | 920,155 | 9,202 | 912,583 | 9,126 | 857,201 | 8,572 | — | — | 26,900 | — | — | (26,900 | ) | — | — | (26,900 | ) | |||||||||||||||||||||||||||||||||||||||||||
Foreign currency translation adjustment | — | — | — | — | — | — | — | — | — | — | — | — | 2,116 | — | 2,116 | |||||||||||||||||||||||||||||||||||||||||||||
Share-based compensation | — | — | — | — | — | — | — | — | — | — | — | 1,161 | — | — | 1,161 | |||||||||||||||||||||||||||||||||||||||||||||
Net loss | — | — | — | — | — | — | — | — | — | — | — | — | — | (35,201 | ) | (35,201 | ) | |||||||||||||||||||||||||||||||||||||||||||
Balance at December 31, 2020 | 7,756,158 | $ | 77,562 | 7,862,107 | $ | 78,621 | 9,090,975 | $ | 90,910 | 2,566,186 | $ | 16,802 | $ | 263,895 | 30,281,520 | $ | 3 | $ | 135,616 | $ | (1,677 | ) | $ | (113,726 | ) | $ | 20,216 | |||||||||||||||||||||||||||||||||
Derecognition of shares | — | — | — | — | — | — | (45,818 | ) | (300 | ) | (300 | ) | — | — | — | — | — | — | ||||||||||||||||||||||||||||||||||||||||||
Accrued dividends payable | 765,609 | 7,656 | 824,076 | 8,241 | 692,543 | 6,925 | — | — | 22,822 | — | — | (22,822 | ) | — | — | (22,822 | ) | |||||||||||||||||||||||||||||||||||||||||||
Foreign currency translation adjustment | — | — | — | — | — | — | — | — | — | — | — | — | (1,654 | ) | — | (1,654 | ) | |||||||||||||||||||||||||||||||||||||||||||
Share-based compensation | — | — | — | — | — | — | — | — | — | 200,426 | — | (1,856 | ) | — | — | (1,856 | ) | |||||||||||||||||||||||||||||||||||||||||||
Distributions to and conversions of preferred stock | (8,521,767 | ) | (85,218 | ) | (8,686,183 | ) | (86,862 | ) | (9,783,518 | ) | (97,835 | ) | (2,520,368 | ) | (16,502 | ) | (286,417 | ) | 7,120,368 | 1 | 56,502 | — | — | 56,503 | ||||||||||||||||||||||||||||||||||||
CTAC shares recapitalized, net of equity issuance costs of $15,943 | — | — | — | — | — | — | — | — | — | 10,373,491 | 1 | 6,428 | — | — | 6,460 | |||||||||||||||||||||||||||||||||||||||||||||
Conversion of KORE warrants | — | — | — | — | — | — | — | — | — | 1,365,612 | — | 10,663 | — | — | 10,663 | |||||||||||||||||||||||||||||||||||||||||||||
Private offering and merger financing, net of equity issuance costs of $8,123 | — | — | — | — | — | — | — | — | — | 22,686,326 | 2 | 216,875 | — | — | 217,126 | |||||||||||||||||||||||||||||||||||||||||||||
Equity portion of convertible debt, net of deferred financing costs of $ 384 , net of sponsor shares of $683, net of deferred tax liability of $3,999 | — | — | — | — | — | — | — | — | — | — | — | 12,240 | — | — | 11,960 | |||||||||||||||||||||||||||||||||||||||||||||
Net loss | — | — | — | — | — | — | — | — | — | — | — | — | — | (24,453 | ) | (24,453 | ) | |||||||||||||||||||||||||||||||||||||||||||
Balance at December 31, 2021 | 0 | $ | 0 | 0 | $ | 0 | 0 | $ | 0 | 0 | $ | 0 | $ | 0 | 72,027,743 | $ | 7 | $ | 413,646 | $ | (3,331 | ) | $ | (138,179 | ) | $ | 272,143 | |||||||||||||||||||||||||||||||||
Consolidated Statements of Cash Flows
(In thousands USD)
| For the Year Ended | |||||||||||
| 2023 | 2022 | ||||||||||
| Operating activities: | |||||||||||
| Net loss | $ | (167,042) | $ | (106,200) | |||||||
| Adjustments to reconcile net loss to net cash (used in) provided by operating activities | |||||||||||
| Depreciation and amortization | 58,363 | 54,499 | |||||||||
| Amortization of deferred financing costs | 2,204 | 2,427 | |||||||||
| Loss on extinguishment of debt | 2,584 | — | |||||||||
| Goodwill impairment | 78,257 | 58,074 | |||||||||
| Stock-based compensation expense | 11,251 | 10,296 | |||||||||
| Deferred income taxes | (11,412) | (16,189) | |||||||||
| Change in fair value of warrant liabilities to affiliates | 6,436 | (254) | |||||||||
| Amortization of operating lease right-of-use assets | 2,331 | 2,218 | |||||||||
| Other | 100 | 429 | |||||||||
| Changes in operating assets and liabilities, net of acquisitions: | |||||||||||
| Accounts receivable | (7,707) | 8,962 | |||||||||
| Inventories | 1,973 | 6,542 | |||||||||
| Prepaid expenses and other assets | (87) | (1,992) | |||||||||
| Accounts payable and accrued liabilities | 12,968 | (1,968) | |||||||||
| Accrued interest due to affiliate | 2,530 | — | |||||||||
| Deferred revenue | 1,175 | 980 | |||||||||
| Operating lease liabilities | (1,847) | (1,468) | |||||||||
| Other assets and liabilities | 1,504 | — | |||||||||
| Net cash (used in) provided by operating activities | $ | (6,419) | $ | 16,356 | |||||||
| Investing activities: | |||||||||||
| Purchases of property and equipment | (4,433) | (3,307) | |||||||||
| Additions to intangible assets | (15,797) | (13,238) | |||||||||
| Acquisitions of business combinations, net of cash acquired | — | (46,002) | |||||||||
| Net cash used in investing activities | $ | (20,230) | $ | (62,547) | |||||||
| Financing activities: | |||||||||||
| Proceeds from issuance of debt | 185,000 | — | |||||||||
| Payment of original issue discount | (4,200) | — | |||||||||
| Payment of deferred financing costs | (6,853) | (356) | |||||||||
| Repayment of debt | (304,847) | (4,188) | |||||||||
| Proceeds from mandatorily redeemable preferred stock due to affiliate | 152,857 | — | |||||||||
| Purchase of treasury stock | (2,754) | — | |||||||||
| Principal payments under finance lease obligations | (123) | (150) | |||||||||
| Private offering and merger financing refund | 231 | — | |||||||||
| Payment of employee tax withholdings through cancelled shares of stock | (405) | — | |||||||||
| Net cash provided by (used in) financing activities | $ | 18,906 | $ | (4,694) | |||||||
| Effect of exchange rate changes on cash | $ | 173 | $ | (451) | |||||||
| Net decrease in cash and restricted cash | $ | (7,570) | $ | (51,336) | |||||||
| Cash and restricted cash, beginning of year | $ | 35,007 | $ | 86,343 | |||||||
| Cash and restricted cash, end of year | $ | 27,437 | $ | 35,007 | |||||||
| Supplemental cash flow information: | |||||||||||
| Cash paid for interest | $ | 35,330 | $ | 29,199 | |||||||
| Cash paid for income taxes (net of refunds) | $ | 5,718 | $ | 2,119 | |||||||
| Non-cash investing and financing activities: | |||||||||||
| Fair value of KORE common stock issued pursuant to acquisition | $ | 14,700 | $ | 23,295 | |||||||
| Issuance of penny warrants | $ | 5,195 | $ | — | |||||||
| Operating lease right-of-use assets obtained in exchange for new operating lease liabilities | $ | 1,636 | $ | 3,409 | |||||||
| ASU 2020-06 Adoption | $ | — | $ | 15,163 | |||||||
| Operating lease right-of-use assets obtained in exchange for new operating lease liabilities upon the adoption of ASC 842 | $ | — | $ | 9,604 | |||||||
| Premium finance agreement | $ | — | $ | 3,621 | |||||||
For the years ended | December 31, 2021 | December 31, 2020 | December 31, 2019 | |||||||||
Cash flows from operating activities | ||||||||||||
Net loss | $ | (24,453 | ) | $ | (35,201 | ) | $ | (23,443 | ) | |||
Adjustments to reconcile net loss to net cash (used in) provided by operating activities | ||||||||||||
Depreciation and amortization | 50,414 | 52,488 | 48,131 | |||||||||
Intangible asset impairment loss | — | — | 3,892 | |||||||||
Amortization of deferred financing costs | 2,097 | 2,313 | 2,063 | |||||||||
Amortization of discount on Backstop Notes | 424 | — | — | |||||||||
Deferred income taxes | (9,871 | ) | (6,178 | ) | (11,419 | ) | ||||||
Non-cash foreign currency loss | 344 | 233 | 1,440 | |||||||||
Share-based compensation | 4,564 | 1,161 | 1,682 | |||||||||
Provision for doubtful accounts | 322 | 640 | 905 | |||||||||
Change in fair value of warrant liability | (5,267 | ) | 7,485 | (235 | ) | |||||||
Settlement gain on carrier commitment liability | — | — | (2,269 | ) | ||||||||
Change in operating assets and liabilities, net of operating assets and liabilities acquired: | ||||||||||||
Accounts receivable | (11,884 | ) | (6,072 | ) | 860 | |||||||
Inventories | (9,875 | ) | (3,027 | ) | (566 | ) | ||||||
Prepaid expenses and other receivables | (1,700 | ) | (2,020 | ) | 169 | |||||||
Accounts payable and accrued liabilities | (8,371 | ) | 13,100 | (2,458 | ) | |||||||
Deferred revenue | (805 | ) | 1,583 | (44 | ) | |||||||
Income taxes payable | (697 | ) | (34 | ) | (1,158 | ) | ||||||
Change in minimum carrier commitment liability | — | — | (3,297 | ) | ||||||||
Cash (used in) provided by operating activities | $ | (14,758 | ) | $ | 26,471 | $ | 14,253 | |||||
Cash flows used in investing activities | ||||||||||||
Additions to intangible assets | (9,247 | ) | (10,135 | ) | (10,491 | ) | ||||||
Additions to property and equipment | (4,172 | ) | (1,834 | ) | (2,391 | ) | ||||||
Acquisition of Integron LLC, net of cash acquired | — | 366 | (37,488 | ) | ||||||||
Net cash used in investing activities | $ | (13,419 | ) | $ | (11,603 | ) | $ | (50,370 | ) | |||
Cash flows from financing activities | ||||||||||||
Proceeds from revolving credit facility | 25,000 | — | 8,135 | |||||||||
Repayment on revolving credit facility | (25,000 | ) | (8,300 | ) | — | |||||||
Repayment of term loan | (3,161 | ) | (3,526 | ) | (2,888 | ) | ||||||
Repayment of other borrowings - notes payable | (173 | ) | — | — | ||||||||
Proceeds from term loan | — | — | 35,000 | |||||||||
Proceeds from convertible debt | 104,167 | 0 | 0 | |||||||||
Proceeds from equity portion of convertible debt, net of issuance costs | 15,697 | — | — | |||||||||
Payment of deferred financing costs | (1,579 | ) | — | (2,089 | ) | |||||||
Repayment of related party note | (1,538 | ) | — | — | ||||||||
Repurchase of common stock | — | (200 | ) | (80 | ) | |||||||
Proceeds from CTAC and PIPE financing, net of issuance costs | 223,688 | — | — | |||||||||
Settlements of preferred shares | (229,915 | ) | — | — | ||||||||
Payment of capital lease obligations | (828 | ) | (692 | ) | (1,080 | ) | ||||||
Payment of stock option share employee withholding taxes | (2,305 | ) | — | — | ||||||||
Cash provided by/(used in) financing activities | $ | 104,053 | $ | (12,718 | ) | $ | 36,998 | |||||
Effect of Exchange Rate Change on Cash and Cash Equivalents | (226 | ) | (149 | ) | (162 | ) | ||||||
Change in Cash and Cash Equivalents and Restricted Cash | 75,650 | 2,001 | 719 | |||||||||
Cash and Cash Equivalents and Restricted Cash, beginning of period | 10,693 | 8,692 | 7,973 | |||||||||
Cash and Cash Equivalents and Restricted Cash, end of period | $ | 86,343 | $ | 10,693 | $ | 8,692 | ||||||
See accompanying notes to consolidated financial statements.
41
KORE Group Holdings, Inc. and Subsidiaries
For the years ended | 2021 | 2020 | 2019 | |||||||||
Non-cash investing and financing activities: | ||||||||||||
Equity issued for acquisition of Integron LLC | $ | — | $ | — | $ | 7,000 | ||||||
Equity financing fees accrued | 3,602 | — | — | |||||||||
Capital leases | 0 | 622 | 1,120 | |||||||||
Common shares issued to preferred shareholders | 56,502 | — | — | |||||||||
Equity financing fees settled in common shares | 1,863 | — | — | |||||||||
Common shares issued to warrant holders | 10,663 | — | — | |||||||||
Common shares issued to option holders pursuant to the Cancellation Agreements | 1,072 | — | — | |||||||||
Sponsor shares distributed to lender under Backstop Agreement | 683 | — | — | |||||||||
Supplemental cash flow information: | ||||||||||||
Interest paid | $ | 19,874 | $ | 21,544 | $ | 23,977 | ||||||
Taxes paid (net of refunds) | 957 | 379 | 417 | |||||||||
Notes to Consolidated Financial Statements
NOTE 1 - NATURE OF OPERATIONS
Organization and Basis of Presentation
The Company has operating subsidiariesis incorporated in the state of Delaware and its operations are primarily located in Australia, Belgium, Brazil, Canada, Dominican Republic, Ireland, Malta, Mexico, the Netherlands, New Zealand, Singapore, Switzerland, the United Kingdom and the United States.North America. The Company’s consolidated financial statements (the “consolidated financial statements”) reflectinclude the accounts of the Company and its financial statements and those of its wholly owned subsidiaries.
The Company’s common stock is traded on the New York Stock Exchange under the ticker symbol “KORE”.
The Company currently qualifies as an Emerging Growth Company under Section 102(b)(1) of the JOBS Act, which, upon consolidation. an affirmative election, which the Company has made, allows the Company to adopt new or revised financial accounting standards at the same time as private companies.
NOTE 2 – SUMMARY OF SIGNIFICANT ACCOUNTING POLICIES
Use of Estimates
The preparation of consolidated financial statements in conformity with GAAP requires managementthe Company to make usea number of significant estimates. These include estimates of revenue recognition, fair value measurements of assets acquired and assumptionsliabilities assumed in business combinations, assessments of indicators of impairment regarding various assets including goodwill, calculation of capitalized software costs, accounting for uncertainties in income tax positions, and other estimates that affect the reported amounts of certain assets and disclosures.
Reclassification of Prior Period Presentation
Certain amounts reported in the prior year in the consolidated balance sheets have been reclassified to conform to the current year’s presentation. For comparative purposes, and to enhance transparency of the Company’s balance sheets, the Company has separately presented in the financial statements transactions with affiliates, and has reclassified certain immaterial amounts in the prior period.
Immaterial Out of Period Adjustment
During the year ended December 31, 2023, the Company identified an immaterial error related to the 2023 and 2022 accounting for indirect taxes that impacted the Company’s previously issued 2022 consolidated financial statements. Management evaluated the effect of the error on the 2023 and 2022 consolidated financial statements and concluded the error was not material. As a result, in 2023, the Company recorded an out of period adjustment to increase accrued liabilities and selling, general, and administrative expenses, each by approximately $1.4 million as of and for the year ended December 31, 2023. An additional amount of $0.4 million was recorded as of December 31, 2023 for a total indirect tax contingent liability of $1.8 million. See also Note 19 — Commitments and Contingencies.
Change in Accounting Estimate — Depreciation of Property and Equipment
On January 1, 2024, the Company elected to change its method of depreciation for long-lived assets from the declining balance method to the straight-line method. The Company’s use of the straight-line depreciation method will be effective beginning January 1, 2024, and will be applied prospectively as a change in estimate.
Restricted Cash
Restricted cash represents cash deposits held with financial institutions for letters of credit and is not available for general corporate purposes.
42
Concentrations of Credit Risk
Cash is a financial instrument that is potentially subject to concentrations of credit risk. The Company’s cash is deposited in accounts at large financial institutions, and amounts may, at times, exceed federally insured limits.
Trade Accounts Receivable and Allowance for Credit Losses
The Business CombinationCompany records accounts receivable at amortized cost less an allowance for credit losses. The Company accounts for credit losses under the current expected credit loss model using a loss rate methodology, which considers historical loss rates on its trade accounts receivable balances, adjusted for current conditions, along with reasonable and supportable forecasts regarding collections and delinquencies on trade accounts receivable.
The Company adopted ASU 2016-13, the updated accounting standard regarding credit losses as described above, on January 1, 2023, utilizing the modified retrospective method. The adoption of ASU 2016-13 modified the measurement of expected credit losses on certain financial instruments such as trade receivables that result from revenue transactions within the scope of ASC 606.
The Company generally does not require collateral from its customers, although it may require letters of credit in certain instances to limit its credit risk.
Inventories
The Company generally records its inventory, of which substantially all inventory consists of finished goods such as SIM cards, other hardware and packaging materials, using the average cost method. One wholly-owned consolidated subsidiary which was acquired in 2022 uses the first-in, first-out (“FIFO”) method. All inventories are stated at the lower of cost or net realizable value.
Deferred Financing Costs
Deferred financing costs consist principally of debt issuance costs which are amortized using the straight-line method (as the straight-line method is not materially different from the effective interest method) over the terms of the related debt agreements and are presented in the consolidated balance sheets as direct deductions from the balance of long-term debt. Issuance costs for undrawn credit facilities are recorded in other long-term assets in the consolidated balance sheets and are amortized over the term of the agreement using the straight-line method.
Property and Equipment
For the years ended December 31, 2023 and 2022, property and equipment, with the exception of leasehold improvements as further described below, were depreciated over their estimated useful lives using the declining balance method.
Leasehold improvements are depreciated using the straight-line method over the shorter of the estimated useful life of the asset or the remaining term of the lease.
Leases
Lessee-type leases
The Company leases real estate, computer hardware, and vehicles for use in its operations under both operating and finance leases. The Company assesses whether an arrangement is a lease or contains a lease at inception. For arrangements considered leases or that contain a lease that is accounted for separately, the Company determines the classification and initial measurement of the right-of-use asset and lease liability at the lease commencement date, which is the date that the underlying asset becomes available for use.
For both operating and finance leases, the Company recognizes a right-of-use asset, which represents its right to use the underlying asset for the lease term, and a lease liability, which represents the present value of the Company’s obligation to make payments arising over the lease term. The present value of the Company’s obligation to make payments is calculated using the incremental borrowing rate for operating and finance leases. The incremental borrowing rate is determined using a portfolio approach based on the rate of interest that the Company would have to pay to borrow an amount equal to the lease payments on a collateralized basis over a similar term. Management uses the unsecured borrowing rate and risk-adjusts that rate to approximate a collateralized rate, which is updated on an annual basis for the measurement of new lease liabilities.
In those circumstances where the Company is the lessee, we have elected to account for non-lease components associated with our leases (e.g., common area maintenance costs) and lease components as a single lease component for all of our asset classes.
Operating lease cost for operating leases is recognized on a straight-line basis over the term of the lease and is included in selling, general, and administrative expense in the Company’s consolidated statements of operations and comprehensive loss, based on the use of the facility on
43
which rent is being paid. Operating leases with a term of 12 months or less are not recorded on the balance sheet; and the Company recognizes rent expense for these leases on a straight-line basis over the lease term.
The Company recognizes the amortization of the right-of-use asset for its finance leases on a straight-line basis over the shorter of the term of the lease or the useful life of the right-of-use asset in depreciation and amortization expense in its consolidated statements of operations and comprehensive loss. The interest expense related to finance leases is recognized using the effective interest method based on the discount rate determined at lease commencement and is included within interest expense in the Company’s consolidated statements of operations and comprehensive loss.
Lessor-type leases
In addition to selling our products directly to customers, the Company has entered into a leasing arrangement as pre-combination a lessor for certain of its hardware devices as further described in Note 7 — Leases.
The Company assesses lessor-type leases in order to classify them as either operating or finance type leases, with finance-type lessor leases further divided into the categories of either sales-type leases or direct financing leases.
The determination for leases classified as sales-type are: (i) whether the lease transfers ownership of the equipment by the end of the lease term, (ii) whether the lease grants the customer an option to purchase the equipment and the customer is reasonably certain to do so, (iii) whether the lease term is for the major part of the economic life of the underlying equipment, (iv) whether the present value of the lease payments, and any residual value guaranteed by the customer that is not already reflected in the lease payments, is equal to or greater than substantially all of the fair market value of the equipment at the commencement of the lease, and (v) whether the equipment is specific to the customer and of such a specialized nature that it is expected to have no alternative use to the Company at the end of the lease term. Leasing arrangements meeting any of these conditions are accounted for as sales-type leases and revenue attributable to the lease component is recognized in a manner consistent with the equipment sales and the related equipment is derecognized with the associated expense presented as a cost of revenue.
Leasing arrangements that do not meet the criteria for classification as a sales-type lease will be accounted for as a direct-financing lease if the following two conditions are met: (i) the present value of the lease payments and any residual value guaranteed by the customer that is not already reflected in the lease payments and any other third party unrelated to the Company, is equal to or greater than substantially all of the fair market value of the equipment at the commencement of the lease, and (ii) it is probable that the Company will collect the lease payments and amounts necessary to satisfy a residual value guarantee.
Leasing arrangements that do not meet any of the finance-type lessor lease classification criteria are accounted for as operating leases and revenue is recognized straight-line over the term of the lease.
Internal Use Software
Certain costs of platform and software applications developed for internal use are capitalized as intangible assets. Capitalization of costs begins when two criteria are met: (i) the preliminary project stage is completed (i.e. application development stage) and (ii) it is probable that the software will be completed and used for its intended function. The Company also capitalizes costs related to specific upgrades and enhancements when it is probable the expenditure will result in additional functionality. Costs incurred for maintenance, minor upgrades and enhancements are recorded under selling, general, and administrative expenses in the consolidated statement of operations and comprehensive loss as incurred. Costs related to preliminary project activities and post-implementation operating activities are also recorded under selling, general, and administrative expenses in the consolidated statement of operations and comprehensive loss as incurred. The Company amortizes the capitalized costs on a straight-line basis over the useful life of the assets.
Intangible Assets
Identifiable intangible assets acquired individually or as part of a group of other assets are initially recognized and measured at cost. The cost of a group of intangible assets acquired in a transaction, including those acquired in a business combination that meet the specified criteria for recognition apart from goodwill, is the sum of the individual assets acquired based on their acquisition date fair values. The cost incurred to enhance the service potential of an intangible asset is capitalized as a betterment.
The Company capitalizes costs directly related to the design, deployment and enhancements of its internal operating support systems, including employee-related costs.
The Company amortizes amortizable intangible assets on a straight-line basis over their estimated useful lives.
Goodwill and Long-Lived Asset Impairment Testing
Goodwill is not amortized, but rather, is subject to impairment testing. The Company tests goodwill for impairment on an annual basis on October 1 of each year, or when events or changes in circumstances indicate that the carrying amount of goodwill may not be recoverable.
44
Goodwill and long-lived assets are tested for impairment at the reporting unit level, and the Company has been determined to be operating as a single reporting unit.
Business Combinations
The Company allocates the fair value of the consideration transferred to the assets acquired and liabilities assumed based on their fair values as of the acquisition date. The excess of the fair value of consideration transferred over the fair value of the assets acquired and liabilities assumed is recorded as goodwill. Acquisition-related expenses and restructuring costs are recognized separately from a business combination and are expensed as incurred. All changes in accounting acquirer under FASB’s ASC Topic 805, Business Combination (“ASC 805”).for deferred tax asset valuation allowances and acquired income tax uncertainties after the measurement period are recognized as a component of provision for income taxes. When determining the fair values of assets acquired and liabilities assumed, management makes significant estimates and assumptions, especially with respect to intangible assets. Critical estimates in valuing intangible assets include expected future cash flows based on consideration of future growth rates and margins, customer attrition rates, future changes in technology and brand awareness and discount rates. Fair value estimates are based on the assumptions management believes a market participant would use in pricing the asset or liability.
Contingent Liabilities
The Company has certain contingent liabilities that arise in the ordinary course of business activities. The Company accrues for loss contingencies when losses become probable and are reasonably estimable. If the reasonable estimate of the loss is a range and no amount within the range is a better estimate, the minimum amount of the range is recorded as a liability. The Company does not accrue for contingent losses that, in its judgment, are considered to be reasonably possible, but not probable; however, it discloses the range of such reasonably possible losses, if estimable.
Treasury Stock
Treasury stock is reflected as a reduction of stockholders’ equity at the cost to acquire the stock at its fair market value, which is determined as the closing price of the Company’s stock on the date of acquisition if purchased in a non-market transaction. Treasury stock purchased on the secondary market is reflected at the actual market purchase price.
Segments
Operating segments are defined as components of an entity for which separate financial information is available and that is regularly reviewed by the CODM in deciding how to allocate resources to the individual segment and in assessing performance. The Company’s CODM is its Chief Executive Officer. The Company has determined that it operates in one operating segment and one reportable segment, as the CODM reviews financial information presented on a consolidated basis for purposes of making operating decisions, allocating resources, and evaluating financial performance.
Revenue Recognition
The Company recognizes revenue when its customer obtains control of promised goods or services, in an amount that reflects the consideration to which the entity expects to be entitled in exchange for those goods or services. To determine the appropriate amount of revenue to be recognized for arrangements determined to be within the scope of ASC 606 — Revenue from Contracts with Customers (“ASC 606”), the Company applies the five step model: (i) identification of the contract(s) with a customer; (ii) identification of the performance obligations in the contract; (iii) determination of the transaction price; (iv) allocation of the transaction price to the performance obligations in the contract; and (v) recognition of revenue when (or as) the Company satisfies a performance obligation. The Company only applies the five-step model to contracts when it is probable that the entity will collect consideration it is entitled to in exchange for the goods or services it transfers to the customer.
The Company derives revenues primarily from IoT Connectivity and IoT Solutions.
IoT Connectivity
IoT Connectivity arrangements provide customers with secure and reliable wireless connectivity to mobile and fixed devices through various mobile network carriers. Revenue from IoT Connectivity consists of MRCs and overage/usage charges, and contracts are generally short-term in nature (i.e., month-to-month arrangements). Revenue for MRCs and overage/usage charges are recognized over time as the Company satisfies the performance obligation (generally starting when an enrolled device is activated on the Company’s platform). Most of the MRCs are billed monthly in advance (generally in the last week of a month); any amounts billed for which the service has not been provided as of the balance sheet dates are reported as a contract liability and components of deferred revenue.
Overage/usage charges are billed in arrears on a monthly cycle. Overage usage charges are evaluated on a monthly basis, and any overage/usage charges determined by management as unlikely to be collected due to a customer disputing the charge or due to a concession are reserved in the month billed and are not initially recognized as revenue. These amounts are netted against accounts receivable and reversed when credited to the
45
customer account, generally no longer than one to two months after initial billing. Reserved items are written off when deemed uncollectible or recognized as revenue if collected.
Certain IoT Connectivity customers also have the option to purchase products and/or equipment (e.g. SIM cards, routers, phones, or tablets) from the Company on an as needed basis. Product sales to IoT Connectivity customers are recognized when control is transferred to the customer, which is typically upon shipment of the product.
IoT Solutions
IoT Solutions arrangements include device solutions (including connectivity), deployment services, and/or technology-related professional services. Management evaluates each IoT Solutions arrangement to determine the contract for accounting acquirerpurposes. If a contract contains more than one performance obligation, consideration is allocated to each performance obligation based on standalone selling prices (“SSPs”). When available, the Company uses observable prices to determine SSPs. When observable prices are not available, SSPs are established that reflect the Company’s best estimates of what the selling price of the performance obligations would be if they were sold regularly on a stand-alone basis. The Company’s process for estimating SSPs without observable prices considers multiple factors that may vary depending upon the unique facts and circumstances related to each performance obligation including, where applicable, prices charged by the Company for similar offerings, market trends in the pricing for similar offerings, product-specific business objectives and the estimated cost to provide the performance obligation. Hardware, deployment services, and connectivity services generally have readily observable prices. The standalone selling price of the Company’s warehouse management services (which is associated with its bill-and-hold inventory and determined to be immaterial as discussed below) was determined using a cost-plus-margin approach with the primary assumptions including company profit objectives, internal cost structure, and current market trends.
Device and other hardware sales in IoT Solutions arrangements are generally accounted for as separate contracts since the customer is not obligated to purchase additional services when committing to the purchase of any products. Such sales are typically recognized upon shipment to the customer. However, in certain contracts, the customer has requested for the Company to hold the products ordered for later shipment to the customer’s remote location or to the customer’s end user as a part of a vendor managed inventory model. In these situations, management has concluded that transfer of control to the customer occurs prior to shipment. In these “bill-and-hold” arrangements, the right to invoice, transfer of legal title and transfer of the risk and rewards associated with the products occurs when the Company receives the hardware from a third-party vendor and has deemed it to be functional. Additionally, the products are identified both physically and systematically as belonging to a specific customer, are usable by the customer, and are only shipped, used, or disposed as directed by the specific customer. Based on these factors, management recognizes revenue on bill-and-hold hardware when the hardware is received by the Company and deemed functional. As part of the bill-and-hold arrangements, the Company performs a service related to the storage of the hardware. The Company has determined that any storage fees related to bill-and-hold inventory are immaterial to the consolidated financial statements taken as a whole.
IoT Solutions arrangements may also contain embedded leases for hardware used to fulfill services. A contract with a customer includes an embedded lease when the Company grants the customer a right to control the use of an identified asset for a period of time in exchange for consideration. Embedded leases with customers are typically recognized either as sales-type leases in which revenue and cost of sales is recognized upon lease commencement; or they may be recognized as operating leases in which revenue is recognized over the usage period. Where a contract contains an embedded lease, the contract’s transaction price is allocated to the contract performance obligations and the lease component based upon the relative standalone selling price.
Deployment services consist of the Company preparing hardware owned by a customer for use by a customer’s end user. Deployment and connectivity may both be included within a single IoT Solutions contract and are considered separate performance obligations. While consideration for deployment services is generally fixed when ordered by the client, consideration for connectivity services is variable and solely related to the connectivity services. Therefore, the fixed consideration is allocated to the deployment services and is recognized as revenue when the services are provided (i.e. when the related hardware is shipped to the customer). Connectivity within IoT Solutions contracts are recognized similar to the IoT Connectivity as described above, since such contracts are generally short term in nature and variability is resolved each month as the services are provided.
Professional services are generally provided over a contract term of one to two months. Revenue is recognized over time on an input method basis (typically, based on hours completed to date and an estimate of total hours to complete the project).
The Company estimates the transaction price based on the evaluationamount expected to be received for transferring the promised goods or services in the contract. The consideration may include fixed consideration or variable consideration. At the inception of each arrangement that includes variable consideration, the Company evaluates the amount of potential payment and the likelihood that the payments will be received. The Company utilizes either the most likely amount method or expected value method to estimate the amount expected to be received based on which method best predicts the amount expected to be received. The amount of variable consideration that is included in the transaction price may be constrained and is included in the transaction price only to the extent that it is probable that a significant reversal in the amount of the following facts and circumstances:cumulative revenue recognized will not occur in a future period.
46
KORE Group Holdings, Inc.
Notes to Consolidated Financial Statements
Product returns are recorded as a reduction to revenue based on anticipated sales returns that occur in the normal course of business and were immaterial for the years ended December 31, 2023 and 2022. The Company primarily has assurance-type warranties that do not result in separate performance obligations.
Contract Balances
Contract assets, or unbilled receivables, are recorded when the Company performs a service or transfers a good in advance of receiving consideration (the right to consideration is conditional on something other than the passage of time). Contract assets are classified as accounts receivable when the Company’s right to consideration is unconditional (only the passage of time is required before payment is due).
Contract liabilities, or deferred revenue, are recorded when the Company receives consideration (or has the unconditional right to receive consideration) in advance of performing a service or transferring a good. Deferred revenue primarily relates to revenue that is recognized over time for connectivity monthly recurring charges, the changes in balance of which are related to the satisfaction or partial satisfaction of these contracts. The balance also contains a deferral for goods that are in-transit at the period end for which control transfers to the customer upon delivery.
Taxes Collected from Customers and Remitted to Governmental Authorities
The Company excludes taxes assessed by governmental authorities that are both imposed on and concurrent with a specific revenue-producing transaction and collected from customers. Accordingly, such tax amounts are not included as a component of revenue or cost of revenue and are accrued in current liabilities until remitted to governmental authorities.
Practical Expedients
The Company applies ASC 606, utilizing the following allowable exemptions or practical expedients:
•Practical expedient not to disclose the unfulfilled performance obligation balance for contracts with an original length of one year or less.
•Practical expedient to recognize the incremental costs of obtaining a contract as an expense when incurred if the amortization period of the asset that the entity otherwise would have recognized is one year or less.
•Practical expedient to present revenue net of sales taxes and other similar taxes.
•Practical expedient from recognizing shipping and handling activities as a separate performance obligation.
•Practical expedient not requiring the entity to adjust the promised amount of consideration for the effects of a significant financing component if the entity expects, at contract inception, that the period between when the entity transfers a promised good or service to a customer and when the customer pays for that good or service will be one year or less.
Cost of revenue, exclusive of depreciation and amortization
Cost of revenue includes any cost of connectivity incurred with the Company’s carriers, as well as hardware products and materials and associated freight expense, and direct labor.
Selling, general, and administrative expenses
Selling, general, and administrative expenses include costs of the Company’s business not directly attributable to performing services or selling products that are not otherwise separately stated on the Company’s consolidated statements of operations and comprehensive loss. Such costs include salaries and benefits, professional services, and lease expenses.
Stock-based compensation
The Company sponsors an equity incentive plan that provides for the grant of various stock-based awards including time-vested restricted stock units and performance share units. The fair value of any such award is calculated on its grant date fair value, which for time-vested and performance share restricted stock units (excluding those with market conditions), is the market price on close of business of the grant date. The fair value of performance share units that include any market-based metrics is determined as of the grant date using either a Monte Carlo simulation or a binomial lattice valuation model. The Company recognizes compensation expense on a straight-line basis over the period the grant is earned by the employee, generally three years.
The Company assesses the likelihood of performance criteria being achieved for performance-based awards on a quarterly basis. If the Company determines that the performance criteria are probable of being achieved, the fair value of the award is expensed on a straight-line basis over the balance of the vesting period. In the event the Company determines it is no longer probable that it will achieve the minimum performance criteria specified in a performance-based award, the Company reverses all of the previously recognized compensation expense in the period such a determination is made.
47
KORE Group Holdings, Inc.
The Company accounts for forfeitures of stock-based compensation as any such forfeitures occur.
For the years ended December 31, 2023 and 2022, property and equipment, with the exception of leasehold improvements as further described below, were depreciated over their estimated useful lives using the declining balance method.
Leasehold improvements are depreciated using the straight-line method over the shorter of the estimated useful life of the asset or the remaining term of the lease.
Leases
Lessee-type leases
The functional currencyCompany leases real estate, computer hardware, and vehicles for use in its operations under both operating and finance leases. The Company assesses whether an arrangement is a lease or contains a lease at inception. For arrangements considered leases or that contain a lease that is accounted for separately, the Company determines the classification and initial measurement of the right-of-use asset and lease liability at the lease commencement date, which is the date that the underlying asset becomes available for use.
For both operating and finance leases, the Company recognizes a right-of-use asset, which represents its right to use the underlying asset for the lease term, and a lease liability, which represents the present value of the Company’s foreign subsidiaries is generallyobligation to make payments arising over the local currency. Any transactions recorded inlease term. The present value of the Company’s foreign subsidiaries denominated inobligation to make payments is calculated using the incremental borrowing rate for operating and finance leases. The incremental borrowing rate is determined using a currency other thanportfolio approach based on the local currency are remeasured using current exchange rates each reporting periodrate of interest that the Company would have to pay to borrow an amount equal to the lease payments on a collateralized basis over a similar term. Management uses the unsecured borrowing rate and risk-adjusts that rate to approximate a collateralized rate, which is updated on an annual basis for the measurement of new lease liabilities.
In those circumstances where the Company is the lessee, we have elected to account for non-lease components associated with our leases (e.g., common area maintenance costs) and lease components as a single lease component for all of our asset classes.
Operating lease cost for operating leases is recognized on a straight-line basis over the resulting unrealized gains or losses beingterm of the lease and is included in selling, general, and administrative expenses onexpense in the Company’s consolidated statements of operations. Such unrealized gainsoperations and losses primarily relate to intercompany balances and amounted to unrealized lossescomprehensive loss, based on the use of $0.3 million, $0.2 million and $1.4 million in 2021, 2020 and 2019, respectively.
43
KORE Group Holdings, Inc.
Notes to Consolidated Financial Statements
which rent is being paid. Operating leases with a foreign currencyterm of 12 months or less are translated into U.S. dollars at the exchange ratenot recorded on the balance sheet date. Revenuessheet; and expenses are translatedthe Company recognizes rent expense for these leases on a straight-line basis over the lease term.
The Company recognizes the amortization of the right-of-use asset for its finance leases on a straight-line basis over the shorter of the term of the lease or the useful life of the right-of-use asset in depreciation and amortization expense in its consolidated statements of operations and comprehensive loss. The interest expense related to finance leases is recognized using the effective interest method based on the discount rate determined at lease commencement and is included within interest expense in the Company’s consolidated statements of operations and comprehensive loss.
Lessor-type leases
In addition to selling our products directly to customers, the Company has entered into a leasing arrangement as a lessor for certain of its hardware devices as further described in Note 7 — Leases.
The Company assesses lessor-type leases in order to classify them as either operating or finance type leases, with finance-type lessor leases further divided into the categories of either sales-type leases or direct financing leases.
The determination for leases classified as sales-type are: (i) whether the lease transfers ownership of the equipment by the end of the lease term, (ii) whether the lease grants the customer an option to purchase the equipment and the customer is reasonably certain to do so, (iii) whether the lease term is for the major part of the economic life of the underlying equipment, (iv) whether the present value of the lease payments, and any residual value guaranteed by the customer that is not already reflected in the lease payments, is equal to or greater than substantially all of the fair market value of the equipment at the average exchange rate duringcommencement of the period. Equity transactionslease, and (v) whether the equipment is specific to the customer and of such a specialized nature that it is expected to have no alternative use to the Company at the end of the lease term. Leasing arrangements meeting any of these conditions are translated using historical exchange rates. Adjustments resulting from translating foreign functional currency financial statements into U.S. dollarsaccounted for as sales-type leases and revenue attributable to the lease component is recognized in a manner consistent with the equipment sales and the related equipment is derecognized with the associated expense presented as a cost of revenue.
Leasing arrangements that do not meet the criteria for classification as a sales-type lease will be accounted for as a direct-financing lease if the following two conditions are met: (i) the present value of the lease payments and any residual value guaranteed by the customer that is not already reflected in the lease payments and any other third party unrelated to the Company, is equal to or greater than substantially all of the fair market value of the equipment at the commencement of the lease, and (ii) it is probable that the Company will collect the lease payments and amounts necessary to satisfy a residual value guarantee.
Leasing arrangements that do not meet any of the finance-type lessor lease classification criteria are accounted for as operating leases and revenue is recognized straight-line over the term of the lease.
Internal Use Software
Certain costs of platform and software applications developed for internal use are capitalized as intangible assets. Capitalization of costs begins when two criteria are met: (i) the preliminary project stage is completed (i.e. application development stage) and (ii) it is probable that the software will be completed and used for its intended function. The Company also capitalizes costs related to specific upgrades and enhancements when it is probable the expenditure will result in additional functionality. Costs incurred for maintenance, minor upgrades and enhancements are recorded under selling, general, and administrative expenses in the consolidated statement of operations and comprehensive loss as incurred. Costs related to preliminary project activities and post-implementation operating activities are also recorded under selling, general, and administrative expenses in the consolidated statement of operations and comprehensive loss as incurred. The Company amortizes the capitalized costs on a straight-line basis over the useful life of the assets.
Intangible Assets
Identifiable intangible assets acquired individually or as part of a separategroup of other assets are initially recognized and measured at cost. The cost of a group of intangible assets acquired in a transaction, including those acquired in a business combination that meet the specified criteria for recognition apart from goodwill, is the sum of the individual assets acquired based on their acquisition date fair values. The cost incurred to enhance the service potential of an intangible asset is capitalized as a betterment.
The Company capitalizes costs directly related to the design, deployment and enhancements of its internal operating support systems, including employee-related costs.
The Company amortizes amortizable intangible assets on a straight-line basis over their estimated useful lives.
Goodwill and Long-Lived Asset Impairment Testing
Goodwill is not amortized, but rather, is subject to impairment testing. The Company tests goodwill for impairment on an annual basis on October 1 of each year, or when events or changes in circumstances indicate that the carrying amount of goodwill may not be recoverable.
44
Goodwill and long-lived assets are tested for impairment at the reporting unit level, and the Company has been determined to be operating as a single reporting unit.
Business Combinations
The Company allocates the fair value of the consideration transferred to the assets acquired and liabilities assumed based on their fair values as of the acquisition date. The excess of the fair value of consideration transferred over the fair value of the assets acquired and liabilities assumed is recorded as goodwill. Acquisition-related expenses and restructuring costs are recognized separately from a business combination and are expensed as incurred. All changes in accounting for deferred tax asset valuation allowances and acquired income tax uncertainties after the measurement period are recognized as a component of provision for income taxes. When determining the fair values of assets acquired and liabilities assumed, management makes significant estimates and assumptions, especially with respect to intangible assets. Critical estimates in valuing intangible assets include expected future cash flows based on consideration of future growth rates and margins, customer attrition rates, future changes in technology and brand awareness and discount rates. Fair value estimates are based on the assumptions management believes a market participant would use in pricing the asset or liability.
Contingent Liabilities
The Company has certain contingent liabilities that arise in the ordinary course of business activities. The Company accrues for loss contingencies when losses become probable and are reasonably estimable. If the reasonable estimate of the loss is a range and no amount within the range is a better estimate, the minimum amount of the range is recorded as a liability. The Company does not accrue for contingent losses that, in its judgment, are considered to be reasonably possible, but not probable; however, it discloses the range of such reasonably possible losses, if estimable.
Treasury Stock
Treasury stock is reflected as a reduction of stockholders’ equity and reportedat the cost to acquire the stock at its fair market value, which is determined as the closing price of the Company’s stock on the date of acquisition if purchased in a non-market transaction. Treasury stock purchased on the consolidated statements of comprehensive loss.
Segments
Operating segments are defined as components of an entity for which separate financial information is available and that is regularly reviewed by the Chief Operating Decision Maker (“CODM”)CODM in deciding how to allocate resources to the individual segment and in assessing performance. The Company’s CODM is its Chief Executive Officer. The Company has determined that it operates in one operating segment and one reportable segment, as the CODM reviews financial information presented on a consolidated basis for purposes of making operating decisions, allocating resources, and evaluating financial performance.
Revenue Recognition
The Company derives revenues primarily from IoT Connectivity and IoT Solutions.
IoT Connectivity
IoT Connectivity arrangements provide customers with secure and reliable wireless connectivity to mobile and fixed devices through various mobile network carriers. Revenue from IoT Connectivity consists of monthly recurring charges (“MRC’s”)MRCs and overage/usage charges, and contracts are generally short-term in nature (i.e.,arrangements). Revenue for MRC’sMRCs and overage/usage charges are recognized over time as the Company satisfies the performance obligation (generally starting when an enrolled device is activated on the Company’s platform). MRC’sMost of the MRCs are billed monthly in advance (generally in the last week of a month); any amounts billed for which the service has not been provided as of the balance sheet dates are reported as a contract liability and components of deferred revenue.
month-to-month
Overage/usage charges are billed in arrears on a monthly cycle. Overage/Overage usage charges are evaluated on a monthly basis, and any overage/usage charges determined by management as unlikely to be collected due to a customer disputing the charge or due to a concession are reserved.reserved in the month billed and are not initially recognized as revenue. These amounts are netted against accounts receivable and reversed when credited to the
45
customer account, generally no longer than one to two months after initial billing. Reserved items are written off when deemed uncollectible or recognized as revenue if collected.
Certain IoT Connectivity customers also have the option to purchase products and/or equipment (e.g. subscriber identification module or “SIM”SIM cards, routers, phones, or tablets) from the Company on an as needed basis. Product sales to IoT Connectivity customers are recognized when control is transferred to the customer, which is typically upon shipment of the product.
IoT Solutions
IoT Solutions arrangements includesinclude device solutions (including connectivity), deployment services, and/or technology-related professional services. Management evaluates each IoT Solutions arrangement to determine the contract for accounting purposes. If a contract contains more than one performance obligation, consideration is allocated to each performance obligation based on standalone selling prices (“SSPs”). When available, the Company uses observable prices to determine SSPs. When observable prices are not available, SSPs are established that reflect the Company’s best estimates of what the selling price of the performance obligations would be if they were sold regularly on a stand-alone basis. The Company’s process for estimating SSPs without observable prices considers multiple factors that may vary depending upon the unique facts and circumstances related to each performance obligation including, where applicable, prices charged by the Company for similar offerings, market trends in the pricing for similar offerings, product-specific business objectives and the estimated cost to provide the performance obligation. Hardware, deployment services, and connectivity services generally have readily observable prices. The standalone selling price of the Company’s warehouse management services (which is associated with its bill-and-hold inventory and determined to be immaterial as discussed below) was determined using a cost-plus-margin approach with the primary assumptions including company profit objectives, internal cost structure, and current market trends.
Device and other hardware sales in IoT Solutions arrangements are generally accounted for as separate contracts since the customer is not obligated to purchase additional services when committing to the purchase of any products. Such sales are typically recognized upon shipment to the customer. However, in certain contracts, the customer has requested for the Company to hold the products ordered for later shipment to the customer’s remote location or to the customer’s end user as a part of a vendor managed inventory model. In these situations, management has concluded that transfer of control to the customer occurs prior to shipment. In these “bill-and-hold” arrangements, the right to invoice, transfer of legal title and transfer of the risk and rewards associated with the products occurs when the Company receives the hardware from a third-party vendor and has deemed it to be functional. Additionally, the products are identified both physically and systematically as belonging to a specific customer, are usable by the customer, and are only shipped, used, or disposed as directed by the specific customer. Based on these factors, management recognizes revenue on bill-and-hold hardware when the hardware is received by the Company and deemed functional. As part of the bill-and-hold arrangements, the Company performs a service related to the storage of the hardware. The Company has determined that any storage feefees related to bill-and-hold inventory isare immaterial to the consolidated financial statements taken as a whole.
IoT Solutions arrangements may also contain embedded leases for hardware used to fulfill services. A contract with a customer includes an embedded lease when the Company grants the customer a right to control the use of an identified asset for a period of time in exchange for consideration. Embedded leases with customers are typically recognized either as sales-type leases in which revenue and cost of sales is recognized upon lease commencement; or they may be recognized as operating leases in which revenue is recognized over the usage period. Where a contract contains an embedded lease, the contract’s transaction price is allocated to the contract performance obligations and the lease component based upon the relative standalone selling price.
Deployment services consist of the Company preparing hardware owned by a customer for use by a customer’s end user. Deployment and connectivity may both be included within a single IoT Solutions contract and are considered separate performance obligations. While consideration for deployment services is generally fixed when ordered by the client, consideration for connectivity services is variable and solely related to the connectivity services. Therefore, the fixed consideration is allocated to the deployment services and is recognized as revenue when the services are provided (i.e. when the related hardware is shipped to the customer). Connectivity within IoT Solutions contracts are recognized similar to the IoT Connectivity as described above, since such contracts are generally short term in nature and variability is resolved each month as the services are provided.
Professional services are generally provided over a contract term of one to two months. Revenue is recognized over time on an input method basis (typically, based on hours completed to date and an estimate of total hours to complete the project).
The Company estimates the transaction price based on the amount expected to be received for transferring the promised goods or services in the contract. The consideration may include fixed consideration or variable consideration. At the inception of each arrangement that includes variable consideration, the Company evaluates the amount of potential payment and the likelihood that the payments will be received. The Company utilizes either the most likely amount method or expected value method to estimate the amount expected to be received based on which method best predicts the amount expected to be received. The amount of variable consideration that is included in the transaction price may be constrained and is included in the transaction price only to the extent that it is probable that a significant reversal in the amount of the cumulative revenue recognized will not occur in a future period.
46
KORE Group Holdings, Inc.
Notes to Consolidated Financial Statements
Product returns are recorded as a reduction to revenue based on anticipated sales returns that occur in the normal course of business and arewere immaterial for the years ended December 31, 2021, 2020,2023 and 2019, respectively.2022. The Company primarily has assurance-type warranties that do not result in separate performance obligations.
Contract liabilities, or deferred revenue, are recorded when the Company receives consideration (or has the unconditional right to receive consideration) in advance of performing a service or transferring a good. Deferred revenue primarily relates to revenue that is recognized over time for connectivity monthly recurring charges, the changes in balance of which are related to obtainingthe satisfaction or partial satisfaction of these contracts. The balance also contains a contract with amortization periods greater than one yeardeferral for any ofgoods that are in-transit at the years presented.
Taxes Collected from Customers and Remitted to two months after initial billing.
The Company excludes taxes assessed by governmental authorities that are both imposed on and concurrent with a specific revenue-producing transaction and collected from customers. Accordingly, such tax amounts are not included as a component of revenue or cost of revenue and are accrued in current liabilities until remitted to governmental authorities.
Practical Expedients
The Company applies ASC 606, utilizing the following allowable exemptions or practical expedients:
•Practical expedient to recognize the dateincremental costs of purchase orobtaining a contract as an expense when incurred if the ability to redeem amounts on demand. Cash and cash equivalents are stated at cost, which approximates their fair value.
•Practical expedient to present revenue net of sales taxes and cash equivalents are held. The Company has noother similar taxes.
Cost of revenue, exclusive of depreciation and amortization
Cost of revenue includes any cost of connectivity incurred with the balance not expected to be collected. All accounts or portions thereof considered uncollectible or require excessive collection costs are written off to the allowance for doubtful accountsCompany’s carriers, as well as hardware products and recorded under selling,materials and associated freight expense, and direct labor.
Selling, general, and administrative expenses
Selling, general, and administrative expenses include costs of the Company’s business not directly attributable to performing services or selling products that are not otherwise separately stated on the Company’s consolidated statements of operations and comprehensive loss. Such costs include salaries and benefits, professional services, and lease expenses.
Stock-based compensation
The Company sponsors an equity incentive plan that provides for the grant of various stock-based awards including time-vested restricted stock units and performance share units. The fair value of any such award is calculated on its grant date fair value, which for time-vested and performance share restricted stock units (excluding those with market conditions), is the market price on close of business of the grant date. The fair value of performance share units that include any market-based metrics is determined as of the grant date using either a Monte Carlo simulation or a binomial lattice valuation model. The Company recognizes compensation expense on a straight-line basis over the period the grant is earned by the employee, generally three years.
The Company assesses the likelihood of performance criteria being achieved for performance-based awards on a quarterly basis. If the Company determines that the performance criteria are probable of being achieved, the fair value of the award is expensed on a straight-line basis over the balance of the vesting period. In the event the Company determines it is no longer probable that it will achieve the minimum performance criteria specified in a performance-based award, the Company reverses all of the previously recognized compensation expense in the consolidated statements of operations. The Company incurred bad debt expense of $0.3 million, $0.6 million and $0.9 million for the years ended December 31, 2021, 2020 and 2019, respectively. As of December 31, 2021 and 2020, the Company reduced accounts receivable forperiod such a valuation allowance for bad debt expense of $0.5determination is made.
47
Property and Equipment
Leases
Lessee-type leases
The Company includesleases real estate, computer softwarehardware, and vehicles for use in propertyits operations under both operating and equipment asfinance leases. The Company assesses whether an arrangement is a lease or contains a lease at inception. For arrangements considered leases or that contain a lease that is accounted for separately, the software is integral to enablingCompany determines the functioningclassification and initial measurement of the hardware.
In those circumstances where the Company is the lessee, we have elected to account for non-lease components associated with our leases (e.g., common area maintenance costs) and lease components as a single lease component for all of our asset classes.
Operating lease cost for operating leases is recognized on a straight-line basis over the term of the assets. All otherlease and is included in selling, general, and administrative expense in the Company’s consolidated statements of operations and comprehensive loss, based on the use of the facility on
43
which rent is being paid. Operating leases with a term of 12 months or less are classified as operatingnot recorded on the balance sheet; and the Company recognizes rent expense for these leases and leasing costs, including any rent holidays, leasehold incentives and rent concessions, are recorded on a straight-line basis over the lease term.
The Company recognizes the amortization of the right-of-use asset for its finance leases on a straight-line basis over the shorter of the term under selling, generalof the lease or the useful life of the right-of-use asset in depreciation and administrativeamortization expense in its consolidated statements of operations and comprehensive loss. The interest expense related to finance leases is recognized using the effective interest method based on the discount rate determined at lease commencement and is included within interest expense in the Company’s consolidated statementstatements of operations.
Lessor-type leases
In addition to selling our products directly to customers, the Company has entered into a leasing arrangement as a lessor for certain of its hardware devices as further described in Note 7 — Leases.
The Company assesses lessor-type leases in order to classify them as either operating or finance type leases, with finance-type lessor leases further divided into the categories of either sales-type leases or direct financing leases.
The determination for leases classified as sales-type are: (i) whether the lease transfers ownership of the equipment by the end of the lease term, (ii) whether the lease grants the customer an option to purchase the equipment and the customer is reasonably certain to do so, (iii) whether the lease term is for the major part of the economic life of the underlying equipment, (iv) whether the present value of the lease payments, and any residual value guaranteed by the customer that is not already reflected in the lease payments, is equal to or greater than substantially all of the fair market value of the equipment at the commencement of the lease, and (v) whether the equipment is specific to the customer and of such a specialized nature that it is expected to have no alternative use to the Company at the end of the lease term. Leasing arrangements meeting any of these conditions are accounted for as sales-type leases and revenue attributable to the lease component is recognized in a manner consistent with the equipment sales and the related equipment is derecognized with the associated expense presented as a cost of revenue.
Leasing arrangements that do not meet the criteria for classification as a sales-type lease will be accounted for as a direct-financing lease if the following two conditions are met: (i) the present value of the lease payments and any residual value guaranteed by the customer that is not already reflected in the lease payments and any other third party unrelated to the Company, is equal to or greater than substantially all of the fair market value of the equipment at the commencement of the lease, and (ii) it is probable that the Company will collect the lease payments and amounts necessary to satisfy a residual value guarantee.
Leasing arrangements that do not meet any of the finance-type lessor lease classification criteria are accounted for as operating leases and revenue is recognized straight-line over the term of the lease.
Internal Use Software
Certain costs of platform and software applications developed for internal use are capitalized as intangible assets. Capitalization of costs begins when two criteria are met: (i) the preliminary project stage is completed (i.e. application development stage) and (ii) it is probable that the software will be completed and used for its intended function. The Company also capitalizes costs related to specific upgrades and enhancements when it is probable the expendituresexpenditure will result in additional functionality. Costs incurred for maintenance, minor upgrades and enhancements are recorded under selling, general, and administrative expenseexpenses in the consolidated statement of operations and comprehensive loss as incurred. Costs related to preliminary project activities and postimplementationpost-implementation operating activities are also recorded under selling, general, and administrative expenseexpenses in the consolidated statement of operations and comprehensive loss as incurred. The Company amortizes the capitalized costs on a straight-line basis over the useful life of the asset. Referassets.
Intangible Assets
Identifiable intangible assets acquired individually or as part of a group of other assets are initially recognized and measured at cost. The cost of a group of intangible assets acquired in a transaction, including those acquired in a business combination that meet the specified criteria for recognition apart from goodwill, is the sum of the individual assets acquired based on their acquisition date fair values. The cost incurred to “Note 7, enhance the service potential of an intangible asset is capitalized as a betterment.
The Company capitalizes costs directly related to the design, deployment and enhancements of its internal operating support systems, including employee-related costs.
The Company amortizes amortizable intangible assets on a straight-line basis over their estimated useful lives.
Goodwill and Other Intangible Assets”Long-Lived Asset Impairment Testing
Goodwill is not amortized, but rather, is subject to impairment testing. The Company tests goodwill for impairment on an annual basis on October 1 of each year, or when events or changes in circumstances indicate that the consolidated financial statements, for further detailcarrying amount of the Company’s average useful lives for capitalized internal use computer software.
44
Goodwill and long-lived assets are tested for impairment at the reporting unit level, and the Company has been determined to be operating as a single reporting unit.
Business Combinations
The Company allocates the fair value of the consideration transferred to the assets acquired and liabilities assumed based on their fair values atas of the acquisition date. The excess of the fair value of consideration transferred over the fair value of the assets acquired and liabilities assumed is recorded as goodwill. Acquisition-related expenses and restructuring costs are recognized separately from thea business combination and are expensed as incurred. All changes in accounting for deferred tax asset valuation allowances and acquired income tax uncertainties after the measurement period are recognized as a component of provision for income taxes. When determining the fair values of assets acquired and liabilities assumed, management makes significant estimates and assumptions, especially with respect to intangible assets. Critical estimates in valuing intangible assets include expected future cash flows based on consideration of future growth rates and margins, customer attrition rates, future changes in technology and brand awareness and discount rates. Fair value estimates are based on the assumptions management believes a market participant would use in pricing the asset or liability. While
Contingent Liabilities
The Company has certain contingent liabilities that arise in the ordinary course of business activities. The Company accrues for loss contingencies when losses become probable and are reasonably estimable. If the reasonable estimate of the loss is a range and no amount within the range is a better estimate, the minimum amount of the range is recorded as a liability. The Company does not accrue for contingent losses that, in its judgment, are considered to be reasonably possible, but not probable; however, it discloses the range of such reasonably possible losses, if estimable.
Treasury Stock
Treasury stock is reflected as a reduction of stockholders’ equity at the cost to acquire the stock at its fair market value, which is determined as the closing price of the Company’s stock on the date of acquisition if purchased in a non-market transaction. Treasury stock purchased on the secondary market is reflected at the actual market purchase price.
Segments
Operating segments are defined as components of an entity for which separate financial information is available and that is regularly reviewed by the CODM in deciding how to allocate resources to the individual segment and in assessing performance. The Company’s CODM is its Chief Executive Officer. The Company has determined that it operates in one operating segment and one reportable segment, as the CODM reviews financial information presented on a consolidated basis for purposes of making operating decisions, allocating resources, and evaluating financial performance.
Revenue Recognition
The Company recognizes revenue when its customer obtains control of promised goods or services, in an amount that reflects the consideration to which the entity expects to be entitled in exchange for those goods or services. To determine the appropriate amount of revenue to be recognized for arrangements determined to be within the scope of ASC 606 — Revenue from Contracts with Customers (“ASC 606”), the Company applies the five step model: (i) identification of the contract(s) with a customer; (ii) identification of the performance obligations in the contract; (iii) determination of the transaction price; (iv) allocation of the transaction price to the performance obligations in the contract; and (v) recognition of revenue when (or as) the Company satisfies a performance obligation. The Company only applies the five-step model to contracts when it is probable that the entity will collect consideration it is entitled to in exchange for the goods or services it transfers to the customer.
The Company derives revenues primarily from IoT Connectivity and IoT Solutions.
IoT Connectivity
IoT Connectivity arrangements provide customers with secure and reliable wireless connectivity to mobile and fixed devices through various mobile network carriers. Revenue from IoT Connectivity consists of MRCs and overage/usage charges, and contracts are generally short-term in nature (i.e., month-to-month arrangements). Revenue for MRCs and overage/usage charges are recognized over time as the Company satisfies the performance obligation (generally starting when an enrolled device is activated on the Company’s platform). Most of the MRCs are billed monthly in advance (generally in the last week of a month); any amounts billed for which the service has not been provided as of the balance sheet dates are reported as a contract liability and components of deferred revenue.
Overage/usage charges are billed in arrears on a monthly cycle. Overage usage charges are evaluated on a monthly basis, and any overage/usage charges determined by management as unlikely to be collected due to a customer disputing the charge or due to a concession are reserved in the month billed and are not initially recognized as revenue. These amounts are netted against accounts receivable and reversed when credited to the
45
customer account, generally no longer than one to two months after initial billing. Reserved items are written off when deemed uncollectible or recognized as revenue if collected.
Certain IoT Connectivity customers also have the option to purchase products and/or equipment (e.g. SIM cards, routers, phones, or tablets) from the Company on an as needed basis. Product sales to IoT Connectivity customers are recognized when control is transferred to the customer, which is typically upon shipment of the product.
IoT Solutions
IoT Solutions arrangements include device solutions (including connectivity), deployment services, and/or technology-related professional services. Management evaluates each IoT Solutions arrangement to determine the contract for accounting purposes. If a contract contains more than one performance obligation, consideration is allocated to each performance obligation based on standalone selling prices (“SSPs”). When available, the Company uses itsobservable prices to determine SSPs. When observable prices are not available, SSPs are established that reflect the Company’s best estimates of what the selling price of the performance obligations would be if they were sold regularly on a stand-alone basis. The Company’s process for estimating SSPs without observable prices considers multiple factors that may vary depending upon the unique facts and circumstances related to each performance obligation including, where applicable, prices charged by the Company for similar offerings, market trends in the pricing for similar offerings, product-specific business objectives and the estimated cost to provide the performance obligation. Hardware, deployment services, and connectivity services generally have readily observable prices. The standalone selling price of the Company’s warehouse management services (which is associated with its bill-and-hold inventory and determined to be immaterial as discussed below) was determined using a cost-plus-margin approach with the primary assumptions including company profit objectives, internal cost structure, and current market trends.
Device and other hardware sales in IoT Solutions arrangements are generally accounted for as separate contracts since the customer is not obligated to purchase additional services when committing to the purchase of any products. Such sales are typically recognized upon shipment to the customer. However, in certain contracts, the customer has requested for the Company to hold the products ordered for later shipment to the customer’s remote location or to the customer’s end user as a part of a vendor managed inventory model. In these situations, management has concluded that transfer of control to the purchase price allocation processcustomer occurs prior to accurately value assets acquiredshipment. In these “bill-and-hold” arrangements, the right to invoice, transfer of legal title and liabilities assumed astransfer of the business combination date, its estimatesrisk and assumptions are inherently uncertain and subject to refinement. As a result, duringrewards associated with the preliminary purchase price measurement period, which may be up to one year from the business
hardware. The Company has determined the estimated fair value of its financial instruments based on appropriate valuation methodologies; however, considerable judgment is requiredthat any storage fees related to develop these estimates. Accordingly, these estimated fair valuesbill-and-hold inventory are not necessarily indicative of the amounts the Company could realize in a current market exchange. The estimated fair values can be materially affected by using different assumptions or methodologies. The methods and assumptions used in estimating the fair values of financial instruments are based on carrying values and future cash flows.
IoT Solutions arrangements may also contain embedded leases for hardware used to fulfill services. A contract with a customer includes an embedded lease when the Company grants the customer a right to control the use of an identified asset for a period of time in exchange for consideration. Embedded leases with customers are typically recognized either as sales-type leases in which revenue and cost of sales is recognized upon lease commencement; or they may be recognized as operating leases in which revenue is recognized over the usage period. Where a contract contains an embedded lease, the contract’s transaction price is allocated to the contract performance obligations and the lease component based upon the relative standalone selling price.
Deployment services consist of the Company preparing hardware owned by a customer for use by a customer’s end user. Deployment and connectivity may both be included within a single IoT Solutions contract and are considered separate performance obligations. While consideration for deployment services is generally fixed when ordered by the client, consideration for connectivity services is variable and solely related to the connectivity services. Therefore, the fixed consideration is allocated to the deployment services and is recognized as revenue when the services are provided (i.e. when the related hardware is shipped to the customer). Connectivity within IoT Solutions contracts are recognized similar to the IoT Connectivity as described above, since such contracts are generally short term in nature and variability is resolved each month as the services are provided.
Professional services are generally provided over a contract term of one to two months. Revenue is recognized over time on an input method basis (typically, based on hours completed to date and an estimate of total hours to complete the project).
The Company estimates the transaction price based on the amount expected to be received for transferring the promised goods or services in the contract. The consideration may include fixed consideration or variable consideration. At the inception of each arrangement that includes variable consideration, the Company evaluates the amount of potential payment and the likelihood that the payments will be received. The Company utilizes either the most likely amount method or expected value method to estimate the amount expected to be received based on which method best predicts the amount expected to be received. The amount of variable consideration that is included in the transaction price may be constrained and is included in the transaction price only to the extent that it is probable that a significant reversal in the amount of the cumulative revenue recognized will not occur in a future period.
Contract Balances
Contract assets, or unbilled receivables, are recorded when the Company additional time to complete the annual impairment test of goodwillperforms a service or transfers a good in advance of our year end reporting. Thereceiving consideration (the right to consideration is conditional on something other than the passage of time). Contract assets are classified as accounts receivable when the Company’s right to consideration is unconditional (only the passage of time is required before payment is due).
Contract liabilities, or deferred revenue, are recorded when the Company will continuereceives consideration (or has the unconditional right to perform interim impairment testing should circumstancesreceive consideration) in advance of performing a service or events require. This change does not resulttransferring a good. Deferred revenue primarily relates to revenue that is recognized over time for connectivity monthly recurring charges, the changes in a delay, acceleration, or avoidancebalance of an impairment charge. This change was applied prospectively in 2021 because it was impracticable to apply it retrospectively duewhich are related to the difficulty in making estimatessatisfaction or partial satisfaction of these contracts. The balance also contains a deferral for goods that are in-transit at the period end for which control transfers to the customer upon delivery.
Taxes Collected from Customers and assumptions without using hindsight.
The Company reviews long-lived assets,excludes taxes assessed by governmental authorities that are both imposed on and concurrent with a specific revenue-producing transaction and collected from customers. Accordingly, such tax amounts are not included as propertya component of revenue or cost of revenue and equipment, and purchased intangibles subjectare accrued in current liabilities until remitted to governmental authorities.
Practical Expedients
The Company applies ASC 606, utilizing the following allowable exemptions or practical expedients:
•Practical expedient not to disclose the unfulfilled performance obligation balance for contracts with an original length of one year or less.
•Practical expedient to recognize the incremental costs of obtaining a contract as an expense when incurred if the amortization for impairment whenever events or changes in circumstances indicate that the carrying amount of an asset may not be recoverable. Recoverability of assets to be held and used is measured by a comparison of the carrying amount of an asset to the estimated undiscounted future cash flows expected to be generated by the asset. If the carrying amount of an asset exceeds its estimated future cash flows, an impairment charge is recognized for the amount by which the carrying amountperiod of the asset exceedsthat the entity otherwise would have recognized is one year or less.
•Practical expedient to present revenue net of sales taxes and other similar taxes.
•Practical expedient from recognizing shipping and handling activities as a separate performance obligation.
•Practical expedient not requiring the entity to adjust the promised amount of consideration for the effects of a significant financing component if the entity expects, at contract inception, that the period between when the entity transfers a promised good or service to a customer and when the customer pays for that good or service will be one year or less.
Cost of revenue, exclusive of depreciation and amortization
Cost of revenue includes any cost of connectivity incurred with the Company’s carriers, as well as hardware products and materials and associated freight expense, and direct labor.
Selling, general, and administrative expenses
Selling, general, and administrative expenses include costs of the Company’s business not directly attributable to performing services or selling products that are not otherwise separately stated on the Company’s consolidated statements of operations and comprehensive loss. Such costs include salaries and benefits, professional services, and lease expenses.
Stock-based compensation
The Company sponsors an equity incentive plan that provides for the grant of various stock-based awards including time-vested restricted stock units and performance share units. The fair value of any such award is calculated on its grant date fair value, which for time-vested and performance share restricted stock units (excluding those with market conditions), is the market price on close of business of the grant date. The fair value of performance share units that include any market-based metrics is determined as of the grant date using either a Monte Carlo simulation or a binomial lattice valuation model. The Company recognizes compensation expense on a straight-line basis over the period the grant is earned by the employee, generally three years.
The Company assesses the likelihood of performance criteria being achieved for performance-based awards on a quarterly basis. If the Company determines that the performance criteria are probable of being achieved, the fair value of the asset. Assetsaward is expensed on a straight-line basis over the balance of the vesting period. In the event the Company determines it is no longer probable that it will achieve the minimum performance criteria specified in a performance-based award, the Company reverses all of the previously recognized compensation expense in the period such a determination is made.
47
The Company accounts for forfeitures of by sale would be separately presentedstock-based compensation as any such forfeitures occur.
Foreign Currency
The functional currency of the Company’s foreign subsidiaries is generally the local currency. Any transactions recorded in the Company’s foreign subsidiaries denominated in a currency other than the local currency are remeasured using current exchange rates each reporting period with the resulting unrealized gains or losses of $0.1 million and $1.8 million being included in selling, general, and administrative expenses in the consolidated balance sheetstatements of operations and reported atcomprehensive loss for the lower of the carrying amount or fair value less costs to sellyears ended December 31, 2023 and are no longer depreciated. The2022.
For consolidation purposes, all assets and liabilities ofdenominated in a group classified as held for sale would be presented separately inforeign currency are translated into U.S. dollars at the appropriate asset and liability sections of the consolidated balance sheet. There were no assets classified as held for sale at any ofexchange rate on the balance sheet dates presented.
Income Taxes
The Company provides for income taxes under the asset and liability method. Deferred tax assets and liabilities are recognized for the future tax consequences attributable to differences between the financial statement carrying amounts of existing assets and liabilities and their respective tax bases. Deferred tax assets and liabilities are measured using enacted tax rates expected to apply to taxable income in the years in which those temporary differences are expected to be recovered or settled. The Company recognizedrecognizes the effect of income tax positions only if those positions are more likely than not to be sustained. Recognized income tax positions are measured at the largest amount that is greater than 50% likely to be realized. The effect on deferred tax assets and liabilities of a change in tax rates is recognized in income in the year that includes the date of enactment. A valuation allowance is recorded to reduce deferred tax assets to an amount, which, in the opinion of management, is more likely than not to be realized. The Company considers factors such as the cumulative income or loss in recent years; reversal of any deferred tax liabilities; projected future taxable income exclusive of temporary differences; the character of the income tax asset, including income tax positions; tax planning strategies and other factors in the determination of the valuation allowance.
Earnings (Loss) Per Share
The Company calculates basicapplies the treasury stock method to determine the dilutive effect of potentially dilutive securities, including warrants, and diluted earnings/(loss) per common share.
Recently Adopted Accounting Pronouncements
Previous Filings | After Correction | |||||||||||||||
2021 | 2020 | 2021 | 2020 | |||||||||||||
(unaudited) | (unaudited) | (unaudited) | (unaudited) | |||||||||||||
Three months Ended September 30, | ||||||||||||||||
Net loss attributable to common shareholders | $ | (8,331 | ) | $ | (12,787 | ) | $ | (8,331 | ) | $ | (12,787 | ) | ||||
Loss per share: | ||||||||||||||||
Basic | $ | (0.27 | ) | $ | (0.42 | ) | $ | (0.26 | ) | $ | (0.40 | ) | ||||
Diluted | $ | (0.27 | ) | $ | (0.42 | ) | $ | (0.26 | ) | $ | (0.40 | ) | ||||
Weighted-average shares outstanding: | ||||||||||||||||
Basic | 30,732,921 | 30,281,520 | 32,098,715 | 31,647,131 | ||||||||||||
Diluted | 30,732,921 | 30,281,520 | 32,098,715 | 31,647,131 | ||||||||||||
Previous Filings | After Correction | |||||||||||||||
2021 | 2020 | 2021 | 2020 | |||||||||||||
(unaudited) | (unaudited) | (unaudited) | (unaudited) | |||||||||||||
Nine months Ended September 30, | ||||||||||||||||
Net loss attributable to common shareholders | $ | (31,222 | ) | $ | (39,966 | ) | $ | (31,222 | ) | $ | (39,966 | ) | ||||
Net loss per share | ||||||||||||||||
Basic | $ | (1.03 | ) | $ | (1.32 | ) | $ | (0.98 | ) | $ | (1.26 | ) | ||||
Diluted | $ | (1.03 | ) | $ | (1.32 | ) | $ | (0.98 | ) | $ | (1.26 | ) | ||||
Weighted-average shares outstanding: | ||||||||||||||||
Basic | 30,433,641 | 30,285,684 | 31,799,313 | 31,651,295 | ||||||||||||
Diluted | 30,433,641 | 30,285,684 | 31,799,313 | 31,651,295 | ||||||||||||
ASU 2022-04, Liabilities—Supplier Finance Programs (Topic 405-50) - Disclosure of Supplier Finance Program Obligations
In August 2018,September 2022, the FASB issued ASU 2018-15,Customer’s Accounting for Implementation Costs IncurredNo. 2022-04, “Liabilities—Supplier Finance Programs (Topic 405-50) - Disclosure of Supplier Finance Program Obligations,” to enhance the transparency of supplier finance programs used by an entity in a Cloud Computing Arrangement That Is a Service Contract, which requires a customer in a hosting arrangement that is a service contract to applyconnection with the guidance on internal-use software to determine which implementation costs to recognize as an assetpurchase of goods and which costs to expense. Costs to develop or obtain internal-use software that cannot be capitalized under Subtopic 350-40,Internal-UseSoftware, such as training costs and certain data conversion costs, also cannot be capitalized for a hosting arrangement that is a service contract. The amendments require a customer in a hosting arrangement that is a service contract to determine whether an implementation activity relates to the preliminary project stage, the application development stage, or the post-implementation stage. Costs for implementation activities in the application development stage will be capitalized depending on the nature of the costs, while costs incurred during the preliminary project and post-implementation stages will be expensed immediately. Theservices. ASU No. 2022-04 is effective for the Companyall companies for annual reporting periodsfiscal years beginning after December 15, 2020, and2022, including interim periods within annual periodsthose fiscal years, except for the required rollforward information, which is effective for fiscal years beginning after December 15, 2021.2023. Early adoption is permitted, includingwas permitted. During the fiscal year of adoption, ASU 2022-04 requires information on the key terms of the program(s) and the balance sheet presentation of the program obligations, which are annual disclosure requirements, to be disclosed in anyeach interim period, for all entities.period. The Company adopted this standardASU 2022-04, on January 1, 2023.
In each annual reporting period, the Company is required to disclose the following information:
1. The key terms of the program, including a description of the payment terms (including payment timing and basis for its determination) and assets pledged as security or other forms of guarantees provided for the committed payment to the finance provider or intermediary.
2. For the obligations that the Company has confirmed as valid to the finance provider or intermediary:
a. The amount outstanding that remains unpaid by the Company as of January 1, 2021. The adoptionthe end of the standard did not have a material impact onannual period (the “outstanding confirmed amount”);
b. A description of where those obligations are presented in the Company’s consolidated financial statementsbalance sheet;
c. A rollforward of those obligations during the annual period, including the amount of obligations confirmed and related disclosures.the amount of obligations subsequently paid.
48
In each interim reporting period (subject to the applicable transition guidance as described above in the initial year of adoption), the Company is required to disclose the amount of obligations outstanding that it has confirmed as valid to the finance provider or intermediary as of the end of the interim period.
The guidance does not affect the recognition, measurement, or financial statement presentation of obligations covered by supplier finance programs.
Contract Balances
Contract assets, or unbilled receivables, are recorded when the Company performs a service or transfers a good in advance of receiving consideration (the right to consideration is conditional on something other than the passage of time). Contract assets are classified as accounts receivable when the Company’s right to consideration is unconditional (only the passage of time is required before payment is due).
Contract liabilities, or deferred revenue, are recorded when the Company receives consideration (or has the unconditional right to receive consideration) in advance of performing a service or transferring a good. Deferred revenue primarily relates to revenue that is recognized over time for connectivity monthly recurring charges, the changes in balance of which are related to the satisfaction or partial satisfaction of these contracts. The balance also contains a deferral for goods that are in-transit at the period end for which control transfers to the customer upon delivery.
Taxes Collected from Customers and Remitted to Governmental Authorities
The Company excludes taxes assessed by governmental authorities that are both imposed on and concurrent with a specific revenue-producing transaction and collected from customers. Accordingly, such tax amounts are not included as a component of revenue or cost of revenue and are accrued in current liabilities until remitted to governmental authorities.
Practical Expedients
The Company applies ASC 606, utilizing the following allowable exemptions or practical expedients:
•Practical expedient not to disclose the unfulfilled performance obligation balance for contracts with an original length of one year or less.
•Practical expedient to recognize the incremental costs of obtaining a contract as an expense when incurred if the amortization period of the asset that the entity otherwise would have recognized is one year or less.
•Practical expedient to present revenue net of sales taxes and other similar taxes.
•Practical expedient from recognizing shipping and handling activities as a separate performance obligation.
•Practical expedient not requiring the entity to adjust the promised amount of consideration for the effects of a significant financing component if the entity expects, at contract inception, that the period between when the entity transfers a promised good or service to a customer and when the customer pays for that good or service will be one year or less.
Cost of revenue, exclusive of depreciation and amortization
Cost of revenue includes any cost of connectivity incurred with the Company’s carriers, as well as hardware products and materials and associated freight expense, and direct labor.
Selling, general, and administrative expenses
Selling, general, and administrative expenses include costs of the Company’s business not directly attributable to performing services or selling products that are not otherwise separately stated on the Company’s consolidated statements of operations and comprehensive loss. Such costs include salaries and benefits, professional services, and lease expenses.
Stock-based compensation
The Company sponsors an equity incentive plan that provides for the grant of various stock-based awards including time-vested restricted stock units and performance share units. The fair value of any such award is calculated on its grant date fair value, which for time-vested and performance share restricted stock units (excluding those with market conditions), is the market price on close of business of the grant date. The fair value of performance share units that include any market-based metrics is determined as of the grant date using either a Monte Carlo simulation or a binomial lattice valuation model. The Company recognizes compensation expense on a straight-line basis over the period the grant is earned by the employee, generally three years.
The Company assesses the likelihood of performance criteria being achieved for performance-based awards on a quarterly basis. If the Company determines that the performance criteria are probable of being achieved, the fair value of the award is expensed on a straight-line basis over the balance of the vesting period. In the event the Company determines it is no longer probable that it will achieve the minimum performance criteria specified in a performance-based award, the Company reverses all of the previously recognized compensation expense in the period such a determination is made.
47
The Company accounts for forfeitures of stock-based compensation as any such forfeitures occur.
Foreign Currency
The functional currency of the Company’s foreign subsidiaries is generally the local currency. Any transactions recorded in the Company’s foreign subsidiaries denominated in a currency other than the local currency are remeasured using current exchange rates each reporting period with the resulting unrealized gains or losses of $0.1 million and $1.8 million being included in selling, general, and administrative expenses in the consolidated statements of operations and comprehensive loss for the years ended December 31, 2023 and 2022.
For consolidation purposes, all assets and liabilities denominated in a foreign currency are translated into U.S. dollars at the exchange rate on the balance sheet date. Revenues and expenses are translated at the average exchange rate during the period. Equity transactions are translated using historical exchange rates. Adjustments resulting from translating foreign functional currency financial statements into U.S. dollars are recorded as part of a separate component of stockholders’ equity and reported in the consolidated statements of operations and comprehensive loss.
Income Taxes
The Company provides for income taxes under the asset and liability method. Deferred tax assets and liabilities are recognized for the future tax consequences attributable to differences between the financial statement carrying amounts of existing assets and liabilities and their respective tax bases. Deferred tax assets and liabilities are measured using enacted tax rates expected to apply to taxable income in the years in which those temporary differences are expected to be recovered or settled. The Company recognizes the effect of income tax positions only if those positions are more likely than not to be sustained. Recognized income tax positions are measured at the largest amount that is greater than 50% likely to be realized. The effect on deferred tax assets and liabilities of a change in tax rates is recognized in income in the year that includes the date of enactment. A valuation allowance is recorded to reduce deferred tax assets to an amount, which, in the opinion of management, is more likely than not to be realized. The Company considers factors such as the cumulative income or loss in recent years; reversal of any deferred tax liabilities; projected future taxable income exclusive of temporary differences; the character of the income tax asset, including income tax positions; tax planning strategies and other factors in the determination of the valuation allowance.
Earnings Per Share
The Company applies the treasury stock method to determine the dilutive effect of potentially dilutive securities, including warrants, and the if-converted method to determine the dilutive effect of any potentially dilutive convertible securities.
Recently IssuedAdopted Accounting Pronouncements
The Company considers the applicability and impact of all ASUs issued by the FASB. ASUs not listed below were assessed and determined to be either not applicable or did not have a material impact on the Company's consolidated financial statements. The following ASUs have been adopted by the Company during the fiscal year 2023:
ASU 2022-04, Liabilities—Supplier Finance Programs (Topic 405-50) - Disclosure of Supplier Finance Program Obligations
In August 2020,September 2022, the FASB issued ASU 2020-06,Debt—DebtNo. 2022-04, “Liabilities—Supplier Finance Programs (Topic 405-50) - Disclosure of Supplier Finance Program Obligations,” to enhance the transparency of supplier finance programs used by an entity in connection with Conversionthe purchase of goods and Other Options (Subtopic470-20)and Derivatives and Hedging—Contracts in Entity’s Own Equity(Subtopic815-40)(“services. ASU 2020-06”) to simplify accounting for certain financial instruments. ASU 2020-06 eliminates the current models that require separation of beneficial conversion and cash conversion features from convertible instruments and simplifies the derivative scope exception guidance pertaining to equity classification of contracts in an entity’s own equity. The new standard also introduces additional disclosures for convertible debt and freestanding instruments that are indexed to and settled in an entity’s own equity. ASU 2020-06 amends the diluted earnings per share guidance, including the requirement to use the if-converted method for all convertible instruments. ASU 2020-06No. 2022-04 is effective for all companies for fiscal years andbeginning after December 15, 2022, including interim periods within those fiscal years, except for the required rollforward information, which is effective for fiscal years beginning after December 15, 2023. Early adoption is permitted, forwas permitted. During the fiscal years (includingyear of adoption, ASU 2022-04 requires information on the key terms of the program(s) and the balance sheet presentation of the program obligations, which are annual disclosure requirements, to be disclosed in each interim periods) beginning after December 15, 2020.period. The Company expects to early adopt 2020-06adopted ASU 2022-04, on January 1, 2022 using2023.
In each annual reporting period, the Company is required to disclose the following information:
1. The key terms of the program, including a modified retrospective approach. Upon adoption, we currently expectdescription of the payment terms (including payment timing and basis for its determination) and assets pledged as security or other forms of guarantees provided for the committed payment to recognize a decrease in additional paid in capital of approximately $11.6 million,the finance provider or intermediary.
2. For the obligations that the Company has confirmed as well as a decreasevalid to deferred tax liabilities of approximately $3.8 million, which will be offset by an increase to retained earnings of approximately $0.3 million as well as approximately $15.5 million increase to long-term debt.the finance provider or intermediary:
a. The increase to long-term debt doesnotrepresent an increase in debt owedamount outstanding that remains unpaid by the Company. It simply reflects the reversalCompany as of the equity component which was previously netted against long-term debt. Refer to “Note 9 – Long-Term Debtend of the annual period (the “outstanding confirmed amount”);
b. A description of where those obligations are presented in the balance sheet;
c. A rollforward of those obligations during the annual period, including the amount of obligations confirmed and Other Borrowings, net”, to the consolidated financial statements for further detail.amount of obligations subsequently paid.
The guidance does not affect the recognition, measurement, or financial statement presentation of new Right of Use (“ROU”) assets and lease liabilities on our balance sheet for our real estate, computer hardware and vehicle leases and (2) providing significant new disclosures about our leasing activities. We do not expect a significant change in our leasing activities between now and adoption.
Contract Balances
Contract assets, or unbilled receivables, are recorded when the Company performs a service or transfers a good in advance of receiving consideration (the right to consideration is conditional on something other than the passage of time). Contract assets are classified as accounts receivable when the Company’s right to consideration is unconditional (only the passage of time is required before payment is due).
Contract liabilities, or deferred revenue, are recorded when the Company receives consideration (or has the unconditional right to receive consideration) in advance of performing a service or transferring a good. Deferred revenue as of December 31
Taxes Collected from Customers and Remitted to Governmental Authorities
The Company excludes taxes assessed by governmental authorities that are both imposed on and concurrent with a specific revenue-producing transaction and collected from customers. Accordingly, such tax amounts are not included as a component of revenue or cost of revenue and are accrued in current liabilities until remitted to governmental authorities.
Practical Expedients
The Company applies ASC 606, utilizing the following allowable exemptions or practical expedients:
•Practical expedient not to disclose the unfulfilled performance obligation balance for contracts with an original length of one year or less.
•Practical expedient to recognize the incremental costs of obtaining a contract as an expense when incurred if the amortization period of the asset that the entity otherwise would have recognized is one year or less.
•Practical expedient to present revenue net of sales taxes and other similar taxes.
•Practical expedient from recognizing shipping and handling activities as a separate performance obligation.
•Practical expedient not requiring the entity to adjust the promised amount of consideration for the effects of a significant financing component if the entity expects, at contract inception, that the period between when the entity transfers a promised good or service to a customer and when the customer pays for that good or service will be one year or less.
Cost of revenue, exclusive of depreciation and amortization
Cost of revenue includes any cost of connectivity incurred with the Company’s carriers, as well as hardware products and materials and associated freight expense, and direct labor.
Selling, general, and administrative expenses
Selling, general, and administrative expenses include costs of the Company’s business not directly attributable to performing services or selling products that are not otherwise separately stated on the Company’s consolidated statements of operations and comprehensive loss. Such costs include salaries and benefits, professional services, and lease expenses.
Stock-based compensation
The Company sponsors an equity incentive plan that provides for the grant of various stock-based awards including time-vested restricted stock units and performance share units. The fair value of any such award is calculated on its grant date fair value, which for time-vested and performance share restricted stock units (excluding those with market conditions), is the market price on close of business of the grant date. The fair value of performance share units that include any market-based metrics is determined as of the grant date using either a Monte Carlo simulation or a binomial lattice valuation model. The Company recognizes compensation expense on a straight-line basis over the period the grant is earned by the employee, generally three years.
The Company assesses the likelihood of performance criteria being achieved for performance-based awards on a quarterly basis. If the Company determines that the performance criteria are probable of being achieved, the fair value of the award is expensed on a straight-line basis over the balance of the vesting period. In the event the Company determines it is no longer probable that it will achieve the minimum performance criteria specified in a performance-based award, the Company reverses all of the previously recognized compensation expense in the period such a determination is made.
47
The Company accounts for forfeitures of stock-based compensation as any such forfeitures occur.
Foreign Currency
The functional currency of the Company’s foreign subsidiaries is generally the local currency. Any transactions recorded in the Company’s foreign subsidiaries denominated in a currency other than the local currency are remeasured using current exchange rates each reporting period with the resulting unrealized gains or losses of $0.1 million and $1.8 million being included in selling, general, and administrative expenses in the consolidated statements of operations and comprehensive loss for the years ended December 31, 2023 and 2022.
Income Taxes
The Company provides for income taxes under the asset and liability method. Deferred tax assets and liabilities are recognized for the future tax consequences attributable to differences between the financial statement carrying amounts of existing assets and liabilities and their respective tax bases. Deferred tax assets and liabilities are measured using enacted tax rates expected to apply to taxable income in the years in which those temporary differences are expected to be recovered or settled. The Company recognizes the effect of income tax positions only if those positions are more likely than not to be sustained. Recognized income tax positions are measured at the largest amount that is greater than 50% likely to be realized. The effect on deferred tax assets and liabilities of a change in tax rates is recognized in income in the year that includes the date of enactment. A valuation allowance is recorded to reduce deferred tax assets to an amount, which, in the opinion of management, is more likely than not to be realized. The Company considers factors such as the cumulative income or loss in recent years; reversal of any deferred tax liabilities; projected future taxable income exclusive of temporary differences; the character of the income tax asset, including income tax positions; tax planning strategies and other factors in the determination of the valuation allowance.
Earnings Per Share
The Company applies the treasury stock method to determine the dilutive effect of potentially dilutive securities, including warrants, and the if-converted method to determine the dilutive effect of any potentially dilutive convertible securities.
Recently Adopted Accounting Pronouncements
The Company considers the applicability and impact of all ASUs issued by the FASB. ASUs not listed below were assessed and determined to be either not applicable or did not have a material impact on the Company's consolidated financial statements. The following ASUs have been adopted by the Company during the fiscal year 2023:
ASU 2022-04, Liabilities—Supplier Finance Programs (Topic 405-50) - Disclosure of Supplier Finance Program Obligations
In September 2022, the FASB issued ASU No. 2022-04, “Liabilities—Supplier Finance Programs (Topic 405-50) - Disclosure of Supplier Finance Program Obligations,” to enhance the transparency of supplier finance programs used by an entity in connection with the purchase of goods and services. ASU No. 2022-04 is effective for all companies for fiscal years beginning after December 15, 2022, including interim periods within those fiscal years, except for the required rollforward information, which is effective for fiscal years beginning after December 15, 2023. Early adoption was permitted. During the fiscal year of adoption, ASU 2022-04 requires information on the key terms of the program(s) and the balance sheet presentation of the program obligations, which are annual disclosure requirements, to be disclosed in each interim period. The Company adopted ASU 2022-04, on January 1, 2023.
In each annual reporting period, the Company is required to disclose the following information:
1. The key terms of the program, including a description of the payment terms (including payment timing and basis for its determination) and assets pledged as security or other forms of guarantees provided for the committed payment to the finance provider or intermediary.
2. For the obligations that the Company has confirmed as valid to the finance provider or intermediary:
a. The amount outstanding that remains unpaid by the Company as of the end of the annual period (the “outstanding confirmed amount”);
b. A description of where those obligations are presented in the balance sheet;
c. A rollforward of those obligations during the annual period, including the amount of obligations confirmed and the amount of obligations subsequently paid.
48
In each interim reporting period (subject to the applicable transition guidance as described above in the initial year of adoption), the Company is required to disclose the amount of obligations outstanding that it has confirmed as valid to the finance provider or intermediary as of the end of the interim period.
The guidance does not affect the recognition, measurement, or financial statement presentation of obligations covered by supplier finance programs.
Recently Issued Accounting Pronouncements
The Company considers the applicability and impact of all ASUs issued by the FASB. ASUs not listed below were assessed and determined to be either not applicable or are not expected to have a material impact on the Company's consolidated financial statements.
ASU No. 2023-07, Segment Reporting: Improvements to Reportable Segment Disclosures (“ASU 2023-07”)
On November 27, 2023, the FASB issued ASU No. 2023-07. The FASB issued the new guidance primarily to provide financial statement users with more disaggregated expense information about a public business entity’s (“PBE”) reportable segment(s). This ASU will require PBEs to provide incremental disclosures related to the entity’s reportable segment(s), including disclosures for expenses that are both 1) significant to each reportable segment and are provided regularly to the CODM or easily computed from information regularly provided to the CODM and 2) included in the reported measure of segment profit or loss used by the CODM to assess performance and allocate resources. If a PBE does not disclose any significant segment expenses for a reportable segment, it is required to disclose narratively the nature of the expenses used by the CODM to manage each segment’s operations.
Under the provisions of this ASU, all of the disclosures required in the segment guidance, including disclosing a measure of segment profit or loss used by the CODM and reporting significant segment expenses, applies to all PBEs, including those with a single operating or reportable segment. However, this ASU does not change the definition of a segment, the method for determining segments, or the criteria for aggregating operating segments into reportable segments. ASU 2023-07 will be effective for the Company’s annual reporting periods beginning in fiscal 2024 and all interim reporting periods beginning in fiscal 2025. At adoption, the disclosures are retrospectively presented for all comparative periods presented. Since this new ASU addresses only disclosures, the Company does not expect the adoption of this ASU to have any material effects on its financial condition, results of operations or cash flows. The Company is currently evaluating any new disclosures that may be required upon adoption of ASU 2023-07.
ASU 2023-09, Income Taxes (Topic 740): Improvements to Income Tax Disclosures (“ASU 2023-09”)
On December 14, 2023, the FASB issued ASU 2023-09 requiring greater disaggregation of income tax disclosures related to the income tax rate reconciliation, income taxes paid, and other disclosures.
•Income tax rate reconciliation – ASU 2023-09 requires disclosing additional information in specified categories to reconcile the effective tax rate to the statutory rate (the rate reconciliation) for federal, state, and foreign income taxes. It also requires greater detail about individual reconciling items in the rate reconciliation to the extent the impact of those items exceeds a specified threshold.
•Income taxes paid – ASU 2023-09 requires disclosing information about taxes paid (net of refunds received) to be disaggregated for federal, state, and foreign taxes and further disaggregated for specific jurisdictions to the extent the related amounts exceed a quantitative threshold.
•Other disclosures – ASU 2023-09 requires disclosing income (or loss) from continuing operations before income tax expense (or benefit) disaggregated between domestic and foreign, and income tax expense (or benefit) from continuing operations disaggregated by federal (national), state, and foreign.
The amendments in ASU 2023-09 eliminated the requirement for all entities to (1) disclose the nature and estimate of the range of the reasonably possible change in the unrecognized tax benefits balance in the next 12 months or (2) make a statement that an estimate of the range cannot be made. The amendments in this update also removed the requirement to disclose the cumulative amount of each type of temporary difference when a deferred tax liability is not recognized because of the exceptions to comprehensive recognition of deferred taxes related to subsidiaries and corporate joint ventures.
The amendments in ASU 2023-09 are effective for annual periods beginning after December 15, 2024, early adoption is permitted. The Company is currently evaluating the effect of this new guidance on the consolidated financial statements.
NOTE 3 – REVENUE RECOGNITION
Disaggregated Revenue
The table below sets forth a summary of revenue by major service line:
49
| For the Year Ended December 31, | |||||||||||
| (in thousands) | 2023 | 2022 | |||||||||
| Services: | |||||||||||
IoT Connectivity (1) | $ | 200,066 | $ | 173,526 | |||||||
| IoT Solutions | 12,579 | 15,459 | |||||||||
| $ | 212,645 | $ | 188,985 | ||||||||
| Products: | |||||||||||
Hardware (2)(3) | $ | 63,965 | $ | 79,462 | |||||||
| Total | $ | 276,610 | $ | 268,447 | |||||||
(1) Includes connectivity-related revenue from IoT Connectivity and IoT Solutions.
(2) Includes hardware-related revenue from IoT Connectivity and IoT Solutions.
(3) Includes $6.4 million and $10.7 million of bill-and-hold arrangements for the years ended December 31, 2023 and 2022, respectively.
| For the Year Ended December 31, | |||||||||||
| (in thousands) | 2023 | 2022 | |||||||||
| United States | $ | 223,172 | $ | 211,599 | |||||||
| Other countries | 53,438 | 56,848 | |||||||||
| Total | $ | 276,610 | $ | 268,447 | |||||||
Contract Assets
The following table sets forth the change in contract assets, or unbilled receivables (1):
| (in thousands) | December 31, 2023 | ||||
| Beginning balance | $ | — | |||
Revenue recognized during the period but not billed (2) | 2,173 | ||||
| Amounts reclassified to accounts receivable | — | ||||
| Ending balance | $ | 2,173 | |||
(1) There were no contract assets as of or for the year ended December 31, 2022.
(2) Net of financing component of $0.3 million.
Contract Liabilities
The table below sets forth the change in contract liabilities, or deferred revenue:
| December 31, | |||||||||||
| (in thousands) | 2023 | 2022 | |||||||||
| Beginning balance | $ | 7,817 | $ | 6,889 | |||||||
| Amounts billed but not recognized as revenue | 9,041 | 7,814 | |||||||||
| Revenue recognized from balances held at the beginning of the period | (7,817) | (6,889) | |||||||||
| Foreign exchange | 3 | 3 | |||||||||
| Ending balance | $ | 9,044 | $ | 7,817 | |||||||
Remaining Performance Obligations
Remaining performance obligations represent the aggregate amount of the transaction price in contracts allocated to performance obligations that are unsatisfied, or partially unsatisfied, at the end of the reporting period. Remaining performance obligations estimates are subject to change and are affected by several factors, including terminations, changes in the scope of contracts, periodic revalidations, adjustments for
revenue that has not materialized, and adjustments for currency. As of December 31, 2023 the Company had approximately $13.1 million of remaining performance obligations on contracts with an original duration of one year or more. The Company viewsexpects to recognize approximately 67% of these remaining performance obligations in 2024, with the following disaggregated disclosures as useful to understand the compositionremaining of revenuebalance recognized during the respective reporting periods:
Year ended December 31, | ||||||||||||
(in ‘000) | 2021 | 2020 | 2019 | |||||||||
Connectivity* | $ | 164,392 | $ | 152,996 | $ | 147,927 | ||||||
Hardware Sales | 54,898 | 29,601 | 8,767 | |||||||||
Hardware Sales - bill-and-hold | 5,357 | 11,314 | 960 | |||||||||
Deployment services, professional services, and other | 23,570 | 19,849 | 11,498 | |||||||||
Total | $ | 248,217 | $ | 213,760 | $ | 169,152 | ||||||
The Company has variable consideration of approximately $1.4 million that was constrained revenue and excluded from the transaction price as of December 31, 2023. There were no material instances where variable consideration was constrained and not recorded at the initial time of sale for the year ended December 31, 2022.
Costs to Obtain and Fulfill a Contract
The Company did not have material costs related to obtaining a contract, or fulfilling a contract that are not addressed by other accounting standards, with amortization periods greater than one year as of December 31, 2023 and 2022.
Customer Concentrations
The Company did not have concentrations in revenue from customers or related accounts receivable for the year ended or as of December 31, 2023.
The Company had one customer, a large multinational medical device andecare company representing 21% and 16% andthat represented 11% of the Company’s total revenue for the years ending December 31, 2021 and 2020, respectively. No individual customer had revenue greater than 10% of the Company’s total revenue for the year ended December 31, 2019.
health car
NOTE 4 – REVERSE RECAPITALIZATION
Business Acquisitions Completed in 2023
On September 30, 2021, pre-combination KOREJune 1, 2023, the Company completed the purchase of certain assets of Twilio Inc., including a carved-out workforce of over 50 employees and CTAC consummatedcertain technology and customer relationships, and assumed certain liabilities related to those assets, primarily related to accrued commissions and benefits owed to the merger contemplated byacquired employees. The assets acquired were dissimilar assets, with the merger agreement (see Note 1 – Nature of Operations).
The transaction was determined to be the accounting acquirer. Under this method of accounting, while CTAC was the legal acquirer, it has been treated as the “acquired” company for financial reporting purposes. Accordingly, the Business Combination was treated as the equivalent of pre-combination KORE issuing stock for the net assets of CTAC, accompaniedfunded by a recapitalization. The net assets of CTAC were stated at historical cost, with no
The following table sets forth a summary of the allocation of the consideration transferred, including the identified assets acquired and liabilities assumed as of the acquisition date:
| (in thousands) | Fair Value | ||||
| Fair value of KORE common stock issued to sellers (10,000,000 shares) | $ | 14,700 | |||
| Total consideration | $ | 14,700 | |||
| Assets acquired: | |||||
| Intangible assets | $ | 11,500 | |||
| Inventories | 326 | ||||
| Property and equipment | 36 | ||||
| Total Assets acquired | $ | 11,862 | |||
| Liabilities assumed: | |||||
| Accrued liabilities | $ | 405 | |||
| Total liabilities assumed | $ | 405 | |||
| Net identifiable assets acquired | 11,457 | ||||
| Goodwill (excess of consideration transferred over net identifiable assets acquired) | $ | 3,243 | |||
Goodwill represents the future economic benefits that the Company expects to achieve as a result of the acquisition of the human capital and assets acquired. The goodwill resulting from this acquisition is deductible for the year ended December 31tax purposes.
Shares | Percentage | |||||||
Pre-combination KORE shareholders | 38,767,500 | 54.0 | % | |||||
Public stockholders | 10,356,593 | 14.4 | % | |||||
Private offering and merger financing | 22,686,326 | 31.6 | % | |||||
Total | 71,810,419 | 100.0 | % | |||||
GAAP requires that a publicly traded entity disclose unaudited pro forma information regarding a business acquisition unless the disclosure of such information is impracticable. This disclosure involves a retrospective application of financial information to create factually supportable unaudited pro forma financial statements as of the reporting date, as if the acquisition had taken place at the beginning of the year of acquisition.
The Company believes that the disclosure of pro forma financial information regarding this acquisition is impracticable. As the acquisition was a carve-out of assets, which only meets the definition of a “business acquisition” because of the dissimilarity of the assets acquired and the ability of the acquired workforce to “create outputs” or generate revenue, no internally generated financial statements were made available to the Company. The Company considers any potential for retrospectively presented information regarding revenue, expenses, and income to require assumptions of significant amounts and about Twilio management’s intent in prior periods that cannot be objectively determined or independently substantiated.
The financial results of this acquisition are included in the Company’s consolidated statements of operations and comprehensive loss from the date of acquisition and the revenue and net loss so included were deemed impracticable to separate from the Company’s overall results.
Business Acquisitions Completed in 2022
On November 22, 2019,February 16, 2022, the Company acquired 100% of the outstanding share capital of lntegronBusiness Mobility Partners, Inc. and Simon IoT LLC a provider of specialized managedwhich are industry-leading mobility service providers, to expand the Company’s services and device solutions with a focus in connected healthwithin the healthcare and life sciences for customers in the United States and Europe. This acquisition further enhances the strategic position of the Company as the global leader in enabling powerful IoT solutions for the largest global organizations.
shares. Transaction costs for legal consulting, accounting, and other related costs incurred in connection with the acquisition of lntegron LLCBMP were $0.7 $1.7 million forof which $1.4 million and $0.3 million were included in selling, general and administrative expenses in the year ended December 31, 2019.
(in ‘000) | Amount | |||
Cash paid to sellers | $ | 37,500 | ||
Common stock issued to sellers | 7,000 | |||
Total consideration | $ | 44,500 | ||
Cash | 12 | |||
Accounts receivable | 7,776 | |||
Inventories | 489 | |||
Prepaid expenses and other receivables | 341 | |||
Property and equipment | 458 | |||
Identifiable intangible assets | 32,000 | |||
Deferred tax liabilities | (1,285 | ) | ||
Accounts payable and accrued liabilities | (1,818 | ) | ||
Net identifiable assets acquired | 37,973 | |||
Goodwill (excess of consideration transferred over net identifiable assets acquired) | $ | 6,527 | ||
The following table sets forth a summary of the combined entity, beginning onallocation of the consideration transferred for BMP, including the identified assets acquired and liabilities assumed as of the acquisition date, November 22, 2019. date:
| (in thousands) | Fair Value | ||||
| Cash, (net of closing cash of $1,995) and working capital adjustments | $ | 46,002 | |||
| Fair value of KORE Common Stock issued to sellers (4,212,246 shares) | 23,295 | ||||
| Total consideration | $ | 69,297 | |||
| Assets acquired: | |||||
| Intangible assets | $ | 28,664 | |||
| Accounts receivable | 3,303 | ||||
| Inventories | 1,323 | ||||
| Prepaid expenses and other receivables | 976 | ||||
| Property and equipment | 201 | ||||
| Total assets acquired | $ | 34,467 | |||
| Liabilities assumed: | |||||
| Deferred tax liabilities | $ | 7,391 | |||
| Accounts payable and accrued liabilities | 2,638 | ||||
| Total liabilities assumed | $ | 10,029 | |||
| Net identifiable assets acquired | 24,438 | ||||
| Goodwill (excess of consideration transferred over net identifiable assets acquired) | $ | 44,859 | |||
Goodwill arises largelyrepresents the future economic benefits that we expect to achieve as a result of the BMP acquisition. Approximately $7.0 million of the goodwill resulting from the growth potential that exists and efficiencies that will be realized under the Company’s new strategic objectives.
The Company recordedBMP Business Combination Agreement contains customary indemnification terms. Under the BMP Business Combination Agreement, a measurement period adjustment resultingportion of the cash purchase price, approximately $3.5 million paid at closing was to be held in escrow for a maximum of 18 months from a working capital shortfall settled with the sellers through escrowed consideration being returnedclosing date, to guarantee performance of general representations and warranties regarding closing amounts and to indemnify the Company in May 2020.against any future claims. The adjustment is recognized as a reductionfinancial results of goodwillBMP are included in the amountCompany’s consolidated statement of $0.4 million. There were no income effects that would have been recognized in previous periods if the adjustment to provisional amounts were recognized as ofoperations and comprehensive loss from the date of acquisition.
52
Unaudited pro forma information
NOTE 5 – ACCOUNTS RECEIVABLE
The following table sets forth the details of the Company’s accounts receivable, net balances included on the consolidated balance sheets as of December 31, 2023 and 2022:
| December 31, | |||||||||||
| (in thousands) | 2023 | 2022 | |||||||||
| Accounts receivable | $ | 52,843 | $ | 45,097 | |||||||
| Less: allowance for credit losses | (430) | (559) | |||||||||
| Accounts receivable, net | $ | 52,413 | $ | 44,538 | |||||||
As of January 1, 2022, the Company’s accounts receivable balance was $51.6 million. The Company incurred bad debt expense of $0.2 million and $0.4 million, respectively, for the years ended December 31, 2023 and 2022. The write-offs and recoveries were immaterial for the years ended December 31, 2023 and 2022. The Company’s adoption of the Current Expected Credit Loss standard did not have a material effect on the Company’s financial statements.
See Note 3 — Revenue Recognition for disclosure of any concentrations in both accounts receivable and revenue.
NOTE 6 – PROPERTY AND EQUIPMENT
| December 31, | |||||||||||
| (in thousands) | 2023 | 2022 | |||||||||
| Computer hardware | $ | 16,381 | $ | 17,684 | |||||||
| Computer software | 8,764 | 9,547 | |||||||||
| Networking equipment | 7,775 | 7,715 | |||||||||
| Leasehold improvements | 3,451 | 3,017 | |||||||||
| Furniture and fixtures | 1,930 | 2,550 | |||||||||
| Property and equipment | $ | 38,301 | $ | 40,513 | |||||||
| Less: accumulated depreciation and amortization | (27,345) | (28,614) | |||||||||
| Property and equipment, net | $ | 10,956 | $ | 11,899 | |||||||
The Company recorded depreciation expense of $5.6 million and $3.7 million, respectively, for the years ended December 31, 2023 and 2022.
NOTE 7 – LEASES
Lessee-type leases
The Company leases real estate, computer hardware, and vehicles for use in its operations under both operating and finance leases. The Company’s leases have remaining lease terms ranging from one to eight years. Most of these leases are non-cancelable and typically have a defined initial lease term, and some provide options to renew at the Company’s election for specified periods of time. Some leases require the Company to pay taxes, insurance, and maintenance expenses associated with the leased assets. The lease agreements do not contain any material residual value guarantees or material restrictive covenants.
Supplemental disclosure related to operating and finance leases included on our consolidated balance sheets are set forth as follows:
53
| December 31, | ||||||||||||||
| (in thousands) | Classification on Consolidated Balance Sheets | 2023 | 2022 | |||||||||||
| Noncurrent assets: | ||||||||||||||
| Operating lease right-of-use assets | Operating lease right-of-use assets | $ | 9,367 | $ | 10,019 | |||||||||
| Finance lease right-of-use assets | Property and equipment, net | 127 | 250 | |||||||||||
| Total | $ | 9,494 | $ | 10,269 | ||||||||||
| Current liabilities: | ||||||||||||||
| Operating lease liabilities | Current portion of operating lease liabilities | $ | 1,446 | $ | 1,811 | |||||||||
| Finance lease liabilities | Accrued liabilities | 106 | 115 | |||||||||||
| Noncurrent liabilities: | ||||||||||||||
| Operating lease liabilities | Noncurrent portion of operating lease liabilities | 9,446 | 9,275 | |||||||||||
| Finance lease liabilities | Other noncurrent liabilities | 21 | 135 | |||||||||||
| Total | $ | 11,019 | $ | 11,336 | ||||||||||
The following table sets forth operating and finance lease cost for the years ended December 31, 2023 and 2022:
| For the Year Ended December 31, | ||||||||||||||
| (in thousands) | Classification on Statement of Operations | 2023 | 2022 | |||||||||||
| Operating lease cost | Selling, general, and administrative expenses | $ | 4,120 | $ | 3,531 | |||||||||
| Finance lease cost: | ||||||||||||||
| Amortization of leased assets | Depreciation and amortization | $ | 241 | $ | 350 | |||||||||
| Interest on lease liabilities | Interest expense | 9 | 17 | |||||||||||
| Total finance lease cost | $ | 250 | $ | 367 | ||||||||||
The weighted-average remaining lease term and the weighted-average discount rate of our leases were as follows:
| December 31, | ||||||||||||||
| 2023 | 2022 | |||||||||||||
| Weighted average remaining lease term: | ||||||||||||||
| Operating leases | 7.1 years | 7.7 years | ||||||||||||
| Finance leases | 1.1 years | 2.1 years | ||||||||||||
| Weighted average discount rate: | ||||||||||||||
| Operating leases | 8.0 | % | 7.6 | % | ||||||||||
| Finance leases | 5.6 | % | 5.5 | % | ||||||||||
The following table sets forth the future minimum lease payments under operating and finance leases subsequent to December 31, 2023:
54
| (in thousands) | Operating Leases | Finance Leases | ||||||||||||
| 2024 | $ | 2,229 | $ | 109 | ||||||||||
| 2025 | 2,079 | 25 | ||||||||||||
| 2026 | 1,809 | — | ||||||||||||
| 2027 | 1,832 | — | ||||||||||||
| 2028 | 1,672 | — | ||||||||||||
| Thereafter | 4,859 | — | ||||||||||||
| Total minimum lease payments | $ | 14,480 | $ | 134 | ||||||||||
| Interest | (3,588) | (7) | ||||||||||||
| Total | $ | 10,892 | $ | 127 | ||||||||||
Lessor-type leases
The Company entered into a long-term contract with a customer on August 1, 2023, which included certain hardware devices, on-site installation, maintenance, and connectivity services. The Company determined that this contract is a lease, and it is a lessor, under this contract. Ownership of the hardware devices component of the contract transfers to the lessee at the end of the 36-month lease for no additional consideration and the lease was therefore determined to be a sales-type lease. The hardware devices have no guaranteed or unguaranteed residual value, nor does the lease contain any variable consideration. The lease does not have any extension options. The remaining components of the transaction were determined to be non-lease components and are accounted for separately under the revenue recognition accounting guidance.
The components of lease income for the year ended December 31, 2023 are set forth as follows (1):
| (in thousands) | December 31, 2023 | ||||
| Selling profit | $ | 2,640 | |||
Interest income (2) | $ | 40 | |||
(1) There were no lessor-type leases as of or for the year ended December 31, 2022.
(2) Interest income is included in the Company’s consolidated statement of operations in “interest income”.
The following table sets forth the Company’s future minimum rental receipts for this lease as of December 31, 2023 (1), the present value of which is included in “accounts receivable, net” in the Company’s consolidated balance sheets as of December 31, 2023:
| (in thousands) | December 31, 2023 | ||||
| 2024 | $ | 989 | |||
| 2025 | 988 | ||||
| 2026 | 787 | ||||
| Total future minimum receipts | $ | 2,764 | |||
| Less: unearned interest income | (285) | ||||
| Net investment in sales-type lease | $ | 2,479 | |||
(1) There were no lessor-type leases as of or for the year ended December 31, 2022.
NOTE 8 – GOODWILL AND OTHER INTANGIBLE ASSETS
Goodwill
The following table sets forth the changes in the carrying amount of the Company’s goodwill on the consolidated balance sheets as of December 31, 2023, and 2022:
55
(in ‘000) | December 31, 2021 | December 31, 2020 | ||||||
Computer hardware | $ | 15,747 | $ | 13,634 | ||||
Computer software | 9,023 | 8,211 | ||||||
Furniture and fixtures | 2,242 | 2,284 | ||||||
Networking equipment | 8,089 | 8,151 | ||||||
Leasehold improvements | 2,793 | 2,803 | ||||||
Total property and equipment | 37,894 | 35,083 | ||||||
Less: accumulated depreciation | (25,654 | ) | (21,374 | ) | ||||
Property and equipment (net) | $ | 12,240 | $ | 13,709 | ||||
KORE Group Holdings, Inc.
Notes to Consolidated Financial Statements
| (in thousands) | Total | ||||
| Goodwill, gross | $ | 384,202 | |||
| Accumulated currency translation | (787) | ||||
| Balance as of January 1, 2022, net | $ | 383,415 | |||
| Acquisitions during the year | 44,859 | ||||
| Impairment losses | (58,074) | ||||
| Currency translation | (494) | ||||
| (13,709) | |||||
| Goodwill, gross | $ | 429,061 | |||
| Accumulated impairment losses | (58,074) | ||||
| Accumulated currency translation | (1,281) | ||||
| Balance as of December 31, 2022, net | $ | 369,706 | |||
| Acquisitions during the year | 3,243 | ||||
| Impairment losses | (78,257) | ||||
| Currency translation | 282 | ||||
| (74,732) | |||||
| Goodwill, gross | $ | 432,304 | |||
| Accumulated impairment losses | (136,331) | ||||
| Accumulated currency translation | (999) | ||||
| Balance as of December 31, 2023, net | $ | 294,974 | |||
2023 Goodwill impairment loss
During the third quarter of 2023, the Company identified circumstances prior to its annual impairment test that indicated that it was “more likely than not” that the fair value of the Company’s goodwill was below its carrying value. The primary qualitative impairment indicator noted was that of a significant and sustained decline in the Company’s share price from that of the second quarter of 2023. The Company therefore performed a long-lived asset and goodwill impairment test during the third quarter of 2023 and determined that goodwill was impaired. The Company recorded a goodwill impairment charge of $78.3 million. No impairment was indicated for long-lived assets.
The fair value of the Company’s goodwill was estimated by equally weighing the results of an income approach and market approach. Valuation techniques utilized were substantially considered Level 3 inputs in the fair value hierarchy. These inputs included the Company’s internal forecasts of its future results, cash flows, and its weighted average cost of capital. Key assumptions used in the impairment analysis included projected revenue growth rates, discount rates, and market factors such as earnings multiples from comparable publicly traded companies.
Long-lived assets and goodwill were not determined to be further impaired as of the annual impairment test date on October 1, 2023.
2022 Goodwill impairment loss
During the fourth quarter of 2022, the Company identified circumstances subsequent to its annual impair test that indicated that it was “more likely than not” that the fair value of the Company’s goodwill was below its carrying value. These impairment indicators included increased interest rates impacting the Company’s weighted average cost of capital, an increase in the Company’s specific risk premium, an increase in debt-free net working capital needs, and a significant and sustained decline in the Company’s share price from the third quarter of 2022. The Company therefore performed a long-lived asset and goodwill impairment test during the fourth quarter of 2022 and determined that goodwill was impaired. The Company recorded a goodwill impairment charge of $58.1 million. No impairment was indicated for long-lived assets,
The fair value of the Company’s goodwill was estimated by equally weighing the results of an income approach and market approach. Valuation techniques utilized were substantially considered Level 3 inputs in the fair value hierarchy. These inputs included the Company’s internal forecasts of its future results, cash flows, and its weighted average cost of capital. Key assumptions used in the impairment analysis included projected revenue growth rates, discount rates, and market factors such as earnings multiples from comparable publicly traded companies.
Other Intangible Assets
The following tables set forth the details of other intangible assets included on the consolidated balance sheets as of December 31, 2023 and 2022:
| (in thousands) | Gross Carrying Value | Accumulated Amortization | Net Carrying Value | ||||||||||||||
| Customer relationships | $ | 334,543 | $ | (227,456) | $ | 107,087 | |||||||||||
| Internally developed computer software | 82,950 | (47,166) | 35,784 | ||||||||||||||
| Carrier contracts | 70,210 | (54,561) | 15,649 | ||||||||||||||
| Technology | 50,366 | (45,978) | 4,388 | ||||||||||||||
| Trademarks | 17,449 | (12,918) | 4,531 | ||||||||||||||
| Non-compete agreement | 5,604 | (5,456) | 148 | ||||||||||||||
| Balance as of December 31, 2023 | $ | 561,122 | $ | (393,535) | $ | 167,587 | |||||||||||
| (in thousands) | Gross Carrying Value | Accumulated Amortization | Net Carrying Value | ||||||||||||||
| Customer relationships | $ | 327,317 | $ | (197,483) | $ | 129,834 | |||||||||||
| Internally developed computer software | 66,459 | (36,579) | 29,880 | ||||||||||||||
| Carrier contracts | 70,210 | (47,483) | 22,727 | ||||||||||||||
| Technology | 46,978 | (42,348) | 4,630 | ||||||||||||||
| Trademarks | 16,214 | (11,060) | 5,154 | ||||||||||||||
| Non-compete agreement | 5,604 | (5,325) | 279 | ||||||||||||||
| Balance as of December 31, 2022 | $ | 532,782 | $ | (340,278) | $ | 192,504 | |||||||||||
As of December 31, 2023, the weighted average remaining useful lives were 4.7 years for customer relationships; 5.4 years for internally developed computer software; 2.8 years for carrier contracts; 4.5 years for technology; 4.2 years for trademarks; and 1.1 years for non-compete agreements.
Amortization expense for the years ended December 31,, 2021, 2020 2023 and 2019,2022 was $3.7 million, $4.5$52.8 million, and $4.7$50.8 million, respectively.
(in ‘000) | Amount | |||
December 31, 2019 | $ | 382,247 | ||
Measurement period adjustment — Integron | (366 | ) | ||
Currency translation | 868 | |||
December 31, 2020 | $ | 382,749 | ||
Currency translation | (787 | ) | ||
December 31, 2021 | $ | 381,962 | ||
(in ‘000) | Carrying Gross Amount | Accumulated Amortization | Net Carrying Value | |||||||||
Customer relationships | $ | 306,732 | $ | (168,679 | ) | $ | 138,053 | |||||
Technology | 45,983 | (37,529 | ) | 8,454 | ||||||||
Carrier contracts | 65,700 | (40,488 | ) | 25,212 | ||||||||
Trademarks | 15,733 | (9,221 | ) | 6,512 | ||||||||
Internally developed computer software | 59,906 | (34,663 | ) | 25,243 | ||||||||
Total as of December 31, 2021 | $ | 494,054 | $ | (290,580 | ) | $ | 203,474 | |||||
(in ‘000) | Carrying Gross Amount | Accumulated Amortization | Net Carrying Value | |||||||||
Customer relationships | $ | 307,356 | $ | (143,230 | ) | $ | 164,126 | |||||
Technology | 46,229 | (33,394 | ) | 12,835 | ||||||||
Carrier contracts | 65,700 | (33,918 | ) | 31,782 | ||||||||
Trademarks | 15,828 | (7,608 | ) | 8,220 | ||||||||
Internally developed computer software | 45,148 | (21,908 | ) | 23,240 | ||||||||
Total as of December 31, 2020 | $ | 480,261 | $ | (240,058 | ) | $ | 240,203 | |||||
The following table shows the weighted average remaining useful lives per intangible asset category as of December 31, 2021.
| (in thousands) | Estimated Amortization Expense | ||||
| 2024 | $ | 51,305 | |||
| 2025 | 47,269 | ||||
| 2026 | 33,273 | ||||
| 2027 | 13,053 | ||||
| 2028 | 10,156 | ||||
| Thereafter | 12,531 | ||||
| Total | $ | 167,587 | |||
Amount | ||||
2022 | $ | 46,788 | ||
2023 | 43,223 | |||
2024 | 39,132 | |||
2025 | 36,359 | |||
2026 | 22,350 | |||
Thereafter | 15,622 | |||
Total | $ | 203,474 | ||
(in ‘000) | December 31, 2021 | December 31, 2020 | ||||||
Accrued payroll and related | $ | 13,103 | $ | 10,657 | ||||
Accrued cost of revenue | 1,641 | 2,142 | ||||||
Accrued other expenses | 5,198 | 3,845 | ||||||
Sales and other taxes payable | 1,369 | 565 | ||||||
Total accrued liabilities | $ | 21,311 | $ | 17,209 | ||||
NOTE 9 –LONG-TERM– LONG-TERM DEBT AND OTHER BORROWINGS,
NET
The fair valuestable below sets forth a summary of the Company’s outstanding borrowings approximate the carrying values. The following is a summarylong-term debt as of long-term debt:
57
(in ‘000) | December 31, 2021 | December 31, 2020 | ||||||
Term Loan – UBS | $ | 305,807 | $ | 308,959 | ||||
Term Loan – BNP Paribas | 0 | 9 | ||||||
Notes under the Backstop Agreement | 120,000 | — | ||||||
Other Borrowings | 173 | — | ||||||
Total | 425,980 | 308,968 | ||||||
Less — current portion | 3,326 | 3,161 | ||||||
Less — equity component, net of accumulated amortization | 15,517 | 0 | ||||||
Less—debt issuance cost, net of accumulated amortization of $6.1 million and $3.7 million, respectively | 8,022 | 7,403 | ||||||
Total notes and debentures | 399,115 | 298,404 | ||||||
Other Borrowings—Notes payable | 0 | 0 | ||||||
Total Long-term debt and other borrowings | $ | 399,115 | $ | 298,404 | ||||
KORE Group Holdings, Inc.
Notes to Consolidated Financial Statements| December 31, | |||||||||||
| (in thousands) | 2023 | 2022 | |||||||||
| Term Loan - Whitehorse | $ | 185,000 | N/A | ||||||||
| Term Loan – UBS | N/A | 302,654 | |||||||||
| Backstop Notes | 120,000 | 120,000 | |||||||||
| Other borrowings | 561 | 2,754 | |||||||||
| Total | $ | 305,561 | $ | 425,408 | |||||||
| Less: current portion of long-term debt | (2,411) | (5,345) | |||||||||
| Less: debt issuance costs, net of accumulated amortization of $0.8 million and $8.5 million, respectively | (2,911) | (6,153) | |||||||||
| Less: original issue discount | (4,130) | N/A | |||||||||
| Total Long-term debt and other borrowings, net | $ | 296,109 | $ | 413,910 | |||||||
Term Loan — WhiteHorse Capital Management, LLC (“WhiteHorse”)
On November 15, 2023, a subsidiary of the Company entered into a credit agreement with WhiteHorse that consisted of a senior secured term loan of $185.0 million (“Term Loan”) as well as a senior secured revolving credit facility of $25.0 million (the “Revolving Credit Facility” and, together with the Term Loan, the “Credit Facilities”). Borrowings under the Term Loan and the Revolving Credit Facility bear interest at a rate at the Company’s option of either (1) Term SOFR for a specified interest period (at the Company’s option) of one to three months plus an applicable margin of up to 6.50% or (2) a base rate plus an applicable margin of up to 5.50%. The Term SOFR rate is subject to a “floor” of 1.0%. The applicable margins for Term SOFR rate and base rate borrowings are each subject to a reduction to 6.25% and 6.00% if the Company maintains a first lien net leverage ratio of less than 2.25:1.00 and greater than or equal to 1.75:1.00 and less than 1.75:1.00, respectively. Interest is paid on the last business day of each quarterly interest period except at maturity.
Principal payments of approximately $0.5 million are due on the last business day of each quarter. The maturity date of the Credit Facilities is November 15, 2028.
The following isCredit Facilities are secured by substantially all of the summaryCompany’s subsidiaries’ assets. The Term Loan agreement restricts cash dividends and other distributions from the Company’s subsidiaries to the Company and also restricts the Company’s ability to pay cash dividends to its shareholders, and contains customary financial covenants related to maximum total debt to Adjusted EBITDA ratio and a first lien debt to Adjusted EBITDA ratio.
As of future principal repaymentsDecember 31, 2023, there were no amounts outstanding on long-term debt:
(in ‘000) | Amount | |||
2022 | $ | 3,326 | ||
2023 | 3,153 | |||
2024 | 299,501 | |||
2025 | 0 | |||
2026 | 0 | |||
Thereafter | 120,000 | |||
Total | $ | 425,980 | ||
On December 21, 2018, the Company entered into a credit agreement with UBS (as from time to time amended and supplemented) that consisted of a term loan of $280.0$315.0 million (the “Term Loan — UBS”), maturity date December 21, 2024, as well as a senior secured revolving credit facility withof $30.0 million.
On November 15, 2023, the Company fully repaid the Term Loan — UBS (the “Senior Secured UBS Term Loan”, and together withthere were no amounts drawn or outstanding on the senior secured revolving credit facility the “Credit Facilities”). The Senior Secured UBS Term Loan required quarterly principal and interest payments of LIBOR plus 5.5%. All remaining principal and interest payments are due on December 21, 2024.
Backstop Notes
On November 12, 2019, the Company amended the Senior Secured UBS Term Loan in order to raise an additional $35.0 million. Under the amended agreement, the maturity date of the term loan and interest rate remained unchanged.
The Backstop Notes were issued at par and bear interest at a rate of 5.50% per annum which is paid semi-annually on March 30 and September 30 of each year, commencing on March 30, 2022. The Backstop Notes are exchangeable into common stock of the Company at $12.50 per share (“the Base(the “Base Exchange Rate”) at any time at the option of Fortress. The Company may redeem the Notes for cash, force an exchange into shares of its common stock at $16.25 per share or settle with a combination of cash and an exchange.lender. At the Base Exchange Rate, the Backstop Notes are exchangeable into 7.6for approximately 9.6 million shares of the Company’s common stock. The Company paid a one
58
The Backstop Notes were issued pursuant to an exchange (the “Company Option”). Sinceindenture which contains financial covenants related to the Company’s maximum total debt to Adjusted EBITDA ratio.
Other borrowings
The Company’s “other borrowings” as set forth on the foregoing table regarding the Company’s long-term debt related solely to a premium finance agreement entered into on August 3, 2022, to purchase a Directors and Officers insurance policy with a two-year policy term. The original amount borrowed was approximately $3.6 million at a fixed rate of 4.6% per annum, amortized over twenty months. The premium finance agreement requires twenty fixed monthly principal and interest payments of approximately $0.2 million per month from August 15, 2022 to March 15, 2024. During the year ended December 31, 2023, principal payments of $2.2 million were paid under this agreement.
This borrowing was classified as short-term as of December 31, 2023, as the remaining principal balance was then due within the subsequent three months.
Future principal repayments
The table below sets forth the future principal repayments on all long-term debt as of December 31, 2023:
| (in thousands) | Principal Repayment | ||||
| 2024 | $ | 1,850 | |||
| 2025 | 1,850 | ||||
| 2026 | 1,850 | ||||
| 2027 | 1,850 | ||||
| 2028 | 297,600 | ||||
| Total | $ | 305,000 | |||
NOTE 10 – WARRANTS ON COMMON STOCK
Penny warrants
On November 15, 2023 and December 13, 2023, in conjunction with the Company’s issuance of Series A-1 Preferred Stock to Searchlight, the Company may useissued a total of 12,024,711 warrants to Searchlight (the “Penny Warrants”), which entitle Searchlight to purchase one share of the Company’s common stock in exchange for one warrant, exercisable immediately post-issuance at either $0.01 per share of common stock or by using a formula for cashless exercise.
The Penny Warrants will expire on November 13, 2033, unless redeemed earlier.
The Company determined that the Penny Warrants were required to be classified as a liability. The Penny Warrants were initially measured at fair value and are subsequently remeasured at fair value at every reporting period. See Note 11 — Fair Value Measurements.
Public warrants
In 2021, the Company Optionissued warrants to potentially settle all or partthird-party investors (the “Public Warrants”). Each whole warrant entitles the holder to purchase one share of the Backstop Notes forCompany’s common stock at an exercise price of $11.50 per share. As of December 31, 2023 and 2022, 8,638,966 Public Warrants remained outstanding.
The Public Warrants will expire five years after the cash equivalentcompletion of the Company’s initial public offering, on October 1, 2026, unless redeemed earlier.
The Public Warrants are classified as equity, and the fair value of the Public Warrants as of the date of the Company’s initial public offering was recorded as additional paid-in capital. As these warrants are equity-classified, the fair value of these warrants is not subsequently remeasured.
Private placement warrants
In its initial public offering process, the Company also sold warrants to affiliates of its private equity sponsor at the time (“Private Placement Warrants”), Cerberus Telecom Acquisition Corp. (“CTAC”). Each Private Placement Warrant allows the holder to purchase one share of the Company’s common stock for whichat $11.50 per share. As of December 31, 2023 and 2022, 272,779 Private Placement Warrants remained outstanding, and were held by affiliates of CTAC.
59
The Private Placement Warrants will expire five years after the notescompletion of the Company’s initial public offering, on October 1, 2026, unless earlier redeemed.
Based on certain provisions within the Private Placement Warrant governing documents, the Company determined that the Private Placement Warrants were required to be classified as a liability. The Private Placement Warrants were initially measured at fair value and are subsequently remeasured at fair value at every reporting period. See Note 11 — Fair Value Measurements.
NOTE 11 – FAIR VALUE MEASUREMENTS
Fair value is defined as the price that would be received to sell an asset or paid to transfer a liability (i.e., the “exit price”) in an orderly transaction between market participants at the measurement date. Inputs refer broadly to the assumptions that market participants would use in pricing the asset or liability. Inputs may be exchanged, a portionobservable or unobservable:
•Observable inputs are inputs that reflect the assumptions market participants would use in pricing the asset or liability based on market data obtained from sources independent of the proceedsreporting entity.
•Unobservable inputs are inputs that reflect the reporting entity’s own assumptions.
A fair value hierarchy for inputs is implemented in measuring fair value that maximizes the use of observable inputs and minimizes the Backstop Notes have been allocateduse of unobservable inputs by requiring that the most observable inputs be used when available. The availability of valuation techniques and the ability to equity,attain observable inputs can vary among different financial instruments and are affected by a wide variety of factors, including the type of instrument, whether the instrument is newly issued and not yet established in the marketplace, the liquidity of markets, and other characteristics particular to the transaction.
The fair value hierarchy is categorized into three broad levels based on the estimatedinputs as follows:
Level 1 - Valuations based on unadjusted, quoted prices in active markets for identical assets and liabilities.
Level 2 - Valuations based on quoted prices in an inactive market, or whose values are based on models - but the inputs to those models are observable either directly or indirectly for substantially the full term of the assets and liabilities. Level 2 inputs include the following:
a) Quoted prices for similar assets and liabilities in active markets;
b) Quoted prices for identical or similar assets and liabilities in non‑active markets;
c) Pricing models whose inputs are observable for substantially the full term of the assets and liabilities; and
d) Pricing models whose inputs are derived principally from or corroborated by observable market data through correlation or other means for substantially the full term of the asset or liability.
Level 3 - Valuations based on inputs that are unobservable and significant to the overall fair value measurement. Valuation of Backstop Notes had they not contained the exchange features. The unamortized discount and issuance costs will be amortized through September 30
The inputs used to measure fair value may fall into different levels of the fair value hierarchy. In such cases, the actual level is determined based on the level of inputs that is most significant to the fair value measurement in its entirety.
To the extent that valuation is based on models or inputs that are less observable or unobservable in the market, the determination of fair value requires more judgment. Because of the inherent uncertainty of valuation, those estimated values may be exchangeable into common stock ofmaterially higher or lower than the Companyvalues that would have been used had a ready market for the investments existed.
Financial Instruments Measured at Fair Value
Penny Warrants
The Penny Warrants, issued in 2023, are marked to fair value by reference to the fair value of the commonCompany’s stock for whichprice on the notes may be exchanged, a portionlast day of the proceeds ofreporting period, less the Additional Backstop Notes have been allocated to equity, based onpenny exercise price, and are therefore considered as Level 2 in the estimatedfair value hierarchy. The fair value of Additional Backstop Notes had they not contained the exchange features. Company’s stock as of December 31, 2023 less the exercise price resulted in a Penny Warrant valuation of approximately $11.7 million as of December 31, 2023.
Private Placement Warrants
The unamortized discount and issuance costs will be amortized through September 30, 2028. The effective interest ratePrivate Placement Warrants are marked to fair value by reference to the fair value of the liability component is 8.4%.Company’s public warrants, which are therefore considered as Level 2 in the fair value hierarchy. The public warrants traded on the NYSE under the ticker symbol KORE.WS until December 2023, at which point the listing transferred to the OTC Pink Marketplace under the ticker symbol KORGW. As of December 31, 2023, the aggregate value of the Private Placement Warrants was zero, as the reference price of the KORGW warrants was less than one cent per warrant.
60
As of December 31,
Financial Instruments Held at Amortized Cost for Which Fair Value is Disclosed
Financial instruments for which cost approximates fair value
Cash, including restricted cash, is stated at cost, which approximates fair value. The carrying amounts reported in the balance sheet for accounts receivable (including contract assets), accounts payable, and accrued liabilities (including contract liabilities) approximate fair value, due to their short-term maturities.
Long-term debt and mandatorily redeemable preferred stock due to affiliate
The table below sets forth the amortized cost and fair value of the Company’s Senior Secured Term Loan, Senior Secured UBS Term Loan, and Mandatorily Redeemable Preferred Stock Due to Affiliate as of December 31, 2023 and 2002. The fair value of this debt is not indicative of the amounts at which the Company could settle this debt.
| (in thousands) | December 31, | |||||||||||||||||||
| Financial Instruments Disclosed at Fair Value Level 2 | Measurement | 2023 | 2022 | |||||||||||||||||
| Senior Secured Term Loan | Amortized cost | $ | 180,042 | N/A | ||||||||||||||||
| Fair value | $ | 174,812 | N/A | |||||||||||||||||
| Senior Secured UBS Term Loan | Amortized cost | N/A | $ | 298,956 | ||||||||||||||||
| Fair value | N/A | $ | 283,612 | |||||||||||||||||
| Mandatorily Redeemable Preferred Stock Due to Affiliate | Amortized cost | $ | 141,594 | N/A | ||||||||||||||||
| Fair value | $ | 141,398 | N/A | |||||||||||||||||
The table below sets forth the amortized cost and fair value of the Backstop AgreementNotes as of December 31, 2023 and 2022. The fair value of this debt is $102.0 million. not indicative of the amounts at which the Company could settle this debt.
| (in thousands) | December 31, | |||||||||||||||||||
| Financial Instrument Disclosed at Fair Value Level 3 | Measurement | 2023 | 2022 | |||||||||||||||||
| Backstop Notes (Level 3) | Amortized cost | $ | 117,916 | $ | 117,545 | |||||||||||||||
| Fair value | $ | 91,204 | $ | 92,900 | ||||||||||||||||
Additional disclosures regarding Level 3 unobservable inputs - Backstop Notes
We use a third‑party valuation firm who utilizes proprietary methodologies to value our Backstop Notes. This firm uses a lattice modeling technique to determine the fair value of this Level 3 liability. Use of this technique requires determination of relevant inputs and assumptions, some of which represent significant unobservable inputs such as credit spreads and equity volatility based on guideline companies, as well as other valuation assumptions. Accordingly, a significant increase or decrease in any of these inputs in isolation may result in a significantly lower or higher fair value measurement. The following table sets forth information regarding the Company’s significant Level 3 inputs as of December 31, 2023, and December 31, 2022:
| ($ in thousands, except as otherwise noted) | December 31, | ||||||||||||||||
| Significant Inputs for Level 3 Fair Value Disclosure | Input | 2023 | 2022 | ||||||||||||||
| Backstop Notes | Principal amount | $120,000 | $120,000 | ||||||||||||||
| Term to maturity date | 4.75 years | 5.75 years | |||||||||||||||
| Stock price | $0.98 | $1.26 | |||||||||||||||
| Credit spreads | 895 bps | 759 bps | |||||||||||||||
| Selected equity volatility | 98.7 | % | 85.6 | % | |||||||||||||
61
NOTE 12 – STOCK BASED COMPENSATION
2021 Long-Term Stock Incentive Plan
On September 29, 2021, the board of directors (the “Board”) approved the KORE Group Holdings, Inc. 2021 Long-Term Stock Incentive Plan (as amended, modified or supplemented from time to time, the “Incentive Plan”) to promote the interests of the Company and its stockholders. The Incentive Plan allows for the issuance of up to 7,181,042 shares of common stock under share-based payment awards to eligible employees, prospective employees, consultants and non-employee directors of the Company or any of its subsidiaries. The Incentive Plan is administered by the Compensation Committee of the Board. On December 8, 2021, the Compensation Committee of the Board approved the future grants of certain Restricted Stock Unit Awards (“RSUs”).
The following table sets forth a summary of the RSUs activity during the reporting periods:
| Number of awards outstanding (in thousands) | Weighted- average grant date fair value (per share) | |||||||||||||
| Unvested RSUs as of December 31, 2021 | — | $ | — | |||||||||||
| Granted | 5,789 | 6.24 | ||||||||||||
| Vested | (52) | 6.88 | ||||||||||||
| Forfeited and canceled | (222) | 6.97 | ||||||||||||
| Unvested RSUs as of December 31, 2022 | 5,515 | $ | 6.06 | |||||||||||
| Granted | 7,513 | 1.55 | ||||||||||||
| Vested | (1,285) | 5.59 | ||||||||||||
| Forfeited and canceled | (1,466) | 3.12 | ||||||||||||
| Unvested RSUs as of December 31, 2023 | 10,277 | $ | 3.12 | |||||||||||
For the year ended December 31, 2021,2023 the interestCompany granted 2.9 million performance-based RSUs that vest in accordance with certain three-year revenue and EBITDA performance criteria. The weighted-average grant date fair value was $0.61 and was based on the Company’s share price on the grant date. The Company recognized $4.3 million of compensation expense. As of December 31, 2023, the total unrecognized compensation cost related to unvested performance-based RSUs was $5.2 million and it is expected to be recognized over the contractual interest coupon was approximately $1.6 million. weighted-average remaining requisite service period of ten months.
For the year ended December 31, 2021,2023 the interestCompany granted 4.4 million time-based RSUs that vest in three equal installments on each of the following three-year anniversaries of the grant date. The weighted-average grant date fair value was $0.94 and was based on the Company’s share price on the grant date. The Company recognized $6.6 million of compensation expense. As of December 31, 2023, the total unrecognized compensation cost related to unvested time-based RSUs was $13.3 million and it is expected to be recognized over the amortizationweighted-average remaining requisite service period of debt issuance costs relatedten months.
On November 15, 2023 the Company granted 0.2 million market-based RSUs to the liability component was approximately $0.5 million.
Company’s president and chief executive officer. The Backstop Agreement contains a customarysix-monthlock up followingRSUs will vest on the day after the closing which prohibits Fortress from hedging the Notes under the Backstop Agreement by short sellingprice of the Company’s common stock is five dollars per share or hedginghigher for at least 20 days out of any consecutive thirty-day period ending on or prior to June 30, 2026. The fair value of the notes viaRSUs was estimated to be $0.08 per RSU using a Monte-Carlo simulation model considering the term, volatility, risk-free rates and the vesting conditions. As of December 31, 2023, the total unrecognized compensation cost related to unvested marked-based RSUs was de minimis and it is expected to be recognized over the weighted-average remaining requisite service period of 1.8 years.
On June 9, 2023 the Company modified and amended various equity plan awards previously granted during 2022 to the Company’s warrants or options.
The majority of RSUs that vested in compliance2023 were net share settled such that the Company withheld shares with these covenantsa value equivalent to the employees’ obligation for the applicable income and other employment taxes, and remitted the cash to the appropriate taxing authorities. Shares with a value of approximately $0.4 million were withheld to satisfy tax withholding for the year ended December 31, 2023.
For the year ended December 31, 2022 the Company granted 4.0 million shares underlyingRSUs that vest based on the Backstop Notespassage of time, and 1.7 million of performance-based RSUs. The actual number of performance-based RSUs that could vest will range from zero to 150% of the Additional Backstop Notes is less1.6 million unvested RSUs granted (net of any forfeitures), depending upon the Company’s level of achievement with respect to the performance goals.
For the year ended December 31, 2022, the Company granted approximately 0.2 million RSUs, which vest based on the Company’s stock price attaining a closing price equal to or greater than the$13, $15, or $18 per share over any 20 trading days within any 30 consecutive trading day period. The fair value of these RSUs was estimated using a lattice model. These RSUs were subsequently modified on June 9, 2023 to remove the Notes undermarket condition and vest the Backstop Agreement. award immediately on that date, as discussed above.
Significant inputs used in the Company’s valuation of the market-based RSUs included the following:
| For the Year Ended December 31, | ||||||||||||||
| 2023 | 2022 | |||||||||||||
| Expected volatility | 85 | % | 57.1% - 75.2% | |||||||||||
| Risk-free interest rate | 4.7 | % | 1.4% - 2.1% | |||||||||||
| Expected term | 2.63 years | 5-80 years | ||||||||||||
The following is a summary of the Company’s principal outstanding balances onshare-based compensation expense related to RSUs during the Notes under the Backstop Agreement were $120.0reporting periods shown below:
| For the Year Ended December 31, | ||||||||||||||
| (in thousands) | 2023 | 2022 | ||||||||||||
| Total stock compensation expense | $ | 11,251 | $ | 10,296 | ||||||||||
| Income tax benefit | $ | 755 | $ | 1,346 | ||||||||||
| Unrecognized compensation cost | $ | 18,411 | $ | 24,272 | ||||||||||
| Weighted-average remaining service period | 1.52 years | 2.55 years | ||||||||||||
NOTE 1013 – INCOME TAXES
| For the Year Ended December 31, | |||||||||||
| (in thousands) | 2023 | 2022 | |||||||||
| United States | $ | (140,821) | $ | (92,021) | |||||||
| Foreign | (30,379) | (24,596) | |||||||||
| Total loss before income taxes | $ | (171,200) | $ | (116,617) | |||||||
For the Years Ended December 31, | ||||||||||||
2021 | 2020 | 2019 | ||||||||||
(in thousands) | ||||||||||||
United States | $ | (13,326 | ) | $ | (25,283 | ) | $ | (27,728 | ) | |||
Foreign | (20,821 | ) | (15,236 | ) | (8,656 | ) | ||||||
Total loss before income taxes | $ | (34,147 | ) | $ | (40,519 | ) | $ | (36,384 | ) | |||
The components of the provision (benefit)forbenefit from income taxes from continuing operations consisted of thefollowing:
63
For the Years Ended December 31, | ||||||||||||
2021 | 2020 | 2019 | ||||||||||
Current: | (in thousands) | |||||||||||
Federal | $ | — | $ | 0 | $ | (1,136 | ) | |||||
State | 420 | 546 | (44 | ) | ||||||||
Foreign | (243 | ) | 505 | (270 | ) | |||||||
Total current provision (benefit) | 177 | 1,051 | (1,450 | ) | ||||||||
Deferred: | ||||||||||||
Federal | (6,213 | ) | (7,120 | ) | (8,626 | ) | ||||||
State | (784 | ) | 2,285 | (2,117 | ) | |||||||
Foreign | (2,874 | ) | (1,534 | ) | (748 | ) | ||||||
Total deferred benefit | (9,871 | ) | (6,369 | ) | (11,491 | ) | ||||||
Total benefit | $ | (9,694 | ) | $ | (5,318 | ) | $ | (12,941 | ) | |||
KORE Group Holdings, Inc.
Notes to Consolidated Financial Statements
| For the Year Ended December 31, | |||||||||||
| (in thousands) | 2023 | 2022 | |||||||||
| Current: | |||||||||||
| Federal | $ | 5,788 | $ | 4,309 | |||||||
| State | 743 | 905 | |||||||||
| Foreign | 723 | 558 | |||||||||
| Total current provision | $ | 7,254 | $ | 5,772 | |||||||
| Deferred: | |||||||||||
| Federal | (8,580) | (9,336) | |||||||||
| State | (946) | (4,455) | |||||||||
| Foreign | (1,886) | (2,398) | |||||||||
| Total deferred benefit | (11,412) | (16,189) | |||||||||
| Total income tax benefit | $ | (4,158) | $ | (10,417) | |||||||
The reconciliation between income taxes computed at the U.S. statutory income tax rate to our provision forthe Company’s benefit from income taxes for the years ended December 31, 2021, 20202023 and 2019 are2022 is set forth in the table below as
follows:
| For the Year Ended December 31, | |||||||||||||||||||||||
| (in thousands) | 2023 | 2022 | |||||||||||||||||||||
| Benefit for income taxes at 21% rate | $ | (35,952) | 21.0 | % | $ | (24,490) | 21.0 | % | |||||||||||||||
| State taxes, net of federal benefit | (2,123) | 1.2 | % | (1,358) | 1.2 | % | |||||||||||||||||
| Change in valuation allowance | 16,889 | (9.9) | % | 10,628 | (9.1) | % | |||||||||||||||||
| Rate change | (44) | 0.0 | % | (1,687) | 1.4 | % | |||||||||||||||||
| Credits | (544) | 0.3 | % | (604) | 0.5 | % | |||||||||||||||||
| Permanent differences and other | 1,440 | (0.7) | % | (2,712) | 2.2 | % | |||||||||||||||||
| Revaluation of warrants | 1,352 | (0.8) | % | (53) | 0.0 | % | |||||||||||||||||
| Uncertain tax positions | 1,580 | (0.9) | % | 591 | (0.5) | % | |||||||||||||||||
| Foreign withholding tax | 148 | (0.1) | % | 134 | (0.1) | % | |||||||||||||||||
| Foreign rate differential | (1,725) | 1.0 | % | (2,120) | 1.8 | % | |||||||||||||||||
| Executive compensation expense | 634 | (0.4) | % | 872 | (0.7) | % | |||||||||||||||||
| Transaction related expense | — | 0.0 | % | 210 | (0.2) | % | |||||||||||||||||
| Global intangible low taxed income | 314 | (0.2) | % | 283 | (0.2) | % | |||||||||||||||||
| Foreign derived intangible income | — | 0.0 | % | (311) | 0.3 | % | |||||||||||||||||
| Goodwill impairment | 13,873 | (8.1) | % | 10,200 | (8.7) | % | |||||||||||||||||
| Benefit for income taxes | $ | (4,158) | 2.4 | % | $ | (10,417) | 8.9 | % | |||||||||||||||
For the Years Ended December 31, | ||||||||||||||||||||||||
2021 | 2020 | 2019 | ||||||||||||||||||||||
(in thousands) | ||||||||||||||||||||||||
Benefit for income taxes at 21% rate | $ | (7,171 | ) | 21.0 | % | $ | (8,509 | ) | 21.0 | % | $ | (7,641 | ) | 21.0 | % | |||||||||
State taxes, net of federal benefit | (1,227 | ) | 3.5 | % | (947 | ) | 2.3 | % | (2,161 | ) | 6.0 | % | ||||||||||||
Change in valuation allowance | 975 | -2.9 | % | 1,016 | -2.5 | % | 0 | 0.0 | % | |||||||||||||||
Rate change | 775 | -2.3 | % | 2,856 | -7.0 | % | 0 | 0.0 | % | |||||||||||||||
Credits | (602 | ) | 1.8 | % | (811 | ) | 2.0 | % | (541 | ) | 1.5 | % | ||||||||||||
Permanent differences and other | 47 | -0.1 | % | 307 | -0.8 | % | (41 | ) | 0.1 | % | ||||||||||||||
Revaluation of warrants | (1,106 | ) | 3.2 | % | 1,572 | -3.9 | % | (49 | ) | 0.1 | % | |||||||||||||
Uncertain tax positions | 9 | 0.0 | % | 226 | -0.6 | % | (984 | ) | 2.7 | % | ||||||||||||||
Foreign withholding tax | 116 | -0.3 | % | 420 | -1.0 | % | 0 | 0.0 | % | |||||||||||||||
Foreign rate differential | (1,573 | ) | 4.6 | % | (1,448 | ) | 3.6 | % | (1,524 | ) | 4.2 | % | ||||||||||||
Executive compensation expense | 1,517 | -4.4 | % | 0 | 0.0 | % | 0 | 0.0 | % | |||||||||||||||
Transaction related expense | (1,454 | ) | 4.3 | % | 0 | 0.0 | % | 0 | 0.0 | % | ||||||||||||||
Benefit for income taxes | $ | (9,694 | ) | 28.4 | % | $ | (5,318 | ) | 13.1 | % | $ | (12,941 | ) | 35.6 | % | |||||||||
Significant components of the Company’s deferred tax assets (liabilities) as of December 31, 20212023 and 20202022 are set forth as follows:
64
As of December 31, | ||||||||
2021 | 2020 | |||||||
(in thousands) | ||||||||
Deferred tax assets: | ||||||||
Net operating loss carry-forward | $ | 11,081 | $ | 10,604 | ||||
Credit carry-forward | 2,802 | 2,468 | ||||||
Interest expense limitation carry-forward | 10,997 | 7,811 | ||||||
Non-deductible reserves | 374 | 520 | ||||||
Accruals and other temporary differences | 1,046 | 1,047 | ||||||
Stock compensation | 0 | 698 | ||||||
Property and equipment | 1,018 | 1,089 | ||||||
Gross deferred tax assets | 27,318 | 24,237 | ||||||
Less Valuation allowance | (7,731 | ) | (7,164 | ) | ||||
Total deferred tax assets (after valuation allowance) | 19,587 | 17,073 | ||||||
Deferred tax liabilities: | ||||||||
Property and equipment | (4,151 | ) | (4,089 | ) | ||||
Intangible assets | (40,754 | ) | (49,461 | ) | ||||
Goodwill | (7,432 | ) | (6,241 | ) | ||||
Debt discount | (3,972 | ) | — | |||||
Total deferred tax liabilities | (56,309 | ) | (59,791 | ) | ||||
Net deferred tax liabilities | $ | (36,722 | ) | $ | (42,718 | ) | ||
KORE Group Holdings, Inc.
Notes to Consolidated Financial Statements| December 31, | |||||||||||
| (in thousands) | 2023 | 2022 | |||||||||
| Deferred tax assets: | |||||||||||
| Net operating loss carry-forward | $ | 17,221 | $ | 13,617 | |||||||
| Credit carryforward | 1,325 | 1,386 | |||||||||
| Interest expense limitation carryforward | 21,978 | 15,844 | |||||||||
| Non-deductible reserves | 1,571 | 339 | |||||||||
| Accruals and other temporary differences | 2,622 | 2,835 | |||||||||
| Stock compensation | 1,665 | 1,164 | |||||||||
| Capitalized R&D Costs | 2,301 | — | |||||||||
| Lease liability | 2,745 | 2,780 | |||||||||
| Property and equipment | 1,849 | 1,007 | |||||||||
| Gross deferred tax assets | $ | 53,277 | $ | 38,972 | |||||||
| Less: valuation allowance | (33,454) | (16,177) | |||||||||
| Total deferred tax assets (after valuation allowance) | $ | 19,823 | $ | 22,795 | |||||||
| Deferred tax liabilities: | |||||||||||
| Property and equipment | (1,442) | (1,738) | |||||||||
| Intangible assets | (22,193) | (33,117) | |||||||||
| Goodwill | (3,569) | (5,914) | |||||||||
| Change in accounting method | (719) | (1,378) | |||||||||
| Right-of-use asset | (2,357) | (2,514) | |||||||||
| Research and development costs | (3,338) | (3,327) | |||||||||
| Total deferred tax liabilities | $ | (33,618) | $ | (47,988) | |||||||
| Net deferred tax liabilities | $ | (13,795) | $ | (25,193) | |||||||
The valuation allowance increased by $0.6$17.3 million during 2021,2023, primarily due to an increase in U.S. disallowed interest expense carryover and U.S. state tax attributes deemed not realizable. In determining the need for a valuation allowance, the Company has given consideration to its worldwide cumulative loss position when assessing the weight of the sources of taxable income that can be used to support the realization of deferred tax assets. The Company has assessed, on a jurisdictional basis, the available means of recovering deferred tax assets, including the ability to carry-backcarry back net operating losses, the existence of reversing temporary differences, the availability of tax planning strategies and available sources of future taxable income. The Company has also considered the ability to implement certain strategies that would, if necessary, be implemented to accelerate taxable income and use expiring deferred tax assets. The Company believes it is able to support the deferred tax assets recognized as of the end of the year based on all of the available evidence.
As of December 31, 2021,2023, the Company has U.S. federal and state tax net operating loss carryforwards of approximately $3.0$48.7 million and $39.7 million respectively, which may be available to offset future income tax liabilities and expire at various dates beginning in 2032 through 2041.2043. Additionally, the Company has U.S. federal and state tax net operating loss carryforwards of approximately $1.2$5.7 million and $13.8 million respectively, which carryforward indefinitely. Additionally, the Company has generated $33.8$57.0 million of foreign operating loss carryforwards which expire at various dates.
As of December 31, 2021,2023, the Company has U.S.did not have any federal and state research and development tax credit carryforwards of $1.8 million and $0.1 million respectively which expire beginning in 2035 through 2041. Additionally, thecredits carried forward. The Company has $0.9$1.6 million of foreign research and development tax credit carryforwards.
Due to provisions of the Tax Cuts and Jobs Act of 2017, the Company has a carryforward of U.S. disallowed interest expense of $44.7$96.3 million, which has an indefinite carryforward period.
Utilization of the NOL carryforwards may be subject to limitation under Section 382 of the Internal Revenue Code of 1986 due to ownership change limitations that have occurred previously or that could occur in the future. These ownership changes may limit the amount of NOL and tax credit carryforwards that can be utilized annually to offset future taxable income and tax, respectively. There could be additional ownership changes in the future, which may result in additional limitations on the utilization of the NOL and tax credit carryforwards.
For taxable years beginning after January 1, 2018,December 31, 2017, taxpayers are subjected to the global intangible low-taxed income provisions, or GILTI provisions. The GILTI provisions require the Company to currently recognize in U.S. taxable income a deemed dividend inclusion of foreign subsidiary earnings in excess of an allowable return on the foreign subsidiary’s tangible assets. The ability to benefit from a deduction and foreign tax credits against a portion of the GILTI income may be limited under the GILTI rules as a result of the utilization of net operating
65
losses, foreign sourced income, and other potential limitations within the foreign tax credit calculation. For each of the years ended December 31, 20212023, and 2020,2022 the Company did 0t recordrecorded an income tax charge related to GILTI.GILTI of $0.3 million. The Company has made an accounting policy election, as allowed by the SEC and FASB, to recognize the impacts of GILTI within the period incurred. Accordingly, no U.S. deferred taxes are provided on GILTI inclusions of future foreign subsidiary earnings.
As of December 31, 2021,2023, the Company has not provided U.S. taxes on the undistributed earnings of its foreign subsidiaries that it considers indefinitely reinvested. This indefinite reinvestment determination is based on the future operational and capital requirements of the Company’s domestic and foreign operations. The Company expects that the cash held by its foreign subsidiaries of $8.6
$6.8 million as of December 31, 20212023 will continue to be used for its foreign operations and, therefore, does not anticipate repatriating these funds.
The Company conducts business globally and, as a result, its subsidiaries file income tax returns in U.S. federal and state jurisdictions and various foreign jurisdictions. In the normal course of business, the Company may be subject to examination by taxing authorities throughout the world, including such major jurisdictions as Australia, Canada, Malta, the Netherlands, the United Kingdom, and the United States. Since the Company is in a U.S. state loss carry-forward position, the Company is generally subject to U.S. federal and state income tax examinations by tax authorities for all years for which a loss carry-forwardcarryforward is utilized. As of December 31, 2021,2023, the Company iswas not under income tax examination in anyjurisdiction.
During the ordinary course of business, there are many transactions and calculations for which the ultimate tax determination is uncertain. The Company establishes reserves for
tax-related
uncertainties based on estimates of whether, and the extent to which, additional taxes will be due. These reserves are established when the Company believes that certain positions might be challenged despite its belief that its tax return positions are fully supportable. The Company adjusts these reserves in light of changing facts and circumstances, such as the outcome of tax examinations.The following table presentssets forth a reconciliation of the total amounts of unrecognized tax benefits, excluding interest and penalties, included onin accrued liabilities and other noncurrent liabilities in the Company’s consolidated balancesheets.
| (in thousands) | December 31, 2023 | December 31, 2022 | |||||||||
| Unrecognized tax benefits as of the beginning of the year | $ | 8,574 | $ | 8,132 | |||||||
| Additions for tax positions of current year | 192 | 442 | |||||||||
| Unrecognized tax benefits as of the end of the year | $ | 8,766 | $ | 8,574 | |||||||
For the Year s Ended December 31, | ||||||||
2021 | 2020 | |||||||
(in thousands) | ||||||||
Unrecognized tax benefits at the beginning of the year | $ | 3,867 | $ | 3,658 | ||||
Additions for tax positions of current year | — | — | ||||||
Additions for tax positions of prior years | 0 | 209 | ||||||
Reductions for tax positions of prior years | — | — | ||||||
Expirations statutes of limitation | — | — | ||||||
Unrecognized tax benefits at the end of the year | $ | 3,867 | $ | 3,867 | ||||
The Company and its subsidiaries have accumulated significant intercompany obligations owed between and among its various subsidiaries and itself. During the year ended December 31, 2022, the Company completed its assessment of its U.S. and non-U.S. income and non-income tax risks related to these obligations. These obligations are included in both current and prior period unrecognized tax benefits associated with the intercompany balances.
If the unrecognized tax benefit balance as of December 31, 20212023 and 2022 were recognized, itthey would decreaseeach separately result in a tax benefit for each year, which would impact the Company’s effective tax rate.rate for each year. The Company does not anticipate any material changes to its unrecognized tax benefits within the next 12 months.
The Company recognizes interest and penalties accrued related to unrecognized tax benefits as income tax expense. During the years ended December 31, 20212023 and 20202022 the Company recognized $9 thousandapproximately $1.1 million and $17 thousandan immaterial amount in interest and penalties, respectively. The Company had $26 thousandaccrued approximately $1.8 million and $17 thousand$1.0 million of interest and penalties accrued atas of December 31, 20212023 and 2020,2022, respectively.
NOTE 14 – NET LOSS PER SHARE
The table below sets forth a reconciliation of the basic and diluted earnings per share (“EPS”) calculations for the years ended December 31, 2023 and 2022:
66
| For the Year Ended December 31, | |||||||||||
| ($ in thousands, except share and per share amounts) | 2023 | 2022 | |||||||||
| Numerator: | |||||||||||
| Net loss | $ | (167,042) | $ | (106,200) | |||||||
| Denominator: | |||||||||||
| Weighted average shares outstanding - basic | 83,808,227 | 75,710,904 | |||||||||
Effect of dilutive equity awards (1) | — | — | |||||||||
| Weighted average shares outstanding - diluted | 83,808,227 | 75,710,904 | |||||||||
| Net loss per share: | |||||||||||
| Basic | $ | (1.99) | $ | (1.40) | |||||||
| Diluted | $ | (1.99) | $ | (1.40) | |||||||
(1) Due to the Company’s net loss, all unvested equity awards and the private placement warrants are anti-dilutive. The dilutive convertible instruments of the Backstop Notes are out of the money.
In determining the weighted average shares outstanding for the year ended December 31, 2023 for both basic and diluted earnings per share, the Company included the Penny Warrants issued to Searchlight in transactions dated November 15, 2023 and December 13, 2023, as the common shares of stock that would be issuable upon the exercise of the warrants are issuable for nominal consideration of one cent per share of common stock or cashless exercise at the option of Searchlight. These warrants were exercisable immediately upon issuance, although no warrants had been exercised as of December 31, 2023.
Set forth in the table below is the number of securities not included in the computation of diluted shares outstanding because the effect would be anti-dilutive:
| For the Year Ended December 31, | |||||||||||
| 2023 | 2022 | ||||||||||
| Grants of RSUs with service only (i.e., time-vesting) conditions | 6,193,746 | 3,552,416 | |||||||||
| Common stock issuable under the Backstop Notes | 9,600,031 | 9,600,031 | |||||||||
| Private placement warrants | 272,779 | 272,779 | |||||||||
Unvested restricted stock units with both “time and performance conditions” and / or “time and market conditions” are excluded from the disclosure of the number of potentially anti-dilutive securities because neither the performance nor market conditions were met at the end of the reporting periods. Therefore, these securities are not considered to be contingently issuable for purposes of dilutive EPS or anti-dilution calculations.
NOTE 15 – SHARES OF COMMON STOCK
The following table sets forth the changes in shares of common stock during the years ended December 31, 2023 and 2022:
67
| December 31, | |||||||||||
| 2023 | 2022 | ||||||||||
| Common stock issued, beginning of year | 76,292,241 | 72,027,743 | |||||||||
| Common stock issued pursuant to acquisition | 10,000,000 | 4,212,246 | |||||||||
| Vesting of restricted stock units | (1,284,939) | 52,252 | |||||||||
| Stock awards cancelled for employee tax withholdings | (190,882) | — | |||||||||
| Common stock issued, end of year | 84,816,420 | 76,292,241 | |||||||||
| Treasury stock, at cost, beginning of year | — | — | |||||||||
| Purchase of treasury stock | (5,000,000) | — | |||||||||
| Treasury stock, at cost, end of year | (5,000,000) | — | |||||||||
| Common stock outstanding, end of the year | 79,816,420 | 76,292,241 | |||||||||
NOTE 16 – MANDATORILY REDEEMABLE PREFERRED STOCK - DUE TO AFFILIATE, NET
The Company has authorized 35,000,000 shares of preferred stock, and has issued to a single investor (Searchlight) who is currently the sole holder of 152,857 shares of Series A-1 preferred stock, which is mandatorily redeemable for cash payable to the holder on November 15, 2033. The number of issued and outstanding shares are currently equivalent. The Series A-1 preferred stock has a liquidation preference of $1,000 per share. No amounts are redeemable during the five years subsequent to December 31, 2023.
The following table sets forth the changes in shares of Series A-1 preferred stock during the year ended December 31, 2023:
| ($ in thousands) | Shares | Carrying amount | |||||||||
| Preferred stock, beginning of year | — | — | |||||||||
| Preferred stock issued November 15, 2023 | 150,000 | $ | 150,000 | ||||||||
| Preferred stock issued December 13, 2023 | 2,857 | 2,857 | |||||||||
Preferred stock issuance costs (1) | N/A | (6,087) | |||||||||
Allocation of proceeds to preferred stock (2) | N/A | (5,327) | |||||||||
| Preferred stock, end of year | 152,857 | $ | 141,443 | ||||||||
(1) Issuance costs were deemed to be allocated based on Day 1 relative fair values of the financial instruments issued, to which was allocated approximately 97% to the preferred stock, which costs presented above were capitalized and will be amortized through the date of mandatory redemption, and 3% to the Penny Warrants, which amount was immaterial and was expensed immediately upon issuance of the Penny Warrants.
(2) The redemption amount of the Series A-1 preferred stock of approximately $152.9 million differs from the carrying amount, above, by approximately $5.3 million, which difference is attributable to an allocation of proceeds received to these shares upon issuance, as this liability is recorded based on its initial fair value as a Level 2 instrument in the fair value hierarchy, which involved an allocation of proceeds between the preferred stock as a freestanding financial instrument and the associated Penny Warrants issued concurrently to the same investor as a freestanding derivative. See Note 11 - Fair Value Measurements.
The allocation of proceeds will be accreted so that the carrying value and redemption amount will be equal on the mandatory redemption date of the preferred stock on November 15, 2033. No accretion was recognized during the year ended December 31, 2023 due to immateriality.
The Company has the ability to redeem the Series A-1 preferred stock before its mandatory redemption date, at 104% of the liquidation preference per share plus accrued and unpaid dividends on or before the first anniversary of the closing date, 102% of the liquidation preference per share plus accrued and unpaid dividends on or before the second anniversary but after the first anniversary of the closing date, 101% of the liquidation preference per share plus accrued and unpaid dividends on or before the third anniversary but after the second anniversary of the closing date, and 100% of the liquidation preference per share plus accrued and unpaid dividends on or after the third anniversary of the closing date.
The Series A-1 preferred stock accrues dividends at a rate of 13% per year, compounded and payable quarterly, though cash payment of dividends must be declared by the Board, and are otherwise accrued.
Searchlight is an affiliate of the Company (see Note 20 — Related Party Transactions).
68
NOTE 17 – DERIVATIVES
Derivatives are complex financial instruments. The Company does not use derivatives to manage financial risks or as an economic hedge. The Company’s sole derivative instrument arose as part of the issuance of Series A-1 preferred stock to Searchlight, in which transaction Searchlight was also granted Penny Warrants (see Note 10 — Warrants on Common Stock). The Penny Warrants are considered a freestanding derivative instrument, as they are separable and legally detachable from the Series A-1 preferred stock, were issued for nominal or no apparent consideration, and have the essential characteristics inherent in a derivative instrument of a notional amount, an underlying security, and a mechanism for net settlement.
The following table sets forth the details of the derivative instrument presented on the consolidated balance sheets and notional amount as of December 31, 2023 (1):
| Derivatives Not Designated as Hedging Instruments | Number of Warrants (Notional Amount) | Warrant Liability | Exercise Price Per Share | |||||||||||||||||
| ($ in thousands, except for per share amounts) | ||||||||||||||||||||
| Penny warrants issued to Searchlight | 12,024,711 | $ | 11,664 | $ | 0.01 | |||||||||||||||
(1) No such instruments existed as of December 31, 2022.
The gains and losses arising from this derivative instrument in the consolidated statements of operations and comprehensive loss for the year ended December 31, 2023 (1) is set forth as follows:
| Derivatives Not Designated as Hedging Instruments | Net Realized Gains (Losses) on Derivative Instruments | Net Change in Unrealized Gain (Loss) on Derivative Instruments (2) | ||||||||||||
| (in thousands) | ||||||||||||||
| Penny warrants issued to Searchlight | $ | — | $ | (6,469) | ||||||||||
(1) No such instruments existed during the year ended December 31, 2022; therefore, there were no gains or losses from such instruments during that year.
(2) The consolidated statements of operations and comprehensive loss include the above unrealized loss on the Penny Warrants as well as the immaterial unrealized loss on the Private Placement Warrants in the “change in fair value of warrant liabilities to affiliates”.
NOTE 18 – CONSOLIDATED FINANCIAL STATEMENT DETAILS
The following table sets forth the details of prepaid expenses and other current assets included on the consolidated balance sheets as of December 31, 2023 and 2022:
| December 31, | |||||||||||
| (in thousands) | 2023 | 2022 | |||||||||
| Prepaid expenses | $ | 7,411 | $ | 8,362 | |||||||
| Other current assets | 2,635 | 523 | |||||||||
| Deposits | 2,061 | 2,864 | |||||||||
| Income taxes receivable | 1,499 | 502 | |||||||||
| Indirect sales taxes receivable | 616 | 1,735 | |||||||||
| Total prepaid expenses and other current assets | $ | 14,222 | $ | 13,986 | |||||||
The following table sets forth the details of accrued liabilities included on the consolidated balance sheets as of December 31, 2023 and 2022:
69
Notes to strengthen the United States economy and fund a nationwide effort to curtail the effect of COVID-19. The CARES Act provides sweeping tax changes in response to the COVID-19 pandemic. The CARES Act allowed the Company to defer the payment of the employer portion of its FICA taxes to 2021 and 2022; deduct additional US interest expense for 2019 and 2020; accelerate a refund of alternative minimum tax (“AMT”) credits; and increase its permitted level of 2019 federal net operating loss carry-forward.Consolidated Financial Statements
| December 31, | |||||||||||
| (in thousands) | 2023 | 2022 | |||||||||
| Accrued other expenses | $ | 8,350 | $ | 3,970 | |||||||
| Accrued cost of revenue | 4,728 | 4,091 | |||||||||
| Accrued payroll and related | 4,623 | 4,804 | |||||||||
| Sales and other taxes payable | 4,999 | 2,813 | |||||||||
| Income taxes payable | 615 | 207 | |||||||||
| Finance lease obligation | 106 | 115 | |||||||||
| Total accrued liabilities | $ | 23,421 | $ | 16,000 | |||||||
NOTE 1119 – COMMITMENTS AND CONTINGENCIES
Indirect Taxes
The Company, leasesassisted by third party experts, is currently conducting a review of potential obligations surrounding indirect taxes, specifically, sales and telecommunications taxes. At the current time, the Company has had no actual or threatened claims arising from any governmental authority in any taxing jurisdiction in the United States where the Company does business regarding claims for any indirect tax liabilities emerging from any potential sales and telecommunications tax that may be owed to any such state or local governments in the various office spaces under non-cancellable operating leases expiring through 2029. Rent expenseaforementioned taxing jurisdictions. However, a liability for years ended December 31, 2021, 2020sales and 2019 was $2.7 million, $2.5 million,telecommunications tax may be asserted by a governmental authority if that authority determines that the Company is engaged in often-taxable “telecommunications services” rather than providing “internet access,” which is not taxable in any jurisdiction by federal law. The determination of if a service provided is defined as “telecommunications services” or “internet access” may be highly subjective, open to interpretation, and $2.3 million, respectively.
can depend upon extremely intricate technical factors and specific fact patterns which may vary by customer and use case. Furthermore, some taxing jurisdictions may not levy taxes on telecommunications services, while others do, and some taxing jurisdictions are at the state level, while others exist at the local level, including by municipality in some states.The future minimum lease payments under operating leasesCompany believes that it is probable that a liability for sales and telecommunications tax may exist. The Company has estimated the possible range of loss in this matter as of December 31, 20212023 as between $1.8 millionand$14.9 million, with anticipation of recoveries from third parties at the low end, and no recoveries from third parties anticipated at the high end of the range, with interest and penalties assessed at both the low and high ends of the range, with penalties reduced in states where the Company intends to seek a “voluntary disclosure arrangement” as described further below. Although the Company’s contracts with customers generally state that the customer must later pay associated taxes if such taxes become an issue, there is always a risk of customer non-payment. Due to the complexities involved in its number of customers, use cases, and jurisdictions in which it does business, along with the treatment of potential indirect taxes varying in each jurisdiction, and collectability estimates, this estimate may ultimately be resolved at either a greater or lesser amount than the estimated range.
Additionally, mitigating factors may exist, such as good-faith reseller certificates, which the Company has previously obtained in instances where the use case indicates that the customer is a reseller, private letter rulings that the Company may request from certain states where the specific tax law is unclear but may be resolved in the Company’s favor, and voluntary disclosure arrangements whereby the Company may determine that it is probable that tax would be owed and enter into an agreement with a taxing jurisdiction to pay back taxes and avoid penalties that would otherwise likely apply.
The Company expects this matter to be settled within the next twelve months, and thus, the net contingent liability estimate of $1.8 million has been accrued in “accrued liabilities” within “current liabilities” of the Company’s consolidated balance sheet for the next five years is as follows:
(in ‘000) | Amount | |||
2022 | $ | 2,924 | ||
2023 | 1,904 | |||
2024 | 1,495 | |||
2025 | 1,170 | |||
2026 | 958 | |||
Thereafter | 3,412 | |||
Total | $ | 11,863 | ||
year ended December 31, 2023. The Companylow end of the range of expense net of recoveries has capital lease obligationsbeen recorded in the Netherlands for hardwareamount of $1.8 million and software leases.
(in ‘000) | Amount | |||
2022 | $ | 207 | ||
2023 | 143 | |||
2024 | 119 | |||
2025 | 26 | |||
2026 | 0 | |||
Total minimum lease payments | $ | 495 | ||
Interest expense | (40 | ) | ||
Total | $ | 455 | ||
Purchase Obligations
The Company has vendor commitments primarily relating to carrier and open purchase obligations that the Company incurs in the ordinary course of business. As of December 31, 2021,2023, the purchase commitments were as follows:
70
KORE Group Holdings, Inc.
(in ‘000) | Amount | |||
2022 | $ | 21,144 | ||
2023 | 9,446 | |||
2024 | 1,245 | |||
2025 | 1,245 | |||
2026 | 0 | |||
Thereafter | 0 | |||
Total | $ | 33,080 | ||
Notes to Consolidated Financial Statements
| ($ in thousands) | |||||
| 2024 | $ | 30,745 | |||
| 2025 | 10,688 | ||||
| 2026 | 5,423 | ||||
| 2027 | 4,773 | ||||
| 2028 | 5,000 | ||||
| Thereafter | 2,273 | ||||
| Total | $ | 58,902 | |||
Self-Insurance
The Company is self-insured for certain employee health benefits in the United States and has purchased stop-loss insurance in order to establish certain limits to its exposure on a per-claim basis, both individually and in the aggregate.
The Company provides for estimated costs to settle both known claims and claims “incurred but not yet reported” by recording a net liability for the foregoing, considering its retention and stop loss limits. Liabilities of the Company associated with these claims are estimated, in part, by considering the frequency and severity of historical claims, both specific to the Company, as well as industry-wide loss experience and other actuarial assumptions. The Company determines its insurance obligations with the assistance of actuarial firms. Since there are many estimates and assumptions involved in recording insurance liabilities, differences between actual future events and prior estimates and assumptions could result in adjustments to these liabilities.
Defined Contribution Plan - Employer Contributions
The Company sponsors defined contribution plans (the “Plans”) that cover our domestic and international employees following the completion of an eligibility period. Under the Plans, participating employees may defer a portion of their pretax earnings up to the limits provided by local statutory requirements. The Company makes matching contributions, subject to limits of the base compensation that a participant contributes to the Plan. The Company’s matching contributions vest over up to a maximum of four years from the participant’s date of hire. The Company records its portion of matching contributions within selling, general, and administrative expenses. The Company contributed $0.6 million and $0.5 million for the years ended December 31, 2023 and 2022, respectively.
Legal Proceedings
From time to time, the Company is involvedmay be a party to litigation relating to claims arising in litigation arising out of the ordinarynormal course of our business. There are no material legal proceedings, other than ordinary routine litigation incidental to the business, to which the Company or any of the Company’s subsidiaries are a party or of which any of the Company or the Company’s subsidiaries’ property is subject.
(in ‘000) | December 31, 2021 | December 31, 2020 | ||||||
Prepaid deposits | $ | 1,030 | $ | 1,734 | ||||
Prepaid expenses | 6,418 | 3,695 | ||||||
Other receivables | 0 | 0 | ||||||
Total Prepaid expenses and other receivables | $ | 7,448 | $ | 5,429 | ||||
As of December 31, 2021,2023, the Company authorized up to 350,000,000 shareswas not aware of capital stock, consisting of 315,000,000 shares of common stock and 35,000,000 shares of preferred stock. As of December 31, 2021, 72,027,743 shares of common stock and 0 shares of preferred stock were issued and outstanding.any legal claims that could materially impact its financial condition.
Searchlight beneficially owned approximately 13% of the SeriesA-1Preferred Stock described previously represent the terms and rights prior to the closing of the Business Combination.
Amount (in ‘000) | Series A | Series A-1 | Series B | |||||||||
Accumulated and unpaid, December 31, 2019 | $ | 25,610 | $ | 8,794 | $ | 25,338 | ||||||
Accumulated | 9,202 | 9,814 | 8,572 | |||||||||
Distributed | 0 | 0 | 0 | |||||||||
Accumulated and unpaid, December 31, 2020 | $ | 34,812 | $ | 18,608 | $ | 33,910 | ||||||
Accumulated | 7,656 | 8,241 | 6,925 | |||||||||
Distributed | (42,468 | ) | (26,849 | ) | (40,835 | ) | ||||||
Accumulated and unpaid, December 31, 2021 | $ | 0 | $ | 0 | $ | 0 | ||||||
Number of Options | Weighted Average Grant Date Fair Value per Option (Amount) | Weighted Average Exercise Price (Amount) | Weighted Average Remaining Contractual Term (Years) | |||||||||||||
Balance, December 31, 2018 | 414,434 | $ | 15.80 | $ | 141.53 | 9.3 | ||||||||||
Granted | 52,083 | 15.91 | 141.53 | |||||||||||||
Exercised | — | — | — | |||||||||||||
Forfeited | (67,366 | ) | 15.80 | 141.53 | ||||||||||||
Expired | — | — | — | |||||||||||||
Balance, December 31, 2019 | 399,151 | $ | 15.82 | 141.53 | 8.4 | |||||||||||
Granted | 64,064 | 13.50 | 141.53 | |||||||||||||
Exercised | — | — | — | |||||||||||||
Forfeited | (30,715 | ) | 15.80 | 141.53 | ||||||||||||
Expired | — | — | — | |||||||||||||
Balance, December 31, 2020 | 432,500 | $ | 15.45 | $ | 141.53 | 7.7 | ||||||||||
Granted | — | — | — | |||||||||||||
Exercised | — | — | — | |||||||||||||
Forfeited | — | — | — | |||||||||||||
Expired | — | — | — | |||||||||||||
Cancelled | (432,500 | ) | (15.45 | ) | (141.53 | ) | (7.7 | ) | ||||||||
Balance, December 31, 2021 | 0 | $ | 0 | $ | 0 | — | ||||||||||
(in ‘000) | December 31, 2021 | December 31, 2020 | ||||||
Total Stock Compensation Expense | $ | 4,564 | $ | 1,161 | ||||
Unrecognized Compensation Cost | 0 | 3,416 | ||||||
Remaining recognition period (in years) | — | 2.7 | ||||||
December 31, 2021 | December 31, 2020 | |||||||
Range of Exercise Prices | 0 | $ | 80.87 -$202.18 | |||||
Number | 0 | 153,898 | ||||||
Weighted Average Remaining Contractual Term (in years) | — | 7.3 | ||||||
Weighted Average Exercise Price | $ | 0 | $ | 141.53 | ||||
Transactions with affiliates of one
(in ‘000) | December 31, 2021 | December 31, 2020 | December 31, 2019 | |||||||||
Numerator: | ||||||||||||
Net loss attributable to the Company | $ | (24,453 | ) $ | (35,201 | ) $ | (23,443 | ) | |||||
Less cumulative earnings to preferred | (22,822 | ) | (26,900 | ) | (21,647 | ) | ||||||
Add premium on preferred conversion to common shares | 4,074 | — | — | |||||||||
Net income (loss) attributable to common stockholders | (43,201 | ) | (62,101 | ) | (45,090 | ) | ||||||
Denominator: | ||||||||||||
Weighted average common shares and warrants outstanding | ||||||||||||
Basic (in number) | 41,933,050 | 31,650,173 | 31,169,435 | |||||||||
Diluted (in number) | 41,933,050 | 31,650,173 | 31,169,435 | |||||||||
Net loss per unit attributable to common stockholder | ||||||||||||
Basic | $ | (1.03 | ) | $ | (1.96 | ) | $ | (1.45 | ) | |||
Diluted | $ | (1.03 | ) | $ | (1.96 | ) | $ | (1.45 | ) | |||
For the years ended (number of shares) | December 31, 2021 | December 31, 2020 | December 31, 2019 | |||||||||
Series C Convertible Preferred Stock | 2,566,186 | 2,566,186 | 2,566,186 | |||||||||
Stock Options | 432,500 | 432,500 | 399,151 | |||||||||
Common stock issued under the Backstop Agreement | 9,600,031 | — | — | |||||||||
Aggregate expenses incurred for these transactions which have been recorded at the exchange amount, representing the amount of consideration established and agreed by the related parties, was $0.2 million, $0.2were $0.3 million and $0.3 million for each of the years ended December 31, 2023, and 2022, respectively, and are recorded as a component of “selling, general, and administrative expense incurred with affiliate” in the consolidated statements of operations and comprehensive loss.
The same wholly-owned subsidiary had an informal services agreement with a separate company controlled by two key members of the Company’s management team. The service agreement with this affiliate was terminated on February 14, 2023.
This services agreement was entered into to render technical assistance services to purchase and deliver telecommunication equipment to the Company’s clients in Brazil, for which the affiliate was paid a nominal monthly fixed fee plus a fee of 7% of the gross amount of the cost incurred to purchase and deliver telecommunication equipment to the Company’s clients in Brazil. In 2023, the Company incurred and paid $0.1 million to this affiliate. In 2022, subsequent to the Company’s acquisition of BMP, the Company incurred and paid $2.3 million to this affiliate. These expenses are recorded as a component of “selling, general, and administrative expense incurred with affiliate” in the consolidated statements of operations and comprehensive loss for the years ended December 31, 2021, 20202023, and 2019,2022, respectively. The amount was recorded under general and administrative expenses in the consolidated statements of operations.
The following is a summarytable sets forth the geographic location of the amounts recorded under due to related parties in the consolidated balance sheets at December 31, 2021 and 2020:
(in ‘000) | December 31, 2021 | December 31, 2020 | ||||||
Interfusion B.V. | 0 | 985 | ||||||
T-Fone B.V. | 0 | 630 | ||||||
| December 31, | |||||||||||||||||
| ($ in thousands) | 2023 | 2022 | |||||||||||||||
| Goodwill: | |||||||||||||||||
| United States | $ | 173,916 | 59 | % | $ | 248,928 | 67 | % | |||||||||
| Switzerland | 112,203 | 38 | % | 112,203 | 30 | % | |||||||||||
| All other countries | 8,855 | 3 | % | 8,575 | 2 | % | |||||||||||
| Total goodwill | $ | 294,974 | 100 | % | $ | 369,706 | 100 | % | |||||||||
| Intangible assets, net: | |||||||||||||||||
| United States | $ | 118,833 | 71 | % | $ | 136,572 | 71 | % | |||||||||
| Switzerland | 25,277 | 15 | % | 36,417 | 19 | % | |||||||||||
All other countries (1) | 23,477 | 14 | % | 19,515 | 10 | % | |||||||||||
| Total intangible assets, net | $ | 167,587 | 100 | % | $ | 192,504 | 100 | % | |||||||||
| Property and equipment, net: | |||||||||||||||||
| United States | $ | 7,070 | 65 | % | $ | 7,060 | 59 | % | |||||||||
| Netherlands | 2,387 | 22 | % | 2,559 | 22 | % | |||||||||||
All other countries (1) | 1,499 | 14 | % | 2,280 | 19 | % | |||||||||||
| Total property and equipment, net | $ | 10,956 | 100 | % | $ | 11,899 | 100 | % | |||||||||
| Operating lease right-of-use assets: | |||||||||||||||||
| United States | $ | 7,612 | 81 | % | $ | 8,729 | 87 | % | |||||||||
All other countries (1) | 1,755 | 19 | % | 1,290 | 13 | % | |||||||||||
| Total operating lease right-of-use assets | $ | 9,367 | 100 | % | $ | 10,019 | 100 | % | |||||||||
(1) No single country in “all other countries” exceeded 10% of the Company has paid all related party transactions resulting fromtotal balance where “all other countries” comprised more than a 10% concentration of the Business Combination.geographic location of long-lived assets as of December 31, 2023 and 2022.
NOTE 1822 – SUBSEQUENT EVENTS
The Company has completed an evaluation of all subsequent events through March 29, 2022 to ensure that these consolidated financial statements include appropriate disclosure of events both recognized in the consolidated financial statements and events which occurred but were not recognized in the consolidated financial statements. Except as described below, the Company has concluded that no subsequent event hasevents have occurred that requiresrequire disclosure.
(in thousands) | ||||
Cash, including closing cash and working capital adjustments | $ | 47,336 | ||
Fair value of KORE common stock issued to sellers (4,212,246 shares) | 23,294 | |||
Total consideration | $ | 70,630 | ||
Assets acquired: | ||||
Cash | 1,996 | |||
Accounts receivable | 3,115 | |||
Inventories | 1,323 | |||
Prepaid expenses and other receivables | 821 | |||
Property and equipment | 201 | |||
Intangible assets | 30,060 | |||
Total Assets acquired | 37,516 | |||
Liabilities assumed: | ||||
Deferred tax liabilities | 7,611 | |||
Accounts payable and accrued liabilities | 2,607 | |||
Liabilities assumed | 10,218 | |||
Net identifiable assets acquired | 27,298 | |||
Goodwill (excess of consideration transferred over net identifiable assets acquired) | $ | 43,332 | ||
December 31, 2021 | December 31, 2020 | |||||||
Assets | ||||||||
Non-current assets | ||||||||
Investment in subsidiaries | $ | 261,012 | $ | 300,055 | ||||
Total non-current assets | 261,012 | 300,055 | ||||||
Total assets | $ | 261,012 | $ | 300,055 | ||||
Liabilities, temporary equity and stockholders’ equity | ||||||||
Long-term liabilities | ||||||||
Warrant liability | $ | 286 | $ | 15,944 | ||||
Total liabilities | 286 | 15,944 | ||||||
Temporary equity | ||||||||
Series A Preferred Stock; par value $1,000 per share; NaN authorized, issued and outstanding at December 31, 2021; 7,765,229 shares authorized, and 7,756,158 shares issued and outstanding at December 31, 2020 | 0 | 77,562 | ||||||
Series A-1 Preferred Stock; par value $1,000 per share; NaN authorized, issued and outstanding at December 31, 2021; 10,480,538 shares authorized, 7,862,107 shares issued and outstanding at December 31, 2020 | 0 | 78,621 | ||||||
Series B Preferred Stock; par value $1,000 per share; NaN authorized, issued and outstanding at December 31, 2021; 9,090,975 shares authorized, 9,090,975 shares issued and outstanding at December 31, 2020 | 0 | 90,910 | ||||||
Series C Convertible Preferred Stock; par value $1,000 per share; NaN authorized, issued and outstanding at December 31, 2021; 6,872,894 shares authorized, 2,566,186 shares issued and outstanding at December 31, 2020 | 0 | 16,802 | ||||||
Total temporary equity | 0 | 263,895 | ||||||
Stockholders’ equity | ||||||||
Common stock, voting; par value $0.0001 per share; 315,000,000 shares authorized, 72,027,743 shares issued and outstanding at December 31, 2021; 55,659,643 shares authorized, 30,281,520 shares issued and outstanding at December 31, 2020 | 7 | 3 | ||||||
Additional paid-in capital | 401,688 | 135,616 | ||||||
Accumulated other comprehensive loss | (3,331 | ) | (1,677 | ) | ||||
Accumulated deficit | (137,638 | ) | (113,726 | ) | ||||
Total stockholders’ equity | 260,726 | 20,216 | ||||||
Total liabilities, temporary equity and stockholders’ equity | $ | 261,012 | $ | 300,055 | ||||
ITEM 9. CHANGES IN AND DISAGREEMENTS WITH ACCOUNTANTS ON ACCOUNTING AND FINANCIAL DISCLOSURE
None.
For the years ended | December 31, 2021 | December 31, 2020 | December 31, 2019 | |||||||||
Equity in net loss of unconsolidated subsidiaries | $ | (29,177 | ) | $ | (27,716 | ) | $ | (23,678 | ) | |||
Change in fair value of warrant liability | (5,267 | ) | 7,485 | (235 | ) | |||||||
Loss before income taxes | (23,910 | ) | (35,201 | ) | (23,443 | ) | ||||||
Net loss | $ | (23,910 | ) | $ | (35,201 | ) | $ | (23,443 | ) | |||
Other comprehensive loss: | ||||||||||||
Foreign currency translation adjustment | (1,654 | ) | 2,116 | 517 | ||||||||
Comprehensive loss | $ | (25,564 | ) | $ | (33,085 | ) | $ | (22,926 | ) | |||
For the years ended | December 31, 2021 | December 31, 2020 | December 31, 2019 | |||||||||
Cash flows from operating activities | ||||||||||||
Net loss | $ | (23,910 | ) | $ | (35,201 | ) | $ | (23,443 | ) | |||
Adjustments to reconcile net loss to net cash provided by operating activities | — | — | ||||||||||
Equity in net loss of unconsolidated subsidiaries | 29,177 | 27,716 | 23,678 | |||||||||
Change in fair value of warrant liability | (5,267 | ) | 7,485 | (235 | ) | |||||||
Cash provided by operating activities | $ | 0 | $ | 0 | $ | 0 | ||||||
Cash flows from investing activities | ||||||||||||
Distribution from subsidiary | 5,947 | 200 | 80 | |||||||||
Cash provided by investing activities | $ | 5,947 | $ | 200 | $ | 80 | ||||||
Cash flows from financing activities | ||||||||||||
Repurchase of common stock | 0 | (200 | ) | (80 | ) | |||||||
Issuance of common stock, net of transaction costs | 223,968 | — | — | |||||||||
Settlement of preferred stock | (229,915 | ) | — | — | ||||||||
Cash used in financing activities | $ | (5,947 | ) | $ | (200 | ) | $ | (80 | ) | |||
Effect of exchange rate change on cash and cash equivalents | 0 | 0 | 0 | |||||||||
Change in cash and cash equivalents and restricted cash | 0 | 0 | 0 | |||||||||
Cash and cash equivalents and restricted cash, beginning of | 0 | 0 | 0 | |||||||||
Cash and cash equivalents and restricted cash, end of year | $ | 0 | $ | 0 | $ | 0 | ||||||
Non-cash investing and financing activities: | ||||||||||||
Equity issued for acquisition of Integron, LLC | $ | 0 | $ | 0 | $ | 7,000 | ||||||
Share-based payment awards issued to employees of subsidiaries | $ | 1,839 | $ | 1,161 | $ | 1,682 | ||||||
(i) CTAC merged with and into King LLC Merger Sub, LLC (“LLC Merger Sub”) (the “Pubco Merger”), with LLC Merger Sub being the surviving entity of the Pubco Merger and King Pubco, Inc. (“Pubco”) as parent of the surviving entity, (ii) immediately prior to the First Merger (as defined below), Cerberus Telecom Acquisition Holdings, LLC (the “Sponsor”) contributed 100% of
Evaluation of disclosure controls and procedures
Our management, with the participation of our Chief Executive Officer (principal executive officer) and our Chief Financial Officer (principal financial officer), evaluated, as of the end of the period covered by this Annual Report on Form
10-K,
the effectiveness of our disclosure controls and procedures (as defined in Rules13a-15(e)
and15d-15(e)
under the Exchange Act). Disclosure controls and procedures are controls and other procedures that are designed to ensure that information required to be disclosed in our reports filed or submitted under the Exchange Act is recorded, processed, summarized and reported within the time periods specified in the SEC’s rules and regulations. Disclosure controls and procedures include controls and procedures designed to ensure that information required to be disclosed in our reports filed under the Exchange Act is accumulated and communicated to management, including our Chief Executive Officer and our Chief Financial Officer, to allow timely decisions regarding required disclosure.Based on the evaluation of our disclosure controls and procedures, our Chief Executive Officer and our Chief Financial Officer concluded that our disclosure controls and procedures were not effective as of December 31, 2021,2023, due to the material weaknesses in our internal control over financial reporting described below. In light of this fact, our management has performed additional analyses, reconciliations, and other post-closing procedures and has concluded that, notwithstanding the material weaknesses in our internal control over financial reporting, the consolidated financial statements for the periods covered by and included in this Annual Report on FormU.S. GAAP.
10-K
fairly present, in all material respects, our financial position, results of operations and cash flows for the periods presented in conformity with Management’s annual report on internal control over financial reporting
13a-15(f)
andOur internal control over financial reporting includes those policies and procedures that: (i) pertain to the maintenance of records that, in reasonable detail, accurately and fairly reflect the transactions and dispositions of our assets; (ii) provide reasonable assurance that transactions are recorded as necessary to permit preparation of financial statements in accordance with generally accepted accounting principles, and that receipts and expenditures are being made only in accordance with authorizations of our management and directors; and (iii) provide reasonable assurance regarding prevention or timely detection of unauthorized acquisition, use or disposition of our assets that could have a material weaknesseseffect on the financial statements.
In accordance with guidance issued by the SEC, companies are permitted to exclude recently acquired businesses from the scope of their assessment of internal control over financial reporting for the first fiscal year in which the acquisition occurred. Accordingly, we have excluded the acquisition of certain assets of Twilio, Inc., including a carved-out workforce of over 50 employees and certain technology and customer relationships, net of certain associated liabilities, which was accounted for as an acquisition of a business (“Twilio’s IoT Business”) from the evaluation of the Company’s internal control over financial reporting as of December 31, 2023. The total assets and total revenue of Twilio’s IoT Business constituted approximately 2% and 7% of the Company’s total assets and total revenues, respectively, as of and for the year ended December 31, 2023.
The Company’s management, including the Chief Executive Officer and Chief Financial Officer, conducted an assessment of the effectiveness of its internal control over financial reporting as follows:
As previously reported, the reviewfollowing material weaknesses in internal control over financial reporting continued to exist as of the completeness and accuracy of the source data utilized and the appropriateness of assumptions used by the control owner.
•Information Technology General Controls –
73
Specifically, management did not design and maintain effective (i) program change management and program development controls for financial systems, including master databases, relevant to our financial reporting, (ii) logical user access controls to ensure appropriate segregation of duties and adequate restrictions of users, including those with privileged access, and (iii) controls related to critical data interfaces, data backups, and restorations.
•Financial Close Process – Management did not design and maintain effective control activities over certain routine aspects of financial reporting. Specifically, management did not design and maintain effective controls over the financial reporting process, including (i) management review controls over key disclosures and financial statement support schedules, (ii) the monthly financial close process, including the review of journal entries, account reconciliations, and analysis of recorded balances, (iii) the completeness and accuracy of information used by control owners in the operation of certain controls, (iv) retention of sufficient appropriate evidence to support the operation of control activities such as non-routine and complex transactions, and (v) multiple financial reporting systems that have not been integrated and which require extensive manual processes to consolidate.
•Taxation Process – Management did not design and maintain effective controls over the identification and monitoring of changes to tax positions in domestic and foreign tax jurisdictions to ensure the Company records its income tax expense and indirect tax obligations correctly.
•Subsidiary Operations – Management did not design and implement effective internal controls in a subsidiary operation related to the inventory and production management business cycle, and related financial reporting systems.
•Order to Cash Process – Management did not design and maintain effective controls to support proper revenue recognition. Specifically, management did not have effective controls over (i) new customer master data setup and validation procedures in the enterprise resource planning (“ERP”) and contract management systems, including the timely and accurate updating of the most recent contract terms, (ii) review and approval of sales orders for the correct pricing and contract terms and conditions, (iii) evidence of delivery in accordance with International Commercial Terms, or “incoterms,” (iv) review of revenue contracts for proper revenue recognition, and (v) manual customer invoice processes.
During 2023, the Company took substantive measures to remediate the design of controls associated with these material weaknesses. In many cases, the controls have only recently been put into operation. As such, we have not had a sufficient period to assess the operating effectiveness of the controls to conclude the material weaknesses have been remediated. As a result of the material weaknesses described above, management has concluded that, as of December 31, 2023, our internal control over financial reporting was ineffective.
As an EGC, we are exempt from the auditor attestation requirements of Section 404(b) of the Sarbanes-Oxley Act of 2002. As a result, our independent registered public accounting firm has not issued an attestation report with respect to our internal control over financial reporting as of December 31, 2023.
Planned Remediation Plan
ITGC Remediation Actions
•Develop a training program addressing ITGCs and policies, including educating control owners concerning the principles and requirements of each control, with a focus on those related to user access, change-management, and critical data interfaces, data backups and restoration over IT systems impacting financial reporting.
•Develop enhanced risk assessment procedures and controls related to changes in IT systems.
•Implement an IT management review and testing plan to monitor ITGCs with focus on systems supporting the financial reporting processes.
Financial Close Process Remediation Actions
•Implement a plan to integrate all legacy financial reporting systems into the Company’s main ERP to improve the reliability of financial reporting and makereduce manual detective controls and interventions. We expect that the global phased ERP integration will reduce the chance of error, including a significant reduction in manual journal entries, improve speed of the consolidation process, and increase transparency in financial reporting.
•Implement any additional remediation measures that may be necessary changesto ensure controls operate effectively.
74
Taxation Remediation Actions
•Hire qualified tax executive to lead global tax strategy and compliance. Continue to leverage external tax advisors in the preparation and review of the Company’s income tax and indirect tax obligations.
•Complete the integration actions to simplify the Company’s legal structure and attain a more optimal tax function. The Company plans to reduce the number of legal entities in its corporate structure to reduce the costs and risk associated with the current complex structure.
Subsidiary Operations Remediation Activities
•Continue evaluating the effectiveness of the controls over inventory valuation to verify that controls are operating consistently.
•Hire qualified supply chain personnel to direct the Company’s overall supply chain operations, including purchasing, inventory, selection of vendors, and distribution of finished goods.
•Complete the integration actions related to the design of controls, if any.
Order to Cash Remediation Actions
•Strengthen the controls around the contract management system and review of our internalsales orders for correct pricing.
•Automate invoicing solutions to consolidate and replace legacy systems and reduce the manual invoicing activities.
•Hire qualified personnel to execute the review of revenue contracts and implement controls over a sustained period of financial reporting cycles. for proper revenue recognition.
The Company believes these actions that we are taking are subjectwill be effective in remediating the deficiencies described above. As the Company continues to ongoing senior management review. We will not be ableevaluate and work to conclude whether the steps we are taking will fully remediate the material weakness in ourimprove its internal control over financial reporting, until we have completed ourmanagement may determine to take additional measures to address the deficiencies or determine to modify the remediation effortsplan described above. Until the remediation steps set forth above are fully implemented and operating for a sufficient period, the material weaknesses described above will continue to exist.
Remediation of Previously Reported Material Weaknesses
Management reported in Item 9A of its Annual Report on Form 10-K for the year ended December 31, 2022, material weaknesses related to controls at the entity-level and procure to pay. During the year ended December 31, 2023, management implemented measures on these processes to ensure that the control deficiencies contributing to the material weaknesses were remediated. Such remedial measures are as follows:
•Entity-Level Controls – Management designed and implemented entity-level controls impacting the (i) control environment, (ii) risk assessment procedures, including those related to fraud, and (iii) monitoring activities to prevent or detect material misstatements to the financial statements and assess whether the components of internal control were present and functioning.
•Procure to Pay Process – Management implemented requirements over the approval of purchase orders and subsequent evaluation of their effectiveness.
The effectiveness of our disclosure controls and procedures and our internal control over financial reporting is subject to various inherent limitations, including cost limitations, judgments used in decision making, assumptions about the likelihood of future events, the soundness of our systems, the possibility of human error, and the risk of fraud. Moreover, projections of any evaluation of effectiveness to future periods are subject to the risk that controls may become inadequate because of changes in conditions and the risk that the degree of compliance with policies or procedures may deteriorate over time. Because of these limitations, there can be no assurance that any system of disclosure controls and procedures or internal control over financial reporting will be successful in preventing all errors or fraud or in making all material information known in a timely manner to the appropriate levels of management.
Changes in internal controls
During the three monthsquarter ended December 31, 20212023, except for the changes discussed above related to remediation of material weaknesses, there have been no other changes in the Company’s internal control over financial reporting that have materially affected, or are reasonably likely to materially affect, ourthe Company’s internal control over financial reporting.
ITEM 9B. OTHER INFORMATION
During the quarter ended December 31, 2023, none of our directors or officers (as defined in Rule 16a-1(f) of the Exchange Act) adopted or terminated a Rule 10b5-1 trading arrangement or non-Rule 10b5-1 trading arrangement (as such terms are defined in Item 408 of Regulation S-K of the Securities Act.
ITEM 9C. DISCLOSURE REGARDING FOREIGN JURISDICTIONS THAT PREVENT INSPECTIONS.
Not applicable.
PART III
ITEM 10. DIRECTORS, EXECUTIVE OFFICERS AND CORPORATE GOVERNANCE
The information required by Items 10 (Directors, Executive Officer and Corporate Governance), 11 (Executive Compensation), 12 (Security Ownership of Certain Beneficial Owners and Management and Related Stockholder Matters), 13 (Certain Relationships and Related Transactions, and Director Independence) and 14 (Principal Accountant Fees and Services) will be furnished on or prior to April 29, 2024 (and is hereby incorporated by reference) by an amendment hereto or pursuant to a definitive proxy statement involving the election of directors pursuant to Regulation 14A that will contain such information. Notwithstanding the foregoing, information appearing in the sections “Compensation Committee Report” and “Audit Committee Report” shall not be deemed to be incorporated by reference in this Form 10-K.
ITEM 11. EXECUTIVE COMPENSATION
The information required by Items 10 (Directors, Executive Officer and Corporate Governance), 11 (Executive Compensation), 12 (Security Ownership of Certain Beneficial Owners and Management and Related Stockholder Matters), 13 (Certain Relationships and Related Transactions, and Director Independence) and 14 (Principal Accountant Fees and Services) will be furnished on or prior to April 29, 2024 (and is hereby incorporated by reference) by an amendment hereto or pursuant to a definitive proxy statement involving the election of directors pursuant to Regulation 14A that will contain such information. Notwithstanding the foregoing, information appearing in the sections “Compensation Committee Report” and “Audit Committee Report” shall not be deemed to be incorporated by reference in this Form 10-K.
ITEM 12. SECURITY OWNERSHIP OF CERTAIN BENEFICIAL OWNERS AND MANAGEMENT AND RELATED STOCKHOLDER MATTERS
The information required by Items 10 (Directors, Executive Officer and Corporate Governance), 11 (Executive Compensation), 12 (Security Ownership of Certain Beneficial Owners and Management and Related Stockholder Matters), 13 (Certain Relationships and Related Transactions, and Director Independence) and 14 (Principal Accountant Fees and Services) will be furnished on or prior to April 29, 2024 (and is hereby incorporated by reference) by an amendment hereto or pursuant to a definitive proxy statement involving the election of directors pursuant to Regulation 14A that will contain such information. Notwithstanding the foregoing, information appearing in the sections “Compensation Committee Report” and “Audit Committee Report” shall not be deemed to be incorporated by reference in this Form 10-K.
ITEM 13. CERTAIN RELATIONSHIPS AND RELATED PERSON TRANSACTIONS, AND DIRECTOR INDEPENDENCE
The information required by Items 10 (Directors, Executive Officer and Corporate Governance), 11 (Executive Compensation), 12 (Security Ownership of Certain Beneficial Owners and Management and Related Stockholder Matters), 13 (Certain Relationships and Related Transactions, and Director Independence) and 14 (Principal Accountant Fees and Services) will be furnished on or prior to April 29, 2024 (and is hereby incorporated by reference) by an amendment hereto or pursuant to a definitive proxy statement involving the election of directors pursuant to Regulation 14A that will contain such information. Notwithstanding the foregoing, information appearing in the sections “Compensation Committee Report” and “Audit Committee Report” shall not be deemed to be incorporated by reference in this Form 10-K.
ITEM 14. PRINCIPAL ACCOUNTANT FEES AND SERVICES
The information required by Items 10 (Directors, Executive Officer and Corporate Governance), 11 (Executive Compensation), 12 (Security Ownership of Certain Beneficial Owners and Management and Related Stockholder Matters), 13 (Certain Relationships and Related Transactions, and Director Independence) and 14 (Principal Accountant Fees and Services) will be furnished on or prior to April 29, 2024 (and is hereby incorporated by reference) by an amendment hereto or pursuant to a definitive proxy statement involving the election of directors pursuant to Regulation 14A that will contain such information. Notwithstanding the foregoing, information appearing in the sections “Compensation Committee Report” and “Audit Committee Report” shall not be deemed to be incorporated by reference in this Form 10-K.
Annual Report on Form 10-K:
Our consolidated financial statements are listed in the “Index to Consolidated Financial Statements” under Part II, Item 8 of this Annual Report on
Form 10-K.
All financial statement schedules have been omitted because they are not applicable, not material or the required information is shownincluded in Part II, Item 8 of this Annual Report on
Form 10-K.
| Exhibit Number | Description | |||||||
| 2.1 | ||||||||
| 2.2 | ||||||||
| 2.3 | ||||||||
| 3.1 | ||||||||
| 3.2 | ||||||||
| 3.3 | ||||||||
| 3.4 | ||||||||
| 4.1 | ||||||||
| 4.2 | ||||||||
| 4.3 | ||||||||
| * | ||||||||
| 4.5 | * | |||||||
| 4.6 | ||||||||
| 4.7 | ||||||||
| * | ||||||||
| 10.1 | ||||||||
| 10.2 | ||||||||
78
79
| Exhibit Number | Description | |||||||
| 10.23 | Business Combination Agreement, by and among Kore Group Holdings, Inc., BMP Simon Holdings, LLC, BMP Merger Sub I, Inc., BMP Merger Sub II, Inc., Business Mobility Partners Inc., Simon IOT LLC, and each of Jared Deith, Steven Daneshgar, David Isler, Stuart Lowenstein and Aaron Slonim, dated February 16, 2022 (incorporated by reference to Exhibit 10.1 to the Company’s Current Report on Form 8-K filed on February 23, 2022). | |||||||
| 10.24 | ||||||||
| 10.25 | ||||||||
| 10.26 | † | |||||||
| 10.27 | † | |||||||
| 10.28 | † | |||||||
| 10.29 | † | |||||||
| 10.30 | † | |||||||
| 14.1 | * | |||||||
| 21.1 | * | |||||||
| 23.1 | ||||||||
| * | ||||||||
| 31.1 | ||||||||
| * | ||||||||
| 31.2 | ||||||||
| * | ||||||||
| 32.1 | ||||||||
| ** | ||||||||
| 32.2 | ||||||||
| ** | ||||||||
| 97.1 | *† | |||||||
| 101.Def | Definition Linkbase Document | |||||||
| 101.Pre | Presentation Linkbase Document | |||||||
| 101.Lab | Labels Linkbase Document | |||||||
| 101.Cal | Calculation Linkbase Document | |||||||
| 101.Sch | Schema Document | |||||||
| 101.Ins | Instance Document - the instance document does not appear in the Interactive Data File because its XBRL tags are embedded within the Inline XBRL document | |||||||
| 104 | Cover Page Interactive Date File (formatted in Inline XBRL and contained in Exhibit 101) | |||||||
† This document has been identified as a management contract or compensatory plan or arrangement.
* Filed herewith.
** Exhibit is being furnished and shall not be deemed to be “filed” for purposes of Section 18 of the Securities Exchange Act of 1934, as amended, or otherwise subject to the liabilities of that section, nor shall it be deemed incorporated by reference into any filing under the Securities Act of 1933, as amended, or the Securities Exchange Act of 1934, as amended.
ITEM 16. FORM 10-K SUMMARY
None.
SIGNATURES
Pursuant to the requirements of Section 13 or 15(d) of the Securities Exchange Act of 1934, the Registrant has duly caused this Report to be signed on its behalf by the undersigned, thereunto duly authorized.
Date: March 29, 2022
| KORE GROUP HOLDINGS, INC. | |||||||||
| By: | /s/ Romil Bahl | ||||||||
| Romil Bahl | |||||||||
| President, Chief Executive Officer and Director | |||||||||
Pursuant to the requirements of the Securities Exchange Act of 1934, this Report has been signed below by the following persons on behalf of the Registrant in the capacities and on the dates indicated.
| Signature | Title | Date | |||||||||||||
/s/ Romil Bahl | President, Chief Executive Officer and Director | ||||||||||||||
Romil Bahl | (Principal Executive Officer) | ||||||||||||||
/s/ Paul Holtz | EVP, Chief Financial Officer and Treasurer | ||||||||||||||
Paul Holtz | (Principal Financial Officer and Principal Accounting Officer) | ||||||||||||||
| /s/ Cheemin Bo-Linn | Director | April 15, 2024 | |||||||||||||
| Cheemin Bo-Linn | |||||||||||||||
/s/ Timothy Donahue | Director | ||||||||||||||
Timothy Donahue | |||||||||||||||
/s/ H. Paulett Eberhart | Director | ||||||||||||||
H. Paulett Eberhart | |||||||||||||||
| /s/ Andrew Frey | Director | April 15, 2024 | |||||||||||||
| Andrew Frey | |||||||||||||||
| /s/ David Fuller | Director | April 15, 2024 | |||||||||||||
David Fuller | |||||||||||||||
| /s/ James Geisler | Director | ||||||||||||||
James Geisler | |||||||||||||||
| /s/ Jay M. Grossman | Director | April 15, 2024 | |||||||||||||
| Jay M. Grossman | |||||||||||||||
| /s/ Robert P. MacInnis | Director | ||||||||||||||
Robert P. MacInnis | |||||||||||||||
/s/ Michael K. Palmer | Director | ||||||||||||||
Michael K. Palmer | |||||||||||||||
81