UNITED STATES
SECURITIES AND EXCHANGE COMMISSION
WASHINGTON, D.C. 20549
FORM 10-K
ANNUAL REPORT
PURSUANT TO SECTIONS 13 OR 15(d)
OF THE SECURITIES EXCHANGE ACT OF 1934
(MARK ONE)
☒ANNUAL REPORT PURSUANT TO SECTION 13 OR 15(d) OF THE SECURITIES EXCHANGE ACT OF 1934
For the fiscal year ended December 31 2022
OR
☐TRANSITION REPORT PURSUANT TO SECTION 13 OR 15(d) OF THE SECURITIES EXCHANGE ACT OF 1934
Commission file number 001-06462
TERADYNE, INC.
(Exact Name of Registrant as Specified in Its Charter)
MASSACHUSETTS | 04-2272148 | |
| ||
(State or Other Jurisdiction of Incorporation or Organization) | (I.R.S. Employer Identification Number) |
600 RIVERPARK DRIVE NORTH READING, MASSACHUSETTS | 01864 | |
(Address of Principal Executive Offices) | (Zip Code) |
Registrant’s telephone number, including area code: (978) (978) 370-2700
Securities registered pursuant to Section 12(b) of the Act:
Title of each class | Trading Symbol(s) | Name of each exchange on which registered | ||
Common Stock, par value | TER | Nasdaq Stock Market LLC |
Indicate by check mark if the registrant is a well-known seasoned issuer, as defined in Rule 405 of the Securities Act. Yes☒ No ☐
Indicate by check mark if the registrant is not required to file reports pursuant to Section 13 or Section 15(d) of the Exchange Act. Yes ☐No☒
Indicate by check mark whether the registrant (1) has filed all reports required to be filed by Section 13 or 15(d) of the Securities Exchange Act of 1934 during the preceding 12 months (or for such shorter period that the registrant was required to file such reports), and (2) has been subject to such filing requirements for the past 90 days. Yes☒ No ☐
Indicate by check mark whether the registrant has submitted electronically every Interactive Data File to be submitted pursuant to Rule 405 of Regulation S-T (232.405 of this chapter) during the preceding 12 months (or for such shorter period that the registrant was required to submit such files). Yes☒ No ☐
If securities are registered pursuant to Section 12(b) of the Act, indicate by check mark whether the financial statements of the registrant included in the filing reflect the correction of an error to previously issued financial statements. ☐
Indicate by check mark whether any of those error corrections are restatements that required a recovery analysis of incentive-based compensation received by any of the registrant’s executive officers during the relevant recovery period pursuant to § 240.10D-1(b). ☐
Indicate by check mark whether the registrant is a large accelerated filer, an accelerated filer, a non-accelerated filer, or a smaller reporting company. See the definitions of “large accelerated filer,” “accelerated filer” and “smaller reporting company” and “emerging growth company” in Rule 12b-2 of the Exchange Act (check one):
Large accelerated filer | ☒ | Accelerated filer | ☐ | |||
Non-accelerated filer | ☐ | Smaller reporting company | ☐ | |||
Emerging growth company | ☐ |
If an emerging growth company, indicate by check mark if the registrant has elected not to use the extended transition period for complying with any new or revised financial accounting standards provided pursuant to Section 13(a) of the Exchange Act. ☐
Indicate by check mark whether the registrant has filed a report on and attestation to its management’s assessment of the effectiveness of its internal control over financial reporting under Section 404(b) of the Sarbanes-Oxley Act (15 U.S.C. 7262(b)) by the registered public accounting firm that prepared or issued its audit report. Yes ☒ No ☐
Indicate by check mark whether the registrant is a shell company (as defined in Rule 12b-2 of the Exchange Act). Yes ☐ No ☒
The aggregate market value of the voting stock held by non-affiliates of the registrant as of July 1, 2022,2, 2023, was approximately $10.0$11.0 billion based upon the closing price of the registrant’s Common Stock on the Nasdaq Stock Market on that date.
The number of shares outstanding of the registrant’s only class of Common Stock as of February 17, 2023,16, 2024, was 156,047,868153,080,607shares.
DOCUMENTS INCORPORATED BY REFERENCE
Portions of the registrant’s proxy statement in connection with its 20232024 annual meeting of shareholders are incorporated by reference into Part III of this Form 10-K.
Table of Contents
TERADYNE, INC.
INDEX
Page No. | ||||||
PART I. | ||||||
Item 1. | 2 | |||||
Item 1A. | 10 | |||||
Item 1B. | 21 | |||||
Item | 21 | |||||
Item | 23 | |||||
Item 3. | 23 | |||||
Item 4. | 23 | |||||
PART II. | ||||||
Item 5. | 24 | |||||
Item 6. | 24 | |||||
Item 7. | Management’s Discussion and Analysis of Financial Condition and Results of Operation | 25 | ||||
Item 7A. | 36 | |||||
Item 8. | 38 | |||||
Item 9. | Changes in and Disagreements with Accountants on Accounting and Financial Disclosure | 87 | ||||
Item 9A. | 87 | |||||
Item 9B. | 87 | |||||
Item 9C. | Disclosure Regarding Foreign Jurisdictions that Prevent Inspections | 87 | ||||
PART III. | ||||||
Item 10. | 88 | |||||
Item 11. | 88 | |||||
Item 12. | Security Ownership of Certain Beneficial Owners and Management and Related Stockholder Matters | 88 | ||||
Item 13. | Certain Relationships and Related Transactions, and Director Independence | 88 | ||||
Item 14. | 88 | |||||
PART IV. | ||||||
Item 15. | 89 | |||||
Item 16. | 90 | |||||
95 | ||||||
TERADYNE, INC.
FORM 10-K
SPECIAL NOTE REGARDING FORWARD-LOOKING STATEMENTS
This Annual Report on Form 10-K contains “forward-looking statements” within the meaningregarding Teradyne's future business prospects, financial performance or position and results of the Private Securities Litigation Reform Act of 1995, Section 27A of the Securities Act and Section 21E of the Securities Exchange Act.operations. When used herein, the words “will,such as “anticipate,” “would,“expect,” “plan,” “could,” “may,” “will,” “believe,” “anticipate,” “plan,” “expect,” “estimate,” “project,“goal,” “intend,” “may,” “see,” “target” andor other words andcomparable terms of similar meaning are intended to identify forward-looking statements although not all forward-looking statements contain these identifying words. Forward-looking statements involve risks and uncertainties, including, but not limited to, those discussed in the section entitled “Risk Factors” of this annual reportAnnual Report on Form 10-K and elsewhere, and in our other reports we filefilings with the Securities and Exchange Commission (“SEC”). Readers are cautioned not to place undue reliance on these forward-looking statements which reflect management’s analysis only as of the date hereof and are subject to risks and uncertainties that could cause actual results to differ materially from those stated or implied. Teradyne assumes no obligation to update these forward-looking statements for any reason, except as may be required by law.
1
PART I
Item 1: Business
|
Teradyne, Inc. (“Teradyne”) was founded in 1960 and is a leading global supplier of automated test equipment and robotics solutions.
We design, develop, manufacture and sell automaticautomated test systems and robotics products. Our automaticautomated test systems are used to test semiconductors, wireless products, data storage and complex electronics systems in many industries including consumer electronics, wireless, automotive, industrial, computing, communications, and aerospace and defense industries. Our robotics products include collaborative robotic arms and autonomous mobile robots (“AMRs”) used by global manufacturing, logistics and industrial customers to improve quality, increase manufacturing and material handling efficiency and decrease manufacturing and logistics costs. Our automaticautomated test equipment and robotics products and services include:
•
•
•
•
The market for our test products is concentrated with a limited number of significant customers accounting for a substantial portion of the purchases of test equipment. A few customers drive significant demand for our products both through direct sales and sales to the customer’s supply partners. We expect that sales of our test products will continue to be concentrated with a limited number of significant customers for the foreseeable future.
In 2022,2023, the demand in the mobility and compute segments of our Semiconductor Test business was lower duecontinued to end market slowdownbe impacted by a correction cycle driven by excess semiconductor inventory, primarily in these segments as well as a slower technology transition in onethe mobility segment of our largest end-markets. While the market. The depth of thethis slowdown and the timing of the recovery are uncertain, however, strong automotive and image sensor demand partially offset these declines. The growth of DDR5 and High Bandwidth Memory ("HBM") devices for data center applications continued to drive demand for our products in the memory market in 2023. Over the midterm, we expect the ramp of 3 nanometer process technology starting in 2023 followed byand gate-all-around process technology, increasing multichip packaging, additional device complexity and unit growth will drive additional demand for test over our four year forecast period.Semiconductor Test.
Our Robotics segment consists of Universal Robots A/S (“UR”), a leading supplier of collaborative robotic arms, and Mobile Industrial Robots A/S (“MiR”), a leading maker of autonomous mobile robots (“AMRs”)AMRs for industrial automation. In September 2022, we merged MiR and AutoGuide, LLC (“AutoGuide”), a maker of high payload AMRs, to become a single supplier of AMRs. The market for our Robotics segment products is dependent on the adoption of new automation technologies by large manufacturers as well as small and medium enterprises (“SMEs”) throughout the world. We expect Robotics sales channel expansion combined withDemand in the fourth quarter of 2023 increased, tied to introduction of new products and seasonally high demand in Robotics after market softness and the impact of our channel transformation resulted in a weaker than forecasted first half of 2023.
On November 7, 2023, Teradyne and Technoprobe S.p.A (“Technoprobe”), a leader in the design and production of probe cards, announced the establishment of a strategic partnership that will seek to driveaccelerate growth for both companies and enable higher performance semiconductor test interfaces for customers worldwide. As part of the partnership, Teradyne will make an investment of 481.0 million Euros in 2023.exchange for a 10% equity investment in Technoprobe and Technoprobe will acquire 100% of Teradyne’s Device Interface Solutions ("DIS") business in exchange for $85.0 million. The transaction is expected to close during the first half of 2024.
BothIn 2023, inflation had minimal effect on our results. While both our test and robotics businesses may continue to be influenced by supply constraints, which could impact our revenue and costs, in 2023. In 2022, inflation had minimal effectwe do not anticipate that supply chain constraints will have a material impact on our results. In 2022, we were unable to supply approximately $20 million of revenuefinancial results in our test businesses for which we had customer demand.2024.
Our financial statements are denominated in U.S. dollars. While the majority of our revenues are in U.S. dollars, approximately 70 percent of our Robotics revenue issales are denominated in foreign currencies. InThere was no material impact to our 2023 results due to changes in foreign exchange rates, however, in 2022, the strengthening of the U.S. dollar was a factor in lower than forecasted revenues in our Robotics segment. Continued strengtheningStrengthening of the U.S. dollar would adversely affect Robotics revenue growth in 2023.2024.
2
Our corporate strategy continues to focus on profitably gaining market share in our test businesses through the introduction of differentiated products that target expanding segments and accelerating growth through continued investment in our Robotics businesses. We plan to continue investing in our growth while balancing capital allocations between returning capital to our shareholders through stock repurchases and dividends and using capital for acquisitions.
Investor Information
We are a Massachusetts corporation incorporated on September 23, 1960. We are subject to the informational requirements of the Securities Exchange Act of 1934 (“Exchange Act”). We file periodic reports, proxy statements and other information with the SEC. The SEC maintains an internet site (http://www.sec.gov) that contains reports, proxy and information statements and other information regarding issuers that file documents electronically.
You can access financial and other information, including the charters of our Audit Committee, Compensation Committee and Nominating and Corporate Governance Committee, our Corporate Governance Guidelines and Code of Conduct, by clicking the Investors link on our web site at www.teradyne.com. We make available, free of charge, copies of our filings with the SEC, including our annual reports on Form 10-K, quarterly reports on Form 10-Q, current reports on Form 8-K and amendments to those reports filed or furnished pursuant to Section 13(a) or 15(d) of the Exchange Act through our web site as soon as reasonably practicable after filing such material electronically or otherwise furnishing it to the SEC.
Products
Semiconductor Test
We design, manufacture, sell and support Semiconductor Test products and services on a worldwide basis. The test systems we provide are used both for wafer level and device package testing of semiconductor devices. These devices are used in automotive, industrial, communications, consumer, smartphones, cloud, computer and electronic game applications, among others. Semiconductor devices span a broad range of functionality, from very simple low-cost devices such as appliance microcontrollers, operational amplifiers or voltage regulators to complex digital signal processors, Artificial Intelligence/Machine Learning (“AI/ML”) training, high performance computing and microprocessors as well as memory devices. Semiconductor Test products and services are sold to integrated device manufacturers (“IDMs”) that integrate the fabrication of silicon wafers into their business, “Fabless” companies that outsource the manufacturing of silicon wafers, “Foundries” that cater to the processing and manufacturing of silicon wafers, and semiconductor assembly and test providers (“OSATs”) that provide test and assembly services for the final packaged devices to both Fabless companies and IDMs. Fabless companies perform the design of integrated circuits without manufacturing capabilities and use Foundries for wafer manufacturing and OSATs for test and assembly. These customers obtain the overall benefit of comprehensively testing devices and reducing the total costs associated with testing by using our Semiconductor Test systems to:
•
•
•
•
Our FLEX Test Platform architecture advances our core technologies to produce test equipment that is designed for high efficiency multi-site testing. Multi-site testing involves the simultaneous testing of many devices in parallel. Leading semiconductor manufacturers are using multi-site testing to significantly improve their “Cost of Test” economics. The FLEX Test Platform architecture addresses customer requirements through the following key capabilities:
•
3
The IG-XL™ software operating system which provides fast program development, including instant conversion from single to multi-site test; and
•
FLEX Test Platform purchases are made by IDMs, OSATs, Foundries and Fabless customers. The FLEX Test Platform has become a widely used test solution at OSATs by providing versatile testers that can handle the widest range of devices, allowing OSATs to leverage their capital investments. The broad consumer, automotive and broadband markets have historically driven most of the device volume growth in the semiconductor industry. These markets include mobile phones and tablets, PCs, servers, networking
3
and automotive electronics. These end use markets continue to be drivers for the FLEX Test Platform family of products because they require a wide range of technologies and instrument coverage. In 2019, we introduced our next generation UltraFLEXPlus tester, the newest member of the UltraFLEX family, UltraFLEXPlus uses the new PACETM architecture to deliver superior economics and fast time to market for complex digital devices.
Our J750™ test system shares the IG-XL software environment with the family of FLEX Test Platform systems. The J750 is designed to handle high volume semiconductor devices, such as microcontrollers, that are central to the functionality of almost every consumer electronics product, from small appliances to automobiles. J750 test systems combine compact packaging, high throughput and ease of production test. We extended the J750 platform technology to create the IP750 Image Sensor™ test system. The IP750 is focused on testing image sensor devices used in smartphones, automobiles and other imaging products. We have continued to invest in the J750 platform with new instrument releases that bring new capabilities to existing market segments and expand the J750 platform to new devices that include high end microcontrollers and the latest generation of image sensors.
Our Magnum platform addresses the requirements of mass production test of memory devices for flash and DRAM memory. Flash and DRAM memory are widely used core building blocks in modern electronic products finding wide application in consumer, industrial, and computing equipment. Magnum 7, the newest member of the family introduced at the end of 2021, is a next generation memory test solution designed for parallel memory test in the flash, DRAM and multi-chip package markets. In 2019, we introduced a high-speed DRAM test version of our Magnum platform called Magnum EPIC giving us full product coverage of the memory test market.
Our ETS platform is used by semiconductor manufacturers and assembly and test subcontractors, primarily in the analog/mixed signal markets that cover more cost sensitive applications. Our proprietary SmartPin™ technology enables high efficiency multi-site testing, on an individual test system, permitting greater test throughput. Semiconductors tested by ETS platform systems are incorporated into a wide range of products in historically high-growth markets, including mobile devices, automotive electronics, computer peripherals, and notebook and desktop computers. The Eagle platform includes the ETS-88, a high performance multi-site production test system designed to test a wide variety of high volume power and precision devices, including Silicon Carbide (SiC) and Gallium Nitride (GaN) power devices used in vehicle electrification, and the ETS-800, a high performance multi-site production test system, is used to test high complexity power devices in automotive, industrial and consumer applications.
System Test
Our System Test segment is comprised of three business units: Storage Test, Defense/Aerospace, and Production Board Test.
4
Storage Test
The Storage Test business unit addresses the high throughput, automated manufacturing test requirements of hard disk drive (“HDD”) and semiconductor manufacturers. Our HDD products address the client and enterprise storage markets. The client market is driven by the needs of desktop, laptop, and external HDD storage products. The enterprise market is driven by the needs of data centers and cloud storage. Our system level test product for the semiconductor production market is used to test devices following wafer and package test. The business unit’s products lead in addressing customer requirements related to factory density, throughput and thermal performance.
Defense/Aerospace
We are a leading provider of high performance test systems, subsystems, instruments and service for the defense and aerospace markets. Our test products are used to ensure the readiness of military and commercial aerospace electronics systems. New programs, such as tactical aircraft and missile systems, as well as upgrade programs, continue to fuel the demand for high performance test systems in this market. Our test products are well-suited to the demands of defense/aerospace electronics manufacturers and repair depots worldwide. Our leadership in this market is underscored by our success with major Department of Defense programs across all U.S. military service branches and many allied defense services worldwide.
Production Board Test
Our test systems are used by electronics manufacturers and OEMs worldwide to perform In-Circuit-Test (“ICT”) and device programming of printed circuit board assemblies. Fast, accurate and cost-effective test capabilities are hallmark features of our Test Station product families. We offer the Test Station in off-line and automated in-line configurations. The automated in-line configurations address the growing requirements for automating production lines for high volume applications, such as automotive electronics, computing, and communications.
4
Wireless Test
Our Wireless Test segment is a business operatesunit run under the LitePoint brand name and providesproviding wireless test solutions utilized in the developmentfor silicon validation, wireless module manufacturing, and manufacturing of wireless devices and modules.end device manufacturing. The world’s leading makers of smartphones, tablets, notebooks, laptops, peripherals,access points, and Internet-of-Things (“IoT”) devices rely on LitePoint technologyequipment to ensure their products get into consumerconsumer’s hands with high quality and high efficiency.
LitePoint hardware and software wireless test solutions are used in test insertions thatsystems span design verification to high volume manufacturing and are deployed across the entire production eco-systemchain from the wireless chipset suppliers to the consumer brands. Wireless devices are often tested at multiple points along the manufacturing process that include insertions at component, system-in-package (“SiP”), module, PCB, SMT and finished product stages.
Design verification isinvolves comprehensive automated testing of small quantities of devices in an important stepR&D lab to ensure the device meets its design targets over a wide range of conditions and scenarios. High Volume manufacturing involves the calibration and testing of each wireless device to ensure the product will deliver the intended customer experience. This ensures all the products perform identically in the development processterms of their wireless characteristics.
LitePoint equipment serves an ever-expanding number of wireless standards in three segments: connectivity, cellular, and secure ranging. Connectivity encompasses numerous short range unlicensed communication standards. Cellular includes standards operating in licensed spectrum from a few GHz to 10s of GHz (mmWave). Finally, secure ranging uses Ultra Wideband (UWB) technology to provide centimeter level positioning with secure data transactions for evaluatingapplications such as “digital keys” and item location (tag type trackers).
LitePoint serves these wireless segments with multiple product families. The LitePoint IQxel-MX and IQxel-MW7G series provide leading edge measurement performance prior to starting production. As end market unit volumes have increased, the quantity of unitsfor both design validation and the amount of data that must be analyzed for a successful product launch continues to grow. LitePoint products provide easy to use, domain specific tools for rapid analysis of product performance. This helps to speed time to market.
In high volume manufacturing wireless test enables the calibration of each individual product’s wireless performanceconnectivity products. The LitePoint IQxstream-5G and IQgig-5G families combine support for 4G and 5G technologies across a wide range of frequencies to improve range, data throughput and battery life. Testing also verifies product specifications for product quality control. As markets become increasingly competitive, product performance and quality provide brand differentiation.
5
Wireless standards can be thought of in three categories: connectivity, cellular and location. Connectivity covers many standards such as Wi-Fi and Bluetooth. LitePoint’s IQxel products cover emerging Wi-Fi standards such as WiFi 6E and WiFi 7 which makes use of the newly allocated 6-7GHz spectrum. Connectivity also includes a variety of other standards such as Bluetooth Classic, Bluetooth 5.0 and Bluetooth low energy, Zigbee, Z-Wave, NFC, LoRa and others.
The IQxel product family’s high performance wireless and multi-device testing economics are aligned withserve all the needs of networking equipment, Internet gateways, IoTboth end user (smartphones) and network infrastructure (small cells and O-RAN) equipment. Finally, the IQgig-UWB+ provides comprehensive certification and manufacturing test support for UWB (802.15.14) products and embedded modules used in smartphones, tablets, and PCs. In 2021, LitePoint introduced the IQxel-MX testing solution for the testing of Wi-Fi devices. Another connectivity product, the IQnfc, addresses the use of NFC technology for payments with mobile devices.
Cellular standards include 2G, 3G, 4G and the new 5G mobile phone technologies. LitePoint’s IQxstream is a multi-device production test optimized solution for high speed testing of GSM, EDGE, CDMA2000, TD-SCDMA, WCDMA, HSPA+, LTE and 5G technologies. It is used for calibration and verification of smartphones, tablets, small cell radio units and embedded cellular modules. The IQcell, is a multi-device cellular signaling test solution which enables user experience testing of LTE and 5G cellular devices over-the-air. The IQgig family provides test solutions at the intermediate and millimeter wave frequencies for 5G, proximity radar and 802.11ad.
Location technologies have traditionally been satellite-based wireless signals such as GPS and GLONASS, which are tested on LitePoint’s connectivity and cellular equipment. A new technology called Ultra-WideBand is being adopted in IoT, automotive and mobile phones. Ultra-WideBand provides finer location capability and is tested on LitePoint’s IQgig-UWB equipment.
To complement the test systems, LitePoint offers turnkey test software for over 350 of the most popular wireless chipsets. These optimized solutions provide rapid development of high volume manufacturing solutions with a minimum of engineering effort by customers.secure ranging.
Robotics
Our Robotics segment is comprised of two business units: Universal Robots and Mobile Industrial Robots.
Universal Robots
Universal Robots is a leading supplierprovider of collaborative robots which(cobots) used across various industries, including automotive, food & beverage, metal & machining, electronics, pharmaceutical, and in education. Founded in 2005 and headquartered in Odense, Denmark, Universal Robots aims to create a world where people work with robots, not like robots. Its mission is simple: “Automation for anyone. Anywhere.”
Since introducing the world's first commercially viable cobot in 2008, Universal Robots has sold over 75,000 cobots worldwide and has developed a product portfolio reflecting a range of reaches and payloads, including the UR3e, UR5e, UR10e, UR16e, UR20 and UR30 robots. All models are low-cost, easy-to-deploy and simple-to-program robots that work side by side with production workersrobust, built to improve quality, increase manufacturing efficiency and decrease manufacturing costs. Collaborative robots are designed to mimic the motion of a human arm and can be fitted with task specific grippers or end effectors to supportwithstand a wide range of applications. Universal Robots offers a variety of collaborative robot models, including the UR3, UR5, UR10, UR16industrial environments, and UR20, each with different weight carrying capacity and arm reach. All models arecan be easily integrated into existing production environments. Universal Robots’ products are differentiated by their:
setups, providing a number of game-changing benefits:
easy•
•
An extensive ecosystem has grown around the company's cobot technology creating innovation, choice for customers and a wide range of components, kits and solutions to suit every application. UR also provides an all-encompassing customer experience including UR Academy - an award-winning training program, available both online and in person in more than 120 training centers worldwide, and three tiers of service offerings carefully designed to accelerate customer success.
5
safe operations as collaborative robots can assist workers in side-by-side production environments requiring no special safety enclosures or shielding to protect workers; and
short payback period, on average 12-18 months.
6
In 2018, Universal Robots introduced its e-Series collaborative robots which include technology advances that enable faster developmenthas recently established global Centers of applications, greater precisionExcellence for Welding, Palletizing, and improved safety. Universal Robots offers four e-Series collaborative robot models UR3e, UR5e, UR10e,Machine Tending applications. These centers, led by subject matter experts, serve as knowledge hubs, offering expert recommendations and UR16e. In 2021, Universal Robots introducedguidance on the upgraded version of its UR10e with 25% more payload to address market demand. In 2022, Universal Robots introduced the first of its next generation industrial collaborative robots, the UR20. This model, which begins shipmentlatest trends in the first half of 2023, has a 1750 millimeter reachfield to UR partners and 20 kg payload capacity. UR20 handles more tasks, fits more applications and assists in more environments.key customers worldwide.
Mobile Industrial Robots
In September 2022, we merged MiR and AutoGuide to becomeis a single supplierleading provider of AMRs to accelerate the creation of the industry’s widest ranging autonomous mobile robot platformrobots (AMRs) for the manufacturing and logistics segments. The MiR isAMRs enhance productivity, offering a leading supplier ofhigh return on investment by streamlining workforce efficiency, reducing lead times, and improving workplace safety. These AMRs which are low-cost, easy-to-deploy and simple-to-program mobile robots that increase manufacturing and warehouse efficiency and decrease costs. Collaborative autonomous mobile robots are designed to move material from point to point via autonomous navigation rather thanoperate autonomously, eliminating the need for traditional mobile robot guidance infrastructure such as painted or magnetic strips and are designed to navigate safely around obstacles and people.infrastructure. MiR currently offers four collaborative autonomous mobile robot models, MiR100, three models—MiR250, MiR600, and MiR1350, MiR1350—each with differentvarying payload carrying capacity.capacities, all managed by our unified fleet management software, MiR 600Fleet. Launched in fall 2021, MiR600 and MiR1350 were launched in the fall 2021. are industrial-grade robots with IP52 rating, compliant with ISO 3691-4 safety standards, and TÜV certified.
All models can be easily integrated into existing production environments. MiR’s products are differentiated by their:
easy programming using a graphical interface which allows users to program the AMR in a few hours;
easeEase of use, speedUse and Speed of Deployment: Our robots are designed for quick deployment and flexibility, in allowing customers to change the task as their demands dictate;
•
short•
MiR also supports high payload AMRs, an emerging and fast-growing segment of the global forklift market used for material transport of payloads up to 4,500 kg in manufacturing, warehouse and logistics applications. These products complement MiR’s lower payload products.
Sales and Distribution
In 2023, revenues from Texas Instruments Inc., a customer of our Semiconductor Test segment, accounted for 10% of our consolidated revenues. In 2021, and 2020, revenues from Taiwan Semiconductor Manufacturing Company Ltd., a customer of our Semiconductor Test segment, accounted for 12% and 15%, respectively, of our consolidated revenues. In each of the years, 2023, 2022 2021 and 2020,2021, our five largest direct customers in aggregate accounted for 26%32%, 33%26% and 36%33% of our consolidated revenues, respectively.
OSAT customers, such as Taiwan Semiconductor Manufacturing Company Ltd., often purchase our test systems based upon recommendations from OEMs, IDMs and Fabless companies. In all cases when an OSAT customer purchases a test system from us, we consider the OSAT as the customer since credit risk, title and risk of loss, among other things, are between Teradyne and the OSAT. We estimate consolidated revenues driven by Qualcomm, a customer of our Semiconductor Test, System Test, and Wireless Test segments, combining direct and indirect sales, accounted for approximately 11% of our consolidated revenues in 2022 and less than 10% in 2021 and 2020.2022. We estimate consolidated revenues driven by one OEM customer, of our Semiconductor Test and Wireless Test segments, combining direct sales to that customer with sales to the customer’s OSATs (which include Taiwan Semiconductor Manufacturing Company Ltd.), accounted for less than 10%approximately 19% of our consolidated revenues in 2022, and 19% and 25% of our consolidated revenues in 2021 and 2020, respectively.2021. The loss of, or significant decrease in demand from this OEM customer or any of our five largest direct customers, could have a material adverse effect on our business, results of operations and financial condition.
We have sales and service offices located throughout North America, Central America, Asia and Europe. We sell in these areas predominantly through a direct sales force, except for Robotics products, which are sold
7
principally through distributors. Our manufacturing activities for our test businesses are primarily conducted through subcontractors and outsourced contract manufacturers with significant operations in China and Malaysia. The manufacturing activities for our Robotics businesses are done primarily in our production facilities in Denmark and the U.S.
Sales to customers outside the United States were 85%84%, 89%85%, and 90%89%, respectively, of our consolidated revenues in 2023, 2022 2021 and 2020.2021. Sales are attributed to geographic areas based on the location of the customer site.
See also “Item 1A: Risk Factors” and Note T: “Operating Segment, Geographic and Significant Customer Information” in Notes to Consolidated Financial Statements.
6
Competition
Competition
We face significant competition throughout the world in each of our reportable segments. Competitors in the Semiconductor Test segment include, among others, Advantest Corporation and Cohu, Inc.
Competitors in the System Test segment include, among others, Keysight Technologies, Inc., Advantest Corporation, Test Research, Inc. and SPEA S.p.A. and Astronics Corporation.
Competitors in our Wireless Test segment include, among others, Rohde & Schwarz GmbH & Co. KG, Anritsu Company, Keysight Technologies, Inc., National Instruments Corporation, Welzek and iTest.
Competitors in our Robotics segment include manufacturers of traditional industrial robots such as KUKA Robotics Corporation, ABB, FANUC, Staubli and Yaskawa Electric Corporation, companies with emerging collaborative robot offerings such as Techman, Doosan, Jaka, and AUBO Robotics, and manufacturers of autonomous mobile robots in the material handling space such as Omron, Fetch, OTTO Motors, Vecna, SeegridRockwell Automation, Junion, HikRobot, Agilox, and Balyo.KION.
Some of our competitors may have greater financial and other resources to pursue engineering, manufacturing, marketing, and distribution of their products. We also face competition from emerging Asian companies and from internal suppliers at several of our customers. Some of our competitors have introduced or announced new products with certain performance characteristics which may be considered equal or superior to those we currently offer. We expect our competitors to continue to improve the performance of their current products and to introduce new products or new technologies that provide improved cost of ownership and performance characteristics. See also “Item 1A: Risk Factors.”
Backlog
At December 31, 20222023 and 2021,2022, our backlog of unfilled orders in our four reportable segments was as follows:
| 2022 | 2021 |
| 2023 |
|
| 2022 |
| |||||||||
| (in millions) |
| (in millions) |
| |||||||||||||
Semiconductor Test | $ | 879.6 | $ | 824.1 |
| $ | 822.8 |
|
| $ | 879.6 |
| ||||
System Test | 253.0 | 375.4 |
|
| 223.8 |
|
|
| 253.0 |
| ||||||
Robotics |
|
| 42.3 |
|
|
| 42.6 |
| ||||||||
Wireless Test | 60.0 | 56.8 |
|
| 35.7 |
|
|
| 60.0 |
| ||||||
Robotics | 42.6 | 28.1 | ||||||||||||||
|
|
| $ | 1,124.6 |
|
| $ | 1,235.2 |
| |||||||
| $ | 1,235.2 | $ | 1,284.4 | |||||||||||||
|
| |||||||||||||||
Customers may delay delivery of products or cancel orders suddenly and without advanced notice, subject to possible cancellation penalties. Due to possible customer changes in delivery schedules and cancellation of orders, our backlog at any particular date is not necessarily indicative of the actual sales for any succeeding
8
period. Delays in delivery schedules or cancellations of backlog during any particular period could have a material adverse effect on our business, financial condition or results of operations.
Raw Materials
Our products contain electronic and mechanical components that are provided by a wide range of suppliers. Some of these components are standard products, while others are manufactured to our specifications. We have experienced delays in obtaining timely delivery of certain components. These delays have impacted and may continue to impact the manufacturing of certain products and the timing of delivery of those products to our customers. While the majority of our components are available from multiple suppliers, certain items are obtained from sole sources. We may experience a temporary adverse impact if any of our sole source suppliers delay or cease to deliver products.
Intellectual Property and Licenses
The development of our products, both hardware and software, is based in significant part on proprietary information, our brands and technology. We protect our rights in proprietary information, brands and technology through various methods, such as:
patents;7
•
•
However, these protections might not be effective in all circumstances. Competitors might independently develop similar technology or exploit our proprietary information and our brands in countries where we lack enforceable intellectual property rights or where enforcement of such rights through the legal system provides an insufficient deterrent. Also, intellectual property protections can lapse or be invalidated through appropriate legal processes. We do not believe that any single piece of intellectual property or proprietary rights is essential to our business.
Human Capital
We believe that our future success depends upon our continued ability to attract, develop, and retain a high-performance workforce, comprised of people with shared values. As of December 31, 2022,2023, we employed approximately 6,500 employees, of whom approximately 2,000 were employed in the United States and approximately 4,500 were employed outside of the United States. Our largest non-US employee populations are in the Philippines (17%(18%), Denmark (12%), China (11%(10%), Taiwan (6%(7%) and Costa Rica (6%). We also leverage contractors to provide flexibility for our business and manufacturing needs. As of December 31, 2022,2023, we worked with approximately 300 contractors globally. Since the inception of our business, we have experienced no work stoppages or other labor disturbances.
Corporate Culture
Our core values are conducting business with honesty and integrity, collaborating with our colleagues as a company without doors, and partnering with our customers every step of the way, because customers count on us.
9
We strive to foster a positive work environment that helps employees thrive. It is a priority for us to ensure that our people feel inspired, supported, safe and able to achieve their personal best. We are committed to equality through nondiscrimination, harassment prevention and pay equity policies. We value a diverse, inclusive and respectful work environment where all employees enjoy challenging assignments, development opportunities and a safe, positive culture.
We are committed to conducting business in a responsible manner, with strategic operational policies, procedures and values that support transparency, sustainability and legal compliance. We ensure ethical operations and business commitments through robust governance of the company’s code of conduct and global environmental, health and safety programs.
Competitive Pay and Benefits
The primary objective of our compensation program is to provide a compensation and benefits package that will continue to attract, retain, motivate and reward high performing employees who operate in a highly competitive and technologically challenging environment. We seek to achieve this objective by linking a significantmeaningful portion of compensation to company and business unit performance. We enable employees worldwide to share in the success of the company through various programs including a stock purchase program, equity compensation, profit sharing and bonus plans. We seek competitiveness and fairness in total compensation with reference to peer comparisons and internal equity.
In addition to providing our employees with competitive compensation packages, we offer benefits designed to meet the needs of employees and their families worldwide, including paid time off, parental leave, bereavement leave, health insurance coverage, flexible work arrangements, contributions to retirement savings, and access to employee assistance and work-life programs.
Employee Development and Training
We believe that employee development and training is a key factor in attracting, motivating, improving and retaining a strong, competitive global workforce. We provide continual development to our employees focused on developing their job skills and competencies. Examples include new manager competencies like giving feedback and coaching, and training in software development tools and project management. Our employees worldwide also receive annual performance reviews and are involved in setting goals for their own development and performance. Employees and managers look back on the previous year, review career development plans and create goals for the next year. In 2022, we implemented a new learning management system integrated with our human resource system. This enabled our business to more easily create and offer business training courses.
8
We are committed to recruiting and developing talent at the collegiate level to help advance Science, Technology, Engineering and Mathematics (“STEM”) education for the future generation. For example, our paid internships and entry-level positions offer real-world experience, and our co-op program offers higher education students a unique learning opportunity as students alternate one semester in a work assignment and one semester in the classroom. Additionally, we offer reimbursement for educational courses related to an employee’s work or as part of a degree program, including tuition, lab fees and books. We also offer a scholarship program for employees with college-age children, step-children and grandchildren. In 2022, almost2023, approximately half of the scholarship recipients were outside of the United States.
Employee Engagement
We conduct regular employee surveys to check in with our global workforce and obtain input on a number of topics. The feedback we receive from these surveys helps us assess employee sentiment, identify areas of improvement and guides our decision-making as it relates to people management. In addition, our CEO and other executives meet with employees wordwideworldwide on a frequent basis through exchange meetings and quarterly
10
webcasts. The exchange meetings allow the executives to directly interact with a small group of employees, while the global webcasts enable all employees to engage with senior leaders and ask questions in an open Q&A session.
We also offer employees worldwide an opportunity to network and connect with colleagues who share similar interests. This includes global groups such as New Employees to Teradyne, Woman’s Affinity Group, Veterans, Blue and Green (for team members that are committed to the environment), Runner’s affinity group and LGBTQ+ advocates.
Diversity and Inclusion
We believe in fostering a diverse workforce and equitable and inclusive culture in order to build a stronger and more resilient company for our customers, our investors, our employees and our communities worldwide. To support this effort, we have a Diversity and Inclusion Charter which was developed by our Diversity, Equity and Inclusion (“DEI”) executive sub-committee and designed to ensure that we build diversity across our workforce. In addition, inSince 2021, we hired our firsthave had a DEI program manager to steer our DEI efforts and launchedmaintain an internal DEI website for employees. We have established programs for recruiting and hiring candidates from various backgrounds and experiences. We have implemented policies regarding gender pay equity and have conductedregularly conduct audits of pay equity in the United States which have not identified any pay equity issues in the employee populations tested.States. We conduct mandatory DEI-related training for our employees worldwide and offer a wide variety of optional DEI-related training courses as well. We are an equal opportunity and affirmative action employer committed to making employment decisions without regard to race, religion, ethnicity or national origin, gender, sexual orientation, gender identity or expression, age, disability, protected veteran status or any other characteristics protected by law.
We have a tradition of amplifying the charitable actions of our employees and responding to the needs of the communities where we work. To support positive change in society, we have donated to organizations fighting for social justice and racial equality. We also sponsor the Massachusetts Conference for Women and the California Conference for Women offering opportunities for business networking, professional development and personal growth. To make it easier for employees to support charitable activities and magnify the impact of support, we established a formal matching gift program, “Teradyne Cares.Gives.” The program matches up to $1,000 per year of an employee’s donations to charities of their choosing, selected from a wide range of qualified non-profit organizations.
Additionally, advancing education for future generations is a primary initiative at Teradyne. We seek to increase the diversity of STEM graduates worldwide through our support of STEM programs at the middle, high school and collegiate level ranging from middle and high school robotics competitions to college scholarships, to underwriting university programs to increase the diversity of STEM graduates worldwide.level. We also donate test equipment and robots to colleges, universities, and vocational programs.
Health and Safety
The health and safety of our employees worldwide is our highest priority. We are committed to complying with all applicable regulatory health and safety requirements wherever we operate. We conduct internal audits, regular reviews and monitoring of regulations to ensure compliance with laws and regulations at the local, state, province and country levels. We ensure workers are provided with the knowledge to perform their jobs safely by deploying mandatory environmental, health and safety training. We also require contractors to complete safety training prior to working at any Teradyne site. We monitor, track and report common safety metrics such as accidents, near misses and illness. Our injury and illness rate is below the industry average. We also provide our employees with a flexible and adjustable workspace, which includes reviewing ergonomics issues in the workplace, educating employees to self-identify risks and ensuring they have the work environment they need to do their jobs safely and effectively.
11
Throughout the novel coronavirus (COVID-19) pandemic, we have focused on ensuring the health and safety of our employees and providing the resources to effectively work remotely and to work in a safe environment when on site. We have encouraged our workforce to become fully vaccinated. We have also supported our global workforce by sending regular all-employee communications, providing development opportunities for managers and employees to support effectively working virtually, establishing emergency response teams to empower local decision-making, conducting surveys to check in with employees, sharing regular video updates from our leadership team, and establishing a well-defined return to work process.
Regulatory Environment
We are subject to various federal, state, and local government laws and regulations relating to international trade, business conduct, the protection of employee health and safety and the environment.
9
We accrue for all known environmental liabilities when it becomes probable that we will incur cleanup costs and those costs can reasonably be estimated. Estimated environmental costs are not expected to materially affect the financial position or results of our operations in future periods. However, estimates of future costs are subject to change due to protracted cleanup periods and changing environmental remediation laws and regulations.
We are subject to U.S. laws and regulations that limit and restrict the export of some of our products and services and may restrict our transactions with certain customers, business partners and other persons. In certain circumstances, export control and economic sanctions regulations prohibit the export of certain products, services, and technologies, and in other circumstances we are required to obtain an export license before exporting the controlled item. For example, we must comply with current U.S. Department of Commerce export control regulations restricting transactions with certain customers in China. We must also comply with export restrictions and laws imposed by other countries affecting trade and investments. We maintain an export compliance program but there are risks that the compliance controls could be circumvented, exposing us to legal liabilities. Compliance with these laws has limited our sales and likely will continue to limit sales to certain customers in the future. Changes in, and responses to, U.S. trade policy could reduce the competitiveness of our products and cause our sales to drop, which could have a material adverse effect on our business, financial condition or results of operations.
Item 1A: Risk Factors
12
INFORMATION ABOUT OUR EXECUTIVE OFFICERS
Pursuant to General Instruction G (3) of Form 10-K, the following table is included in Part I of this Annual Report on Form 10-K in lieu of being included in the Proxy Statement for the Annual Meeting of Shareholders. The table sets forth the names of all of our executive officers and certain other information relating to their positions held with Teradyne and other business experience. Our executive officers do not have a specific term of office but rather serve at the discretion of the Board of Directors.
|
|
| ||||
| ||||||
| ||||||
| ||||||
| ||||||
| ||||||
|
The risks described below are not the only risks that we face. Additional risks and uncertainties not currently known to us or that we currently deem to be immaterial also may materially adversely affect our business, financial condition and/or operating results.
13
Risks Associated with Teradyne’s Markets
Our business is impacted by global and industry-specific economic cycles, which are difficult to predict, and actions we have taken or may take to offset these cycles may not be sufficient.
Capital equipment providers in the electronics, semiconductor industries and robotics, such as Teradyne, have, in the past, been negatively impacted by both sudden slowdowns in the global economies and recurring cyclicality within those industries. These cycles have resulted in periods of over-supply; a trend we believe will continue to occur. Our business and results of operations depend, in significant part, upon capital expenditures of manufacturers of semiconductors electronics and other industrial products, which in turn depend upon the current and anticipated market demand for those products. Disruption or deterioration in economic conditions may reduce customer purchases of our products, thereby reducing our revenues and earnings. In addition, such adverse changes in economic conditions, and resulting slowdowns in the market for our products, may, among other things, result in increased price competition for our products, increased risk of excess and obsolete inventories, increased risk in the collectability of our accounts receivable from our customers, potential reserves for doubtful accountscredit losses and write-offs of accounts receivable, increased risk of restructuring charges, and higher operating costs as a percentage of revenues, which, in each case and together, adversely affect our operating results. We are unable to predict the likely duration, frequency and severity of disruptions in financial markets, credit availability, and adverse economic conditions throughout the world, and we cannot ensure that the level of revenues or new orders for a fiscal quarter will be sustained in subsequent quarters. We have taken actions to address the effects of general economic variability and recurring industry cyclicality, including implementing cost control and reduction measures. We cannot predict whether these measures will be sufficient to offset global or market-specific disruptions that might affect our businesses and we may need to take additional or different measures in the future.
We are subject to intense competition.
We face significant competition throughout the world in each of our reportable segments. Some of our competitors have substantial financial and other resources to pursue engineering, manufacturing, marketing and distribution of their products. In addition, we are subject to trade regulations imposed by the United States government, which may not impact some of our competitors. We also face competition from emerging Asian companies and internal development at several of our customers. Some of our competitors have introduced or announced new products with certain performance characteristics that may be considered equal or superior to those we currently offer. We expect our competitors to continue to improve the performance of their current products and to introduce new products or new technologies that provide improved cost of ownership and performance characteristics. New product introductions by competitors could cause a decline in revenues or loss of market acceptance of our products.
The market for our products is concentrated, and our business depends, in part, on obtaining orders from a few significant customers.
10
The market for our products is concentrated with a limited number of significant customers accounting for a substantial portion of the purchases of test equipment. In each of the years, 2023, 2022 2021 and 2020,2021, our five largest direct customers in aggregate accounted for 26%32%, 33%26% and 36%33% of consolidated revenues, respectively.
We estimate consolidated revenues driven by Qualcomm, a customer of our Semiconductor Test, System Test, and Wireless Test segments, combining direct and indirect sales to Qualcomm, accounted for approximately 11% of our consolidated revenues in 2022 and less than 10% in 2021 and 2020. We estimate consolidated revenues driven by one OEM customer, of our Semiconductor Test and Wireless Test segments, combining direct sales to that customer with sales to the customer’s OSATs (which include Taiwan Semiconductor Manufacturing Company Ltd.), accounted for less than 10%19% of our consolidated revenues in 2022,2021.
Customer consolidation could affect our operating results.
There has been a trend toward customer consolidation in the semiconductor industry through business combinations, including mergers, asset acquisitions and 19%strategic partnerships. If this trend continues, it could make us more dependent on fewer customers who may be able to exert increased pressure on our prices and 25%other contract terms and could increase the portion of our consolidated revenues in 2021total sales concentration for any single customer. Customer consolidation activity could also reduce the demand for our products and 2020, respectively.services if such customers streamline research and development or operations, reduce purchases or delay purchasing decisions. These outcomes could negatively impact our operating results and financial condition.
14
If we fail to develop new technologies to adapt to our customers’ needs andor if our customers fail to accept our new products, our revenues will be adversely affected.
We believe that our technological position depends primarily on the technical competence and creative ability of our engineers. In a rapidly evolving market, such as ours, the development or acquisition of new technologies, commercialization of those technologies into products and market acceptance and customer demand for those products are critical to our success. Successful product development or acquisition, introduction and acceptance depend upon a number of factors, including:
•
•
•
•
•
•
•
•
•
•
•
•
•
•
Risks Associated with Operating a Global Business
We are subject to risks of operating internationally.
A significant portion of our totalconsolidated revenues is derived from customers outside the United States. Our international sales and operations are subject to significant risks and difficulties, including:
•
•
•
•
11
•
•
•
•
•
•
•
15
compliance with customs and trade regulations; and
•
In addition, an increasing portion of our products and the products we purchase from our suppliers are sourced or manufactured in foreign locations, including China, Malaysia and Denmark, and a large portion of the devices our products test are fabricated and tested by foundries and subcontractors in Taiwan, China, Korea and other parts of Asia. As a result, we are subject to a number of economic and other risks, particularly during times of political, health or financial instability in these regions. Disruption of manufacturing or supply sources in these international locations could materially adversely impact our ability to fill customer orders and potentially result in lost business.
We are subject to risks associated with doing business in China.
In addition to the risks associated with the tariffs and trade regulations detailed below, we are subject to the following risks associated with doing business in China:
The foregoing risks and the ongoing geopolitical tensions and economic uncertainty between the United States and China and the unknown impact of current and future Chinese rules and regulations, may cause increased costs, as well as restrictions on our ability to sell, or a decreased demand from customers to purchase, our products, which could harm our business, financial condition and operating results.
The Israel-Hamas conflict may have a material impact on our Business
The Israel-Hamas conflict could have a negative impact on our future revenue and supply chain, either of which could adversely affect our business and financial results. Our customers in Israel may experience delays in product releases due to impacts to their labor force and impacts on their suppliers because of the conflict, which could materially impact demand for our products. Similarly, our suppliers in Israel may experience delays in providing us with parts due to the conflict. In addition, the global economic uncertainty following the start of the conflict could impact demand for our products.
Risks Related to Teradyne’s Finances
We may not fully realize the benefits of our acquisitions or strategic alliances.
In June 2015, we acquired Universal Robots, in 2018, we acquired Energid and MiR and, in 2019, we acquired Lemsys and AutoGuide. In November 2023, we announced entering into strategic partnership agreement with Technoprobe which included
12
Teradyne acquiring 10% of the equity in Technoprobe. We may not be able to realize the benefits of acquiring or successfully growing these businesses. We may continue to acquire additional businesses, form strategic alliances, or create joint ventures with third parties that we believe will complement or augment our existing businesses. We may not be able to realize the expected synergies and cost savings from the integration with our existing operations of other businesses or technologies that we may acquire. In addition, the integration process for our acquisitions may be complex, costly and time consuming and include unanticipated issues, expenses, and liabilities. We may have difficulty in developing, manufacturing, and marketing the products of a newly acquired company in a manner that enhances the performance of our combined businesses or product lines and allows us to realize value from expected synergies. Following an acquisition, we may not achieve the revenue or net income levels that justify the acquisition. Acquisitions may also result in one-time charges (such as acquisition-related expenses, write-offs or restructuring charges) or in the future, impairment of goodwill or acquired intangible assets, or adjustments to contingent consideration liabilities that adversely affect our operating results. Additionally, we may fund acquisitions of new businesses, strategic alliances, or joint ventures by utilizing our cash, incurring debt, issuing shares of our common stock, or by other means. Additionally, we may face restrictions pursuant to the terms of an acquisition or strategic alliance agreement, such as the three year restriction on the transfer or disposition of the Technoprobe shares upon closing of the agreement, subject to certain early termination events.
We may incur higher tax rates than we expect and may have exposure to additional international tax liabilities and costs.
We are subject to paying income taxes in the United States and other countries where we operate. Our effective tax rate is dependent on where our earnings are generated and the tax regulations and the interpretation and judgment of administrative tax or revenue authorities in the United States and other countries. We have pursued a global tax strategy that could be adversely affected by the mix of earnings and tax rates in the countries where we operate, changes to tax laws, tax regulations or an adverse tax ruling by administrative authorities. We are also subject to tax audits in the countries where we operate. Any material change in our tax liability resulting from changes in tax laws, tax regulations, administrative rulings or audits from an administrative tax or revenue authority could negatively affect our financial results.
As a multinational corporation, we are subject to income taxes as well as non-income-based taxes, in both the United States and various foreign jurisdictions. In certain foreign jurisdictions, we qualify for tax incentives and tax holidays based on our ability to meet, on a continuing basis, various tests relating to our employment levels, research and development expenditures and other qualification requirements in a particular foreign jurisdiction. While we intend to operate in such a manner to maintain and maximize our tax incentives and tax holidays, no assurance can be given that we have so qualified or that we will so qualify for any particular year or jurisdiction. If we fail to qualify or fail to remain qualified for certain foreign tax incentives and tax holidays, we may be subject to further taxation or an increase in our effective tax rate which would adversely impact our financial results. In November 2020, we entered into an agreement with the Singapore Economic Development
16
Board which extended our Singapore tax holiday under substantially similar terms to the agreement which expired on December 31, 2020. The new tax holiday is scheduled to expire on December 31, 2025.
The tax savings attributable to the Singapore tax holiday for the years ended December 31, 2023, 2022 and 2021 and 2020 were $1.4 million or $0.01 per diluted share, $16.0 million or $0.09 per diluted share, and $33.3 million or $0.18 per diluted share, and $29.9 million or $0.16 per diluted share, respectively. These tax savings may not be achievable in subsequent years due to changes in Singapore’s tax laws, issuance of new global minimum tax laws, or the expiration of the tax holiday.
In addition, we may incur additional costs, including headcount expenses, in order to maintain or obtain a foreign tax incentive or tax holiday in a particular foreign jurisdiction.
We have significant guarantees, indemnification, and customer confidentiality obligations.
From time to time, we make guarantees to customers regarding the delivery, price and performance of our products and guarantee certain indebtedness, performance obligations or lease commitments of our subsidiary and affiliate companies. We also have agreed to provide indemnification to our officers, directors, employees and agents, to the extent permitted by law, arising from certain events or occurrences, while the officer, director, employee or agent, is or was serving at our request in such capacity. Additionally, we have confidentiality obligations to certain customers and if breached would require the payment of significant penalties. If we become liable under any of these obligations, it could materially and adversely affect our business, financial condition or operating results. For additional information see Note M: “Commitments and Contingencies—GuaranteesContingencies-Guarantees and Indemnification Obligations” in Notes to Consolidated Financial Statements.
We may discontinue or reduce our quarterly cash dividend or share repurchase program.
13
In January 2014, our Board of Directors initiated a quarterly cash dividend. Since 2014, the Board of Directors has increased our quarterly cash dividend from $0.06 per share to $0.11$0.12 per share. Holders of our common stock are only entitled to receive dividends when and if they are declared by our Board of Directors.
In January 2021, our Board of Directors approved a $2.0 billion share repurchase program. In 2022 and 2021, we repurchased $752.1 million, and $600.0 million, respectively of common stock. In January 2023, our Board of Directors cancelled the 2021 repurchase program and approved a new $2.0 billion share repurchase program. In 2023, we repurchased $400.5million of common stock. We intend to repurchase up to $90.0 million in 2024. Under the share repurchase program, we may repurchase outstanding shares of our common stock from time to time in the open market and through privately negotiated transactions. Unless terminated earlier by resolution of our Board of Directors, the repurchase program will expire when we have repurchased all shares authorized for repurchase under the share repurchase program.
Future cash dividends and share repurchases are subject to the discretion of our Board of Directors and will depend, among other things, upon our earnings, capital requirements and financial condition. While we have declared a quarterly cash dividend on our common stock and authorized a share repurchase program, we are not required to do either and may reduce or eliminate our cash dividend or share repurchase program in the future. The reduction or elimination of our cash dividend or our share repurchase program could adversely affect the market price of our common stock.
We have incurred indebtedness and may incur additional indebtedness.
On December 12, 2016, we completed a private offering of $460.0 million aggregate principal amount of 1.25% convertible senior unsecured notes (the “Notes”) due December 15, 2023 and received net proceeds, after issuance costs, of approximately $450.8 million, $33.0 million of which was used to pay the net cost, after being partially offset by proceeds from the sale of the warrants, of the convertible note hedge transactions and $50.1 million of which was used to repurchase 2.0 million shares of our common stock. Holders of the Notes may require us to repurchase the Notes upon the occurrence of certain fundamental changes involving us or the holders may elect to convert into shares of our common stock. As of February 22, 2023, one hundred and twenty four holders had converted $424.9 million worth of notes.
17
On May 1, 2020, we entered into a three-year, senior secured revolving credit facility of up to $400.0 million. On December 10, 2021, the credit agreement was amended to extend the maturity date of the credit facility to December 10, 2026. On October 5, 2022, the credit agreement was amended to increase the amount of the credit facility to $750.0 million from $400.0 million. The amended credit agreement provides that, subject to customary conditions, we may seek to obtain from existing or new lenders the available incremental amount under the credit facility, not to exceed the greater of $200.0 million or 15% of consolidated EBIDTA. We could borrow funds under this credit facility at any time for general corporate purposes and working capital. As of February 22, 2023,2024, we have not borrowed any funds under this credit facility.
The issuance of the NotesOur outstanding and any additional indebtedness, among other things, could:
•
•
•
•
Restrictive covenants in the agreement governing our senior secured revolving credit facility may restrict our ability to pursue business strategies.
The agreement governing our senior secured revolving credit facility limits our ability, among other things, to incur additional secured indebtedness; sell, transfer, license or dispose of assets; consolidate or merge; enter into transactions with our affiliates; and incur liens. In addition, our senior secured revolving credit facility contains financial and other restrictive covenants that limit our ability to engage in activities that may be in our long-term best interest, such as, subject to permitted exceptions, making capital expenditures in excess of certain thresholds, making investments, loans and other advances, and prepaying any additional indebtedness while our indebtedness under our senior secured revolving credit facility is outstanding. Our failure to comply with financial and other restrictive covenants could result in an event of default, which if not cured or waived, could result in the lenders requiring immediate payment of all outstanding borrowings or foreclosing on collateral pledged to them to secure the indebtedness.[3]
Our convertible note hedge and warrant transactions could impact the value of our stock.
On December 12, 2016, we completed a private offering of $460.0 million aggregate principal amount of 1.25% convertible senior unsecured notes (the “Notes”) that matured on December 15, 2023. Concurrent with the offering of the Notes, we entered into convertible note hedge transactions (the “Note Hedge Transactions”) with the initial purchasers or their affiliates (the “Option Counterparties”). The Note Hedge Transactions cover, subject to customary anti-dilution adjustments, the number of shares of our common stock that underlie the Notes, with a strike price equal to the conversion price of the Notes of $31.46. The Note Hedge Transactions cover, subject to customary anti-dilution adjustments, approximately 1.6 million shares of our common stock. On November 4, 2021, we made an irrevocable election under the indenture to require the principal portion of the remaining Notes to be settled in cash.
Separately and concurrent with the pricing of the Notes, we entered into warrant transactions with the Option Counterparties (the “Warrant Transactions”) in which we sold net-share-settled (or, at our election subject to certain conditions, cash-settled) warrants to the Option Counterparties. The Warrant Transactions, which expire between March 18, 2024 and July 10, 2024, cover, subject to customary
14
anti-dilution adjustments, approximately 14.614.7 million shares of our common stock. The strike price of the warrants is $39.48$39.40 per share. The Warrant Transactions could have a dilutive effect to ourresult in increased common stock outstanding to the extent that the market price per share of our common stock, as measured under the terms of the Warrant Transactions, exceeds the applicable strike price of the warrants.
18
The Note Hedge Transactions are expected to reduce the potential dilution to our common stock upon any conversion of the Notes. However, the Warrant Transactions could separately have a dilutive effect to the extent that the market value per share of our common stock exceeds the applicable strike price of the warrants. The net cost of the Note Hedge Transactions, after being partially offset by the proceeds from the sale of the warrants, was approximately $33.0 million.
In connection with establishing their initial hedge of these convertible note hedge and warrant transactions, the Option Counterparties have entered into various derivative transactions with respect to our common stock and/or purchase shares of our common stock or other securities, including the Notes, concurrent with, or shortly after, the pricing of the Notes. In addition, the Option Counterparties may modify their hedge positions by entering into or unwinding various derivative transactions with respect to our common stock or by selling our common stock or other securities, including the Notes, in secondary market transactions (and may do so during any observation period related to the conversion of the Notes). These activities could adversely impact the value of our common stock and the Notes.
We may not be able to pay our debt and other obligations.
If our cash flows are inadequate to meet our obligations, we could face substantial liquidity problems. If we are unable to generate sufficient cash flows or otherwise obtain funds necessary to make required payments on the Notesour senior secured revolving credit facility or certain of our other obligations, we would be in default under the terms thereof, which would permit the holders of those obligations to accelerate their maturity and also could cause defaults under future indebtedness we may incur. Any such default could have a material adverse effect on our business, prospects, financial position and operating results. In addition, we cannot be certain that we would be able to repay amounts due on the Notes if those obligations were to be accelerated following the occurrence of any other event of default as defined in the instruments creating those obligations, or if the holders of the Notes require us to repurchase the Notes upon the occurrence of a fundamental change involving us. Moreover, we cannot be certain that we will have sufficient funds or will be able to arrange for financing to pay the principal amount due on the Notes at maturity.
Foreign currency exchange rates and fluctuations in those rates may affect the Company’s ability to realize projected growth rates in its sales and earnings.
Our financial statements are denominated in U.S. dollars. While the majority of our revenues are in U.S. dollars, approximately 70 percent70% of our Robotics revenue isin 2023 was denominated in foreign currencies. Correspondingly, our results of operations and our ability to realize projected growth rates in sales and earnings in Robotics could be adversely affected if the U.S. dollar strengthens significantly against foreign currencies.
Adverse developments affecting the financial services industry, including events or risks involving liquidity, defaults or non-performance by financial institutions, could have a material adverse effect on our business, financial condition or results of operations.
On March 10, 2023, Silicon Valley Bank (SVB), who is a lender in our revolving credit facility and where we maintain certain accounts and cash deposits, was placed into receivership with the Federal Deposit Insurance Corporation (FDIC), which resulted in all funds held at SVB being temporarily inaccessible by SVB’s customers. As of March 13, 2023, access to our cash and cash equivalents at SVB was fully restored. Although our cash balances at SVB are insignificant and we do not expect further developments at SVB to have a material impact on our cash and cash equivalents, we do hold cash balances in several large financial institutions significantly in excess of FDIC and global insurance limits. If other banks and financial institutions with whom we have banking relationships enter receivership or become insolvent in the future, we may be unable to access, and we may lose, some or all of our existing cash, cash equivalents and investments to the extent those funds are not insured or otherwise protected by the FDIC.
Our stock price has been subject to fluctuations, and will likely continue to be subject to fluctuations, which may be volatile and due to factors beyond our control.
The market price of our common stock is subject to wide fluctuations in response to various factors, some of which are beyond our control. In addition to the factors discussed in this "Risk Factors" section and elsewhere in this report, factors that could cause fluctuations in the market price of our common stock include the following:
15
In addition, the market for technology stocks and the stock markets in general have experienced extreme price and volume fluctuations. Stock prices of many technology companies have fluctuated in a manner unrelated or disproportionate to the operating performance of those companies. In the past, stockholders have instituted securities class action litigation following periods of market volatility. If we were to become involved in securities litigation, it could subject us to substantial costs, divert resources and the attention of management from our business, and adversely affect our business, results of operations, financial condition, and cash flows. A decline in the value of our common stock, including as a result of one or more factors set forth above, may result in substantial losses for our stockholders.
Risks Related to Operations
Our operating results are likely to fluctuate significantly.
Our operating results are affected by a wide variety of factors that could materially adversely affect revenues or profitability. The following factors could impact future operations:
•
•
•
•
•
19
the level of orders received which can be shipped in a quarter because of the tendency of customers to wait until late in a quarter to commit to purchase due to capital expenditure approvals and constraints occurring at the end of a quarter, or the hope of obtaining more favorable pricing from a competitor seeking the business;
•
•
•
•
•
•
•
•
•
As a result of the foregoing and other factors, we have experienced and may continue to experience material fluctuations in future operating results on a quarterly or annual basis which could materially and adversely affect our business, financial condition, operating results or stock price.
If our suppliers do not meet product or delivery requirements, we could have reduced revenues and earnings.
If any of our suppliers were to cancel contracts or commitments or fail to meet the quality or delivery requirements needed to satisfy customer orders for our products, we could lose time-sensitive customer orders, have significantly decreased revenues and earnings and be subject to contractual penalties, which would have a material adverse effect on our business, results of operations and financial condition. In addition, we rely on contract manufacturers for certain of our products, and our ability to meet customer orders
16
for those products depends upon the timeliness and quality of the work performed by these subcontractors, over whom we do not exercise any control.
To a certain extent, we are dependent upon the ability of our suppliers and contract manufacturers to help meet increased product or delivery requirements. It may be difficult for certain suppliers to meet delivery requirements in a period of rapid growth, therefore impacting our ability to meet our customers’ demands.
Our suppliers are subject to trade regulations, including tariffs and export restrictions imposed by the United States Government and by the governments of other countries. These regulations could impact our suppliers’ ability to provide us with components for our products or could increase the price of those components.
We rely on the financial strength of our suppliers. There can be no assurance that theThe loss of suppliers either as a result of financial viability, bankruptcy or otherwise will not have a material adverse effect on our business, results of operations or financial condition.
Our operations may be adversely impacted if our outsourced contract manufacturers or service providers fail to perform.
We depend on Flex Ltd. (“Flex”) to manufacture and test our FLEX and J750 family of products from its facilities in China and, starting in 2022, also Malaysia; Plexus Corp. (“Plexus”) to manufacture and test our
20
Magnum products from its facilities in Malaysia and, starting in 2023, also Thailand and ETS family of products from its facility in Malaysia; SAM Meerkat to manufacture and test our storage test family of products from its facilities in Malaysia and Thailand and on other contract manufacturers to manufacture other products. If for any reason these contract manufacturers cannot provide us with these products in a timely fashion, or at all, we may not be able to sell these products to our customers until we enter a similar arrangement with an alternative contract manufacturer. The Flex facility located in China may be impacted by the ongoing trade dispute between the United States and China, by regulations implemented by the United States or China, or disruption caused by health pandemics, such as the coronavirus.
If we experience a problem with our supply of products from Flex, Plexus, SAM Meerkat, or our other contract manufacturers, it may take us significant time to either manufacture the product or find an alternate contract manufacturer, which could result in substantial expense and disruption to our business.
We have also outsourced certain general and administrative functions to reputable service providers, many of which are in foreign countries, sometimes impacting communication with them because of language and time differences. Their presence in foreign countries also increases the risk they could be exposed to political risk. Additionally, there may be difficulties encountered in coordinating the outsourced operations with existing functions and operations. If we fail in successfully coordinating and managing the outsourced service providers, it may cause an adverse effect on our operations which could have a material adverse effect on our business, results of operations or financial condition.
Our business may suffer if we are unable to attract and retain key employees.
Competition for employees with skills we require is intense in the high technology industry. We expect intense competition for employees to continue in 2023. Our success will depend on our ability to attract and retain key technical employees. The loss of one or more key or other employees, a decrease in our ability to attract additional qualified employees, or the delay in hiring key personnel could each have a material adverse effect on our business, results of operations or financial condition.
Our operations, and the operations of our customers and suppliers, are subject to risks of natural catastrophic events, severe weather, widespread health epidemics, acts of war, terrorist attacks and the threat of domestic and international terrorist attacks, any one of which could result in cancellation of orders, delays in deliveries or other business activities, or loss of customers and could negatively affect our business and results of operations.
Our business is international in nature, with our sales, service and administrative personnel and our customers and suppliers located in numerous countries throughout the world. Our operations, and those of our customers and suppliers, are subject to disruption for a variety of reasons, including work stoppages, acts of war, terrorism, health epidemics, fires, earthquakes, hurricanes, typhoons, volcanic eruptions, energy shortages, telecommunication failures, tsunamis, flooding or other natural disasters. Such disruption could materially increase our costs and expenses as well as cause delays in, among other things, shipments of products to our customers, our ability to perform services requested by our customers, or the installation and acceptance of our products at customer sites. Any of these conditions could have a material adverse effect on our business, financial condition or results of operations.
Global climate change can result in natural disasters occurring more frequently, with greater intensity and with less predictability. For example, in December 2021, our operations in Cebu, Philippines experienced a devastating typhoon. Our employees in Cebu succeeded in restoring most of our operations within days despite the severity of the damage in the region. We have offered support services to many of our employees impacted by the typhoon and have incurred additional costs to maintain our operations following the disaster. The long-term effects of climate change on the global economy and the semiconductor industry in particular are unclear but could be severe.
21
The global supply shortage of electrical components and inflationary cost increases has impacted our ability to meet customer demand and could adversely affect our business and financial results.
The global supply shortage of electrical components, including semiconductor chips, continued to impact our supply chain in 2022.2023. As a result, we have experienced, and expect to continue tomay experience in the future, increases in our lead times and costs for certain components for certain products and delays in the delivery of some orders placed by our customers. In addition, in 2022,2023, inflationary pressures contributed to increased costs for product components and wage inflation, which had minimal impact on our cost of products, gross margin and profit for the year. Our supply chain team, and our suppliers, continue to manage numerous supply, production and logistics obstacles. In an effort to mitigate these risks, in some cases, we have incurred higher costs due to investment in supply chain resiliency and to secure available inventory or have extended or placed non-cancellable purchase commitments with semiconductor suppliers, which introduces inventory risk if our forecasts and assumptions prove inaccurate. We have also sourced components from additional suppliers and multi-sourced and pre-ordered components and finished goods inventory in some cases in an effort to reduce the impact of the adverse supply chain conditions we have experienced. However, if we are unable to secure manufacturing capacities from our current or new suppliers and contract manufacturers, on acceptable terms or at all, or successfully manage our purchase commitments and inventory for components, our ability to deliver our products to our customers in the desired quantities, at competitive prices or in a timely manner may be negatively impacted for 2023.2024. Also, our suppliers and contract manufacturers have increased their prices, which increased our cost of products. We have been and may continue to be, affected by wage inflation. We also have been, and may continue to attempt to, offset the effect of these inflationary pressures by increasing the prices of our products. However, we may not be fully able to pass additional costs on to our customers, which could have a negative impact on our results of operations and financial condition. In 2022,
Our operations may be adversely impacted if our outsourced contract manufacturers or service providers fail to perform.
We depend on Flex Ltd. (“Flex”) to manufacture and test our FLEX and J750 family of products from its facility in Malaysia; Plexus Corp. (“Plexus”) to manufacture and test our Magnum products from its facilities in Malaysia and also Thailand and ETS family of products from its facility in Malaysia; SAM Meerkat to manufacture and test our storage test family of products from its facilities in Malaysia and Thailand and on other contract manufacturers to manufacture other products. If for any reason these contract manufacturers cannot provide us with these products in a timely fashion, or at all, we weremay not be able to sell these products to our customers until we enter a similar arrangement with an alternative contract manufacturer.
If we experience a problem with our supply of products from Flex, Plexus, SAM Meerkat, or our other contract manufacturers, it may take us significant time to either manufacture the product or find an alternate contract manufacturer, which could result in substantial expense and disruption to our business.
We have also outsourced certain general and administrative functions to reputable service providers, many of which are in foreign countries, sometimes impacting communication with them because of language and time differences. Their presence in foreign countries also increases the risk they could be exposed to political and cybersecurity risk. Additionally, there may be difficulties encountered in coordinating the outsourced operations with existing functions and operations. If we fail in successfully coordinating and managing the outsourced service providers, it may cause an adverse effect on our operations which could have a material adverse effect on our business, results of operations or financial condition.
Our business may suffer if we are unable to supply approximately $20 millionattract and retain key employees.
Competition for employees with skills we require is intense in the high technology industry. We expect intense competition for employees to continue in 2024. Our success will depend on our ability to attract and retain key technical employees. The loss of revenueone or
17
more key or other employees, a decrease in our test businessesability to attract additional qualified employees, or the delay in hiring key personnel could each have a material adverse effect on our business, results of operations or financial condition.
Our operations, and the operations of our customers and suppliers, are subject to risks of natural catastrophic events, severe weather, widespread health epidemics, acts of war, terrorist attacks and the threat of domestic and international terrorist attacks, any one of which could result in cancellation of orders, delays in deliveries or other business activities, or loss of customers and could negatively affect our business and results of operations.
Our business is international in nature, with our sales, service and administrative personnel and our customers and suppliers located in numerous countries throughout the world. Our operations, and those of our customers and suppliers, are subject to disruption for which we hada variety of reasons, including work stoppages, acts of war, terrorism, health epidemics, fires, earthquakes, hurricanes, typhoons, volcanic eruptions, energy shortages, telecommunication failures, tsunamis, flooding or other natural disasters. Such disruption could materially increase our costs and expenses as well as cause delays in, among other things, shipments of products to our customers, our ability to perform services requested by our customers, or the installation and acceptance of our products at customer demand.sites. Any of these conditions could have a material adverse effect on our business, financial condition or results of operations.
Global climate change can result in natural disasters occurring more frequently, with greater intensity and with less predictability. For example, in December 2021, our operations in Cebu, Philippines experienced a devastating typhoon. Our employees in Cebu succeeded in restoring most of our operations within days despite the severity of the damage in the region. The long-term effects of climate change on the global economy and the semiconductor industry in particular are unclear but could be severe.
Risks Related to Intellectual Property (“IP”) and Cybersecurity
Third parties may claim we are infringing their intellectual property and we could suffer significant litigation costs, licensing expenses or be prevented from selling our products.
We have been sued for patent infringement and receive notifications from time to time that we may be in violation of patents held by others. An assertion of patent infringement against us, if successful, could have a material adverse effect on our ability to sell our products or it could force us to seek a license to the intellectual property rights of others or alter such products so that they no longer infringe the intellectual property rights of others. A license could be very expensive to obtain or may not be available at all. Similarly, changing our products or processes to avoid infringing the rights of others may be costly or impractical. Additionally, patent litigation could require a significant use of management resources and involve a lengthy and expensive defense, even if we eventually prevail. If we do not prevail, we might be forced to pay significant damages, obtain licenses, modify our products, or stop making our products; each of which could have a material adverse effect on our financial condition, operating results or cash flows.
If we are unable to protect our IP, we may lose a valuable asset or may incur costly litigation to protect our rights.
We protect the technology that is incorporated in our products in several ways, including through patent, copyright, trademark and trade secret protection and by contractual agreement. However, even with these protections, our IP may still be challenged, invalidated or subject to other infringement actions. While we believe that our IP has value in the aggregate, nowe do not believe that any single element of our IP is in itself essential. If a significant portion of our IP is invalidated or ineffective, our business could be materially adversely affected.
A breach of our operational or security systems could negatively affect our business and results of operations.
We rely on various information technology networks and systems to process, transmit and store electronic information, including proprietary and confidential data, and to carry out and support a variety of business
22
activities, including manufacturing, research and development, supply chain management, sales and accounting. We have experienced several attempted cyber-attacks of our network. None of the attempted attacks have caused a disruption to our operations or had a material adverse effect on our business or financial results. As a result of the attempts, we have taken further preventive security measures to protect our systems. Despite these preventative security measures we have implemented, we may continue to be vulnerable to attempts by third parties to gain unauthorized access to our networks or sabotage our systems. These attempts, which might be related to criminal hackers, industrial espionage or state-sponsored intrusions, include trying to covertly introduce malware to our computers, networks and systems and impersonating authorized users. In addition, third party suppliers and service providers that we rely on to manage our networks and systems and process and store our proprietary and confidential data, including the data of our customers and suppliers, may also be subject to similar attacks. Employees and contractors may also attempt to gain unauthorized access to our systems and steal proprietary and confidential data. Such attempts could result in the misappropriation, theft, misuse, disclosure or loss or destruction of
18
the intellectual property, or the proprietary, confidential or personal information, of Teradyne or our employees, customers, suppliers or other third parties, as well as damage to or disruptions in our information technology networks and systems. These threats are constantly evolving and expanding, such as through the increased use of artificial intelligence in our products and expanding remote work opportunities for our employees, thereby increasing the difficulty of defending against them or implementing adequate preventative measures. While we seek to detect and investigate all security incidents and to prevent their recurrence, attempts to gain unauthorized access to our information technology networks and systems may be successful, and in some cases, we might be unaware of an incident or its magnitude and effects. A failure in or a breach of our operational or security systems or infrastructure, or those of our suppliers and other service providers, including as a result of cyber-attacks, could have a material adverse effect on our business or financial results, disrupt our business, result in the disclosure or misuse of proprietary or confidential information, damage our reputation, cause losses and increase our costs. We expect to continue to devote significant resources to the security of our information technology networks and systems.
A breach of the security of our products could negatively affect our business and results of operations.
We may be subject to security breaches of certain of our products caused by viruses, illegal break-ins or hacking, sabotage, or acts of vandalism by third parties or our employees or contractors. A breach of our product security systems could have a material adverse effect on our business or financial results, disrupt our business, result in the disclosure or misuse of proprietary or confidential information, damage our reputation, cause losses, and increase our costs. We expect to continue to devote significant resources to the security of our products.
Risks Related to the COVID-19 Pandemic
The novel coronavirus (COVID-19) pandemic has impacted our business and could materially adversely affect our results of operations, financial condition, liquidity, or cash flows.
During the global COVID-19 pandemic, government authorities implemented numerous measures in an effort to contain the spread of the virus, such as travel bans and restrictions, limitations on gatherings or social distancing requirements, quarantines, shelter-in-place orders, vaccination and testing mandates, and business limitations and shutdowns. These measures impacted our day-to-day operations and disrupted our business, workforce and operations, as well as the operations of our customers, contract manufacturers and suppliers. The COVID-19 pandemic also significantly increased economic and demand uncertainty in our markets. The COVID-19 pandemic, and the numerous measures implemented in response, adversely impacted our results of operations, including increasing costs company-wide, but we cannot accurately estimate the full extent of the impact to our 2022, 2021 and 2020 financial results or to our future financial results.
We will continue to monitor the COVID-19 pandemic. However, we are unable to accurately predict the future of COVID-19, which will depend on future developments that are highly uncertain and cannot be predicted with accuracy, including, but not limited to, any new surges or new strains or variants of the virus in areas where we do business, the availability and use of vaccinations and any further actions we may take as required by government authorities or that we determine are in the best interest of our employees, customers, contract manufacturers and suppliers.
23
Risks Related to Legal and Regulatory Compliance
The implementation of tariffs on our products may have a material impact on our business.
Our business operations and supply chain are global and may be disrupted by the implementation of tariffs.
In 2018, the United States Trade Representative imposed a 25% tariff on many lists of products, including certain Teradyne products that are made in China and imported into the United States. We have implemented operational changes that mitigate the impact of the 25% tariff on the import of our impacted products into the United States. As a result, the existing tariff has not had a material adverse effect on our business, financial condition or results of operations. The implementation of additional tariffs by the United States could have a material adverse effect on our business, financial condition or results of operations.
In addition to the actions taken by the United States, China has implemented retaliatory tariffs on products made in the United States and imported into China, including certain Teradyne products. We have implemented, if appropriate, operational changes that would mitigate the impact of the retaliatory tariffs. However, notwithstanding our efforts, the retaliatory tariffs or other trade restrictions implemented by China could disrupt our business operations, sales and supply chain and, therefore, have a material adverse effect on our business, financial condition or results of operations.
Trade regulations and restrictions impact our ability to manufacture certain products and to sell products to and support certain customers, which may materially adversely affect our sales and results of operations.
We are subject to U.S. laws and regulations that limit and restrict the export of some of our products and services and may restrict our transactions with certain customers, business partners and other persons. In certain circumstances, export control and economic sanctions regulations prohibit the export of certain products, services and technologies, and in other circumstances are required to obtain an export license before exporting the controlled item. We must also comply with export restrictions and laws imposed by other countries affecting trade and investments. We maintain an export compliance program but there are risks that the compliance controls could be circumvented, exposing us to legal liabilities. Compliance with these laws has not significantly limited our sales but could significantly limit them in the future. Changes in, and responses to, U.S. trade policy could reduce the competitiveness of our products and cause our sales to drop, which could have a material adverse effect on our business, financial condition or results of operations.
The U.S. government from time to time has issued export restrictions that prohibit U.S. companies from exporting U.S. manufactured products, foreign manufactured products with more than 25% controlled U.S. content, as well as U.S. origin technology. For example, the U.S. Department of Commerce has restricted the access of U.S. origin technologies to certain Chinese semiconductor companies including YMTC and CXMT by adding those companies to the Entity List under U.S. Export Administration Regulations (“EAR”). The addition of certain of these companies to the entity list has had and will continue to have an adverse impact on our business with these customers. We will take appropriate actions, including filing for licenses with the U.S. Department of Commerce to attempt to minimize the impact of the restrictions on these companies.our business.
19
On May 16, 2019, Huawei and 68 of its affiliates, including HiSilicon, were added to the U.S. Department of Commerce Entity List under the EAR. This action by the U.S. Department of Commerce imposed new export licensing requirements on exports, re-exports, and in-country transfers of all U.S. regulated products, software and technology to the designated Huawei entities. On August 17, 2020, the U.S. Department of Commerce published final regulations expanding the scope of the U.S. EAR to include additional products that would become subject to export restrictions relating to Huawei entities including HiSilicon. These new regulations restrict the sale to Huawei and the designated Huawei entities of certain non-U.S. made items, such as semiconductor devices, manufactured for or sold to Huawei entities including HiSilicon under specific, detailed conditions set forth in the new regulations. These new regulations have impacted our sales to Huawei, HiSilicon and their suppliers. We are taking appropriate actions, including filing license applications and obtaining licenses
24
from the U.S. Department of Commerce. However, we do not expect these actions will mitigate the impact of the regulations on our sales to Huawei, HiSilicon and other suppliers. As a result, the regulations will continue to have an adverse impact on our business and financial results. It is uncertain the extent these new regulations and any additional regulations that may be implemented by the U.S. Department of Commerce or other government agency may have on our business with other customers or potential customers. Also, our controls related to Entity List compliance could be circumvented, exposing us to legal liabilities.
On April 28, 2020, the U.S. Department of Commerce published new export control regulations for certain U.S. products and technology sold to military end users or for military end-use in China, Russia and Venezuela. The definition of military end user is broad. The regulations went into effect on June 29, 2020. In December 2020, the U.S. Department of Commerce issued a list of companies in China and other countries that it considered to be military end users. Compliance with the new export controls has impacted our ability to sell products to certain customers in China. In addition, while we maintain an export compliance program, our compliance controls could be circumvented, exposing us to legal liabilities. We will continue to assess the impact of the newthese export controls on our business and operations and take appropriate actions, including filing for licenses with the U.S. Department of Commerce, to minimize any disruption. However, we cannot be certain that the actions we take will mitigate all the risks associated with the export controls that may impact our business.
On October 7, 2022, the U.S. Department of Commerce published new regulations restricting the export to China of advanced semiconductors, supercomputer technology, equipment for the manufacturing of advanced semiconductors and components and technology for the manufacturing in China of certain semiconductor manufacturing equipment. The new restrictions are lengthy and complex. We continue to assess the impact of these regulations on our business. We have determined that restrictions on the sale of semiconductor testers in China to test certain advanced semiconductors will impactimpacted our sales to certain companies in China and our manufacturing and development operations in China. Several multinational companies manufacturing these advanced semiconductors in China have obtained one-year licenses allowing suppliers such as Teradyne to continue to provide testers to the facilities operated by these companies. We expect that other companies manufacturing advanced semiconductors in China will not receive licenses, thereby restricting our ability to provide testers to the facilities operated by these companies that do not receive a license. We also are filing license requests to sell to and support certain customers in China for certain end uses that, if granted, may reducemitigated the impact of these restrictions on our business. At this time, we do not knowbusiness by obtaining licenses from the U.S. Department of Commerce. On October 17, 2023, the U.S. Department of Commerce released new rules updating the export controls issued on October 7, 2022. The new rules, which took effect on November 17, 2023, significantly limit the impact these end user and end useof the October 7, 2022 restrictions will have on our business in China or on future revenues. In addition to the specific restrictions impacting our business,business. However, the regulations may continue to have an adverse impact on certain actual or potential customers and on the global semiconductor industry. To the extent the regulations impact actual and potential customers or disrupt the global semiconductor industry, our business and revenues will be adversely impacted. We also have determined that the restrictions on the export of certain US origin components and technology for use in the development and production in China of certain semiconductor manufacturing equipment impact our manufacturing and development operations in China. We have received a temporary authorization from the U.S. Department of Commerce allowing us to continue our manufacturing and development operations in China until the U.S. Department of Commerce issues a license to replace this temporary authorization. We cannot assess the likelihood or timing of receiving this license. In addition to requesting a license, we are implementing procedures for minimizing the impact of these new regulations on our operations in China, but there is no assurance that these procedures will succeed.
In response to the regulations issued by the U.S. Department of Commerce, the Chinese government has passed new laws, including blocking legislation, which may impact our business activities in China. The Company is assessing the potential impact of these new Chinese laws and monitoring relevant laws and regulations issued by the Chinese government. The impact of these new Chinese laws on our business activities in China remains uncertain at this time.
We may be subject to product recalls and warranty and product liability claims.
We invest significant resources in the design, manufacturing and testing of our products. However, from time to time, we discover design or manufacturing defects in our products after they have been shipped and, as a
25
result, we have incurred development and remediation costs and settled warranty and product liability claims. In addition, when our products contain defects or have reliability, quality or safety issues, we have conducted a product recall which resulted in significant repair or replacement costs and substantial delays in product shipments and may damage our reputation which could make it more difficult to sell our products. We could continue to have warranty and product liability claims or product recalls in the future. Any of these results could have a material adverse effect on our business, results of operations or financial condition.
We may incur significant costs of complying with present and future environmental regulations and may incur significant liabilities if we fail to comply with such environmental regulations.
We are subject to both domestic and international environmental regulations and statutory strict liability relating to the use, storage, discharge, site cleanup and disposal of hazardous chemicals used in our manufacturing processes. In addition, future regulations in response to global climate change may affect us, our suppliers, and our customers. Such regulations could cause us to incur additional direct costs for compliance, as well as increased indirect costs resulting from our customers, suppliers, or both incurring additional compliance costs that are passed on to us. Future climate change regulations could result in decreased demand for
20
our products. If we fail to comply with present and future regulations, or are required to perform site remediation, we could be subject to future liabilities or cost, including penalties or the suspension of production. Present and future regulations may also:
•
•
•
•
•
Pursuant to present regulations and agreements, we are conducting groundwater and subsurface assessment and monitoring and are implementing remediation and corrective action plans for facilities located in Massachusetts and New Hampshire which are no longer conducting manufacturing operations. As of December 31, 2022,2023, we have not incurred material costs as a result of the monitoring and remediation steps taken at the Massachusetts and New Hampshire sites.
The directive on the Restriction of the Use of Certain Hazardous Substances in Electrical and Electronic Equipment (the “RoHS Directive”) and the directive on Waste Electrical and Electronic Equipment (the “WEEE Directive”) altered the form and manner in which electronic equipment is imported, sold and handled in the European Union. Other jurisdictions, such as China, have followed the European Union’s lead in enacting legislation with respect to hazardous substances and waste removal. Ensuring compliance with the RoHS Directive, the WEEE Directive and similar legislation in other jurisdictions, and integrating compliance activities with our suppliers and customers could result in additional costs and disruption to operations and logistics and thus, could have a negative impact on our business, operations or financial condition.
We currently are, and in the future may be, subject to litigation or regulatory proceedings that could have an adverse effect on our business.
From time to time, we may be subject to litigation or other administrative, regulatory or governmental proceedings, including tax audits and resulting claims that could require significant management time and resources and cause us to incur expenses and, in the event of an adverse decision, pay damages or incur costs in an amount that could have a material adverse effect on our financial position or results of operations.
We may face risks associated with shareholder activism.
We may become subject to campaigns by shareholders advocating corporate actions such as financial restructuring, increased borrowing, special dividends, stock repurchases or divestitures. Such activities could
26
interfere with our ability to execute our business plans, be costly and time-consuming, disrupt our operations, divert the attention of management, or result in our initiating borrowing or increasing our share repurchase plan or dividend, any of which could have an adverse effect on our business or stock price.
Provisions of our charter and by-laws and Massachusetts law may make a takeover of Teradyne more difficult.
There are provisions in our basic corporate documents and under Massachusetts law that could discourage, delay or prevent a change in control, even if a change in control may be regarded as beneficial to some or all of our stockholders.
Item 1B: Unresolved Staff Comments
None. Item 1C: Cybersecurity We believe cybersecurity is critical to supporting our vision and enabling our strategy. As a producer of leading-edge electronic testing products and maker of advanced robotics, we face a multitude of cybersecurity threats that range from attacks common to most industries, such as ransomware and denial-of-service, to attacks from more advanced, persistent, and highly organized adversaries, including nation state actors, that may target us for our role in critical infrastructure sectors. Our customers, suppliers, and partners face similar cybersecurity threats and, while we have not been materially affected to date, a cybersecurity incident impacting us or any of these entities could materially adversely affect our operations, performance, and results of operations. These cybersecurity threats and related risks make it imperative that we maintain a strong focus on cybersecurity. 21 Governance The Board of Directors oversees management’s processes for identifying and mitigating risks, including cybersecurity risks, to help align our risk exposure with our strategic objectives. Senior leadership, including our Chief Information Security Officer ("CISO"), regularly brief the Audit Committee of the Board of Directors on our cybersecurity and information security posture. The corporate information security organization, under the CISO, has implemented a governance structure and processes to assess, identify, manage, and report cybersecurity risks. The CISO chairs management’s Cybersecurity Steering Committee, in which current cyber threats, program performance, and ongoing risk mitigations are regularly reviewed. Cybersecurity related risks are also integrated into our overall enterprise risk management ("ERM") process. These risks are included in the risk universe that the ERM function evaluates to assess top enterprise risks on an annual basis and is reviewed and evaluated by the Board of Directors. The Board of Directors is also apprised of cybersecurity issues or incidents deemed to have a moderate or higher business impact as they arise, even if considered immaterial. In the event of a significant incident, we intend to follow our detailed incident response playbooks, which outline the steps to be followed from incident detection through mitigation, recovery and notification, including escalation to functional areas (e.g., legal), and escalation to senior leadership via the Cybersecurity Steering Committee. Upon escalation, the Cybersecurity Steering Committee will review all inputs, assess the materiality of the incident, and then brief the Board of Directors on the determination and on how management intends to respond. Risk management and strategy Our global information security organization, led by our CISO, is responsible for our overall information security strategy, policy, security engineering, operations, and cyber threat detection and response. Our CISO is an experienced cybersecurity senior executive with more than 25 years of experience building and leading cybersecurity, risk management and information technology teams. The information security organization manages and continually enhances a robust enterprise security structure with the goal of preventing cybersecurity incidents to the extent feasible, while simultaneously increasing system resilience and deploying highly proficient detection and response capabilities in an effort to minimize the business impact should an incident occur. Central to this organization is our global cyber operations team, which is responsible for the protection, detection, and response capabilities used in the defense of critical data and enterprise computing services. We also have a corporate-wide insider threat detection program to proactively identify external and internal threats and mitigate those threats in a timely manner. Our broader Teradyne employee community also has a key role in our cybersecurity defenses and is immersed in a comprehensive training and awareness curriculum to build and promote a corporate culture supportive of security. Third parties also play a role in our cybersecurity. We engage third-party services to provide 24x7x365 monitoring, escalation, and response to cyber events. In addition to consulting on best practices, we leverage third parties for independent evaluations of our security controls through penetration testing and independent audits. These evaluations include testing both the design and operational effectiveness of security controls. We also share and receive threat intelligence with our industry peers, cybersecurity associations, and our cyber controls vendors. We rely on contract manufacturing organizations and distributors to deliver our products to our customers, and a cybersecurity incident at one of these organizations or a key supplier could materially adversely impact us. We assess third party and supply chain cybersecurity controls through risk monitoring services tailored to align with our risk policy. Notwithstanding the extensive approach we take to cybersecurity, we may not be successful in preventing or mitigating a cybersecurity incident that could have a material adverse effect on us, either directly within our managed environment or indirectly via a third-party partner or supply chain vendor. Periodically we have a recognized independent security expert firm to assess our cyber security maturity along with risks and provide feedback on where we should continue to improve to mitigate exposures. We share this review with our Board and develop a security roadmap which incorporates this feedback. Additionally, for our business that supports the defense and aerospace sector, we must comply with extensive regulations, including requirements imposed by the Defense Federal Acquisition Regulation Supplement ("DFARS") related to adequately safeguarding controlled unclassified information ("CUI") and reporting cybersecurity incidents to the DoD. We have implemented cybersecurity policies and frameworks based on industry and governmental standards to align closely with DoD requirements, instructions, and guidance. Moreover, we are pursuing the necessary controls to support the Cybersecurity Maturity Model Certification ("CMMC") program, DoD’s program to ensure members of the defense industrial base meet cybersecurity requirements for handling CUI and federal contract information. We believe we are well positioned to meet the requirements of the CMMC and are preparing for certification once the requirements are effective. 22 Item 2: Properties
|
None.
|
We conduct manufacturing, engineering, sales and marketing, service, corporate administration and other operations in various leased and owned facilities throughout the world. We own approximately 720,000 square feet of office space and lease overapproximately 1,500,000 square feet of office space. Our corporate headquarters is in North Reading, Massachusetts, in buildings that we own consisting of approximately 422,000 square feet. We believe our existing facilities and planned expansions noted below are adequate to meet our current and reasonably foreseeable requirements. We regularly evaluate our expected facility needs and periodically make adjustments based on these evaluations. In 2019, we purchased land in Denmark, approximately 200,000 square feet, to construct a new building for our Robotics operations. The new building construction is expected to be completed by the first quarterhalf of 2024.
Item 3: Legal Proceedings
|
We are subject to legal proceedings, claims and investigations that arise in the ordinary course of business such as, but not limited to, patent, employment, commercial and environmental matters. We believe that we have meritorious defenses against all pending claims and intend to vigorously contest them. While it is not possible to predict or determine the outcomes of any pending claims or to provide possible ranges of losses that may arise, we believe the potential losses associated with all these actions are unlikely to have a material adverse effect on our results of operations, financial condition or cash flows.
Item 4: Mine Safety Disclosure
|
Not Applicable.
2723
PART II
Item 5: Market for Registrant’s Common Equity, Related Shareholder Matters and Issuer Purchases of Equity Securities
|
Our common stock is traded on the Nasdaq Global Select Market under the trading symbol “TER.” As of February 17, 2023,22, 2024, there were approximately 1,2141,148 holders of record of shares of our common stock.
See “Item 7: Management’s Discussion and Analysis of Financial Condition and Results of Operations,” for information on the frequency and amounts of our quarterly cash dividends, equity compensation plans and performance graph.
The following table includes information with respect to repurchases we made of our common stock during the three months ended December 31, 20222023 (in thousands except per share price):
Period | (a) Total Number of Shares (or Units) Purchased | (b) Average Price Paid per Share (or Unit) | (c) Total Number of Shares (or Units) Purchased as Part of Publicly Announced Plans or Programs | (d) Maximum Number (or Approximate Dollar Value) of Shares (or Units) that may Yet Be Purchased Under the Plans or Programs | ||||||||||||
October 3, 2022 – October 30, 2022 | 30 | $ | 69.41 | 30 | $ | 647,918,955 | ||||||||||
October 31, 2022 – November 27, 2022 | 1 | 82.03 | — | 647,918,955 | ||||||||||||
November 28, 2022 – December 31, 2022 | 1 | 92.64 | — | 647,918,955 | ||||||||||||
|
|
|
|
|
| |||||||||||
| 32 | (1) | $ | 70.14 | (1) | 30 | |||||||||||
|
|
|
|
|
| |||||||||||
Period |
| (a) Total |
|
|
| (b) Average |
|
|
| (c) Total Number of |
|
| (d) Maximum Number |
| ||||
October 2, 2023 – October 29, 2023 |
|
| 363 |
|
|
| $ | 97.65 |
|
|
|
| 362 |
|
| $ | 1,615,390 |
|
October 30, 2023 – November 26, 2023 |
|
| 185 |
|
|
|
| 85.97 |
|
|
|
| 185 |
|
|
| 1,599,497 |
|
November 27, 2023 – December 31, 2023 |
|
| 1 |
|
|
|
| 93.70 |
|
|
|
| — |
|
|
| 1,599,497 |
|
|
|
| 549 |
| (1) |
| $ | 93.70 |
| (1) |
|
| 547 |
|
|
|
| |
|
|
We satisfy U.S. federal and state minimum withholding tax obligations due upon the vesting and the conversion of restricted stock units into shares of our common stock, by automatically withholding from the shares being issued, a number of shares with an aggregate fair market value on the date of such vesting and conversion that would satisfy the minimum withholding amount due.
Item 6: (Reserved)
24 Item 7: Management’s Discussion and Analysis of Financial Condition and Results of Operations Overview
|
|
Overview
We are a leading global supplier of automated test equipment and robotics products. We design, develop, manufacture and sell automaticautomated test systems and robotics products. Our automaticautomated test systems are used to test semiconductors, wireless products, data storage and complex electronics systems in many industries including consumer electronics, wireless, automotive, industrial, computing, communications, and aerospace and defense industries. Our Robotics products include collaborative robotic arms and autonomous mobile robots (“AMRs”) used by global manufacturing, logistics and industrial customers to improve quality, increase manufacturing and
28
material handling efficiency and decrease manufacturing and logistics costs. Our automaticautomated test equipment and robotics products and services include:
•
•
•
•
The market for our test products is concentrated with a limited number of significant customers accounting for a substantial portion of the purchases of test equipment. A few customers drive significant demand for our products both through direct sales and sales to the customer’s supply partners. We expect that sales of our test products will continue to be concentrated with a limited number of significant customers for the foreseeable future.
In 2022,2023, the demand in the mobility and compute segments of our Semiconductor Test business was lower duecontinued to end market slowdownbe impacted by a correction cycle driven by excess semiconductor inventory, primarily in these segments as well as a slower technology transition in onethe mobility segment of our largest end-markets. While the market. The depth of thethis slowdown and the timing of the recovery are uncertain, however, strong automotive and image sensor demand partially offset these declines. The growth of DDR5 and High Bandwidth Memory ("HBM") devices for data center applications continued to drive demand for our products in the memory market in 2023. Over the midterm, we expect the ramp of 3 nanometer process technology starting in 2023 followed byand gate-all-around process technology, increasing multichip packaging, additional device complexity and unit growth will drive additional demand for test over our four year forecast period.Semiconductor Test.
Our Robotics segment consists of Universal Robots A/S (“UR”), a leading supplier of collaborative robotic arms, and Mobile Industrial Robots A/S (“MiR”), a leading maker of AMRs for industrial automation. In September 2022, we merged MiR and AutoGuide, LLC (“AutoGuide”), a maker of high payload AMRs, to become a single supplier of AMRs. The market for our Robotics segment products is dependent on the adoption of new automation technologies by large manufacturers as well as small and medium enterprises (“SMEs”) throughout the world. We expect Robotics sales channel expansion combined withDemand in the fourth quarter of 2023 increased, tied to introduction of new products and seasonally high demand in Robotics after market softness and the impact of our channel transformation resulted in a weaker than forecasted first half of 2023.
On November 7, 2023, Teradyne and Technoprobe S.p.A, (“Technoprobe”), a leader in the design and production of probe cards, announced establishment of a strategic partnership that will seek to driveaccelerate growth for both companies and enable higher performance semiconductor test interfaces for customers worldwide. As part of the growthpartnership, Teradyne will make an investment of 481.0 million Euros in 2023.exchange for a 10% equity investment in Technoprobe and Technoprobe will acquire 100% of Teradyne’s Device Interface Solutions ("DIS") business in exchange for $85.0 million. The transaction is expected to close during the first half of 2024.
BothIn 2023, inflation had minimal effect on our results. While both our test and robotics businesses may continue to be influenced by supply constraints, which could impact our revenue and costs, in 2023. In 2022, inflation had minimal effectWe do not anticipate that supply chain constraints will have a material impact on our results. In 2022, we were unable to supply approximately $20 million of revenuefinancial results in our test businesses for which we had customer demand.2024.
Our financial statements are denominated in U.S. dollars. While the majority of our revenues are in U.S. dollars, approximately 70 percent of our Robotics revenue is denominated in foreign currencies. InThere was no material impact to our 2023 results due to changes in foreign exchange rates, however, in 2022, the strengthening of the U.S. dollar was a factor in lower than forecasted revenues in our Robotics segment. Continued strengthening of the U.S. dollar would negativelyadversely affect Robotics revenue growth in 2023.2024.
Our corporate strategy continues to focus on profitably gaining market share in our test businesses through the introduction of differentiated products that target expanding segments and accelerating growth through continued investment in our Robotics businesses. We plan to continue investing in our growth while balancing capital allocations between returning capital to our shareholders through stock repurchases and dividends and using capital for acquisitions.
Impact25
Table of the COVID-19 Pandemic on our BusinessContents
During the novel coronavirus (COVID-19) pandemic, government authorities implemented numerous measures in an effort to contain the spread of the virus, such as travel bans and restrictions, limitations on
29
gatherings or social distancing requirements, quarantines, shelter-in-place orders, vaccination and testing mandates, and business limitations and shutdowns. Additionally, we took proactive, aggressive action to protect the health and safety of our employees, customers, contract manufacturers and suppliers, and to comply with all government orders around the globe. The spread of COVID-19 caused us to modify our business practices, which included implementing social distancing protocols, limiting employee travel and requiring employees to work remotely. These measures impacted our day-to-day operations and disrupted our business, workforce and operations, as well as the operations of our customers, contract manufacturers and suppliers. Due to the COVID-19 pandemic, there has also been uncertainty and disruption in the global economy and our markets. We are not aware of any specific event or circumstance that would require an update to our estimates or judgments or a revision of the carrying value of our assets or liabilities as of February 22, 2023, the date of issuance of this Annual Report on Form 10-K.
We believe the COVID-19 pandemic, and the numerous measures implemented by authorities in response, adversely impacted our results of operations, including by increasing costs, but we cannot accurately estimate the amount of the impact to our 2022 and 2021 financial results or to our future financial results. In addition, the pandemic has disrupted our contract manufacturers and suppliers, and has resulted in some instances in short-term cost increases to meet customer demand. While a continuation of the pandemic may further impact our workforce and operations, as well as those of our customers, contract manufacturers and suppliers, we expect that our manufacturing facilities will remain operational, at sufficient capacity to support production demand. We are monitoring our operations closely in an effort to avoid any potential productivity loss caused by responses to the COVID-19 pandemic.
We experienced interruptions to our supply chain as a result of the COVID-19 pandemic. Our suppliers have faced and may continue to face difficulties maintaining operations in light of COVID-19 disruptions and government-ordered restrictions. Our supply chain team, and our suppliers, continue to manage numerous supply, production, and logistics obstacles caused by the pandemic. There is no assurance that these efforts will be successful. The COVID-19 pandemic may continue to disrupt our ability to obtain components required to manufacture our products, adversely affecting our operations and in some instances resulting in higher costs and delays, both for obtaining components and shipping finished goods to customers.
We will continue to monitor the COVID-19 pandemic. We may take further actions as may be required or recommended by government authorities or that we determine are in the best interests of our employees, customers, contract manufacturers and suppliers. In these circumstances, there may be developments outside our control requiring us to adjust our operating plan. As a result, given the uncertain nature of this situation, we are not able to accurately predict the full extent of the impact of COVID-19 on our business, financial condition, results of operations, liquidity, or cash flows in the future.
Supply Chain Constraints and Inflationary Pressures
The global supply shortage of electrical components, including semiconductor chips, continued to impactimpacted our supply chain in 2022. As a result,the first half of 2023. In the second half of 2023, we experienced,saw improvements related to supply constraints and, expect to continue toconsequently, did not experience material increases in our lead times and costs for certain components for certain of our products.components. In addition, in 2022,the 2023, inflationary pressures contributed to increased costs for product components and wage inflation, which had a minimal impact on our cost of products, gross margin and profit for the year. Our supply chain team, and our suppliers, continue to manage numerous supply, production, and logistics obstacles. In an effort to mitigate these risks, in some cases, we have incurred higher costs due to investment in supply chain resiliency and to secure available inventory or have extended or placed non-cancellable purchase commitments with semiconductor suppliers, which introduces inventory risk if our forecasts and assumptions prove inaccurate. We have also sourced components from additional suppliers and multi-sourced and pre-ordered components and finished goods inventory in some cases in an effort to reduce the impact of the adverse supply chain conditions we have experienced. However, if we are unable to secure manufacturing capacities fromThough these mitigation efforts have not had a material impact on our current or new suppliers and contract manufacturers, on
30
acceptable terms or at all, or successfully managefinancial results, our purchase commitments and inventory for components,continuing efforts may not be successful. While our ability to deliver our products to our customersbusinesses could be impacted by supply constraints in the desired quantities, at competitive prices orfuture, we do not anticipate supply chain constraints will have a material impact on our financial results in a timely manner may be negatively impacted for 2023.2024.
Impact of Russia’s invasion of Ukrainethe Israel-Hamas conflict on our Business
Russia’s invasion of Ukraine, in February 2022, did not have a significant direct impact on our business as we have minimal business in Russia and Ukraine. However, following the invasion, the U.S. and other countries imposed significant sanctions against the Russian government and many Russian companies and individuals. Although we do not have significant operations in Russia, the sanctions and Russia’s response to the sanctions, have impacted our business in other countries andThe recent Israel-Hamas conflict could have a negative impact on our future revenue and supply chain, either of which could adversely affect our business and financial results. Our customers in Israel may experience delays in product releases due to impacts to their labor force and impacts on their suppliers because of the conflict, which could materially impact demand for our products. Similarly, our suppliers in Israel may experience delays in providing us with parts due to the conflict. In addition, the global economic uncertainty following the invasion, sanctions and Russia’s response tostart of the sanctionsconflict could impact demand for our products.
Impact of October 7, 2022 and October 17, 2023 U.S. Department of Commerce Regulations on our Business
On October 7, 2022, the U.S. Department of Commerce published new regulations restricting the export to China of advanced semiconductors, supercomputer technology, equipment for the manufacturing of advanced semiconductors and components and technology for the manufacturing in China of certain semiconductor manufacturing equipment. The newAs previously disclosed, the restrictions are lengthy and complex. We continue to assess the impact of these regulations on our business. We have determined that restrictions on the sale of semiconductor testers in China to test certain advanced semiconductors will impact ourimpacted Teradyne’s sales to certain companies in China and Teradyne’s manufacturing and development operations in China. Several multinational companies manufacturing these advanced semiconductors in China have obtained one-year licenses allowing suppliers such as Teradyne to continue to provide testers to the facilities operated by these companies. We expect that other companies manufacturing advanced semiconductors in China will not receive licenses, thereby restricting our ability to provide testers to the facilities operated by these companies that do not receive a license. We are also filing license requests to sell to and support certain customers in China for certain end uses that, if granted, may reducemitigated the impact of these restrictions on our business. At this time, we do not knowits business by obtaining licenses from the Department of Commerce. On October 17, 2023, the Department of Commerce released new rules updating the exporting controls issued on October 7, 2022. The new rules which took effect on November 17, 2023 significantly limit the impact these end user and end useof the October 7, 2022 restrictions will have on our business in China or on future revenues. In addition to the specific restrictions impacting our business,Teradyne’s business. However, the regulations may continue to have an adverse impact on certain actual or potential customers of Teradyne and on the global semiconductor industry. To the extent the regulations impact actual and potential customers or disrupt the global semiconductor industry, ourTeradyne’s business and revenues will be adversely impacted. We also have determined that the restrictions on the export of certain U.S. origin components and technology for use in the development and production in China of certain semiconductor manufacturing equipment impact our manufacturing and development operations in China. We have received a temporary authorization from the U.S. Department of Commerce allowing us to continue our manufacturing and development operations in China until the U.S. Department of Commerce issues a license to replace this temporary authorization. We cannot assess the likelihood or timing of receiving this license. In addition to requesting a license, we are implementing procedures for minimizing the impact of these new regulations on our operations in China, but there is no assurance that these procedures will succeed.
See Part II—Item 1A, “Risk Factors,” included herein for updates to our risk factors regarding risks associated with the COVID-19 pandemic, supply chain issues, international conflicts, and international conflicts.legal and regulatory compliance.
Critical Accounting Policies and Estimates
We have identified the policies and estimates discussed below as critical to understanding our business and our results of operations and financial condition. The impact and any associated risks related to these estimates on our business operations is discussed throughout Management’s Discussion and Analysis of Financial Condition and Results of Operations where such policies affect our reported and expected financial results. For a full description of our accounting policies related to the below items refer to Note B. Accounting Policies, included in the Notes to Consolidated Financial Statements in this Annual Report.
31
Critical accounting estimates are complex and may require significant judgment by management. Changes to the underlying assumptions may have a material impact on our financial condition and results of operations. These estimates may change, as new events occur, and additional information is obtained. Actual results could differ significantly from these estimates under different assumptions or conditions.
Revenue Recognition
In accordance with ASC 606, “Revenue from Contracts with Customers” (“ASC 606”), we recognize revenues, when or as control is transferred to a customer. Our determination of revenue requires judgment in the determination of performance obligations and allocation of the transaction price to performance obligations. We often sell bundled orders that include both product and services or multiple different products within the same order. We evaluate each of the deliverables to determine if it meets the definition of a performance obligation, which requires that it is capable of being distinct and distinct within the context of the contract. This
26
determination is based on an assessment of contractual rights of the contract and the ability of the performance obligation to perform on its own or with readily available resources. In bundled transactions we estimate the standalone selling price of each identified performance obligation and use that estimate to allocate the transaction price among said performance obligations. The estimated standalone selling price is determined using all information reasonably available to us, including standalone transactions, market information and other observable inputs.
Inventories
Inventories are stated at the lower of cost using a standard costing system which approximates cost based on a first-in, first-out basis or net realizable value. On a quarterly basis, we evaluate all inventories for net realizable value. This quarterly process identifies obsolete and excess inventory. Obsolete inventory, which represents items for which there is no demand, is fully reserved. Excess inventory, which represents inventory items that are not expected to be consumed within the forecasted demand window, is written down to estimated net realizable value. Forecasted demand information is obtained from the sales and marketing groups and incorporates factors such as backlog and future revenues. The demand forecast is based on assumptions around the product life and customer and market forecasts.expectations.
Retirement and Postretirement Plans
We recognize net actuarial gains and losses and the change in the fair value of the plan assets in our operating results in the year in which they occur or upon any interim remeasurement of the plans. Discount rate and expected return on assets are two assumptions which are important elements of pension plan expense and asset/liability measurement. We evaluate our discount rate and expected rate of return on assets assumptions annually on a plan and country specific basis. We evaluate other assumptions related to demographic factors, such as retirement age, mortality and turnover periodically, and update them to reflect our experience and expectations for the future.
In developing the expected return on U.S. Qualified Pension Plan (“U.S. Plan”) assets assumption, we evaluated input from our investment manager and pension consultants, including their forecast of asset class return expectations. We believe that 2.0%4.75% was an appropriate rate of return on assets to use for 2022.2023. The December 31, 20222023 asset allocation for our U.S. Plan was 94% invested in fixed income securities, 5% invested in equity securities, and 1% invested in other securities. Our investment manager regularly reviews the actual asset allocation and periodically rebalances the portfolio to ensure alignment with our target allocations.
The discount rate that we utilized for determining future pension obligations for the U.S. Plan is based on the FTSE Pension Index adjusted for the U.S. Plan’s expected cash flows and was 4.75% at December 31, 2023, down from 4.95% at December 31, 2022, up from 2.65% at December 31, 2021.2022. We estimate that in 20232024 we will recognize approximately $0.4$0.2 million of pension expense for the U.S. Plan. The U.S. Plan pension expense estimate for 20232024 is based on a 4.95%
32
4.75% discount rate and a 4.75%4.65% return on assets. Future pension expense or income will depend on future investment performance, changes in future discount rates and various other factors related to the employee population participating in our pension plans.
Goodwill, Intangible and Long-Lived Assets
We assess goodwill for impairment at least annually in the fourth quarter, as of December 31, on a reporting unit basis, or more frequently, when events and circumstances occur indicating that the recorded goodwill may be impaired. We review intangible and long-lived assets for impairment whenever events or changes in business circumstances indicate that the carrying amount of the assets may not be fully recoverable or that the useful lives of these assets are no longer appropriate. Goodwill impairment will be the amount by which a reporting unit’s carrying value exceeds its fair value, not to exceed the carrying amount of goodwill. Impairment of intangible and long-lived assets would result in the asset being written down to its estimated fair value. The calculated fair value of a reporting unit or intangible or long-lived asset is dependent upon discounted cash flow (“DCF”) models, discount rates, and market multiples. DCF models rely on our forecasted mid-term plans which are subjective based on customer or market conditions and can change materially. We utilize third party specialists when determining discount rates and selected market multiples. A change in any of these key assumptions could result in a reporting unit, intangible asset, or long-lived asset being impaired in a future period.
Convertible Debt
We adopted Accounting Standards Update (“ASU”) ASU 2020-06 – “Debt—Debt with Conversion and Other Options and Derivatives and Hedging—Contracts in Entity’s Own Equity,” on January 1, 2022 using the modified retrospective method of adoption. As a result of adoption, we recorded an increase of $1.4 million to current debt for unsettled shares, an increase of $1.8 million to deferred tax assets, an increase of $6.6 million to long-term debt for unamortized debt discount, and an increase to retained earnings of $94.6 million for the reclassification of the equity component. Mezzanine equity representing unsettled shares value was reduced to zero and additional paid-in capital was reduced by $100.8 million. In accordance with ASU 2020-06, we account for a
27
convertible debt instrument as a single liability measured at its amortized cost, as long as no other features require bifurcation and recognition as derivatives. Unsettled shares are recorded in current debt, and there is no recognition of a debt discount, which was previously amortized to interest expense. Settled shares reduce the outstanding debt balance in an amount equal to the cash paid, but do not result in any gain or loss on extinguishment. We use the if-converted method in the diluted EPS calculation for convertible instruments.
Income Taxes
Deferred tax assets and liabilities are determined based on differences between financial reporting and tax basis of assets and liabilities and are measured using the enacted tax rates and laws that will be in effect when the differences are expected to reverse. The measurement of deferred tax assets is reduced by a valuation allowance if it is more likely than not that some or all of the deferred tax assets will not be realized. Evaluating the positive and negative evidence regarding the realization of the net deferred tax assets in accordance with ASC 740, “Accounting for Income Taxes” is a key judgment in the valuation of income taxes. This assessment included the evaluation of scheduled reversals of deferred tax liabilities, estimates of projected future taxable income and tax-planning strategies. Although realization is not assured, based on our assessment, we concluded that it is more likely than not that such assets, net of the existing valuation allowance, will be realized.
Results of Operations
Information pertaining to fiscal year 20202021 results of operations, including a year-to-year comparison against fiscal year 2021,2022, was included in our Annual Report on Form 10-K for the year ended December 31, 20212022 under Part II, Item 7, “Management’s Discussion and Analysis of Financial Position and Results of Operations,” which was filed with the SEC on February 23, 2022.22, 2023. This information is incorporated by reference herein.
33
The following table sets forth the percentage of total net revenues included in our consolidated statements of operations:
| Years Ended December 31, |
| Years Ended December 31, |
| |||||||||||||
| 2022 | 2021 |
| 2023 |
|
| 2022 |
| |||||||||
Percentage of revenues: |
|
|
|
|
|
| ||||||||||
Revenues: |
|
|
|
|
|
| ||||||||||
Products | 82.1 | % | 86.3 | % |
|
| 78.3 | % |
|
| 82.1 | % | ||||
Services | 17.9 | 13.7 |
|
| 21.7 |
|
|
| 17.9 |
| ||||||
|
| |||||||||||||||
Total revenues | 100.0 | 100.0 |
|
| 100.0 |
|
|
| 100.0 |
| ||||||
Cost of revenues: |
|
|
|
|
|
| ||||||||||
Cost of products | 33.0 | 35.1 |
|
| 33.0 |
|
|
| 33.0 |
| ||||||
Cost of services | 7.8 | 5.3 |
|
| 9.6 |
|
|
| 7.8 |
| ||||||
|
| |||||||||||||||
Total cost of revenues (exclusive of acquired intangible assets amortization shown separately below) | 40.8 | 40.4 |
|
| 42.6 |
|
|
| 40.8 |
| ||||||
|
| |||||||||||||||
Gross profit | 59.2 | 59.6 |
|
| 57.4 |
|
|
| 59.2 |
| ||||||
Operating expenses: |
|
|
|
|
|
| ||||||||||
Selling and administrative | 17.7 | 14.8 |
|
| 21.6 |
|
|
| 17.7 |
| ||||||
Engineering and development | 14.0 | 11.5 |
|
| 15.6 |
|
|
| 14.0 |
| ||||||
Acquired intangible assets amortization | 0.6 | 0.6 |
|
| 0.7 |
|
|
| 0.6 |
| ||||||
Restructuring and other | 0.5 | 0.3 |
|
| 0.8 |
|
|
| 0.5 |
| ||||||
|
| |||||||||||||||
Total operating expenses | 32.8 | 27.2 |
|
| 38.7 |
|
|
| 32.8 |
| ||||||
|
| |||||||||||||||
Income from operations | 26.4 | 32.4 |
|
| 18.7 |
|
|
| 26.4 |
| ||||||
Non-operating (income) expenses: |
|
|
|
|
|
| ||||||||||
Interest income | (0.2 | ) | (0.1 | ) |
|
| (1.0 | ) |
|
| (0.2 | ) | ||||
Interest expense | 0.1 | 0.5 |
|
| 0.1 |
|
|
| 0.1 |
| ||||||
Other (income) expense, net | (0.2 | ) | 0.7 |
|
| — |
|
|
| (0.2 | ) | |||||
|
| |||||||||||||||
Income before income taxes | 26.6 | 31.4 |
|
| 19.6 |
|
|
| 26.6 |
| ||||||
Income tax provision | 4.0 | 4.0 |
|
| 2.9 |
|
|
| 4.0 |
| ||||||
|
| |||||||||||||||
Net income | 22.7 | % | 27.4 | % |
|
| 16.8 | % |
|
| 22.7 | % | ||||
|
| |||||||||||||||
28
Revenues
Revenues for our reportable segments were as follows:
| 2022 | 2021 | 2021-2022 Dollar Change |
| 2023 |
|
| 2022 |
|
| 2022-2023 |
| |||||||||||||
| (in millions) |
| (in millions) |
| |||||||||||||||||||||
Semiconductor Test | $ | 2,080.6 | $ | 2,642.3 | $ | (561.7 | ) |
| $ | 1,818.6 |
|
| $ | 2,080.6 |
|
| $ | (262.0 | ) | |||||
Robotics |
|
| 375.2 |
|
|
| 403.1 |
|
|
| (27.9 | ) | ||||||||||||
System Test | 469.3 | 467.7 | 1.6 |
|
| 338.2 |
|
|
| 469.3 |
|
|
| (131.1 | ) | |||||||||
Robotics | 403.1 | 375.9 | 27.2 | |||||||||||||||||||||
Wireless Test | 201.7 | 216.9 | (15.2 | ) |
|
| 144.3 |
|
|
| 201.7 |
|
|
| (57.4 | ) | ||||||||
Corporate and Eliminations | 0.3 | — | 0.3 |
|
| — |
|
|
| 0.3 |
|
|
| (0.3 | ) | |||||||||
|
|
|
| $ | 2,676.3 |
|
| $ | 3,155.0 |
|
| $ | (478.7 | ) | ||||||||||
| $ | 3,155.0 | $ | 3,702.9 | $ | (547.9 | ) | ||||||||||||||||||
|
|
| ||||||||||||||||||||||
34
The decrease in Semiconductor Test revenues of $561.7$262.0 million, or 21.3%12.6%, was driven primarily by lower tester sales for compute and mobility applications. The decrease in mobileRobotics revenues of $27.9 million, or 6.9%, was driven primarily by softening demand due to slowing global industrial activity and high performance compute processor applications, partially offset by an increase in advance driver assistance systems (“ADAS”) tester sales.macro-economic headwinds and the impact of the transformation of Universal Robots' sales channel. The increasedecrease in System Test revenues of $1.6$131.1 million, or 0.3%27.9%, was primarily due to higherlower sales in Defense/Aerospace and in Production Board Test, partially offset by a decline in Storage Test sales of system level testers. The rise in Robotics revenues of $27.2 million, or 7.2%, was driven primarily by higher demand for UR’s collaborative robotic arms and MiR’s autonomous mobile robots, partially offset by changes in foreign exchange rates.hard disk drive testers. The decrease in Wireless Test revenues of $15.2$57.4 million, or 7.0%28.5%, was primarily due to a decrease in cellularsales of connectivity test product sales, partially offset by an increase in ultra-wide band test product sales.products.
Our reportable segments accounted for the following percentages of consolidated revenues:
| 2022 | 2021 |
| 2023 |
|
| 2022 |
| |||||||||
Semiconductor Test | 66 | % | 71 | % |
|
| 68 | % |
|
| 66 | % | ||||
Robotics |
|
| 14 |
|
|
| 13 |
| ||||||||
System Test | 15 | 13 |
|
| 13 |
|
|
| 15 |
| ||||||
Robotics | 13 | 10 | ||||||||||||||
Wireless Test | 6 | 6 |
|
| 5 |
|
|
| 6 |
| ||||||
|
|
|
| 100 | % |
|
| 100 | % | |||||||
| 100 | % | 100 | % | |||||||||||||
|
| |||||||||||||||
Revenues by country as a percentage of total revenues were as follows (1):
| 2022 | 2021 |
| 2023 |
|
| 2022 |
| |||||||||
United States |
|
| 16 | % |
|
| 15 | % | ||||||||
Korea |
|
| 15 |
|
|
| 17 |
| ||||||||
Taiwan | 20 | % | 30 | % |
|
| 14 |
|
|
| 20 |
| ||||
Korea | 17 | 14 | ||||||||||||||
China | 16 | 17 |
|
| 12 |
|
|
| 16 |
| ||||||
United States | 15 | 11 | ||||||||||||||
Japan |
|
| 11 |
|
|
| 5 |
| ||||||||
Europe | 9 | 7 |
|
| 10 |
|
|
| 9 |
| ||||||
Japan | 5 | 4 | ||||||||||||||
Malaysia | 5 | 4 | ||||||||||||||
Thailand | 4 | 4 | ||||||||||||||
Philippines | 4 | 5 |
|
| 7 |
|
|
| 4 |
| ||||||
Singapore | 3 | 3 |
|
| 4 |
|
|
| 3 |
| ||||||
Thailand |
|
| 3 |
|
|
| 4 |
| ||||||||
Malaysia | �� |
| 3 |
|
|
| 5 |
| ||||||||
Rest of the World | 2 | 1 |
|
| 5 |
|
|
| 2 |
| ||||||
|
|
|
| 100 | % |
|
| 100 | % | |||||||
| 100 | % | 100 | % | |||||||||||||
|
| |||||||||||||||
|
The breakout of product and service revenues was as follows:
| 2022 | 2021 | 2021-2022 Dollar Change |
| 2023 |
|
| 2022 |
|
| 2022-2023 |
| |||||||||||||
| (in millions) |
| (in millions) |
| |||||||||||||||||||||
Product revenues | $ | 2,591.6 | $ | 3,196.6 | $ | (605.0 | ) |
| $ | 2,096.3 |
|
| $ | 2,591.6 |
|
| $ | (495.3 | ) | |||||
Service revenues | 563.5 | 506.3 | 57.2 |
|
| 580.0 |
|
|
| 563.5 |
|
|
| 16.5 |
| |||||||||
|
|
|
| $ | 2,676.3 |
|
| $ | 3,155.0 |
|
| $ | (478.8 | ) | ||||||||||
| $ | 3,155.0 | $ | 3,702.9 | $ | (547.9 | ) | ||||||||||||||||||
|
|
| ||||||||||||||||||||||
29
35
Our product revenues decreased $605.0$495.3 million, or 18.9%19.1%, primarily due to lower tester sales in Semiconductor Test for mobilecompute and high performance compute processormobility applications, a decrease in sales in Storage Test of system level and hard disk drive testers, and a decrease in cellular test product sales in Wireless Test partially offset by the rise in Robotics revenues driven primarily by elevated demand for collaborative robotic arms and autonomous mobile robots.sales of connectivity test products. Our service revenues increased $57.2$16.5 million, or 11.3%2.9%, primarily in Semiconductor Test and Storage Test.
In 2023, revenues from Texas Instruments Inc., a customer of our Semiconductor Test segment, accounted for 10% of our consolidated revenues. In 2021, revenues from Taiwan Semiconductor Manufacturing Company Ltd., a customer of our Semiconductor Test segment, accounted for 12% of our consolidated revenues. In 20222023 and 2021,2022, our five largest direct customers in aggregate accounted for 26%32% and 33%26% of our consolidated revenues, respectively. We estimate consolidated revenues driven by Qualcomm, a customer of our Semiconductor Test, System Test and Wireless Test segments, combining direct and indirect sales, accounted for approximately 11% of our consolidated revenues in 2022 and less than 10% in 2021. We estimate consolidated revenues driven by one OEM customer, of our Semiconductor Test and Wireless Test segments, combining direct sales to that customer with sales to the customer’s OSATs, accounted for less than 10% of our consolidated revenues in 2022 and 19% of our consolidated revenues in 2021.2022.
Gross Profit
| 2022 | 2021 | 2021-2022 Dollar / Point Change |
| 2023 |
|
| 2022 |
|
| 2022-2023 |
| |||||||||||||
| (in millions) |
| (in millions) |
| |||||||||||||||||||||
Gross profit | $ | 1,867.2 | $ | 2,206.7 | $ | (339.5 | ) |
| $ | 1,536.7 |
|
| $ | 1,867.2 |
|
| $ | (330.5 | ) | |||||
Percent of total revenues | 59.2 | % | 59.6 | % | (0.4 | ) |
|
| 57.4 | % |
|
| 59.2 | % |
|
| (1.8 | ) | ||||||
Gross profit as a percent of total revenues decreased by 0.41.8 points, primarily due to a lower volume, higher service costs partially offset by favorablespending to strengthen our supply chain, and product mix and lower variable compensation.mix.
The breakout of product and service gross profit was as follows:
| 2022 | 2021 | 2021-2022 Dollar / Point Change |
| 2023 |
|
| 2022 |
|
| 2022-2023 |
| |||||||||||||
| (in millions) |
| (in millions) |
| |||||||||||||||||||||
Product gross profit | $ | 1,549.0 | $ | 1,896.5 | $ | (347.5 | ) |
| $ | 1,213.4 |
|
| $ | 1,549.0 |
|
| $ | (335.6 | ) | |||||
Percent of product revenues | 59.8 | % | 59.3 | % | 0.5 |
|
| 57.9 | % |
|
| 59.8 | % |
|
| (1.9 | ) | |||||||
Service gross profit | $ | 318.1 | $ | 310.2 | $ | 7.9 |
| $ | 323.4 |
|
| $ | 318.1 |
|
| $ | 5.3 |
| ||||||
Percent of service revenues | 56.5 | % | 61.3 | % | (4.8 | ) |
|
| 55.7 | % |
|
| 56.5 | % |
|
| (0.8 | ) | ||||||
Service
Product revenues gross profit percentage decreased 4.8%by 1.9 points, primarily due to lower margins in Semiconductor Test driven by an increase in headcount.volume, higher spending to strengthen our supply chain, and product mix.
We assess the carrying value of our inventory on a quarterly basis by estimating future demand and comparing that demand against on-hand and on-order inventory positions. Forecasted revenues information is obtained from the sales and marketing groups and incorporates factors such as backlog and future revenues. This quarterly process identifies obsolete and excess inventory. Obsolete inventory, which represents items for which there is no demand, is fully reserved. Excess inventory, which represents inventory items that are not expected to be consumed within the forecasted demand window, is written down to estimated net realizable value.
During the year ended December 31, 2023, we recorded an inventory provision of $28.4 million included in cost of revenues, primarily due to downward revisions to previously forecasted demand levels for certain products. Of the $28.4 million of total excess and obsolete provisions, $22.5 million was related to Semiconductor Test, $2.3 million was related to Robotics, $1.9 million was related to System Test, and $1.7 million was related to Wireless Test.
During the year ended December 31, 2022, we recorded an inventory provision of $31.5 million included in cost of revenues, primarily due to downward revisions to previously forecasted demand levels for certain products. Of the $31.5 million of total excess and obsolete provisions, $21.5 million was related to Semiconductor Test, $4.6 million was related to Wireless Test, $3.7 million was related to Robotics, and $1.7 million was related to System Test.
3630
During the year ended December 31, 2021, we recorded an inventory provision of $15.5 million included in cost of revenues, primarily due to downward revisions to previously forecasted demand levels for certain products. Of the $15.5 million of total excess and obsolete provisions, $6.7 million was related to Semiconductor Test, $6.4 million was related to Robotics, $1.8 million was related to Wireless Test, and $0.6 million was related to System Test.
During the years ended December 31, 20222023 and 2021,2022, we scrapped $8.8$26.4 million and $10.9$8.8 million of inventory, respectively, and sold $1.8$5.2 million and $2.5$1.8 million of previously written-down or written-off inventory, respectively. As of December 31, 2022,2023, we had inventory related reserves for amounts which had been written-down or written-off totaling $136.8$136.0 million. We have no pre-determined timeline to scrap the remaining inventory.
Selling and Administrative
Selling and administrative expenses were as follows:
| 2022 | 2021 | 2021-2022 Change |
| 2023 |
|
| 2022 |
|
| 2022-2023 |
| |||||||||||||
| (in millions) |
| (in millions) |
| |||||||||||||||||||||
Selling and administrative | $ | 558.1 | $ | 547.6 | $ | 10.5 |
| $ | 577.3 |
|
| $ | 558.1 |
|
| $ | 19.2 |
| ||||||
Percent of total revenues | 17.7 | % | 14.8 | % |
|
| 21.6 | % |
|
| 17.7 | % |
|
|
| |||||||||
The increase of $10.5$19.2 million in selling and administrative expenses was primarily driven by increasedue to the charge of $5.9 million related to the modification of Teradyne’s chief executive officer’s outstanding equity awards in headcountconnection with his retirement and greaterhigher sales and marketing spending in Robotics partially offset by lower variable compensation.and Semiconductor Test.
Engineering and Development
Engineering and development expenses were as follows:
| 2022 | 2021 | 2021-2022 Change |
| 2023 |
|
| 2022 |
|
| 2022-2023 |
| |||||||||||||
| (in millions) |
| (in millions) |
| |||||||||||||||||||||
Engineering and development | $ | 440.6 | $ | 427.6 | $ | 13.0 |
| $ | 418.1 |
|
| $ | 440.6 |
|
| $ | (22.5 | ) | ||||||
Percent of total revenues | 14.0 | % | 11.5 | % |
|
| 15.6 | % |
|
| 14.0 | % |
|
|
| |||||||||
The increasedecrease of $13.0$22.5 million in engineering and development expenses was primarily driven by increase in headcountdue to lower variable compensation and greaterlower spending in Robotics and Semiconductor Test, partially offset by lower variable compensation.higher spending in Robotics.
Restructuring and Other
During the year ended December 31, 2023, we recorded $14.7 million of severance charges related to headcount reductions of 215 people primarily in Semiconductor Test and Robotics, which included charges related to a voluntary early retirement program for employees meeting certain conditions, $3.1 million of acquisition and divestiture expenses related to the Technoprobe transaction, a $1.5 million contract termination charge, and a charge of $1.1 million for an increase in environmental liability.
During the year ended December 31, 2022, we recorded a charge of $14.7 million related to the arbitration claim filed against Teradyne and AutoGuide related to an earn-out dispute which was settled on March 25, 2022 for $26.7 million, $2.9 million of severance charges primarily in Robotics, and a charge of $2.7 million for an increase in environmental and legal liabilities, partially offset by a $3.4 million gain on sale of an asset.
During the year ended December 31, 2021, we recorded a charge of $12.0 million related to the arbitration claim filed against Teradyne and AutoGuide related to an earn-out dispute, $1.5 million of severance charges primarily in Robotics, $0.5 million of acquisition related compensation and expenses and $2.5 million for an increase in environmental and legal liabilities, offset by a $7.2 million gain for the decrease in the fair value of the AutoGuide contingent consideration liability.
37
Interest and Other
| 2022 | 2021 | 2021-2022 Change |
| 2023 |
|
| 2022 |
|
| 2022-2023 |
| |||||||||||||
| (in millions) |
| (in millions) |
| |||||||||||||||||||||
Interest income | $ | (6.4 | ) | $ | (2.6 | ) | $ | (3.8 | ) |
| $ | (27.3 | ) |
| $ | (6.4 | ) |
| $ | (20.9 | ) | |||
Interest expense | 3.7 | 17.8 | (14.1 | ) |
|
| 3.8 |
|
|
| 3.7 |
|
|
| 0.1 |
| ||||||||
Other (income) expense, net | (5.8 | ) | 24.6 | (30.4 | ) |
|
| (1.0 | ) |
|
| (5.8 | ) |
|
| 4.8 |
| |||||||
Interest income increased $3.8by $20.9 million due to higher interest rates. Interest expense decreased $14.1 million primarily due to the January 1, 2022 adoption of ASU 2020-06 which eliminated the amortization of the debt discount which was $10.3 millionrates in 2021.2023. Other (income) expense, net decreased by $30.4$4.8 million primarily due to $28.8 million losses on convertible debt conversions recognized in 2021 and an increasethe change in pension actuarial gains,gains/losses, from $2.2 million gain in 2021 toa $25.6 million gain in 2022 to a $2.7 million loss in 2023, partially offset by changesthe change in unrealized gains/losses on equity securities, from a $9.7 million loss in 2022 to a $7.2 million gain in 2021 to a $9.0 million loss in 2022,2023, and a $4$7.5 million increaseunrealized gain on our call option purchased in foreign exchange losses.connection with our agreement to acquire a 10% investment in Technoprobe S.p.A.
31
Income (Loss) Before Income Taxes
| 2022 | 2021 | 2021-2022 Change |
| 2023 |
|
| 2022 |
|
| 2022-2023 |
| |||||||||||||
| (in millions) |
| (in millions) |
| |||||||||||||||||||||
Semiconductor Test | $ | 634.5 | $ | 977.0 | $ | (342.5 | ) |
| $ | 453.3 |
|
| $ | 634.5 |
|
| $ | (181.2 | ) | |||||
System Test | 166.9 | 163.1 | 3.8 |
|
| 94.1 |
|
|
| 166.9 |
|
|
| (72.8 | ) | |||||||||
Wireless Test | 66.8 | 83.5 | (16.7 | ) |
|
| 30.6 |
|
|
| 66.8 |
|
|
| (36.2 | ) | ||||||||
Robotics | (16.2 | ) | (8.2 | ) | (8.0 | ) |
|
| (54.3 | ) |
|
| (16.2 | ) |
|
| (38.1 | ) | ||||||
Corporate and Eliminations (1) | (11.6 | ) | (54.5 | ) | 42.9 |
|
| 1.9 |
|
|
| (11.6 | ) |
|
| 13.5 |
| |||||||
|
|
|
| $ | 525.6 |
|
| $ | 840.4 |
|
| $ | (314.8 | ) | ||||||||||
| $ | 840.4 | $ | 1,161.0 | $ | (320.6 | ) | ||||||||||||||||||
|
|
| ||||||||||||||||||||||
|
The decrease in income before income taxes in Semiconductor Test was driven primarily by lower revenues in mobiletester sales for compute and high performance compute processor applications, partially offset by lower variable compensation.mobility applications. The increasedecrease in income before income taxes in System Test was primarily due to higherlower sales in Defense/Aerospace and in Production Board Test, partially offset by a decline in Storage Test sales of system level and hard disk drive testers. The decrease in income before income taxes in Wireless Test was driven primarily by lowera decrease in sales in cellular test products partially offset by elevated sales in ultra-wide bandof connectivity test products. The decrease in income before income taxes in Robotics was driven primarily by ansoftening demand due to slowing global industrial activity and macro-economic headwinds and the impact of the transformation of Universal Robots sales channel. The increase in headcount and greater spending, partially offset by higher revenue for collaborative robotic arms and autonomous mobile robots. The change in income before income taxes in Corporate and Eliminations of $42.9 million was primarily due primarily to $28.8 million of legal settlement charges in 2022 related to litigation for the earn-out dispute in connection with the AutoGuide acquisition, changes in unrealized gains/losses on convertible debt conversions recognized in 2021equity securities and an increase of $23.4 million in pension actuarial gains in 2022.higher interest income.
Income Taxes
Income tax expense for 2023 and 2022 and 2021, totaled $124.9$76.8 million and $146.4$124.9 million, respectively. The effective tax rate for 2023 and 2022 was 14.6% and 2021 was 14.9% and 12.6%, respectively.
The increasedecrease in the effective tax rate from 20212022 to 20222023 is primarily attributable to increases in benefit from tax credits and the U.S. foreign derived intangible income deduction. These decreases in expense were partially offset by a shift in the geographic distribution of income, which increased the income subject to taxation in higher tax rate jurisdictions relative to lower tax rate jurisdictions increasesand a reduction in expensebenefit from U.S. global low-taxed income and increases in expenseequity compensation.
38
from non-deductible officer compensation. These increases in expense were partially offset by increases in benefits from the U.S. foreign derived intangible income deduction and tax credits.
We qualify for a tax holiday in Singapore by fulfilling the requirements of an agreement with the Singapore Economic Development Board under which certain headcount and spending requirements must be met. The tax savings attributable to the Singapore tax holiday for the years ended December 31, 2023 and 2022 were $1.4 million or $0.01 per diluted share and 2021 were $16.0 million or $0.09 per diluted share and $33.3 million or $0.18 per diluted share, respectively. In November 2020, we entered into an agreement with the Singapore Economic Development Board which extended our Singapore tax holiday under substantially similar terms to the agreement which expired on December 31, 2020. The new tax holiday is scheduled to expire on December 31, 2025.
Capital Resources and Material Cash Requirements
Our cash, cash equivalents and marketable securities balance decreased by $495$68.0 million in 20222023 to $1,005$937.2 million. Cash decreased due to stock repurchases in the amount of $752$397.2 million, quarterly cash dividend payments in the amount of $70$67.9 million, and payments of convertible debt principal in the amount of $67$50.3 million, partially offset by cash generated by our global operations.
Operating activities during 2023 provided cash of $585.2 million. Changes in operating assets and liabilities used cash of $9.6 million. This was due to a $33.2 million decrease in operating assets and a $42.8 million decrease in operating liabilities.
The decrease in operating assets was due to a $71.0 million decrease in accounts receivable due to lower sales and a $5.3 million decrease in inventories, partially offset by a $43.1 million increase in prepayments and other assets due to prepayments to our contract manufacturers.
32
The decrease in operating liabilities was due to a $57.2 million decrease in deferred revenue and customer advance payments, a $26.9 million decrease in income taxes, a $21.2 million decrease in accrued employee compensation, and $5.5 million of retirement plan contributions, partially offset by a $45.0 million increase in accounts payable, and a $23.0 million increase in other accrued liabilities.
Investing activities during 2023 used cash of $179.6 million, due to $161.9 million used for purchases of marketable securities, $159.6 million used for purchases of property, plant and equipment, and $5.0 million used for issuance of convertible loan, partially offset by $85.0 million and $61.4 million in proceeds from maturities and sales of marketable securities, respectively, and $0.5 million in proceeds from the cancellation of Teradyne owned life insurance policies related to the cash surrender value.
Financing activities during 2023 used cash of $501.9 million, due to $397.2 million used for the repurchase of 3.9 million shares of common stock at an average price of $102.47 per share, $67.9 million used for dividend payments, $50.3 million used for the payments of convertible debt principal, and $20.8 million used for payments related to net settlement of employee stock compensation awards, partially offset by $34.3 million from the issuance of common stock under employee stock purchase and stock option plans.
Operating activities during 2022 provided cash of $577.9 million. Changes in operating assets and liabilities used cash of $272.6 million. This was due to a $170.9 million increase in operating assets and a $101.7 million decrease in operating liabilities.
The increase in operating assets was due to a $140.7 million increase in prepayments and other assets due to prepayments to our contract manufacturers, and an $80.8 million increase in inventories, partially offset by a $50.6 million decrease in accounts receivable due to lower sales.
The decrease in operating liabilities was due to a $40.3 million decrease in accrued employee compensation, a $29.8 million decrease in income taxes, a $10.8 million decrease in accounts payable, a $9.3 million decrease in other accrued liabilities, a $6.2 million decrease in deferred revenue and customer advance payments, and $5.1 million of retirement plan contributions.
Investing activities during 2022 provided cash of $43.8 million, due to $268.1 million and $222.9 million in proceeds from sales and maturities of marketable securities, respectively, $3.4 million due to sale of an asset, partially offset by $287.4 million used for purchases of marketable securities and $163.2 million used for purchases of property, plant and equipment.
Financing activities during 2022 used cash of $893.0 million, due to $752.1 million used for the repurchase of 7.3 million shares of common stock at an average price of $103.69 per share, $69.7 million used for dividend payments, $66.8 million used for the payments of convertible debt principal, and $33.2 million used for payments related to net settlement of employee stock compensation awards, partially offset by $28.7 million from the issuance of common stock under employee stock purchase and stock option plans.
Operating activities during 2021 providedIn January 2023, May 2023, August 2023 and November 2023, our Board of Directors declared a quarterly cash dividend of $1,098.4 million. Changes in operating assets and liabilities used cash of $98.8 million. This was due to a $227.1 million increase in operating assets and a $128.4 million increase in operating liabilities.
The increase in operating assets was due to a $175.8 million increase in prepayments and other assets due to prepayments to our contract manufacturers, a $57.8 million increase in accounts receivable due to greater sales, partially offset by a $6.5 million decrease in inventories.
The increase in operating liabilities was due to a $63.5 million increase in other accrued liabilities, a $35.1 million increase in accrued employee compensation, a $22.9 million increase in accounts payable, and a $9.9 million increase in deferred revenue and customer advance payments, partially offset by a $5.6 million decrease in income taxes, and $5.4 million of retirement plan contributions.
39
Investing activities during 2021 provided cash of $120.4 million, due to $660.1 million and $266.5 million in proceeds from maturities and sales of marketable securities, respectively, partially offset by $661.8 million used for purchases of marketable securities, $132.5 million used for purchases of property, plant and equipment, and $12.0 million used for an investment in MachineMetrics, Inc. (“MachineMetrics”).
Financing activities during 2021 used cash of $1,008.6 million, due to $600.0 million used for the repurchase of 4.8 million shares of common stock at an average price of $125.74$0.11 per share, $343.0 million used for the payments of convertible debt principal, $66.0 million used forshare. Total dividend payments and $32.3 million used for payments related to net settlement of employee stock compensation awards, partially offset by $32.7 million from the issuance of common stock under employee stock purchase and stock option plans.
in 2023 were $67.9 million. In January 2022, May 2022, August 2022 and November 2022, our Board of Directors declared a quarterly cash dividend of $0.11 per share. Total dividend payments in 2022 were $69.7 million.
In January 2021, May 2021, August 2021 and November 2021, our Board of Directors declared a quarterly cash dividend of $0.10 per share. Total dividend payments in 2021 were $66.0 million.
In January 2021, our Board of Directors approved a repurchase program for up to $2.0 billion of common stock. In 2022, we repurchased 7.3 million shares of common stock for $752.1 million at an average price of $103.69 per share. In 2021, we repurchased 4.8 million shares of common stock for $600.0 million at an average price of $125.74 per share. The cumulative repurchases as of December 31, 2022, under this repurchase program were 12.0 million shares of common stock for $1,352.1 million at an average price per share of $112.44.
In January 2023, our Board of Directors cancelled the 2021 repurchase program and approved a new repurchase program for up to $2.0 billion of common stock. WeIn 2023, we repurchased 3.9 million shares of common stock for $397.2 million, which excludes related excise tax, at an average price of $102.47 per share. In 2022, we repurchased 7.3 million shares of common stock for $752.1 million at an average price of $103.69 per share against the 2021 repurchase program. The cumulative repurchases as of December 31, 2022, under the 2021 repurchase program, were 12.0 million shares of common stock for $1,352.1 million at an average price per share of $112.44. In 2024 we intend to repurchase up to $500.0 million of common stock in 2023 subject to market conditions.$90.0 million.
While we declared a quarterly cash dividend and authorized a share repurchase program, we may reduce or eliminate the cash dividend or share repurchase program in the future. Future cash dividends and stock repurchases are subject to the discretion of our Board of Directors, which will consider, among other things, our earnings, capital requirements and financial condition.
On November 7, 2023, Teradyne announced a strategic partnership with Technoprobe S.p.A including Teradyne's agreement to acquire a 10% equity investment in Technoprobe for 481.0 million Euros. Teradyne will face a three year restriction on the transfer or disposition of the Technoprobe shares upon closing of the agreement, subject to certain early termination events.
On May 1, 2020, we entered into a credit agreement providing a three-year, senior secured revolving credit facility of $400 million. On December 10, 2021, the credit agreement was amended to extend the senior secured revolving credit facility to December 10, 2026. On October 5, 2022, the credit agreement was amended to increase the amount of the credit facility to $750.0 million from $400.0 million. As of February 22, 2023, we have not borrowed any funds under the credit facility.
33
We expect operations to continue to be the primary source of cash to operate the business and meet material cash commitments, including any payments of convertible debt principal, our stock repurchase program, our quarterly dividends, our office lease obligations, contractual obligations related to inventory purchases and the construction of new facilities. We believe our cash, cash equivalents and marketable securities balance will be sufficient to pay our quarterly dividend and meet our working capital and expenditure needs for at least the next twelve months. Inflation has not had a significant long-term impact on earnings. At this time, the COVID-19 pandemic has not had an impact on our liquidity, but there is no assurance that continued impacts resulting from the pandemic will not have an adverse effect in the future.
At December 31, 2022,2023, our future contractual obligations were related to debt, leases, retirement plan liabilities, deferred tax benefits, and purchase obligations. See Note J. “Debt”, Note I. “Leases”, Note P. “Retirement Plans”, and Note S. “Income Taxes” of Notes to Consolidated Financial Statements in this Annual Report for information about those obligations, which Notes are incorporated by reference into this section. Our purchase obligations were approximately $654.8$414.4 million, with $570.3$379.1 million expected to be paid within twelve months.
40
Retirement Plans
ASC 715-20, “Compensation—Retirement Benefits—Defined Benefit Plans,” requires an employer with defined benefit plans or other postretirement benefit plans to recognize an asset or a liability on its balance sheet for the overfunded or underfunded status of the plans as defined by ASC 715-20. The pension asset or liability represents the difference between the fair value of the pension plans’ assets and the projected benefit obligation as of December 31. For other postretirement benefit plans, the liability is the difference between the fair value of the plan’s assets and the accumulated postretirement benefit obligation as of December 31.
For the year ended December 31, 2022,2023, our pension income,expense, which includes the U.S. Qualified Pension Plan (“U.S. Plan”), certain qualified plans for non-U.S. subsidiaries, and a U.S. Supplemental Executive Defined Benefit Plan, was approximately $19.7$6.8 million. Pension income/expense is calculated based upon a number of actuarial assumptions. Discount rate and expected return on assets are two assumptions which are important elements of pension plan expense and asset/liability measurement. We evaluate our discount rate and expected rate of return on assets assumptions annually on a plan and country specific basis. We evaluate other assumptions related to demographic factors, such as retirement age, mortality and turnover periodically, and update them to reflect our experience and expectations for the future.
In developing the expected return on U.S. Plan assets assumption, we evaluated input from our investment manager and pension consultants, including their forecast of asset class return expectations. We believe that 2.0%4.75% was an appropriate rate of return on assets to use for 2022.2023. The December 31, 20222023 asset allocation for our U.S. Plan was 94% invested in fixed income securities, 5% invested in equity securities, and 1% invested in other securities. Our investment manager regularly reviews the actual asset allocation and periodically rebalances the portfolio to ensure alignment with our target allocations.
We recognize net actuarial gains and losses and the change in the fair value of plan assets in our operating results in the year in which they occur or upon any interim remeasurement of the plans. We calculate the expected return on plan assets using the fair value of the plan assets. Actuarial gains and losses are generally measured annually as of December 31 and, accordingly, recorded during the fourth quarter of each year or upon any interim remeasurement of the plans.
The discount rate that we utilized for determining future pension obligations for the U.S. Plan is based on the FTSE Pension Index adjusted for the U.S. Plan’s expected cash flows and was 4.75% at December 31, 2023, down from 4.95% at December 31, 2022, up from 2.65% at December 31, 2021.2022. We estimate that in 2023,2024, we will recognize approximately $0.4$0.2 million of pension expense for the U.S. Plan. The U.S. Plan pension expense estimate for 20232024 is based on a 4.95%4.75% discount rate and a 4.75%4.65% return on assets. Future pension expense or income will depend on future investment performance, changes in future discount rates and various other factors related to the employee population participating in our pension plans.
As of December 31, 2022,2023, our pension plans had no unrecognized pension prior service cost.
The assets of the U.S. Plan consist substantially of fixed income securities. U.S. Plan assets have decreasedincreased from $149.6 million at December 31, 2021 to $111.8 million at December 31, 2022 to $112.6 million at December 31, 2023, while the U.S. Plan’s liability decreasedincreased from $134.5 million at December 31, 2021 to $100.0 million at December 31, 2022. In 2022 the decrease in plan assets and plan liability was due to an increase in interest rates. In 2020, the accrued pension obligations for approximately 115 retiree participants were transferred to an insurance company and resulted in a $24.4$101.1 million reduction in the pension benefit obligation and pension assets. We recorded $2.2 million of pension actuarial loss and a settlement loss of $0.5 million related to the retiree group annuity transaction.at December 31, 2023.
Our funding policy is to make contributions to our pension plans in accordance with local laws and to the extent that such contributions are tax deductible. During 2022,2023, we made contributions of $3.2$3.1 million to the U.S. supplemental executive defined benefit pension plan, and $0.9$1.0 million to certain qualified plans for non-U.S.
41
subsidiaries. In 2023,2024, we expect to contribute approximately $3.1 million to the U.S. supplemental executive defined benefit pension plan. Contributions to be made in 20232024 to certain qualified plans for non-U.S. subsidiaries are based on local statutory requirements and are estimated at approximately $1.3$1.4 million.
34
Equity Compensation Plans
In addition to our 1996 Employee Stock Purchase Plan discussed in Note Q: “Stock-Based Compensation” in Notes to Consolidated Financial Statements, we have a 2006 Equity and Cash Compensation Incentive Plan (the “2006 Equity Plan”) under which equity securities are authorized for issuance. The 2006 Equity Plan was initially approved by stockholders on May 25, 2006.
At our annual meeting of stockholders held May 21, 2013, our stockholders approved an amendment to the 2006 Equity Plan to increase the number of shares issuable thereunder by 10.0 million, for an aggregate of 32.0 million shares issuable thereunder, and our stockholders also approved an amendment to our 1996 Employee Stock Purchase Plan to increase the number of shares issuable thereunder by 5.0 million, for an aggregate of 30.4 million shares issuable thereunder. At our annual meeting of stockholders held May 12, 2015, our stockholders approved an amendment to the 2006 Equity Plan to extend its term until May 12, 2025. At our annual meeting of stockholders held May 7, 2021, our stockholders approved an amendment to our 1996 Employee Stock Purchase Plan to increase the number of shares issuable thereunder by 3.0 million, for an aggregate of 33.4 million shares issuable thereunder.
The following table presents information about these plans as of December 31, 20222023 (share numbers in thousands):
Plan category | Number of securities to be issued upon exercise of outstanding options, warrants and rights | Weighted average exercise price of outstanding options, warrants and rights | Number of securities remaining available for future issuance under equity compensation plans (excluding securities reflected in column one) |
| Number of securities |
|
| Weighted-average |
|
| Number of securities remaining |
|
| |||||||||||||
Equity plans approved by shareholders | 1,505 | (1) | $ | 55.90 | 8,954 | (2) |
|
| 1,548 |
| (1) |
| $ | 94.85 |
|
|
| 7,863 |
| (2) | ||||||
|
|
The purpose of the 2006 Equity Plan is to motivate employees, officers and directors by providing equity ownership and compensation opportunities in Teradyne. The aggregate number of shares available under the 2006 Equity Plan as of December 31, 20222023 was 5,060,4454,352,428 shares of our common stock. The 2006 Equity Plan authorizes the grant of stock-based awards in the form of (1) non-qualified and incentive stock options, (2) stock appreciation rights, (3) restricted stock awards and restricted stock unit awards, (4) phantom stock, and (5) other stock-based awards. Awards may be tied to time-based vesting schedules and/or performance-based vesting measured by reference to performance criteria chosen by the Compensation Committee of the Board of Directors, which administers the 2006 Equity Plan. Awards may be made to any employee, officer, consultant and advisor of Teradyne and our subsidiaries, as well as to our directors. The maximum number of shares of stock-based awards that may be granted to one participant during any one fiscal year is 2,000,000 shares of common stock.
As of December 31, 2022,2023, total unrecognized compensation expense related to non-vested restricted stock units and options was $61.1$73.7 million and is expected to be recognized over a weighted average period of 2.5 years.
4235
Performance Graph
The following graph compares the change in our cumulative total shareholder return in our common stock with (i) the Standard & Poor’s 500 Index and (ii) the Morningstar Global Semiconductor Equipment & Materials GR USD Industry Group. The comparison assumes $100.00 was invested on December 31, 20172018 in our common stock and in each of the foregoing indices and assumes reinvestment of dividends, if any. Historic stock price performance is not necessarily indicative of future price performance.
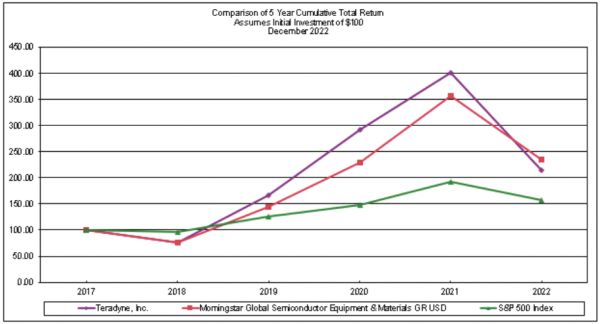

Recently Issued Accounting Pronouncements
ForIn November 2023, the year endedFinancial Accounting Standards Board ("FASB") issued Accounting Standard Update ("ASU") No. 2023-07, "Segment Reporting (Topic 280): Improvements to Reportable Segment Disclosures", which will require us to disclose significant segment expenses and other segment items used by the Chief Operating Decision Maker ("CODM") on an annual and interim basis as well as provide in interim periods all disclosures about a reportable segment’s profit or loss and assets that are currently required annually. Additionally, we will be required to disclose the title and position of the CODM. The new standard is effective for fiscal years beginning after December 31, 2022, there were15, 2023, and interim periods within fiscal years beginning after December 15, 2024, with early adoption permitted. This ASU will have no recently issued accounting pronouncements that had,impact on our results of operations, cash flows or are expectedfinancial condition. Upon adoption, we will apply the amendments in this ASU retrospectively to have, a material impact to our consolidatedall prior period disclosures presented in the financial statements.
In December 2023, FASB issued ASU 2023-09 –“Income Taxes (Topic 740): Improvements to Income Tax Disclosures”, which requires expanded disclosures relating to the tax rate reconciliation, income taxes paid, income (loss) before income tax expense (benefit) and income tax expense (benefit), requiring a greater disaggregation of information for each. The provisions of ASU 2023-09 are effective for fiscal years beginning after December 15, 2024. The amendments in this update should be applied on a prospective basis, but retrospective application is permitted. We are currently evaluating the impact of this new standard.
Item 7A: Quantitative and Qualitative Disclosures about Market Risks
|
Concentration of Credit Risk
Financial instruments which potentially subject us to concentrations of credit risk consist principally of cash equivalents, marketable securities, forward currency contracts and accounts receivable. Our cash equivalents consist primarily of money market funds invested in U.S. Treasuries and government agencies. Our fixed income available-for-sale marketable securities have a minimum rating of AA by one or more of the major credit rating agencies. We place forward currency contracts with high credit-quality financial institutions in order to minimize credit risk exposure. Concentrations of credit risk with respect to accounts receivable
36
are limited due to the large number of geographically dispersed customers. We perform ongoing credit evaluations of our customers’ financial condition and from time to time may require customers to provide a letter of credit from a bank to secure accounts receivable. As of December 31, 2023, a customer of our Semiconductor Test segment, Texas Instruments Inc., accounted for 18% of our accounts receivable balance. There were no customers who accounted for more than 10% of our accounts receivable balance as of December 31, 2022 and December 31, 2021.2022.
In addition to market risks described in our Annual Report on Form 10-K, we have an equity price risk related to the fair value of our convertible senior unsecured notes issued in December 2016. In December 2016, Teradyne issued $460 million aggregate principal amount of 1.25% convertible senior unsecured notes (the “Notes”) due December 15, 2023. As of December 31, 2022, $50.2 million of principal remained outstanding and
43
the Notes had a fair value of $139.0 million. The table below provides a sensitivity analysis of hypothetical 10% changes of Teradyne’s stock price as of the end of the last quarter of 2022 and the estimated impact on the fair value of the Notes. The selected scenarios are not predictions of future events, but rather are intended to illustrate the effect such event may have on the fair value of the Notes. The fair value of the Notes is subject to equity price risk due to the convertible feature. The fair value of the Notes will generally increase as Teradyne’s common stock price increases and will generally decrease as the common stock price declines in value. The change in stock price affects the fair value of the Notes, but does not impact Teradyne’s financial position, cash flows or results of operations due to the fixed nature of the debt obligation. Additionally, we carry the Notes at face value less unamortized debt issuance costs on our balance sheet, and we present the fair value for required disclosure purposes only. In connection with the offering of the Notes we also sold warrants. The warrants will have a dilutive effect on our earnings per share to the extent that the average market price of our common stock for a given reporting period exceeds the applicable strike price of the warrants.
Hypothetical Change in Teradyne Stock Price | Fair Value | Estimated change in fair value | Hypothetical percentage increase (decrease) in fair value | |||||||||
10% Increase | $ | 152,962 | $ | 13,955 | 10.0 | % | ||||||
No Change | 139,007 | — | — | |||||||||
10% Decrease | 125,068 | (13,939 | ) | (10.0 | ) | |||||||
See Note J: “Debt” for further information.
Exchange Rate Risk Management
We regularly enter into foreign currency forward contracts to hedge the value of our monetary assets and liabilities in Japanese Yen, British Pound, Korean Won, Taiwan Dollar, Singapore Dollar, Euro, Philippine Peso, Chinese Yuan, and Danish Krone. These foreign currency forward contracts have maturities of approximately one month. These contracts are used to minimize the effect of exchange rate fluctuations associated with the remeasurement of monetary assets and liabilities.
We also enter into foreign currency forward contracts to hedge the impact of exchange rates on our revenues in Japanese Yen and Taiwan Dollar. These contracts have maturities of less than one year. We do not engage in currency speculation.
On November 7, 2023, in connection with our agreement to acquire 10% investment in Technoprobe S.p.A, we purchased a call option to buy 481.0 million Euros. The expiration date of the option is April 26, 2024. Since the transaction price was agreed to in Euros, this option contract reduces the impact to the purchase price of changes in the Euro to U.S. Dollar exchange rate.
We performed a sensitivity analysis assuming a hypothetical 10% fluctuation in foreign exchange rates to the hedging contracts and the underlying exposures described above. As of December 31, 20222023 and 2021,2022, the analysis indicated that these hypothetical market movements would not have a material effect on our consolidated financial position, results of operations or cash flows.
Interest Rate Risk Management
We are exposed to potential losses due to changes in interest rates. Our interest rate exposure is primarily related to short-term and long-term marketable securities.
In order to estimate the potential loss due to interest rate risk, a fluctuation in interest rates of 25 basis points was assumed. Market risk for the short and long-term marketable securities was estimated as the potential change in the fair value resulting from a hypothetical change in interest rates for securities contained in the investment portfolio. The potential change in the fair value from changes in interest rates is immaterial as of December 31, 20222023 and 2021.2022.
37
Item 8: Financial Statements and Supplementary Data
44
To theBoard of Directors and Shareholders of Teradyne, Inc.
Opinions on the Financial Statements and Internal Control over Financial Reporting
We have audited the accompanying consolidated balance sheets of Teradyne, Inc. and its subsidiaries (the “Company”) as of December 31, 20222023 and 2021,2022, and the related consolidated statements of operations, comprehensive income, convertible common shares and shareholders’shareholders' equity and cash flows for each of the three years in the period ended December 31, 2022,2023, including the related notes and schedule of valuation and qualifying accounts for each of the three years in the period ended December 31, 20222023 appearing under Item 15(c) (collectively referred to as the “consolidated financial statements”). We also have audited the Company’sCompany's internal control over financial reporting as of December 31, 2022,2023, based on criteria established in
In our opinion, the consolidated financial statements referred to above present fairly, in all material respects, the financial position of the Company as of December 31, 20222023 and 2021,2022, and the results of its operations and its cash flows for each of the three years in the period ended December 31, 20222023 in conformity with accounting principles generally accepted in the United States of America. Also in our opinion, the Company maintained, in all material respects, effective internal control over financial reporting as of December 31, 2022,2023, based on criteria established in
Changes in Accounting Principles
As discussed in Note B to the consolidated financial statements, the Company changed the manner in which it accounts for convertible debt in 2022.
Basis for Opinions
The Company’sCompany's management is responsible for these consolidated financial statements, for maintaining effective internal control over financial reporting, and for its assessment of the effectiveness of internal control over financial reporting, included in Management’s Annual Report on Internal Control over Financial Reporting appearing under Item 9A. Our responsibility is to express opinions on the Company’s consolidated financial statements and on the Company’sCompany's internal control over financial reporting based on our audits. We are a public accounting firm registered with the Public Company Accounting Oversight Board (United States) (PCAOB) and are required to be independent with respect to the Company in accordance with the U.S. federal securities laws and the applicable rules and regulations of the Securities and Exchange Commission and the PCAOB.
We conducted our audits in accordance with the standards of the PCAOB. Those standards require that we plan and perform the audits to obtain reasonable assurance about whether the consolidated financial statements are free of material misstatement, whether due to error or fraud, and whether effective internal control over financial reporting was maintained in all material respects.
Our audits of the consolidated financial statements included performing procedures to assess the risks of material misstatement of the consolidated financial statements, whether due to error or fraud, and performing procedures that respond to those risks. Such procedures included examining, on a test basis, evidence regarding the amounts and disclosures in the consolidated financial statements. Our audits also included evaluating the accounting principles used and significant estimates made by management, as well as evaluating the overall presentation of the consolidated financial statements. Our audit of internal control over financial reporting included obtaining an
Definition and Limitations of Internal Control over Financial Reporting
A company’s internal control over financial reporting is a process designed to provide reasonable assurance regarding the reliability of financial reporting and the preparation of financial statements for external purposes in accordance with generally accepted accounting principles. A company’s internal control over financial reporting includes those policies and procedures that (i) pertain to the maintenance of records that, in reasonable detail, accurately and fairly reflect the transactions and dispositions of the assets of the company; (ii) provide reasonable assurance that transactions are recorded as necessary to permit preparation of financial statements in accordance with generally accepted accounting principles, and that receipts and expenditures of the company are being made only in
38
accordance with authorizations of management and directors of the company; and (iii) provide reasonable assurance regarding prevention or timely detection of unauthorized acquisition, use, or disposition of the company’s assets that could have a material effect on the financial statements.
Because of its inherent limitations, internal control over financial reporting may not prevent or detect misstatements. Also, projections of any evaluation of effectiveness to future periods are subject to the risk that controls may become inadequate because of changes in conditions, or that the degree of compliance with the policies or procedures may deteriorate.
Critical Audit Matters
The critical audit matter communicated below is a matter arising from the current period audit of the consolidated financial statements that was communicated or required to be communicated to the audit committee and that (i) relates to accounts or disclosures that are material to the consolidated financial statements and (ii) involved our especially challenging, subjective, or complex judgments. The communication of critical audit matters does not alter in any way our opinion on the consolidated financial statements, taken as a whole, and we are not, by communicating the critical audit matter below, providing a separate opinion on the critical audit matter or on the accounts or disclosures to which it relates.
Revenue Recognition - Certain Product Revenue
As described in NotesNote B and J to the consolidated financial statements, during 2022, forty two holdersthe Company recognizes revenue for transactions that do not meet the criteria for over time recognition at a point in time when shipped or delivered based on contractual terms. The transaction price is the amount of consideration the Company expects to be entitled to in exchange for such products, which is generally at contractually stated prices. The Company’s convertible senior unsecured notes, originally issued on December 12, 2016, converted $66.8 million of the senior unsecured notes. The Company may satisfy its conversion obligation by paying cashtotal product revenue was $2.1 billion for the principal amountyear ended December 31, 2023, of the senior unsecured notes and paying or delivering cash, shares of the Company’s common stock orwhich a combination of cash and shares of the Company’s common stock, at management’s election for the amount in excess of principal.
The principal considerationsconsideration for our determination that performing procedures relating to the conversions of senior unsecured notesrevenue recognition for certain product revenue is a critical audit matter are (i) theis a high degree of auditauditor effort in performing procedures and evaluating management’s calculationrelated to revenue recognition for certain of the conversion transactions and the related settlement calculations and (ii) the audit effort involved the use of professionals with specialized skill and knowledge.
Addressing the matter involved performing procedures and evaluating audit evidence in connection with forming our overall opinion on the consolidated financial statements. These procedures included testing the effectiveness of controls relating to management’s review of conversion transactions related to the Company’s senior unsecured notes, which included controls related to the conversion values and related settlement calculations.recognition process for certain product revenue. These procedures also included, among others on(i) testing the completeness, accuracy, and occurrence of revenue recognized for a test basis (i) evaluating the appropriatenesssample of the conversion
/s/ PricewaterhouseCoopers LLP
Boston, Massachusetts
February 22, 2023
We have served as the Company’s auditor since 1968.
39
TERADYNE, INC.
CONSOLIDATED BALANCE SHEETS
December 31, | ||||||||
2022 | 2021 | |||||||
(in thousands, except per share amount) | ||||||||
ASSETS | ||||||||
Current assets: | ||||||||
Cash and cash equivalents | $ | 854,773 | $ | 1,122,199 | ||||
Marketable securities | 39,612 | 244,231 | ||||||
Accounts receivable, less allowance for credit losses of $1,955 and $2,012 in 2022 and 2021, respectively | 491,145 | 550,749 | ||||||
Inventories, net | 325,019 | 243,330 | ||||||
Prepayments | 532,962 | 406,266 | ||||||
Other current assets | 14,404 | 9,452 | ||||||
Total current assets | 2,257,915 | 2,576,227 | ||||||
Property, plant and equipment, net | 418,683 | 387,240 | ||||||
Operating lease right-of-use assets, net | 73,734 | 68,807 | ||||||
Marketable securities | 110,777 | 133,858 | ||||||
Deferred tax assets | 142,784 | 102,428 | ||||||
Retirement plans assets | 11,761 | 15,110 | ||||||
Other assets | 28,925 | 24,096 | ||||||
Acquired intangible assets, net | 53,478 | 75,635 | ||||||
Goodwill | 403,195 | 426,024 | ||||||
Total assets | $ | 3,501,252 | $ | 3,809,425 | ||||
LIABILITIES | ||||||||
Current liabilities: | ||||||||
Accounts payable | $ | 139,722 | $ | 153,133 | ||||
Accrued employees’ compensation and withholdings | 212,266 | 253,667 | ||||||
Deferred revenue and customer advances | 148,285 | 146,185 | ||||||
Other accrued liabilities | 112,271 | 124,187 | ||||||
Operating lease liabilities | 18,594 | 19,977 | ||||||
Income taxes payable | 65,010 | 88,789 | ||||||
Current debt | 50,115 | 19,182 | ||||||
Total current liabilities | 746,263 | 805,120 | ||||||
Retirement plans liabilities | 116,005 | 151,141 | ||||||
Long-term deferred revenue and customer advances | 45,131 | 54,921 | ||||||
Deferred tax liabilities | 3,267 | 6,327 | ||||||
Long-term other accrued liabilities | 15,981 | 15,497 | ||||||
Long-term operating lease liabilities | 64,176 | 56,178 | ||||||
Long-term income taxes payable | 59,135 | 67,041 | ||||||
Debt | — | 89,244 | ||||||
Total liabilities | 1,049,958 | 1,245,469 | ||||||
Commitments and contingencies (Note M) | ||||||||
Mezzanine equity: | ||||||||
Convertible common shares | — | 1,512 | ||||||
SHAREHOLDERS’ EQUITY | ||||||||
Common stock, $0.125 par value, 1,000,000 shares authorized, 155,759 and 162,251 shares issued and outstanding at December 31, 2022 and 2021, respectively | 19,470 | 20,281 | ||||||
Additional paid-in capital | 1,755,963 | 1,811,545 | ||||||
Accumulated other comprehensive loss | (49,868 | ) | (5,948 | ) | ||||
Retained earnings | 725,729 | 736,566 | ||||||
Total shareholders’ equity | 2,451,294 | 2,562,444 | ||||||
Total liabilities, convertible common shares and shareholders’ equity | $ | 3,501,252 | $ | 3,809,425 | ||||
|
| December 31, |
| |||||
|
| 2023 |
|
| 2022 |
| ||
|
| (in thousands, except per share amount) |
| |||||
ASSETS |
|
|
|
|
|
| ||
Current assets: |
|
|
|
|
|
| ||
Cash and cash equivalents |
| $ | 757,571 |
|
| $ | 854,773 |
|
Marketable securities |
|
| 62,154 |
|
|
| 39,612 |
|
Accounts receivable, less allowance for credit losses of $1,988 and $1,955 in 2023 and 2022, |
|
| 422,124 |
|
|
| 491,145 |
|
Inventories, net |
|
| 309,974 |
|
|
| 325,019 |
|
Prepayments |
|
| 548,970 |
|
|
| 532,962 |
|
Other current assets |
|
| 37,992 |
|
|
| 14,404 |
|
Current assets held for sale |
|
| 23,250 |
|
|
| — |
|
Total current assets |
|
| 2,162,035 |
|
|
| 2,257,915 |
|
Property, plant and equipment, net |
|
| 445,492 |
|
|
| 418,683 |
|
Operating lease right-of-use assets, net |
|
| 73,417 |
|
|
| 73,734 |
|
Marketable securities |
|
| 117,434 |
|
|
| 110,777 |
|
Deferred tax assets |
|
| 175,775 |
|
|
| 142,784 |
|
Retirement plans assets |
|
| 11,504 |
|
|
| 11,761 |
|
Other assets |
|
| 38,580 |
|
|
| 28,925 |
|
Acquired intangible assets, net |
|
| 35,404 |
|
|
| 53,478 |
|
Goodwill |
|
| 415,652 |
|
|
| 403,195 |
|
Long-term assets held for sale |
|
| 11,531 |
|
|
| — |
|
Total assets |
| $ | 3,486,824 |
|
| $ | 3,501,252 |
|
LIABILITIES |
|
|
|
|
|
| ||
Current liabilities: |
|
|
|
|
|
| ||
Accounts payable |
| $ | 180,131 |
|
| $ | 139,722 |
|
Accrued employees’ compensation and withholdings |
|
| 191,750 |
|
|
| 212,266 |
|
Deferred revenue and customer advances |
|
| 99,804 |
|
|
| 148,285 |
|
Other accrued liabilities |
|
| 114,712 |
|
|
| 112,271 |
|
Operating lease liabilities |
|
| 17,522 |
|
|
| 18,594 |
|
Income taxes payable |
|
| 48,653 |
|
|
| 65,010 |
|
Current debt |
|
| — |
|
|
| 50,115 |
|
Current liabilities held for sale |
|
| 7,379 |
|
|
| — |
|
Total current liabilities |
|
| 659,951 |
|
|
| 746,263 |
|
Retirement plans liabilities |
|
| 132,090 |
|
|
| 116,005 |
|
Long-term deferred revenue and customer advances |
|
| 37,282 |
|
|
| 45,131 |
|
Deferred tax liabilities |
|
| 183 |
|
|
| 3,267 |
|
Long-term other accrued liabilities |
|
| 19,998 |
|
|
| 15,981 |
|
Long-term operating lease liabilities |
|
| 65,092 |
|
|
| 64,176 |
|
Long-term income taxes payable |
|
| 44,331 |
|
|
| 59,135 |
|
Long-term liabilities held for sale |
|
| 2,000 |
|
|
| — |
|
Total liabilities |
|
| 960,927 |
|
|
| 1,049,958 |
|
Commitments and contingencies (Note M) |
|
|
|
|
|
| ||
SHAREHOLDERS’ EQUITY |
|
|
|
|
|
| ||
Common stock, $0.125 par value, 1,000,000 shares authorized, 152,698 and 155,759 shares issued |
|
| 19,087 |
|
|
| 19,470 |
|
Additional paid-in capital |
|
| 1,827,274 |
|
|
| 1,755,963 |
|
Accumulated other comprehensive loss |
|
| (26,978 | ) |
|
| (49,868 | ) |
Retained earnings |
|
| 706,514 |
|
|
| 725,729 |
|
Total shareholders’ equity |
|
| 2,525,897 |
|
|
| 2,451,294 |
|
Total liabilities, convertible common shares and shareholders’ equity |
| $ | 3,486,824 |
|
| $ | 3,501,252 |
|
The accompanying notes are an integral part of the consolidated financial statements.
40
TERADYNE, INC.
CONSOLIDATED STATEMENTS OF OPERATIONS
Years Ended December 31, | ||||||||||||
2022 | 2021 | 2020 | ||||||||||
(in thousands, except per share amount) | ||||||||||||
Revenues: | ||||||||||||
Products | $ | 2,591,572 | $ | 3,196,575 | $ | 2,690,906 | ||||||
Services | 563,473 | 506,306 | 430,563 | |||||||||
Total revenues | 3,155,045 | 3,702,881 | 3,121,469 | |||||||||
Cost of revenues: | ||||||||||||
Cost of products | 1,042,555 | 1,300,106 | 1,157,476 | |||||||||
Cost of services | 245,339 | 196,119 | 178,252 | |||||||||
Total cost of revenues (exclusive of acquired intangible assets amortization shown separately below) | 1,287,894 | 1,496,225 | 1,335,728 | |||||||||
Gross profit | 1,867,151 | 2,206,656 | 1,785,741 | |||||||||
Operating expenses: | ||||||||||||
Selling and administrative | 558,103 | 547,559 | 464,769 | |||||||||
Engineering and development | 440,591 | 427,609 | 374,964 | |||||||||
Acquired intangible assets amortization | 19,333 | 21,456 | 30,803 | |||||||||
Restructuring and other | 17,185 | 9,312 | (13,202 | ) | ||||||||
Total operating expenses | 1,035,212 | 1,005,936 | 857,334 | |||||||||
Income from operations | 831,939 | 1,200,720 | 928,407 | |||||||||
Non-operating (income) expenses: | ||||||||||||
Interest income | (6,379 | ) | (2,627 | ) | (5,982 | ) | ||||||
Interest expense | 3,719 | 17,820 | 24,182 | |||||||||
Other (income) expense, net | (5,786 | ) | 24,572 | 9,192 | ||||||||
Income before income taxes | 840,385 | 1,160,955 | 901,015 | |||||||||
Income tax provision | 124,884 | 146,366 | 116,868 | |||||||||
Net income | $ | 715,501 | $ | 1,014,589 | $ | 784,147 | ||||||
Net income per common share: | ||||||||||||
Basic | $ | 4.52 | $ | 6.15 | $ | 4.72 | ||||||
Diluted | $ | 4.22 | $ | 5.53 | $ | 4.28 | ||||||
Weighted average common shares—basic | 158,434 | 164,960 | 166,120 | |||||||||
Weighted average common shares—diluted | 169,734 | 183,625 | 183,042 | |||||||||
|
| Years Ended December 31, |
| |||||||||
|
| 2023 |
|
| 2022 |
|
| 2021 |
| |||
|
| (in thousands, except per share amount) |
| |||||||||
Revenues: |
|
|
|
|
|
|
|
|
| |||
Products |
| $ | 2,096,286 |
|
| $ | 2,591,572 |
|
| $ | 3,196,575 |
|
Services |
|
| 580,012 |
|
|
| 563,473 |
|
|
| 506,306 |
|
Total revenues |
|
| 2,676,298 |
|
|
| 3,155,045 |
|
|
| 3,702,881 |
|
Cost of revenues: |
|
|
|
|
|
|
|
|
| |||
Cost of products |
|
| 882,892 |
|
|
| 1,042,555 |
|
|
| 1,300,106 |
|
Cost of services |
|
| 256,658 |
|
|
| 245,339 |
|
|
| 196,119 |
|
Total cost of revenues (exclusive of acquired intangible assets |
|
| 1,139,550 |
|
|
| 1,287,894 |
|
|
| 1,496,225 |
|
Gross profit |
|
| 1,536,748 |
|
|
| 1,867,151 |
|
|
| 2,206,656 |
|
Operating expenses: |
|
|
|
|
|
|
|
|
| |||
Selling and administrative |
|
| 577,315 |
|
|
| 558,103 |
|
|
| 547,559 |
|
Engineering and development |
|
| 418,089 |
|
|
| 440,591 |
|
|
| 427,609 |
|
Acquired intangible assets amortization |
|
| 18,999 |
|
|
| 19,333 |
|
|
| 21,456 |
|
Restructuring and other |
|
| 21,277 |
|
|
| 17,185 |
|
|
| 9,312 |
|
Total operating expenses |
|
| 1,035,680 |
|
|
| 1,035,212 |
|
|
| 1,005,936 |
|
Income from operations |
|
| 501,068 |
|
|
| 831,939 |
|
|
| 1,200,720 |
|
Non-operating (income) expenses: |
|
|
|
|
|
|
|
|
| |||
Interest income |
|
| (27,348 | ) |
|
| (6,379 | ) |
|
| (2,627 | ) |
Interest expense |
|
| 3,806 |
|
|
| 3,719 |
|
|
| 17,820 |
|
Other (income) expense, net |
|
| (962 | ) |
|
| (5,786 | ) |
|
| 24,572 |
|
Income before income taxes |
|
| 525,572 |
|
|
| 840,385 |
|
|
| 1,160,955 |
|
Income tax provision |
|
| 76,820 |
|
|
| 124,884 |
|
|
| 146,366 |
|
Net income |
| $ | 448,752 |
|
| $ | 715,501 |
|
| $ | 1,014,589 |
|
Net income per common share: |
|
|
|
|
|
|
|
|
| |||
Basic |
| $ | 2.91 |
|
| $ | 4.52 |
|
| $ | 6.15 |
|
Diluted |
| $ | 2.73 |
|
| $ | 4.22 |
|
| $ | 5.53 |
|
Weighted average common shares—basic |
|
| 154,310 |
|
|
| 158,434 |
|
|
| 164,960 |
|
Weighted average common shares—diluted |
|
| 164,304 |
|
|
| 169,734 |
|
|
| 183,625 |
|
The accompanying notes are an integral part of the consolidated financial statements.
41
TERADYNE, INC.
CONSOLIDATED STATEMENTS OF COMPREHENSIVE INCOME
Years Ended December 31, | ||||||||||||
2022 | 2021 | 2020 | ||||||||||
(in thousands) | ||||||||||||
Net income | $ | 715,501 | $ | 1,014,589 | $ | 784,147 | ||||||
Other comprehensive (loss) income, net of tax: | ||||||||||||
Foreign currency translation adjustment, net of tax of $0, $0, $0, respectively | (29,031 | ) | (36,207 | ) | 48,903 | |||||||
Available-for-sale marketable securities: | ||||||||||||
Unrealized (losses) gains on marketable securities arising during period, net of tax of $( 3,388), 578$( ), $ 1,629, respectively | (12,666 | ) | (2,255 | ) | 5,839 | |||||||
Less: Reclassification adjustment for losses (gains) included in net income, net of tax of $25, $(277), $(665), respectively | 301 | (995 | ) | (2,365 | ) | |||||||
| (12,365 | ) | (3,250 | ) | 3,474 | ||||||||
Cash flow hedges: | ||||||||||||
Unrealized losses arising during period, net of tax of $(708), $0, $0, respectively | (2,517 | ) | — | — | ||||||||
Defined benefit post-retirement plan: | ||||||||||||
Amortization of prior service credit, net of tax $(2), $(2), $(2), respectively | (7 | ) | (7 | ) | (7 | ) | ||||||
Other comprehensive (loss) income | (43,920 | ) | (39,464 | ) | 52,370 | |||||||
Comprehensive income | $ | 671,581 | $ | 975,125 | $ | 836,517 | ||||||
|
| Years Ended December 31, |
| |||||||||
|
| 2023 |
|
| 2022 |
|
| 2021 |
| |||
|
| (in thousands) |
| |||||||||
Net income |
| $ | 448,752 |
|
| $ | 715,501 |
|
| $ | 1,014,589 |
|
Other comprehensive income (loss), net of tax: |
|
|
|
|
|
|
|
|
| |||
Foreign currency translation adjustment, net of tax of $0, $0, $0, |
|
| 17,407 |
|
|
| (29,031 | ) |
|
| (36,207 | ) |
Available-for-sale marketable securities: |
|
|
|
|
|
|
|
|
| |||
Unrealized gains (losses) on marketable securities arising during |
|
| 2,423 |
|
|
| (12,666 | ) |
|
| (2,255 | ) |
Less: Reclassification adjustment for losses (gains) included in net |
|
| 44 |
|
|
| 301 |
|
|
| (995 | ) |
|
| 2,467 |
|
|
| (12,365 | ) |
|
| (3,250 | ) | |
Cash flow hedges: |
|
|
|
|
|
|
|
|
| |||
Unrealized gains (losses) arising during period, net of tax of $1,537, |
|
| 5,464 |
|
|
| (2,517 | ) |
|
| — |
|
Less: Reclassification adjustment for losses included in net |
|
| (2,441 | ) |
|
| — |
|
|
| — |
|
|
|
| 3,023 |
|
|
| (2,517 | ) |
|
| — |
|
Defined benefit post-retirement plan: |
|
|
|
|
|
|
|
|
| |||
Amortization of prior service credit, net of tax $(2), $(2), $(2), |
|
| (7 | ) |
|
| (7 | ) |
|
| (7 | ) |
Other comprehensive income (loss) |
|
| 22,890 |
|
|
| (43,920 | ) |
|
| (39,464 | ) |
Comprehensive income |
| $ | 471,642 |
|
| $ | 671,581 |
|
| $ | 975,125 |
|
The accompanying notes are an integral part of the consolidated financial statements.
42
TERADYNE, INC.
CONSOLIDATED STATEMENTS OF CONVERTIBLE COMMON SHARES
AND SHAREHOLDERS’ EQUITY
Shareholders’ Equity | ||||||||||||||||||||||||||||
Convertible Common Shares Value | Common Stock Shares | Common Stock Par Value | Additional Paid-in Capital | Accumulated Other Comprehensive (Loss) Income | (Accumulated Deficit) Retained Earnings | Total Shareholders’ Equity | ||||||||||||||||||||||
(in thousands) | ||||||||||||||||||||||||||||
Year Ended December 31, 2019 | $ | — | 166,410 | $ | 20,801 | $ | 1,720,129 | $ | (18,854 | ) | $ | (241,918 | ) | $ | 1,480,158 | |||||||||||||
Net issuance of common stock under stock-based plans | 1,230 | 154 | 4,696 | 4,850 | ||||||||||||||||||||||||
Stock-based compensation expense | 44,285 | 44,285 | ||||||||||||||||||||||||||
Repurchase of common stock | (1,517 | ) | (190 | ) | (88,275 | ) | (88,465 | ) | ||||||||||||||||||||
Cash dividends ($0.40 per share) | (66,540 | ) | (66,540 | ) | ||||||||||||||||||||||||
Convertible common shares | 3,787 | (3,787 | ) | (3,787 | ) | |||||||||||||||||||||||
Net income | 784,147 | 784,147 | ||||||||||||||||||||||||||
Other comprehensive income | 52,370 | 52,370 | ||||||||||||||||||||||||||
Year Ended December 31, 2020 | 3,787 | 166,123 | 20,765 | 1,765,323 | 33,516 | 387,414 | 2,207,018 | |||||||||||||||||||||
Net issuance of common stock under stock-based plans | 899 | 113 | �� | (225 | ) | (112 | ) | |||||||||||||||||||||
Stock-based compensation expense | 45,632 | 45,632 | ||||||||||||||||||||||||||
Repurchase of common stock | (4,771 | ) | (597 | ) | (599,403 | ) | (600,000 | ) | ||||||||||||||||||||
Cash dividends ($0.40 per share) | (66,034 | ) | (66,034 | ) | ||||||||||||||||||||||||
Settlements of convertible notes | 8,148 | 1,018 | 984,622 | 985,640 | ||||||||||||||||||||||||
Exercise of convertible notes hedge call options | (8,148 | ) | (1,018 | ) | (986,082 | ) | (987,100 | ) | ||||||||||||||||||||
Convertible common shares | (2,275 | ) | 2,275 | 2,275 | ||||||||||||||||||||||||
Net income | 1,014,589 | 1,014,589 | ||||||||||||||||||||||||||
Other comprehensive loss | (39,464 | ) | (39,464 | ) | ||||||||||||||||||||||||
Year Ended December 31, 2021 | 1,512 | 162,251 | 20,281 | 1,811,545 | (5,948 | ) | 736,566 | 2,562,444 | ||||||||||||||||||||
Net issuance of common stock under stock-based plans | 761 | 96 | (4,471 | ) | (4,375 | ) | ||||||||||||||||||||||
Stock-based compensation expense | 48,466 | 48,466 | ||||||||||||||||||||||||||
Repurchase of common stock | (7,253 | ) | (907 | ) | (751,175 | ) | (752,082 | ) | ||||||||||||||||||||
Cash dividends ($0.44 per share) | (69,763 | ) | (69,763 | ) | ||||||||||||||||||||||||
Settlements of convertible notes | 1,495 | 187 | (442 | ) | (255 | ) | ||||||||||||||||||||||
Exercise of convertible notes hedge call options | (1,495 | ) | (187 | ) | 187 | — | ||||||||||||||||||||||
Convertible common shares | (1,512 | ) | 1,512 | 1,512 | ||||||||||||||||||||||||
Cumulative effect of change in accounting principle related to convertible debt | (100,834 | ) | 94,600 | (6,234 | ) | |||||||||||||||||||||||
Net income | 715,501 | 715,501 | ||||||||||||||||||||||||||
Other comprehensive loss | (43,920 | ) | (43,920 | ) | ||||||||||||||||||||||||
Year Ended December 31, 2022 | $ | — | 155,759 | $ | 19,470 | $ | 1,755,963 | $ | (49,868 | ) | $ | 725,729 | $ | 2,451,294 | ||||||||||||||
|
|
|
|
| Shareholders’ Equity |
| ||||||||||||||||||||||
|
| Convertible |
|
| Common |
|
| Common |
|
| Additional |
|
| Accumulated |
|
| Retained |
|
| Total |
| |||||||
|
| (in thousands) |
| |||||||||||||||||||||||||
Year Ended December 31, 2020 |
| $ | 3,787 |
|
|
| 166,123 |
|
| $ | 20,765 |
|
| $ | 1,765,323 |
|
| $ | 33,516 |
|
| $ | 387,414 |
|
|
| 2,207,018 |
|
Net issuance of common stock under stock-based plans |
|
|
|
|
| 899 |
|
|
| 113 |
|
|
| (225 | ) |
|
|
|
|
|
|
|
| (112 | ) | |||
Stock-based compensation expense |
|
|
|
|
|
|
|
|
|
|
| 45,632 |
|
|
|
|
|
|
|
|
| 45,632 |
| |||||
Repurchase of common stock |
|
|
|
|
| (4,771 | ) |
|
| (597 | ) |
|
|
|
|
|
|
|
| (599,403 | ) |
|
| (600,000 | ) | |||
Cash dividends ($0.40 per share) |
|
|
|
|
|
|
|
|
|
|
|
|
|
|
|
|
| (66,034 | ) |
|
| (66,034 | ) | |||||
Settlements of convertible notes |
|
|
|
|
| 8,148 |
|
|
| 1,018 |
|
|
| 984,622 |
|
|
|
|
|
|
|
|
| 985,640 |
| |||
Exercise of convertible notes hedge call options |
|
|
|
|
| (8,148 | ) |
|
| (1,018 | ) |
|
| (986,082 | ) |
|
|
|
|
|
|
|
| (987,100 | ) | |||
Convertible common shares |
|
| (2,275 | ) |
|
|
|
|
|
|
|
| 2,275 |
|
|
|
|
|
|
|
|
| 2,275 |
| ||||
Net income |
|
|
|
|
|
|
|
|
|
|
|
|
|
|
|
|
| 1,014,589 |
|
|
| 1,014,589 |
| |||||
Other comprehensive loss |
|
|
|
|
|
|
|
|
|
|
|
|
|
| (39,464 | ) |
|
|
|
|
| (39,464 | ) | |||||
Year Ended December 31, 2021 |
| $ | 1,512 |
|
|
| 162,251 |
|
| $ | 20,281 |
|
| $ | 1,811,545 |
|
| $ | (5,948 | ) |
| $ | 736,566 |
|
| $ | 2,562,444 |
|
Net issuance of common stock under stock-based plans |
|
|
|
|
| 761 |
|
|
| 96 |
|
|
| (4,471 | ) |
|
|
|
|
|
|
|
| (4,375 | ) | |||
Stock-based compensation expense |
|
|
|
|
|
|
|
|
|
|
| 48,466 |
|
|
|
|
|
|
|
|
| 48,466 |
| |||||
Repurchase of common stock |
|
|
|
|
| (7,253 | ) |
|
| (907 | ) |
|
|
|
|
|
|
|
| (751,175 | ) |
|
| (752,082 | ) | |||
Cash dividends ($0.44 per share) |
|
|
|
|
|
|
|
|
|
|
|
|
|
|
|
|
| (69,763 | ) |
|
| (69,763 | ) | |||||
Settlements of convertible notes |
|
|
|
|
| 1,495 |
|
|
| 187 |
|
|
| (442 | ) |
|
|
|
|
|
|
|
| (255 | ) | |||
Exercise of convertible notes hedge call options |
|
|
|
|
| (1,495 | ) |
|
| (187 | ) |
|
| 187 |
|
|
|
|
|
|
|
|
| — |
| |||
Convertible common shares |
|
| (1,512 | ) |
|
|
|
|
|
|
|
| 1,512 |
|
|
|
|
|
|
|
|
| 1,512 |
| ||||
Cumulative-effect of change in accounting principle |
|
|
|
|
|
|
|
|
|
|
| (100,834 | ) |
|
|
|
|
| 94,600 |
|
|
| (6,234 | ) | ||||
Net income |
|
|
|
|
|
|
|
|
|
|
|
|
|
|
|
|
| 715,501 |
|
|
| 715,501 |
| |||||
Other comprehensive loss |
|
|
|
|
|
|
|
|
|
|
|
|
|
| (43,920 | ) |
|
|
|
|
| (43,920 | ) | |||||
Year Ended December 31, 2022 |
| $ | — |
|
|
| 155,759 |
|
| $ | 19,470 |
|
| $ | 1,755,963 |
|
| $ | (49,868 | ) |
| $ | 725,729 |
|
| $ | 2,451,294 |
|
Net issuance of common stock under stock-based plans |
|
|
|
|
| 848 |
|
|
| 106 |
|
|
| 13,371 |
|
|
|
|
|
|
|
|
| 13,477 |
| |||
Stock-based compensation expense |
|
|
|
|
|
|
|
|
|
|
| 57,940 |
|
|
|
|
|
|
|
|
| 57,940 |
| |||||
Repurchase of common stock |
|
|
|
|
| (3,909 | ) |
|
| (489 | ) |
|
|
|
|
|
|
|
| (400,040 | ) |
|
| (400,529 | ) | |||
Cash dividends ($0.44 per share) |
|
|
|
|
|
|
|
|
|
|
|
|
|
|
|
|
| (67,927 | ) |
|
| (67,927 | ) | |||||
Settlements of convertible notes |
|
|
|
|
| 1,072 |
|
|
| 133 |
|
|
| (133 | ) |
|
|
|
|
|
|
|
| — |
| |||
Exercise of convertible notes hedge call options |
|
|
|
|
| (1,072 | ) |
|
| (133 | ) |
|
| 133 |
|
|
|
|
|
|
|
|
| — |
| |||
Net income |
|
|
|
|
|
|
|
|
|
|
|
|
|
|
|
|
| 448,752 |
|
|
| 448,752 |
| |||||
Other comprehensive income |
|
|
|
|
|
|
|
|
|
|
|
|
|
| 22,890 |
|
|
|
|
|
| 22,890 |
| |||||
Year Ended December 31, 2023 |
| $ | — |
|
|
| 152,698 |
|
| $ | 19,087 |
|
| $ | 1,827,274 |
|
| $ | (26,978 | ) |
| $ | 706,514 |
|
| $ | 2,525,897 |
|
The accompanying notes are an integral part of the consolidated financial statements.
43
TERADYNE, INC.
CONSOLIDATED STATEMENTS OF CASH FLOWS
Years Ended December 31, | ||||||||||||
2022 | 2021 | 2020 | ||||||||||
(in thousands) | ||||||||||||
Cash flows from operating activities: | ||||||||||||
Net income | $ | 715,501 | $ | 1,014,589 | $ | 784,147 | ||||||
Adjustments to reconcile net income from operations to net cash provided by operating activities: | ||||||||||||
Depreciation | 90,763 | 91,073 | 80,119 | |||||||||
Stock-based compensation | 48,228 | 45,643 | 44,906 | |||||||||
Provision for excess and obsolete inventory | 31,452 | 15,475 | 17,534 | |||||||||
Amortization | 19,912 | 34,412 | 46,624 | |||||||||
Deferred taxes | (38,693 | ) | (17,305 | ) | (15,688 | ) | ||||||
Retirement plans actuarial (gains) losses | (25,584 | ) | (2,217 | ) | 10,284 | |||||||
Losses (gains) on investments | 9,985 | (6,410 | ) | (7,898 | ) | |||||||
Gains on sale of asset | (3,410 | ) | — | — | ||||||||
Loss on convertible debt conversion | — | 28,828 | — | |||||||||
Contingent consideration fair value adjustment | — | (7,227 | ) | (23,271 | ) | |||||||
Other | 2,353 | 271 | 1,557 | |||||||||
Changes in operating assets and liabilities, net of businesses acquired: | ||||||||||||
Accounts receivable | 50,628 | (57,778 | ) | (129,451 | ) | |||||||
Inventories | (80,809 | ) | 6,495 | (8,438 | ) | |||||||
Prepayments and other assets | (140,713 | ) | (175,846 | ) | (64,418 | ) | ||||||
Accounts payable and other accrued expenses | (60,507 | ) | 129,499 | 73,167 | ||||||||
Deferred revenue and customer advances | (6,233 | ) | 9,873 | 39,974 | ||||||||
Retirement plan contributions | (5,116 | ) | (5,405 | ) | (5,382 | ) | ||||||
Income taxes | (29,834 | ) | (5,604 | ) | 25,169 | |||||||
Net cash provided by operating activities | 577,923 | 1,098,366 | 868,935 | |||||||||
Cash flows from investing activities: | ||||||||||||
Purchases of property, plant and equipment | (163,249 | ) | (132,472 | ) | (184,977 | ) | ||||||
Purchases of marketable securities | (287,409 | ) | (661,781 | ) | (900,196 | ) | ||||||
Proceeds from maturities of marketable securities | 222,941 | 660,148 | 479,678 | |||||||||
Proceeds from sales of marketable securities | 268,058 | 266,466 | 35,006 | |||||||||
Proceeds from sale of asset | 3,410 | — | — | |||||||||
Purchase of investment and acquisition of business | — | (12,000 | ) | 149 | ||||||||
Proceeds from insurance | — | — | 546 | |||||||||
Net cash provided by (used for) investing activities | 43,751 | 120,361 | (569,794 | ) | ||||||||
Cash flows from financing activities: | ||||||||||||
Repurchase of common stock | (752,082 | ) | (600,000 | ) | (88,465 | ) | ||||||
Payments of convertible debt principal | (66,759 | ) | (342,990 | ) | — | |||||||
Dividend payments | (69,711 | ) | (65,977 | ) | (66,482 | ) | ||||||
Payments related to net settlement of employee stock compensation awards | (33,170 | ) | (32,303 | ) | (23,014 | ) | ||||||
Issuance of common stock under stock purchase and stock option plans | 28,733 | 32,686 | 28,527 | |||||||||
Payments of contingent consideration | — | — | (8,852 | ) | ||||||||
Net cash used for financing activities | (892,989 | ) | (1,008,584 | ) | (158,286 | ) | ||||||
Effects of exchange rate changes on cash and cash equivalents | 3,889 | (2,065 | ) | (658 | ) | |||||||
(Decrease) increase in cash and cash equivalents | (267,426 | ) | 208,078 | 140,197 | ||||||||
Cash and cash equivalents at beginning of year | 1,122,199 | 914,121 | 773,924 | |||||||||
Cash and cash equivalents at end of year | $ | 854,773 | $ | 1,122,199 | $ | 914,121 | ||||||
Supplementary disclosure of cash flow information: | ||||||||||||
Cash paid for: | ||||||||||||
Interest | $ | 1,498 | $ | 4,236 | $ | 6,435 | ||||||
Income taxes | $ | 193,246 | $ | 172,134 | $ | 106,577 | ||||||
Non-cash investing activities: | ||||||||||||
Capital expenditures incurred but not yet paid: | $ | 1,826 | $ | 1,973 | $ | 3,666 | ||||||
|
| Years Ended December 31, |
| |||||||||
|
| 2023 |
|
| 2022 |
|
| 2021 |
| |||
|
| (in thousands) |
| |||||||||
Cash flows from operating activities: |
|
|
|
|
|
|
|
|
| |||
Net income |
| $ | 448,752 |
|
| $ | 715,501 |
|
| $ | 1,014,589 |
|
Adjustments to reconcile net income from operations to net cash provided by operating activities: |
|
|
|
|
|
|
|
|
| |||
Depreciation |
|
| 92,118 |
|
|
| 90,763 |
|
|
| 91,073 |
|
Stock-based compensation |
|
| 57,682 |
|
|
| 48,228 |
|
|
| 45,643 |
|
Provision for excess and obsolete inventory |
|
| 28,358 |
|
|
| 31,452 |
|
|
| 15,475 |
|
Amortization |
|
| 18,768 |
|
|
| 19,912 |
|
|
| 34,412 |
|
Retirement plans actuarial losses (gains) |
|
| 2,703 |
|
|
| (25,584 | ) |
|
| (2,217 | ) |
Deferred taxes |
|
| (37,642 | ) |
|
| (38,693 | ) |
|
| (17,305 | ) |
(Gains) losses on investments |
|
| (14,915 | ) |
|
| 9,985 |
|
|
| (6,410 | ) |
Gains on sale of asset |
|
| — |
|
|
| (3,410 | ) |
|
| — |
|
Loss on convertible debt conversion |
|
| — |
|
|
| — |
|
|
| 28,828 |
|
Contingent consideration fair value adjustment |
|
| — |
|
|
| — |
|
|
| (7,227 | ) |
Other |
|
| (955 | ) |
|
| 2,353 |
|
|
| 271 |
|
Changes in operating assets and liabilities, net of businesses acquired: |
|
|
|
|
|
|
|
|
| |||
Accounts receivable |
|
| 70,977 |
|
|
| 50,628 |
|
|
| (57,778 | ) |
Inventories |
|
| 5,327 |
|
|
| (80,809 | ) |
|
| 6,495 |
|
Prepayments and other assets |
|
| (43,101 | ) |
|
| (140,713 | ) |
|
| (175,846 | ) |
Accounts payable and other accrued expenses |
|
| 46,782 |
|
|
| (60,507 | ) |
|
| 129,499 |
|
Deferred revenue and customer advances |
|
| (57,210 | ) |
|
| (6,233 | ) |
|
| 9,873 |
|
Retirement plan contributions |
|
| (5,492 | ) |
|
| (5,116 | ) |
|
| (5,405 | ) |
Income taxes |
|
| (26,921 | ) |
|
| (29,834 | ) |
|
| (5,604 | ) |
Net cash provided by operating activities |
|
| 585,231 |
|
|
| 577,923 |
|
|
| 1,098,366 |
|
Cash flows from investing activities: |
|
|
|
|
|
|
|
|
| |||
Purchases of property, plant and equipment |
|
| (159,642 | ) |
|
| (163,249 | ) |
|
| (132,472 | ) |
Purchases of marketable securities |
|
| (161,906 | ) |
|
| (287,409 | ) |
|
| (661,781 | ) |
Proceeds from maturities of marketable securities |
|
| 85,042 |
|
|
| 222,941 |
|
|
| 660,148 |
|
Proceeds from sales of marketable securities |
|
| 61,401 |
|
|
| 268,058 |
|
|
| 266,466 |
|
Proceeds from insurance |
|
| 460 |
|
|
| — |
|
|
| — |
|
Issuance of convertible loan |
|
| (5,000 | ) |
|
| — |
|
|
| — |
|
Proceeds from sale of asset |
|
| — |
|
|
| 3,410 |
|
|
| — |
|
Purchase of investment and acquisition of business |
|
| — |
|
|
| — |
|
|
| (12,000 | ) |
Net cash (used for) provided by investing activities |
|
| (179,645 | ) |
|
| 43,751 |
|
|
| 120,361 |
|
Cash flows from financing activities: |
|
|
|
|
|
|
|
|
| |||
Repurchase of common stock |
|
| (397,241 | ) |
|
| (752,082 | ) |
|
| (600,000 | ) |
Dividend payments |
|
| (67,878 | ) |
|
| (69,711 | ) |
|
| (65,977 | ) |
Payments of convertible debt principal |
|
| (50,264 | ) |
|
| (66,759 | ) |
|
| (342,990 | ) |
Payments related to net settlement of employee stock compensation awards |
|
| (20,788 | ) |
|
| (33,170 | ) |
|
| (32,303 | ) |
Issuance of common stock under stock purchase and stock option plans |
|
| 34,259 |
|
|
| 28,733 |
|
|
| 32,686 |
|
Net cash used for financing activities |
|
| (501,912 | ) |
|
| (892,989 | ) |
|
| (1,008,584 | ) |
Effects of exchange rate changes on cash and cash equivalents |
|
| (876 | ) |
|
| 3,889 |
|
|
| (2,065 | ) |
(Decrease) increase in cash and cash equivalents |
|
| (97,202 | ) |
|
| (267,426 | ) |
|
| 208,078 |
|
Cash and cash equivalents at beginning of year |
|
| 854,773 |
|
|
| 1,122,199 |
|
|
| 914,121 |
|
Cash and cash equivalents at end of year |
| $ | 757,571 |
|
| $ | 854,773 |
|
| $ | 1,122,199 |
|
Supplementary disclosure of cash flow information: |
|
|
|
|
|
|
|
|
| |||
Cash paid for: |
|
|
|
|
|
|
|
|
| |||
Interest |
| $ | 296 |
|
| $ | 1,498 |
|
| $ | 4,236 |
|
Income taxes |
| $ | 140,239 |
|
| $ | 193,246 |
|
| $ | 172,134 |
|
Non-cash investing activities: |
|
|
|
|
|
|
|
|
| |||
Capital expenditures incurred but not yet paid: |
| $ | 2,735 |
|
| $ | 1,826 |
|
| $ | 1,973 |
|
The accompanying notes are an integral part of the consolidated financial statements.
44
TERADYNE, INC.
NOTES TO CONSOLIDATED FINANCIAL STATEMENTS
Teradyne, Inc. (“Teradyne”) is a leading global supplier of automated test equipment and robotics solutions. Teradyne designs, develops, manufactures and sells automaticautomated test systems and robotics products. Teradyne’s automaticautomated test systems are used to test semiconductors, wireless products, data storage and complex electronics systems in many industries including consumer electronics, wireless, automotive, industrial, computing, communications, and aerospace and defense industries. Teradyne’s robotics products include collaborative robotic arms, autonomous mobile robots, and advanced robotic control software used by global manufacturing, logistics and industrial customers to improve quality, increase manufacturing and material handling efficiency and decrease manufacturing and logistics costs. Teradyne’s automaticautomated test equipment and robotics products and services include:
The consolidated financial statements include the accounts of Teradyne and its wholly owned subsidiaries. All significant intercompany balances and transactions are eliminated. Certain prior years’ amounts were reclassified to conform to the current year presentation.
Preparation of Financial Statements and Use of Estimates
The preparation of consolidated financial statements requires management to make estimates and judgments that affect the reported amounts of assets, liabilities, revenues and expenses, and related disclosure of contingent liabilities. On an on-going basis, management evaluates its estimates, including those related to inventories, investments, goodwill, intangible and other long-lived assets, accounts receivable, income taxes, deferred tax assets and liabilities, pensions, warranties, contingent consideration liabilities, and loss contingencies. Management bases its estimates on historical experience and on appropriate and customary assumptions that are believed to be reasonable under the circumstances, the results of which form the basis for making judgments about the carrying values of assets and liabilities that are not readily apparent from other sources. Due to the COVID-19 pandemic, there has been uncertainty and disruption in the global economy and our markets. Management is not aware of any specific event or circumstance that would require an update to its estimates or judgments or a revision of the carrying value of its assets or liabilities as of the date of issuance of this Annual Report on Form 10-K. These estimates may change, as new events occur and additional information is obtained. Actual results may differ significantly from these estimates under different assumptions or conditions.
Revenue Recognition
Revenue from Contracts with Customers
In accordance with ASC 606, Teradyne recognizes revenues, when or as control is transferred to a customer. Teradyne’s determination of revenue is dependent upon a five-step process outlined below.
45
Performance Obligations
Products
Teradyne products consist primarily of semiconductor test systems and instruments, defense/aerospace test instrumentation and systems, storage test systems and instruments, circuit-board test and inspection systems and instruments, wireless test systems and robotics products. Teradyne’s hardware is typically recognized at a point in time upon transfer of control to the customer.
Services
Teradyne services consist of extended warranties, training and application support, service agreements, post contract customer support (“PCS”) and replacement parts. Each service is recognized based on relative standalone selling price. Extended warranty, training and support, service agreements and PCS are recognized over time based on the period of service. Replacement parts are recognized at a point in time upon transfer of control to the customer.
Teradyne does not allow customer returns or provide refunds to customers for any products or services. Teradyne products include a standa
As of December 31, 20222023 and 2021,2022, deferred revenue and customer advances consisted of the following and are included in the short and long-term deferred revenue and customer advances:
|
| 2023 |
|
| 2022 |
| ||
|
| (in thousands) |
| |||||
Maintenance, service and training |
| $ | 66,458 |
|
| $ | 78,089 |
|
Customer advances, undelivered elements and other |
|
| 35,731 |
|
|
| 59,147 |
|
Extended warranty |
|
| 34,897 |
|
|
| 56,180 |
|
Total deferred revenue and customer advances |
| $ | 137,086 |
|
| $ | 193,416 |
|
46
2022 | 2021 | |||||||
(in thousands) | ||||||||
Maintenance, service and training | $ | 78,089 | $ | 81,826 | ||||
Customer advances, undelivered elements and other | 59,147 | 55,112 | ||||||
Extended warranty | 56,180 | 64,168 | ||||||
Total deferred revenue and customer advances | $ | 193,416 | $ | 201,106 | ||||
Product Warranty
Teradyne generally provides a one-year warranty on its products, commencing upon installation, acceptance or shipment. A provision is recorded upon revenue recognition to cost of revenues for estimated warranty expense based on historical experience. Related costs are charged to the warranty accrual as incurred. The balance below is included in other accrued liabilities:
|
| Amount |
| |
|
| (in thousands) |
| |
Balance at December 31, 2020 |
| $ | 16,633 |
|
Accruals for warranties issued during the period |
|
| 35,727 |
|
Accruals related to pre-existing warranties |
|
| (6,846 | ) |
Settlements made during the period |
|
| (20,937 | ) |
Balance at December 31, 2021 |
|
| 24,577 |
|
Accruals for warranties issued during the period |
|
| 21,851 |
|
Accruals related to pre-existing warranties |
|
| (5,618 | ) |
Settlements made during the period |
|
| (26,629 | ) |
Balance at December 31, 2022 |
|
| 14,181 |
|
Accruals for warranties issued during the period |
|
| 21,644 |
|
Accruals related to pre-existing warranties |
|
| (1,576 | ) |
Settlements made during the period |
|
| (18,551 | ) |
Balance at December 31, 2023 |
| $ | 15,698 |
|
Amount | ||||
(in thousands) | ||||
Balance at December 31, 2019 | $ | 8,996 | ||
Accruals for warranties issued during the period | 28,490 | |||
Accruals related to pre-existing warranties | 821 | |||
Settlements made during the period | (21,674 | ) | ||
Balance at December 31, 2020 | 16,633 | |||
Accruals for warranties issued during the period | 35,727 | |||
Accruals related to pre-existing warranties | (6,846 | ) | ||
Settlements made during the period | (20,937 | ) | ||
Balance at December 31, 2021 | 24,577 | |||
Accruals for warranties issued during the period | 21,851 | |||
Accruals related to pre-existing warranties | (5,618 | ) | ||
Settlements made during the period | (26,629 | ) | ||
Balance at December 31, 2022 | $ | 14,181 | ||
When Teradyne receives revenue for extended warranties, beyond one year, it is deferred and recognized on a straight-line basis over the contract period. Related costs are expensed as incurred. The balance below is included in short and long-term deferred revenue and customer advances:
|
| Amount |
| |
|
| (in thousands) |
| |
Balance at December 31, 2020 |
| $ | 51,929 |
|
Deferral of new extended warranty revenue |
|
| 43,597 |
|
Recognition of extended warranty deferred revenue |
|
| (31,358 | ) |
Balance at December 31, 2021 |
|
| 64,168 |
|
Deferral of new extended warranty revenue |
|
| 33,686 |
|
Recognition of extended warranty deferred revenue |
|
| (41,674 | ) |
Balance at December 31, 2022 |
|
| 56,180 |
|
Deferral of new extended warranty revenue |
|
| 14,330 |
|
Recognition of extended warranty deferred revenue |
|
| (35,613 | ) |
Balance at December 31, 2023 |
| $ | 34,897 |
|
Amount | ||||
(in thousands) | ||||
Balance at December 31, 2019 | $ | 30,677 | ||
Deferral of new extended warranty revenue | 41,694 | |||
Recognition of extended warranty deferred revenue | (20,442 | ) | ||
Balance at December 31, 2020 | 51,929 | |||
Deferral of new extended warranty revenue | 43,597 | |||
Recognition of extended warranty deferred revenue | (31,358 | ) | ||
Balance at December 31, 2021 | 64,168 | |||
Deferral of new extended warranty revenue | 33,686 | |||
Recognition of extended warranty deferred revenue | (41,674 | ) | ||
Balance at December 31, 2022 | $ | 56,180 | ||
Accounts Receivable and Allowance for Doubtful Accounts
Trade accounts receivable are recorded at the invoiced amount and do not bear interest. Teradyne maintains allowances for doubtful accounts for estimated losses resulting from the inability of its customers to make required payments. Estimated allowances for doubtful accountscredit losses are reviewed periodically taking into account the customer’s recent payment history, the customer’s current financial statements and other information regarding the customer’s credit worthiness.creditworthiness. Account balances are written off against the allowance when it is determined the receivable will not be recovered.
Teradyne sells certain trade accounts receivables on a non-recourse basis to third-party financial institutions pursuant to factoring agreements. Teradyne accounts for these transactions as sales of receivables and presents cash proceeds as a cash provided by operating activities in the consolidated statements of cash flows. Total trade accounts receivable sold under the factoring agreements were $93.9$243.5 million and $111.3$93.9 million during 20222023 and 2021,2022, respectively. Factoring fees for the sales of receivables are recorded in interest expense and are not material.
47
Table of Contents
Inventories
Inventories are stated at the lower of cost (first-in, first-out basis) or net realizable value. On a quarterly basis, Teradyne uses consistent methodologies to evaluate all inventories for net realizable value. Teradyne records a provision for both excess and obsolete inventory when such write-downs or write-offs are identified through the quarterly review process. The inventory valuation is based upon assumptions about future demand, product mix and possible alternative uses.
Investments
Teradyne accounts for its investments in debt and equity securities in accordance with the provisions of ASC 320-10, “
Teradyne uses the market and income approach techniques to value its financial instruments and there were no changes in valuation techniques during the twelve months ended December 31, 20222023 and 2021.
Teradyne measures its debt and equity investments at fair value, in accordance with ASC 820-10, , “
Level 1: Quoted prices in active markets for identical assets as of the reporting date;
Level 2: Inputs other than Level 1, that are observable either directly or indirectly as of the reporting date. For example, a common approach for valuing fixed income securities is the use of matrix pricing. Matrix pricing is a mathematical technique used to value securities by relying on the securities’ relationship to other benchmark quoted prices, and is considered a Level 2 input; or
Level 3: Unobservable inputs that are not supported by market data. Unobservable inputs are developed based on the best information available, which might include Teradyne’s own data.
Teradyne’s debt investments are classified as Level 2, and equity investments are classified as Level 1. Acquisition-related contingent consideration is classified as Level 3. Teradyne determines the fair value of acquisition-related contingent consideration using a Monte Carlo simulation model. Assumptions utilized in the model include forecasted revenues, revenue volatility, earnings before interest and taxes, and discount rate.
Financial Assets and Financial Liabilities
Teradyne records changes in fair value of equity securities directly in earnings and realizedunrealized gains and losses in other (income) expense, net, in accordance with ASU 2016-01, “
48
Table of Contents
Prepayments
Prepayments consist of the following:
|
| 2023 (1) |
|
| 2022 |
| ||
|
| (in thousands) |
| |||||
Contract manufacturer and supplier prepayments |
| $ | 502,257 |
|
| $ | 491,105 |
|
Prepaid maintenance and other services |
|
| 17,592 |
|
|
| 14,545 |
|
Prepaid taxes |
|
| 16,083 |
|
|
| 18,625 |
|
Other prepayments |
|
| 13,038 |
|
|
| 8,687 |
|
Total prepayments |
| $ | 548,970 |
|
| $ | 532,962 |
|
2022 | 2021 | |||||||
(in thousands) | ||||||||
Contract manufacturer and supplier prepayments | $ | 491,105 | $ | 364,478 | ||||
Prepaid taxes | 18,625 | 15,090 | ||||||
Prepaid maintenance and other services | 14,545 | 13,660 | ||||||
Other prepayments | 8,687 | 13,038 | ||||||
Total prepayments | $ | 532,962 | $ | 406,266 | ||||
Retirement and Postretirement Plans
Teradyne recognizes net actuarial gains and losses and the change in the fair value of the plan assets in its operating results in the year in which they occur or upon any interim remeasurement of the plans. Teradyne calculates the expected return on plan assets using the fair value of the plan assets. Actuarial gains and losses are generally measured annually as of December 31 and, accordingly, recorded during the fourth quarter of each year or upon any interim remeasurement of the plans.
Teradyne reports net periodic pension cost and net periodic postretirement benefit costs in accordance with ASU 2017-07, “
Goodwill, Intangible and Long-Lived Assets
Teradyne accounts for goodwill and intangible assets in accordance with ASC 350-10, “
In accordance with ASC 350-10, Teradyne has the option to perform a qualitative assessment to determine whether it is more likely than not that the fair value of a reporting unit is less than its carrying amount. If Teradyne determines this is the case, Teradyne is required to perform a quantitative goodwill impairment test to identify potential goodwill impairment and measure the amount of goodwill impairment loss to be recognized. If Teradyne determines that it is more likely than not that the fair value of the reporting unit is greater than its carrying amounts, a quantitative goodwill impairment test is not required.
In accordance with ASC 360-10, “
Business Combination
Teradyne recognizes the tangible and intangible assets acquired and liabilities assumed based on their estimated fair values at the date of acquisition. The fair value of identifiable intangible assets is based on detailed cash flows valuations that use information and assumptions provided by management. Teradyne estimates the fair value of contingent consideration at the time of the acquisition using all pertinent information known to us at the time to assess the probability of payment of contingent amounts or through the use of a Monte Carlo simulation model. Teradyne allocates any excess purchase price over the fair value of the net tangible and intangible assets acquired and liabilities assumed to goodwill. The assumptions used in the valuations for our acquisitions may differ materially from actual results depending on performance of the acquired businesses and other factors. While Teradyne believes the assumptions used were appropriate, different assumptions in the valuation of assets acquired and liabilities assumed could have a material impact on the timing and extent of impact on our statements of operations. Goodwill is assigned to reporting units as of the date of the related acquisition.
49
Property, Plant and Equipment
Property, plant and equipment are stated at cost and depreciated over the estimated useful lives of the assets. Leasehold improvements and major renewals are capitalized and included in property, plant and equipment accounts, while expenditures for maintenance and repairs and minor renewals are charged to expense. When assets are retired, the assets and related accumulated depreciation are removed from the accounts and any resulting gain or loss is reflected in the consolidated statements of operations.
Teradyne provides for depreciation of its assets principally on the straight-line method with the cost of the assets being charged to expense over their useful lives as follows:
Buildings | 40 years | |
Building improvements | 5 to 10 years | |
Leasehold improvements | Lesser of lease term or | |
Furniture and fixtures | 10 years | |
Test systems manufactured internally | 6 years | |
Machinery, equipment and software | 3 to 5 years |
Test systems manufactured internally are used by Teradyne for customer evaluations and manufacturing and support of its customers. Teradyne depreciates the test systems manufactured internally over a six-year life to cost of revenues, engineering and development, and selling and administrative expenses. Teradyne often sells internally manufactured test equipment to customers. Upon the sale of an internally manufactured test system, the net book value of the system is transferred to inventory and expensed as cost of revenues. The net book value of internally manufactured test systems sold in the years ended December 31, 2023, 2022, and 2021 and 2020 was $6.6$2.8 million, $16.6$6.6 million, and $7.3$16.6 million, respectively.
Convertible Debt
Teradyne adopted Accounting Standards Update (“ASU”) ASU 2020-06 – “Debt—Debt with Conversion and Other Options and Derivatives and Hedging—Contracts in Entity’s Own Equity,” on January 1, 2022 using the modified retrospective method of adoption. As a result of adoption, Teradyne recorded an increase of $1.4$1.4 million to current debt for unsettled shares, an increase of $1.8$1.8 million to deferred tax assets, an increase of $6.6$6.6 million to long-term debt for unamortized debt discount, and an increase to retained earnings of $94.6$94.6 million for the reclassification of the equity component. Mezzanine equity representing unsettled shares value was reduced to zero and additional paid-in capital was reduced by $100.8$100.8 million. In accordance with ASU 2020-06, Teradyne accounts for a convertible debt instrument as a single liability measured at its amortized cost, as long as no other features require bifurcation and recognition as derivatives. Unsettled shares are recorded in current debt, and there is no recognition of a debt discount, which was previously amortized to interest expense. Settled shares reduce the outstanding debt balance in an amount equal to the cash paid, but do not result in any gain or loss on extinguishment. We use the if-converted method in the diluted EPS calculation for convertible instruments.
Leases
Under ASC 842, a contract is or contains a lease when Teradyne has the right to control the use of an identified asset. Teradyne determines if an arrangement is a lease at inception of the contract, which is the date on which the terms of the contract are agreed to and the agreement creates enforceable rights and obligations. The commencement date of the lease is the date that the lessor makes an underlying asset available for use by Teradyne. As of December 31, 2022,2023, Teradyne does not have material leases that have not yet commenced.
Teradyne determines if the lease is an operating or finance lease at the lease commencement date based upon the terms of the lease and the nature of the asset. The lease term used to calculate the lease liability includes options to extend or terminate the lease when it is reasonably certain that the option will be exercised.
The lease liability is measured at the present value of future lease payments, discounted using the discount rate for the lease at the commencement date. As Teradyne is typically unable to determine the implicit rate, Teradyne uses an incremental borrowing rate based on the lease term and economic environment at commencement date. Teradyne initially measures payments based on an index by using the applicable rate at lease commencement. Variable payments that do not depend on an index are not included in the lease liability and are recognized as they are incurred. The right-of-use (“ROU”) asset is initially measured as the amount of lease liability, adjusted for any initial lease costs, prepaid lease payments, and reduced by any lease incentives.
50
Teradyne’s contracts often include non-lease components such as common area maintenance. Teradyne elected the practical expedient to account for the lease and non-lease components as a single lease component. For leases with a term of one year or less, Teradyne has elected not to record the lease asset or liability. The lease payments are recognized in the consolidated statement of earnings on a straight-line basis over the lease term. Teradyne includes lease costs within cost of revenues and operating expenses. See Note I: “Leases.”
Engineering and Development Costs
Teradyne’s products are highly technical in nature and require a large and continuing engineering and development effort. Software development costs incurred prior to the establishment of technological feasibility are charged to expense. Software development costs incurred subsequent to the establishment of technological feasibility are capitalized until the product is available for release to customers. To date, the period between achieving technological feasibility and general availability of the product has been short and software development costs eligible for capitalization have not been material. Engineering and development costs are expensed as incurred and consist primarily of salaries, contractor fees including non-recurring engineering charges related to product design, allocated facility costs, depreciation, and tooling costs.
Stock Compensation Plans and Employee Stock Purchase Plan
Stock-based compensation expense is based on the grant-date fair value estimated in accordance with the provisions of ASC 718-10, “
Excess tax benefits or tax deficiencies are recognized as a discrete tax benefit or discrete tax expense to the current income tax provision in Teradyne’s consolidated statements of operations, all excess tax benefits related to share-based payments are reported as cash flows from operating activities, and all cash payments made to taxing authorities on the employees’ behalf for withheld shares are presented as financing activities on the statement of cash flows.
Income Taxes
Deferred tax assets and liabilities are determined based on differences between financial reporting and tax basis of assets and liabilities and are measured using the enacted tax rates and laws that will be in effect when the differences are expected to reverse. The measurement of deferred tax assets is reduced by a valuation allowance if it is more likely than not that some or all of the deferred tax assets will not be realized. Teradyne performed the required assessment of positive and negative evidence regarding the realization of the net deferred tax assets in accordance with ASC 740,
Advertising Costs
Teradyne expenses all advertising costs as incurred. Advertising costs were $17.3$15.5 million, $13.4$17.3 million and $12.8$13.4 million in 2023, 2022 and 2021, and 2020, respectively.
Translation of Non-U.S. Currencies
The functional currency for all non-U.S. subsidiaries is the U.S. dollar, except for Universal Robots, MiR and Lemsys for which the local currency is its functional currency. All foreign currency denominated monetary
Net foreign exchange gains and losses resulting from remeasurement are included in other (income) expense, net. For the years ended December 31, 2023, 2022 2021 and 2020,2021, losses (gains) from the remeasurement of the monetary assets and liabilities denominated in foreign currencies were $10.8$10.9 million, $(2.1)$10.8 million, and $2.6$(2.1) million, respectively.
51
These amounts do not reflect the corresponding (gains) losses from foreign exchange contracts. See Note H: “Financial Instruments” regarding foreign exchange contracts.
Net Income per Common Share
Basic net income per common share is calculated by dividing net income by the weighted average number of common shares outstanding during the period. Except where the result would be anti-dilutive, diluted net income per common share is calculated by dividing net income by the sum of the weighted average number of common shares plus common stock equivalents, if applicable.
With respect to its convertible debt issued in 2016, Teradyne is required to settle the principal of the convertible debt in cash; accordingly, the principal amount is excluded from the determination of diluted earnings per share. As a result, Teradyne is accounting for the conversion spread using the treasury stock method.
Comprehensive Income
Comprehensive income includes net income, unrealized pension and postretirement prior service costs and benefits, unrealized gains and losses on investments in debt marketable securities, unrealized gains and losses on cash flow hedge and foreign currency translation adjustment.
In November 2023, the year endedFinancial Accounting Standards Board ("FASB") issued Accounting Standard Update ("ASU") No. 2023-07, "Segment Reporting (Topic 280): Improvements to Reportable Segment Disclosures", which will require us to disclose significant segment expenses and other segment items used by the Chief Operating Decision Maker ("CODM") on an annual and interim basis as well as provide in interim periods all disclosures about a reportable segment’s profit or loss and assets that are currently required annually. Additionally, we will be required to disclose the title and position of the CODM. The new standard is effective for fiscal years beginning after December 31, 2022, there were15, 2023, and interim periods within fiscal years beginning after December 15, 2024, with early adoption permitted. This ASU will have no recently issued accounting pronouncements that had,impact on Teradyne’s results of operations, cash flows or are expectedfinancial condition. Upon adoption, Teradyne will apply the amendments in this ASU retrospectively to have, a material impact to our consolidatedall prior period disclosures presented in the financial statements.
In December 2023, FASB issued ASU 2023-09 –“Income Taxes (Topic 740): Improvements to Income Tax Disclosures”, which requires expanded disclosures relating to the tax rate reconciliation, income taxes paid, income (loss) before income tax expense (benefit) and income tax expense (benefit), requiring a greater disaggregation of information for each. The provisions of ASU 2023-09 are effective for fiscal years beginning after December 15, 2024. The amendments in MachineMetrics, Inc. (“MachineMetrics”), a private company that develops and sells products to improve manufacturing performance through automated machine data collection, alerting, and analytics. Teradyne’s investment in MachineMetrics aligns with its strategy of providing and investing in leading edge products for automating industrial production processes in growing markets. The investment was recorded at cost and is evaluated for impairment or an indication of changes in fair value resulting from observable price changes in orderly transactions for the identical or similar investment of the same issuerthis update should be applied on a quarterly basis. At December 31, 2022,prospective basis, but retrospective application is permitted. Teradyne is currently evaluating the valueimpact of the investment was $12.0 million, and there was no change during the year ended December 31, 2022.
52
D. REVENUE
Disaggregation of Revenue
The following table provides information about disaggregated revenue by timing of revenue recognition, primary geographical market, and major product lines.
|
| Semiconductor |
|
|
|
|
| Robotics |
|
|
|
|
|
|
|
| ||||||||||||||||
|
| System-on-a-chip |
|
| Memory |
|
| System |
|
| Universal Robots |
|
| Mobile Industrial Robots |
|
| Wireless |
|
| Corporate |
|
| Total |
| ||||||||
| (in thousands) |
| ||||||||||||||||||||||||||||||
For the Year Ended December 31, 2023 (1) |
|
|
|
|
|
|
|
|
|
|
|
|
|
|
|
|
|
|
|
|
|
|
|
| ||||||||
Timing of Revenue Recognition |
|
|
|
|
|
|
|
|
|
|
|
|
|
|
|
|
|
|
|
|
|
|
|
| ||||||||
Point in Time |
| $ | 1,141,882 |
|
| $ | 356,417 |
|
| $ | 268,379 |
|
| $ | 296,252 |
|
| $ | 66,986 |
|
| $ | 129,399 |
|
| $ | — |
|
| $ | 2,259,315 |
|
Over Time |
|
| 290,739 |
|
|
| 29,598 |
|
|
| 69,818 |
|
|
| 7,540 |
|
|
| 4,405 |
|
|
| 14,883 |
|
|
| — |
|
|
| 416,983 |
|
Total |
| $ | 1,432,621 |
|
| $ | 386,015 |
|
| $ | 338,197 |
|
| $ | 303,792 |
|
| $ | 71,391 |
|
| $ | 144,282 |
|
| $ | — |
|
| $ | 2,676,298 |
|
Geographical Market |
|
|
|
|
|
|
|
|
|
|
|
|
|
|
|
|
|
|
|
|
|
|
|
| ||||||||
Asia Pacific |
| $ | 1,214,322 |
|
| $ | 366,151 |
|
| $ | 153,387 |
|
| $ | 63,312 |
|
| $ | 10,424 |
|
| $ | 85,415 |
|
| $ | — |
|
| $ | 1,893,011 |
|
Americas |
|
| 117,728 |
|
|
| 11,367 |
|
|
| 151,579 |
|
|
| 111,761 |
|
|
| 36,191 |
|
|
| 50,770 |
|
|
| — |
|
|
| 479,396 |
|
Europe, Middle East and Africa |
|
| 100,571 |
|
|
| 8,497 |
|
|
| 33,231 |
|
|
| 128,719 |
|
|
| 24,776 |
|
|
| 8,097 |
|
|
| — |
|
|
| 303,891 |
|
Total |
| $ | 1,432,621 |
|
| $ | 386,015 |
|
| $ | 338,197 |
|
| $ | 303,792 |
|
| $ | 71,391 |
|
| $ | 144,282 |
|
| $ | — |
|
| $ | 2,676,298 |
|
For the Year Ended December 31, 2022 (1) |
|
|
|
|
|
|
|
|
|
|
|
|
|
|
|
|
|
|
|
|
|
|
|
| ||||||||
Timing of Revenue Recognition |
|
|
|
|
|
|
|
|
|
|
|
|
|
|
|
|
|
|
|
|
|
|
|
| ||||||||
Point in Time |
| $ | 1,445,238 |
|
| $ | 344,693 |
|
| $ | 402,074 |
|
| $ | 317,514 |
|
| $ | 73,812 |
|
| $ | 189,040 |
|
| $ | 251 |
|
| $ | 2,772,622 |
|
Over Time |
|
| 261,646 |
|
|
| 29,013 |
|
|
| 67,272 |
|
|
| 8,218 |
|
|
| 3,594 |
|
|
| 12,680 |
|
|
| — |
|
|
| 382,423 |
|
Total |
| $ | 1,706,884 |
|
| $ | 373,706 |
|
| $ | 469,346 |
|
| $ | 325,732 |
|
| $ | 77,406 |
|
| $ | 201,720 |
|
| $ | 251 |
|
| $ | 3,155,045 |
|
Geographical Market |
|
|
|
|
|
|
|
|
|
|
|
|
|
|
|
|
|
|
|
|
|
|
|
| ||||||||
Asia Pacific |
| $ | 1,514,964 |
|
| $ | 360,176 |
|
| $ | 294,350 |
|
| $ | 73,930 |
|
| $ | 15,724 |
|
| $ | 140,767 |
|
| $ | — |
|
| $ | 2,399,911 |
|
Americas |
|
| 122,575 |
|
|
| 11,987 |
|
|
| 146,040 |
|
|
| 112,203 |
|
|
| 35,213 |
|
|
| 47,350 |
|
|
| 251 |
|
|
| 475,619 |
|
Europe, Middle East and Africa |
|
| 69,345 |
|
|
| 1,543 |
|
|
| 28,956 |
|
|
| 139,599 |
|
|
| 26,469 |
|
|
| 13,603 |
|
|
| — |
|
|
| 279,515 |
|
Total |
| $ | 1,706,884 |
|
| $ | 373,706 |
|
| $ | 469,346 |
|
| $ | 325,732 |
|
| $ | 77,406 |
|
| $ | 201,720 |
|
| $ | 251 |
|
| $ | 3,155,045 |
|
For the Year Ended December 31, 2021 (1) |
|
|
|
|
|
|
|
|
|
|
|
|
|
|
|
|
|
|
|
|
|
|
|
| ||||||||
Timing of Revenue Recognition |
|
|
|
|
|
|
|
|
|
|
|
|
|
|
|
|
|
|
|
|
|
|
|
| ||||||||
Point in Time |
| $ | 1,989,979 |
|
| $ | 365,441 |
|
| $ | 409,383 |
|
| $ | 305,512 |
|
| $ | 60,884 |
|
| $ | 204,247 |
|
| $ | — |
|
| $ | 3,335,446 |
|
Over Time |
|
| 256,751 |
|
|
| 30,171 |
|
|
| 58,356 |
|
|
| 5,670 |
|
|
| 3,839 |
|
|
| 12,648 |
|
|
| — |
|
|
| 367,435 |
|
Total |
| $ | 2,246,730 |
|
| $ | 395,612 |
|
| $ | 467,739 |
|
| $ | 311,182 |
|
| $ | 64,723 |
|
| $ | 216,895 |
|
| $ | — |
|
| $ | 3,702,881 |
|
Geographical Market |
|
|
|
|
|
|
|
|
|
|
|
|
|
|
|
|
|
|
|
|
|
|
|
| ||||||||
Asia Pacific |
| $ | 2,076,647 |
|
| $ | 381,444 |
|
| $ | 306,812 |
|
| $ | 81,456 |
|
| $ | 12,919 |
|
| $ | 172,103 |
|
| $ | — |
|
| $ | 3,031,381 |
|
Americas |
|
| 102,702 |
|
|
| 10,665 |
|
|
| 135,230 |
|
|
| 94,897 |
|
|
| 26,069 |
|
|
| 36,173 |
|
|
| — |
|
|
| 405,736 |
|
Europe, Middle East and Africa |
|
| 67,381 |
|
|
| 3,503 |
|
|
| 25,697 |
|
|
| 134,829 |
|
|
| 25,735 |
|
|
| 8,619 |
|
|
| — |
|
|
| 265,764 |
|
Total |
| $ | 2,246,730 |
|
| $ | 395,612 |
|
| $ | 467,739 |
|
| $ | 311,182 |
|
| $ | 64,723 |
|
| $ | 216,895 |
|
| $ | — |
|
| $ | 3,702,881 |
|
Semiconductor Test | Robotics | |||||||||||||||||||||||||||||||
System-on- a-chip | Memory | System Test | Universal Robots | Mobile Industrial Robots | Wireless Test | Corporate and Eliminations | Total | |||||||||||||||||||||||||
(in thousands) | ||||||||||||||||||||||||||||||||
For the Year Ended December 31, 2022 (1) | ||||||||||||||||||||||||||||||||
Timing of Revenue Recognition | ||||||||||||||||||||||||||||||||
Point in Time | $ | 1,445,238 | $ | 344,693 | $ | 402,074 | $ | 317,514 | $ | 73,812 | $ | 189,040 | $ | 251 | $ | 2,772,622 | ||||||||||||||||
Over Time | 261,646 | 29,013 | 67,272 | 8,218 | 3,594 | 12,680 | — | 382,423 | ||||||||||||||||||||||||
Total | $ | 1,706,884 | $ | 373,706 | $ | 469,346 | $ | 325,732 | $ | 77,406 | $ | 201,720 | $ | 251 | $ | 3,155,045 | ||||||||||||||||
Geographical Market | ||||||||||||||||||||||||||||||||
Asia Pacific | $ | 1,514,964 | $ | 360,176 | $ | 294,350 | $ | 73,930 | $ | 15,724 | $ | 140,767 | $ | — | $ | 2,399,911 | ||||||||||||||||
Americas | 122,575 | 11,987 | 146,040 | 112,203 | 35,213 | 47,350 | 251 | 475,619 | ||||||||||||||||||||||||
Europe, Middle East and Africa | 69,345 | 1,543 | 28,956 | 139,599 | 26,469 | 13,603 | — | 279,515 | ||||||||||||||||||||||||
Total | $ | 1,706,884 | $ | 373,706 | $ | 469,346 | $ | 325,732 | $ | 77,406 | $ | 201,720 | $ | 251 | $ | 3,155,045 | ||||||||||||||||
For the Year Ended December 31, 2021 (1) | ||||||||||||||||||||||||||||||||
Timing of Revenue Recognition | ||||||||||||||||||||||||||||||||
Point in Time | $ | 1,989,979 | $ | 365,441 | $ | 409,383 | $ | 305,512 | $ | 60,884 | $ | 204,247 | $ | — | $ | 3,335,446 | ||||||||||||||||
Over Time | 256,751 | 30,171 | 58,356 | 5,670 | 3,839 | 12,648 | — | 367,435 | ||||||||||||||||||||||||
Total | $ | 2,246,730 | $ | 395,612 | $ | 467,739 | $ | 311,182 | $ | 64,723 | $ | 216,895 | $ | — | $ | 3,702,881 | ||||||||||||||||
Geographical Market | ||||||||||||||||||||||||||||||||
Asia Pacific | $ | 2,076,647 | $ | 381,444 | $ | 306,812 | $ | 81,456 | $ | 12,919 | $ | 172,103 | $ | — | $ | 3,031,381 | ||||||||||||||||
Americas | 102,702 | 10,665 | 135,230 | 94,897 | 26,069 | 36,173 | — | 405,736 | ||||||||||||||||||||||||
Europe, Middle East and Africa | 67,381 | 3,503 | 25,697 | 134,829 | 25,735 | 8,619 | — | 265,764 | ||||||||||||||||||||||||
Total | $ | 2,246,730 | $ | 395,612 | $ | 467,739 | $ | 311,182 | $ | 64,723 | $ | 216,895 | $ | — | $ | 3,702,881 | ||||||||||||||||
For the Year Ended December 31, 2020 (1) | ||||||||||||||||||||||||||||||||
Timing of Revenue Recognition | ||||||||||||||||||||||||||||||||
Point in Time | $ | 1,659,414 | $ | 363,324 | $ | 348,454 | $ | 214,212 | $ | 55,533 | $ | 163,834 | $ | (604 | ) | $ | 2,804,167 | |||||||||||||||
Over Time | 217,975 | 18,884 | 61,275 | 7,269 | 2,717 | 9,182 | — | 317,302 | ||||||||||||||||||||||||
Total | $ | 1,877,389 | $ | 382,208 | $ | 409,729 | $ | 221,481 | $ | 58,250 | $ | 173,016 | $ | (604 | ) | $ | 3,121,469 | |||||||||||||||
Geographical Market | ||||||||||||||||||||||||||||||||
Asia Pacific | $ | 1,744,593 | $ | 364,000 | $ | 258,521 | $ | 60,277 | $ | 6,471 | $ | 143,969 | $ | — | $ | 2,577,831 | ||||||||||||||||
Americas | 77,671 | 12,999 | 128,482 | 64,164 | 30,186 | 22,544 | (604 | ) | 335,442 | |||||||||||||||||||||||
Europe, Middle East and Africa | 55,125 | 5,209 | 22,726 | 97,040 | 21,593 | 6,503 | — | 208,196 | ||||||||||||||||||||||||
Total | $ | 1,877,389 | $ | 382,208 | $ | 409,729 | $ | 221,481 | $ | 58,250 | $ | 173,016 | $ | (604 | ) | $ | 3,121,469 | |||||||||||||||
Contract Balances
For the years ended December 31, 2023, 2022 2021 and 2020,2021, Teradyne recognized $112.4$108.1 million, $102.5$112.4 million and $91.0$102.5 million, respectively, that was included within the deferred revenue and customer advances balances at the beginning of the period. This revenue primarily relates to undelivered hardware, extended warranties, training, application support, and post contract support. Each of these represents a distinct performance obligation. As of December 31, 2022,2023, Teradyne had $1,235.2had $1,124.6 million of unsatisfied performance obligations. Teradyne expects to recognize 89%90% of the remaining performance obligation in the next 12 months, 9% in 1-3 years, and 11%1% thereafter.
On November 7, 2023, Teradyne entered into a definitive agreement to sell Teradyne’s Device Interface Solutions ("DIS") business, a component of the Semiconductor Test segment, to Technoprobe S.p.A. for $85.0 million in 1-3 years.cash. As a result, the related assets and liabilities met the criteria and were classified as held-for-sale in Teradyne’s consolidated balance sheet as of December 31, 2023. The transaction, which does not qualify as a strategic shift required for discontinued operations treatment, is expected to close in the first half of 2024.
53
Assets held-for-sale comprise of the following as of December 31, 2023:
|
| December 31, |
| |
|
| 2023 |
| |
|
| (in thousands) |
| |
Current assets: |
|
|
| |
Inventories, net |
| $ | 17,952 |
|
Prepayments |
|
| 5,298 |
|
Total current assets held for sale |
|
| 23,250 |
|
Property, plant and equipment, net |
|
| 8,986 |
|
Operating lease right-of-use assets, net |
|
| 2,545 |
|
Total assets held for sale |
| $ | 34,781 |
|
|
|
|
| |
Current liabilities: |
|
|
| |
Accounts payable |
| $ | 6,356 |
|
Other accrued liabilities |
|
| 552 |
|
Operating lease liabilities |
|
| 471 |
|
Total current liabilities held for sale |
|
| 7,379 |
|
Long-term operating lease liabilities |
|
| 2,000 |
|
Total liabilities held for sale |
| $ | 9,379 |
|
Net assets held for sale |
| $ | 25,402 |
|
Inventories, net consisted of the following at December 31, 20222023 and 2021:2022:
|
| 2023 (1) |
|
| 2022 |
| ||
|
| (in thousands) |
| |||||
Raw material |
| $ | 258,422 |
|
| $ | 256,065 |
|
Work-in-process |
|
| 26,851 |
|
|
| 37,982 |
|
Finished goods |
|
| 24,701 |
|
|
| 30,972 |
|
|
| $ | 309,974 |
|
| $ | 325,019 |
|
2022 | 2021 | |||||||
(in thousands) | ||||||||
Raw material | $ | 256,065 | $ | 155,641 | ||||
Work-in-process | 37,982 | 37,740 | ||||||
Finished goods | 30,972 | 49,949 | ||||||
| $ | 325,019 | $ | 243,330 | |||||
Property, plant and equipment, net consisted of the following at December 31, 20222023 and 2021:2022:
|
| 2023 (1) |
|
| 2022 |
| ||
|
| (in thousands) |
| |||||
Land |
| $ | 19,487 |
|
| $ | 18,481 |
|
Buildings |
|
| 127,705 |
|
|
| 128,991 |
|
Machinery, equipment and software |
|
| 1,047,235 |
|
|
| 1,059,880 |
|
Furniture and fixtures |
|
| 28,093 |
|
|
| 29,929 |
|
Leasehold improvements |
|
| 66,777 |
|
|
| 64,631 |
|
Construction in progress |
|
| 54,799 |
|
|
| 22,470 |
|
|
| 1,344,096 |
|
|
| 1,324,382 |
| |
Less: accumulated depreciation |
|
| 898,604 |
|
|
| 905,699 |
|
| $ | 445,492 |
|
| $ | 418,683 |
| |
2022 | 2021 | |||||||
(in thousands) | ||||||||
Land | $ | 18,481 | $ | 17,207 | ||||
Buildings | 128,991 | 126,468 | ||||||
Machinery, equipment and software | 1,059,880 | 994,828 | ||||||
Furniture and fixtures | 29,929 | 28,743 | ||||||
Leasehold improvements | 64,631 | 64,110 | ||||||
Construction in progress | 22,470 | 8,105 | ||||||
| 1,324,382 | 1,239,461 | |||||||
Less: accumulated depreciation | 905,699 | 852,221 | ||||||
| $ | 418,683 | $ | 387,240 | |||||
Depreciation of property, plant and equipment for the years ended December 31, 2023, 2022, and 2021 and 2020 was $90.8$92.1 million, $91.1$90.8 million, and $80.1$91.1 million, respectively. As of December 31, 20222023 and 2021,2022, the gross book value included in machinery and equipment for internally manufactured test systems being leased by customers was $5.8$5.1 million and $13.4$5.8 million, respectively. As of December 31, 20222023 and 2021,2022, the accumulated depreciation on these test systems was $5.6$4.9 million and $8.7$5.6 million, respectively.
54
Cash Equivalents
Teradyne considers all highly liquid investments with maturities of three months or less at the date of acquisition to be cash equivalents.
Marketable Securities
Teradyne’s equity and debt mutual funds are classified as Level 1 and available-for-sale debt securities are classified as Level 2. Contingent consideration is classified as Level 3. The vast majority of Level 2 securities are fixed income securities priced by third party pricing vendors. These pricing vendors utilize the most recent observable market information in pricing these securities or, if specific prices are not available, use other observable inputs like market transactions involving identical or comparable securities.
During the years ended December 31, 20222023 and 2021,2022, there were no transfers in or out of Level 1, Level 2, or Level 3 financial instruments.
Realized gains recorded in 2023, 2022, and 2021 and 2020 were $0.8$0.6 million, $3.1$0.8 million, and $4.6$3.1 million, respectively. Realized losses recorded in 2023 and 2022 and 2020 were $1.0$0.3 million and $0.3$1.0 million, respectively. No realized losses were recorded in 2021. Realized gains and losses are included in other (income) expense, net.
Unrealized gains on equity securities recorded during the years ended December 31, 2023, 2022 and 2021 and 2020 we
The cost of securities sold is based on average cost.
55
The following table sets forth by fair value hierarchy Teradyne’s financial assets and liabilities that were measured at fair value on a recurring basis as of December 31, 20222023 and 2021:2022:
December 31, 2022 |
| December 31, 2023 |
| |||||||||||||||||||||||||||||
Quoted Prices in Active Markets for Identical Instruments (Level 1) | Significant Other Observable Inputs (Level 2) | Significant Unobservable Inputs (Level 3) | Total |
| Quoted Prices |
|
| Significant |
|
| Significant |
|
| Total |
| |||||||||||||||||
(in thousands) |
| (in thousands) |
| |||||||||||||||||||||||||||||
Assets |
|
|
|
|
|
|
|
|
|
|
|
| ||||||||||||||||||||
Cash | $ | 632,417 | $ | — | $ | — | $ | 632,417 |
| $ | 298,156 |
|
| $ | — |
|
| $ | — |
|
| $ | 298,156 |
| ||||||||
Cash equivalents | 161,767 | 60,589 | — | 222,356 |
|
| 453,298 |
|
|
| 6,117 |
|
|
| — |
|
|
| 459,415 |
| ||||||||||||
Available for sale securities: |
|
|
|
|
|
|
|
|
|
|
|
| ||||||||||||||||||||
Corporate debt securities | — | 50,856 | — | 50,856 |
|
| — |
|
|
| 52,734 |
|
|
| — |
|
|
| 52,734 |
| ||||||||||||
U.S. Treasury securities | — | 39,649 | — | 39,649 |
|
| — |
|
|
| 41,808 |
|
|
| — |
|
|
| 41,808 |
| ||||||||||||
Commercial paper | — | 7,159 | — | 7,159 |
|
| — |
|
|
| 1,667 |
|
|
| — |
|
|
| 1,667 |
| ||||||||||||
Debt mutual funds | 6,580 | — | — | 6,580 |
|
| 8,773 |
|
|
| — |
|
|
| — |
|
|
| 8,773 |
| ||||||||||||
U.S. government agency securities | — | 6,352 | — | 6,352 |
|
| — |
|
|
| 4,892 |
|
|
| — |
|
|
| 4,892 |
| ||||||||||||
Certificates of deposit and time deposits | — | 1,740 | — | 1,740 |
|
| — |
|
|
| 21,772 |
|
|
| — |
|
|
| 21,772 |
| ||||||||||||
Non-U.S. government securities | — | 535 | — | 535 |
|
| — |
|
|
| 810 |
|
|
| — |
|
|
| 810 |
| ||||||||||||
Equity securities: |
|
|
|
|
|
|
|
|
|
|
|
| ||||||||||||||||||||
Mutual funds | 37,518 | — | — | 37,518 |
|
| 47,132 |
|
|
| — |
|
|
| — |
|
|
| 47,132 |
| ||||||||||||
Total | $ | 838,282 | $ | 166,880 | $ | — | $ | 1,005,162 |
| $ | 807,359 |
|
| $ | 129,800 |
|
| $ | — |
|
| $ | 937,159 |
| ||||||||
Derivative assets | — | 86 | — | 86 |
|
| — |
|
|
| 18,746 |
|
|
| — |
|
|
| 18,746 |
| ||||||||||||
Total | $ | 838,282 | $ | 166,966 | $ | — | $ | 1,005,248 |
| $ | 807,359 |
|
| $ | 148,546 |
|
| $ | — |
|
| $ | 955,905 |
| ||||||||
Liabilities |
|
|
|
|
|
|
|
|
|
|
|
| ||||||||||||||||||||
Derivative liabilities | — | 4,215 | — | 4,215 |
|
| — |
|
|
| 2,545 |
|
|
| — |
|
|
| 2,545 |
| ||||||||||||
Total | $ | — | $ | 4,215 | $ | — | $ | 4,215 |
| $ | — |
|
| $ | 2,545 |
|
| $ | — |
|
| $ | 2,545 |
| ||||||||
|
|
|
|
|
|
|
|
|
|
|
| |||||||||||||||||||||
Reported as follows: |
|
|
|
|
|
|
|
|
|
|
|
| ||||||||||||||||||||
(Level 1) | (Level 2) | (Level 3) | Total |
| (Level 1) |
|
| (Level 2) |
|
| (Level 3) |
|
| Total |
| |||||||||||||||||
(in thousands) |
| (in thousands) |
| |||||||||||||||||||||||||||||
Assets |
|
|
|
|
|
|
|
|
|
|
|
| ||||||||||||||||||||
Cash and cash equivalents | $ | 794,184 | $ | 60,589 | $ | — | $ | 854,773 |
| $ | 751,454 |
|
| $ | 6,117 |
|
| $ | — |
|
| $ | 757,571 |
| ||||||||
Marketable securities | — | 39,612 | — | 39,612 |
|
| — |
|
|
| 62,154 |
|
|
| — |
|
|
| 62,154 |
| ||||||||||||
Long-term marketable securities | 44,098 | 66,679 | — | 110,777 |
|
| 55,905 |
|
|
| 61,529 |
|
|
| — |
|
|
| 117,434 |
| ||||||||||||
Prepayments | — | 86 | — | 86 | ||||||||||||||||||||||||||||
Other current assets |
|
| — |
|
|
| 18,746 |
|
|
| — |
|
|
| 18,746 |
| ||||||||||||||||
Total | $ | 838,282 | $ | 166,966 | $ | — | $ | 1,005,248 |
| $ | 807,359 |
|
| $ | 148,546 |
|
| $ | — |
|
| $ | 955,905 |
| ||||||||
Liabilities |
|
|
|
|
|
|
|
|
|
|
|
| ||||||||||||||||||||
Other current liabilities | $ | — | $ | 4,215 | $ | — | $ | 4,215 |
| $ | — |
|
| $ | 2,545 |
|
| $ | — |
|
| $ | 2,545 |
| ||||||||
Total | $ | — | $ | 4,215 | $ | — | $ | 4,215 |
| $ | — |
|
| $ | 2,545 |
|
| $ | — |
|
| $ | 2,545 |
| ||||||||
56
December 31, 2021 | ||||||||||||||||
Quoted Prices in Active Markets for Identical Instruments (Level 1) | Significant Other Observable Inputs (Level 2) | Significant Unobservable Inputs (Level 3) | Total | |||||||||||||
(in thousands) | ||||||||||||||||
Assets | ||||||||||||||||
Cash | $ | 628,740 | $ | — | $ | — | $ | 628,740 | ||||||||
Cash equivalents | 412,212 | 81,247 | — | 493,459 | ||||||||||||
Available for sale securities: | ||||||||||||||||
Commercial paper | — | 189,620 | — | 189,620 | ||||||||||||
U.S. Treasury securities | — | 77,789 | — | 77,789 | ||||||||||||
Corporate debt securities | — | 56,901 | — | 56,901 | ||||||||||||
Debt mutual funds | 7,971 | — | — | 7,971 | ||||||||||||
U.S. government agency securities | — | 4,610 | — | 4,610 | ||||||||||||
Certificates of deposit and time deposits | — | 1,356 | — | 1,356 | ||||||||||||
Non-U.S. government securities | — | 589 | — | 589 | ||||||||||||
Equity securities: | ||||||||||||||||
Mutual funds | 39,253 | — | — | 39,253 | ||||||||||||
Total | $ | 1,088,176 | $ | 412,112 | $ | — | $ | 1,500,288 | ||||||||
Derivative assets | — | 92 | — | 92 | ||||||||||||
Total | $ | 1,088,176 | $ | 412,204 | $ | — | $ | 1,500,380 | ||||||||
Liabilities | ||||||||||||||||
Derivative liabilities | — | 118 | — | 118 | ||||||||||||
Total | $ | — | $ | 118 | $ | — | $ | 118 | ||||||||
Reported as follows: | ||||||||||||||||
(Level 1) | (Level 2) | (Level 3) | Total | |||||||||||||
(in thousands) | ||||||||||||||||
Assets | ||||||||||||||||
Cash and cash equivalents | $ | 1,040,952 | $ | 81,247 | $ | — | $ | 1,122,199 | ||||||||
Marketable securities | — | 244,231 | — | 244,231 | ||||||||||||
Long-term marketable securities | 47,224 | 86,634 | — | 133,858 | ||||||||||||
Prepayments | — | 92 | — | 92 | ||||||||||||
Total | $ | 1,088,176 | $ | 412,204 | $ | — | $ | 1,500,380 | ||||||||
Liabilities | ||||||||||||||||
Other current liabilities | $ | — | $ | 118 | $ | — | $ | 118 | ||||||||
Total | $ | — | $ | 118 | $ | — | $ | 118 | ||||||||
|
| December 31, 2022 |
| |||||||||||||
|
| Quoted Prices |
|
| Significant |
|
| Significant |
|
| Total |
| ||||
|
| (in thousands) |
| |||||||||||||
Assets |
|
|
|
|
|
|
|
|
|
|
|
| ||||
Cash |
| $ | 632,417 |
|
| $ | — |
|
| $ | — |
|
| $ | 632,417 |
|
Cash equivalents |
|
| 161,767 |
|
|
| 60,589 |
|
|
| — |
|
|
| 222,356 |
|
Available for sale securities: |
|
|
|
|
|
|
|
|
|
|
|
| ||||
Corporate debt securities |
|
| — |
|
|
| 50,856 |
|
|
| — |
|
|
| 50,856 |
|
U.S. Treasury securities |
|
| — |
|
|
| 39,649 |
|
|
| — |
|
|
| 39,649 |
|
Commercial paper |
|
| — |
|
|
| 7,159 |
|
|
| — |
|
|
| 7,159 |
|
Debt mutual funds |
|
| 6,580 |
|
|
| — |
|
|
| — |
|
|
| 6,580 |
|
U.S. government agency securities |
|
| — |
|
|
| 6,352 |
|
|
| — |
|
|
| 6,352 |
|
Certificates of deposit and time deposits |
|
| — |
|
|
| 1,740 |
|
|
| — |
|
|
| 1,740 |
|
Non-U.S. government securities |
|
| — |
|
|
| 535 |
|
|
| — |
|
|
| 535 |
|
Equity securities: |
|
|
|
|
|
|
|
|
|
|
|
| ||||
Mutual funds |
|
| 37,518 |
|
|
| — |
|
|
| — |
|
|
| 37,518 |
|
Total |
| $ | 838,282 |
|
| $ | 166,880 |
|
| $ | — |
|
| $ | 1,005,162 |
|
Derivative assets |
|
| — |
|
|
| 86 |
|
|
| — |
|
|
| 86 |
|
Total |
| $ | 838,282 |
|
| $ | 166,966 |
|
| $ | — |
|
| $ | 1,005,248 |
|
Liabilities |
|
|
|
|
|
|
|
|
|
|
|
| ||||
Derivative liabilities |
|
| — |
|
|
| 4,215 |
|
|
| — |
|
|
| 4,215 |
|
Total |
| $ | — |
|
| $ | 4,215 |
|
| $ | — |
|
| $ | 4,215 |
|
|
|
|
|
|
|
|
|
|
|
|
|
| ||||
Reported as follows: |
|
|
|
|
|
|
|
|
|
|
|
| ||||
|
| (Level 1) |
|
| (Level 2) |
|
| (Level 3) |
|
| Total |
| ||||
|
| (in thousands) |
| |||||||||||||
Assets |
|
|
|
|
|
|
|
|
|
|
|
| ||||
Cash and cash equivalents |
| $ | 794,184 |
|
| $ | 60,589 |
|
| $ | — |
|
| $ | 854,773 |
|
Marketable securities |
|
| — |
|
|
| 39,612 |
|
|
| — |
|
|
| 39,612 |
|
Long-term marketable securities |
|
| 44,098 |
|
|
| 66,679 |
|
|
| — |
|
|
| 110,777 |
|
Other current assets |
|
| — |
|
|
| 86 |
|
|
| — |
|
|
| 86 |
|
Total |
| $ | 838,282 |
|
| $ | 166,966 |
|
| $ | — |
|
| $ | 1,005,248 |
|
Liabilities |
|
|
|
|
|
|
|
|
|
|
|
| ||||
Other current liabilities |
| $ | — |
|
| $ | 4,215 |
|
| $ | — |
|
| $ | 4,215 |
|
Total |
| $ | — |
|
| $ | 4,215 |
|
| $ | — |
|
| $ | 4,215 |
|
Contingent Consideration | ||||
(in thousands) | ||||
Balance at December 31, 2020 | $ | 7,227 | ||
Fair value adjustment (1) | (7,227 | ) | ||
Balance at December 31, 2021 | — | |||
Fair value adjustment | — | |||
Balance at December 31, 2022 | $ | — | ||
The carrying amounts and fair values of Teradyne’s financial instruments at December 31, 20222023 and 20212022 were as follows:
|
| December 31, 2023 |
|
| December 31, 2022 |
| ||||||||||
|
| Carrying Value |
|
| Fair Value |
|
| Carrying Value |
|
| Fair Value |
| ||||
|
| (in thousands) |
| |||||||||||||
Assets |
|
|
|
|
|
|
|
|
|
|
|
| ||||
Cash and cash equivalents |
| $ | 757,571 |
|
| $ | 757,571 |
|
| $ | 854,773 |
|
| $ | 854,773 |
|
Marketable securities |
|
| 179,588 |
|
|
| 179,588 |
|
|
| 150,389 |
|
|
| 150,389 |
|
Derivative assets |
|
| 18,746 |
|
|
| 18,746 |
|
|
| 86 |
|
|
| 86 |
|
Liabilities |
|
|
|
|
|
|
|
|
|
|
|
| ||||
Derivative liabilities |
|
| 2,545 |
|
|
| 2,545 |
|
|
| 4,215 |
|
|
| 4,215 |
|
Convertible debt (1) |
|
| — |
|
|
| — |
|
|
| 50,115 |
|
|
| 139,007 |
|
December 31, 2022 | December 31, 2021 | |||||||||||||||
Carrying Value | Fair Value | Carrying Value | Fair Value | |||||||||||||
(in thousands) | ||||||||||||||||
Assets | ||||||||||||||||
Cash and cash equivalents | $ | 854,773 | $ | 854,773 | $ | 1,122,199 | $ | 1,122,199 | ||||||||
Marketable securities | 150,389 | 150,389 | 378,089 | 378,089 | ||||||||||||
Derivative assets | 86 | 86 | 92 | 92 | ||||||||||||
Liabilities | ||||||||||||||||
Derivative liabilities | 4,215 | 4,215 | 118 | 118 | ||||||||||||
Convertible debt (1) | 50,115 | 139,007 | 108,426 | 604,648 | ||||||||||||
The fair values of accounts receivable, net and accounts payable approximate the carrying amount due to the short-term nature of these instruments.
57
The following tables summarize the composition of available-for-sale marketable securities at December 31, 20222023 and 2021:
December 31, 2022 | ||||||||||||||||||||
Available-for-Sale | ||||||||||||||||||||
Cost | Unrealized Gain | Unrealized (Loss) | Fair Market Value | Fair Market Value of Investments with Unrealized Losses | ||||||||||||||||
(in thousands) | ||||||||||||||||||||
Corporate debt securities | $ | 57,006 | $ | 3 | $ | (6,153 | ) | $ | 50,856 | $ | 50,667 | |||||||||
U.S. Treasury securities | 44,030 | — | (4,381 | ) | 39,649 | 39,649 | ||||||||||||||
Commercial paper | 7,089 | 70 | — | 7,159 | — | |||||||||||||||
Debt mutual funds | 6,997 | — | (417 | ) | 6,580 | 3,095 | ||||||||||||||
U.S. government agency securities | 6,442 | — | (90 | ) | 6,352 | 6,352 | ||||||||||||||
Certificates of deposit and time deposits | 1,740 | — | — | 1,740 | — | |||||||||||||||
Non-U.S. government securities | 535 | — | — | 535 | — | |||||||||||||||
| $ | 123,839 | $ | 73 | $ | (11,041 | ) | $ | 112,871 | $ | 99,763 | ||||||||||
|
| December 31, 2023 |
| |||||||||||||||||
|
| Available-for-Sale |
|
|
|
|
|
|
| |||||||||||
|
| Cost |
|
| Unrealized |
|
| Unrealized |
|
| Fair Market |
|
| Fair Market |
| |||||
|
| (in thousands) |
| |||||||||||||||||
Corporate debt securities |
| $ | 56,458 |
|
| $ | 201 |
|
| $ | (3,925 | ) |
| $ | 52,734 |
|
| $ | 44,263 |
|
U.S. Treasury securities |
|
| 45,725 |
|
|
| 14 |
|
|
| (3,931 | ) |
|
| 41,808 |
|
|
| 35,080 |
|
Certificates of deposit and time deposits |
|
| 21,772 |
|
|
| — |
|
|
| — |
|
|
| 21,772 |
|
|
| — |
|
Debt mutual funds |
|
| 9,081 |
|
|
| — |
|
|
| (308 | ) |
|
| 8,773 |
|
|
| 3,303 |
|
U.S. government agency securities |
|
| 4,898 |
|
|
| — |
|
|
| (6 | ) |
|
| 4,892 |
|
|
| 4,892 |
|
Commercial paper |
|
| 1,633 |
|
|
| 34 |
|
|
| — |
|
|
| 1,667 |
|
|
| — |
|
Non-U.S. government securities |
|
| 810 |
|
|
| — |
|
|
| — |
|
|
| 810 |
|
|
| — |
|
|
| $ | 140,377 |
|
| $ | 249 |
|
| $ | (8,170 | ) |
| $ | 132,456 |
|
| $ | 87,538 |
|
Reported as follows:
Cost | Unrealized Gain | Unrealized (Loss) | Fair Market Value | Fair Market Value of Investments with Unrealized Losses | ||||||||||||||||
(in thousands) | ||||||||||||||||||||
Marketable securities | $ | 39,950 | $ | 70 | $ | (408 | ) | $ | 39,612 | $ | 30,713 | |||||||||
Long-term marketable securities | 83,889 | 3 | (10,633 | ) | 73,259 | 69,050 | ||||||||||||||
| $ | 123,839 | $ | 73 | $ | (11,041 | ) | $ | 112,871 | $ | 99,763 | ||||||||||
December 31, 2021 | ||||||||||||||||||||
Available-for-Sale | ||||||||||||||||||||
Cost | Unrealized Gain | Unrealized (Loss) | Fair Market Value | Fair Market Value of Investments with Unrealized Losses | ||||||||||||||||
(in thousands) | ||||||||||||||||||||
Commercial paper | $ | 189,614 | $ | 15 | $ | (9 | ) | $ | 189,620 | $ | 22,784 | |||||||||
U.S. Treasury securities | 77,707 | 551 | (470 | ) | 77,789 | 46,435 | ||||||||||||||
Corporate debt securities | 52,266 | 4,863 | (227 | ) | 56,901 | 19,422 | ||||||||||||||
Debt mutual funds | 7,928 | 43 | — | 7,971 | — | |||||||||||||||
U.S. government agency securities | 4,617 | 5 | (12 | ) | 4,610 | 3,296 | ||||||||||||||
Certificates of deposit and time deposits | 1,356 | — | — | 1,356 | — | |||||||||||||||
Non-U.S. government securities | 589 | — | — | 589 | — | |||||||||||||||
| $ | 334,077 | $ | 5,477 | $ | (718 | ) | $ | 338,836 | $ | 91,937 | ||||||||||
|
| Cost |
|
| Unrealized |
|
| Unrealized |
|
| Fair Market |
|
| Fair Market |
| |||||
|
| (in thousands) |
| |||||||||||||||||
Marketable securities |
| $ | 62,385 |
|
| $ | 36 |
|
| $ | (267 | ) |
| $ | 62,154 |
|
| $ | 34,844 |
|
Long-term marketable securities |
|
| 77,992 |
|
|
| 213 |
|
|
| (7,903 | ) |
| $ | 70,302 |
|
|
| 52,694 |
|
| $ | 140,377 |
|
| $ | 249 |
|
| $ | (8,170 | ) |
| $ | 132,456 |
|
| $ | 87,538 |
| |
|
| December 31, 2022 |
| |||||||||||||||||
|
|
|
|
| Available-for-Sale |
|
|
|
|
|
|
| ||||||||
|
| Cost |
|
| Unrealized |
|
| Unrealized |
|
| Fair Market |
|
| Fair Market |
| |||||
|
| (in thousands) |
| |||||||||||||||||
Corporate debt securities |
| $ | 57,006 |
|
| $ | 3 |
|
| $ | (6,153 | ) |
| $ | 50,856 |
|
| $ | 50,667 |
|
U.S. Treasury securities |
|
| 44,030 |
|
|
| — |
|
|
| (4,381 | ) |
|
| 39,649 |
|
|
| 39,649 |
|
Commercial paper |
|
| 7,089 |
|
|
| 70 |
|
|
| — |
|
|
| 7,159 |
|
|
| — |
|
Debt mutual funds |
|
| 6,997 |
|
|
| — |
|
|
| (417 | ) |
|
| 6,580 |
|
|
| 3,095 |
|
U.S. government agency securities |
|
| 6,442 |
|
|
| — |
|
|
| (90 | ) |
|
| 6,352 |
|
|
| 6,352 |
|
Certificates of deposit and time deposits |
|
| 1,740 |
|
|
| — |
|
|
| — |
|
|
| 1,740 |
|
|
| — |
|
Non-U.S. government securities |
|
| 535 |
|
|
| — |
|
|
| — |
|
|
| 535 |
|
|
| — |
|
|
| $ | 123,839 |
|
| $ | 73 |
|
| $ | (11,041 | ) |
| $ | 112,871 |
|
| $ | 99,763 |
|
Reported as follows:
|
| Cost |
|
| Unrealized |
|
| Unrealized |
|
| Fair Market |
|
| Fair Market |
| |||||
|
| (in thousands) |
| |||||||||||||||||
Marketable securities |
| $ | 39,950 |
|
| $ | 70 |
|
| $ | (408 | ) |
| $ | 39,612 |
|
| $ | 30,713 |
|
Long-term marketable securities |
|
| 83,889 |
|
|
| 3 |
|
|
| (10,633 | ) |
| $ | 73,259 |
|
|
| 69,050 |
|
| $ | 123,839 |
|
| $ | 73 |
|
| $ | (11,041 | ) |
| $ | 112,871 |
|
| $ | 99,763 |
| |
Cost | Unrealized Gain | Unrealized (Loss) | Fair Market Value | Fair Market Value of Investments with Unrealized Losses | ||||||||||||||||
(in thousands) | ||||||||||||||||||||
Marketable securities | $ | 244,213 | $ | 64 | $ | (46 | ) | $ | 244,231 | $ | 54,798 | |||||||||
Long-term marketable securities | 89,864 | 5,413 | (672 | ) | 94,605 | 37,139 | ||||||||||||||
| $ | 334,077 | $ | 5,477 | $ | (718 | ) | $ | 338,836 | $ | 91,937 | ||||||||||
As of December 31, 2023, the fair market value of investments with unrealized losses less than one year and greater than one year totaled $22.3 million and $65.2 million, respectively.
As of December 31, 2022, the fair market value of investments with unrealized losses less than one year and greater than one year totaled $66.3$66.3 million and $33.4$33.4 million, respectively.
58
Teradyne reviews its investments to identify and evaluate investments that have an indication of possible impairment. Based on this review, Teradyne determined that the unrealized losses related to these investments at December 31, 20222023 and 2021,2022 were not other than temporary.
The contractual maturities of investments in available-for-sale marketable securities held at December 31, 20222023 were as follows:
|
| Cost |
|
| Fair Value |
| ||
|
| (in thousands) |
| |||||
Due within one year |
| $ | 62,385 |
|
| $ | 62,154 |
|
Due after 1 year through 5 years |
|
| 23,703 |
|
|
| 23,319 |
|
Due after 5 years through 10 years |
|
| 6,049 |
|
|
| 5,735 |
|
Due after 10 years |
|
| 39,159 |
|
|
| 32,475 |
|
Total |
| $ | 131,296 |
|
| $ | 123,683 |
|
Cost | Fair Value | |||||||
(in thousands) | ||||||||
Due within one year | $ | 39,950 | $ | 39,612 | ||||
Due after 1 year through 5 years | 33,045 | 31,466 | ||||||
Due after 5 years through 10 years | 4,782 | 4,232 | ||||||
Due after 10 years | 39,065 | 30,981 | ||||||
Total | $ | 116,842 | $ | 106,291 | ||||
Contractual maturities of investments in available-for-sale marketable securities held at December 31, 20222023 exclude debt mutual funds with the fair market value of $6.6$8.8 million as they do not have a contractual maturity date.
Derivatives
Teradyne conducts business in various foreign countries, with certain transactions denominated in local currencies. As a result, Teradyne is exposed to risks relating to changes in foreign currency exchange rates. Teradyne’s foreign currency risk management objective is to minimize the effect of exchange rate fluctuations associated with the remeasurement of monetary assets and liabilities denominated in foreign currencies, and changes in its cash inflows attributable to the forecasted cash flows from certain foreign currency denominated revenues.
To minimize the effect of exchange rate fluctuations associated with the remeasurement of monetary assets and liabilities denominated in foreign currencies, Teradyne enters into foreign currency forward contracts. The change in fair value of these derivatives is recorded directly in earnings and is used to offset the change in value of monetary assets and liabilities denominated in foreign currencies.
Teradyne also enters into foreign currency forward and option contracts designated as cash flow hedges to hedge the risk of changes in its cash inflows attributable to changes in foreign currency exchange rates. The cash flow hedges have maturities of less than six months and mature in the period of revenue recognition for certain products and services in backlog and forecasted to be recognized in a future period. Teradyne evaluates cash flow hedges for effectiveness at inception based on the critical terms match method. The hedges are not expected to incur any ineffectiveness however a quarterly qualitative assessment of effectiveness is done to determine if the critical terms match method remains appropriate to use. The change in fair value of the contracts is recorded in accumulated other comprehensive income (loss) and reclassified to earnings at maturity date.
Teradyne does not use derivative financial instruments for speculative purposes.
59
At December 31, 2023 and 2022, to hedge certain of its local currency balance sheet assets and 2021,liabilities, Teradyne had the following contracts to buy and sell non-U.S. currencies for U.S. dollars and other non-U.S. currencies with the following notional amounts:
|
| Net Notional Value |
| |||||
|
| December 31, |
|
| December 31, 2022 |
| ||
|
| (in millions) |
| |||||
Currency Hedged (Buy/Sell) |
|
|
|
|
|
| ||
U.S. dollar/Taiwan dollar |
| $ | 42.7 |
|
| $ | 29.2 |
|
U.S. dollar/Danish krone |
|
| 36.0 |
|
|
| — |
|
U.S. dollar/Japanese yen |
|
| 11.0 |
|
|
| 37.1 |
|
U.S. dollar/Korean won |
|
| 7.2 |
|
|
| 6.4 |
|
U.S. dollar/British pound sterling |
|
| 1.5 |
|
|
| 1.2 |
|
Euro/U.S. dollar |
|
| 25.3 |
|
|
| 38.4 |
|
Singapore dollar/U.S. dollar |
|
| 16.6 |
|
|
| 33.5 |
|
Philippine peso/U.S. dollar |
|
| 10.1 |
|
|
| 2.7 |
|
Chinese yuan/U.S. dollar |
|
| 1.0 |
|
|
| 2.2 |
|
Danish krone/U.S. dollar |
|
| 0.7 |
|
|
| — |
|
Total |
|
| 152.1 |
|
|
| 150.7 |
|
December 31, 2022 | December 31, 2021 | |||||||||||||||||||||||
Buy Position | Sell Position | Net Total | Buy Position | Sell Position | Net Total | |||||||||||||||||||
(in millions) | ||||||||||||||||||||||||
Japanese Yen | $ | (37.1 | ) | $ | — | $ | (37.1 | ) | $ | (31.4 | ) | $ | — | $ | (31.4 | ) | ||||||||
Taiwan Dollar | (29.2 | ) | — | (29.2 | ) | (35.1 | ) | — | (35.1 | ) | ||||||||||||||
Korean Won | (6.4 | ) | — | (6.4 | ) | (4.2 | ) | — | (4.2 | ) | ||||||||||||||
British Pound Sterling | (1.2 | ) | — | (1.2 | ) | (1.8 | ) | — | (1.8 | ) | ||||||||||||||
Euro | — | 38.4 | 38.4 | — | 44.9 | 44.9 | ||||||||||||||||||
Singapore Dollar | — | 33.5 | 33.5 | — | 61.9 | 61.9 | ||||||||||||||||||
Philippine Peso | — | 2.7 | 2.7 | — | 3.9 | 3.9 | ||||||||||||||||||
Chinese Yuan | — | 2.2 | 2.2 | — | 2.8 | 2.8 | ||||||||||||||||||
Total | $ | (73.9 | ) | $ | 76.8 | $ | 2.9 | $ | (72.5 | ) | $ | 113.5 | $ | 41.0 | ||||||||||
The change in the fair value of the outstanding contracts was a loss of $0.9$1.8 million and $0.1$0.9 million, respectively, at December 31, 20222023 and 2021.
Unrealized gains and losses on foreign currency forward contracts and foreign currency remeasurement gains and losses on monetary assets and liabilities are included in other (income) expense, net.
At December 31, 20222023 and 2021,2022, Teradyne had the following cash flow hedge contracts to buy and sell non-U.S. currencies for U.S. dollars with the following notional amounts:
|
| Net Notional Value |
| |||||
|
| December 31, |
|
| December 31, 2022 |
| ||
|
| (in millions) |
| |||||
Currency Hedged (Buy/Sell) |
|
|
|
|
|
| ||
U.S. dollar/Japanese yen |
| $ | 35.5 |
|
| $ | 61.2 |
|
U.S. dollar/Taiwan dollar |
|
| — |
|
|
| 10.9 |
|
Japanese yen/U.S. dollar |
|
| — |
|
|
| 23.4 |
|
Taiwan dollar/U.S. dollar |
|
| — |
|
|
| 5.5 |
|
Total |
| $ | 35.5 |
|
| $ | 101.0 |
|
December 31, 2022 | December 31, 2021 | |||||||||||||||||||||||
Buy Position | Sell Position | Net Total | Buy Position | Sell Position | Net Total | |||||||||||||||||||
(in millions) | ||||||||||||||||||||||||
Japanese Yen | $ | (23.4 | ) | $ | 61.2 | $ | 37.8 | $ | — | $ | — | $ | — | |||||||||||
Taiwan Dollar | (5.5 | ) | 10.9 | 5.4 | — | — | — | |||||||||||||||||
Total | $ | (28.9 | ) | $ | 72.1 | $ | 43.2 | $ | — | $ | — | $ | — | |||||||||||
The change in the fair value of the outstanding cash flow hedge contracts was a lossgain of $3.2$0.6 million at December 31, 2023 and a loss of $3.2 million at December 31, 2022.
Unrealized gains and losses on foreign currency cash flow hedge contracts are included in accumulated other comprehensive income (loss). At maturity, the gains or losses associated with cash flow hedge contracts are recorded to revenue.
On November 7, 2023, in connection with our agreement to acquire 10% investment in Technoprobe S.p.A we purchased a call option to buy 481.0 million Euros. The expiration date of the option is April 26, 2024. At December 31, 2023, the fair value of the outstanding contract was $17.4 million and an unrealized gain of $7.5 million was recorded in other (income) expense, net.
60
The following table summarizes the fair value of derivative instruments as of December 31, 20222023 and 2021:2022:
|
| Balance Sheet Location |
| December 31, |
|
| December 31, |
| ||
|
|
|
| (in thousands) |
| |||||
Derivatives not designated as hedging instruments: |
|
|
|
|
|
|
|
| ||
Foreign exchange forward contracts |
| Other current assets |
| $ | 733 |
|
| $ | 86 |
|
Foreign exchange option contracts |
| Other current assets |
|
| 17,364 |
|
|
| — |
|
Foreign exchange forward contracts |
| Other current liabilities |
|
| (2,545 | ) |
|
| (990 | ) |
Derivatives designated as hedging instruments: |
|
|
|
|
|
|
|
| ||
Foreign exchange forward contracts |
| Other current assets |
|
| 648 |
|
|
| — |
|
Foreign exchange option contracts |
| Other current liabilities |
|
| — |
|
|
| (3,225 | ) |
Total derivatives |
|
|
| $ | 16,200 |
|
| $ | (4,129 | ) |
Balance Sheet Location | December 31, 2022 | December 31, 2021 | ||||||||||
(in thousands) | ||||||||||||
Derivatives not designated as hedging instruments: | ||||||||||||
Foreign exchange forward contracts | Prepayments | $ | 86 | $ | 92 | |||||||
Foreign exchange forward contracts | Other current liabilities | (990 | ) | (118 | ) | |||||||
Derivatives designated as hedging instruments: | ||||||||||||
Foreign exchange option contracts | Other current liabilities | (3,225 | ) | — | ||||||||
Total derivatives | $ | (4,129 | ) | $ | (26 | ) | ||||||
The following table summarizes the effect of derivative instruments in the statements of operations recognized for the years ended December 31, 2023, 2022, 2021, and 2020:
|
| Location of (Gains) Losses |
| December 31, |
|
| December 31, |
|
| December 31, |
| |||
|
|
|
| (in thousands) |
| |||||||||
Derivatives not designated as hedging instruments: |
|
|
|
|
|
|
|
|
|
|
| |||
Foreign exchange forward contracts (1) |
| Other (income) expense, net |
| $ | (1,843 | ) |
| $ | (2,482 | ) |
| $ | 6,488 |
|
Foreign exchange option contracts |
| Other (income) expense, net |
|
| (7,464 | ) |
|
| — |
|
|
| — |
|
Derivatives designated as hedging instruments: |
|
|
|
|
|
|
|
|
|
|
| |||
Foreign exchange forward and option contracts |
| Revenue |
|
| (3,127 | ) |
|
| (251 | ) |
|
| — |
|
Total derivatives |
|
|
| $ | (12,434 | ) |
| $ | (2,733 | ) |
| $ | 6,488 |
|
Location of (Gains) Losses Recognized in Statement of Operations | December 31, 2022 | December 31, 2021 | December 31, 2020 | |||||||||||
(in thousands) | ||||||||||||||
Derivatives not designated as hedging instruments: | ||||||||||||||
Foreign exchange forward contracts | Other (income) expense, net | $ | (2,482 | ) | $ | 6,488 | $ | 3,515 | ||||||
Derivatives designated as hedging instruments: | ||||||||||||||
Foreign exchange option contracts | Revenue | (251 | ) | — | — | |||||||||
Total derivatives | $ | (2,733 | ) | $ | 6,488 | $ | 3,515 | |||||||
See Note J: “Debt” regarding derivatives related to the convertible senior notes.
Concentration of Credit Risk
Financial instruments which potentially subject Teradyne to concentrations of credit risk consist principally of cash equivalents, marketable securities, forward currency contracts and accounts receivable. Teradyne’s cash equivalents consist primarily of money market funds invested in U.S. Treasuries and government agencies. Teradyne’s fixed income available-for-sale marketable securities have a minimum rating of AA by one or more of the major credit rating agencies. Teradyne places foreign currency forward contracts with high credit-quality financial institutions in order to minimize credit risk exposure. Concentrations of credit risk with respect to accounts receivable are limited due to the large number of geographically dispersed customers. Teradyne performs ongoing credit evaluations of its customers’ financial condition and from time to time may require customers to provide a letter of credit from a bank to secure accounts receivable. As of December 31, 2023, one customer of our Semiconductor Test segment, Texas Instruments Inc., accounted for 18% of our accounts receivable balance. There were no customers who accounted for more than 10%10% of our accounts receivable balance as of December 31,
Teradyne has facility and auto leases, which are accounted for as operating leases. Teradyne’s facility leases are primarily used for administrative functions, research and development, manufacturing, and storage and distribution. Remaining lease terms range from less than one year to twelve years.
For the yearyears ended December 31, 2023, 2022 2021 and 2020,2021, total lease expense was $40.1$42.7 million, $39.2$40.1 million, and $38.5$39.2 million respectively, and included $14.1$15.5 million, $12.6$14.1 million, and $12.1$12.6 million, respectively, of variable lease costs and $2.0$1.3 million, $1.8$2.0 million, and $3.4$1.8 million, respectively, of costs related to short-term leases, which are not recorded on the consolidated balance sheets.
61
At December 31, 2023, the weighted average remaining lease term and weighted average discount rate for operating leases was 6.3 years and 5.2%, respectively. At December 31, 2022, the weighted average remaining lease term and weighted average discount rate for operating leases was 5.9 years and 4.7%4.7%, respectively. At December 31, 2021, the weighted average remaining lease term and weighted average discount rate for operating leases was 5.3 years and 4.1%, respectively.
Supplemental cash flows information related to leases was as follows:
|
| For the Years Ended |
| |||||||||
|
| December 31, |
|
| December 31, |
|
| December 31, |
| |||
|
| (in thousands) |
| |||||||||
Cash paid for amounts included in the measurement of lease |
| $ | 26,059 |
|
| $ | 20,775 |
|
| $ | 24,593 |
|
Right-of-use assets obtained in exchange for new lease obligations |
|
| 17,987 |
|
|
| 26,149 |
|
|
| 34,246 |
|
For the Years Ended | ||||||||||||
December 31, 2022 | December 31, 2021 | December 31, 2020 | ||||||||||
(in thousands) | ||||||||||||
Cash paid for amounts included in the measurement of lease liabilities included in operating cash flows: | $ | 20,775 | $ | 24,593 | $ | 24,136 | ||||||
Right-of-use assets obtained in exchange for new lease obligations | 26,149 | 34,246 | 14,801 | |||||||||
Maturities of lease liabilities as of December 31, 20222023 were as follows:
|
| Operating Lease (1) |
| |
|
| (in thousands) |
| |
2024 |
| $ | 21,045 |
|
2025 |
|
| 18,755 |
|
2026 |
|
| 15,074 |
|
2027 |
|
| 11,733 |
|
2028 |
|
| 7,622 |
|
Thereafter |
|
| 23,906 |
|
Total lease payments |
|
| 98,135 |
|
Less imputed interest |
|
| (15,521 | ) |
Total lease liabilities |
| $ | 82,614 |
|
Operating Lease | ||||
(in thousands) | ||||
2023 | $ | 20,120 | ||
2024 | 18,239 | |||
2025 | 15,308 | |||
2026 | 10,635 | |||
2027 | 8,117 | |||
Thereafter | 17,963 | |||
Total lease payments | 90,382 | |||
Less imputed interest | (7,612 | ) | ||
Total lease liabilities | $ | 82,770 | ||
Convertible Senior Notes
On December 12, 2016, Teradyne completed a private offering of $460.0$460.0 million aggregate principal amount of 1.25%1.25% convertible senior unsecured notes (the “Notes”) due December 15, 2023 and received net proceeds, after issuance costs, of approximately $450.8$450.8 million, $33.0$33.0 million of which was used to pay the net cost of the convertible note hedge transactions and $50.1$50.1 million of which was used to repurchase 2.0 million shares of Teradyne’s common stock under its existing stock repurchase program from purchasers of the Notes in privately negotiated transactions effected through one of the initial purchasers or its affiliates conducted concurrently with the pricing of the Note offering. The Notes will mature on December 15, 2023, unless earlier repurchased or converted. The Notes bearbore interest at a rate of 1.25%1.25% per year payable semiannually in arrears on June 15 and December 15 of each year.year. The Notes will be convertible at the option of the noteholders at any time prior to the close of businessnotes matured on the business day immediately preceding SeptemberDecember 15, 2023 only under the following circumstances: (1) during any calendar quarter beginning after March 31, 2017 (and only during such calendar quarter), if the closing sale price of Teradyne’s common stock, for at least 20 trading days (whether or not consecutive) during a period of 30 consecutive trading days ending on the last trading day of the immediately
During 2022, forty-two2023, twenty three debt holders elected to convert $66.8$50.2 million of debt principal. The conversion of the debt was settled in cash for principal amount and in shares for the excess of conversion value over principal amount. The 1.51.1 million shares issued to the debt holders were received from exercising the convertible notes hedge call options.
Concurrent with the offering of the Notes, Teradyne entered into convertible note hedge transactions (the “Note Hedge Transactions”) with the initial purchasers or their affiliates (the “Option Counterparties”). The Note Hedge Transactions cover, subject to customary anti-dilution adjustments, the number of shares of the common stock that underlie the Notes, with a strike price equal to the conversion priceNotes.
62
Separately and concurrent with the pricing of the Notes, Teradyne entered into warrant transactions with the Option Counterparties (the “Warrant Transactions”) in which it sold net-share-settled (or, at its election subject to certain conditions, cash-settled) warrants to the Option Counterparties. These transactions have been accounted for as an adjustment to our shareholders equity. The Warrant Transactions, which expire between March 18, 2024 and July 10, 2024, currently cover, subject to customary anti-dilution adjustments, approximately 14.614.7 million shares of common stock. As of December 31, 2022,2023, the strike price of the warrants was approximately $39.48$39.40 per share. The strike price is subject to adjustment under certain circumstances. The Warrant Transactions could have a dilutive effect toresult in additional shares of Teradyne’s common stock being issued to the extent that the market price per share of Teradyne’s common stock, as measured under the terms of the Warrant Transactions, exceeds the applicable strike price of the warrants.
The net cost of the Note Hedge Transactions, after being partially offset by the proceeds from the sale of the warrants, was approximately $33.0$33.0 million.
In connection with establishing their initial hedge of these convertible note hedge and warrant transactions, the Option Counterparties have entered into various derivative transactions with respect to Teradyne’s common stock and/or purchased shares of Teradyne’s common stock or other securities, including the Notes, concurrent
Originally, Teradyne allocated $100.8$100.8 million of the $460.0$460.0 million principal amount of the Notes to the equity component, which represented a discount to the debt and was amortized to interest expense using the effective interest method through December 2023. Effective January 1, 2022, Teradyne adopted ASC 2020-06 using the modified retrospective method of transition and accounts for the debt as a single liability measured at its amortized cost. As a result of the adoption, Teradyne recorded an increase of $1.4$1.4 million to current debt for unsettled shares, an increase of $1.8$1.8 million to deferred tax assets, an increase of $6.6$6.6 million to long-term debt for unamortized debt discount, and an increase to retained earnings of $94.6$94.6 million for the reclassification of the equity component. Mezzanine equity representing unsettled shares value was reduced to zero and additional paid-in capital was reduced by $100.8$100.8 million.
The below tables represent the key components of Teradyne’s convertible senior notes:
|
| For the Years Ended |
| |||||
|
| December 31, |
|
| December 31, |
| ||
|
| (in thousands) |
| |||||
Debt principal |
| $ | — |
|
| $ | 50,228 |
|
Unamortized debt issuance fees |
|
| — |
|
|
| 113 |
|
Net carrying amount of convertible debt |
| $ | — |
|
| $ | 50,115 |
|
|
| For the Years Ended |
| |||||
|
| December 31, |
|
| December 31, |
| ||
|
| (in thousands) |
| |||||
Contractual interest expense on the coupon |
| $ | 312 |
|
| $ | 732 |
|
Amortization of the issuance fees recognized as interest expense |
|
| 113 |
|
|
| 209 |
|
Total interest expense on the convertible debt |
| $ | 425 |
|
| $ | 941 |
|
December 31, 2022 | December 31, 2021 | |||||||
(in thousands) | ||||||||
Debt principal | $ | 50,228 | $ | 116,980 | ||||
Unamortized debt issuance fees (1) | 113 | 8,554 | ||||||
Net carrying amount of convertible debt | $ | 50,115 | $ | 108,426 | ||||
December 31, 2022 | December 31, 2021 | |||||||
(in thousands) | ||||||||
Current debt | $ | 50,115 | $ | 19,182 | ||||
Long-term debt | — | 89,244 | ||||||
Net carrying amount of convertible debt | $ | 50,115 | $ | 108,426 | ||||
For the Years Ended | ||||||||
December 31, 2022 | December 31, 2021 | |||||||
(in thousands) | ||||||||
Contractual interest expense on the coupon | $ | 732 | $ | 3,009 | ||||
Amortization of the issuance fees recognized as interest expense (2) | 209 | 11,019 | ||||||
Total interest expense on the convertible debt | $ | 941 | $ | 14,028 | ||||
Revolving Credit Facility
On May 1, 2020, Teradyne entered into a credit agreement (the “Credit Agreement”) with Truist Bank, as administrative agent and collateral agent, and the lenders party thereto. The Credit Agreement provides for a three-year, senior secured revolving credit facility of $400.0$400.0 million (the “Credit Facility”).
On December 10, 2021, the Credit Agreement was amended to extend maturity date of the Credit Facility to December 10, 2026. On October 5, 2022, the Credit Agreement was amended to increase the amount of the Credit Facility to $750.0$750.0 million from $400.0$400.0 million.
63
The Credit Agreement provides that, subject to customary conditions, Teradyne may seek to obtain from existing or new lenders the available incremental amount under the Credit Facility, not to exceed the greater of $200.0$200.0 million or 15%15% of consolidated EBIDTA. The interest rate applicable to loans under the Credit Facility are, at Teradyne’s option, equal to either a base rate plus a margin ranging from 0.00%0.00% to 0.75%0.75% per annum or SOFR plus a margin ranging from 1.10%1.10% to 1.85%1.85% per annum, based on the consolidated leverage ratio of Teradyne. In addition, Teradyne will pay a commitment fee on the unused portion of the commitments under the Credit Facility ranging from 0.15%0.15% to 0.25%0.25% per annum, based on the then applicable consolidated leverage ratio.
Teradyne is not required to repay any loans under the Credit Facility prior to maturity, subject to certain customary exceptions. Teradyne is permitted to prepay all or any portion of the loans under the Credit Facility prior to maturity without premium or penalty, other than customary SOFR breakage costs.
The Credit Agreement contains customary events of default, representations, warranties and affirmative and negative covenants that, among other things, limit Teradyne’s ability to sell assets, grant liens on assets, incur other secured indebtedness and make certain investments and restricted payments, all subject to exceptions set forth in the Credit Agreement. The Credit Agreement also requires Teradyne to satisfy two financial ratios measured as of the end of each fiscal quarter; a consolidated leverage ratio and an interest coverage ratio.
The Credit Facility is guaranteed by certain of Teradyne’s domestic subsidiaries and collateralized by assets of Teradyne and such subsidiaries, including a pledge of 65%65% of the capital stock of certain foreign subsidiaries.
As of February 22, 2023,2024, the Credit Agreement was undrawn and Teradyne was in compliance with all covenants under the Credit Agreement.
Changes in accumulated other comprehensive income (loss), which is presented net of tax, consist of the following:
|
| Foreign |
|
| Unrealized |
|
| Unrealized (Losses) Gains on |
|
| Retirement |
|
| Total |
| |||||
|
| (in thousands) |
| |||||||||||||||||
Balance at December 31, 2021, net of tax of $0, $1,055, $0, |
| $ | (10,818 | ) |
| $ | 3,704 |
|
| $ | — |
|
| $ | 1,166 |
|
| $ | (5,948 | ) |
Other comprehensive loss before reclassifications, net of tax of |
|
| (29,031 | ) |
|
| (12,666 | ) |
|
| (2,517 | ) |
|
| — |
|
|
| (44,214 | ) |
Amounts reclassified from accumulated other comprehensive |
|
| — |
|
|
| 301 |
|
|
| — |
|
|
| (7 | ) |
|
| 294 |
|
Net current period other comprehensive loss, net of tax of $0, |
|
| (29,031 | ) |
|
| (12,365 | ) |
|
| (2,517 | ) |
|
| (7 | ) |
|
| (43,920 | ) |
Balance at December 31, 2022, net of tax of $0, $(2,308), $(708), |
| $ | (39,849 | ) |
| $ | (8,661 | ) |
| $ | (2,517 | ) |
| $ | 1,159 |
|
| $ | (49,868 | ) |
Other comprehensive gain before reclassifications, net of tax of |
|
| 17,407 |
|
|
| 2,423 |
|
|
| 5,464 |
|
|
| — |
|
|
| 25,294 |
|
Amounts reclassified from accumulated other comprehensive |
|
| — |
|
|
| 44 |
|
|
| (2,441 | ) |
|
| (7 | ) |
|
| (2,404 | ) |
Net current period other comprehensive gain (loss), net of tax |
|
| 17,407 |
|
|
| 2,467 |
|
|
| 3,023 |
|
|
| (7 | ) |
|
| 22,890 |
|
Balance at December 31, 2023, net of tax of $0, $(1,728), $143, |
| $ | (22,442 | ) |
| $ | (6,194 | ) |
| $ | 506 |
|
| $ | 1,152 |
|
| $ | (26,978 | ) |
Foreign Currency Translation Adjustment | Unrealized Gains (Losses) on Marketable Securities | Unrealized Losses on Cash Flow Hedges | Retirement Plans Prior Service Credit | Total | ||||||||||||||||
(in thousands) | ||||||||||||||||||||
Balance at December 31, 2020, net of tax of $0, $1,910, $0, $(1,126), respectively | $ | 25,389 | $ | 6,954 | $ | — | $ | 1,173 | $ | 33,516 | ||||||||||
Other comprehensive loss before reclassifications, net of tax of $0, $(578), $0, $0, respectively | (36,207 | ) | (2,255 | ) | — | — | (38,462 | ) | ||||||||||||
Amounts reclassified from accumulated other comprehensive income, net of tax of $0, $(277), $0, $(2), respectively | — | (995 | ) | — | (7 | ) | (1,002 | ) | ||||||||||||
Net current period other comprehensive loss, net of tax of $0, $(855), $0, $(2), respectively | (36,207 | ) | (3,250 | ) | — | (7 | ) | (39,464 | ) | |||||||||||
Balance at December 31, 2021, net of tax of $0, $1,055, $0, $(1,128), respectively | $ | (10,818 | ) | $ | 3,704 | $ | — | $ | 1,166 | $ | (5,948 | ) | ||||||||
Other comprehensive loss before reclassifications, net of tax of $0, $(3,388), $(708), $0, respectively | (29,031 | ) | (12,666 | ) | (2,517 | ) | — | (44,214 | ) | |||||||||||
Amounts reclassified from accumulated other comprehensive income (loss), net of tax of $0, $25, $0, $(2), respectively | — | 301 | — | (7 | ) | 294 | ||||||||||||||
Net current period other comprehensive loss, net of tax of $0, $(3,363), $(708), $(2), respectively | (29,031 | ) | (12,365 | ) | (2,517 | ) | (7 | ) | (43,920 | ) | ||||||||||
Balance at December 31, 2022, net of tax of $0, $(2,308), $(708), $(1,130), respectively | $ | (39,849 | ) | $ | (8,661 | ) | $ | (2,517 | ) | $ | 1,159 | $ | (49,868 | ) | ||||||
64
Reclassifications out of accumulated other comprehensive income (loss) to the statements of operations for the years ended December 31, 2023, 2022, 2021, and 2020,2021, were as follows:
Details about Accumulate Other Comprehensive Income (Loss) Components |
| For the years ended |
|
| Affected Line Item | |||||||||
|
| December 31, |
|
| December 31, |
|
| December 31, |
|
|
| |||
|
| (in thousands) |
|
|
| |||||||||
Available-for-sale marketable securities |
|
|
|
|
|
|
|
|
|
|
| |||
Unrealized (losses) gains, net of tax of $(12), $(25), $277, |
| $ | (44 | ) |
| $ | (301 | ) |
| $ | 995 |
|
| Other (income) expense, net |
Cash flow hedges: |
|
|
|
|
|
|
|
|
|
|
| |||
Unrealized gains, net of tax of $686, $0, $0, respectively |
|
| 2,441 |
|
|
| — |
|
|
| — |
|
| Revenue |
Defined benefit pension and postretirement plans: |
|
|
|
|
|
|
|
|
|
|
| |||
Amortization of prior service benefit, net of tax of $2, $2, $2, |
|
| 7 |
|
|
| 7 |
|
|
| 7 |
|
| (a) |
Total reclassifications, net of tax of $676, $(23), $279, respectively |
| $ | 2,404 |
|
| $ | (294 | ) |
| $ | 1,002 |
|
| Net income |
Details about Accumulated Other Comprehensive Income (Loss) Components | For the year s ended | Affected Line Item in the Statements of Operations | ||||||||||||||
December 31, 2022 | December 31, 2021 | December 31, 2020 | ||||||||||||||
(in thousands) | ||||||||||||||||
Available-for-sale marketable securities | ||||||||||||||||
Unrealized (losses) gains, net of tax of $(25), $277, $665, respectively | $ | (301 | ) | $ | 995 | $ | 2,365 | Other (income) expense, net | | |||||||
Defined benefit pension and postretirement plans: | ||||||||||||||||
Amortization of prior service benefit, net of tax of $2, $2, $2, respectively | 7 | 7 | 7 | (a | ) | |||||||||||
Total reclassifications, net of tax of $(23), $279, $667, respectively | $ | (294 | ) | $ | 1,002 | $ | 2,372 | Net income | ||||||||
Goodwill
Teradyne performs its annual goodwill impairment test as required under the provisions of ASC 350-10, “
Teradyne has the option to perform a qualitative assessment to determine whether it is more likely than not that the fair value of a reporting unit is less than its carrying amount. If Teradyne determines this is the case, Teradyne is required to perform a quantitative goodwill impairment test to identify potential goodwill impairment and measure the amount of goodwill impairment loss to be recognized. If Teradyne determines that it is more likely than not that the fair value of the reporting unit is greater than its carrying amounts, the quantitative goodwill impairment test is not required. In performing the quantitative goodwill impairment test, Teradyne determines the fair value of a reporting unit using the results derived from an income approach and a market approach, weighting the fair value determined under each approach to determine an estimated fair value for a reporting unit. The income approach is estimated through the discounted cash flows (“DCF”) analysis. Determining fair value requires the exercise of significant judgment, including judgments about appropriate discount rates, perpetual growth rates, and the amount and timing of expected future cash flows. Discount rates are based on a weighted average cost of capital (“WACC”), which represents the average rate a business must pay its providers of debt and equity, plus a risk premium. The WACC used to test goodwill is derived from a group of comparable companies. The cash flows employed in the DCF analysis are derived from internal forecasts and external market forecasts. The market approach estimates the fair value of the reporting unit by utilizing the market comparable method which is based on revenue and earnings multiples from comparable companies. If the estimated fair value of a reporting unit exceeds its carrying amount, goodwill of the reporting unit is not impaired. If the carrying amount of a reporting unit exceeds its estimated fair value, then the goodwill is written down by the amount that carrying value exceeds the fair value of the reporting unit, but not below zero.
In the fourth quarter of 2022,2023, Teradyne performed the annual goodwill impairment test, completing a quantitative assessment for the Robotics reporting unit and a qualitative assessment for the Wireless Test and System Test reporting units
In the fourth quarter of 2021,2022, Teradyne performed the annual goodwill impairment test, completing a quantitative assessment for the Robotics reporting unit and a qualitative assessment for the Wireless Test and System Test reporting units and qualitative assessment for the
65
The changes in the carrying amount of goodwill by reportable segments for the years ended December 31, 20222023 and 20212022 are as follows:
|
| Robotics |
|
| Wireless |
|
| Semiconductor |
|
| System |
|
| Total |
| |||||
|
| (in thousands) |
| |||||||||||||||||
Balance at December 31, 2021: |
|
|
|
|
|
|
|
|
|
|
|
|
|
|
| |||||
Goodwill |
| $ | 405,971 |
|
| $ | 361,819 |
|
| $ | 262,101 |
|
| $ | 158,699 |
|
| $ | 1,188,590 |
|
Accumulated impairment losses |
|
| — |
|
|
| (353,843 | ) |
|
| (260,540 | ) |
|
| (148,183 | ) |
|
| (762,566 | ) |
|
| 405,971 |
|
|
| 7,976 |
|
|
| 1,561 |
|
|
| 10,516 |
|
|
| 426,024 |
| |
Foreign currency translation adjustment |
|
| (22,805 | ) |
|
| — |
|
|
| (24 | ) |
|
| — |
|
|
| (22,829 | ) |
Balance at December 31, 2022: |
|
|
|
|
|
|
|
|
|
|
|
|
|
|
| |||||
Goodwill |
|
| 383,166 |
|
|
| 361,819 |
|
|
| 262,077 |
|
|
| 158,699 |
|
|
| 1,165,761 |
|
Accumulated impairment losses |
|
| — |
|
|
| (353,843 | ) |
|
| (260,540 | ) |
|
| (148,183 | ) |
|
| (762,566 | ) |
|
| 383,166 |
|
|
| 7,976 |
|
|
| 1,537 |
|
|
| 10,516 |
|
|
| 403,195 |
| |
Foreign currency translation adjustment |
|
| 12,297 |
|
|
| — |
|
|
| 160 |
|
|
| — |
|
|
| 12,457 |
|
Balance at December 31, 2023: |
|
|
|
|
|
|
|
|
|
|
|
|
|
|
| |||||
Goodwill |
|
| 395,463 |
|
|
| 361,819 |
|
|
| 262,237 |
|
|
| 158,699 |
|
|
| 1,178,218 |
|
Accumulated impairment losses |
|
| — |
|
|
| (353,843 | ) |
|
| (260,540 | ) |
|
| (148,183 | ) |
|
| (762,566 | ) |
|
| $ | 395,463 |
|
| $ | 7,976 |
|
| $ | 1,697 |
|
| $ | 10,516 |
|
| $ | 415,652 |
|
Robotics | Wireless Test | Semiconductor Test | System Test | Total | ||||||||||||||||
(in thousands) | ||||||||||||||||||||
Balance at December 31, 2020: | ||||||||||||||||||||
Goodwill | $ | 433,752 | $ | 361,819 | $ | 262,155 | $ | 158,699 | $ | 1,216,425 | ||||||||||
Accumulated impairment losses | — | (353,843 | ) | (260,540 | ) | (148,183 | ) | (762,566 | ) | |||||||||||
| 433,752 | 7,976 | 1,615 | 10,516 | 453,859 | ||||||||||||||||
Foreign currency translation adjustment | (27,781 | ) | — | (54 | ) | — | (27,835 | ) | ||||||||||||
Balance at December 31, 2021: | ||||||||||||||||||||
Goodwill | 405,971 | 361,819 | 262,101 | 158,699 | 1,188,590 | |||||||||||||||
Accumulated impairment losses | — | (353,843 | ) | (260,540 | ) | (148,183 | ) | (762,566 | ) | |||||||||||
| 405,971 | 7,976 | 1,561 | 10,516 | 426,024 | ||||||||||||||||
Foreign currency translation adjustment | (22,805 | ) | — | (24 | ) | — | (22,829 | ) | ||||||||||||
Balance at December 31, 2022: | ||||||||||||||||||||
Goodwill | 383,166 | 361,819 | 262,077 | 158,699 | 1,165,761 | |||||||||||||||
Accumulated impairment losses | — | (353,843 | ) | (260,540 | ) | (148,183 | ) | (762,566 | ) | |||||||||||
| $ | 383,166 | $ | 7,976 | $ | 1,537 | $ | 10,516 | $ | 403,195 | |||||||||||
Intangible Assets
Teradyne reviews long-lived assets for impairment whenever events or changes in business circumstances indicate that the carrying amount of the assets may not be fully recoverable or that the useful lives of these assets are no longer appropriate.
There were no events or circumstances indicating that the carrying value of intangible and long-lived assets may not be recoverable in 2023, 2022 2021 and 2020.
Amortizable intangible assets consist of the following and are included in intangible assets, net on the balance sheets:
|
| December 31, 2023 |
| |||||||||||||
|
| Gross |
|
| Accumulated |
|
| Foreign Currency Translation Adjustment |
|
| Net |
| ||||
|
| (in thousands) |
| |||||||||||||
Developed technology |
| $ | 267,706 |
|
| $ | (243,191 | ) |
| $ | (5,343 | ) |
| $ | 19,172 |
|
Customer relationships |
|
| 52,109 |
|
|
| (47,850 | ) |
|
| 232 |
|
|
| 4,491 |
|
Tradenames and trademarks |
|
| 59,007 |
|
|
| (46,021 | ) |
|
| (1,245 | ) |
|
| 11,741 |
|
Total intangible assets |
| $ | 378,822 |
|
| $ | (337,062 | ) |
| $ | (6,356 | ) |
| $ | 35,404 |
|
|
| December 31, 2022 |
| |||||||||||||
|
| Gross |
|
| Accumulated |
|
| Foreign Currency Translation Adjustment |
|
| Net |
| ||||
|
| (in thousands) |
| |||||||||||||
Developed technology |
| $ | 270,967 |
|
| $ | (234,208 | ) |
| $ | (5,935 | ) |
| $ | 30,824 |
|
Customer relationships |
|
| 57,739 |
|
|
| (51,186 | ) |
|
| 172 |
|
|
| 6,725 |
|
Tradenames and trademarks |
|
| 59,387 |
|
|
| (41,930 | ) |
|
| (1,528 | ) |
|
| 15,929 |
|
Total intangible assets |
| $ | 388,093 |
|
| $ | (327,324 | ) |
| $ | (7,291 | ) |
| $ | 53,478 |
|
66
December 31, 2022 | ||||||||||||||||
Gross Carrying Amount (1) | Accumulated Amortization (1) | Foreign Currency Translation Adjustment | Net Carrying Amount | |||||||||||||
(in thousands) | ||||||||||||||||
Developed technology | $ | 270,967 | $ | (234,208 | ) | $ | (5,935 | ) | $ | 30,824 | ||||||
Customer relationships | 57,739 | (51,186 | ) | 172 | 6,725 | |||||||||||
Tradenames and trademarks | 59,387 | (41,930 | ) | (1,528 | ) | 15,929 | ||||||||||
Total intangible assets | $ | 388,093 | $ | (327,324 | ) | $ | (7,291 | ) | $ | 53,478 | ||||||
December 31, 2021 | ||||||||||||||||
Gross Carrying Amount | Accumulated Amortization | Foreign Currency Translation Adjustment | Net Carrying Amount | |||||||||||||
(in thousands) | ||||||||||||||||
Developed technology | $ | 272,547 | $ | (223,413 | ) | $ | (4,093 | ) | $ | 45,041 | ||||||
Customer relationships | 57,739 | (48,921 | ) | 209 | 9,027 | |||||||||||
Tradenames and trademarks | 59,387 | (37,237 | ) | (583 | ) | 21,567 | ||||||||||
Total intangible assets | $ | 389,673 | $ | (309,571 | ) | $ | (4,467 | ) | $ | 75,635 | ||||||
Aggregate intangible assets amortization expense for the years ended December 31, 2023, 2022, and 2021, and 2020, was $19.3$19.0 million, $21.5$19.3 million, and $30.8$21.5 million, respectively. Estimated intangible assets amortization expense for each of the five succeeding fiscal years is as follows:
Year |
| Amortization Expense |
| |
|
| (in thousands) |
| |
2024 |
| $ | 18,983 |
|
2025 |
|
| 11,402 |
|
2026 |
|
| 2,390 |
|
2027 |
|
| 1,173 |
|
2028 |
|
| 1,092 |
|
Thereafter |
|
| 364 |
|
Year | Amortization Expense | |||
(in thousands) | ||||
2023 | $ | 18,835 | ||
2024 | 18,527 | |||
2025 | 11,230 | |||
2026 | 2,350 | |||
2027 | 1,134 | |||
Thereafter | 1,402 | |||
Purchase Commitments
As of December 31, 2022,2023, Teradyne had entered into non-cancelable purchase commitments for certain components and materials. The purchase commitments covered by the agreements aggregate to approximately $654.8$414.4 million, of which $570.3$379.1 million is for less than one year.
Legal Claims
Teradyne is subject to various legal proceedings and claims which have arisen in the ordinary course of business such as, but not limited to, patent, employment, commercial and environmental matters. Teradyne believes that it has meritorious defenses against all pending claims and intends to vigorously contest them. While
On March 8, 2021, Industrial Automation LLC, sellers of AutoGuide, submitted a demand for arbitration against Teradyne and AutoGuide in Wilmington, Delaware alleging that Teradyne and AutoGuide breached certain provisions of the Membership Interests Purchase Agreement (the “Purchase Agreement”), dated as of October 18, 2019, among Industrial Automation LLC, Teradyne and AutoGuide. The arbitration demand sought full acceleration of the maximum earn-out amount payable under the Purchase Agreement, or $106.9$106.9 million, for the alleged breach of the earn-out provisions of the Purchase Agreement. On March 25, 2022, the arbitration claim was settled for $26.7$26.7 million. As a result, Teradyne has no remaining earn-out obligations.
Guarantees and Indemnification Obligations
Teradyne provides indemnification, to the extent permitted by law, to its officers, directors, employees and agents for liabilities arising from certain events or occurrences, while the officer, director, employee, or agent, is or was serving, at Teradyne’s request in such capacity. Teradyne may enter into indemnification agreements with certain of its officers and directors. With respect to acquisitions, Teradyne provides indemnifications to or assumes indemnification obligations for the current and former directors, officers and employees of the acquired companies in accordance with the acquired companies’ by-laws and charter. As a matter of practice, Teradyne has maintained directors’ and officers’ liability insurance coverage including coverage for directors and officers of acquired companies.
Teradyne enters into agreements in the ordinary course of business with customers, resellers, distributors, integrators and suppliers. Most of these agreements require Teradyne to defend and/or indemnify the other party against intellectual property infringement claims brought by a third party with respect to Teradyne’s products. From time to time, Teradyne also indemnifies customers and business partners for damages, losses and liabilities they may suffer or incur relating to personal injury, personal property damage, product liability, breach of confidentiality obligations and environmental claims relating to the use of Teradyne’s products and services or resulting from the acts or omissions of Teradyne, its employees, authorized agents or subcontractors. On occasion, Teradyne has also provided guarantees to customers regarding the delivery and performance of its products in addition to the warranty described below.
As a matter of ordinary course of business, Teradyne warrants that its products will substantially perform in accordance with its standard published specifications in effect at the time of delivery. Most warranties have a one-year duration commencing from installation. A provision is recorded upon revenue recognition to cost of revenues for estimated warranty expense based upon historical experience. When Teradyne receives revenue for extended warranties beyond the standard duration, the revenue is deferred
67
and recognized on a straight-line basis over the contract period. Related costs are expensed as incurred. As of December 31, 2022,2023 and 2021,2022, Teradyne had a product warranty accrual of $14.2$15.7 million and $24.6$14.2 million, respectively, included in other accrued liabilities, and revenue deferrals related to extended warranties of $56.2$34.9 million and $64.2$56.2 million, respectively, included in short and long-term deferred revenue and customer advances.
In addition, in the ordinary course of business, Teradyne provides minimum purchase guarantees to certain vendors to ensure continuity of supply against the market demand. Although some of these guarantees provide penalties for cancellations and/or modifications to the purchase commitments as the market demand decreases, most of the guarantees do not. Therefore, as the market demand decreases, Teradyne re-evaluates these guarantees and determines what charges, if any, should be recorded.
With respect to its agreements covering product, business or entity divestitures and acquisitions, Teradyne provides certain representations, warranties and covenants to purchasers and agrees to indemnify and hold such purchasers harmless against breaches of such representations, warranties and covenants. Many of the
As a matter of ordinary course of business, Teradyne occasionally guarantees certain indebtedness obligations of its subsidiary companies, limited to the borrowings from financial institutions, purchase commitments to certain vendors, and lease commitments to landlords.
Based on historical experience and information known as of December 31, 2022,2023, and 2021,2022, except for product warranty, Teradyne has not recorded any liabilities for these guarantees and obligations because the amount would be immaterial.
The following table sets forth the computation of basic and diluted net income per common share:
|
| 2023 |
|
| 2022 |
|
| 2021 |
| |||
|
| (in thousands, except per share amounts) |
| |||||||||
Net income for basic and diluted net income per share |
| $ | 448,752 |
|
| $ | 715,501 |
|
| $ | 1,014,589 |
|
Weighted average common shares-basic |
|
| 154,310 |
|
|
| 158,434 |
|
|
| 164,960 |
|
Effect of dilutive potential common shares: |
|
|
|
|
|
|
|
|
| |||
Convertible note hedge warrant shares (1) |
|
| 8,897 |
|
|
| 8,806 |
|
|
| 9,956 |
|
Incremental shares from assumed conversion of convertible notes (2) |
|
| 633 |
|
|
| 1,763 |
|
|
| 7,435 |
|
Restricted stock units |
|
| 423 |
|
|
| 657 |
|
|
| 1,180 |
|
Stock options |
|
| 34 |
|
|
| 52 |
|
|
| 86 |
|
Employee stock purchase rights |
|
| 7 |
|
|
| 22 |
|
|
| 8 |
|
Dilutive potential common shares |
|
| 9,994 |
|
|
| 11,300 |
|
|
| 18,665 |
|
Weighted average common shares-diluted |
|
| 164,304 |
|
|
| 169,734 |
|
|
| 183,625 |
|
Net income per common share-basic |
| $ | 2.91 |
|
| $ | 4.52 |
|
| $ | 6.15 |
|
Net income per common share-diluted |
| $ | 2.73 |
|
| $ | 4.22 |
|
| $ | 5.53 |
|
2022 | 2021 | 2020 | ||||||||||
(in thousands, except per share amounts) | ||||||||||||
Net income for basic and diluted net income per share | $ | 715,501 | $ | 1,014,589 | $ | 784,147 | ||||||
Weighted average common shares-basic | 158,434 | 164,960 | 166,120 | |||||||||
Effect of dilutive potential common shares: | ||||||||||||
Convertible note hedge warrant shares (1) | 8,806 | 9,956 | 6,989 | |||||||||
Incremental shares from assumed conversion of convertible notes (2) | 1,763 | 7,435 | 8,528 | |||||||||
Restricted stock units | 657 | 1,180 | 1,264 | |||||||||
Stock options | 52 | 86 | 131 | |||||||||
Employee stock purchase rights | 22 | 8 | 10 | |||||||||
Dilutive potential common shares | 11,300 | 18,665 | 16,922 | |||||||||
Weighted average common shares-diluted | 169,734 | 183,625 | 183,042 | |||||||||
Net income per common share-basic | $ | 4.52 | $ | 6.15 | $ | 4.72 | ||||||
Net income per common share-diluted | $ | 4.22 | $ | 5.53 | $ | 4.28 | ||||||
The computation of diluted net income per common share for 2023 excludes the effect of the potential exercise of stock options to purchase approximately 0.1 million shares and restricted stock units to purchase approximately 0.1 million shares because the effect would have been anti-dilutive. The computation of diluted net income per common share for 2022 excludes the effect of the potential exercise of stock options to purchase approximately 0.1 million shares and restricted stock units to purchase approximately 0.4 million shares because the effect would have been anti-dilutive.
68
During the year ended December 31, 2023, Teradyne recorded $14.7 million of diluted net income per common shareseverance charges related to headcount reductions of 215 people primarily in Semiconductor Test and Robotics, which included charges related to a voluntary early retirement program for 2021 excludes the effectemployees meeting certain conditions, a $3.1 million of the potential exerciseacquisition and divestiture expenses related to Technoprobe transaction, a $1.5 million contract termination charge, and a charge of stock options to purchase approximately 0.1$1.1 million shares and restricted stock units to purchase approximately 0.1 million shares because the effect would have been anti-dilutive.
During the year ended December 31, 2022, Teradyne recorded a charge of $14.7$14.7 million related to the arbitration claim filed against Teradyne and AutoGuide related to an earn-out dispute, which was settled on March 25, 2022 for $26.7$26.7 million, $2.9$2.9 million of severance charges primarily in Robotics, and a charge of $2.7$2.7 million for an increase in environmental and legal liabilities, partially offset by a $3.4$3.4 million gain on sale of asset.
During the year ended December 31, 2021, Teradyne recorded a charge of $12.0$12.0 million related to the arbitration claim filed against Teradyne and AutoGuide related to an earn-out dispute, $1.5$1.5 million of severance charges primarily in Robotics, $0.5$0.5 million of acquisition related compensation and expenses, and $2.5$2.5 million for other expenses, offset by a $7.2$7.2 million gain for the decrease in the fair value of the AutoGuide contingent consideration liability.
ASC 715
Defined Benefit Pension Plans
Teradyne has defined benefit pension plans covering a portion of domestic employees and employees of certain non-U.S. subsidiaries. Benefits under these plans are based on employees’ years of service and compensation. Teradyne’s funding policy is to make contributions to the plans in accordance with local laws and to the extent that such contributions are tax deductible. The assets of these plans consist primarily of fixed income and equity securities. In addition, Teradyne has an unfunded supplemental executive defined benefit plan in the United States to provide retirement benefits in excess of levels allowed by the Employment Retirement Income Security Act (“ERISA”) and the Internal Revenue Code (the “IRC”), as well as unfunded qualified foreign plans.
In 2023, Teradyne’s projected benefit obligations increased primarily due to actuarial losses of approximately $6.0 million across all pension plans from increases in discount rates, and approximately $1.0 million of losses from foreign exchange effects for foreign plans. In 2022, Teradyne’s projected benefit obligations decreased primarily due to actuarial gains of approximately $59.1$59.1 million across all pension plans from increases in discount rates, and approximately $3.1$3.1 million gain from foreign exchange effects for foreign plans. In 2021, Teradyne’s projected benefit obligations decreased primarily due to actuarial gains of approximately $8.7 million across all pension plans from increases in discount rates, and approximately $3.3 million gain from foreign exchange effects for foreign plans.
69
The December 31 balances of these defined benefit pension plans assets and obligations are shown below:
|
| 2023 |
|
| 2022 |
| ||||||||||
|
| United States |
|
| Foreign |
|
| United States |
|
| Foreign |
| ||||
|
| (in thousands) |
| |||||||||||||
Assets and Obligations |
|
|
|
|
|
|
|
|
|
|
|
| ||||
Change in benefit obligation: |
|
|
|
|
|
|
|
|
|
|
|
| ||||
Projected benefit obligation: |
|
|
|
|
|
|
|
|
|
|
|
| ||||
Beginning of year |
| $ | 143,814 |
|
| $ | 29,935 |
|
| $ | 192,472 |
|
| $ | 45,774 |
|
Service cost |
|
| 1,063 |
|
|
| 446 |
|
|
| 1,588 |
|
|
| 784 |
|
Interest cost |
|
| 6,888 |
|
|
| 1,057 |
|
|
| 4,886 |
|
|
| 482 |
|
Actuarial loss (gain) |
|
| 3,229 |
|
|
| 2,738 |
|
|
| (45,932 | ) |
|
| (13,181 | ) |
Benefits paid |
|
| (10,807 | ) |
|
| (947 | ) |
|
| (9,200 | ) |
|
| (863 | ) |
Liability (gain) loss due to settlement |
|
| — |
|
|
| (254 | ) |
|
| — |
|
|
| — |
|
Non-U.S. currency movement |
|
| — |
|
|
| 1,009 |
|
|
| — |
|
|
| (3,061 | ) |
End of year |
|
| 144,187 |
|
|
| 33,984 |
|
|
| 143,814 |
|
|
| 29,935 |
|
Change in plan assets: |
|
|
|
|
|
|
|
|
|
|
|
| ||||
Fair value of plan assets: |
|
|
|
|
|
|
|
|
|
|
|
| ||||
Beginning of year |
|
| 111,760 |
|
|
| 2,087 |
|
|
| 149,578 |
|
|
| 2,017 |
|
Actual return on plan assets |
|
| 8,613 |
|
|
| 43 |
|
|
| (31,835 | ) |
|
| 153 |
|
Company contributions |
|
| 3,051 |
|
|
| 1,028 |
|
|
| 3,217 |
|
|
| 949 |
|
Benefits paid |
|
| (10,807 | ) |
|
| (947 | ) |
|
| (9,200 | ) |
|
| (863 | ) |
Settlements gain |
|
| — |
|
|
| (254 | ) |
|
| — |
|
|
| — |
|
Non-U.S. currency movement |
|
| — |
|
|
| (28 | ) |
|
| — |
|
|
| (169 | ) |
End of year |
|
| 112,617 |
|
|
| 1,929 |
|
|
| 111,760 |
|
|
| 2,087 |
|
Funded status |
| $ | (31,570 | ) |
| $ | (32,055 | ) |
| $ | (32,054 | ) |
| $ | (27,848 | ) |
2022 | 2021 | |||||||||||||||
United States | Foreign | United States | Foreign | |||||||||||||
(in thousands) | ||||||||||||||||
Assets and Obligations | ||||||||||||||||
Change in benefit obligation: | ||||||||||||||||
Projected benefit obligation: | ||||||||||||||||
Beginning of year | $ | 192,472 | $ | 45,774 | $ | 202,233 | $ | 50,988 | ||||||||
Service cost | 1,588 | 784 | 1,784 | 941 | ||||||||||||
Interest cost | 4,886 | 482 | 4,427 | 337 | ||||||||||||
Actuarial (gain) loss | (45,932 | ) | (13,181 | ) | (6,432 | ) | (2,257 | ) | ||||||||
Benefits paid | (9,200 | ) | (863 | ) | (9,337 | ) | (925 | ) | ||||||||
Liability (gain) loss due to settlement | — | — | (204 | ) | — | |||||||||||
Non-U.S. currency movement | — | (3,061 | ) | — | (3,310 | ) | ||||||||||
End of year | 143,814 | 29,935 | 192,472 | 45,774 | ||||||||||||
Change in plan assets: | ||||||||||||||||
Fair value of plan assets: | ||||||||||||||||
Beginning of year | 149,578 | 2,017 | 158,855 | 1,856 | ||||||||||||
Actual return on plan assets | (31,835 | ) | 153 | (3,217 | ) | 33 | ||||||||||
Company contributions | 3,217 | 949 | 3,276 | 1,022 | ||||||||||||
Benefits paid | (9,200 | ) | (863 | ) | (9,337 | ) | (925 | ) | ||||||||
Non-U.S. currency movement | — | (169 | ) | — | 31 | |||||||||||
End of year | 111,760 | 2,087 | 149,578 | 2,017 | ||||||||||||
Funded status | $ | (32,054 | ) | $ | (27,848 | ) | $ | (42,894 | ) | $ | (43,757 | ) | ||||
The following table provides amounts recorded within the account line items of the statements of financial position as of December 31:
|
| 2023 |
|
| 2022 |
| ||||||||||
|
| United States |
|
| Foreign |
|
| United States |
|
| Foreign |
| ||||
|
| (in thousands) |
| |||||||||||||
Retirement plans assets |
| $ | 11,504 |
|
| $ | — |
|
| $ | 11,761 |
|
| $ | — |
|
Accrued employees’ compensation and withholdings |
|
| (3,110 | ) |
|
| (1,255 | ) |
|
| (3,055 | ) |
|
| (1,191 | ) |
Retirement plans liabilities |
|
| (39,964 | ) |
|
| (30,800 | ) |
|
| (40,760 | ) |
|
| (26,657 | ) |
Funded status |
| $ | (31,570 | ) |
| $ | (32,055 | ) |
| $ | (32,054 | ) |
| $ | (27,848 | ) |
2022 | 2021 | |||||||||||||||
United States | Foreign | United States | Foreign | |||||||||||||
(in thousands) | ||||||||||||||||
Retirement plans assets | $ | 11,761 | $ | — | $ | 15,110 | $ | — | ||||||||
Accrued employees’ compensation and withholdings | (3,055 | ) | (1,191 | ) | (3,288 | ) | (936 | ) | ||||||||
Retirement plans liabilities | (40,760 | ) | (26,657 | ) | (54,716 | ) | (42,821 | ) | ||||||||
Funded status | $ | (32,054 | ) | $ | (27,848 | ) | $ | (42,894 | ) | $ | (43,757 | ) | ||||
The accumulated benefit obligation for the United States defined benefit pension plans was $140.6$142.2 million and $187.5$140.6 million at December 31, 20222023 and 2021,2022, respectively. The accumulated benefit obligation for foreign defined benefit pension plans was $28.6$32.6 million and $42.5$28.6 million at December 31, 2023 and 2022, and 2021, respectively.
Information for pension plans with an accumulated benefit obligation in excess of plan assets as of December 31:
|
| 2023 |
|
| 2022 |
| ||||||||||
|
| United States |
|
| Foreign |
|
| United States |
|
| Foreign |
| ||||
|
| (in millions) |
| |||||||||||||
Projected benefit obligation |
| $ | 43.1 |
|
| $ | 34.0 |
|
| $ | 43.8 |
|
| $ | 29.9 |
|
Accumulated benefit obligation |
|
| 42.6 |
|
|
| 32.5 |
|
|
| 42.3 |
|
|
| 28.6 |
|
Fair value of plan assets |
|
| — |
|
|
| 1.9 |
|
|
| — |
|
|
| 2.1 |
|
2022 | 2021 | |||||||||||||||
United States | Foreign | United States | Foreign | |||||||||||||
(in millions) | ||||||||||||||||
Projected benefit obligation | $ | 43.8 | $ | 29.9 | $ | 58.0 | $ | 45.8 | ||||||||
Accumulated benefit obligation | 42.3 | 28.6 | 55.7 | 42.5 | ||||||||||||
Fair value of plan assets | — | 2.1 | — | 2.0 | ||||||||||||
70
Expense
For the years ended December 31, 2023, 2022, 2021, and 2020,2021, Teradyne’s net periodic pension cost (income) cost was comprised of the following:
|
| 2023 |
|
| 2022 |
|
| 2021 |
| |||||||||||||||
|
| United |
|
| Foreign |
|
| United |
|
| Foreign |
|
| United |
|
| Foreign |
| ||||||
|
| (in thousands) |
| |||||||||||||||||||||
Components of Net Periodic Pension Cost (Income): |
|
|
|
|
|
|
|
|
|
|
|
|
| |||||||||||
Service cost |
| $ | 1,063 |
|
| $ | 446 |
|
| $ | 1,588 |
|
| $ | 784 |
|
| $ | 1,784 |
|
| $ | 941 |
|
Interest cost |
|
| 6,888 |
|
|
| 1,057 |
|
|
| 4,886 |
|
|
| 482 |
|
|
| 4,427 |
|
|
| 337 |
|
Expected return on plan assets |
|
| (5,194 | ) |
|
| (45 | ) |
|
| (2,927 | ) |
|
| (75 | ) |
|
| (3,858 | ) |
|
| (67 | ) |
Net actuarial loss (gain) |
|
| 18 |
|
|
| 2,735 |
|
|
| (11,170 | ) |
|
| (13,259 | ) |
|
| 643 |
|
|
| (2,223 | ) |
Settlement (gain) loss |
|
| (209 | ) |
|
| 5 |
|
|
| — |
|
|
| — |
|
|
| (204 | ) |
|
| — |
|
Total net periodic pension cost (income) |
| $ | 2,566 |
|
| $ | 4,198 |
|
| $ | (7,623 | ) |
| $ | (12,068 | ) |
| $ | 2,792 |
|
| $ | (1,012 | ) |
2022 | 2021 | 2020 | ||||||||||||||||||||||
United States | Foreign | United States | Foreign | United States | Foreign | |||||||||||||||||||
(in thousands) | ||||||||||||||||||||||||
Components of Net Periodic Pension (Income) Cost: | ||||||||||||||||||||||||
Service cost | $ | 1,588 | $ | 784 | $ | 1,784 | $ | 941 | $ | 1,773 | $ | 907 | ||||||||||||
Interest cost | 4,886 | 482 | 4,427 | 337 | 5,770 | 516 | ||||||||||||||||||
Expected return on plan assets | (2,927 | ) | (75 | ) | (3,858 | ) | (67 | ) | (4,840 | ) | (65 | ) | ||||||||||||
Net actuarial(gain) loss | (11,170 | ) | (13,259 | ) | 643 | (2,223 | ) | 6,463 | 2,949 | |||||||||||||||
Settlement (gain) loss | — | — | (204 | ) | — | 451 | — | |||||||||||||||||
Total net periodic pension (income) cost | $ | (7,623 | ) | $ | (12,068 | ) | $ | 2,792 | $ | (1,012 | ) | $ | 9,617 | $ | 4,307 | |||||||||
Weighted Average Assumptions to Determine Net Periodic Pension Cost at January 1:
2022 | 2021 | 2020 | ||||||||||||||||||||||
United States | Foreign | United States | Foreign | United States | Foreign | |||||||||||||||||||
Discount rate | 2.5 | % | 1.1 | % | 2.2 | % | 0.7 | % | 2.8 | % | 1.1 | % | ||||||||||||
Expected return on plan assets | 2.0 | 4.0 | 2.4 | 3.5 | 3.0 | 3.8 | ||||||||||||||||||
Salary progression rate | 2.4 | 2.2 | 2.4 | 2.3 | 2.6 | 2.5 | ||||||||||||||||||
|
| 2023 |
|
| 2022 |
|
| 2021 |
| |||||||||||||||
|
| United |
|
| Foreign |
|
| United |
|
| Foreign |
|
| United |
|
| Foreign |
| ||||||
Discount rate |
|
| 3.5 | % |
|
| 3.5 | % |
|
| 2.5 | % |
|
| 1.1 | % |
|
| 2.2 | % |
|
| 0.7 | % |
Expected return on plan assets |
|
| 4.8 |
|
|
| 1.8 |
|
|
| 2.0 |
|
|
| 4.0 |
|
|
| 2.4 |
|
|
| 3.5 |
|
Salary progression rate |
|
| 2.4 |
|
|
| 2.1 |
|
|
| 2.4 |
|
|
| 2.2 |
|
|
| 2.4 |
|
|
| 2.3 |
|
Weighted Average Assumptions to Determine Pension Obligations at December 31:
|
| 2023 |
|
| 2022 |
| ||||||||||
|
| United States |
|
| Foreign |
|
| United States |
|
| Foreign |
| ||||
Discount rate |
|
| 4.7 | % |
|
| 3.0 | % |
|
| 4.9 | % |
|
| 3.5 | % |
Salary progression rate |
|
| 2.5 |
|
|
| 2.4 |
|
|
| 2.5 |
|
|
| 2.1 |
|
2022 | 2021 | |||||||||||||||
United States | Foreign | United States | Foreign | |||||||||||||
Discount rate | 4.9 | % | 3.5 | % | 2.6 | % | 1.1 | % | ||||||||
Salary progression rate | 2.5 | 2.1 | 2.4 | 2.2 | ||||||||||||
In developing the expected return on plan assets assumption, Teradyne evaluates input from its investment manager and pension consultants, including their forecast of asset class return expectations. Teradyne believes that 2.0%4.75% was an appropriate rate to use for fiscal year 20222023 for the U.S. Qualified Pension Plan (“U.S. Plan”).
Teradyne recognizes net actuarial gains and losses and the change in the fair value of the plan assets in its operating results in the year in which they occur or upon any interim remeasurement of the plans. Teradyne calculates the expected return on plan assets using the fair value of the plan assets. Actuarial gains and losses are generally measured annually as of December 31 and, accordingly, recorded during the fourth quarter of each year or upon any interim remeasurement of the plans.
The discount rate utilized to determine future pension obligations for the U.S. Plan is based on FTSE Pension Index adjusted for the plan’s expected cash flows and was 4.9%4.7% at December 31, 2022, up2023, down from 2.6%4.9% at December 31, 2021.
Plan Assets
As of December 31, 2022,2023, the fair value of Teradyne’s pension plans’ assets totaled $113.8$114.5 million, of which $111.8$112.6 million was related to the U.S. Plan and $2.1$1.9 million was related to the Taiwan defined benefit pension plan. Substantially all of Teradyne’s pension plans’ assets are held in individual trusts, which were established for the investment of assets of Teradyne’s sponsored retirement plans.
71
The following table provides weighted average pension asset allocation by asset category at December 31, 20222023 and 2021:2022:
|
| 2023 |
|
| 2022 |
| ||||||||||
|
| United States |
|
| Foreign |
|
| United States |
|
| Foreign |
| ||||
Fixed income securities |
|
| 94.0 | % |
|
| — | % |
|
| 94.0 | % |
|
| — | % |
Equity securities |
|
| 5.0 |
|
|
| — |
|
|
| 5.0 |
|
|
| — |
|
Other |
|
| 1.0 |
|
|
| 100.0 |
|
|
| 1.0 |
|
|
| 100.0 |
|
|
|
| 100.0 | % |
|
| 100.0 | % |
|
| 100.0 | % |
|
| 100.0 | % |
2022 | 2021 | |||||||||||||||
United States | Foreign | United States | Foreign | |||||||||||||
Fixed income securities | 94.0 | % | — | % | 94.0 | % | — | % | ||||||||
Equity securities | 5.0 | — | 5.0 | — | ||||||||||||
Other | 1.0 | 100.0 | 1.0 | 100.0 | ||||||||||||
| 100.0 | % | 100.0 | % | 100.0 | % | 100.0 | % | |||||||||
The assets of the U.S. Plan are overseen by the Teradyne Fiduciary Committee which is comprised of members of senior management drawn from appropriate diversified levels of the management team. The Fiduciary Committee is responsible for setting the policy that provides the framework for management of the U.S. Plan assets. In accordance with its responsibilities, the Fiduciary Committee meets on a regular basis to review the performance of the U.S. Plan assets and compliance with the investment policy. The policy sets forth an investment structure for managing U.S. Plan assets, including setting the asset allocation ranges, which are expected to provide an appropriate level of overall diversification required to maximize the long-term return on plan assets for a prudent and reasonable level of risk given prevailing market conditions, total investment return over the long term, and preservation of capital, while maintaining sufficient liquidity to pay the benefits of the U.S. Plan. The investment portfolio will not, at any time, have a direct investment in Teradyne stock. It may have indirect investment in Teradyne stock, if one of the funds selected by the investment manager invests in Teradyne stock. In developing the asset allocation ranges, third party asset allocation studies are periodically performed that consider the current and expected positions of the plan assets and funded status. Based on this study and other appropriate information, the Fiduciary Committee establishes asset allocation ranges taking into account acceptable risk targets and associated returns. The investment return objectives are to avoid excessive volatility and produce a rate of return that at least matches the Policy Index identified below. The manager’s investment performance is reviewed at least annually. Results for the total portfolio and for each major category of assets are evaluated in comparison with appropriate market indices and the Policy Index.
The target asset allocation and the index for each asset category for the U.S. Plan, per the investment policy, are as follows:
Asset Category: | Policy Index: | Target | |||||
U.S. corporate fixed income | Bloomberg | 43 | % | ||||
U.S. corporate fixed income | Bloomberg U.S. Corporate A or Better Index, 5- 20 Year Index | 32 | |||||
U.S. government fixed income | Bloomberg | 14 | |||||
Global equity | MSCI World | 5 | |||||
High yield fixed income | ICE BofA BB-B U.S. | 5 | |||||
Cash | ICE BofA 3-Month Treasury BillIndex | 1 | |||||
Teradyne’s U.S. Plan invests primarily in common trust funds. Units held in the common trust funds are valued at the unit price as reported by the investment manager based on the asset value of the underlying investments; underlying investments in equity securities are valued at the last reported sales price, and underlying investments in fixed-income securities are generally valued using methods based upon market transactions for comparable securities.
During the years ended December 31, 20222023 and December 31, 2021,2022, there were no transfers of pension assets in or out of Level 1, Level 2, and Level 3.
72
The fair value of pension plan assets by asset category and by level at December 31, 20222023 and December 31, 2021
|
| December 31, 2023 |
| |||||||||||||||||||||||||||||
|
| United States |
|
| Foreign |
| ||||||||||||||||||||||||||
|
| Level 1 |
|
| Level 2 |
|
| Level 3 |
|
| Total |
|
| Level 1 |
|
| Level 2 |
|
| Level 3 |
|
| Total |
| ||||||||
|
| (in thousands) |
| |||||||||||||||||||||||||||||
Fixed income securities: |
|
|
|
|
|
|
|
|
|
|
|
|
|
|
|
|
|
|
|
|
|
|
|
| ||||||||
Corporate debt securities |
| $ | — |
|
| $ | 89,971 |
|
| $ | — |
|
| $ | 89,971 |
|
| $ | — |
|
| $ | — |
|
| $ | — |
|
| $ | — |
|
U.S. government securities |
|
| — |
|
|
| 15,817 |
|
|
| — |
|
|
| 15,817 |
|
|
| — |
|
|
| — |
|
|
| — |
|
|
| — |
|
Global equity |
|
| — |
|
|
| 5,691 |
|
|
| — |
|
|
| 5,691 |
|
|
| — |
|
|
| — |
|
|
| — |
|
|
| — |
|
Other |
|
| — |
|
|
| — |
|
|
| — |
|
|
| — |
|
|
| — |
|
|
| 1,929 |
|
|
| — |
|
|
| 1,929 |
|
Cash and cash equivalents |
|
| 1,138 |
|
|
| — |
|
|
| — |
|
|
| 1,138 |
|
|
| — |
|
|
| — |
|
|
| — |
|
|
| — |
|
Total |
| $ | 1,138 |
|
| $ | 111,479 |
|
| $ | — |
|
| $ | 112,617 |
|
| $ | — |
|
| $ | 1,929 |
|
| $ | — |
|
| $ | 1,929 |
|
|
| December 31, 2022 |
| |||||||||||||||||||||||||||||
|
| United States |
|
| Foreign |
| ||||||||||||||||||||||||||
|
| Level 1 |
|
| Level 2 |
|
| Level 3 |
|
| Total |
|
| Level 1 |
|
| Level 2 |
|
| Level 3 |
|
| Total |
| ||||||||
|
| (in thousands) |
| |||||||||||||||||||||||||||||
Fixed income securities: |
|
|
|
|
|
|
|
|
|
|
|
|
|
|
|
|
|
|
|
|
|
|
|
| ||||||||
Corporate debt securities |
| $ | — |
|
| $ | 89,403 |
|
| $ | — |
|
| $ | 89,403 |
|
| $ | — |
|
| $ | — |
|
| $ | — |
|
| $ | — |
|
U.S. government securities |
|
| — |
|
|
| 15,631 |
|
|
| — |
|
|
| 15,631 |
|
|
| — |
|
|
| — |
|
|
| — |
|
|
| — |
|
Global equity |
|
| — |
|
|
| 5,579 |
|
|
| — |
|
|
| 5,579 |
|
|
| — |
|
|
| — |
|
|
| — |
|
|
| — |
|
Other |
|
| — |
|
|
| — |
|
|
| — |
|
|
| — |
|
|
| — |
|
|
| 2,087 |
|
|
| — |
|
|
| 2,087 |
|
Cash and cash equivalents |
|
| 1,147 |
|
|
| — |
|
|
| — |
|
|
| 1,147 |
|
|
| — |
|
|
| — |
|
|
| — |
|
|
| — |
|
Total |
| $ | 1,147 |
|
| $ | 110,613 |
|
| $ | — |
|
| $ | 111,760 |
|
| $ | — |
|
| $ | 2,087 |
|
| $ | — |
|
| $ | 2,087 |
|
December 31, 2022 | ||||||||||||||||||||||||||||||||
United States | Foreign | |||||||||||||||||||||||||||||||
Level 1 | Level 2 | Level 3 | Total | Level 1 | Level 2 | Level 3 | Total | |||||||||||||||||||||||||
(in thousands) | ||||||||||||||||||||||||||||||||
Fixed income securities: | ||||||||||||||||||||||||||||||||
Corporate debt securities | $ | — | $ | 89,403 | $ | — | $ | 89,403 | $ | — | $ | — | $ | — | $ | — | ||||||||||||||||
U.S. government securities | — | 15,631 | — | 15,631 | — | — | — | — | ||||||||||||||||||||||||
Global equity | — | 5,579 | — | 5,579 | — | — | — | — | ||||||||||||||||||||||||
Other | — | — | — | — | — | 2,087 | — | 2,087 | ||||||||||||||||||||||||
Cash and cash equivalents | 1,147 | — | — | 1,147 | — | — | — | — | ||||||||||||||||||||||||
Total | $ | 1,147 | $ | 110,613 | $ | — | $ | 111,760 | $ | — | $ | 2,087 | $ | — | $ | 2,087 | ||||||||||||||||
December 31, 2021 | ||||||||||||||||||||||||||||||||
United States | Foreign | |||||||||||||||||||||||||||||||
Level 1 | Level 2 | Level 3 | Total | Level 1 | Level 2 | Level 3 | Total | |||||||||||||||||||||||||
(in thousands) | ||||||||||||||||||||||||||||||||
Fixed income securities: | ||||||||||||||||||||||||||||||||
Corporate debt securities | $ | — | $ | 119,805 | $ | — | $ | 119,805 | $ | — | $ | — | $ | — | $ | — | ||||||||||||||||
U.S. government securities | — | 20,847 | — | 20,847 | — | — | — | — | ||||||||||||||||||||||||
Global equity | — | 7,426 | — | 7,426 | — | — | — | — | ||||||||||||||||||||||||
Other | — | — | — | — | — | 2,017 | — | 2,017 | ||||||||||||||||||||||||
Cash and cash equivalents | 1,500 | — | — | 1,500 | — | — | — | — | ||||||||||||||||||||||||
Total | $ | 1,500 | $ | 148,078 | $ | — | $ | 149,578 | $ | — | $ | 2,017 | $ | — | $ | 2,017 | ||||||||||||||||
Contributions
Teradyne’s funding policy is to make contributions to the plans in accordance with local laws and to the extent that such contributions are tax deductible. During 2022,2023, Teradyne contributed $3.2$3.1 million to the U.S. supplemental executive defined benefit pension plan and $0.9$1.0 million to certain qualified plans for non-U.S. subsidiaries. During 2021,2022, Teradyne contributed $3.3$3.2 million to the U.S. supplemental executive defined benefit pension plan and $1.0$0.9 million to certain qualified plans for non-U.S. subsidiaries. In 2023,2024, contributions to the U.S. supplemental executive defined benefit pension plan and certain qualified plans from non-U.S. subsidiaries will be approximately $3.1$3.1 million and $1.3$1.4 million, respectively.
Contributions to the U.S. supplemental executive defined benefit pension plan and certain non-U.S. subsidiaries qualified plans will be approximately $6.4$6.6 million and $2.1$2.3 million, respectively, in 1 to 3 years, $7.1$7.1 million and $2.3$2.5 million, respectively, in 3 to 5 years and $17.4$16.9 million and $7.0$7.9 million, respectively, thereafter.
Expected Future Pension Benefit Payments
Future benefit payments are expected to be paid as follows:
|
| United States |
|
| Foreign |
| ||
|
| (in thousands) |
| |||||
2024 |
| $ | 10,210 |
|
| $ | 1,312 |
|
2025 |
|
| 9,720 |
|
|
| 1,068 |
|
2026 |
|
| 9,863 |
|
|
| 1,191 |
|
2027 |
|
| 10,792 |
|
|
| 1,301 |
|
2028 |
|
| 10,795 |
|
|
| 1,238 |
|
2029-2032 |
|
| 51,857 |
|
|
| 8,832 |
|
73
United States | Foreign | |||||||
(in thousands) | ||||||||
2023 | $ | 10,323 | $ | 1,239 | ||||
2024 | 9,274 | 1,055 | ||||||
2025 | 9,912 | 1,014 | ||||||
2026 | 9,971 | 1,130 | ||||||
2027 | 10,742 | 1,239 | ||||||
2028-2031 | 52,877 | 8,216 | ||||||
Postretirement Benefit Plans
In addition to receiving pension benefits, U.S. Teradyne employees who meet early retirement eligibility requirements as of their termination dates may participate in Teradyne’s Welfare Plan, which includes medical and dental benefits up to age 65. Death benefits provide a fixed sum to retirees’ survivors and are available to all retirees. Substantially all of Teradyne’s current U.S. employees could become eligible for these benefits, and the existing benefit obligation relates primarily to those employees.
The December 31 balances of the postretirement assets and obligations are shown below:
|
| 2023 |
|
| 2022 |
| ||
|
| (in thousands) |
| |||||
Assets and Obligations |
|
|
|
|
|
| ||
Change in benefit obligation: |
|
|
|
|
|
| ||
Projected benefit obligation: |
|
|
|
|
|
| ||
Beginning of year |
| $ | 5,345 |
|
| $ | 7,210 |
|
Service cost |
|
| 34 |
|
|
| 64 |
|
Interest cost |
|
| 299 |
|
|
| 177 |
|
Actuarial loss (gain) |
|
| 155 |
|
|
| (1,155 | ) |
Benefits paid |
|
| (1,413 | ) |
|
| (950 | ) |
Special termination benefits |
|
| 2,513 |
|
|
| — |
|
End of year |
|
| 6,933 |
|
|
| 5,345 |
|
Change in plan assets: |
|
|
|
|
|
| ||
Fair value of plan assets: |
|
|
|
|
|
| ||
Beginning of year |
|
| — |
|
|
| — |
|
Company contributions |
|
| 1,413 |
|
|
| 950 |
|
Benefits paid |
|
| (1,413 | ) |
|
| (950 | ) |
End of year |
|
| — |
|
|
| — |
|
Funded status |
| $ | (6,933 | ) |
| $ | (5,345 | ) |
2022 | 2021 | |||||||
(in thousands) | ||||||||
Assets and Obligations | ||||||||
Change in benefit obligation: | ||||||||
Projected benefit obligation: | ||||||||
Beginning of year | $ | 7,210 | $ | 8,515 | ||||
Service cost | 64 | 64 | ||||||
Interest cost | 177 | 170 | ||||||
Actuarial gain | (1,155 | ) | (433 | ) | ||||
Benefits paid | (950 | ) | (1,107 | ) | ||||
End of year | 5,345 | 7,210 | ||||||
Change in plan assets: | ||||||||
Fair value of plan assets: | ||||||||
Beginning of year | — | — | ||||||
Company contributions | 950 | 1,107 | ||||||
Benefits paid | (950 | ) | (1,107 | ) | ||||
End of year | — | — | ||||||
Funded status | $ | (5,345 | ) | $ | (7,210 | ) | ||
The following table provides amounts recorded within the account line items of financial position as of December 31:
|
| 2023 |
|
| 2022 |
| ||
|
| (in thousands) |
| |||||
Accrued employees’ compensation and withholdings |
| $ | (1,508 | ) |
| $ | (853 | ) |
Retirement plans liabilities |
|
| (5,425 | ) |
|
| (4,492 | ) |
Funded status |
| $ | (6,933 | ) |
| $ | (5,345 | ) |
2022 | 2021 | |||||||
(in thousands) | ||||||||
Accrued employees’ compensation and withholdings | $ | (853 | ) | $ | (930 | ) | ||
Retirement plans liability | (4,492 | ) | (6,280 | ) | ||||
Funded status | $ | (5,345 | ) | $ | (7,210 | ) | ||
The following table provides amounts recognized in accumulated other comprehensive income (loss) as of December 31:
|
| 2023 |
|
| 2022 |
| ||
|
| (in thousands) |
| |||||
Prior service credit, before tax |
| $ | (23 | ) |
| $ | (31 | ) |
Deferred taxes |
|
| (1,691 | ) |
|
| (1,689 | ) |
Total recognized in other comprehensive income (loss), net of tax |
| $ | (1,714 | ) |
| $ | (1,720 | ) |
74
Expense
2022 | 2021 | |||||||
(in thousands) | ||||||||
Prior service credit, before tax | $ | (31 | ) | $ | (40 | ) | ||
Deferred taxes | (1,689 | ) | (1,688 | ) | ||||
Total recognized in other comprehensive income (loss), net of tax | $ | (1,720 | ) | $ | (1,728 | ) | ||
For the years ended December 31, 2023, 2022, 2021, and 2020,2021, Teradyne’s net periodic postretirement benefit cost (income) cost was comprised of the following:
|
| 2023 |
|
| 2022 |
|
| 2021 |
| |||
|
| (in thousands) |
| |||||||||
Components of Net Periodic Postretirement Benefit Cost (income): |
| |||||||||||
Service cost |
| $ | 34 |
|
| $ | 64 |
|
| $ | 64 |
|
Interest cost |
|
| 299 |
|
|
| 177 |
|
|
| 170 |
|
Amortization of prior service credit |
|
| (9 | ) |
|
| (9 | ) |
|
| (9 | ) |
Net actuarial loss (gain) |
|
| 155 |
|
|
| (1,155 | ) |
|
| (433 | ) |
Special termination benefits |
|
| 2,513 |
|
|
| — |
|
|
| — |
|
Total net periodic postretirement benefit cost (income) |
|
| 2,992 |
|
|
| (923 | ) |
|
| (208 | ) |
Changes in Plan Assets and Benefit Obligations Recognized in Other |
|
|
|
|
|
|
|
|
| |||
Reversal of amortization items: |
|
|
|
|
|
|
|
|
| |||
Prior service credit |
|
| 9 |
|
|
| 9 |
|
|
| 9 |
|
Total recognized in other comprehensive income |
|
| 9 |
|
|
| 9 |
|
|
| 9 |
|
Total recognized in net periodic postretirement cost (income) and other |
| $ | 3,001 |
|
| $ | (914 | ) |
| $ | (199 | ) |
2022 | 2021 | 2020 | ||||||||||
(in thousands) | ||||||||||||
Components of Net Periodic Postretirement Benefit Income (cost ): | ||||||||||||
Service cost | $ | 64 | $ | 64 | $ | 57 | ||||||
Interest cost | 177 | 170 | 240 | |||||||||
Amortization of prior service credit | (9 | ) | (9 | ) | (9 | ) | ||||||
Net actuarial (gain) loss | (1,155 | ) | (433 | ) | 421 | |||||||
Total net periodic postretirement benefit (income) cost | (923 | ) | (208 | ) | 709 | |||||||
Changes in Plan Assets and Benefit Obligations Recognized in Other Comprehensive Income: | ||||||||||||
Reversal of amortization items: | ||||||||||||
Prior service credit | 9 | 9 | 9 | |||||||||
Total recognized in other comprehensive income | 9 | 9 | 9 | |||||||||
Total recognized in net periodic postretirement (income) cost and other comprehensive income | $ | (914 | ) | $ | (199 | ) | $ | 718 | ||||
Weighted Average Assumptions to Determine Net Periodic Postretirement Benefit Income as of January 1:
2022 | 2021 | 2020 | ||||||||||
Discount rate | 2.6 | % | 2.2 | % | 3.0 | % | ||||||
Initial health care cost trend rate | 7.3 | 7.3 | 7.1 | |||||||||
Ultimate health care cost trend rate | 4.5 | 4.5 | 4.5 | |||||||||
Year in which ultimate health care cost trend rate is reached | 2029 | 2029 | 2026 | |||||||||
|
| 2023 |
|
| 2022 |
|
| 2021 |
| |||
Discount rate |
|
| 5.0 | % |
|
| 2.6 | % |
|
| 2.2 | % |
Initial health care cost trend rate |
|
| 7.2 |
|
|
| 7.3 |
|
|
| 7.3 |
|
Ultimate health care cost trend rate |
|
| 4.5 |
|
|
| 4.5 |
|
|
| 4.5 |
|
Year in which ultimate health care cost trend rate is reached |
| 2032 |
|
| 2029 |
|
| 2029 |
| |||
Weighted Average Assumptions to Determine Postretirement Benefit Obligation as of December 31:
|
| 2023 |
|
| 2022 |
|
| 2021 |
| |||
Discount rate |
|
| 4.7 | % |
|
| 5.0 | % |
|
| 2.6 | % |
Initial health care trend |
|
| 7.7 |
|
|
| 7.2 |
|
|
| 7.3 |
|
Ultimate health care trend |
|
| 4.5 |
|
|
| 4.5 |
|
|
| 4.5 |
|
Medical cost trend rate decrease to ultimate rate in year |
|
| 2033 |
|
|
| 2032 |
|
|
| 2029 |
|
2022 | 2021 | 2020 | ||||||||||
Discount rate | 5.0 | % | 2.6 | % | 2.2 | % | ||||||
Initial medical trend | 7.2 | 7.3 | 7.3 | |||||||||
Ultimate health care trend | 4.5 | 4.5 | 4.5 | |||||||||
Medical cost trend rate decrease to ultimate rate in year | 2032 | 2029 | 2029 | |||||||||
Contributions
Contributions to the U.S. postretirement benefit plan will be approximately $0.9$1.5 million in 2023, $1.32024, $1.6 million in 1 to 3 years, $0.8$1.2 million in 3 to 5 years and $1.3$2.0 million, thereafter.
Expected Future Benefit Payments
Future benefit payments are expected to be paid as follows:
|
| Benefit Payments |
| |
|
| (in thousands) |
| |
2024 |
| $ | 1,508 |
|
2025 |
|
| 924 |
|
2026 |
|
| 701 |
|
2027 |
|
| 637 |
|
2028 |
|
| 568 |
|
2029-2032 |
|
| 2,004 |
|
75
Benefit Payments | ||||
(in thousands) | ||||
2023 | $ | 853 | ||
2023 | 688 | |||
2024 | 573 | |||
2025 | 436 | |||
2027 | 386 | |||
2028-2031 | 1,291 | |||
Stock Compensation Plans
On February 1, 2023 (the “Retirement Date”), Mark E. Jagiela retired as Chief Executive Officer of Teradyne and a member of Teradyne's Board of Directors, and Teradyne entered into an agreement (the “Retirement Agreement”) with Mr. Jagiela. Under the Retirement Agreement, Mr. Jagiela's unvested time-based restricted stock units and stock options granted prior to his Retirement Date were modified to allow continued vesting; and any vested options or options that vest during that period may be exercised for the remainder of the applicable option term. During 2023, Teradyne recorded a stock-based compensation expense of $5.9 million related to the Retirement Agreement.
Under Teradyne’s stock compensation plans, Teradyne grants time-based restricted stock units, performance-based restricted stock units, and stock options, and employees are eligible to purchase Teradyne’s common stock through its Employee Stock Purchase Plan (“ESPP”).
Service-based restricted stock unit awards granted to employees vest in equal annual installments over four years.years. Restricted stock unit awards granted to non-employee directors vest after a one-year period, with 100%100% of the award vesting on the earlier of (a) the first anniversary of the grant date or (b) the date of the following year’s Annual Meeting of Shareholders. Teradyne expenses the cost of the restricted stock unit awards subject to time-based vesting, which is determined to be the fair market value of the shares at the date of grant, ratably over the period during which the restrictions lapse.
Performance-based restricted stock units (“PRSUs”) granted to Teradyne’s executive officers may have a performance metric based on relative total shareholder return (“TSR”). Teradyne’s three-year TSR performance is measured against the New York Stock Exchange (“NYSE”) Composite Index. The final number of TSR PRSUs that vest will vary based upon the level of performance achieved from 0%0% to 200%200% of the target shares. The TSR PRSUs will vest upon the three-year anniversary of the grant date. The TSR PRSUs are valued using a Monte Carlo simulation model. The number of units expected to be earned, based upon the achievement of the TSR market condition, is factored into the grant date Monte Carlo valuation. Compensation expense is recognized on a straight-line basis over the shorter of the three-year service period or the period from the grant to the date described in the retirement provisions below. Compensation expense for executive officers meeting the retirement provisions prior to the grant date is recognized during the year following the grant. Compensation expense is recognized regardless of the eventual number of units that are earned based upon the market condition, provided the executive officer remains an employee at the end of the three-year period. Compensation expense is reversed if at any time during the three-year service period the executive officer is no longer an employee, subject to the retirement and termination eligibility provisions noted below.
PRSUs granted to Teradyne’s executive officers may also have a performance metric based on three-year cumulative non-GAAP profit before interest and tax (“PBIT”) as a percent of Teradyne’s revenue. Non-GAAP PBIT is a financial measure equal to GAAP income from operations less restructuring and other, net; amortization of acquired intangible assets; acquisition and divestiture related charges or credits; pension actuarial gains and losses; non-cash convertible debt interest expense; and other non-recurring gains and charges. The final
If a PRSU recipient’s employment ends prior to the determination of the performance percentage due to (1) permanent disability or death or (2) retirement or termination other than for cause, after attaining both at least age sixty and at least ten years of service, then all or a portion of the recipient’s PRSUs (based on the actual performance percentage achieved on the determination date) will vest on the date the performance percentage is determined. Except as set forth in the preceding sentence, no PRSUs will vest if the executive officer is no longer an employee at the end of the three-year period. Stock options to purchase Teradyne’s common stock at 100%100% of the fair marketyears.
During 2023, 2022 2021 and 2020,2021, Teradyne granted 0.40.5 million, 0.30.4 million and 0.40.3 million of service-based restricted stock unit awards to employees at a weighted average grant date fair value of $109.42, $114.16,$102.45, $109.42, and $71.31,$114.16, respectively.
76
During 2023, 2022 2021, and 2020,2021, Teradyne granted 0.1 million of service-based restricted stock unit awards to non-employee directors at a weighted average grant date fair value of $105.93, $128.70,$90.50, $105.93, and $66.56,$128.70, respectively.
During 2023, 2022 2021, and 2020,2021, Teradyne granted 0.1 million of PBIT PRSUs with a grant date fair value of $110.84, $113.65$102.91, $110.84 and $70.94,$113.65, respectively.
During 2023, 2022 2021 and 2020,2021, Teradyne granted 0.1 million TSR PRSUs, with a grant date fair value of $101.06, $125.02,$139.04, $101.06, and $89.93,$125.02, respectively. The fair value was estimated using the Monte Carlo simulation model with the following assumptions:
|
| 2023 |
|
| 2022 |
|
| 2021 |
| |||
Risk-free interest rate |
|
| 4.0 | % |
|
| 1.4 | % |
|
| 0.2 | % |
Teradyne volatility-historical |
|
| 49.7 | % |
|
| 47.1 | % |
|
| 43.9 | % |
NYSE Composite Index volatility-historical |
|
| 24.1 | % |
|
| 22.7 | % |
|
| 22.9 | % |
Dividend yield |
|
| 0.4 | % |
|
| 0.4 | % |
|
| 0.4 | % |
2022 | 2021 | 2020 | ||||||||||
Risk-free interest rate | 1.4 | % | 0.2 | % | 1.5 | % | ||||||
Teradyne volatility-historical | 47.1 | % | 43.9 | % | 34.9 | % | ||||||
NYSE Composite Index volatility-historical | 22.7 | % | 22.9 | % | 11.4 | % | ||||||
Dividend yield | 0.4 | % | 0.4 | % | 0.6 | % | ||||||
Expected volatility was based on the historical volatility of Teradyne’s stock and the NYSE Composite Index for each of the 2023, 2022 2021 and 20202021 grants over the most recent three-year period. The risk-free interest rate was determined using the U.S. Treasury yield curve in effect at the time of each of the grants. Dividend yield was based upon an estimated annual dividend amount of $0.44$0.44 per share for 2023, $0.44 per share for 2022, $0.40and $0.40 per share for 2021, and $0.40 per share for 2020, divided by Teradyne’s stock price on the grant date of $112.12$104.12 for the 2023 grants, $112.12 for the 2022 grants, $113.48and $113.48 for the 2021 grants,grants.
During 2023, 2022 and $72.10 for the 2020 grants.
The fair value of stock options was estimated using the Black-Scholes option-pricing model with the following assumptions:
|
| 2023 |
|
| 2022 |
|
| 2021 |
| |||
Expected life (years) |
|
| 4.0 |
|
|
| 4.0 |
|
|
| 5.0 |
|
Risk-free interest rate |
|
| 3.8 | % |
|
| 1.6 | % |
|
| 0.4 | % |
Volatility-historical |
|
| 46.6 | % |
|
| 43.7 | % |
|
| 37.8 | % |
Dividend yield |
|
| 0.4 | % |
|
| 0.4 | % |
|
| 0.4 | % |
2022 | 2021 | 2020 | ||||||||||
Expected life (years) | 4.0 | 5.0 | 5.0 | |||||||||
Risk-free interest rate | 1.6 | % | 0.4 | % | 1.5 | % | ||||||
Volatility-historical | 43.7 | % | 37.8 | % | 32.0 | % | ||||||
Dividend yield | 0.4 | % | 0.4 | % | 0.5 | % | ||||||
Teradyne determined the stock options’ expected life based upon historical exercise data for executive officers, the age of the executive officers and the terms of the stock option grant. Volatility was determined using historical volatility for a period equal to the expected life. The risk-free interest rate was determined using the U.S. Treasury yield curve in effect at the time of grant. Dividend yield was based upon an estimated annual dividend amount of $0.44$0.44 per share divided by Teradyne’s stock on the grant date of $112.12$104.15 for the 2023 grant, and $112.12 for the 2022 grant, $0.40and $0.40 per share divided by Teradyne’s stock price on the grant date of $113.48$113.48 for the 2021 grants, and $72.61 for the 2020 grants.
Stock compensation plan activity for the years 2023, 2022 2021, and 2020,2021, is as follows:
|
| 2023 |
|
| 2022 |
|
| 2021 |
| |||
|
| (in thousands) |
| |||||||||
Restricted Stock Units: |
|
|
|
|
|
|
|
|
| |||
Non-vested at January 1 |
|
| 1,317 |
|
|
| 1,417 |
|
|
| 1,789 |
|
Awarded |
|
| 728 |
|
|
| 660 |
|
|
| 447 |
|
Vested |
|
| (609 | ) |
|
| (709 | ) |
|
| (749 | ) |
Forfeited |
|
| (58 | ) |
|
| (51 | ) |
|
| (70 | ) |
Non-vested at December 31 |
|
| 1,378 |
|
|
| 1,317 |
|
|
| 1,417 |
|
Stock Options: |
|
|
|
|
|
|
|
|
| |||
Outstanding at January 1 |
|
| 188 |
|
|
| 171 |
|
|
| 216 |
|
Granted |
|
| 41 |
|
|
| 42 |
|
|
| 34 |
|
Exercised |
|
| (56 | ) |
|
| (25 | ) |
|
| (78 | ) |
Forfeited |
|
| (2 | ) |
|
| — |
|
|
| (1 | ) |
Expired |
|
| — |
|
|
| — |
|
|
| — |
|
Outstanding at December 31 |
|
| 171 |
|
|
| 188 |
|
|
| 171 |
|
Vested and expected to vest at December 31 |
|
| 171 |
|
|
| 188 |
|
|
| 171 |
|
Exercisable at December 31 |
|
| 68 |
|
|
| 69 |
|
|
| 30 |
|
77
2022 | 2021 | 2020 | ||||||||||
(in thousands) | ||||||||||||
Restricted Stock Units: | ||||||||||||
Non-vested at January 1 | 1,417 | 1,789 | 2,269 | |||||||||
Awarded | 660 | 447 | 616 | |||||||||
Vested | (709 | ) | (749 | ) | (1,028 | ) | ||||||
Forfeited | (51 | ) | (70 | ) | (68 | ) | ||||||
Non-vested at December 31 | 1,317 | 1,417 | 1,789 | |||||||||
Stock Options: | ||||||||||||
Outstanding at January 1 | 171 | 216 | 319 | |||||||||
Granted | 42 | 34 | 56 | |||||||||
Exercised | (25 | ) | (78 | ) | (159 | ) | ||||||
Forfeited | — | (1 | ) | — | ||||||||
Expired | — | — | — | |||||||||
Outstanding at December 31 | 188 | 171 | 216 | |||||||||
Vested and expected to vest at December 31 | 188 | 171 | 216 | |||||||||
Exercisable at December 31 | 69 | 30 | 27 | |||||||||
Total shares available for the years 2023, 2022 2021, and 2020:2021:
|
| 2023 |
|
| 2022 |
|
| 2021 |
| |||
|
| (in thousands) |
| |||||||||
Shares available: |
|
|
|
|
|
|
|
|
| |||
Available for grant at January 1 |
|
| 5,062 |
|
|
| 5,713 |
|
|
| 6,123 |
|
Options granted |
|
| (41 | ) |
|
| (42 | ) |
|
| (34 | ) |
Options forfeited |
|
| 2 |
|
|
| — |
|
|
| 1 |
|
Restricted stock units awarded |
|
| (728 | ) |
|
| (660 | ) |
|
| (447 | ) |
Restricted stock units forfeited |
|
| 58 |
|
|
| 51 |
|
|
| 70 |
|
Available for grant at December 31 |
|
| 4,353 |
|
|
| 5,062 |
|
|
| 5,713 |
|
2022 | 2021 | 2020 | ||||||||||
(in thousands) | ||||||||||||
Shares available: | ||||||||||||
Available for grant at January 1 | 5,713 | 6,123 | 6,727 | |||||||||
Options granted | (42 | ) | (34 | ) | (56 | ) | ||||||
Options forfeited | — | 1 | — | |||||||||
Restricted stock units awarded | (660 | ) | (447 | ) | (616 | ) | ||||||
Restricted stock units forfeited | 51 | 70 | 68 | |||||||||
Available for grant at December 31 | 5,062 | 5,713 | 6,123 | |||||||||
Weighted average restricted stock unit award date fair value information for the years 2023, 2022 2021, and 2020,2021, is as follows:
|
| 2023 |
|
| 2022 |
|
| 2021 |
| |||
Non-vested at January 1 |
| $ | 88.71 |
|
| $ | 67.97 |
|
| $ | 47.84 |
|
Awarded |
|
| 105.05 |
|
|
| 108.74 |
|
|
| 115.51 |
|
Vested |
|
| 75.55 |
|
|
| 54.27 |
|
|
| 43.99 |
|
Forfeited |
|
| 102.12 |
|
|
| 85.71 |
|
|
| 65.52 |
|
Non-vested at December 31 |
| $ | 101.00 |
|
| $ | 88.71 |
|
| $ | 67.97 |
|
2022 | 2021 | 2020 | ||||||||||
Non-vested at January 1 | $ | 67.97 | $ | 47.84 | $ | 35.58 | ||||||
Awarded | 108.74 | 115.51 | 72.76 | |||||||||
Vested | 54.27 | 43.99 | 31.53 | |||||||||
Forfeited | 85.71 | 65.52 | 45.36 | |||||||||
Non-vested at December 31 | $ | 88.71 | $ | 67.97 | $ | 47.84 | ||||||
Restricted stock unit awards aggregate intrinsic value information at December 31 for the years 2023, 2022 2021, and 20202021 is as follows:
|
| 2023 |
|
| 2022 |
|
| 2021 |
| |||
|
| (in thousands) |
| |||||||||
Vested |
| $ | 62,001 |
|
| $ | 95,408 |
|
| $ | 101,679 |
|
Outstanding |
|
| 149,504 |
|
|
| 115,087 |
|
|
| 231,763 |
|
Expected to vest |
|
| 135,238 |
|
|
| 108,666 |
|
|
| 231,246 |
|
2022 | 2021 | 2020 | ||||||||||
(in thousands) | ||||||||||||
Vested | $ | 95,408 | $ | 101,679 | $ | 71,582 | ||||||
Outstanding | 115,087 | 231,763 | 214,509 | |||||||||
Expected to vest | 108,666 | 231,246 | 210,301 | |||||||||
Restricted stock units weighted average remaining contractual terms (in years) information at December 31 for the years 2023, 2022 2021, and 20202021 is as follows:
|
| 2023 |
|
| 2022 |
|
| 2021 |
| |||
Outstanding |
|
| 1.13 |
|
|
| 0.99 |
|
|
| 0.89 |
|
Expected to vest |
|
| 1.13 |
|
|
| 0.99 |
|
|
| 0.89 |
|
2022 | 2021 | 2020 | ||||||||||
Outstanding | 0.99 | 0.89 | 0.96 | |||||||||
Expected to vest | 0.99 | 0.89 | 0.96 | |||||||||
Weighted average stock options exercise price information for the year ended December 31, 20222023 is as follows:
|
| 2023 |
| |
Outstanding at January 1 |
| $ | 76.52 |
|
Options granted |
|
| 104.15 |
|
Options exercised |
|
| 39.71 |
|
Options forfeited |
|
| 112.57 |
|
Options cancelled |
|
| 113.03 |
|
Outstanding at December 31 |
|
| 94.85 |
|
Exercisable at December 31 |
|
| 81.53 |
|
2022 | ||||
Outstanding at January 1 | $ | 62.13 | ||
Options granted | 112.12 | |||
Options exercised | 37.13 | |||
Options forfeited | — | |||
Options cancelled | — | |||
Outstanding at December 31 | 76.52 | |||
Exercisable at December 31 | 55.90 | |||
The total cash received from employees as a result of employee stock options exercised during the years ended December 31, 2023, 2022 and 2021, and 2020, was $0.9$2.2 million, $3.1$0.9 million, and $3.8$3.1 million, respectively. In connection with these exercises, the tax benefit realized by Teradyne for the years ended December 31, 2023, 2022 and 2021, and 2020, was $0.1$0.2 million, $0.4$0.1 million, and $1.5$0.4 million, respectively.
78
Stock option aggregate intrinsic value information for the years ended December 31, 2023, 2022 2021, and 20202021 is as follows:
|
| 2023 |
|
| 2022 |
|
| 2021 |
| |||
|
| (in thousands) |
| |||||||||
Exercised |
| $ | 3,901 |
|
| $ | 2,030 |
|
| $ | 6,345 |
|
Outstanding |
|
| 2,647 |
|
|
| 3,963 |
|
|
| 17,356 |
|
Expected to vest |
|
| 696 |
|
|
| 1,583 |
|
|
| 13,500 |
|
Vested and exercisable |
|
| 1,950 |
|
|
| 2,380 |
|
|
| 3,856 |
|
2022 | 2021 | 2020 | ||||||||||
(in thousands) | ||||||||||||
Exercised | $ | 2,030 | $ | 6,345 | $ | 9,682 | ||||||
Outstanding | 3,963 | 17,356 | 16,083 | |||||||||
E xpected to vest | 1,583 | 13,500 | 13,499 | |||||||||
Vested and exercisable | 2,380 | 3,856 | 2,584 | |||||||||
Stock options weighted average remaining contractual terms (in years) information at December 31, for the years 2023, 2022 2021, and 20202021 is as follows:
|
| 2023 |
|
| 2022 |
|
| 2021 |
| |||
Outstanding |
|
| 4.4 |
|
|
| 4.2 |
|
|
| 4.4 |
|
Expected to vest |
|
| 5.1 |
|
|
| 4.8 |
|
|
| 4.8 |
|
Vested and exercisable |
|
| 3.4 |
|
|
| 3.1 |
|
|
| 2.5 |
|
2022 | 2021 | 2020 | ||||||||||
Outstanding | 4.2 | 4.4 | 4.6 | |||||||||
E xpected to vest | 4.8 | 4.8 | 4.9 | |||||||||
Vested and exercisable | 3.1 | 2.5 | 2.5 | |||||||||
As of December 31, 2022,2023, total unrecognized expense related to non-vested restricted stock unit awards and stock options was $61.1$73.7 million and is expected to be recognized over a weighted average period of 2.5 years.
Employee Stock Purchase Plan
Under the ESPP, eligible employees may purchase shares of common stock through regular payroll deductions of up to 10%10% of their compensation, to a maximum of shares with a fair market value of $25,000$25,000 per calendar year, not to exceed 6,000 shares. Under the plan, the price paid for the common stock is equal to 85%85% of the stock price on the last business day of the six-month purchase period.
In July 2023, 0.2 million shares of common stock were issued to employees who participated in the plan during the first half of 2023 at the price of $94.64 per share. In January 2024, Teradyne issued 0.2 million shares of common stock to employees who participated in the plan during the second half of 2023 at the price of $92.25 per share.
In July 2022, 0.2 million shares of common stock were issued to employees who participated in the plan during the first half of 2022 at the price of $76.12$76.12 per share. In January 2023, Teradyne issued 0.2 million shares of common stock to employees who participated in the plan during the second half of 2022 at the price of $74.25$74.25 per share.
In July 2021, 0.1 million shares of common stock were issued to employees who participated in the plan during the first half of 2021 at the price of $113.87$113.87 per share. In January 2022, Teradyne issued 0.1 million shares of common stock to employees who participated in the plan during the second half of 2021 at the price of $139.00$139.00 per share.
As of December 31, 2022,2023, there were 3.93.5 million shares available for grant under the ESPP.
The following table provides the effect to income from operations for recording stock-based compensation for the years ended December 31, 2023, 2022, 2021, and 2020:2021:
|
| 2023 |
|
| 2022 |
|
| 2021 |
| |||
|
| (in thousands) |
| |||||||||
Cost of revenues |
| $ | 4,208 |
|
| $ | 4,050 |
|
| $ | 4,196 |
|
Engineering and development |
|
| 10,659 |
|
|
| 9,992 |
|
|
| 9,783 |
|
Selling and administrative |
|
| 42,815 |
|
|
| 34,186 |
|
|
| 31,664 |
|
Stock-based compensation |
|
| 57,682 |
|
|
| 48,228 |
|
|
| 45,643 |
|
Income tax benefit |
|
| (10,397 | ) |
|
| (11,493 | ) |
|
| (14,389 | ) |
Total stock-based compensation expense after income taxes |
| $ | 47,285 |
|
| $ | 36,735 |
|
| $ | 31,254 |
|
2022 | 2021 | 2020 | ||||||||||
(in thousands) | ||||||||||||
Cost of revenues | $ | 4,050 | $ | 4,196 | $ | 4,227 | ||||||
Engineering and development | 9,992 | 9,783 | 12,039 | |||||||||
Selling and administrative | 34,186 | 31,664 | 28,640 | |||||||||
Stock-based compensation | 48,228 | 45,643 | 44,906 | |||||||||
Income tax benefit | (11,493 | ) | (14,389 | ) | (13,060 | ) | ||||||
Total stock-based compensation expense after income taxes | $ | 36,735 | $ | 31,254 | $ | 31,846 | ||||||
Teradyne sponsors a defined contribution employee retirement savings plan (“Savings Plan”) covering substantially all U.S. employees. Under the Savings Plan, employees may contribute up to 20%20% of their compensation (subject to Internal Revenue Service limitations). The Savings Plan provides for a discretionary employer match that is determined each year. In 2023, 2022 2021 and 2020, 2021,
79
Teradyne matched 100%100% of eligible employee contributions up to 4%4% of their compensation for employees not accruing benefits in the U.S. Qualified Pension Plan. There was no match for employees still actively accruing benefits in the U.S. Qualified Pension Plan. Teradyne’s contributions vest 25%25% per year for the first four years of employment, and contributions for those employees with four years of service vest immediately.
In addition, Teradyne sponsors an unfunded U.S. Supplemental Savings Plan to provide savings benefits in excess of those allowed by the Employee Retirement Income Security Act of 1974 and the Internal Revenue Code. The provisions of this plan are the same as the Savings Plan. The liability for the U.S. Supplemental Savings Plan at December 31, 2023 and 2022, and 2021, was $44.1$55.9 million and $47.2$44.1 million, respectively, and is included in retirement plan liabilities. Teradyne contributes to defined contributions savings plans for its foreign employees. Under Teradyne’s savings plans, amounts charged to the statements of operations for the years ended December 31, 2023, 2022, and 2021 and 2020 were $30.1$30.5 million, $26.9$30.1 million, and $21.7$26.9 million, respectively.
The components of income before income taxes and the provision (benefit) for income taxes as shown in the consolidated statements of operations were as follows:
|
| 2023 |
|
| 2022 |
|
| 2021 |
| |||
|
| (in thousands) |
| |||||||||
Income before income taxes: |
|
|
|
|
|
|
|
|
| |||
U.S. |
| $ | 307,997 |
|
| $ | 385,968 |
|
| $ | 403,451 |
|
Non-U.S. |
|
| 217,575 |
|
|
| 454,417 |
|
|
| 757,504 |
|
| $ | 525,572 |
|
| $ | 840,385 |
|
| $ | 1,160,955 |
| |
Provision (benefit) for income taxes: |
|
|
|
|
|
|
|
|
| |||
Current: |
|
|
|
|
|
|
|
|
| |||
U.S. Federal |
| $ | 58,063 |
|
| $ | 86,692 |
|
| $ | 58,218 |
|
Non-U.S. |
|
| 54,037 |
|
|
| 74,204 |
|
|
| 105,153 |
|
State |
|
| 2,362 |
|
|
| 2,681 |
|
|
| 300 |
|
|
| 114,462 |
|
|
| 163,577 |
|
|
| 163,671 |
| |
Deferred: |
|
|
|
|
|
|
|
|
| |||
U.S. Federal |
|
| (27,459 | ) |
|
| (36,739 | ) |
|
| (15,106 | ) |
Non-U.S. |
|
| (8,584 | ) |
|
| 1,232 |
|
|
| (4,300 | ) |
State |
|
| (1,599 | ) |
|
| (3,186 | ) |
|
| 2,101 |
|
|
| (37,642 | ) |
|
| (38,693 | ) |
|
| (17,305 | ) | |
Total provision for income taxes: |
| $ | 76,820 |
|
| $ | 124,884 |
|
| $ | 146,366 |
|
2022 | 2021 | 2020 | ||||||||||
(in thousands) | ||||||||||||
Income before income taxes: | ||||||||||||
U.S. | $ | 385,968 | $ | 403,451 | $ | 312,153 | ||||||
Non-U.S. | 454,417 | 757,504 | 588,862 | |||||||||
| $ | 840,385 | $ | 1,160,955 | $ | 901,015 | |||||||
Provision (benefit) for income taxes: | ||||||||||||
Current: | ||||||||||||
U.S. Federal | $ | 86,692 | $ | 58,218 | $ | 58,678 | ||||||
Non-U.S. | 74,204 | 105,153 | 75,193 | |||||||||
State | 2,681 | 300 | (1,315 | ) | ||||||||
| 163,577 | 163,671 | 132,556 | ||||||||||
Deferred: | ||||||||||||
U.S. Federal | (36,739 | ) | (15,106 | ) | (12,604 | ) | ||||||
Non-U.S. | 1,232 | (4,300 | ) | (5,127 | ) | |||||||
State | (3,186 | ) | 2,101 | 2,043 | ||||||||
| (38,693 | ) | (17,305 | ) | (15,688 | ) | |||||||
Total provision for income taxes: | $ | 124,884 | $ | 146,366 | $ | 116,868 | ||||||
Income tax expense for 2023, 2022 and 2021 and 2020 totaled $124.9$76.8 million, $146.4$124.9 million, and $116.9$146.4 million, respectively. The effective tax rate for 2023, 2022 and 2021 was 14.6%, 14.9% and 2020 was 14.9%, 12.6% and 13.0%12.6%, respectively.
At December 31, 2022,2023, Teradyne’s remaining tax liability resulting from the U.S. one-time transition tax on the mandatory deemed repatriation of foreign earnings amounts to $67.0$59.1 million. Teradyne will pay approximately $7.9$14.8 million related to the transition tax in 2023, $34.52024, and $44.3 million in 1 to 3 years, and $24.6 million in 3 to 5 years.
Teradyne has made an accounting policy election to account for global intangible low-taxed income (“GILTI”) as a component of tax expense in the period in which Teradyne is subject to the rules and therefore did not provide any deferred tax impacts of GILTI in its consolidated financial statements.
On July 27, 2015, in Altera Corp. (“Altera”) v. Commissioner, the U.S. Tax Court issued an opinion invalidating the regulations relating to the treatment of stock-based compensation expense in an intercompany cost-sharing arrangement. A final decision was issued by the Tax Court in December 2015. The IRS appealed the decision in June 2016. On July 24, 2018, the U.S. Court of Appeals for the Ninth Circuit (“Ninth Circuit”) issued a decision that was subsequently withdrawn and a reconstituted panel conferred on the appeal. On June 7, 2019, the Ninth Circuit upheld the cost-sharing regulations. On November 12, 2019,,2020 and 2021, Teradyne recognized approximately $2.3$2.5 million of tax expense and $2.5 million of tax benefit in 2020 and 2021, respectively, related to the inclusion of stock-based compensation in its intercompany cost-sharing arrangement.
80
The decrease in the effective tax rate from 2022 to 2023 is primarily attributable to increases in benefit from tax credits and the U.S. foreign derived intangible income deduction. These decreases in expense were partially offset by a shift in the geographic distribution of income, which increased the income subject to taxation in higher tax rate jurisdictions relative to lower tax rate jurisdictions and a reduction in benefit from equity compensation.
The increase in the effective tax rate from 2021 to 2022 is primarily attributable to a shift in the geographic distribution of income, which increased the income subject to taxation in higher tax rate jurisdictions relative to lower tax rate jurisdictions, increases in expense from U.S. global low-taxed income and increases in expense from non-deductible officer compensation. These increases in expense were partially offset by increases in benefits from the U.S. foreign derived intangible income deduction and tax credits.
A reconciliation of the effective tax rate for the years 2023, 2022 2021 and 20202021 is as follows:
|
| 2023 |
|
| 2022 |
|
| 2021 |
| |||
U.S. statutory federal tax rate |
|
| 21.0 | % |
|
| 21.0 | % |
|
| 21.0 | % |
Foreign taxes |
|
| 2.5 |
|
|
| (1.9 | ) |
|
| (4.5 | ) |
Non-deductible officers’ compensation |
|
| 1.1 |
|
|
| 1.3 |
|
|
| 0.8 |
|
U.S. global intangible low-taxed income |
|
| 0.8 |
|
|
| 1.2 |
|
|
| 0.6 |
|
State income taxes, net of federal tax benefit |
|
| 0.1 |
|
|
| (0.1 | ) |
|
| 0.2 |
|
U.S. research and development credit |
|
| (4.2 | ) |
|
| (1.8 | ) |
|
| (1.4 | ) |
U.S. foreign derived intangible income |
|
| (3.9 | ) |
|
| (3.1 | ) |
|
| (2.3 | ) |
Foreign tax credits |
|
| (3.3 | ) |
|
| (1.0 | ) |
|
| (0.5 | ) |
Equity compensation |
|
| (0.4 | ) |
|
| (1.1 | ) |
|
| (1.0 | ) |
Other, net |
|
| 0.9 |
|
|
| 0.4 |
|
|
| (0.3 | ) |
|
| 14.6 | % |
|
| 14.9 | % |
|
| 12.6 | % | |
2022 | 2021 | 2020 | ||||||||||
U.S. statutory federal tax rate | 21.0 | % | 21.0 | % | 21.0 | % | ||||||
Non-deductible officers’ compensation | 1.3 | 0.8 | 0.5 | |||||||||
U.S. global intangible low-taxed income | 1.2 | 0.6 | 2.1 | |||||||||
U.S. foreign derived intangible income | (3.1 | ) | (2.3 | ) | (2.2 | ) | ||||||
Foreign taxes | (1.9 | ) | (4.5 | ) | (5.6 | ) | ||||||
U.S. research and development credit | (1.8 | ) | (1.4 | ) | (1.3 | ) | ||||||
Equity compensation | (1.1 | ) | (1.0 | ) | (0.8 | ) | ||||||
Foreign tax credits | (1.0 | ) | (0.5 | ) | (1.2 | ) | ||||||
State income taxes, net of federal tax benefit | (0.1 | ) | 0.2 | 0.3 | ||||||||
Other, net | 0.4 | (0.3 | ) | 0.2 | ||||||||
| 14.9 | % | 12.6 | % | 13.0 | % | |||||||
Teradyne qualifies for a tax holiday in Singapore by fulfilling the requirements of an agreement with the Singapore Economic Development Board under which certain headcount and spending requirements must be met. The tax savings attributable to the Singapore tax holiday for the years ended December 31, 2023, 2022 and 2021 and 2020 were $16.0$1.4 million or $0.09$0.01 per diluted share, $33.3$16.0 million or $0.18$0.09 per diluted share, and $29.9$33.3 million or $0.16$0.18 per diluted share, respectively. In November 2020, Teradyne entered into an agreement with the Singapore Economic Development Board which extended our Singapore tax holiday under substantially similar terms to the agreement which expired on December 31, 2020. The new tax holiday is scheduled to expire on December 31, 2025.
81
Significant components of Teradyne’s deferred tax assets (liabilities) as of December 31, 20222023 and 20212022 were as follows:
|
| 2023 |
|
| 2022 |
| ||
|
| (in thousands) |
| |||||
Deferred tax assets: |
|
|
|
|
|
| ||
Tax credits |
| $ | 112,571 |
|
| $ | 105,503 |
|
Research and development |
|
| 82,571 |
|
|
| 47,760 |
|
Accruals |
|
| 25,644 |
|
|
| 30,747 |
|
Pension liabilities |
|
| 24,997 |
|
|
| 21,335 |
|
Lease liabilities |
|
| 21,167 |
|
|
| 18,679 |
|
Inventory valuations |
|
| 19,289 |
|
|
| 22,554 |
|
Deferred revenue |
|
| 13,807 |
|
|
| 14,909 |
|
Equity compensation |
|
| 7,179 |
|
|
| 6,578 |
|
Vacation accrual |
|
| 6,096 |
|
|
| 5,856 |
|
Net operating loss carryforwards |
|
| 5,737 |
|
|
| 1,857 |
|
Investment impairment |
|
| 3,292 |
|
|
| 3,292 |
|
Intangible assets |
|
| 2,323 |
|
|
| 350 |
|
Marketable securities |
|
| 128 |
|
|
| 2,283 |
|
Other |
|
| 953 |
|
|
| 2,520 |
|
Gross deferred tax assets |
|
| 325,754 |
|
|
| 284,223 |
|
Less: valuation allowance |
|
| (109,251 | ) |
|
| (103,807 | ) |
Total deferred tax assets |
| $ | 216,503 |
|
| $ | 180,416 |
|
Deferred tax liabilities: |
|
|
|
|
|
| ||
Right of use assets |
| $ | (19,016 | ) |
| $ | (16,607 | ) |
Depreciation |
|
| (16,681 | ) |
|
| (19,078 | ) |
Contingent consideration |
|
| (5,214 | ) |
|
| (5,214 | ) |
Total deferred tax liabilities |
| $ | (40,911 | ) |
| $ | (40,899 | ) |
Net deferred assets |
| $ | 175,592 |
|
| $ | 139,517 |
|
2022 | 2021 | |||||||
(in thousands) | ||||||||
Deferred tax assets: | ||||||||
Tax credits | $ | 105,503 | $ | 98,378 | ||||
Research and development | 47,760 | — | ||||||
Accruals | 30,747 | 41,459 | ||||||
Inventory valuations | 22,554 | 20,991 | ||||||
Pension liabilities | 21,335 | 28,722 | ||||||
Lease liability | 18,679 | 16,484 | ||||||
Deferred revenue | 14,909 | 11,164 | ||||||
Equity compensation | 6,578 | 6,630 | ||||||
Vacation accrual | 5,856 | 6,050 | ||||||
Investment impairment | 3,292 | 3,292 | ||||||
Marketable securities | 2,283 | — | ||||||
Net operating loss carryforwards | 1,857 | 1,721 | ||||||
Intangible assets | 350 | — | ||||||
Other | 2,520 | 774 | ||||||
Gross deferred tax assets | 284,223 | 235,665 | ||||||
Less: valuation allowance | (103,807 | ) | (97,170 | ) | ||||
Total deferred tax assets | $ | 180,416 | $ | 138,495 | ||||
Deferred tax liabilities: | ||||||||
Depreciation | $ | (19,078 | ) | $ | (10,691 | ) | ||
Right-of-use assets | (16,607 | ) | (14,738 | ) | ||||
Contingent consideration | (5,214 | ) | (5,214 | ) | ||||
Intangible assets | — | (8,531 | ) | |||||
Marketable securities | — | (3,220 | ) | |||||
Total deferred tax liabilities | $ | (40,899 | ) | $ | (42,394 | ) | ||
Net deferred assets | $ | 139,517 | $ | 96,101 | ||||
As of December 31, 20222023 and 2021,2022, Teradyne evaluated the likelihood that it would realize deferred income taxes to offset future taxable income and concluded that it is more likely than not that a substantialthe majority of its deferred tax assets will be realized through consideration of both the positive and negative evidence. At December 31, 20222023 and 2021,2022, Teradyne maintained a valuation allowance for certain deferred tax assets of $103.8$109.3 million and $97.2$103.8 million, respectively, primarily related to state net operating losses and state tax credit carryforwards, due to the uncertainty regarding their realization. Adjustments could be required in the future if Teradyne estimates that the amount of deferred tax assets to be realized is more or less than the net amount recorded.
At December 31, 2022,2023, Teradyne had tax effected operating loss carryforwards that expire in the following years:
|
| State |
|
| Foreign |
| ||
|
| (in thousands) |
| |||||
2024 |
| $ | 6 |
|
| $ | — |
|
2025 |
|
| 4 |
|
|
| — |
|
2026 |
|
| — |
|
|
| — |
|
2027 |
|
| — |
|
|
| — |
|
2028 |
|
| 23 |
|
|
| 83 |
|
2029-2033 |
|
| 121 |
|
|
| 500 |
|
2034-2038 |
|
| 31 |
|
|
| — |
|
Beyond 2038 |
|
| — |
|
|
| — |
|
Non-expiring |
|
| 30 |
|
|
| 4,939 |
|
Total |
| $ | 215 |
|
| $ | 5,522 |
|
State Operating Loss Carryforwards | Foreign Operating Loss Carryforwards | |||||||
(in thousands) | ||||||||
2023 | $ | 222 | $ | — | ||||
2024 | 6 | — | ||||||
2025 | 4 | — | ||||||
2026 | — | — | ||||||
2027 | — | — | ||||||
2028-2032 | 299 | 676 | ||||||
2033-2037 | 44 | 3 | ||||||
Beyond 2037 | 24 | — | ||||||
Non-expiring | 29 | 550 | ||||||
Total | $ | 628 | $ | 1,229 | ||||
Teradyne has approximately $138.4$147.1 million of tax credit carryforwards including federal business tax credits of approximately $2.4$3.4 million which expire in 2028 through 2032,2033, and state tax credits of $136.1$143.8 million, of which $72.0$76.5 million do not expire and the remainder expires in the years 2023 through 2042.2043.
82
Teradyne’s gross unrecognized tax benefits for the years ended December 31, 2023, 2022 2021 and 20202021 were as follows:
|
| 2023 |
|
| 2022 |
|
| 2021 |
| |||
|
| (in thousands) |
| |||||||||
Beginning balance as of January 1 |
| $ | 15,608 |
|
| $ | 14,465 |
|
| $ | 17,903 |
|
Additions: |
|
|
|
|
|
|
|
|
| |||
Tax positions for current year |
|
| — |
|
|
| 1,398 |
|
|
| 1,417 |
|
Tax positions for prior years |
|
| 3,024 |
|
|
| 13 |
|
|
| 30 |
|
Reductions: |
|
|
|
|
|
|
|
|
| |||
Tax positions for prior years |
|
| (26 | ) |
|
| (56 | ) |
|
| (1,639 | ) |
Expiration of statutes |
|
| — |
|
|
| (212 | ) |
|
| (3,246 | ) |
Ending balance as of December 31 |
| $ | 18,606 |
|
| $ | 15,608 |
|
| $ | 14,465 |
|
2022 | 2021 | 2020 | ||||||||||
(in thousands) | ||||||||||||
Beginning balance as of January 1 | $ | 14,465 | $ | 17,903 | $ | 21,180 | ||||||
Additions: | ||||||||||||
Tax positions for current year | 1,398 | 1,417 | 1,082 | |||||||||
Tax positions for prior years | 13 | 30 | 66 | |||||||||
Reductions: | ||||||||||||
Tax positions for prior years | (56 | ) | (1,639 | ) | (2,989 | ) | ||||||
Expiration of statutes | (212 | ) | (3,246 | ) | (1,436 | ) | ||||||
Ending balance as of December 31 | $ | 15,608 | $ | 14,465 | $ | 17,903 | ||||||
Current year additions primarily relate to foreign transfer pricing and prior year reductions relate to federal and state research credits. Prior year reductions and expirations of statute relate to foreign net operating loss carryforwards.
Of the $15.6$18.6 million of unrecognized tax benefits as of December 31, 2022, $10.12023, $12.9 million would impact the consolidated income tax rate if ultimately recognized. The remaining $5.5$5.7 million would impact deferred taxes if recognized.
As of December 31, 2022,2023, Teradyne does not anticipate a material change inestimates that it is reasonably possible that the balance of unrecognized tax benefits duringmay decrease approximately $2.8 million in the next twelve months.
Teradyne records all interest and penalties related to income taxes as a component of income tax expense. Accrued interest and penalties related to income tax items at December 31, 20222023 and 20212022 amounted to $0.4$1.3 million and $0.3$0.4 million, respectively. For the years ended December 31, 2023, 2022 2021 and 2020,2021, expense of $0.1$0.9 million, expense of $0.1 million, and benefit of $0.9 million, and expense of $0.2$0.9 million, respectively, was recorded for interest and penalties related to income tax items.
Teradyne is subject to U.S. federal income tax, as well as income tax in multiple state, local and foreign jurisdictions. As of December 31, 2022,2023, all material state and local income tax matters have been concluded through 2017,2018, all material federal income tax matters have been concluded through 2017 and all material foreign income tax matters have been concluded through 2016.2015. However, in some jurisdictions, including the United States, operating losses and tax credits may be subject to adjustment until such time as they are utilized and the year of utilization is closed to adjustment.
As of December 31, 2022,2023, Teradyne is not permanently reinvested with respect to the unremitted earnings of non-U.S. subsidiaries to the extent that those earnings exceed local statutory and operational requirements. Remittance of those earnings is not expected to result in material income tax.
On August 16, 2022, the Inflation Reduction Act of 2022 (“IRA”) was signed into law. The IRA introduced a 15% alternative minimum tax based on the financial statement income of certain large corporations (“CAMT”), effective January 1, 2023. Teradyne currently does not expect the CAMT to have a material impact on its financial results.
On December 15, 2022, the European Union ("EU") Member States formally adopted the EU’s Pillar Two Directive, which generally provides for a minimum effective tax rate of 15%, as established by the Organization for Economic Co-operation and Development ("OECD") Pillar Two Framework. The EU’s Pillar Two Directive effective dates are January 1, 2024, and January 1, 2025, for different aspects of the directive. On July 17, 2023, the OECD published Administrative Guidance proposing certain safe harbor rules that effectively extend certain effective dates to January 1, 2027. Certain EU Member States where Teradyne has foura legal presence have recently enacted the directive and administrative guidance into their local tax legislation. Additionally, countries outside the EU where Teradyne has a legal presence have enacted similar language as the EU Members States in their local tax legislation. Teradyne is closely monitoring these developments and evaluating the potential financial impact on future periods. Based upon preliminary calculations for calendar year 2024, Teradyne anticipates it will meet the safe harbors in most jurisdictions, and any remaining tax under the rules should be immaterial.
83
Teradyne has fourreportable segments (Semiconductor Test, System Test, Wireless Test and Robotics). Each of the reportable segments represents an individual operating segment. On September 15, 2020, Teradyne announced the appointment of Gregory Smith as President of Robotics reportable segment effective October 1, 2020. With the appointment of the President of Robotics, the Robotics reportable segment is considered one operating segment and one reporting unit.
The Semiconductor Test segment includes operations related to the design, manufacturing and marketing of semiconductor test products and services. The System Test segment includes operations related to the design, manufacturing and marketing of products and services for storage and system level test, defense/aerospace instrumentation test, and circuit-board test. The Wireless Test segment includes operations related to the design, manufacturing and marketing of wireless test products and services. The Robotics segment includes operations related to the design, manufacturing and marketing of collaborative robotic arms, autonomous mobile robots and advanced robotic control software. Each operating segment has a segment manager who is accountable to and maintains regular contract with Teradyne’s chief operating decision maker (Teradyne’s chief executive officer) to discuss operating activities, financial results, forecasts, and plans for the segment.
Teradyne evaluates performance based on several factors, of which the primary financial measure is business segment income (loss) before income taxes. The accounting policies of the business segments are the same as those described in Note B: “Accounting Policies.”
Segment information for the years ended December 31, 2023, 2022 2021, and 20202021 is as follows:
| Semiconductor |
|
| System |
|
| Robotics |
|
| Wireless |
|
| Segment |
|
| Corporate |
|
| Consolidated |
| |||||||
| (in thousands) |
| |||||||||||||||||||||||||
2023 |
|
|
|
|
|
|
|
|
|
|
|
|
|
|
|
|
|
|
|
| |||||||
Revenues | $ | 1,818,636 |
|
| $ | 338,197 |
|
| $ | 375,183 |
|
| $ | 144,282 |
|
| $ | 2,676,298 |
|
| $ | — |
|
| $ | 2,676,298 |
|
Income (loss) before taxes (1)(2) |
| 453,320 |
|
|
| 94,073 |
|
|
| (54,251 | ) |
|
| 30,568 |
|
|
| 523,710 |
|
|
| 1,862 |
|
|
| 525,572 |
|
Total assets (3) |
| 1,329,522 |
|
|
| 182,084 |
|
|
| 737,323 |
|
|
| 68,291 |
|
|
| 2,317,220 |
|
|
| 1,169,604 |
|
|
| 3,486,824 |
|
Property additions |
| 113,415 |
|
|
| 3,643 |
|
|
| 40,739 |
|
|
| 1,845 |
|
|
| 159,642 |
|
|
| — |
|
|
| 159,642 |
|
Depreciation and amortization expense |
| 77,745 |
|
|
| 3,801 |
|
|
| 25,527 |
|
|
| 4,043 |
|
|
| 111,116 |
|
|
| (230 | ) |
|
| 110,886 |
|
2022 |
|
|
|
|
|
|
|
|
|
|
|
|
|
|
|
|
|
|
|
| |||||||
Revenues | $ | 2,080,590 |
|
| $ | 469,346 |
|
| $ | 403,138 |
|
| $ | 201,720 |
|
| $ | 3,154,794 |
|
| $ | 251 |
|
| $ | 3,155,045 |
|
Income (loss) before taxes (1)(2) |
| 634,488 |
|
|
| 166,879 |
|
|
| (16,244 | ) |
|
| 66,820 |
|
|
| 851,943 |
|
|
| (11,558 | ) |
|
| 840,385 |
|
Total assets (3) |
| 1,382,623 |
|
|
| 165,925 |
|
|
| 665,638 |
|
|
| 94,298 |
|
|
| 2,308,484 |
|
|
| 1,192,768 |
|
|
| 3,501,252 |
|
Property additions |
| 126,898 |
|
|
| 7,275 |
|
|
| 25,712 |
|
|
| 3,364 |
|
|
| 163,249 |
|
|
| — |
|
|
| 163,249 |
|
Depreciation and amortization expense |
| 76,532 |
|
|
| 3,235 |
|
|
| 25,339 |
|
|
| 4,991 |
|
|
| 110,097 |
|
|
| 578 |
|
|
| 110,675 |
|
2021 |
|
|
|
|
|
|
|
|
|
|
|
|
|
|
|
|
|
|
|
| |||||||
Revenues | $ | 2,642,342 |
|
| $ | 467,739 |
|
| $ | 375,905 |
|
| $ | 216,895 |
|
| $ | 3,702,881 |
|
| $ | — |
|
| $ | 3,702,881 |
|
Income (loss) before taxes (1)(2) |
| 976,988 |
|
|
| 163,064 |
|
|
| (8,167 | ) |
|
| 83,543 |
|
|
| 1,215,428 |
|
|
| (54,473 | ) |
|
| 1,160,955 |
|
Total assets (3) |
| 1,245,596 |
|
|
| 170,954 |
|
|
| 701,196 |
|
|
| 107,513 |
|
|
| 2,225,259 |
|
|
| 1,584,166 |
|
|
| 3,809,425 |
|
Property additions |
| 115,618 |
|
|
| 3,905 |
|
|
| 9,821 |
|
|
| 3,128 |
|
|
| 132,472 |
|
|
| — |
|
|
| 132,472 |
|
Depreciation and amortization expense |
| 75,982 |
|
|
| 3,156 |
|
|
| 27,336 |
|
|
| 6,055 |
|
|
| 112,529 |
|
|
| 12,956 |
|
|
| 125,485 |
|
Semiconductor Test | System Test | Robotics | Wireless Test | Corporate and Eliminations | Consolidated | |||||||||||||||||||
(in thousands) | ||||||||||||||||||||||||
2022 | ||||||||||||||||||||||||
Revenues | $ | 2,080,590 | $ | 469,346 | $ | 403,138 | $ | 201,720 | $ | 251 | $ | 3,155,045 | ||||||||||||
Income (loss) before taxes (1)(2) | 634,488 | 166,879 | (16,244 | ) | 66,820 | (11,558 | ) | 840,385 | ||||||||||||||||
Total assets (3) | 1,382,623 | 165,925 | 665,638 | 94,298 | 1,192,768 | 3,501,252 | ||||||||||||||||||
Property additions | 126,898 | 7,275 | 25,712 | 3,364 | — | 163,249 | ||||||||||||||||||
Depreciation and amortization expense | 76,532 | 3,235 | 25,339 | 4,991 | 578 | 110,675 | ||||||||||||||||||
2021 | ||||||||||||||||||||||||
Revenues | $ | 2,642,342 | $ | 467,739 | $ | 375,905 | $ | 216,895 | $ | — | $ | 3,702,881 | ||||||||||||
Income (loss) before taxes (1)(2) | 976,988 | 163,064 | (8,167 | ) | 83,543 | (54,473 | ) | 1,160,955 | ||||||||||||||||
Total assets (3) | 1,245,596 | 170,954 | 701,196 | 107,513 | 1,584,166 | 3,809,425 | ||||||||||||||||||
Property additions | 115,618 | 3,905 | 9,821 | 3,128 | — | 132,472 | ||||||||||||||||||
Depreciation and amortization expense | 75,982 | 3,156 | 27,336 | 6,055 | 12,956 | 125,485 | ||||||||||||||||||
2020 | ||||||||||||||||||||||||
Revenues | $ | 2,259,597 | $ | 409,729 | $ | 279,731 | $ | 173,016 | $ | (604 | ) | $ | 3,121,469 | |||||||||||
Income (loss) before taxes (1)(2) | 739,695 | 152,092 | (24,019 | ) | 41,950 | (8,703 | ) | 901,015 | ||||||||||||||||
Total assets (3) | 1,070,378 | 138,295 | 712,936 | 106,273 | 1,624,464 | 3,652,346 | ||||||||||||||||||
Property additions | 168,055 | 3,092 | 8,899 | 4,931 | — | 184,977 | ||||||||||||||||||
Depreciation and amortization expense | 64,998 | 3,426 | 36,242 | 6,258 | 15,819 | 126,743 | ||||||||||||||||||
84
Included in each segment are charges and credits in the following line items in the statements of operations:
|
| For the Years Ended December 31, |
| |||||||||
|
| 2023 |
|
| 2022 |
|
| 2021 |
| |||
|
| (in thousands) |
| |||||||||
Semiconductor Test: |
|
|
|
|
|
|
|
|
| |||
Cost of revenues—inventory charge |
| $ | 22,482 |
|
| $ | 21,456 |
|
| $ | 6,661 |
|
Restructuring and other—employee severance |
|
| 5,666 |
|
|
| — |
|
|
| — |
|
System Test: |
|
|
|
|
|
|
|
|
| |||
Cost of revenues—inventory charge |
| $ | 1,855 |
|
| $ | 1,730 |
|
| $ | 641 |
|
Restructuring and other—employee severance |
|
| 1,541 |
|
| $ | — |
|
| $ | — |
|
Robotics: |
|
|
|
|
|
|
|
|
| |||
Cost of revenues—inventory charge |
| $ | 2,275 |
|
| $ | 3,668 |
|
| $ | 6,403 |
|
Restructuring and other—employee severance |
|
| 3,707 |
|
|
| 2,115 |
|
|
| 1,210 |
|
Restructuring and other—acquisition & divestiture related expenses |
|
| — |
|
|
| — |
|
|
| 1,000 |
|
Wireless: |
|
|
|
|
|
|
|
|
| |||
Cost of revenues—inventory charge |
| $ | 1,746 |
|
| $ | 4,598 |
|
| $ | 1,770 |
|
Corporate and Eliminations: |
|
|
|
|
|
|
|
|
| |||
Selling and administrative—equity modification charge |
| $ | 5,889 |
|
| $ | — |
|
| $ | — |
|
Restructuring and other—employee severance |
|
| 3,599 |
|
|
| — |
|
|
| — |
|
Restructuring and other—acquisition & divestiture related expenses |
|
| 3,562 |
|
|
| — |
|
|
| (513 | ) |
Restructuring and other—contract termination |
|
| 1,511 |
|
|
| — |
|
|
| — |
|
Restructuring and other—environmental and legal liabilities |
|
| 1,100 |
|
|
| 2,700 |
|
|
| 1,971 |
|
Other (income) expense, net—gain on foreign exchange option |
|
| (7,464 | ) |
|
| — |
|
|
| — |
|
Restructuring and other—legal settlement charge |
|
| — |
|
|
| 14,700 |
|
|
| 12,000 |
|
Restructuring and other—gain on sale of asset |
|
| — |
|
|
| (3,410 | ) |
|
| — |
|
Other (income) expense, net—loss on convertible debt conversion |
|
| — |
|
|
| — |
|
|
| 28,828 |
|
Restructuring and other—AutoGuide contingent consideration adjustment |
|
| — |
|
|
| — |
|
|
| (7,227 | ) |
For the Years Ended December 31, | ||||||||||||
2022 | 2021 | 2020 | ||||||||||
(in thousands) | ||||||||||||
Semiconductor Test: | ||||||||||||
Cost of revenues—inventory charge | $ | 21,456 | $ | 6,661 | $ | 11,013 | ||||||
Contract termination settlement fee | — | — | 4,000 | |||||||||
System Test: | ||||||||||||
Cost of revenues—inventory charge | $ | 1,730 | $ | 641 | $ | 887 | ||||||
Robotics: | ||||||||||||
Cost of revenues—inventory charge | $ | 3,668 | $ | 6,403 | $ | 834 | ||||||
Restructuring and other—employee severance | 2,115 | 1,210 | 1,584 | |||||||||
Restructuring and other—acquisition related expenses and compensation | — | 1,000 | 985 | |||||||||
Wireless Test: | ||||||||||||
Cost of revenues—inventory charge | $ | 4,598 | $ | 1,770 | $ | 4,800 | ||||||
Corporate and Eliminations: | ||||||||||||
Restructuring and other—legal settlement charge | $ | 14,700 | $ | 12,000 | $ | — | ||||||
Restructuring and other— environmental and legal liabilities | 2,700 | 1,971 | — | |||||||||
Restructuring and other—gain on sale of asset | (3,410 | ) | — | — | ||||||||
Other (income) expense, net—loss on convertible debt conversion | — | 28,828 | — | |||||||||
Restructuring and other—AutoGuide contingent consideration adjustment | — | (7,227 | ) | (19,724 | ) | |||||||
Restructuring and other—MiR contingent consideration adjustment | — | — | (3,546 | ) | ||||||||
Restructuring and other—acquisition related expenses and compensation | — | (513 | ) | 1,728 | ||||||||
Selling and administrative—equity modification charge | — | — | 766 | |||||||||
Information as to Teradyne’s revenues by country is as follows:
|
| 2023 |
|
| 2022 |
|
| 2021 |
| |||
|
| (in thousands) |
| |||||||||
Revenues from customers (1): |
|
|
|
|
|
|
|
|
| |||
United States |
| $ | 433,661 |
|
| $ | 469,948 |
|
| $ | 392,626 |
|
Korea |
|
| 394,690 |
|
|
| 544,816 |
|
|
| 502,167 |
|
Taiwan |
|
| 384,842 |
|
|
| 626,424 |
|
|
| 1,117,874 |
|
China |
|
| 314,899 |
|
|
| 491,798 |
|
|
| 631,963 |
|
Japan |
|
| 281,742 |
|
|
| 162,920 |
|
|
| 166,231 |
|
Europe |
|
| 273,784 |
|
|
| 268,384 |
|
|
| 259,954 |
|
Philippines |
|
| 189,419 |
|
|
| 124,107 |
|
|
| 166,838 |
|
Singapore |
|
| 116,969 |
|
|
| 99,503 |
|
|
| 121,582 |
|
Thailand |
|
| 91,818 |
|
|
| 137,356 |
|
|
| 138,812 |
|
Malaysia |
|
| 89,197 |
|
|
| 142,203 |
|
|
| 136,774 |
|
Rest of the World |
|
| 105,277 |
|
|
| 87,586 |
|
|
| 68,060 |
|
|
| $ | 2,676,298 |
|
| $ | 3,155,045 |
|
| $ | 3,702,881 |
|
2022 | 2021 | 2020 | ||||||||||
(in thousands) | ||||||||||||
Revenues from customers (1): | ||||||||||||
Taiwan | $ | 626,424 | $ | 1,117,874 | $ | 1,178,068 | ||||||
Korea | 544,816 | 502,167 | 391,571 | |||||||||
China | 491,798 | 631,963 | 465,722 | |||||||||
United States | 469,948 | 392,626 | 321,674 | |||||||||
Europe | 268,384 | 259,954 | 205,587 | |||||||||
Japan | 162,920 | 166,231 | 143,983 | |||||||||
Malaysia | 142,203 | 136,774 | 56,096 | |||||||||
Thailand | 137,356 | 138,812 | 138,787 | |||||||||
Philippines | 124,107 | 166,838 | 68,887 | |||||||||
Singapore | 99,503 | 121,582 | 76,460 | |||||||||
Rest of the World | 87,586 | 68,060 | 74,634 | |||||||||
| $ | 3,155,045 | $ | 3,702,881 | $ | 3,121,469 | |||||||
In 2023, revenues from Texas Instruments Inc., a customer of our Semiconductor Test segment, accounted for 10% of our consolidated revenues. In 2021, and 2020, revenues from Taiwan Semiconductor Manufacturing Company Ltd., a customer of Teradyne’s Semiconductor Test segment, accounted for
85
Long-lived assets by geographic area:
|
| United |
|
| Foreign (1) |
|
| Total |
| |||
|
| (in thousands) |
| |||||||||
December 31, 2023 (2) |
| $ | 322,445 |
|
| $ | 207,995 |
|
| $ | 530,440 |
|
December 31, 2022 |
| $ | 328,341 |
|
| $ | 164,076 |
|
| $ | 492,417 |
|
United States | Foreign | Total | ||||||||||
(in thousands) | ||||||||||||
December 31, 2022 | $ | 328,341 | $ | 164,076 | $ | 492,417 | ||||||
December 31, 2021 | $ | 308,438 | $ | 147,609 | $ | 456,047 | ||||||
In January 2023, Teradyne’s Board of Directors cancelled the January 2021 repurchase program and approved a new repurchase program for up to $2.0$2.0 billion of common stock. In 2023, Teradyne intends to repurchase up to $500.0
The total cost of shares acquired includes commissions and, starting in 2023, based on market conditions.
In January 2023,2024, Teradyne’s Board of Directors declaredof0.110.12 per share to be paid on March 17, 202315, 2024 to shareholders of record as of February 17, 2023. 16, 2024.
While Teradyne declared a quarterly cash dividend and authorized a share repurchase program, it may reduce or eliminate the cash dividend or share repurchase program in the future. Future cash dividends and stock repurchases are subject to the discretion of Teradyne’s Board of Directors which will consider, among other things, Teradyne’s earnings, capital requirements and financial condition.
86
SUPPLEMENTARY INFORMATION
(Unaudited)
Item 9: Changes in and disagreements with accountants on accounting and financial disclosure
None.
Item 9A: Controls and procedures
Disclosure Controls and Procedures
As of the end of the period covered by this report, our management, with the participation of our CEO and CFO, evaluated the effectiveness of our disclosure controls and procedures pursuant to Rule 13a-15(b) promulgated under the Exchange Act. Based upon that evaluation, our CEO and CFO concluded that, as of the end of the period covered by this report, our disclosure controls and procedures were effective in ensuring that material information required to be disclosed by us in the reports that we file or submit under the Exchange Act is recorded, processed, summarized and reported within the time periods specified in the SEC’s rules and forms, including ensuring that such material information is accumulated and communicated to our management, including our CEO and CFO, as appropriate to allow timely decisions regarding required disclosure.
Changes in Internal Control over Financial Reporting
There was no change in our internal control over financial reporting during the fourth fiscal quarter ended December 31, 20222023 that has materially affected, or is reasonably likely to materially affect, our internal control over financial reporting.
Management’s Annual Report on Internal Control over Financial Reporting
Our management is responsible for establishing and maintaining adequate internal control over financial reporting, as such term is defined in Exchange Act Rule 13a-15(f). Under the supervision and with the participation of our management, including our CEO and CFO, we conducted an evaluation of the effectiveness of our internal control over financial reporting based on the framework in2022.
The effectiveness of our internal control over financial reporting as of December 31, 20222023 has been audited by PricewaterhouseCoopers LLP, our independent registered public accounting firm, as stated in their report which is included under Item 8 of this Annual Report.
Inherent Limitations on Effectiveness of Controls
Because of its inherent limitations, internal control over financial reporting may not prevent or detect misstatements. Also, projections of any evaluation of effectiveness to future periods are subject to the risk that controls may become inadequate because of changes in conditions, or that the degree of compliance with the policies or procedures may deteriorate.
Item 9B: Other Information
Our officers (as defined in Rule 16a-1(f) under the Securities Exchange Act of 1934, as amended (the “Exchange Act”)) (“Section 16 Officers”) and directors from time to time enter into contracts, instructions or written plans for the purchase or sale of our securities that are intended to satisfy the conditions specified in Rule 10b5-1(c) under the Exchange Act for an affirmative defense against liability for trading in securities on the basis of material nonpublic information. We refer to these contracts, instructions, and written plans as “Rule 10b5-1 trading plans” and each one as a “Rule 10b5-1 trading plan.” During our fiscal quarter ended December 31, 2023, no Section 16 Officer or director adopted, modified or terminated a Rule 10b5-1 trading plan.
Item 9C: Disclosure Regarding Foreign Jurisdictions that Prevent Inspections
Not applicable.
87
PART III
Item 10: Directors, Executive Officers and Corporate Governance
The information relating to our directors and executive officers, committee information, reports and charters, executive compensation, security ownership of certain beneficial owners and management and related stockholder matters, and certain relationships and related transactions is incorporatedrequired by reference herein fromthis Item 10 will be included in our definitive proxy statementProxy Statement in connection with our 2024 Annual Meeting of Shareholders to be held on May 12, 2023.9, 2024. The proxy statementProxy Statement will be filed with the SEC not later than 120 days after the close of the fiscal year.year covered by this Annual Report and is incorporated herein by reference.
We have adopted a written code of business conduct that applies to all of our employees, officers and directors, including our principal executive officer, principal financial officer and principal accounting officer. Our Code of Conduct is available on our investor relations website at investors.teradyne.com under the section entitled "Governance Policies" in the "Governance" menu. If we make any substantive amendments to our Code of Conduct or grant any of our directors or executive officers any waiver, including any implicit waiver, from a provision of our Code of Conduct, we will disclose the nature of the amendment or waiver on our website or in a Current Report on Form 8-K.
Item 11: Executive Compensation
The information required by this Item 11 will be included in our definitive Proxy Statement in connection with our 2024 Annual Meeting of Shareholders to be held on May 9, 2024. The Proxy Statement will be filed with the SEC not later than 120 days after the close of the fiscal year covered by this Annual Report and is incorporated herein by reference. For this purpose, the Compensation Committee Report included in such proxy statement is specifically not incorporated herein. Also see “Item 1: Business—Our Executive Officers.”
Item 12: Security Ownership of Certain Beneficial Owners and Management and Related Stockholder Matters
The information relating to our directors and executive officers, executive compensation, security ownership of certain beneficial owners and management and related stockholder matters, and certain relationships and related transactions is incorporatedrequired by reference herein fromthis Item 12 will be included in our definitive proxy statementProxy Statement in connection with our 2024 Annual Meeting of Shareholders to be held on May 12, 2023.9, 2024. The proxy statementProxy Statement will be filed with the SEC not later than 120 days after the close of the fiscal year. Foryear covered by this purpose, the Compensation CommitteeAnnual Report included in such proxy statement is specifically not incorporated herein.
Item 13: Certain Relationships and Related Transactions, and Director Independence
The information relating to our directors and executive officers, executive compensation, security ownership of certain beneficial owners and management and related stockholder matters, and certain relationships and related transactions is incorporatedrequired by reference herein fromthis Item 13 will be included in our definitive proxy statementProxy Statement in connection with our 2024 Annual Meeting of Shareholders to be held on May 12, 2023.9, 2024. The proxy statementProxy Statement will be filed with the SEC not later than 120 days after the close of the fiscal year. Foryear covered by this purpose, the Compensation CommitteeAnnual Report and is incorporated herein by reference.
Item 14: Principal Accountant Fees and Services
The information required by this Item 14 will be included in such proxy statement is specifically not incorporated herein.
88
PART IV
Item 15: Exhibits and Financial Statement Schedule.
15(a)(1) Financial Statements
The following consolidated financial statements are included in Item 8:
Page | ||||
Report of Independent Registered Public Accounting Firm (PricewaterhouseCoopers LLP, PCAOB ID | 38 | |||
40 | ||||
41 | ||||
42 | ||||
43 | ||||
44 | ||||
15(a)(2) Financial Statement Schedule
The following consolidated financial statement schedule is included in Item 15(c):
Schedule II—Valuation and Qualifying Accounts
Schedules other than those listed above have been omitted since they are either not required or information is otherwise included.
15(a)(3) Listing of Exhibits
The Exhibits which are filed with this report or which are incorporated by reference herein are set forth in the Exhibit Index.
89
15(c) Financial Statement Schedules
TERADYNE, INC.
SCHEDULE II—VALUATION AND QUALIFYING ACCOUNTS
Column A |
| Column B |
|
| Column C |
|
| Column D |
|
| Column E |
|
| Column F |
| |||||
Description |
| Balance at |
|
| Additions |
|
| Other |
|
| Deductions |
|
| Balance at |
| |||||
|
| (in thousands) |
| |||||||||||||||||
Valuation reserve deducted in the balance sheet |
|
|
|
|
|
|
|
|
|
|
|
|
|
|
| |||||
Accounts receivable: |
|
|
|
|
|
|
|
|
|
|
|
|
|
|
| |||||
2023 Allowance for credit losses |
| $ | 1,955 |
|
| $ | 301 |
|
| $ | 23 |
|
| $ | 291 |
|
| $ | 1,988 |
|
2022 Allowance for credit losses |
| $ | 2,012 |
|
| $ | 500 |
|
| $ | (6 | ) |
| $ | 551 |
|
| $ | 1,955 |
|
2021 Allowance for credit losses |
| $ | 2,034 |
|
| $ | 500 |
|
| $ | (27 | ) |
| $ | 495 |
|
| $ | 2,012 |
|
Column A |
| Column B |
|
| Column C |
|
| Column D |
|
| Column E |
|
| Column F |
| |||||
Description |
| Balance at |
|
| Additions |
|
| Other |
|
| Deductions |
|
| Balance at |
| |||||
|
| (in thousands) |
| |||||||||||||||||
Valuation reserve deducted in the balance sheet |
|
|
|
|
|
|
|
|
|
|
|
|
|
|
| |||||
Deferred taxes: |
|
|
|
|
|
|
|
|
|
|
|
|
|
|
| |||||
2023 Valuation allowance |
| $ | 103,807 |
|
| $ | 5,759 |
|
| $ | 59 |
|
| $ | 374 |
|
| $ | 109,251 |
|
2022 Valuation allowance |
| $ | 97,170 |
|
| $ | 7,652 |
|
| $ | 21 |
|
| $ | 1,036 |
|
| $ | 103,807 |
|
2021 Valuation allowance |
| $ | 84,962 |
|
| $ | 13,502 |
|
| $ | — |
|
| $ | 1,294 |
|
| $ | 97,170 |
|
Column A | Column B | Column C | Column D | Column E | Column F | |||||||||||||||
Description | Balance at Beginning of Period | Additions Charged to Cost and Expenses | Other | Deductions | Balance at End of Period | |||||||||||||||
(in thousands) | ||||||||||||||||||||
Valuation reserve deducted in the balance sheet from the asset to which it applies: | ||||||||||||||||||||
Accounts receivable: | ||||||||||||||||||||
2022 Allowance for doubtful account | $ | 2,012 | $ | 500 | $ | (6 | ) | $ | 551 | $ | 1,955 | |||||||||
2021 Allowance for doubtful account | $ | 2,034 | $ | 500 | $ | (27 | ) | $ | 495 | $ | 2,012 | |||||||||
2020 Allowance for doubtful account | $ | 1,736 | $ | 356 | $ | 32 | $ | 90 | $ | 2,034 | ||||||||||
Column A | Column B | Column C | Column D | Column E | Column F | |||||||||||||||
Description | Balance at Beginning of Period | Additions Charged to Cost and Expenses | Other | Deductions | Balance at End of Period | |||||||||||||||
(in thousands) | ||||||||||||||||||||
Valuation reserve deducted in the balance sheet from the asset to which it applies: | ||||||||||||||||||||
Inventory: | ||||||||||||||||||||
2022 Inventory reserve | $ | 114,055 | $ | 31,452 | $ | 1,926 | $ | 10,595 | $ | 136,838 | ||||||||||
2021 Inventory reserve | $ | 110,587 | $ | 15,475 | $ | 1,335 | $ | 13,342 | $ | 114,055 | ||||||||||
2020 Inventory reserve | $ | 103,556 | $ | 17,534 | $ | (521 | ) | $ | 9,982 | $ | 110,587 | |||||||||
Column A | Column B | Column C | Column D | Column E | Column F | |||||||||||||||
Description | Balance at Beginning of Period | Additions Charged to Cost and Expenses | Other | Deductions | Balance at End of Period | |||||||||||||||
(in thousands) | ||||||||||||||||||||
Valuation reserve deducted in the balance sheet from the asset to which it applies: | ||||||||||||||||||||
Deferred taxes: | ||||||||||||||||||||
2022 Valuation allowance | $ | 97,170 | $ | 7,652 | $ | 21 | $ | 1,036 | $ | 103,807 | ||||||||||
2021 Valuation allowance | $ | 84,962 | $ | 13,502 | $ | — | $ | 1,294 | $ | 97,170 | ||||||||||
2020 Valuation allowance | $ | 77,177 | $ | 7,785 | $ | — | $ | — | $ | 84,962 | ||||||||||
Item 16: Form 10-K Summary
Not applicable.
90
Table of Contents
EXHIBIT INDEX
The following designated exhibits are, as indicated below, either filed herewith or have heretofore been filed with the Securities and Exchange Commission and are referred to and incorporated by reference to such filings.
Exhibit No. |
| Description | SEC Document Reference | ||
3.1 | Restated Articles of Organization. | Exhibit 3.1 to Teradyne’s Current Report on Form 8-K filed on May 13, 2021. | |||
3.2 | Amended and Restated By-laws, as amended. | Exhibit 3.1 to Teradyne’s Current Report on Form 8-K filed on | |||
4.1 | Indenture dated as of December 12, 2016, between Teradyne, Inc. and Wilmington Trust, National Association, as trustee. | Exhibit 4.1 to Teradyne’s Current Report on Form 8-K filed on December 12, 2016. | |||
4.2 | First Supplemental Indenture dated as of November 4, 2021 between Teradyne, Inc. and Wilmington Trust, National Association, as trustee. | Exhibit 4.1 to Teradyne’s Quarterly Report on Form 10-Q for the quarter ended October 3, 2021. | |||
4.3 | Description of Teradyne, Inc. Securities Registered under Section 12 of the Exchange Act. | Filed herewith. | |||
10.1† | Standard Manufacturing Agreement entered into as of November 24, 2003 by and between Teradyne and Solectron. | Exhibit 10.1 to Teradyne’s Quarterly Report on Form 10-Q for the quarter ended September 30, 2007. | |||
10.2† | Second Amendment to Standard Manufacturing Agreement, dated as of August 27, 2007, by and between Teradyne and Solectron. | Exhibit 10.3 to Teradyne’s Quarterly Report on Form 10-Q for the quarter ended September 30, 2007. | |||
10.3† | Sixth Amendment to Standard Manufacturing Agreement, dated as of July 27, 2009, by and between Teradyne and Flextronics Corporation. | Exhibit 10.5 to Teradyne’s Annual Report on Form 10-K for the fiscal year ended December 31, 2009. | |||
10.4 | Addendum to Standard Manufacturing Agreement (Authorized Purchase Agreement)—Revised July 1, 2010. | Exhibit 10.6 to Teradyne’s Annual Report on Form 10-K for the fiscal year ended December 31, 2010. | |||
10.5 | Eighth Amendment to Standard Manufacturing Agreement, dated as of April 13, 2012, by and between Teradyne and Flextronics Sales & Marketing North Asia (L) LTD. | Exhibit 10.7 to Teradyne’s Annual Report on Form 10-K for the fiscal year ended December 31, 2012. | |||
10.6† | Ninth Amendment to Standard Manufacturing Agreement, dated as of September 17, 2012, by and between Teradyne and Flextronics Sales & Marketing North Asia (L) LTD. | Exhibit 10.8 to Teradyne’s Annual Report on Form 10-K for the fiscal year ended December 31, 2012. | |||
10.7 | 2006 Equity and Cash Compensation Incentive Plan, as amended. * | Exhibit 10.2 to Teradyne’s Current Report on Form 8-K filed on May 13, 2021. | |||
10.8 | Danish Sub-Plan to the 2006 Equity and Cash Compensation Incentive Plan. | Exhibit 10.10 to Teradyne’s Annual Report on Form 10-K for the fiscal year ended December 31, 2018. |
106
|
| |||
10.9 | Form of Performance-Based Restricted Stock Unit Agreement for Executive Officers under 2006 Equity and Cash Compensation Incentive Plan.* | Exhibit 10.9 to Teradyne’s Annual Report on Form 10-K for the fiscal year ended December 31, 2020. | ||
10.10 | Form of Time-Based Restricted Stock Unit Agreement for Executive Officers under 2006 Equity and Cash Compensation Incentive Plan.* | Exhibit 10.10 to Teradyne’s Annual Report on Form 10-K for the fiscal year ended December 31, 2020. | ||
10.11 | Form of Executive Officer Stock Option Agreement under 2006 Equity and Cash Compensation Incentive Plan, as amended. * | Exhibit 10.11 to Teradyne’s Annual Report on Form 10-K for the fiscal year ended December 31, 2020. | ||
10.12 | Form of Restricted Stock Unit Agreement for Directors under 2006 Equity and Cash Compensation Incentive Plan.* | Exhibit 10.12 to Teradyne’s Annual Report on Form 10-K for the fiscal year ended December 31, 2016. | ||
91
10.13 | 1996 Employee Stock Purchase Plan, as amended.* | |||
10.14 | Danish Sub-Plan to the 1996 Employee Stock Purchase Plan. | Exhibit 10.15 to Teradyne’s Annual Report on Form 10-K for the fiscal year ended December 31, 2019 | ||
10.15 | Deferral Plan for Non-Employee Directors, as amended.* | Exhibit 10.1 to Teradyne’s Quarterly Report on form 10-Q for the quarter ended October 3, 2021. | ||
10.16 | Supplemental Savings Plan, as amended and restated.* | Exhibit 10.18 to Teradyne’s Annual Report on Form 10-K for the fiscal year ended December 31, 2008. | ||
10.17 | Supplemental Executive Retirement Plan, as restated.* | Exhibit 10.19 to Teradyne’s Annual Report on Form 10-K for the fiscal year ended December 31, 2008. | ||
10.18 | Agreement Regarding Termination Benefits dated January 31, 2023 between Teradyne and Gregory S. Smith.* | |||
10.19 | Employment Agreement dated May 7, 2004 between Teradyne and Mark Jagiela.* | Exhibit 10.37 to Teradyne’s Quarterly Report on Form 10-Q for the quarter ended July 4, 2004. | ||
10.20 | Executive Officer Retirement Agreement dated July 17, 2019 between Teradyne and Gregory R. Beecher.* | Exhibit 10.1 to Teradyne’s Quarterly Report on Form 10-Q for the quarter ended June 30, 2019. | ||
10.21 | Executive Officer Agreement dated January 31, 2023 between Teradyne and Mark Jagiela.* | |||
10.22 | Amended and Restated Executive Officer Change in Control Agreement dated May 26, 2009 between Teradyne and Charles J. Gray, as amended.* | Exhibit 10.30 to Teradyne’s Annual Report on Form 10-K for the fiscal year ended December 31, 2012. | ||
10.23 | Employment Agreement dated July 24, 2009 between Teradyne and Charles J. Gray.* | Exhibit 10.1 to Teradyne’s Quarterly Report on Form 10-Q for the quarter ended April 4, 2010. |
107
|
| |||
10.24 | Executive Officer Agreement dated January 25, 2024 between Teradyne and Charles J. Gray.* | Exhibit 10.1 to Teradyne's Current Reprot on Form 8-K/A filed January 29, 2024 | ||
10.25 | Amended and Restated Executive Officer Change in Control Agreement dated June 30, 2012 between Teradyne and Walter G. Vahey, as amended.* | Exhibit 10.32 to Teradyne’s Annual Report on Form 10-K for the fiscal year ended December 31, 2012. | ||
10.26 | Employment Agreement dated February 6, 2013 between Teradyne and Walter G. Vahey.* | Exhibit 10.33 to Teradyne’s Annual Report on Form 10-K for the fiscal year ended December 31, 2012. | ||
10.27 | Executive Officer Change in Control Agreement dated September 1, 2014 between Teradyne, Inc. and Bradford Robbins.* | Exhibit 10.1 to Teradyne’s Quarterly Report on Form 10-Q for the quarter ended September 28, 2014. | ||
10.28 | Employment Agreement dated September 1, 2014 between Teradyne, Inc. and Bradford Robbins.* | Exhibit 10.2 to Teradyne’s Quarterly Report on Form 10-Q for the quarter ended September 28, 2014. | ||
10.29 | Executive Change in Control Agreement dated February 8, 2016 between Teradyne, Inc. and Gregory S. Smith.* | Exhibit 10.1 to Teradyne’s Quarterly Report on Form 10-Q for the quarter ended April 3, 2016. | ||
10.30 | Employment Agreement dated February 8, 2016 between Teradyne, Inc. and Gregory S. Smith.* | Exhibit 10.2 to Teradyne’s Quarterly Report on Form 10-Q for the quarter ended April 3, 2016. | ||
10.31 | Teradyne Offer of Employment dated February 8, 2019 for Sanjay Mehta.* | Exhibit 10.1 to Teradyne’s Quarterly Report on Form 10-Q for the quarter ended March 31, 2019. | ||
10.32 | Executive Officer Change in Control Agreement dated April 25, 2019 between Teradyne, Inc. and Sanjay Mehta.* | Exhibit 10.2 to Teradyne’s Quarterly Report on Form 10-Q for the quarter ended March 31, 2019. | ||
10.33 | Employment Agreement dated April 25, 2019 between Teradyne, Inc. and Sanjay Mehta.* | Exhibit 10.3 to Teradyne’s Quarterly Report on Form 10-Q for the quarter ended March 31, 2019. | ||
10.34 | Agreement Regarding Termination Benefits dated April 25, 2019 between Teradyne, Inc. and Sanjay Mehta.* | Exhibit 10.4 to Teradyne’s Quarterly Report on Form 10-Q for the quarter ended March 31, 2019. |
92
108
|
| |||
10.43 | Letter Agreement, dated December 6, 2016, between Barclays Bank PLC and Teradyne, Inc., regarding the Base Warrants. | Exhibit 10.1 to Teradyne’s Current Report on Form 8-K filed December 12, 2016. | ||
10.44 | Letter Agreement, dated December 6, 2016, between Bank of America, N.A., and Teradyne, Inc. regarding the Base Warrants. | Exhibit 10.2 to Teradyne’s Current Report on Form 8-K filed December 12, 2016. | ||
10.45 | Letter Agreement, dated December 6, 2016, between Wells Fargo Bank, National Association and Teradyne, Inc. regarding the Base Warrants. | Exhibit 10.3 to Teradyne’s Current Report on Form 8-K filed December 12, 2016. | ||
10.46 | Letter Agreement, dated December 6, 2016, between Barclays Bank PLC and Teradyne, Inc. regarding the Base Call Option Transaction. | Exhibit 10.4 to Teradyne’s Current Report on Form 8-K filed December 12, 2016. | ||
10.47 | Letter Agreement, dated December 6, 2016, between Bank of America, N.A. and Teradyne, Inc. regarding the Base Call Option Transaction. | Exhibit 10.5 to Teradyne’s Current Report on Form 8-K filed December 12, 2016. | ||
10.48 | Letter Agreement, dated December 6, 2016, between Wells Fargo Bank, National Association and Teradyne, Inc. regarding the Base Call Option Transaction. | Exhibit 10.6 to Teradyne’s Current Report on Form 8-K filed December 12, 2016. | ||
10.49 | Letter Agreement, dated December 9, 2016, between Barclays Bank PLC and Teradyne, Inc., regarding the Additional Warrants | Exhibit 10.7 to Teradyne’s Current Report on Form 8-K filed December 12, 2016. | ||
10.50 | Letter Agreement, dated December 9, 2016, between Bank of America, N.A., and Teradyne, Inc. regarding the Additional Warrants. | Exhibit 10.8 to Teradyne’s Current Report on Form 8-K filed December 12, 2016. | ||
10.51 | Letter Agreement, dated December 9, 2016, between Wells Fargo Bank, National Association and Teradyne, Inc. regarding the Additional Warrants. | Exhibit 10.9 to Teradyne’s Current Report on Form 8-K filed December 12, 2016. | ||
10.52 | Letter Agreement, dated December 9, 2016, between Barclays Bank PLC and Teradyne, Inc. regarding the Additional Call Option Transaction. | Exhibit 10.10 to Teradyne’s Current Report on Form 8-K filed December 12, 2016. | ||
10.53 | Letter Agreement, dated December 9, 2016, between Bank of America, N.A. and Teradyne, Inc. regarding the Additional Call Option Transaction | Exhibit 10.11 to Teradyne’s Current Report on Form 8-K filed December 12, 2016. | ||
93
10.54 | Letter Agreement, dated December 9, 2016, between Wells Fargo Bank, National Association and Teradyne, Inc. regarding the Additional Call Option Transaction. | Exhibit 10.12 to Teradyne’s Current Report on Form 8-K filed December 12, 2016. | ||
10.55 | Credit Agreement dated May 1, 2020 among Teradyne, Inc., Truist Bank, as the administrative agent, issuing bank and swingline lender, and other lenders party thereto. | Exhibit 10.1 to Teradyne’s Current Report on Form 8-K filed May 5, 2020. |
109
|
| |||
10.56 | First Amendment to Credit Agreement dated December 10, 2021 among Teradyne, Inc., Truist Bank, as the administrative agent, issuing bank and swingline lender, and other lenders party thereto. | Exhibit 10.52 to Teradyne’s Annual Report on Form 10-K for the fiscal year ended December 31, 2021. | ||
10.57 | Second Amendment to Credit Agreement dated October 5, 2022 among Teradyne, Inc., Truist Bank, as the administrative agent, issuing bank and swingline lender, and other lenders party thereto. | Exhibit 10.1 to Teradyne’s Quarterly Report on Form 10-Q for the quarter ended October 2, 2022. | ||
21.1 | Filed herewith. | |||
23.1 | Filed herewith. | |||
31.1 | Rule 13a-14(a) Certification of Principal Executive Officer. | Filed herewith. | ||
31.2 | Rule 13a-14(a) Certification of Principal Financial Officer. | Filed herewith. | ||
32.1 | Furnished herewith. | |||
32.2 | Furnished herewith. | |||
97.1 | Filed herewith. | |||
101 | The following financial information from Teradyne, Inc.’s Annual Report on Form 10-K for the fiscal year ended December 31, | |||
104 | The cover page of the Annual Report on Form 10-K formatted in Inline XBRL (included in Exhibit 101). |
|
|
110† -Confidential treatment granted.
* -Management contract or compensatory plan.
94
SIGNATURES
Pursuant to the requirements of Section 13 or 15(d) of the Securities Exchange Act of 1934, the registrant has duly caused this report to be signed on its behalf by the undersigned, thereunto duly authorized this 22nd day of February 2023.2024.
TERADYNE, INC. | ||
By: | /S/ SANJAY MEHTA | |
Sanjay Mehta, | ||
Vice President, Chief Financial Officer and Treasurer | ||
Pursuant to the requirements of the Securities Exchange Act of 1934, this report has been signed below by the following persons on behalf of the registrant and in the capacities and on the dates indicated.
Signature | Title | Date | ||
|
|
| ||
/S/ Paul J. Tufano | Chair of the Board | February 22, | ||
| 2024 | ||||
/S/ GREGORY SMITH Gregory Smith | Chief Executive Officer (Principal Executive Officer) and Director | February 22, | ||
| 2024 | ||||
/S/ Sanjay Mehta | Vice President, Chief Financial Officer and Treasurer (Principal Financial and Accounting Officer) | February 22, | ||
| 2024 | ||||
| ||||
/S/ Timothy E. Guertin | Director | February 22, | ||
| 2024 | ||||
| ||||
/S/
Peter Herweck | Director | February 22, | ||
| 2024 | ||||
/S/ MERCEDES JOHNSON Mercedes Johnson | Director | February 22, 2024 | ||
/S/ ERNEST E. MADDOCK Ernest E. Maddock | Director | February 22, | ||
| 2024 | ||||
| ||||
/S/
Marilyn Matz | Director | February 22, | ||
/S/ FOUAD TAMER Fouad Tamer | Director | February 22, 2024 | ||
/S/ BRIDGET VAN KRALINGEN Bridget van Kralingen | Director | February 22, 2024 |
111
95