| ☒ | Annual report pursuant to Section 13 or 15(d) of the Securities Exchange Act of 1934 for the fiscal year ended December 31, |
| ☐ | Transition report pursuant to Section 13 or 15(d) of the Securities Exchange Act of 1934 for the transition period from to . |
Delaware | 87-6284802 | |
(State or other jurisdiction of incorporation or organization) | (I.R.S. Employer Identification No.) |
Title of each class | Trading Symbol(s) | Name of each exchange | ||
ProShares Short VIX Short-Term Futures ETF | SVXY | Cboe BZX Exchange | ||
ProShares Ultra Bloomberg Crude Oil | UCO | NYSE Arca | ||
ProShares Ultra Bloomberg Natural Gas | BOIL | NYSE Arca | ||
ProShares Ultra Euro | ULE | NYSE Arca | ||
ProShares Ultra Gold | UGL | NYSE Arca | ||
ProShares Ultra Silver | AGQ | NYSE Arca | ||
ProShares Ultra VIX Short-Term Futures ETF | UVXY | Cboe BZX Exchange | ||
ProShares Ultra Yen | YCL | NYSE Arca | ||
ProShares UltraShort Bloomberg Crude Oil | SCO | NYSE Arca | ||
ProShares UltraShort Bloomberg Natural Gas | KOLD | NYSE Arca |
ProShares UltraShort Euro | EUO | NYSE Arca | ||
ProShares UltraShort Gold | GLL | NYSE Arca | ||
ProShares UltraShort Silver | ZSL | NYSE Arca | ||
ProShares UltraShort Yen | YCS | NYSE Arca | ||
ProShares VIX Mid-Term Futures ETF | VIXM | Cboe BZX Exchange | ||
ProShares VIX Short-Term Futures ETF | VIXY | Cboe BZX Exchange |
| Large Accelerated Filer | ☒ | Accelerated Filer | ☐ | |||
| Non-Accelerated Filer | ☐ | Smaller Reporting Company | ☐ | |||
| Emerging Growth Company | ☐ | |||||
Fund | Aggregate Market Value of the Fund’s Units Held by Non-Affiliates as of June 30, 2023 | Number of Outstanding Units as of February 22, 2024 | ||||||
ProShares Short VIX Short-Term Futures ETF | 282,353,267 | 3,084,307 | ||||||
ProShares Ultra Bloomberg Crude Oil | 738,194,368 | 20,793,096 | ||||||
ProShares Ultra Bloomberg Natural Gas | 1,141,021,278 | 36,968,544 | ||||||
ProShares Ultra Euro | 7,535,435 | 550,000 | ||||||
ProShares Ultra Gold | 180,916,531 | 2,800,000 | ||||||
ProShares Ultra Silver | 356,791,659 | 14,396,526 | ||||||
ProShares Ultra VIX Short-Term Futures ETF | 387,764,059 | 36,424,459 | ||||||
ProShares Ultra Yen | 12,330,974 | 1,349,970 | ||||||
ProShares UltraShort Bloomberg Crude Oil | 112,854,952 | 10,855,220 | ||||||
ProShares UltraShort Bloomberg Natural Gas | 141,324,963 | 866,856 | ||||||
ProShares UltraShort Euro | 50,931,301 | 1,350,000 | ||||||
ProShares UltraShort Gold | 15,809,378 | 496,977 | ||||||
ProShares UltraShort Silver | 19,290,473 | 941,329 | ||||||
ProShares UltraShort Yen | 27,077,656 | 348,580 | ||||||
ProShares VIX Mid-Term Futures ETF | 49,421,413 | 2,287,403 | ||||||
ProShares VIX Short-Term Futures ETF | 230,227,830 | 11,550,947 | ||||||
Fund | Aggregate Market Value of the Fund’s Units Held by Non-Affiliates as ofJune 30, 2022 | Number of Outstanding Units as of February 22, 2023 | ||||||
ProShares Short VIX Short-Term Futures ETF | 403,644,956 | 2,984,307 | ||||||
ProShares Ultra Bloomberg Crude Oil | 1,060,867,238 | 28,043,096 | ||||||
ProShares Ultra Bloomberg Natural Gas | 187,297,842 | 254,987,527 | ||||||
ProShares Ultra Euro | 9,415,626 | 850,000 | ||||||
ProShares Ultra Gold | 239,938,853 | 3,100,000 | ||||||
ProShares Ultra Silver | 355,577,515 | 13,396,526 | ||||||
ProShares Ultra VIX Short-Term Futures ETF | 975,683,533 | 114,578,420 | ||||||
ProShares Ultra Yen | 5,024,773 | 399,970 | ||||||
ProShares UltraShort Bloomberg Crude Oil | 501,157,304 | 8,305,220 | ||||||
ProShares UltraShort Bloomberg Natural Gas | 211,823,446 | 1,366,856 | ||||||
ProShares UltraShort Euro | 62,270,097 | 2,350,000 | ||||||
ProShares UltraShort Gold | 34,611,284 | 496,977 | ||||||
ProShares UltraShort Silver | 33,052,840 | 1,191,329 | ||||||
ProShares UltraShort Yen | 45,568,882 | 398,580 | ||||||
ProShares VIX Mid-Term Futures ETF | 95,721,271 | 2,537,403 | ||||||
ProShares VIX Short-Term Futures ETF | 341,714,316 | 26,932,826 | ||||||
PROSHARES TRUST II
Table of Contents
| Page | |||||||
Part I. | |||||||
| 1 | |||||||
| 20 | |||||||
| 54 | |||||||
| 54 | |||||||
| 54 | |||||||
| 54 | |||||||
Part II. | |||||||
| 55 | |||||||
| 58 | |||||||
| 58 | |||||||
Item 7A. Quantitative and Qualitative Disclosures About Market | |||||||
| 100 | |||||||
| 100 | |||||||
| 101 | |||||||
Item 9C. Disclosure Regarding Foreign Jurisdictions that Prevent | 101 | ||||||
Part III. | |||||||
Item 10. Directors, Executive Officers and Corporate | 102 | ||||||
| 104 | |||||||
| 105 | |||||||
Item 13. Certain Relationships and Related Transactions, and Director | 105 | ||||||
| 105 | |||||||
Part IV. | |||||||
Item 15. Exhibits and Financial Statement | 106 | ||||||
| 106 | |||||||
| 106 | |||||||
| 107 | |||||||
Part I.
Item 1. Business.
Summary
ProShares Trust II (the “Trust”) is a Delaware statutory trust formed on October 9, 2007 and is currently organized into separate series (each, a “Fund” and collectively, the “Funds”). As of December 31, 2022,2023, the following sixteen series of the Trust have commenced investment operations: (i) ProShares VIX Short-Term Futures ETF and ProShares VIX Mid-Term Futures ETF (each, a “Matching VIX Fund” and collectively, the “Matching VIX Funds”); (ii) ProShares Short VIX Short-Term Futures ETF and ProShares Ultra VIX Short-Term Futures ETF (each, a “Geared VIX Fund” and collectively, the “Geared VIX Funds”); and (iii) ProShares UltraShort Bloomberg Crude Oil, ProShares UltraShort Bloomberg Natural Gas, ProShares UltraShort Gold, ProShares UltraShort Silver, ProShares UltraShort Euro, ProShares UltraShort Yen, ProShares Ultra Bloomberg Crude Oil, ProShares Ultra Bloomberg Natural Gas, ProShares Ultra Gold, ProShares Ultra Silver, ProShares Ultra Euro and ProShares Ultra Yen (each, a “Leveraged Fund” and collectively, the “Leveraged Funds”); Each of the Funds listed above issues common units of beneficial interest (“Shares”), which represent units of fractional undivided beneficial interest in and ownership of only that Fund. The Shares of each Fund, other than the Matching VIX Funds and the Geared VIX Funds, are listed on the NYSE Arca, Inc. (“NYSE Arca”). The Matching VIX Funds and the Geared VIX Funds are listed on the Cboe BZX Exchange (“Cboe BZX”). The Leveraged Funds and the Geared VIX Funds, are collectively referred to as the “Geared Funds”. The Geared VIX Funds and the Matching VIX Funds are collectively referred to as the “VIX Funds”.
On March 15, 2020 ProShare Capital Management LLC announced that it planned to close and liquidate ProShares UltraPro 3x Crude Oil ETF (ticker symbol: OILU) and ProShares UltraPro 3x Short Crude Oil ETF (ticker symbol: OILD). The last day the liquidated funds accepted creation orders was on March 27, 2020. Trading in each liquidated fund was suspended prior to market open on March 30, 2020. Proceeds of the liquidation were sent to shareholders on April 3, 2020. From March 30, 2020 through April 3, 2020, shares of the liquidated funds did not trade on the NYSE Arca nor was there a secondary market for the shares. Any shareholders that remained in a liquidated fund on April 3, 2020 automatically had their shares redeemed for cash at the current net asset value on that day.
On March 11, 2022, ProShares Capital Management LLC announced that it planned to close and liquidate ProShares UltraShort Australian Dollar ETF (ticker symbol: CROC) and ProShares Short Euro ETF (ticker symbol: EUFX). The last day the liquidated funds accepted creation orders was on May 2, 2022. Trading in each liquidated fund was suspended prior to market open on May 3, 2022. Proceeds of the liquidation were sent to shareholders on May 12, 2022. From May 3, 2022 through May 12, 2022, shares of the liquidated funds did not trade on the NYSE Arca nor was there a secondary market for the shares. Any shareholders that remained in a liquidated fund on May 12, 2022 automatically had their shares redeemed for cash at the current net asset value on that day.
The Trust had no operations prior to November 24, 2008, other than matters relating to its organization, the registration of each series under the Securities Act of 1933, as amended, and the sale and issuance to ProShare Capital Management LLC (the “Sponsor”) of fourteen Shares at an aggregate purchase price of $350 in each of the following Funds: ProShares UltraShort Bloomberg Crude Oil, ProShares UltraShort Gold, ProShares UltraShort Silver, ProShares UltraShort Euro, ProShares UltraShort Yen, ProShares Ultra Bloomberg Crude Oil, ProShares Ultra Gold, ProShares Ultra Silver, ProShares Ultra Euro and ProShares Ultra Yen.
The Sponsor also serves as the Trust’s commodity pool operator. Wilmington Trust Company serves as the Trustee of the Trust (the “Trustee”). The Funds are commodity pools, as defined under the Commodity Exchange Act (the “CEA”), and the applicable regulations of the Commodity Futures Trading Commission (the “CFTC”) and are operated by the Sponsor, a commodity pool operator registered with the CFTC. The Trust is not an investment company registered under the Investment Company Act of 1940, as amended.
Groups of Funds are collectively referred to in this Annual Report on Form 10-K in several different ways. References to “Short Funds,Fund,” “UltraShort Funds,” or “Ultra Funds” refer to the different Funds based upon their investment objectives, but without distinguishing among the Funds’ benchmarks. References to “Commodity Index Funds,” “Commodity Funds” and “Currency Funds” refer to the different Funds according to their general benchmark categories without distinguishing among the Funds’ investment objectives or Fund-specific benchmarks. References to “VIX Funds” refer to the different Funds based upon their investment objective and their general benchmark categories.
1
As described in each Fund’s prospectus, each of the Funds intends to invest in “Financial Instruments” (Financial Instruments are instruments whose value is derived from the value of an underlying asset, rate or benchmark including futures contracts, swap agreements, forward contracts and other instruments) as a substitute for investing directly in commodities, currencies, or spot volatility products in order to gain exposure to the VIX Index, natural gas, crude oil, precious metals, or currencies, as applicable. Financial Instruments also are used to produce economically “inverse”, “inverse leveraged” or “leveraged” investment results for the Geared Funds.
The “Short” Fund seeks daily investment results, before fees and expenses, that correspond to one-half the inverse (-0.5x) of the daily performance of its corresponding benchmark. Each “UltraShort” Fund seeks daily investment results, before fees and expenses, that correspond to two times the inverse (-2x) of the daily performance of its corresponding benchmark. Each “Ultra” Fund seeks daily investment results, before fees and expenses, that
1
correspond to either one and one-half times (1.5x) or two times (2x) the daily performance of its corresponding benchmark. Each Matching VIX Fund seeks investment results, before fees and expenses, both for a single day and over time, that match (1x) the performance of its corresponding benchmark. Daily performance is measured from the calculation of each Fund’s net asset value (“NAV”) to the Fund’s next NAV calculation.
Each Geared Fund seeks investment results for a single day only, not for any other period. This is different from most exchange-traded funds and means that the return of such Fund for a period longer than a single trading day will be the result of each day’s returns compounded over the period, which will very likely differ in amount and possibly even direction from -0.5x, -2x, 1.5x, or 2x, of the return of the benchmark to which such Fund is benchmarked for that period. Volatility of the benchmark may be at least as important to a Geared Fund’s return for the period as the return of the benchmark. Geared Funds that use leverage, are riskier than similarly benchmarked exchange-traded funds that do not use leverage. Accordingly, these Funds may not be suitable for all investors and should be used only by knowledgeable investors who understand the potential consequences of seeking daily leveraged, inverse or inverse leveraged investment results. Shareholders who invest in the Geared Funds should consider actively manage and monitormonitoring and/or periodically rebalancing their investments, as frequently as daily.investments.
Each Matching VIX Fund seeks investment results, before fees and expenses, that match the performance of the S&P 500 VIX Short-Term Futures Index (the “Short-Term VIX Index”) or the S&P 500 VIX Mid-Term Futures Index (the “Mid-Term VIX Index”) (each a “VIX Futures Index”). Each Geared VIX Fund seeks daily investment results, before fees and expenses, that correspond to a multiple or the inverse of the daily performance of the Short-Term VIX Index. Each VIX Fund intends to obtain exposure to its benchmark by taking positions in futures contracts (“VIX futures contracts”) based on the Chicago Board Options Exchange (“Cboe”) Volatility Index (the “VIX”).
ProShares UltraShort Bloomberg Crude Oil, ProShares Ultra Gold, ProShares Ultra Silver, ProShares UltraShort Gold, ProShares UltraShort Silver, ProShares UltraShort Bloomberg Natural Gas, ProShares Ultra Bloomberg Crude Oil, and ProShares Ultra Bloomberg Natural Gas are benchmarked to indexes designed to track the performance of commodity futures contracts, as applicable. The daily performance of these Indexes and the corresponding Funds will likely be very different in amount and possibly even direction from the daily performance of the price of the related physical commodities.
Each Geared Fund continuously offers and redeems its Shares in blocks of 50,000 Shares and each Matching VIX Fund continuously offers and redeems its Shares in blocks of 25,000 Shares (each such block a “Creation Unit”). Only Authorized Participants may purchase and redeem Shares from a Fund and then only in Creation Units. An Authorized Participant is an entity that has entered into an Authorized Participant Agreement with one or more of the Funds. Shares of the Funds are offered to Authorized Participants in Creation Units at each Fund’s respective NAV. Authorized Participants may then offer to the public, from time to time, Shares from any Creation Unit they create at a per-Share market price that varies depending on, among other factors, the trading price of the Shares of each Fund on its applicable listing exchange, the NAV and the supply of and demand for the Shares at the time of the offer. Shares from the same Creation Unit may be offered at different times and may have different offering prices based upon the above factors. The form of Authorized Participant Agreement and related Authorized Participant Handbook set forth the terms and conditions under which an Authorized Participant may purchase or redeem a Creation Unit. Authorized Participants do not receive from any Fund, the Sponsor, or any of their affiliates, any underwriting fees or compensation in connection with their sale of Shares to the public.
Forward Share Splits and Reverse Share SplitsSplits*
On April 3, 2020, the Trust announced a 1-for-25 reverse split of the shares of beneficial interest of ProShares Ultra Bloomberg Crude Oil (ticker symbol: UCO) and a 1-for-10 reverse split of the shares of beneficial interest of ProShares Ultra Bloomberg Natural Gas (ticker symbol: BOIL). The reverse splits were effective prior to market open on April 21, 2020, when the funds began trading at their post-split price. The reverse splits were applied retroactively for all periods presented, reducing the number of shares outstanding and resulting in a proportionate increase in the price per share and per share information of these funds. Therefore, the reverse splits did not change the aggregate net asset value of a shareholder’s investment at the time of the reverse splits.
2
On May 11, 2021, the Trust announced a 1-for-10 reverse split of the shares of beneficial interest of ProShares Ultra VIX Short-Term Futures ETF (ticker symbol: UVXY), a 1-for-4 reverse split of the shares of beneficial interest of ProShares UltraShort Bloomberg Crude Oil (ticker symbol: SCO), a 1-for-4 reverse split of the shares of beneficial interest of ProShares UltraShort Silver (ticker symbol: ZSL) and a 1-for-4 reverse split of the shares of beneficial interest of ProShares VIX Short-Term Futures ETF (ticker symbol: VIXY). The reverse splits were effective prior to market open on May 26, 2021, when the funds began trading at their post-split price. The reverse splits were applied retroactively for all periods presented, reducing the number of shares outstanding and resulted in a proportionate increase in the price per share and the per share information of the 4 funds. Therefore, the reverse splits did not change the aggregate net asset value of a shareholder’s investment at the time of the reverse splits.
On December 22, 2021, the Trust announced a 1-for-5 reverse split of the shares of beneficial interest of ProShares UltraShort Bloomberg Natural Gas ETF (ticker symbol: KOLD). The reverse splits weresplit was effective prior to market open on January 14, 2022, when the fundsfund began trading at theirits post-split price. The reverse splits weresplit was applied retroactively for all periods presented, reducing the number of shares outstanding and resulted in a proportionate increase in the price per share and the per share information of the fund. Therefore, the reverse splitssplit did not change the aggregate net asset value of a shareholder’s investment at the time of the reverse splits.split.
2
On May 11, 2022, the Trust announcedissued a press release announcing a forward share split on ProShares UltraShort Yen and ProShares Ultra Bloomberg Crude Oil and a reverse share split on ProShares UltraShort Bloomberg Natural Gas and ProShares UltraShort Bloomberg Crude Oil. The Splits did not change the value of a shareholder’s investment. ProShares UltraShort Yen executed a 2:1 Forward Split of its shares. ProShares Ultra Bloomberg Crude Oil executed a 4:1 Forward Split of its shares. The Forward Split wasSplits were effective at the market open on May 26, 2022, when the Funds began trading at their post-Forward Split prices. The ticker symbol for the Funds did not change. The Forward SplitSplits decreased the price per share of the Funds with a proportionate increase in the number of shares outstanding. ProShares UltraShort Bloomberg Natural Gas executed a 1:4 Reverse Split of its shares. ProShares UltraShort Bloomberg Crude Oil executed a 1:5 Reverse Split of its shares. The Reverse Split wasSplits were effective at the market open on May 26, 2022, when the Funds began trading at their post-Reverse Split prices. The ticker symbol for the Funds did not change, but the Funds issued new CUSIP numbers (74347Y813 for KOLD and 74347Y797 for SCO). The Reverse SplitSplits increased the price per share of the Funds with a proportionate decrease in the number of shares outstanding.
On June 7, 2023, the Trust issued a press release announcing a reverse share split on ProShares VIX Short-Term Futures ETF, ProShares Ultra VIX Short-Term Futures ETF and ProShares Ultra Bloomberg Natural Gas. The Splits did not change the value of a shareholder’s investment. ProShares VIX Short-Term Futures ETF executed a 1:5 Reverse Split of its shares. ProShares Ultra VIX Short-Term Futures ETF executed a 1:10 Reverse Split of its shares. ProShares Ultra Bloomberg Natural Gas ETF executed a 1:20 Reverse Split of its shares. The Reverse Splits were effective at the market open on June 23, 2023, when the Funds began trading at their post-Reverse Split prices. The ticker symbol for the Funds did not change, but the Funds issued new CUSIP numbers (74347Y789 for VIXY, 74347Y771 for UVXY, and 74347Y763 for BOIL). The Reverse Splits increased the price per share of the Funds with a proportionate decrease in the number of shares outstanding.
| * | See Note 1 of the Notes to Financial Statements in Item 15 of part IV in this Annual Report on Form 10-K. |
Investment Objectives and Principal Investment Strategies
Investment Objectives
The Matching Funds
Investment Objectives of the “Matching VIX” Funds
Each Matching VIX Fund seeks investment results, before fees and expenses, both for a single day andthat over time, that match the performance of the Short-Term VIX Index or the Mid-Term VIX Index (together, the “VIX Futures Indexes”). The VIX Futures Indexes seek to offer exposure to forward market equity volatility through publicly traded futures markets. If a Matching VIX Fund is successful in meeting its objective, its value, before fees and expenses, should gain approximately as much on a percentage basis as the level of its corresponding VIX Futures Index when the benchmark rises. Conversely, its value, before fees and expenses, should lose approximately as much on a percentage basis as the level of its benchmark when the benchmark declines. Each Matching VIX Fund acquires exposure through any one of or combinations of Financial Instruments, including Financial Instruments with respect to the applicable Matching VIX Fund; such that each Matching VIX Fund has exposure intended to approximate its applicable VIX Futures Index at the time of its NAV calculation. The VIX Futures Indexes track the performance of VIX futures contracts; they do not track the performance of the Cboe VIX, and the Matching VIX Funds should not be expected to match the performance of the VIX.
The Geared Funds
Investment Objectives of the “Short” FundsFund
The ProShares Short VIX Short-Term Futures ETF seeks daily investment results, before fees and expenses, that correspond to one-half the inverse (-0.5x) of the daily performance of its benchmark.benchmark (referred to, for Geared Funds, as the “Daily Target”). If the ProShares Short VIX Short-Term Futures ETF is successful in meeting its objective, its value on a given day, before fees and expenses, should gain approximately one-half as much on a percentage basis as its corresponding benchmark when the benchmark declines. Conversely, its value on a given day, before fees and expenses, should lose approximately one-half as much on a percentage basis as the corresponding benchmark when the benchmark
3
rises. The ProShares Short VIX Short-Term Futures ETF will acquire short exposure through any one of or combinations of Financial Instruments, including Financial Instruments with respect to the ProShares Short VIX Short-Term Futures ETF benchmark, such that the Fund has exposure intended to approximate the one-half inverse (-0.5x) of its corresponding benchmark at the time of its NAV calculation. The Fund is benchmarked to the S&P VIX Short-Term Futures Index, an investable index of VIX futures contracts. The Fund is not benchmarked to the VIX.
3
Investment Objectives of the “UltraShort” Funds
Each “UltraShort” Fund seeks daily investment results, before fees and expenses, that correspond to two times the inverse (-2x) of the daily performance of its corresponding benchmark. Expenses may include, among other things, costs related to the purchase, sale and storage of commodities or currencies and the cost of leverage, all of which may be embedded in Financial Instruments used by that Fund. If an UltraShort Fund is successful in meeting its objective, its value on a given day, before fees and expenses, should gain approximately two times as much on a percentage basis as its corresponding benchmark when the benchmark declines. Conversely, its value on a given day, before fees and expenses, should lose approximately two times as much on a percentage basis as the corresponding benchmark when the benchmark rises. Each UltraShort Fund acquires short exposure through any one of or combinations of Financial Instruments, including Financial Instruments with respect to the applicable UltraShort Fund’s benchmark, such that each UltraShort Fund has exposure intended to approximate two times the inverse (-2x) of its corresponding benchmark at the time of its NAV calculation.
Investment Objectives of the “Ultra” Funds
Each “Ultra” Fund, other than the ProShares Ultra VIX Short-Term Futures ETF, seeks daily investment results, before fees and expenses, that correspond to two times (2x) the daily performance of its corresponding benchmark. Expenses may include, among other things, costs related to the purchase, sale and storage of commodities or currencies and the cost of leverage, all of which may be embedded in Financial Instruments used by that Fund. If an Ultra Fund, other than the ProShares Ultra VIX Short-Term Futures ETF, is successful in meeting its objective, its value on a given day, before fees and expenses, should gain approximately two times as much on a percentage basis as its corresponding benchmark when the benchmark rises. Conversely, its value on a given day, before fees and expenses, should lose approximately two times as much on a percentage basis as the corresponding benchmark when the benchmark declines. Each Ultra Fund, other than the ProShares Ultra VIX Short-Term Futures ETF, acquires long exposure through any one of or combinations of Financial Instruments, including Financial Instruments with respect to the applicable Ultra Fund’s benchmark such that each Ultra Fund, other than the ProShares Ultra VIX Short-Term Futures ETF, has exposure intended to approximate two times (2x) its corresponding benchmark at the time of its NAV calculation.
The ProShares Ultra VIX Short-Term Futures ETF seeks daily investment results, before fees and expenses, that correspond to one and one-half times (1.5x) the daily performance of its corresponding benchmark. If the ProShares Ultra VIX Short-Term Futures ETF is successful in meeting its objective, its value on a given day, before fees and expenses, should gain approximately one and one-half times as much on a percentage basis as its corresponding benchmark when the benchmark rises. Conversely, its value on a given day, before fees and expenses, should lose approximately one and one-half times as much on a percentage basis as the corresponding benchmark when the benchmark declines. The ProShares Ultra VIX Short-Term Futures ETF acquires long exposure through any one of or combinations of Financial Instruments, including Financial Instruments with respect to the ProShares Ultra VIX Short-Term Futures ETF benchmark such that the Fund has exposure intended to approximate one and one-half times (1.5x) its corresponding benchmark at the time of its NAV calculation. The Fund is benchmarked to the S&P VIX Short-Term Futures Index, an investable index of VIX futures contracts. The Fund is not benchmarked to the VIX.
The Geared Funds do not seek to achieve their Daily Target for any period other than a day.
The corresponding benchmark for each Fund is listed below:
ProShares VIX Short-Term Futures ETF, ProShares Short VIX Short-Term Futures ETF and ProShares Ultra VIX Short-Term Futures ETF: The S&P 500 VIX Short-Term Futures Index. The S&P 500 VIX Short-Term Futures Index seeks to offer exposure to market volatility through publicly traded futures markets and is designed to measure the return from a rolling long position in the first and second month VIX futures contracts.
ProShares VIX Mid-Term Futures ETF: The S&P 500 VIX Mid-Term Futures Index. The S&P 500 VIX Mid-Term Futures Index seeks to offer exposure to market volatility through publicly traded futures markets and is designed to measure the return from a rolling long position in the fourth, fifth, sixth and seventh month VIX futures contracts.
ProShares UltraShort Bloomberg Crude Oil and ProShares Ultra Bloomberg Crude Oil: The Bloomberg Commodity Balanced WTI Crude Oil IndexSM. The Bloomberg Commodity Balanced WTI Crude Oil IndexSM is designed to track crude oil futures prices.
4
ProShares UltraShort Bloomberg Natural Gas and ProShares Ultra Bloomberg Natural Gas: The Bloomberg Natural Gas SubindexSM. The Bloomberg Natural Gas SubindexSM is designed to track natural gas futures prices traded on the NYMEX.
4
ProShares UltraShort Gold and ProShares Ultra Gold: The Bloomberg Gold SubindexSM. The Bloomberg Gold SubindexSM is intended to reflect the performance of gold, as measured by the price of COMEX gold futures contracts.
ProShares UltraShort Silver and ProShares Ultra Silver: The Bloomberg Silver SubindexSM. The Bloomberg Silver SubindexSM is intended to reflect the performance of silver, as measured by the price of COMEX silver futures contracts.
ProShares UltraShort Euro and ProShares Ultra Euro: The 4:00 p.m. (Eastern Time) spot price of the euro versus the U.S. dollar, using euro/U.S. dollar exchange rate as provided by Bloomberg, expressed in terms of U.S. dollars per unit of foreign currency.
ProShares UltraShort Yen and ProShares Ultra Yen: The 4:00 p.m. (Eastern Time) spot price of the Japanese yen versus the U.S. dollar using the Japanese yen/U.S. dollar exchange rate as provided by Bloomberg, expressed in terms of U.S. dollars per unit of foreign currency.
Principal Investment Strategies
In seeking to achieve each Fund’s investment objective or Daily Target, the Sponsor uses a mathematical approach to investing. Using this approach, the Sponsor determines the type, quantity and mix of Financial Instruments the Sponsor believes, in combination, should produce daily returns consistent with a Fund’s objective.objective or Daily Target. The Funds are not actively managed by traditional methods (e.g., by effecting changes in the composition of a portfolio on the basis of judgments relating to economic, financial and market conditions with a view toward obtaining positive results under all market conditions). Each Fund seeks to remain fully invested at all times in Financial Instruments and money market instruments that, in combination, provide exposure to its underlying benchmark consistent with its investment objective without regard to market conditions, trends or direction.
Certain of the Funds may obtain exposure through Financial Instruments to a representative sample of the components in its underlying index, which have aggregate characteristics similar to those of the underlying benchmark. This “sampling” process typically involves selecting a representative sample of components in the benchmark principally to enhance liquidity and reduce transaction costs while seeking to maintain high correlation with, and similar aggregate characteristics (e.g., underlying commodities and valuations) to, the underlying benchmark. In addition, the Funds may obtain exposure to components not included in the underlying benchmark, invest in assets that are not included in the underlying benchmark or may overweight or underweight certain components contained in the underlying benchmark. For further discussion of the Financial Instruments, see “Information about Financial Instruments and Commodities Markets” below.
Information about Financial Instruments and Commodities Markets
Swap Agreements
Swap agreements are two-party contracts that have traditionally been entered into primarily by institutional investors in over the counter (“OTC”) markets for a specified period ranging from a day to more than a year. However, the Dodd-Frank Wall Street Reform and Consumer Protection Act (the “Dodd-Frank Act”) provides for significant reforms of the OTC derivatives markets, including a requirement to execute certain swap and forward transactions on a CFTC-regulated market and/or to clear such transactions through a CFTC-regulated central clearing organization. In a standard swap transaction, the parties agree to exchange the returns on a particular predetermined investment, instrument or index for a fixed or floating rate of return (the “interest rate leg,” which will also include the cost of borrowing for short swaps) in respect of a predetermined notional amount. The notional amount of the agreement reflects the extent of a Fund’s total investment exposure under the swap agreement. Transaction or commission costs are reflected in the benchmark level at which the transaction is entered into. The gross returns to be exchanged are calculated with respect to the notional amount and the benchmark returns to which the swap is linked. Swaps are usually closed out on a net basis, i.e., the two payment streams are netted out in a cash settlement on the payment date specified in the agreement, with the parties receiving or paying, as the case may be, only the net amount of the two payments. Thus, while the notional amount reflects a Fund’s total investment exposure under the swap agreement (i.e., the entire face amount or principal of a swap agreement), the net amount is a Fund’s current obligations (or rights) under the swap agreement, which is the net amount to be paid or received under the agreement based on the relative values of the positions held by each party to the agreement on any given termination date. In a typical swap agreement entered into by an UltraShort Fund or a Short Fund, absent fees, transaction costs and interest, such Fund would be required to make payments to the swap counterparty in the event the benchmark increases and would be entitled to settlement payments in the event the benchmark decreases. In a typical swap agreement entered into by an Ultra Fund, absent fees, transaction costs and interest, the Ultra Fund would be entitled to settlement payments in the event the benchmark increases and would be required to make payments to the swap counterparty in the event the benchmark decreases.
5
Swap agreements involve, to varying degrees, elements of market risk and exposure to loss in excess of the amount which would be reflected on the Statement of Financial Condition. The notional amounts of the agreement reflect the extent of each Ultra Fund’s total investment exposure under the swap agreement. An UltraShort Fund’s or a Short Fund’s exposure is not limited by the notional amount and its exposure is in theory potentially infinite as there is no fixed limit on the increase in any index value. The primary risks associated with the use of swap agreements arise from the inability of counterparties to perform. Each Fund that invests in swaps bears the risk of loss of the net amount, if any, expected to be received under a swap agreement in the event of the default or bankruptcy of a swap counterparty. Each such Fund enters or intends to enter into swap agreements only with major, global financial institutions; however, there are no limitations on the percentage of its assets each Fund may invest in swap agreements with a particular counterparty. Each Fund that invests in swaps may use various techniques to minimize credit risk including early termination or reset and payment, using different counterparties and limiting the net amount due from any individual counterparty.
Each Fund that invests in swaps generally collateralizes the swap agreements with cash and/or certain securities. Collateral posted in connection with OTC derivative transactions is generally held for the benefit of the counterparty in a segregated tri-party account at the Custodian to protect the counterparty against non-payment by the Fund. The counterparty also may collateralize the OTC swap agreements with cash and/or certain securities, which collateral is typically held for the benefit of the Fund in a segregated tri-party account at a third party custodian. In the event of a default by the counterparty, and the Fund is owed money in the OTC swap transaction, such Fund will seek withdrawal of this collateral from the segregated account and may incur certain costs exercising its right with respect to the collateral. These Funds remain subject to credit risk with respect to the amount it expects to receive from counterparties.
The Funds have sought to mitigate these risks in connection with the OTC swaps by generally requiring that the counterparties for each Fund agree to post collateral for the benefit of the Fund, marked to market daily, subject to certain minimum thresholds; however there are no limitations on the percentage of its assets each Fund may invest in swap agreements with a particular counterparty. To the extent any such collateral is insufficient or there are delays in accessing the collateral, the Funds will be exposed to counterparty risk as described above, including possible delays in recovering amounts as a result of bankruptcy proceedings.
The counterparty risk for cleared derivative transactions is generally lower than for OTC derivatives since generally a clearing organization becomes substituted for each counterparty to a cleared derivative contract and, in effect, guarantees the parties’ performance under the contract as each party to a trade looks only to the clearing house for performance of financial obligations. In addition, cleared derivative transactions benefit from daily marking-to-market and settlement, and segregation and minimum capital requirements applicable to intermediaries.
Forward Contracts
A forward contract is a contractual obligation to purchase or sell a specified quantity of a particular underlying asset at or before a specified date in the future at a specified price and, therefore, is economically similar to a futures contract. Unlike futures contracts, however, forward contracts are typically traded in the OTC markets and are not standardized contracts. Forward contracts for a given commodity or currency are generally available for various amounts and maturities and subject to individual negotiation between the parties involved. Moreover, there is generally no direct means of offsetting or closing out a forward contract by taking an offsetting position as one would a futures contract on a U.S. exchange. If a trader desires to close out a forward contract position, he generally will establish an opposite position in the contract but will settle and recognize the profit or loss on both positions simultaneously on the delivery date. Thus, unlike in the futures contract market where a trader who has offset positions will recognize profit or loss immediately, in the forward market a trader with a position that has been offset at a profit will generally not receive such profit until the delivery date, and likewise a trader with a position that has been offset at a loss will generally not have to pay money until the delivery date. In recent years, however, the terms of forward contracts have become more standardized, and in some instances such contracts now provide a right of offset or cash settlement as an alternative to making or taking delivery of the underlying commodity or currency. The primary risks associated with the use of forward contracts arise from the inability of the counterparty to perform.
Each Fund that invests in forward contracts generally collateralizes the OTC forward contracts with cash and/or certain securities. Such collateral is generally held for the benefit of the counterparty in a segregated tri-party account at the Custodian to protect the counterparty against non-payment by the Fund. The counterparty also may collateralize the OTC forward contracts with cash and/or certain securities, which collateral is typically held for the benefit of the Fund in a segregated tri-party account at a third party custodian. In the event of a default by the counterparty, and the Fund is owed money in the OTC forward transaction, such Fund will seek withdrawal of this collateral from the segregated account and may incur certain costs exercising its right with respect to the collateral. These Funds remain subject to credit risk with respect to the amount it expects to receive from OTC counterparties.
6
The Funds have sought to mitigate these risks with respect to OTC forwards by generally requiring that the counterparties for each Fund agree to post collateral for the benefit of the Fund, marked to market daily, subject to certain minimum thresholds; however, there are no limitations on the percentage of its assets each Fund may invest in forward contracts with a particular counterparty. To the extent any such collateral is insufficient or there are delays in accessing the collateral, the Funds will be exposed to counterparty risk as described above, including possible delays in recovering amounts as a result of bankruptcy proceedings.
The forward markets provide what has typically been a highly liquid market for foreign exchange trading, and in certain cases the prices quoted for foreign exchange forward contracts may be more favorable than the prices for foreign exchange futures contracts traded on U.S. exchanges. Forward contracts have traditionally not been cleared or guaranteed by a third party. However, the Dodd-Frank Act provides for significant reforms of OTC derivatives markets. As a result of the Dodd-Frank Act, the CFTC now regulates non- deliverable forwards (including deliverable forwards where the parties do not take delivery). Certain non-deliverable forward contracts, such as non-deliverable foreign exchange forwards, may be subject to regulation as swap agreements, including mandatory clearing. All foreign exchange forwards, including non-deliverable foreign exchange forwards as well as physically settled foreign exchange forwards, are subject to new reporting requirements. Changes in the forward markets may entail increased costs and result in burdensome reporting requirements.
Commercial banks participating in trading OTC foreign exchange forward contracts often do not require margin deposits, but rely upon internal credit limitations and their judgments regarding the creditworthiness of their counterparties. In recent years, however, many OTC market participants in foreign exchange trading have begun to require that their counterparties post margin.
Futures Contracts
A futures contract is a standardized contract traded on, or subject to the rules of, an exchange that calls for the future delivery of a specified quantity and type of commodity at a specified time and place or alternatively, may call for cash settlement as is the case with VIX futures contracts. Futures contracts are traded on a wide variety of commodities, including bonds, interest rates, agricultural products, stock indexes, currencies, energy, metals, economic indicators and statistical measures. The notional size and calendar term of futures contracts on a particular commodity are identical and are not subject to any negotiation, other than with respect to price and the number of contracts traded between the buyer and seller. Each Fund generally deposits cash with a Futures Commission Merchant (“FCM”) for its open positions in futures contracts, which may, in turn, transfer such deposits to the clearing house to protect the clearing house against non-payment by the Fund. The clearing house becomes substituted for each counterparty to a futures contract, and in effect, guarantees performance. In addition, the FCM may require the Funds to deposit collateral in excess of the clearing house’s margin requirements for the FCM’s own protection.
Certain futures contracts, such as VIX futures contracts, as well as stock index contracts and certain commodity futures contracts, settle in cash, reflecting the difference between the contract purchase/sale price and the contract settlement price. The cash settlement mechanism avoids the potential for either side to have to deliver the underlying asset. For other futures contracts, the contractual obligations of a buyer or seller may generally be satisfied by taking or making physical delivery of the underlying asset or by making an offsetting sale or purchase of an identical futures contract on the same or linked exchange before the designated date of delivery. The difference between the price at which the futures contract is purchased or sold and the price paid for the offsetting sale or purchase, after allowance for brokerage commissions, constitutes the profit or loss to the trader.
Regulations
Derivatives exchanges in the United States are subject to regulation under the CEA, by the CFTC, the governmental agency having responsibility for regulation of derivatives exchanges and trading on those exchanges. Following the adoption of the Dodd-Frank Act, the CFTC also has authority to regulate OTC derivative markets, including certain OTC foreign exchange markets. The CFTC has exclusive authority to designate exchanges for the trading of specific futures contracts and options on futures contracts and to prescribe rules and regulations of the marketing of each. The CFTC also regulates the activities of “commodity pool operators” and the CFTC has adopted regulations with respect to certain of such persons’ activities. Pursuant to its authority, the CFTC requires a commodity pool operator, such as the Sponsor, to keep accurate, current and orderly records with respect to each pool it operates. The CFTC may suspend, modify or terminate the registration of any registrant for failure to comply with CFTC rules or regulations. Suspension, restriction or termination of the Sponsor’s registration as a commodity pool operator would prevent it, until such time (if any) as such registration were to be reinstated, from managing, and might result in the termination of the Funds. If the Sponsor were unable to provide services and/or advice to the Funds, the Funds would be unable to pursue their investment objectives unless and until the Sponsor’s ability to provide services and advice to the Funds was reinstated or a replacement for the Sponsor as commodity pool operator could be found. Such an event could result in termination of the Funds.
7
The CEA requires all FCMs to meet and maintain specified fitness and financial requirements, segregate customer funds from proprietary funds and account separately for all customers’ funds and positions, and to maintain specified books and records open to inspection by the staff of the CFTC. See “Item 1A. Risk Factors. Failure of the FCMs to segregate assets may increase losses in the Funds.” in this Annual Report on Form 10-K.
7
The CEA also gives the states certain powers to enforce its provisions and the regulations of the CFTC.
Under certain circumstances, the CEA grants shareholders the right to institute a reparations proceeding before the CFTC against the Sponsor (as a registered commodity pool operator), an FCM, as well as those of their respective employees who are required to be registered under the CEA. Shareholders may also be able to maintain a private right of action for certain violations of the CEA.
Pursuant to authority in the CEA, the National Futures Association (the “NFA”) has been formed and registered with the CFTC as a registered futures association. At the present time, the NFA is the only self-regulatory organization for commodities professionals other than exchanges. As such, the NFA promulgates rules governing the conduct of commodity professionals and disciplines those professionals that do not comply with such standards. The CFTC has delegated to the NFA responsibility for the registration of commodity pool operators, FCMs, swap dealers, commodity trading advisors, introducing brokers and their respective associated persons and floor brokers. The Sponsor is a member of the NFA (the Funds themselves are not required to become members of the NFA). As an NFA member, the Sponsor is subject to NFA standards relating to fair trade practices, financial condition, and consumer protection. The CFTC is prohibited by statute from regulating trading on foreign commodity exchanges and markets.
The CEA and CFTC regulations prohibit market abuse and generally require that all futures exchange-based trading be conducted in compliance with rules designed to ensure the integrity of market prices and without any intent to manipulate prices. CFTC regulations and futures exchange rules also impose limits on the size of the positions that a person may hold or control as well as standards for aggregating certain positions. The rules of the CFTC and the futures exchanges also authorize special emergency actions to halt, suspend or limit trading overall or to restrict, halt, suspend or limit the trading of an individual trader or to otherwise impose special reporting or margin requirements. See also “Item 1A. Risk Factors. Regulatory changes or actions, including the implementation of new legislation, may alter the operations and profitability of the Funds” and “Item 1A. Risk Factors. Regulatory and exchange accountability levels may restrict the creation of Creation Units and the operation of the Trust” in this Annual Report on Form 10-K.
Description of the Bloomberg Commodity Index SM and its Sub-Indexes
Overview of the Bloomberg Family of Indices
Bloomberg Commodity Balanced WTI Crude Oil IndexSM
ProShares UltraShort Bloomberg Crude Oil and ProShares Ultra Bloomberg Crude Oil are designed to correspond, before fees and expenses, to two times the inverse (-2x) or two times (2x), respectively, of the daily performance of the Bloomberg Commodity Balanced WTI Crude Oil IndexSM, a sub-index of the Bloomberg Commodity Index. The Bloomberg Commodity Balanced WTI Crude Oil IndexSM is intended to track the performance of 3 separate contract schedules for WTI Crude Oil futures. One third of the Benchmark follows a monthly roll schedule two months beyond the nearby contract. The second third of the Benchmark follows a June annual roll schedule, while the remaining third follows a December annual roll schedule. The Benchmark weights are equally reset semi-annually in the months of March and September on close of the first business day. The weighting of the futures contracts included in the Benchmark is not linked to the “spot” price of WTI crude oil. For more information about the risks associated with rolling futures positions, see “Item 1A. Risk Factors. Potential negative impact from rolling futures positions” in this Annual Report on Form 10-K.
Bloomberg Natural Gas SubindexSM
ProShares UltraShort Bloomberg Natural Gas and ProShares Ultra Bloomberg Natural Gas are designed to correspond, before fees and expenses, to two times the inverse (-2x) or two times (2x), respectively, of the daily performance of the Bloomberg Natural Gas SubindexSM, a sub-index of the Bloomberg Commodity Index. The Bloomberg Natural Gas SubindexSM is intended to reflect the performance of a rolling position in natural gas futures contracts traded on the NYMEX without regard to income earned on cash positions. An investment in natural gas futures contracts may often perform very differently than the price of physical natural gas (e.g., the wellhead or end-user price of natural gas). See “Item 1A. Risk Factors. The Commodity Index Funds are linked to an index comprised of commodity futures contracts, and are not linked to the spot prices of the underlying physical commodities. Commodity futures contracts may perform very differently from the spot price of the underlying physical commodities” in this Annual Report on Form 10-K.
8
The Bloomberg Natural Gas SubindexSM is based on the Natural Gas component of the Bloomberg Commodity Index, which is described above under “Bloomberg Commodity IndexSM,” and tracks what is known as a rolling futures position. The roll occurs over a period of five Bloomberg Commodity Index business days in certain months according to a pre-determined schedule, generally beginning on the sixth business day of the month and ending on the tenth business day. Each day, approximately 20% of each rolling futures position that is included in the month’s roll is rolled, increasing from 0% to 20%, 40%, 60%, 80% and finally 100%. The exact roll methodology differs between certain commodities. The index will reflect the performance of its underlying natural gas contracts, including the impact of rolling, without regard to income earned on cash positions. For more information about the risks associated with rolling futures positions, see “Item 1A. Risk Factors. Potential negative impact from rolling futures positions” in this Annual Report on Form 10-K.
Bloomberg Gold SubindexSM
ProShares Ultra Gold and ProShares UltraShort Gold are designed to correspond, before fees and expenses, to two times (2x) or two times the inverse (-2x), respectively, of the daily performance of the Bloomberg Gold SubindexSM, a sub-index of the Bloomberg Commodity Index. The Bloomberg Gold Subindex is intended to reflect the performance of gold, as measured by the price of COMEX gold futures contracts, including the impact of rolling, without regard to income earned on cash positions. The Gold Subindex is not directly linked to the “spot price” of gold. Futures contracts may perform very differently from the spot price of gold.
The Gold Subindex is based on the gold component of the Bloomberg Commodity Index and tracks what is known as a rolling futures position. Unlike equities, which entitle the holder to a continuing stake in a corporation, commodity futures contracts specify a delivery date for the underlying physical commodity or its cash equivalent. The Gold Subindex is a “rolling index,” which means that the Gold Subindex does not take physical possession of any commodities. An investor with a rolling futures position is able to avoid delivering (or taking delivery of) underlying physical commodities while maintaining exposure to those commodities. The roll occurs over a period of five Gold Subindex business days in certain months according to a pre-determined schedule, generally beginning on the sixth business day of the month and ending on the tenth business day. Each day, approximately 20% of each rolling futures position that is included in the month’s roll is rolled, increasing from 0% to 20%, 40%, 60%, 80% and finally 100%. The Gold Subindex will reflect the performance of its underlying gold futures contracts, including the impact of rolling, without regard to the income earned on cash positions.
Bloomberg Silver SubindexSM
ProShares Ultra Silver and ProShares UltraShort Silver are designed to correspond, before fees and expenses, to two times (2x) or two times the inverse (-2x), respectively, of the daily performance of the Bloomberg Silver SubindexSM, a sub-index of the Bloomberg Commodity Index. The Bloomberg Silver Subindex is intended to reflect the performance of silver, as measured by the price of COMEX silver futures contracts, including the impact of rolling, without regard to income earned on cash positions. The Silver Subindex is not directly linked to the “spot price” of silver. Futures contracts may perform very differently from the spot price of silver.
The Silver Subindex is based on the silver component of the Bloomberg Commodity Index and tracks what is known as a rolling futures position. Unlike equities, which entitle the holder to a continuing stake in a corporation, commodity futures contracts specify a delivery date for the underlying physical commodity or its cash equivalent. The Silver Subindex is a “rolling index,” which means that the Silver Subindex does not take physical possession of any commodities. An investor with a rolling futures position is able to avoid delivering (or taking delivery of) underlying physical commodities while maintaining exposure to those commodities. The roll occurs over a period of five Silver Subindex business days in certain months according to a pre-determined schedule, generally beginning on the sixth business day of the month and ending on the tenth business day. Each day, approximately 20% of each rolling futures position that is included in the month’s roll is rolled, increasing from 0% to 20%, 40%, 60%, 80% and finally 100%. The Silver Subindex will reflect the performance of its underlying silver futures contracts, including the impact of rolling, without regard to the income earned on cash positions.
Information about the Index Licensor
“Bloomberg®”, “Bloomberg Commodity IndexSM”, “Bloomberg Commodity Balanced WTI Crude Oil IndexSM”, “Bloomberg Natural Gas SubindexSM”, “Bloomberg Gold SubindexSM” and “Bloomberg Silver SubindexSM” are service marks of Bloomberg Finance L.P. and its affiliates, including Bloomberg Index Services Limited (“BISL”), the administrator of the indices (collectively, “Bloomberg”) and have been licensed for use for certain purposes by ProShares Trust II (“Licensee”).
9
The Products are not sponsored, endorsed, sold or promoted by Bloomberg. Bloomberg does not make any representation or warranty, express or implied, to the owners of or counterparties to the Product(s) or any member of the public regarding the advisability of investing in securities or commodities generally or in the Product(s) particularly. The only relationship of Bloomberg to the Licensee is the licensing of certain trademarks, trade names and service marks and of the Bloomberg Commodity IndexSM, the Bloomberg
9
Commodity Balanced WTI Crude Oil IndexSM, the Bloomberg Natural Gas SubindexSM, the Bloomberg Gold SubindexSM and the Bloomberg Silver SubindexSM, which are determined, composed and calculated by BISL without regard to the Licensee or the Product(s). Bloomberg has no obligation to take the needs of the Licensee or the owners of the Product(s) into consideration in determining, composing or calculating the Bloomberg Commodity IndexSM, the Bloomberg Commodity Balanced WTI Crude Oil IndexSM, the Bloomberg Natural Gas SubindexSM, the Bloomberg Gold SubindexSM or the Bloomberg Silver SubindexSM. Bloomberg is not responsible for and has not participated in the determination of the timing of, prices at, or quantities of the Product(s) to be issued or in the determination or calculation of the equation by which the Product(s) are to be converted into cash. Bloomberg shall not have any obligation or liability, including, without limitation, to Products customers, in connection with the administration, marketing or trading of the Product(s).
This Annual Report on Form 10-K relates only to Products and does not relate to the exchange-traded physical commodities underlying any of the Bloomberg Commodity IndexSM, the Bloomberg Commodity Balanced WTI Crude Oil IndexSM, the Bloomberg Natural Gas SubindexSM, the Bloomberg Gold SubindexSM or the Bloomberg Silver SubindexSM components. Purchasers of the Products should not conclude that the inclusion of a futures contract in the Bloomberg Commodity IndexSM, the Bloomberg Commodity Balanced WTI Crude Oil IndexSM, the Bloomberg Natural Gas SubindexSM, the Bloomberg Gold SubindexSM or the Bloomberg Silver SubindexSM is any form of investment recommendation of the futures contract or the underlying exchange-traded physical commodity by Bloomberg. The information in this Annual Report on Form 10-K regarding the Bloomberg Commodity IndexSM, the Bloomberg Commodity Balanced WTI Crude Oil IndexSM, the Bloomberg Natural Gas SubindexSM, the Bloomberg Gold SubindexSM and the Bloomberg Silver SubindexSM components has been derived solely from publicly available documents. Bloomberg has not made any due diligence inquiries with respect to the Bloomberg Commodity IndexSM, the Bloomberg Commodity Balanced WTI Crude Oil IndexSM, the Bloomberg Natural Gas SubindexSM, the Bloomberg Gold SubindexSM or the Bloomberg Silver SubindexSM components in connection with Products. Bloomberg makes no representation that these publicly available documents or any other publicly available information regarding the Bloomberg Commodity IndexSM, the Bloomberg Commodity Balanced WTI Crude Oil IndexSM, the Bloomberg Natural Gas SubindexSM, the Bloomberg Gold SubindexSM or the Bloomberg Silver SubindexSM components, including without limitation a description of factors that affect the prices of such components, are accurate or complete.
BLOOMBERG DOES NOT GUARANTEE THE ACCURACY AND/OR THE COMPLETENESS OF THE BLOOMBERG COMMODITY INDEXSM,INDEXSM, THE BLOOMBERG COMMODITY BALANCED WTI CRUDE OIL INDEXSM,INDEXSM, THE BLOOMBERG NATURAL GAS SUBINDEXSM,SUBINDEXSM, THE BLOOMBERG GOLD SUBINDEXSMSUBINDEXSM OR THE BLOOMBERG SILVER SUBINDEXSMSUBINDEXSM OR ANY DATA RELATED THERETO AND SHALL HAVE NO LIABILITY FOR ANY ERRORS, OMISSIONS OR INTERRUPTIONS THEREIN. BLOOMBERG DOES NOT MAKE ANY WARRANTY, EXPRESS OR IMPLIED, AS TO RESULTS TO BE OBTAINED BY THE LICENSEE, OWNERS OF THE PRODUCT(S) OR ANY OTHER PERSON OR ENTITY FROM THE USE OF THE BLOOMBERG COMMODITY INDEXSM,INDEXSM, THE BLOOMBERG COMMODITY BALANCED WTI CRUDE OIL INDEXSM,INDEXSM, THE BLOOMBERG NATURAL GAS SUBINDEXSM,SUBINDEXSM, THE BLOOMBERG GOLD SUBINDEXSMSUBINDEXSM OR THE BLOOMBERG SILVER SUBINDEXSMSUBINDEXSM OR ANY DATA RELATED THERETO. BLOOMBERG DOES NOT MAKE ANY EXPRESS OR IMPLIED WARRANTIES AND EXPRESSLY DISCLAIMS ALL WARRANTIES OF MERCHANTABILITY OR FITNESS FOR A PARTICULAR PURPOSE OR USE WITH RESPECT TO THE BLOOMBERG COMMODITY INDEXSM,INDEXSM, THE BLOOMBERG COMMODITY BALANCED WTI CRUDE OIL INDEXSM,INDEXSM, THE BLOOMBERG NATURAL GAS SUBINDEXSM,SUBINDEXSM, THE BLOOMBERG GOLD SUBINDEXSMSUBINDEXSM OR THE BLOOMBERG SILVER SUBINDEXSMSUBINDEXSM OR ANY DATA RELATED THERETO. WITHOUT LIMITING ANY OF THE FOREGOING, TO THE MAXIMUM EXTENT ALLOWED BY LAW, BLOOMBERG, ITS LICENSORS, AND ITS AND THEIR RESPECTIVE EMPLOYEES, CONTRACTORS, AGENTS, SUPPLIERS, AND VENDORS SHALL HAVE NO LIABILITY OR RESPONSIBILITY WHATSOEVER FOR ANY INJURY OR DAMAGES—WHETHERDAMAGES —WHETHER DIRECT, INDIRECT, CONSEQUENTIAL, INCIDENTAL, PUNITIVE OR OTHERWISE—ARISINGOTHERWISE —ARISING IN CONNECTION WITH THE NAME OF PRODUCT OR NAME OF INDEX OR ANY DATA OR VALUES RELATING THERETO—WHETHERTHERETO —WHETHER ARISING FROM THEIR NEGLIGENCE OR OTHERWISE, EVEN IF NOTIFIED OF THE POSSIBILITY THEREOF.
Description of the Currencies Benchmarks
The Currency Funds are designed to correspond, before fees and expenses, to two times the inverse (-2x), or two times (2x) of the daily performance of the spot price of the applicable currency versus the U.S. dollar. The spot price of each currency is measured by the 4:00 p.m. (Eastern Time) spot prices as provided by Bloomberg, expressed in terms of U.S. dollars per unit of foreign currency. The Currency Funds do not necessarily directly or physically hold the underlying currency and will instead seek exposure through the use of certain Financial Instruments whose value is based on the price of the underlying currency to pursue its investment objective.
10
Euro
ProShares UltraShort Euro and ProShares Ultra Euro are designed to correspond, before fees and expenses, to the two times the inverse (-2x), or two times (2x), respectively, of the daily performance of the euro spot price versus the U.S. dollar. These Funds use the 4:00 p.m. (Eastern Time) euro/U.S. dollar exchange rate as provided by Bloomberg, expressed in terms of U.S. dollars per unit of foreign currency, as the basis for the underlying benchmark.
10
In 1998, the European Central Bank in Frankfurt was organized by Austria, Belgium, Finland, France, Germany, Ireland, Italy, Luxembourg, the Netherlands, Portugal and Spain in order to establish a common currency-the euro. Unlike the U.S. Federal Reserve System, the Bank of Japan and other comparable central banks, the European Central Bank is a central authority that conducts monetary policy for an economic area consisting of many otherwise largely autonomous states.
At its inception on January 1, 1999, the euro was launched as an electronic currency used by banks, foreign exchange dealers and stock markets. In 2002, the euro became cash currency for approximately 300 million citizens of twelve European countries (the eleven countries mentioned above, in addition to Greece). As of December 31, 2022,2023, 23 countries used the euro, including Andorra, Austria, Belgium, Cyprus, Estonia, Finland, France, Germany, Greece, Ireland, Italy, Latvia, Lithuania, Luxembourg, Malta, the Netherlands, Portugal, San Marino, Slovakia, Slovenia, and the Vatican City.
The European financial markets and the value of the euro have experienced significant volatility, in part related to unemployment, budget deficits and economic downturns. In addition, several member countries of the Economic and Monetary Union (the “EMU”) of the European Union (the “EU”) have experienced credit rating downgrades, rising government debt levels and, for certain EU member countries (including Greece, Spain, Portugal, Ireland and Italy), weaknesses in sovereign debt. Following a referendum in June 2016, the United Kingdom formally exited the EU on January 31, 2020 (known as “Brexit”). During a transition period where the United Kingdom remained subject to EU rules but had no role in the EU law-making process, the United Kingdom and EU representatives negotiated the precise terms of their future relationship, reaching an agreement on December 24, 2020. On December 31, 2020, the transition period concluded and the terms of the new agreement went into effect on January 1, 2021. The complete impact of the new agreement, as well as the full scope and nature of the consequences of the exit, are not at this time known and are unlikely to be known for a significant period of time, but the future direction of the value of non-U.S. currencies or the U.S. dollar and, in turn, affect the value of the Currency Funds. In addition, these uncertainties could increase volatility in the market prices of non-U.S. currencies or the U.S. dollar and, in turn, affect the value of the Currency Funds. The effects of Brexit will depend on agreements the UK negotiates to retain access to EU markets either during a transitional period or more permanently. Brexit could lead to legal and tax uncertainty and potentially divergent national laws and regulations as the UK determines which EU laws to replace and replicate.
Although the European countries that have adopted the euro are members of the European Union (“EU”), the United Kingdom, Denmark and Sweden are EU members that have not adopted the euro as their national currency.
Japanese Yen
ProShares UltraShort Yen and ProShares Ultra Yen are designed to correspond, before fees and expenses, to two times the inverse (-2x) or two times (2x), respectively, of the daily performance of the Japanese yen spot price versus the U.S. dollar. These Funds use the 4:00 p.m. (Eastern Time) Japanese yen/U.S. dollar exchange rate as provided by Bloomberg, expressed in terms of U.S. dollars per unit of foreign currency, as the basis for the underlying benchmark.
The Japanese yen has been the official currency of Japan since 1871. The Bank of Japan has been operating as the central bank of Japan since 1882.
Description of the VIX Futures Indexes
The VIX Funds seek to offer exposure to forward equity market volatility by obtaining exposure to the VIX Futures Indexes, which are based on publicly traded VIX futures contracts. The VIX Futures Indexes are intended to reflect the returns that are potentially available through an unleveraged investment in the VIX futures contracts comprising each VIX Futures Index. The VIX, which is not the index underlying the VIX Funds, is calculated based on the prices of put and call options on the S&P 500. The VIX Funds can be expected to perform very differently from the VIX.
The Short-Term VIX Index employs rules for selecting VIX futures contracts comprising the Short-Term VIX Index and a formula to calculate a level for that index from the prices of these VIX futures contracts. Specifically, the VIX futures contracts comprising the Short-Term VIX Index represent the prices of two near-term VIX futures contracts, replicating a position that rolls the nearest month VIX futures to the next month VIX futures on a daily basis in equal fractional amounts. This results in a constant weighted average maturity of one-month. The roll period begins on the Tuesday prior to the monthly Cboe VIX futures settlement and runs through the Tuesday prior to the subsequent month’s Cboe VIX futures settlement date.
11
The Mid-Term VIX Index also employs rules for selecting its VIX futures contracts comprising the Mid-Term VIX Index and a formula to calculate a level for that index from the prices of these VIX futures contracts. Specifically, the VIX futures contracts comprising the Mid-Term VIX Index represent the prices for four contract months of VIX futures contracts, representing a rolling long position in the fourth, fifth, sixth and seventh month VIX futures contracts. The Mid-Term VIX Index rolls continuously throughout each month while maintaining positions in the fifth and sixth month contracts. This results in a constant weighted average maturity of five months.
11
The level of each VIX Futures Index will be published by Bloomberg L.P. in real time and at the close of trading on each VIX Futures Index business day under the following ticker symbols:
Index | Bloomberg Ticker Symbol | ||||||
S&P 500 VIX Short-Term Futures Index | SPVXSP | ||||||
S&P 500 VIX Mid-Term Futures Index | SPVXMPID | ||||||
The performance of the VIX Futures Indexes is influenced by the S&P 500 (and options thereon) and the VIX. A description of VIX futures contracts, the VIX and the S&P 500 follows:
VIX Futures Contracts
Both VIX Futures Indexes are comprised of VIX futures contracts. VIX futures contracts were first launched for trading by the Cboe in 2004. VIX futures contracts allow investors to invest based on their view of the forward implied market volatility of the S&P 500. Investors that believe the forward implied market volatility of the S&P 500 will increase may buy VIX futures contracts. Conversely, investors that believe that the forward implied market volatility of the S&P 500 will decline may sell VIX futures contracts.
While the VIX represents a measure of the current expected volatility of the S&P 500 over the next 30 days, the prices of VIX futures contracts are based on the current expectation of the expected 30-day volatility of the S&P 500 on the expiration date of the futures contract. Since the VIX and VIX futures contracts are two distinctly different measures, the VIX and VIX futures contracts generally behave quite differently.
The VIX
The VIX Funds are not linked to the VIX and can be expected to perform very differently from the VIX. The VIX is an index designed to measure the implied volatility of the S&P 500 over 30 days in the future, and is calculated based on the prices of certain put and call options on the S&P 500. The VIX is reflective of the premium paid by investors for certain options linked to the level of the S&P 500. During periods of rising investor uncertainty, including periods of market instability, the implied level of volatility of the S&P 500 typically increases and, consequently, the prices of options linked to the S&P 500 typically increase (assuming all other relevant factors remain constant or have negligible changes). This, in turn, causes the level of the VIX to increase. The VIX has historically had a negative correlation to the S&P 500. The VIX was developed by the Cboe and is calculated, maintained and published by the Cboe. The Cboe has no obligation to continue to publish, and may discontinue the publication of, the VIX. The VIX is reported by Bloomberg under the ticker symbol “VIX.”
The calculation of the VIX involves a formula that uses the prices of a weighted series of out-of-the-money put and call options on the level of the S&P 500 (“SPX Options”) with two adjacent expiry terms to derive a constant 30-day forward measure of market volatility. The VIX is calculated independent of any particular option pricing model and in doing so seeks to eliminate any biases which may otherwise be included in using options pricing methodology based on certain assumptions. Although the VIX measures the
12
30-day forward volatility of the S&P 500 as implied by the SPX Options, 30-day options are only available once a month. To arrive at the VIX level, a broad range of out-of-the-money SPX Options expiring on the two closest nearby months (“near term options” and “next term options,” respectively) are selected in order to bracket a 30-day calendar period. SPX Options having a maturity of less than eight days are excluded at the outset and, when the near term options have eight days or less left to expiration, the VIX rolls to the second and third contract months in order to minimize pricing anomalies that occur close to expiration. The model-free implied volatility using prices of the near term options and next term options are then calculated on a strike price weighted average basis in order to arrive at a single average implied volatility value for each month. The results of each of the two months are then interpolated to arrive at a single value with a constant maturity of 30 days to expiration.
The S&P 500
The S&P 500 is an index that measures large-cap U.S. stock market performance. It is a float-adjusted market capitalization weighted index of 500 U.S. operating companies and real estate investment trusts selected by the S&P U.S. Index Committee through a non-non-mechanical mechanical process that factor in criteria such as domicile, investible weight factor, liquidity, market capitalization and financial viability. Changes to the index composition are made on an as needed basis. There is no scheduled reconstitution. Rather, changes in response to corporate actions and market developments can be made at any time. As of December 31, 2022,2023, the S&P 500 included companies with capitalizations between $3.6$4.9 billion and $2.1$3.0 trillion. The average capitalization of the companies comprising the Index was approximately $67.2$83.6 billion. S&P publishes the S&P 500. The daily calculation of the current value of the S&P 500 is based on the relative value of the aggregate market value of the common stocks of 500 companies as of a particular time compared to the
12
aggregate average initial market value of the common stocks of 500 similar companies at the time of the inception of the S&P 500. The 500 companies are not the 500 largest publicly traded companies and not all 500 companies are listed on the NYSE. Constituent selection is at the discretion of the Index Committee and is based on eligibility criteria. The indices have a fixed constituent company count of 500, 400, and 600, respectively. Sector balance, as measured by a comparison of each GICs sector’s weight in the S&P Total Market Index, in the relevant capitalization range, is also considered in the selection of companies for the indices. S&P may from time-to-time, in its sole discretion, add companies to, or delete companies from, the S&P 500 to achieve the objectives stated above. Relevant criteria employed by S&P include the viability of the particular company, the extent to which that company represents the industry group to which it is assigned, the extent to which the company’s common stock is widely held and the market value and trading activity of the common stock of that company.
THE VIX FUNDS ARE NOT SPONSORED, ENDORSED, SOLD OR PROMOTED BY S&P AND ITS AFFILIATES OR CBOE. S&P AND CBOE MAKE NO REPRESENTATION, CONDITION OR WARRANTY, EXPRESS OR IMPLIED, TO THE OWNERS OF THE VIX FUNDS OR ANY MEMBER OF THE PUBLIC REGARDING THE ADVISABILITY OF INVESTING IN SECURITIES GENERALLY OR IN THE VIX FUNDS PARTICULARLY OR THE ABILITY OF THE INDEXES TO TRACK MARKET PERFORMANCE AND/OR OF GROUPS OF ASSETS OR ASSET CLASSES AND/OR TO ACHIEVE ITS STATED OBJECTIVE AND/OR TO FORM THE BASIS OF A SUCCESSFUL INVESTMENT STRATEGY, AS APPLICABLE. S&P’S AND CBOE’S ONLY RELATIONSHIP TO THE TRUST ON BEHALF OF ITS APPLICABLE SERIES AND THE SPONSOR IS THE LICENSING OF CERTAIN TRADEMARKS AND TRADE NAMES AND OF THE VIX FUTURES INDEXES WHICH ARE DETERMINED, COMPOSED AND CALCULATED BY S&P WITHOUT REGARD TO THE TRUST ON BEHALF OF ITS APPLICABLE SERIES AND THE SPONSOR OR THE VIX FUNDS. S&P HAS NO OBLIGATION TO TAKE THE NEEDS OF THE TRUST ON BEHALF OF ITS APPLICABLE SERIES AND THE SPONSOR OR THE OWNERS OF THE VIX FUNDS INTO CONSIDERATION IN DETERMINING, COMPOSING OR CALCULATING THE VIX FUTURES INDEXES. S&P AND CBOE ARE NOT ADVISORS TO THE VIX FUNDS AND ARE NOT RESPONSIBLE FOR AND HAVE NOT PARTICIPATED IN THE DETERMINATION OF THE PRICES AND AMOUNT OF THE VIX FUNDS OR THE TIMING OF THE ISSUANCE OR SALE OF THE VIX FUNDS OR IN THE DETERMINATION OR CALCULATION OF THE EQUATION BY WHICH THE VIX FUND SHARES ARE TO BE CONVERTED INTO CASH. S&P AND CBOE HAVE NO OBLIGATION OR LIABILITY IN CONNECTION WITH THE ADMINISTRATION, MARKETING, OR TRADING OF THE VIX FUNDS.
NEITHER S&P DOW JONES INDICES NOR THIRD PARTY LICENSOR GURANTEES THE ADEQUACY, ACCURACY, TIMELINESS, AND/OR THE COMPLETENESS OF THE S&P 500 VIX MID-TERM FUTURES INDEX OR ANY DATA RELATED THERETO OR ANY COMMUNICATION INCLUDING BUT NOT LIMITED TO, ORAL OR WRITTEN COMMUNCATION, (INCLUDING ELECTRONIC COMMUNICATIONS) WITH RESEPECT THERETO. NEITHER S&P DOW JONES INDICES NOR CBOE SHALL BE SUBJECT TO ANY DAMANGES OR LIABILITY FOR ANY ERRORS, OMISSIONS, OR DELAYS THEREIN. S&P DOW JONES INDICES AND CBOE MAKES NO EXPRESS OR IMPLIED WARRANTIES, AND EXPRESSLY DISCLAIMS ALL WARRANTIES, OF MERCHANTABILITY OR FITNESS FOR A PARCIULAR PRUPOSE OR USE AS TO RESULTS TO BE OBTAINED BY PROSHARES TRUST II, ON BEHALF OF ITS APPLICABLE SERIES, AND PROSHARE CAPITAL MANAGEMENT LLC, OWNERS OF THE FUND, OR ANY OTHER PERSON OR ENTITY FROM THE USE OF THE S&P 500 VIX SHORT-TERM FUTURES ER MCAP INDEX OR WITH RESPECT TO ANY DATA RELATED THERETO. IN NO EVENT WHATSOEVER SHALL S&P DOW JONES INDICES OR CBOE, BE LIABLE FOR ANY INDEIRECT, SPECIAL, INCIDENTAL, PUNITIVE, OR CONSEQUENTIAL DAMAGES INCLUDING BUT NOT LIMITED TO,
13
LOSS OF PROFITS, TRADING LOSSES, LOST TIME OR GOODWILL, EVEN IF THEY HAVE BEEN ADVISED OF THE POSSIBLITY OF SUCH DAMAGES, WHETHER IN CONTRACT, TORT, STRICT LIABILITY, OR OTHERWISE. THERE ARE NO THIRD PARTY BENEFICIARIES OF ANY AGREEMENTS OR ARRANGEMENTS BETWEEN S&P DOW JONES INDICES AND PROSHARES TRUST II, ON BEHALF OF ITS APPLICABLE SERIES, OR PROSHARE CAPITAL MANAGEMENT LLC, OTHER THAN THE LICENSORS OF S&P DOW JONES INDICES.
Creation and Redemption of Shares
Each Fund creates and redeems Shares from time to time, but only in one or more Creation Units. A Creation Unit is a block of 50,000 Shares of a Geared Fund or a block of 25,000 Shares of a Matching VIX Fund. Creation Units may be created or redeemed only by Authorized Participants. Except when aggregated in Creation Units, the Shares are not redeemable securities.
The manner by which Creation Units are purchased and redeemed is dictated by the terms of the Authorized Participant Agreement and Authorized Participant Handbook. By placing a purchase order, an Authorized Participant agrees to deposit cash (unless as provided otherwise in the prospectus) with the Custodian of the Funds.
13
From time to time the Sponsor, in its sole discretion, may impose limits on the number of Creation Units that may be created each day by each Authorized Participant, or on the total number of Creation Units that may be created by all Authorized Participants on such day, or may suspend the purchase and/or redemption of Creation Units altogether. For example, the Sponsor may impose such limits or suspension if it believes doing so would help a Fund manage its portfolio, such as by allowing a Fund to comply with counterparty or position limits, or to manage or otherwise comply with Share registration requirements, or in response to significant and/or rapid increases in the size of a Fund as a result of an increase in creation activity.
If permitted by the Sponsor in its sole discretion with respect to a Fund, an Authorized Participant may also agree to enter into or arrange for an exchange of a futures contract for a related position (“EFCRP”) or block trade with the relevant Fund whereby the Authorized Participant would also transfer to such Fund a number and type of exchange-traded futures contracts at or near the closing settlement price for such contracts on the purchase order date. Similarly, the Sponsor in its sole discretion may agree with an Authorized Participant to use an EFCRP to affect an order to redeem Creation Units.
An EFCRP is a technique permitted by the rules of the applicable futures exchange that, as utilized by a Fund in the Sponsor’s discretion, would allow such Fund to take a position in a futures contract from an Authorized Participant, or give futures contracts to an Authorized Participant, in the case of a redemption, rather than to enter the futures exchange markets to obtain such a position. An EFCRP by itself will not change either party’s net risk position materially. Because the futures position that a Fund would otherwise need to take in order to meet its investment objective can be obtained without unnecessarily impacting the financial or futures markets or their pricing, EFCRPs can generally be viewed as transactions beneficial to a Fund. A block trade is a technique that permits certain Funds to obtain a futures position without going through the market auction system and can generally be viewed as a transaction beneficial to the Fund.
Authorized Participants pay a fixed transaction fee of up to $250 in connection with each order to create or redeem a Creation Unit in order to compensate The Bank of New York Mellon (“BNY Mellon”), as the Administrator, the Custodian and the Transfer Agent of each Fund and its Shares, for services in processing the creation and redemption of Creation Units and to offset the costs of increasing or decreasing derivative positions. Authorized Participants also may pay a variable transaction fee to the Funds of up to 0.10% (and a variable transaction fee to the Matching VIX Funds of 0.05%) of the value of the Creation Unit that is purchased or redeemed unless the transaction fee is waived or otherwise adjusted by the Sponsor. The Sponsor provides such Authorized Participant with prompt notice in advance of any such waiver or adjustment of the transaction fee. Authorized Participants may sell the Shares included in the Creation Units they purchase from the Funds to other investors in the secondary market.
The form of Authorized Participant Agreement and the related Authorized Participant Handbook set forth the procedures for the creation and redemption of Creation Units and for the payment of cash required for such creations and redemptions. The Sponsor may delegate its duties and obligations under the form of Authorized Participant Agreement to SEI Investments Distribution Co. (“SEI”) or BNY Mellon, in its capacity as the Administrator, without consent from any shareholder or Authorized Participant. The form of Authorized Participant Agreement and the related procedures attached thereto may be amended by the Sponsor without the consent of any shareholder or Authorized Participant. Authorized Participants who purchase Creation Units from a Fund receive no fees, commissions or other form of compensation or inducement of any kind from either the Sponsor or the Fund, and no such person has any obligation or responsibility to the Sponsor or the Fund to affect any sale or resale of Shares.
Authorized Participants are cautioned that some of their activities may result in their being deemed participants in a distribution in a manner which would render them statutory underwriters and subject them to the prospectus delivery and liability provisions of the Securities Act of 1933, as amended (the “1933 Act”).
14
Each Authorized Participant must be registered as a broker-dealer under the 1934 Act and regulated by Financial Industry Regulatory Authority (“FINRA”), or exempt from being, or otherwise not required to be, so regulated or registered, and must be qualified to act as a broker or dealer in the states or other jurisdictions where the nature of its business so requires. Certain Authorized Participants may be regulated under federal and state banking laws and regulations. Each Authorized Participant must have its own set of rules and procedures, internal controls and information barriers as it determines is appropriate in light of its own regulatory regime.
Authorized Participants may act for their own accounts or as agents for broker-dealers, custodians and other securities market participants that wish to create or redeem Creation Units.
Persons interested in purchasing Creation Units should contact the Sponsor or the Administrator to obtain the contact information for the Authorized Participants. Shareholders who are not Authorized Participants are only able to redeem their Shares through an Authorized Participant.
Pursuant to the Authorized Participant Agreement, the Sponsor agreed to indemnify the Authorized Participants against certain liabilities, including liabilities under the 1933 Act, and to contribute to the payments the Authorized Participants may be required to make in respect of those liabilities.
14
The following description of the procedures for the creation and redemption of Creation Units is only a summary and an investor should refer to the relevant provisions of the Amended and Restated Trust Agreement of the Trust, as may be further amended from time to time (the “Trust Agreement”) and the form of Authorized Participant Agreement for more detail. The Trust Agreement and the form of Authorized Participant Agreement are incorporated by reference into this Annual Report on Form 10-K.
Creation Procedures
On any Business Day, an Authorized Participant may place an order with the Distributor to create one or more Creation Units. For purposes of processing both purchase and redemption orders, a “Business Day” for each Fund means any day on which the NAV of such Fund is determined. Purchase orders must be placed by the cut-off time shown below or earlier if the Fund’s primary listing exchange, or other exchange material to the valuation or operation of such Fund (an “Exchange” as defined below) closes before the cut-off time. If a purchase order is received prior to the applicable cut-off time, the day on which SEI receives a valid purchase order is the purchase order date. If the purchase order is received after the applicable cut-off time, the purchase order date will be the next day. Purchase orders are irrevocable. By placing a purchase order, and prior to delivery of such Creation Units, an Authorized Participant’s DTC account will be charged the non-refundable transaction fee due for the purchase order.
Determination of Required Payment
The total payment required to create each Creation Unit is the NAV of 50,000 Shares of the applicable Geared Fund or 25,000 Shares of the applicable Matching VIX Fund on the purchase order date plus the applicable transaction fee. For each Fund, Authorized Participants have create/redeem cut-off times prior to the NAV calculation time, which may be different from the close of the U.S. markets, as shown in the table below.
Underlying Benchmark | Create/Redeem Cutoff* | NAV Calculation Time | ||||
Silver | 1:00 p.m. (Eastern Time) | 1:25 p.m. (Eastern Time) | ||||
Gold | 1:00 p.m. (Eastern Time) | 1:30 p.m. (Eastern Time) | ||||
S&P 500 VIX Short-Term Futures Index | 2:00 p.m. (Eastern Time) | 4:00 p.m. (Eastern Time) | ||||
S&P 500 VIX Mid-Term Futures Index | 2:00 p.m. (Eastern Time) | 4:00 p.m. (Eastern Time) | ||||
Bloomberg Commodity Balanced WTI Crude Oil IndexSM | 2:00 p.m. (Eastern Time) | 2:30 p.m. (Eastern Time) | ||||
Bloomberg Natural Gas SubindexSM | 2:00 p.m. (Eastern Time) | 2:30 p.m. (Eastern Time) | ||||
Euro | 3:00 p.m. (Eastern Time) | 4:00 p.m. (Eastern Time) | ||||
Yen | 3:00 p.m. (Eastern Time) | 4:00 p.m. (Eastern Time) |
| * | Although the Funds’ shares may continue to trade on secondary markets subsequent to the calculation of the final NAV, |
these times represent the final opportunity to transact in creation or redemption units for the year ended December 31, 2023.
15
Delivery of Cash
Cash required for settlement will typically be transferred to the Custodian through: (1) the Continuous Net Settlement (“CNS”) clearing process of the National Securities Clearing Corporation (“NSCC”), as such processes have been enhanced to effect creations and redemptions of Creation Units; or (2) the facilities of DTC on a Delivery Versus Payment (“DVP”) basis, which is the procedure in which the buyer’s payment for securities is due at the time of delivery. Security delivery and payment are simultaneous. If the Custodian does not receive the cash by the market close on the first Business Day following the purchase order date (T+1), such order may be charged interest for delayed settlement or cancelled. The Sponsor reserves the right to extend the deadline for the Custodian to receive the cash required for settlement up to the second Business Day following the purchase order date (T+2). In the event a purchase order is cancelled, the Authorized Participant will be responsible for reimbursing the Fund for all costs associated with cancelling the order including costs for repositioning the portfolio. At its sole discretion, the Sponsor may agree to a delivery date other than T+2. Additional fees may apply for special settlement. The Creation Unit will be delivered to the Authorized Participant upon the Custodian’s receipt of the purchase amount.
Delivery of Exchange of Futures Contract for Related Position (“EFCRP”) Futures Contracts or Block Trades
In the event that the Sponsor shall have determined to permit the Authorized Participant to transfer futures contracts pursuant to an EFCRP or to engage in a block trade purchase of futures contracts from the Authorized Participant with respect to a Fund, as well as to deliver cash, in the creation process, futures contracts required for settlement must be transferred directly to the Fund’s account at its FCM. If the cash is not received by the market close on the second Business Day following the purchase order date (T+2); such order may be charged interest for delayed settlements or cancelled. In the event a purchase order is cancelled, the Authorized Participant will be responsible for reimbursing a Fund for all costs associated with cancelling the order including costs for repositioning the portfolio. At its sole discretion, the Sponsor may agree to a delivery date other than T+2. The Creation Unit will be delivered to the Authorized Participant upon the Custodian’s receipt of the cash purchase amount and the futures contracts.
15
Suspension or Rejection of Purchase Orders
In respect of any Fund, the Sponsor may, in its discretion, suspend the right to purchase, or postpone the purchase settlement date, (1) for any period during which any of the NYSE, NYSE Arca, Cboe, CFE, CME (including CBOT and NYMEX) or ICE or other exchange material to the valuation or operation of the Funds (each, an “Exchange”) is closed or when trading is suspended or restricted on such exchanges in any of the underlying commodities; (2) for any period during which an emergency exists as a result of which the fulfillment of a purchase order is not reasonably practicable; or (3) for such other period as the Sponsor determines, in its sole discretion, to be necessaryappropriate for the protection of the shareholders.Fund, the shareholders of the Fund or otherwise in the interest of such Fund (for example, in response to, or anticipation of, a period of significant and/or rapid increases in the size of a Fund as a result of an increase in creation activity. The Sponsor will not be liable to any person or in any way for any loss or damages that may result from any such suspension or postponement.
The Sponsor also may reject a purchase order if:
it determines that the purchase order is not in proper form;
the Sponsor believes that the purchase order would have adverse tax consequences to a Fund or its shareholders;
the order would be illegal; or
circumstances outside the control of the Sponsor make it, for all practical purposes, not feasible to process creations of Creation Units.
None of the Sponsor, the Administrator, the Transfer Agent, the Distributor or the Custodian will be liable for the suspension or rejection of any purchase order.
Redemption Procedures
The procedures by which an Authorized Participant may redeem one or more Creation Units mirror the procedures for the creation of Creation Units. On any Business Day, an Authorized Participant may place an order with the Distributor to redeem one or more Creation Units. If a redemption order is received prior to the applicable cut-off time, or earlier if the Exchange, or other exchange material to the valuation or operation of such Fund, closes before the cut-off time, the day on which SEI receives a valid redemption order is the redemption order date. If the redemption order is received after the applicable cut-off time, the redemption order date will be the next day. Redemption orders are irrevocable. The redemption procedures allow Authorized Participants to redeem Creation Units. Individual shareholders may not redeem directly from a Fund.
By placing a redemption order, an Authorized Participant agrees to deliver the Creation Units to be redeemed through DTC’s book-entry system to the applicable Fund not later than noon (Eastern Time), on the first Business Day immediately following the redemption order date (T+1). The Sponsor reserves the right to extend the deadline for the Fund to receive the Creation Units required for settlement up to the second Business Day following the redemption order date (T+2). By placing a redemption order, and prior to receipt of the redemption proceeds, an Authorized Participant must wire to the Custodian the non-refundable transaction fee due for the redemption order or any proceeds due will be reduced by the amount of the fee payable. At its sole discretion, the Sponsor may agree to a delivery date other than T+2. Additional fees may apply for special settlement.
16
Upon request of an Authorized Participant made at the time of a redemption order, the Sponsor at its sole discretion may determine, in addition to delivering redemption proceeds, to transfer futures contracts to the Authorized Participant pursuant to an EFCRP or to a block trade sale of futures contracts to the Authorized Participant.
Determination of Redemption Proceeds
The redemption proceeds from a Fund consist of the cash redemption amount and, if permitted by the Sponsor in its sole discretion with respect to a Fund, an EFCRP or block trade with the relevant Fund, as described in “Creation and Redemption of Shares” above. The cash redemption amount is equal to the NAV of the number of Creation Unit(s) of such Fund requested in the Authorized Participant’s redemption order as of the time of the calculation of such Fund’s NAV on the redemption order date, less transaction fees and any amounts attributable to any applicable EFCRP or block trade.
16
Delivery of Redemption Proceeds
The redemption proceeds due from a Fund are delivered to the Authorized Participant at noon (Eastern Time), on the second Business Day immediately following the redemption order date if, by such time on such Business Day immediately following the redemption order date, a Fund’s DTC account has been credited with the Creation Units to be redeemed. The Fund should be credited through: (1) the CNS clearing process of NSCC, as such processes have been enhanced to effect creations and redemptions of Creation Units; or (2) the facilities of DTC on a Delivery Versus Payment basis. If a Fund’s DTC account has not been credited with all of the Creation Units to be redeemed by such time, the redemption distribution is delivered to the extent whole Creation Units are received. Any remainder of the redemption distribution is delivered on the next Business Day to the extent any remaining whole Creation Units are received if: (1) the Sponsor receives the fee applicable to the extension of the redemption distribution date which the Sponsor may, from time to time, determine, and; (2) the remaining Creation Units to be redeemed are credited to the Fund’s DTC account by noon (Eastern Time), on such next Business Day. Any further outstanding amount of the redemption order may be cancelled. The Authorized Participant will be responsible for reimbursing a Fund for all costs associated with cancelling the order including costs for repositioning the portfolio.
The Sponsor is also authorized to deliver the redemption distribution notwithstanding that the Creation Units to be redeemed are not credited to a Fund’s DTC account by noon (Eastern Time), on the second Business Day immediately following the redemption order date if the Authorized Participant has collateralized its obligation to deliver the Creation Units through DTC’s book-entry system on such terms as the Sponsor may determine from time-to-time.
In the event that the Authorized Participant shall have requested, and the Sponsor shall have determined to permit the Authorized Participant to receive futures contracts pursuant to an EFCRP, as well as the cash redemption proceeds, in the redemption process, futures contracts required for settlement shall be transferred directly from the Fund’s account at its FCM to the account of the Authorized Participant at its FCM.
Suspension or Rejection of Redemption Orders
In respect of any Fund, the Sponsor may, in its discretion, suspend the right of redemption, or postpone the redemption settlement date: (1) for any period during which any Exchange, or other exchange material to the valuation or operation of the Fund, is closed or when trading is suspended or restricted on such Exchanges in any of the underlying commodities; (2) for any period during which an emergency exists as a result of which the redemption distribution is not reasonably practicable; or (3) for such other period as the Sponsor determines to be necessary for the protection of the shareholders. The Sponsor will not be liable to any person or in any way for any loss or damages that may result from any such suspension or postponement.
The Sponsor will reject a redemption order if the order is not in proper form as described in the form of Authorized Participant Agreement or if the fulfillment of the order might be unlawful.
Creation and Redemption Transaction Fee
To compensate BNY Mellon for services in processing the creation and redemption of Creation Units and to offset some or all of the transaction costs, an Authorized Participant may be required to pay a fixed transaction fee to BNY Mellon of up to $250 per order to create or redeem Creation Units and may pay a variable transaction fee to a Fund of up to 0.10% (and a variable transaction fee to the Matching VIX Funds of 0.05%) of the value of a Creation Unit. An order may include multiple Creation Units. The transaction fee(s) may be reduced, increased or otherwise changed by the Sponsor at its sole discretion.
17
Special Settlement
The Sponsor may allow for early settlement of purchase or redemption orders. Such arrangements may result in additional charges to the Authorized Participant.
NAV
The NAV in respect of a Fund means the total assets of the Fund including, but not limited to, all cash and cash equivalents or other debt securities less total liabilities of such Fund, consistently applied under the accrual method of accounting. In particular, the NAV includes any unrealized profit or loss on open Financial Instruments, and any other credit or debit accruing to a Fund but unpaid or not received by a Fund. The NAV per Share of each Fund is computed by dividing the value of the net assets of such Fund (i.e., the value of its total assets less total liabilities) by its total number of Shares outstanding. Expenses and fees are accrued daily and taken into account for purposes of determining the NAV. Each Fund’s NAV is calculated on each day other than a day when the Exchange is closed for regular trading. The Funds compute their NAVs at the times set forth below, or an earlier time as set forth on www.ProShares.com if necessitated by the Exchange or other exchange material to the valuation or operation of such Fund closing early. Each Fund’s NAV is calculated only once each trading day.
17
Fund | NAV Calculation Time | ||
ProShares UltraShort Silver and ProShares Ultra Silver | 1:25 p.m. (Eastern Time) | ||
ProShares UltraShort Gold and ProShares Ultra Gold | 1:30 p.m. (Eastern Time) | ||
ProShares UltraShort Bloomberg Crude Oil and ProShares Ultra Bloomberg Crude Oil | 2:30 p.m. (Eastern Time) | ||
ProShares UltraShort Bloomberg Natural Gas and ProShares Ultra Bloomberg Natural Gas | 2:30 p.m. (Eastern Time) | ||
ProShares UltraShort Euro and ProShares Ultra Euro | 4:00 p.m. (Eastern Time) | ||
ProShares UltraShort Yen and ProShares Ultra Yen | 4:00 p.m. (Eastern Time) | ||
ProShares VIX Short-Term Futures ETF, ProShares Ultra VIX Short-Term Futures ETF and | |||
ProShares Short VIX Short-Term Futures ETF | 4:00 p.m. (Eastern Time) | ||
ProShares VIX Mid-Term Futures ETF | 4:00 p.m. (Eastern Time) |
In calculating the NAV of a Fund, the settlement value of the Fund’s non-exchange traded Financial Instruments, is determined by applying the then-current disseminated value for the corresponding benchmark to the terms of such Fund’s non-exchange traded Financial Instruments. However, in the event that an underlying reference asset is not trading due to the operation of daily limits or otherwise, the Sponsor may, in its sole discretion, choose to fair value the Fund’s non-exchange traded Financial Instruments for purposes of the NAV calculation. Such fair value prices would generally be determined based on available inputs about the current value of the underlying reference assets and would be based on principles that the Sponsor deems fair and equitable so long as such principles are consistent with normal industry standards.
Futures contracts traded on a U.S. exchange are calculated at their then-current market value, which is based upon the settlement price (for the VIX Funds and the Commodity Index Funds) or the last traded price before the NAV time (for the Currency Funds), for that particular futures contract traded on the applicable U.S. exchange on the date with respect to which the NAV is being determined. If a futures contract traded on a U.S. exchange could not be liquidated on such day, due to the operation of daily limits or other rules of the exchange upon which that position is traded or otherwise, the Sponsor may, in its sole discretion, choose to determine a fair value price as the basis for determining the market value of such position for such day.
In addition, the Sponsor may, in its sole discretion, choose to fair value a Fund’s Financial Instruments for purposes of the NAV calculation for (1) any period for which, in the Sponsor’s sole discretion, market quotations or settlement prices do not accurately reflect the fair value of a Financial Instrument, (2) any period during which the Exchange or any other exchange, marketplace or trading center, deemed to affect the normal operations of the Funds, is closed, or when trading is restricted or suspended, or (3) such other period as the Sponsor determines, in its sole discretion, to be necessary for the protection of the Shareholders of the Funds.
Such fair value prices would generally be determined based on available inputs about the current value of the underlying reference assets and would be based on principles that the Sponsor deems fair and equitable so long as such principles are consistent with normal industry standards.
The Funds may use a variety of money market instruments to invest excess cash. Money Market instruments used in this capacity are valued at amortized cost which approximates fair value for daily NAV purposes.
18
Indicative Optimized Portfolio Value (“IOPV”)
The IOPV is an indicator of the value of a Fund’s net assets at the time the IOPV is disseminated. The IOPV is calculated and disseminated every 15 seconds throughout the trading day. The IOPV is generally calculated using the prior day’s closing net assets of a Fund as a base and updating throughout the trading day changes in the value of the Financial Instruments held by a Fund. The IOPV should not be viewed as an actual real time update of the NAV because NAV is calculated only once at the end of each trading day. The IOPV also should not be viewed as a precise value of the Shares. Neither the Funds nor the Sponsor are liable for any errors in the calculation of the IOPV or any failure to disseminate IOPV.
The Fund’s primary listing exchange disseminates the IOPV. In addition, the IOPV is published on the Fund’s primary listing exchange’s website and is available through on- line information services such as Bloomberg Finance L.P. and/or Reuters.
18
Fees and Expenses
Offering Expenses
Offering costs will be amortized by the Funds over a twelve month period on a straight-line basis beginning once the fund commences operations. The Sponsor will not charge its Management Fee in the first year of operations of a Fund in an amount equal to the offering costs. Normal and expected expenses incurred in connection with the continuous offering of Shares of a Fund after the commencement of its trading operations will be paid by the Sponsor.
Offering expenses mean those expenses incurred in connection with the qualification and registration of the Shares of each Fund and in offering, distributing and processing the Shares of each Fund under applicable federal law, and any other expenses actually incurred and, directly or indirectly, related to the organization of each offering of the Shares of such Fund, including, but not limited to, expenses such as:
initial SEC registration fees and SEC and FINRA filing fees;
costs of preparing, printing (including typesetting), amending, supplementing, mailing and distributing the Trust’s Registration Statements, the exhibits thereto and the related prospectuses;
the costs of qualifying, printing (including typesetting), amending, supplementing and mailing sales materials used in connection with the offering and issuance of the Shares; and
accounting, auditing and legal fees (including disbursements related thereto) incurred in connection therewith.
Management Fee
Each Geared Fund pays the Sponsor a Management Fee, monthly in arrears, in an amount equal to 0.95% per annum of its average daily NAV of such Fund. Each Matching VIX Fund pays the Sponsor a Management Fee, monthly in arrears, in an amount equal to 0.85% per annum of its average daily NAV. No other management fee is paid by the Funds. The Management Fee is paid in consideration of the Sponsor’s trading advisory services and the other services provided to the Funds that the Sponsor pays directly.
Licensing Fee
The Sponsor pays S&P a licensing fee for use of the VIX Futures Indexes as the benchmarks for the VIX Funds. The Sponsor pays Bloomberg a licensing fee for the Bloomberg Commodity IndexSM, as well as each subindex that serves as a benchmark for a Commodity Index Fund.
Routine Operational, Administrative and Other Ordinary Expenses
The Sponsor pays all of the routine operational, administrative and other ordinary expenses of each Fund, generally, as determined by the Sponsor, including, but not limited to, fees and expenses of the Administrator, Custodian, Distributor, ProFunds Distributors, Inc., an affiliated broker-dealer of the Sponsor, and Transfer Agent, licensing fees, accounting and audit fees and expenses, tax preparation expenses, legal fees not in excess of $100,000 per annum, ongoing SEC registration fees not exceeding 0.021% per annum of the NAV of a Fund, FINRA filing fees, individual K-1 preparation and mailing fees not exceeding 0.10% per annum of the NAV of a Fund, and report preparation and mailing expenses.
Non-Recurring Fees and Expenses
Each Fund pays all of its non-recurring and unusual fees and expenses, if any, as determined by the Sponsor. Non-recurring and unusual fees and expenses are fees and expenses that are unexpected or unusual in nature, such as legal claims and liabilities, litigation costs or indemnification or other material expenses which are not currently anticipated obligations of the Funds. Routine operational, administrative and other ordinary expenses are not deemed extraordinary expenses.
19
Selling Commission
Retail investors may purchase and sell Shares through traditional brokerage accounts. Investors are expected to be charged a customary commission by their brokers in connection with purchases of Shares that will vary from investor to investor. Investors are encouraged to review the terms of their brokerage accounts for applicable charges. The price at which an Authorized Participant sells a Share may be higher or lower than the price paid by such Authorized Participant in connection with the creation of such Share in a Creation Unit.
19
Brokerage Commissions and Fees
Each Fund with the exception of the Matching VIX Funds, pays all of its respective brokerage commissions, including applicable exchange fees, NFA fees and give-up fees, pit brokerage fees and other transaction related fees and expenses charged in connection with trading activities for each Fund’s investments in CFTC regulated investments. The Sponsor is currently paying brokerage commissions on VIX futures contracts for the Matching VIX Funds in amounts that exceed variable create/redeem fees collected by more than 0.02% of the Matching VIX Fund’s average net assets annually.
Other Transaction Costs
The Funds bear other transaction costs including the effects of trading spreads and financing costs/fees, if any, associated with the use of Financial Instruments, and costs relating to the purchase of U.S. Treasury securities or similar high credit quality short-term fixed- income or similar securities (such as shares of money market funds and collateralized repurchase agreements).
Employees
The Trust has no employees.
Item 1A. Risk Factors. |
RISK FACTOR SUMMARY
Risks Specific to the Geared Funds
Due to the compounding of daily returns, the Geared Funds’ returns over periods longer than a single day will likely differ in amount and possibly even direction from the Geared Fund multiple times the benchmark return for the period.
Correlation risks specific to the Geared Funds may arise because the Geared Funds seek to rebalance their portfolios daily to keep daily exposure consistent with their investment objectives to achieve a high degree of daily correlation with their applicable underlying benchmarks.
The use of leveraged, inverse and/or inverse leveraged positions could result in the total loss of an investor’s investment within a single day.
A number of factors may have a negative impact on the price of commodities, such as oil, gold, silver and gas, and the price of Financial Instruments based on such commodities.
Intraday price/performance of Geared Funds will likely differ from the Fund’s stated daily multiple times the performance of its Benchmark for such day.
Risks Specific to the Currency Funds, Precious Metals Funds, Natural Gas Funds, and Oil Funds
| • | The Currency Funds are subject to a number of risks impacting the value of non-U.S. currencies and the value of Financial Instruments based on such currencies. For example, European financial markets and the value of the euro have experienced significant volatility, in part related to unemployment, budget deficits and economic downturns. In addition, the euro could be abandoned in the future by countries that have already adopted its use. |
The Precious Metals Funds do not hold gold or silver bullion. Rather, the Precious Metals Funds use Financial Instruments to gain exposure to gold and silver bullion. Using Financial Instruments to obtain exposure to gold or silver bullion may cause tracking error and subject the Precious Metals Funds to the effects of contango and backwardation.
The Natural Gas Funds are linked to an index comprised of natural gas futures contracts, and are not directly linked to the “spot” price of natural gas. Natural Gas futures contracts may perform very differently from the spot price of natural gas.
The Oil Funds are linked to an index comprised of crude oil futures contracts, and are not directly linked to the “spot” price of crude oil. Oil futures contracts may perform very differently from the spot price of crude oil.
In April 2020, the market for crude oil futures contracts experienced a period of “extraordinary contango” (the spot price for a commodity is significantly lower than the price of the futures contract in that commodity) that resulted in a negative price in the May 2020 WTI crude oil futures contract. If all or a significant portion of the futures contracts held by the Oil Funds at a future date were to reach a negative price, investors in any such Fund could lose their entire investment.
A number of factors may have a negative impact on the price of commodities, such as oil, gold, silver and gas, and the price of Financial Instruments based on such commodities.
20
Risks Specific to the VIX Funds
The VIX Funds are benchmarked to a VIX Futures Index. They are not benchmarked to the VIX or actual realized volatility of the S&P 500.
20
VIX futures contracts can be highly volatile and the Funds may experience sudden and large losses when buying, selling or holding such instruments.
The level of the VIX has historically reverted to a long-term mean level and is subject to sudden and unexpected reversions to its mean. Accordingly, investors should not expect the VIX Funds to retain any appreciation in value over extended periods of time.
Risks Related to All Funds
There is no guarantee that a Fund will achieve its investment objective or that the returns of a Fund will correlate to the returns of its index times its stated multiple. There may be circumstances that could prevent a Fund from being operated in a manner consistent with its investment objective and principal investment strategies.
The assets that the Funds invest in can be highly volatile and the Funds may experience large losses when buying, selling or holding such instruments; you can lose of your investment within a single day.
Each Fund seeks to achieve its investment objective even during periods when the performance of the Fund’s benchmark is flat of when the benchmark is moving in a manner that may cause the value of the Fund to decline.
The value of the Shares of the Funds relates directly to the value of, and realized profit or loss from, the Financial Instruments and other assets held by that Fund. Fluctuations in the price of these Financial Instruments or assets could materially adversely affect an investment in such Fund’s Shares.
Margin requirements and position limits applicable to futures contracts and swaps may limit a Fund’s ability to achieve sufficient exposure and prevent a Fund from achieving its investment objective.
Possible illiquid markets may cause or exacerbate losses; the large size of the positions the Funds may acquire increases these risks.
The Funds may be subject to significant and sustained losses from rolling futures positions.
It may not be possible to gain exposure to the benchmarks using exchange-traded Financial Instruments in the future.
Fees are charged regardless of a Fund’s returns and may result in depletion of assets.
For the Funds linked to a benchmark, changes implemented by the benchmark provider that affect the composition and valuation of the benchmark could adversely affect the value of Fund Shares and an investment in a Fund Shares.
The particular benchmark used by a Fund may underperform other asset classes and may underperform other indices or benchmarks based upon the same underlying Reference Asset.
The Funds may be subject to counterparty risks.
Historical correlation trends between Fund benchmarks and other asset classes may not continue or may reverse, limiting or eliminating any potential diversification or other benefit from owning a Fund.
The lack of active trading markets for any of the Shares of the Funds may result in losses on investors’ investments at the time of disposition of such Shares.
A Fund may change its investment objective, benchmark or strategies and may liquidate at a time that is disadvantageous to shareholders.
Investors may be adversely affected by redemption or creation orders that are subject to postponement, suspension or rejection under certain circumstances.
The NAV per Share may not correspond to the market price per Share.
Investors may be adversely affected by an overstatement or understatement of a Fund’s NAV due to the valuation method employed or errors in the NAV calculation.
Regulatory and exchange position limits or accountability levels may restrict the creation of Creation Units and have a negative impact on operation of the Trust.
The number of underlying components included in a Fund’s benchmark may impact volatility, which could adversely affect an investment in the Shares.
The liquidity of the Shares may also be affected by the withdrawal from participation of Authorized Participants, which could adversely affect the market price of the Shares.
Shareholders that are not Authorized Participants may only purchase or sell their Shares in secondary trading markets, and the conditions associated with trading in secondary markets may adversely affect investors’ investment in the Shares.
The applicable Exchange may halt trading in the Shares of a Fund which would adversely impact investors’ ability to sell Shares.
Shareholders do not have the protections associated with ownership of shares in an investment company registered under the 1940 Act.
21
Shareholders do not have the rights enjoyed by investors in certain other vehicles and may be adversely affected by a lack of statutory rights and by limited voting and distribution rights.
The value of the Shares will be adversely affected if the Funds are required to indemnify Wilmington Trust Company (the “Trustee”) and/or the Sponsor.
Although the Shares of the Funds are limited liability investments, certain circumstances such as bankruptcy of a Fund will increase a shareholder’s liability.
Failure of the FCMs to segregate assets may increase losses in the Funds.
A court could potentially conclude that the assets and liabilities of one Fund are not segregated from those of another Fund and may thereby potentially expose assets in a Fund to the liabilities of another Fund.
The discontinuance of LIBOR could cause or contribute to market volatility and could affect the market value and/or liquidity of the Funds’ investments.
Due to the increased use of technologies, intentional and unintentional cyber-attacks pose operational and information security risks.
Trading on exchanges outside the United States is generally not subject to U.S. regulation and may result in different or diminished investor protections.
Competing claims of intellectual property rights may affect the Funds and an investment in the Shares.
Shareholders’ tax liability may exceed cash distributions on the Shares.
The U.S. Internal Revenue Service (“IRS”) could adjust or reallocate items of income, gain, deduction, loss and credit with respect to the Shares if the IRS does not accept the assumptions or conventions utilized by the Fund.
|
Shareholders of each Fund may recognize significant amounts of ordinary income and short-term capital gain.
A Fund could be treated as a corporation for federal income tax purposes, which may substantially reduce the value of Shares.
Changes in U.S. federal income tax law could affect an investment in the Shares.
The Funds and the Sponsor are subject to extensive legal and regulatory requirements. Regulatory changes or actions, including the implementation of new legislation, may alter the operations and profitability of the Funds.
Investors cannot be assured of the Sponsor’s continued services, the discontinuance of which may be detrimental to the Funds.
|
In response to Russia’s invasion of Ukraine in February 2022 and the ongoing conflict between those two countries, the U.S. and other countries, as well as the European Union, have issued broad-ranging economic sanctions designed to impose severe pressure on Russia’s economy. Such sanctions, and the conflict generally, may have adverse effects on regional and global economic markets, and may result in increased volatility and could have a negative impact on the performance of a Fund and its or the liquidity and price of Fund Shares.
These risk factors should be read in connection with the other information included in this Annual Report on Form 10-K, including Management’s Discussion and Analysis of Financial Condition and Results of Operations and the Funds’ Financial Statements and the related Notes to the Funds’ Financial Statements. For purposes of this section:
|
|
|
|
|
|
|
|
22
Risks Specific to the Geared Funds
In addition to the risks described elsewhere in this “Risk Factors” section, the following risks apply to the Geared Funds.
Due to the compounding of daily returns, the Geared Funds’ returns over periods longer than a single day will likely differ in amount and possibly even direction from the Geared Fund multiple times the benchmark return for the period.
Each of the Geared Funds is “geared” in the sense that each has an investment objective to correspond, before fees and expenses, to the one-half inverse (e.g., -0.5x), an inverse multiple (e.g., -2x), or a multiple (e.g., 1.5x, 2x), of the performance of a benchmark on a given day. Each Geared Fund seeks investment results for a single day only, as measured from its NAV calculation time to its next NAV calculation time, and not for any other period. The return of a Geared Fund for a period longer than a single day is the result of its return for each day compounded over the period and usually will differ from one-half inverse (e.g., -0.5x), one and one-half times (1.5x), two times the inverse (-2x) or two times (2x) the return of the Geared Fund’s benchmark for the period. A Geared Fund will lose money if its benchmark’s performance is flat over time, and it is possible for a Geared Fund to lose money over time regardless of the performance of an underlying benchmark, as a result of daily rebalancing, the benchmark’s volatility and compounding. Longer holding periods, higher benchmark volatility, inverse exposure and greater leverage each affect the impact of compounding on a Geared Fund’s returns. Daily compounding of a Geared Fund’s investment returns can dramatically and adversely affect its longer-term performance during periods of high volatility. Volatility may be at least as important to a Geared Fund’s return for a period as the return of the Geared Fund’s underlying benchmark.
A Geared Fund will lose money if the Index’s performance is flat over time, and it is possible for a Geared Fund to lose money over time regardless of the performance of the Index, as a result of daily rebalancing, the Index’s volatility, compounding and other factors. Longer holding periods, higher index volatility, inverse exposure and greater leverage each affect the impact of compounding on a Geared Fund’s returns. Daily compounding of a Geared Fund’s investment returns can dramatically and adversely affect performance, especially during periods of high volatility. Volatility has a negative impact on Geared Fund performance and the volatility of the Index may be at least as important to a Geared Fund’s return for a period as the return of the Index.
Each Ultra or UltraShort Fund uses leverage and should produce daily returns that are more volatile than that of its benchmark. For example, the daily return of an Ultra Fund with a 2x multiple should be approximately two times as volatile on a daily basis as the return of a fund with an objective of matching the same benchmark. The daily return of an Ultra Fund with a 1.5x multiple should be approximately one and one-half times as volatile on a daily basis as the return of a fund with an objective of matching the same benchmark. The daily return of a Short Fund is designed to return one-half the inverse (-0.5x) of the return, that would be expected of a fund with an objective of matching the same benchmark. The Geared Funds are not appropriate for all investors and present different risks than other funds. The daily return of an UltraShort Fund is designed to return two times the inverse (-2x) of the return, respectively, that would be expected of a fund with an objective of matching the same benchmark. The Geared Funds that use leverage are riskier than similarly benchmarked exchange-traded funds that do not use leverage. An investor should only consider an investment in a Geared Fund if he or she understands the consequences of seeking daily leveraged, daily inverse or daily inverse leveraged investment results. Daily objective geared funds, if used properly and in conjunction with the investor’s view on the future direction and volatility of the markets, can be useful tools for investors who want to manage their exposure to various markets and market segments and who are willing to monitor and/or periodically rebalance their portfolios. Shareholders who invest in the Geared Funds should actively manage and monitor their investments, as frequently as daily.
The hypothetical examples below illustrate how daily geared fund returns can behave for periods longer than a single day. Each involves a hypothetical fund XYZ that seeks to double the daily performance of benchmark XYZ. On each day, fund XYZ performs in line with its objective (two times (2x) the benchmark’s daily performance before fees and expenses). Notice that, in the first example (showing an overall benchmark loss for the period), over the entire seven-day period, the fund’s total return is more than two times the loss of the period return of the benchmark. For the seven-day period, benchmark XYZ lost 3.26% while fund XYZ lost 7.01% (versus -6.52% or 2 x -3.26%).
| Benchmark XYZ | Fund XYZ | |||||||||||||||
| Level | Daily Performance | Daily Performance | Net Asset Value | |||||||||||||
Start | 100.00 | $ | 100.00 | |||||||||||||
Day 1 | 97.00 | -3.00 | % | -6.00 | % | 94.00 | ||||||||||
Day 2 | 99.91 | 3.00 | % | 6.00 | % | 99.64 | ||||||||||
Day 3 | 96.91 | -3.00 | % | -6.00 | % | 93.66 | ||||||||||
Day 4 | 99.82 | 3.00 | % | 6.00 | % | 99.28 | ||||||||||
Day 5 | 96.83 | -3.00 | % | -6.00 | % | 93.32 | ||||||||||
Day 6 | 99.73 | 3.00 | % | 6.00 | % | 98.92 | ||||||||||
Day 7 | 96.74 | -3.00 | % | -6.00 | % | 92.99 | ||||||||||
|
|
|
| |||||||||||||
Total Return | -3.26 | % | -7.01 | % | ||||||||||||
|
|
|
| |||||||||||||
23
Similarly, in another example (showing an overall benchmark gain for the period), over the entire seven-day period, the fund’s total return is considerably less than double that of the period return of the benchmark. For the seven-day period, benchmark XYZ gained 2.72% while fund XYZ gained 4.86% (versus 5.44% (or 2 x 2.72%)).
| Benchmark XYZ | Fund XYZ | |||||||||||||||
| Level | Daily Performance | Daily Performance | Net Asset Value | |||||||||||||
Start | 100.00 | $ | 100.00 | |||||||||||||
Day 1 | 103.00 | 3.00 | % | 6.00 | % | 106.00 | ||||||||||
Day 2 | 99.91 | -3.00 | % | -6.00 | % | 99.64 | ||||||||||
Day 3 | 102.91 | 3.00 | % | 6.00 | % | 105.62 | ||||||||||
Day 4 | 99.82 | -3.00 | % | -6.00 | % | 99.28 | ||||||||||
Day 5 | 102.81 | 3.00 | % | 6.00 | % | 105.24 | ||||||||||
Day 6 | 99.73 | -3.00 | % | -6.00 | % | 98.92 | ||||||||||
Day 7 | 102.72 | 3.00 | % | 6.00 | % | 104.86 | ||||||||||
|
|
|
| |||||||||||||
Total Return | 2.72 | % | 4.86 | % | ||||||||||||
|
|
|
| |||||||||||||
These effects are caused by the compounding, which exists in all investments, but has a more significant impact in geared funds. In general, during periods of higher benchmark volatility, compounding will cause an Ultra Fund’s results for periods longer than a single day to be less than two times (2x) (or less than one and one-half times (1.5x) with respect to the ProShares Ultra VIX Short-Term Futures ETF) the return of the benchmark. Compounding will cause a Short Fund’s results for periods longer than a single day to be less than one-half the inverse (-0.5x) of the return of the benchmark. Additionally, compounding will cause an UltraShort Fund’s results for periods longer than a single day to be less than two times the inverse (-2x) of the return of the benchmark, respectively. This effect becomes more pronounced as volatility increases. Conversely, in periods of lower benchmark volatility (particularly when combined with higher benchmark returns), an Ultra Fund’s returns over longer periods can be higher than two times (2x) (or higher than one and one-half times (1.5x) with respect to the ProShares Ultra VIX Short-Term Futures ETF) the return of the benchmark. Actual results for a particular period, before fees and expenses, are also dependent on the magnitude of the benchmark return in addition to the benchmark volatility. Similar effects exist for the Short Funds and UltraShort Funds and the significance of these effects may be even greater with such inverse or inverse leveraged funds.
The graphs that follow illustrate this point. Each of the graphs shows a simulated hypothetical one-year performance of a benchmark compared with the performance of a geared fund that perfectly achieves its geared daily investment objective. The graphs demonstrate that, for periods greater than a single day, a geared fund is likely to underperform or overperform (but not match) the benchmark performance (or the inverse of the benchmark performance) times the multiple stated as the daily fund objective. Investors should understand the consequences of holding daily rebalanced funds for periods longer than a single day and should actively manage and monitor their investments, as frequently as daily. A one-year period is used solely for illustrative purposes. Deviations from the benchmark return (or the inverse of the benchmark return) times the fund multiple can occur over periods as short as two days (each day as measured from NAV to NAV) and may also occur in periods shorter than a single day (when measured intraday as opposed to NAV to NAV). See “Intraday Price Performance Risk” below for additional details. To isolate the impact of daily leveraged, inverse or inverse leveraged exposure, these graphs assume: a) no fund expenses or transaction costs; b) borrowing/lending rates (to obtain required inverse, inverse leveraged or leveraged exposure) and cash reinvestment rates of zero percent; and c) the fund consistently maintaining perfect exposure (-0.5x, -2x, 1.5x, or 2x) as of the fund’s NAV time each day. If these assumptions were different, the fund’s performance would be different than that shown. If fund expenses, transaction costs and financing expenses greater than zero percent were included, the fund’s performance would also be different than that shown. Each of the graphs also assumes a volatility rate of 73%, which is an approximate average of the five-year historical volatility rate of the most volatile benchmark referenced herein (the S&P 500 VIX Short-Term Futures Index). A benchmark’s volatility rate is a statistical measure of the magnitude of fluctuations in its returns.
24
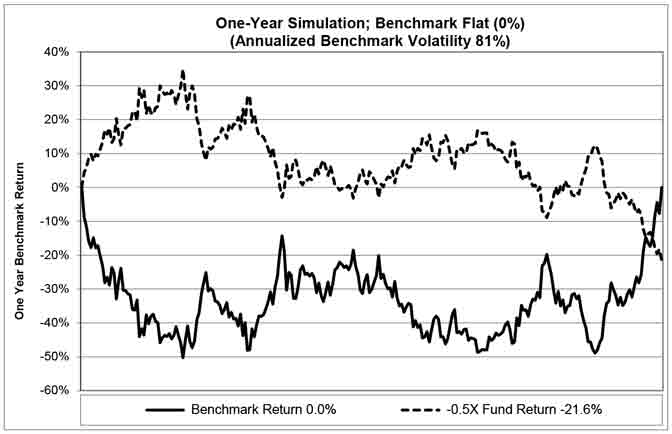
The graph above shows a scenario where the index, which exhibits day-to-day volatility, is flat or trendless over the year (i.e., begins and ends the year at 0%), but the Short Fund (-0.5x) is down.
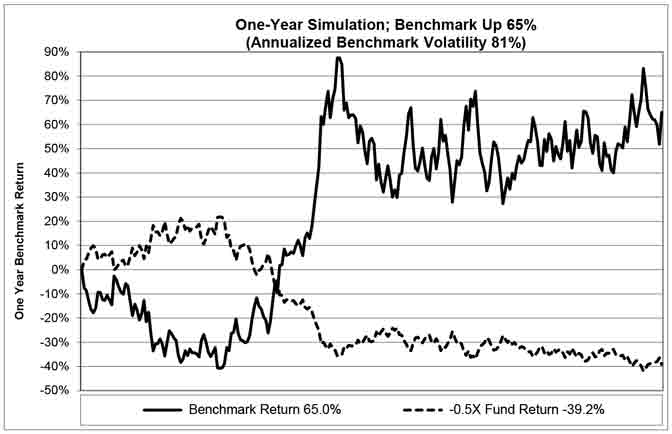
The graph above shows a scenario where the benchmark, which exhibits day-to-day volatility, is up over the year, but the Short Fund (-0.5x) is down more than one-half the inverse of the benchmark.
25
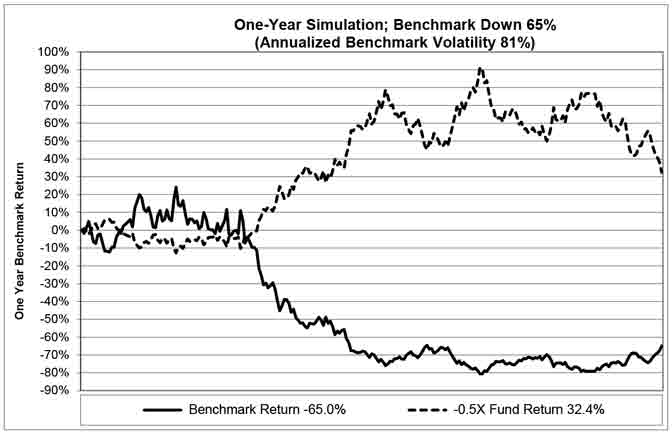
The graph above shows a scenario where the benchmark, which exhibits day-to-day volatility, is down over the year, but the Short Fund (-0.5x) is up less than one-half the inverse of the benchmark.
26

The graph above shows a scenario where the index, which exhibits day-to-day volatility, is flat or trendless over the year (i.e., begins and ends the year at 0%), but the Ultra Fund (1.5x) is down.
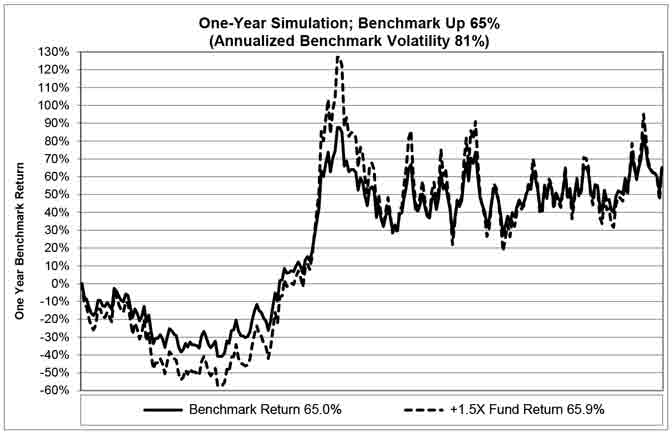
The graph above shows a scenario where the index, which exhibits day-to-day volatility, is up over the year, but the Ultra Fund (1.5x) is up less than one and one-half times the index.
27
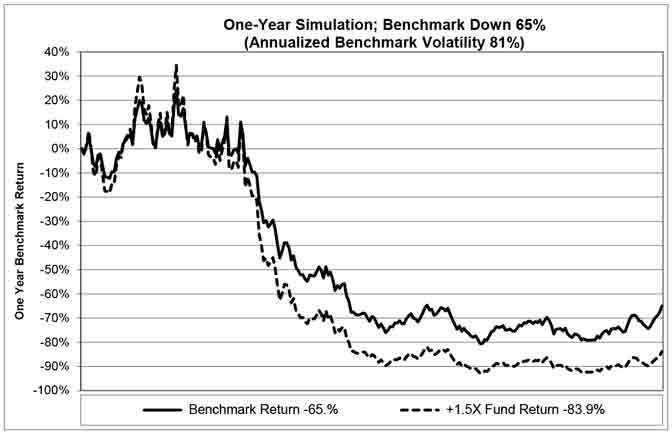
The graph above shows a scenario where the index, which exhibits day-to-day volatility, is down over the year, but the Ultra Fund (1.5x) is down less than one and one-half times the index.

The graph above shows a scenario where the benchmark, which exhibits day-to-day volatility, is flat or trendless over the year (i.e., provides a return of 0% over the course of the year), but the Ultra Fund (2x) and the UltraShort Fund (-2x) are both down.
28
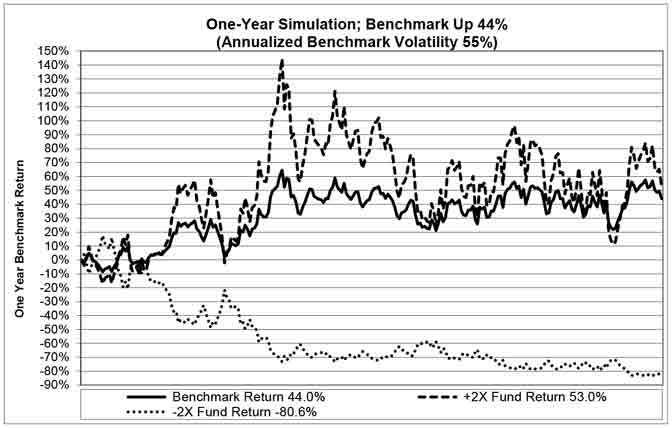
The graph above shows a scenario where the benchmark, which exhibits day-to-day volatility, is up over the year, but the Ultra Fund (2x) is up less than two times the benchmark and the UltraShort Fund (-2x) is down less than two times the inverse of the benchmark.
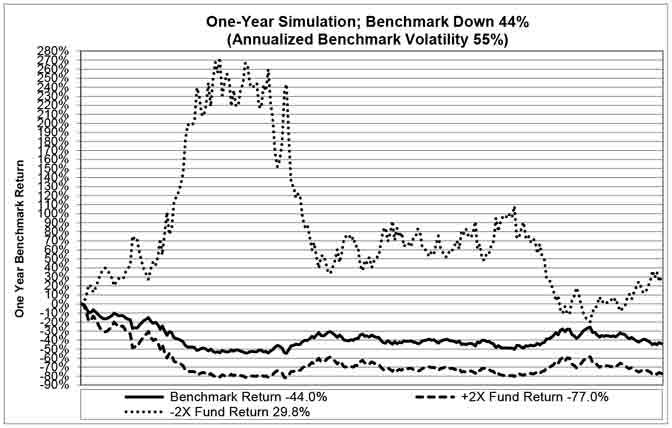
The graph above shows a scenario where the benchmark, which exhibits day-to-day volatility, is down over the year, but the Ultra Fund (2x) is down less than two times the benchmark and the UltraShort Fund (-2x) is up less than two times the inverse of the benchmark.
29
The historical five year average volatility of the benchmarks utilized by the Funds ranges from 7.20% to 81.02%, as set forth in the table below.
| Average Volatility Rate As of December 31, 2022 | |||||||
| ||||||||
| ||||||||
| ||||||||
| ||||||||
| ||||||||
| ||||||||
| ||||||||
| ||||||||
The tables below illustrate the impact of two factors that affect a Geared Fund’s performance, benchmark volatility and benchmark return. Benchmark volatility is a statistical measure of the magnitude of fluctuations in the returns of a benchmark and is calculated as the standard deviation of the natural logarithms of one plus the benchmark return (calculated daily), multiplied by the square root of the number of trading days per year (assumed to be 252). The tables show estimated fund returns for a number of combinations of benchmark volatility and benchmark return over a one-year period. To isolate the impact of daily leveraged, inverse or inverse leveraged exposure, these graphs assume: a) no fund expenses or transaction costs; b) borrowing/lending rates of zero percent (to obtain required inverse, inverse leveraged or leveraged exposure) and cash reinvestment rates of zero percent; and c) the fund consistently maintaining perfect exposure (-0.5x, -2x, 1.5x, or 2x) as of the fund’s NAV time each day. If these assumptions were different, the fund’s performance would be different than that shown. If fund expenses, transaction costs and financing expenses were included, the fund’s performance would be different than that shown. The tables below show examples in which a Geared Fund has an investment objective to correspond, before fees and expenses, to one-half the inverse (-0.5x), two times the inverse (-2x), two times (2x), one and one-half times (1.5x) the daily performance of a benchmark. The Geared Fund that has an investment objective to correspond to two times (2x) the daily performance of a benchmark could incorrectly be expected to achieve a 20% return on a yearly basis if the benchmark return was 10%, absent the effects of compounding. However, as the tables below show, with a benchmark volatility of 40%, such a fund would return 3.1 %. In the charts below, shaded areas represent those scenarios where a geared fund with the investment objective described will outperform (i.e., return more than) the benchmark performance times the stated multiple in the fund’s investment objective; conversely areas not shaded represent those scenarios where the fund will underperform (i.e., return less than) the benchmark performance times the multiple stated as the daily fund objective.
Estimated Fund Return Over One Year When the Fund Objective is to Seek Daily Investment Results For a single day, Before Fees and Expenses, that Correspond to One-Half the Inverse (-0.5x) of the Daily Performance of an Index.
Index Volatility | ||||||||||||||||||||||||||||||||||||||||||||||||||||||||||||||||||||
One Year Index Performance | One-Half the Invers (-0.5x) One Year Index Performance | 0% | 5% | 10% | 15% | 20% | 25% | 30% | 35% | 40% | 45% | 50% | 55% | 60% | 65% | 70% | 75% | |||||||||||||||||||||||||||||||||||||||||||||||||||
-60% | 30.0 | % | 58.1 | % | 58.0 | % | 57.5 | % | 56.8 | % | 55.8 | % | 54.5 | % | 52.9 | % | 51.0 | % | 48.9 | % | 46.6 | % | 44.0 | % | 41.2 | % | 38.1 | % | 34.9 | % | 31.6 | % | 28.0 | % | ||||||||||||||||||||||||||||||||||
-55% | 27.5 | % | 49.1 | % | 48.9 | % | 48.5 | % | 47.8 | % | 46.9 | % | 45.6 | % | 44.1 | % | 42.4 | % | 40.4 | % | 38.2 | % | 35.7 | % | 33.1 | % | 30.2 | % | 27.2 | % | 24.0 | % | 20.7 | % | ||||||||||||||||||||||||||||||||||
-50% | 25.0 | % | 41.4 | % | 41.3 | % | 40.9 | % | 40.2 | % | 39.3 | % | 38.1 | % | 36.7 | % | 35.1 | % | 33.2 | % | 31.1 | % | 28.8 | % | 26.3 | % | 23.6 | % | 20.7 | % | 17.7 | % | 14.5 | % | ||||||||||||||||||||||||||||||||||
-45% | 22.5 | % | 34.8 | % | 34.7 | % | 34.3 | % | 33.7 | % | 32.8 | % | 31.7 | % | 30.4 | % | 28.8 | % | 27.0 | % | 25.0 | % | 22.8 | % | 20.4 | % | 17.8 | % | 15.1 | % | 12.2 | % | 9.2 | % | ||||||||||||||||||||||||||||||||||
-40% | 20.0 | % | 29.1 | % | 29.0 | % | 28.6 | % | 28.0 | % | 27.2 | % | 26.1 | % | 24.8 | % | 23.3 | % | 21.6 | % | 19.7 | % | 17.5 | % | 15.3 | % | 12.8 | % | 10.2 | % | 7.4 | % | 4.5 | % | ||||||||||||||||||||||||||||||||||
-35% | 17.5 | % | 24.0 | % | 23.9 | % | 23.6 | % | 23.0 | % | 22.2 | % | 21.2 | % | 19.9 | % | 18.5 | % | 16.8 | % | 15.0 | % | 12.9 | % | 10.7 | % | 8.4 | % | 5.9 | % | 3.2 | % | 0.4 | % | ||||||||||||||||||||||||||||||||||
-30% | 15.0 | % | 19.5 | % | 19.4 | % | 19.1 | % | 18.5 | % | 17.7 | % | 16.8 | % | 15.6 | % | 14.2 | % | 12.6 | % | 10.8 | % | 8.8 | % | 6.7 | % | 4.4 | % | 2.0 | % | -0.5 | % | -3.2 | % | ||||||||||||||||||||||||||||||||||
-25% | 12.5 | % | 15.5 | % | 15.4 | % | 15.0 | % | 14.5 | % | 13.8 | % | 12.8 | % | 11.6 | % | 10.3 | % | 8.7 | % | 7.0 | % | 5.1 | % | 3.1 | % | 0.9 | % | -1.4 | % | -3.9 | % | -6.5 | % | ||||||||||||||||||||||||||||||||||
-20% | 10.0 | % | 11.8 | % | 11.7 | % | 11.4 | % | 10.9 | % | 10.1 | % | 9.2 | % | 8.1 | % | 6.8 | % | 5.3 | % | 3.6 | % | 1.8 | % | -0.2 | % | -2.3 | % | -4.6 | % | -7.0 | % | -9.5 | % | ||||||||||||||||||||||||||||||||||
-15% | 7.5 | % | 8.5 | % | 8.4 | % | 8.1 | % | 7.6 | % | 6.9 | % | 6.0 | % | 4.9 | % | 3.6 | % | 2.1 | % | 0.5 | % | -1.2 | % | -3.2 | % | -5.2 | % | -7.4 | % | -9.7 | % | -12.2 | % | ||||||||||||||||||||||||||||||||||
-10% | 5.0 | % | 5.4 | % | 5.3 | % | 5.0 | % | 4.5 | % | 3.8 | % | 3.0 | % | 1.9 | % | 0.7 | % | -0.7 | % | -2.3 | % | -4.0 | % | -5.9 | % | -7.9 | % | -10.0 | % | -12.3 | % | -14.6 | % | ||||||||||||||||||||||||||||||||||
-5% | 2.5 | % | 2.6 | % | 2.5 | % | 2.2 | % | 1.7 | % | 1.1 | % | 0.2 | % | -0.8 | % | -2.0 | % | -3.4 | % | -4.9 | % | -6.6 | % | -8.4 | % | -10.4 | % | -12.4 | % | -14.6 | % | -16.9 | % | ||||||||||||||||||||||||||||||||||
0% | 0.0 | % | 0.0 | % | -0.1 | % | -0.4 | % | -0.8 | % | -1.5 | % | -2.3 | % | -3.3 | % | -4.5 | % | -5.8 | % | -7.3 | % | -8.9 | % | -10.7 | % | -12.6 | % | -14.7 | % | -16.8 | % | -19.0 | % | ||||||||||||||||||||||||||||||||||
5% | -2.5 | % | -2.4 | % | -2.5 | % | -2.8 | % | -3.2 | % | -3.9 | % | -4.7 | % | -5.6 | % | -6.8 | % | -8.1 | % | -9.5 | % | -11.1 | % | -12.9 | % | -14.7 | % | -16.7 | % | -18.8 | % | -21.0 | % | ||||||||||||||||||||||||||||||||||
10% | -5.0 | % | -4.7 | % | -4.7 | % | -5.0 | % | -5.5 | % | -6.1 | % | -6.9 | % | -7.8 | % | -8.9 | % | -10.2 | % | -11.6 | % | -13.2 | % | -14.9 | % | -16.7 | % | -18.6 | % | -20.7 | % | -22.8 | % | ||||||||||||||||||||||||||||||||||
15% | -7.5 | % | -6.7 | % | -6.8 | % | -7.1 | % | -7.5 | % | -8.1 | % | -8.9 | % | -9.8 | % | -10.9 | % | -12.2 | % | -13.6 | % | -15.1 | % | -16.7 | % | -18.5 | % | -20.4 | % | -22.4 | % | -24.5 | % | ||||||||||||||||||||||||||||||||||
20% | -10.0 | % | -8.7 | % | -8.8 | % | -9.1 | % | -9.5 | % | -10.1 | % | -10.8 | % | -11.7 | % | -12.8 | % | -14.0 | % | -15.4 | % | -16.9 | % | -18.5 | % | -20.2 | % | -22.1 | % | -24.0 | % | -26.1 | % | ||||||||||||||||||||||||||||||||||
25% | -12.5 | % | -10.6 | % | -10.6 | % | -10.9 | % | -11.3 | % | -11.9 | % | -12.6 | % | -13.5 | % | -14.6 | % | -15.8 | % | -17.1 | % | -18.6 | % | -20.1 | % | -21.9 | % | -23.7 | % | -25.6 | % | -27.6 | % | ||||||||||||||||||||||||||||||||||
30% | -15.0 | % | -12.3 | % | -12.4 | % | -12.6 | % | -13.0 | % | -13.6 | % | -14.3 | % | -15.2 | % | -16.2 | % | -17.4 | % | -18.7 | % | -20.1 | % | -21.7 | % | -23.4 | % | -25.1 | % | -27.0 | % | -29.0 | % | ||||||||||||||||||||||||||||||||||
35% | -17.5 | % | -13.9 | % | -14.0 | % | -14.3 | % | -14.7 | % | -15.2 | % | -15.9 | % | -16.8 | % | -17.8 | % | -18.9 | % | -20.2 | % | -21.6 | % | -23.2 | % | -24.8 | % | -26.5 | % | -28.4 | % | -30.3 | % | ||||||||||||||||||||||||||||||||||
40% | -20.0 | % | -15.5 | % | -15.6 | % | -15.8 | % | -16.2 | % | -16.7 | % | -17.4 | % | -18.3 | % | -19.3 | % | -20.4 | % | -21.7 | % | -23.0 | % | -24.5 | % | -26.2 | % | -27.9 | % | -29.7 | % | -31.6 | % | ||||||||||||||||||||||||||||||||||
45% | -22.5 | % | -17.0 | % | -17.0 | % | -17.3 | % | -17.7 | % | -18.2 | % | -18.9 | % | -19.7 | % | -20.7 | % | -21.8 | % | -23.0 | % | -24.4 | % | -25.9 | % | -27.4 | % | -29.1 | % | -30.9 | % | -32.7 | % | ||||||||||||||||||||||||||||||||||
50% | -25.0 | % | -18.4 | % | -18.4 | % | -18.7 | % | -19.0 | % | -19.6 | % | -20.2 | % | -21.1 | % | -22.0 | % | -23.1 | % | -24.3 | % | -25.7 | % | -27.1 | % | -28.7 | % | -30.3 | % | -32.1 | % | -33.9 | % | ||||||||||||||||||||||||||||||||||
55% | -27.5 | % | -19.7 | % | -19.8 | % | -20.0 | % | -20.4 | % | -20.9 | % | -21.5 | % | -22.3 | % | -23.3 | % | -24.4 | % | -25.6 | % | -26.9 | % | -28.3 | % | -29.8 | % | -31.4 | % | -33.2 | % | -35.0 | % | ||||||||||||||||||||||||||||||||||
60% | -30.0 | % | -20.9 | % | -21.0 | % | -21.2 | % | -21.6 | % | -22.1 | % | -22.8 | % | -23.6 | % | -24.5 | % | -25.5 | % | -26.7 | % | -28.0 | % | -29.4 | % | -30.9 | % | -32.5 | % | -34.2 | % | -36.0 | % | ||||||||||||||||||||||||||||||||||
30
Estimated Fund Return Over One Year When the Fund Objective is to Seek Daily Investment Results, Before Fees and Expenses, that Correspond to Two Times the Inverse (-2x) of the Daily Performance of a Benchmark.
Benchmark Volatility | ||||||||||||||||||||||||||||||||||||||||||||||||||||||||||||||||
One Year Benchmark Performance | Two Times Inverse(-2x) of One Year Benchmark Performance | 0% | 5% | 10% | 15% | 20% | 25% | 30% | 35% | 40% | 45% | 50% | 55% | 60% | 65% | 70% | ||||||||||||||||||||||||||||||||||||||||||||||||
-60% | 120 | % | 525.0 | % | 520.3 | % | 506.5 | % | 484.2 | % | 454.3 | % | 418.1 | % | 377.1 | % | 332.8 | % | 286.7 | % | 240.4 | % | 195.2 | % | 152.2 | % | 112.2 | % | 76.0 | % | 43.7 | % | ||||||||||||||||||||||||||||||||
-55% | 110 | % | 393.8 | % | 390.1 | % | 379.2 | % | 361.6 | % | 338.0 | % | 309.4 | % | 277.0 | % | 242.0 | % | 205.6 | % | 169.0 | % | 133.3 | % | 99.3 | % | 67.7 | % | 39.0 | % | 13.5 | % | ||||||||||||||||||||||||||||||||
-50% | 100 | % | 300.0 | % | 297.0 | % | 288.2 | % | 273.9 | % | 254.8 | % | 231.6 | % | 205.4 | % | 177.0 | % | 147.5 | % | 117.9 | % | 88.9 | % | 61.4 | % | 35.8 | % | 12.6 | % | -8.0 | % | ||||||||||||||||||||||||||||||||
-45% | 90 | % | 230.6 | % | 228.1 | % | 220.8 | % | 209.0 | % | 193.2 | % | 174.1 | % | 152.4 | % | 128.9 | % | 104.6 | % | 80.1 | % | 56.2 | % | 33.4 | % | 12.3 | % | -6.9 | % | -24.0 | % | ||||||||||||||||||||||||||||||||
-40% | 80 | % | 177.8 | % | 175.7 | % | 169.6 | % | 159.6 | % | 146.4 | % | 130.3 | % | 112.0 | % | 92.4 | % | 71.9 | % | 51.3 | % | 31.2 | % | 12.1 | % | -5.7 | % | -21.8 | % | -36.1 | % | ||||||||||||||||||||||||||||||||
-35% | 70 | % | 136.7 | % | 134.9 | % | 129.7 | % | 121.2 | % | 109.9 | % | 96.2 | % | 80.7 | % | 63.9 | % | 46.5 | % | 28.9 | % | 11.8 | % | -4.5 | % | -19.6 | % | -33.4 | % | -45.6 | % | ||||||||||||||||||||||||||||||||
-30% | 60 | % | 104.1 | % | 102.6 | % | 98.1 | % | 90.8 | % | 81.0 | % | 69.2 | % | 55.8 | % | 41.3 | % | 26.3 | % | 11.2 | % | -3.6 | % | -17.6 | % | -30.7 | % | -42.5 | % | -53.1 | % | ||||||||||||||||||||||||||||||||
-25% | 50 | % | 77.8 | % | 76.4 | % | 72.5 | % | 66.2 | % | 57.7 | % | 47.4 | % | 35.7 | % | 23.1 | % | 10.0 | % | -3.2 | % | -16.0 | % | -28.3 | % | -39.6 | % | -49.9 | % | -59.1 | % | ||||||||||||||||||||||||||||||||
-20% | 40 | % | 56.3 | % | 55.1 | % | 51.6 | % | 46.1 | % | 38.6 | % | 29.5 | % | 19.3 | % | 8.2 | % | -3.3 | % | -14.9 | % | -26.2 | % | -36.9 | % | -46.9 | % | -56.0 | % | -64.1 | % | ||||||||||||||||||||||||||||||||
-15% | 30 | % | 38.4 | % | 37.4 | % | 34.3 | % | 29.4 | % | 22.8 | % | 14.7 | % | 5.7 | % | -4.2 | % | -14.4 | % | -24.6 | % | -34.6 | % | -44.1 | % | -53.0 | % | -61.0 | % | -68.2 | % | ||||||||||||||||||||||||||||||||
-10% | 20 | % | 23.5 | % | 22.5 | % | 19.8 | % | 15.4 | % | 9.5 | % | 2.3 | % | -5.8 | % | -14.5 | % | -23.6 | % | -32.8 | % | -41.7 | % | -50.2 | % | -58.1 | % | -65.2 | % | -71.6 | % | ||||||||||||||||||||||||||||||||
-5% | 10 | % | 10.8 | % | 10.0 | % | 7.5 | % | 3.6 | % | -1.7 | % | -8.1 | % | -15.4 | % | -23.3 | % | -31.4 | % | -39.6 | % | -47.7 | % | -55.3 | % | -62.4 | % | -68.8 | % | -74.5 | % | ||||||||||||||||||||||||||||||||
0% | 0 | % | 0.0 | % | -0.7 | % | -3.0 | % | -6.5 | % | -11.3 | % | -17.1 | % | -23.7 | % | -30.8 | % | -38.1 | % | -45.5 | % | -52.8 | % | -59.6 | % | -66.0 | % | -71.8 | % | -77.0 | % | ||||||||||||||||||||||||||||||||
5% | -10 | % | -9.3 | % | -10.0 | % | -12.0 | % | -15.2 | % | -19.6 | % | -24.8 | % | -30.8 | % | -37.2 | % | -43.9 | % | -50.6 | % | -57.2 | % | -63.4 | % | -69.2 | % | -74.5 | % | -79.1 | % | ||||||||||||||||||||||||||||||||
10% | -20 | % | -17.4 | % | -18.0 | % | -19.8 | % | -22.7 | % | -26.7 | % | -31.5 | % | -36.9 | % | -42.8 | % | -48.9 | % | -55.0 | % | -61.0 | % | -66.7 | % | -71.9 | % | -76.7 | % | -81.0 | % | ||||||||||||||||||||||||||||||||
15% | -30 | % | -24.4 | % | -25.0 | % | -26.6 | % | -29.3 | % | -32.9 | % | -37.3 | % | -42.3 | % | -47.6 | % | -53.2 | % | -58.8 | % | -64.3 | % | -69.5 | % | -74.3 | % | -78.7 | % | -82.6 | % | ||||||||||||||||||||||||||||||||
20% | -40 | % | -30.6 | % | -31.1 | % | -32.6 | % | -35.1 | % | -38.4 | % | -42.4 | % | -47.0 | % | -51.9 | % | -57.0 | % | -62.2 | % | -67.2 | % | -72.0 | % | -76.4 | % | -80.4 | % | -84.0 | % | ||||||||||||||||||||||||||||||||
25% | -50 | % | -36.0 | % | -36.5 | % | -37.9 | % | -40.2 | % | -43.2 | % | -46.9 | % | -51.1 | % | -55.7 | % | -60.4 | % | -65.1 | % | -69.8 | % | -74.2 | % | -78.3 | % | -82.0 | % | -85.3 | % | ||||||||||||||||||||||||||||||||
30% | -60 | % | -40.8 | % | -41.3 | % | -42.6 | % | -44.7 | % | -47.5 | % | -50.9 | % | -54.8 | % | -59.0 | % | -63.4 | % | -67.8 | % | -72.0 | % | -76.1 | % | -79.9 | % | -83.3 | % | -86.4 | % | ||||||||||||||||||||||||||||||||
35% | -70 | % | -45.1 | % | -45.5 | % | -46.8 | % | -48.7 | % | -51.3 | % | -54.5 | % | -58.1 | % | -62.0 | % | -66.0 | % | -70.1 | % | -74.1 | % | -77.9 | % | -81.4 | % | -84.6 | % | -87.4 | % | ||||||||||||||||||||||||||||||||
40% | -80 | % | -49.0 | % | -49.4 | % | -50.5 | % | -52.3 | % | -54.7 | % | -57.7 | % | -61.1 | % | -64.7 | % | -68.4 | % | -72.2 | % | -75.9 | % | -79.4 | % | -82.7 | % | -85.6 | % | -88.3 | % | ||||||||||||||||||||||||||||||||
45% | -90 | % | -52.4 | % | -52.8 | % | -53.8 | % | -55.5 | % | -57.8 | % | -60.6 | % | -63.7 | % | -67.1 | % | -70.6 | % | -74.1 | % | -77.5 | % | -80.8 | % | -83.8 | % | -86.6 | % | -89.1 | % | ||||||||||||||||||||||||||||||||
50% | -100 | % | -55.6 | % | -55.9 | % | -56.9 | % | -58.5 | % | -60.6 | % | -63.2 | % | -66.1 | % | -69.2 | % | -72.5 | % | -75.8 | % | -79.0 | % | -82.1 | % | -84.9 | % | -87.5 | % | -89.8 | % | ||||||||||||||||||||||||||||||||
55% | -110 | % | -58.4 | % | -58.7 | % | -59.6 | % | -61.1 | % | -63.1 | % | -65.5 | % | -68.2 | % | -71.2 | % | -74.2 | % | -77.3 | % | -80.3 | % | -83.2 | % | -85.9 | % | -88.3 | % | -90.4 | % | ||||||||||||||||||||||||||||||||
60% | -120 | % | -60.9 | % | -61.2 | % | -62.1 | % | -63.5 | % | -65.4 | % | -67.6 | % | -70.2 | % | -73.0 | % | -75.8 | % | -78.7 | % | -81.5 | % | -84.2 | % | -86.7 | % | -89.0 | % | -91.0 | % | ||||||||||||||||||||||||||||||||
Estimated Fund Return Over One Year When the Fund Objective is to Seek Daily Investment Results For a single day, Before Fees and Expenses, that Correspond to One and One-Half Times (1.5x) the Daily Performance of an Index.
| Index Volatility | ||||||||||||||||||||||||||||||||||||||||||||||||||||||||||||||||||||
One Year Index Performance | One and One-Half Times (1.5x) One Year Index Performance | 0% | 5% | 10% | 15% | 20% | 25% | 30% | 35% | 40% | 45% | 50% | 55% | 60% | 65% | 70% | 75% | |||||||||||||||||||||||||||||||||||||||||||||||||||
-60% | -90.0 | % | -74.7 | % | -74.7 | % | -74.8 | % | -74.9 | % | -75.1 | % | -75.3 | % | -75.5 | % | -75.8 | % | -76.2 | % | -76.6 | % | -77.0 | % | -77.4 | % | -77.9 | % | -78.4 | % | -78.9 | % | -79.5 | % | ||||||||||||||||||||||||||||||||||
-55% | -82.5 | % | -69.8 | % | -69.8 | % | -69.9 | % | -70.1 | % | -70.3 | % | -70.5 | % | -70.8 | % | -71.2 | % | -71.6 | % | -72.0 | % | -72.5 | % | -73.1 | % | -73.6 | % | -74.2 | % | -74.9 | % | -75.6 | % | ||||||||||||||||||||||||||||||||||
-50% | -75.0 | % | -64.6 | % | -64.7 | % | -64.8 | % | -64.9 | % | -65.2 | % | -65.5 | % | -65.8 | % | -66.2 | % | -66.7 | % | -67.2 | % | -67.8 | % | -68.4 | % | -69.1 | % | -69.8 | % | -70.6 | % | -71.4 | % | ||||||||||||||||||||||||||||||||||
-45% | -67.5 | % | -59.2 | % | -59.2 | % | -59.4 | % | -59.6 | % | -59.8 | % | -60.2 | % | -60.6 | % | -61.0 | % | -61.6 | % | -62.2 | % | -62.9 | % | -63.6 | % | -64.4 | % | -65.2 | % | -66.1 | % | -67.0 | % | ||||||||||||||||||||||||||||||||||
-40% | -60.0 | % | -53.5 | % | -53.6 | % | -53.7 | % | -53.9 | % | -54.2 | % | -54.6 | % | -55.1 | % | -55.6 | % | -56.2 | % | -56.9 | % | -57.7 | % | -58.5 | % | -59.4 | % | -60.3 | % | -61.3 | % | -62.4 | % | ||||||||||||||||||||||||||||||||||
-35% | -52.5 | % | -47.6 | % | -47.6 | % | -47.8 | % | -48.0 | % | -48.4 | % | -48.8 | % | -49.3 | % | -49.9 | % | -50.6 | % | -51.4 | % | -52.3 | % | -53.2 | % | -54.2 | % | -55.3 | % | -56.4 | % | -57.6 | % | ||||||||||||||||||||||||||||||||||
-30% | -45.0 | % | -41.4 | % | -41.5 | % | -41.7 | % | -41.9 | % | -42.3 | % | -42.8 | % | -43.4 | % | -44.1 | % | -44.8 | % | -45.7 | % | -46.7 | % | -47.7 | % | -48.8 | % | -50.0 | % | -51.3 | % | -52.6 | % | ||||||||||||||||||||||||||||||||||
-25% | -37.5 | % | -35.0 | % | -35.1 | % | -35.3 | % | -35.6 | % | -36.0 | % | -36.6 | % | -37.2 | % | -38.0 | % | -38.8 | % | -39.8 | % | -40.9 | % | -42.0 | % | -43.3 | % | -44.6 | % | -46.0 | % | -47.4 | % | ||||||||||||||||||||||||||||||||||
-20% | -30.0 | % | -28.4 | % | -28.5 | % | -28.7 | % | -29.0 | % | -29.5 | % | -30.1 | % | -30.8 | % | -31.7 | % | -32.6 | % | -33.7 | % | -34.8 | % | -36.1 | % | -37.5 | % | -38.9 | % | -40.5 | % | -42.1 | % | ||||||||||||||||||||||||||||||||||
-15% | -22.5 | % | -21.6 | % | -21.7 | % | -21.9 | % | -22.3 | % | -22.8 | % | -23.4 | % | -24.2 | % | -25.2 | % | -26.2 | % | -27.4 | % | -28.6 | % | -30.0 | % | -31.5 | % | -33.1 | % | -34.8 | % | -36.5 | % | ||||||||||||||||||||||||||||||||||
-10% | -15.0 | % | -14.6 | % | -14.7 | % | -14.9 | % | -15.3 | % | -15.9 | % | -16.6 | % | -17.5 | % | -18.5 | % | -19.6 | % | -20.9 | % | -22.3 | % | -23.8 | % | -25.4 | % | -27.1 | % | -29.0 | % | -30.9 | % | ||||||||||||||||||||||||||||||||||
-5% | -7.5 | % | -7.4 | % | -7.5 | % | -7.8 | % | -8.2 | % | -8.8 | % | -9.6 | % | -10.5 | % | -11.6 | % | -12.8 | % | -14.2 | % | -15.7 | % | -17.3 | % | -19.1 | % | -21.0 | % | -22.9 | % | -25.0 | % | ||||||||||||||||||||||||||||||||||
0% | 0.0 | % | 0.0 | % | -0.1 | % | -0.4 | % | -0.8 | % | -1.5 | % | -2.3 | % | -3.3 | % | -4.5 | % | -5.8 | % | -7.3 | % | -8.9 | % | -10.7 | % | -12.6 | % | -14.7 | % | -16.8 | % | -19.0 | % | ||||||||||||||||||||||||||||||||||
5% | 7.5 | % | 7.6 | % | 7.5 | % | 7.2 | % | 6.7 | % | 6.0 | % | 5.1 | % | 4.0 | % | 2.8 | % | 1.3 | % | -0.3 | % | -2.0 | % | -3.9 | % | -6.0 | % | -8.2 | % | -10.5 | % | -12.9 | % | ||||||||||||||||||||||||||||||||||
10% | 15.0 | % | 15.4 | % | 15.3 | % | 14.9 | % | 14.4 | % | 13.7 | % | 12.7 | % | 11.5 | % | 10.2 | % | 8.7 | % | 6.9 | % | 5.0 | % | 3.0 | % | 0.8 | % | -1.5 | % | -4.0 | % | -6.6 | % | ||||||||||||||||||||||||||||||||||
15% | 22.5 | % | 23.3 | % | 23.2 | % | 22.9 | % | 22.3 | % | 21.5 | % | 20.5 | % | 19.2 | % | 17.8 | % | 16.1 | % | 14.3 | % | 12.3 | % | 10.1 | % | 7.7 | % | 5.3 | % | 2.6 | % | -0.1 | % | ||||||||||||||||||||||||||||||||||
20% | 30.0 | % | 31.5 | % | 31.3 | % | 31.0 | % | 30.3 | % | 29.5 | % | 28.4 | % | 27.1 | % | 25.6 | % | 23.8 | % | 21.8 | % | 19.7 | % | 17.4 | % | 14.9 | % | 12.2 | % | 9.4 | % | 6.5 | % | ||||||||||||||||||||||||||||||||||
25% | 37.5 | % | 39.8 | % | 39.6 | % | 39.2 | % | 38.6 | % | 37.7 | % | 36.5 | % | 35.1 | % | 33.5 | % | 31.6 | % | 29.5 | % | 27.2 | % | 24.8 | % | 22.1 | % | 19.3 | % | 16.3 | % | 13.2 | % | ||||||||||||||||||||||||||||||||||
30% | 45.0 | % | 48.2 | % | 48.1 | % | 47.7 | % | 47.0 | % | 46.0 | % | 44.8 | % | 43.3 | % | 41.6 | % | 39.6 | % | 37.4 | % | 35.0 | % | 32.3 | % | 29.5 | % | 26.5 | % | 23.3 | % | 20.0 | % | ||||||||||||||||||||||||||||||||||
35% | 52.5 | % | 56.9 | % | 56.7 | % | 56.3 | % | 55.5 | % | 54.5 | % | 53.2 | % | 51.7 | % | 49.8 | % | 47.7 | % | 45.4 | % | 42.8 | % | 40.0 | % | 37.0 | % | 33.9 | % | 30.5 | % | 27.0 | % | ||||||||||||||||||||||||||||||||||
40% | 60.0 | % | 65.7 | % | 65.5 | % | 65.0 | % | 64.3 | % | 63.2 | % | 61.8 | % | 60.2 | % | 58.2 | % | 56.0 | % | 53.5 | % | 50.8 | % | 47.9 | % | 44.7 | % | 41.4 | % | 37.8 | % | 34.1 | % | ||||||||||||||||||||||||||||||||||
45% | 67.5 | % | 74.6 | % | 74.4 | % | 73.9 | % | 73.1 | % | 72.0 | % | 70.6 | % | 68.8 | % | 66.8 | % | 64.4 | % | 61.8 | % | 59.0 | % | 55.9 | % | 52.6 | % | 49.0 | % | 45.3 | % | 41.4 | % | ||||||||||||||||||||||||||||||||||
50% | 75.0 | % | 83.7 | % | 83.5 | % | 83.0 | % | 82.2 | % | 81.0 | % | 79.5 | % | 77.6 | % | 75.5 | % | 73.0 | % | 70.3 | % | 67.3 | % | 64.0 | % | 60.5 | % | 56.8 | % | 52.9 | % | 48.8 | % | ||||||||||||||||||||||||||||||||||
55% | 82.5 | % | 93.0 | % | 92.8 | % | 92.3 | % | 91.4 | % | 90.1 | % | 88.5 | % | 86.6 | % | 84.3 | % | 81.7 | % | 78.9 | % | 75.7 | % | 72.3 | % | 68.6 | % | 64.7 | % | 60.6 | % | 56.3 | % | ||||||||||||||||||||||||||||||||||
60% | 90.0 | % | 102.4 | % | 102.2 | % | 101.6 | % | 100.7 | % | 99.4 | % | 97.7 | % | 95.7 | % | 93.3 | % | 90.6 | % | 87.6 | % | 84.3 | % | 80.7 | % | 76.8 | % | 72.7 | % | 68.4 | % | 63.9 | % | ||||||||||||||||||||||||||||||||||
31
Estimated Fund Return Over One Year When the Fund Objective is to Seek Daily Investment Results, Before Fees and Expenses, that Correspond to Two Times (2x) the Daily Performance of a Benchmark.
| Benchmark Volatility | ||||||||||||||||||||||||||||||||||||||||||||||||||||||||||||||||
One Year Benchmark Performance | Two Times (2x) One Year Benchmark Performance | 0% | 5% | 10% | 15% | 20% | 25% | 30% | 35% | 40% | 45% | 50% | 55% | 60% | 65% | 70% | ||||||||||||||||||||||||||||||||||||||||||||||||
-60% | -120 | % | -84.0 | % | -84.0 | % | -84.2 | % | -84.4 | % | -84.6 | % | -85.0 | % | -85.4 | % | -85.8 | % | -86.4 | % | -86.9 | % | -87.5 | % | -88.2 | % | -88.8 | % | -89.5 | % | -90.2 | % | ||||||||||||||||||||||||||||||||
-55% | -110 | % | -79.8 | % | -79.8 | % | -80.0 | % | -80.2 | % | -80.5 | % | -81.0 | % | -81.5 | % | -82.1 | % | -82.7 | % | -83.5 | % | -84.2 | % | -85.0 | % | -85.9 | % | -86.7 | % | -87.6 | % | ||||||||||||||||||||||||||||||||
-50% | -100 | % | -75.0 | % | -75.1 | % | -75.2 | % | -75.6 | % | -76.0 | % | -76.5 | % | -77.2 | % | -77.9 | % | -78.7 | % | -79.6 | % | -80.5 | % | -81.5 | % | -82.6 | % | -83.6 | % | -84.7 | % | ||||||||||||||||||||||||||||||||
-45% | -90 | % | -69.8 | % | -69.8 | % | -70.1 | % | -70.4 | % | -70.9 | % | -71.6 | % | -72.4 | % | -73.2 | % | -74.2 | % | -75.3 | % | -76.4 | % | -77.6 | % | -78.9 | % | -80.2 | % | -81.5 | % | ||||||||||||||||||||||||||||||||
-40% | -80 | % | -64.0 | % | -64.1 | % | -64.4 | % | -64.8 | % | -65.4 | % | -66.2 | % | -67.1 | % | -68.2 | % | -69.3 | % | -70.6 | % | -72.0 | % | -73.4 | % | -74.9 | % | -76.4 | % | -77.9 | % | ||||||||||||||||||||||||||||||||
-35% | -70 | % | -57.8 | % | -57.9 | % | -58.2 | % | -58.7 | % | -59.4 | % | -60.3 | % | -61.4 | % | -62.6 | % | -64.0 | % | -65.5 | % | -67.1 | % | -68.8 | % | -70.5 | % | -72.3 | % | -74.1 | % | ||||||||||||||||||||||||||||||||
-30% | -60 | % | -51.0 | % | -51.1 | % | -51.5 | % | -52.1 | % | -52.9 | % | -54.0 | % | -55.2 | % | -56.6 | % | -58.2 | % | -60.0 | % | -61.8 | % | -63.8 | % | -65.8 | % | -67.9 | % | -70.0 | % | ||||||||||||||||||||||||||||||||
-25% | -50 | % | -43.8 | % | -43.9 | % | -44.3 | % | -45.0 | % | -46.0 | % | -47.2 | % | -48.6 | % | -50.2 | % | -52.1 | % | -54.1 | % | -56.2 | % | -58.4 | % | -60.8 | % | -63.1 | % | -65.5 | % | ||||||||||||||||||||||||||||||||
-20% | -40 | % | -36.0 | % | -36.2 | % | -36.6 | % | -37.4 | % | -38.5 | % | -39.9 | % | -41.5 | % | -43.4 | % | -45.5 | % | -47.7 | % | -50.2 | % | -52.7 | % | -55.3 | % | -58.1 | % | -60.8 | % | ||||||||||||||||||||||||||||||||
-15% | -30 | % | -27.8 | % | -27.9 | % | -28.5 | % | -29.4 | % | -30.6 | % | -32.1 | % | -34.0 | % | -36.1 | % | -38.4 | % | -41.0 | % | -43.7 | % | -46.6 | % | -49.6 | % | -52.6 | % | -55.7 | % | ||||||||||||||||||||||||||||||||
-10% | -20 | % | -19.0 | % | -19.2 | % | -19.8 | % | -20.8 | % | -22.2 | % | -23.9 | % | -26.0 | % | -28.3 | % | -31.0 | % | -33.8 | % | -36.9 | % | -40.1 | % | -43.5 | % | -46.9 | % | -50.4 | % | ||||||||||||||||||||||||||||||||
-5% | -10 | % | -9.8 | % | -10.0 | % | -10.6 | % | -11.8 | % | -13.3 | % | -15.2 | % | -17.5 | % | -20.2 | % | -23.1 | % | -26.3 | % | -29.7 | % | -33.3 | % | -37.0 | % | -40.8 | % | -44.7 | % | ||||||||||||||||||||||||||||||||
0% | 0 | % | 0.0 | % | -0.2 | % | -1.0 | % | -2.2 | % | -3.9 | % | -6.1 | % | -8.6 | % | -11.5 | % | -14.8 | % | -18.3 | % | -22.1 | % | -26.1 | % | -30.2 | % | -34.5 | % | -38.7 | % | ||||||||||||||||||||||||||||||||
5% | 10 | % | 10.3 | % | 10.0 | % | 9.2 | % | 7.8 | % | 5.9 | % | 3.6 | % | 0.8 | % | -2.5 | % | -6.1 | % | -10.0 | % | -14.1 | % | -18.5 | % | -23.1 | % | -27.7 | % | -32.5 | % | ||||||||||||||||||||||||||||||||
10% | 20 | % | 21.0 | % | 20.7 | % | 19.8 | % | 18.3 | % | 16.3 | % | 13.7 | % | 10.6 | % | 7.0 | % | 3.1 | % | -1.2 | % | -5.8 | % | -10.6 | % | -15.6 | % | -20.7 | % | -25.9 | % | ||||||||||||||||||||||||||||||||
15% | 30 | % | 32.3 | % | 31.9 | % | 30.9 | % | 29.3 | % | 27.1 | % | 24.2 | % | 20.9 | % | 17.0 | % | 12.7 | % | 8.0 | % | 3.0 | % | -2.3 | % | -7.7 | % | -13.3 | % | -19.0 | % | ||||||||||||||||||||||||||||||||
20% | 40 | % | 44.0 | % | 43.6 | % | 42.6 | % | 40.8 | % | 38.4 | % | 35.3 | % | 31.6 | % | 27.4 | % | 22.7 | % | 17.6 | % | 12.1 | % | 6.4 | % | 0.5 | % | -5.6 | % | -11.8 | % | ||||||||||||||||||||||||||||||||
25% | 50 | % | 56.3 | % | 55.9 | % | 54.7 | % | 52.8 | % | 50.1 | % | 46.8 | % | 42.8 | % | 38.2 | % | 33.1 | % | 27.6 | % | 21.7 | % | 15.5 | % | 9.0 | % | 2.4 | % | -4.3 | % | ||||||||||||||||||||||||||||||||
30% | 60 | % | 69.0 | % | 68.6 | % | 67.3 | % | 65.2 | % | 62.4 | % | 58.8 | % | 54.5 | % | 49.5 | % | 44.0 | % | 38.0 | % | 31.6 | % | 24.9 | % | 17.9 | % | 10.8 | % | 3.5 | % | ||||||||||||||||||||||||||||||||
35% | 70 | % | 82.3 | % | 81.8 | % | 80.4 | % | 78.2 | % | 75.1 | % | 71.2 | % | 66.6 | % | 61.2 | % | 55.3 | % | 48.8 | % | 41.9 | % | 34.7 | % | 27.2 | % | 19.4 | % | 11.7 | % | ||||||||||||||||||||||||||||||||
40% | 80 | % | 96.0 | % | 95.5 | % | 94.0 | % | 91.6 | % | 88.3 | % | 84.1 | % | 79.1 | % | 73.4 | % | 67.0 | % | 60.1 | % | 52.6 | % | 44.8 | % | 36.7 | % | 28.5 | % | 20.1 | % | ||||||||||||||||||||||||||||||||
45% | 90 | % | 110.3 | % | 109.7 | % | 108.2 | % | 105.6 | % | 102.0 | % | 97.5 | % | 92.2 | % | 86.0 | % | 79.2 | % | 71.7 | % | 63.7 | % | 55.4 | % | 46.7 | % | 37.8 | % | 28.8 | % | ||||||||||||||||||||||||||||||||
50% | 100 | % | 125.0 | % | 124.4 | % | 122.8 | % | 120.0 | % | 116.2 | % | 111.4 | % | 105.6 | % | 99.1 | % | 91.7 | % | 83.8 | % | 75.2 | % | 66.3 | % | 57.0 | % | 47.5 | % | 37.8 | % | ||||||||||||||||||||||||||||||||
55% | 110 | % | 140.3 | % | 139.7 | % | 137.9 | % | 134.9 | % | 130.8 | % | 125.7 | % | 119.6 | % | 112.6 | % | 104.7 | % | 96.2 | % | 87.1 | % | 77.5 | % | 67.6 | % | 57.5 | % | 47.2 | % | ||||||||||||||||||||||||||||||||
60% | 120 | % | 156.0 | % | 155.4 | % | 153.5 | % | 150.3 | % | 146.0 | % | 140.5 | % | 134.0 | % | 126.5 | % | 118.1 | % | 109.1 | % | 99.4 | % | 89.2 | % | 78.6 | % | 67.8 | % | 56.8 | % | ||||||||||||||||||||||||||||||||
The foregoing tables are intended to isolate the effect of benchmark volatility and benchmark performance on the return of inverse, inverse leveraged or leveraged funds. The Geared Funds’ actual returns may be significantly greater or less than the returns shown above as a result of any of the factors discussed above or under the below risk factor describing correlation risks.
Correlation Risks Specific to the Geared Funds.
In order to achieve a high degree of correlation with their applicable underlying benchmarks, the Geared Funds seek to rebalance their portfolios daily to keep exposure consistent with their investment objectives. Being materially under- or overexposed to the benchmarks may prevent such Geared Funds from achieving a high degree of correlation with their applicable underlying benchmarks. Market disruptions or closures, large movements of assets into or out of the Geared Funds, regulatory restrictions or extreme market volatility will adversely affect such Geared Funds’ ability to adjust exposure to requisite levels. The target amount of portfolio
32
exposure is impacted dynamically by the benchmarks’ movements during each day. Other things being equal, more significant movement in the value of its benchmark up or down will require more significant adjustments to a Fund’s portfolio. Because of this, it is unlikely that the Geared Funds will be perfectly exposed (i.e., -0.5x, -2x, 1.5x, or 2x, as applicable) at the end of each day, and the likelihood of being materially under- or overexposed is higher on days when the benchmark levels are volatile near the close of the trading day. In addition, unlike other funds that do not rebalance their portfolios as frequently, each Geared Fund may be subject to increased trading costs associated with daily portfolio rebalancing in order to maintain appropriate exposure to the underlying benchmarks. Such costs include commissions paid to the FCMs, and may vary by FCM.
Each Geared Fund seeks to rebalance its portfolio on a daily basis. The time and manner in which a Geared Fund rebalances its portfolio may vary from day to day at the discretion of the Sponsor, depending upon market conditions and other circumstances. Unlike other funds that do not rebalance their portfolios as frequently, each Geared Fund may be subject to increased trading costs associated with daily portfolio rebalancing. The effects of these trading costs have been estimated and included in the Breakeven Table.
For general correlation risks of the Funds, please see “Correlation Risks For All Funds.” below.
Intraday Price Performance Risk.
Each Geared Fund is typically rebalanced at or about the time of its NAV calculation time (which may be other than at the close of the U.S. equity markets). As such, the intraday position of the Geared Fund will generally be different from the Geared Fund’s stated daily investment objective (i.e., -0.5x, -2x, 1.5x, or 2x). Intraday price performance of the Geared Funds will likely differ from the Fund’s stated daily multiple times the performance of the Benchmark for such day.
The use of leveraged, inverse and/or inverse leveraged positions could result in the total loss of an investor’s investment.
Each of the Geared Funds utilize leverage in seeking to achieve its respective investment objective and will lose more money in market environments adverse to their respective daily investment objectives than funds that do not employ leverage. The use of leveraged and/or inverse leveraged positions could result in the total loss of an investor’s investment, even within a single day. Even if held for only a single day, the Fund is highly vulnerable to sudden large changes in the daily movement of the Index.
For example, because the Ultra Funds and the UltraShort Funds offered hereby include a two times (2x) or a two times inverse (-2x) multiplier, a single-day movement in the benchmark for one of these Funds approaching 50% at any point in the day could result in the total loss or almost total loss of an investment in such Fund if that movement is contrary to the investment objective of the Fund. This would be the case with downward single-day or intraday movements in the underlying benchmark of an Ultra Fund or upward single day or intraday movements in the benchmark of an UltraShort Fund, even if the underlying benchmark maintains a level greater than zero at all times and even if the benchmark subsequently moves in an opposite direction, eliminating all or a portion of the prior adverse movement. It is not possible to predict when sudden large changes in the daily movement in an Index may occur.
A number of factors may have a negative impact on the price of commodities, such as oil, gold, silver and natural gas, and the price of Financial Instruments based on such commodities.
With regard to the Natural Gas Funds, the Precious Metals Funds and the Oil Funds, a number of factors may affect the price of these commodities and, in turn, the Financial Instruments and other assets, if any, owned by such a Fund, including, but not limited to:
Significant increases or decreases in the available supply of a physical commodity due to natural, technological, or other factors. Natural factors would include depletion of known cost-effective sources for a commodity or the impact of severe weather or other natural events on the ability to produce or distribute the commodity. Technological factors, such as increases in availability created by new or improved extraction, refining and processing equipment and methods or decreases caused by failure or unavailability of major refining and processing equipment (for example, shutting down or constructing natural gas processing plants), also materially influence the supply of the commodity. General economic conditions in the world or in a major region, such as population growth rates, periods of civil unrest, government austerity programs, or currency exchange rate fluctuations may affect prices of underlying commodities.
The exploration and production of commodities are uncertain processes with many risks. The cost of extraction, completing and operating wells / mines is often uncertain, and a number of factors can delay or prevent operations or production of commodities, including: (1) unexpected extraction or drilling conditions; (2) pressure or irregularities in formations; (3) equipment failures or repairs; (4) fires or other accidents; (5) adverse weather conditions; (6) pipeline ruptures, spills or other supply disruptions; and (7) shortages or delays in the availability of extraction delivery equipment.
33
In regard to the Oil Funds, the exploration and production of crude oil are uncertain processes with many risks. The cost of drilling, completing and operating wells for crude oil is often uncertain, and a number of factors can delay or prevent operations or production of crude oil, including (1) unexpected drilling conditions, (2) pressure or irregularities in formations, (3) equipment failures or repairs, (4) fires or other accidents, (5) adverse weather conditions, (6) pipeline ruptures, spills or other supply disruptions, and (7) shortages or delays in the availability of extraction or delivery equipment.
Significant increases or decreases in the demand for a physical commodity due to natural, technological or other factors. Natural factors would include such events as unusual climatological or health conditions (such as disease or pandemics) impacting the demand for commodities. Technological or other factors may include such developments as substitutes or new uses for particular commodities or changes in the demand for particular commodities. General economic conditions in the world or in a major region, such as population growth rates, periods of civil unrest, government austerity programs, or currency exchange rate fluctuations may affect prices of underlying commodities. For example, gold and silver are used in a wide range of industrial applications and demand for gold and silver is driven by, among other things, demand for jewelry. An economic downturn could have a negative impact on gold and silver demand and, consequently, their prices.
A significant change in the attitude of speculators and investors towards a commodity or in the commodity hedging activities of commodity producers. Should the speculative community take a negative or positive view towards any given commodity, or if there is an increase or decrease in the level of hedge activity of commodity producing companies, countries and/or organizations, such action could cause a change in world prices of any given commodity.
Large purchases or sales of physical commodities by the official sector. Governments and large institutions have large commodities holdings or may establish major commodities positions. For example, a significant portion of the aggregate world precious metals holdings is owned by governments, central banks and related institutions. Similarly, nations with centralized or nationalized energy production organizations may control large physical quantities of certain commodities. The purchase or sale by one of these institutions in large amounts could potentially cause a change in prices for that commodity.
With regard to the Oil Funds, nations with centralized or nationalized oil production and organizations such as the Organization of Petroleum Exporting Countries (OPEC) control large physical qualities of crude oil. The purchase or sale by one of these institutions in large amounts could potentially cause a change in prices for that commodity. Tension between the governments of the United States and oil exporting nations, civil unrest and sabotage, the ability of members of OPEC to agree upon and maintain oil prices and production levels, and fluctuations in the reserve capacity of crude oil could impact future oil prices.
Political activity such as the adoption of changes to legislation, imposition of regulations or entry into trade treaties, as well as political disruptions caused by societal breakdown, insurrection, terrorism, pandemics, sabotage and/or war may greatly influence commodities prices.
With regard to the Natural Gas Funds, the demand for natural gas correlates closely with general economic growth rates. The occurrence of recessions or other periods of low or negative economic growth will typically have a direct adverse impact on natural gas demand and natural gas prices. The supply and demand for natural gas may also be impacted by changes in interest rates, inflation, and other local or regional weather and market conditions, as well as by the development of alternative energy sources.
The demand for natural gas has traditionally been cyclical, with higher demand during winter months and lower demand during summer months. Natural gas prices are subject to volatile, sudden, unpredictable and/or temporary price movements over short periods of time.
The recent proliferation of commodity-linked products and their unknown effect on the commodity markets.
With regard to the Oil and Natural Gas Funds, competition from clean power companies, fluctuations in the supply and demand of alternative energy fuels, energy conservation, changes in consumer preferences regarding the use of renewable energy sources to replace fossil fuels, and tax and other government regulations can significantly affect the prices of oil and natural gas.
The prices, supply and demand for gold and silver may also be impacted by changes in interest rates, inflation, and other local or regional market conditions, as well as by investor confidence. There can be no assurance that either gold or silver will maintain its long-term value in terms of future purchasing power. As of the date of this prospectus, gold and silver prices are at or near historically high levels. Gold and silver prices are volatile and subject to sudden, and unpredictable price movements, including reversals. Gold and silver markets also have historically experienced extended periods of flat or declining prices. There can be no assurance that either gold or silver prices will maintain their price levels as of the date of this prospectus.
34
Each of these factors could have a negative impact on the value of the Funds. These factors interrelate in complex ways, and the effect of one factor on the market value of a Fund may offset or enhance the effect of another factor.
Risks Specific to the Currency Funds.
A number of factors may have a negative impact on the value of non-U.S. currencies and the value of Financial Instruments based on such currencies.
A number of factors may affect the value of non-U.S. currencies or the U.S. dollar and, in turn, Financial Instruments based on such non-U.S. currencies or the U.S. dollar. These factors include:
|
Debt level and trade deficit of the relevant foreign countries;
Inflation rates of the United States and the relevant foreign countries and investors’ expectations concerning inflation rates;
Interest rates of the United States and the relevant foreign countries and investors’ expectations concerning interest rates;
Investment and trading activities of mutual funds, hedge funds and other market participants;
Global or regional political, economic or financial events and situations;
Sovereign action to set or restrict currency conversion;
|
Overall growth and performance of the economies of the relevant countries; and
|
In periods of financial turmoil, capital can move quickly out of countries or geographic regions that are perceived to be more vulnerable to the effects of the crisis than other countries or geographic regions, with sudden and severely adverse consequences to the currencies of those countries or geographic regions. Each of these factors could have a negative impact on the value of a Currency Fund. These factors interrelate in complex ways, and the effect of one factor on the market value of a Currency Fund may offset or enhance the effect of another factor. All of these factors are, in turn, sensitive to the monetary, fiscal and trade policies pursued by the relevant countries and those of other countries important to international trade and finance. In addition, information relating to non-U.S. countries or currencies may not be as well-known or as rapidly or thoroughly reported as information regarding the U.S. or the U.S. dollar.
The value of the Shares of the VIX Futures Fund relates directly to the value of, and realized gain or loss from, the Financial Instruments and other assets held by the Fund. Fluctuations in the price of these Financial Instruments or assets could materially adversely affect an investment in Shares of the VIX Futures Fund.
Several factors may affect the price and/or liquidity of VIX futures contracts and other assets, if any, owned by the VIX Futures Fund, including, but not limited to:
Prevailing market prices and forward volatility levels of the U.S. stock markets, the S&P 500, the equity securities included in the S&P 500 and prevailing market prices of options on the S&P 500, the VIX, options on the VIX, the relevant VIX futures contracts, or any other financial instruments related to the S&P 500 and the VIX or VIX futures contracts;
Interest rates, and investors’ expectations concerning interest rates; Inflation rates and investors’ expectations concerning inflation rates;
|
Supply and demand as well as hedging activities in the listed and OTC equity derivatives markets;
The level of margin requirements;
The position limits imposed by futures exchanges and any position or risk limits imposed by FCMs and swap counterparties;
Disruptions in trading of the S&P 500, futures contracts on the S&P 500 or options on the S&P 500; and
The level of contango or backwardation in the VIX futures contract market.
35
These factors interrelate in complex ways, and the effect of one factor on the market value of the VIX Futures Fund may offset or enhance the effect of another factor.
The Natural Gas Funds are linked to an index comprised of natural gas futures contracts, and are not directly linked to the “spot” price of natural gas. Natural Gas futures contracts may perform very differently from the spot price of natural gas.
The benchmark used by each Natural Gas Fund is intended to reflect the performance of the prices of futures contracts on natural gas. The Natural Gas Funds are not directly linked to the “spot” price of natural gas. The price of a futures contract reflects the expected value of the commodity upon delivery in the future whereas the spot price of a commodity reflects the immediate delivery value of the commodity. While prices of swaps, futures contracts and other derivatives contracts on natural gas are related to the prices of an underlying cash market (i.e., the “spot market”), they have typically performed very differently from, and commonly underperform, the spot price of natural gas. This is primarily due to a variety of factors including the current (and future) expectations of storage costs, geopolitical risks, interest charges incurred to finance the purchase of the commodity, and expectations concerning supply and demand for the commodity. It is possible that during certain time periods the performance of different derivatives contracts may be substantially lower or higher than cash market prices for natural gas due to differences in derivatives contract terms or as supply, demand or other economic or regulatory factors become more pronounced in either the cash or derivatives markets. As a result, the Natural Gas Funds may underperform a similar investment that is linked to the “spot” price of natural gas.
The Oil Funds are linked to an index comprised of crude oil futures contracts, and are not directly linked to the “spot” price of crude oil. Oil futures contracts may perform very differently from the spot price of crude oil.
The benchmark used by each Oil Fund, the Bloomberg Commodity Balanced WTI Crude Oil IndexSM (the “Oil Index”), is intended to reflect the performance of crude oil as measured by the price of West Texas Intermediate (“WTI”), sweet light crude oil futures contracts traded on the New York Mercantile Exchange (the “NYMEX”). The Oil Funds are not directly linked to the “spot” price of crude oil. The price of a futures contract reflects the expected value of the commodity upon delivery in the future, whereas the spot price of a commodity reflects the immediate delivery values of the commodity. While prices of futures contracts and other derivatives contracts on crude oil are related to the prices of an underlying cash market (i.e., the “spot” market), they may not be well correlated and have typically performed very differently from, and commonly underperform, the spot price of crude oil due to a variety of factors including the current (and future) expectations of storage costs, geopolitical risks, interest charges incurred to finance the purchase of the commodity, and expectations concerning supply and demand for the commodity. It is possible that during certain time periods derivatives contract prices may not be correlated to spot market prices and may be substantially lower or higher than spot market prices for oil due to differences in derivatives contract terms or as supply, demand or other economic or regulatory factors become more pronounced in either the spot or derivatives markets. As a result, the Oil Funds may underperform a similar investment that is linked to the “spot” price of crude oil.
Risks Specific to ProShares Ultra Euro and ProShares UltraShort Euro
The European financial markets and the value of the euro have experienced significant volatility, in part related to unemployment, budget deficits and economic downturns. In addition, several member countries of the Economic and Monetary Union (the “EMU”) of the European Union (the “EU”) have experienced credit rating downgrades, rising government debt levels and, for certain EU member countries (including Greece, Spain, Portugal, Ireland and Italy), weaknesses in sovereign debt. Following a referendum in June 2016, the United Kingdom (the “UK”) formally exited the EU on January 31, 2020 (known as “Brexit”). During a transition period where the UK remained subject to EU rules but had no role in the EU law-making process, the UK and EU representatives negotiated the precise terms of their future relationship, reaching an agreement on December 24, 2020. On December 31, 2020, the transition period concluded and the terms of the new agreement went into effect on January 1, 2021. The complete impact of the new agreement, as well as the full scope and nature of the consequences of the exit, are not at this time known and are unlikely to be known for a significant period of time, but may impact the future direction of the value of non-U.S. currencies or the U.S. dollar and, in turn, affect the value of the Currency Funds. In addition, these uncertainties could increase volatility in the market prices of non-U.S. currencies or the U.S. dollar and, in turn, affect the value of the Currency Funds. The effects of Brexit will depend on agreements the UK negotiates to retain access to EU markets either during a transitional period or more permanently. Brexit could lead to legal and tax uncertainty and potentially divergent national laws and regulations as the UK determines which EU laws to replace and replicate.
In addition, it is possible that the euro could be abandoned in the future by countries that have already adopted its use. If this were to occur, the value of the euro could fluctuate drastically. Increased volatility related to the euro could exacerbate the effects of daily compounding on the Ultra Euro Fund’s and the UltraShort Euro Fund’s performance over periods longer than a single day. If the euro is abandoned by all or a significant number of countries that have adopted its use, the Ultra Euro Fund and the UltraShort Euro Fund may be forced to switch benchmarks or terminate.
36
Risks Specific to the VIX Funds
The VIX Funds are benchmarked to a VIX Futures Index. They are not benchmarked to the VIX or actual realized volatility of the S&P 500. The Index and each Fund should be expected to perform very differently from the VIX over all periods of time.
VIX futures contracts can be highly volatile and the Funds may experience sudden and large losses when buying, selling or holding such instruments.
The level of the VIX has historically reverted to a long-term mean level and is subject to sudden and unexpected reversions to its mean. Accordingly, investors should not expect the VIX Funds to retain any appreciation in value over extended periods of time.
The CBOE can make changes to the methodology and calculation of the VIX that could affect the value of VIX futures contracts, and consequently, the value of the Index and the Funds.
Risks Related to All Funds
There is no guarantee that a Fund will achieve its investment objective or that the returns of a Fund will correlate to the returns of its index times its stated multiple. There may be circumstances that could prevent a Fund from being operated in a manner consistent with its investment objective and principal investment strategies.
The assets that the Funds invest in can be highly volatile and the Funds may experience large losses when buying, selling or holding such instruments; you can lose all of your investment within a single day.
Each Fund seeks to achieve its investment objective even during periods when the performance of the Fund’s benchmark is flat or when the benchmark is moving in a manner that may cause the value of the Fund to decline.
The value of the Shares of the Funds relates directly to the value of, and realized profit or loss from, the Financial Instruments and other assets held by that Fund. Fluctuations in the price of these Financial Instruments or assets could materially adversely affect an investment in such Fund’s Shares.
Margin requirements and position limits applicable to futures contracts and swaps may limit a Fund’s ability to achieve sufficient exposure and prevent a Fund from achieving its investment objective.
Possible illiquid markets may cause or exacerbate losses; the large size of the positions the Funds may acquire increases these risks.
The Funds may be subject to significant and sustained losses from rolling futures positions.
It may not be possible to gain exposure to the benchmarks using exchange-traded Financial Instruments in the future.
Fees are charged regardless of a Fund’s returns and may result in depletion of assets.
For the Funds linked to a benchmark, changes implemented by the benchmark provider that affect the composition and valuation of the benchmark could adversely affect the value of Fund Shares and an investment in a Funds Shares.
The particular benchmark used by a Fund may underperform other asset classes and may underperform other indices or benchmarks based upon the same underlying Reference Asset.
The Funds may be subject to counterparty risks.
Historical correlation trends between Fund benchmarks and other asset classes may not continue or may reverse, limiting or eliminating any potential diversification or other benefit from owning a Fund.
The lack of active trading markets for any of the Shares of the Funds may result in losses on investors’ investments at the time of disposition of such Shares.
A Fund may change its investment objective, benchmark or strategies and may liquidate at a time that is disadvantageous to shareholders.
Investors may be adversely affected by redemption or creation orders that are subject to postponement, suspension or rejection under certain circumstances.
The NAV per Share may not correspond to the market price per Share.
Investors may be adversely affected by an overstatement or understatement of a Fund’s NAV due to the valuation method employed or errors in the NAV calculation.
Regulatory and exchange position limits or accountability levels may restrict the creation of Creation Units and have a negative impact on operation of the Trust.
Purchases of Creation Units by Authorized Participants may be limited or suspended by the Sponsor in its sole discretion. For example, the Sponsor may limit or suspend the purchase of Creation Units if it believes doing so would help a Fund manage its portfolio, such as by allowing a Fund to comply with counterparty or position limits, or in response to significant and/or rapid increase in the size of a Fund as a result of an increase in creation activity. This may, among other things, cause Fund Shares to trade at a premium to NAV or otherwise have a negative impact on the liquidity and trading of Fund shares.
21
The number of underlying components included in a Fund’s benchmark may impact volatility, which could adversely affect an investment in the Shares.
The liquidity of the Shares may also be affected by the withdrawal from participation of Authorized Participants, which could adversely affect the market price of the Shares.
Shareholders that are not Authorized Participants may only purchase or sell their Shares in secondary trading markets, and the conditions associated with trading in secondary markets may adversely affect investors’ investment in the Shares.
The applicable Exchange may halt trading in the Shares of a Fund which would adversely impact investors’ ability to sell Shares.
Shareholders do not have the protections associated with ownership of shares in an investment company registered under the 1940 Act.
Shareholders do not have the rights enjoyed by investors in certain other vehicles and may be adversely affected by a lack of statutory rights and by limited voting and distribution rights.
The value of the Shares will be adversely affected if the Funds are required to indemnify Wilmington Trust Company (the “Trustee”) and/or the Sponsor.
Although the Shares of the Funds are limited liability investments, certain circumstances such as bankruptcy of a Fund will increase a shareholder’s liability.
Failure of the FCMs to segregate assets may increase losses in the Funds.
A court could potentially conclude that the assets and liabilities of one Fund are not segregated from those of another Fund and may thereby potentially expose assets in a Fund to the liabilities of another Fund.
Due to the increased use of technologies, intentional and unintentional cyber-attacks pose operational and information security risks.
Trading on exchanges outside the United States is generally not subject to U.S. regulation and may result in different or diminished investor protections.
Competing claims of intellectual property rights may affect the Funds and an investment in the Shares.
Shareholders’ tax liability may exceed cash distributions on the Shares.
The U.S. Internal Revenue Service (“IRS”) could adjust or reallocate items of income, gain, deduction, loss and credit with respect to the Shares if the IRS does not accept the assumptions or conventions utilized by the Fund.
| • | Shareholders will receive partner information tax returns on Schedule K-1, which could increase the complexity of tax returns. |
Shareholders of each Fund may recognize significant amounts of ordinary income and short-term capital gain.
A Fund could be treated as a corporation for federal income tax purposes, which may substantially reduce the value of Shares.
Changes in U.S. federal income tax law could affect an investment in the Shares.
The Funds and the Sponsor are subject to extensive legal and regulatory requirements. Regulatory changes or actions, including the implementation of new legislation, may alter the operations and profitability of the Funds.
Investors cannot be assured of the Sponsor’s continued services, the discontinuance of which may be detrimental to the Funds.
| • | Natural disasters and public health disruptions, such as the COVID-19 virus (including any variants), may have a significant negative impact on the performance of each Fund; the risks and other information described herein could become outdated as a result of such events. |
In response to Russia’s invasion of Ukraine in February 2022 and the ongoing conflict between those two countries, the U.S. and other countries, as well as the European Union, have issued broad-ranging economic sanctions designed to impose severe pressure on Russia’s economy. Such sanctions, and the conflict generally, may have adverse effects on regional and global economic markets, and may result in increased volatility and could have a negative impact on the performance of a Fund and its or the liquidity and price of Fund Shares.
Public health issues, war and military conflicts (such as Russia’s continued military actions against Ukraine that started in February 2022 and the Israel-Hamas conflict and the ensuring conflict) sanctions, acts of terrorism, sustained elevated inflation, supply chain issues or other events could have a significant negative impact on global financial markets and economies.
22
These risk factors should be read in connection with the other information included in this Annual Report on Form 10-K, including Management’s Discussion and Analysis of Financial Condition and Results of Operations and the Funds’ Financial Statements and the related Notes to the Funds’ Financial Statements. For purposes of this section:
| • | The term “Matching VIX Fund” refers to ProShares VIX Short-Term Futures ETF and ProShares VIX Mid-Term Futures ETF; |
| • | The term “Geared VIX Fund” refers to ProShares Ultra VIX Short-Term Futures ETF and ProShares Short VIX Short-Term Futures ETF; |
| • | The term “VIX Fund” refers to each Geared VIX Fund and each Matching VIX Fund; |
| • | The term “Geared Fund” refers to ProShares UltraShort Bloomberg Crude Oil, ProShares UltraShort Bloomberg Natural Gas, ProShares UltraShort Gold, ProShares UltraShort Silver, ProShares UltraShort Euro, ProShares UltraShort Yen, ProShares Ultra Bloomberg Crude Oil, ProShares Ultra Bloomberg Natural Gas, ProShares Ultra Gold, ProShares Ultra Silver, ProShares Ultra Euro and ProShares Ultra Yen, and each Geared VIX Fund; |
| • | The term “Natural Gas Fund” refers to ProShares UltraShort Bloomberg Natural Gas and ProShares Ultra Bloomberg Natural Gas; |
| • | The term “Oil Fund” refers to ProShares UltraShort Bloomberg Crude Oil and ProShares Ultra Bloomberg Crude Oil; |
| • | The term “Precious Metal Fund” refers to ProShares UltraShort Gold, ProShares UltraShort Silver, ProShares Ultra Gold and ProShares Ultra Silver; and |
| • | The term “Currency Fund” refers to ProShares UltraShort Euro, ProShares UltraShort Yen, ProShares Ultra Euro and ProShares Ultra Yen. |
Risks Specific to the Geared Funds
In addition to the risks described elsewhere in this “Risk Factors” section, the following risks apply to the Geared Funds.
The performance of a Geared Fund for periods longer than a single day will likely differ from the Daily Target and investors holding shares for longer than a day should understand the impact of benchmark returns and volatility (how much the value of the benchmark moves up and down from day-to-day) on their holding period return.
Each of the Geared Funds is “geared” in the sense that each has an investment objective to correspond, before fees and expenses, to the one-half inverse (e.g., -0.5x), an inverse multiple (e.g., -2x), or a multiple (e.g., 1.5x, 2x), of the performance of a benchmark on a given day (referred to as the “Daily Target”). Each Geared Fund seeks investment results for a single day only, as measured from its NAV calculation time to its next NAV calculation time, and not for any other period. The return of a Geared Fund for a period longer than a single day is the result of its return for each day compounded over the period and usually will differ from one-half inverse (e.g., -0.5x), one and one-half times (1.5x), two times the inverse (-2x) or two times (2x) the return of the Geared Fund’s benchmark for the period. A Geared Fund will lose money if its benchmark’s performance is flat over time, and it is possible for a Geared Fund to lose money over time regardless of the performance of an underlying benchmark, as a result of daily rebalancing, the benchmark’s volatility and compounding. Longer holding periods, higher benchmark volatility, inverse exposure and greater leverage each affect the impact of compounding on a Geared Fund’s returns. Daily compounding of a Geared Fund’s investment returns can dramatically and adversely affect its longer-term performance during periods of high volatility. Volatility may be at least as important to a Geared Fund’s return for a period as the return of the Geared Fund’s underlying benchmark.
A Geared Fund will lose money if the Index’s performance is flat over time, and it is possible for a Geared Fund to lose money over time regardless of the performance of the Index, as a result of daily rebalancing, the Index’s volatility, compounding and other factors. Longer holding periods, higher index volatility, inverse exposure and greater leverage each affect the impact of compounding on a Geared Fund’s returns. Daily compounding of a Geared Fund’s investment returns can dramatically and adversely affect performance, especially during periods of high volatility. Volatility has a negative impact on Geared Fund performance and the volatility of the Index may be at least as important to a Geared Fund’s return for a period as the return of the Index.
23
Each Ultra or UltraShort Fund uses leverage and should produce daily returns that are more volatile than that of its benchmark. For example, the daily return of an Ultra Fund with a 2x multiple should be approximately two times as volatile on a daily basis as the return of a fund with an objective of matching the same benchmark. The daily return of an Ultra Fund with a 1.5x multiple should be approximately one and one-half times as volatile on a daily basis as the return of a fund with an objective of matching the same benchmark. The daily return of a Short Fund is designed to return one-half the inverse (-0.5x) of the return, that would be expected of a fund with an objective of matching the same benchmark. The Geared Funds are not appropriate for all investors and present different risks than other funds. The daily return of an UltraShort Fund is designed to return two times the inverse (-2x) of the return, respectively, that would be expected of a fund with an objective of matching the same benchmark. The Geared Funds that use leverage are riskier than similarly benchmarked exchange-traded funds that do not use leverage. An investor should only consider an investment in a Geared Fund if he or she understands the consequences of seeking daily leveraged, daily inverse or daily inverse leveraged investment results. Daily objective geared funds, if used properly and in conjunction with the investor’s view on the future direction and volatility of the markets, can be useful tools for investors who want to manage their exposure to various markets and market segments and who are willing to monitor and/or periodically rebalance their portfolios. Shareholders who invest in the Geared Funds should actively manage and monitor their investments, as frequently as daily.
The hypothetical examples below illustrate how daily Geared Fund returns can behave for periods longer than a single day. On each day, fund XYZ performs in line with its objective (two times (2x) the benchmark’s daily performance before fees and expenses). Notice that, in the first example (showing an overall benchmark loss for the period), over the entire seven-day period, the fund’s total return is more than two times the loss of the period return of the benchmark. For the seven-day period, benchmark XYZ lost 3.26% while fund XYZ lost 7.01% (versus -6.52% or 2 x -3.26%). In other scenarios, the return of a daily rebalanced fund could be greater than three times the benchmark’s returns.
| Benchmark XYZ | Fund XYZ | |||||||||||||||
| Level | Daily Performance | Daily Performance | Net Asset Value | |||||||||||||
Start | 100.00 | $ | 100.00 | |||||||||||||
Day 1 | 97.00 | -3.00 | % | -6.00 | % | 94.00 | ||||||||||
Day 2 | 99.91 | 3.00 | % | 6.00 | % | 99.64 | ||||||||||
Day 3 | 96.91 | -3.00 | % | -6.00 | % | 93.66 | ||||||||||
Day 4 | 99.82 | 3.00 | % | 6.00 | % | 99.28 | ||||||||||
Day 5 | 96.83 | -3.00 | % | -6.00 | % | 93.32 | ||||||||||
Day 6 | 99.73 | 3.00 | % | 6.00 | % | 98.92 | ||||||||||
Day 7 | 96.74 | -3.00 | % | -6.00 | % | 92.99 | ||||||||||
|
|
|
| |||||||||||||
Total Return | -3.26 | % | -7.01 | % | ||||||||||||
|
|
|
| |||||||||||||
Similarly, in another example (showing an overall benchmark gain for the period), over the entire seven-day period, the fund’s total return is considerably less than double that of the period return of the benchmark. For the seven-day period, benchmark XYZ gained 2.72% while fund XYZ gained 4.86% (versus 5.44% (or 2 x 2.72%)).
| Benchmark XYZ | Fund XYZ | |||||||||||||||
| Level | Daily Performance | Daily Performance | Net Asset Value | |||||||||||||
Start | 100.00 | $ | 100.00 | |||||||||||||
Day 1 | 103.00 | 3.00 | % | 6.00 | % | 106.00 | ||||||||||
Day 2 | 99.91 | -3.00 | % | -6.00 | % | 99.64 | ||||||||||
Day 3 | 102.91 | 3.00 | % | 6.00 | % | 105.62 | ||||||||||
Day 4 | 99.82 | -3.00 | % | -6.00 | % | 99.28 | ||||||||||
Day 5 | 102.81 | 3.00 | % | 6.00 | % | 105.24 | ||||||||||
Day 6 | 99.73 | -3.00 | % | -6.00 | % | 98.92 | ||||||||||
Day 7 | 102.72 | 3.00 | % | 6.00 | % | 104.86 | ||||||||||
|
|
|
| |||||||||||||
Total Return | 2.72 | % | 4.86 | % | ||||||||||||
|
|
|
| |||||||||||||
24
This effect is caused by compounding, which exists in all investments. The return of a Geared Fund for a period longer than a single day is the result of its return for each day compounded over the period and usually will differ in amount, and possibly even direction, from the Geared Fund’s stated multiple times the return of the Geared Fund’s benchmark for the same period. In general, during periods of higher benchmark volatility, compounding will cause the longer term results to be less than the multiple (or inverse multiple) of the return of the benchmark. This effect becomes more pronounced as volatility increases. Conversely, in periods of lower benchmark volatility, returns over longer periods can be higher than the multiple of the return of the benchmark. Actual results for a particular period, before fees and expenses, are also dependent on the following factors: (a) the benchmark’s volatility; (b) the benchmark’s performance; (c) period of time; (d) financing rates associated with derivatives; (e) other Fund expenses; and (f) dividends or interest paid with respect to the securities in the benchmark. The examples herein illustrate the impact of two principal factors- benchmark volatility and benchmark performance – on Fund performance. Similar effects exist for the Short Fund and UltraShort Funds, and the significance of this effect is even greater for such inverse leveraged funds.
The graphs that follow illustrate this point. Each of the graphs shows a simulated hypothetical one-year performance of a benchmark compared with the performance of a Geared Fund that perfectly achieves its daily investment objective. The graphs demonstrate that, for periods greater than a single day, a Geared Fund is likely to underperform or overperform (but not match) the benchmark performance (or the inverse of the benchmark performance) times the stated multiple in the fund’s investment objective. Investors should understand the consequences of holding daily rebalanced funds for periods longer than a single day, including the impact of compounding on fund performance. Investors should consider actively monitoring and/or periodically rebalancing their portfolios (which will possibly trigger transaction costs and tax consequences) in light of their investment goals and risk tolerance. A one-year period is used solely for illustrative purposes only. Deviations from the benchmark return times the fund multiple can occur over periods as short as a single day (as measured from one day’s NAV to the next day’s NAV) and may also occur in periods shorter than a single day (when measured intraday as opposed to NAV to NAV). An investor in a Geared Fund could potentially lose the full value of their investment within a single day. See “Intraday Price Performance Risk” below for additional details.
To isolate the impact of daily leveraged, inverse or inverse leveraged exposure, these graphs assume: a) no fund expenses or transaction costs; b) borrowing/lending rates (to obtain required inverse, inverse leveraged or leveraged exposure) and cash reinvestment rates of zero percent; and c) the fund consistently maintaining perfect exposure (-0.5x, -2x, 1.5x, or 2x) as of the fund’s NAV time each day. If these assumptions were different, the fund’s performance would be different than that shown. If fund expenses, transaction costs and financing expenses greater than zero percent were included, the fund’s performance would also be different than that shown. The -0.5x and 1.5x graphs below assume a volatility rate of 73%, which is an approximate average of the five-year historical volatility rate of the most volatile benchmark referenced herein (the S&P 500 VIX Short-Term Futures Index) for funds with these multiples. The -2x and 2x graphs below assume a volatility rate of 57%, which is an approximate average of the five-year historical volatility rate of the most volatile benchmark referenced herein (the Bloomberg Natural Gas Subindex) for funds with these multiples. A benchmark’s volatility rate is a statistical measure of the magnitude of fluctuations in its returns.

The graph above shows a scenario where the index, which exhibits day-to-day volatility, is flat or trendless over the year (i.e., begins and ends the year at 0%), but the Short Fund (-0.5x) is down.
25

The graph above shows a scenario where the benchmark, which exhibits day-to-day volatility, is up over the year, but the Short Fund (-0.5x) is down more than one-half the inverse of the benchmark.

The graph above shows a scenario where the benchmark, which exhibits day-to-day volatility, is down over the year, but the Short Fund (-0.5x) is up less than one-half the inverse of the benchmark.
26

The graph above shows a scenario where the index, which exhibits day-to-day volatility, is flat or trendless over the year (i.e., begins and ends the year at 0%), but the Ultra Fund (1.5x) is down.

The graph above shows a scenario where the index, which exhibits day-to-day volatility, is up over the year, but the Ultra Fund (1.5x) is up less than one and one-half times the index.
27

The graph above shows a scenario where the index, which exhibits day-to-day volatility, is down over the year, but the Ultra Fund (1.5x) is down less than one and one-half times the index.

The graph above shows a scenario where the benchmark, which exhibits day-to-day volatility, is flat or trendless over the year (i.e., provides a return of 0% over the course of the year), but the Ultra Fund (2x) and the UltraShort Fund (-2x) are both down.
28

The graph above shows a scenario where the benchmark, which exhibits day-to-day volatility, is up over the year, but the Ultra Fund (2x) is up less than two times the benchmark and the UltraShort Fund (-2x) is down less than two times the inverse of the benchmark.

The graph above shows a scenario where the benchmark, which exhibits day-to-day volatility, is down over the year, but the Ultra Fund (2x) is down less than two times the benchmark and the UltraShort Fund (-2x) is up less than two times the inverse of the benchmark.
29
The historical five year average volatility of the benchmarks utilized by the Funds ranges from 7.26% to 73.04%, as set forth in the table below.
Index | Identifier | Historical Five-Year Average Volatility Rate As of December 31, 2023 | ||||||
S&P 500 VIX Short-Term Futures Index | SPVXSP | 73.04 | % | |||||
S&P 500 VIX Mid-Term Futures Index | SPVXMP | 34.18 | % | |||||
Bloomberg Commodity Balanced WTI Crude Oil IndexSM | BCBCLIT | 38.09 | % | |||||
Bloomberg Natural Gas SubindexSM | BCOMNGTR | 57.39 | % | |||||
Bloomberg Gold SubindexSM | BCOMGCTR | 15.70 | % | |||||
Bloomberg Silver SubindexSM | BCOMSITR | 32.15 | % | |||||
The US dollar price of the euro | USDEUR | 7.26 | % | |||||
The US dollar price of the Japanese yen | USDJPY | 8.68 | % | |||||
The tables below illustrate the impact of two factors that affect a Geared Fund’s performance, benchmark volatility and benchmark return. Benchmark volatility is a statistical measure of the magnitude of fluctuations in the returns of a benchmark and is calculated as the standard deviation of the natural logarithms of one plus the benchmark return (calculated daily), multiplied by the square root of the number of trading days per year (assumed to be 252). The tables show estimated fund returns for a number of combinations of benchmark volatility and benchmark return over a one-year period. To isolate the impact of daily leveraged, inverse or inverse leveraged exposure, these graphs assume: a) no fund expenses or transaction costs; b) borrowing/lending rates of zero percent (to obtain required inverse, inverse leveraged or leveraged exposure) and cash reinvestment rates of zero percent; and c) the fund consistently maintaining perfect exposure (-0.5x, -2x, 1.5x, or 2x) as of the fund’s NAV time each day. If these assumptions were different, the fund’s performance would be different than that shown. If fund expenses, transaction costs and financing expenses were included, the fund’s performance would be different than that shown. The tables below show examples in which a Geared Fund has an investment objective to correspond, before fees and expenses, to one-half the inverse (-0.5x), two times the inverse (-2x), two times (2x), one and one-half times (1.5x) the daily performance of a benchmark. The Geared Fund that has an investment objective to correspond to two times (2x) the daily performance of a benchmark could incorrectly be expected to achieve a 20% return on a yearly basis if the benchmark return was 10%, absent the effects of compounding. However, as the tables below show, with a benchmark volatility of 40%, such a fund would return 3.1 %. In the charts below, shaded areas represent those scenarios where a geared fund with the investment objective described will outperform (i.e., return more than) the benchmark performance times the stated multiple in the fund’s investment objective; conversely areas not shaded represent those scenarios where the fund will underperform (i.e., return less than) the benchmark performance times the multiple stated as the daily fund objective.
30
Estimated Fund Return Over One Year When the Fund Objective is to Seek Daily Investment Results For a single day, Before Fees and Expenses, that Correspond to One-Half the Inverse (-0.5x) of the Daily Performance of an Index.
Index Volatility | ||||||||||||||||||||||||||||||||||||||||||||||||||||||||||||||||||||
One Year Index Performance | One-Half the Invers (-0.5x) One Year Index Performance | 0% | 5% | 10% | 15% | 20% | 25% | 30% | 35% | 40% | 45% | 50% | 55% | 60% | 65% | 70% | 75% | |||||||||||||||||||||||||||||||||||||||||||||||||||
-60% | 30.0 | % | 58.1 | % | 58.0 | % | 57.5 | % | 56.8 | % | 55.8 | % | 54.5 | % | 52.9 | % | 51.0 | % | 48.9 | % | 46.6 | % | 44.0 | % | 41.2 | % | 38.1 | % | 34.9 | % | 31.6 | % | 28.0 | % | ||||||||||||||||||||||||||||||||||
-55% | 27.5 | % | 49.1 | % | 48.9 | % | 48.5 | % | 47.8 | % | 46.9 | % | 45.6 | % | 44.1 | % | 42.4 | % | 40.4 | % | 38.2 | % | 35.7 | % | 33.1 | % | 30.2 | % | 27.2 | % | 24.0 | % | 20.7 | % | ||||||||||||||||||||||||||||||||||
-50% | 25.0 | % | 41.4 | % | 41.3 | % | 40.9 | % | 40.2 | % | 39.3 | % | 38.1 | % | 36.7 | % | 35.1 | % | 33.2 | % | 31.1 | % | 28.8 | % | 26.3 | % | 23.6 | % | 20.7 | % | 17.7 | % | 14.5 | % | ||||||||||||||||||||||||||||||||||
-45% | 22.5 | % | 34.8 | % | 34.7 | % | 34.3 | % | 33.7 | % | 32.8 | % | 31.7 | % | 30.4 | % | 28.8 | % | 27.0 | % | 25.0 | % | 22.8 | % | 20.4 | % | 17.8 | % | 15.1 | % | 12.2 | % | 9.2 | % | ||||||||||||||||||||||||||||||||||
-40% | 20.0 | % | 29.1 | % | 29.0 | % | 28.6 | % | 28.0 | % | 27.2 | % | 26.1 | % | 24.8 | % | 23.3 | % | 21.6 | % | 19.7 | % | 17.5 | % | 15.3 | % | 12.8 | % | 10.2 | % | 7.4 | % | 4.5 | % | ||||||||||||||||||||||||||||||||||
-35% | 17.5 | % | 24.0 | % | 23.9 | % | 23.6 | % | 23.0 | % | 22.2 | % | 21.2 | % | 19.9 | % | 18.5 | % | 16.8 | % | 15.0 | % | 12.9 | % | 10.7 | % | 8.4 | % | 5.9 | % | 3.2 | % | 0.4 | % | ||||||||||||||||||||||||||||||||||
-30% | 15.0 | % | 19.5 | % | 19.4 | % | 19.1 | % | 18.5 | % | 17.7 | % | 16.8 | % | 15.6 | % | 14.2 | % | 12.6 | % | 10.8 | % | 8.8 | % | 6.7 | % | 4.4 | % | 2.0 | % | -0.5 | % | -3.2 | % | ||||||||||||||||||||||||||||||||||
-25% | 12.5 | % | 15.5 | % | 15.4 | % | 15.0 | % | 14.5 | % | 13.8 | % | 12.8 | % | 11.6 | % | 10.3 | % | 8.7 | % | 7.0 | % | 5.1 | % | 3.1 | % | 0.9 | % | -1.4 | % | -3.9 | % | -6.5 | % | ||||||||||||||||||||||||||||||||||
-20% | 10.0 | % | 11.8 | % | 11.7 | % | 11.4 | % | 10.9 | % | 10.1 | % | 9.2 | % | 8.1 | % | 6.8 | % | 5.3 | % | 3.6 | % | 1.8 | % | -0.2 | % | -2.3 | % | -4.6 | % | -7.0 | % | -9.5 | % | ||||||||||||||||||||||||||||||||||
-15% | 7.5 | % | 8.5 | % | 8.4 | % | 8.1 | % | 7.6 | % | 6.9 | % | 6.0 | % | 4.9 | % | 3.6 | % | 2.1 | % | 0.5 | % | -1.2 | % | -3.2 | % | -5.2 | % | -7.4 | % | -9.7 | % | -12.2 | % | ||||||||||||||||||||||||||||||||||
-10% | 5.0 | % | 5.4 | % | 5.3 | % | 5.0 | % | 4.5 | % | 3.8 | % | 3.0 | % | 1.9 | % | 0.7 | % | -0.7 | % | -2.3 | % | -4.0 | % | -5.9 | % | -7.9 | % | -10.0 | % | -12.3 | % | -14.6 | % | ||||||||||||||||||||||||||||||||||
-5% | 2.5 | % | 2.6 | % | 2.5 | % | 2.2 | % | 1.7 | % | 1.1 | % | 0.2 | % | -0.8 | % | -2.0 | % | -3.4 | % | -4.9 | % | -6.6 | % | -8.4 | % | -10.4 | % | -12.4 | % | -14.6 | % | -16.9 | % | ||||||||||||||||||||||||||||||||||
0% | 0.0 | % | 0.0 | % | -0.1 | % | -0.4 | % | -0.8 | % | -1.5 | % | -2.3 | % | -3.3 | % | -4.5 | % | -5.8 | % | -7.3 | % | -8.9 | % | -10.7 | % | -12.6 | % | -14.7 | % | -16.8 | % | -19.0 | % | ||||||||||||||||||||||||||||||||||
5% | -2.5 | % | -2.4 | % | -2.5 | % | -2.8 | % | -3.2 | % | -3.9 | % | -4.7 | % | -5.6 | % | -6.8 | % | -8.1 | % | -9.5 | % | -11.1 | % | -12.9 | % | -14.7 | % | -16.7 | % | -18.8 | % | -21.0 | % | ||||||||||||||||||||||||||||||||||
10% | -5.0 | % | -4.7 | % | -4.7 | % | -5.0 | % | -5.5 | % | -6.1 | % | -6.9 | % | -7.8 | % | -8.9 | % | -10.2 | % | -11.6 | % | -13.2 | % | -14.9 | % | -16.7 | % | -18.6 | % | -20.7 | % | -22.8 | % | ||||||||||||||||||||||||||||||||||
15% | -7.5 | % | -6.7 | % | -6.8 | % | -7.1 | % | -7.5 | % | -8.1 | % | -8.9 | % | -9.8 | % | -10.9 | % | -12.2 | % | -13.6 | % | -15.1 | % | -16.7 | % | -18.5 | % | -20.4 | % | -22.4 | % | -24.5 | % | ||||||||||||||||||||||||||||||||||
20% | -10.0 | % | -8.7 | % | -8.8 | % | -9.1 | % | -9.5 | % | -10.1 | % | -10.8 | % | -11.7 | % | -12.8 | % | -14.0 | % | -15.4 | % | -16.9 | % | -18.5 | % | -20.2 | % | -22.1 | % | -24.0 | % | -26.1 | % | ||||||||||||||||||||||||||||||||||
25% | -12.5 | % | -10.6 | % | -10.6 | % | -10.9 | % | -11.3 | % | -11.9 | % | -12.6 | % | -13.5 | % | -14.6 | % | -15.8 | % | -17.1 | % | -18.6 | % | -20.1 | % | -21.9 | % | -23.7 | % | -25.6 | % | -27.6 | % | ||||||||||||||||||||||||||||||||||
30% | -15.0 | % | -12.3 | % | -12.4 | % | -12.6 | % | -13.0 | % | -13.6 | % | -14.3 | % | -15.2 | % | -16.2 | % | -17.4 | % | -18.7 | % | -20.1 | % | -21.7 | % | -23.4 | % | -25.1 | % | -27.0 | % | -29.0 | % | ||||||||||||||||||||||||||||||||||
35% | -17.5 | % | -13.9 | % | -14.0 | % | -14.3 | % | -14.7 | % | -15.2 | % | -15.9 | % | -16.8 | % | -17.8 | % | -18.9 | % | -20.2 | % | -21.6 | % | -23.2 | % | -24.8 | % | -26.5 | % | -28.4 | % | -30.3 | % | ||||||||||||||||||||||||||||||||||
40% | -20.0 | % | -15.5 | % | -15.6 | % | -15.8 | % | -16.2 | % | -16.7 | % | -17.4 | % | -18.3 | % | -19.3 | % | -20.4 | % | -21.7 | % | -23.0 | % | -24.5 | % | -26.2 | % | -27.9 | % | -29.7 | % | -31.6 | % | ||||||||||||||||||||||||||||||||||
45% | -22.5 | % | -17.0 | % | -17.0 | % | -17.3 | % | -17.7 | % | -18.2 | % | -18.9 | % | -19.7 | % | -20.7 | % | -21.8 | % | -23.0 | % | -24.4 | % | -25.9 | % | -27.4 | % | -29.1 | % | -30.9 | % | -32.7 | % | ||||||||||||||||||||||||||||||||||
50% | -25.0 | % | -18.4 | % | -18.4 | % | -18.7 | % | -19.0 | % | -19.6 | % | -20.2 | % | -21.1 | % | -22.0 | % | -23.1 | % | -24.3 | % | -25.7 | % | -27.1 | % | -28.7 | % | -30.3 | % | -32.1 | % | -33.9 | % | ||||||||||||||||||||||||||||||||||
55% | -27.5 | % | -19.7 | % | -19.8 | % | -20.0 | % | -20.4 | % | -20.9 | % | -21.5 | % | -22.3 | % | -23.3 | % | -24.4 | % | -25.6 | % | -26.9 | % | -28.3 | % | -29.8 | % | -31.4 | % | -33.2 | % | -35.0 | % | ||||||||||||||||||||||||||||||||||
60% | -30.0 | % | -20.9 | % | -21.0 | % | -21.2 | % | -21.6 | % | -22.1 | % | -22.8 | % | -23.6 | % | -24.5 | % | -25.5 | % | -26.7 | % | -28.0 | % | -29.4 | % | -30.9 | % | -32.5 | % | -34.2 | % | -36.0 | % | ||||||||||||||||||||||||||||||||||
Estimated Fund Return Over One Year When the Fund Objective is to Seek Daily Investment Results, Before Fees and Expenses, that Correspond to Two Times the Inverse (-2x) of the Daily Performance of a Benchmark.
Benchmark Volatility | ||||||||||||||||||||||||||||||||||||||||||||||||||||||||||||||||
One Year Benchmark Performance | Two Times Inverse(-2x) of One Year Benchmark Performance | 0% | 5% | 10% | 15% | 20% | 25% | 30% | 35% | 40% | 45% | 50% | 55% | 60% | 65% | 70% | ||||||||||||||||||||||||||||||||||||||||||||||||
-60% | 120 | % | 525.0 | % | 520.3 | % | 506.5 | % | 484.2 | % | 454.3 | % | 418.1 | % | 377.1 | % | 332.8 | % | 286.7 | % | 240.4 | % | 195.2 | % | 152.2 | % | 112.2 | % | 76.0 | % | 43.7 | % | ||||||||||||||||||||||||||||||||
-55% | 110 | % | 393.8 | % | 390.1 | % | 379.2 | % | 361.6 | % | 338.0 | % | 309.4 | % | 277.0 | % | 242.0 | % | 205.6 | % | 169.0 | % | 133.3 | % | 99.3 | % | 67.7 | % | 39.0 | % | 13.5 | % | ||||||||||||||||||||||||||||||||
-50% | 100 | % | 300.0 | % | 297.0 | % | 288.2 | % | 273.9 | % | 254.8 | % | 231.6 | % | 205.4 | % | 177.0 | % | 147.5 | % | 117.9 | % | 88.9 | % | 61.4 | % | 35.8 | % | 12.6 | % | -8.0 | % | ||||||||||||||||||||||||||||||||
-45% | 90 | % | 230.6 | % | 228.1 | % | 220.8 | % | 209.0 | % | 193.2 | % | 174.1 | % | 152.4 | % | 128.9 | % | 104.6 | % | 80.1 | % | 56.2 | % | 33.4 | % | 12.3 | % | -6.9 | % | -24.0 | % | ||||||||||||||||||||||||||||||||
-40% | 80 | % | 177.8 | % | 175.7 | % | 169.6 | % | 159.6 | % | 146.4 | % | 130.3 | % | 112.0 | % | 92.4 | % | 71.9 | % | 51.3 | % | 31.2 | % | 12.1 | % | -5.7 | % | -21.8 | % | -36.1 | % | ||||||||||||||||||||||||||||||||
-35% | 70 | % | 136.7 | % | 134.9 | % | 129.7 | % | 121.2 | % | 109.9 | % | 96.2 | % | 80.7 | % | 63.9 | % | 46.5 | % | 28.9 | % | 11.8 | % | -4.5 | % | -19.6 | % | -33.4 | % | -45.6 | % | ||||||||||||||||||||||||||||||||
-30% | 60 | % | 104.1 | % | 102.6 | % | 98.1 | % | 90.8 | % | 81.0 | % | 69.2 | % | 55.8 | % | 41.3 | % | 26.3 | % | 11.2 | % | -3.6 | % | -17.6 | % | -30.7 | % | -42.5 | % | -53.1 | % | ||||||||||||||||||||||||||||||||
-25% | 50 | % | 77.8 | % | 76.4 | % | 72.5 | % | 66.2 | % | 57.7 | % | 47.4 | % | 35.7 | % | 23.1 | % | 10.0 | % | -3.2 | % | -16.0 | % | -28.3 | % | -39.6 | % | -49.9 | % | -59.1 | % | ||||||||||||||||||||||||||||||||
-20% | 40 | % | 56.3 | % | 55.1 | % | 51.6 | % | 46.1 | % | 38.6 | % | 29.5 | % | 19.3 | % | 8.2 | % | -3.3 | % | -14.9 | % | -26.2 | % | -36.9 | % | -46.9 | % | -56.0 | % | -64.1 | % | ||||||||||||||||||||||||||||||||
-15% | 30 | % | 38.4 | % | 37.4 | % | 34.3 | % | 29.4 | % | 22.8 | % | 14.7 | % | 5.7 | % | -4.2 | % | -14.4 | % | -24.6 | % | -34.6 | % | -44.1 | % | -53.0 | % | -61.0 | % | -68.2 | % | ||||||||||||||||||||||||||||||||
-10% | 20 | % | 23.5 | % | 22.5 | % | 19.8 | % | 15.4 | % | 9.5 | % | 2.3 | % | -5.8 | % | -14.5 | % | -23.6 | % | -32.8 | % | -41.7 | % | -50.2 | % | -58.1 | % | -65.2 | % | -71.6 | % | ||||||||||||||||||||||||||||||||
-5% | 10 | % | 10.8 | % | 10.0 | % | 7.5 | % | 3.6 | % | -1.7 | % | -8.1 | % | -15.4 | % | -23.3 | % | -31.4 | % | -39.6 | % | -47.7 | % | -55.3 | % | -62.4 | % | -68.8 | % | -74.5 | % | ||||||||||||||||||||||||||||||||
0% | 0 | % | 0.0 | % | -0.7 | % | -3.0 | % | -6.5 | % | -11.3 | % | -17.1 | % | -23.7 | % | -30.8 | % | -38.1 | % | -45.5 | % | -52.8 | % | -59.6 | % | -66.0 | % | -71.8 | % | -77.0 | % | ||||||||||||||||||||||||||||||||
5% | -10 | % | -9.3 | % | -10.0 | % | -12.0 | % | -15.2 | % | -19.6 | % | -24.8 | % | -30.8 | % | -37.2 | % | -43.9 | % | -50.6 | % | -57.2 | % | -63.4 | % | -69.2 | % | -74.5 | % | -79.1 | % | ||||||||||||||||||||||||||||||||
10% | -20 | % | -17.4 | % | -18.0 | % | -19.8 | % | -22.7 | % | -26.7 | % | -31.5 | % | -36.9 | % | -42.8 | % | -48.9 | % | -55.0 | % | -61.0 | % | -66.7 | % | -71.9 | % | -76.7 | % | -81.0 | % | ||||||||||||||||||||||||||||||||
15% | -30 | % | -24.4 | % | -25.0 | % | -26.6 | % | -29.3 | % | -32.9 | % | -37.3 | % | -42.3 | % | -47.6 | % | -53.2 | % | -58.8 | % | -64.3 | % | -69.5 | % | -74.3 | % | -78.7 | % | -82.6 | % | ||||||||||||||||||||||||||||||||
20% | -40 | % | -30.6 | % | -31.1 | % | -32.6 | % | -35.1 | % | -38.4 | % | -42.4 | % | -47.0 | % | -51.9 | % | -57.0 | % | -62.2 | % | -67.2 | % | -72.0 | % | -76.4 | % | -80.4 | % | -84.0 | % | ||||||||||||||||||||||||||||||||
25% | -50 | % | -36.0 | % | -36.5 | % | -37.9 | % | -40.2 | % | -43.2 | % | -46.9 | % | -51.1 | % | -55.7 | % | -60.4 | % | -65.1 | % | -69.8 | % | -74.2 | % | -78.3 | % | -82.0 | % | -85.3 | % | ||||||||||||||||||||||||||||||||
30% | -60 | % | -40.8 | % | -41.3 | % | -42.6 | % | -44.7 | % | -47.5 | % | -50.9 | % | -54.8 | % | -59.0 | % | -63.4 | % | -67.8 | % | -72.0 | % | -76.1 | % | -79.9 | % | -83.3 | % | -86.4 | % | ||||||||||||||||||||||||||||||||
35% | -70 | % | -45.1 | % | -45.5 | % | -46.8 | % | -48.7 | % | -51.3 | % | -54.5 | % | -58.1 | % | -62.0 | % | -66.0 | % | -70.1 | % | -74.1 | % | -77.9 | % | -81.4 | % | -84.6 | % | -87.4 | % | ||||||||||||||||||||||||||||||||
40% | -80 | % | -49.0 | % | -49.4 | % | -50.5 | % | -52.3 | % | -54.7 | % | -57.7 | % | -61.1 | % | -64.7 | % | -68.4 | % | -72.2 | % | -75.9 | % | -79.4 | % | -82.7 | % | -85.6 | % | -88.3 | % | ||||||||||||||||||||||||||||||||
45% | -90 | % | -52.4 | % | -52.8 | % | -53.8 | % | -55.5 | % | -57.8 | % | -60.6 | % | -63.7 | % | -67.1 | % | -70.6 | % | -74.1 | % | -77.5 | % | -80.8 | % | -83.8 | % | -86.6 | % | -89.1 | % | ||||||||||||||||||||||||||||||||
50% | -100 | % | -55.6 | % | -55.9 | % | -56.9 | % | -58.5 | % | -60.6 | % | -63.2 | % | -66.1 | % | -69.2 | % | -72.5 | % | -75.8 | % | -79.0 | % | -82.1 | % | -84.9 | % | -87.5 | % | -89.8 | % | ||||||||||||||||||||||||||||||||
55% | -110 | % | -58.4 | % | -58.7 | % | -59.6 | % | -61.1 | % | -63.1 | % | -65.5 | % | -68.2 | % | -71.2 | % | -74.2 | % | -77.3 | % | -80.3 | % | -83.2 | % | -85.9 | % | -88.3 | % | -90.4 | % | ||||||||||||||||||||||||||||||||
60% | -120 | % | -60.9 | % | -61.2 | % | -62.1 | % | -63.5 | % | -65.4 | % | -67.6 | % | -70.2 | % | -73.0 | % | -75.8 | % | -78.7 | % | -81.5 | % | -84.2 | % | -86.7 | % | -89.0 | % | -91.0 | % | ||||||||||||||||||||||||||||||||
31
Estimated Fund Return Over One Year When the Fund Objective is to Seek Daily Investment Results For a single day, Before Fees and Expenses, that Correspond to One and One-Half Times (1.5x) the Daily Performance of an Index.
| Index Volatility | ||||||||||||||||||||||||||||||||||||||||||||||||||||||||||||||||||||
One Year Index Performance | One and One-Half Times (1.5x) One Year Index Performance | 0% | 5% | 10% | 15% | 20% | 25% | 30% | 35% | 40% | 45% | 50% | 55% | 60% | 65% | 70% | 75% | |||||||||||||||||||||||||||||||||||||||||||||||||||
-60% | -90.0 | % | -74.7 | % | -74.7 | % | -74.8 | % | -74.9 | % | -75.1 | % | -75.3 | % | -75.5 | % | -75.8 | % | -76.2 | % | -76.6 | % | -77.0 | % | -77.4 | % | -77.9 | % | -78.4 | % | -78.9 | % | -79.5 | % | ||||||||||||||||||||||||||||||||||
-55% | -82.5 | % | -69.8 | % | -69.8 | % | -69.9 | % | -70.1 | % | -70.3 | % | -70.5 | % | -70.8 | % | -71.2 | % | -71.6 | % | -72.0 | % | -72.5 | % | -73.1 | % | -73.6 | % | -74.2 | % | -74.9 | % | -75.6 | % | ||||||||||||||||||||||||||||||||||
-50% | -75.0 | % | -64.6 | % | -64.7 | % | -64.8 | % | -64.9 | % | -65.2 | % | -65.5 | % | -65.8 | % | -66.2 | % | -66.7 | % | -67.2 | % | -67.8 | % | -68.4 | % | -69.1 | % | -69.8 | % | -70.6 | % | -71.4 | % | ||||||||||||||||||||||||||||||||||
-45% | -67.5 | % | -59.2 | % | -59.2 | % | -59.4 | % | -59.6 | % | -59.8 | % | -60.2 | % | -60.6 | % | -61.0 | % | -61.6 | % | -62.2 | % | -62.9 | % | -63.6 | % | -64.4 | % | -65.2 | % | -66.1 | % | -67.0 | % | ||||||||||||||||||||||||||||||||||
-40% | -60.0 | % | -53.5 | % | -53.6 | % | -53.7 | % | -53.9 | % | -54.2 | % | -54.6 | % | -55.1 | % | -55.6 | % | -56.2 | % | -56.9 | % | -57.7 | % | -58.5 | % | -59.4 | % | -60.3 | % | -61.3 | % | -62.4 | % | ||||||||||||||||||||||||||||||||||
-35% | -52.5 | % | -47.6 | % | -47.6 | % | -47.8 | % | -48.0 | % | -48.4 | % | -48.8 | % | -49.3 | % | -49.9 | % | -50.6 | % | -51.4 | % | -52.3 | % | -53.2 | % | -54.2 | % | -55.3 | % | -56.4 | % | -57.6 | % | ||||||||||||||||||||||||||||||||||
-30% | -45.0 | % | -41.4 | % | -41.5 | % | -41.7 | % | -41.9 | % | -42.3 | % | -42.8 | % | -43.4 | % | -44.1 | % | -44.8 | % | -45.7 | % | -46.7 | % | -47.7 | % | -48.8 | % | -50.0 | % | -51.3 | % | -52.6 | % | ||||||||||||||||||||||||||||||||||
-25% | -37.5 | % | -35.0 | % | -35.1 | % | -35.3 | % | -35.6 | % | -36.0 | % | -36.6 | % | -37.2 | % | -38.0 | % | -38.8 | % | -39.8 | % | -40.9 | % | -42.0 | % | -43.3 | % | -44.6 | % | -46.0 | % | -47.4 | % | ||||||||||||||||||||||||||||||||||
-20% | -30.0 | % | -28.4 | % | -28.5 | % | -28.7 | % | -29.0 | % | -29.5 | % | -30.1 | % | -30.8 | % | -31.7 | % | -32.6 | % | -33.7 | % | -34.8 | % | -36.1 | % | -37.5 | % | -38.9 | % | -40.5 | % | -42.1 | % | ||||||||||||||||||||||||||||||||||
-15% | -22.5 | % | -21.6 | % | -21.7 | % | -21.9 | % | -22.3 | % | -22.8 | % | -23.4 | % | -24.2 | % | -25.2 | % | -26.2 | % | -27.4 | % | -28.6 | % | -30.0 | % | -31.5 | % | -33.1 | % | -34.8 | % | -36.5 | % | ||||||||||||||||||||||||||||||||||
-10% | -15.0 | % | -14.6 | % | -14.7 | % | -14.9 | % | -15.3 | % | -15.9 | % | -16.6 | % | -17.5 | % | -18.5 | % | -19.6 | % | -20.9 | % | -22.3 | % | -23.8 | % | -25.4 | % | -27.1 | % | -29.0 | % | -30.9 | % | ||||||||||||||||||||||||||||||||||
-5% | -7.5 | % | -7.4 | % | -7.5 | % | -7.8 | % | -8.2 | % | -8.8 | % | -9.6 | % | -10.5 | % | -11.6 | % | -12.8 | % | -14.2 | % | -15.7 | % | -17.3 | % | -19.1 | % | -21.0 | % | -22.9 | % | -25.0 | % | ||||||||||||||||||||||||||||||||||
0% | 0.0 | % | 0.0 | % | -0.1 | % | -0.4 | % | -0.8 | % | -1.5 | % | -2.3 | % | -3.3 | % | -4.5 | % | -5.8 | % | -7.3 | % | -8.9 | % | -10.7 | % | -12.6 | % | -14.7 | % | -16.8 | % | -19.0 | % | ||||||||||||||||||||||||||||||||||
5% | 7.5 | % | 7.6 | % | 7.5 | % | 7.2 | % | 6.7 | % | 6.0 | % | 5.1 | % | 4.0 | % | 2.8 | % | 1.3 | % | -0.3 | % | -2.0 | % | -3.9 | % | -6.0 | % | -8.2 | % | -10.5 | % | -12.9 | % | ||||||||||||||||||||||||||||||||||
10% | 15.0 | % | 15.4 | % | 15.3 | % | 14.9 | % | 14.4 | % | 13.7 | % | 12.7 | % | 11.5 | % | 10.2 | % | 8.7 | % | 6.9 | % | 5.0 | % | 3.0 | % | 0.8 | % | -1.5 | % | -4.0 | % | -6.6 | % | ||||||||||||||||||||||||||||||||||
15% | 22.5 | % | 23.3 | % | 23.2 | % | 22.9 | % | 22.3 | % | 21.5 | % | 20.5 | % | 19.2 | % | 17.8 | % | 16.1 | % | 14.3 | % | 12.3 | % | 10.1 | % | 7.7 | % | 5.3 | % | 2.6 | % | -0.1 | % | ||||||||||||||||||||||||||||||||||
20% | 30.0 | % | 31.5 | % | 31.3 | % | 31.0 | % | 30.3 | % | 29.5 | % | 28.4 | % | 27.1 | % | 25.6 | % | 23.8 | % | 21.8 | % | 19.7 | % | 17.4 | % | 14.9 | % | 12.2 | % | 9.4 | % | 6.5 | % | ||||||||||||||||||||||||||||||||||
25% | 37.5 | % | 39.8 | % | 39.6 | % | 39.2 | % | 38.6 | % | 37.7 | % | 36.5 | % | 35.1 | % | 33.5 | % | 31.6 | % | 29.5 | % | 27.2 | % | 24.8 | % | 22.1 | % | 19.3 | % | 16.3 | % | 13.2 | % | ||||||||||||||||||||||||||||||||||
30% | 45.0 | % | 48.2 | % | 48.1 | % | 47.7 | % | 47.0 | % | 46.0 | % | 44.8 | % | 43.3 | % | 41.6 | % | 39.6 | % | 37.4 | % | 35.0 | % | 32.3 | % | 29.5 | % | 26.5 | % | 23.3 | % | 20.0 | % | ||||||||||||||||||||||||||||||||||
35% | 52.5 | % | 56.9 | % | 56.7 | % | 56.3 | % | 55.5 | % | 54.5 | % | 53.2 | % | 51.7 | % | 49.8 | % | 47.7 | % | 45.4 | % | 42.8 | % | 40.0 | % | 37.0 | % | 33.9 | % | 30.5 | % | 27.0 | % | ||||||||||||||||||||||||||||||||||
40% | 60.0 | % | 65.7 | % | 65.5 | % | 65.0 | % | 64.3 | % | 63.2 | % | 61.8 | % | 60.2 | % | 58.2 | % | 56.0 | % | 53.5 | % | 50.8 | % | 47.9 | % | 44.7 | % | 41.4 | % | 37.8 | % | 34.1 | % | ||||||||||||||||||||||||||||||||||
45% | 67.5 | % | 74.6 | % | 74.4 | % | 73.9 | % | 73.1 | % | 72.0 | % | 70.6 | % | 68.8 | % | 66.8 | % | 64.4 | % | 61.8 | % | 59.0 | % | 55.9 | % | 52.6 | % | 49.0 | % | 45.3 | % | 41.4 | % | ||||||||||||||||||||||||||||||||||
50% | 75.0 | % | 83.7 | % | 83.5 | % | 83.0 | % | 82.2 | % | 81.0 | % | 79.5 | % | 77.6 | % | 75.5 | % | 73.0 | % | 70.3 | % | 67.3 | % | 64.0 | % | 60.5 | % | 56.8 | % | 52.9 | % | 48.8 | % | ||||||||||||||||||||||||||||||||||
55% | 82.5 | % | 93.0 | % | 92.8 | % | 92.3 | % | 91.4 | % | 90.1 | % | 88.5 | % | 86.6 | % | 84.3 | % | 81.7 | % | 78.9 | % | 75.7 | % | 72.3 | % | 68.6 | % | 64.7 | % | 60.6 | % | 56.3 | % | ||||||||||||||||||||||||||||||||||
60% | 90.0 | % | 102.4 | % | 102.2 | % | 101.6 | % | 100.7 | % | 99.4 | % | 97.7 | % | 95.7 | % | 93.3 | % | 90.6 | % | 87.6 | % | 84.3 | % | 80.7 | % | 76.8 | % | 72.7 | % | 68.4 | % | 63.9 | % | ||||||||||||||||||||||||||||||||||
Estimated Fund Return Over One Year When the Fund Objective is to Seek Daily Investment Results, Before Fees and Expenses, that Correspond to Two Times (2x) the Daily Performance of a Benchmark.
| Benchmark Volatility | ||||||||||||||||||||||||||||||||||||||||||||||||||||||||||||||||
One Year Benchmark Performance | Two Times (2x) One Year Benchmark Performance | 0% | 5% | 10% | 15% | 20% | 25% | 30% | 35% | 40% | 45% | 50% | 55% | 60% | 65% | 70% | ||||||||||||||||||||||||||||||||||||||||||||||||
-60% | -120 | % | -84.0 | % | -84.0 | % | -84.2 | % | -84.4 | % | -84.6 | % | -85.0 | % | -85.4 | % | -85.8 | % | -86.4 | % | -86.9 | % | -87.5 | % | -88.2 | % | -88.8 | % | -89.5 | % | -90.2 | % | ||||||||||||||||||||||||||||||||
-55% | -110 | % | -79.8 | % | -79.8 | % | -80.0 | % | -80.2 | % | -80.5 | % | -81.0 | % | -81.5 | % | -82.1 | % | -82.7 | % | -83.5 | % | -84.2 | % | -85.0 | % | -85.9 | % | -86.7 | % | -87.6 | % | ||||||||||||||||||||||||||||||||
-50% | -100 | % | -75.0 | % | -75.1 | % | -75.2 | % | -75.6 | % | -76.0 | % | -76.5 | % | -77.2 | % | -77.9 | % | -78.7 | % | -79.6 | % | -80.5 | % | -81.5 | % | -82.6 | % | -83.6 | % | -84.7 | % | ||||||||||||||||||||||||||||||||
-45% | -90 | % | -69.8 | % | -69.8 | % | -70.1 | % | -70.4 | % | -70.9 | % | -71.6 | % | -72.4 | % | -73.2 | % | -74.2 | % | -75.3 | % | -76.4 | % | -77.6 | % | -78.9 | % | -80.2 | % | -81.5 | % | ||||||||||||||||||||||||||||||||
-40% | -80 | % | -64.0 | % | -64.1 | % | -64.4 | % | -64.8 | % | -65.4 | % | -66.2 | % | -67.1 | % | -68.2 | % | -69.3 | % | -70.6 | % | -72.0 | % | -73.4 | % | -74.9 | % | -76.4 | % | -77.9 | % | ||||||||||||||||||||||||||||||||
-35% | -70 | % | -57.8 | % | -57.9 | % | -58.2 | % | -58.7 | % | -59.4 | % | -60.3 | % | -61.4 | % | -62.6 | % | -64.0 | % | -65.5 | % | -67.1 | % | -68.8 | % | -70.5 | % | -72.3 | % | -74.1 | % | ||||||||||||||||||||||||||||||||
-30% | -60 | % | -51.0 | % | -51.1 | % | -51.5 | % | -52.1 | % | -52.9 | % | -54.0 | % | -55.2 | % | -56.6 | % | -58.2 | % | -60.0 | % | -61.8 | % | -63.8 | % | -65.8 | % | -67.9 | % | -70.0 | % | ||||||||||||||||||||||||||||||||
-25% | -50 | % | -43.8 | % | -43.9 | % | -44.3 | % | -45.0 | % | -46.0 | % | -47.2 | % | -48.6 | % | -50.2 | % | -52.1 | % | -54.1 | % | -56.2 | % | -58.4 | % | -60.8 | % | -63.1 | % | -65.5 | % | ||||||||||||||||||||||||||||||||
-20% | -40 | % | -36.0 | % | -36.2 | % | -36.6 | % | -37.4 | % | -38.5 | % | -39.9 | % | -41.5 | % | -43.4 | % | -45.5 | % | -47.7 | % | -50.2 | % | -52.7 | % | -55.3 | % | -58.1 | % | -60.8 | % | ||||||||||||||||||||||||||||||||
-15% | -30 | % | -27.8 | % | -27.9 | % | -28.5 | % | -29.4 | % | -30.6 | % | -32.1 | % | -34.0 | % | -36.1 | % | -38.4 | % | -41.0 | % | -43.7 | % | -46.6 | % | -49.6 | % | -52.6 | % | -55.7 | % | ||||||||||||||||||||||||||||||||
-10% | -20 | % | -19.0 | % | -19.2 | % | -19.8 | % | -20.8 | % | -22.2 | % | -23.9 | % | -26.0 | % | -28.3 | % | -31.0 | % | -33.8 | % | -36.9 | % | -40.1 | % | -43.5 | % | -46.9 | % | -50.4 | % | ||||||||||||||||||||||||||||||||
-5% | -10 | % | -9.8 | % | -10.0 | % | -10.6 | % | -11.8 | % | -13.3 | % | -15.2 | % | -17.5 | % | -20.2 | % | -23.1 | % | -26.3 | % | -29.7 | % | -33.3 | % | -37.0 | % | -40.8 | % | -44.7 | % | ||||||||||||||||||||||||||||||||
0% | 0 | % | 0.0 | % | -0.2 | % | -1.0 | % | -2.2 | % | -3.9 | % | -6.1 | % | -8.6 | % | -11.5 | % | -14.8 | % | -18.3 | % | -22.1 | % | -26.1 | % | -30.2 | % | -34.5 | % | -38.7 | % | ||||||||||||||||||||||||||||||||
5% | 10 | % | 10.3 | % | 10.0 | % | 9.2 | % | 7.8 | % | 5.9 | % | 3.6 | % | 0.8 | % | -2.5 | % | -6.1 | % | -10.0 | % | -14.1 | % | -18.5 | % | -23.1 | % | -27.7 | % | -32.5 | % | ||||||||||||||||||||||||||||||||
10% | 20 | % | 21.0 | % | 20.7 | % | 19.8 | % | 18.3 | % | 16.3 | % | 13.7 | % | 10.6 | % | 7.0 | % | 3.1 | % | -1.2 | % | -5.8 | % | -10.6 | % | -15.6 | % | -20.7 | % | -25.9 | % | ||||||||||||||||||||||||||||||||
15% | 30 | % | 32.3 | % | 31.9 | % | 30.9 | % | 29.3 | % | 27.1 | % | 24.2 | % | 20.9 | % | 17.0 | % | 12.7 | % | 8.0 | % | 3.0 | % | -2.3 | % | -7.7 | % | -13.3 | % | -19.0 | % | ||||||||||||||||||||||||||||||||
20% | 40 | % | 44.0 | % | 43.6 | % | 42.6 | % | 40.8 | % | 38.4 | % | 35.3 | % | 31.6 | % | 27.4 | % | 22.7 | % | 17.6 | % | 12.1 | % | 6.4 | % | 0.5 | % | -5.6 | % | -11.8 | % | ||||||||||||||||||||||||||||||||
25% | 50 | % | 56.3 | % | 55.9 | % | 54.7 | % | 52.8 | % | 50.1 | % | 46.8 | % | 42.8 | % | 38.2 | % | 33.1 | % | 27.6 | % | 21.7 | % | 15.5 | % | 9.0 | % | 2.4 | % | -4.3 | % | ||||||||||||||||||||||||||||||||
30% | 60 | % | 69.0 | % | 68.6 | % | 67.3 | % | 65.2 | % | 62.4 | % | 58.8 | % | 54.5 | % | 49.5 | % | 44.0 | % | 38.0 | % | 31.6 | % | 24.9 | % | 17.9 | % | 10.8 | % | 3.5 | % | ||||||||||||||||||||||||||||||||
35% | 70 | % | 82.3 | % | 81.8 | % | 80.4 | % | 78.2 | % | 75.1 | % | 71.2 | % | 66.6 | % | 61.2 | % | 55.3 | % | 48.8 | % | 41.9 | % | 34.7 | % | 27.2 | % | 19.4 | % | 11.7 | % | ||||||||||||||||||||||||||||||||
40% | 80 | % | 96.0 | % | 95.5 | % | 94.0 | % | 91.6 | % | 88.3 | % | 84.1 | % | 79.1 | % | 73.4 | % | 67.0 | % | 60.1 | % | 52.6 | % | 44.8 | % | 36.7 | % | 28.5 | % | 20.1 | % | ||||||||||||||||||||||||||||||||
45% | 90 | % | 110.3 | % | 109.7 | % | 108.2 | % | 105.6 | % | 102.0 | % | 97.5 | % | 92.2 | % | 86.0 | % | 79.2 | % | 71.7 | % | 63.7 | % | 55.4 | % | 46.7 | % | 37.8 | % | 28.8 | % | ||||||||||||||||||||||||||||||||
50% | 100 | % | 125.0 | % | 124.4 | % | 122.8 | % | 120.0 | % | 116.2 | % | 111.4 | % | 105.6 | % | 99.1 | % | 91.7 | % | 83.8 | % | 75.2 | % | 66.3 | % | 57.0 | % | 47.5 | % | 37.8 | % | ||||||||||||||||||||||||||||||||
55% | 110 | % | 140.3 | % | 139.7 | % | 137.9 | % | 134.9 | % | 130.8 | % | 125.7 | % | 119.6 | % | 112.6 | % | 104.7 | % | 96.2 | % | 87.1 | % | 77.5 | % | 67.6 | % | 57.5 | % | 47.2 | % | ||||||||||||||||||||||||||||||||
60% | 120 | % | 156.0 | % | 155.4 | % | 153.5 | % | 150.3 | % | 146.0 | % | 140.5 | % | 134.0 | % | 126.5 | % | 118.1 | % | 109.1 | % | 99.4 | % | 89.2 | % | 78.6 | % | 67.8 | % | 56.8 | % | ||||||||||||||||||||||||||||||||
32
The foregoing tables are intended to isolate the effect of benchmark volatility and benchmark performance on the return of inverse, inverse leveraged or leveraged funds. The Geared Funds’ actual returns may be significantly greater or less than the returns shown above as a result of any of the factors discussed above or under the below risk factor describing correlation risks.
Correlation and Performance Risks Specific to the Geared Funds.
A number of factors may affect a Geared Fund’s ability to achieve a high correlation with its benchmark, and there is no guarantee that a Geared Fund will achieve a high degree of correlation Failure to achieve a high degree of correlation may prevent a Geared Fund from achieving its investment objective, and the percentage change of the Geared Fund’s NAV each day may differ, perhaps significantly in amount, and possibly even direction from its Daily Target.
Factors that may affect a Geared Fund’s ability to meet its investment objective include: (1) the Sponsor’s ability to purchase and sell Financial Instruments in a manner that correlates to a Fund’s objective, including the Sponsor’s ability to enter into new positions and contracts to replace exposure that has been reduced or terminated by a counterparty or otherwise; (2) an imperfect correlation between the performance of the Financial Instruments held by a Fund and the performance of the applicable benchmark; (3) bid-ask spreads on such Financial Instruments; (4) fees, expenses, transaction costs, financing costs and margin requirements associated with the use of Financial Instruments and commission costs; (5) holding or trading Financial Instruments in a market that has become illiquid or disrupted; (6) a Fund’s Share prices being rounded to the nearest cent and/or valuation methodologies; (7) changes to a benchmark that are not disseminated in advance; (8) the need to conform a Fund’s portfolio holdings to comply with investment restrictions or policies, position limits and accountability levels, and regulatory or tax law requirements; (9) early or unanticipated closings of the markets on which the holdings of a Fund trade, limiting or preventing the Fund from executing intended portfolio transactions; (10) accounting standards; (11) differences caused by a Fund obtaining exposure to only a representative sample of the components of a benchmark, overweighting or underweighting certain components of a benchmark or obtaining exposure to assets that are not included in a benchmark; (12) large movements of assets into and/or out of a Fund, particularly late in the day; (13) significant and/or rapid increases in the size of the Fund as a result of an increase in creation activity that cause the Fund to approach or reach position or accountability limits or other portfolio limits; and (14) events such as natural disasters (including disease, epidemics and pandemics) that can be highly disruptive to economies, markets and companies including, but not limited to, the Sponsor and third party service providers.
In order to achieve a high degree of correlation with their respective benchmarks, the Geared Funds seek to rebalance their portfolios daily to keep exposure consistent with their respective investment objectives. Being materially under- or overexposed to the benchmark may prevent a Geared Fund from achieving a high degree of correlation with its benchmark and may expose the Geared Fund to greater leverage risk.
Market disruptions or closures, large movements of assets into or out of the Geared Funds, regulatory restrictions, market volatility, illiquidity, margin requirements, accountability levels, position limits, and daily price fluctuation limits set forth by the exchanges and other factors will adversely affect such Geared Funds’ ability to adjust exposure to requisite levels. The target amount of a Fund’s portfolio exposure may be impacted by changes to the value of its benchmark each day. The target amount of portfolio exposure is impacted dynamically by a benchmark’s movements, including intraday movements. Because of this, it is unlikely that a Geared Fund will have perfect exposure during the day or at the end of each day and the likelihood of being materially under- or overexposed is higher on days when its benchmark is volatile, particularly when the benchmark is volatile at or near the close of the trading day.
The time and manner in which a Geared Fund rebalances its portfolio may vary from day to day at the sole discretion of the Sponsor, depending upon market conditions and other circumstances. If for any reason a Geared Fund is unable to rebalance all or a portion of its portfolio, or if all or a portion of the portfolio is rebalanced incorrectly, the Fund’s investment exposure may not be consistent with the Fund’s investment objective. In these instances, the Geared Fund may have investment exposure to its benchmark that is significantly greater or less than its stated multiple. As a result, the Geared Fund may be more or less exposed to leverage risk than if it had been properly rebalanced and may not achieve its investment objective. Unlike other funds that do not rebalance their portfolios as frequently, each Geared Fund may be subject to increased trading costs associated with daily portfolio rebalancings.
33
Intraday Price Performance Risk.
Each Geared Fund is typically rebalanced at or about the time of its NAV calculation time (which may be other than at the close of the U.S. equity markets). As such, the intraday position of the Geared Fund will generally be different from the Geared Fund’s stated daily investment objective (i.e., -0.5x, -2x, 1.5x, or 2x). Intraday price performance of the Geared Funds will likely differ from the Fund’s stated daily multiple times the performance of the Benchmark for such day.
The use of leveraged, inverse and/or inverse leveraged positions could result in the total loss of an investor’s investment.
Each of the Geared Funds utilize leverage in seeking to achieve its respective investment objective and will lose more money in market environments adverse to its Daily Target than funds that do not employ leverage. The use of leveraged and/or inverse leveraged positions could result in the total loss of an investor’s investment, even within a single day. Even if held for only a single day, the Fund is highly vulnerable to sudden large changes in the daily movement of the Index. The use of leverage increases the volatility of your returns. The cost of obtaining leverage will lower your returns.
For example, because the Ultra Funds and the UltraShort Funds offered hereby include a two times (2x) or a two times inverse (-2x) multiplier, a single-day movement in the benchmark for one of these Funds approaching 50% at any point in the day could result in the total loss or almost total loss of an investment in such Fund if that movement is contrary to the investment objective of the Fund. This would be the case with downward single-day or intraday movements in the underlying benchmark of an Ultra Fund or upward single day or intraday movements in the benchmark of an UltraShort Fund, even if the underlying benchmark maintains a level greater than zero at all times and even if the benchmark subsequently moves in an opposite direction, eliminating all or a portion of the prior adverse movement. It is not possible to predict when sudden large changes in the daily movement in an Index may occur.
A number of factors may have a negative impact on the price of commodities, such as oil, gold, silver and natural gas, and the price of Financial Instruments based on such commodities.
With regard to the Natural Gas Funds, the Precious Metals Funds and the Oil Funds, a number of factors may affect the price of these commodities and, in turn, the Financial Instruments and other assets, if any, owned by such a Fund, including, but not limited to:
Significant increases or decreases in the available supply of a physical commodity due to natural, technological, or other factors. Natural factors would include depletion of known cost-effective sources for a commodity or the impact of severe weather or other natural events on the ability to produce or distribute the commodity. Technological factors, such as increases in availability created by new or improved extraction, refining and processing equipment and methods or decreases caused by failure or unavailability of major refining and processing equipment (for example, shutting down or constructing natural gas processing plants), also materially influence the supply of the commodity. General economic conditions in the world or in a major region, such as population growth rates, periods of civil unrest, government austerity programs, or currency exchange rate fluctuations may affect prices of underlying commodities.
The exploration and production of commodities are uncertain processes with many risks. The cost of extraction, completing and operating wells / mines is often uncertain, and a number of factors can delay or prevent operations or production of commodities, including: (1) unexpected extraction or drilling conditions; (2) pressure or irregularities in formations; (3) equipment failures or repairs; (4) fires or other accidents; (5) adverse weather conditions; (6) pipeline ruptures, spills or other supply disruptions; and (7) shortages or delays in the availability of extraction delivery equipment.
In regard to the Oil Funds, the exploration and production of crude oil are uncertain processes with many risks. The cost of drilling, completing and operating wells for crude oil is often uncertain, and a number of factors can delay or prevent operations or production of crude oil, including (1) unexpected drilling conditions, (2) pressure or irregularities in formations, (3) equipment failures or repairs, (4) fires or other accidents, (5) adverse weather conditions, (6) pipeline ruptures, spills or other supply disruptions, and (7) shortages or delays in the availability of extraction or delivery equipment.
Significant increases or decreases in the demand for a physical commodity due to natural, technological or other factors. Natural factors would include such events as unusual climatological or health conditions (such as disease or pandemics) impacting the demand for commodities. Technological or other factors may include such developments as substitutes or new uses for particular commodities or changes in the demand for particular commodities. General economic conditions in the world or in a major region, such as population growth rates, periods of civil unrest, government austerity programs, or currency exchange rate fluctuations may affect prices of underlying commodities. For example, gold and silver are used in a wide range of industrial applications and demand for gold and silver is driven by, among other things, demand for jewelry. An economic downturn could have a negative impact on gold and silver demand and, consequently, their prices.
34
A significant change in the attitude of speculators and investors towards a commodity or in the commodity hedging activities of commodity producers. Should the speculative community take a negative or positive view towards any given commodity, or if there is an increase or decrease in the level of hedge activity of commodity producing companies, countries and/or organizations, such action could cause a change in world prices of any given commodity.
Large purchases or sales of physical commodities by the official sector. Governments and large institutions have large commodities holdings or may establish major commodities positions. For example, a significant portion of the aggregate world precious metals holdings is owned by governments, central banks and related institutions. Similarly, nations with centralized or nationalized energy production organizations may control large physical quantities of certain commodities. The purchase or sale by one of these institutions in large amounts could potentially cause a change in prices for that commodity.
With regard to the Oil Funds, nations with centralized or nationalized oil production and organizations such as the Organization of Petroleum Exporting Countries (OPEC) control large physical qualities of crude oil. The purchase or sale by one of these institutions in large amounts could potentially cause a change in prices for that commodity. Tension between the governments of the United States and oil exporting nations, civil unrest and sabotage, the ability of members of OPEC to agree upon and maintain oil prices and production levels, and fluctuations in the reserve capacity of crude oil could impact future oil prices.
Political activity such as the adoption of changes to legislation, imposition of regulations or entry into trade treaties, as well as political disruptions caused by societal breakdown, insurrection, terrorism, pandemics, sabotage and/or war may greatly influence commodities prices.
With regard to the Natural Gas Funds, the demand for natural gas correlates closely with general economic growth rates. The occurrence of recessions or other periods of low or negative economic growth will typically have a direct adverse impact on natural gas demand and natural gas prices. The supply and demand for natural gas may also be impacted by changes in interest rates, inflation, and other local or regional weather and market conditions, as well as by the development of alternative energy sources.
The demand for natural gas has traditionally been cyclical, with higher demand during winter months and lower demand during summer months. Natural gas prices are subject to volatile, sudden, unpredictable and/or temporary price movements over short periods of time.
The recent proliferation of commodity-linked products and their unknown effect on the commodity markets.
With regard to the Oil and Natural Gas Funds, competition from clean power companies, fluctuations in the supply and demand of alternative energy fuels, energy conservation, changes in consumer preferences regarding the use of renewable energy sources to replace fossil fuels, and tax and other government regulations can significantly affect the prices of oil and natural gas.
The prices, supply and demand for gold and silver may also be impacted by changes in interest rates, inflation, and other local or regional market conditions, as well as by investor confidence. There can be no assurance that either gold or silver will maintain its long-term value in terms of future purchasing power. Gold and silver prices are volatile and subject to sudden, and unpredictable price movements, including reversals. Gold and silver markets also have historically experienced extended periods of flat or declining prices.
Each of these factors could have a negative impact on the value of the Funds. These factors interrelate in complex ways, and the effect of one factor on the market value of a Fund may offset or enhance the effect of another factor.
Risks Specific to the Currency Funds.
A number of factors may have a negative impact on the value of non-U.S. currencies and the value of Financial Instruments based on such currencies.
A number of factors may affect the value of non-U.S. currencies or the U.S. dollar and, in turn, Financial Instruments based on such non-U.S. currencies or the U.S. dollar. These factors include:
| • | Natural or environmental disasters and widespread disease, including public health disruptions, pandemics and epidemics (for example COVID-19); |
Debt level and trade deficit of the relevant foreign countries;
Inflation rates of the United States and the relevant foreign countries and investors’ expectations concerning inflation rates;
35
Interest rates of the United States and the relevant foreign countries and investors’ expectations concerning interest rates;
Investment and trading activities of mutual funds, hedge funds and other market participants;
Global or regional political, economic or financial events and situations;
Sovereign action to set or restrict currency conversion;
| • | Monetary policies and other related activities of central banks within the U.S. and other relevant non-U.S. markets; |
Overall growth and performance of the economies of the relevant countries; and
| • | Non-U.S. financial markets may be closed on a day when U.S. domestic markets are open for trading. As a result, liquidity and/or pricing may be affected by the absence of trading in a specific currency. |
In periods of financial turmoil, capital can move quickly out of countries or geographic regions that are perceived to be more vulnerable to the effects of the crisis than other countries or geographic regions, with sudden and severely adverse consequences to the currencies of those countries or geographic regions. Each of these factors could have a negative impact on the value of a Currency Fund. These factors interrelate in complex ways, and the effect of one factor on the market value of a Currency Fund may offset or enhance the effect of another factor. All of these factors are, in turn, sensitive to the monetary, fiscal and trade policies pursued by the relevant countries and those of other countries important to international trade and finance. In addition, information relating to non-U.S. countries or currencies may not be as well-known or as rapidly or thoroughly reported as information regarding the U.S. or the U.S. dollar.
The value of the Shares of the VIX Futures Fund relates directly to the value of, and realized gain or loss from the Financial Instruments and other assets held by the Fund. Fluctuations in the price of these Financial Instruments or assets could materially adversely affect an investment in Shares of the VIX Futures Fund.
Several factors may affect the price and/or liquidity of VIX futures contracts and other assets, if any, owned by the VIX Futures Fund, including, but not limited to:
Prevailing market prices and forward volatility levels of the U.S. stock markets, the S&P 500, the equity securities included in the S&P 500 and prevailing market prices of options on the S&P 500, the VIX, options on the VIX, the relevant VIX futures contracts, or any other financial instruments related to the S&P 500 and the VIX or VIX futures contracts;
Interest rates, and investors’ expectations concerning interest rates; Inflation rates and investors’ expectations concerning inflation rates;
| • | Economic, financial, political, regulatory, geographical, judicial and other events that affect the level of the Mid-Term VIX Futures Index or the market price or forward volatility of the U.S. stock markets, the equity securities included in the S&P 500, the S&P 500, the VIX or the relevant futures or option contracts on the VIX; |
Supply and demand as well as hedging activities in the listed and OTC equity derivatives markets;
The level of margin requirements;
The position limits imposed by futures exchanges and any position or risk limits imposed by FCMs and swap counterparties;
Disruptions in trading of the S&P 500, futures contracts on the S&P 500 or options on the S&P 500; and
The level of contango or backwardation in the VIX futures contract market.
These factors interrelate in complex ways, and the effect of one factor on the market value of the VIX Futures Fund may offset or enhance the effect of another factor.
The Natural Gas Funds are linked to an index comprised of natural gas futures contracts, and are not directly linked to the “spot” price of natural gas. Natural Gas futures contracts may perform very differently from the spot price of natural gas.
The benchmark used by each Natural Gas Fund is intended to reflect the performance of the prices of futures contracts on natural gas. The Natural Gas Funds are not directly linked to the “spot” price of natural gas. The price of a futures contract reflects the expected value of the commodity upon delivery in the future whereas the spot price of a commodity reflects the immediate delivery value of the commodity. While prices of swaps, futures contracts and other derivatives contracts on natural gas are related to the prices of an underlying cash market (i.e., the “spot market”), they have typically performed very differently from, and commonly underperform, the spot price of natural gas. This is primarily due to a variety of factors including the current (and future) expectations of storage costs, geopolitical risks, interest charges incurred to finance the purchase of the commodity, and expectations concerning supply and demand for the commodity. It is possible that during certain time periods the performance of different derivatives contracts may be substantially lower or higher than cash market prices for natural gas due to differences in derivatives contract terms or as supply, demand or other economic or regulatory factors become more pronounced in either the cash or derivatives markets. As a result, the Natural Gas Funds may underperform a similar investment that is linked to the “spot” price of natural gas.
36
The Oil Funds are linked to an index comprised of crude oil futures contracts, and are not directly linked to the “spot” price of crude oil. Oil futures contracts may perform very differently from the spot price of crude oil.
The benchmark used by each Oil Fund, the Bloomberg Commodity Balanced WTI Crude Oil IndexSM (the “Oil Index”), is intended to reflect the performance of crude oil as measured by the price of West Texas Intermediate (“WTI”), sweet light crude oil futures contracts traded on the New York Mercantile Exchange (the “NYMEX”). The Oil Funds are not directly linked to the “spot” price of crude oil. The price of a futures contract reflects the expected value of the commodity upon delivery in the future, whereas the spot price of a commodity reflects the immediate delivery values of the commodity. While prices of futures contracts and other derivatives contracts on crude oil are related to the prices of an underlying cash market (i.e., the “spot” market), they may not be well correlated and have typically performed very differently from, and commonly underperform, the spot price of crude oil due to a variety of factors including the current (and future) expectations of storage costs, geopolitical risks, interest charges incurred to finance the purchase of the commodity, and expectations concerning supply and demand for the commodity. It is possible that during certain time periods derivatives contract prices may not be correlated to spot market prices and may be substantially lower or higher than spot market prices for oil due to differences in derivatives contract terms or as supply, demand or other economic or regulatory factors become more pronounced in either the spot or derivatives markets. As a result, the Oil Funds may underperform a similar investment that is linked to the “spot” price of crude oil.
Risks Specific to ProShares Ultra Euro and ProShares UltraShort Euro
The European financial markets and the value of the euro have experienced significant volatility, in part related to unemployment, budget deficits and economic downturns. In addition, several member countries of the Economic and Monetary Union (the “EMU”) of the European Union (the “EU”) have experienced credit rating downgrades, rising government debt levels and, for certain EU member countries (including Greece, Spain, Portugal, Ireland and Italy), weaknesses in sovereign debt. Following a referendum in June 2016, the United Kingdom (the “UK”) formally exited the EU on January 31, 2020 (known as “Brexit”). During a transition period where the UK remained subject to EU rules but had no role in the EU law-making process, the UK and EU representatives negotiated the precise terms of their future relationship, reaching an agreement on December 24, 2020. On December 31, 2020, the transition period concluded and the terms of the new agreement went into effect on January 1, 2021. The complete impact of the new agreement, as well as the full scope and nature of the consequences of the exit, are not at this time known and are unlikely to be known for a significant period of time, but may impact the future direction of the value of non-U.S. currencies or the U.S. dollar and, in turn, affect the value of the Currency Funds. In addition, these uncertainties could increase volatility in the market prices of non-U.S. currencies or the U.S. dollar and, in turn, affect the value of the Currency Funds. The effects of Brexit will depend on agreements the UK negotiates to retain access to EU markets either during a transitional period or more permanently. Brexit could lead to legal and tax uncertainty and potentially divergent national laws and regulations as the UK determines which EU laws to replace and replicate.
In addition, it is possible that the euro could be abandoned in the future by countries that have already adopted its use. If this were to occur, the value of the euro could fluctuate drastically. Increased volatility related to the euro could exacerbate the effects of daily compounding on the Ultra Euro Fund’s and the UltraShort Euro Fund’s performance over periods longer than a single day. If the euro is abandoned by all or a significant number of countries that have adopted its use, the Ultra Euro Fund and the UltraShort Euro Fund may be forced to switch benchmarks or terminate.
Risks Specific to the VIX Funds
In addition to the risks described elsewhere in this “Risk Factors” section, the following risks apply to the VIX Funds.
The VIX Funds are benchmarked to a VIX Futures Index. They are not benchmarked to the VIX or actual realized volatility of the S&P 500.
The level of each VIX Futures Index is based on the value of the relevant VIX futures contracts based on the Chicago Board Options Exchange, Incorporated Volatility Index (the “VIX”) comprising the applicable VIX Futures Index. Each VIX Fund is benchmarked to its respective VIX Futures Index. The VIX Funds are not linked to the VIX (which is a measure of implied volatility of the S&P 500 over the next 30 days derived from option prices), to realized volatility of the S&P 500 or to the options that underlie the VIX calculation. Each VIX Fund should be expected to perform very differently from the VIX over all periods of time. In many cases, the VIX Futures Indexes will significantly underperform the VIX.
VIX futures contracts are not directly based on a tradable underlying asset.
The VIX is not directly investable. The settlement price at maturity of VIX futures contracts are based on the calculation that determines the level of the VIX. As a result, the behavior of the VIX futures contracts may be different from traditional futures contracts whose settlement price is based on a specific tradable asset.
37
The level of the VIX has historically reverted to a long-term mean level and is subject to the risk associated with reversion to its mean. Accordingly, investors should not expect the VIX Funds to retain any appreciation in value over extended periods of time.
In the past, the level of the VIX has typically reverted over the longer term to a historical mean, and its absolute level has been constrained within a band. As such, the potential upside of long or short exposure to VIX futures contracts may be limited, and any gains may be subject to sharp reversals during such reversions to the mean.
When economic uncertainty increases and there is an associated increase in expected volatility, the value of VIX futures contracts will likely also increase and the potential upside of an investment in a VIX Short Fund will correspondingly be limited as a result. Similarly, when economic uncertainty recedes, and there is an associated decrease in expected volatility, the value of VIX futures contracts will likely also decrease and the potential upside of an investment in a VIX Ultra Fund or a Matching VIX Fund will correspondingly be limited as a result.
The value of the Shares of a VIX Futures Fund relates directly to the value of, and realized profit or loss from, the Financial Instruments and other assets held by that Fund. Fluctuations in the price of these Financial Instruments or assets could materially adversely affect an investment in such Fund’s Shares.
Several factors may affect the price and/or liquidity of VIX futures contracts and other assets, if any, owned by the VIX Futures Fund, including, but not limited to:
Prevailing market prices and forward volatility levels of the U.S. stock markets, the S&P 500, the equity securities included in the S&P 500 and prevailing market prices of options on the S&P 500, the VIX, options on the VIX, the relevant VIX futures contracts, or any other financial instruments related to the S&P 500 and the VIX or VIX futures contracts;
Interest rates, and investors’ expectations concerning interest rates;
Inflation rates and investors’ expectations concerning inflation rates;
| • | Economic, financial, political, regulatory, geographical, biological or judicial events that affect the level of the Mid-Term VIX Index or the market price or forward volatility of the U.S. stock markets, the equity securities included in the S&P 500, the S&P 500, the VIX or the relevant futures or option contracts on the VIX; |
Supply and demand as well as hedging activities in the listed and OTC equity derivatives markets;
Disruptions in trading of the S&P 500, futures contracts on the S&P 500 or options on the S&P 500;
The level of contango or backwardation in the VIX futures contract market;
The position limits imposed by FCMs; and
The level of margin requirements.
Margin requirements for VIX futures contracts and position limits imposed by exchanges and/or FCMs may limit the VIX Futures Fund’s ability to achieve sufficient exposure and prevent the Fund from achieving its investment objective.
The term “margin” refers to the minimum amount a Fund must deposit and maintain with its FCM in order to establish an open position in futures contracts. The minimum amount of margin required in connection with a particular futures contract is set by the exchange on which such contract is traded and is subject to change at any time during the term of the contract. Futures contracts are customarily bought and sold on margins that represent a percentage of the aggregate purchase or sales price of the contract.
37
An FCM may compute margin requirements multiple times per day. When a Fund has an open futures contract position, it is subject to daily variation margin calls by an FCM that could be substantial in the event of adverse price movements. Because futures contracts require only a small initial investment in the form of a deposit or initial margin, they involve a high degree of leverage. A Fund with open positions is subject to maintenance or variation margin on its open positions. When the market value of a particular open futures contract position changes to a point where the margin on deposit does not satisfy maintenance margin requirements, a margin call is made by the FCM. If the margin call is not met within a reasonable time, the FCM may close out a Fund’s position. If a Fund has insufficient cash to meet daily variation margin requirements, it might need to sell Financial Instruments at a time when such sales are disadvantageous. Futures markets are highly volatile and the use of or exposure to futures contracts may increase volatility of a Fund’s NAV.
VIX futures contracts have been subject to periods of sudden and extreme volatility. As a result, margin requirements for VIX futures contracts are higher than the margin requirements for most other types of futures contracts. In addition, the FCMs utilized by the Fund may impose margin requirements in addition to those imposed by the clearinghouse. Margin requirements are subject to change, and may be raised in the future by either or both the clearinghouse and the FCMs. High margin requirements could prevent the Fund from obtaining sufficient exposure to VIX futures contracts and may adversely affect the Fund’s ability to achieve its investment objective. An FCM’s failure to return required margin to the Fund on a timely basis may cause the Fund to delay redemption settlement dates and/or restrict, postpone or limit the right of redemption.
38
Futures contracts are subject to liquidity risk. Certain of the FCMs utilized by the Fund have imposed their own “position limits” on the Fund. Position limits restrict the amount of exposure to futures contracts the Fund can obtain through such FCMs. As a result, the Fund may need to transact through a number of FCMs to achieve its investment objective. If enough FCMs are not willing to transact with the Fund, or if the position limits imposed by such FCMs do not provide sufficient exposure, the Fund may not be able to achieve its investment objectiveobjective.
Risks Related to All Funds
Correlation Risks for all Funds.
While the Funds seek to meet their investment objectives, there is no guarantee they will do so. Factors that may affect a Fund’s ability to meet its investment objective include: (1) the Sponsor’s ability to purchase and sell each Fund’s Financial Instruments in a manner that correlates to a Fund’s objective; (2) an imperfect correlation between the performance of the Financial Instruments held by a Fund and the performance of the corresponding benchmark; (3) bid-ask spreads on each Fund’s Financial Instruments; (4) fees, expenses, transaction costs, commissions, financing costs and margin requirements associated with the use of each Fund’s Financial
38
Instruments; (5) holding or trading Financial Instruments in a market that has become illiquid or disrupted; (6) a Fund’s Share prices being rounded to the nearest cent and/or other valuation methodologies; (7) changes to a benchmark that are not disseminated in advance; (8) the need to conform a Fund’s Financial Instruments to comply with investment restrictions or policies or regulatory or tax law requirements; (9) early and unanticipated closings of the markets on which the holdings of a Fund trade; (10) accounting standards; (11) differences caused by a Fund obtaining exposure to only a representative sample of the components of a benchmark, overweighting or underweighting certain components of a benchmark or obtaining exposure to assets that are not included in a benchmark; and (12) large movements of assets into and/or out of a Fund.
Each Geared Fund seeks to provide investment results that correspond, before fees and expenses, to the performance of, or a multiple of, the inverse or an inverse multiple of the daily performance of a benchmark at all times, even during periods when the applicable benchmark is flat as well as when the benchmark is moving in a manner which causes the Fund’s NAV to decline, thereby causing losses to such Fund.
Other than for cash management purposes, the Funds are not actively managed by traditional methods (e.g., by effecting changes in the composition of a portfolio on the basis of judgments relating to economic, financial and market considerations with a view toward obtaining positive results under all market conditions). Rather, the Sponsor seeks to cause the NAV to track the daily performance of a benchmark in accordance with each Fund’s investment objective, even during periods in which the benchmark is flat or moving in a manner which causes the NAV of a Fund to decline. It is possible to lose money over time regardless of the performance of an underlying benchmark, due to the effects of daily rebalancing, volatility and compounding, as applicable (see “Correlation Risks Specific to the Geared Funds” in this Annual Report on Form 10-K for additional details).
The assets that the Funds invest in can be highly volatile and the Funds may experience large losses when buying, selling or holding such instruments.
Investments linked to volatility, commodity, currency or fixed income markets can be highly volatile compared to investments in traditional securities and the Funds may experience large losses. The value of these investments may be affected by changes in overall market movements, commodity or currency benchmarks (as the case may be), volatility, changes in interest rates, changes in inflation rates and investors’ expectations concerning inflation rates or factors affecting a particular industry, commodity or currency. For example, commodity futures contracts (as may be held by the Commodity Index Funds) may be affected by numerous factors, including drought, floods, fires, weather, livestock diseases, pipeline ruptures or spills, embargoes, tariffs and international, economic, political or regulatory developments. In particular, trading in VIX futures contracts and trading in natural gas futures contracts (or other Financial Instruments linked to natural gas) have been very volatile and can be expected to be very volatile in the future. High volatility may have an adverse impact on the Funds beyond the impact of any performance-based losses of the underlying benchmark.
Potential negative impact from rolling futures positions.
Certain of the Funds invest in or have exposure to futures contracts and are subject to risks related to “rolling” such futures contracts, which is the process by which a Fund closes out a futures position prior to its expiration month and purchases an identical futures contract with a later expiration date. The Funds do not intend to hold futures contracts through expiration, but instead intend to “roll” their respective positions as they approach expiration. The contractual obligations of a buyer or seller holding a futures contract to expiration may be satisfied by settling in cash as designated in the contract specifications. As explained further below, the price of futures contracts further from the expiration may be higher (a condition known as “contango”) or lower (a condition known as “backwardation”), which can impact the Funds’ returns.
39
When the market for these futures contracts is such that the prices are higher in the more distant delivery months than in the nearer delivery months, the sale during the course of the rolling process of the more nearby contract would take place at a price that is lower than the price of the more distant futures contract. This pattern of higher prices for longer expiration futures contracts is often referred to as “contango.” Alternatively, when the market for these futures contracts is such that the prices are higher in the nearer months than in the more distant months, the sale during the course of the rolling process of the more nearby contract would take place at a price that is higher than the price of the more distant futures contract. This pattern of higher futures prices for shorter expiration futures contracts is referred to as “backwardation.” The presence of contango in certain futures contracts at the time of rolling would be expected to adversely affect the relevant Funds with long positions, and positively affect the Funds with short positions. Similarly, the presence of backwardation in certain futures contracts at the time of rolling such contracts would be expected to adversely affect the Funds with short positions and positively affect the Funds with long positions.
There have been extended periods in which contango or backwardation have existed in the futures contract markets for various types of futures contracts and such periods can be expected to occur in the future. These extended periods have caused in the past, and may cause in the future, significant losses, and these periods can have as much or more impact over time than movements in the level of a Fund’s benchmark. Additionally, because of the frequency with which the Funds may roll futures contracts, the impact of such contango or backwardation on Fund performance may be greater than it would have been if the Funds rolled futures contracts less frequently.
39
The Precious Metals Funds do not hold gold or silver bullion. Rather, the Precious Metals Funds use Financial Instruments to gain exposure to gold and silver bullion. Using Financial Instruments to obtain exposure to gold or silver bullion may cause tracking error and subject the Precious Metals Funds to the effects of contango and backwardation as described herein.
Using Financial Instruments such as swaps, forwards and futures in an effort to replicate the inverse performance of gold or silver bullion may cause tracking error which is the divergence between the price behavior of a position and that of a benchmark. While prices of Financial Instruments are related to the prices of an underlying cash market, they may not be perfectly correlated and typically have performed differently. In addition, the use of forward or futures contracts exposes a Fund to risks associated with “rolling” as described herein (forward contracts are subject to the same risks as rolling futures contracts), including the possibility that contango or backwardation can occur. Gold and silver historically exhibit contango markets during most periods. Although the existence of historically prevalent contango markets would be expected to be beneficial to the Precious Metals Funds, there can be no assurance that such contango markets will always exist. Alternatively, the existence of backwardated markets would be expected to adversely impact the Precious Metals Funds.
Credit and liquidity risks associated with collateralized repurchase agreements.
A portion of each Fund’s assets may be held in cash and/or U.S. Treasury securities, agency securities, or other high credit quality short-term fixed-income or similar securities (such as shares of money market funds and collateralized repurchase agreements). These securities may be used for direct investment or serve as collateral for such Fund’s trading in Financial Instruments, as applicable, and may include collateralized repurchase agreements. Collateralized repurchase agreements involve an agreement to purchase a security and to sell that security back to the original seller at an agreed-upon price. The resale price reflects the purchase price plus an agreed- upon incremental amount which is unrelated to the coupon rate or maturity of the purchased security. As protection against the risk that the original seller will not fulfill its obligation, the buyer receives collateral marked-to-market daily, and maintained at a value at least equal to the sale price plus the accrued incremental amount. Although the collateralized repurchase agreements that the Funds enter into require that counterparties (which act as original sellers) over-collateralize the amount owed to a Fund with U.S. Treasury securities and/or agency securities, there is a risk that such collateral could decline in price at the same time that the counterparty defaults on its obligation to repurchase the security. If this occurs, a Fund may incur losses or delays in receiving proceeds. To minimize these risks, the Funds typically enter into transactions only with major global financial institutions.
The discontinuance of the U.S. dollar London interbank offered rate (LIBOR) could cause or contribute to market volatility and could affect the market value and/or liquidity of the Funds’ investments.
Shareholders should be aware that (i) relevant regulatory announcements about the phase out of LIBOR, (ii) the possibility of changes being made to the basis on which LIBOR is calculated and published (or its ceasing to be published), (iii) uncertainty as to whether or how any alternative reference rate may replace LIBOR, (iv) the ability of the Funds’ third-party service providers and/or counterparties to support and process the Funds’ investments based on an alternative reference rate, and (v) any other actions taken by the ICE Benchmark Administration, the Financial Conduct Authority (the “FCA”) or any other entity with respect to LIBOR or its replacement (if any), could cause or contribute to market volatility and could negatively affect the market value, availability and/or liquidity of the Funds’ investments. The unavailability or replacement of LIBOR may affect the valuation of certain Fund investments. Any pricing adjustments to a Fund’s investments resulting from a substitute reference rate may also adversely affect the Fund’s performance and/or NAV. However, it is not possible at this time to predict or ascertain what precise impact these will have on the Funds.
Possible illiquid markets may exacerbate losses.
Financial Instruments cannot always be liquidated at the desired price. It is difficult to execute a trade at a specific price when there is a relatively small volume of buy and sell orders in a market. A market disruption can also make it difficult to liquidate a position or find a swap or forward contract counterparty at a reasonable cost.
Market illiquidity may cause losses for the Funds. The large size of the positions which the Funds may acquire increases the risk of illiquidity by both making their positions more difficult to liquidate and increasing the losses incurred while trying to do so. Any type of disruption or illiquidity will potentially be exacerbated due to the fact that the Funds will typically invest in Financial Instruments related to one benchmark, which in many cases is highly concentrated. Limits imposed by counterparties, exchanges or other regulatory organizations, such as accountability levels, position limits and daily price fluctuation limits, may contribute to lack of liquidity with respect to some Financial Instruments.
40
It may not be possible to gain exposure to the benchmarks using exchange-traded Financial Instruments in the future.
The Funds may utilize exchange-traded Financial Instruments. It may not be possible to gain exposure to the benchmarks with these Financial Instruments in the future. If these Financial Instruments cease to be traded on regulated exchanges, they may be replaced with Financial Instruments traded on trading facilities that are subject to lesser degrees of regulation or, in some cases, no substantive regulation. As a result, trading in such Financial Instruments, and the manner in which prices and volumes are reported by the relevant trading facilities, may not be subject to the provisions of, and the protections afforded by the CEA, or other applicable statutes and related regulations, that govern trading on regulated U.S. futures exchanges, or similar statutes and regulations that govern trading on regulated U.K. futures exchanges. In addition, many electronic trading facilities have only recently initiated trading and do not have significant trading histories. As a result, the trading of contracts on such facilities, and the inclusion of such contracts in a benchmark, may be subject to certain risks not presented by U.S. or U.K. exchange-traded futures contracts, including risks related to the liquidity and price histories of the relevant contracts.
Fees are charged regardless of a Fund’s returns and may result in depletion of assets.
The Funds are subject to the fees and expenses described herein which are payable irrespective of a Fund’s returns, as well as the effects of commissions, trading spreads, and embedded financing, borrowing costs and fees associated with applicable swaps, forwards, futures contracts, and costs relating to the purchase of U.S. Treasury securities or similar high credit quality, short-term fixed-income or similar securities. Additional charges may include other fees as applicable. These fees and expenses have a negative impact on the Funds returns.
For the Funds linked to a benchmark, changes implemented by the benchmark provider that affect the composition and valuation of the benchmark could adversely affect the value of Fund Shares and an investment in a Fund Shares.
The Funds, other than the Currency Funds, are linked to benchmarks maintained by third-party providers that are unaffiliated with the Funds or the Sponsor. There can be no guarantee or assurance that the methodology used by the third-party provider to create the benchmark will result in a Fund achieving high, or even positive, returns. The policies implemented by each benchmark provider concerning the calculation or the composition of the benchmark could affect the value of a benchmark and, therefore, the value of the corresponding Fund’s Shares. A benchmark provider may change the composition of the benchmark, or make other methodological changes that could change the value of a benchmark. Additionally, a benchmark provider may alter, discontinue or suspend calculation or dissemination of a benchmark. Any of these actions could adversely affect the value of Shares of a Fund using that benchmark. There is no guarantee that the methodology underlying the benchmark will be free mfrom error. Benchmark providers have no obligation to consider Fund shareholder interests in calculating or revising a benchmark. Each of these factors could have a negative impact on the performance of the Funds.
In addition, for the VIX Futures Fund, the Chicago Board Options Exchange, Incorporated (“Cboe”) can make methodological changes to the calculation of the VIX that could affect the value of VIX futures contracts and, consequently, the value of the VIX Futures Fund’s Shares. There can be no assurance that Cboe will not change the VIX calculation methodology in a way which may affect the value of the VIX Futures Fund’s Shares. The Cboe may also alter, discontinue or suspend calculation or dissemination of the VIX and/or exercise settlement value. It is also possible that a third party may attempt to manipulate the value of the VIX Futures Index or the VIX. S&P Dow Jones Indices may also make changes to the equity securities underlying the S&P 500 or the futures contracts included in the Index, or make other methodological changes that could change the level of the S&P 500. Any of these actions could adversely affect the value of such Fund’s Shares.
Calculation of a benchmark may not be possible or feasible under certain events or circumstances that are beyond the reasonable control of the Sponsor, which in turn may adversely impact both the benchmark and/or the Shares, as applicable. Additionally, benchmark calculations are subject to error and may be disrupted by rollover disruptions, rebalancing disruptions and/or market emergencies, which may have an adverse effect on the value of the Shares.
The particular benchmark used by a Fund may underperform other asset classes and may underperform other indices or benchmarks based upon the same underlying Reference Asset.
The Funds, other than the Currency Funds, are linked to benchmarks maintained by third-party providers unaffiliated with the Funds or the Sponsor. There can be no guarantee or assurance that the methodology used by the third party provider to create the benchmark will result in a Fund achieving high, or even positive, returns. Further, there can be no guarantee that the methodology underlying the
41
benchmark or the daily calculation of the benchmark will be free from error. It is also possible that the value of the benchmark or its underlying Reference Asset may be subject to intentional manipulation by third-party market participants. The particular benchmark used by each Fund may underperform other asset classes and may underperform other indices or benchmarks based upon the same underlying Reference Asset. Each of these factors could have a negative impact on the performance of a Fund.
41
The Funds may be subject to counterparty risks.
Each Fund may use derivatives such as swap agreements and forward contracts (collectively referred to herein as “derivatives”) in the manner described herein as a means to achieve their respective investment objectives. The use of derivatives by a Fund exposes the Fund to counterparty risks.
Financial markets, including the Financial Instruments used by a Fund, may be subject to unusual trading activity, volatility, and potential fraud and/or manipulation by third parties.
Financial markets, including the Financial Instruments in which the Funds invest can be highly volatile and the Funds may experience sudden and large movements in price. Unusual trading activity that is unrelated to economic fundamentals, including activity that is considered market fraud and/or manipulation or excessive speculation, can lead to unusual movements in the prices of a commodity, currency, or security, which, in turn, may increase the price volatility of such commodity, currency, or security and the risk of investing in such instrument during periods of unusual market volatility. Market fraud and/or manipulation and other fraudulent trading practices (such as the intentional dissemination of false or misleading information (e.g., false rumors)) can, among other things, lead to disruption of the orderly functioning of markets, lead to significant market volatility and cause the value of a Fund and/or the Financial Instruments held by a Fund to fluctuate quickly and without warning. Such fluctuations could be significant and could be temporary or last for longer periods of time. High volatility may have an adverse impact on the performance of the Funds. The widespread demand for a commodity, currency, or security may cause price increases in the commodity, currency, or security, which could result in an increased demand for Shares. The Funds may experience difficulty in registering additional Shares in a timely manner in response to a high demand for Shares. An increase in demand for a commodity, currency, or security also may make it difficult for the Funds to create or redeem Creation Units. An investor in any of the Funds could potentially lose the full principal value of his or her investment within a single day.
Regulatory Treatment
Derivatives are generally traded in over-the-counter (“OTC”) markets and have only recently become subject to comprehensive regulation in the United States. Cash-settled forwards are generally regulated as “swaps”, whereas physically settled forwards are generally not subject to regulation (in the case of commodities other than currencies) or subject to the federal securities laws (in the case of securities).
Title VII of the Dodd-Frank Act (“Title VII”) created a regulatory regime for derivatives, with the CFTC responsible for the regulation of swaps and the SEC responsible for the regulation of “security-based swaps.” The SEC requirements have largely yet to be made effective, but the CFTC requirements are largely in place. The CFTC requirements have included rules for some of the types of transactions in which the Funds will engage, including mandatory clearing and exchange trading for certain categories of swaps, reporting, and margin for OTC swaps. Title VII also created new categories of regulated market participants, such as “swap dealers,” “security-based swap dealers,” “major swap participants,” and “major security-based swap participants” who are, or will be, subject to significant new capital, registration, recordkeeping, reporting, disclosure, business conduct and other regulatory requirements. The regulatory requirements under Title VII continue to be developed and there may be further modifications that could materially and adversely impact the Funds, the markets in which a Fund trades and the counterparties with which the Fund engages in derivatives transactions.
As noted, the CFTC rules may not apply to all of the physically settled forward contracts entered into by the Funds. Investors, therefore, may not receive the protection of CFTC regulation or the statutory scheme of the CEA in connection with each Fund’s physically settled forward contracts. The lack of regulation in these markets could expose investors to significant losses under certain circumstances, including in the event of trading abuses or financial failure by participants.
Counterparty Credit Risk
The Funds will be subject to the credit risk of the counterparties to the derivatives. In the case of cleared derivatives, the Funds will have credit risk to the clearinghouse in a similar manner as the Funds would for futures contracts. In the case of OTC derivatives, the Funds will be subject to the credit risk of the counterparty to the transaction – typically a single bank or financial institution. As a result, a Fund is subject to increased credit risk with respect to the amount it expects to receive from counterparties to OTC derivatives entered into as part of that Fund’s principal investment strategy. If a counterparty becomes bankrupt or otherwise fails to perform its obligations due to financial difficulties or other reasons, a Fund could suffer significant losses on these contracts and the value of an investor’s investment in a Fund may decline.
42
The Funds have sought to mitigate these risks by generally requiring that the counterparties for each Fund agree to post collateral for the benefit of the Fund, marked to market daily, subject to certain minimum thresholds. However, there are no limitations on the percentage of assets each Fund may invest in swap agreements or forward contracts with a particular counterparty. To the extent any such collateral is insufficient or there are delays in accessing the collateral, the Funds will be exposed to counterparty risk as described above, including possible delays in recovering amounts as a result of bankruptcy proceedings. The Funds typically enter into transactions only with major, global financial institutions.
42
OTC derivatives of the type that may be utilized by the Funds are generally less liquid than futures contracts because they are not traded on an exchange, do not have uniform terms and conditions, and are generally entered into based upon the creditworthiness of the parties and the availability of credit support, such as collateral, and in general, are not transferable without the consent of the counterparty. These agreements contain various conditions, events of default, termination events, covenants and representations. The triggering of certain events or the default on certain terms of the agreement could allow a party to terminate a transaction under the agreement and request immediate payment in an amount equal to the net positions owed to the party under the agreement. For example, if the level of the Fund’s benchmark has a dramatic intraday move that would cause a material decline in the Fund’s NAV, the terms of the swap may permit the counterparty to immediately close out the transaction with the Fund. In that event, it may not be possible for the Fund to enter into another swap or to invest in other Financial Instruments necessary to achieve the desired exposure consistent with the Fund’s objective. This, in turn, may prevent the Fund from achieving its investment objective, particularly if the level of the Fund’s benchmark reverses all or part of its intraday move by the end of the day.
In addition, cleared derivatives benefit from daily marking-to-market and settlement, and segregation and minimum capital requirements applicable to intermediaries. To the extent that a Fund enters into cleared swap transactions, the Fund will deposit collateral with a FCM in cleared swaps customer accounts, which are required by CFTC regulations to be separate from its proprietary collateral posted for cleared swaps transactions. Cleared swap customer collateral is subject to regulations that closely parallel the regulations governing customer segregated funds for futures transactions (described above) but provide certain additional protections to cleared swaps collateral in the event of a clearing broker or clearing broker customer default. For example, in the event of a default of both the clearing broker and a customer of the clearing broker, a clearing house is only permitted to access the cleared swaps collateral in the legally separate (but operationally comingled) account of the defaulting cleared swap customer of the clearing broker, as opposed to the treatment of customer segregated funds, under which the clearing house may access all of the commingled customer segregated funds of a defaulting clearing broker. OTC derivatives entered into directly between two counterparties do not necessarily benefit from such protections, particularly if entered into with an entity that is not registered as a “swap dealer” with the CFTC. This exposes the Funds to the risk that a counterparty will not settle a transaction in accordance with its terms and conditions because of a dispute over the terms of the contract (whether or not bona fide) or because of a credit or liquidity problem, thus causing the Funds to suffer a loss.
Each counterparty and/or any of its affiliates may be an Authorized Participant or shareholder of a Fund, subject to applicable law.
The counterparty risk for cleared derivatives transactions is generally lower than for OTC derivatives. Once a transaction is cleared, the clearinghouse is substituted and is a Fund’s counterparty on the derivative. The clearinghouse guarantees the performance of the other side of the derivative. Nevertheless, some risk remains, as there is no assurance that the clearinghouse, or its members, will satisfy its obligations to a Fund.
As of December 31, 2022,2023, the Funds’ approved counterparties for swap agreements and forward contracts are Royal Bank of Canada, Citibank N.A., UBS AG, Goldman Sachs & Co., Goldman Sachs International, Morgan Stanley & Co. International PLC and Societe Generale. The Sponsor regularly reviews the performance of its counterparties for, among other things, creditworthiness and execution quality. In addition, the Sponsor periodically considers the addition of new counterparties. Thus, the list of counterparties noted above may change at any time. Each day, the Funds disclose their portfolio holdings as of the prior Business Day (as such term is defined in “Creation and Redemption of Shares-Creation Procedures” in Part I, Item 1 of this Annual Report on Form 10-K). Each Fund’s portfolio holdings identity its counterparties, as applicable. This portfolio holdings information may be accessed through the web on the Sponsor’s website at www.ProShares.com.
More information about Royal Bank of Canada, including its current financial statements, may be found on the SEC’s EDGAR website under CIK No. 0001000275 (for Royal Bank of Canada). More information about Citibank N.A., including its current financial statements, may also be found on the SEC’s EDGAR website under CIK No. 0000036684 (for Citibank N.A.). More information about UBS AG, including its current financial statements, may also be found on the SEC’s EDGAR website under CIK No. 0001114446 (for UBS AG). More information about Goldman Sachs & Co., including its current financial statements, may also be found on the SEC’s EDGAR website under CIK No. 0000042352 (for Goldman Sachs & Co. LLC) More information about Goldman Sachs International, a U.K. broker-dealer and subsidiary of The Goldman Sachs Group, Inc., may also be found on the SEC’s EDGAR website under CIK No. 0000886982 (for The Goldman Sachs Group, Inc.). The Goldman Sachs Group, Inc. consolidates the financial statements of each of its subsidiaries, including Goldman Sachs & Co. and Goldman Sachs International,
43
with its own. More information about Morgan Stanley & Co. International PLC may be found on the SEC’s EDGAR website under CIK No. 0000924186 (for Morgan Stanley & Co. International PLC). More information about Societe Generale, a French public limited company, including its current financial statements as filed with the AMF (the French securities regulator), may be found on Societe Generale’s website. Please note that the references to third-party websites have been provided solely for informational
43
purposes. Neither the Funds nor the Sponsor endorses or is responsible for the content or information contained on any third-party website, including with respect to any financial statements. In addition, neither the Funds nor the Sponsor makes any warranty, express or implied or assumes any legal liability or responsibility for the accuracy, completeness or usefulness of any such information.
Each counterparty and/or any of its affiliates may be an Authorized Participant or shareholder of a Fund, subject to applicable law.
The counterparty risk for cleared derivatives transactions is generally lower than for OTC derivatives since generally a clearing organization becomes substituted for each counterparty to a cleared derivatives contract and, in effect, guarantees the parties’ performance under the contract as each party to a trade looks only to the clearing house for performance of financial obligations. However, there can be no assurance that the clearing house, or its members, will satisfy its obligations to the Fund.
Historical correlation trends between Fund benchmarks and other asset classes may not continue or may reverse, limiting or eliminating any potential diversification or other benefit from owning a Fund.
To the extent that an investor purchases a Fund seeking diversification benefits based on the historic correlation (whether positive or negative) between the returns of that Fund or its underlying benchmark and other asset classes, such historic correlation may not continue or may reverse itself. In this circumstance, the diversification or other benefits sought may be limited or nonexistent. The diversification or other benefits sought by an investor in a Fund may also become limited or cease to exist if the Sponsor determines to change the Fund’s benchmark or otherwise modify the Fund’s investment objective or strategy.
Investors cannot be assured of the Sponsor’s continued services, the discontinuance of which may be detrimental to the Funds.
Investors cannot be assured that the Sponsor will be able to continue to service the Funds for any length of time. If the Sponsor discontinues its activities on behalf of the Funds, the Funds may be adversely affected, as there may be no entity servicing the Funds for a period of time. If the Sponsor’s registrations with the CFTC or memberships in the NFA were revoked or suspended, the Sponsor would no longer be able to provide services and/or to render advice to the Funds. If the Sponsor were unable to provide services and/or advice to the Funds, the Funds would be unable to pursue their investment objectives unless and until the Sponsor’s ability to provide services and advice to the Funds was reinstated or a replacement for the Sponsor as commodity pool operator could be found. Such an event could result in termination of the Funds.
The lack of active trading markets for any of the Shares of the Funds may result in losses on investors’ investments at the time of disposition of such Shares.
Although the Shares of the Funds are publicly listed and traded on the applicable Exchange, there can be no guarantee that an active trading market for the Shares of any Fund will develop or be maintained. In this regard, if a Fund is not able to meet the continued listing standards of its primary listing exchange and is delisted, there will not be an active trading market for such Fund’s Shares. If investors need to sell their Shares at a time when no active market for them exists, the price investors receive for their Shares, assuming that investors are able to sell them, likely will be lower than the price that investors would receive if an active market did exist.
A Fund may change its investment objective, benchmark and investment strategies, and/or may terminate, at any time without shareholder approval.
The Sponsor has the authority to change a Fund’s investment objective, benchmark or investment strategy at any time, or to terminate the Trust or a Fund, in each case, without shareholder approval or advance notice, subject to applicable regulatory requirements. Although such changes may be subject to applicable regulatory approvals, the Sponsor may determine to operate a Fund in accordance with its new investment objective, benchmark or investment strategy while the applicable approvals, if any, are pending. Such changes may expose shareholders to losses on their investments in a Fund. When a Fund’s assets are sold as part of the Fund’s termination, the resulting proceeds distributed to shareholders may be less than those that could have been realized in a sale outside of a termination context.
44
Investors may be adversely affected by redemption or creation orders that are subject to postponement, suspension or rejection under certain circumstances.
A Fund may, in its discretion, suspend the right of creation or redemption or may postpone the redemption or purchase settlement date, for (1) any period during which the Exchange or any other exchange, marketplace or trading center, deemed to affect the normal operations of any of the Funds, is closed, or when trading is restricted or suspended on such exchanges in any of the Funds’ futures contracts, (2) any period during which an emergency exists as a result of which the fulfillment of a purchase order or the redemption
44
distribution is not reasonably practicable, or (3) such other period as the Sponsor determines to be necessary for the protection of the shareholders of the Funds. In addition, a Fund will reject a redemption order if the order is not in proper form as described in the Authorized Participant Agreement or if the fulfillment of the order might be unlawful. Any such postponement, suspension or rejection could adversely affect a redeeming Authorized Participant. For example, the resulting delay may adversely affect the value of the Authorized Participant’s redemption proceeds if the NAV of a Fund declines during the period of delay. The Funds disclaim any liability for any loss or damage that may result from any such suspension or postponement. Suspension of creation privileges may adversely impact how the Shares are traded and arbitraged on the secondary market, which could cause them to trade at levels materially different (premiums and discounts) from the fair value of their underlying holdings.
The NAV per Share may not correspond to the market price per Share.
The NAV per Share of a Fund changes as fluctuations occur in the market value of the Fund’s portfolio. Investors should be aware that the public trading price per Share of a Fund may be different from the NAV per Share of the Fund (i.e., the secondary market price may trade at a premium or discount to NAV). The price at which an investor may be able to sell Shares at any time, especially in times of market volatility, may be significantly less than the NAV per Share of the Fund at the time of sale. Consequently, an Authorized Participant may be able to create or redeem a Creation Unit of a Fund at a discount or a premium to the public trading price per Share of that Fund.
Authorized Participants or their customers may have an opportunity to realize a profit if they can purchase a Creation Unit at a discount to the public trading price of the Shares of a Fund or can redeem a Creation Unit at a premium over the public trading price of the Shares of a Fund. The Sponsor expects that the exploitation of such arbitrage opportunities by Authorized Participants and their clients and customers will tend to cause the public trading price to track the NAV per Share of the Funds closely over time.
Investors who purchase Fund Shares in the secondary market and pay a premium purchase price over a Fund’s indicative optimized portfolio value (“IOPV”) could incur significant losses in the event such investor sells such Fund Shares at a time when such premium is no longer present in the marketplace.
The value of a Share may be influenced by non-concurrent trading hours between the Exchange and the market in which Financial Instruments (or related Reference Assets, as applicable) held by a Fund are traded. The Shares of each Fund trade on the Exchange from 9:30 a.m. to 4:00 p.m. (Eastern Time). The Financial Instruments (and/or the related Reference Assets, as applicable) held by a particular Fund, however, may have earlier fixing or settlement times. Consequently, liquidity in the Financial Instruments (and/or the related Reference Assets, as applicable) may be reduced after such fixing or settlement time. As a result, during the time when the Exchange is open after the applicable fixing or settlement time of an underlying component, trading spreads and the resulting premium or discount on the Shares of a Fund may widen, and, therefore, may increase the difference between the price of the Shares of a Fund and the NAV of such Shares. Also, during the time when the Exchange is open but the Fund’s NAV has already been determined, there could be market developments or other events that cause or exacerbate the difference between the price of the Shares of such Funds in the secondary market and the NAV of such Shares.
The VIX futures contracts in which the VIX Futures Fund invests may be traded throughout the day, up to 4:15 p.m. and including between 4:30 p.m. and 5:00 p.m. (Eastern Time). As a result, during the time when the Exchange is closed for trading, there could be market developments or other events that cause or exacerbate the difference between the price of the Shares of the VIX Futures Fund in the secondary market and the NAV of such Shares.
The number of underlying components included in a Fund’s benchmark may impact volatility, which could adversely affect an investment in the Shares.
The number of underlying components in a Fund’s benchmark may also impact volatility, which could adversely affect an investment in the Shares. For example, each of the indexes for the Commodity Index Funds is concentrated in terms of the number and type of commodities represented, and some of the subindexes are solely concentrated in a single commodity futures contract. In addition, the benchmarks for the Currency Funds are concentrated solely on a single currency and the benchmarks for the VIX Funds are
45
concentrated solely in VIX futures contracts. Investors should be aware that other benchmarks are more diversified in terms of both the number and variety of investments included. Concentration in fewer underlying components may result in a greater degree of volatility in a benchmark and the NAV of the Fund which corresponds to that benchmark under specific market conditions and over time.
45
Trading on exchanges outside the United States is generally not subject to U.S. regulation and may result in different or diminished investor protections.
To the extent that a Fund places trades on exchanges outside the United States trading on such exchanges is generally not regulated by any U.S. governmental agency and may involve certain risks not applicable to trading on U.S. exchanges, including different or diminished investor protections. In trading contracts denominated in currencies other than U.S. dollars, the Shares are subject to the risk of adverse exchange rate movements between the dollar and the functional currencies of such contracts. Investors could incur substantial losses from trading on foreign exchanges which such investors would not have otherwise been subject had the Funds’ trading been limited to U.S. markets.
Competing claims of intellectual property rights may affect the Funds and an investment in the shares.
The Sponsor believes that it has obtained all required licenses or the appropriate consent of all necessary parties with respect to the intellectual property rights necessary to operate the Funds. However, other third parties could allege ownership as to such rights and may bring legal action asserting their claims. The expenses in litigating, negotiating, cross-licensing or otherwise settling such claims may adversely affect the Funds. Additionally, as a result of such action, a Fund could potentially change its investment objective, strategies or benchmark. Each of these factors could have a negative impact on the performance of the Funds.
Investors may be adversely affected by an overstatement or understatement of a Fund’s NAV due to the valuation method employed or errors in the NAV calculation.
Under normal circumstances, the NAV of a Fund reflects the value of the Financial Instruments held by the Fund, as of the time the NAV is calculated. The NAV of the Funds includes, in part, any unrealized profits or losses on open Financial Instrument positions. In certain circumstances (e.g., if the Sponsor believes market quotations do not accurately reflect fair value of an investment, or a trading halt closes an exchange or market early), the Sponsor may, in its sole discretion, choose to determine a fair value price as the basis for determining the market value of such position for such day. The fair value of an investment determined by the Sponsor may be different from other value determinations of the same investment. Such fair value prices generally would be determined based on available inputs about the current value of the underlying Reference Assets and would be based on principles that the Sponsor deems fair and equitable. The valuation method or errors in calculation of a Fund’s NAV also may cause the Fund’s NAV to be overstated or understated and may affect the performance of the Fund and the value of an investment in the Shares.
The liquidity of the Shares may also be affected by the withdrawal from participation of Authorized Participants, which could adversely affect the market price of the Shares.
In the event that one or more Authorized Participants which have substantial interests in the Shares withdraw from participation, the liquidity of the Shares will likely decrease, which could adversely affect the market price of the Shares and result in investors incurring a loss on their investment.
Additionally, Authorized Participants with large holdings may choose to terminate the Trust. This power may be exercised by a relatively small number of holders and, if exercised, investors may have to find another vehicle in which to invest and may have difficulty finding one offering the same features as the TrustTrust.
Shareholders that are not Authorized Participants may only purchase or sell their Shares in secondary trading markets, and the conditions associated with trading in secondary markets may adversely affect investors’ investment in the Shares.
Only Authorized Participants may create or redeem Creation Units. All other investors that desire to purchase or sell Shares must do so through the Exchange or in other markets, if any, in which the Shares may be traded. Shares may trade at a premium or discount to NAV per Share.
The applicable Exchange may halt trading in the Shares of a Fund which would adversely impact investors’ ability to sell Shares.
Trading in Shares of a Fund may be halted due to market conditions or, in light of the applicable Exchange rules and procedures, for reasons that, in the view of the applicable Exchange, make trading in Shares of a Fund inadvisable. In addition, trading is subject to trading halts caused by extraordinary market volatility pursuant to “circuit breaker” rules that require trading to be halted for a specified period based on a specified decline or rise in a market index (e.g., the Dow Jones Industrial Average) or in the price of a
46
Fund’s Shares. Additionally, the ability to short sell a Fund’s Shares may be restricted when there is a 10% or greater change from the previous day’s official closing price. There can be no assurance that the requirements necessary to maintain the listing of the Shares of a Fund will continue to be met or will remain unchanged.
46
Shareholders do not have the protections associated with ownership of shares in an investment company registered under the 1940 Act.
The Funds are not subject to registration or regulation under the 1940 Act. Consequently, shareholders do not have the regulatory protections provided to investors in investment companies registered under 1940 Act. These protections include, but are not limited to, provisions in the 1940 Act that limit transactions with affiliates, prohibit the suspension of redemptions (except under limited circumstances), require a board of directors that must include disinterested directors, limit leverage, impose a fiduciary duty on the fund’s manager with respect to the receipt of compensation for services, require shareholder approval for certain fundamental changes, limit sales loads, and require proper valuation of fund assets.
Shareholders do not have the rights enjoyed by investors in certain other vehicles and may be adversely affected by a lack of statutory rights and by limited voting and distribution rights.
The Shares have limited voting and distribution rights. For example, shareholders do not have the right to elect directors, the Funds may enact splits or reverse splits without shareholder approval and the Funds are not required to pay regular distributions, although the Funds may pay distributions at the discretion of the Sponsor.
The value of the Shares will be adversely affected if the Funds are required to indemnify Wilmington Trust Company (the “Trustee”) and/or the Sponsor.
Under the Trust Agreement, the Trustee and the Sponsor each has the right to be indemnified for any liability or expense incurred without gross negligence or willful misconduct. That means the Sponsor may require the assets of a Fund to be sold in order to cover losses or liability suffered by it or by the Trustee. Any such sale would decrease the value of an investment in an impacted Fund.
Although the Shares of the Funds are limited liability investments, certain circumstances such as bankruptcy of a Fund will increase a shareholder’s liability.
The Shares of the Funds are limited liability investments; investors may not lose more than the amount that they invest plus any profits recognized on their investment. However, shareholders could be required, as a matter of bankruptcy law, to return to the estate of a Fund any distribution they received at a time when such Fund was in fact insolvent or in violation of the Trust Agreement.
Failure of the FCMs to segregate assets may increase losses in the Funds.
The CEA requires a clearing broker to segregate all funds received from customers from such broker’s proprietary assets. There is a risk that assets deposited by the Sponsor on behalf of the Funds as margin with the FCMs may, in certain circumstances, be used to satisfy losses of other clients of the FCMs. If an FCM fails to segregate the funds received from the Sponsor, the assets of the Funds might not be fully protected in the event of the FCM’s bankruptcy. Furthermore, in the event of an FCM’s bankruptcy, Fund Shares could be limited to recovering only a pro rata share of all available funds segregated on behalf of the FCM’s combined customer accounts, even though certain property specifically traceable to a particular Fund was held by the FCM. Each FCM may, from time to time, be the subject of certain regulatory and private causes of action.
Similarly, the CEA requires a clearing organization approved by the CFTC as a derivatives clearing organization to segregate all funds and other property received from a clearing member’s clients in connection with domestic futures and options contracts from any funds held at the clearing organization to support the clearing member’s proprietary trading. Nevertheless, customer funds held at a clearing organization in connection with any futures or options contracts may be held in a commingled omnibus account, which may not identify the name of the clearing member’s individual customers. With respect to futures and options contracts, a clearing organization may use assets of a non-defaulting customer held in an omnibus account at the clearing organization to satisfy payment obligations of a defaulting customer of the clearing member to the clearing organization. As a result, in the event of a default of the clearing FCM’s other clients or the clearing FCM’s failure to extend its own funds in connection with any such default, a Fund may not be able to recover the full amount of assets deposited by the clearing FCM on behalf of the Fund with the clearing organization.
In the event of a bankruptcy or insolvency of any exchange or a clearing house, a Fund could experience a loss of the funds deposited through its FCM as margin with the exchange or clearing house, a loss of any profits on its open positions on the exchange, and the loss of unrealized profits on its closed positions on the exchange.
47
A court could potentially conclude that the assets and liabilities of one Fund are not segregated from those of another Fund and may thereby potentially expose assets in a Fund to the liabilities of another Fund.
Each Fund is a separate series of a Delaware statutory trust and not itself a separate legal entity. Section 3804(a) of the Delaware Statutory Trust Act, as amended (the “DSTA”) provides that if certain provisions are in the formation and governing documents of a statutory trust organized in series, and if separate and distinct records are maintained for any series and the assets associated with that series are held in separate and distinct records (directly or indirectly, including through a nominee or otherwise) and accounted for in
47
such separate and distinct records separately from the other assets of the statutory trust, or any series thereof, then the debts, liabilities, obligations and expenses incurred, contracted for or otherwise existing with respect to a particular series are enforceable against the assets of such series only, and not against the assets of the statutory trust generally or any other series thereof, and none of the debts, liabilities, obligations and expenses incurred, contracted for or otherwise existing with respect to the statutory trust generally or any other series thereof shall be enforceable against the assets of such series. The Sponsor is not aware of any court case that has interpreted Section 3804(a) of the DSTA or provided any guidance as to what is required for compliance. The Sponsor maintains separate and distinct records for each Fund and accounts for them separately, but it is possible a court could conclude that the methods used did not satisfy Section 3804(a) of the DSTA and thus potentially expose assets in a Fund to the liabilities of another Fund.
There may be circumstances that could prevent a Fund from being operated in a manner consistent with its investment objective and principal investment strategies.
There may be circumstances outside the control of the Sponsor and/or a Fund that could prevent or make it impractical to reposition such Fund’s portfolio investments, to process purchase or redemption orders, or to otherwise operate in a manner consistent with its investment objective and principal investment strategies. Examples of such circumstances include: market disruptions; significant market volatility, particularly late in the trading day; natural disasters; public service disruptions or utility problems such as those caused by fires, floods, extreme weather conditions, and power outages resulting in telephone, telecopy, and computer failures; market conditions or activities causing trading halts; systems failures involving computer or other information systems affecting the aforementioned parties, as well as the Depository Trust Company (“DTC”), the National Securities Clearing Corporation (“NSCC”), or any other participant in the trading or operations of a Fund; and similar extraordinary events.
While the Sponsor has implemented and tested a business continuity plan and a disaster recovery plan designed to address circumstances such as those above, these and other circumstances may prevent a Fund from being operated in a manner consistent with its investment objective and/or principal investment strategies.
Due to the increased use of technologies, intentional and unintentional cyber-attacks pose operational and information security risks.
With the increased use of technologies such as the Internet and the dependence on computer systems to perform necessary business functions, the Funds and their service providers are susceptible to operational and information security risks. In general, cyber incidents can result from deliberate attacks or unintentional events. Cyber-attacks include, but are not limited to gaining unauthorized access to digital systems for purposes of misappropriating assets or sensitive information, corrupting data, or causing operational disruption. Cyber-attacks may also be carried out in a manner that does not require gaining unauthorized access, such as causing denial-of-service attacks on websites. Cyber security failures or breaches of a Fund’s third party service provider (including, but not limited to, index providers, the administrator and transfer agent) or the issuers of securities in which the Funds invest, have the ability to cause disruptions and impact business operations, potentially resulting in financial losses, the inability of Fund shareholders to transact business, violations of applicable privacy and other laws, regulatory fines, penalties, reputational damage, reimbursement or other compensation costs, and/or additional compliance costs. In addition, substantial costs may be incurred in order to prevent any cyber incidents in the future. The Funds and their shareholders could be negatively impacted as a result. While the Funds haveSponsor has established business continuity plans and systems to prevent such cyber-attacks, there are inherent limitations in such plans and risk management systems including the possibility that certain risks have not been identified. Security controls and systems, no matter how well designed or implemented, may only partially mitigate and not fully eliminate risks. Events, when detected by security tools or third parties, may not always be immediately understood or acted upon. Furthermore, the FundsSponsor cannot control the cyber security plans and systems of each Fund’s service providers, market makers, Authorized Participants or issuers of securities in which each Fund invests.
Shareholders’ tax liability may exceed cash distributions on the Shares.
Shareholders of each Fund may be subject to U.S. federal income taxation and, in some cases, state, local, or foreign income taxation on their share of the Fund’s taxable income, whether or not they receive cash distributions from the Fund. Each Fund does not currently expect to make distributions with respect to capital gains or ordinary income. Accordingly, shareholders of a Fund will not receive cash distributions equal to their share of the Fund’s taxable income or the tax liability that results from such income. A Fund’s income, gains, losses and deductions are allocated to shareholders on a monthly basis. If you own Shares in a Fund at the beginning of a month and sell them during the month, you are generally still considered a shareholder through the end of that month.
48
The U.S. Internal Revenue Service (“IRS”) could adjust or reallocate items of income, gain, deduction, loss and credit with respect to the Shares if the IRS does not accept the assumptions or conventions utilized by the Fund.
U.S. federal income tax rules applicable to partnerships, which each Fund is anticipated to be treated as under the Internal Revenue Code of 1986, as amended (the “Code”), are complex and their application is not always clear. Moreover, the rules generally were not written for, and in some respects are difficult to apply to, publicly traded interests in partnerships. The Funds apply certain assumptions and conventions intended to comply with the intent of the rules and to report income, gain, deduction, loss and credit to
48
shareholders in a manner that reflects the shareholders’ economic gains and losses, but these assumptions and conventions may not comply with all aspects of the applicable regulations. It is possible therefore that the IRS will successfully assert that these assumptions or conventions do not satisfy the technical requirements of the Code or the Treasury regulations promulgated thereunder and will require that items of income, gain, deduction, loss and credit be adjusted or reallocated in a manner that could be adverse to investors.
Shareholders will receive partner information tax returns on Schedule K-1, which could increase the complexity of tax returns.
The partner information tax returns on Schedule K-1 which the Funds will distribute to shareholders will contain information regarding the income items and expense items of the Funds. If you have not received Schedule K-1s from other investments, you may find that preparing your tax return may require additional time, or it may be necessary for you to retain an accountant or other tax preparer, at an additional expense to you, to assist you in the preparation of your return.
Shareholders of each Fund may recognize significant amounts of ordinary income and short-term capital gain.
Due to the investment strategy of the Funds, the Funds may realize and pass-through to Shareholders significant amounts of ordinary income and short-term capital gains as opposed to long-term capital gains, which generally are taxed at a preferential rate. A Fund’s income, gains, losses and deductions are allocated to shareholders on a monthly basis. If you own shares in a Fund at the beginning of a month and sell them during the month, the fund will generally still consider you a shareholder through the end of that month.
A Fund may be liable for U.S. federal income tax on any “imputed underpayment” of tax resulting from an adjustment as a result of an IRS audit. The amount of the imputed underpayment generally includes increases in allocations of items of income or gains to any shareholder and decreases in allocations of items of deduction, loss, or credit to any shareholder without any offset for any corresponding reductions in allocations of items of income or gain to any shareholder or increases in allocations of items of deduction, loss, or credit to any shareholder. If a Fund is required to pay any U.S. federal income taxes on any imputed underpayment, the resulting tax liability would reduce the net assets of the Fund and would likely have an adverse impact on the value of the Shares. Under certain circumstances, a Fund may be eligible to make an election to cause the shareholders to take into account the amount of any imputed underpayment, including any interest and penalties. However, there can be no assurance that such election will be made or effective. If the election is made, the Fund would be required to provide shareholders who owned beneficial interests in the Shares in the year to which the adjusted allocations relate with a statement setting forth their proportionate shares of the adjustment (“Adjustment Statements”). Those shareholders would be required to take the adjustment into account in the taxable year in which the Adjustment Statements are issued.
A Fund could be treated as a corporation for federal income tax purposes, which may substantially reduce the value of Shares.
Each Fund has received an opinion of counsel that, under current U.S. federal income tax laws, such will be treated as a partnership that is not taxable as a corporation for U.S. federal income tax purposes, provided that, inter alia, (i) at least 90 percent of such Fund’s annual gross income will be derived from qualifying income which includes dividends, interest, capital gains from the sale or other disposition of stocks and debt instruments and, in the case of a partnership a principal activity of which is the buying and selling of commodities or certain positions with respect to commodities, income and gains derived from certain swap agreements or regulated futures or forward contracts with respect to commodities, (ii) such Fund is organized and operated in accordance with its governing agreements and applicable law and (iii) such Fund does not elect to be taxed as a corporation for federal income tax purposes. Although the Sponsor anticipates that each Fund has satisfied and will continue to satisfy the “qualifying income” requirement for all of its taxable years, such result cannot be assured. The Funds have not requested and will not request any ruling from the IRS with respect to their classification that each Fund is treated as a partnership not taxable as a corporation for federal income tax purposes. If the IRS were to successfully assert that a Fund is taxable as a corporation for federal income tax purposes in any taxable year, rather than passing through its income, gains, losses and deductions proportionately to shareholders, such Fund would be subject to tax on its net income for the year at the 21% corporate tax rate. In addition, although each Fund does not currently intend to make distributions with respect to Shares, any distributions would be taxable to shareholders as dividend income. Taxation of a Fund as a corporation could materially reduce the after-tax return on an investment in Shares and could substantially reduce the value of the Shares.
49
Changes in U.S. federal income tax law could affect an investment in the Shares.
Recently enacted legislation commonly known as the “Tax Cuts and Jobs Act” has made significant changes to U.S. federal income tax rules. As of the date of this filing, the long-term impact of the Tax Cuts and Jobs Act, including on the Shares, is unclear. Investors are urged to consult their tax advisors regarding the effect of the Tax Cuts and Jobs Act prior to investing in the Shares.
INVESTORS ARE STRONGLY URGED TO CONSULT THEIR OWN TAX ADVISERS AND COUNSEL WITH RESPECT TO THE POSSIBLE TAX CONSEQUENCES TO THEM OF AN INVESTMENT IN THE SHARES OF A FUND; SUCH TAX CONSEQUENCES MAY DIFFER IN RESPECT OF DIFFERENT INVESTORS.
49
Regulatory changes or actions, including the implementation of new legislation, may alter the operations and profitability of the Funds.
The U.S. derivatives markets and market participants have been subject to comprehensive regulation, not only by the CFTC but also by self-regulatory organizations, including the NFA and the exchanges on which the derivatives contracts are traded and/or cleared. The regulation of commodity interest transactions and markets, including under the Dodd-Frank Act, is a rapidly changing area of law and is subject to ongoing modification by governmental and judicial action. In particular, the Dodd-Frank Act has expanded the regulation of markets, market participants and financial instruments. The regulatory regime under the Dodd-Frank Act has imposed additional compliance and legal burdens on participants in the markets for futures and other commodity interests. For example, under the Dodd-Frank Act new capital and risk requirements have been imposed on market intermediaries. Those requirements may cause the cost of trading to increase for market participants, like the Funds, that must interact with those intermediaries to carry out their trading activities. These increased costs can detract from the Funds’ performance.
As with any regulated activity, changes in regulations may have unexpected results. For example, changes in the amount or quality of the collateral that traders in derivatives contracts are required to provide to secure their open positions, or in the limits on number or size of positions that a trader may have open at a given time, may adversely affect the ability of the Funds to enter into certain transactions that could otherwise present lucrative opportunities. Considerable regulatory attention has been focused on non-traditional investment pools which are publicly distributed in the United States. There is a possibility of future regulatory changes altering, perhaps to a material extent, the nature of an investment in the Funds or the ability of the Funds to continue to implement their investment strategies.
In November 2019, the SEC issued proposed regulations limiting the purchase and sale of funds like the Geared Funds. Instead of adopting these regulations, in October 2020, the SEC directed its staff to conduct a review of the existing regulatory framework related to the purchase and sale of funds like the Geared Funds. Although it is impossible to predict the outcome of such review, its impact could be adverse to the effect on the Geared Funds.
In addition, the SEC, CFTC and the exchanges are authorized to take extraordinary actions in the event of a market emergency, including, for example, the retroactive implementation of speculative position limits or higher margin requirements, the establishment of daily price limits and the suspension of trading. The regulation of swaps, forwards and futures transactions in the United States is a rapidly changing area of law and is subject to modification by government and judicial action. The effect of any future regulatory change on the Funds is impossible to predict, but could be substantial and adverse.
In particular, the Dodd-Frank Act was signed into law on July 21, 2010. The Dodd-Frank Act has made and will continue to make sweeping changes to the way in which the U.S. financial system is supervised and regulated. Title VII of the Dodd-Frank Act sets forth a new legislative framework for OTC derivatives, including certain Financial Instruments, such as swaps, in which certain of the Funds may invest. Title VII of the Dodd-Frank Act makes broad changes to the OTC derivatives market, grants significant new authority to the SEC and the CFTC to regulate OTC derivatives and market participants, and will require clearing and exchange trading of many OTC derivatives transactions.
Pursuant to relatively recent regulations adopted by the CFTC, swap dealers are required to be registered and are subject to various regulatory requirements, including, but not limited to, margin, recordkeeping, reporting and various business conduct requirements, as well as proposed minimum financial capital requirements.
Pursuant to the Dodd-Frank Act, regulations adopted by the CFTC and the federal banking regulators that are now in effect require swap dealers to post and collect variation margin (comprised of specified liquid instruments and subject to a required haircut) in connection with trading of OTC swaps with a Fund. These requirements may increase the amount of collateral the Funds are required to provide and the costs associated with providing it.
50
OTC swap agreements submitted for clearing are subject to minimum initial and variation margin requirements set by the relevant clearinghouse, as well as margin requirements mandated by the CFTC, SEC and/or federal banking regulators. Swap dealers also typically demand the unilateral ability to increase a Fund’s collateral requirements for cleared swap agreements beyond any regulatory and clearinghouse minimums. Such requirements may make it more difficult and costly for investment funds, such as the Funds, to enter into customized transactions. They may also render certain strategies in which a Fund might otherwise engage impossible or so costly that they will no longer be economical to implement. If a Fund decides to execute swap agreements through such an exchange or execution facility, the Fund would be subject to the rules of the exchange or execution facility, which would bring additional risks and liabilities, and potential requirements under applicable regulations and under rules of the relevant exchange or execution facility.
With respect to cleared OTC derivatives, a Fund will not face a clearinghouse directly but rather will do so through a swap dealer that is registered with the CFTC or SEC and that acts as a clearing member. A Fund may face the indirect risk of the failure of another clearing member customer to meet its obligations to its clearing member. This risk could arise due to a default by the clearing member on its obligations to the clearinghouse triggered by a customer’s failure to meet its obligations to the clearing member.
50
Swap dealers also are required to post margin to the clearinghouses through which they clear their customers’ trades instead of using such margin in their operations, as was widely permitted before Dodd-Frank. This has increased and will continue to increase swap dealers’ costs, and these increased costs are generally passed through to other market participants such as the Funds in the form of higher upfront and mark-to-market margin, less favorable trade pricing, and the imposition of new or increased fees, including clearing account maintenance fees.
While certain regulations have been promulgated and are already in effect, the full impact of the Dodd-Frank Act on any of the Funds remains uncertain. The legislation and the related regulations that have been and may be promulgated in the future may negatively impact a Fund’s ability to meet its investment objective either through limits on its investments or requirements imposed on it or any of its counterparties. In particular, new requirements, including capital requirements and mandatory clearing of OTC derivatives transactions, which may increase derivative counterparties’ costs and are expected to generally be passed through to other market participants in the form of higher upfront and mark-to-market margin, less favorable trade pricing, and the imposition of new or increased fees, including clearinghouse account maintenance fees, may increase the cost of a Fund’s investments and the cost of doing business, which could adversely affect investors.
Regulatory bodies outside the U.S. have also passed or proposed, or may propose in the future, legislation similar to that proposed by Dodd-Frank or other legislation containing other restrictions that could adversely impact the liquidity of and increase costs of participating in the commodities markets.
In addition, regulations adopted by U.S. federal banking regulators that began to take effect in 2019 will require certain bank- regulated swap dealer counterparties and certain of their affiliates and subsidiaries, including swap dealers, to include in certain financial contracts, including many derivatives contracts, such as swap agreements, terms that delay or restrict the rights of counterparties, such as a Fund, to terminate such contracts, foreclose upon collateral, exercise other default rights or restrict transfers of credit support in the event that the counterparty and/or its affiliates are subject to certain types of resolution or insolvency proceedings. Similar regulations and laws have been adopted in the United Kingdom and the European Union that applies to the Funds’ counterparties located in those jurisdictions. It is possible that these new requirements could adversely affect the Funds’ ability to terminate existing derivatives agreements or to realize amounts to be received under such agreements.
Regulatory and exchange accountability levels may restrict the creation of Creation Units and the operation of the Trust.
Many U.S. futures exchanges limit the amount of fluctuation permitted in futures contract prices during a single trading day by regulations referred to as “daily price fluctuation limits” or “daily limits.” Once the daily limit has been reached in a particular contract, no trades may be made that day at a price beyond that limit or trading may be suspended for specified periods during the trading day. Derivatives contract prices could move to a limit for several consecutive trading days with little or no trading, thereby preventing prompt liquidation of or entry into derivatives positions and potentially subjecting the Fund to substantial losses or periods in which the Fund does not create additional Creation Units.
In addition, the CFTC, U.S. futures exchanges and certain non-U.S. exchanges have established limits referred to as “speculative position limits” or “accountability levels” on the maximum net long or short futures positions that any person may hold or control in futures contracts traded on U.S. and certain non-U.S. exchanges. The CFTC’s rules require that all accounts owned or managed by an entity that is responsible for such accounts’ trading decisions, their principals and their affiliates be aggregated for position limit purposes. The CFTC amended these aggregation rules in December 2016.
In connection with these limits, the Dodd-Frank Act amended the Commodity Exchange Act and, as a result, the CFTC has adopted regulations establishing speculative position limits applicable to regulated futures and OTC derivatives and impose aggregate speculative position limits across regulated U.S. futures, OTC positions and certain futures contracts traded on non-U.S. exchanges. The CFTC has sought to amend its position limits rules for several years and on October 15, 2020 the CFTC re-proposed rules on position limits with respect to the 25 physical delivery commodity futures contracts and options on futures, as well as to swaps that are economically equivalent to such contracts and futures and options thereon that are directly or indirectly linked to the price of such contracts or to the same commodity underlying such contracts (e.g., cash-settled look-a-like futures).
51
Exchanges may establish accountability levels applicable to futures contracts instead of position limits. An accountability level is not a strict limit, but when a person holds or controls a position in excess of a position accountability level, the relevant exchange may convert the accountability level to a limit based on information that it collects from the person as to the person’s investment intentions and strategy as part of the position accountability process and market conditions. In addition, the relevant exchange may order a person who holds or controls a position in excess of a position accountability level not to further increase its position, to comply with any prospective limit that exceeds the size of the position owned or controlled, or to reduce any open position that exceeds the position accountability level if the exchange determines that such action is necessary to maintain an orderly market. Position
51
accountability levels could adversely affect each of the Fund’s ability to establish and maintain positions in commodity futures contracts to which such levels apply, if the Funds were to trade in such contracts. Such an outcome could adversely affect each of the Fund’s ability to pursue its investment objective.
Currently, the Sponsor and the Funds are subject to position limits and accountability levels established by the CFTC and exchanges. Accordingly, the Sponsor and the Funds may be required to reduce the size of outstanding positions or be restricted from entering into new positions that would otherwise be taken for the Fund or not trade in certain markets on behalf of the Fund in order to comply with those limits or any future limits established by the CFTC and the relevant exchanges. These restrictions, if implemented, could limit the ability of each Fund to invest in additional futures contracts, add to existing positions in the desired amount, or create additional Creation Units and could otherwise have a significant negative impact on Fund operations.
In May and June 2020, the Sponsor engaged in discussions with the CME regarding position limits in September 2020 WTI oil futures contracts with respect to the Oil Funds. Any limitation on positions for particular oil futures contracts could limit the Oil Funds’ ability to increase their oil futures contracts to the extent needed to achieve their respective investment objectives and may force the Funds to seek to obtain exposure to economically similar contracts through alternative instruments, if available. This could have a negative impact on the Oil Funds due to potentially increased costs of trading in alternative instruments or the inability to obtain the desired exposure. In May 2020, in response to a notice directing the Oil Funds to not exceed a designated position accountability level in the September 2020 WTI crude oil futures contracts, and to help manage the impact of unprecedented price volatility in the markets for crude oil and crude oil futures contracts and related Financial Instruments, and other market conditions, each Oil Fund repositioned its portfolio in early May to have approximately 2/3 of its portfolio exposed to the September 2020 WTI crude oil futures contract and approximately 1/3 of its portfolio exposed to the December 2020 crude oil futures contract. In July 2020, in anticipation of the Prior Oil Benchmark’s upcoming roll, and in order to help manage the impact of recent extraordinary conditions and volatility in the markets for crude oil and related Financial Instruments, each Oil Fund repositioned its portfolio in early July to have approximately 1/3 of its portfolio exposed to the October 2020 WTI crude oil futures contract, approximately 1/3 of its portfolio exposed to the November 2020 WTI crude oil futures contract, and approximately 1/3 of its portfolio exposed to the December 2020 crude oil futures contract. In August 2020, in anticipation of the Prior Oil Benchmark’s upcoming roll, and in order to help manage the impact of recent extraordinary conditions and volatility in the markets for crude oil and related Financial Instruments, each Oil Fund repositioned its portfolio in early August to have approximately 2/3 of its portfolio exposed to the December 2020 WTI crude oil futures contract, and approximately 1/3 of its portfolio exposed to the June 2021 crude oil futures contract. To the extent an Oil Fund has exposure to a WTI crude oil futures contract not included in its benchmark, the performance of such Oil Fund should not be expected to correspond to two times (2x), or two times the inverse (-2x), as applicable, of the daily performance of its benchmark, and such Fund’s performance could differ significantly from its stated investment objective. Further, when an Oil Fund is exposed to longer-dated futures contracts, the performance of the Fund should be expected to deviate to a greater extent from the “spot” price of WTI crude oil than if the Fund had exposure to a shorter-dated futures contract.
In addition, the Sponsor may be required to liquidate certain open positions in order to ensure compliance with the speculative position limits at unfavorable prices, which may result in substantial losses for the relevant Funds. There also can be no assurance that the Sponsor will liquidate positions held on behalf of all the Sponsor’s accounts, including any proprietary accounts, in a proportionate manner. In the event the Sponsor chooses to liquidate a disproportionate number of positions held on behalf of any of the Funds at unfavorable prices, such Funds may incur substantial losses and the value of the Shares may be adversely affected.
A person is generally required by CFTC or exchange rules, as applicable, to aggregate all positions in accounts as to which the person has 10% or greater ownership or control. However, CFTC and exchange rules provide certain exemptions from this requirement. For example, a person is not required to aggregate positions in multiple accounts that it owns or controls if that person is able to satisfy the requirements of an exemption from aggregation of those accounts, including, where available, the independent account controller exemption. Any failure to comply with the independent account controller exemption or another exemption from the aggregation requirement could obligate the Sponsor to aggregate positions in multiple accounts under its control, which could include the Funds and other commodity pools or accounts under the Sponsor’s control. In such a scenario, the Funds may not be able to obtain exposure to one or more Financial Instruments necessary to pursue their investment objectives, or they may be required to liquidate existing futures contract positions in order to comply with a limit. Such an outcome could adversely affect each of the Fund’s ability to pursue its investment objective or achieve favorable performance.
52
The Funds are currently subject to position limits and accountability levels and may be subject to new or more restrictive position limits or accountability levels in the future. If the Funds reached a position limit or accountability level or became subject to a daily limit, their ability to issue new Creation Units or reinvest income in additional commodity futures contracts may be limited to the extent these restrictions limit its ability to establish new futures positions, add to existing positions, or otherwise transact in futures. Limiting the size of the Funds, or restricting the Funds’ futures trading, under these requirements could adversely affect the Funds’ ability to pursue its investment objective.
52
The Trust or Sponsor may apply to the CFTC or to the relevant exchanges for relief from certain position limits. If the Trust or Sponsor is unable to obtain such relief, a Fund’s ability to issue new Creation Units, or the Fund’s ability to reinvest income in additional futures contracts, may be limited to the extent these activities cause the Trust to exceed applicable position limits. Limiting the size of a Fund may affect the correlation between the price of the Shares, as traded on an exchange, and the net asset value of the Fund. Accordingly, the inability to create additional Creation Units or add to existing positions in the desired amount could result in Shares trading at a premium or discount to NAV.
Margin for Non-cleared Swap and Forward Transactions
In 2015, the regulators adopted, and in 2016 the CFTC adopted new mandatory margin requirements for non-cleared swap and foreign currency forward transactions and new requirements for the holding of collateral by derivative dealers. These requirements, which are still pending final adoption, may increase the amount of collateral a Fund is required to provide to derivative dealers for non-cleared swaps and foreign currency forwards.
Regulatory changes or actions may alter the operations and profitability of the Funds.
The regulation of commodity interest transactions and markets, including under the Dodd-Frank Act, is a rapidly changing area of law and is subject to ongoing modification by governmental and judicial action. In particular, the Dodd-Frank Act has expanded the regulation of markets, market participants and financial instruments. The regulatory regime under the Dodd-Frank Act has imposed additional compliance and legal burdens on participants in the markets for futures and other commodity interests. For example, under the Dodd-Frank Act new capital and risk requirements have been imposed on market intermediaries. Those requirements may cause the cost of trading to increase for market participants, like the Funds, that must interact with those intermediaries to carry out their trading activities. These increased costs can detract from the Funds’ performance.
A Fund’s performance could be adversely affected if the FCM reduces its internal risk limits for the Fund.
Further, CFTC rules require clearing member FCMs to establish risk-based limits on position and order size. As a result, the Trust’s FCMs may be required to reduce their internal limits on the size of the positions they will execute or clear for the Funds, and the Funds’ ability to transact in futures contracts could be reduced. Under these circumstances, the Trust may seek to use additional FCMs, which may increase the costs for the Funds, make the Funds’ trading less efficient or more prone to error, or adversely affect the value of the Shares.
The Funds and the Sponsor are subject to extensive legal and regulatory requirements.
The Funds are subject to a comprehensive scheme of regulation under the federal commodity futures trading and securities laws, as well as futures exchange rules and the rules and listing standards for their Shares. Each of the Funds and the Sponsor could each be subject to sanctions for a failure to comply with those requirements, which could adversely affect the Funds’ financial performance and their ability to pursue their investment objectives. In addition, the SEC, CFTC, and exchanges are empowered to intervene in their respective markets in response to extreme market conditions. Those interventions could adversely affect the Funds’ ability to pursue their investment objectives and could lead to losses for the Funds and their shareholders.
In addition, each of the Funds is subject to significant disclosure, internal control, governance, and financial reporting requirements because the Shares are publicly traded.
For example, the Funds are responsible for establishing and maintaining internal controls over financial reporting. Under this requirement, the Funds must adopt, implement and maintain an internal control system designed to provide reasonable assurance to its management regarding the preparation and fair presentation of published financial statements. The Funds are also required to adopt, implement, and maintain disclosure controls and procedures that are designed to ensure information required to be disclosed by the Funds in reports that they file or submit to the SEC is recorded, processed, summarized and reported within the time periods specified by the SEC. There is a risk that the Funds’ internal controls over financial reporting and disclosure controls and procedures could fail
53
to operate as designed or otherwise fail to satisfy SEC requirements. Such a failure could result in the reporting or disclosure of incorrect information or a failure to report information on a timely basis. Such a failure could be to the disadvantage of shareholders and could expose the Funds to penalties or otherwise adversely affect each of the Fund’s status under the federal securities laws and SEC regulations. Any internal control system, no matter how well designed, has inherent limitations. Therefore, even those systems determined to be effective may provide only reasonable assurance with respect to financial statement preparation and presentation and other disclosure matters.
Item 1B. Unresolved Staff Comments.
None.
Item 1C. Cybersecurity.
53Risk Management and Strategy
Cyber-attacks and threats are considered one of the most significant risks facing the Funds. The Funds’ cybersecurity is managed through the Sponsor. The Sponsor maintains an enterprise-wide cybersecurity management program designed to assess, identify and manage material risks from cybersecurity threats. The cybersecurity management program is based on the NIST Cybersecurity Framework, an internationally recognized framework, and is integrated into the Sponsor’s enterprise risk management system. As part of the Sponsor’s cybersecurity strategy, the Sponsor also maintains an enterprise-wide Information Security Policy as well as a Security Incident Response Plan that sets forth an enterprise-wide framework and guidelines to facilitate an effective response to and handling of cybersecurity incidents. The Sponsor’s cybersecurity management program includes business continuity plans and systems applicable to the Funds.
The cybersecurity management program is led by the Sponsor’s Cyber Security Task Force, composed of the Chief Technology Officer; Director, Information Technology; General Counsel; Chief Compliance Officer; Chief Financial Officer; Senior Manager, Risk and Audit; and other key individuals. The Cyber Security Task Force meets regularly to assess the cybersecurity management program, including the enterprise-wide strategy, policies, standards and processes.
With the ever-evolving cybersecurity risk environment, the Sponsor engages both internal and external specialists in its cybersecurity efforts. Internal and independent third-party assessors periodically conduct enterprise-wide risk assessments on a wide spectrum of risks facing the Trust, the Sponsor and the Funds, including penetration assessments and phishing attacks. Following these risk assessments, the Cyber Security Task Force re-designs, enhances and implements reasonable controls to mitigate any identified risks. Additionally, the Sponsor engages a third-party consultant and service provider to assist with managed IT services and advise on the Sponsor’s IT infrastructure and system as well as cybersecurity awareness, prevention and best practices.
As part of the Sponsor’s overall enterprise-wide cybersecurity strategy, the Sponsor’s employees complete annual cybersecurity awareness training, which includes training on the Sponsor’s Information Security Policy and Security Incident Response Plan.
The Sponsor’s cybersecurity risk management extends to its vendors. Each vendor is subject to a comprehensive cybersecurity risk assessment conducted at the vendor’s initial engagement with the Sponsor and ongoing monitoring through the term of its engagement with the Sponsor.
Governance
The Sponsor has a dedicated team under the supervision of the Chief Technology Officer that is responsible for the day-to-day management of the Sponsor’s technology infrastructure. The Chief Technology Officer is responsible for providing strategic direction and, with the support of the Cyber Security Task Force and senior management, is also responsible for the assessment and management of all cybersecurity risks and threats, as well as the prevention, detection, mitigation and remediation of cybersecurity incidents. The Chief Technology Officer has more than 20 years of experience working in information technology-related roles within the financial services industry, a bachelor’s degree in electronics and communications and a master’s degree in computer science.
The Cyber Security Task Force has oversight of the Sponsor’s cybersecurity risks, threats and incidents and is informed of such risks, threats and incidents through the Chief Technology Officer. The Cyber Security Task Force escalates any significant cybersecurity developments or incidents, even if not material to the Sponsor, to the Sponsor’s Core Business Services committee at its regularly scheduled meetings, the Sponsor’s full Management Team, or directly to the Chief Executive Officer, depending on the cybersecurity matter.
Although the Funds have experienced cybersecurity incidents in the past, to date, the risks from cybersecurity threats, including as a result of any previous cybersecurity incidents, have not materially affected their operations, financial condition or investment objectives. See “Risk Factors” in Part I, Item 1A on this Annual Report for a discussion of the risks related to cybersecurity.
Item 2. Properties.
Not applicable.
Item 3. Legal Proceedings.
The Sponsor and the Trust were named as defendants in the following purported class action lawsuits filed in the United States District Court for the Southern District of New York on the following dates: (i) on January 29, 2019 and captioned Ford v. ProShares Trust II et al.; (ii) on February 27, 2019 and captioned Bittner v. ProShares Trust II, et al.; and (iii) on March 1, 2019 and captioned Mareno v. ProShares Trust II, et al. The allegations in the complaints were substantially the same, namely that the defendants violated Sections 11 and 15 of the 1933 Act, Sections 10(b) and 20(a) and Rule 10b-5 of the 1934 Act, and Items 303 and 105 of Regulation S-K, 17 C.F.R. Section 229.303(a)(3)(ii), 229.105 by issuing untrue statements of material fact and omitting material facts in the prospectus for ProShares Short VIX Short-Term Futures ETF, and allegedly failing to state other facts necessary to make the statements made not misleading. Certain Principals of the Sponsor and Officers of the Trust were also defendants in the actions, along with a number of others. The Court consolidated the three actions under the caption In re ProShares Trust II Securities Litigation and appointed lead plaintiffs and lead counsel. On January 3, 2020, the Court granted defendants’ motion to dismiss the consolidated class action in its entirety and ordered the case closed. On January 31, 2020, the plaintiffs filed a notice of appeal to the Second Circuit Court of Appeals. On March 4, 2021, the Second Circuit Court of Appeals heard oral argument. On March 15, 2021, the Second Circuit Court of Appeals found the plaintiffs’ arguments to be without merit and affirmed the District Court’s judgment. No further appeals are pending, and this matter is now closed.
On July 28, 2020, the Sponsor, the Trust, and ProShares Ultra Bloomberg Crude Oil (“UCO”), a series of the Trust, were named as defendants in a purported class action lawsuit filed in the United States District Court for the Southern District of New York, captioned Di Scala v. ProShares Ultra Bloomberg Crude Oil, et al. The allegations in the complaint claim that the defendants violated Sections 10(b) and 20(a) and Rule 10b-5 of the 1934 Act as well as Items 303 and 105 of Regulation S-K, 17 C.F.R. §§ 229.303(a)(ii), 229.105, by issuing untrue statements of material fact and omitting material facts in the prospectus disclosures for ProShares Ultra Bloomberg Crude Oil, and allegedly failing to state other facts necessary to make the statements made not misleading. Certain Principals of the Sponsor and Officers of the Trust were also defendants in the action. After the Court appointed a lead plaintiff and lead counsel and entered a scheduling order for filing an amended complaint and motion to dismiss briefing, the lead plaintiff decided to voluntarily dismiss the lawsuit. On February 22, 2021, the parties filed a stipulation of voluntary dismissal, and the case was closed. The parties have not exchanged monetary consideration and each party will bear its own costs and attorneys’ fees.Not applicable.
Item 4. Mine Safety Disclosures.
Not applicable.
54
Part II.
Item 5. Market for Registrant’s Common Equity, Related Stockholder Matters and Issuer Purchases of Equity Securities.
| a) | The Shares of each Fund that has commenced investment operations are listed in the accompanying table. The dates the Shares of each Fund began trading, their symbols and their primary listing exchange are indicated below: |
Fund | Commencement of | Ticker | Name of each | |||
| ProShares Short VIX Short-Term Futures ETF | October 3, 2011 | SVXY | Cboe BZX Exchange | |||
| ProShares Ultra Bloomberg Crude Oil | November 25, 2008 | UCO | NYSE Arca | |||
| ProShares Ultra Bloomberg Natural Gas | October 4, 2011 | BOIL | NYSE Arca | |||
| ProShares Ultra Euro | November 25, 2008 | ULE | NYSE Arca | |||
| ProShares Ultra Gold | December 3, 2008 | UGL | NYSE Arca | |||
| ProShares Ultra Silver | December 3, 2008 | AGQ | NYSE Arca | |||
| ProShares Ultra VIX Short-Term Futures ETF | October 3, 2011 | UVXY | Cboe BZX Exchange | |||
| ProShares Ultra Yen | November 25, 2008 | YCL | NYSE Arca | |||
| ProShares UltraShort Bloomberg Crude Oil | November 25, 2008 | SCO | NYSE Arca | |||
| ProShares UltraShort Bloomberg Natural Gas | October 4, 2011 | KOLD | NYSE Arca | |||
| ProShares UltraShort Euro | November 25, 2008 | EUO | NYSE Arca | |||
| ProShares UltraShort Gold | December 3, 2008 | GLL | NYSE Arca | |||
| ProShares UltraShort Silver | December 3, 2008 | ZSL | NYSE Arca | |||
| ProShares UltraShort Yen | November 25, 2008 | YCS | NYSE Arca | |||
| ProShares VIX Mid-Term Futures ETF | January 3, 2011 | VIXM | Cboe BZX Exchange | |||
| ProShares VIX Short-Term Futures ETF | January 3, 2011 | VIXY | Cboe BZX Exchange |
The approximate number of holders of the Shares of each Fund as of December 31, 20222023 was as follows:
Fund | Number of Holders | ||||||
ProShares Short VIX Short-Term Futures ETF | |||||||
ProShares Ultra Bloomberg Crude Oil | |||||||
ProShares Ultra Bloomberg Natural Gas | |||||||
ProShares Ultra Euro | |||||||
ProShares Ultra Gold | |||||||
ProShares Ultra Silver | |||||||
ProShares Ultra VIX Short-Term Futures ETF | |||||||
ProShares Ultra Yen | |||||||
ProShares UltraShort Bloomberg Crude Oil | |||||||
ProShares UltraShort Bloomberg Natural Gas | |||||||
ProShares UltraShort Euro | |||||||
ProShares UltraShort Gold | |||||||
ProShares UltraShort Silver | |||||||
ProShares UltraShort Yen | |||||||
ProShares VIX Mid-Term Futures ETF | |||||||
ProShares VIX Short-Term Futures ETF | |||||||
|
| ||||||
Combined Trust: | |||||||
|
| ||||||
The Funds made no distributions to Shareholders during the fiscal year ended December 31, 2022.2023. The Funds have no obligation to make periodic distributions to Shareholders.
55
| b) | Not applicable |
| c) | The Trust does not purchase shares directly from its shareholders. The following table summarizes the redemptions by Authorized Participants during the three months ended December 31, |
Title of Securities Registered* | Total Number of Shares Redeemed | Average Price Per Share | ||||||
ProShares Short VIX Short-Term Futures ETF | ||||||||
Common Units of Beneficial Interest | ||||||||
10/01/22 to 10/31/22 | 200,000 | $ | 48.98 | |||||
11/01/22 to 11/30/22 | — | $ | — | |||||
12/01/22 to 12/31/22 | 2,750,000 | $ | 57.66 | |||||
ProShares Ultra Bloomberg Crude Oil | ||||||||
Common Units of Beneficial Interest | ||||||||
10/01/22 to 10/31/22 | 2,850,000 | $ | 31.26 | |||||
11/01/22 to 11/30/22 | 2,550,000 | $ | 32.50 | |||||
12/01/22 to 12/31/22 | 4,850,000 | $ | 28.96 | |||||
ProShares Ultra Bloomberg Natural Gas | ||||||||
Common Units of Beneficial Interest | ||||||||
10/01/22 to 10/31/22 | 2,400,000 | $ | 44.79 | |||||
11/01/22 to 11/30/22 | 10,000,000 | $ | 45.11 | |||||
12/01/22 to 12/31/22 | 9,000,000 | $ | 34.47 | |||||
ProShares Ultra Euro | ||||||||
Common Units of Beneficial Interest | ||||||||
10/01/22 to 10/31/22 | 50,000 | $ | 9.55 | |||||
11/01/22 to 11/30/22 | 200,000 | $ | 10.54 | |||||
12/01/22 to 12/31/22 | 550,000 | $ | 11.08 | |||||
ProShares Ultra Gold | ||||||||
Common Units of Beneficial Interest | ||||||||
10/01/22 to 10/31/22 | 100,000 | $ | 47.66 | |||||
11/01/22 to 11/30/22 | 100,000 | $ | 47.96 | |||||
12/01/22 to 12/31/22 | 150,000 | $ | 54.15 | |||||
ProShares Ultra Silver | ||||||||
Common Units of Beneficial Interest | ||||||||
10/01/22 to 10/31/22 | 800,000 | $ | 21.05 | |||||
11/01/22 to 11/30/22 | 1,700,000 | $ | 24.62 | |||||
12/01/22 to 12/31/22 | 2,100,000 | $ | 30.78 | |||||
ProShares Ultra VIX Short-Term Futures ETF | ||||||||
Common Units of Beneficial Interest | ||||||||
10/01/22 to 10/31/22 | 11,000,000 | $ | 12.56 | |||||
11/01/22 to 11/30/22 | 1,100,000 | $ | 10.20 | |||||
12/01/22 to 12/31/22 | 11,400,000 | $ | 7.32 | |||||
ProShares Ultra Yen | ||||||||
Common Units of Beneficial Interest | ||||||||
10/01/22 to 10/31/22 | 50,000 | $ | 27.35 | |||||
11/01/22 to 11/30/22 | 50,000 | $ | 32.09 | |||||
12/01/22 to 12/31/22 | — | $ | — | |||||
ProShares UltraShort Bloomberg Crude Oil | ||||||||
Common Units of Beneficial Interest | ||||||||
10/01/22 to 10/31/22 | 2,800,000 | $ | 25.73 | |||||
11/01/22 to 11/30/22 | 3,550,000 | $ | 24.77 | |||||
12/01/22 to 12/31/22 | 2,500,000 | $ | 27.64 | |||||
ProShares UltraShort Bloomberg Natural Gas | ||||||||
Common Units of Beneficial Interest | ||||||||
10/01/22 to 10/31/22 | 8,450,000 | $ | 20.94 | |||||
11/01/22 to 11/30/22 | 30,250,000 | $ | 15.91 | |||||
12/01/22 to 12/31/22 | 22,600,000 | $ | 18.97 | |||||
ProShares UltraShort Euro | ||||||||
Common Units of Beneficial Interest | ||||||||
10/01/22 to 10/31/22 | 150,000 | $ | 34.43 | |||||
11/01/22 to 11/30/22 | 300,000 | $ | 31.99 | |||||
12/01/22 to 12/31/22 | 150,000 | $ | 30.01 | |||||
Title of Securities Registered* | Total Number of Shares Redeemed | Average Price Per Share | ||||||
ProShares Short VIX Short-Term Futures ETF | ||||||||
Common Units of Beneficial Interest | ||||||||
10/01/23 to 10/31/23 | 50,000 | $ | 80.00 | |||||
11/01/23 to 11/30/23 | 150,000 | $ | 90.03 | |||||
12/01/23 to 12/31/23 | 700,000 | $ | 100.36 | |||||
ProShares Ultra Bloomberg Crude Oil | ||||||||
Common Units of Beneficial Interest | ||||||||
10/01/23 to 10/31/23 | 1,500,000 | $ | 33.40 | |||||
11/01/23 to 11/30/23 | 1,150,000 | $ | 30.22 | |||||
12/01/23 to 12/31/23 | 2,050,000 | $ | 27.80 | |||||
ProShares Ultra Bloomberg Natural Gas | ||||||||
Common Units of Beneficial Interest | ||||||||
10/01/23 to 10/31/23 | 7,700,000 | $ | 64.91 | |||||
11/01/23 to 11/30/23 | 300,000 | $ | 47.82 | |||||
12/01/23 to 12/31/23 | 5,450,000 | $ | 27.50 | |||||
ProShares Ultra Euro | ||||||||
Common Units of Beneficial Interest | ||||||||
10/01/23 to 10/31/23 | 50,000 | $ | 10.87 | |||||
11/01/23 to 11/30/23 | 50,000 | $ | 11.53 | |||||
12/01/23 to 12/31/23 | – | $ | – | |||||
ProShares Ultra Gold | ||||||||
Common Units of Beneficial Interest | ||||||||
10/01/23 to 10/31/23 | 50,000 | $ | 56.66 | |||||
11/01/23 to 11/30/23 | 150,000 | $ | 59.53 | |||||
12/01/23 to 12/31/23 | 100,000 | $ | 59.04 | |||||
ProShares Ultra Silver | ||||||||
Common Units of Beneficial Interest | ||||||||
10/01/23 to 10/31/23 | 450,000 | $ | 25.93 | |||||
11/01/23 to 11/30/23 | 650,000 | $ | 26.44 | |||||
12/01/23 to 12/31/23 | 850,000 | $ | 27.52 | |||||
ProShares Ultra VIX Short-Term Futures ETF | ||||||||
Common Units of Beneficial Interest | ||||||||
10/01/23 to 10/31/23 | 2,200,000 | $ | 18.05 | |||||
11/01/23 to 11/30/23 | 950,000 | $ | 11.93 | |||||
12/01/23 to 12/31/23 | 1,100,000 | $ | 8.42 | |||||
ProShares Ultra Yen | ||||||||
Common Units of Beneficial Interest | ||||||||
10/01/23 to 10/31/23 | — | $ | — | |||||
11/01/23 to 11/30/23 | 50,000 | $ | 24.65 | |||||
12/01/23 to 12/31/23 | 50,000 | $ | 27.46 | |||||
ProShares UltraShort Bloomberg Crude Oil | ||||||||
Common Units of Beneficial Interest | ||||||||
10/01/23 to 10/31/23 | 6,800,000 | $ | 17.90 | |||||
11/01/23 to 11/30/23 | 3,150,000 | $ | 19.31 | |||||
12/01/23 to 12/31/23 | 2,450,000 | $ | 20.99 | |||||
ProShares UltraShort Bloomberg Natural Gas | ||||||||
Common Units of Beneficial Interest | ||||||||
10/01/23 to 10/31/23 | 3,100,000 | $ | 50.54 | |||||
11/01/23 to 11/30/23 | 3,200,000 | $ | 58.91 | |||||
12/01/23 to 12/31/23 | 1,000,000 | $ | 101.71 | |||||
56
ProShares UltraShort Gold | ||||||||
Common Units of Beneficial Interest | ||||||||
10/01/22 to 10/31/22 | 200,000 | $ | 37.35 | |||||
11/01/22 to 11/30/22 | 200,000 | $ | 32.94 | |||||
12/01/22 to 12/31/22 | — | $ | — | |||||
ProShares UltraShort Silver | ||||||||
Common Units of Beneficial Interest | ||||||||
10/01/22 to 10/31/22 | 500,000 | $ | 30.79 | |||||
11/01/22 to 11/30/22 | 150,000 | $ | 25.20 | |||||
12/01/22 to 12/31/22 | 100,000 | $ | 20.99 | |||||
ProShares UltraShort Yen | ||||||||
Common Units of Beneficial Interest | ||||||||
10/01/22 to 10/31/22 | 50,000 | $ | 64.97 | |||||
11/01/22 to 11/30/22 | 150,000 | $ | 60.25 | |||||
12/01/22 to 12/31/22 | 400,000 | $ | 55.62 | |||||
ProShares VIX Mid-Term Futures ETF | ||||||||
Common Units of Beneficial Interest | ||||||||
10/01/22 to 10/31/22 | 750,000 | $ | 35.38 | |||||
11/01/22 to 11/30/22 | — | $ | — | |||||
12/01/22 to 12/31/22 | 25,000 | $ | 30.63 | |||||
ProShares VIX Short-Term Futures ETF | ||||||||
Common Units of Beneficial Interest | ||||||||
10/01/22 to 10/31/22 | 4,375,000 | $ | 16.74 | |||||
11/01/22 to 11/30/22 | — | $ | — | |||||
12/01/22 to 12/31/22 | 2,425,000 | $ | 11.61 |
ProShares UltraShort Euro | ||||||||
Common Units of Beneficial Interest | ||||||||
10/01/23 to 10/31/23 | — | $ | — | |||||
11/01/23 to 11/30/23 | 50,000 | $ | 31.59 | |||||
12/01/23 to 12/31/23 | 200,000 | $ | 30.40 | |||||
ProShares UltraShort Gold | ||||||||
Common Units of Beneficial Interest | ||||||||
10/01/23 to 10/31/23 | 50,000 | $ | 31.82 | |||||
11/01/23 to 11/30/23 | — | $ | — | |||||
12/01/23 to 12/31/23 | 50,000 | $ | 27.50 | |||||
ProShares UltraShort Silver | ||||||||
Common Units of Beneficial Interest | ||||||||
10/01/23 to 10/31/23 | 350,000 | $ | 22.97 | |||||
11/01/23 to 11/30/23 | 250,000 | $ | 18.97 | |||||
12/01/23 to 12/31/23 | 2,400,000 | $ | 18.79 | |||||
ProShares UltraShort Yen | ||||||||
Common Units of Beneficial Interest | ||||||||
10/01/23 to 10/31/23 | — | $ | — | |||||
11/01/23 to 11/30/23 | — | $ | — | |||||
12/01/23 to 12/31/23 | 100,000 | $ | 70.71 | |||||
ProShares VIX Mid-Term Futures ETF | ||||||||
Common Units of Beneficial Interest | ||||||||
10/01/23 to 10/31/23 | 425,000 | $ | 19.87 | |||||
11/01/23 to 11/30/23 | 650,000 | $ | 18.72 | |||||
12/01/23 to 12/31/23 | — | $ | — | |||||
ProShares VIX Short-Term Futures ETF | ||||||||
Common Units of Beneficial Interest | ||||||||
10/01/23 to 10/31/23 | 1,475,000 | $ | 25.24 | |||||
11/01/23 to 11/30/23 | 1,200,000 | $ | 19.63 | |||||
12/01/23 to 12/31/23 | 275,000 | $ | 15.48 |
* The registration statement covers an indeterminate amount of securities to be offered or sold. |
57
Item 6. [Reserved]
Item 7. Management’s Discussion and Analysis of Financial Condition and Results of Operations.
This information should be read in conjunction with the financial statements and notes to the financial statements included with this Annual Report on Form 10-K. The discussion and analysis that follows may contain statements that relate to future events or future performance. In some cases, such forward-looking statements can be identified by terminology such as “will,” “may,” “should,” “expect,” “plan,” “anticipate,” “believe,” “estimate,” “predict,” “potential,” “intend,” “project,” “seek” or the negative of these terms or other comparable terminology. None of the Trust, the Sponsor, the Trustee, or the Administrator assumes responsibility for the accuracy or completeness of any forward-looking statements. Except as expressly required by federal securities laws, none of the Trust, the Sponsor, the Trustee, or the Administrator is under a duty to update any of the forward-looking statements to conform such statements to actual results or to a change in expectations or predictions.
Because forward-looking statements relate to the future, they are subject to inherent uncertainties, risk and changes in circumstances that are difficult to predict and many of which are outside of the Funds’ control. The Funds’ forward-looking statements are not guarantees of future results and conditions and important factors, risks and uncertainties in the markets for financial instruments that the Funds trade, in the markets for related physical commodities, in the legal and regulatory regimes applicable to the Sponsor, the Funds, and the Funds’ service providers, and in the broader economy may cause the Funds’ actual results to differ materially from those expressed in forward-looking statements.
Introduction
Each of the Funds generally invests in Financial Instruments (i.e., instruments whose value is derived from the value of an underlying asset, rate or index)index (Collectively, “Financial Instruments”), including futures contracts, swap agreements, forward contracts and other instruments as a substitute for investing directly in commodities, currencies, or spot volatility products in order to gain exposure to its applicable underlying commodity futures index, commodity, currency exchange rate or equity volatility index. Financial Instruments also are used to produce economically “inverse,” “inverse leveraged” or “leveraged” investment results for the Geared Funds.
As further described in Item 1 in this Annual Report on Form 10-K, eachThe “Short” Fund seeks daily investment results, before fees and expenses, that correspond to either one-half the inverse (-0.5x) of the daily performance of its corresponding benchmark. Each “UltraShort” Fund seeks daily investment results, before fees and expenses, that correspond to two times the inverse (-2x) of the daily performance of its corresponding benchmark. Each “Ultra” Fund seeks daily investment results, before fees and expenses, that correspond to either one and one-half times (1.5x) or two times (2x) the daily performance of its corresponding benchmark. Each Matching VIX Fund seeks investment results, before fees and expenses, both overfor a single day and over time, that match (1x) the performance of its corresponding benchmark. Daily performance is measured from the calculation of each Fund’s net asset value (“NAV”) to the Fund’s next NAV calculation.
58
Each Geared Fund seeks investment results for a single day only, not for any other period. This is different from most exchange-traded funds and means that the return of such Fund for a period longer than a single trading day will be the result of each day’s returns compounded over the period, which will very likely differ in amount and possibly even direction from -0.5x, -2x, 1.5x, or 2x, of the return of the benchmark to which such Fund is benchmarked for that period. Volatility of the benchmark may be at least as important to a Geared Fund’s return for the period as the return of the benchmark. Geared Funds that use leverage, are riskier than similarly benchmarked exchange-traded funds that do not use leverage. Accordingly, these Funds may not be suitable for all investors and should be used only by knowledgeable investors who understand the potential consequences of seeking daily leveraged, inverse or inverse leveraged investment results. Shareholders who invest in the Geared Funds should actively manage and monitor their investments, as frequently as daily.
Each Matching VIX Fund seeks investment results, before fees and expenses, that match the performance of the S&P 500 VIX Short-Term Futures Index (the “Short-Term VIX Index”) or the S&P 500 VIX Mid-Term Futures Index (the “Mid-Term VIX Index”) (each a “VIX Futures Index”). Each Geared VIX Fund seeks daily investment results, before fees and expenses, that correspond to a multiple or the inverse of the daily performance of the Short-Term VIX Index. Each VIX Fund intends to obtain exposure to its benchmark by taking positions in futures contracts (“VIX futures contracts”) based on the Chicago Board Options Exchange (“Cboe”) Volatility Index (the “VIX”).
ProShares UltraShort Bloomberg Crude Oil, ProShares Ultra Gold, ProShares Ultra Silver, ProShares UltraShort Gold, ProShares UltraShort Silver, ProShares UltraShort Bloomberg Natural Gas, ProShares Ultra Bloomberg Crude Oil, and ProShares Ultra Bloomberg Natural Gas are benchmarked to indexes designed to track the performance of commodity futures contracts, as applicable. The daily performance of these Indexes and the corresponding Funds will likely be very different in amount and possibly even direction from the daily performance of the price of the related physical commodities.
5958
Each Geared Fund continuously offers and redeems its Shares in blocks of 50,000 Shares and each Matching VIX Fund continuously offers and redeems its Shares in blocks of 25,000 Shares (each such block a “Creation Unit”). Only Authorized Participants may purchase and redeem Shares from a Fund and then only in Creation Units. An Authorized Participant is an entity that has entered into an Authorized Participant Agreement with one or more of the Funds. Shares of the Funds are offered to Authorized Participants in Creation Units at each Fund’s respective NAV. Authorized Participants may then offer to the public, from time to time, Shares from any Creation Unit they create at a per-Share market price that varies depending on, among other factors, the trading price of the Shares of each Fund on its applicable listing exchange, the NAV and the supply of and demand for the Shares at the time of the offer. Shares from the same Creation Unit may be offered at different times and may have different offering prices based upon the above factors. The form of Authorized Participant Agreement and related Authorized Participant Handbook set forth the terms and conditions under which an Authorized Participant may purchase or redeem a Creation Unit. Authorized Participants do not receive from any Fund, the Sponsor, or any of their affiliates, any underwriting fees or compensation in connection with their sale of Shares to the public.
The Sponsor maintains a website at www.ProShares.com, through which monthly account statements and the Trust’s Annual Report on Form 10-K, Quarterly Reports on Form 10-Q, Current Reports on Form 8-K and amendments to those reports filed or furnished pursuant to Section 13(a) or 15(d) of the Securities Exchange Act of 1934, as amended (the “1934 Act”), can be accessed free of charge, as soon as reasonably practicable after such material is electronically filed with, or furnished to, the U.S. Securities and Exchange Commission (the “SEC”). Additional information regarding the Trust may also be found on the SEC’s EDGAR database at www.sec.gov.
Liquidity and Capital Resources
In order to collateralize derivatives positions in indices, commodities or currencies, a portion of the NAV of each Fund is held in cash and/or U.S. Treasury securities, agency securities, or other high credit quality short term fixed-income or similar securities (such as shares of money market funds, bank deposits, bank money market accounts, certain variable rate-demand notes and repurchase agreements collateralized by government securities, whether denominated in U.S. dollars or the applicable foreign currency with respect to a Currency Fund). A portion of these investments may be posted as collateral in connection with swap agreements, futures, and/or forward contracts. The percentage that U.S. Treasury bills and other short-term fixed-income securities bear to the shareholders’ equity of each Fund varies from period to period as the market values of the underlying swaps, futures contracts and forward contracts change. During the years ended December 31, 20222023 and 2021,2022, each of the Funds earned interest income as follows:
60
Fund | Total Income Year Ended December 31, 2022 | Total Income Year Ended December 31, 2021 | Interest Income Year Ended December 31, 2023 | Interest Income Year Ended December 31, 2022 | ||||||||||||
ProShares Short Euro* | (41 | ) | 1,451 | $ | — | $ | (41 | ) | ||||||||
ProShares Short VIX Short-Term Futures ETF | 3,512,477 | $ | 101,467 | 10,251,068 | 3,512,477 | |||||||||||
ProShares Ultra Bloomberg Crude Oil | 8,777,690 | 488,829 | 22,579,489 | 8,777,690 | ||||||||||||
ProShares Ultra Bloomberg Natural Gas | 4,362,018 | 50,091 | 34,926,670 | 4,362,018 | ||||||||||||
ProShares Ultra Euro | 149,251 | 1,922 | 343,876 | 149,251 | ||||||||||||
ProShares Ultra Gold | 2,321,780 | 92,581 | 7,285,355 | 2,321,780 | ||||||||||||
ProShares Ultra Silver | 3,844,119 | 261,655 | 13,905,665 | 3,844,119 | ||||||||||||
ProShares Ultra VIX Short-Term Futures ETF | 8,744,418 | 249,487 | 15,951,926 | 8,744,418 | ||||||||||||
ProShares Ultra Yen | 120,631 | 1,187 | 667,026 | 120,631 | ||||||||||||
ProShares UltraShort Australian Dollar* | 139 | 1,414 | — | 139 | ||||||||||||
ProShares UltraShort Bloomberg Crude Oil | 4,116,166 | 51,207 | 8,581,404 | 4,116,166 | ||||||||||||
ProShares UltraShort Bloomberg Natural Gas | 2,635,445 | 44,855 | 5,542,278 | 2,635,445 | ||||||||||||
ProShares UltraShort Euro | 906,928 | 24,790 | 2,251,539 | 906,928 | ||||||||||||
ProShares UltraShort Gold | 215,724 | 13,048 | 582,222 | 215,724 | ||||||||||||
ProShares UltraShort Silver | 215,031 | 12,422 | 1,118,150 | 215,031 | ||||||||||||
ProShares UltraShort Yen | 496,989 | 12,708 | 1,052,461 | 496,989 | ||||||||||||
ProShares VIX Mid-Term Futures ETF | 860,134 | 41,362 | 2,412,485 | 860,134 | ||||||||||||
ProShares VIX Short-Term Futures ETF | 3,668,406 | 101,051 | 8,917,672 | 3,668,406 | ||||||||||||
| * | The operations include the activity of ProShares Short Euro ETF and ProShares UltraShort Australian Dollar ETF through May 12, 2022, the date of liquidation. |
59