5
New York | 13-4224248 | |
| (State or other jurisdiction of | (I.R.S. Employer | |
| incorporation or organization) | Identification No.) |
| Title of each class | Trading symbol(s) | Name of each exchange on which registered | ||
| N/A | N/A | N/A |
Large accelerated filer | Accelerated filer | Non-accelerated filer X | ||||||||
Smaller reporting company | Emerging growth company |
PART I
Item 1. Business.
(a)General Development of Business. Ceres Tactical Systematic L.P. (formerly, Tactical Diversified Futures Fund L.P.) (the “Partnership”) is a limited partnership organized under the partnership laws of the State of New York on December 3, 2002 to engage directly or indirectly, in the speculative trading of a diversified portfolio of commodity interests including futures, option, swap and forward contracts. The sectors traded include currencies, energy, grains, indices, U.S. and non-U.S. interest rates, livestock, metals and softs. The commodity interests that are traded by the Partnership directly or indirectly through its investment in the Funds (as defined below) are volatile and involve a high degree of market risk. The General Partner (as defined below) may also determine to invest up to all of the Partnership’s assets (directly or indirectly through its investment in the Funds) in United States (“U.S.”) Treasury bills and/or money market mutual funds, including money market mutual funds managed by Morgan Stanley or its affiliates.
A Registration Statement on Form S-1 relating to the public offering of 300,000 redeemable units of limited partnership interest (“Redeemable Units”) became effective March 27, 2003. Between March 27, 2003 (commencement of the offering period) and April 30, 2003, 36,616 Redeemable Units were publicly offered at $1,000 per Redeemable Unit. The proceeds of the initial public offering were held in an escrow account until April 30, 2003, at which time they were turned over to the Partnership for trading.
A second Registration Statement on Form S-1 relating to the public offering of 1,000,000 Redeemable Units (including the 300,000 Redeemable Units that had been previously registered) became effective on December 4, 2003. As of that date, 260,732.3028 Redeemable Units had been sold.
A third Registration Statement on Form S-1 relating to the public offering of 2,000,000 Redeemable Units (including the 1,000,000 Redeemable Units that had been previously registered) became effective on October 7, 2004. As of that date, 807,449.3782 Redeemable Units had been sold.
A fourth Registration Statement on Form S-1 relating to the public offering of 2,000,000 Redeemable Units previously registered became effective on June 30, 2005. As of that date, 1,027,701.7549 Redeemable Units had been sold. The public offering of Redeemable Units terminated on November 30, 2008. The Partnership currently privately and continuously offers Redeemable Units to qualified investors. There is no maximum number of Redeemable Units that may be sold by the Partnership.
Subscriptions of additional Redeemable Units and additional General Partner contributions and redemptions of Redeemable Units for the years ended December 31, 2023, 2022 2021 and 20202021 are reported in the Statements of Changes in Partners’ Capital under “Item 8. Financial Statements and Supplementary Data.”
Ceres Managed Futures LLC, a Delaware limited liability company, acts as the general partner (the “General Partner”) and commodity pool operator of the Partnership. During the periods covered by this report and prior to the Partnership’s redemption from the Funds (as defined below), the General Partner also acted as the trading manager (the “Trading Manager”) and/or general partner, as applicable, of ADG Master (as defined below), AE Capital Master (as defined below), Aquantum Master (as defined below), Cambridge Master (as defined below), FORT Contrarian Master (as defined below) and SECOR Master (as defined below). The General Partner is a wholly-owned subsidiary of Morgan Stanley Domestic Holdings, Inc.Capital Management LLC (“MSD Holdings”MSCM”). MSD HoldingsMSCM is ultimately owned by Morgan Stanley. Morgan Stanley is a publicly held company whose shares are listed on the New York Stock Exchange. Morgan Stanley is engaged in various financial services and other businesses.
During the years ended December 31, 2023, 2022 and 2021, and 2020, the Partnership’s/Funds’Partnership’s commodity broker was Morgan Stanley & Co. LLC (“MS&Co.”), a registered futures commission merchant. JPMorgan Chase Bank, N.A. (“JPMorgan”) was also a foreign exchange forward counterparty for certain Funds. During certain periods included in this report, the Partnership/Funds deposited a portion of their cash in non-trading bank accounts at JPMorgan.
As of December 31, 2022,2023, all trading decisions were made for the Partnership by DCM Systematic Advisors SA (“DCM”), Drury Capital, Inc. (“Drury”), Episteme Capital Partners (UK) LLP, Episteme Capital Partners (US) LLC, and Episteme Capital Partners (Cayman) LTD (collectively, “Episteme”), and Millburn Ridgefield Corporation (“Millburn”) (each an “Advisor” and, collectively, the “Advisors”), each of which is a registered commodity trading advisor. Effective December 31, 2022, the General Partner terminated ISAM Systematic Management (“ISAM SM”) as an Advisor to the Partnership. Effective October 31, 2021, the General Partner terminated FORT, L.P. (“FORT”) as an Advisor to the Partnership. Effective December 31, 2020, the General Partner terminated ADG Capital Management LLP (“ADG”) and Aquantum GmbH (Aquantum”) as Advisors to the Partnership. Effective June 30, 2019, the General Partner terminated SECOR Capital Advisors, LP (“SECOR”) as an Advisor to the Partnership. Effective April 3, 2019, the General Partner terminated AE Capital Pty Limited (“AE Capital”) as an Advisor to the Partnership. Effective October 1, 2018, the Partnership, the General Partner, The Cambridge Strategy (Asset Management) Limited (“Cambridge”) and Mesirow Financial International UK Limited (“Mesirow”) entered into a novation, assignment and assumption agreement, dated September 28, 2018, pursuant to which Cambridge transferred all of its future rights, obligations, and liabilities under that certain amended and restated management agreement, by and among the General Partner, the Partnership and Cambridge, dated as of December 1, 2015, as amended January 1, 2018 (collectively, the “Cambridge Initial Advisory Agreement”), to Mesirow. As of October 1, 2018 and until its termination effective March 31, 2019, Mesirow had undertaken to perform the Cambridge Initial Advisory Agreement and be bound by its terms in every way as if it were the original party to it in place of Cambridge. Effective November 1, 2018, the Partnership, the General Partner, ISAM (USA) LLC, ISAM Funds (UK) Limited, International Standard Asset Management (“ISAM”) and ISAM SM entered into a novation agreement, dated October 25, 2018, pursuant to which ISAM transferred all of its future rights, obligations, and liabilities under that certain amended and restated management agreement, by and among the General Partner, the Partnership, ISAM, ISAM (USA) LLC and ISAM Funds (UK) Limited, dated as of November 1, 2017 (the “ISAM Initial Advisory Agreement”), to ISAM SM. As of November 1, 2018, ISAM SM has undertaken to perform the ISAM Initial Advisory Agreement and be bound by its terms in every way as if it were the original party in place of ISAM. Reference herein to “Advisors” may include, as relevant, ADG, Aquantum, AE Capital, Cambridge, ISAMFORT and ISAM SM, Mesirow and SECOR.SM. Each Advisor is allocated a portion of the Partnership’s assets to manage. The Partnership invests or invested the portion of its assets allocated to each of the Advisors either directly, through individually managed accounts, or indirectly, through its investment in the Funds.accounts.
2
Effective January 1, 2020, Millburn directly trades the Partnership’s assets allocated to it through a managed account in the name of the Partnership pursuant to Millburn’s Multi-Markets Program. The General Partner and Millburn have agreed that Millburn will trade the Partnership’s assets allocated to Millburn at a level that is up to 1.5 times the amount of assets allocated. The amount of leverage may be increased or decreased in the future, but it may not exceed 2 times the amount of assets allocated. Effective November 1, 2020, Episteme directly trades the Partnership’s assets allocated to them through a managed account in the name of the Partnership pursuant to Episteme’s Systematic Quest Program. The General Partner and Episteme have agreed that Episteme will trade the Partnership’s assets allocated to Episteme at a level that is up to 21.5 times the amount of assets allocated. The amount of leverage may be increased or decreased in the future, but it may not exceed 2 times the amount of assets allocated. Effective January 1, 2021, DCM directly trades a portion of the Partnership’s assets allocated to it through a managed account in the name of the Partnership pursuant to DCM’s Diversified Alpha Program. The General Partner and DCM have agreed that DCM will trade the Partnership’s assets allocated to DCM at a level that is 1.75 times the amount of assets allocated. The amount of leverage maybe increased or decreased in the future but may not exceed 2 times the amount of assets allocated. Effective February 1, 2023, Drury trades a portion of the Partnership’s assets allocated to it through a managed account in the name of the Partnership pursuant to Drury Diversified Trend-Following Program.
Prior to its termination effective December 31, 2022, ISAM SM directly traded the Partnership’s assets allocated to it through a managed account in the name of the Partnership pursuant to ISAM SM’s Systematic Trend Programme.
The Partnership and prior to the Partnership’s full redemption effective June 30, 2019, SECOR Master Fund L.P. (“SECOR Master”), and prior to the Partnership’s full redemption effective April 30, 2019, CMF AE Capital Master Fund LLC (“AE Capital Master”), and prior to the Partnership’s full redemption effective March 31, 2019, Cambridge Master Fund L.P. (“Cambridge Master”), entered into futures brokerage account agreements and foreign exchange brokerage account agreements with MS&Co. Prior to the Partnership’s respective full redemptions effective December 31, 2020, CMF ADG Master Fund LLC (“ADG Master”), CMF Aquantum Master Fund LLC (“Aquantum Master”) and CMF FORT Contrarian Master Fund LLC (“FORT Contrarian Master”) had each entered into futures brokerage account agreements with MS&Co. Reference herein to the “Funds” may include, as relevant, ADG Master, Aquantum Master, FORT Contrarian Master, AE Capital Master, Cambridge Master and SECOR Master.
Effective July 12, 2017, and prior to their respective terminations, Cambridge Master and SECOR Master each entered into certain agreements with JPMorgan in connection with trading in forward foreign currency contracts on behalf of the referenced Funds and, indirectly, the Partnership. These agreements included a foreign exchange and bullion authorization agreement (“FX Agreement”), an International Swap Dealers Association, Inc. master agreement (“Master Agreement”), a schedule to the Master Agreement, a 2016 credit support annex for variation margin to the schedule and an institutional account agreement. On October 10, 2018, Cambridge, Mesirow, Cambridge Master and JPMorgan entered into an amendment and assignment agreement (the “Assignment Agreement”), effective as of October 1, 2018, to the FX Agreement, pursuant to which Cambridge assigned to Mesirow all of its rights, liabilities, duties and obligations under and in respect of the FX Agreement, Mesirow accepted such assignment and assumed all rights, liabilities, duties and obligations under and in respect of the FX Agreement, and JPMorgan consented to such assignment and assumption. Pursuant to the Assignment Agreement, all references to Cambridge were replaced by references to Mesirow, and all references to “Investment Manager” were deemed to refer to Mesirow. On October 10, 2018, Cambridge Master and JPMorgan entered into an amendment (the “ISDA Amendment”), effective as of October 1, 2018, to the schedule to the Master Agreement, dated as of July 12, 2017, between Cambridge Master and JPMorgan. Pursuant to the ISDA Amendment, all references to Cambridge were replaced by references to Mesirow. In addition to Cambridge Master and SECOR Master, Mesirow/Cambridge and SECOR were all parties to the FX Agreements for the Funds to which each acted as an Advisor. Under each FX Agreement, JPMorgan charged a fee on the aggregate foreign currency transactions entered into on behalf of the respective Fund during a month.
The Partnership, directly and indirectly through its investment in the Funds, pays (or paid with respect to the Funds) MS&Co. trading fees for clearing and, where applicable, execution of transactions.
The Partnership will be liquidated upon the first to occur of the following: (1) December 31, 2052; (2) the net asset value per Redeemable Unit decreases to less than $400 per Redeemable Unit as of the close of any business day; or (3) the occurrence of certain other circumstances as set forth in the limited partnership agreement of the Partnership (the “Limited Partnership Agreement”).
On January 12, 2018, a portion of the assets allocated to FORT for trading were invested in FORT Contrarian Master, a limited liability company organized under the limited liability company laws of the State of Delaware. FORT Contrarian Master permitted accounts managed by FORT using its Global Contrarian Trading Program, a proprietary, systematic trading system, to invest together in one trading vehicle. The Partnership fully redeemed its investment in FORT Contrarian Master on December 31, 2020.
On February 1, 2019, the assets allocated to ADG for trading were invested in ADG Master, a limited liability company organized under the limited liability company laws of the State of Delaware. ADG Master permitted accounts managed by ADG using its Systematic Macro Strategy, a proprietary, systematic trading system, to invest together in one trading vehicle. The Partnership fully redeemed its investment in ADG Master on December 31, 2020.
On June 1, 2019, the assets allocated to Aquantum for trading were invested in Aquantum Master, a limited liability company organized under the limited liability company laws of the State of Delaware. Aquantum Master permitted accounts managed by Aquantum using its Aquantum Commodity Spread (ACS) Program, a proprietary, systematic trading system, to invest together in one trading vehicle. The Partnership fully redeemed its investment in Aquantum Master on December 31, 2020.
On January 1, 2018, the assets allocated to SECOR for trading were invested in SECOR Master, a limited partnership organized under the partnership laws of the State of Delaware. SECOR Master permitted accounts managed by SECOR using a variation of the program traded by SECOR Alpha Master Fund L.P., a proprietary, systematic trading program, to invest together in one trading vehicle. The Partnership fully redeemed its investment in SECOR Master on June 30, 2019.
On February 1, 2018, the assets allocated to AE Capital for trading were invested in AE Capital Master, a limited liability company organized under the limited liability company laws of the State of Delaware. AE Capital Master permitted accounts managed by AE Capital using its AE Systematic FX Fund Program, a proprietary, systematic trading system, to invest together in one trading vehicle. Effective April 3, 2019, the General Partner terminated AE Capital as an Advisor to the Partnership. For the interim period from April 4, 2019 through April 30, 2019, the Partnership’s assets previously allocated to AE Capital were not charged a management fee and were credited with interest income at a rate equal to the monthly average of the 4-week U.S. Treasury bill discount rate. The Partnership fully redeemed its investment in AE Capital Master on April 30, 2019.
3
On December 1, 2015, the assets allocated to Cambridge for trading were invested in Cambridge Master, a limited partnership organized under the partnership laws of the State of Delaware. Effective October 1, 2018 until its termination effective March 31, 2019, Mesirow had undertaken to perform the Cambridge Initial Advisory Agreement and be bound by its terms in every way as if it were the original party to it in place of Cambridge. Cambridge Master permitted accounts managed by Mesirow/Cambridge using the Asian Markets Alpha Programme and the Emerging Markets Alpha Programme, each a proprietary, systematic trading program, to invest together in one trading vehicle. The Partnership fully redeemed its investment in Cambridge Master on March 31, 2019.
The General Partner is not aware of any material changes to the trading programs discussed above during the year ended December 31, 2022.2023.
2
As of January 1, 2018, the Partnership began offering three classes of limited partnership interests, Class A Redeemable Units, Class D Redeemable Units and Class Z Redeemable Units. All Redeemable Units issued prior to January 1, 2018 were deemed Class A Redeemable Units. The rights, liabilities, risks, and fees associated with investment in Class A Redeemable Units were not changed. Class A Redeemable Units are available to taxable U.S. individuals and institutions, U.S. tax exempt individuals and institutions, and non-U.S. investors. Class D Redeemable Units and Class Z Redeemable Units were first issued on January 1, 2018. Class A Redeemable Units, Class D Redeemable Units and Class Z Redeemable Units will each be referred to as a “Class” and collectively referred to as the “Classes.” The Class of Redeemable Units that a limited partner receives upon a subscription will generally depend upon the amount invested in the Partnership or the status of the limited partner, although the General Partner may determine to offer any Class of Redeemable Units to investors at its discretion. Class D Redeemable Units are available to taxable U.S. individuals and institutions, U.S. tax exempt individuals and institutions, and non-U.S. investors. Class Z Redeemable Units are offered to certain employees of Morgan Stanley and its subsidiaries (and their family members). In the future, Class Z Redeemable Units may also be offered to certain limited partners who receive advisory services from Morgan Stanley Smith Barney LLC, doing business as Morgan Stanley Wealth Management (“Morgan Stanley Wealth Management”). Class A Redeemable Units, Class D Redeemable Units and Class Z Redeemable Units are identical, except that they are subject to different monthly ongoing selling agent fees. Effective January 1, 2021, Class A Redeemable Units are subject to a monthly ongoing selling agent fee equal to 1/12 of 0.75% (a 0.75% annual rate) of the net assets of Class A Redeemable Units as of the end of each month. From July 1, 2020 through December 31, 2020, Class A Redeemable Units were subject to a monthly ongoing selling agent fee equal to 1/12 of 1.00% (a 1.00% annual rate) of the net assets of Class A Redeemable Units as of the end of each month. Prior to July 1, 2020, Class A Redeemable Units were subject to a monthly ongoing selling agent fee equal to 1/12 of 2.00% (a 2.00% annual rate) of the net assets of Class A Redeemable Units as of the end of each month. Class D Redeemable Units are subject to a monthly ongoing selling agent fee equal to 1/12 of 0.75% (a 0.75% annual rate) of the net assets of Class D Redeemable Units as of the end of each month. Class Z Redeemable Units are not subject to a monthly ongoing selling agent fee.
The Partnership’s trading of futures, forward and option contracts, as applicable, on commodities is done primarily on U.S. and foreign commodity exchanges. The Funds’ trading of futures, forward and option contracts, as applicable, on commodities was also done primarily on U.S. and foreign commodity exchanges. The Partnership engages and the Funds engaged, in such trading through commodity brokerage accounts maintained with MS&Co.
Generally, a limited partner/member in the Funds withdrew all or part of its capital contribution and undistributed profits, if any, from the Funds as of the end of any month (the “Redemption Date”) after a request had been made to the General Partner/Trading Manager at least three days in advance of the Redemption Date. Such withdrawals were classified as a liability when the limited partner/member elected to redeem and informed the Funds. However, a limited partner/member had the right to request a withdrawal as of the end of any day if such request was received by the General Partner/Trading Manager at least three days in advance of the proposed withdrawal day.
Management fees, General PartnerThe Partnership pays clearing fees, ongoing selling agent fees, andGeneral Partner fees, management fees, incentive fees are charged at the Partnership level. Clearing fees were borne by the Funds and allocated to the Funds’ limited partners/non-managing members, including the Partnership. Clearing fees are also borne by the Partnership directly. Professional fees were borne by the Funds and allocated to the Partnership, and are also charged directly at the Partnership level.professional fees.
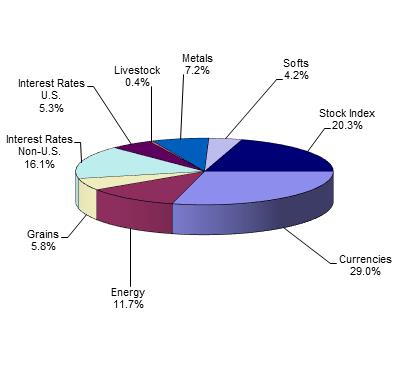
For the period January 1, 20222023 through December 31, 2022,2023, the approximate average market sector distribution for the Partnership was as follows:
4
5
There were no investments in the Funds as of December 31, 2022 and 2021.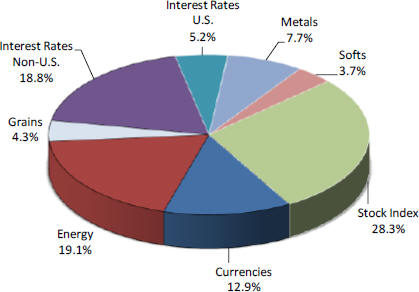
The General Partner administers the business and affairs of the Partnership, including selecting one or more advisors to make trading decisions for the Partnership. The General Partner has agreed to make capital contributions, if necessary, so that its general partnership interest will be equal to the greater of (i) 1% of the partners’ contributions to the Partnership or (ii) $25,000. Effective July 1, 2020, theThe Partnership pays the General Partner a monthly fee equal to 1/12 of 0.875% (0.875% per year) of month-end net assets of the Partnership. Prior to July 1, 2020, the Partnership paid the General Partner a monthly fee equal to 1/12 of 1% (1% per year) of month-end net assets of the Partnership. Month-end net assets, for purposes of calculating the General Partner fee, are net assets, as defined in the Limited Partnership Agreement, prior to the reduction of the current month’s management fees, incentive fee accruals, the General Partner fee and any redemptions or distributions as of the end of such month. The General Partner fee is allocated proportionately to each Class based on the net asset value of the respective Class.
The General Partner, on behalf of the Partnership, has entered into management agreements (each a “Management Agreement”) with the Advisors. The Advisors are not affiliated with one another, are not affiliated with the General Partner or MS&Co., and are not responsible for the organization or operation of the Partnership. Each Management Agreement may be terminated upon notice by either party.
3
Effective January 1, 2021, the Partnership pays to DCM a monthly management fee equal to 1/12 of 0.75% (0.75% per year) of month-end net assets of the Partnership allocated to DCM. Effective February 1, 2023, the Partnership pays to Drury a monthly management fee equal to 1/12 of 0.50% (0.50% per year) of month-end net assets of the Partnership allocated to Drury. Effective November 1, 2020, the Partnership pays to Episteme a monthly management fee equal to 1/12 of 1.0% (1.0% per year) of month-end net assets of the Partnership allocated to Episteme. Effective January 1, 2020, the Partnership pays to Millburn a monthly management fee equal to 1/12 of 0.25%, 0.375% or 0.50% (0.25%, 0.375% or 0.5% per year), depending on account leverage, of month-end net assets of the Partnership allocated to Millburn. Month-end net assets, for purposes of calculating management fees, are net assets, as defined in the Limited Partnership Agreement, prior to the reduction of the current month’s incentive fee accruals, the monthly management fees, the General Partner fee and any redemptions or distributions as of the end of such month. An Advisor’s management fee is allocated proportionately to each Class based on the net asset value of the respective Class.
Prior to its termination effective December 31, 2022, the Partnership paid to ISAM SM a monthly management fee equal to 1/12 of 1.0% (1.0% per year) of month end net assets of the Partnership allocated to ISAM SM. Prior to FORT’s termination on October 31, 2021, the Partnership paid to FORT a monthly management fee equal to 1/12 of 0.75% (0.75% per year) of month-end net assets of the Partnership allocated to FORT’s Global Trend Trading Program, and until December 31, 2020, paid to FORT a monthly management fee equal to 1/12 of 1.15% (1.15% per year) of month-end net assets allocated to FORT Contrarian Master. Prior to ADG’s termination on December 31, 2020, the Partnership paid to ADG a monthly management fee equal to 1/12 of 1.00% (1.00% per year) of month-end net assets of the Partnership allocated to ADG. Prior to Aquantum’s termination on December 31, 2020, the Partnership paid to Aquantum a monthly management fee equal to 1/12 of 1.25% (1.25% per year) of month-end net assets of the Partnership allocated to Aquantum. As of October 1, 2018 and until its termination effective March 31, 2019, Mesirow received a monthly management fee equal to 1/12 of 1.0% (1.0% per year) of month-end net assets allocated to Mesirow. From January 1, 2018 to September 30, 2018, the monthly management fee paid by the Partnership to Cambridge was equal to 1/12 of 1.0% (1.0% per year) of month-end net assets allocated to Cambridge. Prior to January 1, 2018, Cambridge received a monthly management fee equal to 1/12 of 1.5% (1.5% per year) of month-end net assets allocated to Cambridge. Prior to its termination effective June 30, 2019, SECOR received a monthly management fee equal to 1/12 of 1.15% (1.15% per year) of month-end net assets allocated to SECOR. Prior to its termination effective April 3, 2019, AE Capital received a monthly management fee equal to 1/12 of 1.50% (1.50% per year) of month-end net assets allocated to AE Capital.Program.
In addition, effective January 1, 2021, the Partnership is obligated to pay DCM an incentive fee, payable quarterly, equal to 15% of the New Trading Profits, as defined in the Management Agreement, earned by DCM. Effective February 1, 2023, the Partnership is obligated to pay Drury an incentive fee, payable annually, equal to 25% of the New Trading Profits, as defined in the Management Agreement, earned by Drury. Effective November 1, 2020, the Partnership is obligated to pay Episteme an incentive fee, payable quarterly, equal to 22.5% of the New Trading Profits, as defined in the Management Agreement, earned by Episteme. Effective January 1, 2020, the Partnership is obligated to pay Millburn an incentive fee, payable annually, equal to 28% of the New Trading Profits, as defined in the Management Agreement, earned by Millburn. To the extent an Advisor incurs a loss for the Partnership, the Advisor will not be paid incentive fees until the Advisor recovers the net loss incurred and earns additional new trading profits for the Partnership. An Advisor’s incentive fee is allocated proportionately to each Class based on the net asset value of the respective Class.
Prior to its termination effective December 31, 2022, ISAM SM was eligible to receive an incentive fee, payable quarterly, equal to 25% of the New Trading Profits, as defined in the Management Agreement, earned by ISAM SM. Prior to the Partnership’s full redemption out of FORT Contrarian Master effective December 31, 2020, FORT was eligible to receive an incentive fee, payable annually, equal to 20% of the New Trading Profits, as defined in the Management Agreement, earned by FORT for the Partnership’s assets allocated to FORT Contrarian Master during each calendar year. Prior to its termination effective December 31, 2020, ADG was eligible to receive an incentive fee, payable semi-annually, equal to 25% of the New Trading Profits, as defined in the Management Agreement, earned by ADG for the Partnership during each calendar half-year. Prior to its termination effective December 31, 2020, Aquantum was eligible to receive an incentive fee, payable semi-annually, equal to 20% of the New Trading Profits, as defined in the Management Agreement, earned by Aquantum for the Partnership during each calendar half-year. As of October 1, 2018 and until its termination effective March 31, 2019, Mesirow was eligible to receive an incentive fee, payable annually, equal to 15% of New Trading Profits, as defined in the Management Agreement, earned by Mesirow for the Partnership during each calendar year. From January 1, 2018 to September 30, 2018, Cambridge was eligible to receive an incentive fee, payable annually, equal to 15% of the New Trading Profits, as defined in the Management Agreement, earned by Cambridge for the Partnership during each calendar year. Prior to January 1, 2018, Cambridge was eligible to receive an incentive fee, payable quarterly, equal to 15% of the New Trading Profits, as defined in the Management Agreement, earned by Cambridge for the Partnership during each calendar quarter. Prior to its termination effective June 30, 2019, SECOR was eligible to receive an incentive fee, payable annually, equal to 25% of the New Trading Profits, as defined in the Management Agreement, earned by SECOR for the Partnership during each calendar year. Prior to its termination effective April 3, 2019, AE Capital was eligible to receive an incentive fee, payable quarterly, equal to 20% of the New Trading Profits, as defined in the Management Agreement, earned by AE Capital for the Partnership during each calendar quarter.
The Partnership has entered into a customer agreement with MS&Co. (the “Partnership Customer Agreement”). Under the Partnership Customer Agreement and the foreign exchange brokerage account agreement, the Partnership pays (or paid with respect to the Funds) trading fees for the clearing and, where applicable, execution of transactions, as well as exchange, user, give-up, floor brokerage and National Futures Association (“NFA”) fees (collectively, the “clearing fees”), directly and indirectly through its investment in the Funds. Clearing fees were allocated to the Partnership based on its proportionate share of each Fund. Clearing fees are also borne directly by the Partnership for its direct trading.. Clearing fees will be paid for the life of the Partnership, although the rate at which such fees are paid may be changed. All of the Partnership’s assets available for trading in commodity interests previously not held in the Funds’ accounts at MS&Co. or JPMorgan were deposited in the Partnership’s accounts at MS&Co. The Partnership’s cash
6
deposited with MS&Co. were held in segregated bank accounts to the extent required by Commodity Futures Trading Commission (“CFTC”) regulations. The Partnership’s restricted cash is equal to the cash portion of assets on deposit to meet margin requirements, as determined by the exchange or counterparty, and required by MS&Co. At December 31, 20222023 and 2021,2022, the amount of cash held by the Partnership for margin requirements was $12,210,997$9,285,004 and $11,511,892,$12,210,997, respectively. Cash that is not classified as restricted cash is therefore classified as unrestricted cash. The Partnership receives monthly interest on 100% of the average daily equity maintained in cash in the Partnership’s (or the Partnership’s allocable portion of a Fund’s) brokerage account at MS&Co. during each month at a rate equal to the monthly average of the 4-week U.S. Treasury bill discount rate. During prior periods included in this report, the Partnership received interest on 80% of the average daily equity maintained in cash in the Partnership’s (or the Partnership’s allocable portion of a Fund’s) brokerage account at the rate equal to the monthly average of the 4-week U.S. Treasury bill discount rate. For purposes of these interest credits, daily funds did not include monies due to futures, forward, or option contracts that had not been received. The Partnership Customer Agreement may generally be terminated upon notice by either party.
The Partnership has entered into a selling agreement with Morgan Stanley Wealth Management (the “Selling Agreement”). Under the Selling Agreement, and effective January 1, 2021, the Partnership pays Morgan Stanley Wealth Management a monthly ongoing selling agent fee equal to 0.75% per year of adjusted month-end net assets for Class A Redeemable Units. From July 1, 2020 through December 31, 2020, the Partnership paid Morgan Stanley Wealth Management a monthly ongoing selling agent fee equal to 1.00% per year of adjusted month-end net assets for Class A Redeemable Units. Effective January 1, 2018 and until June 30, 2020, the Partnership paid Morgan Stanley Wealth Management a monthly ongoing selling agent fee equal to 2.00% per year of adjusted month-end net assets for Class A Redeemable Units. Effective January 1, 2018, theThe Partnership pays Morgan Stanley Wealth Management a monthly ongoing selling agent fee equal to 0.75% per year of the adjusted month-end net assets for Class D Redeemable Units. Morgan Stanley Wealth Management pays a portion of its ongoing selling agent fees to properly registered or exempted financial advisors who have sold Class A and Class D Redeemable Units. Class Z Redeemable Units are not subject to an ongoing selling agent fee. Month-end net assets, for the purpose of calculating ongoing selling agent fees are Net Assets, as defined in the Limited Partnership Agreement, for the Class, prior to the reduction of the current month’s ongoing selling agent fee, incentive fee accrual, management fee, General Partner fee and other expenses and any redemptions or distributions as of the end of such month.
As of November 1, 2018, the Partnership entered into an alternative investment placement agent agreement (the “Harbor Selling Agreement”), by and among the Partnership, the General Partner, Morgan Stanley Distribution Inc. (“MSDI”) and Harbor Investment Advisory, LLC, a Maryland limited liability company (“Harbor”), which supersedes and replaces the alternative investment selling agent agreement, dated January 19, 2018, between the Partnership, the General Partner and Harbor. Pursuant to the Harbor Selling Agreement, MSDI and Harbor have been appointed as a non-exclusive selling agent and sub-selling agent, respectively, of the Partnership for the purpose of finding eligible investors for Redeemable Units through offerings that are exempt from registration under the Securities Act of 1933, as amended (the “Securities Act”), pursuant to Section 4(a)(2) thereof and Rule 506 of Regulation D promulgated thereunder and for Harbor to serve as an investment advisor to its customers investing in one or more of the partnerships party to the Harbor Selling Agreement; provided, that, included within such appointment, Harbor will provide certain services to certain holders of Redeemable Units of the Partnership, who had acquired such Redeemable Units prior to such holders becoming clients of Harbor. The Harbor Selling Agreement continues in effect until September 30, 20232024 unless terminated in certain circumstances as set forth in the Harbor Selling Agreement, including by any party on thirty days’ prior written notice, after which the General Partner or the Partnership may, in its sole discretion, renew the Harbor Selling Agreement for additional one year periods. Pursuant to the Harbor Selling Agreement, and effective January 1, 2021, the Partnership pays Harbor an ongoing selling agent fee equal to 1/12 of 0.75% (a 0.75% annual rate) of the adjusted month-end net asset value per Redeemable Unit for certain holders of Class A Redeemable Units in the Partnership. From July 1, 2020 through December 31, 2020, the Partnership paid Harbor an ongoing selling agent fee equal to 1/12 of 1.0% (a 1.0% annual rate) of the adjusted month-end net asset value per Redeemable Unit for certain holders of Class A Redeemable Units in the Partnership. Prior to July 1, 2020, the Partnership paid Harbor an ongoing selling agent fee equal to 1/12 of 2.0% (a 2.0% annual rate) of the adjusted month-end net asset value per Redeemable Unit for certain holders of Class A Redeemable Units in the Partnership. The Partnership pays Harbor an ongoing selling agent fee equal to 1/12 of 0.75% (a 0.75% annual rate) of the adjusted month-end net asset value per Redeemable Unit for certain holders of Class D Redeemable Units in the Partnership.
The General Partner has delegated certain administrative functions to SS&C Technologies, Inc., a Delaware corporation, currently doing business as SS&C GlobeOp (the “Administrator”). Pursuant to a master services agreement, the Administrator furnishes certain administrative, accounting, regulatory reporting, tax and other services as agreed from time to time. In addition, the Administrator maintains certain books and records of the Partnership. The cost of retaining the Administrator is allocated among the pools operated by the General Partner, including the Partnership.
(b) Financial Information about Segments. The Partnership’s business consists of only one segment, speculative trading of commodity interests. The Partnership does not engage in sales of goods or services. The Partnership’s net income (loss) from operations for the years ended December 31, 2022, 2021, 2020, 2019 and 2018 is set forth under “Item 6. Selected Financial Data.” The Partnership’s capital as of December 31, 20222023 was $65,387,698.$53,044,907.
(c) Narrative Description of Business.
See Paragraphs (a) and (b) above.
4
(i) through (xii) — Not applicable.
(xiii) — The Partnership has no employees.
(d)Financial Information About Geographic Areas. The Partnership does not engage in the sale of goods or services or own any long lived assets, and therefore this item is not applicable.
(e)Available Information. The Partnership does not have an Internet address. The Partnership will provide paper copies of its Annual Report on Form 10-K, Quarterly Reports on Form 10-Q, Current Reports on Form 8-K and any amendments to these reports free of charge upon request.
(f) Reports to Security Holders. Not applicable.
(g) Enforceability of Civil Liabilities Against Foreign Persons. Not applicable.
(h) Smaller Reporting Companies. Not applicable.
7
Item 1A. Risk Factors.
As a result of leverage, small changes in the price of the Partnership’s positions may result in major losses.
The trading of commodity interests is speculative, volatile and involves a high degree of leverage. A small change in the market price of a commodity interest contract can produce major losses for the Partnership. Market prices can be influenced by, among other things, changing supply and demand relationships, governmental, agricultural, commercial and trade programs and policies, national and international political and economic events, weather and climate conditions, insects and plant disease, purchases and sales by foreign countries, changing interest rates, pandemics, epidemics and other public health crises.
An investor may lose all of their investment.
Due to the speculative nature of trading commodity interests, an investor could lose all of their investment in the Partnership.
The Partnership will pay substantial fees and expenses regardless of profitability.
Regardless of its trading performance, the Partnership will incur fees and expenses, including but not limited to clearing fees, the General Partner fee, ongoing selling agent fees and management fees. Substantial incentive fees may be paid to one or more of the Advisors even if the Partnership experiences a net loss for the full year.
An investor’s ability to redeem or transfer Redeemable Units is limited.
An investor’s ability to redeem or transfer Redeemable Units is limited and no market exists for the Redeemable Units.
Conflicts of interest exist.
The Partnership is subject to numerous conflicts of interest including those that arise from the fact that:
| 1. | The General Partner and the Partnership’s commodity brokers are affiliates; |
| 2. | Each of the Advisors, the Partnership’s commodity brokers, the General Partner and their respective principals and affiliates may trade in commodity interests for their own accounts; |
| 3. | An investor’s financial advisor will receive ongoing compensation for providing services to the investor’s account; and |
| 4. | The General Partner, on behalf of the Partnership, may purchase shares from money market mutual funds affiliated and/or unaffiliated with the General Partner. |
Investing in Redeemable Units may not provide the desired diversification of an investor’s overall portfolio.
One of the Partnership’s objectives is to add an element of diversification to a traditional stock and bond portfolio, but any benefit of portfolio diversification is dependent upon the Partnership achieving positive returns and such returns being independent of stock and bond market returns.
Past performance is no assurance of future results.
The Advisors’ trading strategies may not perform as they have performed in the past and past performance does not necessarily predict future returns. The Advisors have from time to time incurred substantial losses in trading on behalf of clients.
An investor’s tax liability may exceed cash distributions.
Investors are taxed on their share of the Partnership’s income, even though the Partnership does not intend to make any distributions.
The General Partner may allocate the Partnership’s assets to undisclosed advisors.
The General Partner at any time may select and allocate the Partnership’s assets to undisclosed advisors. Investors may not be advised of such changes in advance or at all. Investors must rely on the ability of the General Partner to select commodity trading advisors and allocate assets among them.
5
Regulatory changes could restrict the Partnership’s operations and increase its operational costs.
Regulatory costs or changes could adversely affect the Partnership by restricting its markets or activities, limiting its trading and/or increasing the costs or taxes to which investors are subject. Pursuant to the mandate of the Dodd-Frank Wall Street Reform and Consumer Protection Act, signed into law on July 21, 2010, the CFTC and the Securities and Exchange Commission (the “SEC”) have promulgated rules to regulate trading in swaps and swap dealers and to mandate additional reporting and disclosure requirements and continue to promulgate rules regarding capital and margin requirements, to require that certain swaps be traded on an exchange or a swap execution facility, to mandate additional reporting and disclosure requirements and to require that derivatives (such as those traded by the Partnership) be moved into central clearinghouses. The CFTC and the prudential regulators that oversee swap dealers have adopted rules regarding margin requirements for certain derivatives. In addition, the CFTC and such prudential regulators have adopted rules regarding capital requirements for swap dealers. These rules may negatively impact the manner in which swap contracts are traded and/or settled, increase the costs of such trades, and limit trading by speculators (such as the Partnership) in futures and over-the-counter (“OTC”) markets.
8
Speculative position and trading limits may reduce profitability.
The CFTC and U.S. exchanges have established speculative position limits on the maximum net long or net short positions which any person or a group of persons may hold or control in particular futures and options on futures. In January 2021, the CFTC finalized new rules that impose position limits on certain futures and option contracts and physical commodity swaps that are “economically equivalent” to such contracts. In addition to speculative position limits, most commodity exchanges also limit fluctuations in futures contract prices during a single day by regulations referred to as “daily price fluctuation limits” or “daily limits.” Such regulations could have an adverse effect on an Advisor’s trading for the Partnership. The trading instructions of an Advisor may have to be modified, and positions held by the Partnership may have to be liquidated, in order to avoid exceeding these limits. Such modification or liquidation could adversely affect the operations and profitability of the Partnership by increasing transaction costs to liquidate positions and limiting potential profits on liquidated positions.
The General Partner, the Partnership and their respective service providers (including the Advisors) and operations are potentially vulnerable to cyber-security attacks or incidents.
Like other business enterprises, the use of the internet and other electronic media and technology exposes the General Partner, the Partnership and their respective service providers and operations, to potential risks from cyber-security attacks or incidents (collectively, “cyber events”). Cyber events may include, for example, unauthorized access to systems, networks or devices, infection from computer viruses or other malicious software code, mishandling or misuse of information and attacks which shut down, disable, slow or otherwise disrupt operations, business processes or website access or functionality. In addition to intentional cyber events, unintentional cyber events can occur. Unintentional cyber events may include, for example, the inadvertent release of confidential information, the mishandling or misuse of information and/or technological limitations or hardware failures (in the markets or otherwise) that constrain the Partnership’s ability to gather, process and communicate information efficiently and securely, without interruption.
Any cyber event could adversely affect the Partnership’s business, financial condition or results of operations and cause the Partnership to incur financial loss and expense, as well as face exposure to regulatory penalties or legal claims, reputational damage and additional costs associated with corrective measures. A cyber-security breach could also jeopardize a limited partner’s personal, confidential, proprietary or other information processed and stored in, and transmitted through, the General Partner’s or a service provider’s computer systems. A cyber event may cause the Partnership or its service providers to lose proprietary information, suffer data corruption, lose operational capacity (such as, for example, the loss of the ability to process transactions, calculate the Partnership’s net asset value, or allow investors to transact business) and/or fail to comply with applicable privacy and other laws. Among other potentially harmful effects, cyber events also may result in theft, unauthorized monitoring and failures in the physical infrastructure or operating systems that support the Partnership or its service providers.
The nature of malicious cyber-attacks is becoming increasingly sophisticated and neither the General Partner nor the Partnership can control whether a cyber event will adversely affect the cyber systems of the Advisors or other third-party service providers.
Tax laws are subject to change at any time.
Tax laws and court and Internal Revenue Service (“IRS”) interpretations thereof are subject to change at any time, possibly with retroactive effect.
Prospective investors are urged to consult with their tax advisors with respect to regulatory or administrative developments and proposals, and their potential effects on them based on their unique circumstances.
The continuing spread of a new strain of coronavirus, which causes the viral disease known as COVID-19, may adversely affect our investments and operations.
Since its discoveryBeginning in December 2019, a new strain of coronavirus, which causes the viral disease known as COVID-19, has spread from China to many other countries, including the United States. The outbreak has been declared a pandemic by the World Health Organization, and the U.S. Health and Human Services Secretary has declared a public health emergency in the United States in response to the outbreak.
The COVID-19 pandemic and related voluntary and government-imposed social and business restrictions has impacted global economic conditions and adversely affected various industries (including, but not limited to, transportation, hospitality and entertainment), resulting in volatility in the global financial markets, disruption in global supply chains, increased unemployment, and operational challenges such as the temporary and permanent closures of businesses, sheltering-in-place directives and increased remote work protocols. If the pandemic continues to be prolonged or the actions of governments and central banks are unsuccessful, including actions to facilitate the comprehensive distribution of effective vaccines, the adverse impact on the global economy will deepen.
Given the continuing development of this situation, it is not possible to accurately predict how the market disruptions caused by COVID-19 will further impact the U.S and other world economies or the value of the Partnership’s investments, or for how long the effects of such events will continue. Nevertheless, the novel coronavirus continues to present material uncertainty and risk with respect to the Partnership’s investments and operations.
On February 22, 2022, the United States, the United Kingdom, the European Union, and several Europeana number of other nations announcedimposed sanctions against Russia in response to Russia’s mobilization of forces and threat of invasion of the Ukraine, and these and other governments around the world imposed, and may impose additional sanctions in the future impose, additionalas the conflict develops. In addition, on October 7, 2023, Hamas militants and members of other terrorist organizations infiltrated Israel’s southern border from the Gaza Strip and conducted a series of terror attacks on civilian and military targets. Shortly following the attack, Israel’s security cabinet declared war against Hamas. These conflicts and subsequent sanctions on Russia in response to its continued escalation of this conflict. On February 24, 2022, Russian President Putin commenced a full-scale invasion of Russia’s pre-positioned forces into the Ukraine. The conflict hashave created volatility in the price of various commodities and may lead to a deterioration in the political and trade relationships that exist between the countries involved and have a negative impact on business activity globally, and therefore could adversely affect the performance of the Partnership’s investments. Furthermore, uncertainties regarding the conflict between the two nationsthese conflicts and the varying involvement of the United States and other NATO countries preclude prediction as to the ultimate impact on global economic and market conditions, and, as a result, presents material uncertainty and risk with respect to the Partnership and the performance of its investments or operations, and the ability of the Partnership to achieve its investment objectives. Additionally, to the extent that investors, service providers and/or other third parties have material operations or assets in Russia, Belarus, Ukraine or Ukraine,Israel, they may have their operations disrupted and/or suffer adverse consequences related to the ongoing conflict.conflicts.
6
Item 1C. Cybersecurity.
Risk management and strategy
The Partnership has no directors or executive officers and its affairs are managed by its General Partner. The General Partner is a wholly-owned subsidiary of MSCM. MSCM is ultimately owned by Morgan Stanley. Morgan Stanley, its businesses, the General Partner, the Partnership, and the broader financial services industry face an increasingly complex and evolving threat environment. Morgan Stanley has made and continues to make substantial investments in cybersecurity and fraud prevention technology, and employ experienced talent to lead its Cybersecurity and Information Security organizations and program under the oversight of the Morgan Stanley Board of Directors (the “Board”) and the Operations and Technology Committee of the Board (the “BOTC”). See “Risk Factors – The General Partner, the Partnership, the Funds and their respective service providers (including the Advisors) and operations are potentially vulnerable to cyber-security attacks or incidents” for information on risks to the Partnership from cybersecurity threats.
As part of its enterprise risk management (“ERM”) framework, Morgan Stanley has implemented and maintains a program to assess, identify and manage risks arising from the cybersecurity threats (the “Cybersecurity Program”). The Cybersecurity Program has been adopted by the General Partner, and applies to its business, as relevant. The Cybersecurity Program helps protect Morgan Stanley’s clients, customers, employees, property, products, services and reputation by seeking to preserve the confidentiality, integrity and availability of information, enable the secure delivery of financial services, and protect the business and the safe operation of Morgan Stanley’s technology systems. Morgan Stanley continually adjusts the Cybersecurity Program to address the evolving cybersecurity threat landscape and comply with extensive legal and regulatory expectations.
Processes for assessing, identifying and managing material risks from cybersecurity threats
The Cybersecurity Program takes into account industry best practices and addresses risks from cybersecurity threats to Morgan Stanley’s network, infrastructure, computing environment and the third parties that Morgan Stanley, and its affiliates rely on. Morgan Stanley periodically assesses the design of its cybersecurity controls against the Cyber Risk Institute Cyber Profile, which is based on the National Institute of Standards and Technology (“NIST”) Cybersecurity Framework for Improving Critical Infrastructure Cybersecurity, as well as global cybersecurity regulations, and develops improvements to those controls in response to that assessment. The Cybersecurity Program also includes cybersecurity and information security policies, procedures and technologies that are designed to address regulatory requirements and to protect clients’, employees’ and Morgan Stanley’s own data against unauthorized disclosure, modification and misuse. These policies, procedures and technologies cover a broad range of areas, including: identification of internal and external threats, access control, data security, protective controls, detection of malicious or unauthorized activity, incident response, and recovery planning.
7
The threat intelligence function within the Cybersecurity Program actively engages in private and public information sharing communities and leverages both commercial and proprietary products to collect a wide variety of industry and governmental information regarding the latest cybersecurity threats, which informs the cybersecurity risk assessments and strategy. This information is also provided to an internal forensics team, which develops and implements technologies designed to help detect these cybersecurity threats. Where a potential threat is identified, an incident response team evaluates the potential impact, and coordinates remediation where required. These groups, as well as Morgan Stanley’s Operational Risk Department (the “Operational Risk Department”), review external cybersecurity incidents that may be relevant to Morgan Stanley and its affiliates, and the outcomes of these incidents further inform the design of the Cybersecurity Program. In addition, Morgan Stanley maintains a robust global training program on cybersecurity risks and requirements and conducts regular phishing email simulations for its employees and consultants.
The cybersecurity processes are designed to help oversee, identify and mitigate risks associated with Morgan Stanley’s use of third-party vendors. Morgan Stanley maintains a third-party risk management program that includes evaluation of, and response to, cybersecurity risks at its third-party vendors. Prior to engaging third-party vendors to provide services, Morgan Stanley conducts assessments of the third-party vendors’ cybersecurity programs to identify the impact of their services on the cybersecurity risks to Morgan Stanley. Once on-boarded, third-party vendors’ cybersecurity programs are subject to risk-based oversight, which may include security questionnaires, submission of independent security audit reports or an audit of the third-party vendor’s security program, and, with limited exceptions, third-party vendors are required to meet Morgan Stanley’s cybersecurity standards. Where a third-party vendor cannot meet those standards, its services, and the residual risk, are subject to review, challenge and escalation through Morgan Stanley’s risk management processes and ERM committees, which may ultimately result in requesting increased security measures or ceasing engagement with such third-party vendor.
The Cybersecurity Program is regularly assessed by Morgan Stanley’s Internal Audit Department (“IAD”) through various assurance activities, with the results reported to the Audit Committee of the Board (“BAC”) and the BOTC. Annually, certain elements of the Cybersecurity Program are subject to an audit by an independent consultant, as well as an assessment by a separate, independent third party, the results of which, including opportunities identified for improvement and related remediation plans, are reviewed with the BOTC. The Cybersecurity Program is also examined regularly by Morgan Stanley’s prudential and conduct regulators within the scope of their jurisdiction.
8
Governance
Morgan Stanley Management’s role in assessing and managing material risks from cybersecurity threats
The Cybersecurity Program is operated and maintained by management, including Morgan Stanley’s Chief Information Officer of Cyber, Data, Risk and Resilience (“CIO”) and Morgan Stanley’s Chief Information Security Officer (“CISO”). These senior officers are responsible for assessing and managing the Firm’s cybersecurity risks. The General Partner adheres to the Cybersecurity Program’s policies and participates in periodic testing. The Cybersecurity Program strategy, which is set by the CISO and overseen by the Head of the Operational Risk Department, is informed by various risk and control assessments, control testing, external assessments, threat intelligence, and public and private information sharing. The Cybersecurity Program also includes processes for escalating and considering the materiality of incidents that impact Morgan Stanley and its affiliates, including escalation to senior management and the Board, which are periodically tested through tabletop exercises.
The members of management that lead the Cybersecurity Program and strategy have extensive experience in technology, cybersecurity and information security. The CIO has over 30 years of experience in various engineering, IT, operations and information security roles. The CISO has over 25 years of experience leading cybersecurity teams at financial institutions, including in the areas of IT strategy, risk management and information security. The Head of the Operational Risk Department has over 20 years of experience in technology, security and compliance roles, including experience in government security agencies.
Risk levels and mitigating measures are presented to and monitored by dedicated management-level cybersecurity risk committees. These committees include representatives from management as well as business and control stakeholders who review, challenge and, where appropriate, consider exceptions to its policies and procedures. Significant cybersecurity risks are escalated from these committees to Morgan Stanley’s non-financial risk committee. The CIO and the Head of the Operational Risk Department report on the status of the Cybersecurity Program, including significant cybersecurity risks; review metrics related to the program; and discuss the status of regulatory and remedial actions and incidents to Morgan Stanley’s non-financial risk committee, the BOTC and the Board, as appropriate.
Item 2. Properties.
The Partnership does not own or lease any properties. The General Partner operates out of facilities provided by Morgan Stanley and/or one of its subsidiaries.
9
Item 3. Legal Proceedings.
This section describes the major pending legal proceedings, other than ordinary routine litigation incidental to the business, to which MS&Co.Morgan Stanley & Co. LLC or its subsidiaries is a party or to which any of their property is subject. There are no material legal proceedings pending against the Partnership or the General Partner.
On June 1, 2011, Morgan Stanley & Co. Incorporated converted from a Delaware corporation to a Delaware limited liability company. As a result of that conversion, Morgan Stanley & Co. Incorporated is now named Morgan Stanley & Co. LLC (“MS&Co.” or “the Company”).
MS&Co.The Company is a wholly-owned, indirect subsidiary of Morgan Stanley, a Delaware holding company. Morgan Stanley files periodic reports with the SEC as required by the Securities Exchange Act of 1934, as amended (the “Exchange Act”) which include current descriptions of material litigation and material proceedings and investigations, if any, by governmental and/or regulatory agencies or self-regulatory organizations concerning Morgan Stanley and its subsidiaries, including MS&Co.the Company. As a consolidated subsidiary of Morgan Stanley, MS&Co.the Company does not file its own periodic reports with the SEC that contain descriptions of material litigation, proceedings and investigations. As a result, we refer you to the “Legal Proceedings” section of Morgan Stanley’s SEC 10-K filings for 2023, 2022, 2021, 2020, 2019, 2018, and 2017.2019. In addition, MS&Co.the Company annually prepares an Audited, Consolidated Statement of Financial Condition (“Audited Financial Statement”) that is publicly available on Morgan Stanley’s website at www.morganstanley.com. We refer you to the Commitments, Guarantees and Contingencies – Legal section of MS&Co.’s 2021the Company’s 2023 Audited Financial Statement.
In addition to the matters described in those filings, in the normal course of business, each of Morgan Stanley and MS&Co.the Company has been named, from time to time, as a defendant in various legal actions, including arbitrations, class actions, and other litigation, as well as being subject to regulatory investigations arising in connection with its activities as a global diversified financial services institution. Certain of the actual or threatened legal actions or regulatory investigations include claims for substantial penalties, compensatory and/or punitive damages or claims for indeterminate amounts of damages. In some cases, the third-party entities that are, or would otherwise be, the primary defendants in such cases are bankrupt, in financial distress, or may not honor applicable indemnification obligations. These actions have included, but are not limited to, antitrust claims, claims under various false claims act statutes, and matters arising from our sales and trading businesses and our activities in the capital markets.
Each of Morgan Stanley and the Company is also involved, from time to time, in other reviews, investigations and proceedings (both formal and informal) by governmental and self-regulatory agencies regarding the Company’s business and involving, among other matters, sales, trading, financing, prime brokerage, market-making activities, investment banking advisory services, capital market activities, financial products or offerings sponsored, underwritten, or sold by the Company, wealth and investment management services, and accounting and operational matters, certain of which may result in adverse judgments, settlements, fines, penalties, disgorgement, restitution, forfeiture, injunctions, limitations on our ability to conduct certain business, or damages.other relief.
MS&Co.The Company is a Delaware limited liability company with its main business office located at 1585 Broadway, New York, New York 10036. Among other registrations and memberships, MS&Co.the Company is registered as a futures commission merchant and is a member of the National Futures Association.
10
During the preceding five years, the following administrative, civil, or criminal actions pending, on appeal or concluded against MS&Co.the Company or any of its principals are material within the meaning of CFTC Rule 4.24(l)(2) or 4.34(k)(2):
Regulatory and Governmental Matters.Matters
The Company has been responding to subpoenas and other requests for information fromOn January 12, 2024, the Enforcement Division of the U.S. Securities and Exchange Commission and the United States Attorney’s Office for the Southern District of New York (“USAO”) and the SEC announced they had reached settlement agreements with the Company in connection with their investigations into various aspects of the Company’s blocks business, certain related sales and trading practices, and applicable controls (the “Investigations”). The Investigations are focused on whetherbusiness. Specifically, the Company and/orentered into a three-year non-prosecution agreement (“NPA”) with the USAO that included the payment of forfeiture, restitution, and a criminal fine for making false statements in connection with the sale of certain block trades from 2018 through August 2021. The NPA required the Company to admit responsibility for certain acts of its employees shared and/or used information regarding impending block transactions in violation of federal securities laws and regulations. The Company is continuingto continue to cooperate with the Investigations and is respondingprovide certain information to the requests.USAO for the term of the agreement. Additionally, the SEC charged the Company with violations of Section 10(b) of the Exchange Act and Rule 10b-5(b) thereunder for the disclosure of confidential information about block trades and also violations of Section 15(g) of the Exchange Act for the failure to enforce its policies concerning the misuse of material non-public information related to block trades. As part of the SEC agreement, the Company paid disgorgement and a civil penalty. After the agreed-upon credits were applied, the Company paid a total amount of approximately $249 million under both settlements. The Company also faces potential civil liability arising from claims that have been or may be asserted by, among others, block transaction participants who contend they were harmed or disadvantaged including, among other things, as a result of a share price decline allegedly caused by the activities of the Company and/or its employees, or as a result of the Company’s and/or its employees’ failure to adhere to applicable laws and regulations. In addition, the Company has responded to demands from shareholders under Section 220 of the Delaware General Corporation Law for books and records concerning the Investigations.investigations.
On September 30, 2020, the SEC entered into a settlement order with MS&Co.the Company settling an administrative action which relates to MS&Co.’sthe Company’s violations of the order marking requirements of Regulation SHO of the Exchange Act resulting from its improper use of aggregation units in structuring the Firm’s equity swaps business. The order found that MS&Co.the Company improperly operated its equity swaps business without netting certain “long” and “short” positions as required by Rule 200(c) of Regulation SHO. The order found that the long exposure to an equity security (the “Long Unit”) and the short exposure to an equity security (the “Short Unit”) were not independent from one another and did not have separate trading strategies or objectives without regard to each other, and that the Long and Short Units were not eligible for the exception in Rule 200(f) of Regulation SHO. The order found that MS&Co.the Company willfully violated Section 200(g) of Regulation SHO. MS&Co.The Company consented, without admitting or denying the findings and without adjudication of any issue of law or fact, to a censure; to cease and desist from committing or causing future violations; to pay a civil penalty of $5 million; and to comply with the undertaking enumerated in the order.
The Firm has reached agreements in principle with two regulatory agencies—the SEC for $125 million and the CFTC for $75 million— to resolve record-keeping related investigations by those agencies relating to business communications on messaging platforms that had not been approved by the Firm. The Company was one of the entities involved in these investigations, and has recognized a provision of $63 million in anticipation of concluding the settlement with the SEC. On September 27, 2022, the Firm’s settlements with the SEC and the CFTC became effective.
11
Civil Litigation
On August 18, 2009, Relators Roger Hayes and C. Talbot Heppenstall, Jr., filed a qui tam action in New Jersey state court styled State of New Jersey ex. rel. Hayes v. Bank of America Corp., et al.al. The complaint, filed under seal pursuant to the New Jersey False Claims Act, alleged that the Company and several other underwriters of municipal bonds had defrauded New Jersey issuers by misrepresenting that they would achieve the best price or lowest cost of capital in connection with certain municipal bond issuances. On March 17, 2016, the court entered an order unsealing the complaint. On November 17, 2017, Relators filed an amended complaint to allege the Company mispriced certain bonds issued in twenty-three bond offerings between 2008 and 2017, having a total par amount of $6,946$6,900 million. The complaint seeks, among other relief, treble damages. On February 22, 2018, the Company moved to dismiss the amended complaint, and on July 17, 2018, the court denied the Company’s motion. On October 13, 2021, following a series of voluntary and involuntary dismissals, Relators limited their claims to certain bonds issued in five offerings the Company underwrote between 2008 and 2011, having a total par amount of $3,856$3,900 million. On August 22, 2023, the Firm reached an agreement in principle to settle the litigation.
10
On May 17, 2013, plaintiff in IKB International S.A. in Liquidation, et al. v. Morgan Stanley, et al. filed a complaint against MS&Co.the Company and certain affiliates in the Supreme Court of the State of New York, New York County (“Supreme Court of NY”). The complaint alleges that defendants made material misrepresentations and omissions in the sale to plaintiff of certain mortgage pass-through certificates backed by securitization trusts containing residential mortgage loans. The total amount of certificates allegedly sponsored, underwritten and/or sold by MS&Co.the Company to plaintiff was approximately $133 million. The complaint alleges causes of action against MS&Co.the Company for common law fraud, fraudulent concealment, aiding and abetting fraud, and negligent misrepresentation, and seeks, among other things, compensatory and punitive damages. On October 29, 2014, the court granted in part and denied in part MS&Co.’sthe Company’s motion to dismiss. All claims regarding four certificates were dismissed. After these dismissals, the remaining amount of certificates allegedly issued by MS&Co.the Company or sold to plaintiff by MS&Co.the Company was approximately $116 million. On August 11, 2016, the Appellate Division, First Department (“First Department”) affirmed the trial court’s decision denying in part MS&Co.’sthe Company’s motion to dismiss the complaint. On July 15, 2022, MS&Co.the Company filed a motion for summary judgment. AtOn March 1, 2023, the court granted in part and denied in part the Company’s motion for summary judgment, narrowing the alleged misrepresentations at issue in the case. On March 14, 2023, the Company filed its notice of appeal, and on March 21, 2023, plaintiffs filed their notice of cross appeal. As of December 25, 2019, the current unpaid balance of the mortgage pass-through certificates at issue in this action was approximately $22 million, and the certificates had incurred actual losses of $58 million. Based on currently available information, MS&Co.the Company believes it could incur a loss in this action up to the difference between the $22 million unpaid balance of these certificates (plus any losses incurred) and their fair market value at the time of a judgment against MS&Co.,the Company, or upon sale, plus pre- and post-judgment interest, fees and costs. MS&Co.The Company may be entitled to be indemnified for some of these losses and to an offset for interest received by the plaintiff prior to a judgment.
In August
12
Beginning in February of 2017, MS&Co.2016, the Company was named as a defendant in amultiple purported antitrust class actionactions now consolidated into a single proceeding in the United States District Court for the Southern District of New York (“SDNY”) styled Iowa Public Employees’ Retirement System et al. v. Bank of America Corporation et al.In Re: Interest Rate Swaps Antitrust Litigation. Plaintiffs allege, inter alia, that MS&Co.,the Company, together with a number of other financial institution defendants violated U.S. antitrust laws and New York state lawantitrust laws from 2008 through December of 2016 in connection with their alleged efforts to prevent the development of electronic exchange-based platforms for securities lending. The class action complaint wasinterest rate swaps trading. Complaints were filed both on behalf of a purported class of borrowers and lendersinvestors who entered into stock loan transactions withpurchased interest rate swaps from defendants, as well as on behalf of three operators of swap execution facilities that allegedly were thwarted by the defendants.defendants in their efforts to develop such platforms. The class action complaint seeks,consolidated complaints seek, among other relief, certification of the investor class of plaintiffs and treble damages. On September 27, 2018,July 28, 2017, the court granted in part and denied in part the defendants’ motion to dismiss the complaints. On December 15, 2023, the court denied the class action complaint. Plaintiffs’plaintiffs’ motion for class certification was referred bycertification. On December 29, 2023, the Districtclass plaintiffs petitioned the United States Court of Appeals for the Second Circuit for leave to a magistrate judge who, on June 30, 2022, issued a report and recommendationappeal that the District Court certify a class. The motion for class certification and the parties’ objections to the report and recommendation are pending before the District Court.decision.
On August 13, 2021, the plaintiff in Camelot Event Driven Fund, a Series of Frank Funds Trust v. Morgan Stanley & Co. LLC, et al. filed in the Supreme Court of NY a purported class action complaint alleging violations of the federal securities laws against ViacomCBS (“Viacom”), certain of its officers and directors, and the underwriters, including the Company, of two March 2021 Viacom offerings: a $1,700 million Viacom Class B Common Stock offering and a $1,000 million offering of 5.75% Series A Mandatory Convertible Preferred Stock (collectively, the “Offerings”). The complaint alleges, inter alia, that the Viacom offering documents for both issuances contained material omissions because they did not disclose that certain of the underwriters, including the Company, had prime brokerage relationships and served as counterparties to certain derivative transactions with Archegos Capital Management LP, (“Archegos”), a fund with significant exposure to Viacom securities across multiple prime brokers. The complaint, which seeks, among other things, unspecified compensatory damages, alleges that the offering documents did not adequately disclose the risks associated with Archegos’s concentrated Viacom positions at the various prime brokers, including that the unwind of those positions could have a deleterious impact on the stock price of Viacom. On November 5, 2021, the complaint was amended to add allegations that defendants failed to disclose that certain underwriters, including the Company, had intended to unwind Archegos’s Viacom positions while simultaneously distributing the Offerings. On February 6, 2023, the court issued a decision denying the motions to dismiss as to the Company and the other underwriters, but granted the motion to dismiss as to Viacom and the Viacom individual defendants. On February 15, 2023, the underwriters, including the Firm, filed their Noticesnotices of Appealappeal of the denial of their motions to dismiss. On March 10, 2023, the plaintiff filed a Notice of Appeal of the dismissal of Viacom and the individual Viacom defendants. On January 4, 2024, the court granted the plaintiff’s motion for class certification. On February 14, 2024, the defendants filed their notice of appeal.
13
Settled Civil Litigation
On July 15, 2010, China Development Industrial Bank (“CDIB”) filed a complaint against MS&Co.,the Company, styled China Development Industrial Bank v. Morgan Stanley & Co. Incorporated et al., in the Supreme Court of NY. The complaint related to a $275 million credit default swap (“CDS”) referencing the super senior portion of the STACK 2006-1 CDO. The complaint asserted claims for common law fraud, fraudulent inducement and fraudulent concealment and alleges that MS&Co.the Company misrepresented the risks of the STACK 2006-1 CDO to CDIB, and that MS&Cothe Company knew that the assets backing the CDO were of poor quality when it entered into the CDS with CDIB. On March 22, 2021, the parties entered into a settlement agreement. On April 16, 2021, the court entered a stipulation of voluntary discontinuance, with prejudice.
On October 15, 2010, the Federal Home Loan Bank of Chicago filed a complaint against MS&Co.the Company and other defendants in the Circuit Court of the State of Illinois, styled Federal Home Loan Bank of Chicago v. Bank of America Funding Corporation et alal.. A corrected amended complaint was filed on April 8, 2011, which allegesalleged that defendants made untrue statements and material omissions in the sale to plaintiff of a number of mortgage pass-through certificates backed by securitization trusts containing residential mortgage loans and asserts claims under Illinois law. The total amount of certificates allegedly sold to plaintiff by MS&Co.the Company at issue in the action was approximately $203 million. The complaint seeks,sought, among other things, to rescind the plaintiff’s purchase of such certificates. On November 4, 2021, the Firm entered into an agreement to settle the litigation.
On April 20, 2011, the Federal Home Loan Bank of Boston filed a complaint against MS&Co. and other defendants in the Superior Court of the Commonwealth of Massachusetts styled Federal Home Loan Bank of Boston v. Ally Financial, Inc. F/K/A GMAC LLC et al. An amended complaint was filed on June 29, 2012 and alleged that defendants made untrue statements and material omissions in the sale to plaintiff of certain mortgage pass-through certificates backed by securitization trusts containing residential mortgage loans. The total amount of certificates allegedly issued by MS&Co. or sold to plaintiff by MS&Co. was approximately $385 million. The amended complaint raised claims under the Massachusetts Uniform Securities Act, the Massachusetts Consumer Protection Act and common law and sought, among other things, to rescind the plaintiff’s purchase of such certificates. On November 25, 2013, July 16, 2014, and May 19, 2015, respectively, the plaintiff voluntarily dismissed its claims against MS&Co. with respect to three of the securitizations at issue. After these voluntary dismissals, the remaining amount of certificates allegedly issued by MS&Co. or sold to plaintiff by MS&Co. was approximately $332 million. On July 13, 2018, the parties reached an agreement in principle to settle the litigation.
11
On May 3, 2013, plaintiffs in Deutsche Zentral-Genossenschaftsbank AG et al. v. Morgan Stanley et al. filed a complaint against MS&Co., certain affiliates, and other defendants in the Supreme Court of NY. The complaint alleged that defendants made material misrepresentations and omissions in the sale to plaintiffs of certain mortgage pass-through certificates backed by securitization trusts containing residential mortgage loans. The total amount of certificates allegedly sponsored, underwritten and/or sold by MS&Co. to plaintiff was approximately $634 million. The complaint alleged causes of action against MS&Co. for common law fraud, fraudulent concealment, aiding and abetting fraud, negligent misrepresentation, and rescission and sought, among other things, compensatory and punitive damages. On June 26, 2018, the parties entered into an agreement to settle the litigation.
On April 1, 2016, the California Attorney General’s Office filed an action against MS&Co.the Company in California state court styled California v. Morgan Stanley, et al., on behalf of California investors, including the California Public Employees’ Retirement System and the California Teachers’ Retirement System. The complaint alleged that MS&Co.the Company made misrepresentations and omissions regarding residential mortgage-backed securities and notes issued by the Cheyne SIV, and asserted violations of the California False Claims Act and other state laws and sought treble damages, civil penalties, disgorgement, and injunctive relief. On April 24, 2019, the parties reached an agreement to settle the litigation.
In August of 2017, the Company was named as a defendant in a purported antitrust class action in the United States District Court for the SDNY styled Iowa Public Employees’ Retirement System et al. v. Bank of America Corporation et al. Plaintiffs allege, inter alia, that the Company, together with a number of other financial institution defendants, violated U.S. antitrust laws and New York state law in connection with their alleged efforts to prevent the development of electronic exchange-based platforms for securities lending. The class action complaint was filed on behalf of a purported class of borrowers and lenders who entered into stock loan transactions with the defendants. The class action complaint seeks, among other relief, certification of the class of plaintiffs and treble damages. On September 27, 2018, the court denied the defendants’ motion to dismiss the class action complaint. Plaintiffs’ motion for class certification was referred by the District Court to a magistrate judge who, on June 30, 2022, issued a report and recommendation that the District Court certify a class. The motion for class certification and the parties’ objections to the report and recommendation are pending before the District Court. On May 20, 2023, the Firm reached an agreement in principle to settle the litigation. On September 1, 2023, the court granted preliminary approval of the settlement.
14
Beginning on March 25, 2019, MS&Co.the Company was named as a defendant in a series of putative class action complaints filed in the United States District Court for the SDNY, the first of which is styled Alaska Electrical Pension Fund v. BofA Secs., Inc., et al. Each complaint alleged a conspiracy to fix prices and restrain competition in the market for unsecured bonds issued by the following Government-Sponsored Enterprises: the Federal National Mortgage Association; the Federal Home Loan Mortgage Corporation; the Federal Farm Credit Banks Funding Corporation; and the Federal Home Loan Banks. The purported class period for each suit is from January 1, 2012 to June 1, 2018. Each complaint raised a claim under Section 1 of the Sherman Act and sought, among other things, injunctive relief and treble compensatory damages. On May 23, 2019, plaintiffs filed a consolidated amended class action complaint styled In re GSE Bonds Antitrust Litigation, with a purported class period from January 1, 2009 to January 1, 2016. On June 13, 2019, the defendants filed a joint motion to dismiss the consolidated amended complaint. On August 29, 2019, the court denied MS&Co.’sthe Company’s motion to dismiss. On December 15, 2019, MS&Co.the Company and certain other defendants entered into a stipulation of settlement to resolve the action as against each of them in its entirety. On June 16, 2020, the court granted final approval of the settlement.
Additional lawsuits containing claims similar to those described above may be filed in the future. In the course of its business, MS&Co.,the Company, as a major futures commission merchant, is party to various civil actions, claims and routine regulatory investigations and proceedings that the General Partner believes do not have a material effect on the business of MS&Co. MS&Co.the Company. The Company may establish reserves from time to time in connections with such actions.
15
Item 4. Mine Safety Disclosures. Not applicable.
1216
PART II
Item 5. Market for Registrant’s Common Equity, Related Security Holder Matters and Issuer Purchase of Equity Securities.
| (a) | Market Information. The Partnership has issued no stock. There is no public market for the Redeemable Units. |
| (b) | Holders. The number of holders of Redeemable Units as of February |
| (c) | Dividends. The Partnership did not declare any distributions in |
| (d) | Securities Authorized for Issuance Under Equity Compensation Plans. None. |
| (e) | Performance Graph. Not applicable. |
| (f) | Recent Sales of Unregistered Securities-Use of Proceeds from Registered Securities. The public offering of Redeemable Units terminated on November 30, 2008. For the twelve months ended December 31, 2023, 2022 |
Redeemable Units are issued in reliance upon applicable exemptions from registration under Section 4(a)(2) of the Securities Act and Section 506 of Regulation D promulgated thereunder. Redeemable Units are purchased by accredited investors, as described in Regulation D. In determining the applicability of the private offering exemption, the General Partner relies on the fact that Redeemable Units are purchased by accredited investors in a private offering. |
Proceeds of the net offering are used for the trading of commodity interests including futures, option and forward contracts. |
| (g) | Purchases of Equity Securities by the Issuer and Affiliated Purchasers. |
The following chart sets forth the purchases of limited partner Redeemable Units for each Class by the Partnership. |
Period | Class A (a) Total Number of Redeemable Units Purchased* | Class A (b) Average Price Paid per Redeemable Unit** | Class Z (a) Total Number of Redeemable Units Purchased* | Class Z (b) Average Price Paid per Redeemable Unit** | (c) Total Number of Redeemable Units Purchased as Part of Publicly Announced Plans or Programs | (d) Maximum Number (or Approximate Dollar Value) of Redeemable Units that May Yet Be Purchased Under the Plans or Programs | ||||||||||||||||
October 1, 2022 - October 31, 2022 | 651.3470 | $ | 944.98 | N/A | N/A | N/A | N/A | |||||||||||||||
November 1, 2022 - November 30, 2022 | 275.0390 | $ | 883.09 | N/A | N/A | N/A | N/A | |||||||||||||||
December 1, 2022 - December 31, 2022 | 309.3450 | $ | 901.95 | 24.4530 | $ | 1,172.31 | N/A | N/A | ||||||||||||||
| 1,235.7310 | $ | 920.43 | 24.4530 | $ | 1,172.31 | |||||||||||||||||
| Period | Class A (a) Total Number of Redeemable Units Purchased* | Class A (b) Average Price Paid per Redeemable Unit** | (c) Total Number of Redeemable Units Purchased as Part of Publicly Announced Plans or Programs | (d) Maximum Number (or Approximate Dollar Value) of Redeemable Units that May Yet Be Purchased Under the Plans or Programs | ||||||||||
October 1, 2023 - October 31, 2023 | 561.0960 | $ | 870.17 | N/A | N/A | |||||||||
November 1, 2023 - November 30, 2023 | 303.6130 | $ | 830.28 | N/A | N/A | |||||||||
December 1, 2023 - December 31, 2023 | 649.0160 | $ | 801.93 | N/A | N/A | |||||||||
| 1,513.7250 | $ | 832.91 | ||||||||||||
| * | Generally, limited partners are permitted to redeem their Redeemable Units as of the end of each month on three business days’ notice to the General Partner. Under certain circumstances, the General Partner can compel redemption, although to date the General Partner has not exercised this right. Purchases of Redeemable Units by the Partnership reflected in the chart above were made in the ordinary course of the Partnership’s business in connection with effecting redemptions for limited partners. |
| ** | Redemptions of Redeemable Units are effected as of the end of each month at the net asset value per Redeemable Unit as of that day. No fee will be charged for redemptions. |
13
Item 6. Reserved.
Item 7. Management’s Discussion and Analysis of Financial Condition and Results of Operations.
Overview
The Partnership aims to achieve substantial capital appreciation and permit investors to diversify a traditionally structured stock and bond portfolio. The Partnership attempts to accomplish its objectives through speculative trading in U.S. and international markets for currencies, interest rates, stock indices, agricultural and energy products and precious and base metals. The Partnership engages in such trading directly, and previously also engaged indirectly in such trading through investment in the Funds. The Funds could have employed futures, options on futures, forward, spot and swaps contracts in those markets.
The General Partner/Trading ManagerPartner manages all business of the Partnership, as well as all business of the Funds prior to the Partnership’s respective full redemptions.Partnership. The General Partner has delegated its responsibility for the investment of the Partnership’s assets to the Advisors. The General Partner/Trading ManagerPartner engages a team of approximately 9 professionals whose primary emphasis is on attempting to maintain quality control among the Advisors to the funds operated or managed by the General Partner/Trading Manager.Partner. A full-time staff of due diligence professionals uses state-of-the-art technology and on-site evaluations to monitor new and existing futures money managers. The accounting and operations staff provides processing of subscriptions and redemptions and reporting to limited partners and regulatory authorities. The General Partner also engages staff involved in marketing and sales support.
17
Responsibilities of the General Partner/Trading ManagerPartner include:
due diligence examinations of the Advisors;
selection, appointment and termination of the Advisors;
negotiation of the management agreements; and
monitoring the activity of the Advisors.
In addition, the General Partner/Trading ManagerPartner prepares, or assists the Administrator in preparing, the books and records and provides, or assists the Administrator in providing, the administrative and compliance services that are required by law or regulation from time to time in connection with the operation of the Partnership, as well as the operation of the Funds prior to the Partnership’s respective full redemptions.Partnership.
While the Partnership has and the Funds had, the right to seek lower commission rates from other commodity brokers at any time, the General Partner/Trading ManagerPartner believes that the customer agreements and other arrangements with the commodity broker are fair, reasonable and competitive.
The programs traded by each Advisor on behalf of the Partnership as of December 31, 20222023 were: DCM — DCM’s Diversified Alpha Program, Drury — Drury Diversified Trend-Following Program, Episteme — Systematic Quest Program and 2021Millburn — Multi-Markets Program. The programs traded by each Advisor on behalf of the Partnership as of December 31, 2022 were: DCM — DCM’s Diversified Alpha Program, Episteme — Systematic Quest Program, ISAM SM — Systematic Trend Programme and Millburn — Multi-Markets Program.
As of December 31, 20222023 and September 30, 2022,2023, the Partnership’s assets were allocated among the Advisors in the following approximate percentages:
Advisor | December 31, 2022 | December 31, 2022 (percentage of Partners’ Capital) | September 30, 2022 | September 30, 2022 (percentage of Partners’ Capital) | December 31, 2023 | December 31, 2023 (percentage of Partners’ Capital) | September 30, 2023 | September 30, 2023 (percentage of Partners’ Capital) | ||||||||||||||||||||||||
DCM | $ | 18,156,276 | 28% | $ | 16,778,349 | 24% | $ | 14,350,619 | 27% | $ | 14,297,703 | 23% | ||||||||||||||||||||
Drury | $ | 10,208,901 | 19% | $ | 11,997,818 | 20% | ||||||||||||||||||||||||||
Episteme | $ | 18,182,719 | 28% | $ | 20,227,318 | 30% | $ | 13,316,369 | 25% | $ | 16,531,931 | 27% | ||||||||||||||||||||
ISAM SM | $ | 14,301,742 | 22% | $ | 16,398,505 | 24% | ||||||||||||||||||||||||||
Millburn | $ | 14,000,599 | 21% | $ | 14,473,409 | 21% | $ | 11,944,525 | 23% | $ | 15,589,208 | 25% | ||||||||||||||||||||
Unallocated | $ | 746,362 | 1% | $ | 742,833 | 1% | $ | 3,224,493 | 6% | $ | 2,760,342 | 5% | ||||||||||||||||||||
DCM Systematic Advisors SA
DCM directly trades a portion of the Partnership’s assets in accordance with its Diversified Alpha Strategy (the “Strategy”) utilizes a multi-model approach allowing the program to capture trading opportunities across three different model styles and further diversified through a wide spectrum of different time horizons. The average holding period for positions typically ranges from one week to a couple of months, depending on the sub-strategy. With this diversified return profile, the Strategy enjoys the flexibility that allows it to aim for positive returns as the market environment shifts and evolves. The majority of the Strategy’s exposure over the long-term is allocated to non-trend models that have historically proven to be uncorrelated to traditional asset classes, and is meant to provide an alternative to the trend-dominated CTA space. The Strategy is comprised of some forty products, future contract spanning across equities, volatility, bonds, interest rates, currencies, energy, metal, and agricultural markets.
Diversified Alpha Program is comprised of only quantitative models, which are categorized as behavioral, relative value, and macro models. The behavioral models anticipate the flows of large market participants to take advantage of their market impact. The relative value premia models focus on capturing relative-value opportunities derived from selected risk premia with a strong emphasis on tail-risk protection. The macro strategies use a broad range of statistical models derived from economic and technical principles.
Drury Diversified Trend-Following Program
14Drury trades a portion of the Partnership’s assets in accordance with its Diversified Trend-Following Program. The Diversified Trend-Following Program is built on elements of trend following and diversification. The portfolio emphasizes diversification by trading metals, agricultural products, foreign exchange, stock index futures, energy products, financial instruments and tropical products (softs). Trading is based upon the premise that research can reveal pricing inefficiencies that can be exploited by a systematic disciplined approach to trading futures markets.
The Diversified Trend-Following Program trades approximately 70 portfolio instruments and is generally positioned in 40 of these instruments on average. Positions can be short as well as long. The Diversified Trend-Following Program has no market or sector bias, based on the belief that each instrument can produce long-term profits through the application of independent technical analysis and risk management. Numerous models are traded, but all are trend-following in nature.
Episteme Capital Partners (UK) LLP, Episteme Capital Partners (US) LLC, and Episteme Capital Partners (Cayman) LTD
Episteme trades a portion of the Partnership’s assets in accordance with their Systematic Quest Program. The Systematic Quest Program is a diversified systematic global macro program that seeks to maximize returns by pursuing a diversified portfolio of systematic strategies subject to the constraints of its risk management framework. The trading strategies are generally medium-term and aim to exploit a number of sources of alpha based upon fundamental, technical, and liquidity effects. This managed futures strategy consists of seven different model styles, which include carry, cross-market, idiosyncratic, liquidity, mean reversion, momentum, and value models. By applying each of these trading styles, across multiple time horizons, the strategy blends multiple alpha drivers seeking consistent returns, uncorrelated to traditional asset classes and the managed futures asset class.
18
Millburn Ridgefield Corporation
Millburn trades a portion of the Partnership’s assets in accordance with its Multi-Markets Program. The Multi-Markets Program implements a group of quantitative models that collectively trade futures, forward and spot contracts on currencies, interest rate instruments, stock indices, metals, energy and agricultural commodities. The aim of the Multi-Markets Program is to target opportunities in a wide range of global markets under a variety of conditions. The Multi-Markets Program’s trading strategies are based on the implementation of a multi-data input, statistical/machine learning framework, and are 100% systematic and quantitative in nature. This framework utilizes price, price-derivative, and non-price data sources or “features,” in an attempt to provide an informed, context-specific and continuous view of portfolio positioning (long or short, and to what extent) in a particular market. Millburn’s investment approach centers on the development of process-driven, measurable and risk-controlled methods to trade a universe of approximately 105 (which number may change from time to time) global currency spot and forward markets, and exchange-traded equity, fixed income and commodity futures markets.
ISAM Systematic Management/International Standard Asset Management
ISAM SM and ISAM directly traded, a managed account in the name of the Partnership pursuant to ISAM SM’s/ISAM’s Systematic Trend Programme. The Systematic Trend Programme’s investment objective was to achieve growth in the value of its assets, providing absolute returns with low correlations to the stock and bond markets through the implementation of systematic trading models. The system traded in the global futures markets covering stock indices, interest rates, currency, energy commodities, precious and base metals and agricultural products, and might also have traded in OTC foreign exchange contracts (including currency spot contracts) and exchange-cleared swap and forward contracts.
The Advisor relied on the comprehensive quantitative analysis of historical data to develop trading strategies. These proprietary trading strategies were then implemented subject to strict risk management and controls. The Advisor’s guiding principle was that a disciplined trading approach combined with a broad diversification over a large number of markets, instruments and investment strategies was likely to lead to superior investment results, while maintaining risk at a level comparable to that associated with traditional asset classes. The target volatility of the portfolio was 15-20% annualized.
The Systematic Trend Programme’s investment strategy was to harness the performance of several systematic investment programs in a balanced portfolio, each program selected primarily for its methods of generating returns from global investments that were not highly correlated to the performance of traditional investment strategies such as the stock and bond markets. The goal remained to maximize diversification across various trading strategies and markets with the purpose of achieving capital appreciation objectives for investors while reducing overall portfolio volatility.
ADG Capital Management LLP
The portion of the Partnership’s assets that was allocated to ADG for trading were not invested in commodity interests directly. ADG’s allocation of the Partnership’s assets was invested in ADG Master. ADG traded the Partnership’s assets allocated to it pursuant to its Systematic Macro Strategy. The Systematic Macro Strategy sought to provide investors with positive absolute returns through taking long and short positions on a global basis in a broad range of financial instruments. The Systematic Macro Strategy would take directional and relative value positions based on systematically applied fundamental global macro analysis and ADG’s assessment of prevailing economic conditions and other relevant factors. The Systematic Macro Strategy aimed for the generation of excess returns by means of tactical reallocation of the risk budget between asset classes, within asset classes and between various risk factors.
The Systematic Macro Strategy was based on a proprietary software tool which analyzed macroeconomic and market information and produced recommended portfolios and trades for assessment by ADG. The methodology coded into the software made use of theory based analysis of markets and advanced risk management techniques.
The Systematic Macro Strategy was composed of four independent models, consisting of one directional trading model and three relative value models. The Systematic Macro Strategy would take directional and relative value positions based on systematic analysis of global macro and economic data. Each of these models was built from 7-11 factors which were uncorrelated and fundamental drivers of markets. The Systematic Macro Strategy utilized a total of 38 factors, which ranged from GDP measurements to curve analysis.
Aquantum GmbH
The portion of the Partnership’s assets that was allocated to Aquantum for trading were not invested in commodity interests directly. Aquantum’s allocation of the Partnership’s assets was invested in Aquantum Master. Aquantum traded the Partnership’s assets allocated to it pursuant to its Aquantum Commodity Spread Program. The Aquantum Commodity Spread Program was a systematic commodity market-neutral trading program. It was designed to benefit from seasonal price dislocations in the forward structure of numerous commodity futures markets across all sectors (energy, softs, grains, livestock, and metals) which are the result of changing market participants’ expectations and fundamental factors like weather, climate, trends in consumption, harvest cycles, feed and storage costs, which typically trigger supply and demand dislocations.
While the Aquantum Commodity Spread Program may have combined multiple spread positions per market, each individual trade was implemented as an intra-market calendar spread and was placed according to a 100% systematic methodology. Due to the seasonal character of the patterns traded, the Aquantum Commodity Spread Program was a “time” based strategy.
15
FORT, L.P. (Global Trend Trading Program)
FORT traded a portion of the Partnership’s assets in accordance with its Global Trend Trading Program.
FORT’s Global Trend Trading Program was a systematic, technical trend-following futures trading strategy that attempted to capture large moves in futures contracts identified by the particular strategy. The Global Trend Trading Program generally took a momentum-based approach, which bought when prices rise and sold when prices decline. The Global Trend Trading Program did not attempt to forecast trends, but rather, attempted to capitalize on existing trends identified by the trading program. A certain amount of time must elapse for this strategy to infer and confirm a trend, as well as determine that a trend had ceased. Therefore, the Global Trend Trading Program generally entered and exited a trend late. Trend-following strategies had the potential to perform well during long-term, high-volatility markets or during periods of market stress; however, they might experience flat or negative performance during periods in which no major prices trends developed or when markets exhibited short-term volatility.
Total risk was measured primarily by using the margin-to-equity ratio, which was targeted not to exceed 14% for a fully funded account. The margin-to-equity ratio was monitored systematically as well as by FORT’s trading principals.
FORT, L.P. (Global Contrarian Trading Program)
FORT also previously traded a portion of the Partnership’s assets through FORT Contrarian Master in accordance with its Global Contrarian Trading Program.
FORT’s Global Contrarian Trading Program was a systematic, technical, trend-anticipating futures trading strategy that attempted to profit from emerging trends by identifying price behaviors that signaled possible turning points. Rather than attempting to identify existing trends, the Global Contrarian Trading Program attempted to anticipate trends before they occurred. Trading decisions were based primarily on an analysis of market prices, volume and volatility; factors external to the trading markets were incorporated only in rare cases. The Global Contrarian Trading Program generally operated on the theory that market prices reflect all known factors affecting supply and demand of a particular financial instrument.
The Global Contrarian Trading Program was designed to incorporate concepts akin to “channels,” which FORT defined using systematic, mathematical tools. The Global Contrarian Trading Program estimated a large number of channels and identified a confluence of channels to find resistance and support points. FORT believed that this style is markedly different from most trend-following strategies, which are generally late to enter and exit a trend. In contrast, the Global Contrarian Trading Program was designed to enter and exit a trend early. The Global Contrarian Trading Program generally sought to anticipate and capitalize on short to intermediate-term trends. Because the Global Contrarian Trading Program sought to anticipate trends in market prices, it had the potential to perform well even in what standard trend-following systems perceived as directionless periods.
The Global Contrarian Trading Program took positions while a market was moving against one of its signals. As a result, its performance could have been much more volatile than traditional trend-following models, but the potential for diversification was much greater. In an attempt to reduce the volatility of returns, the allocation of the Global Contrarian Trading Program’s capital was geographically diversified across Asia, Europe, Australia and North America. This diversification also provided the Global Contrarian Trading Program with opportunities to seek profits in a variety of market environments.
Total risk was measured primarily by using the margin-to-equity ratio, which was targeted not to exceed 14% for a fully funded account. The margin-to-equity ratio was monitored systematically as well as by FORT’s trading principals.
AE Capital Pty Limited
AE Capital’s philosophy was that markets are driven by fundamental themes and that those fundamental themes inherently change over time. AE Capital developed a proprietary systematic strategy that dynamically adapted to the fundamental themes quantified to be driving markets. New themes were identified by AE Capital’s trading principals primarily through fundamental research. Once a new theme was scientifically tested and deemed eligible it was incorporated into the theme adapting system framework. Capital was only allocated to a theme if the theme adapting system determined that the theme carried statistically significant information and improved the overall portfolio. Risk was minimized through a proprietary portfolio construction technique that diversified the portfolio in terms of the underlying currency exposures, trade time horizons and fundamental views.
Mesirow Financial International UK Limited/The Cambridge Strategy (Asset Management) Limited
Mesirow/Cambridge traded its Asian Markets Alpha Programme and Emerging Markets Alpha Programme, each a proprietary, systematic trading program, on behalf of Cambridge Master.
The Asian Markets Alpha Programme aimed to profit from short and medium term moves in the Asian markets’ currency pairs. To achieve this, a largely systematic approach was employed, designed to perform across diverse market environments. The process combined three decision making tools: a Systematic Technical Strategy, a Systematic Fundamental Strategy and a Market Information Strategy. During periods of higher volatility, the Systematic Technical Strategy used a series of proprietary trading algorithms operating over multiple timeframes. The algorithms combined trend continuation and trend reversal signals. During periods of lower volatility, the Systematic Fundamental Strategy reflected a predetermined set of positions designed to reflect ‘market’ views on the relative attractiveness of currencies versus the U.S. dollar, thereby realizing the inherent benefits of the carry trade. The Market Information Strategy leveraged the experience and global network of the Advisor’s portfolio managers to understand and exploit the behavior of other market participants and to participate in hedging and investment flows. It had characteristics often associated with discretionary managers. The Advisor’s proprietary Global Volatility Indicator was employed as the Advisor’s regime shifting mechanism within the systematic strategies. The Advisor believed that long run success was achieved through successful mitigation of downside returns with risk controlled at the portfolio, strategy and individual trade levels.
16
The Emerging Markets Alpha Programme aimed to profit from short and medium term moves in the developing markets’ currency pairs. To achieve this, a largely systematic approach was employed, designed to perform across diverse market environments. The process combined three decision making tools: a Systematic Technical Strategy, a Systematic Fundamental Strategy and a Market Information Strategy. During periods of higher volatility, the Systematic Technical Strategy used a series of proprietary trading algorithms operating over multiple timeframes. The algorithms combined trend continuation and trend reversal signals. During periods of lower volatility, the Systematic Fundamental Strategy reflected a predetermined set of positions designed to reflect ‘market’ views on the relative attractiveness of currencies versus the U.S. dollar, thereby realizing the inherent benefits of the carry trade. The Market Information Strategy leveraged the experience and global network of the Advisor’s portfolio managers to understand and exploit the behavior of other market participants and to participate in hedging and investment flows. It had characteristics often associated with discretionary managers. The Advisor’s proprietary Global Volatility Indicator was employed as the Advisor’s regime shifting mechanism within the systematic strategies. The Advisor believed that long run success was achieved through successful mitigation of downside returns with risk controlled at the portfolio, strategy and individual trade levels.
SECOR Capital Advisors, LP
SECOR’s investment objectives were to generate high risk-adjusted returns by: (i) investing across a diverse set of asset classes, geographies, factors, themes and time horizons, (ii) identifying and exploiting temporarily pronounced market inefficiencies or risk premia, (iii) employing dynamic risk-budgeting to minimize tail risk and potentially enable alpha to be generated through timing of exposures and (iv) utilizing sophisticated modeling techniques supported by straight-forward economic intuition and sound fundamentals. SECOR sought to target long-term annualized volatility of 15% and low long-term correlation to other hedge fund strategies and broader markets.
SECOR had a healthy respect for the general information efficiency of markets but believed that certain inefficiencies (or outsized risk premia) could exist in certain markets, and these or other inefficiencies (or risk premia) may periodically become more pronounced in particular market conditions. SECOR believed that it was feasible to construct an investment strategy that sought to capture such inefficiencies (premia) in pursuit of high risk-adjusted returns (or excess returns for benchmarked mandates) that were lowly correlated with broad stock and bond market returns (alpha).
SECOR employed statistical techniques and empirical analysis to help determine whether they believed that observed or conjectured alpha opportunities were real and, more importantly, likely to be sustained in the future. If properly employed, these techniques could have had certain advantages versus a purely judgmental approach including the potential ability to: control for the impact of particular factors, evaluate phenomena over a longer history, systematically assess confidence levels based on availability of data, evaluate performance over certain sub-periods and market cycles, identify certain possible causation and lead/lag effects, reduce certain common behavioral biases in human judgment and evaluate a range of factors in a systematic way.
When determining whether a factor should be used in driving SECOR’s models and strategies, conclusions derived from the statistical techniques were generally not sufficient. SECOR also sought to reconcile whether the findings were consistent with some economic, theoretical or behavioral intuition, including why a factor may lead to alpha and what conditions could cause a factor to cease to work at some point in the future. Although the statistical techniques that SECOR used to conduct its empirical evaluations may have been sophisticated, SECOR strove to keep the models that drove the investment process as simple as practicable.
SECOR used its proprietary models to systematically allocate and manage risk across a wide breadth of quantitative investment strategies, geographies and asset classes – a process known as risk budgeting. SECOR employed these models to construct a portfolio and manage risk. These strategies could have included currencies, commodities, equity indices, fixed income, cross-asset class trades and opportunistic strategies.
SECOR strongly believed in the benefits of diversification and that diversification should be sought across many aspects of the investment process. Under most circumstances, SECOR attempted to take positions in a large number of positions across a wide range of asset classes to enhance diversification.
SECOR also sought diversification across strategies, factors, themes and time horizons. Diversification of risk across strategies may have helped to produce a more consistent stream of returns by reducing the impact of poor performance in any one strategy. Recognizing that none of SECOR’s strategies would work at all times and, in fact, most strategies experienced periods of significant negative performance, SECOR sought to develop strategies in many asset classes and markets in which SECOR identified potential value. Within each strategy, it was also important to ensure that there was appropriate diversification across factors and themes and that the weightings of these themes could be controlled and easily changed dynamically as market conditions warranted, while taking into account factors such as liquidity, volatility, correlations, market impact and transaction costs. In portfolio construction, SECOR’s initial task was to identify, among other things, tilts, premia, signals, relative value pairs, anomalies, liquidity events and temporary price pressure that SECOR believed may provide attractive risk/return contributions on a stand-alone basis and in the context of a broader portfolio. SECOR then combined data and general conviction levels (in the form of priors) regarding the potential contributions and correlations of these exposures to help determine their allocations within the portfolio, utilizing a thoughtful, systematic risk-budgeting approach that sought to enable these exposures to be dynamic, rather than static. In doing so, part of SECOR’s alpha proposition could have resided in timing exposures, or identifying the appropriate times to: increase or decrease exposures and/or include or exclude exposures from the portfolio altogether.
The foregoing is not a comprehensive list of the methods of analysis and/or investment strategies that may have been employed by SECOR. SECOR intended to continue to review and refine its strategies and to examine new ideas and opportunities. Additional strategies may have been added from time to time.
No assurance can be given that the Advisors’ strategies will be successful or that they will generate profits for the Partnership.
1719
Specific Fund level performance information is included in Note 6 to the financial statements included in “Item 8. Financial Statements and Supplementary Data.”
(a) Liquidity.
The Partnership does not engage in sales of goods or services. Its assets are its (i) equity in trading account, consisting of unrestricted and restricted cash, net unrealized appreciation on open futures contracts, net unrealized appreciation on open forward contracts and investment in U.S. Treasury bills at fair value, as applicable, and (ii) interest receivable. Because of the low margin deposits normally required in commodity futures trading, relatively small price movements may result in substantial losses to the Partnership, through its direct investments and also previously through its investment in the Funds.Partnership. While substantial losses could lead to a material decrease in liquidity, no such illiquidity occurred during the year ended December 31, 2022.2023.
To minimize the risk relating to low margin deposits, the Partnership follows certain trading policies, including:
| (i) | The Partnership invests its assets only in commodity interests that an Advisor believes are traded in sufficient volume to permit ease of taking and liquidating positions. Sufficient volume, in this context, refers to a level of liquidity that an Advisor believes will permit it to enter and exit trades without noticeably moving the market. |
| (ii) | An Advisor will not initiate additional positions in any commodity if these positions would result in aggregate positions requiring a margin of more than 66 2/3% of the Partnership’s net assets allocated to that Advisor. |
| (iii) | The Partnership may occasionally accept physical delivery of a commodity. Unless such delivery is disposed of promptly by retendering the warehouse receipt representing the delivery to the appropriate clearinghouse, the physical commodity position will be fully hedged. |
| (iv) | The Partnership does not employ the trading technique commonly known as “pyramiding,” in which the speculator uses unrealized profits on existing positions as margin for the purchase or sale of additional positions in the same or related commodities. |
| (v) | The Partnership does not utilize borrowings except if the Partnership purchases or takes delivery of commodities. |
| (vi) | The Advisors may, from time to time, employ trading strategies such as spreads or straddles on behalf of the Partnership. “Spreads” and “straddles” describe commodity futures trading strategies involving the simultaneous buying and selling of futures contracts on the same commodity but involving different delivery dates or markets. |
| (vii) | The Partnership will not permit the churning of its commodity trading account. The term “churning” refers to the practice of entering and exiting trades with a frequency unwarranted by legitimate efforts to profit from the trades, indicating the desire to generate commission income. |
| (viii) | The Partnership will not purchase, sell, or trade securities (except securities approved by the CFTC for investment of customer funds). |
| (ix) | The Advisors will trade only in those futures interests that have been approved by the General Partner. |
| (x) | The Partnership will, except under extraordinary circumstances, maintain positions in futures interests in at least two market segments (i.e., agricultural items, industrial items (including energies), metals, currencies, and financial instruments (including stock, financial and economic indexes)) at any one time. |
| (xi) | The Advisors will not generally take a position after the first notice day in any futures interest during the delivery month of the futures interest, except to match. |
The Funds previously followed the same trading polices above prior to the Partnership’s respective full redemptions.
From January 1, 20222023 through December 31, 2022,2023, the Partnership’s average margin to equity ratio (i.e., the percentage of assets on deposit required for margin) was approximately 19.2%21.4%. The foregoing margin to equity ratio took into account cash held in the Partnership’s name, as well as the allocable value of the positions and cash held on behalf of the Partnership in the name of the Funds.positions.
In the normal course of business, the Partnership are and the Funds were, parties to financial instruments with off-balance-sheet risk, including derivative financial instruments and derivative commodity instruments. These financial instruments may include forwards, futures, options, and swaps, whose values are based upon an underlying asset, index, or reference rate, and generally represent future commitments to exchange currencies or cash balances, or to purchase or sell other financial instruments at specific terms at specified future dates, or, in the case of derivative commodity instruments, to have a reasonable possibility to be settled in cash, through physical delivery or with another financial instrument. These instruments may be traded on an exchange, a swap execution facility or OTC. Exchange-traded instruments include futures and certain standardized forward, option and swap contracts. Certain swap contracts may also be traded on a swap execution facility or OTC. OTC contracts are negotiated between contracting parties and also include certain forward and option contracts. Specific market movements of commodities or futures contracts underlying an option cannot accurately be predicted. The purchaser of an option may lose the entire premium paid for the option. The writer or seller of an option has unlimited risk. Each of these instruments is subject to various risks similar to those relating to the underlying financial instruments, including market and credit risk. In general, the risks associated with OTC contracts are greater than those associated with exchange-traded instruments because of the greater risk of default by the counterparty to an OTC contract. The General Partner estimates that at any given time approximately 15.6%0.0% to 32.8%20.5% of the Partnership’s/Funds’Partnership’s contracts are traded OTC.
Market risk is the potential for changes in the value of the financial instruments traded by the Partnership/FundsPartnership due to market changes, including interest and foreign exchange rate movements and fluctuations in commodity or security prices. Market risk is directly impacted by the volatility and liquidity in the markets in which the related underlying assets are traded. The Partnership is and the Funds were, exposed to market risk equal to the value of the futures and forward contracts held and unlimited liability on such contracts sold short.
18
Credit risk is the possibility that a loss may occur due to the failure of a counterparty to perform according to the terms of a contract. The Partnership’s/Funds’Partnership’s risk of loss in the event of counterparty default is (or was with respect to the Funds) typically limited to the amounts recognized in the Statements of Financial Condition and is (was) not represented by the contract or notional amounts of the instruments. The Partnership’s/Funds’Partnership’s risk of loss is (or was with respect to the Funds) reduced through the use of legally enforceable master netting agreements with counterparties that permit the Partnership and permitted the Funds, to offset unrealized gains and losses and other assets and liabilities with such counterparties upon the occurrence of certain events. The Partnership has and the Funds had, credit risk and concentration risk, as MS&Co. or an MS&Co. affiliate are (or were with respect to the Funds) counterparties or brokers with respect to the Partnership’s/Funds’ assets. For certain OTC contracts traded by Cambridge Master and SECOR Master prior to their respective full redemptions, JPMorgan was the counterparty with respect to thosePartnership’s assets. Credit risk with respect to exchange-traded instruments is (or was with respect to the Funds) reduced to the extent that, through MS&Co. or an MS&Co. affiliate, the Partnership’s/Funds’Partnership’s counterparty is or was an exchange or clearing organization.
20
The risk to the limited partners that have purchased Redeemable Units is limited to the amount of their share of the Partnership’s net assets and undistributed profits. This limited liability is a result of the organization of the Partnership as a limited partnership under New York law.
The General Partner/Trading ManagerPartner monitors and attempts (or with respect to the Funds, monitored and attempted) to mitigate the Partnership’s/Funds’Partnership’s risk exposure on a daily basis through financial, credit and risk management monitoring systems, and accordingly, believes (or with respect to the Funds, believed) that it has or had effective procedures for evaluating and limiting the credit and market risks to which the Partnership/FundsPartnership may or may have been be subject. These monitoring systems generally allow the General Partner/Trading ManagerPartner to statistically analyze actual trading results with risk-adjusted performance indicators and correlation statistics. In addition, online monitoring systems provide account analysis of futures, exchange-cleared swaps, forward and option contracts by sector, margin requirements, gain and loss transactions and collateral positions. (See also “Item 8. Financial Statements and Supplementary Data.” for further information on financial instrument risk included in the notes to financial statements.)
The majority of these financial instruments mature within one year of the inception date. However, due to the nature of the Partnership’s/Funds’Partnership’s business, these instruments may not be or have been held to maturity.
Other than the risks inherent in U.S. Treasury bills, money market mutual fund securities, commodity futures, forward, option and swap contracts, the Partnership knows of no trends, demands, commitments, events or uncertainties which will result in or which are reasonably likely to result in the Partnership’s liquidity increasing or decreasing in any material way. The Limited Partnership Agreement provides that the Partnership shall cease trading operations and liquidate all open positions under certain circumstances including a decrease in net asset value per Redeemable Unit to less than $400 as of the close of business on any trading day.
| (b) | Capital Resources. |
| (i) | The Partnership has made no material commitments for capital expenditures. |
| (ii) | The Partnership’s capital consists of the capital contributions of the partners as increased or decreased by gains or losses on trading and by expenses, interest income, redemptions of Redeemable Units and distributions of profits, if any. Gains or losses on trading cannot be predicted. Market movements in commodities are dependent upon fundamental and technical factors which the Advisors may or may not be able to identify, such as changing supply and demand relationships, pandemics, epidemics and other public health crises, weather, governmental, agricultural, commercial and trade programs and policies, national and international political and economic events and changes in interest rates. Partnership expenses consist of, among other things, clearing, ongoing selling agent, management and General Partner fees. The level of these expenses is dependent upon trading performance and the level of net assets maintained. In addition, the amount of interest income earned by the |
No forecast can be made as to the level of redemptions in any given period. A limited partner may require the Partnership to redeem its Redeemable Units at the net asset value per Redeemable Unit as of the end of any month on three business days’ notice to the General Partner. There is no fee charged to limited partners in connection with redemptions. Redemptions are generally funded out of the Partnership’s cash holdingsholdings. For the year ended December 31, 2023, 5,919.1640 Class A limited partner Redeemable Units were redeemed totaling $5,090,648, 299.0970 Class D limited partner Redeemable Units were redeemed totaling $325,433 and may have also previously been funded out of redemptions from the Funds.47.6100 Class Z General Partner Redeemable Units were redeemed totaling $50,000. For the year ended December 31, 2022, 8,164.3340 Class A limited partner Redeemable Units were redeemed totaling $7,266,578, 155.6940 Class D limited partner Redeemable Units were redeemed totaling $156,748, 43.2490 Class Z limited partner Redeemable Units were redeemed totaling $51,309 and 106.6270 Class Z General Partner Redeemable Units were redeemed totaling $125,000. For the year ended December 31, 2021, 18,194.9190 Class A limited partner Redeemable Units were redeemed totaling $14,065,961, 2,179.8600 Class D limited partner Redeemable Units were redeemed totaling $2,217,552 and 278.9350 Class Z General Partner Redeemable Units were redeemed totaling $275,000. For the year ended December 31, 2020, 37,473.6290 Class A limited partner Redeemable Units were redeemed totaling $26,476,389, 829.6260 Class D limited partner Redeemable Units were redeemed totaling $741,074, 83.3770 Class Z limited partner Redeemable Units were redeemed totaling $75,779 and 325.3940 Class Z General Partner Redeemable Units were redeemed totaling $300,000.
For the years ended December 31, 2023, 2022 2021 and 2020,2021, there were no subscriptions.
19
(c) Results of Operations.
For the year ended December 31, 2023, the Partnership’s net asset value per Class A Redeemable Unit decreased 11.1% from $901.95 to $801.93, the Partnership’s net asset value per Class D Redeemable Unit decreased 11.1% from $1,128.79 to $1,003.61, and the Partnership’s net asset value per Class Z Redeemable Unit decreased 10.4% from $1,172.31 to $1,050.19. For the year ended December 31, 2022, the Partnership’s net asset value per Class A Redeemable Unit increased 13.8% from $792.73 to $901.95, the Partnership’s net asset value per Class D Redeemable Unit increased 13.8% from $992.10 to $1,128.79, and the Partnership’s net asset value per Class Z Redeemable Unit increased 14.6% from $1,022.54 to $1,172.31. For the year ended December 31, 2021, the Partnership’s net asset value per Class A Redeemable Unit increased 10.1% from $720.19 to $792.73, the Partnership’s net asset value per Class D Redeemable Unit increased 10.1% from $901.32 to $992.10, and the Partnership’s net asset value per Class Z Redeemable Unit increased 10.9% from $921.96 to $1,022.54. For
The Partnership experienced a net trading loss of $7,315,876 before fees and expenses for the year ended December 31, 2020,2023. Losses were primarily attributable to the Partnership’s net asset value per Class A Redeemable Unit decreased 4.2% from $751.88 to $720.19,trading in currencies, energy, grains, non-U.S. interest rates and metals and were partially offset by gains in indices, U.S. interest rates, livestock and softs.
During the first quarter of 2023, the Partnership’s net asset value per Class D Redeemable Unit decreased 3.5%largest losses were experienced within the global fixed income markets during January from $933.92 to $901.32,short positions in European and U.S. fixed income futures as an apparent slowing of inflation growth boosted bond prices. Further losses from short positions in U.S. and European fixed income futures were incurred during March as additional bond buying occurred. In the energy markets, losses were incurred from futures positions in Brent crude oil, heating oil, and gasoline as prices moved inconsistently throughout a majority of the quarter amid the lack of a consistent consensus regarding oil supply/demand. Further losses for the quarter were recorded in the currency markets from positions in the euro and Swiss franc as the values of these currencies experienced short-term volatility versus the U.S. dollar. A portion of the Partnership’s net assetoverall losses for the first quarter was offset by gains recorded in the global stock indices from long positions in European equity index futures during January and February as investor appetite for risk assets in the region boosted stock prices. In the agricultural markets, gains were achieved during January, February, and March from short positions in wheat futures as wheat prices declined amid easing drought conditions in key South American growing regions. In the metals markets, long positioning in gold futures profited during January and March as investors sought out precious metals as a store of value.
21
During the second quarter of 2023, the Partnership’s most meaningful gains were achieved in the global fixed income markets from short positions in European, U.S., and Canadian government debt futures during May and June as prices declined and yields rose amid ongoing concerns regarding inflation and expectations for hawkish central bank policy to continue. In global stock indices, long futures positions in Asian equity indices profited during April, May, and June as prices rose amid economic data supporting investors’ “risk-on” stance. In the currency markets, gains were achieved from short positions in the Japanese yen as the value per Class Z Redeemable Unit decreased 2.8%of the yen declined against the U.S. dollar throughout the quarter. In the agricultural markets, gains were recorded during April from $948.13long positions in sugar futures as prices climbed to $921.96.an 11-year high amid adverse weather in key growing regions and supply tightness. A portion of the Partnership’s trading gains for the second quarter was offset by losses incurred in the energy markets from positions in Brent and West Texas Intermediate crude oil futures as oil prices moved without consistent direction for a majority of the quarter. In the metals, losses were recorded from long positions in gold futures as prices reversed lower during May amid broad strength in the U.S. dollar.
During the third quarter of 2023, the Partnership’s most significant gains were recorded in the energy markets from long futures positions in crude oil, heating oil and unleaded gasoline as prices trended higher throughout the quarter amid supply related concerns. In the global fixed income markets, profits were achieved from short positions in U.S., Canadian, and European government debt futures as prices dropped amid expectations central banks would keep interest rates high. In the currency markets, gains were recorded from short positions in the Japanese yen versus the U.S. dollar as the value of the dollar strengthened versus the yen during August and September on expectations the Federal Reserve would continue to battle inflation. A portion of the Partnership’s gains for the third quarter was offset by losses incurred in the global stock indices from long futures positions in European equity indices as prices declined amid investor expectations for interest rates to remain higher for longer. In the metals sector, losses were experienced from short positions in copper during July and long positions in silver during September as the prices of these metals fluctuated. Net trading results in the agricultural were relatively flat and did not have a material impact on the Partnership’s performance for the quarter.
During the fourth quarter of 2023, the most significant losses were incurred during October from long positions in crude oil and its refined products as prices fell amid concerns of potential demand reduction. Losses in the global fixed income sector were incurred during November from short positions in European and U.S. government debt futures as investors speculated central banks would be moderating hawkish interest rate policies. During November and December, losses were incurred from short positions in the Swiss franc, Japanese yen, euro, and Canadian dollar versus the U.S. dollar as the relative value of the U.S. currency weakened. Metals losses were experienced throughout the quarter as both industrial and precious metals exhibited choppy price tendencies. Smaller losses were incurred during October from long positions in global stock indices. The Partnership’s losses for the fourth quarter were partially offset by gains achieved within the agricultural during December from short positions in sugar futures as prices reversed lower following a long bullish trend.
The Partnership experienced a net trading gain of $12,411,168 before fees and expenses for the year ended December 31, 2022. Gains were primarily attributable to the Partnership’s trading in currencies, energy, grains, indices, non-U.S. interest rates and metals and were partially offset by losses in U.S. interest rates, livestock and softs. The net trading gain (or loss) realized from the Partnership’s investment in the Funds is disclosed under “Item 8. Financial Statements and Supplementary Data.”
During the first quarter of 2022, the most significant gains were achieved within the energy markets during January, February, and March from long positions in crude oil futures as prices surged amid concerns Russia’s invasion of Ukraine would curtail global crude oil production. Gains within the global fixed income sector were recorded during January and February from short positions in European fixed income futures and during March from short positions in U.S. Treasury note futures as global central banks weighed increasing interest rates in an effort to combat inflation. Further gains were experienced within the agricultural markets during January and February from long positions in corn and soybean futures as grain prices advanced. Within the metals, gains were achieved during February and March from long positions in gold futures as the increasing potential of a prolonged war between Russia and Ukraine spurred investor demand for precious metals. Additional gains were recorded during March from short positions in Asian equity index futures as global geopolitical tensions and renewed outbreaks of the COVID virus in China stoked concerns for the region’s economy.
During the second quarter of 2022, the most significant gains were achieved within the energy markets during April and May from long positions in a variety of energy products as high global demand continued amid widespread supply shortfalls. Within the global fixed income sector, gains were recorded during April from short positions in U.S. and European fixed income futures as global central banks stepped up measures to battle decades-high inflation. In currencies, gains were experienced during April from short positions in the euro versus the U.S. dollar as the Eurozone currency weakened on fears for the strength of the region’s economy amid the war between Russia and Ukraine. Further gains were achieved within the metals during June from short positions in copper futures as a resurgence of COVID-19 lockdowns in China threatened global industrial metal demand. A portion of the Partnership’s gains for the second quarter was offset by losses incurred within the agricultural complex from long futures positions in the grains as prices reversed lower after the U.S. Department of Agriculture released reports which indicated the start of the spring planting season was off to a strong start. Smaller losses were experienced within the global stock index markets during April and June.
During the third quarter of 2022, the most significant gains were achieved within the global fixed income sector during August and September from short positions in European fixed income futures as the region’s central banks pledged to battle high inflation levels. Within the currency markets, gains were recorded during August and September from short positions in the Japanese yen, euro, Canadian dollar and New Zealand dollar versus the U.S. dollar as the value of the U.S. currency continued to rally higher. Additional gains were achieved within the metals markets during August and September from short positions in gold futures as the strengthening U.S. dollar diminished investor demand for precious metals. Gains were also achieved during September from short positions in U.S. and Asian equity index futures as global recession concerns brought stock prices lower. A portion of the Partnership’s gains for the third quarter was offset by losses incurred within the energy sector during all three months of the quarter from long positions in crude oil and its refined products as energy prices reversed lower. Losses were also incurred within the agricultural sector during July, August, and September from long positions in wheat, soybeans, and corn futures as prices declined amid signs of strong U.S. grain harvests.
During the fourth quarter of 2022, the most significant losses were incurred from short positions in gold futures during November as prices rallied on a weakening U.S. dollar. Losses were also recorded within the currencies during November from positions in the Swiss franc, New Zealand dollar, Japanese yen and Canadian dollar. Within the global stock index sector, losses were experienced during November from short positions in Asian equity index futures as easing inflation expectations boosted stock prices. A sell-off in Brent crude oil futures during November and December contributed to the Partnership’s losses for the quarter. Smaller losses were incurred within the agricultural sector during November from long positions in corn and cotton futures. The Partnership’s losses for the fourth quarter were partially offset by gains achieved within the global fixed income sector during December from short positions in European fixed income futures as European bond prices fell amid a push by Eurozone central banks to combat high inflation.
20
The Partnership experienced a net trading gain of $11,625,977 before fees and expenses for the year ended December 31, 2021. Gains were primarily attributable to the Partnership’s trading in energy, grains, indices, and softs and were partially offset by losses in currencies, U.S. and non-U.S. interest rates, livestock and metals.
During the first quarter of 2021, the most significant gains were achieved within the energy markets during February and March from long positions in Brent crude oil futures as prices rallied amid an outlook for growing global energy demand. Within the global stock index sector, gains were recorded during February and March from long positions in U.S., Asian and European equity index futures as continued investor appetites for risk assets boosted global stock prices. Further gains were achieved within the agricultural complex during January and February from long positions in grain futures as prices advanced higher. Within the currencies, gains were experienced primarily during March from short positions in the euro as the value of the European currency declined amid growing COVID-19 cases in the region. A portion of the Partnership’s gains for the first quarter was offset by losses incurred within the global fixed income sector during February and March from long positions in U.S. and Canadian fixed income futures as a growing expectation of inflationary pressures pushed bond yields higher. Losses were also recorded during January and March in the metals markets primarily due to long positions in gold futures as a strengthening U.S. dollar diminished demand for precious metals.
During the second quarter of 2021, the most significant gains were achieved within the global fixed income markets during May from short positions in U.S. fixed income futures as prices fell amid speculation the Federal Reserve would increase interest rates sooner than expected. Within the energy complex, gains were experienced during April, May, and June from long positions in crude oil futures as signs of tightening global oil supplies and increasing energy demand boosted prices. Gains within the global stock index sector were experienced during April and May from long positions in U.S. and European equity index futures as investor momentum buying pushed stock prices higher. Within the metals markets, gains were recorded during April and May from long positions in gold and copper futures as a weakening U.S. dollar buoyed metals prices. A portion of the Partnership’s gains for the second quarter was offset by losses incurred within the currency sector during April from short positions in the euro and Swiss franc versus the U.S. dollar as the relative value of the dollar fell on signs the Federal Reserve would continue its dovish monetary policies.
During the third quarter of 2021, the most significant gains were achieved within the energy markets during September from long positions in natural gas and crude oil futures as constrictions in the global supply chain boosted prices. Inflationary pressures within the commodity markets also helped to spur gains within the agricultural complex during July from long positions in coffee futures, during August from long positions in sugar futures, and during September from long positions in cotton futures. A portion of the Partnership’s gains for the third quarter was offset by losses incurred within the global fixed income sector during September from long positions in U.S., Australian, and Canadian bond futures as central banks indicated curtailing of monetary easing measures could occur sooner than expected. Additional losses were recorded within the currencies during July from short positions in the Japanese yen as the value of the Pacific nation’s currency advanced. Within the metals markets, losses were experienced during August from long positions in gold futures as a strengthening U.S. dollar diminished investor demand for precious metals.
During the fourth quarter of 2021, the most significant losses were incurred within the global fixed income sector during October from long positions in Australian, British, Canadian and U.S. fixed income futures as prices fell amid speculation central banks would soon hike interest rates. Within the metals, losses were experienced during October from long positions in silver and copper futures as metals prices reversed lower. Additional losses were recorded within the agricultural markets during November from positions in soybeans, soybean oil and soybean meal futures amid increased price volatility in the soybean complex. Losses were also incurred during November from long positions in U.S. and European equity index futures. The Partnership’s losses for the fourth quarter were partially offset by gains achieved within the currency sector during October from short positions in the Japanese yen versus the U.S. dollar as the relative value of the dollar strengthened during the month. Further gains were recorded within the energy complex during October from long futures positions in Brent crude oil and natural gas as tightening global energy supplies boosted prices.
The results of operations for the twelve months ended 20202021 is discussed under “Item 7. Management’s Discussion and Analysis of Financial Condition and Results of Operations.” in the Partnership’s Annual Report on Form 10-K for the fiscal year ended December 31, 2020.2021.
22
For the years ended December 31, 2023, 2022 2021 and 2020,2021, the Partnership received monthly interest on 100% of the average daily equity maintained in cash in the Partnership’s (or the Partnership’s allocable portion of a Fund’s) brokerage account at MS&Co. during each month at a rate equal to the monthly average of the 4-week U.S. Treasury bill discount rate. During prior periods included in this report, the Partnership received monthly interest on 80% of the average daily equity maintained in cash in the Partnership’s (or the Partnership’s allocable portion of a Fund’s) brokerage account during each month at a rate equal to the monthly average of the 4-week U.S. Treasury bill discount rate. For the avoidance of doubt, the Partnership/FundsPartnership did not receive interest on amounts in the futures brokerage account that were committed to margin. Any interest earned on the Partnership’s and/or each Fund’s cash account in excess of the amounts described above, if any, was retained by MS&Co. and/or shared with the General Partner. All interest earned on U.S. Treasury bills and money market mutual fund securities was retained by the Partnership, and/or the Funds, as applicable. Any interest income earned on collateral or excess cash deposited by certain of the Funds and held by JPMorgan in its capacity as such Funds’ forward foreign currency counterparty was retained by such Funds, and the Partnership received its allocable portion of such interest from the applicable Fund. Interest income for the three and twelve months ended December 31, 20222023 increased by $505,661$121,340 and $900,533,$1,454,011, respectively, as compared to the corresponding periods in 2021.2022. The increase in interest income was primarily due to higher 4-week U.S. Treasury bill discount rates during the three and twelve months ended December 31, 20222023 as compared to the corresponding periods in 2021.2022. Interest earned by the Partnership will increase the net asset value of the Partnership. The amount of interest income earned by the Partnership and the Funds depended on (1) the average daily equity maintained in cash in the Partnership’s and/or applicable Fund’s accounts, (2) the amount of U.S. Treasury bills and/or money market mutual fund securities held by the Partnership and/or the Funds and (3) interest rates over which none of the Partnership the Funds,or MS&Co. or JPMorgan had control.
Certain clearing fees are based on the number of trades executed by the Advisors for the Partnership/Funds.Partnership. Accordingly, they must be compared in relation to the number of trades executed during the period. Clearing fees related to direct investments for the three and twelve months ended December 31, 2022 decreased2023 increased by $20,162$7,684 and $91,876,$1,818, respectively, as compared to the corresponding periods in 2021.2022. The decreaseincrease in these clearing fees was due to a decreasean increase in the number of direct trades made by the Partnership during the three and twelve months ended December 31, 20222023 as compared to the corresponding periods in 2021.2022.
21
Ongoing selling agent fees are calculated as a percentage of the Partnership’s adjusted net asset value of Class A and Class D Redeemable Units on the last day of each month and are affected by trading performance, subscriptions and redemptions. Accordingly, they must be compared in relation to the fluctuations in the monthly net asset values. Ongoing selling agent fees for the three and twelve months ended December 31, 2022 increased by $1,414 and2023 decreased by $14,974,$20,918 and $68,200, respectively, as compared to the corresponding periods in 2021.2022. The increase was primarily due to an increase in average net assets attributable to Class A and Class D Redeemable Units during the three months ended December 31, 2022, and the decrease was primarily due to a decrease in average net assets attributable to Class A and Class D Redeemable Units during the three and twelve months ended December 31, 20222023 as compared to the corresponding periods in 2021.2022.
General Partner fees are paid to the General Partner for administering the business and affairs of the Partnership. General Partner fees are calculated as a percentage of the Partnership’s adjusted net assets as of the end of each month and are affected by trading performance, subscriptions and redemptions. Accordingly, they must be compared in relation to the fluctuations in the monthly net asset values. General Partner fees for the three and twelve months ended December 31, 2022 increased by $1,775 and2023 decreased by $17,270,$24,902 and $81,177, respectively, as compared to the corresponding periods in 2021.2022. The increase was primarily due to an increase in average net assets during the three months ended December 31, 2022, and the decrease was primarily due to a decrease in average net assets during the three and twelve months ended December 31, 20222023 as compared to the corresponding periods in 2021.2022.
Management fees are calculated as a percentage of the Partnership’s adjusted net assets as of the end of each month and are affected by trading performance, subscriptions and redemptions. Accordingly, they must be compared in relation to the fluctuations in the monthly net asset values. Management fees for the three and twelve months ended December 31, 2022 increased by $11,177 and2023 decreased by $30,213,$45,133 and $149,509, respectively, as compared to the corresponding periods in 2021.2022. The increase was primarily due to an increase in average net assets during the three months ended December 31, 2022, and the decrease was primarily due to a decrease in average net assets during the three and twelve months ended December 31, 20222023 as compared to the corresponding periods in 2021.2022.
Incentive fees are based on the New Trading Profits generated by each Advisor at the end of the quarter, half-year or year, as applicable, as defined in the respective Management Agreements between the Partnership, the General Partner and each Advisor. Trading performance for the three and twelve months ended December 31, 2023 resulted in a reversal of incentive fees of $323,351 and incentive fees of $0, respectively. Trading performance for the three and twelve months ended December 31, 2022 resulted in a reversal of incentive fees of $227,646 and incentive fees of $2,432,924, respectively. Trading performance for the three and twelve months ended December 31, 2021 resulted in incentive fees of $0 and $2,147,999, respectively. To the extent an Advisor incurs a loss for the Partnership, the Advisor will not be paid incentive fees until such Advisor recovers any net loss incurred by the Advisor and earns additional New Trading Profits for the Partnership.
The Partnership pays professional fees, which generally include certain offering costs and legal, accounting, administrative, filing, reporting and data processing fees. Professional fees for the years ended December 31, 2023 and 2022 were $314,389 and 2021 were $237,008, and $308,588, respectively.
In the General Partner’s opinion, the Partnership’s Advisors continue to employ trading methods consistent with the objectives of the Partnership. The General Partner monitors the Advisors’ performance on a daily, weekly, monthly and annual basis to assure these objectives are met.
Commodity futures markets are highly volatile. Broad price fluctuations and rapid inflation increase not only the risks involved in commodity trading, but also the possibility of profit. The profitability of the Partnership/FundsPartnership depends on the existence of major price trends and the ability of the Advisors to correctly identify those price trends. Price trends are influenced by, among other things, changing supply and demand relationships, weather, governmental, agricultural, commercial and trade programs and policies, national and international political and economic events, changes in interest rates, pandemics, epidemics and other public health crises. To the extent that market trends exist and the Advisors are able to identify them, the Partnership expects to increase capital through operations.
In allocating the assets of the Partnership among the Advisors, the General Partner considers, among other factors, each Advisor’s past performance, trading style, volatility of markets traded and fee requirements. The General Partner may modify or terminate the allocation of assets among the Advisors and may allocate assets to additional advisors at any time. Each Advisor’s percentage allocation and trading program is described in the “Overview” section of this Item 7.
(d) Off-Balance Sheet Arrangements. None.
(e) Contractual Obligations. None.
23
(f) Operational Risk.
The Partnership is exposed to market risk and credit risk, which arise in the normal course of its business activities. Slightly less direct, but of critical importance, are risks pertaining to operational and back office support. This is particularly the case in a rapidly changing and increasingly global environment with increasing transaction volumes and an expansion in the number and complexity of products in the marketplace.
Such risks include:
Operational/Settlement Risk— the risk of financial and opportunity loss and legal liability attributable to operational problems, such as inaccurate pricing of transactions, untimely trade execution, clearance and/or settlement, or the inability to process large volumes of transactions. The Partnership is subject to increased risks with respect to its trading activities in emerging market instruments, where clearance, settlement, and/or custodial risks are often greater than in more established markets.
Technological Risk— the risk of loss attributable to technological limitations or hardware failure that constrain the Partnership’s ability to gather, process, and communicate information efficiently and securely, without interruption, to customers and in the markets where the Partnership participates. Additionally, the General Partner’s computer systems may be vulnerable to unauthorized access, mishandling or misuse, computer viruses or malware, cyber attacks and other events that could have a security impact on such systems. If one or more of such events occur, this potentially could jeopardize a limited partner’s personal, confidential, proprietary or other information processed and stored in, and transmitted through, the General Partner’s computer systems, and adversely affect the Partnership’s business, financial condition or results of operations.
Legal/Documentation Risk —the risk of loss attributable to deficiencies in the documentation of transactions (such as trade confirmations) and customer relationships (such as master netting agreements) or errors that result in non-compliance with applicable legal and regulatory requirements.
22
Financial Control Risk — the risk of loss attributable to limitations in financial systems and controls. Strong financial systems and controls ensure that assets are safeguarded, that transactions are executed in accordance with management’s authorization, and that financial information utilized by management and communicated to external parties, including the Partnership’s unit holders, creditors, and regulators, is free of material errors.
(g) Critical Accounting Policies.
The preparation of financial statements in conformity with accounting principles generally accepted in the United States of America (“GAAP”) requires the General Partner to make estimates and assumptions that affect the reported amounts of assets and liabilities and disclosures of contingent assets and liabilities at the date of the financial statements and the reported amounts of income and expenses during the reporting period. As a result, actual results could differ from these estimates. A summary of the Partnership’s significant accounting policies is described in Note 2 to the Partnership’s financial statements included in “Item 8. Financial Statements and Supplementary Data.”
The Partnership’s most significant accounting policy is the valuation of its investment in futures, option and forward contracts and U.S. Treasury bills, as applicable. Prior to the Funds’ respective full redemptions, the Partnership’s most significant accounting policy also included the valuation of its investment in the Funds. The Partnership previously carried its investments in ADG Master, Aquantum Master, FORT Contrarian Master, AE Capital Master, Cambridge Master and SECOR Master based on the Partnership’ s (1) net contribution to the applicable Fund and (2) its allocated share of the undistributed profits and losses, including realized gains (losses) and net change in unrealized gains (losses), of the applicable Fund. The fair value of exchange-traded futures, option and forward contracts is determined by the various exchanges, and reflects the settlement price for each contract as of the close of business on the last business day of the reporting period. The fair value of foreign currency forward contracts is extrapolated on a forward basis from the spot prices quoted as of approximately 3:00 P.M. (E.T.) on the last business day of the reporting period from various exchanges. The fair value of non-exchange-traded foreign currency option contracts is calculated by applying an industry standard model application for options valuation of foreign currency options, using as inputs the spot prices, interest rates, and option implied volatilities quoted as of approximately 3:00 P.M. (E.T.) on the last business day of the reporting period. U.S. Treasury bills are valued at the last available bid price received from independent pricing services as of the close of the last business day of the reporting period.
23
Item 7A. Quantitative and Qualitative Disclosures about Market Risk.
Introduction
The Partnership/Funds arePartnership is a speculative commodity pools.pool. The market sensitive instruments held by themthe Partnership are acquired for speculative trading purposes, and all or substantially all of the Partnership’s/Funds’Partnership’s assets are subject to the risk of trading loss. Unlike an operating company, the risk of market sensitive instruments is integral, not incidental, to the Partnership’s/Funds’Partnership’s main line of business.
The limited partners will not be liable for losses exceeding the current net asset value of their investment. This limited liability is a result of the organization of the Partnership as a limited partnership under New York law.
Market movements result in frequent changes in the fair value of the Partnership’s/Funds’Partnership’s open positions and, consequently, in their earnings and cash balances. The Partnership’s/Funds’Partnership’s market risk is influenced by a wide variety of factors, including the level and volatility of interest rates, exchange rates, equity price levels, the market value of financial instruments and contracts, the diversification effects among the Partnership’s/Funds’Partnership’s open positions and the liquidity of the markets in which they trade.
The Partnership/FundsPartnership rapidly acquireacquires and liquidateliquidates both long and short positions in a wide range of different markets. Consequently, it is not possible to predict how a particular future market scenario will affect performance, and the Partnership’s/Funds’Partnership’s past performance is not necessarily indicative of their future results.
“Value at Risk” is a measure of the maximum amount which the Partnership/FundsPartnership could reasonably be expected to lose in a given market sector. However, the inherent uncertainty of the Partnership’s/Funds’Partnership’s speculative trading and the recurrence in the markets traded by the Partnership/FundsPartnership of market movements far exceeding expectations could result in actual trading or non-trading losses far beyond the indicated Value at Risk or the Partnership’s/Funds’Partnership’s experience to date (i.e., “risk of ruin”). In light of the foregoing as well as the risks and uncertainties intrinsic to all future projections, the inclusion of the quantification in this section should not be considered to constitute any assurance or representation that the Partnership’s/Funds’Partnership’s losses in any market sector will be limited to Value at Risk or by the Partnership’s/Funds’Partnership’s attempts to manage their market risk.
Materiality as used in this section is based on an assessment of reasonably possible market movements and the potential losses caused by such movements, taking into account the leverage, optionality and multiplier features of the Partnership’s/Funds’Partnership’s market sensitive instruments.
24
Quantifying the Partnership’s and the Funds’ Trading Value at Risk
The following quantitative disclosures regarding the Partnership’s/Funds’Partnership’s market risk exposures contain “forward-looking statements” within the meaning of the safe harbor from civil liability provided for such statements by the Private Securities Litigation Reform Act of 1995 (set forth in Section 27A of the Securities Act, and Section 21E of the Securities Exchange Act of 1934, as amended (the “Exchange Act”)). All quantitative disclosures in this section are deemed to be forward-looking statements for purposes of the safe harbor, except for statements of historical fact.
The Partnership/Funds accountPartnership accounts for open positions on the basis of fair value accounting principles. Any loss in the market value of the Partnership’s and each Fund’s open positions is directly reflected in the Partnership’s and each Fund’s earnings and cash flow.
The Partnership’s/Funds’Partnership’s risk exposure in the market sectors traded by the Advisors is estimated below in terms of Value at Risk. Please note that the Value at Risk model is used to numerically quantify market risk for historic reporting purposes only and is not utilized by either the General Partner or the Advisors in their daily risk management activities.
Exchange margin requirements have been used by the Partnership/FundsPartnership as the measure of their Value at Risk. Margin requirements are set by exchanges to equal or exceed the maximum losses reasonably expected to be incurred in the fair value of any given contract in 95%—99% of any one-day interval. The margin levels are established by dealers and exchanges using historical price studies as well as an assessment of current market volatility (including the implied volatility of the options on a given futures contract) and economic fundamentals to provide a probabilistic estimate of the maximum expected near-term one-day price fluctuation.
In the case of market sensitive instruments which are not exchange-traded (almost exclusively currencies in the case of the Partnership/Funds)Partnership), the margin requirements for the equivalent futures positions have been used as Value at Risk. In those rare cases in which a futures-equivalent margin is not available, dealers’ margins have been used.
The fair value of the Partnership’s/Funds’Partnership’s futures and forward positions does not have any optionality component. However, the Advisors may trade commodity options. The Value at Risk associated with options is reflected in the following tables as the margin requirement attributable to the instrument underlying each option. Where this instrument is a futures contract, the futures margin, and where this instrument is a physical commodity, the futures- equivalent margin has been used. This calculation is conservative in that it assumes that the fair value of an option will decline by the same amount as the fair value of the underlying instrument, whereas, in fact, the fair values of the options traded by the Partnership/FundsPartnership in almost all cases fluctuate to a lesser extent than those of the underlying instruments.
In quantifying the Partnership’s/Funds’Partnership’s Value at Risk, a 100% positive correlation in the different positions held in each market risk category has been assumed. Consequently, the margin requirements applicable to the open contracts have simply been added to determine each trading category’s aggregate Value at Risk. The diversification effects resulting from the fact that the Partnership’s/Funds’Partnership’s positions are rarely, if ever, 100% positively correlated have not been reflected.
The Partnership’s and the Funds’ Trading Value at Risk in Different Market Sectors
DCM, Drury, Episteme and Millburn each directly trade managed accounts in the name of the Partnership. Prior to its termination effective December 31, 2022, ISAM SM directly traded managed accounts in the name of the Partnership. Prior to its termination effective October 31, 2021, FORT directly traded managed accounts in the name of the Partnership. The trading Value at Risk tables reflect the market sensitive instruments held by the Partnership directly (i.e., in the managed accounts in the Partnership’s name traded by DCM.DCM, Drury, Episteme, Millburn and ISAM SM, and FORT, respectively) as of December 31, 20222023 and 2021.2022.
24
The following tables indicate the trading Value at Risk associated with the Partnership’s direct investments by market category as of December 31, 20222023 and 2021,2022, and the highest, lowest and average values during the applicable years. All open position trading risk exposures have been included in calculating the figures set forth below.
As of December 31, 2022,2023, the Partnership’s total capitalization was $65,387,698.
As of December 31, 2022, the Partnership’s Value at Risk for the portion of its assets that are traded directly was as follows:$53,044,907.
| December 31, 2022 | ||||||||||||||||||||
| Twelve Months Ended December 31, 2022 | ||||||||||||||||||||
Market Sector | Value at Risk | % of Total
Capitalization | High
Value at Risk | Low
Value at Risk | Average
Value at Risk* | |||||||||||||||
Currencies | $ | 2,396,130 | 3.66 | % | $ | 5,174,957 | $ | 2,168,466 | $ | 3,766,373 | ||||||||||
Energy | 1,479,619 | 2.26 | 2,759,364 | 170,243 | 1,567,593 | |||||||||||||||
Grains | 736,575 | 1.13 | 1,288,345 | 280,376 | 773,384 | |||||||||||||||
Indices | 2,853,573 | 4.36 | 4,150,965 | 429,670 | 2,636,612 | |||||||||||||||
Interest Rates U.S. | 608,173 | 0.93 | 1,250,386 | 169,738 | 698,859 | |||||||||||||||
Interest Rates Non-U.S. | 3,036,414 | 4.64 | 3,236,617 | 873,360 | 2,101,574 | |||||||||||||||
Livestock | 3,685 | 0.01 | 115,528 | 3,685 | 54,943 | |||||||||||||||
Metals | 653,539 | 1.00 | 1,549,990 | 270,436 | 940,266 | |||||||||||||||
Softs | 422,396 | 0.65 | 1,266,142 | 266,254 | 553,715 | |||||||||||||||
|
|
|
|
| ||||||||||||||||
Total | $ | 12,190,104 | 18.64 | % | ||||||||||||||||
|
|
|
|
| ||||||||||||||||
|
As of December 31, 2021, the Partnership’s total capitalization was $64,243,621.
As of December 31, 2021, the Partnership’s Value at Risk for the portion of its assets that are traded directly was as follows:
| December 31, 2021 | ||||||||||||||||||||||||||||||||||||||||
| December 31, 2023 | December 31, 2023 | |||||||||||||||||||||||||||||||||||||||
| Twelve Months Ended December 31, 2021 | Twelve Months Ended December 31, 2023 | |||||||||||||||||||||||||||||||||||||||
Market Sector | Value at Risk | % of Total
Capitalization | High
Value at Risk | Low
Value at Risk | Average
Value at Risk* | Value at Risk | % of Total
Capitalization | High
Value at Risk | Low
Value at Risk | Average
Value at Risk* | ||||||||||||||||||||||||||||||
Currencies | $ | 3,820,937 | 5.95 | % | $ | 5,682,259 | $ | 2,869,950 | $ | 4,543,583 | $ | 360,534 | 0.68 | % | $ | 4,391,514 | $ | 330,382 | $ | 1,628,951 | ||||||||||||||||||||
Energy | 1,061,964 | 1.65 | 3,477,833 | 460,362 | 2,243,824 | 1,919,269 | 3.62 | 3,554,367 | 975,590 | 2,338,606 | ||||||||||||||||||||||||||||||
Grains | 683,308 | 1.06 | 959,613 | 212,085 | 553,742 | 498,429 | 0.94 | 984,221 | 136,835 | 523,764 | ||||||||||||||||||||||||||||||
Indices | 2,228,067 | 3.47 | 6,329,410 | 1,408,841 | 2,914,081 | 3,372,873 | 6.36 | 5,970,138 | 1,942,323 | 3,465,639 | ||||||||||||||||||||||||||||||
Interest Rates U.S. | 649,202 | 1.01 | 1,574,351 | 233,358 | 902,416 | 318,052 | 0.60 | 1,090,293 | 232,186 | 641,457 | ||||||||||||||||||||||||||||||
Interest Rates Non-U.S. | 1,508,717 | 2.35 | 3,865,774 | 896,905 | 2,709,654 | 1,453,716 | 2.74 | 3,669,229 | 1,208,241 | 2,302,372 | ||||||||||||||||||||||||||||||
Livestock | 33,935 | 0.05 | 103,180 | 6,710 | 55,202 | 2,695 | 0.01 | 11,440 | - | 4,212 | ||||||||||||||||||||||||||||||
Metals | 971,091 | 1.51 | 2,479,421 | 507,856 | 1,444,822 | 882,644 | 1.66 | 1,653,272 | 386,729 | 935,313 | ||||||||||||||||||||||||||||||
Softs | 393,462 | 0.61 | 986,138 | 234,408 | 536,427 | 443,392 | 0.84 | 619,237 | 176,895 | 437,031 | ||||||||||||||||||||||||||||||
|
| |||||||||||||||||||||||||||||||||||||||
Total | $ | 11,350,683 | 17.66 | % | ||||||||||||||||||||||||||||||||||||
|
| |||||||||||||||||||||||||||||||||||||||
| * | Annual average of daily Values at Risk. |
25
As of December 31, 2022, the Partnership’s total capitalization was $65,387,698.
| December 31, 2022 | ||||||||||||||||||||
| Twelve Months Ended December 31, 2022 | ||||||||||||||||||||
Market Sector | Value at Risk | % of Total
Capitalization | High
Value at Risk | Low
Value at Risk | Average
Value at Risk* | |||||||||||||||
Currencies | $ | 2,396,130 | 3.66 | % | $ | 5,174,957 | $ | 2,168,466 | $ | 3,766,373 | ||||||||||
Energy | 1,479,619 | 2.26 | 2,759,364 | 170,243 | 1,567,593 | |||||||||||||||
Grains | 736,575 | 1.13 | 1,288,345 | 280,376 | 773,384 | |||||||||||||||
Indices | 2,853,573 | 4.36 | 4,150,965 | 429,670 | 2,636,612 | |||||||||||||||
Interest Rates U.S. | 608,173 | 0.93 | 1,250,386 | 169,738 | 698,859 | |||||||||||||||
Interest Rates Non-U.S. | 3,036,414 | 4.64 | 3,236,617 | 873,360 | 2,101,574 | |||||||||||||||
Livestock | 3,685 | 0.01 | 115,528 | 3,685 | 54,943 | |||||||||||||||
Metals | 653,539 | 1.00 | 1,549,990 | 270,436 | 940,266 | |||||||||||||||
Softs | 422,396 | 0.65 | 1,266,142 | 266,254 | 553,715 | |||||||||||||||
|
|
|
|
| ||||||||||||||||
Total | $ | 12,190,104 | 18.64 | % | ||||||||||||||||
|
|
|
|
| ||||||||||||||||
| * | Annual average of daily Values at Risk. |
Material Limitations on Value at Risk as an Assessment of Market Risk
The face value of the market sector instruments held by the Partnership/FundsPartnership is typically many times the applicable margin requirement (margin requirements generally range between 1% and 15% of contract face value, although an exchange may increase margin requirement on short notice) as well as many times the capitalization of the Partnership/Funds.Partnership. The magnitude of the Partnership’s/Funds’Partnership’s open positions creates a “risk of ruin” not typically found in most other investment vehicles. Because of the size of the Partnership’s/Funds’Partnership’s positions, certain market conditions — unusual, but historically recurring from time to time — could cause the Partnership/FundsPartnership to incur severe losses over a short period of time. The foregoing Value at Risk tables — as well as the past performance of the Partnership/FundsPartnership — give no indication of this “risk of ruin.”
Non-Trading Risk
The Partnership has non-trading market risk on its foreign cash balances not needed for margin. However, these balances (as well as any market risk they represent) are immaterial.
Materiality as used in this section is based on an assessment of reasonably possible market movements and the potential losses caused by such movements, taking into account the leverage, optionality and multiplier features of the Partnership’s market sensitive instruments.
Qualitative Disclosures Regarding Primary Trading Risk Exposures
The following qualitative disclosures regarding the Partnership’s market risk exposures — except for (i) those disclosures that are statements of historical fact and (ii) the descriptions of how the Partnership manages its primary market risk exposures — constitute forward-looking statements within the meaning of Section 27A of the Securities Act and Section 21E of the Exchange Act. The Partnership’s primary market risk exposures as well as the strategies used and to be used by the General Partner and the Advisors for managing such exposures are subject to numerous uncertainties, contingencies and risks, any one of which could cause the actual results of the Partnership’s risk controls to differ materially from the objectives of such strategies. Government interventions, pandemics, epidemics, and other public health crises, defaults and expropriations, illiquid markets, the emergence of dominant fundamental factors, political upheavals, changes in historical price relationships, an influx of new market participants, increased regulation and many other factors could result in material losses as well as in material changes to the risk exposures and the management strategies of the Partnership. There can be no assurance that the Partnership’s current market exposure and/or risk management strategies will not change materially or that any such strategies will be effective in either the short- or long- term. Investors must be prepared to lose all or substantially all of their investment in the Partnership.
The following were the primary trading risk exposures of the Partnership on December 31, 2022,2023, by market sector. It may be anticipated, however, that these market exposures will vary materially over time.
Currencies. The Partnership’s currency exposure is to exchange rate fluctuations, primarily fluctuations that disrupt the historical pricing relationships between different currencies and currency pairs. These fluctuations are influenced by interest rate changes as well as political and general economic conditions. The General Partner does not anticipate that the risk profile of the Partnership’s currency sector will change significantly in the future.
Equities. The Partnership’s primary equity exposure is to equity price risk in the G20 countries. The stock index futures traded by the Partnership are limited to futures on broadly based indices. As of December 31, 2022,2023, the Partnership’s primary exposures were in the CBOE VIX Volatility Index (U.S.), S&P 500 (U.S.), DAX (Germany), FTSE 100 (United Kingdom), NASDAQ 100 (U.S.), S&P/TSX 60 (Canada), IBEX (Spain), and Dow Jones Euro STOXX 50 (European Union), and Hang Seng (Hong Kong) stock indices. The Partnership is primarily exposed to the risk of adverse price trends or static markets in the major North American, European, and Pacific Rim indices, as well as emerging markets. (Static markets would not cause major market changes but would make it difficult for the Partnership to avoid being “whipsawed” into numerous small losses.)
Interest Rates. Interest rate movements directly affect the price of the futures positions held by the Partnership and indirectly the value of its stock index and currency positions. Interest rate movements in one country as well as relative interest rate movements between countries materially affect the Partnership’s profitability. The Partnership’s primary interest rate exposure is to interest rate fluctuations in the United States and the other G7 countries. However, the Partnership may also take futures positions on the government debt of smaller economies — e.g., Australia and New Zealand.Australia.
26
Commodities:
Energy. The Partnership’s primary energy market exposure is to oil and natural gas price movements, often resulting from political developments in the Middle East, weather conditions, and other factors contributing to supply and demand. Further energy market exposure is to the carbon emission allowances market which are subject to price movements driven by geopolitical events, climate related regulation, and supply and demand related factors. Energy prices can be volatile and substantial profits and losses, which have been experienced in the past, are expected to continue to be experienced in these markets in the future.
Metals. The Partnership’s primary metal market exposure as of December 31, 20222023, was to fluctuations in the prices of gold, copper, silver, palladium,zinc, and platinum.aluminum.
Grains. The Partnership’s trading risk exposure in the grains is primarily to agricultural price movements, which are often directly affected by severe or unexpected weather conditions. The soybean complex, wheat, and corn accounted for the majority of the Partnership’s grain exposure as of December 31, 2022.2023.
Softs. The Partnership’s trading risk exposure in the soft commodities is to agricultural-related price movements, which are often directly affected by severe or unexpected weather conditions. Coffee,Sugar, cocoa, cotton, sugar, and cocoacoffee for the majority of the Partnership’s soft commodities exposure as of December 31, 2022.2023.
Livestock. The Partnership’s primary risk exposure in livestock is to fluctuations in cattle and hog prices.
26
Qualitative Disclosures Regarding Non-Trading Risk Exposure
The following was the only non-trading risk exposure of the Partnership as of December 31, 2022.2023.
Foreign Currency Balances. The Partnership may hold various foreign balances. The Advisors regularly convert foreign currency balances to U.S. dollars in an attempt to manage the Partnership’s non-trading risk.
Qualitative Disclosures Regarding Means of Managing Risk Exposure
The General Partner monitors and attempts to mitigate the Partnership’s risk exposure on a daily basis through financial, credit and risk management monitoring systems and, accordingly, believes that it has effective procedures for evaluating and limiting the credit and market risks to which the Partnership may be subject. These monitoring systems generally allow the General Partner to statistically analyze actual trading results with risk-adjusted performance indicators and correlation statistics. In addition, online monitoring systems provide account analysis of futures, forward and option contracts by sector, margin requirements, gain and loss transactions and collateral positions.
The General Partner monitors the Partnership’s performance and the concentration of its open positions, and consults with the Advisors concerning the Partnership’s overall risk profile. If the General Partner felt it necessary to do so, the General Partner could require the Advisors to close out positions as well as enter positions traded on behalf of the Partnership. However, any such intervention would be a highly unusual event. The General Partner primarily relies on the Advisors’ own risk control policies while maintaining a general supervisory overview of the Partnership’s market risk exposures.
The Advisors apply their own risk management policies to their trading. The Advisors often follow diversification guidelines, margin limits and stop loss points to exit a position. The Advisors’ research of risk management often suggests ongoing modifications to their trading programs.
As part of the General Partner’s risk management, the General Partner periodically meets with each Advisor to discuss their risk management and to look for any material changes to the Advisors’ portfolio balance and trading techniques. The Advisors are required to notify the General Partner of any material changes to their programs.
27
  | |||
| By: | Patrick T. Egan | |
| President and Director | ||
| Ceres Managed Futures LLC | ||
| General Partner, | ||
| Ceres Tactical Systematic L.P. | ||
Ceres Managed Futures LLC | ||
| New York, NY 10036 | ||
| (855) 672-4468 | ||
| (i) | pertain to the maintenance of records that, in reasonable detail, accurately and fairly reflect the transactions and dispositions of the assets of the Partnership; |
| (ii) | provide reasonable assurance that transactions are recorded as necessary to permit preparation of financial statements in accordance with accounting principles generally accepted in the United States of America, and that receipts and expenditures of the Partnership are being made only in accordance with authorizations of management and directors of the Partnership; and |
| (iii) | provide reasonable assurance regarding prevention or timely detection and correction of unauthorized acquisition, use or disposition of the Partnership’s assets that could have a material effect on the financial statements. |
|  | |||
Patrick T. Egan | Brooke Lambert | |||
| President and Director | Chief Financial Officer | |||
| Ceres Managed Futures LLC | Ceres Managed Futures LLC | |||
| General Partner, | General Partner, | |||
| Ceres Tactical Systematic L.P. | Ceres Tactical Systematic L.P. | |||


December 31, 2023 | December 31, 2022 | |||||||
Assets: | ||||||||
Equity in trading account: | ||||||||
| Unrestricted cash (Note 3c) | $ | 43,582,526 | $ | 50,058,379 | ||||
| Restricted cash (Note 3c) | 9,285,004 | 12,210,997 | ||||||
Foreign cash (cost $740,454 and $1,917,654 | 745,796 | 1,924,402 | ||||||
| Net unrealized appreciation on open futures contracts | 370,473 | 2,445,391 | ||||||
| Total equity in trading account | 53,983,799 | 66,639,169 | ||||||
| Interest receivable (Note 3c) | 206,971 | 174,983 | ||||||
| Total assets | $ | 54,190,770 | $ | 66,814,152 | ||||
Liabilities and Partners’ Capital: | ||||||||
| Liabilities: | ||||||||
| Net unrealized depreciation on open forward contracts | $ | 337,766 | $ | 39,323 | ||||
| Accrued expenses: | ||||||||
| Ongoing selling agent fees (Notes 3d and 3e) | 33,201 | 41,122 | ||||||
| Management fees (Note 3b) | 28,091 | 43,440 | ||||||
| Incentive fees (Note 3b) | - | 714,301 | ||||||
| General Partner fees (Note 3a) | 39,144 | 48,582 | ||||||
| Professional fees | 137,196 | 107,005 | ||||||
| Redemptions payable to General Partner (Note 7) | 50,000 | 125,000 | ||||||
| Redemptions payable to Limited Partners (Note 7) | 520,465 | 307,681 | ||||||
| Total liabilities | 1,145,863 | 1,426,454 | ||||||
| Partners’ Capital (Notes 1 and 7): | ||||||||
General Partner, Class Z, 550.3190 and 597.9290 Redeemable Units 2022, respectively | 577,940 | 700,959 | ||||||
Limited Partners, Class A, 61,308.4508 and 67,227.6148 Redeemable Units 2023 and 2022, respectively | 49,165,031 | 60,636,182 | ||||||
Limited Partners, Class D, 3,190.2310 and 3,489.3280 Redeemable Units 2023 and 2022, respectively | 3,201,761 | 3,938,734 | ||||||
Limited Partners, Class Z, 95.3870 Redeemable Units | 100,175 | 111,823 | ||||||
| Total partners’ capital (net asset value) | 53,044,907 | 65,387,698 | ||||||
| Total liabilities and partners’ capital | $ | 54,190,770 | $ | 66,814,152 | ||||
| Net asset value per Redeemable Unit: | ||||||||
| Class A | $ | 801.93 | $ | 901.95 | ||||
| Class D | $ | 1,003.61 | $ | 1,128.79 | ||||
| Class Z | $ | 1,050.19 | $ | 1,172.31 | ||||
December 31, 2022 | December 31, 2021 | |||||||
Assets: | ||||||||
Equity in trading account: | ||||||||
Unrestricted cash (Note 3c) | $ | 50,058,379 | $ | 52,262,908 | ||||
Restricted cash (Note 3c) | 12,210,997 | 11,511,892 | ||||||
Foreign cash (cost $1,917,654 and $718,056 at December 31, 2022 and 2021, respectively) | 1,924,402 | 720,689 | ||||||
Net unrealized appreciation on open futures contracts | 2,445,391 | 858,348 | ||||||
Net unrealized appreciation on open forward contracts | - | 54,739 | ||||||
Total equity in trading account | 66,639,169 | 65,408,576 | ||||||
Interest receivable (Note 3c) | 174,983 | 1,852 | ||||||
Total assets | $ | 66,814,152 | $ | 65,410,428 | ||||
Liabilities and Partners’ Capital: | ||||||||
Liabilities: | ||||||||
Net unrealized depreciation on open forward contracts | $ | 39,323 | $ | - | ||||
Accrued expenses: | ||||||||
Ongoing selling agent fees (Notes 3d and 3e) | 41,122 | 40,278 | ||||||
Management fees (Note 3b) | 43,440 | 36,981 | ||||||
Incentive fees (Note 3b) | 714,301 | - | ||||||
General Partner fees (Note 3a) | 48,582 | 47,545 | ||||||
Professional fees | 107,005 | 165,264 | ||||||
Redemptions payable to General Partner (Note 7) | 125,000 | 100,000 | ||||||
Redemptions payable to Limited Partners (Note 7) | 307,681 | 776,739 | ||||||
Total liabilities | 1,426,454 | 1,166,807 | ||||||
Partners’ Capital (Notes 1 and 7): | ||||||||
General Partner, Class Z, 597.9290 and 704.5560 Redeemable Units outstanding at December 31, 2022 and 2021, respectively | 700,959 | 720,433 | ||||||
Limited Partners, Class A, 67,227.6148 and 75,391.9488 Redeemable Units outstanding at December 31, 2022 and 2021, respectively | 60,636,182 | 59,765,213 | ||||||
Limited Partners, Class D, 3,489.3280 and 3,645.0220 Redeemable Units outstanding at December 31, 2022 and 2021, respectively | 3,938,734 | 3,616,215 | ||||||
Limited Partners, Class Z, 95.3870 and 138.6360 Redeemable Units outstanding at December 31, 2022 and 2021, respectively | 111,823 | 141,760 | ||||||
Total partners’ capital (net asset value) | 65,387,698 | 64,243,621 | ||||||
Total liabilities and partners’ capital | $ | 66,814,152 | $ | 65,410,428 | ||||
Net asset value per Redeemable Unit: | ||||||||
Class A | $ | 901.95 | $ | 792.73 | ||||
Class D | $ | 1,128.79 | $ | 992.10 | ||||
Class Z | $ | 1,172.31 | $ | 1,022.54 | ||||
Notional ($)/ | ||||||||||||
Number of | % of Partners’ | |||||||||||
Contracts | Fair Value | Capital | ||||||||||
Futures Contracts Purchased | ||||||||||||
Currencies | 160 | $ | 138,274 | 0.26 | % | |||||||
Energy | 233 | (875,142 | ) | (1.65 | ) | |||||||
Grains | 98 | (156,597 | ) | (0.30 | ) | |||||||
Indices | 484 | 388,130 | 0.73 | |||||||||
Interest Rates U.S. | 62 | 126,367 | 0.24 | |||||||||
Interest Rates Non-U.S. | 562 | 480,571 | 0.91 | |||||||||
Metals | 60 | 95,533 | 0.18 | |||||||||
Softs | 71 | 67,325 | 0.13 | |||||||||
Total futures contracts purchased | 264,461 | 0.50 | ||||||||||
Futures Contracts Sold | ||||||||||||
Currencies | 89 | (230,673 | ) | (0.43 | ) | |||||||
Energy | 188 | 361,970 | 0.68 | |||||||||
Grains | 212 | 208,689 | 0.39 | |||||||||
Indices | 324 | 99,982 | 0.19 | |||||||||
Interest Rates U.S. | 97 | (109,061 | ) | (0.21 | ) | |||||||
Interest Rates Non-U.S. | 327 | (593,600 | ) | (1.12 | ) | |||||||
Livestock | 1 | 220 | 0.00 | * | ||||||||
Metals | 66 | (64,723 | ) | (0.12 | ) | |||||||
Softs | 108 | 433,208 | 0.82 | |||||||||
Total futures contracts sold | 106,012 | 0.20 | ||||||||||
Net unrealized appreciation on open futures contracts | $ | 370,473 | 0.70 | % | ||||||||
Unrealized Appreciation on Open Forward Contracts | ||||||||||||
Currencies | $ | 41,258,458 | $ | 562,573 | 1.06 | % | ||||||
Metals | 121 | 326,349 | 0.61 | |||||||||
Total unrealized appreciation on open forward contracts | 888,922 | 1.67 | ||||||||||
Unrealized Depreciation on Open Forward Contracts | ||||||||||||
Currencies | $ | 38,087,753 | (691,946 | ) | (1.30 | ) | ||||||
Metals | 153 | (534,742 | ) | (1.01 | ) | |||||||
Total unrealized depreciation on open forward contracts | (1,226,688 | ) | (2.31 | ) | ||||||||
Net unrealized depreciation on open forward contracts | $ | (337,766 | ) | (0.64 | ) % | |||||||
Notional ($)/ | Notional ($)/ | |||||||||||||||||||||||
Number of | % of Partners’ | Number of | % of Partners’ | |||||||||||||||||||||
Contracts | Fair Value | Capital | Contracts | Fair Value | Capital | |||||||||||||||||||
Futures Contracts Purchased | ||||||||||||||||||||||||
Currencies | 205 | $ | 224,798 | 0.34 | % | 205 | $ | 224,798 | 0.34 | % | ||||||||||||||
Energy | 239 | 539,597 | 0.83 | 239 | 539,597 | 0.83 | ||||||||||||||||||
Grains | 237 | 429,927 | 0.66 | 237 | 429,927 | 0.66 | ||||||||||||||||||
Indices | 293 | (428,762) | (0.66) | 293 | (428,762 | ) | (0.66 | ) | ||||||||||||||||
Interest Rates U.S. | 85 | (135,594) | (0.21) | 85 | (135,594 | ) | (0.21 | ) | ||||||||||||||||
Interest Rates Non-U.S. | 174 | (401,257) | (0.61) | 174 | (401,257 | ) | (0.61 | ) | ||||||||||||||||
Livestock | 2 | (890) | (0.00) | * | 2 | (890 | ) | (0.00 | ) * | |||||||||||||||
Metals | 68 | 116,110 | 0.18 | 68 | 116,110 | 0.18 | ||||||||||||||||||
Softs | 60 | 53,603 | 0.08 | 60 | 53,603 | 0.08 | ||||||||||||||||||
Total futures contracts purchased | 397,532 | 0.61 | 397,532 | 0.61 | ||||||||||||||||||||
Futures Contracts Sold | ||||||||||||||||||||||||
Futures Contracts Sold | ||||||||||||||||||||||||
Futures Contracts Sold | ||||||||||||||||||||||||
Futures Contracts Sold | ||||||||||||||||||||||||
Currencies | 129 | (17,562) | (0.03) | 129 | (17,562 | ) | (0.03 | ) | ||||||||||||||||
Energy | 225 | (254,040) | (0.39) | 225 | (254,040 | ) | (0.39 | ) | ||||||||||||||||
Grains | 90 | (144,992) | (0.22) | 90 | (144,992 | ) | (0.22 | ) | ||||||||||||||||
Indices | 357 | 262,132 | 0.40 | 357 | 262,132 | 0.40 | ||||||||||||||||||
Interest Rates U.S. | 207 | 82,672 | 0.13 | 207 | 82,672 | 0.13 | ||||||||||||||||||
Interest Rates Non-U.S. | 922 | 2,252,519 | 3.45 | 922 | 2,252,519 | 3.45 | ||||||||||||||||||
Metals | 33 | (96,587) | (0.15) | 33 | (96,587 | ) | (0.15 | ) | ||||||||||||||||
Softs | 65 | (36,283) | (0.06) | 65 | (36,283 | ) | (0.06 | ) | ||||||||||||||||
Total futures contracts sold | 2,047,859 | 3.13 | 2,047,859 | 3.13 | ||||||||||||||||||||
Net unrealized appreciation on open futures contracts | $ | 2,445,391 | 3.74 | % | $ | 2,445,391 | 3.74 | % | ||||||||||||||||
Unrealized Appreciation on Open Forward Contracts | ||||||||||||||||||||||||
Unrealized Appreciation on Open Forward Contracts | ||||||||||||||||||||||||
Unrealized Appreciation on Open Forward Contracts | ||||||||||||||||||||||||
Unrealized Appreciation on Open Forward Contracts | ||||||||||||||||||||||||
Currencies | $ | 56,648,446 | $ | 713,033 | 1.09 | % | $ | 56,648,446 | $ | 713,033 | 1.09 | % | ||||||||||||
Metals | 22 | 54,836 | 0.08 | 22 | 54,836 | 0.08 | ||||||||||||||||||
Total unrealized appreciation on open forward contracts | 767,869 | 1.17 | 767,869 | 1.17 | ||||||||||||||||||||
Unrealized Depreciation on Open Forward Contracts | ||||||||||||||||||||||||
Unrealized Depreciation on Open Forward Contracts | ||||||||||||||||||||||||
Unrealized Depreciation on Open Forward Contracts | ||||||||||||||||||||||||
Unrealized Depreciation on Open Forward Contracts | ||||||||||||||||||||||||
Currencies | $ | 58,456,926 | (729,014) | (1.11) | $ | 58,456,926 | (729,014 | ) | (1.11 | ) | ||||||||||||||
Metals | 35 | (78,178) | (0.12) | 35 | (78,178 | ) | (0.12 | ) | ||||||||||||||||
Total unrealized depreciation on open forward contracts | (807,192) | (1.23) | (807,192 | ) | (1.23 | ) | ||||||||||||||||||
Net unrealized depreciation on open forward contracts | $ | (39,323) | (0.06) | % | $ | (39,323 | ) | (0.06 | ) % | |||||||||||||||
Notional ($)/ Number of Contracts | Fair Value | % of Partners’ Capital | ||||||||||
Futures Contracts Purchased | ||||||||||||
Currencies | 43 | $ | (39,892 | ) | (0.06 | ) % | ||||||
Energy | 179 | 374,101 | 0.58 | |||||||||
Grains | 393 | 24,995 | 0.04 | |||||||||
Indices | 315 | 206,969 | 0.32 | |||||||||
Interest Rates U.S. | 368 | (47,109 | ) | (0.07 | ) | |||||||
Interest Rates Non-U.S. | 279 | (148,277 | ) | (0.23 | ) | |||||||
Livestock | 16 | (725 | ) | (0.00 | ) * | |||||||
Metals | 89 | 183,889 | 0.29 | |||||||||
Softs | 94 | 67,838 | 0.11 | |||||||||
Total futures contracts purchased | 621,789 | 0.98 | ||||||||||
Futures Contracts Sold | ||||||||||||
Currencies | 190 | (155,673 | ) | (0.24 | ) | |||||||
Energy | 139 | (125,010 | ) | (0.20 | ) | |||||||
Grains | 78 | (29,167 | ) | (0.05 | ) | |||||||
Indices | 233 | 19,629 | 0.03 | |||||||||
Interest Rates U.S. | 48 | 5,054 | 0.01 | |||||||||
Interest Rates Non-U.S. | 540 | 599,106 | 0.93 | |||||||||
Livestock | 2 | 560 | 0.00 | * | ||||||||
Metals | 26 | (90,039 | ) | (0.14 | ) | |||||||
Softs | 77 | 12,099 | 0.02 | |||||||||
Total futures contracts sold | 236,559 | 0.36 | ||||||||||
Net unrealized appreciation on open futures contracts | $ | 858,348 | 1.34 | % | ||||||||
Unrealized Appreciation on Open Forward Contracts Currencies | $ | 81,157,828 | $ | 900,388 | 1.40 | % | ||||||
Metals | 58 | 241,320 | 0.38 | |||||||||
Total unrealized appreciation on open forward contracts | 1,141,708 | 1.78 | ||||||||||
Unrealized Depreciation on Open Forward Contracts Currencies | $ | 72,375,905 | (822,999 | ) | (1.28 | ) | ||||||
Metals | 64 | (263,970 | ) | (0.41 | ) | |||||||
Total unrealized depreciation on open forward contracts | (1,086,969 | ) | (1.69 | ) | ||||||||
Net unrealized appreciation on open forward contracts | $ | 54,739 | 0.09 | % | ||||||||
2022 | 2021 | 2020 | 2023 | 2022 | 2021 | |||||||||||||||||||
Investment Income: | ||||||||||||||||||||||||
Interest income | $ | 922,272 | $ | 21,739 | $ | 192,095 | $ | 2,376,283 | $ | 922,272 | $ | 21,739 | ||||||||||||
Interest income allocated from the Funds | - | - | 132,455 | |||||||||||||||||||||
Total investment income | 922,272 | 21,739 | 324,550 | |||||||||||||||||||||
Expenses: | ||||||||||||||||||||||||
Expenses allocated from the Funds | - | - | 357,071 | |||||||||||||||||||||
Clearing fees related to direct investments (Note 3c) | 257,932 | 349,808 | 225,768 | 259,750 | 257,932 | 349,808 | ||||||||||||||||||
Ongoing selling agent fees (Notes 3d and 3e) | 514,934 | 529,908 | 1,311,388 | 446,734 | 514,934 | 529,908 | ||||||||||||||||||
General Partner fees (Note 3a) | 607,560 | 624,830 | 835,900 | 526,383 | 607,560 | 624,830 | ||||||||||||||||||
Management fees (Note 3b) | 539,370 | 569,583 | 799,137 | 389,861 | 539,370 | 569,583 | ||||||||||||||||||
Incentive fees (Note 3b) | 2,432,924 | 2,147,999 | 99,425 | - | 2,432,924 | 2,147,999 | ||||||||||||||||||
Professional fees | 237,008 | 308,588 | 415,288 | 314,389 | 237,008 | 308,588 | ||||||||||||||||||
Total expenses | 4,589,728 | 4,530,716 | 4,043,977 | 1,937,117 | 4,589,728 | 4,530,716 | ||||||||||||||||||
Net investment loss | (3,667,456 | ) | (4,508,977 | ) | (3,719,427 | ) | ||||||||||||||||||
Net investment income (loss) | 439,166 | (3,667,456 | ) | (4,508,977 | ) | |||||||||||||||||||
Trading Results: | ||||||||||||||||||||||||
Net gains (losses) on trading of commodity interests and investment in the Funds: | ||||||||||||||||||||||||
Net gains (losses) on trading of commodity interests: | ||||||||||||||||||||||||
Net realized gains (losses) on closed contracts | 10,914,072 | 13,340,586 | (1,749,965 | ) | (4,941,109 | ) | 10,914,072 | 13,340,586 | ||||||||||||||||
Net realized gains (losses) on closed contracts allocated from the Funds | - | - | (1,713,607 | ) | ||||||||||||||||||||
Net change in unrealized gains (losses) on open contracts | 1,497,096 | (1,714,609 | ) | 2,213,664 | (2,374,767 | ) | 1,497,096 | (1,714,609 | ) | |||||||||||||||
Net change in unrealized gains (losses) on open contracts allocated from the Funds | - | - | 39,112 | |||||||||||||||||||||
Total trading results | 12,411,168 | 11,625,977 | (1,210,796 | ) | (7,315,876 | ) | 12,411,168 | 11,625,977 | ||||||||||||||||
Net income (loss) | $ | 8,743,712 | $ | 7,117,000 | $ | (4,930,223 | ) | $ | (6,876,710 | ) | $ | 8,743,712 | $ | 7,117,000 | ||||||||||
Net income (loss) per Redeemable Unit (Note 8)*: | ||||||||||||||||||||||||
Class A | $ | 109.22 | $ | 72.54 | $ | (31.69 | ) | $ | (100.02 | ) | $ | 109.22 | $ | 72.54 | ||||||||||
Class D | $ | 136.69 | $ | 90.78 | $ | (32.60 | ) | $ | (125.18 | ) | $ | 136.69 | $ | 90.78 | ||||||||||
Class Z | $ | 149.77 | $ | 100.58 | $ | (26.17 | ) | $ | (122.12 | ) | $ | 149.77 | $ | 100.58 | ||||||||||
Weighted average Redeemable Units outstanding: | ||||||||||||||||||||||||
Class A | 71,181.0507 | 83,038.9042 | 115,008.3148 | 64,612.7001 | 71,181.0507 | 83,038.9042 | ||||||||||||||||||
Class D | 3,502.3025 | 4,921.9299 | 6,165.8878 | 3,339.7795 | 3,502.3025 | 4,921.9299 | ||||||||||||||||||
Class Z | 838.4930 | 986.2728 | 1,502.3373 | 693.3160 | 838.4930 | 986.2728 | ||||||||||||||||||
Class A | Class D | Class Z | Total | Class A | Class D | Class Z | Total | |||||||||||||||||||||||||||||||||||||||||||||||||||||||||
Amount | Redeemable Units | Amount | Redeemable Units | Amount | Redeemable Units | Amount | Redeemable Units | |||||||||||||||||||||||||||||||||||||||||||||||||||||||||
Partners’ Capital, December 31, 2019 | $ | 98,542,340 | 131,060.4968 | $ | 6,214,764 | 6,654.5080 | $ | 1,451,495 | 1,530.8980 | 106,208,599 | 139,245.9028 | |||||||||||||||||||||||||||||||||||||||||||||||||||||
Redemptions - General Partner | - | - | - | - | (300,000 | ) | (325.3940 | ) | (300,000 | ) | (325.3940 | ) | ||||||||||||||||||||||||||||||||||||||||||||||||||||
Redemptions - Limited Partners | (26,476,389 | ) | (37,473.6290 | ) | (741,074 | ) | (829.6260 | ) | (75,779 | ) | (83.3770 | ) | (27,293,242 | ) | (38,386.6320 | ) | ||||||||||||||||||||||||||||||||||||||||||||||||
Net income (loss) | (4,665,462 | ) | - | (223,602 | ) | - | (41,159 | ) | - | (4,930,223 | ) | - | ||||||||||||||||||||||||||||||||||||||||||||||||||||
Amount | Redeemable Units | Amount | Redeemable Units | Amount | Redeemable Units | Amount | Redeemable Units | |||||||||||||||||||||||||||||||||||||||||||||||||||||||||
Partners’ Capital, December 31, 2020 | 67,400,489 | 93,586.8678 | 5,250,088 | 5,824.8820 | 1,034,557 | 1,122.1270 | 73,685,134 | 100,533.8768 | $ | 67,400,489 | 93,586.8678 | $ | 5,250,088 | 5,824.8820 | $ | 1,034,557 | 1,122.1270 | 73,685,134 | 100,533.8768 | |||||||||||||||||||||||||||||||||||||||||||||
Redemptions - General Partner | - | - | - | - | (275,000 | ) | (278.9350 | ) | (275,000 | ) | (278.9350 | ) | - | - | - | - | (275,000 | ) | (278.9350 | ) | (275,000 | ) | (278.9350 | ) | ||||||||||||||||||||||||||||||||||||||||
Redemptions - Limited Partners | (14,065,961 | ) | (18,194.9190 | ) | (2,217,552 | ) | (2,179.8600 | ) | - | - | (16,283,513 | ) | (20,374.7790 | ) | (14,065,961 | ) | (18,194.9190 | ) | (2,217,552 | ) | (2,179.8600 | ) | - | - | (16,283,513 | ) | (20,374.7790 | ) | ||||||||||||||||||||||||||||||||||||
Net income (loss) | 6,430,685 | - | 583,679 | - | 102,636 | - | 7,117,000 | - | 6,430,685 | - | 583,679 | - | 102,636 | - | 7,117,000 | - | ||||||||||||||||||||||||||||||||||||||||||||||||
Partners’ Capital, December 31, 2021 | 59,765,213 | 75,391.9488 | 3,616,215 | 3,645.0220 | 862,193 | 843.1920 | 64,243,621 | 79,880.1628 | 59,765,213 | 75,391.9488 | 3,616,215 | 3,645.0220 | 862,193 | 843.1920 | 64,243,621 | 79,880.1628 | ||||||||||||||||||||||||||||||||||||||||||||||||
Redemptions - General Partner | - | - | - | - | (125,000 | ) | (106.6270 | ) | (125,000 | ) | (106.6270 | ) | - | - | - | - | (125,000 | ) | (106.6270 | ) | (125,000 | ) | (106.6270 | ) | ||||||||||||||||||||||||||||||||||||||||
Redemptions - Limited Partners | (7,266,578 | ) | (8,164.3340 | ) | (156,748 | ) | (155.6940 | ) | (51,309 | ) | (43.2490 | ) | (7,474,635 | ) | (8,363.2770 | ) | (7,266,578 | ) | (8,164.3340 | ) | (156,748 | ) | (155.6940 | ) | (51,309 | ) | (43.2490 | ) | (7,474,635 | ) | (8,363.2770 | ) | ||||||||||||||||||||||||||||||||
Net income (loss) | 8,137,547 | - | 479,267 | - | 126,898 | - | 8,743,712 | - | 8,137,547 | - | 479,267 | - | 126,898 | - | 8,743,712 | - | ||||||||||||||||||||||||||||||||||||||||||||||||
Partners’ Capital, December 31, 2022 | $ | 60,636,182 | 67,227.6148 | $ | 3,938,734 | 3,489.3280 | $ | 812,782 | 693.3160 | $ | 65,387,698 | 71,410.2588 | 60,636,182 | 67,227.6148 | 3,938,734 | 3,489.3280 | 812,782 | 693.3160 | 65,387,698 | 71,410.2588 | ||||||||||||||||||||||||||||||||||||||||||||
Redemptions - General Partner | - | - | - | - | (50,000 | ) | (47.6100 | ) | (50,000 | ) | (47.6100 | ) | ||||||||||||||||||||||||||||||||||||||||||||||||||||
Redemptions - Limited Partners | (5,090,648 | ) | (5,919.1640 | ) | (325,433 | ) | (299.0970 | ) | - | - | (5,416,081 | ) | (6,218.2610 | ) | ||||||||||||||||||||||||||||||||||||||||||||||||||
Net income (loss) | (6,380,503 | ) | - | (411,540 | ) | - | (84,667 | ) | - | (6,876,710 | ) | - | ||||||||||||||||||||||||||||||||||||||||||||||||||||
Partners’ Capital, December 31, 2023 | $ | 49,165,031 | 61,308.4508 | $ | 3,201,761 | 3,190.2310 | $ | 678,115 | 645.7060 | $ | 53,044,907 | 65,144.3878 | ||||||||||||||||||||||||||||||||||||||||||||||||||||
Class A | Class D | Class Z | ||||||||||||||||||||||
| 2020: | $ | 720.19 | $ | 901.32 | $ | 921.96 | ||||||||||||||||||
Class A | Class D | Class Z | ||||||||||||||||||||||
| 2021: | $ | 792.73 | $ | 992.10 | $ | 1,022.54 | $ | 792.73 | $ | 992.10 | $ | 1,022.54 | ||||||||||||
| 2022: | $ | 901.95 | $ | 1,128.79 | $ | 1,172.31 | $ | 901.95 | $ | 1,128.79 | $ | 1,172.31 | ||||||||||||
| 2023: | $ | 801.93 | $ | 1,003.61 | $ | 1,050.19 | ||||||||||||||||||
1. | Organization: |
2. | Basis of Presentation and Summary of Significant Accounting Policies: |
| a. | Use of Estimates. |
| b. | Profit Allocation. |
| c. | Statement of Cash Flows. “Statement of Cash Flows.” |
| d. | Partnership’s |
first-in, first-out method. Unrealized gains or losses on open contracts are |
Partnership’s Cash. |
Income Taxes “Income Taxes,” “more-likely-than-not” of being sustained “when challenged” or “when examined” by the applicable tax authority. Tax positions determined not to meet themore-likely-than-not threshold would be recorded as a tax benefit or liability in the Partnership’s Statements of Financial Condition for the current year. If a tax position does not meet the minimum statutory threshold to avoid the incurring of penalties, an expense for the amount of the statutory penalty and interest, if applicable, shall be recognized in the Partnership’s Statements of Income and Expenses in the years in which the position is claimed or expected to be claimed. The General Partner has concluded that there are no significant uncertain tax positions that would require recognition in the financial statements. The Partnership files U.S. federal and various state and local tax returns. No income tax returns are currently under examination. The2020 through tax years remain subject to examination by U.S. federal and most state tax authorities. |
Investment Company Status 2013-08 “Financial Services—Investment Companies (Topic 946): Amendments to the Scope, Measurement and Disclosure Requirements” |
Net Income (Loss) per Redeemable Unit. “Financial Services - Investment Companies.” |
3. | Agreements: |
| a. | Limited Partnership Agreement: |
| b. | Management Agreement: |
| c. | Customer Agreement: |
| d. | Selling Agreement: |
| e. | Harbor Selling Agreement: |
4. | Trading Activities: |
Gross Amounts | Net Amounts | Gross Amounts Not Offset in the | ||||||||||||||||||||||
Offset in the | Presented in the | Statements of Financial Condition | ||||||||||||||||||||||
Gross Amounts | Statements of Financial | Statements of Financial | Financial | Cash Collateral Received/ | Net | |||||||||||||||||||
December 31, 2022 | Recognized | Condition | Condition | Instruments | Pledged* | Amount | ||||||||||||||||||
Assets | ||||||||||||||||||||||||
Futures | $ | 4,783,634 | $ | (2,338,243) | $ | 2,445,391 | $ | - | $ | - | $ | 2,445,391 | ||||||||||||
Forwards | 767,869 | (767,869) | - | - | - | - | ||||||||||||||||||
Total assets | $ | 5,551,503 | $ | (3,106,112) | $ | 2,445,391 | $ | - | $ | - | $ | 2,445,391 | ||||||||||||
Liabilities | ||||||||||||||||||||||||
Futures | $ | (2,338,243) | $ | 2,338,243 | $ | - | $ | - | $ | - | $ | - | ||||||||||||
Forwards | (807,192) | 767,869 | (39,323 | ) | - | 39,323 | - | |||||||||||||||||
Total liabilities | $ | (3,145,435) | $ | 3,106,112 | $ | (39,323) | $ | - | $ | 39,323 | $ | - | ||||||||||||
Net fair value | $ | 2,445,391 | * | |||||||||||||||||||||
Gross Amounts | Net Amounts | Gross Amounts Not Offset in the | ||||||||||||||||||||||
Offset in the | Presented in the | Statements of Financial Condition | ||||||||||||||||||||||
Gross Amounts | Statements of Financial | Statements of Financial | Financial | Cash Collateral Received/ | Net | |||||||||||||||||||
December 31, 2021 | Recognized | Condition | Condition | Instruments | Pledged* | Amount | ||||||||||||||||||
Assets | ||||||||||||||||||||||||
Futures | $ | 2,170,180 | $ | (1,311,832) | $ | 858,348 | $ | - | $ | - | $ | 858,348 | ||||||||||||
Forwards | 1,141,708 | (1,086,969) | 54,739 | - | - | 54,739 | ||||||||||||||||||
Total assets | $ | 3,311,888 | $ | (2,398,801) | $ | 913,087 | $ | - | $ | - | $ | 913,087 | ||||||||||||
Liabilities | ||||||||||||||||||||||||
Futures | $ | (1,311,832) | $ | 1,311,832 | $ | - | $ | - | $ | - | $ | - | ||||||||||||
Forwards | (1,086,969) | 1,086,969 | - | - | - | - | ||||||||||||||||||
Total liabilities | $ | (2,398,801) | $ | 2,398,801 | $ | - | $ | - | $ | - | $ | - | ||||||||||||
Net fair value | $ | 913,087 | * | |||||||||||||||||||||
Gross Amounts | Net Amounts | Gross Amounts Not Offset in the | ||||||||||||||||||||||
Offset in the | Presented in the | Statements of Financial Condition | ||||||||||||||||||||||
Gross Amounts | Statements of Financial | Statements of Financial | Financial | Cash Collateral Received/ | Net | |||||||||||||||||||
December 31, 2023 | Recognized | Condition | Condition | Instruments | Pledged* | Amount | ||||||||||||||||||
Assets | ||||||||||||||||||||||||
| Futures | $ | 2,995,671 | $ | (2,625,198 | ) | $ | 370,473 | $ | - | $ | - | $ | 370,473 | |||||||||||
| Forwards | 888,922 | (888,922 | ) | - | - | - | - | |||||||||||||||||
| Total assets | $ | 3,884,593 | $ | (3,514,120 | ) | $ | 370,473 | $ | - | $ | - | $ | 370,473 | |||||||||||
Liabilities | ||||||||||||||||||||||||
| Futures | $ | (2,625,198 | ) | $ | 2,625,198 | $ | - | $ | - | $ | - | $ | - | |||||||||||
| Forwards | (1,226,688 | ) | 888,922 | (337,766 | ) | - | 337,766 | - | ||||||||||||||||
| Total liabilities | $ | (3,851,886 | ) | $ | 3,514,120 | $ | (337,766 | ) | $ | - | $ | 337,766 | $ | - | ||||||||||
| Net fair value | $ | 370,473 | * | |||||||||||||||||||||
Gross Amounts | Net Amounts | Gross Amounts Not Offset in the | ||||||||||||||||||||||
Offset in the | Presented in the | Statements of Financial Condition | ||||||||||||||||||||||
Gross Amounts | Statements of Financial | Statements of Financial | Financial | Cash Collateral Received/ | Net | |||||||||||||||||||
December 31, 2022 | Recognized | Condition | Condition | Instruments | Pledged* | Amount | ||||||||||||||||||
Assets | ||||||||||||||||||||||||
| Futures | $ | 4,783,634 | $ | (2,338,243 | ) | $ | 2,445,391 | $ | - | $ | - | $ | 2,445,391 | |||||||||||
| Forwards | 767,869 | (767,869 | ) | - | - | - | - | |||||||||||||||||
| Total assets | $ | 5,551,503 | $ | (3,106,112 | ) | $ | 2,445,391 | $ | - | $ | - | $ | 2,445,391 | |||||||||||
Liabilities | ||||||||||||||||||||||||
| Futures | $ | (2,338,243 | ) | $ | 2,338,243 | $ | - | $ | - | $ | - | $ | - | |||||||||||
| Forwards | (807,192 | ) | 767,869 | (39,323 | ) | - | 39,323 | - | ||||||||||||||||
| Total liabilities | $ | (3,145,435 | ) | $ | 3,106,112 | $ | (39,323 | ) | $ | - | $ | 39,323 | $ | - | ||||||||||
| Net fair value | $ | 2,445,391 | * | |||||||||||||||||||||
| * | In the event of default by the Partnership, MS&Co., the Partnership’s commodity futures broker and the sole counterparty to the Partnership’s non-exchange-traded contracts, as applicable, has the right to offset the Partnership’s obligation with the Partnership’s cash and/or U.S. Treasury bills held by MS&Co., thereby minimizing MS&Co.’s risk of loss. In certain instances, MS&Co. may not post collateral and as such, in the event of default by MS&Co., the Partnership is exposed to the amount shown in the Statements of Financial Condition. In the case of exchange-traded contracts, the Partnership’s exposure to counterparty risk may be reduced since the exchange’s clearinghouse interposes its credit between buyer and seller and the clearinghouse’s guarantee funds may be available in the event of a default. In some instances, the actual collateral received and/or pledged may be more than the amount shown due to overcollateralization. |
December 31, | |||||
Assets | |||||
Futures Contracts | |||||
Currencies | $ | ||||
Energy | |||||
Grains | |||||
Indices | |||||
Interest Rates U.S. | |||||
Interest Rates Non-U.S. | |||||
Livestock | |||||
Metals | |||||
Softs | |||||
Total unrealized appreciation on open futures contracts | 2,995,671 | ||||
Liabilities | |||||
Futures Contracts | |||||
Currencies | (239,168 | ) | |||
Energy | (996,165 | ) | |||
Grains | (184,709 | ) | |||
Indices | (245,853 | ) | |||
Interest Rates U.S. | (113,358 | ) | |||
Interest Rates Non-U.S. | (672,519 | ) | |||
Metals | (126,095 | ) | |||
Softs | (47,331 | ) | |||
Total unrealized depreciation on open futures contracts | ( | ) | |||
Net unrealized appreciation on open futures contracts | $ | 370,473 | * | ||
Assets | |||||
Forward Contracts | |||||
Currencies | $ | 562,573 | |||
Metals | 326,349 | ||||
Total unrealized appreciation on open forward contracts | |||||
Liabilities | |||||
Forward Contracts | |||||
Currencies | (691,946 | ) | |||
| (534,742 | ) | ||||
Total unrealized depreciation on open forward contracts | (1,226,688 | ) | |||
Net unrealized depreciation on open forward contracts | $ | ( | ) ** | ||
| * | This amount is in “Net unrealized appreciation on open futures contracts” in the Statements of Financial Condition. |
| ** | This amount is in “Net unrealized depreciation on open forward contracts” in the Statements of Financial Condition. |
December 31, | |||||
Assets | |||||
Futures Contracts | |||||
Currencies | $ | ||||
Energy | |||||
Grains | |||||
Indices | |||||
Interest Rates U.S. | |||||
Interest Rates Non-U.S. | |||||
Livestock | |||||
Metals | |||||
Softs | |||||
Total unrealized appreciation on open futures contracts | 4,783,634 | ||||
Liabilities | |||||
Futures Contracts | |||||
Currencies | (128,154 | ) | |||
Energy | (801,290 | ) | |||
Grains | (169,873 | ) | |||
Indices | (514,146 | ) | |||
Interest Rates U.S. | (151,219 | ) | |||
Interest Rates Non-U.S. | (411,124 | ) | |||
Livestock | (1,200 | ) | |||
Metals | (112,209 | ) | |||
Softs | (49,028 | ) | |||
Total unrealized depreciation on open futures contracts | ) | ||||
Net unrealized appreciation on open futures contracts | $ | 2,445,391 | * | ||
Assets | |||||
Forward Contracts | |||||
Currencies | $ | 713,033 | |||
Metals | 54,836 | ||||
Total unrealized appreciation on open forward contracts | |||||
Liabilities | |||||
Forward Contracts | |||||
Currencies | (729,014 | ) | |||
Metals | (78,178 | ) | |||
Total unrealized depreciation on open forward contracts | (807,192 | ) | |||
| $ | |||||
| * | This amount is in “Net unrealized appreciation on open futures contracts” in the Statements of Financial Condition. |
| ** | This amount is in “Net unrealized |
Sector | 2022 | 2021 | 2020 | |||||||||||||||
Currencies | $ | 1,868,856 | $ | (610,839 | ) | $ | (882,066 | ) | ||||||||||
Energy | 4,221,030 | 11,006,591 | 1,918,213 | |||||||||||||||
Grains | 193,707 | 2,268,001 | 2,475,299 | |||||||||||||||
Indices | 225,406 | 3,540,100 | (6,408,863) | |||||||||||||||
Interest Rates U.S. | (2,062,820 | ) | (807,159 | ) | 821,085 | |||||||||||||
Interest Rates Non-U.S. | 8,906,493 | (3,572,828 | ) | 1,546,319 | ||||||||||||||
Livestock | (462,710 | ) | (301,560 | ) | 63,833 | |||||||||||||
Metals | 906,913 | (923,008 | ) | 1,946,232 | ||||||||||||||
Softs | (1,385,707 | ) | 1,026,679 | (1,016,353 | ) | |||||||||||||
Total | $ | 12,411,168 | *** | $ | 11,625,977 | *** | $ | 463,699 | *** | |||||||||
Sector | 2023 | 2022 | 2021 | |||||||||||||||
Currencies | $ | (763,584 | ) | $ | 1,868,856 | $ | (610,839 | ) | ||||||||||
Energy | (3,025,817 | ) | 4,221,030 | 11,006,591 | ||||||||||||||
Grains | (351,578 | ) | 193,707 | 2,268,001 | ||||||||||||||
Indices | 124,217 | 225,406 | 3,540,100 | |||||||||||||||
Interest Rates U.S. | 253,640 | (2,062,820 | ) | (807,159 | ) | |||||||||||||
Interest Rates Non-U.S. | (3,144,974 | ) | 8,906,493 | (3,572,828 | ) | |||||||||||||
Livestock | 10,170 | (462,710 | ) | (301,560 | ) | |||||||||||||
| Metals | (1,860,735 | ) | 906,913 | (923,008 | ) | |||||||||||||
Softs | 1,442,785 | (1,385,707 | ) | 1,026,679 | ||||||||||||||
Total | $ | (7,315,876 | ) | *** | $ | 12,411,168 | *** | $ | 11,625,977 | *** | ||||||||
| *** | This amount is included in “Total trading results” in the Statements of Income and Expenses. |
5. | Fair Value Measurements: |
December 31, 2022 | Total | Level 1 | Level 2 | Level 3 | ||||||||||||
Assets | ||||||||||||||||
Futures | $ | 4,783,634 | $ | 4,783,634 | $ | - | $ | - | ||||||||
Forwards | 767,869 | - | 767,869 | - | ||||||||||||
Total Assets | $ | 5,551,503 | $ | 4,783,634 | $ | 767,869 | $ | - | ||||||||
Liabilities | ||||||||||||||||
Futures | $ | 2,338,243 | $ | 2,338,243 | $ | - | $ | - | ||||||||
Forwards | 807,192 | - | 807,192 | - | ||||||||||||
Total Liabilities | $ | 3,145,435 | $ | 2,338,243 | $ | 807,192 | $ | - | ||||||||
December 31, 2021 | Total | Level 1 | Level 2 | Level 3 | ||||||||||||
Assets | ||||||||||||||||
Futures | $ | 2,170,180 | $ | 2,170,180 | $ | - | $ | - | ||||||||
Forwards | 1,141,708 | - | 1,141,708 | - | ||||||||||||
Total Assets | $ | 3,311,888 | $ | 2,170,180 | $ | 1,141,708 | $ | - | ||||||||
Liabilities | ||||||||||||||||
Futures | $ | 1,311,832 | $ | 1,311,832 | $ | - | $ | - | ||||||||
Forwards | 1,086,969 | - | 1,086,969 | - | ||||||||||||
Total Liabilities | $ | 2,398,801 | $ | 1,311,832 | $ | 1,086,969 | $ | - | ||||||||
| December 31, 2023 | Total | Level 1 | Level 2 | Level 3 | ||||||||||||
| Assets | ||||||||||||||||
| Futures | $ | 2,995,671 | $ | 2,995,671 | $ | - | $ | - | ||||||||
| Forwards | 888,922 | - | 888,922 | - | ||||||||||||
| Total Assets | $ | 3,884,593 | $ | 2,995,671 | $ | 888,922 | $ | - | ||||||||
| Liabilities | ||||||||||||||||
| Futures | $ | 2,625,198 | $ | 2,625,198 | $ | - | $ | - | ||||||||
| Forwards | 1,226,688 | - | 1,226,688 | - | ||||||||||||
| Total Liabilities | $ | 3,851,886 | $ | 2,625,198 | $ | 1,226,688 | $ | - | ||||||||
| December 31, 2022 | Total | Level 1 | Level 2 | Level 3 | ||||||||||||
| Assets | ||||||||||||||||
| Futures | $ | 4,783,634 | $ | 4,783,634 | $ | - | $ | - | ||||||||
| Forwards | 767,869 | - | 767,869 | - | ||||||||||||
| Total Assets | $ | 5,551,503 | $ | 4,783,634 | $ | 767,869 | $ | - | ||||||||
| Liabilities | ||||||||||||||||
| Futures | $ | 2,338,243 | $ | 2,338,243 | $ | - | $ | - | ||||||||
| Forwards | 807,192 | - | 807,192 | - | ||||||||||||
| Total Liabilities | $ | 3,145,435 | $ | 2,338,243 | $ | 807,192 | $ | - | ||||||||
Subscriptions, Distributions and Redemptions : |
7. | Financial Highlights: |
2022 | 2021 | 2020 | ||||||||||||||||||||||||||||||||||
Class A | Class D | Class Z | Class A | Class D | Class Z | Class A | Class D | Class Z | ||||||||||||||||||||||||||||
Per Redeemable Unit Performance (for a unit outstanding throughout the year):* | ||||||||||||||||||||||||||||||||||||
Net realized and unrealized gains (losses) | $ | 157.24 | $ | 195.30 | $ | 201.95 | $ | 122.31 | $ | 156.08 | $ | 156.23 | $ | (1.33) | $ | (1.70) | $ | (1.38) | ||||||||||||||||||
Net investment loss | (48.02) | (58.61) | (52.18) | (49.77) | (65.30) | (55.65) | (30.36) | (30.90) | (24.79) | |||||||||||||||||||||||||||
Increase (decrease) for the year | 109.22 | 136.69 | 149.77 | 72.54 | 90.78 | 100.58 | (31.69) | (32.60) | (26.17) | |||||||||||||||||||||||||||
Net asset value per Redeemable Unit, beginning of year | 792.73 | 992.10 | 1,022.54 | 720.19 | 901.32 | 921.96 | 751.88 | 933.92 | 948.13 | |||||||||||||||||||||||||||
Net asset value per Redeemable Unit, end of year | $ | 901.95 | $ | 1,128.79 | $ | 1,172.31 | $ | 792.73 | $ | 992.10 | $ | 1,022.54 | $ | 720.19 | $ | 901.32 | $ | 921.96 | ||||||||||||||||||
2022 | 2021 | 2020 | ||||||||||||||||||||||||||||||||||
Class A | Class D | Class Z | Class A | Class D | Class Z | Class A | Class D | Class Z | ||||||||||||||||||||||||||||
Ratios to Average Limited Partners’ Capital: | ||||||||||||||||||||||||||||||||||||
Net investment loss** | (5.4) | % | (5.3) | % | (4.8) | % | (6.4) | % | (6.9) | % | (5.5) | % | (4.3) | % | (3.5) | % | (2.8) | % | ||||||||||||||||||
Operating expenses | 3.2 | % | 3.2 | % | 2.5 | % | 3.4 | % | 3.5 | % | 2.6 | % | 4.6 | % | 3.7 | % | 3.0 | % | ||||||||||||||||||
Incentive fees | 3.5 | % | 3.5 | % | 3.7 | % | 3.0 | % | 3.4 | % | 2.9 | % | 0.1 | % | 0.1 | % | 0.1 | % | ||||||||||||||||||
Total expenses | 6.7 | % | 6.7 | % | 6.2 | % | 6.4 | % | 6.9 | % | 5.5 | % | 4.7 | % | 3.8 | % | 3.1 | % | ||||||||||||||||||
Total return: | ||||||||||||||||||||||||||||||||||||
Total return before incentive fees | 17.8 | % | 17.8 | % | 18.8 | % | 13.3 | % | 13.7 | % | 14.1 | % | (4.1) | % | (3.4) | % | (2.6) | % | ||||||||||||||||||
Incentive fees | (4.0) | % | (4.0) | % | (4.2) | % | (3.2) | % | (3.6) | % | (3.2) | % | (0.1) | % | (0.1) | % | (0.2) | % | ||||||||||||||||||
Total return after incentive fees | 13.8 | % | 13.8 | % | 14.6 | % | 10.1 | % | 10.1 | % | 10.9 | % | (4.2) | % | (3.5) | % | (2.8) | % | ||||||||||||||||||
2023 | 2022 | 2021 | ||||||||||||||||||||||||||||||||||
Class A | Class D | Class Z | Class A | Class D | Class Z | Class A | Class D | Class Z | ||||||||||||||||||||||||||||
Per Redeemable Unit Performance (for a unit outstanding throughout the year):* | ||||||||||||||||||||||||||||||||||||
Net realized and unrealized gains (losses) | $ | (106.24 | ) | $ | (132.89 | ) | $ | (138.95 | ) | $ | 157.24 | $ | 195.30 | $ | 201.95 | $ | 122.31 | $ | 156.08 | $ | 156.23 | |||||||||||||||
Net investment income (loss) | 6.22 | 7.71 | 16.83 | (48.02 | ) | (58.61 | ) | (52.18 | ) | (49.77 | ) | (65.30 | ) | (55.65 | ) | |||||||||||||||||||||
Increase (decrease) for the year | (100.02 | ) | (125.18 | ) | (122.12 | ) | 109.22 | 136.69 | 149.77 | 72.54 | 90.78 | 100.58 | ||||||||||||||||||||||||
Net asset value per Redeemable Unit, beginning of year | 901.95 | 1,128.79 | 1,172.31 | 792.73 | 992.10 | 1,022.54 | 720.19 | 901.32 | 921.96 | |||||||||||||||||||||||||||
Net asset value per Redeemable Unit, end of year | $ | 801.93 | $ | 1,003.61 | $ | 1,050.19 | $ | 901.95 | $ | 1,128.79 | $ | 1,172.31 | $ | 792.73 | $ | 992.10 | $ | 1,022.54 | ||||||||||||||||||
2023 | 2022 | 2021 | ||||||||||||||||||||||||||||||||||
Class A | Class D | Class Z | Class A | Class D | Class Z | Class A | Class D | Class Z | ||||||||||||||||||||||||||||
Ratios to Average Limited Partners’ Capital: | ||||||||||||||||||||||||||||||||||||
Net investment income (loss)** | 0.7 | % | 0.7 | % | 1.5 | % | (5.4) | % | (5.3) | % | (4.8) | % | (6.4) | % | (6.9) | % | (5.5) | % | ||||||||||||||||||
Operating expenses | 3.2 | % | 3.2 | % | 2.5 | % | 3.2 | % | 3.2 | % | 2.5 | % | 3.4 | % | 3.5 | % | 2.6 | % | ||||||||||||||||||
Incentive fees | 0.0 | % | 0.0 | % | 0.0 | % | 3.5 | % | 3.5 | % | 3.7 | % | 3.0 | % | 3.4 | % | 2.9 | % | ||||||||||||||||||
Total expenses | 3.2 | % | 3.2 | % | 2.5 | % | 6.7 | % | 6.7 | % | 6.2 | % | 6.4 | % | 6.9 | % | 5.5 | % | ||||||||||||||||||
Total return: | ||||||||||||||||||||||||||||||||||||
Total return before incentive fees | (11.1) | % | (11.1) | % | (10.4) | % | 17.8 | % | 17.8 | % | 18.8 | % | 13.3 | % | 13.7 | % | 14.1 | % | ||||||||||||||||||
Incentive fees | 0.0 | % | 0.0 | % | 0.0 | % | (4.0) | % | (4.0) | % | (4.2) | % | (3.2) | % | (3.6) | % | (3.2) | % | ||||||||||||||||||
Total return after incentive fees | (11.1) | % | (11.1) | % | (10.4) | % | 13.8 | % | 13.8 | % | 14.6 | % | 10.1 | % | 10.1 | % | 10.9 | % | ||||||||||||||||||
| * | Net investment loss per Redeemable Unit is calculated by dividing the interest income less total expenses by the average number of Redeemable Units outstanding during the year. The net realized and unrealized gains (losses) per Redeemable Unit is a balancing amount necessary to reconcile the change in net asset value per Redeemable Unit with the other per unit information. |
| ** | Interest income less total expenses. |
8. | Financial Instrument Risks: |
Subsequent Events: |
For the period from October 1, 2022 to December 31, 2022 | For the period from July 1, 2022 to September 30, 2022 | For the period from April 1, 2022 to June 30, 2022 | For the period from January 1, 2022 to March 31, 2022 | For the period from October 1, 2023 to December 31, 2023 | For the period from July 1, 2023 to September 30, 2023 | For the period from April 1, 2023 to June 30, 2023 | For the period from January 1, 2023 to March 31, 2023 | |||||||||||||||||||||||||
Total investment income | $ | 512,905 | $ | 309,752 | $ | 87,657 | $ | 11,958 | $ | 634,245 | $ | 619,065 | $ | 588,873 | $ | 534,100 | ||||||||||||||||
Total expenses | (285,279 | ) | (916,353 | ) | (1,548,176 | ) | (1,839,920 | ) | (128,034 | ) | (729,465 | ) | (553,120 | ) | (526,498 | ) | ||||||||||||||||
Total trading results | (2,169,268 | ) | 1,003,273 | 4,510,269 | 9,066,894 | (7,327,508 | ) | 2,417,602 | 2,012,484 | (4,418,454 | ) | |||||||||||||||||||||
Net income (loss) | $ | (1,941,642 | ) | $ | 396,672 | $ | 3,049,750 | $ | 7,238,932 | $ | (6,821,297 | ) | $ | 2,307,202 | $ | 2,048,237 | $ | (4,410,852 | ) | |||||||||||||
Increase (decrease) in Net Asset Value per Redeemable Unit: | ||||||||||||||||||||||||||||||||
Class A | $ | (26.61 | ) | $ | 5.90 | $ | 38.86 | $ | 91.07 | $ | (101.44 | ) | $ | 33.97 | $ | 28.78 | $ | (61.33 | ) | |||||||||||||
Class D | $ | (33.30 | ) | $ | 7.38 | $ | 48.63 | $ | 113.98 | $ | (126.96 | ) | $ | 42.52 | $ | 36.01 | $ | (76.75 | ) | |||||||||||||
Class Z | $ | (32.29 | ) | $ | 9.92 | $ | 52.50 | $ | 119.64 | $ | (130.62 | ) | $ | 46.55 | $ | 39.60 | $ | (77.65 | ) | |||||||||||||
For the period from October 1, 2021 to December 31, 2021 | For the period from July 1, 2021 to September 30, 2021 | For the period from April 1, 2021 to June 30, 2021 | For the period from January 1, 2021 to March 31, 2021 | |||||||||||||||||||||||||||||
For the period from October 1, 2022 to December 31, 2022 | For the period from July 1, 2022 to September 30, 2022 | For the period from April 1, 2022 to June 30, 2022 | For the period from January 1, 2022 to March 31, 2022 | |||||||||||||||||||||||||||||
Total investment income | $ | 7,244 | $ | 6,284 | $ | 1,882 | $ | 6,329 | $ | 512,905 | $ | 309,752 | $ | 87,657 | $ | 11,958 | ||||||||||||||||
Total expenses | (525,406 | ) | (1,323,129 | ) | (1,461,726 | ) | (1,220,455 | ) | (285,279 | ) | (916,353 | ) | (1,548,176 | ) | (1,839,920 | ) | ||||||||||||||||
Total trading results | (2,264,109 | ) | 3,138,442 | 6,318,701 | 4,432,943 | (2,169,268 | ) | 1,003,273 | 4,510,269 | 9,066,894 | ||||||||||||||||||||||
Net income (loss) | $ | (2,782,271 | ) | $ | 1,821,597 | $ | 4,858,857 | $ | 3,218,817 | $ | (1,941,642 | ) | $ | 396,672 | $ | 3,049,750 | $ | 7,238,932 | ||||||||||||||
Increase (decrease) in Net Asset Value per Redeemable Unit: | ||||||||||||||||||||||||||||||||
Class A | $ | (33.61 | ) | $ | 21.23 | $ | 51.85 | $ | 33.07 | $ | (26.61 | ) | $ | 5.90 | $ | 38.86 | $ | 91.07 | ||||||||||||||
Class D | $ | (42.06 | ) | $ | 26.57 | $ | 64.89 | $ | 41.38 | $ | (33.30 | ) | $ | 7.38 | $ | 48.63 | $ | 113.98 | ||||||||||||||
Class Z | $ | (41.34 | ) | $ | 29.29 | $ | 68.48 | $ | 44.15 | $ | (32.29 | ) | $ | 9.92 | $ | 52.50 | $ | 119.64 | ||||||||||||||
Certain impacts to public health conditions particular to
Effective February 1, 2023, the Partnership allocated a portion of its assets to Drury Capital, Inc. (“Drury”). Drury directly trades the Partnership’s assets allocated to it through a managed account in the name of the Partnership pursuant to Drury Diversified Trend-Following Program.
55
PART III
Item 10. Directors, Executive Officers and Corporate Governance.
The Partnership has no directors or executive officers and its affairs are managed by its General Partner. Investment decisions are made by the Advisors.
The directors and executive officers of the General Partner are Patrick T. Egan (President and Chairman of the Board of Directors of the General Partner), Brooke Lambert (Chief Financial Officer), Steven Ross (Director), Victoria Eckstein (Director) and Tatiana Segal (Director). Each director holds office until the earlier of his or her death, resignation or removal. Vacancies on the board of directors may be filled by either (i) the majority vote of the remaining directors or (ii) MSD Holdings,MSCM, as the sole member of the General Partner. The officers of the General Partner are designated by the General Partner’s board of directors. Each officer will hold office until his or her successor is designated and qualified or until his or her death, resignation or removal.
Directors of the General Partner are responsible for overall corporate governance of the General Partner and meet periodically to consider strategic decisions regarding the General Partner’s activities. Under CFTC rules, each Director of the General Partner is deemed to be a principal of the General Partner and, as a result, is listed as such with the NFA. Patrick T. Egan and Steven Ross serveserves on the General Partner’s Investment Committee and are the trading principals responsible for allocation decisions (or responsible for supervising those who are).
Patrick T. Egan, age 54, has been a Director of the General Partner since December 2010. Since December 2010, Mr. Egan has been a principal and registered as an associated person of the General Partner, and is an associate member of NFA. Since October 2014, Mr. Egan has served as President and Chairman of the Board of Directors of the General Partner. Since August 2013, Mr. Egan has been registered as a swap associated person of the General Partner. From September 2013 to May 2014, Mr. Egan served as a Vice President of Morgan Stanley Strategies LLC, (formerly, Morgan Stanley GWM Feeder Strategies LLC), which acts as a general partner to multiple alternative investment entities, and Morgan Stanley AI GP LLC, (formerly, Morgan Stanley HedgePremier GP LLC), which acts as a general partner and administrative agent to numerous hedge fund feeder funds. From September 2013 to May 2014, Mr. Egan was registered as an associated person and listed as a principal of each such entity. Since January 2013, each such entity has been registered as a commodity pool operator with the CFTC. Mr. Egan was responsible for overseeing the implementation of certain CFTC and NFA regulatory requirements applicable to such entities. From June 2009 to December 2014, Mr. Egan was employed by Morgan Stanley Smith Barney LLC, a financial services firm, where his responsibilities included serving as Executive Director and as Co-Chief Investment Officer for Morgan Stanley Managed Futures from June 2009 through June 2011 and as Chief Risk Officer for Morgan Stanley Managed Futures from June 2011 through October 2014. Since October 2014, Mr. Egan has been responsible for management of the day-to-day operations of Morgan Stanley Managed Futures. Since January 2015, Mr. Egan has been employed by the General Partner. From November 2010 to October 2014, Mr. Egan was registered as an associated person of Morgan Stanley Smith Barney LLC. From April 2007 through June 2009, Mr. Egan was employed by MS & Co., a financial services firm, where his responsibilities included serving as Head of Due Diligence and Manager Research for Morgan Stanley’s Managed Futures Department. From April 2007 through June 2009, Mr. Egan was registered as an associated person of MS & Co. From March 1993 through April 2007, Mr. Egan was employed by Morgan Stanley DW Inc., a financial services firm, where his initial responsibilities included serving as an analyst and manager within the Managed Futures Department (with primary responsibilities for product development, due diligence, investment analysis and risk management of the firm’s commodity pools) and later included serving as Head of Due Diligence and Manager Research for Morgan Stanley’s Managed Futures Department. From February 1998 through April 2007, Mr. Egan was registered as an associated person of Morgan Stanley DW Inc. From August 1991 through March 1993, Mr. Egan was employed by Dean Witter Intercapital, the asset management arm of Dean Witter Reynolds, Inc., where his responsibilities included serving as a mutual fund administration associate. Mr. Egan also served as a Director from November 2004 through October 2006, and from November 2006 through October 2008 of the Managed Funds Association’s Board of Directors, a position he was elected to by industry peers for two consecutive two-year terms. Mr. Egan earned his Bachelor of Business Administration degree with a concentration in Finance in May 1991 from the University of Notre Dame.
Brooke Lambert, age 39,40, has been the Chief Financial Officer, Treasurer and a principal of the General Partner since May 2022. Ms. Lambert has been employed by Morgan Stanley Investment Management, a financial services firm, since July 2014, where her responsibilities include serving as a Vice President and managing the accounting, financial reporting and regulatory reporting of the commodity pools operated by the General Partner. From July 2009 to July 2014, Ms. Lambert was employed by Morgan Stanley Smith Barney, a financial services firm, where her responsibilities included serving as a Vice President responsible for the accounting, financial reporting and regulatory reporting of the commodity pools operated by the General Partner. Before joining Morgan Stanley, Ms. Lambert was employed by Citigroup Alternative Investments, a financial services firm, from January 2006 through July 2009, where her responsibilities included serving as an Assistant Vice President responsible for the accounting, financial reporting and regulatory reporting of Citigroup Alternative Investments’ managed futures funds. Ms. Lambert earned her Bachelor of Science in Finance in May 2005 from Towson University.
Steven Ross, age 51, has been a principal of the General Partner since July 2014 and a Director of the General Partner since February 2016. Mr. Ross has been employed by Morgan Stanley Investment Management, a financial services firm, since September 2005, where his responsibilities include serving as an Assistant Treasurer of Morgan Stanley with respect to certain investment vehicles publicly offered by Morgan Stanley. Mr. Ross is also an Executive Director of the Morgan Stanley Fund Administration Group where he is responsible for finance and accounting matters for certain private funds offered by Morgan Stanley. Before joining Morgan Stanley Investment Management, Mr. Ross was employed by JPMorgan Investor Services Co., a financial services firm, from December 1997 through September 2005, where his responsibilities included serving as a Vice President responsible for the accounting of certain funds sponsored by JP Morgan Chase & Co. and other large fund families serviced by JPMorgan Investor Services Co. From April 1997 to December 1997, Mr. Ross was employed by Investors Bank & Trust, a financial services firm, where his responsibilities included performing mutual fund accounting for financial services firms. Mr. Ross began his career at Putnam Investments LLC, a financial services firm, where he was responsible for providing broker services for certain funds sponsored by Putnam Investments LLC from August 1996 to April 1997. Mr. Ross received a B.S. in Accounting from Rhode Island College in May 1995.
Victoria Eckstein, age 41,42, has been a Director of the General Partner since June 30, 2022, and a principal of the General Partner since July 14, 2022. Since November 2022, Ms. Eckstein has served as Chief Operating Officer of Calvert Research and Management, an investment management company focused on responsible investments. Since December 2020, Ms. Eckstein has served as a Managing Director of Morgan Stanley Investment Management Inc. (“MSIM”), and from December 2020 to November 2022 served as Chief Operating Officer of the Solutions & Multi-Asset Group at MSIM, a collection of business units offering alpha-centric, multi-asset or multi-manager investment solutions. From December 2016 to December 2020, Ms. Eckstein served as an Executive Director of MSIM and from April 2010 to December 2016, Ms. Eckstein served as a Vice President of MSIM. From April 2010 to December 2020, Ms. Eckstein primarily managed the day-to-daynon-investment functions of the Portfolio Solutions Group, a business unit offering multi-asset, multi-manager managed portfolios. From January 2007 to April 2010, Ms. Eckstein was employed by Morgan Stanley Smith Barney LLC, a financial services firm, where her responsibilities included trade execution, portfolio analysis, external manager selection and research coverage. Ms. Eckstein received her Juris Doctorate from the Benjamin N. Cardozo School of Law in 2006 and her Bachelor of Arts, magna cum laude, from Brandeis University in 2003.
Tatiana Segal, age 54,55, has been a Director of the General Partner since June 30, 2022, and a principal of the General Partner since July 1, 2022. She has also been a principal of MSIM since October 31, 2019. Ms. Segal joined MSIM as a Managing Director and Head of Risk Management in August 2019. She is responsible for risk management across MSIM business units and risk categories, including investment, operational, and franchise risk, and is a member of
56
the Investment Management Operating Committee and a chair of the Investment Management Risk Committee. In June 2022, in addition to her original role, Tatiana was appointed as Global Head of Non-Financial Risk for Investment Management to manage existing and emergent non-financial risks across the division. She has since been appointed a member of Morgan Stanley’s NFR Steering Committee and Enterprise Controls Committee. From August 2011 to August 2019, Tatiana was a partner and Head of Risk Management at SkyBridge Capital Management, a global alternative investments firm, where she was also a member of the Manager Selection, Portfolio Allocation and Real Estate Investment Committees. Prior to joining SkyBridge in August 2011, she was a Managing Director and Chief Risk Officer at Cerberus Capital Management, LLC from January 2009 through July 2011. Before joining Cerberus, Ms. Segal was Managing Director and Chief Risk Officer for Diamond Lake Investment Group from February 2008 through September 2008. From May 2006 through January 2008, Ms. Segal was a Senior Risk Manager at Citigroup Alternative Investments, where she was responsible for independent risk oversight of a multi-billion hedge fund and fund of funds portfolio. From October 2000 through April 2006, Ms. Segal was a Director of Market Risk at Nomura Securities,
53
Inc. Prior to joining Nomura Securities, she was Risk Manager at BNP Paribas from January 1999 through October 2000 and a Risk Manager at Goldman, Sachs & Co., Ltd. from October 1995 through January 1999. Ms. Segal started her career at BlackRock Financial Management, Inc. from January 1993 through September 1995, as a portfolio analyst within BlackRock’s Institutional Accounts Division. Ms. Segal graduated from Columbia University in January 1993 with a Bachelor’s Degree in Economics. Ms. Segal is a Co-Chair of Risk Peer Advisory Group NY for 100 Women in Finance, as well as a contributing member of the council of The Directors and Chief Risk Officers. She serves as a board member of the Tenement Museum.
The Partnership has not adopted a code of ethics that applies to officers because it has no officers. In addition, the Partnership has not adopted any procedures by which investors may recommend nominees to the Partnership’s board of directors and has not established an audit committee because it has no board of directors.
Item 11. Executive Compensation.
The Partnership has no directors or executive officers. As a limited partnership, the business of the Partnership is managed by the General Partner, which is responsible for the administration of the business affairs of the Partnership. Effective July 1, 2020,The Partnership pays the General Partner fees paid by the Partnership to the General Partner was reduced for all limited partners from a monthly rate of 1/12 of 1.00% of the adjusted month-end net assetsfee equal to a monthly rate of 1/12 of 0.875% of the adjusted month-end net assets.
Item 12. Security Ownership of Certain Beneficial Owners and Management and Related Stockholder Matters.
(a) Security ownership of certain beneficial owners. As of February 28, 2023,29, 2024, the Partnership knows of no person who beneficially owns more than 5% of the Redeemable Units outstanding.
(b) Security ownership of management. Under the terms of the Limited Partnership Agreement, the Partnership’s affairs are managed by the General Partner.
The following table indicates securities owned by management as of December 31, 2022:2023:
(1) Title of Class | (2) Name of Beneficial Owner | (3) Amount and Nature of Beneficial Ownership | (4) Percent of Class | (2) Name of Beneficial Owner | (3) Amount and Nature of Beneficial Ownership | (4) Percent of Class | ||||||
Class Z Redeemable Units | General Partner | 597.9290 | 86.24% | |||||||||
Class Z Redeemable Units | General Partner | 550.3190 | 85.23% | |||||||||
Principals of the General Partner who own Redeemable Units:* | |||||||||
* Patrick T. Egan | 8.3490 | Redeemable Units | |||||||
* No one principal owns more than 1% of the Redeemable Units. | |||||||||
(c) Changes in control. None.
Item 13. Certain Relationships and Related Transactions and Director Independence.
(a) Transactions with related persons. None.
(b) Review, approval or ratification of transactions with related persons.Not applicable.
(c) Promoters and certain control persons. MS&Co., Morgan Stanley Wealth Management and the General Partner could be considered promoters for purposes of Item 404(c) of Regulation S-K. The nature and the amounts of compensation each promoter received or will receive, if any, from the Partnership are set forth under “Item 1. Business,” “Item 8. Financial Statements and Supplementary Data.” and “Item 11. Executive Compensation.”
Item 14. Principal Accountant Fees and Services.
(1) Audit Fees. The aggregate fees billed for each of the last two fiscal years ended December 31, 20222023 and 20212022 for professional services rendered by Ernst & Young LLP (“EY”) for the audit of the Partnership’s annual financial statements, review of financial statements included in the Partnership’s Forms 10-Q and 10-K and other services normally provided in connection with regulatory filings or engagements were:
2023 $94,300
| 2022 | $ | 89,000 | ||||
| 2021 | $ | 81,583 |
2022 $89,000
(2) Audit-Related Fees. None.
(3) Tax Fees. The Partnership did not pay EY any amounts in 20222023 and 20212022 for professional services in connection with tax compliance, tax advice, and tax planning.
(4) All Other Fees. None.
(5) Not Applicable.
(6) Not Applicable.
5754
PART IV
Item 15. Exhibits and Financial Statement Schedules.
(1) Financial Statements:
Statements of Financial Condition at December 31, 20222023 and 2021.2022.
Condensed Schedules of Investments at December 31, 20222023 and 2021.2022.
Statements of Income and Expenses for the years ended December 31, 2023, 2022 2021 and 2020.2021.
Statements of Changes in Partners’ Capital for the years ended December 31, 2023, 2022 2021 and 2020.2021.
Notes to Financial Statements.
(2) Exhibits:
| 3.1 | ||||||
| (a) | ||||||
| (b) | ||||||
| (c) | ||||||
| (d) | ||||||
| (e) | ||||||
| (f) | ||||||
| (g) | ||||||
| (h) | ||||||
| 3.2 | ||||||
| (a) | ||||||
| (b) | ||||||
| (c) | ||||||
| 3.3 | ||||||
| 4.1 | ||||||
| 10.1 | ||||||
| (a) | ||||||
| (b) | ||||||
5855
| 10.2 | ||||||
| (a) | ||||||
| 10.3 | ||||||
| 10.4 | ||||||
| 10.5 | ||||||
| (a) | ||||||
| 10.6 | ||||||
| (a) | ||||||
| 10.7 | ||||||
| 10.8 | ||||||
| (a) | ||||||
| 10.9 | ||||||
| (a) | ||||||
| (b) | ||||||
| 10.10 | ||||||
| 10.11 | ||||||
| (a) | ||||||
| 10.12 | ||||||
| 10.13 | ||||||
| (a) | ||||||
| (b) | ||||||
59
| 10.14 | |||||||
| (a) | |||||||
| (b) | |||||||
56
| (c) | ||||
| (d) | ||||
| 10.15 | ||||
| 10.16 | ||||
| 10.17 | ||||
| 10.18 | ||||
| (a) | ||||
| (b) | ||||
| 10.19 | ||||
| 10.20 | ||||
| 10.21 | ||||
| 10.22 | ||||
| 10.23 | ||||
| 10.24 | ||||
| (a) | ||||
| 10.25 | ||||
| (a) | ||||
| 10.26 | ||||
| 10.27 | ||||
| 10.28 | ||||
60
| 10.29 | |||||||
| 10.30 | |||||||
57
| 10.31 | ||||
| 10.32 | ||||
| 10.33 | ||||
| 10.34 | ||||
| 10.35 | ||||
| 10.36 | ||||
| 10.37 | ||||
| 10.38 | ||||
| 10.39 | ||||
| (a) | ||||
| 10.40 | ||||
| 10.41 | ||||
| 10.42 | ||||
| 10.43 | ||||
| 10.44 | ||||
The exhibits required to be filed by Item 601 of regulation S-K are incorporated herein by reference:
31.1 — Rule 13a-14(a)/15d-14(a) Certification (Certification of President and Director) (filed herewith).
31.2 — Rule 13a-14(a)/15d-14(a) Certification (Certification of Chief Financial Officer) (filed herewith).
32.1 — Section 1350 Certification (Certification of President and Director) (filed herewith).
32.2 — Section 1350 Certification (Certification of Chief Financial Officer) (filed herewith).
101.INS | XBRL Instance Document. | |
| 101.SCH | XBRL Taxonomy Extension Schema Document. | |
| 101.CAL | XBRL Taxonomy Extension Calculation Linkbase Document. | |
| 101.LAB | XBRL Taxonomy Extension Label Linkbase Document. | |
| 101.PRE | XBRL Taxonomy Extension Presentation Linkbase Document. | |
| 101.DEF | XBRL Taxonomy Extension Definition Linkbase Document. | |
104. Cover Page Interactive Data File (formatted as Inline XBRL and contained in Exhibit 101).
6158
SIGNATURES
Pursuant to the requirements of Section 13 or 15(d) of the Securities Exchange Act of 1934, the registrant has duly caused this report to be signed on its behalf by the undersigned, thereunto duly authorized.
CERES TACTICAL SYSTEMATIC L.P.
By: | Ceres Managed Futures LLC (General Partner) | |
By: | /s/ Patrick T. Egan | |
Patrick T. Egan | ||
President and Director | ||
Date: March | ||
Pursuant to the requirements of the Securities Exchange Act of 1934, this report has been signed below by the following persons on behalf of the Registrant and in the capacities and on the date indicated.
/s/ Patrick T. Egan | /s/ | |||
Patrick T. Egan |
| |||
President and Director | Director | |||
Ceres Managed Futures LLC | Ceres Managed Futures LLC | |||
Date: March | Date: March | |||
/s/ Brooke Lambert | /s/ Victoria Eckstein | |||
| Brooke Lambert | Victoria Eckstein | |||
| Chief Financial Officer | Director | |||
| (Principal Accounting Officer) | Ceres Managed Futures LLC | |||
| Ceres Managed Futures LLC | Date: March | |||
| Date: March | ||||
Supplemental Information to be Furnished With Reports Filed Pursuant To Section 15(d) of the Act by Registrants Which Have Not Registered Securities Pursuant to Section 12 of the Act.
Annual Report to Limited Partners.
No proxy material has been sent to limited partners.
6259