| x | ANNUAL REPORT PURSUANT TO SECTION 13 OR 15(d) OF THE SECURITIES EXCHANGE ACT OF 1934 | |||||||
2023
| ¨ | TRANSITION REPORT PURSUANT TO SECTION 13 OR 15(d) OF THE SECURITIES EXCHANGE ACT OF 1934 | |||||||
| Indiana | 82-3784946 | |||||||
| (State or other jurisdiction of incorporation) | (I.R.S. Employer Identification No.) | |||||||
| 19100 Ridgewood Parkway, | Suite 1200 | ||||||||
San Antonio, | Texas |
| |||||||
| (Address of principal executive offices) | (Zip Code) | ||||||||
| Title of each class | Trading Symbols | Name of each exchange on which registered | ||||||
Class A Common Stock, no par value | BH.A | New York Stock Exchange | ||||||
| Class B Common Stock, no par value | BH | New York Stock Exchange
| ||||||
Indicate by check mark if disclosure of delinquent filers pursuant to Item 405 of Regulation S-K is not contained herein, and will not be contained, to the best of registrant’s knowledge, in definitive proxy or information statements incorporated by reference in Part III of this Form 10-K or any amendment to this Form 10-K.x
| Large accelerated filer | ¨ | Accelerated filer | x | Non-accelerated filer | ¨ | Smaller reporting company | x | Emerging growth company | ¨ | ||||||||||||||||||||
$201,503,586.
| Class A common stock – | 206,864 | ||||
| Class B common stock – | 2,068,640 | ||||
| Page No. | |||||||||||
| Item 1B. | |||||||||||
Issuance of Dual Class Common Stock
On March 5, 2018, the Company entered into an agreement with its predecessor registrant, now known as OBH Inc. (the “Predecessor”), and BH Merger Company, a wholly owned subsidiary of the Company. Pursuant to the agreement on April 30, 2018, BH Merger Company merged with and into the Predecessor, with the Predecessor continuing as the surviving corporation and a wholly owned subsidiary of the Company.
As a result of the April 30, 2018 transaction, the Company has two classes of common stock, designated Class A common stock and Class B common stock. A share of Class B common stock has economic rights equivalent to 1/5th of a share of Class A common stock; however, Class B common stock has no voting rights. Upon completion of the transaction, every ten (10) shares of common stock outstanding on April 30, 2018 converted into (i) ten (10) shares of Class B common stock and (ii) one (1) share of Class A common stock.
Since May 1, 2018, theBiglari beneficially owns shares of the Company’s Class A common stock have traded on the New York Stock Exchange (“NYSE”) under the ticker symbol “BH.A” and the sharesCompany that represent approximately 66.8% of the Company’s Class B common stock have traded oneconomic interest and approximately 71.0% of the NYSE under the ticker symbol “BH”.
voting interest.
Steak n Shake is engaged in the ownership, operation, and franchising of Steak n Shake restaurants.
Western Sizzlin is engaged primarily in the franchising of restaurants.
Operations
1
Franchising
In addition to the traditional franchise arrangements described above, Steak n Shake initiated a new franchise partner program during 2018 to transition company-operated restaurants to such franchisees. The franchise agreement stipulates that the franchisee make an upfront investment totaling $10,000. Steak n Shake, as the franchisor, assesses a fee of up to 15% of sales as well as 50% of profits. Potential franchisees are screened based on entrepreneurial attitude and ability, but they become franchise partners based on achievement. Each must meet the gold standard in service. Franchise partners are required to be hands-on operators. We limit a franchisee to a single location.
Regulations
Licenses
Our
First Guard competes for truck insurance with other companies. The commercial truck insurance business is highly competitive in the areas of price and service. Vigorous competition is provided by large, well-capitalized companies and by small regional insurers. First Guard’s insurance products are marketed primarily through direct response methods via the Internet or by telephone. First Guard’s cost-efficient direct response marketing methods enable it to be a low-cost truck insurer. First Guard uses its own claim staff to manage claims. Seasonal variations in First Guard’s insurance business are not significant. However, extraordinary weather conditions or other factors may have a significant effect upon the frequency or severity of claims.
The insurance business is stringently regulated by state insurance departments. First Guard is headquartered in Venice, Florida.
2
Media
Employees
The Company employs 18,684 persons.
humanity. We seek to associate with people of high character and competence.
3
We are a “controlled company” within the meaning of the New York Stock Exchange rules and thus can rely on exemptions from certain corporate governance requirements.
Our historical growth rate is The Company does not indicative of our future growth.
When evaluating our historical growthhave a governance and prospects for future growth, it is important to consider that while our business philosophy has remained constant our mix of business has changed and will continue to change. Our business model makes it difficult to assess our prospects for future growth.
nominating committee.
requirements.
Competition.
Each of ourlower earnings.
Unfavorable domestic and international
Toearnings.
Our operating businesses face a varietyand investments.
There is no assurance thatdemand for our international operations will remain profitable. Our international operations are subject to all of the risks associated with our domestic operations, as well as a number of additional risks, varying substantially country by country. These include,inter alia, international economicproducts and political conditions, corruption, terrorism, social and ethnic unrest, foreign currency fluctuations, differing cultures and consumer preferences. Our expansion into international markets could also create risks to our brands.
In addition, we may become subject to foreign governmental regulations that impact the way we do business with our international franchisees and vendors. These include antitrust and tax requirements, anti-boycott regulations, international trade regulations, the USA Patriot Act, the Foreign Corrupt Practices Act, and applicable local law. Failure to comply with any such legal requirements could subject us to monetary liabilitiesservices, credit losses when customers and other sanctions, which could harm our businesscounterparties fail to satisfy their obligations to us, and our financial condition.
4
We may not be able to adequately protect our intellectual property, which could decrease the value of our brand and products.
The success of our business depends on the continued ability to use the existing trademarks, service marks, and other components of our brand to increase brand awareness and further develop branded products. While we take steps to protect our intellectual property, our rights to our trademarks could be challenged by third parties or our use of these trademarks may result in a liability for trademark infringement, trademark dilution, or unfair competition, adversely affecting our profitability. We may also become subject to these risks in the international markets in which we operate and in which we plan to expand. Any impairment of our intellectual property or brands, including due to changes in U.S. or foreign intellectual property laws or the absence of effective legal protections or enforcement measures, could adversely impact our business, financial condition and results of operations.
Certain agreements with our Chairman and CEO may have an adverse effect on our financial position.
We have entered into a license agreement with Sardar Biglari, Chairman and Chief Executive Officer, under which Mr. Biglari has granted the Company an exclusive license to use his name when connected to the provision of certain products and services, as well as a sublicense agreement with Steak n Shake that,inter alia, grants Steak n Shake the right to use the trademark “Steak n Shake by Biglari.” In the event of a change of control of the Company or Mr. Biglari’s termination without cause or resignation following specified occurrences, including (1) his removal as Chairman of the Board or Chief Executive Officer or (2) his not maintaining sole capital allocation authority, Mr. Biglari would be entitled to receive revenue-based royalty payments related to the usage of his name under the terms of the license agreement for a defined period of no less than five years. In addition, we have an incentive agreement with Mr. Biglari, in which he is entitled to receive performance-based annual incentive payments contingent on the growth of the Company’s adjusted book value in each fiscal year.
5
Changes in economic conditions may have an adverse impact on our restaurant operations.
Our cash flows and financial position could be negatively impacted if we are unable to comply with the restrictions and covenants in Steak n Shake’s debt agreements.
Covenants in Steak n Shake’s credit facility include restrictions on, among other things, its ability to incur additional indebtedness and to make distributions to the Company. Steak n Shake’s ability to make payments on its credit facility and to fund operations depends on its ability to generate cash, which is subject to general economic, financial, competitive, regulatory and other factors that are beyond our control. Steak n Shake may not generate sufficient cash flow from operations to service this debt or to fund its other liquidity needs. Steak n Shake’s failure to service its debt could constitute an event of default that, if not cured or waived, could result, among other things, in the acceleration of their indebtedness, which could negatively impact our operations. However, neither the Company nor any of our affiliates provide any guarantees of Steak n Shake’s debts.
We cannot predict whether we will continue to be able to anticipate and react to changing food costs by adjusting our purchasing practices, menu offerings, and menu prices, and a failure to do so could adversely affect our operating results.
6
In recent years, there has been an increased legislative, regulatory, and consumer focus on nutrition and advertising practices in the food industry. As a result, restaurantRestaurant operations may becomeare also subject to regulatory initiatives in the area of nutrition disclosure or advertising, such as requirements to provide information about the nutritional content of our food products, which could increase expenses.products. The operation of the Steak n Shake and Western Sizzlin franchise systemsystems is also subject to franchise laws and regulations enacted by a number of states, and to rules promulgated by the U.S. Federal Trade Commission. Any future legislation regulating franchise relationships may negatively affect our operations, particularly our relationshiprelationships with franchisees. Failure to comply with new or existing franchise laws and regulations in any jurisdiction, or to obtain required government approvals, could result in a ban or temporary suspension on future franchise sales. Further national, state, and local government initiatives, such as mandatory health insurance coverage or proposed increases in minimum wage rates, could adversely affect our business.
Our
Our
7
Risks Relating to Our Insurance Business
Our media business faces significant competition from other magazine publishers and new forms of media, including digital media, and as a result our media business may not be able to improve its operating results.
Our media business competes principally with other magazine publishers. The proliferation of choices available to consumers for information and entertainment has resulted in audience fragmentation and has negatively impacted overall consumer demand for print magazines and intensified competition with other magazine publishers for share of print magazine readership. Our media business also competes with digital publishers and other forms of media. This competition has intensified as a result of the growing popularity of mobile devices and the shift in preference of some consumers from print media to digital media for the delivery and consumption of content.
Competition among print magazine and digital publishers for advertising is primarily based on the circulation and readership of magazines and the number of visitors to websites, respectively, and the demographics of customers, advertising rates, plus the effectiveness of advertising sales teams. The proliferation of new platforms available to advertisers, combined with continuing competition from print platforms, has impacted both the amount of advertising our media business is able to sell and the rates it can command.
8
Our pursuit of licensingLicensing opportunities for the Maxim brand may provebe difficult to be unsuccessful.
maintain.
Because magazines are generally discretionary purchasesthe effects of volatile commodity prices.
Item 1B. Unresolved Staff Comments |
None.
9
None.
2018,2023, restaurant operations included 685492 company-operated and franchise locations. Restaurant operations own the land and building for 153 restaurants.142 restaurants; they also own one other property. The following table lists the locations of the restaurants as of December 31, 2018. Steak n Shake Western Sizzlin Company Operated Franchise Company Operated Franchise Total Domestic: Alabama 2 7 - 6 15 Arizona 1 1 - - 2 Arkansas - 7 - 16 23 California 1 6 - 1 8 Colorado 2 2 - - 4 Delaware - 1 - - 1 Florida 80 4 - - 84 Georgia 22 17 - 5 44 Illinois 61 10 - - 71 Indiana 68 5 - - 73 Iowa 3 - - - 3 Kansas - 4 - - 4 Kentucky 14 10 - - 24 Louisiana - 1 - - 1 Maryland - 1 - 1 2 Michigan 19 - - - 19 Mississippi - 4 - 1 5 Missouri 37 24 - - 61 Nevada - 6 - - 6 North Carolina 6 11 - 6 23 Ohio 63 3 - 1 67 Oklahoma - 3 - 7 10 Pennsylvania 7 6 - - 13 South Carolina 1 5 - 3 9 Tennessee 9 17 - 4 30 Texas 14 18 - 1 33 Virginia - 8 3 3 14 Washington - 1 - - 1 West Virginia - 2 1 - 3 International: France 2 20 - - 22 Italy - 2 - - 2 Portugal - 4 - - 4 Qatar - 1 - - 1 Saudi Arabia - 1 - - 1 Spain 1 1 - - 2 Total 413 213 4 55 685 Steak n Shake Western Sizzlin Company
OperatedFranchise
PartnerTraditional
FranchiseCompany
OperatedFranchise Total Domestic: Alabama 1 1 4 — 5 11 Arkansas — — 4 — 6 10 California — — 2 — — 2 Colorado 1 — — — — 1 Florida 16 60 5 — — 81 Georgia 7 11 10 — 4 32 Illinois 37 17 8 — — 62 Indiana 35 20 1 — — 56 Iowa 2 1 1 — — 4 Kansas — — 2 — — 2 Kentucky — 12 6 — — 18 Louisiana — — 1 — — 1 Maryland — — — — 1 1 Michigan 7 6 1 — — 14 Mississippi — — 6 — 1 7 Missouri 6 14 20 — — 40 Nebraska — — 1 — — 1 Nevada — — 5 — — 5 North Carolina 1 5 2 — 6 14 Ohio 27 19 1 — 1 48 Oklahoma — — 2 — 2 4 Pennsylvania 1 — 1 — — 2 South Carolina 1 — 2 — 1 4 Tennessee 1 7 9 — 3 20 Texas 1 8 10 — — 19 Virginia — — 4 2 2 8 Washington, D.C. — — 1 — — 1 West Virginia — — 2 1 — 3 International: France 2 — 17 — — 19 Monaco 1 — — — — 1 Spain 1 — — — — 1 Total 148 181 128 3 32 492 Item 3.Legal Proceedings
We are involved in various legal proceedings
On January 29, 2018, a shareholder of the Company filed a purported class action complaint against the Company and the members of our Board of Directors in the Superior Court of Hamilton County, Indiana. The shareholder generally alleges claims of breach of fiduciary duty by the members of our Board of Directors and unjust enrichment to Mr. Biglari as a result of the issuance of a dual class structure.
On March 26, 2018, a shareholder of the Company filed a purported class action complaint against the Company and the members of our Board of Directors in the Superior Court of Hamilton County, Indiana. This shareholder generally alleges claims of breach of fiduciary duty by the members of our Board of Directors. This shareholder sought to enjoin the shareholder vote on April 26, 2018 to approve the issuance of the dual class structure. On April 16, 2018, the shareholders withdrew their motions to enjoin the shareholder vote on April 26, 2018.
On May 17, 2018, the shareholders who filed the January 29, 2018 complaint and the March 26, 2018 complaint filed a new, consolidated complaint against the Company and the members of our Board of Directors in the Superior Court of Hamilton County, Indiana. The shareholders generally allege claims of breach of fiduciary duty by the members of our Board of Directors and unjust enrichment to Mr. Biglari arising out of the issuance of the dual class structure. The shareholders seek, for themselves and on behalf of all other shareholders as a class, a declaration that the defendants breached their dutyContingencies - Note 15 to the shareholders and the class, and to recover unspecified damages, pre-judgment and post-judgment interest, and an awardConsolidated Financial Statements included in Item 8 for a discussion of their attorneys’ fees and other costs.
On December 14, 2018, the Judge of the Superior Court of Hamilton County, Indiana issued an order granting the Company’s motion to dismiss the shareholders’ lawsuits. On January 11, 2019, the shareholders filed an appeal of the Judge’s order dismissing the lawsuits.
The Company believes the claims in each case are without merit and intends to defend these cases vigorously.
1, 2024.
11
Total Number of Class A Shares Purchased Average Price Paid per Class A Share Total Number of Class B Shares Purchased Average Price Paid per Class B Share Total Number of Shares Purchased as Part of Publicly Announced Plans or Programs Maximum Number of Shares That May Yet Be Purchased Under Plans or Programs October 1, 2023 - October 31, 2023 — $ — — $ — — — November 1, 2023 - November 30, 2023 — $ — — $ — — — December 1, 2023 - December 31, 2023 1,100 $ 828.69 9,813 $ 164.99 — — Total 1,100 9,813 —
Performance Graph
The graph below matches Biglari Holdings Inc.'s cumulative 5-year total shareholder return on its Class A common stock and Class B common stock with the cumulative total returns of the S&P 500 Index and the S&P Restaurants Index. The graph tracks the performance of a $100 investment in our common stock and in each index (with the reinvestment of all dividends) from December 31, 2013 to December 31, 2018.
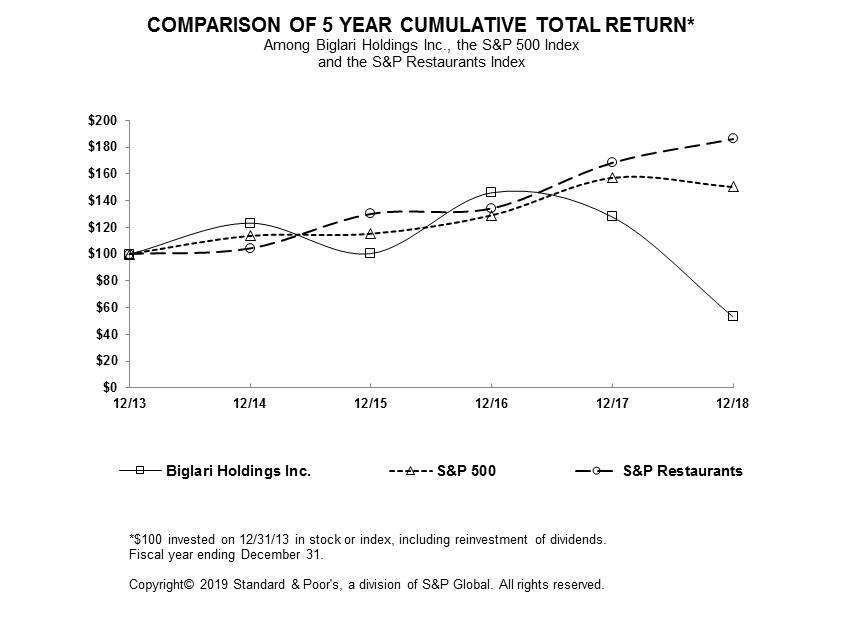
The preceding stock price performance graph and related information shall not be deemed “soliciting material” or to be “filed” with the SEC, nor shall such information be incorporated by reference into any future filings under the Securities Exchange Act of 1934, as amended, or the Securities Act of 1933, as amended, except to the extent that we specifically incorporate it by reference into such filings.
Securities Authorized for Issuance Under Equity Compensation Plans
Biglari Holdings does not have any equity compensation plans.
12
(dollars in thousands except per share data)
| 2018 | 2017 | 2016 | 2015 | |||||||||||||
| Revenue: | ||||||||||||||||
| Total revenues | $ | 809,894 | $ | 839,804 | $ | 850,076 | $ | 861,452 | ||||||||
| Earnings: | ||||||||||||||||
| Net earnings (loss) | $ | 19,392 | $ | 50,071 | $ | 99,451 | $ | (15,843 | ) | |||||||
| Net earnings (loss) per equivalent Class A share | $ | 55.71 | $ | 136.01 | $ | 271.22 | $ | (33.94 | ) | |||||||
| Year-end data: | ||||||||||||||||
| Total assets | $ | 1,029,493 | $ | 1,063,584 | $ | 1,096,967 | $ | 987,079 | ||||||||
| Long-term notes payable and other borrowings | 240,001 | 256,994 | 281,555 | 296,062 | ||||||||||||
| Biglari Holdings Inc. shareholders’ equity | $ | 570,455 | $ | 571,328 | $ | 531,940 | $ | 451,372 | ||||||||
| Transition Period | 52 Weeks Ended | |||||||
| Fiscal | ||||||||
| 2014 | 2014 | |||||||
| Revenue: | ||||||||
| Total revenues | $ | 224,450 | $ | 793,811 | ||||
| Earnings: | ||||||||
| Net earnings attributable to Biglari Holdings Inc. | $ | 91,050 | $ | 28,804 | ||||
| Net earnings per equivalent Class A share | $ | 161.63 | $ | 56.16 | ||||
| Year-end data: | ||||||||
| Total assets | $ | 1,298,509 | $ | 1,156,310 | ||||
| Long-term notes payable and other borrowings | 309,003 | 311,448 | ||||||
| Biglari Holdings Inc. shareholders’ equity | $ | 725,551 | $ | 638,717 | ||||
Earnings per share of common stock is based on the weighted average number of shares outstanding during the period. The issuance of dual class common stock on April 30, 2018 is applied to years 2014 through 2017 on a retrospective basis for the calculation of earnings per share. The Company has applied the “two-class method” of computing earnings per share as prescribed in ASC 260, “Earnings Per Share.”
For total assets, periods prior to 2016 were adjusted for the reclassifications of debt issuance costs and deferred taxes. For long-term notes payable and other borrowings, periods prior to 2016 were adjusted for the reclassification of debt issuance.
As of January 1, 2018, franchise royalties and fees are composed of royalties and fees from Steak n Shake and Western Sizzlin franchisees. Royalties are based upon a percentage of sales of the franchise restaurant and are recognized as earned. Franchise royalties are billed on a monthly basis. Initial franchise fees when a new restaurant opens or at the start of a new franchise term are recorded as deferred revenue when received and recognized as revenue over the term of the franchise agreement. This represents a change in methodology under the January 1, 2018 adoption of ASC 606 for we have historically recognized initial franchise fees upon the opening of a franchise restaurant. Comparative prior periods have not been adjusted.
Years 2015 through 2018 ended December 31. In 2014, the Company’s Board of Directors approved a change in the Company’s fiscal year-end moving from the last Wednesday in September to December 31 of each year. Transition period is for September 25, 2014 to December 31, 2014. Fiscal year 2014 ended on the last Wednesday nearest September 30.
13
Preferred Shares. Abraxas Petroleum operates oil and natural gas properties in the Permian Basin. The purchase price allocation included $70,200 of oil and gas properties, cash of $21,726, and liabilities, net of other assets, of $11,926. The Company’s financial results include the results of Abraxas Petroleum from the initial acquisition date to the end of the calendar year. generally discusses 2023 and 2022 items. Discussions of 2021 items can be found in “Management’s Discussion and Analysis of Financial Condition and Results of Operations” in Part II, Item 7 of our Annual Report on Form 10-K for the year ended December 31, 2022, filed with the SEC on February 27, 2023. revenue during 2022. General and administrative expenses increased gains on the sale of real estate. First Guard’s insurance products are marketed primarily through direct response methods via the Internet or by telephone. First Guard’s cost-efficient direct response marketing methods enable it to be a low-cost our periodic earnings. Investment gains and losses in 2023 and 2022 were mainly derived from our investments in equity securities and included unrealized gains and losses from market price changes during the period. We believe that investment gains/losses are generally meaningless for analytical purposes in understanding our reported quarterly or annual results. These gains and losses have caused and will continue to cause significant volatility in our periodic earnings. 2022. Other $7,271. $6,662. acquire Abraxas Petroleum. credit. 2023, follows. Income Taxes Not applicable. 24, 2024 2021. COMPREHENSIVE INCOME 2021) voting interest. December 31, our aggregate insurance operating results. However, we consider investment gains and losses, whether realized or unrealized, as non-operating. whether the wells found proved reserves. Costs of wells that are assigned proved reserves remain capitalized. Costs are also capitalized for exploratory wells that have found crude oil and natural gas reserves, even if the reserves cannot be classified as proved when the drilling is completed, provided the exploratory well has found a sufficient quantity of reserves to justify its completion as a producing well and the company is making sufficient progress assessing the reserves and the economic and operating viability of the project. All other exploratory wells and costs are expensed. We did not have any property acquisition or exploration activities during 2023, and our development costs were nominal. $443 of deferred revenue during 2024. During the 2024. Insurance premiums are earned over the terms of the related policies. Expenses incurred in connection with acquiring new insurance business, including acquisition costs, are charged to operations as incurred. Premiums earned are stated net of amounts ceded to reinsurer. Gas revenue. production taxes. Use of Estimates the new guidance on our disclosures. recorded noncontrolling interests attributable to the interest held by other shareholders. The 2022, respectively. Gains/losses from investment partnerships recorded in the Company’s consolidated statements of earnings are presented below. 2023, 2022, or 2021. The depletion expense related to oil and gas properties was $9,533, $7,024, and $7,600 during 2023, 2022, and 2021, respectively. The accretion expense of the Company’s asset retirement obligations was $695, $540, and $438 during 2023, 2022, and 2021, respectively. Depletion and accretion expense are included in depreciation, depletion, and amortization expense within the consolidated statement of earnings. Accumulated depreciation, depletion, and accretion on oil and gas properties was $44,716 and $35,072 as of December 31, 2023 and 2022, respectively. No goodwill was recorded with the acquisition of Southern Oil or Abraxas Petroleum. 10. Unpaid Loss and Loss Adjustment Expense 2023. Our deferred tax assets and liabilities consist of the following. $3,881 as of December 31, 2022. Corp. stock and the related incentive reallocations are eliminated in our financial statements. sheets: hierarchy. 2023. 2023.per shareper-share data)media, property and casualty insurance, licensing and restaurants.media, restaurants, and oil and gas. The Company’s largest operating subsidiaries are involved in the franchising and operating of restaurants. Biglari Holdings is founded and led by Sardar Biglari, Chairman and Chief Executive Officer of the Company.Holdings and its major operating subsidiaries. The Company’s long-term objective is to maximize per-share intrinsic value.Holdings’ management system combines decentralized operations with centralized financial decision-making. Operating decisions for the various business units are made by their respective managers. All major operating, investment and capital allocation decisions are made for the Company and its subsidiaries by Mr. Biglari.2018,2023, Mr. Biglari’s beneficial ownership was approximately 56.9% of the Company’s outstanding Class A common stock and 54.3% of the Company’s outstanding Class B common stock.Issuance of Dual Class Common StockOn March 5, 2018, the Company entered into an agreement with its predecessor registrant, now known as OBH Inc. (the “Predecessor”), and BH Merger Company, a wholly owned subsidiary of the Company. Pursuant to the agreement on April 30, 2018, BH Merger Company merged with and into the Predecessor, with the Predecessor continuing as the surviving corporation and a wholly owned subsidiary of the Company.As a result of the April 30, 2018 transaction, the Company has two classes of common stock, designated Class A common stock and Class B common stock. A share of Class B common stock has economic rights equivalent to 1/5th of a share of Class A common stock; however, Class B common stock has no voting rights. Upon completion of the transaction, every ten (10) shares of common stock outstanding on April 30, 2018 converted into (i) ten (10) shares of Class B common stock and (ii) one (1) share of Class A common stock.Since May 1, 2018, theBiglari beneficially owns shares of the Company’s Class ACompany that represent approximately 66.8% of the economic interest and approximately 71.0% of the voting interest.have traded onof Abraxas Petroleum. On June 14, 2023, the New York Stock Exchange (“NYSE”) under the ticker symbol “BH.A” and the sharesremaining 10% of the Company’s Class Boutstanding common stock have traded onof Abraxas Petroleum was acquired for $5,387. The Company used working capital including its line of credit to fund the NYSE underpurchase of the ticker symbol “BH”. Amounts are recorded after deducting income taxes. 2018 2017 2016 Operating businesses: Restaurant $ (2,613 ) $ 9,725 $ 24,834 Insurance 4,915 3,097 3,313 Media 796 435 (6,385 ) Other 472 506 (157 ) Total operating businesses 3,570 13,763 21,605 Corporate (8,661 ) 32,072 (6,387 ) Investment partnership gains 33,240 11,080 91,332 Interest expense on notes payable (8,757 ) (6,844 ) (7,099 ) $ 19,392 $ 50,071 $ 99,451 2023 2022 2021 Operating businesses: Restaurant $ 21,831 $ 9,383 $ 11,235 Insurance 10,262 7,662 11,290 Oil and gas 25,406 19,091 7,528 Brand licensing 8 1,313 2,364 Interest expense (531) (305) (841) Corporate and other (17,814) (9,806) (9,829) Total operating businesses 39,162 27,338 21,747 Investment partnership gains (losses) 14,646 (56,961) 8,899 Investment gains (losses) 1,731 (2,682) 4,832 Net earnings (loss) 55,539 (32,305) 35,478 Earnings (loss) attributable to noncontrolling interest 591 (287) — Net earnings (loss) attributable to Biglari Holdings Inc. shareholders $ 54,948 $ (32,018) $ 35,478 14 Management’s(continued)685492 company-operated and franchise restaurants as of December 31, 2018.
Steak n Shake Western Sizzlin Company- operated Franchise Company-operated Franchise Total Total stores as of December 31, 2015 417 144 4 66 631 Net restaurants opened (closed) — 29 (1 ) (2 ) 26 Total stores as of December 31, 2016 417 173 3 64 657 Net restaurants opened (closed) (2 ) 27 1 (6 ) 20 Total stores as of December 31, 2017 415 200 4 58 677 Net restaurants opened (closed) (2 ) 13 — (3 ) 8 Total stores as of December 31, 2018 413 213 4 55 685 The term “same-store sales” refers to the sales2023.Steak n Shake Western Sizzlin Company-
operatedFranchise
PartnerTraditional
FranchiseCompany-
operatedFranchise Total Stores on December 31, 2020 276 86 194 3 39 598 Corporate stores transitioned (73) 73 — — — — Net restaurants opened (closed) (4) — (16) — (1) (21) Stores on December 31, 2021 199 159 178 3 38 577 Corporate stores transitioned (16) 16 — — — — Net restaurants opened (closed) (6) — (24) — (2) (32) Stores on December 31, 2022 177 175 154 3 36 545 Corporate stores transitioned (6) 7 (1) — — — Net restaurants opened (closed) (23) (1) (25) — (4) (53) Stores on December 31, 2023 148 181 128 3 32 492 company-operated units open at least 18 months at the beginningDecember 31, 2023, 17 of the current period and have remained open through the end148 company-operated Steak n Shake stores were closed. Steak n Shake plans to sell or lease 10 of the period. Same-store traffic measures17 locations and refranchise the numberbalance.2018, 20172023, 2022, and 20162021 are summarized below. 2018 2017 2016 Revenue Net sales $ 740,922 $ 781,856 $ 795,322 Franchise royalties and fees 30,998 20,773 18,794 Other revenue 3,770 4,524 3,798 Total revenue 775,690 807,153 817,914 Restaurant cost of sales Cost of food 223,273 30.1 % 238,143 30.5 % 221,657 27.9 % Restaurant operating costs 393,348 53.1 % 404,373 51.7 % 395,262 49.7 % Rent 19,835 2.7 % 18,514 2.4 % 18,047 2.3 % Total cost of sales 636,456 661,030 634,966 Selling, general and administrative General and administrative 57,684 7.4 % 60,527 7.5 % 59,446 7.3 % Marketing 55,063 7.1 % 49,589 6.1 % 51,324 6.3 % Other expenses 8,060 1.0 % 4,011 0.5 % 3,907 0.5 % Total selling, general and administrative 120,807 15.6 % 114,127 14.1 % 114,677 14.0 % Depreciation and amortization 18,831 2.4 % 20,623 2.6 % 21,573 2.6 % Interest on obligations under leases 8,207 9,082 9,475 Earnings before income taxes (8,611 ) 2,291 37,223 Income tax expense (benefit) (5,998 ) (7,434 ) 12,389 Net earnings (loss) $ (2,613 ) $ 9,725 $ 24,834 2023 2022 2021 Revenue Net sales $ 152,545 $ 149,184 $ 187,913 Franchise partner fees 72,552 63,853 55,641 Franchise royalties and fees 16,443 19,678 21,736 Other revenue 9,317 8,853 6,000 Total revenue 250,857 241,568 271,290 Restaurant cost of sales Cost of food 44,993 29.5 % 44,461 29.8 % 55,315 29.4 % Labor costs 47,090 30.9 % 50,524 33.9 % 58,159 30.9 % Occupancy and other 45,903 30.1 % 45,279 30.4 % 54,017 28.7 % Total cost of sales 137,986 140,264 167,491 Selling, general and administrative General and administrative 44,120 17.6 % 40,206 16.6 % 39,940 14.7 % Marketing 12,631 5.0 % 13,921 5.8 % 13,923 5.1 % Other expenses (income) (7,935) (3.2) % (2,294) (0.9) % 3,323 1.2 % Total selling, general and administrative 48,816 51,833 57,186 Impairments 3,947 1.6 % 3,520 1.5 % 4,635 1.7 % Depreciation and amortization 27,031 10.8 % 27,496 11.4 % 21,484 7.9 % Interest on finance leases and obligations 5,114 5,493 6,039 Earnings before income taxes 27,963 12,962 14,455 Income tax expense 6,132 3,579 3,220 Contribution to net earnings $ 21,831 $ 9,383 $ 11,235 restaurant operatinglabor, and occupancy and other costs and rent expense are expressed as a percentage of net sales.15 Net sales during 2018 were $740,922 representing a decrease of $40,934 when compared to 2017. decreased performance of our restaurant operations in 2018 was largely driven by Steak n Shake’s same-store sales, which decreased 5.1% whereas customer traffic decreased by 7.0%. Net sales during 2017 were $781,856 representing a decrease of $13,466 when compared to 2016. The decreased performance of our restaurant operations in 2017 was largely driven by Steak n Shake’s same-store sales. In 2017, Steak n Shake’s same-store sales decreased by 1.8% compared to 2016.In 2018, franchise royalties and fees increased $10,225 or 49.2%. During 2018, Steak n Shake opened 33 franchise units and closed 20. Western Sizzlin opened one franchise unit and closed four.generated by the traditional franchising business were $16,443 during 2023 as compared to $19,678 during 2022. The increasedecrease in franchise royalties and fees was primarily due to the adoptionclosing of new ASC 606 accounting guidance for revenue recognition. Franchise marketing contributions are now reflected in revenue with a corresponding increase in marketing expense. As a result,certain traditional franchise revenue increased by $9,417 or 45.3% during 2018. Franchise royalties and fees during 2017 increased $1,979stores. There were 160 traditional units open on December 31, 2023, as compared to 2016. In 2017 Steak n Shake opened 40 franchise190 units and closed thirteen. During the same period, six Western Sizzlin franchise units closed. open on December 31, 2022.increase in franchise fees and royalties during 2017 are primarily attributable to new Steak n Shake franchise units, which opened in 2017 and 2016.Costcost of food at company-operated units in 20182023 was $223,273$44,993, or 30.1%29.5% of net sales as compared with $238,143to $44,461, or 30.5%29.8% of net sales in 2017 and $221,657 or 27.9%2022. The cost of food expressed as a percentage of net sales in 2016. 2023 remained consistent with 2022.increase as a percentlabor costs at company-operated restaurants during 2023 were $47,090, or 30.9% of net sales during 2018 and 2017as compared to 2016 was attributable to increased commodity costs.Restaurant operating costs during 2018 were $393,348$50,524, or 53.1% of net sales, compared to $404,373 or 51.7%33.9% of net sales in 2017 and $395,262 or 49.7% of net sales2022. The 3-percentage-point decrease in 2016. Totalcosts was primarily attributable to a 2.7-percentage-point decrease in Steak n Shake’s labor costs as a percentresult of net sales during 2018 and 2017 increased compared to the respective prior years principally due to higher wages.Selling, generala gain in productivity.20182023 were $120,807$44,120, or 15.6%17.6% of total revenues.General and administrative expenses decreased by $2,843 during 2018revenue as compared to 2017, primarily because of decreased personnel costs.Marketing expense increased by $5,474 in 2018 compared to 2017 primarily due to the adoption of new accounting guidance. New ASC 606 accounting guidance requires the Company to recognize franchise fees as revenue and reflect advertising expenditures made on behalf of the franchisees as marketing expense. The new guidance increased marketing expenses by $9,689 during 2018.Other expenses increased by $4,049 during 2018 compared to 2017. The increase in other expenses was primarily due to asset impairments of $5,677.Selling, general and administrative expenses during 2017 were $114,127$40,206, or 14.1%16.6% of total revenues.by $1,081 during 20172023 as compared to 2016,2022 primarily because of higher salaries and wages. An increase in overall personnel and additional franchise partner training accounted for much of the increase in general and administrative expenses.recruiting.Marketing expense decreased by $1,735 in 2017during 2023 compared to 20162022 primarily because of a decrease in promotions.$8,207$5,114 during 2018,2023 versus $9,082$5,493 during 2017 and $9,475 during 2016.2022. The year over yearyear-over-year decrease in interest expense iswas primarily attributable to the maturity and retirement of lease obligations.2023 2022 Revenue Net sales and other $ 324,281 $ 296,045 Restaurant cost of sales Cost of food $ 91,317 28.2 % $ 81,952 27.7 % Labor costs 86,286 26.6 % 84,191 28.4 % Occupancy and other 66,135 20.4 % 59,647 20.1 % Total cost of sales $ 243,738 $ 225,790 total obligations under leases outstanding at December 31, 2018 were $64,200, compared to $80,752 at December 31, 2017 and $89,498 at December 31, 2016. 16 2023 2022 2021 Underwriting gain (loss) attributable to: First Guard $ 9,492 $ 6,578 $ 10,573 Southern Pioneer (1,038) (1,277) 1,744 Pre-tax underwriting gain 8,454 5,301 12,317 Income tax expense 1,775 1,113 2,587 Net underwriting gain $ 6,679 $ 4,188 $ 9,730 2023 2022 2021 Premiums earned $ 61,225 $ 59,949 $ 55,411 Insurance losses 35,668 37,187 27,649 Underwriting expenses 17,103 17,461 15,445 Pre-tax underwriting gain 8,454 5,301 12,317 Other income and expenses Investment income 3,074 1,380 704 Other income 1,555 3,223 1,414 Total other income 4,629 4,603 2,118 Earnings before income taxes 13,083 9,904 14,435 Income tax expense 2,821 2,242 3,145 Contribution to net earnings $ 10,262 $ 7,662 $ 11,290 Earnings of our insurance business are summarized below. 2018 2017 2016 Premiums earned $ 26,465 $ 24,242 $ 22,397 Insurance losses 15,457 14,959 12,641 Underwriting expenses 5,374 4,765 4,843 Pre-tax underwriting gain 5,634 4,518 4,913 Other income and expenses Investment income and commissions 1,163 701 600 Other expense (582 ) (449 ) (378 ) Total other income 581 252 222 Earnings before income taxes 6,215 4,770 5,135 Income tax expense 1,300 1,673 1,822 Contribution to net earnings $ 4,915 $ 3,097 $ 3,313 trucking insurer.In 2018, A summary of First Guard’s underwriting results follows.2023 2022 2021 Amount % Amount % Amount % Premiums earned $ 36,917 100.0 % $ 35,914 100.0 % $ 33,521 100.0 % Insurance losses 20,861 56.5 % 22,299 62.1 % 16,338 48.7 % Underwriting expenses 6,564 17.8 % 7,037 19.6 % 6,610 19.7 % Total losses and expenses 27,425 74.3 % 29,336 81.7 % 22,948 68.4 % Pre-tax underwriting gain $ 9,492 $ 6,578 $ 10,573 increased $2,223 or 9.2%was 56.5% during 2023 as compared to 2017. Premiums62.1% during 2022. First Guard’s underwriting results in 2023 were in line with its historical performance despite cost inflation in property and physical damage claims, which began to accelerate in 2022.2023 2022 2021 Amount % Amount % Amount % Premiums earned $ 24,308 100.0 % $ 24,035 100.0 % $ 21,890 100.0 % Insurance losses 14,807 60.9 % 14,888 61.9 % 11,311 51.7 % Underwriting expenses 10,539 43.4 % 10,424 43.4 % 8,835 40.4 % Total losses and expenses 25,346 104.3 % 25,312 105.3 % 20,146 92.1 % Pre-tax underwriting gain (loss) $ (1,038) $ (1,277) $ 1,744 2017 increased $1,845 or 8.2%2023 as compared to 2016. Pre-tax underwriting gain61.9% during 20182022. Southern Pioneer’s performance in both years was $5,634, an increase of $1,116 (24.7%) comparedprimarily attributable to 2017. Pre-tax underwriting gain during 2017 was $4,518, a decrease of $395 (8.0%) compared to 2016. We strive to generate pre-tax underwriting profits every year.Insurance premiums and other on the statement of earnings includes premiums earned, investment income and commissions, which are included in other income in the above table.17 2023 2022 2021 Interest, dividends, and other investment income: First Guard $ 1,873 $ 751 $ 133 Southern Pioneer 1,201 629 571 Pre-tax investment income 3,074 1,380 704 Income tax expense 646 289 148 Net investment income $ 2,428 $ 1,091 $ 556 2023 2022 2021 Oil and gas revenue $ 45,071 $ 57,546 $ 33,004 Oil and gas production costs 17,365 17,842 10,470 Depreciation, depletion, and accretion 10,339 8,013 8,073 Gain on sale of properties (13,563) — — General and administrative expenses 5,164 6,500 4,748 Earnings before income taxes 25,766 25,191 9,713 Income tax expense (benefit) 360 6,100 2,185 Contribution to net earnings $ 25,406 $ 19,091 $ 7,528 2023 2022 Oil and gas revenue $ 27,576 $ 11,455 Oil and gas production costs 9,605 4,487 Depreciation, depletion, and accretion 6,359 2,510 Gain on sale of properties (13,563) — General and administrative expenses 2,765 3,806 Earnings before income taxes 22,410 652 Income tax expense (benefit) (384) 154 Contribution to net earnings $ 22,794 $ 498 2023 2022 2021 Oil and gas revenue $ 17,495 $ 46,091 $ 33,004 Oil and gas production costs 7,760 13,355 10,470 Depreciation, depletion, and accretion 3,980 5,503 8,073 General and administrative expenses 2,399 2,694 4,748 Earnings before income taxes 3,356 24,539 9,713 Income tax expense 744 5,946 2,185 Contribution to net earnings $ 2,612 $ 18,593 $ 7,528 medialicensing and licensing.media. Earnings of our media operations are summarized below. 2018 2017 2016 Revenue $ 6,576 $ 7,708 $ 9,165 Media cost of sales 4,152 6,527 15,834 Selling, general and administrative expenses 1,329 1,570 3,000 Depreciation and amortization 27 50 409 Earnings (loss) before income taxes 1,068 (439 ) (10,078 ) Income tax expense (benefit) 272 (874 ) (3,693 ) Contribution to net earnings $ 796 $ 435 $ (6,385 ) 2023 2022 2021 Licensing and media revenue $ 2,118 $ 4,577 $ 3,203 Licensing and media cost 1,840 2,695 2,275 General and administrative expenses 267 122 114 Earnings before income taxes 11 1,760 814 Income tax expense 3 447 (1,550) Contribution to net earnings $ 8 $ 1,313 $ 2,364 We have taken the risk on the belief that the probability for gain in value more than justifies the risk of loss. 2018 2017 2016 Investment partnership gains $ 40,411 $ 6,965 $ 135,886 Loss on contribution of securities to investment partnership — — (306 ) Investment partnership gains 40,411 6,965 135,580 Income tax expense (benefit) 7,171 (4,115 ) 44,248 Contribution to net earnings $ 33,240 $ 11,080 $ 91,332 2023 2022 2021 Investment partnership gains (losses) $ 19,440 $ (75,953) $ 10,953 Tax expense (benefit) 4,794 (18,992) 2,054 Contribution to net earnings $ 14,646 $ (56,961) $ 8,899 gains and gains/losses from changes in the market values of underlying investments held by the investment partnerships and dividends earned by the partnerships. The volatility of the gains and losses during the various years is attributable to changes in market values of investments. Dividend income has a lower effective tax rate than income from changescapital gains. These gains and losses have caused and will continue to cause significant volatility in market values.The investments held by the investment partnerships are largely concentrated in the common stock of one investee, Cracker Barrel Old Country Store, Inc.eliminated.18 2018 2017 2016 Interest expense on notes payable and other borrowings $ (11,677 ) $ (11,040 ) $ (11,450 ) Income tax benefit (2,920 ) (4,196 ) (4,351 ) Interest expense net of tax $ (8,757 ) $ (6,844 ) $ (7,099 ) 2023 2022 2021 Interest expense on notes payable and other borrowings $ (681) $ (399) $ (1,121) Tax benefit (150) (94) (280) Interest expense net of tax $ (531) $ (305) $ (841) outstanding balance onCompany paid Steak n Shake’s outstanding credit facility in full in February 2021. On September 13, 2022, Biglari Holdings entered into a line of credit in an aggregate principal amount of up to $30,000. There was no balance on the line of credit on December 31, 20182023. The balance on the line of credit was $183,698 compared to $185,898$10,000 on December 31, 2017. The decrease in the outstanding balance was due to debt payments of $2,200 during 2018. The interest rate was 6.28% and 5.32% as of December 31, 2018 and 2017, respectively. Interest expense during 2018 increased by $637 compared to 2017, primarily due to higher interest rates during 2018. Interest expense during 2017 decreased by $410 compared to 2016, primarily due to lower debt during 2017.Consolidateda benefit of $2,637$9,308 in 20182023 versus a benefit of $62,961$10,722 in 20172022. During 2023, the Company recognized tax benefits of $5,660 associated with the tax attributes of Abraxas Petroleum’s oil and gas properties offset by an increase in tax expense of $46,812$23,786 for investment partnership gains in 2016. The income tax benefit of $2,637 was primarily from the use of employment tax credits generated by restaurant operations. The 2017 Tax Cuts2023.Jobs Act reduces the U.S. statutory corporate tax rate from 35% to 21% for our tax years beginning in 2018, which resulted in the re-measurement of the federal portion of our deferred tax assets and liabilities as of December 31, 2017. The change in the tax rate resulted in a onetime deferred tax benefit of $51,707 during 2017. The deferred income tax benefit is derived from a re-measurement in deferred tax balances to the new statutory rate applicable to unrealized gains on marketable securities held by the Company and in the investment partnerships.Corporateinof the restaurant, insurance, mediabrand licensing, and oil and gas businesses. Corporate and other companies. Corporate net losses during 2018 were $8,661 versus net earningsincreased in 2023 compared to 2022 primarily due to an incentive fee of $32,072 during 2017 and net losses of $6,387 during 2016. In 2017, an increase in shareholders’ equity was derived from a re-measurement in deferred tax liability to the new statutory rate applicable to unrealized gains on marketable securities. The majority of the Company’s deferred tax liabilities associated with unrealized gains on marketable securities are held in the corporate account. 20182023, was $570,455, a decrease$599,330, an increase of $873$52,364 as compared to the December 31, 20172022 balance. Shareholders’The increase in shareholders’ equity increased by $19,392 inwas primarily due to net income of $54,948 and wasan increase in additional paid-in capital for purchases of noncontrolling interest of $3,806, offset by an increasea change in treasury stock of $19,292. The increase in treasury stock was primarily a result of recording our proportionate interest in shares of the Company’s stock purchased during 2018 by The Lion Fund II, L.P. under a Rule 10b5-1 trading plan. The shares purchased by the investment partnership are legally outstanding but under accounting convention the Company’s proportional ownership of the shares is reflected as treasury shares in the consolidated financial statements. December 31, 2018 2017 Cash and cash equivalents $ 48,557 $ 58,577 Investments 33,860 23,289 Investments reported in other current assets and other assets 4,463 4,463 Fair value of interest in investment partnerships 715,102 925,279 Total cash and investments 801,982 1,011,608 Less: portion of Company stock held by investment partnerships (157,622 ) (359,258 ) Carrying value of cash and investments on balance sheet $ 644,360 $ 652,350 December 31, 2023 2022 Cash and cash equivalents $ 28,066 $ 37,467 Investments 91,879 69,466 Fair value of interest in investment partnerships 472,772 383,004 Total cash and investments 592,717 489,937 Less: portion of Company stock held by investment partnerships (273,669) (227,210) Carrying value of cash and investments on balance sheet $ 319,048 $ 262,727 19 2018 2017 2016 Net cash provided by operating activities $ 20,678 $ 25,780 $ 63,349 Net cash used in investing activities (25,290 ) (11,548 ) (28,795 ) Net cash used in financing activities (7,530 ) (23,000 ) (15,231 ) Effect of exchange rate changes on cash (78 ) 165 (38 ) Increase (decrease) in cash, cash equivalents and restricted cash $ (12,220 ) $ (8,603 ) $ 19,285 2023 2022 2021 Net cash provided by operating activities $ 73,002 $ 127,825 $ 228,767 Net cash used in investing activities (66,080) (136,605) (58,525) Net cash provided by (used in) financing activities (16,132) 3,860 (156,157) Effect of exchange rate changes on cash 59 38 (64) Increase (decrease) in cash, cash equivalents, and restricted cash $ (9,151) $ (4,882) $ 14,021 2018,2023, cash from operating activities decreased by $5,102$54,823 as compared to 2017 and by $42,671 compared to 2016. Net earnings (excluding non-cash items) were $3,061 during 2018, $3,316 during 2017 and $28,780 during 2016.2022. The decrease in net earnings during 2018 and 2017 compared to 2016change was primarily dueattributable to decreases in restaurant net earnings. Distributionsdistributions from investment partnerships of $14,500 in 2023 compared to $70,700 in 2022. The distributions during 2022 were $29,660 during 2018, $9,395 during 2017 and $26,265 during 2016. Changes in working capital accounts were a decrease of $12,043 during 2018, and increases during 2017 and 2016 of $13,069 and $8,304, respectively. The decrease of working capital accounts during 2018 was primarily tiedused to the payment of the 2017 CEO incentive fee of $7,353. And the accrual of the 2017 CEO incentive fee increased working capital accounts during 2017.increasedwas $70,525 lower during 2018 by $13,7422023 as compared to 2017, and decreased by $3,505 compared to 2016.2022. Capital expenditures during 2018 were $7,259$6,341 higher in 2022 primarily due to Steak n Shake’s implementation of a self-service model. Proceeds from sales of property and $6,630equipment were $19,309 higher than capital expenditures during 2017in 2023 primarily due to the sale of oil and 2016, respectively. Purchasesgas properties for $13,563 and the sale of investments,restaurant properties for $10,883. During 2022, the Company acquired 90% of Abraxas Petroleum for $58,274, net of redemptionscash acquired. In 2023, the Company acquired the remaining 10% of fixed maturity securitiesAbraxas Petroleum for $5,387.2018 were $9,273 and $6,385 higher than purchases2023 was primarily due to net repayments on the Company’s line of investmentscredit. Cash provided by financing activities of $3,860 during 2017 and 2016, respectively. Distributions from investment partnerships2022 was primarily due to net borrowings on the Company’s line of $39,040 during 2018 were reinvested into the investment partnerships during 2018.During 2018, 2017 and 2016 we incurred debt payments of $7,579, $23,030 and $15,295, respectively. Debt obligations were reduced in 2018 because of additional principal payments on long-term debt during 2017 and 2016.anticipated cash flows generated from operations and cash on hand, existing credit facilities, and the sale of excess properties and investments.hand. We continually review available financing alternatives.Steak n Shake FacilityMarch 19, 2014, Steak n Shake and its subsidiariesSeptember 13, 2022, Biglari Holdings entered into a credit agreement which provided for a senior secured term loan facility in an aggregate principal amountline of $220,000 and a senior secured revolving credit facility in an aggregate principal amount of up to $30,000. On October 27, 2017, Steak n Shake determined to end the use of its senior secured revolving credit facility. In 2017, Steak n Shake deposited cash to satisfy required collateral for casualty insurance previously collateralized by lettersThe line of credit issued through the revolving credit facility. The deposits are recorded in other assets under restricted cash in the consolidated balance sheets.The term loan is scheduled to mature on March 19, 2021. It amortizes at an annual rate of 1.0% in equal quarterly installments, beginning June 30, 2014, at 0.25% of the original principal amount of the term loan, subject to mandatory prepayments from excess cash flow, asset sales and other events described in the credit agreement. The balance will be due at maturity.Steak n Shake has the right to request an incremental term loan facility from participating lenders and/or eligible assignees at any time, up to an aggregate total principal amount not to exceed $70,000 if certain customary conditions within the credit agreement are met.Borrowings bear interest at a rate per annum equal to a base rate or a Eurodollar rate (minimum of 1%) plus an applicable margin. Interest on the term loan is basedavailable on a Eurodollar rate plus an applicable marginrevolving basis until September 13, 2024. The line of 3.75% or on the prime rate plus an applicable margin of 2.75%. The interest rate on the term loan was 6.28% and 5.32% as of December 31, 2018 and 2017, respectively.The credit agreement includes customary affirmative and negative covenants, and events of default.as well as financial maintenance covenants. As of December 31, 2018,2023, we were in compliance with all covenants. Steak n Shake’sThere was no balance on the line of credit facility contains restrictions on its ability to pay dividends to Biglari Holdings.20 ContentsManagement’s Discussion and Analysis(continued)The term loancredit is secured by first priority security interests in substantially all the assets of Steak n Shake. Disruptions in debt capital markets that restrict access to funding when needed could adversely affect the results of operations, liquidity and capital resources of Steak n Shake. Biglari Holdings is not a guarantor under the credit facility.$500. As of December 31, 2018, $183,698 was outstanding under the term loan.Western Sizzlin RevolverAs of December 31, 2018,2023 and 2022, Western Sizzlin had no debt outstanding under theits revolver.Management’s discussion and analysis of financial condition and results of operations is based upon our consolidated financial statements, which have been prepared in accordance with accounting principles generally accepted in the United States. managementus to make estimates and judgments concerning transactions that will be settled several yearsin determining the amounts reflected in the future. Amounts recognized in our consolidated financial statements from suchstatements. Such estimates areand judgments necessarily based on numerous assumptions involvinginvolve varying, and potentiallypossibly significant, degrees of judgment and uncertainty. Accordingly, thecertain amounts currently reflectedrecorded in our consolidatedthe financial statements will likely increase or decreasebe adjusted in the future as additionalbased on new available information becomes available.We believe the following criticaland changes in other facts and circumstances. A discussion of our principal accounting policies represent our morethat required the application of significant judgments and estimates used in preparation of our consolidated financial statements. Given the current composition of our business, we do not believe that any accounting policies related to our insurance or media businesses were critical to the preparation of our consolidated financial statements as of and for the year ended December 31, 2018.(i) Biglari Holdings Inc., and (ii) the wholly owned subsidiaries of Biglari Holdings Inc. in which control can be exercised. In evaluating whether we have a controlling interest in entities in which we would consolidate, we consider the following: (1) for voting interest entities, we consolidate those entities in which we own a majority of the voting interests; and (2) for limited partnership entities, we consolidate those entities if we are the general partner of such entities and for which no substantive removal rights exist. The analysis as to whether to consolidate an entity is subject to a significant amount of judgment. Some of the criteria considered include the determination as to the degree of control over an entity by its various equity holders and the design of the entity. All intercompany accounts and transactions are eliminated in consolidation.TheDetermining the future cash flows expected to be generated by an asset requires significant judgment regarding future performance of the asset, fair market value if the asset were to be sold, and other financial and economic assumptions.InsuranceWe currently self-insure a significant portion of expected losses under our workers’ compensation, general liability, directors’officers’ liability, and auto liability insurance programs. For certain programs, we purchase reinsurance for individual and aggregate claims that exceed predetermined limits. We record a liability for all unresolved claims and ournatural gas reserves are estimates of incurred but not reported (“IBNR”) claims atfuture production that impact certain asset and expense accounts. Proved reserves are the anticipated costestimated quantities of oil and gas that geoscience and engineering data demonstrate with reasonable certainty to us. The liability estimate is basedbe economically producible in the future under existing economic conditions, operating methods, and government regulations. Proved reserves include both developed and undeveloped volumes. Proved developed reserves represent volumes expected to be recovered through existing wells with existing equipment and operating methods. Proved undeveloped reserves are volumes expected to be recovered from new wells on information receivedundrilled proved acreage, or from insurance companies, combined with management’s judgments regarding frequency and severity of claims, claims development history, and settlement practices. Significant judgmentexisting wells where expenditure is required for recompletion. We estimate our proved oil and natural gas reserves in accordance with the guidelines established by the SEC. Due to estimate IBNR claims as parties have yet to assert a claim, and therefore the degree to which injuries have been incurredinherent uncertainties and the related costs have not yet been determined. Additionally,limited nature of reservoir data, estimates about future costs involve significant judgment regarding legislation, case jurisdictions, and other matters.21 Management’s Discussion and Analysis(continued)would beare unable to be utilized;utilized, we would record a valuation allowance against the unrealizable amount and record that amount as a charge against earnings. Due to changing tax laws and state income tax rates, significant judgment is required to estimate the effective tax rate expected to applyapplicable to tax differences that are expected to reversearising from reversal in the future. We must also make estimates about the sufficiency of taxable income in future periods to offset any deductions related to deferred tax assets currently recorded. As of December 31, 2018, a change of one percentage point in an enacted tax rate would have an impact of approximately $3,800 on net earnings.We recognize the tax benefit from an uncertain tax position only if it is more likely than not that the tax position will be sustained on examination by the taxing authorities, based on the technical merits of the position. The tax benefits recognized in the financial statements from such a position are measured based on the largest benefit that has a greater than 50% likelihood of being realized upon ultimate resolution.are required to assessevaluate goodwill and any indefinite-lived intangible assets for impairment annually, or more frequently if circumstances indicate impairment may have occurred. Goodwill impairment occurs when the estimated fair value of goodwill is less than its carrying value. The valuation methodology and underlying financial information included in our determination of fair value require significant management judgments.managerial judgment. Based on a review of the qualitative factors, if we determine it is not more likely than not that the fair value is less than the carrying value, we may bypass the quantitative impairment test. We may also elect not to perform the qualitative assessment for the reporting unit or intangible assets and perform a quantitative impairment test instead.both marketof, such assets. When we determine a lease exists, we record a right-of-use asset and income approachescorresponding lease liability on our consolidated balance sheets. Right-of-use assets represent our right to derive fair value. The judgments in these two approaches include, butuse an underlying asset for the lease term. Lease liabilities represent our obligation to make lease payments arising from the lease. Right-of-use assets are not limited to, comparable market multiples, long-term projectionsrecognized at the commencement date at the value of future financial performance,the lease liability and are adjusted for any prepayments, lease incentives received, and initial direct costs incurred. Lease liabilities are recognized at the selection of appropriate discount rates used to determinelease commencement date based on the present value of future cash flows. Changesremaining lease payments over the lease term. As the discount rate implicit in such estimatesthe lease is not readily determinable in most of our leases, we use our incremental borrowing rate based on the information available at the commencement date in determining the present value of lease payments. Our lease terms include options to extend or terminate the applicationlease when it is reasonably certain that we will exercise that option. We do not record lease contracts with a term of alternative assumptions could produce significantly different results.LeasesRestaurant operations12 months or less on our consolidated balance sheets. We recognize fixed lease certain properties underexpense for operating leases. Many of these lease agreements contain rent holidays, rent escalation clauses and/or contingent rent provisions. Rent expense is recognizedleases on a straight-line basis over the expected lease term, including cancelable option periods when failure to exercise such options would result in an economic penalty. We use a time period for straight-line rentterm. For finance leases, we recognize amortization expense calculation that equals or exceedson the time period used for depreciation. In addition, the rent commencement date ofright-of-use asset and interest expense on the lease term isliability over the earlier of the date when they become legally obligated for the rent payments or the date when they take access to the grounds for build out. Accounting for leases involves significant management judgment.22 Contractual ObligationsOur significant contractual obligations and commitments as of December 31, 2018 are shown in the following table. Payments due by period Contractual Obligations Less than
1 year 1 – 3 years 3 – 5 years More than
5 years Total Long-term debt (1)(2) $ 11,926 $ 193,562 $ — $ — $ 205,488 Capital leases and finance obligations (1) 11,169 14,075 4,543 1,673 31,460 Operating leases (3) 18,397 34,611 30,811 38,499 122,318 Purchase commitments (4) 7,320 8,699 1,000 — 17,019 Other long-term liabilities (5) — — — 2,149 2,149 Total $ 48,812 $ 250,947 $ 36,354 $ 42,321 $ 378,434 ________________(1)Includes principal and interest and assumes payoff of indebtedness at maturity date.(2)Includes outstanding borrowings under the Credit Facility.(3)Excludes amounts to be paid for contingent rents. Includes amounts to be paid for subleased properties.(4)Includes agreements to purchase goods or services that are enforceable and legally binding on us and that specify all significant terms. Excludes agreements that are cancelable without penalty.(5)Includes liabilities for Non-Qualified Deferred Compensation Plan. Excludes our unrecognized tax benefits of $341 as of December 31, 2018 because we cannot make a reliable estimate of the timing of cash payments.Off-Balance Sheet ArrangementsWe have no off-balance sheet arrangements other than operating leases entered into in the normal course of business.23 Item 7A. and Qualitative Disclosures About Market RiskThe majority of our investments are conducted through investment partnerships which generally hold common stocks. We also hold marketable securities directly. Through investments in the investment partnerships we hold a concentrated position in the common stock of Cracker Barrel Old Country Store, Inc. A significant decline in the general stock market or in the prices of major investments may produce a large net loss and decrease in our consolidated shareholders’ equity. Decreases in values of equity investments can have a materially adverse effect on our earnings and on consolidated shareholders’ equity.We prefer to hold equity investments for very long periods of time so we are not troubled by short-term price volatility with respect to our investments. Our interests in the investment partnerships are committed on a rolling 5-year basis, and any distributions upon our withdrawal of funds will be paid out over two years (and may be paid in kind rather than in cash).Qualitative Disclosures About Market prices for equity securities are subject to fluctuation. Consequently, the amount realized in the subsequent sale of an investment may significantly differ from the reported market value. A hypothetical 10% increase or decrease in the market price of our investments would result in a respective increase or decrease in the fair market value of our investments of $59,581, along with a corresponding change in shareholders’ equity of approximately 8%.Borrowings on Steak n Shake’s credit facility bear interest at a rate per annum equal to a base rate or a Eurodollar rate (minimum of 1%) plus an applicable margin. Interest on the term loan is based on a Eurodollar rate plus an applicable margin of 3.75% or on the prime rate plus an applicable margin of 2.75%. At December 31, 2018, a hypothetical 100 basis point increase in short-term interest rates would have an impact of approximately $1,400 on our net earnings.We have had minimal exposure to foreign currency exchange rate fluctuations in 2018, 2017 and 2016.24 Item 8.Financial Statements and Supplementary DataShareholdersthe shareholders and the Board of Directors of Biglari Holdings Inc."Company"“Company”) as of December 31, 20182023 and 2017,2022, the related consolidated statements of earnings, comprehensive income, changes in shareholders’ equity, and cash flows for each of the three years in the period ended December 31, 2018,2023, and the related notes (collectively referred to as the "financial statements"“financial statements”). In our opinion, the financial statements present fairly, in all material respects, the financial position of the Company as of December 31, 20182023 and 2017,2022, and the results of its operations and its cash flows for each of the three years in the period ended December 31, 2018,2023, in conformity with accounting principles generally accepted in the United States of America.Company'sCompany’s internal control over financial reporting as of December 31, 2018,2023, based on criteria established inInternal Control — Integrated Framework (2013) issued by the Committee of Sponsoring Organizations of the Treadway Commission and our report dated February 23, 2019,24, 2024 expressed an unqualified opinion on the Company'sCompany’s internal control over financial reporting.Company'sCompany’s management. Our responsibility is to express an opinion on the Company'sCompany’s financial statements based on our audits. We are a public accounting firm registered with the PCAOB and are required to be independent with respect to the Company in accordance with the U.S. federal securities laws and the applicable rules and regulations of the Securities and Exchange Commission and the PCAOB.34 and Note 1214 to the consolidated financial statements, the Company and its subsidiaries have invested in investment partnerships in the form of limited partnership interests. These investment partnerships represent related parties, and such investments are subject to a rolling five-year lock up period under the terms of the respective partnership agreements.agreements for the investment partnerships. The value of these investments reported in the Company’s consolidated balance sheets as of December 31, 20182023 and 20172022 totals $557,480,000$199,103,000 and $566,021,000,$155,794,000, respectively. Our opinion is not modified with respect to this matter.Indianapolis, Indiana23, 2019Company'sCompany’s auditor since 2003.25 Shareholdersshareholders and the Board of Directors of Biglari Holdings Inc.2018,2023, based on criteria established inInternal Control — Integrated Framework (2013) issued by the Committee of Sponsoring Organizations of the Treadway Commission (COSO). In our opinion, the Company maintained, in all material respects, effective internal control over financial reporting as of December 31, 2018,2023, based on criteria established inInternal Control — Integrated Framework (2013) issued by COSO.2018,2023, of the Company and our report dated February 23, 2019,24, 2024, expressed an unqualified opinion on those financial statements and included an emphasis of a matter paragraph relating to the Company’s investment in related party investment partnerships.Overover Financial Reporting. Our responsibility is to express an opinion on the Company’s internal control over financial reporting based on our audit. We are a public accounting firm registered with the PCAOB and are required to be independent with respect to the Company in accordance with the U.S. federal securities laws and the applicable rules and regulations of the Securities and Exchange Commission and the PCAOB.Indianapolis, Indiana23, 201926 December 31, 2018 2017 Assets Current assets: Cash and cash equivalents $ 48,557 $ 58,577 Investments 33,860 23,289 Receivables 15,743 16,284 Inventories 7,537 7,268 Other current assets 9,236 7,221 Total current assets 114,933 112,639 Property and equipment 274,716 295,800 Goodwill 40,052 40,081 Other intangible assets 28,114 26,564 Investment partnerships 557,480 566,021 Other assets 14,198 22,479 Total assets $ 1,029,493 $ 1,063,584 Liabilities and shareholders’ equity Liabilities Current liabilities: Accounts payable and accrued expenses $ 117,265 $ 128,744 Current portion of notes payable and other borrowings 5,720 6,748 Total current liabilities 122,985 135,492 Long-term notes payable and other borrowings 240,001 256,994 Deferred taxes 86,871 88,401 Other liabilities 9,181 11,369 Total liabilities 459,038 492,256 Shareholders’ equity Common stock 1,138 1,071 Additional paid-in capital 381,904 382,014 Retained earnings 564,160 565,504 Accumulated other comprehensive loss (2,516 ) (1,404 ) Treasury stock, at cost (374,231 ) (375,857 ) Biglari Holdings Inc. shareholders’ equity 570,455 571,328 Total liabilities and shareholders’ equity $ 1,029,493 $ 1,063,584 December 31, 2023 2022 Assets Current assets: Cash and cash equivalents $ 28,066 $ 37,467 Investments 91,879 69,466 Receivables 22,241 29,375 Inventories 2,980 3,851 Other current assets 7,385 10,495 Total current assets 152,551 150,654 Property and equipment 380,491 400,725 Operating lease assets 32,215 34,739 Goodwill 53,530 53,513 Other intangible assets 23,230 23,037 Investment partnerships 199,103 155,794 Other assets 8,302 10,012 Total assets $ 849,422 $ 828,474 Liabilities and shareholders’ equity Liabilities Current liabilities: Accounts payable and accrued expenses $ 66,743 $ 78,616 Loss and loss adjustment expenses 15,168 16,805 Unearned premiums 14,334 12,495 Current portion of lease obligations 14,855 16,981 Line of credit — 10,000 Total current liabilities 111,100 134,897 Lease obligations 86,389 91,844 Deferred taxes 37,939 31,343 Asset retirement obligations 14,316 14,068 Other liabilities 348 754 Total liabilities 250,092 272,906 Shareholders’ equity Common stock 1,138 1,138 Additional paid-in capital 385,594 381,788 Retained earnings 631,458 576,510 Accumulated other comprehensive loss (2,518) (2,790) Treasury stock, at cost (416,342) (409,680) Biglari Holdings Inc. shareholders’ equity 599,330 546,966 Noncontrolling interests — 8,602 Total shareholders’ equity 599,330 555,568 Total liabilities and shareholders’ equity $ 849,422 $ 828,474 27 Year Ended
December 31, 2018 2017 2016 Revenues Restaurant operations $ 775,690 $ 807,153 $ 817,914 Insurance premiums and other 27,628 24,943 22,997 Media advertising and other 6,576 7,708 9,165 809,894 839,804 850,076 Cost and expenses Restaurant cost of sales 636,456 661,030 634,966 Insurance losses and underwriting expenses 20,831 19,724 17,484 Media cost of sales 4,152 6,527 15,834 Selling, general and administrative 132,909 130,808 127,259 Depreciation and amortization 19,318 21,448 22,925 813,666 839,537 818,468 Other income (expenses) Interest expense (11,677 ) (11,040 ) (11,450 ) Interest on obligations under leases (8,207 ) (9,082 ) (9,475 ) Investment partnership gains 40,411 6,965 135,580 Total other income (expenses) 20,527 (13,157 ) 114,655 Earnings (loss) before income taxes 16,755 (12,890 ) 146,263 Income tax expense (benefit) (2,637 ) (62,961 ) 46,812 Net earnings $ 19,392 $ 50,071 $ 99,451 Earnings per share Net earnings per equivalent Class A share * $ 55.71 $ 136.01 $ 271.22 Year Ended December 31, 2023 2022 2021 Revenue Restaurant operations $ 250,857 $ 241,568 $ 271,290 Insurance premiums and other 67,272 64,540 58,609 Oil and gas 45,071 57,546 33,004 Licensing and media 2,118 4,577 3,203 Total revenue 365,318 368,231 366,106 Cost and expenses Restaurant cost of sales 137,986 140,264 167,491 Insurance losses and underwriting expenses 52,771 54,648 43,094 Oil and gas production costs 17,365 17,842 10,470 Licensing and media costs 1,840 2,695 2,275 Selling, general and administrative 77,002 70,608 76,018 Gain on sale of oil and gas properties (13,563) — — Impairments 3,947 3,520 4,635 Depreciation, depletion, and amortization 38,979 36,443 30,050 Interest expense on leases 5,114 5,493 6,039 Interest expense on debt 681 399 1,121 Total cost and expenses 322,122 331,912 341,193 Other income (expenses) Investment gains (losses) 2,211 (3,393) 6,401 Investment partnership gains (losses) 19,440 (75,953) 10,953 Total other income (expenses) 21,651 (79,346) 17,354 Earnings (loss) before income taxes 64,847 (43,027) 42,267 Income tax expense (benefit) 9,308 (10,722) 6,789 Net earnings (loss) 55,539 (32,305) 35,478 Earnings (loss) attributable to noncontrolling interest 591 (287) — Net earnings (loss) attributable to Biglari Holdings Inc. shareholders $ 54,948 $ (32,018) $ 35,478 Net earnings (loss) per equivalent Class A share * $ 189.49 $ (107.43) $ 111.83 $11.14$37.90 for 2018, $27.202023, $(21.49) for 20172022, and $54.24$22.37 for 2016.CONSOLIDATED STATEMENTS OF COMPREHENSIVE INCOME(dollars in thousands) Year Ended
December 31, 2018 2017 2016 Net earnings $ 19,392 $ 50,071 $ 99,451 Other comprehensive income: Reclassification of investment appreciation in net earnings (73 ) — 306 Applicable income taxes 15 — (113 ) Net change in unrealized gains on investments — 284 568 Applicable income taxes — (89 ) (211 ) Foreign currency translation (1,054 ) 1,985 (455 ) Other comprehensive income (loss), net (1,112 ) 2,180 95 Total comprehensive income $ 18,280 $ 52,251 $ 99,546 28 CASH FLOWS Year Ended
December 31, 2018 2017 2016 Operating activities Net earnings $ 19,392 $ 50,071 $ 99,451 Adjustments to reconcile net earnings to operating cash flows: Depreciation and amortization 19,318 21,448 22,925 Provision for deferred income taxes (2,153 ) (64,321 ) 38,485 Asset impairments and other non-cash expenses 6,481 3,860 1,693 (Gain) loss on disposal of assets 993 (777 ) 1,806 Investment (gains) losses (including contributions) (559 ) — 306 Investment partnership gains (40,411 ) (6,965 ) (135,886 ) Distributions from investment partnerships 29,660 9,395 26,265 Changes in receivables and inventories (359 ) (2,235 ) 4,280 Changes in other assets 536 268 116 Changes in accounts payable and accrued expenses (12,220 ) 15,036 3,908 Net cash provided by operating activities 20,678 25,780 63,349 Investing activities Capital expenditures (15,293 ) (8,034 ) (8,663 ) Purchases of perpetual lease rights (2,503 ) — (3,367 ) Proceeds from property and equipment disposals 2,590 1,004 1,084 Distributions from investment partnerships 39,040 — — Purchases of limited partner interests (39,040 ) (3,707 ) (14,150 ) Purchases of investments (58,642 ) (42,648 ) (35,784 ) Redemptions of fixed maturity securities 48,558 41,837 32,085 Net cash used in investing activities (25,290 ) (11,548 ) (28,795 ) Financing activities Payments on revolving credit facility (175 ) (202 ) (409 ) Principal payments on long-term debt (2,200 ) (17,200 ) (9,277 ) Principal payments on direct financing lease obligations (5,204 ) (5,628 ) (5,609 ) Proceeds for exercise of stock options 49 30 64 Net cash used in financing activities (7,530 ) (23,000 ) (15,231 ) Effect of exchange rate changes on cash (78 ) 165 (38 ) Increase (decrease) in cash, cash equivalents and restricted cash (12,220 ) (8,603 ) 19,285 Cash, cash equivalents and restricted cash at beginning of period 67,230 75,833 56,548 Cash, cash equivalents and restricted cash at end of period $ 55,010 $ 67,230 $ 75,833 Year Ended December 31, 2023 2022 2021 Net earnings (loss) $ 55,539 $ (32,305) $ 35,478 Foreign currency translation 272 (883) (376) Comprehensive income 55,811 (33,188) 35,102 Comprehensive income attributable to noncontrolling interest 591 (287) — Total comprehensive income attributable to Biglari Holdings Inc. shareholders $ 55,220 $ (32,901) $ 35,102 29 Year Ended December 31, 2023 2022 2021 Operating activities Net earnings (loss) $ 55,539 $ (32,305) $ 35,478 Adjustments to reconcile net earnings (loss) to operating cash flows: Depreciation and amortization 38,979 36,443 30,050 Provision for deferred income taxes 6,567 (15,582) 5,269 Asset impairments 3,947 3,520 4,772 Gains on sale of assets (21,241) (1,578) (25) Investment (gains) losses (2,211) 3,393 (6,214) Investment partnership (gains) losses (19,440) 75,953 (10,953) Distributions from investment partnerships 14,500 70,700 180,170 Changes in receivables and inventories 5,783 3,339 (9,324) Changes in other assets 2,810 8,523 136 Changes in accounts payable and accrued expenses (12,231) (24,581) (592) Net cash provided by operating activities 73,002 127,825 228,767 Investing activities Capital expenditures (23,405) (29,746) (64,549) Proceeds from property and equipment disposals 24,627 5,318 10,101 Acquisition of business, net of cash acquired — (58,274) — Purchases of noncontrolling interests (5,387) — — Purchases of interests in limited partnerships (45,030) (48,569) (12,300) Purchases of investments (107,866) (134,451) (110,199) Sales of investments and redemptions of fixed maturity securities 90,981 129,117 118,422 Net cash used in investing activities (66,080) (136,605) (58,525) Financing activities Payments on line of credit (41,600) (20,000) — Proceeds from line of credit 31,600 30,000 — Principal payments on long-term debt — — (149,952) Principal payments on direct financing lease obligations (6,132) (6,140) (6,205) Net cash provided by (used in) financing activities (16,132) 3,860 (156,157) Effect of exchange rate changes on cash 59 38 (64) Increase (decrease) in cash, cash equivalents, and restricted cash (9,151) (4,882) 14,021 Cash, cash equivalents, and restricted cash at beginning of period 38,805 43,687 29,666 Cash, cash equivalents, and restricted cash at end of period $ 29,654 $ 38,805 $ 43,687 Year Ended December 31, 2023 2022 2021 Cash and cash equivalents $ 28,066 $ 37,467 $ 42,349 Restricted cash included in other long-term assets 1,588 1,338 1,338 Cash, cash equivalents, and restricted cash at end of period $ 29,654 $ 38,805 $ 43,687 Common Stock Additional Paid-In Capital Retained Earnings Accumulated Other Comprehensive Income (Loss) Treasury Stock Total Balance at December 31, 2015 $ 1,071 $ 391,853 $ 415,982 $ (3,679 ) $ (353,855 ) $ 451,372 Net earnings 99,451 99,451 Other comprehensive income, net 95 95 Adjustment to treasury stock for holdings in investment partnerships (9,939 ) (9,103 ) (19,042 ) Exercise of stock options (8 ) 72 64 Balance at December 31, 2016 $ 1,071 $ 381,906 $ 515,433 $ (3,584 ) $ (362,886 ) $ 531,940 Net earnings 50,071 50,071 Other comprehensive income, net 2,180 2,180 Adjustment to treasury stock for holdings in investment partnerships 116 (13,009 ) (12,893 ) Exercise of stock options (8 ) 38 30 Balance at December 31, 2017 $ 1,071 $ 382,014 $ 565,504 $ (1,404 ) $ (375,857 ) $ 571,328 Net earnings 19,392 19,392 Adoption of accounting standards 90 90 Other comprehensive income, net (1,112 ) (1,112 ) Conversion of common stock 67 (67 ) (20,826 ) 20,826 — Adjustment to treasury stock for holdings in investment partnerships (19,292 ) (19,292 ) Exercise of stock options (43 ) 92 49 Balance at December 31, 2018 $ 1,138 $ 381,904 $ 564,160 $ (2,516 ) $ (374,231 ) $ 570,455 Biglari Holdings Inc. Shareholder’s Equity Common Stock Additional Paid-
In CapitalRetained
EarningsAccumulated
Other
Comprehensive
Income (Loss)Treasury Stock Non-controlling interest Total Balance at December 31, 2020 $ 1,138 $ 381,788 $ 573,050 $ (1,531) $ (389,617) $ — $ 564,828 Net earnings (loss) 35,478 35,478 Other comprehensive income, net (376) (376) Adjustment for holdings in investment partnerships (12,234) (12,234) Balance at December 31, 2021 $ 1,138 $ 381,788 $ 608,528 $ (1,907) $ (401,851) $ — $ 587,696 Net earnings (loss) (32,018) (287) (32,305) Other comprehensive income, net (883) (883) Adjustment for holdings in investment partnerships (7,829) (7,829) Transactions with noncontrolling interests 8,889 8,889 Balance at December 31, 2022 $ 1,138 $ 381,788 $ 576,510 $ (2,790) $ (409,680) $ 8,602 $ 555,568 Net earnings (loss) 54,948 591 55,539 Other comprehensive income, net 272 272 Adjustment for holdings in investment partnerships (6,662) (6,662) Purchases of noncontrolling interests 3,806 (9,193) (5,387) Balance at December 31, 2023 $ 1,138 $ 385,594 $ 631,458 $ (2,518) $ (416,342) $ — $ 599,330 30 2018, 20172023, 2022, and 2016)share and per-share data)media, property and casualty insurance, licensing and restaurants.media, restaurants, and oil and gas. The Company’s largest operating subsidiaries are involved in the franchising and operating of restaurants. Biglari Holdings is founded and led by Sardar Biglari, Chairman and Chief Executive Officer of the Company.Holdings and its major operating subsidiaries. The Company’s long-term objective is to maximize per-share intrinsic value.Holdings’ management system combines decentralized operations with centralized financial decision-making. Operating decisions for the various business units are made by their respective managers. All major operating, investment and capital allocation decisions are made for the Company and its subsidiaries by Mr. Biglari.2018,2023, Mr. Biglari’s beneficial ownership was approximately 56.9% of the Company’s outstanding Class A common stock and 54.3% of the Company’s outstanding Class B common stock.Issuance of Dual Class Common StockOn March 5, 2018, the Company entered into an agreement with its predecessor registrant, now known as OBH Inc. (the “Predecessor”), and BH Merger Company, a wholly owned subsidiary of the Company. Pursuant to the agreement on April 30, 2018, BH Merger Company merged with and into the Predecessor, with the Predecessor continuing as the surviving corporation and a wholly owned subsidiary of the Company.As a result of the April 30, 2018 transaction, the Company has two classes of common stock, designated Class A common stock and Class B common stock. A share of Class B common stock has economic rights equivalent to 1/5th of a share of Class A common stock; however, Class B common stock has no voting rights. Upon completion of the transaction, every ten (10) shares of common stock outstanding on April 30, 2018 converted into (i) ten (10) shares of Class B common stock and (ii) one (1) share of Class A common stock.Since May 1, 2018, theBiglari beneficially owns shares of the Company’s Class A common stock have traded on the New York Stock Exchange (“NYSE”) under the ticker symbol “BH.A” and the sharesCompany that represent approximately 66.8% of the Company’s Class B common stock have traded on the NYSE under the ticker symbol “BH”.For accounting purposes, the April 30, 2018 transaction has been treated as a merger of entities under common control. Accordingly, the consolidated financial positioneconomic interest and results of operationsapproximately 71.0% of the Predecessor has been included in the consolidated financial statements on a historical basis, except for earnings per share which is impacted by the issuance of the new common shares. wholly-ownedwholly owned subsidiaries, including Steak n Shake Inc. (“Steak n Shake”), Western Sizzlin Corporation, (“Western Sizzlin”), Maxim Inc. (“Maxim”,) and First Guard Insurance Company, Maxim Inc., Southern Pioneer Property & Casualty Insurance Company, Southern Oil Company, and its agency, 1st Guard Corporation (collectively “First Guard”).Abraxas Petroleum Corporation. Intercompany accounts and transactions have been eliminated in consolidation.In November 2016, the Financial Accounting Standards Board (“FASB”) issued Accounting Standards Update (“ASU”) 2016-18,Statement of Cash Flows: Restricted Cash. ASU 2016-18 requires that theThe statement of cash flows includeincludes restricted cash with cash and cash equivalents when reconcilingequivalents.beginning-of-periodacquisition date as either available-for-sale or held-to-maturity and end-of-period amounts shown on statementsre-evaluate the classification at each balance sheet date. Securities classified as held-to-maturity are carried at amortized cost, reflecting the ability and intent to hold the securities to maturity. As of cash flows. In 2017, the Company deposited cash to satisfy required collateral for casualty insurance.Note 1. Summary of Significant Accounting Policies(continued)Cash2023 and 2022, all investments were classified as reported on the statements of cash flows consists of the following. December 31, 2018 2017 2016 Cash and cash equivalents $ 48,557 $ 58,577 $ 75,808 Restricted cash included in other long-term assets 6,453 8,653 25 Cash, cash equivalents and restricted cash $ 55,010 $ 67,230 $ 75,833 InvestmentsOur investments consist of available-for-sale securities. Available-for-sale securities areand carried at fair value with net unrealized gains or losses reported in the statements of earnings. Realized gains and losses on disposals of investments are determined by the specific identification of the cost of investments sold andsold. Dividends earned on investments are included inreported as investment gains/losses,income by our insurance companies. We consider investment income as a component of other income.whichthat generally hold common stocks. We also hold marketable securities directly. ThroughWe concentrate a high percentage of the investment partnerships we holdinvestments in a concentrated position in the common stocksmall number of Cracker Barrel Old Country Store, Inc.equity securities. A significant decline in the general stock market or in the prices of our major investments may have a materially adverse effect on our earnings and on consolidated shareholders’ equity.$3,901$2,546 and $2,298$1,151 at December 31, 20182023 and 2017,2022, respectively.flows.flows, which is generally at the individual restaurant level. Assets included in the impairment assessment generally consist of property, equipment, and leasehold improvements directly associated with an individual restaurant as well as any related finance or operating lease assets. If the future undiscounted cash flows of an asset are less than the recorded value, an impairment is recorded for the difference between the carrying value and the estimated fair value of the asset.32 ContentsNote 1. Summaryexploratory wells are capitalized pending determination of Significant Accounting Policies(continued)NoDuring 2023, 2022 and 2021, no impairments were recorded on goodwill orto goodwill. During 2023, we recorded impairments to indefinite life intangible assets during 2018, 2017 or 2016.of $20. During 2022 and 2021, no impairments were recorded to other intangible assets. Refer to Note 68 for information regarding our goodwill and other intangible assets.Operating Leasesleases certain property under operating leases. Manyhas two classes of these lease agreements contain rent holidays, rent escalation clauses and/or contingent rent provisions. Rent expense is recognized on a straight-line basis over the expected lease term, including cancellable option periods when failure to exercise such options would result in an economic penalty. In addition, the rent commencement date of the lease term is the earlier due date when we become legally obligated for the rent payments, the date when we take access to the property, or the grounds for build out.Common StockAs a result of the transaction on April 30, 2018, the Predecessor’s common stock, converted into the right to receive shares ofdesignated Class A common stock and Class B common stock. The treasury shares outstanding on April 30, 2018, were retired and not converted intoEach Class A andcommon share is entitled to one vote. Class B common stock. stock possesses economic rights equal to one-fifth (1/5th) of such rights of Class A common stock; however, Class B common stock has no voting rights. December 31, 2018 Class A Class B December 31, 2017 December 31, 2016 Common stock authorized 500,000 10,000,000 2,500,000 2,500,000 Common stock issued 206,864 2,068,640 2,142,202 2,142,202 Treasury stock held by the Company — — (74,589 ) (75,009 ) Outstanding shares 206,864 2,068,640 2,067,613 2,067,193 On an equivalent Class A common stock basis, there were 620,592, 620,284 and 620,158 shares outstanding as of December 31, 2018, 2017 and 2016, respectively.December 31, 2023 December 31, 2022 December 31, 2021 Class A Class B Class A Class B Class A Class B Common stock authorized 500,000 10,000,000 500,000 10,000,000 500,000 10,000,000 Common stock issued and outstanding 206,864 2,068,640 206,864 2,068,640 206,864 2,068,640 weighted averageweighted-average number of shares outstanding during the year. The shares of Company stock attributable to our limited partner interest in the investment partnerships — based on our proportional ownership during this period — are considered treasury stock on the consolidated balance sheet and thereby deemed not to be included in the calculation of weighted averageweighted-average common shares outstanding. However, these shares are legally outstanding.ASCAccounting Standards Codification (“ASC”) 260, “Earnings“Earnings Per Share.Share.” The issuance of dual class common stock on April 30, 2018 is applied on a retrospective basis for the calculation of earnings per share. Accordingly, earnings per share for 2018, 2017 and 2016 are impacted by the issuance of the new common shares. The equivalent Class A common stock applied for computing earnings per share excludes the proportional shares of Biglari Holdings’ stock held by the investment partnerships. TheIn the tabulation below is the equivalent Class A common stock for the earnings per share calculation was 348,108, 368,150 and 366,678 for 2018, 2017 and 2016, respectively.share. There are no dilutive securities outstanding.33 2023 2022 2021 Equivalent Class A common stock outstanding 620,592 620,592 620,592 Proportional ownership of Company stock held by investment partnerships 330,606 322,561 303,341 Equivalent Class A common stock for earnings per share 289,986 298,031 317,251 2023 2022 2021 Net sales $ 152,545 $ 149,184 $ 187,913 Franchise partner fees 72,552 63,853 55,641 Franchise royalties and fees 16,443 19,678 21,736 Other 9,317 8,853 6,000 $ 250,857 $ 241,568 $ 271,290 Revenue RecognitionRestaurant operationsRestaurant operations revenues were as follows. 2018 2017 2016 Net sales $ 740,922 $ 781,856 $ 795,322 Franchise royalties and fees 30,998 20,773 18,794 Other 3,770 4,524 3,798 $ 775,690 $ 807,153 $ 817,914 In accordance with ASC 606-10-50, the Company disaggregates revenue from contracts with customers. The only Company segment that was affected significantly by ASC 606 was restaurants. The Company’s accounting policies and practices related to restaurant operations revenues consist of the following under ASC 606.wereare composed of retail sales of food through company-ownedcompany-operated stores. Company-ownedCompany-operated store revenues are recognized, net of discounts and sales taxes, when our obligation to perform is satisfied at the point of sale. Sales taxes related to these sales are collected from customers and remitted to the appropriate taxing authority and are not reflected in the Company’s consolidated statements of incomeearnings as revenue.royalties andPartner Feesfranchisees. Royaltiesfranchisees are based upon a percentage of sales of the franchise restaurant and are recognized as earned. Franchise royalties are billed on a monthly basis. Initial franchise fees when a new restaurant opens or at the start of a new franchise term are recorded as deferred revenue when received and recognized as revenue over the term of the franchise agreement. This represents a change in methodology under the January 1, 2018 adoption of ASC 606 for we have historically recognized initial franchise fees upon the opening of a franchise restaurant. Comparative prior periods have not been adjusted.yearyears ended December 31, 2018,2023, 2022, and 2021, restaurant operations recognized $3,096$1,207, $1,810, and $2,033, respectively, in revenue related to initial franchise fees. As of December 31, 20182023 and January 1, 2018,2022, restaurant operations had deferred revenue recorded in accrued expenses related to franchise fees of $9,075$2,280 and $10,581,$3,484, respectively. Restaurant operations expectsexpect to recognize approximately $649 in 2019 and the balance in the years 2020 through 2039. This represents a change in methodology under the adoption of ASC 606 as we have historically applied advertising funds from the franchisees directly to various marketing programs. The new guidance requires the Company to recognize the marketing contributions received from franchisees as revenue and record a corresponding increase to marketing expense as the funds are applied to marketing programs as required by our franchise agreements.yearyears ended December 31, 2018,2023, 2022, and 2021, restaurant operations recognized $9,675$4,479, $6,386, and $6,829, respectively, in revenue related to franchisee advertising fees. As of December 31, 20182023 and January 1, 2018,2022, restaurant operations had deferred revenue recorded in accrued expenses related to franchisee advertising fees of $2,255$1,945 and $2,064,$2,748, respectively. Restaurant operations expectsexpect to recognize approximately $1,128$1,556 of deferred revenue during 2019 and the balance in 2020. This represents a change in the methodology, under the adoption of ASC 606, used to estimate breakage for we have historically recognized breakage for the portion of the gift card balances that remained outstanding following 48 months of issuance. yearyears ended December 31, 2018,2023, 2022, and 2021, restaurant operations recognized $27,081$5,276, $5,395, and $5,903, respectively, of revenue from gift card redemptions. As of December 31, 20182023 and January 1, 2018,2022, restaurant operations had deferred revenue recorded in accrued expenses related to unredeemed gift cards of $22,685$5,144 and $20,968,$9,279, respectively. The Company expectsRestaurant operations expect to recognize approximately $18,132 in 2019$2,500 of deferred revenue during 2024.the balance in the years 2020 through 2022. 34 Note 1. Summary of Significant Accounting Policies(continued)Insurance premiums and commissionsMedia advertisingotherrevenues, net of any commissions paid to subscription agents. Also included in subscription revenues are revenues generated from single-copy sales of magazines through retail outlets such as newsstands, supermarkets, convenience stores and drugstores and on certain digital devices, which may or may not result in future subscription sales. Revenues from retail outlet sales are recognized based on gross sales less a provision for estimated returns. License revenue is recognized when earned. We derive value and revenues from intellectual property assets through a range of licensing and business activities, including licensing and syndication of our trademarks and copyrights in the United States and internationally.rent expense.occupancy costs. Cost of sales excludes depreciation and amortization, which is presented as a separate line item on the consolidated statement of earnings. Liabilities for insurance losses of $1,891$1,907Gas Production Costsincluded in accruedcosts incurred to operate and maintain wells and related equipment and facilities, including lease operating expenses in the consolidated balance sheet as of December 31, 2018 and 2017, respectively.Insurance ReservesWe self-insure a significant portion of expected losses under our workers’ compensation, general liability, auto, directors’ and officers’ and medical liability insurance programs, and record a reserve for our estimated losses on all unresolved open claims and our estimated incurred but not reported claims at the anticipated cost to us. Insurance reserves are recorded in accrued expenses in the consolidated balance sheet. deferred compensation and defined contribution retirement plans, such as 401(k) or profit sharingprofit-sharing plans. Employee contributions to the plans are subject to regulatory limitations and the specific plan provisions. Some of the plans allow for discretionary contributions as determined by management. Employer contributions expensed with respect to these plans were not material.weighted averageweighted-average exchange rates for revenue and expenses, and historical rates for equity. The resulting currency translation adjustment is recorded in accumulated other comprehensive income, as a component of equity.35 Note 1. Summary of Significant Accounting Policies(continued)January 2017,November 2023, the Financial Accounting Standards Board (“FASB”) issued ASU 2017-04,Intangibles - Goodwill and Other: Simplifying the Test for Goodwill Impairment. ASU 2017-04 provides for the elimination of Step 2 from the goodwill impairment test. If impairment charges are recognized, the amount recorded will be the amount by which the carrying amount exceeds the reporting unit’s fair value with certain limitations.authoritative guidance to improve reportable segment disclosure requirements. The ASU is effective for public companies for annual periods, and interim periods within those annual periods, beginning after December 15, 2019. The Company adopted ASU 2017-04 on January 1, 2018.In November 2016, the FASB issued ASU 2016-18,Statement of Cash Flows: Restricted Cash. ASU 2016-18new guidance requires that the statement of cash flows include restricted cash with cash and cash equivalents when reconciling the beginning-of-period and end-of-period amounts shown on statements of cash flows. For public entities this standarddisclose additional information related to significant segment expenses regularly provided to the chief operating decision maker and other segment items. The guidance is effective for fiscal years beginning after December 15, 2017. This standard should be applied retrospectively2023 and early adoption is permitted, including adoption in an interim period.periods within fiscal years beginning after December 15, 2024. We adopted this standard in 2017 and have retroactively adjustedare evaluating the consolidated statementsimpact of cash flows for all periods presented.October 2016,December 2023, the FASB issued ASU 2016-17,Interests Held through Related Parties That Are under Common Control.ASU 2016-17 amendsauthoritative guidance modifying the consolidation guidance in ASU 2015-02 regarding the treatment of indirect interests held through related parties that are under common control. The adoption of ASU 2016-17 did not have a material effect on our consolidated financial statements.In August 2016, the FASB issued ASU 2016-15,Statement of Cash Flows (Topic 230): Classification of Certain Cash Receipts and Cash Payments.The objective of the update is to reduce diversity in how certain transactions are classifieddisclosure requirements for income tax. Notable changes in the statementnew guidance include disaggregation of cash flows.income tax information by jurisdiction and changes to the presentation of information for the reconciliation of effective tax rates. The amendments in this update areguidance is effective for financial statements issued for fiscal years beginning after December 15, 2017, and interim periods within those fiscal years. The adoption of ASU 2016-15 did not have a material effect on our consolidated financial statements.In June 2016, the FASB issued ASU 2016-13,Financial Instruments—Credit Losses: Measurement of Credit Losses on Financial Instruments. ASU 2016-13 amends guidance on reporting credit losses for assets held at amortized cost basis and available for sale debt securities. For available for sale debt securities, credit losses should be measured in a manner similar to current GAAP; however, ASU 2016-13 will require that credit losses be presented as an allowance rather than as a write-down. The amendments in this update2024. We are effective for financial statements issued for fiscal years beginning after December 15, 2019, and interim periods within those fiscal years. The Company is currently evaluating the impact the adoption of ASU 2016-13 will have on its consolidated financial statements and related disclosures.In February 2016, the FASB issued ASU 2016-02,Leases. ASU 2016-02 requires a lessee to recognize lease assets and lease liabilities on the balance sheet, along with additional qualitative and quantitative disclosures. ASU 2016-02 is effective for annual and interim periods beginning after December 15, 2018, with early adoption permitted. In July 2018, the FASB issued ASU 2018-11,Leases (Topic 842): Targeted Improvements, which provides an additional transition method with which to adopt the new leases standard. Most prominent among the changes in the standard is the recognition of right of use assets and lease liabilities by lessees for those leases classified as operating leases under current GAAP. Leases will be classified as either finance or operating, with classification affecting the pattern of expense recognition in the consolidated statement of earnings. Under the new standard, disclosures are required to meet the objective of enabling users of financial statements to assess the amount, timing, and uncertainty of cash flows arising from leases.36 Note 1. Summary of Significant Accounting Policies(continued)The guidance permits the use of a modified retrospective approach, which requires an entity to recognize and measure leases existing at, or entered into after, the beginning of the earliest comparative period presented. Alternatively, the guidance permits a “Comparatives Under 840 Option” that changes the date of initial application to the beginning of the period of adoption. We will be electing the Comparatives Under 840 Option in which we will apply ASC 840 to all comparative periods, including disclosures, and recognize the effects of applying ASC 842 as a cumulative-effect adjustment to retained earnings as of the effective date (January 1, 2019). We will elect the package of practical expedients permitted under the transition guidance within the new standard, which among other things, allows us to carryforward the historical lease classification. In addition, we elected certain practical expedients and accounting policies, including an accounting policy election to keep leases with an initial term of 12 months or less off of the balance sheet. We will recognize those lease payments in the consolidated statements of earnings on a straight-line basis over the lease term.The standard will have a material impact on our consolidated balance sheets, but will not have a material impact on our consolidated statements of earnings and statements of cash flow. The most significant impact will be the recognition of right of use assets and lease liabilities for operating leases. Although our accounting for existing capital leases remains substantially unchanged, the adoption of the standard will result in the recognition of right of use assets and lease liabilities for operating leases of approximately $90,000 as of January 1, 2019.In May 2014, the FASB issued ASU 2014-09,Revenue from Contracts with Customers (Topic 606). On January 1, 2018, we adopted FASB accounting standards codification Topic 606 (“ASC 606”). In accordance with ASC 606, we changed certain characteristics of our revenue recognition accounting policy as described below. ASC 606 was applied using the modified retrospective method, where the cumulative effect of the initial application is recognized as an adjustment to opening retained earnings at January 1, 2018. Comparative prior periods have not been adjusted.The following table summarizes the impact of the adoptionnew guidance on our disclosures.net earnings for 2018. As Reported Adjustments
for the
Adoption of
ASC 606 Amounts without
Adoption of
ASC 606Statements of Earnings Revenues Restaurant operations Net sales $ 740,922 $ — $ 740,922 Franchise royalties and fees 30,998 9,417 21,581 Other 3,770 (463 ) 4,233 Selling, general and administrative 132,909 9,689 123,220 Earnings before income taxes 16,755 (735 ) 17,490 Income tax expense (benefit) (2,637 ) (184 ) (2,453 ) Net earnings 19,392 (551 ) 19,943 impactCompany used working capital including its line of ASC 606 oncredit to fund the purchase of the Preferred Shares. Abraxas Petroleum operates oil and natural gas properties in the Permian Basin. The Company’s balance sheetfinancial results include the results of Abraxas Petroleum from the acquisition date.September 14, 2022 Cash and cash equivalents $ 21,726 Receivables and other assets 6,518 Property and equipment 75,400 Total identifiable assets acquired 103,644 Accounts payable and accrued expenses (10,719) Asset retirement obligations (3,587) Deferred taxes (449) Total liabilities assumed (14,755) Noncontrolling interest (8,889) Total consideration $ 80,000 2018 was not material. The cumulative change2023 and 2022, respectively. We classify investments in retained earningsfixed maturity securities at the acquisition date as available-for-sale. Realized gains and losses on disposals of January 1, 2018 was $90. Upon adoption of ASC 606, the Company changed its restaurant operations accounting policies for the recognition of franchise fees, recording of advertising arrangements, and recognition of gift card revenue. The adoption of ASC 606 did not have any significant impactinvestments are determined on a specific identification basis. Dividends earned on investments held by our insurance companies are reported as investment income. We consider investment income as a component of our aggregate insurance operating results. However, we consider investment gains and losses, whether realized or media/licensing businesses.Note 2. InvestmentsAvailable forunrealized, as non-operating.investments were $33,860 and $23,289 as of December 31, 2018 and 2017, respectively. Investments in equity securities and a related derivative position of $4,463 are included in other current assets as of December 31, 2018 and in other assets as of December 31, 2017. The investments are recorded at fair value.37 3.4. Investment Partnershipstheythese shares are legally outstanding. The Company records gains/losses from investment partnerships (inclusive of the investment partnerships’ unrealized gains and losses on their securities) in the consolidated statements of earnings based on our carrying value of these partnerships. The fair value is calculated net of the general partner’s accrued incentive fees. Gains and losses on Company common stock included in the earnings of these partnerships are eliminated because they are recorded as treasury stock. partnerships andpartnerships. Biglari Capital Corp. is an entity solely owned by Mr. Biglari.isare presented below. Fair Value Company Common Stock Carrying
ValuePartnership interest at December 31, 2015 $ 734,668 $ 262,979 $ 471,689 Investment partnership gains 248,935 113,049 135,886 Distributions (net of contributions of $19,832) (10,896 ) (10,896 ) Increase in proportionate share of Company stock held 19,042 (19,042 ) Partnership interest at December 31, 2016 $ 972,707 $ 395,070 $ 577,637 Investment partnership gains (losses) (41,740 ) (48,705 ) 6,965 Distributions (net of contributions of $3,707) (5,688 ) (5,688 ) Increase in proportionate share of Company stock held 12,893 (12,893 ) Partnership interest at December 31, 2017 $ 925,279 $ 359,258 $ 566,021 Investment partnership gains (losses) (180,517 ) (220,928 ) 40,411 Distributions (net of reinvestments of $39,040) (29,660 ) (29,660 ) Increase in proportionate share of Company stock held 19,292 (19,292 ) Partnership interest at December 31, 2018 $ 715,102 $ 157,622 $ 557,480 The Company recognized a pre-tax loss of $306 ($193 net of tax) on a contribution of $5,682 in securities to investment partnerships during 2016.Fair Value Company Common Stock Carrying
ValuePartnership interest at December 31, 2020 $ 590,926 $ 171,376 $ 419,550 Investment partnership gains (losses) 51,145 40,192 10,953 Distributions (net of contributions) (167,870) (167,870) Increase in proportionate share of Company stock held 12,234 (12,234) Partnership interest at December 31, 2021 $ 474,201 $ 223,802 $ 250,399 Investment partnership gains (losses) (80,374) (4,421) (75,953) Distributions (net of contributions) (10,823) (10,823) Increase in proportionate share of Company stock held 7,829 (7,829) Partnership interest at December 31, 2022 $ 383,004 $ 227,210 $ 155,794 Investment partnership gains (losses) 59,238 39,797 19,441 Contributions (net of distributions) 30,530 30,530 Increase in proportionate share of Company stock held 6,662 (6,662) Partnership interest at December 31, 2023 $ 472,772 $ 273,669 $ 199,103 December 31, 2018 2017 Carrying value of investment partnerships $ 557,480 $ 566,021 Deferred tax liability related to investment partnerships (92,703 ) (95,309 ) Carrying value of investment partnerships net of deferred taxes $ 464,777 $ 470,712 December 31, 2023 2022 Carrying value of investment partnerships $ 199,103 $ 155,794 Deferred tax liability related to investment partnerships (27,896) (23,643) Carrying value of investment partnerships net of deferred taxes $ 171,207 $ 132,151 is $374,231was $416,342 and $354,939$409,680 at December 31, 20182023 and 2017, respectively, and is recorded as treasury stock.The fair value measurement is classified as level 3 withinUnrealized gains and losses on marketable securities held by the fair value hierarchy.38 Note 3. Investment Partnerships(continued) 2018 2017 2016 Gains from investment partnerships $ 40,411 $ 6,965 $ 135,886 Loss on contribution of securities to investment partnerships — — (306 ) Investment partnership gains 40,411 6,965 135,580 Tax expense (benefit) 7,171 (4,115 ) 44,248 Contribution to net earnings $ 33,240 $ 11,080 $ 91,332 2023 2022 2021 Gains (losses) from investment partnerships $ 19,440 $ (75,953) $ 10,953 Tax expense (benefit) 4,794 (18,992) 2,054 Contribution to net earnings $ 14,646 $ (56,961) $ 8,899 The totalAn incentive reallocation from Biglari Holdings to Biglari Capital includeswould include gains on the Company’s common stock. Gains and losses on the Company’s common stock and the related incentive reallocations are eliminated in our financial statements. Our investments in these partnerships are committed on a rolling 5-year basis.2018 and 2017. The incentive reallocation on December 31, 2016 was $31,628 (including $11,514 for gains on Company common stock). Equity in Investment Partnerships Lion Fund Lion Fund II Total assets as of December 31, 2018 $ 107,207 $ 901,750 Total liabilities as of December 31, 2018 $ 447 $ 202,770 Revenue for the year ended December 31, 2018 $ (92,093 ) $ (120,431 ) Earnings for the year ended December 31, 2018 $ (92,159 ) $ (130,193 ) Biglari Holdings’ ownership interest 65.9 % 92.2 % Total assets as of December 31, 2017 $ 203,560 $ 1,060,737 Total liabilities as of December 31, 2017 $ 157 $ 199,974 Revenue for the year ended December 31, 2017 $ (13,322 ) $ (25,283 ) Earnings for the year ended December 31, 2017 $ (13,383 ) $ (35,740 ) Biglari Holdings’ ownership interest 64.3 % 92.3 % Total assets as of December 31, 2016 $ 221,676 $ 1,109,465 Total liabilities as of December 31, 2016 $ 2,694 $ 201,460 Revenue for the year ended December 31, 2016 $ 37,098 $ 282,242 Earnings for the year ended December 31, 2016 $ 36,933 $ 273,736 Biglari Holdings’ ownership interest 63.6 % 91.8 % Equity in Investment Partnerships Lion Fund Lion Fund II Total assets as of December 31, 2023 $ 371,365 $ 373,302 Total liabilities as of December 31, 2023 $ 26,594 $ 185,024 Revenue for the year ended December 31, 2023 $ 48,242 $ 31,157 Earnings for the year ended December 31, 2023 $ 47,154 $ 21,135 Biglari Holdings’ ownership interest 89.7 % 86.8 % Total assets as of December 31, 2022 $ 285,071 $ 330,832 Total liabilities as of December 31, 2022 $ 10,517 $ 167,847 Revenue for the year ended December 31, 2022 $ (8,353) $ (79,397) Earnings for the year ended December 31, 2022 $ (8,690) $ (82,534) Biglari Holdings’ ownership interest 88.5 % 86.0 % Total assets as of December 31, 2021 $ 114,749 $ 564,022 Total liabilities as of December 31, 2021 $ 7,763 $ 130,417 Revenue for the year ended December 31, 2021 $ 20,068 $ 41,486 Earnings for the year ended December 31, 2021 $ 19,994 $ 40,621 Biglari Holdings’ ownership interest 62.7 % 93.9 % above summarized financial information of the investment partnerships, summarized above, includes investment income and unrealized gains and losses on investments.39 4.5. Other Current Assets December 31, 2018 2017 Investment in equity security and related derivative position $ 4,463 $ — Deferred commissions on gift cards sold by third parties 3,218 3,946 Prepaid contractual obligations 1,555 3,068 Assets held for sale — 207 Other current assets $ 9,236 $ 7,221 December 31, 2023 2022 Deferred commissions on gift cards sold by third parties $ 1,019 $ 1,454 Assets held for sale 773 4,700 Prepaid contractual obligations 5,593 4,341 Other current assets $ 7,385 $ 10,495 5.6. Property and Equipmentisare composed of the following. December 31, 2018 2017 Land $ 146,015 $ 156,506 Buildings 142,658 152,610 Land and leasehold improvements 158,938 162,652 Equipment 201,738 203,145 Construction in progress 1,703 1,782 651,052 676,695 Less accumulated depreciation and amortization (376,336 ) (380,895 ) Property and equipment, net $ 274,716 $ 295,800 DepreciationDecember 31, 2023 2022 Land $ 139,897 $ 143,313 Buildings 151,716 151,627 Land and leasehold improvements 149,795 151,496 Equipment 212,424 222,661 Oil and gas properties 145,065 144,888 Construction in progress 1,629 2,238 800,526 816,223 Less accumulated depreciation, depletion, and amortization (420,035) (415,498) Property and equipment, net $ 380,491 $ 400,725 2018, 20172023, 2022, and 20162021 was $18,646, $20,706$28,751, $28,879, and $21,635,$22,012, respectively.an impairmentimpairments to restaurant long-lived assets of $5,677, $1,789$3,947, $3,520, and $695$4,635 during 2018, 20172023, 2022, and 2016,2021, respectively. The fair value of the long-lived assets was determined based on Level 23 inputs using a discounted cash flow model and quoted prices for the properties. The fair valueassets impairedtransaction, a gain of $13,563 was not material for anyrecorded in 2023. Also during 2023, Steak n Shake recognized a net gain of $7,918 in connection with property sales, lease terminations, and asset disposals.applicable periods.ending aggregate carrying amount of asset retirement obligations is as follows.December 31 2023 2022 Beginning balance $ 14,645 $ 10,624 Acquired balance — 3,587 Liabilities settled (294) (106) Accretion expense 695 540 Asset retirement obligation $ 15,046 $ 14,645 6.8. Goodwill and Other Intangible Assets Restaurants Other Total Goodwill at December 31, 2015 $ 28,109 $ 11,913 $ 40,022 Change in foreign exchange rates during 2016 (19 ) — (19 ) Goodwill at December 31, 2016 $ 28,090 $ 11,913 $ 40,003 Change in foreign exchange rates during 2017 78 — 78 Goodwill at December 31, 2017 $ 28,168 $ 11,913 $ 40,081 Change in foreign exchange rates during 2018 (29 ) — (29 ) Goodwill at December 31, 2018 $ 28,139 $ 11,913 $ 40,052 Restaurants Insurance Total Balance as of December 31, 2021 Goodwill $ 28,134 $ 25,713 $ 53,847 Accumulated impairment losses (300) — (300) $ 27,834 $ 25,713 $ 53,547 Change in foreign exchange rates during 2022 (34) — (34) Balance as of December 31, 2022 $ 27,800 $ 25,713 $ 53,513 Change in foreign exchange rates during 2023 17 — 17 Balance as of December 31, 2023 $ 27,817 $ 25,713 $ 53,530 are required to assessevaluate goodwill and any indefinite-lived intangible assets for impairment annually, or more frequently if circumstances indicate impairment may have occurred. Goodwill and indefinite-lived intangible asset impairment occurs whenevaluations include determining the estimated fair values of our reporting units and indefinite-lived intangible assets. The key assumptions and inputs used in such determinations may include forecasting revenue and expenses, cash flows, and capital expenditures, as well as an appropriate discount rate and other inputs. Significant judgment by management is required in estimating the fair value of a reporting unit and in performing impairment reviews. Due to the inherent subjectivity and uncertainty in forecasting future cash flows and earnings over long periods of time, actual results may differ materially from the forecasts. If the carrying value of the indefinite-lived intangible asset exceeds fair value, the excess is charged to earnings as an impairment loss. If the carrying value of a reporting unit exceeds the estimated fair value of the reporting unit, then the excess, limited to the carrying amount of goodwill, is less than its carrying value. The valuation methodology and underlying financial information included in our determinationwill be charged to earnings as an impairment loss. GAAP allows entities testing for impairment the option of performing a qualitative assessment before calculating the fair value require significant management judgments. We use both market and income approachesof a reporting unit for the goodwill impairment test. For our 2023 annual goodwill impairment testing, we elected to derive fair value. The judgments in these two approaches include, but are not limited to, comparable market multiples, long-term projectionsperform qualitative assessments for our reporting units. No indicators of future financial performance, and the selection of appropriate discount rates used to determine the present value of future cash flows. Changes in such estimates or the application of alternative assumptions could produce significantly different results.impairment were noted. No impairment chargeswas recorded for goodwill were recordedour reporting units in 2018, 20172023 or 2016.40 Note 6. Goodwill and Other Intangible Assets(continued)Other AssetsOther intangible assets with indefinite lives are composed of the following. December 31, 2018 2017 Gross carrying amount Accumulated amortization Total Gross carrying amount Accumulated amortization Total Franchise agreement $ 5,310 $ (4,647 ) $ 663 $ 5,310 $ (4,116 ) $ 1,194 Other 810 (774 ) 36 810 (743 ) 67 Total 6,120 (5,421 ) 699 6,120 (4,859 ) 1,261 Intangible assets with indefinite lives: Trade names 15,876 — 15,876 15,876 — 15,876 Other assets with indefinite lives 11,539 — 11,539 9,427 — 9,427 Total intangible assets $ 33,535 $ (5,421 ) $ 28,114 $ 31,423 $ (4,859 ) $ 26,564 Trade Names Lease Rights Total Balance as of December 31, 2021 Intangibles $ 15,876 $ 11,315 $ 27,191 Accumulated impairment losses — (3,728) (3,728) $ 15,876 $ 7,587 $ 23,463 Change in foreign exchange rates during 2022 — (426) (426) Balance as of December 31, 2022 $ 15,876 $ 7,161 $ 23,037 Impairment — (20) (20) Change in foreign exchange rates during 2023 — 213 213 Balance as of December 31, 2023 $ 15,876 $ 7,354 $ 23,230 subject to amortizationwith indefinite lives consist of franchise agreements connected with the purchasetrade names and lease rights. During 2023, $20 of Western Sizzlin as well as rights to favorable leases related to prior acquisitions. These intangible assets are being amortized over their estimated weighted averageimpairment was recorded. No impairment was recorded in 2022 or 2021.7.9. Accounts Payable and Accrued Expenses December 31, 2018 2017 Accounts payable $ 41,967 $ 40,616 Gift card liability 22,685 27,436 Salaries, wages, and vacation 13,107 22,875 Deferred revenue 11,681 9,522 Taxes payable 11,214 10,571 Workers' compensation and other self-insurance accruals 8,394 9,047 Other 8,217 8,677 Accounts payable and accrued expenses $ 117,265 $ 128,744 December 31, 2023 2022 Accounts payable $ 22,448 $ 28,431 Gift cards and other marketing 7,089 12,028 Insurance accruals 2,565 6,012 Compensation 12,821 4,400 Deferred revenue 5,314 4,445 Taxes payable 11,050 14,896 Oil and gas payable 3,560 3,877 Other 1,896 4,527 Accounts payable and accrued expenses $ 66,743 $ 78,616 8. Other Liabilitiesfollowing. December 31, 2018 2017 Deferred rent expense $ 6,468 $ 6,726 Other 2,713 4,643 Other liabilities $ 9,181 $ 11,369 41 2023 2022 Balances at beginning of year: Gross liabilities $ 17,520 $ 14,993 Reinsurance recoverable on unpaid losses (715) (1,892) Net liabilities 16,805 13,101 Incurred losses and loss adjustment expenses: Current accident year 39,303 37,837 Prior accident years (3,634) (652) Total 35,669 37,185 Paid losses and loss adjustment expenses: Current accident year 30,554 27,415 Prior accident years 6,752 6,066 Total 37,306 33,481 Balances at December 31: Net liabilities 15,168 16,805 Reinsurance recoverable on unpaid losses 937 715 Gross liabilities $ 16,105 $ 17,520 9.10. Unpaid Losses and Loss Adjustment Expenses (continued)Incurred Losses and Loss Adjustment Expenses through December 31, Accident Year 2017* 2018* 2019* 2020* 2021* 2022* 2023 IBNR and Case Development Liabilities Cumulative Number of Reported Claims 2017 $ 29,627 $ 28,778 $ 28,895 $ 28,537 $ 28,189 $ 28,213 $ 28,171 $ 179 4,343 2018 26,576 26,650 26,455 26,385 26,328 26,194 145 3,762 2019 27,331 26,746 26,444 26,325 25,972 141 3,681 2020 26,415 25,118 24,305 23,804 323 3,662 2021 26,555 26,527 26,267 1,874 3,685 2022 34,356 32,137 3,399 3,876 2023 35,450 8,198 3,611 $ 197,995 Cumulative Paid Losses and Loss Adjustment Expenses through December 31, Accident Year 2017* 2018* 2019* 2020* 2021* 2022* 2023 2017 $ 22,293 $ 25,491 $ 26,991 $ 27,584 $ 27,815 $ 27,990 $ 27,992 2018 20,246 23,796 24,844 25,589 25,974 26,049 2019 20,755 23,787 24,647 25,357 25,831 2020 20,481 22,614 23,386 23,481 2021 19,649 22,800 24,393 2022 24,775 28,738 2023 27,252 Paid losses and loss adjustment expenses 183,736 Incurred less paid losses and loss adjustment expenses 14,259 Unpaid loss adjustment expenses 909 Net unpaid losses and loss adjustment expenses $ 15,168 2018 2017 2016 Current: Federal $ (1,688 ) $ 544 $ 6,329 State 1,204 816 1,998 Deferred (2,153 ) (64,321 ) 38,485 Total income taxes $ (2,637 ) $ (62,961 ) $ 46,812 Reconciliation of effective income tax: Tax at U.S. statutory rates $ 3,519 $ (4,512 ) $ 51,227 State income taxes, net of federal benefit 741 259 3,332 Tax rate changes (1,342 ) (51,707 ) — Federal income tax credits (4,587 ) (3,158 ) (4,692 ) Dividends received deduction (2,142 ) (6,304 ) (5,851 ) Valuation allowance 658 742 905 Foreign tax rate differences 349 1,598 2,249 Other 167 121 (358 ) Total income taxes $ (2,637 ) $ (62,961 ) $ 46,812 On December 22, 2017, new federal income tax legislation, the Tax Cuts and Jobs Act (“Act”), was signed into law. Effective January 1, 2018, the U.S. corporate federal statutory income tax rate was reduced from 35.0% to 21.0% and required re-measurement of deferred balances to the new statutory rates as of December 31, 2017.The Act also imposed a mandatory one-time transition tax on undistributed international earnings. We do not expect to have any additional tax liability related to a transition tax. 2023 2022 2021 Current: Federal $ 2,197 $ 1,935 $ 1,053 State 544 2,925 467 Deferred 6,567 (15,582) 5,269 Income tax expense (benefit) $ 9,308 $ (10,722) $ 6,789 Reconciliation of effective income tax: Tax at U.S. statutory rates $ 13,618 $ (9,036) $ 8,875 State income taxes, net of federal benefit 1,572 (555) 192 Federal income tax credits (1,309) (106) (864) Dividends received deduction (1,169) (1,183) (468) Valuation allowance 709 614 (723) 162(m) compensation limitation 1,506 — — Foreign tax rate differences (97) (124) (78) Abraxas tax attributes (5,660) — — Other 138 (332) (145) Income tax expense (benefit) $ 9,308 $ (10,722) $ 6,789 (losses) before income taxes derived from domestic operations during 2018, 20172023 were $67,736, losses before income taxes derived from domestic operations during 2022 were $40,624, and 2016earnings before income taxes derived from domestic operations during 2021 were $21,700, $(6,230) and $154,520, respectively.$43,886. Losses before income taxes derived from international operations during 2018, 20172023, 2022, and 20162021 were $4,945, $6,660$2,889, $2,403, and $8,257,$1,619, respectively.2018,2023, we had $341$348 of unrecognized tax benefits, including $43$48 of interest and penalties, which are included in other long-term liabilities in the consolidated balance sheet. As of December 31, 2017,2022, we had $357$99 of unrecognized tax benefits, including $29$13 of interest and penalties, which areis included in other long-term liabilities in the consolidated balance sheet. Our continuing practice is to recognize interest expense and penalties related to income tax matters in income tax expense. The unrecognized tax benefits of $341$348 would impact the effective income tax rate if recognized. Adjustments to the Company’s unrecognized tax benefit for gross increases for the current period tax position, gross decreases for prior period tax positions, and the lapse of statutestatutes of limitations during 2018, 20172023, 2022, and 20162021 were not significant.2015.2020. We believe we have certain state income tax exposures related to fiscal years 20142019 through 2018. Because of the expiration of the various state statutes of limitations for these fiscal years, it is possible that the total amount of unrecognized tax benefits will decrease by approximately $14 within 12 months.42 Note 9. Income Taxes(continued) December 31, 2018 2017 Deferred tax assets: Insurance reserves $ 1,816 $ 2,011 Compensation accruals 677 729 Gift card accruals 2,515 3,149 Net operating loss credit carryforward 5,547 5,273 Valuation allowance on net operating losses (4,978 ) (5,031 ) Income tax credit carryforward 4,965 5,707 Other 953 629 Total deferred tax assets 11,495 12,467 Deferred tax liabilities: Investments 92,743 95,324 Fixed asset basis difference 934 554 Goodwill and intangibles 4,689 4,990 Total deferred tax liabilities 98,366 100,868 Net deferred tax liability $ (86,871 ) $ (88,401 ) Receivables on the balance sheetDecember 31, 2023 2022 Deferred tax assets: Insurance reserves $ 1,734 $ 1,490 Compensation accruals 653 373 Gift card accruals 749 1,159 Net operating loss credit carryforward 19,840 12,597 Valuation allowance on net operating losses (14,643) (6,043) Deferred income 351 830 Bad debt reserve 667 1,104 Other 313 487 Total deferred tax assets 9,664 11,997 Deferred tax liabilities: Investment partnerships 27,896 23,643 Investments 288 (197) Goodwill and intangibles 16,350 16,027 Fixed assets and depletable assets basis difference 3,069 3,867 Total deferred tax liabilities 47,603 43,340 Net deferred tax liability $ (37,939) $ (31,343) receivablepayable of $2,022 and $751$980 as of December 31, 20182023, and 2017, respectively. Income taxes paid during 2018, 2017 and 2016 were $810, $3,211 and $6,961, respectively. Income tax refunds during 2018, 2017 and 2016 were $8, $0 and $233, respectively.10. Notes Payable and Other BorrowingsNotes payable and other borrowings include the following. December 31, 2018 2017 Current portion of notes payable and other borrowings Notes payable $ 2,200 $ 2,200 Unamortized original issue discount (334 ) (321 ) Unamortized debt issuance costs (609 ) (585 ) Obligations under leases 4,463 5,279 Western revolver — 175 Total current portion of notes payable and other borrowings $ 5,720 $ 6,748 Long-term notes payable and other borrowings Notes payable $ 181,498 $ 183,698 Unamortized original issue discount (438 ) (772 ) Unamortized debt issuance costs (796 ) (1,405 ) Obligations under leases 59,737 75,473 Total long-term notes payable and other borrowings $ 240,001 $ 256,994 Steak n Shake12. Lines of Credit FacilityMarch 19, 2014, Steak n Shake and its subsidiariesSeptember 13, 2022, Biglari Holdings entered into a credit agreement which provided for a senior secured term loan facility in an aggregate principal amountline of $220,000 and a senior secured revolving credit facility in an aggregate principal amount of up to $30,000. On October 27, 2017, Steak n Shake determined to end the use of its senior secured revolving credit facility. In 2017, Steak n Shake deposited cash to satisfy required collateral for casualty insurance previously collateralized by lettersThe line of credit issued through thewill be available on a revolving basis until September 13, 2024. The line of credit facility.43 Note 10. Notes Payable and Other Borrowings(continued)The term loan is scheduled to mature on March 19, 2021. It amortizes at an annual rate of 1.0% in equal quarterly installments, beginning June 30, 2014, at 0.25%includes customary covenants, as well as financial maintenance covenants. There was no balance of the original principal amountline of credit on December 31, 2023. The balance of the term loan, subject to mandatory prepayments from excess cash flow, asset salesline of credit was $10,000 on December 31, 2022. Our interest rate was 8.06% and other events described in the credit agreement. The balance will be due at maturity.Steak n Shake has the right to request an incremental term loan facility from participating lenders and/or eligible assignees at any time, up to an aggregate total principal amount not to exceed $70,000 if certain customary conditions within the credit agreement are met.Borrowings bear interest at a rate per annum equal to a base rate or a Eurodollar rate (minimum of 1%) plus an applicable margin. Interest6.53% on the term loanDecember 31, 2023 and 2022, respectively, which is based on a Eurodollar ratethe 30-day Secured Overnight Financing Rate plus an applicable margin2.73%.3.75% or on the prime rate plus an applicable margin of 2.75%. The interest rate on the term loan was 6.28% as of December 31, 2018.The credit agreement includes customary affirmative and negative covenants and events of default. Steak n Shake’s credit facility contains restrictions on its ability to pay dividends to Biglari Holdings.The term loan is secured by first priority security interests in substantially all the assets of Steak n Shake. Disruptions in debt capital markets that restrict access to funding when needed could adversely affect the results of operations, liquidity and capital resources of Steak n Shake. Biglari Holdings is not a guarantor under the credit facility.$500. As of December 31, 2018, $183,698 was outstanding under the term loan.Western Sizzlin RevolverAs of December 31, 2018,2023 and 2022, Western Sizzlin had no debt outstanding under its revolver.revolver.Expected principal paymentsfollowing.December 31, 2023 2022 Current portion of lease obligations Finance lease liabilities $ 1,258 $ 1,237 Finance obligations 4,826 5,161 Operating lease liabilities 8,771 10,583 Total current portion of lease obligations $ 14,855 $ 16,981 Long-term lease obligations Finance lease liabilities $ 3,581 $ 4,129 Finance obligations 56,471 58,868 Operating lease liabilities 26,337 28,847 Total long-term lease obligations $ 86,389 $ 91,844 notes payableoperating leases on a straight-line basis over the lease term. For finance leases, we recognize amortization expense on the right-of-use asset and interest expense on the lease liability over the lease term.
*Includes short-term leases, variable lease costs, and sublease income.2023 2022 2021 Finance lease costs: Amortization of right-of-use assets $ 949 $ 1,290 $ 1,576 Interest on lease liabilities 345 422 521 Operating lease costs* 284 2,736 1,119 Total lease costs $ 1,578 $ 4,448 $ 3,216 Year Ended December 31, 2023 2022 Cash paid for amounts included in the measurement of lease liabilities: Financing cash flows from finance leases $ 1,220 $ 1,396 Operating cash flows from finance leases $ 345 $ 421 Operating cash flows from operating leases $ 12,469 $ 12,946 December 31, 2023 2022 Finance leases: Property and equipment, net $ 3,574 $ 4,352 2023 Weighted-average remaining lease terms: Finance leases 4.73 years Operating leases 5.41 years Weighted-average discount rates: Finance leases 7.0% Operating leases 7.0% 2018,2023, are as follows.2019 $ 2,200 2020 2,200 2021 179,298 Total $ 183,698 Year Operating Leases Finance
Leases2024 $ 10,863 $ 1,552 2025 9,070 1,403 2026 6,551 1,063 2027 4,272 728 2028 3,451 337 After 2028 7,792 613 Total lease payments 41,999 5,696 Less interest 6,891 857 Total lease liabilities $ 35,108 $ 4,839 2023 2022 2021 Minimum rent $ 12,712 $ 14,333 $ 14,926 Contingent rent 73 105 137 Rent expense $ 12,785 $ 14,438 $ 15,063 fair valuecomponents of long-term debt, excluding capitalized lease obligations, was approximately $147,000 at December 31, 2018. The fair value of our debt was estimated based on quoted market prices. The fair value was determined to be a Level 3 fair value measurement.InterestInterest paid on debt and obligations under leasesincome are as follows. 2018 2017 2016 Interest paid on debt $ 10,655 $ 9,969 $ 10,508 Interest paid on obligations under leases $ 8,207 $ 9,132 $ 9,475 Note 11. Leased Assets2023 2022 2021 Operating lease income $ 16,343 $ 15,698 $ 13,173 Variable lease income 7,349 5,875 3,479 Total lease income $ 23,692 $ 21,573 $ 16,652 Lease CommitmentsWe lease certain physical facilities under non-cancelable lease agreements. These leases require the payment of real estate taxes, insurance and maintenance costs. Certain leased facilities, which are no longer operated but are subleased to third parties or franchisees, are classified below as non-operating properties. Minimum future rental payments for non-operating properties have not been reduced by minimum sublease rentals of $6,850 related to operating leases receivable under non-cancelable subleases. The property and equipment cost related to finance obligations and capital leasessubleases as of December 31, 2018 is as follows: $56,311 of buildings, $45,017 of land, $21,351 of land and leasehold improvements, $1,952 of equipment and $64,036 of accumulated depreciation.44 Note 11. Leased Assets and Lease Commitments(continued)On December 31, 2018, obligations under non-cancelable finance obligations, capital2023. Franchise partner leases and operatingsubleases are short-term leases (excluding real estate taxes, insurance and maintenance costs) requirehave been excluded from the following minimum future rental payments. Operating Leases Year Finance Obligations Capital Leases Total Operating Property Non-Operating Property 2019 $ 11,114 $ 55 $ 11,169 $ 17,914 $ 483 2020 8,040 55 8,095 16,691 554 2021 5,925 55 5,980 16,787 578 2022 2,951 5 2,956 15,603 599 2023 1,587 — 1,587 14,071 539 After 2023 1,673 — 1,673 36,709 1,790 Total minimum future rental payments 31,290 170 31,460 $ 117,775 $ 4,543 Less amount representing interest 18,004 60 18,064 Total principal obligations under leases 13,286 110 13,396 Less current portion 4,433 30 4,463 Non-current principal obligations under leases 8,853 80 8,933 Residual value at end of lease term 50,744 60 50,804 Obligations under leases $ 59,597 $ 140 $ 59,737 Rent expense is presented below. 2018 2017 2016 Minimum rent $ 20,158 $ 18,157 $ 17,906 Contingent rent 1,470 1,839 1,841 Rent expense $ 21,628 $ 19,996 $ 19,747 Non-cancellable finance obligations were created when the Company entered into certain build-to-suit or sale leaseback arrangements. As a result of continuing involvement in the underlying leases (generally due to right of substitution or purchase option provisions of the leases), the Company accounts for the leases as financings.Operating Leases Year Subleases Owned Properties 2024 $ 622 $ 396 2025 544 404 2026 225 407 2027 206 415 2028 86 423 After 2028 — 2,435 Total future minimum receipts $ 1,683 $ 4,480 12.14. Related Party TransactionsOn September 15,. under which the Biglari Entities provide business and administrative related services to the Company. The Biglari Entities are owned by Mr. Biglari. The services agreement replaces the shared services agreement between the Company and Biglari Capital dated July 1, 2013. The services agreement was executed in connectionhas a rolling five-year term, with a review of the relationships and transactions between the Company and Biglari Capital. After careful consideration, including an assessment by a public accounting firm of administrative-related costs incurred by the Company in connection with its investments, the Company’s Governance, Compensation and Nominating Committee, comprised solely of independent board members, approved the services agreement. Under the terms of the services agreement, the Company will no longer provide business and administrative-related services to Biglari Capital. Instead, the Biglari Entities will assume the responsibility to provide the services and the Company will pay a fixed feeannual adjustments to the Biglari Entities.The services agreement has a five-year term, effective on October 1, 2017.fixed fee. The fixed fee isincreased from $700 per month for the first year with adjustmentsto $800 per month in years two through five.December 2023. The fixed fee had not been adjusted since its inception in October 2017.by the Company.2018,2023, the Company’s investments in The Lion Fund, L.P., and The Lion Fund II, L.P., had a fair value of $715,102.45 Note 12. Related Party Transactions(continued) 2018 2017 2016 Contributions of cash $ 39,040 $ 3,707 $ 14,150 Contributions of securities — — 5,682 Distributions of cash (68,700 ) (9,395 ) (26,265 ) Distributions of securities — — (4,463 ) $ (29,660 ) $ (5,688 ) $ (10,896 ) 2023 2022 2021 Contributions $ 45,030 $ 59,877 $ 12,300 Distributions (14,500) (70,700) (180,170) $ 30,530 $ (10,823) $ (167,870) will earn an incentive reallocation fee for the Company’s investments equal to 25% of the net profits above a hurdle rate of 6% over the previous high-water mark. Our policy is to accrue an estimated incentive fee throughout the year. In 2018 and 2017,There were no incentive reallocation was earned. Based on Biglari Holdings’ $280,563 of earnings from the investment partnerships for 2016, the total incentive reallocation from Biglari Holdings to Biglari Capital was $31,628, including $11,514 associated with gainsreallocations in 2023, 2022, or 2021. Gains on the Company’s common stock.AmendmentDuring 2013, Biglari Holdings andestablishes a performance-based annual incentive payment for Mr. Biglari entered intocontingent upon the growth in adjusted equity in each year attributable to our operating businesses. In order for Mr. Biglari to receive any incentive, our operating businesses must achieve an amendment toannual increase in shareholders’ equity in excess of 6% (the “hurdle rate”) above the Incentive Agreement to exclude earnings byprevious highest level (the “high-water mark”). Mr. Biglari will receive 25% of any incremental book value created above the investment partnerships fromhigh-water mark plus the calculation of Mr. Biglari’s incentive fee. No incentive fees were earned in 2018 and 2016.hurdle rate. In 2017,2023, Mr. Biglari earned an incentive fee of $7,353. Under the Amended$7,271. The incentive fee will be paid in 2024 and Restated Incentive Agreement Mr. Biglari would receive a paymentis recorded as accrued compensation within accounts payable and accrued expenses as of approximately $7,000 if an event occurred entitling him to a severance payment.License AgreementOn January 11, 2013, the Company entered into a Trademark License Agreement (the “License Agreement”) with Mr. Biglari. The License Agreement was unanimously approved by the Governance, Nominating and Compensation Committee (comprised of independent members of the Company’s Board of Directors). In addition, the license under the License Agreement is provided on a royalty-free basis in the absence of specified extraordinary events described below. Accordingly, the Company and its subsidiaries have paid no royalties to Mr. Biglari under the License Agreement since its inception.Under the License Agreement, Mr. Biglari granted to the Company an exclusive license to use the Biglari and Biglari Holdings names (the “Licensed Marks”) in association with various products and services (collectively the “Products and Services”). Upon (a) the expiration of twenty years from the date of the License Agreement (subject to extension as provided in the License Agreement), (b) Mr. Biglari’s death, (c) the termination of Mr. Biglari’s employment by the Company for Cause (as defined in the License Agreement), or (d) Mr. Biglari’s resignation from his employment with the Company absent an Involuntary Termination Event (as defined in the License Agreement), the Licensed Marks for the Products and Services will transfer from Mr. Biglari to the Company, without any compensation, if the Company is continuing to use the Licensed Marks in the ordinary course of its business. Otherwise, the rights will revert to Mr. Biglari.If (i) a Change of Control (as defined in the License Agreement) of the Company; (ii) the termination of Mr. Biglari’s employment by the Company without Cause; or (iii) Mr. Biglari’s resignation from his employment with the Company due to an Involuntary Termination Event (each, a “Triggering Event”) were to occur, Mr. Biglari would be entitled to receive a 2.5% royalty on “Revenues” with respect to the “Royalty Period.” The royalty payment to Mr. Biglari would not apply to all revenues received by Biglari Holdings and its subsidiaries nor would it apply retrospectively (i.e., to revenues received with respect to the period prior to the Triggering Event). The royalty would apply to revenues recorded by the Company on an accrual basis under GAAP, solely with respect to the defined period of time after the Triggering Event equal to the Royalty Period, from a covered Product, Service or business that (1) has used the Biglari Holdings or Biglari name at any time during the term of the License Agreement, whether prior to or after a Triggering Event, or (2) the Company has specifically identified, prior to a Triggering Event, will use the name Biglari or Biglari Holdings.46 Note 12. Related Party Transactions(continued)“Revenues” means all revenues received, on an accrual basis under GAAP, by the Company, its subsidiaries and affiliates from the following: (1) all Products and Services covered by the License Agreement bearing or associated with the names Biglari and Biglari Holdings at any time (whether prior to or after a Triggering Event). This category would include, without limitation, the use of Biglari or Biglari Holdings in the public name of a business providing any covered Product or Service; and (2) all covered Products, Services and businesses that the Company has specifically identified, prior to a Triggering Event, will bear, use or be associated with the name Biglari or Biglari Holdings.The Governance, Nominating and Compensation Committee unanimously approved the association of the Biglari name and mark with all of Steak n Shake’s restaurants (including Company operated and franchise locations), products and brands. On May 14, 2013, the Company, Steak n Shake, LLC and Steak n Shake Enterprises, Inc. entered into a Trademark Sublicense Agreement in connection therewith. Accordingly, revenues received by the Company, its subsidiaries and affiliates from Steak n Shake’s restaurants, products and brands would come within the definition of Revenues for purposes of the License Agreement.The “Royalty Period” is a defined period of time, after the Triggering Event, calculated as follows: (i) if, following three months after a Triggering Event, the Company or any of its subsidiaries or affiliates continues to use the Biglari or Biglari Holdings name in connection with any covered Product or Service, or continues to use Biglari as part of its corporate or public company name, then the Royalty Period will equal (a) the period of time during which the Company or any of its subsidiaries or affiliates continues any such use, plus (b) a period of time after the Company, its subsidiaries and affiliates have ceased all uses of the names Biglari and Biglari Holdings equal to the length of the term of the License Agreement prior to the Triggering Event, plus three years. As an example, if a Triggering Event occurs five years after the date of the License Agreement, and the Company ceases all uses of the Biglari and Biglari Holdings names two years after the Triggering Event, the Royalty Period will equal a total of ten years (the sum of two years after the Triggering Event during which the Biglari and Biglari Holdings names are being used, plus a period of time equal to the five years prior to the Triggering Event, plus three years); or (ii) if the Company, its subsidiaries and affiliates cease all uses of the Biglari and Biglari Holdings names within three months after a Triggering Event, then the Royalty Period will equal the length of the term of the License Agreement prior to the Triggering Event, plus three years. As an example, if a Triggering Event occurs five years after the date of the License Agreement, and the Company ceases all uses of the Biglari and Biglari Holdings names two months after the Triggering Event, the Royalty Period will equal a total of eight years (the sum of the period of time equal to the five years prior to the Triggering Event, plus three years). Notwithstanding the above methods of determining the Royalty Period, the minimum Royalty Period is five years after a Triggering Event.The Company and its subsidiaries have paid no royalties to Mr. Biglari under the License Agreement since its execution.The actual amount of royalties paid to Mr. Biglari following the occurrence of a Triggering Event (as defined in the License Agreement) would depend on the Company’s revenues during the applicable period following the Triggering Event, and, therefore, depends on material assumptions and estimates regarding future operations and revenues. Assuming for purposes of illustration a Triggering Event occurred on December 31, 2018, using revenue from 2018 as an estimate of future revenue and calculated according to terms of the License Agreement, Mr. Biglari would receive approximately $19,000 in royalty payments annually. At a minimum, the royalties would be2023. No incentive fees were earned on revenue generated from January 1, 2019 through December 21, 2025. Royalty payments beyond the minimum period would be subject to the licensee’s continued use of the licensed marks.13.15. Commitments and ContingenciesOn January 29, 2018, a shareholder of the Company filed a purported class action complaint against the Company and the members of our Board of Directors in the Superior Court of Hamilton County, Indiana. The shareholder generally alleges claims of breach of fiduciary duty by the members of our Board of Directors and unjust enrichment to Mr. Biglari as a result of the issuance of a dual class structure.47 Note 13. Commitments and Contingencies(continued)On March 26, 2018, a shareholder of the Company filed a purported class action complaint against the Company and the members of our Board of Directors in the Superior Court of Hamilton County, Indiana. This shareholder generally alleges claims of breach of fiduciary duty by the members of our Board of Directors. This shareholder sought to enjoin the shareholder vote on April 26, 2018 to approve the issuance of the dual class structure. On April 16, 2018, the shareholders withdrew their motions to enjoin the shareholder vote on April 26, 2018.On May 17, 2018, the shareholders who filed the January 29, 2018 complaint and the March 26, 2018 complaint filed a new, consolidated complaint against the Company and the members of our Board of Directors in the Superior Court of Hamilton County, Indiana. The shareholders generally allege claims of breach of fiduciary duty by the members of our Board of Directors and unjust enrichment to Mr. Biglari arising out of the issuance of the dual class structure. The shareholders seek, for themselves and on behalf of all other shareholders as a class, a declaration that the defendants breached their duty to the shareholders and the class, and to recover unspecified damages, pre-judgment and post-judgment interest, and an award of their attorneys’ fees and other costs.On December 14, 2018, the Judge of the Superior Court of Hamilton County, Indiana issued an order granting the Company’s motion to dismiss the shareholders’ lawsuits. On January 11, 2019, the shareholders filed an appeal of the Judge’s order dismissing the lawsuits.The Company believes the claims in each case are without merit and intends to defend these cases vigorously.14.16. Fair Value of Financial Assets48 Note 14. Fair Value of Financial Assets(continued)sheet:withinas Level 1 or Level 2 of the fair value hierarchy depending on the instrument.Derivative instruments: Options related to equity securities are marked to market each reporting period and are classified within Level 2 of the fair value hierarchy.20182023 and 20172022, the fair values of financial assets were as follows. December 31, 2018 2017 Level 1 Level 2 Level 3 Total Level 1 Level 2 Level 3 Total Assets Cash equivalents $ 21,448 $ — $ — $ 21,448 $ 5,785 $ — $ — $ 5,785 Equity securities: Consumer goods 1,708 4,100 — 5,808 2,445 — — 2,445 Bonds 32,404 — — 32,404 — 25,901 — 25,901 Options on equity securities — 2,775 — 2,775 — 2,018 — 2,018 Non-qualified deferred compensation plan investments 2,149 — — 2,149 3,459 — — 3,459 Total assets at fair value $ 57,709 $ 6,875 $ — $ 64,584 $ 11,689 $ 27,919 $ — $ 39,608 December 31, 2023 2022 Level 1 Level 2 Level 3 Total Level 1 Level 2 Level 3 Total Assets Cash equivalents $ 2,374 $ — $ — $ 2,374 $ 17,608 $ — $ — $ 17,608 Equity securities: Consumer goods 26,660 — — 26,660 17,274 — — 17,274 Other 3,171 — — 3,171 2,031 — — 2,031 Bonds: Government 61,536 — — 61,536 48,456 — — 48,456 Corporate 3,199 — — 3,199 2,199 — — 2,199 Non-qualified deferred compensation plan investments — — — — 699 — — 699 Total assets at fair value $ 96,940 $ — $ — $ 96,940 $ 88,267 $ — $ — $ 88,267 ourthe valuation techniques used to measure fair values on a recurring basis.Note 15. Accumulated Other Comprehensive IncomeChanges in the balances of each component of accumulated other comprehensive income (loss), net of tax, were as follows. 2018 2017 Foreign Currency Translation Adjustments Investment
Gain (Loss) Accumulated
Other
Comprehensive
Loss Foreign Currency Translation Adjustments Investment
Gain (Loss) Accumulated
Other
Comprehensive
Loss Beginning Balance $ (1,462 ) $ 58 $ (1,404 ) $ (3,447 ) $ (137 ) $ (3,584 ) Other comprehensive income (loss) before reclassifications — — 195 195 Reclassification to (earnings) loss (58 ) (58 ) Foreign currency translation (1,054 ) (1,054 ) 1,985 1,985 Ending Balance $ (2,516 ) $ — $ (2,516 ) $ (1,462 ) $ 58 $ (1,404 ) 49 Note 15. Accumulated Other Comprehensive Income(continued) 2016 Foreign Currency Translation Adjustments Investment
Gain (Loss) Accumulated
Other
Comprehensive
Loss Beginning Balance $ (2,992 ) $ (687 ) $ (3,679 ) Other comprehensive income (loss) before reclassifications 357 357 Reclassification to (earnings) loss 193 193 Foreign currency translation (455 ) (455 ) Ending Balance $ (3,447 ) $ (137 ) $ (3,584 ) Reclassifications made from accumulated other comprehensive income to the statement of earnings were $58 of income to earnings during 2018 and $193 of losses to earnings during 2016; there were no reclassifications from accumulated other comprehensive income to earnings during 2017.16.17. Business Segment Reporting First Guard and Maxim. Other business activities not specifically identified with reportable business segments are presented in “other” within total operating businesses.under corporate and other. We report our earnings from investment partnerships separate from our corporate expenses. We assess and measure segment operating results based on segment earnings as disclosed below. Segment earnings from operations are neither necessarily indicative of cash available to fund cash requirements nor synonymous with cash flow from operations. The tabular information that follows shows data of our reportable segments reconciled to amounts reflected in the consolidated financial statements.Revenue for 2018, 2017 and 2016 were as follows. Revenue 2018 2017 2016 Operating Businesses: Restaurant Operations: Steak n Shake $ 760,565 $ 792,827 $ 804,423 Western 15,125 14,326 13,491 Total Restaurant Operations 775,690 807,153 817,914 First Guard 27,628 24,943 22,997 Maxim 6,576 7,708 9,165 $ 809,894 $ 839,804 $ 850,076 50 16.17. Business Segment Reporting(continued)Earnings (loss) before income taxes for 2018, 2017 and 2016 were as follows. Earnings (Loss) Before Income Taxes 2018 2017 2016 Operating Businesses: Restaurant Operations: Steak n Shake $ (10,657 ) $ 431 $ 34,717 Western 2,046 1,860 2,506 Total Restaurant Operations (8,611 ) 2,291 37,223 First Guard 6,215 4,770 5,135 Maxim 1,068 (439 ) (10,078 ) Other 635 669 94 Total Operating Businesses (693 ) 7,291 32,374 Corporate and investments: Corporate (11,286 ) (16,106 ) (10,241 ) Investment partnership gains 40,411 6,965 135,580 Total corporate 29,125 (9,141 ) 125,339 Interest expense on notes payable and other borrowings (11,677 ) (11,040 ) (11,450 ) $ 16,755 $ (12,890 ) $ 146,263 capital expendituresdata for 2018, 2017 and 2016each of the three most recent years is presented in the tables thatwhich follow. Capital Expenditures 2018 2017 2016 Operating Businesses: Restaurant Operations: Steak n Shake $ 14,982 $ 7,565 $ 8,257 Western 61 410 306 Total Restaurant Operations 15,043 7,975 8,563 First Guard 236 43 7 Maxim — — 42 Other 14 16 51 Total Operating Businesses 15,293 8,034 8,663 Corporate — — — Consolidated results $ 15,293 $ 8,034 $ 8,663 51 Revenue 2023 2022 2021 Operating Businesses: Restaurant Operations: Steak n Shake $ 239,956 $ 231,820 $ 263,135 Western Sizzlin 10,901 9,748 8,155 Total Restaurant Operations 250,857 241,568 271,290 Insurance Operations: Underwriting: First Guard 36,917 35,914 33,521 Southern Pioneer 24,308 24,035 21,890 Investment income and other 6,047 4,591 3,198 Total Insurance Operations 67,272 64,540 58,609 Oil and Gas Operations: Abraxas Petroleum 27,576 11,455 — Southern Oil 17,495 46,091 33,004 Total Oil and Gas Operations 45,071 57,546 33,004 Maxim 2,118 4,577 3,203 $ 365,318 $ 368,231 $ 366,106 16.17. Business Segment Reporting(continued)Earnings (Loss) Before Income Taxes 2023 2022 2021 Operating Businesses: Restaurant Operations: Steak n Shake $ 26,170 $ 11,478 $ 13,524 Western Sizzlin 1,793 1,484 931 Total Restaurant Operations 27,963 12,962 14,455 Insurance Operations: Underwriting: First Guard 9,492 6,578 10,573 Southern Pioneer (1,038) (1,277) 1,744 Investment income and other 4,629 4,603 2,118 Total Insurance Operations 13,083 9,904 14,435 Oil and Gas Operations: Abraxas Petroleum 22,410 652 — Southern Oil 3,356 24,539 9,713 Total Oil and Gas Operations 25,766 25,191 9,713 Maxim 11 1,760 814 Interest expense not allocated to segments (681) (399) (1,121) Operating Businesses 66,142 49,418 38,296 Corporate and other (22,946) (13,099) (13,383) Investment gains (losses) 2,211 (3,393) 6,401 Investment partnership gains (losses) 19,440 (75,953) 10,953 $ 64,847 $ (43,027) $ 42,267 Capital Expenditures 2023 2022 2021 Operating Businesses: Restaurant $ 21,294 $ 24,470 $ 60,296 Insurance 309 1,558 1,451 Oil and Gas 544 906 996 Operating Businesses 22,147 26,934 62,743 Corporate and other 1,258 2,812 1,806 $ 23,405 $ 29,746 $ 64,549 Depreciation, Depletion, and Amortization 2023 2022 2021 Operating Businesses: Restaurant $ 27,031 $ 27,496 $ 21,484 Insurance 339 193 176 Oil and Gas 10,339 8,013 8,073 Operating Businesses 37,709 35,702 29,733 Corporate and other 1,270 741 317 $ 38,979 $ 36,443 $ 30,050 depreciation and amortization captions for 2018, 2017 and 2016 is presented in the tables that follow. Depreciation and Amortization 2018 2017 2016 Operating Businesses: Restaurant Operations: Steak n Shake $ 18,180 $ 19,987 $ 20,968 Western 651 636 605 Total Restaurant Operations 18,831 20,623 21,573 First Guard 76 56 64 Maxim 27 50 409 Other 287 287 431 Total Operating Businesses 19,221 21,016 22,477 Corporate 97 432 448 Consolidated results $ 19,318 $ 21,448 $ 22,925 A disaggregation of our consolidated asset captionsassets is presented in the table that follows. Identifiable Assets December 31, 2018 2017 Reportable segments: Restaurant Operations: Steak n Shake $ 330,100 $ 373,654 Western 16,444 17,027 Total Restaurant Operations 346,544 390,681 First Guard 51,565 46,693 Maxim 18,143 19,155 Other 19,774 20,514 Corporate 35,987 20,520 Investment partnerships 557,480 566,021 Total assets $ 1,029,493 $ 1,063,584 52 Identifiable Assets December 31, 2023 2022 Reportable segments: Restaurant Operations: Steak n Shake $ 325,229 $ 341,199 Western Sizzlin 20,296 19,431 Total Restaurant Operations 345,525 360,630 Insurance Operations: First Guard 67,204 58,997 Southern Pioneer 76,324 75,373 Total Insurance Operations 143,528 134,370 Oil and Gas Operations: Abraxas Petroleum 66,155 81,339 Southern Oil 43,644 49,416 Total Oil and Gas Operations 109,799 130,755 Maxim 16,056 16,093 Corporate 35,411 30,832 Investment partnerships 199,103 155,794 $ 849,422 $ 828,474 Note 17. Quarterly Financial Data(Unaudited) 1stQuarter 2ndQuarter 3rdQuarter 4thQuarter For the year ended December 31, 2018 Total revenues $ 202,225 $ 208,739 $ 203,582 $ 195,348 Gross profit 36,430 42,727 36,153 33,145 Costs and expenses 203,391 203,778 204,518 201,979 Earnings (loss) before income taxes (2,611 ) (8,429 ) (24,902 ) 52,697 Net earnings (loss) (1,814 ) (7,539 ) (13,703 ) 42,448 Net earnings (loss) per equivalent Class A share $ (5.15 ) $ (21.73 ) $ (39.50 ) $ 122.53 For the year ended December 31, 2017 Total revenues $ 203,393 $ 212,954 $ 214,234 $ 209,223 Gross profit 39,582 39,992 36,664 36,285 Costs and expenses 198,918 210,050 215,327 215,242 Earnings (loss) before income taxes (25,597 ) 35,043 (49,926 ) 27,590 Net earnings (loss) (15,821 ) 21,126 (24,700 ) 69,466 Net earnings (loss) per equivalent Class A share $ (42.72 ) $ 57.27 $ (66.96 ) $ 190.05 We define gross profit as net revenue less restaurant cost of sales, media cost of sales, and insurance losses and underwriting expenses, which excludes depreciation and amortization. Capital expendituresaccounts payablethe following table.2023 2022 2021 Cash paid during the year for: Interest on debt $ 710 $ 359 $ 994 Interest on obligations under leases 5,114 5,493 6,039 Income taxes 5,677 1,092 4,532 Non-cash investing and financing activities Capital expenditures in accounts payable 2,077 1,897 8,733 Finance lease additions 694 — 733 Finance lease retirements — — 1,216 2018, 20172023. All proved oil and 2016 were $1,776, $1,036natural gas reserves are located in the United States, primarily offshore in the shallow waters of the Gulf of Mexico and $480, respectively.In 2018, we had new capital lease obligations of $1,000 and lease retirements of $11,557. In 2017, we had new capital lease obligations of $1,952 and lease retirements of $5,030. During 2016, we had new capital lease obligations of $258 and lease retirements of $1,006.In 2016,in the Company made a non-cash contribution of securities of $5,682 to the investment partnerships and received a non-cash distribution of securities of $4,463 from the investment partnerships.53 Oil (MBbl) Gas (MMcf) Liquids (MBbl) MBOE Total proved reserves at December 31, 2021 2,361 26,544 — 6,785 Revisions (355) (3,288) — (903) Extensions — — — — Acquisition of reserves 3,415 19,334 1,550 8,188 Production (450) (2,341) (42) (882) Total proved reserves at December 31, 2022 4,971 40,249 1,508 13,188 Revisions (512) (14,934) (42) (3,043) Extensions 219 470 66 362 Acquisition of reserves — — — — Production (542) (2,181) (111) (1,016) Total proved reserves at December 31, 2023 4,136 23,604 1,421 9,491 Proved developed reserves December 31, 2023 3,534 21,395 1,355 8,455 December 31, 2022 4,507 32,132 1,508 11,371 Proved undeveloped reserves December 31, 2023 602 2,209 66 1,036 December 31, 2022 464 8,117 — 1,817 December 31, 2023 December 31, 2022 Future cash inflows $ 367,867 $ 728,382 Future production costs (172,239) (288,816) Future development and abandonment costs (28,533) (36,719) Future income tax expense (22,919) (69,999) Future net cash flows 144,176 332,848 10% annual discount for estimated timing of cash flows (51,727) (122,781) Standardized measure of discounted future net cash flows $ 92,449 $ 210,067 Standardized measure at December 31, 2021 $ 77,759 Net change in prices and production costs 58,439 Net change in future development costs 104 Sales of oil and natural gas, net of production expenses (41,859) Acquisition of reserves 141,051 Revisions of previous quantity estimates (9,072) Net change in taxes (26,456) Accretion of discount 9,862 Changes in timing and other 239 Standardized measure at December 31, 2022 $ 210,067 Net change in prices and production costs (86,323) Net change in future development costs (101) Sales of oil and natural gas, net of production expenses (27,706) Extensions 8,836 Revisions of previous quantity estimates (59,164) Net change in taxes 30,792 Accretion of discount 22,641 Changes in timing and other (6,593) Standardized measure at December 31, 2023 $ 92,449 Item 9.Changes in and Disagreements with Accountants on Accounting and Financial DisclosureItem 9A.Controls and Procedures2018.have beenwere no changes in our internal control over financial reporting that occurred during the quarter ended December 31, 20182023, that have materially affected, or that are reasonably likely to materially affect, our internal control over financial reporting.Management20182023, as required by the Securities Exchange Act of 1934 Rule 13a-15(c). In making this assessment, we used the criteria set forth in the framework in Internal Control—Integrated Framework (2013) issued by the Committee of Sponsoring Organizations of the Treadway Commission. Based on our evaluation under the framework in Internal Control—Integrated Framework (2013), our management concluded that our internal control over financial reporting was effective as of December 31, 2018.20182023, has been audited by Deloitte & Touche LLP, an independent registered public accounting firm, as stated in their report which is included herein.23, 201924, 2024Item 9B.Other InformationItem 10.Directors, Executive Officers and Corporate GovernanceItem 11.Executive CompensationItem 12.Security Ownership of Certain Beneficial Owners and Management and Related Stockholder MattersItem 13.Certain Relationships and Related Transactions, and Director IndependenceItem 14.Principal Accountant Fees and Services20192024 Annual Meeting of Shareholders, to be filed on or before April 25, 2019,17, 2024, and such information is incorporated herein by reference.54 Item 15.Exhibits and Financial Statement SchedulesPAGE Reports of Independent Registered Public Accounting Firm (PCAOB ID No 34) 25-2625-27Consolidated Balance Sheets 2728Consolidated Statements of Earnings 2829Consolidated Statements of Comprehensive Income 2830Consolidated Statements of Cash Flows 2931Consolidated Statements of Changes in Shareholders’ Equity 3032Notes to Consolidated Financial Statements 3133Management’s Report on Internal Control over Financial Reporting 5458(b)Exhibits55 Item 16.Form 10-K Summary56 23, 2019.24, 2024.By: Biglari Holdings inc.By:/s/ Bruce LewisBruce Lewis
Controller23, 2019.24, 2024.Signature Title SignatureTitle/s/ Sardar BiglariSARDAR BIGLARIChairman of the Board and Chief Executive Officer (Principal Executive Officer) Sardar Biglari /s/ Bruce LewisBRUCE LEWISController (Principal Financial and Accounting Officer) Bruce Lewis /s/ JOHN G. CARDWELL Director John G. Cardwell /s/ PHILIP COOLEY Director - Vice Chairman Philip Cooley /s/ Philip CooleyKENNETH R. COOPERDirector Philip CooleyKenneth R. Cooper/s/ RUTH J. PERSON Director /s/ Ruth J. Person/s/ EDMUND B. CAMPBELL, III Director Ruth J. PersonEdmund B. Campbell, III/s/ Kenneth R. CooperDirectorKenneth R. Cooper/s/ James P. MastrianDirectorJames P. Mastrian