TABLE OF CONTENTS
| PART I | ||||||||||||||
| Item | Business | 1 | ||||||||||||
| Item | Risk Factors | 2 | ||||||||||||
| Item 1B | Unresolved Staff Comments | 4 | ||||||||||||
| Item 2 | Properties | 4 | ||||||||||||
| Item 3 | Legal Proceedings | 4 | ||||||||||||
| Item 4 | Submission of Matters to a Vote of Security Holders | 5 | ||||||||||||
| PART II | ||||||||||||||
| Item 5 | Market for the Company’s Common Equity and Related Stockholder Matters and Issuer | 6 | ||||||||||||
| Item 6 | Selected Financial Data | 7 | ||||||||||||
| Item 7 | Management’s Discussion and Analysis of Financial Condition and Results of Operations | 7 | ||||||||||||
| Item 7A | Quantitative and Qualitative Disclosures | 21 | ||||||||||||
| Item 8 | Consolidated Financial Statements and Supplementary Data | 22 | ||||||||||||
| Item 9 | Changes | 63 | ||||||||||||
| Item 9A | Controls and Procedures | 63 | ||||||||||||
| Item 9B | Other Information | 63 | ||||||||||||
| PART III | ||||||||||||||
| Item | Directors, Executive Officers and Corporate Goverance | 64 | ||||||||||||
| Item 11 | Executive Compensation | 64 | ||||||||||||
| Item 12 | Security Ownership of Certain Beneficial Owners and Management and Related Stockholder | 64 | ||||||||||||
| Item 13 | Certain Relationships and Related Transactions, and Director Independence | 64 | ||||||||||||
| Item 14 | Principal Accountant Fees and Services | 64 | ||||||||||||
| PART IV | ||||||||||||||
| Item 15 | Exhibits and Financial Statement Schedules | 65 | ||||||||||||
PART I
Item 1. Business
General
The Certification of the Chief Executive Officer required by Section 303A.12(a) of The New York Stock Exchange Listing Standards relating to the Company’s compliance with The New York Stock Exchange Corporate Governance Listing Standards was submitted to The New York Stock Exchange on June 2, 2006.
Information Regarding Business Segments and Geographic Areas
Employees
Competition
Merchandise Purchases
1
Item 1A. Risk Factors
The statements contained in this Annual Report on Form 10-K and incorporated by reference (“Annual Report”) that are not historical facts, including, but not limited to, statements regarding our expected financial position, business and financing plans found in “Item 1. Business” and “Item 7. Management’s Discussion and Analysis of Financial Condition and Results of Operations,” constitute “forward-looking statements” within the meaning of the Private Securities Litigation Reform Act of 1995. The words “may,” “believes,” “expects,” “plans,” “intends,” “anticipates” and similar expressions identify forward-looking statements. The actual results of the future events described in these forward-looking statements could differ materially from those stated in the forward-looking statements.
Our actual results may differ materially due to the risks and uncertainties discussed in this Annual Report, including those discussed below. Additional risks and uncertainties that we do not presently know about or that we currently consider to be insignificant may also affect our business operations and financial performance. Accordingly, readers of the Annual Report should consider these risks and uncertainties in evaluating the information and are cautioned not to place undue reliance on the forward-looking statements contained herein. We undertake no obligation to update or revise publicly any forward-looking statements, whether as a result of new information, future events or otherwise.
The industry in which we operate is dependent upon fashion trends, customer preferences and other fashion-related factors.
The athletic footwear and apparel industry is subject to changing fashion trends and customer preferences. We cannot guarantee that our merchandise selection will accurately reflect customer preferences when it is offered for sale or that we will be able to identify and respond quickly to fashion changes, particularly given the long lead times for ordering much of our merchandise from vendors. For example, we order athletic footwear four to six months prior to delivery to our stores. If we fail to anticipate accurately either the market for the merchandise in our stores or our customers’ purchasing habits, we may be forced to rely on markdowns or promotional sales to dispose of excess, slow moving inventory, which could have a material adverse effect on our business, financial condition, and results of operations.
A substantial portion of our highest margin sales are to young males (ages 12–25), many of whom we believe purchase athletic footwear and licensed apparel as a fashion statement and are frequent purchasers of athletic footwear. Any shift in fashion trends that would make athletic footwear or licensed apparel less attractive to these customers could have a material adverse effect on our business, financial condition, and results of operations.
The businesses in which we operate are highly competitive.
The retail athletic footwear and apparel business is highly competitive with relatively low barriers to entry. Our athletic footwear and apparel operations compete primarily with athletic footwear specialty stores, sporting goods stores and superstores, department stores, discount stores, traditional shoe stores, and mass merchandisers, many of which are units of national or regional chains that have significant financial and marketing resources. The principal competitive factors in our markets are price, quality, selection of merchandise, reputation, store location, advertising, and customer service. We cannot assure you that we will continue to be able to compete successfully against existing or future competitors. Our expansion into markets served by our competitors and entry of new competitors or expansion of existing competitors into our markets could have a material adverse effect on our business, financial condition, and results of operations.
Although we sell merchandise via the Internet, a significant shift in customer buying patterns to purchasing athletic footwear, athletic apparel, and sporting goods via the Internet could have a material adverse effect on our business results. In addition, some of our vendors distribute products directly through the Internet and others may follow. Some vendors operate retail stores and some have indicated that further retail stores will open. Should this continue to occur, and if our customers decide to purchase directly from our vendors, it could have a material adverse effect on our business, financial condition, and results of operations.
2
We depend on mall traffic and our ability to identify suitable store locations.
Our sales, particularly in the United States and Canada, are dependent in part on a high volume of mall traffic. Our stores are located primarily in enclosed regional and neighborhood malls. Mall traffic may be adversely affected by, among other things, economic downturns, the closing of anchor department stores or changes in customer preferences or acts of terrorism. A decline in the popularity of mall shopping among our target customers could have a material adverse effect on us.
To take advantage of customer traffic and the shopping preferences of our customers, we need to maintain or acquire stores in desirable locations such as in regional and neighborhood malls anchored by major department stores. We cannot be certain that desirable mall locations will continue to be available.
The effects of natural disasters, terrorism, acts of war and retail industry conditions may adversely affect our business.
Natural disasters, including hurricanes, floods, and tornados may affect store and distribution center operations. In addition, acts of terrorism, acts of war, and military action both in the United States and abroad can have a significant effect on economic conditions and may negatively affect our ability to purchase merchandise from vendors for sale to our customers. Any significant declines in general economic conditions, public safety concerns or uncertainties regarding future economic prospects that affect customer spending habits could have a material adverse effect on customer purchases of our products.
A change in the relationship with any of our key vendors or the unavailability of our key products at competitive prices could affect our financial health.
Our business is dependent to a significant degree upon our ability to purchase brand-name merchandise at competitive prices, including the receipt of volume discounts, cooperative advertising, and markdown allowances from our vendors. The Company purchased approximately 78 percent of its merchandise in 2006 from its top five vendors and expects to continue to obtain a significant percentage of its athletic product from these vendors in future periods. Approximately 50 percent was purchased from one vendor — Nike, Inc. (“Nike”). Each of our operating divisions is highly dependent on Nike, they individually purchase 40 to 65 percent of their merchandise from Nike. We have no long-term supply contracts with any of our vendors. Our inability to obtain merchandise in a timely manner from major suppliers (particularly Nike) as a result of business decisions by our suppliers or any disruption in the supply chain could have a material adverse effect on our business, financial condition, and results of operations. Because of our strong dependence on Nike, any adverse development in Nike’s financial condition and results of operations or the inability of Nike to develop and manufacture products that appeal to our target customers could also have an adverse effect on our business, financial condition, and results of operations. We cannot be certain that we will be able to acquire merchandise at competitive prices or on competitive terms in the future.
Merchandise that is high profile and in high demand is allocated by our vendors based upon their internal criteria. Although we have generally been able to purchase sufficient quantities of this merchandise in the past, we cannot be certain that our vendors will continue to allocate sufficient amounts of such merchandise to us in the future. In addition, our vendors provide support to us through cooperative advertising allowances and promotional events. We cannot be certain that such assistance from our vendors will continue in the future. These risks could have a material adverse effect on our business, financial condition, and results of operations.
We may experience fluctuations in and cyclicality of our comparable store sales results.
Our comparable-store sales have fluctuated significantly in the past, on both an annual and a quarterly basis, and we expect them to continue to fluctuate in the future. A variety of factors affect our comparable-store sales results, including, among others, fashion trends, the highly competitive retail store sales environment, economic conditions, timing of promotional events, changes in our merchandise mix, calendar shifts of holiday periods, and weather conditions.
Many of our products, particularly high-end athletic footwear and licensed apparel, represent discretionary purchases. Accordingly, customer demand for these products could decline in a recession or if our customers develop other priorities for their discretionary spending. These risks could have a material adverse effect on our business, financial condition, and results of operations.
3
Our operations may be adversely affected by economic or political conditions in other countries.
Approximately 24 percent of our sales and a significant portion of our operating profits for 2006 were attributable to our sales in Europe, Canada, New Zealand, and Australia. As a result, our business is subject to the risks associated with doing business outside of the United States, such as foreign governmental regulations, foreign customer preferences, political unrest, disruptions or delays in shipments, and changes in economic conditions in countries in which we operate. Although we enter into forward foreign exchange contracts and option contracts to reduce the effect of foreign currency exchange rate fluctuations, our operations may be adversely affected by significant changes in the value of the U.S. dollar as it relates to certain foreign currencies.
In addition, because we and our suppliers have a substantial amount of our products manufactured in foreign countries, our ability to obtain sufficient quantities of merchandise on favorable terms may be affected by governmental regulations, trade restrictions, and economic, labor, and other conditions in the countries from which our suppliers obtain their product.
Our business is subject to economic cycles and retail industry conditions. Purchases of discretionary athletic footwear, apparel, and related products, tend to decline during recessionary periods when disposable income is low and customers are hesitant to use available credit.
Complications in our distribution centers and other factors affecting the distribution of merchandise may affect our business.
We operate three distribution centers worldwide to support our athletic business. If complications arise with any facility or any facility is severely damaged or destroyed, the other distribution centers may not be able to support the resulting additional distribution demands. This may adversely affect our ability to deliver inventory on a timely basis. We depend upon UPS for shipment of a significant amount of merchandise. An interruption in service by UPS for any reason could cause temporary disruptions in our business, a loss of sales and profits, and other material adverse effects.
Our freight cost is affected by changes in fuel prices through surcharges. Increases in fuel prices and surcharges and other factors may increase freight costs and thereby increase our cost of sales.
A major failure of our information systems could harm our business.
We depend on information systems to process transactions, manage inventory, operate our website, purchase, sell and ship goods on a timely basis and maintain cost-efficient operations. Any material disruption or slowdown of our systems could cause information to be lost or delayed which could have a negative effect on our business. We may experience operational problems with our information systems as a result of system failures, viruses, computer “hackers” or other causes. We cannot be assured that our systems will be adequate to support future growth.
Item 1B. Unresolved Staff Comments
None.
Item 2. Properties
Item 3. Legal Proceedings
4
Item 4. Submission of Matters to a Vote of Security Holders
Executive Officers of the Company
| Chairman of the Board, President and Chief Executive Officer | Matthew D. Serra | |||||
| President and Chief Executive Officer - Foot Locker, Inc. — International | Ronald J. Halls | |||||
| President and Chief Executive Officer - Foot Locker, Inc. — U.S.A. | Richard T. Mina | |||||
| Senior Vice President, General Counsel and Secretary | Gary M. Bahler | |||||
| Senior Vice President — Real Estate | Jeffrey L. Berk | |||||
| Senior Vice President, | Peter D. Brown | |||||
| Senior Vice President and Chief Financial Officer | ||||||
| Senior Vice President — Strategic Planning | Lauren B. Peters | |||||
| Senior Vice President — Human Resources | Laurie J. Petrucci | |||||
| Vice President and Chief Accounting Officer | Giovanna Cipriano | |||||
| Vice President and Treasurer | ||||||
Richard T. Mina, age 50, has served as President and Chief Executive Officer of Foot Locker, Inc.- U.S.A. since February 2, 2003. He served as President and Chief Executive Officer of Champs Sports, an operating division of the Company, from April 1999 to February 1, 2003. He served as President of Foot Locker Europe from January 1996 to April 1999.
2
Robert W. McHugh, age 48, has served as Senior Vice President and Chief Financial Officer since November 2005. He served as Vice President and Chief FinancialAccounting Officer from January 2000 to November 2005.
Lauren B. Peters, age 45, has served as Senior Vice President — Strategic Planning since April 2002. Ms. Peters served as Vice President — Planning from January 2000 to April 2002.
Laurie J. Petrucci, age 48, has served as Senior Vice President — Human Resources since May 2001. Ms. Petrucci served as Senior Vice President — Human Resources of Ladythe Foot Locker Worldwide division from October 1999March 2000 to August 2000, and as Director of the Company’s Profit Improvement Task Force from November 1998 to October 1999.May 2001.
John Maurer, age 47, has served as Vice President — Taxationand Treasurer since September 12, 2006. Mr. Maurer served as Assistant Treasurer from November 1997April 2002 to January 2000.September 11, 2006.
5
PART II
Item 5. Market for the Company’s Common Equity, and Related Stockholder Matters and Issuer Purchases of Equity Securities
There were no purchases of common stock during the fourth quarter of 2006. On February 15, 2006, the Company announced that its Board of Directors authorized a $150 million, three-year share repurchase plan program. During 2006, the Company repurchased 334,200 of common stock at a cost of approximately $8 million. On March 7, 2007, the Company announced that its Board of Directors authorized a new $300 million, three-year share repurchase program replacing the earlier $150 million program.
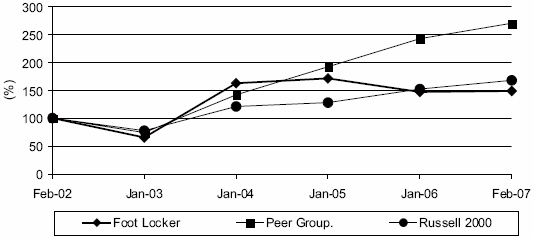
Performance Graph
The following graph compares the cumulative 5-year total return to shareholders on Foot Locker, Inc.’s common stock relative to the total returns of the Russell 2000 Index and a selected peer group, which represents its peers as retailers in the athletic footwear and apparel industry. The peer group comprises:
- Dick’s Sporting Goods, Inc.
- The Finish Line, Inc.
- Hibbett Sporting Goods, Inc., and
- Genesco, Inc., whose business includes operations outside of the athletic footwear and apparel retailing.
In 2005, the peer group also included The Sports Authority, Inc. On January 23, 2006, The Sports Authority, Inc. announced it had agreed to go private through an acquisition by Leonard Green & Partners LP and certain members of its senior management and, therefore, it was not included in this year's performance graph.
Indexed Share Price Performance
6
Item 6. Selected Financial Data
Item 7. Management’s Discussion and Analysis of Financial Condition and Results of Operations
Business Overview
3
Athletic Stores
Footaction— Footaction is a national athletic footwear and apparel retailer. The primary customers are young urban males that seek street-inspired fashion styles. Its 373 stores are located throughout the United States and Canada.Puerto Rico and focus on marquee allocated footwear and branded apparel. The Champs SportsFootaction stores have an average of 3,9002,900 selling square feet.
Lady Foot Locker — Lady Foot Locker is a leading U.S. retailer of athletic footwear, apparel and accessories for women. Its stores carry major athletic footwear and apparel brands, as well as casual wear and an assortment of proprietary merchandise designed for a variety of activities, including running, basketball, walking, and fitness. Its 557 stores are located in the United States, Puerto Rico, the U. S. Virgin Islands, and Guam and have an average of 1,300 selling square feet.
Kids Foot Locker — Kids Foot Locker is a national children’s athletic retailer that offers the largest selection of brand-name athletic footwear, apparel and accessories for children. Its stores feature an environment geared to appeal to both parents and children. Its 335 stores are located in the United States, Puerto Rico, and the U.S. Virgin Islands and have an average of 1,400 selling square feet.
7
Store Profile
| At | At | |||||||
| January 28, 2006 | Opened | Closed | February 3, 2007 | |||||
| Foot Locker | 2,121 | 57 | 77 | 2,101 | ||||
| Champs Sports | 556 | 27 | 7 | 576 | ||||
| Footaction | 363 | 17 | 7 | 373 | ||||
| Lady Foot Locker | 554 | 22 | 19 | 557 | ||||
| Kids Foot Locker | 327 | 23 | 15 | 335 | ||||
| Total Athletic Stores | 3,921 | 146 | 125 | 3,942 |
| At February 1, 2003 | Opened | Closed | At January 31, 2004 | |||||||||||||||
|---|---|---|---|---|---|---|---|---|---|---|---|---|---|---|---|---|---|---|
| Foot Locker | 2,060 | 94 | 66 | 2,088 | ||||||||||||||
| Lady Foot Locker | 606 | 2 | 24 | 584 | ||||||||||||||
| Kids Foot Locker | 377 | — | 20 | 357 | ||||||||||||||
| Champs Sports | 582 | 17 | 18 | 581 | ||||||||||||||
| Total Athletic Stores | 3,625 | 113 | 128 | 3,610 | ||||||||||||||
4
Direct-to-Customers
Saleswww.ESPNshop.com, where consumers can purchase athletic footwear, apparel and equipment which will be managed by SegmentFootlocker.com. Both the catalog and the e-commerce site feature a variety of ESPN-branded and non-ESPN-branded athletically inspired merchandise.
In March of 2006, the Company entered into a ten-year area development agreement with the Alshaya Trading Co. W.L.L., in which the Company agreed to enter into separate license agreements for the operation of a minimum of 75 Foot Locker stores, subject to certain restrictions, located within the Middle East. Three of these franchised stores were operational at February 3, 2007. Revenue from the three franchised stores was not significant for the year-ended February 3, 2007. These stores are not included in the Company’s operating store count above.
Overview of Consolidated Results
2006 was a challenging year for the Company due to the continued highly competitive retail environment both in the United States and abroad. The 2006 results represent the 53 weeks ended February 3, 2007 as compared with the 52 weeks in the 2005 and 2004 reporting years. Income from continuing operations in 2006, after-tax, was $247 million, or $1.58 per diluted share, as compared with $263 million or $1.67 per diluted share in 2005. The following were the financial highlights of 2006:
- Contributed $68 million to its U.S. and Canadian qualified pension plans. The U.S. payment was made inadvance of ERISA requirements.
- Repaid $50 million of its 5-year term loan, in advance of the regularly scheduled payment dates of May 2007and May 2008.
- Purchased and retired $38 million of the $200 million 8.50 percent debentures payable in 2022 at a $2 milliondiscount from face value, bringing the outstanding amount to $134 million as of February 3, 2007.
- Declared and paid dividends totaling $61 million. In the fourth quarter the Company increased its quarterlydividend per share by 39 percent.
- Repurchased $8 million of common stock.
8
Additionally, the following were the key factors affecting the Company’s performance during 2006:
- The 53rdweek increased sales by $95 million and increased net income by $18 million or $0.11 per dilutedshare.
- Included in 2006 is a non-cash impairment charge of $17 million ($12 million after-tax), or $0.08 per dilutedshare, recorded to write-down the value of long-lived assets of underperforming stores in the Company’sEuropean operations. This was necessitated by the continued declines in sales and division profit, principallyas the result of a fashion shift from higher priced marquee footwear to lower priced low-profile footwear and acontinued highly competitive environment, particularly for the sale of low-profile footwear styles.
- During the first quarter of 2006, the Company adopted SFAS No. 123(R), “Share-Based Payment.” The Companyhas recorded an incremental $6 million of share-based compensation in 2006. Additionally, the Companyrecorded a cumulative effect of a change in accounting of $1 million to reflect estimated forfeitures for priorperiods related to the Company’s nonvested restricted stock awards.
The following table summarizesrepresents a summary of sales by segment, after reclassification for businesses disposed. The disposition of all businesses previously held for disposal was completed by the end of 2001:
| 2003 | 2002 | 2001 | ||||||||||||||||
|---|---|---|---|---|---|---|---|---|---|---|---|---|---|---|---|---|---|---|
| (in millions) | ||||||||||||||||||
| Athletic Stores | $ | 4,413 | $ | 4,160 | $ | 3,999 | ||||||||||||
| Direct-to-Customers | 366 | 349 | 326 | |||||||||||||||
| 4,779 | 4,509 | 4,325 | ||||||||||||||||
Disposed(1) | — | — | 54 | |||||||||||||||
| $ | 4,779 | $ | 4,509 | $ | 4,379 | |||||||||||||
Division Profit
| 2006 | 2005 | 2004 | |||||||||||
| (in millions) | |||||||||||||
| Sales | |||||||||||||
| Athletic Stores | $ | 5,370 | $ | 5,272 | $ | 4,989 | |||||||
| Direct-to-Customers | 380 | 381 | 366 | ||||||||||
| $ | 5,750 | $ | 5,653 | $ | 5,355 | ||||||||
| Operating Result | |||||||||||||
| Athletic Stores | $ | 405 | $ | 419 | $ | 420 | |||||||
| Direct-to-Customers | 45 | 48 | 45 | ||||||||||
| Division profit | 450 | 467 | 465 | ||||||||||
| Restructuring charges(1) | (1 | ) | — | (2 | ) | ||||||||
| Total division profit | 449 | 467 | 463 | ||||||||||
| Corporate expense | (68 | ) | (58 | ) | (74 | ) | |||||||
| Total operating profit | 381 | 409 | 389 | ||||||||||
| Other income | 14 | 6 | — | ||||||||||
| Interest expense, net | 3 | 10 | 15 | ||||||||||
| Income from continuing operations before income taxes | $ | 392 | $ | 405 | $ | 374 | |||||||
| 2003 | 2002 | 2001 | ||||||||||||||||
|---|---|---|---|---|---|---|---|---|---|---|---|---|---|---|---|---|---|---|
| (in millions) | ||||||||||||||||||
| Athletic Stores | $ | 363 | $ | 279 | $ | 283 | ||||||||||||
| Direct-to-Customers | 53 | 40 | 24 | |||||||||||||||
| Division profit from ongoing operations | 416 | 319 | 307 | |||||||||||||||
Disposed(1) | — | — | (12 | ) | ||||||||||||||
Restructuring income (charges)(2) | (1 | ) | 2 | (33 | ) | |||||||||||||
| Total division profit | 415 | 321 | 262 | |||||||||||||||
Corporate expense(3) | (73 | ) | (52 | ) | (65 | ) | ||||||||||||
| Total operating profit | 342 | 269 | 197 | |||||||||||||||
| Non-operating income | — | 3 | 2 | |||||||||||||||
| Interest expense, net | (18 | ) | (26 | ) | (24 | ) | ||||||||||||
| Income from continuing operations before | ||||||||||||||||||
| income taxes | $ | 324 | $ | 246 | $ | 175 | ||||||||||||
| (1) |
5
Sales
Sales of $4,509$5,653 million in 20022005 increased 3.0by 5.6 percent from sales of $4,379$5,355 million in 2001. Excluding sales from businesses disposed and the2004. The effect of foreign currency fluctuations 2002on sales was not significant. This increase was primarily related to increased by 3.1 percent as compared with 2001 primarily as a result ofsales in the new store opening program.Company’s Footaction and Champs Sports formats. Comparable-store sales increased by 0.12.7 percent.
Gross Margin
Segment Information
Athletic Stores
| 2003 | 2002 | 2001 | ||||||||||||||||
|---|---|---|---|---|---|---|---|---|---|---|---|---|---|---|---|---|---|---|
| (in millions) | ||||||||||||||||||
| Sales | $ | 4,413 | $ | 4,160 | $ | 3,999 | ||||||||||||
Division profit | ||||||||||||||||||
| Stores | $ | 363 | $ | 279 | $ | 283 | ||||||||||||
| Restructuring income | — | 1 | — | |||||||||||||||
| Total division profit | $ | 363 | $ | 280 | $ | 283 | ||||||||||||
| Sales as a percentage of consolidated total | 92 | % | 92 | % | 92 | % | ||||||||||||
| Number of stores at year end | 3,610 | 3,625 | 3,590 | |||||||||||||||
| Selling square footage (in millions) | 7.92 | 8.04 | 7.94 | |||||||||||||||
| Gross square footage (in millions) | 13.14 | 13.22 | 13.14 | |||||||||||||||
6
7
Direct-to-Customers
| 2003 | 2002 | 2001 | ||||||||||||||||
|---|---|---|---|---|---|---|---|---|---|---|---|---|---|---|---|---|---|---|
| (in millions) | ||||||||||||||||||
| Sales | $ | 366 | $ | 349 | $ | 326 | ||||||||||||
| Division profit | $ | 53 | $ | 40 | $ | 24 | ||||||||||||
| Sales as a percentage of consolidated total | 8 | % | 8 | % | 7 | % | ||||||||||||
8
All Other Businesses
| 2003 | 2002 | 2001 | ||||||||||||||||
|---|---|---|---|---|---|---|---|---|---|---|---|---|---|---|---|---|---|---|
| (in millions) | ||||||||||||||||||
Sales | $ | — | $ | — | $ | 54 | ||||||||||||
Division profit (loss) | ||||||||||||||||||
| Disposed | $ | — | $ | — | $ | (12 | ) | |||||||||||
| Restructuring income (charges) | (1 | ) | 1 | (33 | ) | |||||||||||||
| Total division profit (loss) | $ | (1 | ) | $ | 1 | $ | (45 | ) | ||||||||||
| Sales as a percentage of consolidated total | — | % | — | % | 1 | % | ||||||||||||
Corporate Expense
The increase in corporate expense in 20032006 as compared with 2005 of $10 million reflects the adoption of SFAS No. 123(R) that resulted in incremental compensation expense of $6 million and a charge of $4 million for anticipated settlements of certain legal matters. The effect of the 53rd week on corporate expense was not significant. Depreciation and amortization included in corporate expense amounted to $22 million in 2006, $24 million in 2005, and $23 million in 2004.
The decrease in corporate expense in 2005 as compared with 2004 primarily included decreased incentive bonuses of $14 million; a $3 million decrease in costs associated with the Company’s loyalty program, as 2004 represented the initial costs to launch the program; and decreased restricted stock expense of $2 million. In addition, 2004 included $5 million for the integration of the Footaction stores. Included in 2005 was also a settlement of $3 million pursuant to a class action settlement with Visa and MasterCard related to past overcharges for certain debit card transactions. These decreases were offset, in part, by a charge of $4 million due to the potential insolvency of one of the Company’s insurance carriers and legal and settlement costs of $5 million.
Other Income
During 2006, the Company terminated two of its leases for approximately $5 million, which resulted in a net gain of $4 million. In addition, the Company finalized its insurance claims related to Hurricane Katrina, which resulted in a gain of $8 million, which represents amounts in excess of losses. Also during 2006, the Company purchased and retired $38 million of long-term debt at a discount from face value of $2 million. The 2005 amounts represent $3 million related to the insurance recoveries associated with Hurricane Katrina, as well as $3 million of a net gain on foreign currency option contracts that were entered into by the Company to mitigate the effect of fluctuating foreign exchange rates on the reporting of euro-denominated earnings.
Selling, General and Administrative Expenses
Selling, general and administrative (“SG&A”) expenses increased by $34 million to $1,163 million in 2006, or by 3.0 percent, as compared with 2005. SG&A as a percentage of sales increased to 20.2 percent as compared with 20.0 percent in 2005. Excluding the effect of foreign currency fluctuations and the 53rd week, SG&A would have increased by 1.4 percent. This increase is primarily the result of incremental share-based compensation included in corporate expense, associated with the adoption of SFAS No. 123(R) of $6 million. Additionally, the net benefit cost for the Company’s pension and postretirement plans reflected a reduction of $5 million, primarily as a result of additional contributions and improved pension fund asset performance.
10
SG&A increased by $41 million to $1,129 million in 2005, or by 3.8 percent, as compared with 2004. SG&A as a percentage of sales decreased to 20.0 percent as compared with 20.3 percent in 2004. The increase in SG&A is primarily related to an increase in payroll and related costs. The effect of including Footaction for the full fiscal year is an incremental $21 million, excluding the integration costs. During 2005, the Company donated 82,500 pairs of athletic footwear with a cost of $2 million to Save the Children Foundation. This donation benefited the tsunami victims in Banda Aceh, Indonesia, and Save the Children programs in the United States.
Depreciation and Amortization
Depreciation and amortization of $175 million increased by 2.3 percent in 2006 from $171 million in 2005. This increase primarily reflects additional depreciation and amortization for the Athletic Stores segment due to capital spending and the effect of foreign currency fluctuations of approximately $1 million.
Depreciation and amortization of $171 million increased by 11.0 percent in 2005 from $154 million in 2004. This increase primarily reflects additional depreciation and amortization for the Athletic Stores segment due to capital spending and adjustments to depreciable lives of certain fixed assets. Additionally, depreciation and amortization for the Footaction format increased by $6 million as compared with 2004, primarily due to increased capital expenditures related to store improvements and point-of-sale equipment.
Interest Expense, Net
| 2006 | 2005 | 2004 | |||||||||||
| (in millions) | |||||||||||||
| Interest expense | $ | 23 | $ | 23 | $ | 22 | |||||||
| Interest income | (20 | ) | (13 | ) | (7 | ) | |||||||
| Interest expense, net | $ | 3 | $ | 10 | $ | 15 | |||||||
| Weighted-average interest rate (excluding facility fees): | |||||||||||||
| Short-term debt | — | % | — | % | — | % | |||||||
| Long-term debt | 7.8 | % | 6.2 | % | 5.2 | % | |||||||
| Total debt | 7.8 | % | 6.2 | % | 5.2 | % | |||||||
| Short-term debt outstanding during the year: | |||||||||||||
| High | $ | — | $ | — | $ | — | |||||||
| Weighted-average | $ | — | $ | — | $ | — | |||||||
Interest expense of $23 million remained unchanged from 2005. Interest rate swap agreements did not significantly affect interest expense in 2006.
Interest income is generated through the investment of cash equivalents, short-term investments, the accretion of the Northern Group note to its face value and accrual of interest on the outstanding principal, as well as interest on income tax refunds. The increase in interest income of $7 million in 2006 was primarily related to increased compensation costs for incentive bonusesinterest income earned on cash, cash equivalents, and short-term investments. Interest income related to cash, cash equivalents and short-term investments was $14 million in 2006 and $11 million in 2005. Interest income on the Northern Group note amounted to $2 million in both 2006 and 2005. Also included in interest income is the effect of the Company’s cross currency swaps, which totaled $3 million in 2006 and was not significant in 2005.
Interest expense of $23 million increased by 4.5 percent in 2005 from $22 million in 2004 primarily attributable to higher interest rates. Interest rate swap agreements reduced interest expense by approximately $1 million and $3 million in 2005 and 2004, respectively.
The increase in interest income of $6 million in 2005 as compared with 2004 was primarily related to increased interest income earned on short-term investments due to higher interest rates and increased restricted stock expenseshort-term investment balances. Interest income related to additional grants.
9
Results of Operations
Selling, General and Administrative Expenses
11
Income Taxes
The effective tax rate for 2006 was 36.9 percent as compared with 2002.35.0 percent in the prior year. The increase in the rate is primarily due to the change in the mix of U.S. and international profits and the $17 million impairment charge relating to the Company’s European operations, as well as a $6 million valuation allowance adjustment recorded in 2005.
The effective tax rate for 2005 was 35.0 percent as compared with 31.7 percent in 2004. The increase was attributable to less benefit from non-recurring items than in 2004 and a higher percentage of the Company’s income earned in the United States, rather than from lower-taxed international operations. During 2005, the Company restructured its Canadian continuing business, which resulted in a $6 million reduction to its income tax valuation allowance related to Canadian tax loss carry-forwards and unclaimed tax depreciation. Additionally, the Company recorded an income tax benefit of $3 million in discontinued operations related to its former Canadian operations. During 2004, the Company settled foreign and domestic income tax examinations and reviews that resulted in reductions of its income tax provision for continuing operations by $14 million and discontinued operations by $37 million.
Segment Information
The Company evaluates performance based on several factors, the primary financial measure of which is division profit. Division profit reflects income from continuing operations before income taxes, corporate expense, non-operating income, and net interest expense.
Athletic Stores
| 2006 | 2005 | 2004 | |||||||||
| (in millions) | |||||||||||
| Sales | $ | 5,370 | $ | 5,272 | $ | 4,989 | |||||
| Division profit | $ | 405 | $ | 419 | $ | 420 | |||||
| Sales as a percentage of consolidated total | 93 | % | 93 | % | 93 | % | |||||
| Division profit margin | 7.5 | % | 7.9 | % | 8.4 | % | |||||
| Number of stores at year end | 3,942 | 3,921 | 3,967 | ||||||||
| Selling square footage (in millions) | 8.74 | 8.71 | 8.89 | ||||||||
| Gross square footage (in millions) | 14.55 | 14.48 | 14.78 | ||||||||
2006 compared with 2005
Athletic Stores sales of $5,370 million increased 1.9 percent in 2006, as compared with $5,272 million in 2005. Excluding the effect of foreign currency fluctuations, primarily related to the euro, SG&Aand the effect of the 53rd week, sales from athletic store formats decreased by 0.6 percent in 2006. Footaction and Champs Sports significantly increased sales, primarily from the sales of marquee basketball and running footwear. This was offset primarily by 2.7 percent. The increases were related to additional payroll costs of $16 milliondecreased sales in Europe, primarily as a result of new store openings and $12 million related to compensation costs for incentive bonusesFoot Locker Europe. Foot Locker Europe’s sales declined due to the Company’s performance. Additionally, pension expense increasedcontinued difficult athletic retail environment, particularly in France, the U.K and Italy. Comparable-store sales decreased by $81.1 percent in 2006.
Division profit from Athletic Stores decreased by 3.3 percent to $405 million due to the decline in plan asset values experienced2006 from $419 million in prior years, partially offset by a $4 million increase in the recognition of postretirement income and foreign exchange gain recorded in 2002. During 2002, the Company recorded asset impairment charges of $6 million and $1 million related to the Kids Foot Locker and Lady Foot Locker formats, respectively. SG&A2005. Division profit as a percentage of sales remained relatively flatdecreased to 7.5 percent. The decrease in division profit is primarily attributable to the Foot Locker Europe division due to the fashion shift from higher priced marquee footwear to lower priced low-profile footwear styles and a highly competitive retail environment, particularly for the sale of low-profile footwear styles. Included in the Athletic Stores division profit for 2006 is an impairment charge of $17 million related to the Company’s European operations, consistent with the Company’s recoverability of long-lived assets policy. The charge was comprised primarily of stores located in the U.K. and France. As previously disclosed in 2005, the Company was monitoring the progress of the European operations and the possible analysis of recoverability of store long-lived assets pursuant to SFAS No. 144. Excluding the impairment charge, Athletic Stores division profit increased by 0.7 percent as compared with the corresponding prior yearprior-year period.
2005 compared with 2004
Athletic Stores sales of $5,272 million increased by $55.7 percent in 2005, as compared with $4,989 million in 2002 to $928 million. The increase included $13 million related to new store openings, $11 million related to2004. Excluding the impacteffect of foreign currency fluctuations, primarily related to the euro, and $10 million related tosales from athletic store formats increased pension costs. The increase5.5 percent in pension costs resulted from the decline2005. Comparable-store sales increased by 2.6 percent in the retirement plans’ asset values experienced in prior years and the expected long-term rate of return used to determine the expense.2005. These increases were partially offsetprimarily driven by $29 million in the reduction in SG&A expensessales related to the dispositionsFootaction division, which was acquired in May 2004. Approximately $126 million of SFMB and the Burger King and Popeye’s franchises during the third quarter of 2001, and a $3 million increase in income related toFootaction represented the postretirement plan. Theinclusion of their operations for the full year in 2005. Champs Sports experienced a strong increase in postretirement incomesales during 2005, as this format benefited from higher quantities of $3marquee athletic footwear and private-label apparel. Foot Locker Canada also experienced increased sales. Excluding the effect of foreign currency fluctuations, Foot Locker Europe’s sales were essentially flat as compared with the corresponding prior-year period.
Division profit from Athletic Stores decreased by 0.2 percent to $419 million resultedin 2005 from the amortization of the associated gains. SG&A,$420 million in 2004. Division profit as a percentage of sales decreased to 20.67.9 percent in 20022005 from 21.18.4 percent in 2001. During 2002,2004. This decline is primarily a result of the Company recorded asset impairment charges of $6 milliondecreased profit from the European operations as compared with the prior year. The continued weak economy, the increased competitive environment and $1 million relateda fashion shift from higher priced marquee footwear to the Kidslower priced low-profile footwear negatively affected Europe’s operating results. In addition during 2005, Foot Locker and Lady Foot Locker formats, respectively, compared with $2 million in 2001 for the Lady Foot Locker format. SG&A in 2002 was reduced by a net foreign exchange gain of $4 million related to intercompany foreign currency denominated firm commitments.
Depreciation and Amortization
Interest Expense, Net
| 2003 | 2002 | 2001 | ||||||||||||||||
|---|---|---|---|---|---|---|---|---|---|---|---|---|---|---|---|---|---|---|
| (in millions) | ||||||||||||||||||
| Interest expense | $ | 26 | $ | 33 | $ | 35 | ||||||||||||
| Interest income | (8 | ) | (7 | ) | (11 | ) | ||||||||||||
| Interest expense, net | $ | 18 | $ | 26 | $ | 24 | ||||||||||||
| Weighted-average interest rate (excluding facility fees): | ||||||||||||||||||
| Short-term debt | — | % | — | % | 6.0 | % | ||||||||||||
| Long-term debt | 6.1 | % | 7.2 | % | 7.4 | % | ||||||||||||
| Total debt | 6.1 | % | 7.2 | % | 7.4 | % | ||||||||||||
| Short-term debt outstanding during the year: | ||||||||||||||||||
| High | $ | — | $ | — | $ | 11 | ||||||||||||
| Weighted-average | $ | — | $ | — | $ | — | ||||||||||||
10
Direct-to-Customers
| 2006 | 2005 | 2004 | |||||||||
| (in millions) | |||||||||||
| Sales | $ | 380 | $ | 381 | $ | 366 | |||||
| Division profit | $ | 45 | $ | 48 | $ | 45 | |||||
| Sales as a percentage of consolidated total | 7 | % | 7 | % | 7 | % | |||||
| Division profit margin | 11.8 | % | 12.6 | % | 12.3 | % | |||||
2006 compared with 2005
Direct-to-Customers sales decreased to $380 million in 2006, as compared with $381 million in 2005. Internet sales increased to $270 million, increasing by 11.1 percent debenturesas compared with 2005. Catalog sales decreased by 20.3 percent to variable rate debt and subsequently entered into two additional swaps during 2003, totaling $50$110 million in 2006 from $138 million in 2005. Management believes that the decrease in catalog sales, which allowedwas substantially offset by the Company to lower the net amount of interest expense being paid at each interest payment date. The swaps reduced interest expense by approximately $4 million. The remaining decreaseincrease in Internet sales, is a result of customers browsing and selecting products through its catalogs and then making their purchases via the lower debt balanceInternet. Sales for the Direct-to-Customer business were negatively affected by the termination of a third party arrangement in the early part of 2006.
The Direct-to-Customers business generated division profit of $45 million in 2006, as compared with $48 million in 2005. Division profit, as a percentage of sales, decreased to 11.8 percent in 2006 from 12.6 percent in 2005. Several initiatives were implemented to mitigate the Company repurchased $19 millionloss of revenue from the cancelled third party contract, such as expanding the ESPN offerings. However, these iniatitives did not fully offset the loss in profit which resulted in a decline in division profit. The effect of the 8.5053rd week on this segment was not significant.
2005 compared with 2004
Direct-to-Customers sales increased 4.1 percent debentures in 2003 and $9to $381 million in 2005, as compared with $366 million 2004. The growth of the latter part of 2002. Interest expenseInternet business continued to drive sales in 2005. Internet sales increased by 14.6 percent to $243 million from $212 million in 2004. Catalog sales decreased by 10.4 percent to $138 million in 2005 from $154 million in 2004. Management believes that the decrease in catalog sales, which was further reduced assubstantially offset by the increase in Internet sales, is a result of customers browsing and selecting products through its catalogs and then making their purchases via the repaymentInternet.
The Direct-to-Customers business generated division profit of the remaining $32 million of the $40 million 7.00 percent medium-term notes that matured in October 2002.
Income Taxes
11
13
Liquidity and Capital Resources
Cash Flow and Liquidity
Planned capital expenditures for 20042007 are $141approximately $170 million, of which $97$144 million relates to new store openings and modernizations of existing stores, and $44$26 million reflects the development of information systems and other support facilities. In addition, planned lease acquisition costs are $24 million and primarily relate to the Company’s operations in Europe. The Company has the ability to revise and reschedule the anticipated capital expenditure program, should the Company’s financial position require it.
Any materially adverse reaction tochange in customer demand, fashion trends, competitive market forces or customer acceptance of the Company’s merchandise mix and retail locations, uncertainties related to the effect of competitive products and pricing, customer acceptance of the Company’s merchandise mix and retail locations, the Company’s reliance on a few key vendors for a significant portion of its merchandise purchases, (and on one key vendor for approximately 40 percent of its merchandise purchases), risks associated with foreign global sourcing or economic conditions worldwide could affect the ability of the Company to continue to fund its needs from business operations.
Operating activities offrom continuing operations provided cash of $264$189 million in 20032006 as compared with $347$349 million in 2002.2005. These amounts reflect income from continuing operations adjusted for non-cash items and working capital changes. The decrease was primarily the result of a $50 million pension contribution and working capital usage, partially offset by increased income from continuing operations. Income from continuing operations increased by $54 million in 2003. Working capital usage included higher net cash outflow for merchandise inventories in 2003 as compared with 2002 andDuring 2006, the Company increased itsrecorded a non-cash impairment charge of $17 million related to the operations in Europe. The decline in operating cash flows of $160 million is primarily due to a reduction of accounts payable at year-end reflecting an acceleration of inventory position to accommodate anticipated salesreceipts earlier in 2004. The decrease in income taxes payable was attributable to increased payments made during 2003. The Company received a refund of tax and interest of $13 million during the fourth quarter of 2003.
12
14
During 2005, the Company received $1 million from an escrow account upon the resolution of a Footaction lease matter relating to the 2004 acquisition. The change was due to a $34Company’s purchase of short-term investments, net of sales, increased by $31 million in 2005 as compared with an increase of $9 million in capital2004. Capital expenditures of $155 million in 20022005 and $156 million in 2004 primarily related to store remodelingsremodeling and new stores. Lease acquisition costs were $18 million and $20 million in 2002 and 2001, respectively. Proceeds from sales of real estate and other assets and investments were $6 million in 2002 compared with $20 million in 2001. Proceeds from the condemnation of the Company’s part-owned and part-leased property contributed $6The Company also received $3 million of cash receivedinsurance proceeds related to the hurricanes in 2002. Proceeds from2005, representing the salesportion of The San Francisco Music Box Company and the Burger King and Popeye’s franchises contributed $14 million and $5 millioninsurance recoveries in cash, respectively, in 2001.
Net cash used in financing activities of continuing operations was $105 million in 2005 as compared with net cash provided of $167 million in 2004. The Company repaid $35 million of its 5-year, $175 million term loan during 2005 and declared and paid dividends totaling $49 million in 2005 and $39 million in 2004. During 2005 and 2004, the Company received proceeds from the issuance of common and treasury stock in connection with employee stock programs of $27$14 million and $10$33 million, respectively.
Capital Structure
During 2004, the Company obtained a 5-year, $175 million term loan to finance a portion of the $40 million 7.00 percent medium-term notes. During 2002,purchase price of the Footaction stores. Concurrent with the financing of a portion of the Footaction acquisition, the Company repaid the balance of the $40 million 7.00 percent medium-term notes that were due in October 2002 and $9 million of the $200 million of debentures due in 2022. There were no outstanding borrowings under the Company’samended its revolving credit agreement, as of February 1, 2003 and February 2, 2002. During 2002,thereby extending the Company declared and paid a $0.03 per share dividend during the fourth quarter of $4 million.
Capital Structure
13
During 2006, the Company purchased and retired $9$38 million of the $200 million 8.50 percent notes duedebentures payable in 2022 contributingat a $2 million discount from face value bringing the outstanding amount to the reduction$134 million as of debt and capital lease obligations. During the fourth quarter of 2002, the Board of Directors initiated the Company’s dividend program and declared and paid a dividend of $0.03 per share.
Credit Rating
Debt Capitalization and credit metrics despite shifts in consumer preferences and a challenging retail environment.” The Company is working toward attaining an investment grade rating from both agencies.
Debt Capitalization
15
| 2006 | 2005 | ||||||
| (in millions) | |||||||
| Cash, cash equivalents and short-term investments, net of debt and | |||||||
| capital lease obligations | $ | 236 | $ | 261 | |||
| Present value of operating leases | 2,069 | 1,934 | |||||
| Total net debt | 1,833 | 1,673 | |||||
| Shareholders’ equity | 2,295 | 2,027 | |||||
| Total capitalization | $ | 4,128 | $ | 3,700 | |||
| Net debt capitalization percent | 44.4 | % | 45.2 | % | |||
| Net debt capitalization percent without operating leases | — | % | — | % | |||
| 2003 | 2002 | ||||||||||
|---|---|---|---|---|---|---|---|---|---|---|---|
| (in millions) | |||||||||||
| Cash and cash equivalents, net of debt and capital lease obligations | $ | 112 | $ | — | |||||||
| Present value of operating leases | 1,683 | 1,571 | |||||||||
| Total net debt | 1,571 | 1,571 | |||||||||
| Shareholders’ equity | 1,375 | 1,110 | |||||||||
| Total capitalization | $ | 2,946 | $ | 2,681 | |||||||
| Net debt capitalization percent | 53.3 | % | 58.6 | % | |||||||
| Net debt capitalization percent without operating leases | — | % | — | % | |||||||
Excluding the present value of operating leases, the Company’s cash, cash equivalents and short-term investments, net of debt and capital lease obligations, increased to $261 million at January 28, 2006 from $127 million at January 29, 2005. The Company reduced debt and capital lease obligations by $39 million, while increasing cash, cash equivalents and short-term investments by $95 million. Additionally, the present value of the operating leases decreased by $55 million representing the net change of lease renewals, the effect of foreign currency fluctuations primarily related to the euro and the result of the closure of 25 stores due to the hurricanes. Including the present value of operating leases, the Company’s net debt capitalization percent decreased 520 basis points in 2005. The increase in shareholders’ equity relates to net income of $264 million in 2005, $26 million related to stock plans, and a decrease of $25 million in the foreign exchange currency translation adjustment, primarily related to the value of the euro in relation to the U.S. contribution was madedollar. The Company declared and paid dividends totaling $49 million during 2005.The Company repurchased approximately 1.6 million shares for $35 million during the year. During 2005, the Company reduced its minimum liability for the Company’s pension plans by $15 million, primarily as a result of the plans’ asset performance. The Company contributed $19 million and $7 million to the Company’s U.S. and Canadian qualified pension plans, respectively, in advance of ERISA requirements.
14
16
Contractual Obligations and Commitments
| Payments Due by Period | ||||||||||||||||
| Less than | 2 –3 | 3 –5 | After 5 | |||||||||||||
| Contractual Cash Obligations | Total | 1Year | Years | Years | Years | |||||||||||
| (in millions) | ||||||||||||||||
| Long-term debt(1) | $ | 220 | $ | — | $ | 90 | $ | — | $ | 130 | ||||||
| Operating leases | 2,739 | 486 | 803 | 621 | 829 | |||||||||||
| Capital lease obligations | 14 | 14 | — | — | — | |||||||||||
| Other long-term liabilities(2) | — | — | — | — | — | |||||||||||
| Total contractual cash obligations | $ | 2,973 | $ | 500 | $ | 893 | $ | 621 | $ | 959 | ||||||
| ____________________ | ||||||||||||||||
| Payments Due by Period | |||||||||||||||||||||||
|---|---|---|---|---|---|---|---|---|---|---|---|---|---|---|---|---|---|---|---|---|---|---|---|
| Contractual Cash Obligations | Total | Less than 1 Year | 2 – 3 Years | 4 – 5 Years | After 5 Years | ||||||||||||||||||
| (in millions) | |||||||||||||||||||||||
Long-term debt(1) | $ | 321 | $ | — | $ | — | $ | 150 | $ | 171 | |||||||||||||
| Operating leases | 2,366 | 387 | 693 | 533 | 753 | ||||||||||||||||||
| Capital lease obligations | 14 | — | — | 14 | — | ||||||||||||||||||
Other long-term liabilities(2) | — | — | — | — | — | ||||||||||||||||||
| Total contractual cash obligations | $ | 2,701 | $ | 387 | $ | 693 | $ | 697 | $ | 924 | |||||||||||||
| Amount of Commitment Expiration by Period | |||||||||||||||||||||||
|---|---|---|---|---|---|---|---|---|---|---|---|---|---|---|---|---|---|---|---|---|---|---|---|
| Other Commercial Commitments | Total Amounts Committed | Less than 1 Year | 2 – 3 Years | 4 – 5 Years | After 5 Years | ||||||||||||||||||
| (in millions) | |||||||||||||||||||||||
| Line of credit | $ | 176 | $ | — | $ | 176 | $ | — | $ | — | |||||||||||||
| Stand-by letters of credit | 24 | — | 24 | — | — | ||||||||||||||||||
Purchase commitments(3) | 1,377 | 1,377 | — | — | — | ||||||||||||||||||
Other(4) | 56 | 6 | 19 | 27 | 4 | ||||||||||||||||||
| Total commercial commitments | $ | 1,633 | $ | 1,383 | $ | 219 | $ | 27 | $ | 4 | |||||||||||||
| (1) | The |
| (2) | The Company’s other liabilities in the Consolidated Balance Sheet as of | |
| Total | Amount of Commitment Expiration by Period | |||||||||||||||
| Amounts | Less than | 2 –3 | 3 –5 | After 5 | ||||||||||||
| Other Commercial Commitments | Committed | 1Year | Years | Years | Years | |||||||||||
| (in millions) | ||||||||||||||||
| Line of credit | $ | 186 | $ | — | $ | 186 | $ | — | $ — | |||||||
| Stand-by letters of credit | 14 | — | 14 | — | — | |||||||||||
| Purchase commitments(3) | 1,676 | 1,670 | 5 | 1 | — | |||||||||||
| Other(4) | 53 | 25 | 21 | 7 | — | |||||||||||
| Total commercial commitments | $ | 1,929 | $ | 1,695 | $ | 226 | $ | 8 | $ — | |||||||
| ____________________ | ||||||||||||||||
| (3) | Represents open purchase orders, as well as minimum required purchases under merchandise contractual agreements, at |
| (4) | Represents | |
15
Critical Accounting Policies
17
Statements and Supplementary Data” is a summary of the Company’s most significant accounting policies. In some cases, management is required to calculate amounts based on estimates for matters that are inherently uncertain. The Company believes the following to be the most critical of those accounting policies that necessitate subjective judgments.
Merchandise Inventories
Vendor AllowancesReimbursements
Impairment of Long-Lived Assets
16
18
exceeds its estimated fair value. The fair value of each of the Company’s reporting units exceeded its carrying value as of February 2, 2003.the beginning of the year. The Company used a combination of a discounted cash flow approach and market-based approach to determine the fair value of a reporting unit, whichunit. The latter requires judgment and uses one or more methods to compare the reporting unit with similar businesses, business ownership interests or securities that have been sold.
During 2006, the Company recorded an impairment charge of $17 million ($12 million after-tax) to write-down long-lived assets such as store fixtures and leasehold improvements in 69 stores in the European operations to their estimated fair value.
Share-Based Compensation
The Company estimates the fair value of options granted using the Black-Scholes option pricing model. The Company estimates the expected term of options granted using its historical exercise and post-vesting employment termination patterns, which the Company believes are representative of future behavior. Changing the expected term by one year changes the fair value by 10 to 15 percent depending if the change was an increase or decrease to the expected term. The Company estimates the expected volatility of its common stock at the grant date using a weighted-average of the Company’s historical volatility and implied volatility from traded options on the Company’s common stock. A 50 basis point change in volatility would have a 1 percent change to the fair value. The risk-free interest rate assumption is determined using the Federal Reserve nominal rates for U.S. Treasury zero-coupon bonds with maturities similar to those of the expected term of the award being valued. The expected dividend yield is derived from the Company’s historical experience. A 50 basis point change to the dividend yield would change the fair value by approximately 5 percent. The Company records stock-based compensation expense only for those awards expected to vest using an estimated forfeiture rate based on its historical pre-vesting forfeiture data, which it believes are representative of future behavior, and periodically will revise those estimates in subsequent periods if actual forfeitures differ from those estimates.
The Black-Scholes option valuation model requires the use of subjective assumptions. Changes in these assumptions can materially affect the fair value of the options. The Company may elect to use different assumptions under the Black-Scholes option pricing model in the future if there is a difference between the assumptions used in determining stock-based compensation cost and the actual factors that become known over time.
The guidance in SFAS No. 123(R) is relatively new and best practices are not well established. The application of these principles may be subject to further interpretation and refinement over time. There are significant differences among valuation models and there is a possibility that the Company will adopt different valuation models and assumptions in the future. This may result in both a lack of comparability with other companies that use different models, methods, and assumptions, and in a lack of consistency in future periods.
Pension and Postretirement Liabilities
Long-Term Rate of Return Assumption - The expected long-term rate of return on invested plan assets is a component of pension expense and the rate is based on the plans’ weighted-average target asset allocation of 64 percent equity securities and 36 percent fixed income investments, as well as historical and future expected performance of those assets. The target asset allocation is selected to obtain an investment return that is sufficient to cover the expected benefit payments based on the timing of settlements and to reduce future contributions by the Company. The Company’s common stock represented approximately two1 percent of the total pension plans’ assets at January 31, 2004.February 3, 2007. A decrease of 50 basis points in the weighted-average expected long-term rate of return would have increased 20032006 pension expense by approximately $2.5$3 million. The actual return on plan assets in a given year may differ from the expected long-term rate of return and the resulting gain or loss is deferred and amortized into the plans’ performance over time.
19
Discount Rate - An assumed discount rate is used to measure the present value of future cash flow obligations of the plans and the interest cost component of pension expense and postretirement income. The discount rate selected to measure the present value of the Company’s benefit obligations as of February 3, 2007 was derived using a cash flow matching method whereby the Company compares the plans’ projected payment obligations by year with the corresponding yield on the Citibank Pension Discount Curve. The cash flows are then discounted to their present value and an overall discount rate is selected with reference to the long-term corporate bond yield.determined. A decrease of 50 basis points in the weighted-average discount rate would have increased the accumulated benefit obligation as of January 31, 2004February 3, 2007 of the pension and postretirement plansplan by approximately $30$28 million and approximately $0.6 million, respectively.the effect on the postretirement plan would not be significant. Such a decrease would not have significantly changed 20032006 pension expense or postretirement income.
There is limited risk to the Company for increases in healthcare costs related to the postretirement plan as, beginning in 2001, new retirees have assumed the full expected costs and then existing retirees and future retirees have assumed all increases in such costs since the beginning of fiscal year 2001. The additional minimum liability included in shareholders’ equity at January 31, 2004 for the pension plans represented the amount by which the accumulated benefit obligation exceeded the fair market value of the plan assets. The Company was able to reduce the additional minimum liability by $16 million during 2003 to reflect the better performance of the plans’ assets as well as a $50 million contribution made in February 2003.
Income Taxes
In accordance with GAAP, deferred tax assets are recognized for tax credit and net operating loss carryforwards, reduced by a valuation allowance, which is established when it is more likely than not that some portion or all of the deferred tax assets will not be realized. Management is required to estimate taxable income for future years by taxing jurisdiction and to use its judgment to determine whether or not to record a valuation allowance for part or all of a deferred tax asset. A one percent change in the Company’s overall statutory tax rate for 2006 would have resulted in a $3 million change in the carrying value of the net deferred tax asset and a corresponding charge or credit to income tax expense woulddepending on whether such tax rate change was a decrease or increase.
The Company has operations in multiple taxing jurisdictions and is subject to audit in these jurisdictions. Tax audits by their nature are often complex and can require several years to resolve. Accruals of tax contingencies require management to make estimates and judgments with respect to the ultimate outcome of tax audits. Actual results could vary from these estimates.
The Company expects its 2007 effective tax rate to be $22 millionapproximately 37.5 percent. The actual rate will primarily depend upon the percentage of the Company’s income earned in 2004 had the Company not made the $44 million contribution to its U.S. qualified retirement plan and the $6 million required contribution to its Canadian qualified retirement plan.
Discontinued, Repositioning and Restructuring Reserves
17
Income Taxes
Business Concentration
18
20
Disclosure Regarding Forward-Looking Statements
Item 7A. Quantitative and Qualitative Disclosures About Market Risk
19
21
Item 8. Consolidated Financial Statements and Supplementary Data
MANAGEMENT’S REPORT
 | |
| MATTHEW D. SERRA, | ROBERT W. MCHUGH, |
| Chairman of the Board, | Senior Vice President and |
| President and Chief Executive Officer | Chief Financial Officer |
22

MATTHEW D. SERRA, ChairmanMANAGEMENT’S REPORT ON INTERNAL CONTROL OVER FINANCIAL REPORTING
The management of the Board, PresidentCompany is responsible for establishing andChief Executive Officer

BRUCE L. HARTMAN,Executive Vice President and ChiefThe Company’s independent registered public accounting firm has issued their attestation report on management’s assessment of the Company’s internal control over financial reporting. That report appears in this Annual Report on Form 10-K under the heading,Report of Independent Registered Public Accounting Firm on Internal Control Over Financial OfficerReporting
 |  |
| MATTHEW D. SERRA, | ROBERT W. MCHUGH, |
| Chairman of the Board, | Senior Vice President and |
| President and Chief Executive Officer | Chief Financial Officer |
April 1, 20042, 2007
20
23
REPORT OF INDEPENDENT AUDITORS’ REPORTREGISTERED PUBLIC ACCOUNTING FIRM
To theThe Board of Directors and Shareholders of
Foot Locker, Inc.

/s/ KPMG LLP
New York, New YorkMarchApril 2, 20042007
21
24
REPORT OF INDEPENDENT REGISTERED PUBLIC ACCOUNTING FIRM ON INTERNAL CONTROL OVER FINANCIAL REPORTING
The Board of Directors and Shareholders of
Foot Locker, Inc.
We have audited management’s assessment, included in the accompanying Management’s Report on Internal Control Over Financial Reporting, that Foot Locker, Inc. maintained effective internal control over financial reporting as of February 3, 2007, based on criteria established in Internal Control—Integrated Framework issued by the Committee of Sponsoring Organizations of the Treadway Commission (COSO). Foot Locker, Inc.’s management is responsible for maintaining effective internal control over financial reporting and for its assessment of the effectiveness of internal control over financial reporting. Our responsibility is to express an opinion on management’s assessment and an opinion on the effectiveness of the Company’s internal control over financial reporting based on our audit.
We conducted our audit in accordance with the standards of the Public Company Accounting Oversight Board (United States). Those standards require that we plan and perform the audit to obtain reasonable assurance about whether effective internal control over financial reporting was maintained in all material respects. Our audit included obtaining an understanding of internal control over financial reporting, evaluating management’s assessment, testing and evaluating the design and operating effectiveness of internal control, and performing such other procedures as we considered necessary in the circumstances. We believe that our audit provides a reasonable basis for our opinion.
A company’s internal control over financial reporting is a process designed to provide reasonable assurance regarding the reliability of financial reporting and the preparation of financial statements for external purposes in accordance with generally accepted accounting principles. A company’s internal control over financial reporting includes those policies and procedures that (1) pertain to the maintenance of records that, in reasonable detail, accurately and fairly reflect the transactions and dispositions of the assets of the company; (2) provide reasonable assurance that transactions are recorded as necessary to permit preparation of financial statements in accordance with generally accepted accounting principles, and that receipts and expenditures of the company are being made only in accordance with authorizations of management and directors of the company; and (3) provide reasonable assurance regarding prevention or timely detection of unauthorized acquisition, use, or disposition of the company’s assets that could have a material effect on the financial statements.
Because of its inherent limitations, internal control over financial reporting may not prevent or detect misstatements. Also, projections of any evaluation of effectiveness to future periods are subject to the risk that controls may become inadequate because of changes in conditions, or that the degree of compliance with the policies or procedures may deteriorate.
In our opinion, management’s assessment that Foot Locker, Inc. maintained effective internal control over financial reporting as of February 3, 2007, is fairly stated, in all material respects, based on criteria established in Internal Control—Integrated Framework issued by the Committee of Sponsoring Organizations of the Treadway Commission (COSO). Also, in our opinion, Foot Locker, Inc. maintained, in all material respects, effective internal control over financial reporting as of February 3, 2007, based on criteria established in Internal Control—Integrated Framework issued by the Committee of Sponsoring Organizations of the Treadway Commission (COSO).
We also have audited, in accordance with the standards of the Public Company Accounting Oversight Board (United States), the consolidated balance sheets of Foot Locker, Inc. and subsidiaries as of February 3, 2007 and January 28, 2006, and the related consolidated statements of operations, comprehensive income, shareholders’ equity, and cash flows for each of the years in the three-year period ended February 3, 2007, and our report dated April 2, 2007 expressed an unqualified opinion on those consolidated financial statements.
/s/ KPMG LLP
New York, New York
April 2, 2007
25
CONSOLIDATED STATEMENTS OF OPERATIONS
| 2003 | 2002 | 2001 | |||||||||||||
|---|---|---|---|---|---|---|---|---|---|---|---|---|---|---|---|
| (in millions, except per share amounts) | |||||||||||||||
Sales | $ | 4,779 | $ | 4,509 | $ | 4,379 | |||||||||
| Costs and expenses | |||||||||||||||
| Cost of sales | 3,302 | 3,165 | 3,071 | ||||||||||||
| Selling, general and administrative expenses | 987 | 928 | 923 | ||||||||||||
| Depreciation and amortization | 147 | 149 | 154 | ||||||||||||
| Restructuring charges (income) | 1 | (2 | ) | 34 | |||||||||||
| Interest expense, net | 18 | 26 | 24 | ||||||||||||
| 4,455 | 4,266 | 4,206 | |||||||||||||
| Other income | — | (3 | ) | (2 | ) | ||||||||||
| 4,455 | 4,263 | 4,204 | |||||||||||||
| Income from continuing operations before income taxes | 324 | 246 | 175 | ||||||||||||
| Income tax expense | 115 | 84 | 64 | ||||||||||||
Income from continuing operations | 209 | 162 | 111 | ||||||||||||
| Loss on disposal of discontinued operations, net of income tax benefit of $4, $2, and $—, respectively | (1 | ) | (9 | ) | (19 | ) | |||||||||
| Cumulative effect of accounting change, net of income tax benefit of $— | (1 | ) | — | — | |||||||||||
Net income | $ | 207 | $ | 153 | $ | 92 | |||||||||
| Basic earnings per share: | |||||||||||||||
| Income from continuing operations | $ | 1.47 | $ | 1.15 | $ | 0.79 | |||||||||
| Loss from discontinued operations | (0.01 | ) | (0.06 | ) | (0.13 | ) | |||||||||
| Cumulative effect of accounting change | — | — | — | ||||||||||||
| Net income | $ | 1.46 | $ | 1.09 | $ | 0.66 | |||||||||
| Diluted earnings per share: | |||||||||||||||
| Income from continuing operations | $ | 1.40 | $ | 1.10 | $ | 0.77 | |||||||||
| Loss from discontinued operations | (0.01 | ) | (0.05 | ) | (0.13 | ) | |||||||||
| Cumulative effect of accounting change | — | — | — | ||||||||||||
| Net income | $ | 1.39 | $ | 1.05 | $ | 0.64 | |||||||||
| 2006 | 2005 | 2004 | ||||||||
| (in millions, except per share amounts) | ||||||||||
| Sales | $ | 5,750 | $ | 5,653 | $ | 5,355 | ||||
| Costs and expenses | ||||||||||
| Cost of sales | 4,014 | 3,944 | 3,722 | |||||||
| Selling, general and administrative expenses | 1,163 | 1,129 | 1,090 | |||||||
| Depreciation and amortization | 175 | 171 | 154 | |||||||
| Impairment charge | 17 | — | — | |||||||
| Interest expense, net | 3 | 10 | 15 | |||||||
| 5,372 | 5,254 | 4,981 | ||||||||
| Other income | (14 | ) | (6 | ) | — | |||||
| 5,358 | 5,248 | 4,981 | ||||||||
| Income from continuing operations before income taxes | 392 | 405 | 374 | |||||||
| Income tax expense | 145 | 142 | 119 | |||||||
| Income from continuing operations | 247 | 263 | 255 | |||||||
| Income on disposal of discontinued operations, | ||||||||||
| net of income tax benefit of $1, $3, and $37, respectively | 3 | 1 | 38 | |||||||
| Cumulative effect of accounting change, | ||||||||||
| net of income tax benefit of $ — | 1 | — | — | |||||||
| Net income | $ | 251 | $ | 264 | $ | 293 | ||||
| Basic earnings per share: | ||||||||||
| Income from continuing operations | $ | 1.59 | $ | 1.70 | $ | 1.69 | ||||
| Income from discontinued operations | 0.02 | 0.01 | 0.25 | |||||||
| Cumulative effect of accounting change | 0.01 | — | — | |||||||
| Net income | $ | 1.62 | $ | 1.71 | $ | 1.94 | ||||
| Diluted earnings per share: | ||||||||||
| Income from continuing operations | $ | 1.58 | $ | 1.67 | $ | 1.64 | ||||
| Income from discontinued operations | 0.02 | 0.01 | 0.24 | |||||||
| Cumulative effect of accounting change | — | — | — | |||||||
| Net income | $ | 1.60 | $ | 1.68 | $ | 1.88 | ||||
See Accompanying Notes to Consolidated Financial Statements.
22
26
CONSOLIDATED STATEMENTS OF COMPREHENSIVE INCOME (LOSS)
| 2003 | 2002 | 2001 | |||||||||||||
|---|---|---|---|---|---|---|---|---|---|---|---|---|---|---|---|
| (in millions) | |||||||||||||||
Net income | $ | 207 | $ | 153 | $ | 92 | |||||||||
Other comprehensive income (loss), net of tax | |||||||||||||||
Foreign currency translation adjustment: | |||||||||||||||
| Translation adjustment arising during the period | 31 | 38 | (12 | ) | |||||||||||
Cash flow hedges: | |||||||||||||||
| Cumulative effect of accounting change, net of income tax expense of $1 | — | — | 1 | ||||||||||||
| Change in fair value of derivatives, net of income tax | — | — | — | ||||||||||||
| Reclassification adjustments, net of income tax benefit of $1 | (1 | ) | — | (1 | ) | ||||||||||
Net change in cash flow hedges | (1 | ) | — | — | |||||||||||
Minimum pension liability adjustment: | |||||||||||||||
| Minimum pension liability adjustment, net of deferred tax expense (benefit) of $10, $(56) and $(71), respectively | 16 | (83 | ) | (115 | ) | ||||||||||
Comprehensive income (loss) | $ | 253 | $ | 108 | $ | (35 | ) | ||||||||
| 2006 | 2005 | 2004 | |||||||||
| (in millions) | |||||||||||
| Net income | $ | 251 | $ | 264 | $ | 293 | |||||
| Other comprehensive income, net of tax | |||||||||||
| Foreign currency translation adjustment: | |||||||||||
| Translation adjustment arising during the period, net of tax | 27 | (25 | ) | 19 | |||||||
| Cash flow hedges: | |||||||||||
| Change in fair value of derivatives, net of income tax | — | 2 | (1 | ) | |||||||
| Reclassification adjustments, net of income tax | — | (1 | ) | 1 | |||||||
| Net change in cash flow hedges | — | 1 | — | ||||||||
| Minimum pension liability adjustment: | |||||||||||
| Minimum pension liability adjustment, net of deferred tax expense | |||||||||||
| (benefit) of $120, $10 and $(9) million, respectively | 181 | 15 | (14 | ) | |||||||
| Comprehensive income | $ | 459 | $ | 255 | $ | 298 | |||||
See Accompanying Notes to Consolidated Financial Statements.
23
27
CONSOLIDATED BALANCE SHEETS
| 2003 | 2002 | ||||||||||
|---|---|---|---|---|---|---|---|---|---|---|---|
| (in millions) | |||||||||||
ASSETS | |||||||||||
Current assets | |||||||||||
| Cash and cash equivalents | $ | 448 | $ | 357 | |||||||
| Merchandise inventories | 920 | 835 | |||||||||
| Assets of discontinued operations | 2 | 2 | |||||||||
| Other current assets | 149 | 90 | |||||||||
| 1,519 | 1,284 | ||||||||||
Property and equipment, net | 644 | 636 | |||||||||
Deferred taxes | 194 | 240 | |||||||||
Goodwill | 136 | 136 | |||||||||
Intangible assets, net | 96 | 80 | |||||||||
Other assets | 100 | 110 | |||||||||
| $ | 2,689 | $ | 2,486 | ||||||||
LIABILITIES AND SHAREHOLDERS’ EQUITY | |||||||||||
Current liabilities | |||||||||||
| Accounts payable | $ | 234 | $ | 251 | |||||||
| Accrued liabilities | 300 | 296 | |||||||||
| Liabilities of discontinued operations | 2 | 3 | |||||||||
| Current portion of repositioning and restructuring reserves | 1 | 3 | |||||||||
| Current portion of reserve for discontinued operations | 8 | 18 | |||||||||
| Current portion of long-term debt and obligations under capital leases | — | 1 | |||||||||
| 545 | 572 | ||||||||||
Long-term debt and obligations under capital leases | 335 | 356 | |||||||||
Other liabilities | 434 | 448 | |||||||||
Total liabilities | 1,314 | 1,376 | |||||||||
Shareholders’ equity | 1,375 | 1,110 | |||||||||
| $ | 2,689 | $ | 2,486 | ||||||||
| 2006 | 2005 | ||||
| (in millions) | |||||
| ASSETS | |||||
| Current assets | |||||
| Cash and cash equivalents | $ | 221 | $ | 289 | |
| Short-term investments | 249 | 298 | |||
| Total cash, cash equivalents and short-term investments | 470 | 587 | |||
| Merchandise inventories | 1,303 | 1,254 | |||
| Other current assets | 261 | 173 | |||
| 2,034 | 2,014 | ||||
| Property and equipment, net | 654 | 675 | |||
| Deferred taxes | 109 | 147 | |||
| Goodwill | 264 | 263 | |||
| Intangible assets, net | 105 | 117 | |||
| Other assets | 83 | 96 | |||
| $ | 3,249 | $ | 3,312 | ||
| LIABILITIES AND SHAREHOLDERS’ EQUITY | |||||
| Current liabilities | |||||
| Accounts payable | $ | 256 | $ | 361 | |
| Accrued and other liabilities | 246 | 305 | |||
| Current portion of long-term debt and obligations under capital leases | 14 | 51 | |||
| 516 | 717 | ||||
| Long-term debt and obligations under capital leases | 220 | 275 | |||
| Other liabilities | 218 | 293 | |||
| Total liabilities | 954 | 1,285 | |||
| Shareholders’ equity | 2,295 | 2,027 | |||
| $ | 3,249 | $ | 3,312 | ||
See Accompanying Notes to Consolidated Financial Statements.
24
28
CONSOLIDATED STATEMENTS OF SHAREHOLDERS’ EQUITY
| 2003 | 2002 | 2001 | |||||||||||||||||||||||||
|---|---|---|---|---|---|---|---|---|---|---|---|---|---|---|---|---|---|---|---|---|---|---|---|---|---|---|---|
| Shares | Amount | Shares | Amount | Shares | Amount | ||||||||||||||||||||||
| (shares in thousands, amounts in millions) | |||||||||||||||||||||||||||
Common Stock and Paid-In Capital | |||||||||||||||||||||||||||
| Par value $0.01 per share, 500 million shares authorized | |||||||||||||||||||||||||||
| Issued at beginning of year | 141,180 | $ | 378 | 139,981 | $ | 363 | 138,691 | $ | 351 | ||||||||||||||||||
| Restricted stock issued under stock option and award plans | 845 | — | 60 | — | 210 | (2 | ) | ||||||||||||||||||||
| Forfeitures of restricted stock | — | 1 | — | 1 | — | 1 | |||||||||||||||||||||
| Amortization of stock issued under restricted stock option plans | — | 4 | — | 2 | — | 2 | |||||||||||||||||||||
| Issued under director and employee stock plans, net of tax | 1,984 | 28 | 1,139 | 12 | 1,080 | 11 | |||||||||||||||||||||
| Issued at end of year | 144,009 | 411 | 141,180 | 378 | 139,981 | 363 | |||||||||||||||||||||
| Common stock in treasury at beginning of year | (105 | ) | (1 | ) | (70 | ) | — | (200 | ) | (2 | ) | ||||||||||||||||
| Reissued under employee stock plans | 152 | 1 | — | — | 192 | 1 | |||||||||||||||||||||
| Restricted stock issued under stock option and award plans | — | — | 30 | — | 210 | 2 | |||||||||||||||||||||
| Forfeitures of restricted stock | (80 | ) | (1 | ) | (60 | ) | (1 | ) | (270 | ) | (1 | ) | |||||||||||||||
| Exchange of options | (24 | ) | — | (5 | ) | — | (2 | ) | — | ||||||||||||||||||
| Common stock in treasury at end of year | (57 | ) | (1 | ) | (105 | ) | (1 | ) | (70 | ) | — | ||||||||||||||||
| 143,952 | 410 | 141,075 | 377 | 139,911 | 363 | ||||||||||||||||||||||
Retained Earnings | |||||||||||||||||||||||||||
| Balance at beginning of year | 946 | 797 | 705 | ||||||||||||||||||||||||
| Net income | 207 | 153 | 92 | ||||||||||||||||||||||||
| Cash dividends declared on common stock $0.15, $0.03 and $— per share, respectively | (21 | ) | (4 | ) | — | ||||||||||||||||||||||
| Balance at end of year | 1,132 | 946 | 797 | ||||||||||||||||||||||||
Accumulated Other Comprehensive Loss | |||||||||||||||||||||||||||
Foreign Currency Translation Adjustment | |||||||||||||||||||||||||||
| Balance at beginning of year | (15 | ) | (53 | ) | (41 | ) | |||||||||||||||||||||
| Translation adjustment arising during the period | 31 | 38 | (12 | ) | |||||||||||||||||||||||
| Balance at end of year | 16 | (15 | ) | (53 | ) | ||||||||||||||||||||||
Cash Flow Hedges | |||||||||||||||||||||||||||
| Balance at beginning of year | — | — | — | ||||||||||||||||||||||||
| Change during year, net of tax | (1 | ) | — | — | |||||||||||||||||||||||
| Balance at end of year | (1 | ) | — | — | |||||||||||||||||||||||
Minimum Pension Liability Adjustment | |||||||||||||||||||||||||||
| Balance at beginning of year | (198 | ) | (115 | ) | — | ||||||||||||||||||||||
| Change during year, net of tax | 16 | (83 | ) | (115 | ) | ||||||||||||||||||||||
| Balance at end of year | (182 | ) | (198 | ) | (115 | ) | |||||||||||||||||||||
Total Accumulated Other Comprehensive Loss | (167 | ) | (213 | ) | (168 | ) | |||||||||||||||||||||
Total Shareholders’ Equity | $ | 1,375 | $ | 1,110 | $ | 992 | |||||||||||||||||||||
| 2006 | 2005 | 2004 | ||||||||||||||||||
| Shares | Amount | Shares | Amount | Shares | Amount | |||||||||||||||
| (shares in thousands, amounts in millions) | ||||||||||||||||||||
| Common Stock and Paid-In Capital | ||||||||||||||||||||
| Par value $0.01 per share, 500 million shares authorized | ||||||||||||||||||||
| Issued at beginning of year | 157,280 | $ | 635 | 156,155 | $ | 608 | 144,009 | $ | 411 | |||||||||||
| Restricted stock issued under stock option and award plans | — | (3 | ) | 225 | — | 400 | — | |||||||||||||
| Forfeitures of restricted stock | — | — | — | 2 | — | 2 | ||||||||||||||
| Share-based compensation expense | — | 10 | — | 6 | — | 8 | ||||||||||||||
| Conversion of convertible debt | — | — | — | — | 9,490 | 150 | ||||||||||||||
| Reclassification of convertible debt issuance costs | — | — | — | — | — | (3 | ) | |||||||||||||
| Issued under director and employee stock plans, net of tax | 530 | 11 | 900 | 19 | 2,256 | 40 | ||||||||||||||
| Issued at end of year | 157,810 | 653 | 157,280 | 635 | 156,155 | 608 | ||||||||||||||
| Common stock in treasury at beginning of year | (1,776 | ) | (38 | ) | (64 | ) | (2 | ) | (57 | ) | (1 | ) | ||||||||
| Reissued under employee stock plans | 122 | 3 | 90 | 2 | 260 | 5 | ||||||||||||||
| Restricted stock issued under stock option and award plans | 157 | 3 | — | — | — | — | ||||||||||||||
| Forfeitures/cancellations of restricted stock | (30 | ) | (1 | ) | (135 | ) | (2 | ) | (100 | ) | (2 | ) | ||||||||
| Shares of common stock used to satisfy tax | ||||||||||||||||||||
| withholding obligations | (241 | ) | (6 | ) | (49 | ) | (1 | ) | (137 | ) | (3 | ) | ||||||||
| Stock repurchases | (334 | ) | (8 | ) | (1,590 | ) | (35 | ) | — | — | ||||||||||
| Exchange of options | (5 | ) | — | (28 | ) | — | (30 | ) | (1 | ) | ||||||||||
| Common stock in treasury at end of year | (2,107 | ) | (47 | ) | (1,776 | ) | (38 | ) | (64 | ) | (2 | ) | ||||||||
| 155,703 | 606 | 155,504 | 597 | 156,091 | 606 | |||||||||||||||
| Retained Earnings | ||||||||||||||||||||
| Balance at beginning of year | 1,601 | 1,386 | 1,132 | |||||||||||||||||
| Cumulative effect of adjustments resulting from | ||||||||||||||||||||
| the adoption of SAB 108, net of tax (see note 2) | (6 | ) | — | — | ||||||||||||||||
| Adjusted balance at beginning of year | 1,595 | 1,386 | 1,132 | |||||||||||||||||
| Net income | 251 | 264 | 293 | |||||||||||||||||
| Cash dividends declared on common stock | ||||||||||||||||||||
| $0.40, $0.32 and $0.26 per share, respectively | (61 | ) | (49 | ) | (39 | ) | ||||||||||||||
| Balance at end of year | 1,785 | 1,601 | 1,386 | |||||||||||||||||
| Accumulated Other Comprehensive Loss | ||||||||||||||||||||
| Foreign Currency Translation Adjustment | ||||||||||||||||||||
| Balance at beginning of year | 10 | 35 | 16 | |||||||||||||||||
| Translation adjustment arising during the period, net of tax | 27 | (25 | ) | 19 | ||||||||||||||||
| Balance at end of year | 37 | 10 | 35 | |||||||||||||||||
| Cash Flow Hedges | ||||||||||||||||||||
| Balance at beginning of year | — | (1 | ) | (1 | ) | |||||||||||||||
| Change during year, net of tax | — | 1 | — | |||||||||||||||||
| Balance at end of year | — | — | (1 | ) | ||||||||||||||||
| Minimum Pension Liability Adjustment | ||||||||||||||||||||
| Balance at beginning of year | (181 | ) | (196 | ) | (182 | ) | ||||||||||||||
| Change during year, net of tax | 181 | 15 | (14 | ) | ||||||||||||||||
| Balance at end of year | — | (181 | ) | (196 | ) | |||||||||||||||
| Adjustment related to initial application of | ||||||||||||||||||||
| SFAS No. 158, net of tax (see note 21) | (133 | ) | — | — | ||||||||||||||||
| Total Accumulated Other Comprehensive Loss | (96 | ) | (171 | ) | (162 | ) | ||||||||||||||
| Total Shareholders’ Equity | $ | 2,295 | $ | 2,027 | $ | 1,830 | ||||||||||||||
See Accompanying Notes to Consolidated Financial Statements.
25
29
CONSOLIDATED STATEMENTS OF CASH FLOWS
| 2003 | 2002 | 2001 | |||||||||||||
|---|---|---|---|---|---|---|---|---|---|---|---|---|---|---|---|
| (in millions) | |||||||||||||||
From Operating Activities | |||||||||||||||
| Net income | $ | 207 | $ | 153 | $ | 92 | |||||||||
| Adjustments to reconcile net income to net cash provided by operating activities of continuing operations: | |||||||||||||||
| Loss on disposal of discontinued operations, net of tax | 1 | 9 | 19 | ||||||||||||
| Restructuring charges (income) | 1 | (2 | ) | 34 | |||||||||||
| Cumulative effect of accounting change, net of tax | 1 | — | — | ||||||||||||
| Depreciation and amortization | 147 | 149 | 154 | ||||||||||||
| Impairment of long-lived assets | — | 7 | 2 | ||||||||||||
| Restricted stock compensation expense | 4 | 2 | 2 | ||||||||||||
| Tax benefit on stock compensation | 2 | 2 | 2 | ||||||||||||
| Gains on sales of real estate and assets | — | (3 | ) | (2 | ) | ||||||||||
| Deferred income taxes | (5 | ) | 38 | 38 | |||||||||||
| Change in assets and liabilities, net of dispositions: | |||||||||||||||
| Merchandise inventories | (63 | ) | (22 | ) | (69 | ) | |||||||||
| Accounts payable and other accruals | (17 | ) | (22 | ) | 9 | ||||||||||
| Repositioning and restructuring reserves | (1 | ) | (3 | ) | (62 | ) | |||||||||
| Pension contribution | (50 | ) | — | — | |||||||||||
| Income taxes | 9 | 42 | (45 | ) | |||||||||||
| Other, net | 28 | (3 | ) | 30 | |||||||||||
| Net cash provided by operating activities of continuing operations | 264 | 347 | 204 | ||||||||||||
From Investing Activities | |||||||||||||||
| Proceeds from sales of real estate and assets | — | 6 | 20 | ||||||||||||
| Lease acquisition costs | (15 | ) | (18 | ) | (20 | ) | |||||||||
| Capital expenditures | (144 | ) | (150 | ) | (116 | ) | |||||||||
| Net cash used in investing activities of continuing operations | (159 | ) | (162 | ) | (116 | ) | |||||||||
From Financing Activities | |||||||||||||||
| Issuance of convertible long-term debt | — | — | 150 | ||||||||||||
| Debt issuance costs | — | — | (8 | ) | |||||||||||
| Reduction in long-term debt | (19 | ) | (41 | ) | (58 | ) | |||||||||
| Reduction in capital lease obligations | — | (1 | ) | (4 | ) | ||||||||||
| Dividends paid on common stock | (21 | ) | (4 | ) | — | ||||||||||
| Issuance of common stock | 27 | 10 | 9 | ||||||||||||
| Net cash (used in) provided by financing activities of continuing operations | (13 | ) | (36 | ) | 89 | ||||||||||
Net Cash Provided by (Used in) Discontinued Operations | 7 | (10 | ) | (75 | ) | ||||||||||
Effect of Exchange Rate Fluctuations on Cash and Cash Equivalents | (8 | ) | 3 | 4 | |||||||||||
Net Change in Cash and Cash Equivalents | 91 | 142 | 106 | ||||||||||||
Cash and Cash Equivalents at Beginning of Year | 357 | 215 | 109 | ||||||||||||
Cash and Cash Equivalents at End of Year | $ | 448 | $ | 357 | $ | 215 | |||||||||
Cash Paid During the Year: | |||||||||||||||
| Interest | $ | 25 | $ | 27 | $ | 36 | |||||||||
| Income taxes | $ | 77 | $ | 39 | $ | 35 | |||||||||
| 2006 | 2005 | 2004 | |||||||||
| (in millions) | |||||||||||
| From Operating Activities | |||||||||||
| Net income | $ | 251 | $ | 264 | $ | 293 | |||||
| Adjustments to reconcile net income to net cash provided by operating | |||||||||||
| activities of continuing operations: | |||||||||||
| Income on disposal of discontinued operations, net of tax | (3 | ) | (1 | ) | (38 | ) | |||||
| Impairment charge | 17 | — | — | ||||||||
| Cumulative effect of accounting change, net of tax | (1 | ) | — | — | |||||||
| Depreciation and amortization | 175 | 171 | 154 | ||||||||
| Share-based compensation expense | 10 | 6 | 8 | ||||||||
| Deferred income taxes | 21 | 24 | 50 | ||||||||
| Change in assets and liabilities: | |||||||||||
| Merchandise inventories | (38 | ) | (111 | ) | (183 | ) | |||||
| Accounts payable and other accruals | (103 | ) | 14 | 157 | |||||||
| Qualified pension plan contributions | (68 | ) | (26 | ) | (106 | ) | |||||
| Income taxes | (3 | ) | (8 | ) | — | ||||||
| Other, net | (69 | ) | 16 | (63 | ) | ||||||
| Net cash provided by operating activities of continuing operations | 189 | 349 | 272 | ||||||||
| From Investing Activities | |||||||||||
| Acquisitions | — | 1 | (242 | ) | |||||||
| Gain from lease termination | 4 | — | — | ||||||||
| Gain from insurance recoveries | 4 | 3 | — | ||||||||
| Purchases of short-term investments | (1,992 | ) | (2,798 | ) | (2,884 | ) | |||||
| Sales of short-term investments | 2,041 | 2,767 | 2,875 | ||||||||
| Capital expenditures | (165 | ) | (155 | ) | (156 | ) | |||||
| Net cash used in investing activities of continuing operations | (108 | ) | (182 | ) | (407 | ) | |||||
| From Financing Activities | |||||||||||
| Debt issuance costs | — | — | (2 | ) | |||||||
| (Reduction) increase in long-term debt | (86 | ) | (35 | ) | 175 | ||||||
| Repayment of capital lease | (1 | ) | — | — | |||||||
| Dividends paid on common stock | (61 | ) | (49 | ) | (39 | ) | |||||
| Issuance of common stock | 9 | 12 | 28 | ||||||||
| Treasury stock reissued under employee stock plans | 3 | 2 | 5 | ||||||||
| Purchase of treasury shares | (8 | ) | (35 | ) | — | ||||||
| Tax benefit on stock compensation | 2 | — | — | ||||||||
| Net cash (used in) provided by financing activities of continuing operations | (142 | ) | (105 | ) | 167 | ||||||
| Net Cash (Used In) Provided by operating activities of Discontinued Operations | (8 | ) | — | 1 | |||||||
| Effect of Exchange Rate Fluctuations on Cash and Cash Equivalents | 1 | 2 | 2 | ||||||||
| Net Change in Cash and Cash Equivalents | (68 | ) | 64 | 35 | |||||||
| Cash and Cash Equivalents at Beginning of Year | 289 | 225 | 190 | ||||||||
| Cash and Cash Equivalents at End of Year | $ | 221 | $ | 289 | $ | 225 | |||||
| Cash Paid During the Year: | |||||||||||
| Interest | $ | 20 | $ | 21 | $ | 23 | |||||
| Income taxes | $ | 133 | $ | 93 | $ | 121 | |||||
| Non-cash Financing Activities: | |||||||||||
| Common stock issued upon conversion of convertible debt | $ | — | $ | — | $ | 150 | |||||
| Debt issuance costs reclassified to equity upon conversion of convertible debt | $ | — | $ | — | $ | 3 | |||||
See Accompanying Notes to Consolidated Financial Statements.
26
30
NOTES TO CONSOLIDATED FINANCIAL STATEMENTS
1 Summary of Significant Accounting Policies
Basis of Presentation
Reporting Year
Revenue Recognition
Gift Cards
The Company sells gift cards to its customers; the cards do not have expiration dates. Revenue from Internet and cataloggift card sales is recognizedrecorded when the productgift cards are redeemed or when the likelihood of the gift card being redeemed by the customer is shippedremote and there is no legal obligation to customers. Sales include shippingremit the value of unredeemed gift cards to the relevant jurisdictions. The Company has determined its gift card breakage rate based upon historical redemption patterns. Historical experience indicates that after 12 months the likelihood of redemption is deemed to be remote. Gift card breakage income is included in selling, general and handling feesadministrative expenses and totaled $7 million in 2006 and $2 million, for both 2005 and 2004. Unredeemed gift cards are recorded as a current liability.
Statement of Cash Flows
The Company has selected to present the operations of the discontinued business as one line in the Consolidated Statements of Cash Flows. For all the periods presented.
Store Pre-Opening and Closing Costs
Advertising Costs and Sales Promotion
31
expense is incurred. Advertising costs asIn accordance with EITF 02-16, “Accounting by a component of selling, general and administrative expenses of $74.1 million in 2003, $73.8 million in 2002 and $79.7 million in 2001, net ofReseller for Cash Consideration from a Vendor,” the Company accounts for reimbursements for cooperative advertising of $23.4 million in 2003, $15.4 million in 2002 and $8.8 million in 2001. Income recognizedreceived in excess of expenses incurred related to specific, incremental advertising, during 2003 was recorded in accordance with EITF 02-16, which was applied as a reduction to the cost of merchandise and is reflected in cost of sales as the merchandise wasis sold.
Advertising costs, which are included as a component of selling, general and administrative expenses, net of reimbursements for cooperative advertising, were as follows:
| 2006 | 2005 | 2004 | |||||||||
| (in millions) | |||||||||||
| Advertising expenses | $ | 92.5 | $ | 99.0 | $ | 102.5 | |||||
| Cooperative advertising reimbursements | (23.0 | ) | (21.2 | ) | (24.8 | ) | |||||
| Net advertising expense | $ | 69.5 | $ | 77.8 | $ | 77.7 | |||||
Catalog Costs
Catalog costs, which are included as a component of selling, general and administrative expenses, of $38.9 million in 2003, $39.0 million in 2002 and $37.7 million in 2001 were net of reimbursements for cooperative reimbursements, of $3.5 million in 2003, $2.9 million in 2002 and $2.3 million in 2001. Prepaid catalog costs totaled $2.9 million and $3.5 million at January 31, 2004 and February 1, 2003, respectively.were as follows:
| 2006 | 2005 | 2004 | |||||||||
| (in millions) | |||||||||||
| Catalog costs | $ | 47.0 | $ | 48.2 | $ | 50.3 | |||||
| Cooperative reimbursements | (3.5 | ) | (3.0 | ) | (2.9 | ) | |||||
| Net catalog expense | $ | 43.5 | $ | 45.2 | $ | 47.4 | |||||
27
Earnings Per Share
| 2006 | 2005 | 2004 | ||||||
| (in millions) | ||||||||
| Income from continuing operations | $ | 247 | $ | 263 | $ | 255 | ||
| Effect of Dilution: | ||||||||
| Convertible debt(1) | — | — | 2 | |||||
| Income from continuing operations assuming dilution | $ | 247 | $ | 263 | $ | 257 | ||
| Weighted-average common shares outstanding | 155.0 | 155.1 | 150.9 | |||||
| Effect of Dilution: | ||||||||
| Stock options and awards | 1.8 | 2.5 | 3.0 | |||||
| Convertible debt(1) | — | — | 3.2 | |||||
| Weighted-average common shares outstanding | ||||||||
| assuming dilution | 156.8 | 157.6 | 157.1 | |||||
| (1) | In 2001, the Company issued $150 million of subordinated convertible notes due 2008. Effective June 4, 2004, all of the convertible subordinated notes were cancelled and approximately 9.5 million new shares of the Company’s common stock were issued. |
32
| 2003 | 2002 | 2001 | |||||||||||||
|---|---|---|---|---|---|---|---|---|---|---|---|---|---|---|---|
| (in millions) | |||||||||||||||
| Income from continuing operations | $ | 209 | $ | 162 | $ | 111 | |||||||||
Effect of Dilution: | |||||||||||||||
| Convertible debt | 5 | 5 | 3 | ||||||||||||
| Income from continuing operations assuming dilution | $ | 214 | $ | 167 | $ | 114 | |||||||||
| Weighted-average common shares outstanding | 141.6 | 140.7 | 139.4 | ||||||||||||
Effect of Dilution: | |||||||||||||||
| Stock options and awards | 1.8 | 0.6 | 1.3 | ||||||||||||
| Convertible debt | 9.5 | 9.5 | 6.2 | ||||||||||||
| Weighted-average common shares outstanding assuming dilution | 152.9 | 150.8 | 146.9 | ||||||||||||
Stock-BasedShare-Based Compensation
Prior to January 29, 2006, the Company accounted for these stock-based compensation plans in accordance with APB No. 25 and related interpretations. This method did not result in compensation cost for stock options and shares purchased under employee stock purchase plans. No compensation expense is notfor employee stock options was recorded, foras all stock options granted ifunder the stock option plans had an exercise price isthat was not less than the quoted market price at the date of grant. Compensation expense iswas also not recorded for employee purchases of stock under the 1994 Stock Purchase Plan. The plan, which is compensatoryemployee stock purchase plans as defined in SFAS No. 123, isit was considered non-compensatory as defined in APB No. 25. SFAS No. 123 requires disclosure of the impact on earnings per share if the fair value method of accounting for stock-based compensation is applied for companies electing to continue to account for stock-based plans under APB No. 25. Accounting forPrior to the Company’s stock-based compensation duringadoption of SFAS No. 123(R), as required under the three-year period ended January 31, 2004, in accordance with the fair value methoddisclosure provisions of SFAS No. 123, would have resulted inas amended, the following:
| 2003 | 2002 | 2001 | |||||||||||||
|---|---|---|---|---|---|---|---|---|---|---|---|---|---|---|---|
| (in millions, except per share amounts) | |||||||||||||||
| Net income: | |||||||||||||||
| As reported | $ | 207 | $ | 153 | $ | 92 | |||||||||
| Compensation expense included in reported net income, net of income tax benefit | 2 | 1 | 1 | ||||||||||||
| Total compensation expense under fair value method for all awards, net of income tax benefit | (7 | ) | (6 | ) | (7 | ) | |||||||||
| Pro forma | $ | 202 | $ | 148 | $ | 86 | |||||||||
| Basic earnings per share: | |||||||||||||||
| As reported | $ | 1.46 | $ | 1.09 | $ | 0.66 | |||||||||
| Pro forma | $ | 1.43 | $ | 1.05 | $ | 0.62 | |||||||||
| Diluted earnings per share: | |||||||||||||||
| As reported | $ | 1.39 | $ | 1.05 | $ | 0.64 | |||||||||
| Pro forma | $ | 1.36 | $ | 1.02 | $ | 0.61 | |||||||||
28
The Company has recorded an additional $6 million of stock-based compensation expense, net of estimated forfeitures, during 2006 as a result of its adoption of SFAS No. 123(R). During 2006, the Company recorded a cumulative effect of a change in accounting of $1 million to reflect estimated forfeitures for prior periods related to the Company’s nonvested restricted stock awards. Prior to the adoption of SFAS No. 123(R), the Company recognized compensation cost of restricted stock awards over the vesting term based upon the fair value of the pro forma impactCompany’s common stock at the date of grant. Forfeitures were recorded as they occurred, however under SFAS No. 123(R) an estimate of forfeitures is required to be included over the vesting term. Under SFAS No. 123(R), the Company will continue to recognize compensation expense over the vesting term, net of estimated forfeitures. See Note 22 for information on earnings per share. The disclosure portion of the statement was adopted in 2002. On April 22, 2003,assumptions the FASB determined thatCompany used to calculate the fair value of stock-based compensation.
SFAS No. 123(R) requires the benefits associated with tax deductions in excess of recognized compensation shouldcost to be recognizedreported as a costfinancing cash flow rather than as an operating cash flow as previously required. For 2006, the Company recorded an excess tax benefit of $2 million as a financing cash flow as required by the standard.
Upon exercise of stock options, issuance of restricted stock or issuance of shares under the employee stock purchase plan, the Company will issue authorized but unissued common stock or use common stock held in the financial statements. On March 31, 2004, the FASB issued an exposure draft that provides for a comment period, which ends June 30, 2004. The proposed statement would be effective for awards that are granted, modified, or settled in fiscal years beginning after December 15, 2004.treasury. The Company has not yet determinedmay make repurchases of its common stock from time to time, subject to legal and contractual restrictions, market conditions and other factors.
33
The following table illustrates the impacteffect on net income and earnings per common share as if the Company had applied the fair value method to measure stock-based compensation, as required under the disclosure provisions of this statement on its consolidated financial position, results of operations or cash flows.SFAS No. 123:
| 2005 | 2004 | ||||||
| Net income: | |||||||
| As reported | $ | 264 | $ | 293 | |||
| Compensation expense included in reported net income, | |||||||
| net of income tax benefit | 4 | 5 | |||||
| Total compensation expense under fair value method for | |||||||
| all awards, net of income tax benefit | (9 | ) | (13 | ) | |||
| Pro forma | $ | 259 | $ | 285 | |||
| Basic earnings per share: | |||||||
| As reported | $ | 1.71 | $ | 1.94 | |||
| Pro forma | $ | 1.67 | $ | 1.89 | |||
| Diluted earnings per share: | |||||||
| As reported | $ | 1.68 | $ | 1.88 | |||
| Pro forma | $ | 1.64 | $ | 1.83 | |||
Cash and Cash Equivalents
Short-Term Investments
The Company accounts for its short-term investments in accordance with SFAS No. 115, “Accounting for Certain Investments in Debt and Equity Securities.” At February 3, 2007, all of the Company’s investments were classified as available for sale, and accordingly are reported at fair value. Short-term investments comprise auction rate securities. Auction rate securities are perpetual preferred or long-dated securities whose dividend/coupon resets periodically through a Dutch auction process. A Dutch auction is a competitive bidding process designed to determine a rate for the next term, such that all sellers sell at par and all buyers buy at par. Accordingly, there were no realized or unrealized gains or losses for any of the periods presented.
Merchandise Inventories and Cost of Sales
34
Property and Equipment
29
Recoverability of Long-Lived Assets
During 2006, the Company recorded an impairment charge of $17 million ($12 million after-tax) to write-down long-lived assets such as store fixtures and leasehold improvements in 69 stores in the European operations to their estimated fair value.
Goodwill and Intangible Assets
The Company performs its annual impairment review as of the beginning of each fiscal year. The fair value of each reporting unit which wasis evaluated as of the beginning of each year, determined using a combination of market and discounted cash flow approach,approaches, exceeded the carrying value of each respective reporting unit.
Derivative Financial Instruments
35
The effective portion of the gain or loss on hedges of foreign net investments is generally not reclassified to earnings unless the net investment is disposed of. To the extent derivatives do not qualify as hedges, or are ineffective, their changes in fair value are recorded in earnings immediately, which may subject the Company to increased earnings volatility. The adoptionchanges in the fair value of SFAS No. 133 in 2001 did not have a material impact on the Company’s consolidated earnings and reduced accumulated other comprehensive loss by approximately $1 million.
Fair Value of Financial Instruments
30
Income Taxes
Pension and Postretirement Obligations
The discount rate selected to measure the present value of the Company’s benefit obligations as of February 3, 2007 was derived using a cash flow matching method whereby the Company compares the plans’ projected payment obligations by year with the corresponding yield on the Citibank Pension Discount Curve. The cash flows are then discounted to their present value and an overall discount rate is determined.
Insurance Liabilities
Accounting for Leases
The Company recognizes rent expense for operating leases as of the possession date for store leases or the commencement of the agreement for a non-store lease. Rental expense, inclusive of rent holidays, concessions and 2001.
36
Foreign Currency Translation
Reclassifications
Recent Accounting Pronouncements Not Previously Discussed Herein
In March 2006, the EITF reached a consensus on EITF Issue No. 06-3, “How Taxes Collected from Customers and Remitted to Governmental Authorities Should Be Presented in the Income Statement (That is, Gross versus Net Presentation)” that entities may adopt a policy of presenting taxes in the income statement on either a gross or net basis. Gross or net presentation may be elected for each different type of tax, but similar taxes should be presented consistently. Taxes within the scope of this EITF would include taxes that are imposed on a revenue transaction between a seller and a customer, for example, sales taxes, use taxes, value-added taxes, and some types of excise taxes. EITF 06-3 will not impact the method for recording these sales taxes in the Company’s consolidated financial statements as the Company has historically presented sales excluding all taxes.
In July 2006, the FASB issued Interpretation No. 48, “Accounting for Uncertainty in Income Taxes - An interpretation of FASB Statement No. 109” (“FIN 48”), which clarifies the accounting and disclosure requirements for uncertainty in tax positions. This Interpretation requires financial statement recognition of the impact of a tax position if that position is more likely than not of being sustained on audit based on the technical merits of the position. Additionally, FIN 48 provides guidance on measurement, derecognition, classification, accounting in interim periods, and disclosure requirements for uncertain tax positions. The provisions of FIN 48 will be effective as of the beginning of 2007, with the cumulative effect of the change in accounting principle, if any, recorded as an adjustment to opening retained earnings. The Company is currently evaluating the effect of FIN 48. However, the Company does not expect the adoption of this interpretation will significantly affect the Company’s financial position or results of operations.
In September 2006, the FASB issued SFAS No. 157, “Fair Value Measurements,” (“SFAS No. 157”). This statement provides a single definition of fair value, a framework for measuring fair value, and expanded disclosures concerning fair value. Previously, different definitions of fair value were contained in various accounting pronouncements creating inconsistencies in measurement and disclosures. SFAS No. 157 applies under those previously issued pronouncements that prescribe fair value as the relevant measure of value, except SFAS No. 123(R) and related interpretations and pronouncements that require or permit measurement similar to fair value but are not intended to measure fair value. This pronouncement is effective for fiscal years beginning after November 15, 2007. The Company does not believe that this standard will significantly affect the Company’s financial position or results of operations.
In February 2007, the FASB issued SFAS No. 159, "The Fair Value Option for Financial Assets and Financial Liabilities—Including an Amendment of FASB Statement No. 115." This statement permits, but does not require, entities to measure many financial instruments at fair value. The objective is to provide entities with an opportunity to mitigate volatility in reported earnings caused by measuring related assets and liabilities differently without having to apply complex hedge accounting provisions. The Company does not believe that this standard will significantly affect the Company's financial position or results of operations.
2 Staff Accounting Bulletin No. 108
In September 2006, the SEC issued Staff Accounting Bulletin No. 108 (“SAB 108”) “Considering the Effects of Prior Year Misstatements when Quantifying Misstatements in Current Year Financial Statements,” that provides interpretive guidance on how the effects of the carryover or reversal of prior year misstatements should be considered in quantifying a current year misstatement. There are two widely recognized methods for quantifying the effects of financial statement misstatements: the “rollover” or income statement method and the “iron curtain” or balance sheet method. The SEC staff believes that registrants should quantify errors using both a balance sheet and an income
37
statement approach (“dual method”) and evaluate whether either approach results in quantifying a misstatement that, when all relevant quantitative and qualitative factors are considered, is material. The Company had historically evaluated uncorrected misstatements using the “rollover” method. SAB 108 permits companies to apply its provisions initially by either (i) restating prior financial statements as if the provisions had always been applied or (ii) recording the cumulative effect of initially applying SAB 108 as adjustments to the carrying value of assets and liabilities as of the beginning of 2006 with an offsetting adjustment recorded to the opening balance of shareholders’ equity.
The Company believes its prior period assessments of uncorrected misstatements and the conclusions reached regarding its quantitative and qualitative assessments of materiality of such items, both individually and in the aggregate, were appropriate. These items did not significantly affect 2005 or 2004 as these items originated in earlier periods. In accordance with SAB 108, the Company has adjusted its opening retained earnings for 2006 for the items described below.
| Adjustment | ||||
| at Jan. 29, | ||||
| (in millions) | 2006 | |||
| Accrued liabilities(1) | $ | 3.4 | ||
| Revenue recognition(2) | 2.8 | |||
| Inventory valuation(3) | 4.2 | |||
| 10.4 | ||||
| Provision for income taxes | 4.1 | |||
| Decrease to shareholders’ equity | $ | 6.3 | ||
| (1) | Accrued liabilities – The Company understated its accrued liabilities for certain items, such as telecommunications, utilities and property taxes in years prior to 2003. These items originated when the Company was accruing for these items on a calendar year rather than a fiscal year basis. | |
| (2) | Revenue recognition – The Company had historically recorded revenue from its catalog and Internet operations when the product was shipped to the customer, rather than upon the actual receipt of the product by the customer. | |
| (3) | Inventory valuation – The Company did not properly recognize the permanent reduction of the retail value of its inventory upon the transfer to clearance stores. The Company provided a reserve for the value of this inventory that had not been marked down to current selling prices. | |
In addition, the Company had historically included its lease acquisition costs of $8 million in 2005 and $17 million in 2004 within the investing section of the Statement of Cash Flows. In 2005, the Company classified the premiums paid and proceeds received ($3 million, net) associated with its option currency contracts as an investing activity. The Company has determined that these activities would be more appropriately classified as an operating activity. Accordingly, the Company reclassified $5 million and $17 million for 2005 and 2004, respectively, to operating activities.
3 Segment Information
The Company has determined that its reportable segments are those that are based on its method of internal reporting. As of February 3, 2007, the Company has two reportable segments, Athletic Stores, which sells athletic footwear and apparel through its various retail stores, and Direct-to-Customers, which includes the Company’s catalogs and Internet business.
The accounting policies of both segments are the same as those described in the “Summary of Significant Accounting Policies.” The Company evaluates performance based on several factors, of which the primary financial measure is division results. Division profit reflects income from continuing operations before income taxes, corporate expense, non-operating income, and net interest expense.
| Sales | |||||||||
| 2006 | 2005 | 2004 | |||||||
| (in millions) | |||||||||
| Athletic Stores | $ | 5,370 | $ | 5,272 | $ | 4,989 | |||
| Direct-to-Customers | 380 | 381 | 366 | ||||||
| Total sales | $ | 5,750 | $ | 5,653 | $ | 5,355 | |||
38
| Operating Results | |||||||||
| 2006 | 2005 | 2004 | |||||||
| (in millions) | |||||||||
| Athletic Stores | $ | 405 | $ | 419 | $ | 420 | |||
| Direct-to-Customers | 45 | 48 | 45 | ||||||
| 450 | 467 | 465 | |||||||
| Restructuring charges(1) | (1 | ) | — | (2 | ) | ||||
| Division profit | 449 | 467 | 463 | ||||||
| Corporate expense(2) | (68 | ) | (58 | ) | (74 | ) | |||
| Operating profit | 381 | 409 | 389 | ||||||
| Other income(3) | 14 | 6 | — | ||||||
| Interest expense, net | 3 | 10 | 15 | ||||||
| Income from continuing operations before income taxes | $ | 392 | $ | 405 | $ | 374 | |||
| (1) | The restructuring charge in 2006 represents a revision to the original estimate of the lease liability associated with the guarantee of The San Francisco Music Box distribution center. During 2004, the Company recorded a restructuring charge of $2 million related to the dispositions of non-core businesses. These charges were classified within selling, general and administrative expenses in the Consolidated Statements of Operations. | |
| (2) | 2004 includes integration costs of $5 million related to the acquisitions of Footaction and the 11 stores in the Republic of Ireland. | |
| (3) | 2006 includes $4 million gain on lease terminations; $8 million of insurance proceeds related to the 2005 hurricane; and $2 million gain on debt repurchase. | |
| 2005 includes a $3 million gain from insurance recoveries associated with Hurricane Katrina. Additionally, $3 million represents a net gain on foreign currency option contracts that were entered into by the Company to mitigate the effect of fluctuating foreign exchange rates on the reporting of euro dominated earnings. | ||
| Depreciation and | |||||||||||||||||||||||||||
| Amortization | Capital Expenditures | Total Assets | |||||||||||||||||||||||||
| 2006 | 2005 | 2004 | 2006 | 2005 | 2004 | 2006 | 2005 | 2004 | |||||||||||||||||||
| (in millions) | |||||||||||||||||||||||||||
| Athletic Stores | $ | 147 | $ | 141 | $ | 126 | $ | 135 | $ | 137 | $ | 139 | $ | 2,374 | $ | 2,322 | $ | 2,335 | |||||||||
| Direct-to-Customers | 6 | 6 | 5 | 4 | 6 | 8 | 195 | 196 | 190 | ||||||||||||||||||
| 153 | 147 | 131 | 139 | 143 | 147 | 2,569 | 2,518 | 2,525 | |||||||||||||||||||
| Corporate | 22 | 24 | 23 | 26 | 12 | 9 | 680 | 794 | 711 | ||||||||||||||||||
| Discontinued operations | — | — | — | — | — | — | — | — | 1 | ||||||||||||||||||
| Total Company | $ | 175 | $ | 171 | $ | 154 | $ | 165 | $ | 155 | $ | 156 | $ | 3,249 | $ | 3,312 | $ | 3,237 | |||||||||
Sales and long-lived asset information by geographic area as of and for the fiscal years ended February 3, 2007, January 28, 2006 and January 29, 2005 are presented below. Sales are attributed to the country in which the sales originate, which is where the legal subsidiary is domiciled. Long-lived assets reflect property and equipment. The Company’s sales in Italy and France represent approximately 36, 39 and 40 percent of the International category’s sales for the three-year period ended February 3, 2007. No other individual country included in the International category is significant.
| Sales | |||||||||
| 2006 | 2005 | 2004 | |||||||
| (in millions) | |||||||||
| United States | $ | 4,356 | $ | 4,257 | $ | 3,982 | |||
| International | 1,394 | 1,396 | 1,373 | ||||||
| Total sales | $ | 5,750 | $ | 5,653 | $ | 5,355 | |||
39
| Long-Lived Assets | |||||||||
| 2006 | 2005 | 2004 | |||||||
| (in millions) | |||||||||
| United States | $ | 504 | $ | 523 | $ | 547 | |||
| International | 150 | 152 | 168 | ||||||
| Total long-lived assets | $ | 654 | $ | 675 | $ | 715 | |||
4 Other Income
In 2006, other income includes a gain of $8 million related to a final settlement with the Company’s insurance carriers of claims related to Hurricane Katrina. In 2005, the Company recorded a gain of $3 million of insurance recoveries in excess of losses associated with Hurricane Katrina.
During 2006, the Company purchased and retired $38 million of the $200 million 8.50 percent debentures payable in 2022, at a $2 million discount from face value. Also during 2006, the Company terminated two of its leases and recorded a net gain of $4 million.
In 2005, the Company recorded a net gain of $3 million related to foreign currency option contracts that were entered into by the Company to mitigate the effect of fluctuating foreign exchange rates on the reporting of euro denominated earnings.
5 Short-Term Investments
The Company’s auction rate security investments are accounted for as available-for-sale securities. The fair value of all investments approximate their carrying cost as the investments are generally not held for more than 49 days and they are traded at par value. The following represents the composition of the Company’s auction rate securities by underlying investment.
| 2006 | 2005 | |||||
| (in millions) | ||||||
| Tax exempt municipal bonds | $ | 44 | $ | 41 | ||
| Equity securities | 205 | 257 | ||||
| $ | 249 | $ | 298 | |||
Contractual maturities of the bonds outstanding at February 3, 2007 range from 2026 to 2042.
6 Merchandise Inventories
| 2006 | 2005 | |||||
| (in millions) | ||||||
| LIFO inventories | $ | 967 | $ | 939 | ||
| FIFO inventories | 336 | 315 | ||||
| Total merchandise inventories | $ | 1,303 | $ | 1,254 | ||
The value of the Company’s LIFO inventories, as calculated on a LIFO basis, approximates their value as calculated on a FIFO basis.
40
| 7 Other Current Assets | ||||||||
| 2006 | 2005 | |||||||
| (in millions) | ||||||||
| Net receivables | $ 59 | $ 49 | ||||||
| Prepaid expenses and other current assets | 36 | 31 | ||||||
| Prepaid rent | 62 | 15 | ||||||
| Prepaid income taxes | 67 | 49 | ||||||
| Deferred taxes | 21 | 28 | ||||||
| Investments | 14 | — | ||||||
| Current portion of Northern Group note receivable | 1 | 1 | ||||||
| Fair value of derivative contracts | 1 | — | ||||||
| $261 | $173 | |||||||
8 Property and Equipment, net | ||||||||
| 2006 | 2005 | |||||||
| (in millions) | ||||||||
| Land | $ | 3 | $ | 3 | ||||
| Buildings: | ||||||||
| Owned | 30 | 31 | ||||||
| Furniture, fixtures and equipment: | ||||||||
| Owned | 1,139 | 1,087 | ||||||
| Leased | 14 | 15 | ||||||
| 1,186 | 1,136 | |||||||
| Less: accumulated depreciation | (870 | ) | (800 | ) | ||||
| 316 | 336 | |||||||
| Alterations to leased and owned buildings, | ||||||||
| net of accumulated amortization | 338 | 339 | ||||||
| $ | 654 | $ | 675 | |||||
| 9 Goodwill | ||||||||
| 2006 | 2005 | |||||||
| (in millions) | ||||||||
| Athletic Stores | $184 | $183 | ||||||
| Direct-to-Customers | 80 | 80 | ||||||
| $264 | $263 | |||||||
The effect of foreign exchange fluctuations for the fiscal year ended February 3, 2007 increased goodwill by $1 million, resulting from the strengthening of the euro in relation to the U.S. dollar.
41
10 Intangible Assets, net
| February 3, 2007 | January 28, 2006 | ||||||||||||||||||||||
| Net | Wtd. Avg. | Net | |||||||||||||||||||||
| Gross | Accum. | Value | Useful Life | Gross | Accum. | Value | |||||||||||||||||
| (in millions) | value | amort. | (1) | in Years | value | amort. | (1) | ||||||||||||||||
| Finite life intangible assets | |||||||||||||||||||||||
| Lease acquisition costs | $ | 178 | $ | (98 | ) | $ | 80 | 11.9 | $ | 165 | $ | (77 | ) | $ | 88 | ||||||||
| Trademark | 21 | (3 | ) | 18 | 20.0 | 21 | (2 | ) | 19 | ||||||||||||||
| Loyalty program | 1 | (1 | ) | — | 2.0 | 1 | (1 | ) | — | ||||||||||||||
| Favorable leases | 9 | (5 | ) | 4 | 3.9 | 10 | (4 | ) | 6 | ||||||||||||||
| Total finite life intangible assets | 209 | (107 | ) | 102 | 12.3 | 197 | (84 | ) | 113 | ||||||||||||||
| Intangible assets not subject to | |||||||||||||||||||||||
| amortization | 3 | — | 3 | 4 | — | 4 | |||||||||||||||||
| Total intangible assets | $ | 212 | $ | (107 | ) | $ | 105 | $ | 201 | $ | (84 | ) | $ | 117 | |||||||||
| (1) | Includes effect of foreign currency translation of $5 million in 2006 and $8 million in 2005 primarily related to the strengthening of the euro in relation to the U.S. dollar. |
Intangible assets not subject to amortization at February 3, 2007, includes $3 million related to the trademark of the 11 stores acquired in the Republic of Ireland. The additional minimum liability at January 28, 2006, which represented the amount by which the accumulated benefit obligation exceeded the fair market value of U.S. defined benefit plan’s assets, was offset by an intangible asset to the extent of previously unrecognized prior service costs of $1 million. The adoption of SFAS No. 144158 in 2002, which also supersedes2006 has eliminated the accountingintangible asset.
Lease acquisition costs represent amounts that are required to secure prime lease locations and reporting requirementsother lease rights, primarily in Europe. Included in finite life intangibles, as a result of APB No. 30, “Reporting the ResultsFootaction and Republic of Operations — ReportingIreland purchases, are the Effects of Disposal of a Segment of a Business, and Extraordinary, Unusual and Infrequently Occurring Events,” required balance sheet reclassificationstrademark for the presentationFootaction name, amounts paid for leased locations with rents below their fair value for both acquisitions and amounts paid to obtain names of discontinued operationsmembers of the Footaction loyalty program.
Amortization expense for the intangibles subject to amortization was approximately $19 million, $18 million and other long-lived$17 million for 2006, 2005 and 2004, respectively. Annual estimated amortization expense for finite life intangible assets heldis expected to approximate $19 million for disposal.
Recent Accounting Pronouncements11 Other Assets
| 2006 | 2005 | ||
| (in millions) | |||
| Deferred tax costs | $21 | $24 | |
| Investments and note receivable | 7 | 22 | |
| Northern Group note receivable, net of current portion | 10 | 9 | |
| Fair value of derivative contracts | — | 1 | |
| Pension benefits | 8 | — | |
| Other | 37 | 40 | |
| $83 | $96 | ||
42
12 Accrued and Other Liabilities
| 2006 | 2005 | ||||
| (in millions) | |||||
| Pension and postretirement benefits | $ | 4 | $ | 72 | |
| Incentive bonuses | 12 | 20 | |||
| Other payroll and payroll related costs, excluding taxes | 46 | 52 | |||
| Taxes other than income taxes | 46 | 43 | |||
| Property and equipment | 24 | 16 | |||
| Customer deposits1 | 33 | 31 | |||
| Income taxes payable | 2 | 3 | |||
| Fair value of derivative contracts | 2 | 1 | |||
| Current deferred tax liabilities | 4 | 3 | |||
| Sales return reserve | 4 | 4 | |||
| Liabilities of discontinued operations | — | 2 | |||
| Current portion of repositioning and restructuring reserves | 1 | 1 | |||
| Current portion of reserve for discontinued operations | 3 | 8 | |||
| Other operating costs | 65 | 49 | |||
| $ | 246 | $ | 305 | ||
| 1 | Customer deposits include unredeemed gift cards and certificates, merchandise credits and, deferred revenue related to undelivered merchandise, including layaway sales. |
13 Revolving Credit Facility
In May 2004, shortly after the Footaction acquisition, the Company amended its revolving credit agreement, thereby extending the maturity date to May 2009 from July 2006. The agreement includes various restrictive financial covenants with which the Company was in compliance on February 3, 2007. Deferred financing fees are amortized over the life of the facility on a straight-line basis, which is comparable to the interest method. The unamortized balance at February 3, 2007 is approximately $1.9 million. Interest is determined at the time of borrowing based on variable rates and the Company’s fixed charge coverage ratio, as defined in the agreement. The rates range from LIBOR plus 0.875 percent to LIBOR plus 1.625 percent. The quarterly facility fees paid on the unused portion during 2003. The adoption of these pronouncements did not have a material impact2006 and 2005, which are also based on the Company’s consolidated financial position, resultsfixed charge coverage ratio, ranged from 0.175 percent to 0.25 percent. There were no short-term borrowings during 2006 or 2005.
Interest expense, including facility fees, related to the revolving credit facility was $2 million in 2006, 2005 and 2004.
14 Long-Term Debt and Obligations under Capital Leases
In May 2004, the Company obtained a 5-year, $175 million amortizing term loan from the bank group participating in its existing revolving credit facility to finance a portion of operationsthe purchase price of the Footaction stores. The interest rate on the LIBOR-based, floating-rate loan was 6.5 percent on February 3, 2007 and 5.568 percent on January 28, 2006. The loan requires minimum principal payments each May, equal to a percentage of the original principal amount of 10 percent in 2005 and 2006, 15 percent in years 2007 and 2008 and 50 percent in year 2009. Closing and upfront fees totaling approximately $1 million were paid for the term loan and these fees are being amortized using the interest rate method as determined by the principal repayment schedule. During 2005, the Company repaid $35 million of its 5-year term loan. This payment was in advance of the originally scheduled payment dates of May 19, 2005 and May 19, 2006 as permitted by the agreement. During 2006, the Company repaid an additional $50 million of its 5-year term loan. This payment was in advance of the originally scheduled payment dates of May 19, 2007 and May 19, 2008.
43
During 2006, the Company purchased and retired $38 million of the $200 million 8.50 percent debentures payable in 2022 at a $2 million discount from face value bringing the outstanding amount to $134 million as of February 3, 2007. The Company has various interest rate swap agreements, which convert $100 million of the 8.50 percent debentures from a fixed interest rate to a variable interest rate, which are collectively classified as a fair value hedge. The net fair value of the interest rate swaps at February 3, 2007 was a liability of $4 million, which was included in other liabilities, the carrying value of the 8.50 percent debentures was decreased by the corresponding amount. The net fair value of the interest rate swaps at January 28, 2006 was a liability $1 million, of which $1 million was included in other assets and $2 million was included in other liabilities. Accordingly, the fair value of the interest rate swaps decreased the carrying value of the 8.50 percent debentures at January 28, 2006 by $1 million.
Following is a summary of long-term debt and obligations under capital leases:
| 2006 | 2005 | ||||
| (in millions) | |||||
| 8.50% debentures payable 2022 | $ | 130 | $ | 171 | |
| $175 million term loan | 90 | 140 | |||
| Total long-term debt | 220 | 311 | |||
| Obligations under capital leases | 14 | 15 | |||
| 234 | 326 | ||||
| Less: Current portion | 14 | 51 | |||
| $ | 220 | $ | 275 | ||
Maturities of long-term debt and minimum rent payments under capital leases in future periods are:
| Long-Term | Capital | ||||||||||
| Debt | Leases | Total | |||||||||
| (in millions) | |||||||||||
| 2007 | $ | — | $ | 14 | $ | 14 | |||||
| 2008 | 2 | — | 2 | ||||||||
| 2009 | 88 | — | 88 | ||||||||
| 2010 | — | — | — | ||||||||
| 2011 | — | — | — | ||||||||
| Thereafter | 130 | — | 130 | ||||||||
| 220 | 14 | 234 | |||||||||
| Less: Current portion | — | 14 | 14 | ||||||||
| $ | 220 | $ | — | $ | 220 | ||||||
Interest expense related to long-term debt and capital lease obligations, including the effect of the interest rate swaps and the amortization of the associated debt issuance costs was $20 million in both 2006 and 2005, and $19 million in 2004. The effect of the interest rate swaps was not significant for the year ended February 3, 2007. The effect of the interest rate swaps resulted in a combined reduction in interest expense of $1 million in 2005, and $3 million in 2004.
15 Leases
The Company is obligated under operating leases for almost all of its store properties. Some of the store leases contain renewal options with varying terms and conditions. Management expects that in the normal course of business, expiring leases will generally be renewed or, cash flows.upon making a decision to relocate, replaced by leases on other premises. Operating lease periods generally range from 5 to 10 years. Certain leases provide for additional rent payments based on a percentage of store sales. Rent expense includes real estate taxes, insurance, maintenance, and other costs as required by some of the Company’s leases. The adopted pronouncements were as follows:
31
44
| Rent expense consists of the following: | |||||||||||
| 2006 | 2005 | 2004 | |||||||||
| (in millions) | |||||||||||
| Minimum rent | $ | 496 | $ | 489 | $ | 470 | |||||
| Other occupancy expenses | 145 | 141 | 135 | ||||||||
| Contingent rent based on sales | 21 | 13 | 11 | ||||||||
| Sublease income | (1 | ) | (1 | ) | (1 | ) | |||||
| Total rent expense | $ | 661 | $ | 642 | $ | 615 | |||||
2 Future minimum lease payments under non-cancelable operating leases are:
| (in millions) | |||
| 2007 | $ | 486 | |
| 2008 | 432 | ||
| 2009 | 371 | ||
| 2010 | 332 | ||
| 2011 | 289 | ||
| Thereafter | 829 | ||
| Total operating lease commitments | $ | 2,739 | |
| Present value of operating lease commitments | $ | 2,069 | |
16 Other Liabilities
| 2006 | 2005 | ||||
| (in millions) | |||||
| Pension benefits | $ | 21 | $ | 42 | |
| Postretirement benefits | 11 | 84 | |||
| Straight-line rent liability | 91 | 83 | |||
| Income taxes | 45 | 35 | |||
| Workers’ compensation / general liability reserves | 12 | 12 | |||
| Reserve for discontinued operations | 12 | 14 | |||
| Repositioning and restructuring reserves | 3 | 3 | |||
| Fair value of derivatives | 12 | 2 | |||
| Unfavorable leases | 2 | 3 | |||
| Other | 9 | 15 | |||
| $ | 218 | $ | 293 | ||
17 Discontinued Operations
32
Future adjustments, if any, to the carrying value of the Notenote will be recorded pursuant to SEC Staff Accounting Bulletin Topic 5:Z:5, “Accounting and Disclosure Regarding Discontinued Operations,” which requires changes in the carrying value of assets received as consideration from the disposal of a discontinued operation to be classified within continuing operations. Interest income will also be recorded within continuing operations. The Company will recognize an impairment loss when, and if, circumstances indicate that the carrying value of the Notenote may not be recoverable. Such circumstances would include a deterioration in the business, as evidenced by significant operating losses incurred by the purchaser or nonpayment of an amount due under the terms of the Note.
33
Northern Group
| 2000 | 2001 | 2002 | 2003 | ||||||||||||||||||||||||||||||||||||||||
|---|---|---|---|---|---|---|---|---|---|---|---|---|---|---|---|---|---|---|---|---|---|---|---|---|---|---|---|---|---|---|---|---|---|---|---|---|---|---|---|---|---|---|---|
| Balance | Charge/ (Income) | Net Usage* | Balance | Charge/ (Income) | Net Usage* | Balance | Charge/ (Income) | Net Usage* | Balance | ||||||||||||||||||||||||||||||||||
| (in millions) | |||||||||||||||||||||||||||||||||||||||||||
| Realized loss — currency movement | $ | — | $ | — | $ | — | $ | — | $ | — | $ | — | $ | — | $ | — | $ | — | $ | — | |||||||||||||||||||||||
| Asset write-offs & impairments | — | 23 | (23 | ) | — | 18 | (18 | ) | — | — | — | — | |||||||||||||||||||||||||||||||
| Recognition of note receivable | — | — | — | — | (10 | ) | 10 | — | — | — | — | ||||||||||||||||||||||||||||||||
| Real estate & lease liabilities | 68 | (16 | ) | (46 | ) | 6 | 1 | (1 | ) | 6 | 1 | (7 | ) | — | |||||||||||||||||||||||||||||
| Severance & personnel | 23 | (13 | ) | (8 | ) | 2 | — | (2 | ) | — | — | — | — | ||||||||||||||||||||||||||||||
| Operating losses & other costs | 24 | 18 | (39 | ) | 3 | — | (2 | ) | 1 | — | 1 | 2 | |||||||||||||||||||||||||||||||
| Total | $ | 115 | $ | 12 | $ | (116 | ) | $ | 11 | $ | 9 | $ | (13 | ) | $ | 7 | $ | 1 | $ | (6 | ) | $ | 2 | ||||||||||||||||||||
| 2003 | 2004 | 2005 | 2006 | |||||||||||||||||||||||||||||||||||||
| Charge/ | Net | Charge/ | Net | Charge/ | Net | |||||||||||||||||||||||||||||||||||
| Balance | (Income) | Usage* | Balance | (Income) | Usage* | Balance | (Income) | Usage* | Balance | |||||||||||||||||||||||||||||||
(in millions) | ||||||||||||||||||||||||||||||||||||||||
| Northern Group | $ | 2 | $ | — | $ | 1 | $ | 3 | $ | — | $ | 2 | $ | 5 | $ | (2 | ) | $ | (1 | ) | $ | 2 | ||||||||||||||||||
| International General Merchandise | 5 | — | — | 5 | 2 | 1 | 8 | (2 | ) | — | 6 | |||||||||||||||||||||||||||||
| Specialty Footwear | 2 | (1 | ) | 1 | 2 | — | (1 | ) | 1 | — | — | 1 | ||||||||||||||||||||||||||||
| Domestic General Merchandise | 10 | — | (2 | ) | 8 | — | — | 8 | — | (2 | ) | 6 | ||||||||||||||||||||||||||||
| Total | $ | 19 | $ | (1 | ) | $ | — | $ | 18 | $ | 2 | $ | 2 | $ | 22 | $ | (4 | ) | $ | (3 | ) | $ | 15 | |||||||||||||||||
International General Merchandise
| 2000 | 2001 | 2002 | 2003 | ||||||||||||||||||||||||||||||||||||||||
|---|---|---|---|---|---|---|---|---|---|---|---|---|---|---|---|---|---|---|---|---|---|---|---|---|---|---|---|---|---|---|---|---|---|---|---|---|---|---|---|---|---|---|---|
| Balance | Charge/ (Income) | Net Usage* | Balance | Charge/ (Income) | Net Usage* | Balance | Charge/ (Income) | Net Usage* | Balance | ||||||||||||||||||||||||||||||||||
| (in millions) | |||||||||||||||||||||||||||||||||||||||||||
| Woolco | $ | — | $ | 4 | $ | (4 | ) | $ | — | $ | 1 | $ | — | $ | 1 | $ | — | $ | (1 | ) | $ | — | |||||||||||||||||||||
| The Bargain! Shop | 7 | — | (1 | ) | 6 | — | — | 6 | — | (1 | ) | 5 | |||||||||||||||||||||||||||||||
| Total | $ | 7 | $ | 4 | $ | (5 | ) | $ | 6 | $ | 1 | $ | — | $ | 7 | $ | — | $ | (2 | ) | $ | 5 | |||||||||||||||||||||
Specialty Footwear
| 2000 | 2001 | 2002 | 2003 | ||||||||||||||||||||||||||||||||||||||||
|---|---|---|---|---|---|---|---|---|---|---|---|---|---|---|---|---|---|---|---|---|---|---|---|---|---|---|---|---|---|---|---|---|---|---|---|---|---|---|---|---|---|---|---|
| Balance | Charge/ (Income) | Net Usage | Balance | Charge/ (Income) | Net Usage | Balance | Charge/ (Income) | Net Usage | Balance | ||||||||||||||||||||||||||||||||||
| (in millions) | |||||||||||||||||||||||||||||||||||||||||||
| Lease liabilities | $ | 9 | $ | — | $ | (2 | ) | $ | 7 | $ | (4 | ) | $ | (1 | ) | $ | 2 | $ | — | $ | — | $ | 2 | ||||||||||||||||||||
| Operating losses & other costs | 3 | — | (1 | ) | 2 | — | (1 | ) | 1 | — | (1 | ) | — | ||||||||||||||||||||||||||||||
| Total | $ | 12 | $ | — | $ | (3 | ) | $ | 9 | $ | (4 | ) | $ | (2 | ) | $ | 3 | $ | — | $ | (1 | ) | $ | 2 | |||||||||||||||||||
Domestic General Merchandise
| 2000 | 2001 | 2002 | 2003 | ||||||||||||||||||||||||||||||||||||||||
|---|---|---|---|---|---|---|---|---|---|---|---|---|---|---|---|---|---|---|---|---|---|---|---|---|---|---|---|---|---|---|---|---|---|---|---|---|---|---|---|---|---|---|---|
| Balance | Charge/ (Income) | Net Usage | Balance | Charge/ (Income) | Net Usage | Balance | Charge/ (Income) | Net Usage | Balance | ||||||||||||||||||||||||||||||||||
| (in millions) | |||||||||||||||||||||||||||||||||||||||||||
| Lease liabilities | $ | 16 | $ | — | $ | (6 | ) | $ | 10 | $ | — | $ | (3 | ) | $ | 7 | $ | — | $ | (1 | ) | $ | 6 | ||||||||||||||||||||
| Legal and other costs | 2 | 3 | (3 | ) | 2 | 5 | (4 | ) | 3 | 4 | (3 | ) | 4 | ||||||||||||||||||||||||||||||
| Total | $ | 18 | $ | 3 | $ | (9 | ) | $ | 12 | $ | 5 | $ | (7 | ) | $ | 10 | $ | 4 | $ | (4 | ) | $ | 10 | ||||||||||||||||||||
| * | Net usage includes effect of foreign exchange translation |
34
| Northern Group | Specialty Footwear | Domestic General Merchandise | Total | ||||||||||||||||
|---|---|---|---|---|---|---|---|---|---|---|---|---|---|---|---|---|---|---|---|
| (in millions) | |||||||||||||||||||
2003 | |||||||||||||||||||
| Assets | $ | — | $ | — | $ | 2 | $ | 2 | |||||||||||
| Liabilities | 1 | — | 1 | 2 | |||||||||||||||
| $ | (1 | ) | $ | — | $ | 1 | $ | — | |||||||||||
2002 | |||||||||||||||||||
| Assets | $ | — | $ | — | $ | 2 | $ | 2 | |||||||||||
| Liabilities | 1 | — | 2 | 3 | |||||||||||||||
| $ | (1 | ) | $ | — | $ | — | $ | (1 | ) | ||||||||||
35
318 Repositioning and Restructuring Reserves
1999 Restructuring
46
1993 Repositioning and 1991 Restructuring
36
Non-Core Businesses
| 2000 | 2001 | 2002 | 2003 | ||||||||||||||||||||||||||||||||||||||||
| Balance | Charge/ (Income) | Net Usage | Balance | Charge/ (Income) | Net Usage | Balance | Charge/ (Income) | Net Usage | Balance | ||||||||||||||||||||||||||||||||||
| (in millions) | |||||||||||||||||||||||||||||||||||||||||||
| Real estate | $ | 4 | $ | — | $ | (3 | ) | $ | 1 | $ | — | $ | — | $ | 1 | $ | 1 | $ | (1 | ) | $ | 1 | |||||||||||||||||||||
| Asset impairment | — | 30 | (30 | ) | — | — | — | — | — | — | — | ||||||||||||||||||||||||||||||||
| Severance & personnel | 2 | — | (2 | ) | — | — | — | — | — | — | — | ||||||||||||||||||||||||||||||||
| Other disposition costs | 3 | 3 | (3 | ) | 3 | (2 | ) | (1 | ) | — | — | — | — | ||||||||||||||||||||||||||||||
| Total | $ | 9 | $ | 33 | $ | (38 | ) | $ | 4 | $ | (2 | ) | $ | (1 | ) | $ | 1 | $ | 1 | $ | (1 | ) | $ | 1 | |||||||||||||||||||
Corporate Overhead and Logistics
| 2000 | 2001 | 2002 | 2003 | ||||||||||||||||||||||||||||||||||||||||
| Balance | Charge/ (Income) | Net Usage | Balance | Charge/ (Income) | Net Usage | Balance | Charge/ (Income) | Net Usage | Balance | ||||||||||||||||||||||||||||||||||
| (in millions) | |||||||||||||||||||||||||||||||||||||||||||
| Real estate | $ | — | $ | 1 | $ | — | $ | 1 | $ | — | $ | (1 | ) | $ | — | $ | — | $ | — | $ | — | ||||||||||||||||||||||
| Severance & personnel | 2 | — | (2 | ) | — | — | — | — | — | — | — | ||||||||||||||||||||||||||||||||
| Other disposition costs | — | — | — | — | — | — | — | — | — | — | |||||||||||||||||||||||||||||||||
| Total | $ | 2 | $ | 1 | $ | (2 | ) | $ | 1 | $ | — | $ | (1 | ) | $ | — | $ | — | $ | — | $ | — | |||||||||||||||||||||
Total 1999 Restructuring
| 2000 | 2001 | 2002 | 2003 | ||||||||||||||||||||||||||||||||||||||||
|---|---|---|---|---|---|---|---|---|---|---|---|---|---|---|---|---|---|---|---|---|---|---|---|---|---|---|---|---|---|---|---|---|---|---|---|---|---|---|---|---|---|---|---|
| Balance | Charge/ (Income) | Net Usage | Balance | Charge/ (Income) | Net Usage | Balance | Charge/ (Income) | Net Usage | Balance | ||||||||||||||||||||||||||||||||||
| (in millions) | |||||||||||||||||||||||||||||||||||||||||||
Real estate | $ | 4 | $ | 1 | $ | (3 | ) | $ | 2 | $ | — | $ | (1 | ) | $ | 1 | $ | 1 | $ | (1 | ) | $ | 1 | ||||||||||||||||||||
Asset impairment | — | 30 | (30 | ) | — | — | — | — | — | — | — | ||||||||||||||||||||||||||||||||
Severance & personnel | 4 | — | (4 | ) | — | — | — | — | — | — | — | ||||||||||||||||||||||||||||||||
Other disposition costs | 3 | 3 | (3 | ) | 3 | (2 | ) | (1 | ) | — | — | — | — | ||||||||||||||||||||||||||||||
Total | $ | 11 | $ | 34 | $ | (40 | ) | $ | 5 | $ | (2 | ) | $ | (2 | ) | $ | 1 | $ | 1 | $ | (1 | ) | $ | 1 | |||||||||||||||||||
1993 Repositioning and 1991 Restructuring
| 2000 | 2001 | 2002 | 2003 | ||||||||||||||||||||||||||||||||||||||||
| Balance | Charge/ (Income) | Net Usage | Balance | Charge/ (Income) | Net Usage | Balance | Charge/ (Income) | Net Usage | Balance | ||||||||||||||||||||||||||||||||||
| (in millions) | |||||||||||||||||||||||||||||||||||||||||||
| Real estate | $ | 3 | $ | — | $ | (2 | ) | $ | 1 | $ | — | $ | — | $ | 1 | $ | — | $ | — | $ | 1 | ||||||||||||||||||||||
| Other disposition costs | 3 | — | (1 | ) | 2 | — | (1 | ) | 1 | — | — | 1 | |||||||||||||||||||||||||||||||
| Total | $ | 6 | $ | — | $ | (3 | ) | $ | 3 | $ | — | $ | (1 | ) | $ | 2 | $ | — | $ | — | $ | 2 | |||||||||||||||||||||
Total Restructuring Reserves
| 2000 | 2001 | 2002 | 2003 | ||||||||||||||||||||||||||||||||||||||||
|---|---|---|---|---|---|---|---|---|---|---|---|---|---|---|---|---|---|---|---|---|---|---|---|---|---|---|---|---|---|---|---|---|---|---|---|---|---|---|---|---|---|---|---|
| Balance | Charge/ (Income) | Net Usage | Balance | Charge/ (Income) | Net Usage | Balance | Charge/ (Income) | Net Usage | Balance | ||||||||||||||||||||||||||||||||||
| (in millions) | |||||||||||||||||||||||||||||||||||||||||||
Real estate | $ | 7 | $ | 1 | $ | (5 | ) | $ | 3 | $ | — | $ | (1 | ) | $ | 2 | $ | 1 | $ | (1 | ) | $ | 2 | ||||||||||||||||||||
Asset impairment | — | 30 | (30 | ) | — | — | — | — | — | — | — | ||||||||||||||||||||||||||||||||
Severance & personnel | 4 | — | (4 | ) | — | — | — | — | — | — | — | ||||||||||||||||||||||||||||||||
Other disposition costs | 6 | 3 | (4 | ) | 5 | (2 | ) | (2 | ) | 1 | — | — | 1 | ||||||||||||||||||||||||||||||
Total | $ | 17 | $ | 34 | $ | (43 | ) | $ | 8 | $ | (2 | ) | $ | (3 | ) | $ | 3 | $ | 1 | $ | (1 | ) | $ | 3 | |||||||||||||||||||
37
4 Other Income
5 Impairment of Long-Lived Assets
6 Segment Information
Sales
| 2003 | 2002 | 2001 | |||||||||||||
|---|---|---|---|---|---|---|---|---|---|---|---|---|---|---|---|
| (in millions) | |||||||||||||||
| Athletic Stores | $ | 4,413 | $ | 4,160 | $ | 3,999 | |||||||||
| Direct-to-Customers | 366 | 349 | 326 | ||||||||||||
| 4,779 | 4,509 | 4,325 | |||||||||||||
| All Other | — | — | 54 | ||||||||||||
| Total sales | $ | 4,779 | $ | 4,509 | $ | 4,379 | |||||||||
38
Operating Results
| 2003 | 2002 | 2001 | |||||||||||||
|---|---|---|---|---|---|---|---|---|---|---|---|---|---|---|---|
| (in millions) | |||||||||||||||
Athletic Stores(1) | $ | 363 | $ | 280 | $ | 283 | |||||||||
| Direct-to-Customers | 53 | 40 | 24 | ||||||||||||
| 416 | 320 | 307 | |||||||||||||
All Other(2) | (1 | ) | 1 | (45 | ) | ||||||||||
| Division profit | 415 | 321 | 262 | ||||||||||||
Corporate expense(3) | (73 | ) | (52 | ) | (65 | ) | |||||||||
| Operating profit | 342 | 269 | 197 | ||||||||||||
| Non-operating income | — | 3 | 2 | ||||||||||||
| Interest expense, net | (18 | ) | (26 | ) | (24 | ) | |||||||||
| Income from continuing operations before income taxes | $ | 324 | $ | 246 | $ | 175 | |||||||||
| Depreciation and Amortization | Capital Expenditures | Total Assets | |||||||||||||||||||||||||||||||||||||
|---|---|---|---|---|---|---|---|---|---|---|---|---|---|---|---|---|---|---|---|---|---|---|---|---|---|---|---|---|---|---|---|---|---|---|---|---|---|---|---|
| 2003 | 2002 | 2001 | 2003 | 2002 | 2001 | 2003 | 2002 | 2001 | |||||||||||||||||||||||||||||||
| (in millions) | |||||||||||||||||||||||||||||||||||||||
| Athletic Stores | $ | 118 | $ | 119 | $ | 115 | $ | 126 | $ | 124 | $ | 106 | $ | 1,715 | $ | 1,564 | $ | 1,474 | |||||||||||||||||||||
Direct-to-Customers(1) | 4 | 4 | 11 | 6 | 8 | 4 | 183 | 177 | 179 | ||||||||||||||||||||||||||||||
| 122 | 123 | 126 | 132 | 132 | 110 | 1,898 | 1,741 | 1,653 | |||||||||||||||||||||||||||||||
| Corporate | 25 | 26 | 28 | 12 | 18 | 6 | 789 | 743 | 612 | ||||||||||||||||||||||||||||||
| Assets of business transferred under contractual arrangement | — | — | 30 | ||||||||||||||||||||||||||||||||||||
| Discontinued operations, net | �� | 2 | 2 | 5 | |||||||||||||||||||||||||||||||||||
| Total Company | $ | 147 | $ | 149 | $ | 154 | $ | 144 | $ | 150 | $ | 116 | $ | 2,689 | $ | 2,486 | $ | 2,300 | |||||||||||||||||||||
Sales
| 2003 | 2002 | 2001 | |||||||||||||
|---|---|---|---|---|---|---|---|---|---|---|---|---|---|---|---|
| (in millions) | |||||||||||||||
| United States | $ | 3,597 | $ | 3,639 | $ | 3,686 | |||||||||
| International | 1,182 | 870 | 693 | ||||||||||||
| Total sales | $ | 4,779 | $ | 4,509 | $ | 4,379 | |||||||||
Long-Lived Assets
| 2003 | 2002 | 2001 | |||||||||||||
|---|---|---|---|---|---|---|---|---|---|---|---|---|---|---|---|
| (in millions) | |||||||||||||||
| United States | $ | 504 | $ | 518 | $ | 549 | |||||||||
| International | 140 | 118 | 88 | ||||||||||||
| Total long-lived assets | $ | 644 | $ | 636 | $ | 637 | |||||||||
39
7 Merchandise Inventories
| 2003 | 2002 | ||||||||||
|---|---|---|---|---|---|---|---|---|---|---|---|
| (in millions) | |||||||||||
| LIFO inventories | $ | 651 | $ | 622 | |||||||
| FIFO inventories | 269 | 213 | |||||||||
| Total merchandise inventories | $ | 920 | $ | 835 | |||||||
8 Other Current Assets
| 2003 | 2002 | ||||||||||
|---|---|---|---|---|---|---|---|---|---|---|---|
| (in millions) | |||||||||||
| Net receivables | $ | 41 | $ | 33 | |||||||
| Prepaid expenses and other current assets | 45 | 37 | |||||||||
| Deferred taxes | 60 | 15 | |||||||||
| Current portion of Northern Group note receivable | 2 | 4 | |||||||||
| Fair value of derivative contracts | 1 | 1 | |||||||||
| $ | 149 | $ | 90 | ||||||||
9 Property and Equipment, net
| 2003 | 2002 | ||||||||||
|---|---|---|---|---|---|---|---|---|---|---|---|
| (in millions) | |||||||||||
Land | $ | 3 | $ | 3 | |||||||
Buildings: | |||||||||||
| Owned | 32 | 32 | |||||||||
| Leased | — | 1 | |||||||||
Furniture, fixtures and equipment: | |||||||||||
| Owned | 1,015 | 994 | |||||||||
| Leased | 14 | 18 | |||||||||
| 1,064 | 1,048 | ||||||||||
| Less: accumulated depreciation | (706 | ) | (675 | ) | |||||||
| 358 | 373 | ||||||||||
Alterations to leased and owned buildings, net of accumulated amortization | 286 | 263 | |||||||||
| $ | 644 | $ | 636 | ||||||||
10 Goodwill
11 Intangible Assets, net
| 2003 | 2002 | ||||||||||
|---|---|---|---|---|---|---|---|---|---|---|---|
| (in millions) | |||||||||||
| Intangible assets not subject to amortization | $ | 2 | $ | 2 | |||||||
| Intangible assets subject to amortization | 94 | 78 | |||||||||
| $ | 96 | $ | 80 | ||||||||
40
| Lease Acquisition Costs (in millions) | Gross Carrying Amount | Accumulated Amortization | Net | |||||||||||
|---|---|---|---|---|---|---|---|---|---|---|---|---|---|---|
| 2003 | $ | 145 | $ | (51 | ) | $ | 94 | |||||||
| 2002 | $ | 114 | $ | (36 | ) | $ | 78 | |||||||
12 Other Assets
| 2003 | 2002 | ||||||||||
|---|---|---|---|---|---|---|---|---|---|---|---|
| (in millions) | |||||||||||
| Deferred tax costs | $ | 35 | $ | 39 | |||||||
| Investments and notes receivable | 23 | 23 | |||||||||
| Northern Group note receivable, net of current portion | 6 | 6 | |||||||||
| Income taxes receivable | 1 | 8 | |||||||||
| Fair value of derivative contracts | — | 1 | |||||||||
| Other | 35 | 33 | |||||||||
| $ | 100 | $ | 110 | ||||||||
13 Accrued Liabilities
| 2003 | 2002 | ||||||||||
|---|---|---|---|---|---|---|---|---|---|---|---|
| (in millions) | |||||||||||
| Pension and postretirement benefits | $ | 57 | $ | 59 | |||||||
| Incentive bonuses | 38 | 29 | |||||||||
| Other payroll and payroll related costs, excluding taxes | 44 | 38 | |||||||||
| Taxes other than income taxes | 44 | 36 | |||||||||
| Property and equipment | 32 | 25 | |||||||||
| Gift cards and certificates | 16 | 21 | |||||||||
| Income taxes payable | 9 | 23 | |||||||||
| Fair value of derivative contracts | 3 | 8 | |||||||||
| Other operating costs | 57 | 57 | |||||||||
| $ | 300 | $ | 296 | ||||||||
41
14 Revolving Credit Facility
15 Long-Term Debt and Obligations under Capital Leases
| 2003 | 2002 | ||||||||||
|---|---|---|---|---|---|---|---|---|---|---|---|
| (in millions) | |||||||||||
| 8.50% debentures payable 2022 | $ | 171 | $ | 192 | |||||||
| 5.50% convertible notes payable 2008 | 150 | 150 | |||||||||
| Total long-term debt | 321 | 342 | |||||||||
| Obligations under capital leases | 14 | 15 | |||||||||
| 335 | 357 | ||||||||||
| Less: Current portion | — | 1 | |||||||||
| $ | 335 | $ | 356 | ||||||||
42
| Long-Term Debt | Capital Leases | Total | |||||||||||||
|---|---|---|---|---|---|---|---|---|---|---|---|---|---|---|---|
| (in millions) | |||||||||||||||
| 2004 | $ | — | $ | — | $ | — | |||||||||
| 2005 | — | — | — | ||||||||||||
| 2006 | — | — | — | ||||||||||||
| 2007 | — | 14 | 14 | ||||||||||||
| 2008 | 150 | — | 150 | ||||||||||||
| Thereafter | 171 | — | 171 | ||||||||||||
| 321 | 14 | 335 | |||||||||||||
| Less: Current portion | — | — | — | ||||||||||||
| $ | 321 | $ | 14 | $ | 335 | ||||||||||
16 Leases
| 2003 | 2002 | 2001 | |||||||||||||
|---|---|---|---|---|---|---|---|---|---|---|---|---|---|---|---|
| (in millions) | |||||||||||||||
| Rent | $ | 537 | $ | 495 | $ | 475 | |||||||||
| Contingent rent based on sales | 11 | 11 | 11 | ||||||||||||
| Sublease income | (1 | ) | (1 | ) | (1 | ) | |||||||||
| Total rent expense | $ | 547 | $ | 505 | $ | 485 | |||||||||
| (in millions) | ||||||
|---|---|---|---|---|---|---|
| 2004 | $ | 387 | ||||
| 2005 | 361 | |||||
| 2006 | 332 | |||||
| 2007 | 296 | |||||
| 2008 | 237 | |||||
| Thereafter | 753 | |||||
| Total operating lease commitments | $ | 2,366 | ||||
| Present value of operating lease commitments | $ | 1,683 | ||||
43
17 Other Liabilities
| 2003 | 2002 | ||||||||||
|---|---|---|---|---|---|---|---|---|---|---|---|
| (in millions) | |||||||||||
| Pension benefits | $ | 175 | $ | 237 | |||||||
| Postretirement benefits | 113 | 132 | |||||||||
| Income taxes | 62 | 16 | |||||||||
| Straight-line rent liability | 43 | 30 | |||||||||
| Other | 12 | 10 | |||||||||
| Workers’ compensation / general liability reserves | 12 | 14 | |||||||||
| Reserve for discontinued operations | 11 | 9 | |||||||||
| Asset retirement obligations | 3 | — | |||||||||
| Repositioning and restructuring reserves | 2 | — | |||||||||
| Fair value of derivatives | 1 | — | |||||||||
| $ | 434 | $ | 448 | ||||||||
1819 Income Taxes
| 2006 | 2005 | 2004 | |||||||
| (in millions) | |||||||||
| Domestic | $ | 320 | $ | 309 | $ | 222 | |||
| International | 72 | 96 | 152 | ||||||
| Total pre-tax income | $ | 392 | $ | 405 | $ | 374 | |||
| 2003 | 2002 | 2001 | |||||||||||||
|---|---|---|---|---|---|---|---|---|---|---|---|---|---|---|---|
| (in millions) | |||||||||||||||
| Domestic | $ | 186 | $ | 160 | $ | 113 | |||||||||
| International | 138 | 86 | 62 | ||||||||||||
| Total pre-tax income | $ | 324 | $ | 246 | $ | 175 | |||||||||
| 2006 | 2005 | 2004 | |||||||||
| (in millions) | |||||||||||
| Current: | |||||||||||
| Federal | $ | 93 | $ | 72 | $ | 11 | |||||
| State and local | 14 | 11 | 6 | ||||||||
| International | 17 | 35 | 52 | ||||||||
| Total current tax provision | 124 | 118 | 69 | ||||||||
| Deferred: | |||||||||||
| Federal | 10 | 22 | 43 | ||||||||
| State and local | 6 | 7 | 8 | ||||||||
| International | 5 | (5 | ) | (1 | ) | ||||||
| Total deferred tax provision | 21 | 24 | 50 | ||||||||
| Total income tax provision | $ | 145 | $ | 142 | $ | 119 | |||||
| 2003 | 2002 | 2001 | |||||||||||||
|---|---|---|---|---|---|---|---|---|---|---|---|---|---|---|---|
| (in millions) | |||||||||||||||
Current: | |||||||||||||||
| Federal | $ | 48 | $ | 16 | $ | 7 | |||||||||
| State and local | 14 | 5 | (5 | ) | |||||||||||
| International | 58 | 25 | 24 | ||||||||||||
| Total current tax provision | 120 | 46 | 26 | ||||||||||||
Deferred: | |||||||||||||||
| Federal | 11 | 31 | 32 | ||||||||||||
| State and local | (6 | ) | — | 7 | |||||||||||
| International | (10 | ) | 7 | (1 | ) | ||||||||||
| Total deferred tax provision | (5 | ) | 38 | 38 | |||||||||||
| Total income tax provision | $ | 115 | $ | 84 | $ | 64 | |||||||||
44
| 2006 | 2005 | 2004 | ||||||
| Federal statutory income tax rate | 35.0 | % | 35.0 | % | 35.0 | % | ||
| State and local income taxes, net of federal tax benefit | 3.3 | 2.8 | 2.3 | |||||
| International income taxed at varying rates | (0.9 | ) | 0.8 | (0.6 | ) | |||
| Foreign tax credit utilization | (1.2 | ) | (3.1 | ) | (2.5 | ) | ||
| Increase (decrease) in valuation allowance | 0.1 | (1.5 | ) | 0.1 | ||||
| Federal/foreign tax settlements | (0.1 | ) | 0.4 | (3.3 | ) | |||
| Tax exempt obligations | (0.5 | ) | (0.4 | ) | (0.2 | ) | ||
| Federal tax credits | (0.2 | ) | (0.2 | ) | (0.2 | ) | ||
| Other, net | 1.4 | 1.2 | 1.1 | |||||
| Effective income tax rate | 36.9 | % | 35.0 | % | 31.7 | % | ||
| 2003 | 2002 | 2001 | ||||||||||||
|---|---|---|---|---|---|---|---|---|---|---|---|---|---|---|
| Federal statutory income tax rate | 35.0 | % | 35.0 | % | 35.0 | % | ||||||||
| State and local income taxes, net of federal tax benefit | 2.4 | 2.0 | 3.5 | |||||||||||
| International income taxed at varying rates | 0.5 | 1.0 | (1.0 | ) | ||||||||||
| Foreign tax credit utilization | (1.0 | ) | (1.2 | ) | (0.8 | ) | ||||||||
| Increase (decrease) in valuation allowance | (1.5 | ) | (2.0 | ) | — | |||||||||
| Change in Canadian tax rates | — | — | 1.1 | |||||||||||
| State and local tax settlements | (0.2 | ) | (0.3 | ) | (4.1 | ) | ||||||||
| Goodwill amortization | — | — | 1.5 | |||||||||||
| Tax exempt obligations | (0.2 | ) | (0.1 | ) | — | |||||||||
| Work opportunity tax credit | (0.1 | ) | (0.3 | ) | (0.5 | ) | ||||||||
| Other, net | 0.6 | 0.1 | 1.9 | |||||||||||
| Effective income tax rate | 35.5 | % | 34.2 | % | 36.6 | % | ||||||||
Items that gave rise to significant portions of the deferred tax accounts are as follows:
| 2006 | 2005 | ||||||
| (in millions) | |||||||
| Deferred tax assets: | |||||||
| Tax loss/credit carryforwards | $ | 56 | $ | 71 | |||
| Employee benefits | 26 | 75 | |||||
| Reserve for discontinued operations | 6 | 8 | |||||
| Repositioning and restructuring reserves | 2 | 3 | |||||
| Property and equipment | 116 | 108 | |||||
| Allowance for returns and doubtful accounts | 4 | 4 | |||||
| Straight-line rent | 24 | 22 | |||||
| Other | 21 | 19 | |||||
| Total deferred tax assets | 255 | 310 | |||||
| Valuation allowance | (105 | ) | (123 | ) | |||
| Total deferred tax assets, net | $ | 150 | $ | 187 | |||
| 2006 | 2005 | ||||||
| (in millions) | |||||||
| Deferred tax liabilities: | |||||||
| Inventories | $ | 24 | $ | 18 | |||
| Goodwill | 13 | 12 | |||||
| Other | 8 | 10 | |||||
| Total deferred tax liabilities | 45 | 40 | |||||
| Net deferred tax asset | $ | 105 | $ | 147 | |||
| Balance Sheet caption reported in: | |||||||
| Deferred taxes | $ | 109 | $ | 147 | |||
| Other current assets | 21 | 28 | |||||
| Other current liabilities | (4 | ) | (3 | ) | |||
| Other liabilities | (21 | ) | (25 | ) | |||
| $ | 105 | $ | 147 | ||||
The Company operates in multiple taxing jurisdictions and is subject to audit. Audits can involve complex issues and may require an extended period of time to resolve. A taxing authority may challenge positions that the Company has adopted in its income tax filings. Accordingly, the Company may apply different tax treatments for transactions in filing its income tax returns than for income tax financial reporting. The Company regularly assesses its tax positions for such transactions and records reserves for those differences.
The Company’s U.S. Federal income tax filings have been examined by the Internal Revenue Service (the “IRS”) through 2005. The Company participated in the IRS’ Compliance Assurance Process (“CAP”) for 2006, which is expected to conclude during 2007. The Company has started the CAP for 2007.| 2003 | 2002 | ||||||||||
|---|---|---|---|---|---|---|---|---|---|---|---|
| (in millions) | |||||||||||
Deferred tax assets: | |||||||||||
| Tax loss/credit carryforwards | $ | 99 | $ | 95 | |||||||
| Employee benefits | 135 | 162 | |||||||||
| Reserve for discontinued operations | 8 | 10 | |||||||||
| Repositioning and restructuring reserves | 2 | 3 | |||||||||
| Property and equipment | 82 | 76 | |||||||||
| Allowance for returns and doubtful accounts | 10 | 6 | |||||||||
| Straight-line rent | 17 | 11 | |||||||||
| Other | 22 | 25 | |||||||||
| Total deferred tax assets | 375 | 388 | |||||||||
| Valuation allowance | (122 | ) | (121 | ) | |||||||
| Total deferred tax assets, net | $ | 253 | $ | 267 | |||||||
Deferred tax liabilities: | |||||||||||
| Inventories | $ | 13 | $ | 25 | |||||||
| Other | 1 | 3 | |||||||||
| Total deferred tax liabilities | 14 | 28 | |||||||||
| Net deferred tax asset | $ | 239 | $ | 239 | |||||||
Balance Sheet caption reported in: | |||||||||||
| Deferred taxes | $ | 194 | $ | 240 | |||||||
| Other current assets | 60 | 15 | |||||||||
| Other liabilities | (15 | ) | (16 | ) | |||||||
| $ | 239 | $ | 239 | ||||||||
45
Based upon the level of historical taxable income and projections for future taxable income over the periods in which the temporary differences are anticipated to reverse, management believes it is more likely than not that the Company will realize the benefits of these deductible differences, net of the valuation allowances at January 31, 2004.February 3, 2007. However, the amount of the deferred tax asset considered realizable could be adjusted in the future if estimates of taxable income are revised.
1920 Financial Instruments and Risk Management
Foreign Exchange Risk Management — Derivative Holdings Designated as Hedges
For a derivative to qualify as a hedge at inception and throughout the hedged period, the Company formally documents the nature of the hedged items and the relationships between the hedging instruments and the hedged items, as well as its risk-management objectives, strategies for undertaking the various hedge transactions, and the methods of assessing hedge effectiveness and hedge ineffectiveness. Additionally, for hedges of forecasted transactions, the significant characteristics and expected terms of a forecasted transaction must be specifically identified, and it must be probable that each forecasted transaction willwould occur. If it were deemed probable that the forecasted transaction would not occur, the gain or loss would be recognized in earnings immediately. No such gains or losses were recognized in earnings during 20032006 or 2002.2005. Derivative financial instruments qualifying for hedge accounting must maintain a specified level of effectiveness between the hedging instrument and the item being hedged, both at inception and throughout the hedged period. The Company does not hold derivative financial instruments for trading or speculative purposes.
46
49
The Company has designated these hedging instruments as hedges of the net investments in foreign subsidiaries, and will use the spot rate method of accounting to value changes of the hedging instrument attributable to currency rate fluctuations. As such, adjustments in the fair market value of the hedging instrument due to changes in the spot rate will be recorded in other comprehensive income and are expected to offset changes in the euro-denominated net investment. Amounts recorded to foreign currency translation within accumulated other comprehensive loss will remain there until the net investment is disposed of. The amount recorded within the foreign currency translation adjustment included in accumulated other comprehensive loss on the Consolidated Balance Sheet at February 3, 2007 decreased shareholders’ equity by $5 million, net of tax. At January 28, 2006, the amount recorded to foreign currency translation was not significant. The effect on the Consolidated Statements of Operations related to the net investments hedges was income of $3 million for 2006 and was not significant for 2005.
Foreign Exchange Risk Management — Derivative Holdings Designated as Non-Hedges
The Company mitigates the effect of fluctuating foreign exchange rates on the reporting of foreign currency denominated earnings by entering into a variety of derivative instruments including option currency contracts. These contracts are not designated as hedges and as a result, the changes in the fair value of these financial instruments are charged to the statement of operations immediately. The changes in fair valuevalues recorded in the Consolidated Statement of forward contractsOperations for the year ended February 3, 2007 was not significant and optionwas a net gain of approximately $3 million for contracts that do not qualify as hedges are recordedsettled in earnings. In 2002, the second quarter of 2005.
The Company enteredalso enters into certain forward foreign exchange contracts to hedge intercompany foreign-currency denominated firm commitments andtransactions. In 2005, the Company recorded lossesgains of approximately $9$3 million in selling, general and administrative expenses to reflect their fair value. These losses were more than offset by foreign exchange gains of approximately $13 million related to the underlying commitments, which were expected to be settled in 2003 and 2004.
Foreign Currency Exchange Rates
| Fair Value | Contract Value | Weighted-Average | |||||||||
| (US in millions) | (US in millions) | Exchange Rate | |||||||||
| Inventory | |||||||||||
| Buy €/Sell British £ | $ | (1 | ) | $ | 63 | .6799 | |||||
| Buy $US/Sell € | — | 4 | 1.3108 | ||||||||
| Buy $US/Sell CAD$ | — | 2 | .9088 | ||||||||
| Earnings | |||||||||||
| Sell €/Buy $US | $ | — | $ | 29 | 1.2962 | ||||||
| Sell CAD$/ Buy $US | — | 7 | .8739 | ||||||||
| Intercompany | |||||||||||
| Buy €/ Sell British £ | $ | — | $ | 25 | .6762 | ||||||
| Buy British £/Sell € | — | 25 | .6668 | ||||||||
| Buy SEK/Sell € | — | 1 | .7456 | ||||||||
| Buy €/Sell $US | — | 1 | 1.3078 | ||||||||
| Buy US/Sell NZD | — | 2 | .5985 | ||||||||
| Buy US/Sell AUD | — | 2 | .7456 | ||||||||
| Buy US/Sell CAD | — | 1 | .8727 | ||||||||
| Fair Value (US in millions) | Contract Value (US in millions) | Weighted-Average Exchange Rate | ||||||||||||
|---|---|---|---|---|---|---|---|---|---|---|---|---|---|---|
Inventory | ||||||||||||||
| Buy euro/ Sell British pound | $ | (1 | ) | $ | 41 | 0.7028 | ||||||||
| Buy $US/Sell euro | — | 2 | 1.2631 | |||||||||||
| $ | (1 | ) | $ | 43 | �� | |||||||||
Intercompany | ||||||||||||||
| Buy $US/Sell euro | $ | — | $ | 78 | 1.2331 | |||||||||
| Buy $US/Sell CAD$ | — | 6 | 0.7588 | |||||||||||
| Buy euro/Sell British pound | (1 | ) | 27 | 0.7086 | ||||||||||
| $ | (1 | ) | $ | 111 | ||||||||||
47
50
Interest Rate Risk Management
The following table presents the Company’s outstanding interest rate swaps during 2003 totaling $100 million reduced interest expense by approximately $4 million. As of January 31, 2004, swaps totaling $100 million were outstanding.derivatives:
| 2006 | 2005 | 2004 | |||||||||
| (in millions) | |||||||||||
| Interest Rate Swaps: | |||||||||||
| Fixed to Variable ($US) — notional amount | $ | 100 | $ | 100 | $ | 100 | |||||
| Average pay rate | 8.53 | % | 8.00 | % | 6.46 | % | |||||
| Average receive rate | 8.50 | % | 8.50 | % | 8.50 | % | |||||
| Variable to variable ($US) — notional amount | $ | 100 | $ | 100 | $ | 100 | |||||
| Average pay rate | 5.57 | % | 4.82 | % | 2.73 | % | |||||
| Average receive rate | 5.32 | % | 4.79 | % | 3.25 | % | |||||
Fair Value
| 2006 | 2005 | ||
| (in millions) | |||
| Current assets | $ 1 | $ — | |
| Non-current assets | — | 1 | |
| Current liabilities | 2 | 1 | |
| Non-current liabilities | 12 | 2 | |
Interest Rates
| 2004 | 2005 | 2006 | 2007 | 2008 | Thereafter | Jan. 31, 2004 Total | Feb. 1, 2003 Total | ||||||||||||||||||||||||||
|---|---|---|---|---|---|---|---|---|---|---|---|---|---|---|---|---|---|---|---|---|---|---|---|---|---|---|---|---|---|---|---|---|---|
| (in millions) | |||||||||||||||||||||||||||||||||
| Long-term debt | $ | — | — | — | — | 239 | 196 | $ | 435 | $ | 341 | ||||||||||||||||||||||
| Fixed rate | |||||||||||||||||||||||||||||||||
| weighted-average interest rate | 5.9 | % | 5.9 | % | 5.9 | % | 5.9 | % | 6.1 | % | 6.3 | % | |||||||||||||||||||||
| Feb. 3, | Jan. 28, | ||||||||||||||||||||
| 2007 | 2006 | ||||||||||||||||||||
| 2007 | 2008 | 2009 | 2010 | 2011 | Thereafter | Total | Total | ||||||||||||||
| ($ in millions) | |||||||||||||||||||||
| Long-term debt | $ — | 2 | 88 | — | — | 132 | $222 | $330 | |||||||||||||
| Weighted-average interest rate | 7.8 | % | 7.8 | % | 7.8 | % | 8.7 | % | 8.7 | % | 8.7 | % | |||||||||
Fair Value of Financial Instruments
51
Business Risk
48
2021 Retirement Plans and Other Benefits
Pension and Other Postretirement Plans
The following tables set forth the plans’ changes in benefit obligations and plan assets, funded status and amounts recognized in the Consolidated Balance Sheet,Sheets, measured at February 3, 2007 and January 31, 2004 and28, 2006:
| Postretirement | ||||||||||||
| Pension Benefits | Benefits | |||||||||||
| 2006 | 2005 | 2006 | 2005 | |||||||||
| (in millions) | ||||||||||||
| Change in benefit obligation | ||||||||||||
| Benefit obligation at beginning of year | $ 689 | $ 703 | $ 17 | $ 24 | ||||||||
| Service cost | 10 | 9 | — | — | ||||||||
| Interest cost | 36 | 36 | 1 | 1 | ||||||||
| Plan participants’ contributions | — | — | 5 | 5 | ||||||||
| Actuarial gain | (12 | ) | — | (3 | ) | (5 | ) | |||||
| Foreign currency translation adjustments | (2 | ) | 7 | — | — | |||||||
| Plan amendment | 1 | — | — | — | ||||||||
| Benefits paid | (60 | ) | (66 | ) | (7 | ) | (8 | ) | ||||
| Benefit obligation at end of year | $ 662 | $ 689 | $ 13 | $ 17 | ||||||||
52
| Postretirement | ||||||||||||||||
| Pension Benefits | Benefits | |||||||||||||||
| 2006 | 2005 | 2006 | 2005 | |||||||||||||
| (in millions) | ||||||||||||||||
| Change in plan assets | ||||||||||||||||
| Fair value of plan assets at beginning of year | $ | 579 | $ | 551 | ||||||||||||
| Actual return on plan assets | 60 | 60 | ||||||||||||||
| Employer contribution | 70 | 29 | ||||||||||||||
| Foreign currency translation adjustments | (2 | ) | 5 | |||||||||||||
| Benefits paid | (60 | ) | (66 | ) | ||||||||||||
| Fair value of plan assets at end of year | $ | 647 | $ | 579 | ||||||||||||
| Funded status | ||||||||||||||||
| Funded status | $ | (15 | ) | $ | (110 | ) | $ | (13 | ) | $ | (17 | ) | ||||
| Unrecognized prior service cost (benefit) | 3 | (9 | ) | |||||||||||||
| Unrecognized net (gain) loss | 303 | (60 | ) | |||||||||||||
| Prepaid asset (accrued liability) | $ | 196 | $ | (86 | ) | |||||||||||
| Balance Sheet caption reported in: | ||||||||||||||||
| Intangible assets | $ | — | $ | 1 | $ | — | $ | — | ||||||||
| Other assets | 8 | — | — | — | ||||||||||||
| Accrued and other liabilities | (2 | ) | (70 | ) | (2 | ) | (2 | ) | ||||||||
| Other liabilities | (21 | ) | (42 | ) | (11 | ) | (84 | ) | ||||||||
| Accumulated other comprehensive loss, pre-tax | — | 307 | — | — | ||||||||||||
| $ | (15 | ) | $ | 196 | $ | (13 | ) | $ | (86 | ) | ||||||
At February 1, 2003:
| Pension Benefits | Postretirement Benefits | ||||||||||||||||||
|---|---|---|---|---|---|---|---|---|---|---|---|---|---|---|---|---|---|---|---|
| 2003 | 2002 | 2003 | 2002 | ||||||||||||||||
| (in millions) | |||||||||||||||||||
Change in benefit obligation | |||||||||||||||||||
| Benefit obligation at beginning of year | $ | 685 | $ | 655 | $ | 30 | $ | 37 | |||||||||||
| Service cost | 8 | 8 | — | — | |||||||||||||||
| Interest cost | 43 | 44 | 1 | 2 | |||||||||||||||
| Plan participants’ contributions | — | — | 5 | 5 | |||||||||||||||
| Actuarial (gain) loss | 18 | 43 | 1 | (3 | ) | ||||||||||||||
| Foreign currency translation adjustments | 11 | 3 | — | — | |||||||||||||||
| Benefits paid | (68 | ) | (68 | ) | (10 | ) | (11 | ) | |||||||||||
| Benefit obligation at end of year | $ | 697 | 685 | $ | 27 | 30 | |||||||||||||
Change in plan assets | |||||||||||||||||||
| Fair value of plan assets at beginning of year | $ | 380 | $ | 500 | |||||||||||||||
| Actual return on plan assets | 101 | (57 | ) | ||||||||||||||||
| Employer contribution | 54 | 2 | |||||||||||||||||
| Foreign currency translation adjustments | 7 | 3 | |||||||||||||||||
| Benefits paid | (68 | ) | (68 | ) | |||||||||||||||
| Fair value of plan assets at end of year | $ | 474 | $ | 380 | |||||||||||||||
Funded status | |||||||||||||||||||
| Funded status | $ | (223 | ) | $ | (305 | ) | $ | (27 | ) | $ | (30 | ) | |||||||
| Unrecognized prior service cost (benefit) | 5 | 5 | (11 | ) | (12 | ) | |||||||||||||
| Unrecognized net (gain) loss | 296 | 337 | (80 | ) | (96 | ) | |||||||||||||
| Prepaid asset (accrued liability) | $ | 78 | $ | 37 | $ | (118 | ) | $ | (138 | ) | |||||||||
Balance Sheet caption reported in: | |||||||||||||||||||
| Intangible assets | $ | 2 | $ | 2 | $ | — | $ | — | |||||||||||
| Accrued liabilities | (52 | ) | (53 | ) | (5 | ) | (6 | ) | |||||||||||
| Other liabilities | (175 | ) | (237 | ) | (113 | ) | (132 | ) | |||||||||||
| Accumulated other comprehensive income, pre-tax | 303 | 325 | — | — | |||||||||||||||
| $ | 78 | $ | 37 | $ | (118 | ) | $ | (138 | ) | ||||||||||
| Pension | Postretirement | |||||
| Benefits | Benefits | |||||
| Prior service cost (benefit) | $ | 4 | $ | (7 | ) | |
| Net actuarial (gain) loss | 274 | (53 | ) | |||
| Total amount recognized | $ | 278 | $ | (60 | ) | |
| Prior to | ||||||||||||
| AML and | Effect of | Post AML and | ||||||||||
| Statement | Adoption | Statement | ||||||||||
| No. 158 | AML | Statement | No. 158 | |||||||||
| Adjustments | Adjustment | No. 158 | Adjustments | |||||||||
| (in millions) | ||||||||||||
| Current assets | 2,034 | — | — | 2,034 | ||||||||
| Deferred taxes | 144 | (120 | ) | 85 | 109 | |||||||
| Intangible assets | 106 | (1 | ) | — | 105 | |||||||
| Other assets | 75 | — | 8 | 83 | ||||||||
| Total assets | $ 3,277 | (121 | ) | 93 | $ 3,249 | |||||||
49
53
| Prior to | ||||||||||||
| AML and | Effect of | Post AML and | ||||||||||
| Statement | Adoption | Statement | ||||||||||
| No. 158 | AML | Statement | No. 158 | |||||||||
| Adjustments | Adjustment | No. 158 | Adjustments | |||||||||
| (in millions) | ||||||||||||
| Accrued and other liabilities | 246 | — | — | 246 | ||||||||
| Total current liabilities | 516 | — | — | 516 | ||||||||
| Other liabilities | 300 | (308 | ) | 226 | 218 | |||||||
| Other comprehensive loss | (150 | ) | 187 | (133 | ) | (96 | ) | |||||
| Total shareholders’ equity | 2,323 | (121 | ) | 93 | 2,295 | |||||||
| Total liabilities and shareholders’ equity | $ 3,277 | (121 | ) | 93 | $ 3,249 | |||||||
| Pension Benefits | Postretirement Benefits | ||||||
| 2006 | 2005 | 2006 | 2005 | ||||
| Discount rate | 5.68% | 5.43% | 5.80% | 5.50% | |||
| Rate of compensation increase | 3.76% | 3.77% | |||||
| Pension Benefits | Postretirement Benefits | ||||||||||||||||||
|---|---|---|---|---|---|---|---|---|---|---|---|---|---|---|---|---|---|---|---|
| 2003 | 2002 | 2003 | 2002 | ||||||||||||||||
| Discount rate | 5.90 | % | 6.50 | % | 5.90 | % | 6.50 | % | |||||||||||
| Rate of compensation increase | 3.72 | % | 3.65 | % | |||||||||||||||
| Pension Benefits | Postretirement Benefits | ||||||||||||||||||||||||||
|---|---|---|---|---|---|---|---|---|---|---|---|---|---|---|---|---|---|---|---|---|---|---|---|---|---|---|---|
| 2003 | 2002 | 2001 | 2003 | 2002 | 2001 | ||||||||||||||||||||||
| (in millions) | |||||||||||||||||||||||||||
| Service cost | $ | 8 | $ | 8 | $ | 8 | $ | — | $ | — | $ | — | |||||||||||||||
| Interest cost | 43 | 44 | 45 | 2 | 2 | 3 | |||||||||||||||||||||
| Expected return on plan assets | (46 | ) | (50 | ) | (58 | ) | — | — | — | ||||||||||||||||||
| Amortization of prior service cost | — | 1 | 1 | (1 | ) | (1 | ) | (2 | ) | ||||||||||||||||||
| Amortization of net (gain) loss | 9 | 3 | — | (16 | ) | (12 | ) | (9 | ) | ||||||||||||||||||
| Net benefit expense (income) | $ | 14 | $ | 6 | $ | (4 | ) | $ | (15 | ) | $ | (11 | ) | $ | (8 | ) | |||||||||||
| Pension Benefits | Postretirement Benefits | |||||||||||||||||||||||
| 2006 | 2005 | 2004 | 2006 | 2005 | 2004 | |||||||||||||||||||
| (in millions) | ||||||||||||||||||||||||
| Service cost | $ | 10 | $ | 9 | $ | 9 | $ | — | $ | — | $ | — | ||||||||||||
| Interest cost | 36 | 36 | 39 | 1 | 1 | 1 | ||||||||||||||||||
| Expected return on plan assets | (56 | ) | (49 | ) | (48 | ) | — | — | — | |||||||||||||||
| Amortization of prior service cost (benefit) | 1 | 1 | 1 | (1 | ) | (1 | ) | (1 | ) | |||||||||||||||
| Amortization of net (gain) loss | 12 | 13 | 11 | (10 | ) | (12 | ) | (13 | ) | |||||||||||||||
| Net benefit expense (income) | $ | 3 | $ | 10 | $ | 12 | $ | (10 | ) | $ | (12 | ) | $ | (13 | ) | |||||||||
| Pension Benefits | Postretirement Benefits | ||||||||||||||||||||||||||
|---|---|---|---|---|---|---|---|---|---|---|---|---|---|---|---|---|---|---|---|---|---|---|---|---|---|---|---|
| 2003 | 2002 | 2001 | 2003 | 2002 | 2001 | ||||||||||||||||||||||
| (in millions) | |||||||||||||||||||||||||||
| Discount rate | 6.50 | % | 7.00 | % | 7.44 | % | 6.50 | % | 7.00 | % | 7.50 | % | |||||||||||||||
| Rate of compensation increase | 3.72 | % | 3.53 | % | 4.96 | % | |||||||||||||||||||||
| Expected long-term rate of return on assets | 8.88 | % | 8.87 | % | 9.93 | % | |||||||||||||||||||||
| Pension Benefits | Postretirement Benefits | |||||||||||
| 2006 | 2005 | 2004 | 2006 | 2005 | 2004 | |||||||
| Discount rate | 5.44% | 5.50% | 5.90% | 5.50% | 5.50% | 5.90% | ||||||
| Rate of compensation increase | 3.76% | 3.77% | 3.79% | |||||||||
| Expected long-term rate of return on assets | 8.87% | 8.88% | 8.89% | |||||||||
The amounts in accumulated other comprehensive loss that are expected to be recognized as components of net periodic benefit cost (income) during the next year are as follows:
| Pension | Postretirement Benefits | Total | ||||||||
| (in millions) | ||||||||||
| Amortization of prior service cost (benefit) | $ | 1 | $ | (1 | ) | $ | — | |||
| Amortization of net loss (gain) | $ | 11 | $ | (8 | ) | $ | 3 | |||
The expected long-term rate of return on invested plan assets is based on historical long-term performance and future expected performance of those assets based upon current asset allocations.
54
Beginning inwith 2001, new retirees were charged the expected full cost of the medical plan and existing retirees will incur 100 percent of the expected future increase in medical plan costs. The substantive plan change increased postretirement benefit income by approximately $3 million for 2001 and was recorded as a prior service benefit. Any changes in the health care cost trend rates assumed would not impactaffect the accumulated benefit obligation or net benefit income, since retirees will incur 100 percent of such expected future increases. In 2002, based on historical experience, the drop out rate assumption was increased for the medical plan, thereby shortening the expected amortization period, which decreased the accumulated postretirement benefit obligation at February 1, 2003 by approximately $6 million, and increased postretirement benefit income by approximately $3 million in 2002.
In January 2004,August 2006, the FASB issued FASB Staff Position No. FAS 106-1, “Accounting and Disclosure Requirements Related to the Medicare Prescription Drug, Improvement and ModernizationPension Protection Act of 2003,” (“FSP 106-1”). As permitted by FSP 106-1, the Company has elected to defer accounting for the effects2006 was signed into law. The major provisions of the statute will take effect January 1, 2008. Among other things, the statute is designed to ensure timely and adequate funding of pension plans by shortening the time period within which employers must fully fund pension benefits. The Company is currently evaluating the effect, if any, that the Pension Protection Act as specific authoritative guidance is pending and that guidance, when issued, could require the Company to change previously reported information. Accordingly, the Company’s accumulated postretirement benefit obligation andof 2006 will have on funding requirements. The effect on net periodic benefit cost doesis not reflect the effects of the Act.
50
| 2006 | 2005 | ||||
| Asset Category | |||||
| Equity securities | 64 | % | 62 | % | |
| Foot Locker, Inc. common stock | 1 | % | 2 | % | |
| Debt securities | 33 | % | 34 | % | |
| Real estate | 1 | % | 1 | % | |
| Other | 1 | % | 1 | % | |
| Total | 100 | % | 100 | % | |
| Plan Assets as of | |||||||||||
|---|---|---|---|---|---|---|---|---|---|---|---|
| 2003 | 2002 | ||||||||||
Asset Category | |||||||||||
| Equity securities | 63 | % | 61 | % | |||||||
| Foot Locker, Inc. common stock | 2 | % | 1 | % | |||||||
| Debt securities | 33 | % | 36 | % | |||||||
| Real estate | 1 | % | 1 | % | |||||||
| Other | 1 | % | 1 | % | |||||||
Total | 100 | % | 100 | % | |||||||
Estimated future benefit payments for each of the next five years and the five years thereafter are as follows:
| Pension | Postretirement | |||||
| Benefits | Benefits | |||||
| (in millions) | ||||||
| 2007 | $ | 64 | $ | 2 | ||
| 2008 | 62 | 2 | ||||
| 2009 | 61 | 2 | ||||
| 2010 | 58 | 2 | ||||
| 2011 | 56 | 1 | ||||
| 2012–2015 | 259 | 5 | ||||
In the fourth quarter of 2006, the Company and its U.S. pension plan, the Foot Locker Retirement Plan, were named as defendants in a class action in federal court in Illinois. The Complaint alleged that the Company’s pension plan violated the Employee Retirement Income Security Act of 1974 as a result of the Company’s conversion of its defined benefit plan to a defined benefit pension plan with a cash balance feature in 1996. In March 2007, the class action was dismissed without prejudice. In February 2007, the same plaintiff filed a class action in federal court in New York against the Company and its U.S. pension plan, the Foot Locker Retirement Plan. The Complaint alleged that the
55
Company’s pension plan violated the Employee Retirement Income Security Act of 1974, including, without limitation, its age discrimination and notice provisions, as a result of the Company’s conversion of its defined benefit plan to a defined benefit pension plan with a cash balance feature in 1996. The Company currently expectsplans to contribute $50 million to its pension plans during 2004 todefend the extent that the contributions are tax deductible. However, this is subject to change, and is based upon the Company’s overall financial performance as well as plan asset performance significantly above or below the assumed long-term rate of return.
401(k) PlanSavings Plans
21 22 Share-Based Compensation
Stock PlansOptions
51
The Company’s 2003 Employees Stock Purchase Plan (the “2003 Employee Stock Purchase Plan”) terms are substantially the same as the 1994 Employees Stock Purchase Plan (the “1994 Employee Stock Purchase Plan”), which expired in June 2004. Under the Company’s 19942003 Employee Stock Purchase Plan participating employees mayare able to contribute up to 10 percent of their annual compensation through payroll deductions to acquire shares of the Company’s
56
common stock at 85 percent of the lower market price on one of two specified dates in each plan year. Under the 2003 Employee Stock Purchase Plan, 3,000,000 shares of common stock are authorized for purchase beginning June 2005. Of the 8,000,0003,000,000 shares of common stock authorized for purchase under this plan, 572806 participating employees purchased 120,208105,123 shares in 2003. To date,2006 and 1,191 participating employees purchased 237,353 shares in 2005.
Valuation Model and Assumptions
The Company uses a totalBlack-Scholes option-pricing model to estimate the fair value of 1,628,176 shares have been purchasedshare-based awards under this plan.
| Stock Option Plans | Stock Purchase Plan | ||||||||||||||||||||||||||
|---|---|---|---|---|---|---|---|---|---|---|---|---|---|---|---|---|---|---|---|---|---|---|---|---|---|---|---|
| 2003 | 2002 | 2001 | 2003 | 2002 | 2001 | ||||||||||||||||||||||
| Weighted-average risk free rate of interest | 2.26 | % | 4.17 | % | 4.17 | % | 1.11 | % | 2.59 | % | 3.73 | % | |||||||||||||||
| Expected volatility | 37 | % | 42 | % | 48 | % | 31 | % | 35 | % | 40 | % | |||||||||||||||
| Weighted-average expected award life | 3.4 | years | 3.5 | years | 4.0 | years | .7 | years | .7 | years | .7 | years | |||||||||||||||
| Dividend yield | 1.2 | % | 1.2 | % | — | — | — | — | |||||||||||||||||||
| Weighted-average fair value | $ | 2.90 | $ | 5.11 | $ | 5.31 | $ | 14.15 | $ | 4.23 | $ | 4.42 | |||||||||||||||
Additionally, SFAS No. 123(R) requires the characteristicsCompany to estimate pre-vesting option forfeitures at the time of traded options,grant and periodically revise those estimates in subsequent periods if actual forfeitures differ from those estimates. The Company records stock-based compensation expense only for those awards expected to vest using an estimated forfeiture rate based on its historical pre-vesting forfeiture data. Previously, the option valuation models do not necessarily provide a reliable measureCompany accounted for forfeitures as they occurred under the pro forma disclosure provisions of SFAS No. 123 for periods prior to 2006.
The following table shows the fair value of its options.Company’s assumptions used to compute the stock-based compensation expense and pro forma information:
| Stock Option Plans | Stock Purchase Plan | |||||||||||||||||
| 2006 | 2005 | 2004 | 2006 | 2005 | 2004 | |||||||||||||
| Weighted-average risk free rate | ||||||||||||||||||
| of interest | 4.68 | % | 3.99 | % | 2.57 | % | 4.39 | % | 4.19 | % | 1.33 | % | ||||||
| Expected volatility | 30 | % | 28 | % | 33 | % | 22 | % | 25 | % | 32 | % | ||||||
| Weighted-average expected | ||||||||||||||||||
| award life | 4.0 years | 3.8 years | 3.7 years | 1.0 years | .7 years | .7 years | ||||||||||||
| Dividend yield | 1.5 | % | 1.1 | % | 1.1 | % | 1.4 | % | — | — | ||||||||
| Weighted-average fair value | $6.36 | $6.69 | $6.51 | $4.71 | $5.54 | $11.44 | ||||||||||||
52
57
| 2006 | 2005 | 2004 | ||||||||||||||||
| Weighted- | Weighted- | Weighted- | ||||||||||||||||
| Number | Average | Number | Average | Number | Average | |||||||||||||
| of | Exercise | of | Exercise | of | Exercise | |||||||||||||
| Shares | Price | Shares | Price | Shares | Price | |||||||||||||
| (in thousands, except prices per share) | ||||||||||||||||||
| Options outstanding at beginning | ||||||||||||||||||
| of year | 5,962 | $ | 18.45 | 5,909 | $ | 16.69 | 6,886 | $ | 14.73 | |||||||||
| Granted | 858 | $ | 23.98 | 1,014 | $ | 27.42 | 1,183 | $ | 25.20 | |||||||||
| Exercised | (459 | ) | $ | 15.12 | (682 | ) | $ | 15.03 | (1,853 | ) | $ | 14.43 | ||||||
| Expired or cancelled | (313 | ) | $ | 24.83 | (279 | ) | $ | 22.11 | (307 | ) | $ | 19.13 | ||||||
| Options outstanding at end of year | 6,048 | $ | 19.15 | 5,962 | $ | 18.45 | 5,909 | $ | 16.69 | |||||||||
| Options exercisable at end of year | 4,455 | $ | 16.94 | 4,042 | $ | 16.00 | 3,441 | $ | 15.34 | |||||||||
| Options available for future grant at end | ||||||||||||||||||
| of year | 4,931 | 5,768 | 7,464 | |||||||||||||||
| 2003 | 2002 | 2001 | |||||||||||||||||||||||||
|---|---|---|---|---|---|---|---|---|---|---|---|---|---|---|---|---|---|---|---|---|---|---|---|---|---|---|---|
| Number of Shares | Weighted- Average Exercise Price | Number of Shares | Weighted- Average Exercise Price | Number of Shares | Weighted- Average Exercise Price | ||||||||||||||||||||||
| (in thousands, except prices per share) | |||||||||||||||||||||||||||
| Options outstanding at beginning of year | 7,676 | $ | 15.18 | 7,557 | $ | 14.63 | 7,696 | $ | 14.49 | ||||||||||||||||||
| Granted | 1,439 | $ | 10.81 | 1,640 | $ | 15.72 | 2,324 | $ | 12.81 | ||||||||||||||||||
| Exercised | 1,830 | $ | 12.50 | 783 | $ | 6.67 | 995 | $ | 7.28 | ||||||||||||||||||
| Expired or canceled | 399 | $ | 19.55 | 738 | $ | 19.80 | 1,468 | $ | 15.98 | ||||||||||||||||||
| Options outstanding at end of year | 6,886 | $ | 14.73 | 7,676 | $ | 15.18 | 7,557 | $ | 14.63 | ||||||||||||||||||
| Options exercisable at end of year | 4,075 | $ | 15.99 | 4,481 | $ | 15.94 | 4,371 | $ | 16.83 | ||||||||||||||||||
| Options available for future grant at end of year | 8,780 | 6,739 | 7,389 | ||||||||||||||||||||||||
The following table summarizes information about stock options outstanding and exercisable at
| Options Outstanding | Options Exercisable | ||||||||||
| Weighted- | |||||||||||
| Average | Weighted- | Weighted- | |||||||||
| Remaining | Average | Average | |||||||||
| Contractual | Exercise | Exercise | |||||||||
| Range of Exercise Prices | Shares | Life | Price | Shares | Price | ||||||
| (in thousands, except prices per share) | |||||||||||
| $ 4.53 to $11.91 | 1,540 | 4.8 | $ 10.64 | 1,540 | $ 10.64 | ||||||
| $12.31 to $16.02 | 1,306 | 4.6 | 14.90 | 1,306 | 14.90 | ||||||
| $16.19 to $25.19 | 1,241 | 7.4 | 22.80 | 399 | 20.52 | ||||||
| $25.28 to $26.66 | 1,211 | 5.3 | 25.42 | 920 | 25.39 | ||||||
| $26.87 to $28.50 | 750 | 7.9 | 27.86 | 290 | 27.80 | ||||||
| $ 4.53 to $28.50 | 6,048 | 5.8 | $ 19.15 | 4,455 | $ 16.94 | ||||||
| Options Outstanding | Options Exercisable | ||||||||||||||||||||||
|---|---|---|---|---|---|---|---|---|---|---|---|---|---|---|---|---|---|---|---|---|---|---|---|
| Range of Exercise Prices | Shares | Weighted- Average Remaining Contractual Life | Weighted- Average Exercise Price | Shares | Weighted- Average Exercise Price | ||||||||||||||||||
| (in thousands, except prices per share) | |||||||||||||||||||||||
| $ 4.53 to $10.78 | 1,815 | 8.0 | $ | 9.58 | 553 | $ | 8.10 | ||||||||||||||||
| $10.90 to $12.99 | 1,891 | 7.0 | 12.28 | 1,476 | 12.13 | ||||||||||||||||||
| $13.21 to $16.02 | 1,726 | 7.4 | 15.77 | 711 | 15.67 | ||||||||||||||||||
| $16.19 to $28.13 | 1,454 | 4.0 | 23.08 | 1,335 | 23.69 | ||||||||||||||||||
| $ 4.53 to $28.13 | 6,886 | 6.7 | $ | 14.73 | 4,075 | $ | 15.99 | ||||||||||||||||
22 Changes in the Company’s nonvested options at February 3, 2007 are summarized as follows:
| Weighted- | ||||
| average grant | ||||
| Number of | date fair value | |||
| shares | per share | |||
| (in thousands) | ||||
| Nonvested at January 29, 2006 | 1,920 | $ 23.59 | ||
| Granted | 858 | 23.98 | ||
| Vested | (872 | ) | 20.35 | |
| Cancelled | (313 | ) | 24.83 | |
| Nonvested at February 3, 2007 | 1,593 | 25.33 | ||
58
As of February 3, 2007 there was $3.3 million of total unrecognized compensation cost related to nonvested stock options, which is expected to be recognized over a weighted-average period of 0.86 years.
Restricted Stock
Restricted shares and units activity for the dateyear-ended February 3, 2007, January 28, 2006 and January 29, 2005 is summarized as follows:
| 2006 | 2005 | 2004 | |||||||
| (in thousands) | |||||||||
| Outstanding at beginning of the year | 1,041 | 1,177 | 1,150 | ||||||
| Granted | 157 | 245 | 402 | ||||||
| Vested | (600 | ) | (205 | ) | (345 | ) | |||
| Cancelled or forfeited | (61 | ) | (176 | ) | (30 | ) | |||
| Outstanding at end of year | 537 | 1,041 | 1,177 | ||||||
| Aggregate value (in millions) | $ 13.6 | $ 18.0 | $ 18.8 | ||||||
| Weighted average remaining contractual life | 0.93 | 0.69 | 1.25 | ||||||
The weighted average grant-date fair value per share was $24.08, $26.55 and $25.34 for 2006, 2005 and 2004, respectively. The total value of grant. During 2003, 2002awards for which restrictions lapsed during the year-ended February 3, 2007, January 28, 2006 and 2001, respectively, 80,000, 60,000 and 270,000 restricted shares were forfeited. The deferred compensation balance, reflected as a reduction to shareholders’ equity,January 29, 2005 was $7.1$6.7 million, $2.4$4.0 million and $3.9$3.0 million, asrespectively. As of January 31, 2004, February 1, 2003 and February 2, 2002, respectively.3, 2007, there was $4.0 million of total unrecognized compensation cost, related to nonvested restricted stock awards. The Company recorded compensation expense related to restricted shares, net of $4.1forfeitures, of $4.0 million in 2003, $1.92006, $6.1 million in 20022005 and $1.6$8.0 million in 2001.
23 Shareholder Rights Plan2004.
53
2423 Legal Proceedings
These legal proceedings include commercial, intellectual property, customer, and labor-and-employment-related claims. Certain of the Company’s subsidiaries are defendants in a number of lawsuits filed in state and federal courts containing various class action allegations under state wage and hour laws, including allegations concerning classification of employees as exempt or nonexempt, unpaid overtime, meal and rest breaks, and uniforms.
2524 Commitments
59
is also operating certain stores and making rental payments for which lease agreements are in the process of being negotiated with landlords. Although there is no contractual commitment to make these payments, it is likely that a lease will be executed.
The Company does not have any off-balance sheet financing, other than operating leases entered into in the normal course of business and disclosed above, or unconsolidated special purpose entities. The Company does not participate in transactions that generate relationships with unconsolidated entities or financial partnerships, including variable interest entities.
2625 Shareholder Information and Market Prices (Unaudited)
| 2006 | 2005 | |||||||
| High | Low | High | Low | |||||
| Common Stock | ||||||||
| Quarter | ||||||||
| 1stQ | $ 24.39 | $ 22.26 | $ 29.95 | $ 25.88 | ||||
| 2ndQ | 28.00 | 21.50 | 27.65 | 24.31 | ||||
| 3rdQ | 27.80 | 22.34 | 25.37 | 18.75 | ||||
| 4thQ | 24.92 | 21.10 | 24.07 | 18.74 | ||||
| 2003 | 2002 | ||||||||||||||||||
|---|---|---|---|---|---|---|---|---|---|---|---|---|---|---|---|---|---|---|---|
| High | Low | High | Low | ||||||||||||||||
Common Stock Quarter | |||||||||||||||||||
1st Q | $ | 11.40 | $ | 9.28 | $ | 17.95 | $ | 14.35 | |||||||||||
2nd Q | 15.20 | 10.10 | 16.00 | 9.02 | |||||||||||||||
3rd Q | 18.20 | 13.85 | 11.19 | 8.20 | |||||||||||||||
4th Q | 25.97 | 18.01 | 13.73 | 9.75 | |||||||||||||||
54
During 2005, the Company declared quarterly dividends of $0.075 per share during the first, second and third quarters. On November 16, 2005, the Company increased the quarterly dividend per share by 20 percent to $0.09, beginning in the fourth quarter of 2005.
60
2726 Quarterly Results (Unaudited)
| 1stQ | 2ndQ | 3rdQ | 4thQ | Year | ||||||||
| (in millions, except per share amounts) | ||||||||||||
| Sales | ||||||||||||
| 2006(a) | $ | 1,365 | 1,303 | 1,430 | 1,652 | 5,750 | ||||||
| 2005 | 1,377 | 1,304 | 1,408 | 1,564 | 5,653 | |||||||
| Gross margin(b) | ||||||||||||
| 2006(a) | $ | 419 | 361 | 422 | 534 | 1,736 | ||||||
| 2005 | 418 | 377 | 430 | 484 | (d) | 1,709 | ||||||
| Operating profit(c) | ||||||||||||
| 2006(a) | $ | 93 | 27 | 94 | 167 | 381 | ||||||
| 2005 | 94 | 71 | 104 | 140 | 409 | |||||||
| Income from continuing operations | ||||||||||||
| 2006(a) | $ | 58 | 14 | 65 | 110 | 247 | ||||||
| 2005 | 58 | 44 | 65 | 96 | 263 | |||||||
| Net income | ||||||||||||
| 2006(a) | $ | 59 | 14 | 65 | 113 | 251 | ||||||
| 2005 | 58 | 44 | 66 | 96 | 264 | |||||||
| Basic earnings per share: | ||||||||||||
| 2006(a) | ||||||||||||
| Income from continuing operations | $ | 0.37 | 0.09 | 0.42 | 0.71 | 1.59 | ||||||
| Income from discontinued operations | — | — | — | 0.02 | 0.02 | |||||||
| Cumulative effect of accounting change | 0.01 | — | — | — | 0.01 | |||||||
| Net income | 0.38 | 0.09 | 0.42 | 0.73 | 1.62 | |||||||
| 2005 | ||||||||||||
| Income from continuing operations | $ | 0.37 | 0.29 | 0.42 | 0.62 | 1.70 | ||||||
| Income from discontinued operations | — | — | 0.01 | — | 0.01 | |||||||
| Net income | 0.37 | 0.29 | 0.43 | 0.62 | 1.71 | |||||||
| Diluted earnings per share: | ||||||||||||
| 2006(a) | ||||||||||||
| Income from continuing operations | $ | 0.37 | 0.09 | 0.42 | 0.70 | 1.58 | ||||||
| Income from discontinued operations | — | — | — | 0.02 | 0.02 | |||||||
| Cumulative effect of accounting change | 0.01 | — | — | — | — | |||||||
| �� Net income | 0.38 | 0.09 | 0.42 | 0.72 | 1.60 | |||||||
| 2005 | ||||||||||||
| Income from continuing operations | $ | 0.37 | 0.28 | 0.41 | 0.61 | 1.67 | ||||||
| Income from discontinued operations | — | — | 0.01 | — | 0.01 | |||||||
| Net income | 0.37 | 0.28 | 0.42 | 0.61 | 1.68 | |||||||
____________________
| 1st Q | 2nd Q | 3rd Q | 4th Q | Year | |||||||||||||||||||
|---|---|---|---|---|---|---|---|---|---|---|---|---|---|---|---|---|---|---|---|---|---|---|---|
| (in millions, except per share amounts) | |||||||||||||||||||||||
| Sales | |||||||||||||||||||||||
| 2003 | $ | 1,128 | 1,123 | 1,194 | 1,334 | 4,779 | |||||||||||||||||
| 2002 | 1,090 | 1,085 | 1,120 | 1,214 | 4,509 | ||||||||||||||||||
Gross margin(a) | |||||||||||||||||||||||
| 2003 | $ | 345 | 331 | 389 | 412 | 1,477 | |||||||||||||||||
| 2002 | 320 | 312 | 343 | 369 | 1,344 | ||||||||||||||||||
Operating profit(b) | |||||||||||||||||||||||
| 2003 | $ | 67 | 59 | 102 | 114 | 342 | |||||||||||||||||
| 2002 | 64 | 55 | 72 | (c) | 78 | (d) | 269 | ||||||||||||||||
| Income from continuing operations | |||||||||||||||||||||||
| 2003 | $ | 39 | 37 | 62 | 71 | 209 | |||||||||||||||||
| 2002 | �� | 38 | (e) | 33 | 43 | (e) | 48 | 162 | (e) | ||||||||||||||
| Net income | |||||||||||||||||||||||
| 2003 | $ | 38 | 36 | 62 | 71 | 207 | |||||||||||||||||
| 2002 | 20 | (e) | 31 | 45 | (e) | 57 | 153 | (e) | |||||||||||||||
| Basic earnings per share: | |||||||||||||||||||||||
| 2003 | |||||||||||||||||||||||
| Income from continuing operations | $ | 0.28 | 0.26 | 0.43 | 0.50 | 1.47 | |||||||||||||||||
| Loss from discontinued operations | — | (0.01 | ) | — | — | (0.01 | ) | ||||||||||||||||
Cumulative effect of accounting change(f) | (0.01 | ) | — | — | — | — | |||||||||||||||||
| Net income | 0.27 | 0.25 | 0.43 | 0.50 | 1.46 | ||||||||||||||||||
| 2002 | |||||||||||||||||||||||
| Income from continuing operations | $ | 0.27 | (e) | 0.23 | 0.30 | (e) | 0.35 | 1.15 | (e) | ||||||||||||||
| Income (loss) from discontinued operations | (0.13 | ) | (0.01 | ) | 0.02 | 0.06 | (0.06 | ) | |||||||||||||||
| Net income | 0.14 | (e) | 0.22 | 0.32 | (e) | 0.41 | 1.09 | (e) | |||||||||||||||
| Diluted earnings per share: | |||||||||||||||||||||||
| 2003 | |||||||||||||||||||||||
| Income from continuing operations | $ | 0.27 | 0.25 | 0.41 | 0.47 | 1.40 | |||||||||||||||||
| Loss from discontinued operations | — | (0.01 | ) | — | — | (0.01 | ) | ||||||||||||||||
Cumulative effect of accounting change(f) | (0.01 | ) | — | — | — | — | |||||||||||||||||
| Net income | 0.26 | 0.24 | 0.41 | 0.47 | 1.39 | ||||||||||||||||||
| 2002 | |||||||||||||||||||||||
| Income from continuing operations | $ | 0.26 | (e) | 0.22 | 0.29 | (e) | 0.33 | 1.10 | (e) | ||||||||||||||
| Income (loss) from discontinued operations | (0.12 | ) | (0.01 | ) | 0.02 | 0.06 | (0.05 | ) | |||||||||||||||
| Net income | 0.14 | (e) | 0.21 | 0.31 | (e) | 0.39 | 1.05 | (e) | |||||||||||||||
| (a) | The fourth quarter of 2006 represents the 14 weeks ended February 3, 2007. |
| (b) | Gross margin represents sales less cost of sales. |
| (c) | Operating profit represents income from continuing operations before income taxes, interest expense, net and non-operating income. |
| (d) |
55
61
FIVE YEARFIVE-YEAR SUMMARY OF SELECTED FINANCIAL DATA
| 2006(1) | 2005 | 2004 | 2003 | 2002 | ||||||||
| ($ in millions, except per share amounts) | ||||||||||||
| Summary of Continuing Operations | ||||||||||||
| Sales | $ | 5,750 | 5,653 | 5,355 | 4,779 | 4,509 | ||||||
| Gross margin(2) | 1,736 | 1,709 | 1,633 | 1,482 | 1,348 | |||||||
| Selling, general and administrative expenses | 1,163 | 1,129 | 1,090 | 988 | 926 | |||||||
| Impairment charge | 17 | — | — | — | — | |||||||
| Depreciation and amortization(2) | 175 | 171 | 154 | 152 | 153 | |||||||
| Interest expense, net | 3 | 10 | 15 | 18 | 26 | |||||||
| Other income | (14 | ) | (6 | ) | — | — | (3 | ) | ||||
| Income from continuing operations | 247 | 263 | 255 | 209 | 162 | |||||||
| Cumulative effect of accounting change(3) | 1 | — | — | (1 | ) | — | ||||||
| Basic earnings per share from continuing operations | 1.59 | 1.70 | 1.69 | 1.47 | 1.15 | |||||||
| Basic earnings per share from cumulative effect of accounting change | 0.01 | — | — | — | — | |||||||
| Diluted earnings per share from continuing operations | 1.58 | 1.67 | 1.64 | 1.40 | 1.10 | |||||||
| Diluted earnings per share from cumulative effect of accounting change | — | — | — | — | — | |||||||
| Common stock dividends declared | 0.40 | 0.32 | 0.26 | 0.15 | 0.03 | |||||||
| Weighted-average common shares outstanding (in millions) | 155.0 | 155.1 | 150.9 | 141.6 | 140.7 | |||||||
| Weighted-average common shares outstanding assuming dilution (in millions) | 156.8 | 157.6 | 157.1 | 152.9 | 150.8 | |||||||
| Financial Condition | ||||||||||||
| Cash, cash equivalents and short-term investments | $ | 470 | 587 | 492 | 448 | 357 | ||||||
| Merchandise inventories | 1,303 | 1,254 | 1,151 | 920 | 835 | |||||||
| Property and equipment, net(4) | 654 | 675 | 715 | 668 | 664 | |||||||
| Total assets(4) | 3,249 | 3,312 | 3,237 | 2,713 | 2,514 | |||||||
| Short-term debt | — | — | — | — | — | |||||||
| Long-term debt and obligations under capital leases | 234 | 326 | 365 | 335 | 357 | |||||||
| Total shareholders’ equity | 2,295 | 2,027 | 1,830 | 1,375 | 1,110 | |||||||
| Financial Ratios | ||||||||||||
| Return on equity (ROE) | 11.5 | % | 13.6 | 15.9 | 16.8 | 15.4 | ||||||
| Operating profit margin | 6.8 | % | 7.2 | 7.3 | 7.2 | 6.0 | ||||||
| Income from continuing operations as a percentage of sales | 4.3 | % | 4.7 | 4.8 | 4.4 | 3.6 | ||||||
| Net debt capitalization percent(5) | 44.4 | % | 45.2 | 50.4 | 53.3 | 58.6 | ||||||
| Net debt capitalization percent (without present value of operating leases)(5) | — | — | — | — | — | |||||||
| Current ratio | 3.9 | 2.8 | 2.7 | 2.8 | 2.2 | |||||||
| Other Data | ||||||||||||
| Capital expenditures | $ | 165 | 155 | 156 | 144 | 150 | ||||||
| Number of stores at year end | 3,942 | 3,921 | 3,967 | 3,610 | 3,625 | |||||||
| Total selling square footage at year end (in millions) | 8.74 | 8.71 | 8.89 | 7.92 | 8.04 | |||||||
| Total gross square footage at year end (in millions) | 14.55 | 14.48 | 14.78 | 13.14 | 13.22 | |||||||
| 2003 | 2002 | 2001 | 2000 | 1999 | |||||||||||||||||||
|---|---|---|---|---|---|---|---|---|---|---|---|---|---|---|---|---|---|---|---|---|---|---|---|
| | ($ in millions, except per share amounts) | | |||||||||||||||||||||
Summary of Continuing Operations | |||||||||||||||||||||||
| Sales | $ | 4,779 | 4,509 | 4,379 | 4,356 | 4,263 | |||||||||||||||||
| Gross margin | 1,477 | 1,344 | 1,308 | 1,309 | 1,164 | (1) | |||||||||||||||||
| Selling, general and administrative expenses | 987 | 928 | 923 | 975 | 985 | ||||||||||||||||||
| Restructuring charges (income) | 1 | (2 | ) | 34 | 1 | 85 | |||||||||||||||||
| Depreciation and amortization | 147 | 149 | 154 | 151 | 169 | ||||||||||||||||||
| Interest expense, net | 18 | 26 | 24 | 22 | 51 | ||||||||||||||||||
| Other income | — | (3 | ) | (2 | ) | (16 | ) | (223 | ) | ||||||||||||||
| Income from continuing operations | 209 | 162 | 111 | (4) | 107 | (4) | 59 | (4) | |||||||||||||||
Cumulative effect of accounting change(2) | (1 | ) | — | — | (1 | ) | 8 | ||||||||||||||||
| Basic earnings per share from continuing operations | 1.47 | 1.15 | 0.79 | (4) | 0.78 | (4) | 0.43 | (4) | |||||||||||||||
| Basic earnings per share from cumulative effect of accounting change | — | — | — | (0.01 | ) | 0.06 | |||||||||||||||||
| Diluted earnings per share from continuing operations | 1.40 | 1.10 | 0.77 | (4) | 0.77 | (4) | 0.43 | (4) | |||||||||||||||
| Diluted earnings per share from cumulative effect of accounting change | — | — | — | (0.01 | ) | 0.06 | |||||||||||||||||
| Common stock dividends declared | 0.15 | 0.03 | — | — | — | ||||||||||||||||||
| Weighted-average common shares outstanding (in millions) | 141.6 | 140.7 | 139.4 | 137.9 | 137.2 | ||||||||||||||||||
| Weighted-average common shares outstanding assuming dilution (in millions) | 152.9 | 150.8 | 146.9 | 139.1 | 138.2 | ||||||||||||||||||
Financial Condition | |||||||||||||||||||||||
| Cash and cash equivalents | $ | 448 | 357 | 215 | 109 | 162 | |||||||||||||||||
| Merchandise inventories | 920 | 835 | 793 | 730 | 697 | ||||||||||||||||||
| Property and equipment, net | 644 | 636 | 637 | 684 | 754 | ||||||||||||||||||
| Total assets | 2,689 | 2,486 | 2,300 | 2,278 | 2,525 | ||||||||||||||||||
| Short-term debt | — | — | — | — | 71 | ||||||||||||||||||
| Long-term debt and obligations under capital leases | 335 | 357 | 399 | 313 | 418 | ||||||||||||||||||
| Total shareholders’ equity | 1,375 | 1,110 | 992 | 1,013 | 1,139 | ||||||||||||||||||
Financial Ratios | |||||||||||||||||||||||
| Return on equity (ROE) | 16.8 | % | 15.4 | 11.1 | 10.0 | 5.4 | |||||||||||||||||
| Operating profit margin | 7.2 | % | 6.0 | 4.5 | 4.2 | (1.8 | ) | ||||||||||||||||
| Income from continuing operations as a percentage of sales | 4.4 | % | 3.6 | 2.5 | (4) | 2.5 | (4) | 1.4 | (4) | ||||||||||||||
Net debt capitalization percent(3) | 53.3 | % | 58.6 | 61.1 | 60.9 | 61.2 | |||||||||||||||||
Net debt capitalization percent (without present value of operating leases)(3) | — | — | 15.6 | 16.8 | 22.3 | ||||||||||||||||||
| Current ratio | 2.8 | 2.2 | 2.0 | 1.5 | 1.5 | ||||||||||||||||||
Other Data | |||||||||||||||||||||||
| Capital expenditures | $ | 144 | 150 | 116 | 94 | 152 | |||||||||||||||||
| Number of stores at year end | 3,610 | 3,625 | 3,590 | 3,752 | 3,953 | ||||||||||||||||||
| Total selling square footage at year end (in millions) | 7.92 | 8.04 | 7.94 | 8.09 | 8.40 | ||||||||||||||||||
| Total gross square footage at year end (in millions) | 13.14 | 13.22 | 13.14 | 13.32 | 13.35 | ||||||||||||||||||
____________________
| (1) | 2006 represents the 53 weeks ended February 3, 2007. | |
| (2) | Gross margin and depreciation expense include the effects of the reclassification of tenant allowances as deferred credits, which are amortized as a reduction of rent expense as a component of costs of sales. Gross margin was reduced by $5 million in 2004 and 2003 and $4 million in 2002 and accordingly, depreciation expense was increased by the corresponding amount. |
| (3) | 2006 relates to the adoption of SFAS No. 123(R), “Share-Based Payment.” 2003 relates to adoption of SFAS No. 143, “Accounting for Asset Retirement |
| (4) | Property and equipment, net and total assets include the reclassification of tenant allowances as deferred credits, which were previously recorded as a reduction to the cost of property and equipment, and are now classified as part of the deferred rent liability. Property and equipment, net and total assets were increased by $22 million in |
| (5) | Represents total debt, net of cash, |
56
62
Item 9. Changes inIn and Disagreements with Accountants on Accounting and Financial Disclosure
Item 9A. Controls and Procedures
| (a) | Evaluation of Disclosure Controls and Procedures. |
| The Company’s management performed an evaluation under the supervision and with the participation of the Company’s Chief Executive Officer (“CEO”) and Chief Financial Officer (“CFO”), and completed an evaluation of the effectiveness of the design and operation of the Company’s disclosure controls and procedures (as that term is defined in Rules 13a-15(e) and 15d-15(e) under the Securities Exchange Act of 1934, as amended (the “Exchange Act”)) as of February 3, 2007. Based on that evaluation, the Company’s CEO and CFO concluded that the Company’s disclosure controls and procedures were effective as of February 3, 2007 in alerting them in a timely manner to all material information required to be disclosed in this report. | |
| (b) | Management’s Annual Report on Internal Control over Financial Reporting. |
| The Company’s management is responsible for establishing and maintaining adequate internal control over financial reporting (as that term is defined in Exchange Act Rules 13a-15(f) and 15d-15(f)). To evaluate the effectiveness of the Company’s internal control over financial reporting, the Company uses the framework in Internal Control-Integrated Framework issued by the Committee of Sponsoring Organizations of the Treadway Commission (the “COSO Framework”). Using the COSO Framework, the Company’s management, including the CEO and CFO, evaluated the Company’s internal control over financial reporting and concluded that the Company’s internal control over financial reporting was effective as of February 3, 2007. KPMG LLP, the independent registered public accounting firm that audits the Company’s consolidated financial statements included in this annual report, has issued an attestation report on the Company’s assessment of and effectiveness of internal control over financial reporting, which is included herein under the caption “Management’s Report on Internal Control over Financial Reporting” in “Item 8. Consolidated Financial Statements and Supplementary Data.” | |
| (c) | Attestation Report of the Independent Registered Public Accounting Firm. |
| KPMG's attestation report on management's assessment and the effectiveness of our internal control over financial reporting is included in "Item 8. Consolidated Financial Statements and Supplementary Data." | |
| (d) | Changes in Internal Control over Financial Reporting. |
During the Company’s last fiscal quarter there were no changes in internal control over financial reporting that materially affected, or is reasonably likely to materially affect, the Company’s internal control over financial reporting. | |
Item 9B. Other Information
None.
63
PART III
Item 10.10 Directors, and Executive Officers of the Companyand Corporate Governance
| (a) | Directors of the Company | ||
| Information relative to directors of the Company is set forth under the section captioned “Election of Directors” in the Proxy Statement and is incorporated herein by reference. | ||
| (b) | Executive Officers of the Company | |
| Information with respect to executive officers of the Company is set forth immediately following Item 4 in Part I. | ||
| (c) | Information with respect to compliance with Section 16(a) of the Securities Exchange Act of 1934 is set forth under the section captioned “Section 16(a) Beneficial Ownership Reporting Compliance” in the Proxy Statement and is incorporated herein by reference. | |
| (d) | Information on our audit committee | |
| (e) | Information about the Code of Business Conduct governing our employees, including our Chief Executive Officer, Chief Financial Officer, Chief Accounting Officer, and the Board of Directors, is set forth under the heading “Code of Business Conduct” under the Corporate Governance Information section of the Proxy Statement and is incorporated herein by reference. | |
Item 11. Executive Compensation
Item 12. Security Ownership of Certain Beneficial Owners and Management and Related Stockholder Matters
57
Item 13. Certain Relationships and Related Transactions, and Director Independence
Item 14. Principal Accountant Fees and Services
64
PART IV
Item 15. Exhibits and Financial Statement Schedules and Reports on Form 8-K
(a)(1)(a)(2) Financial Statements
58
65
SIGNATURES
| FOOT LOCKER, INC. | |
 | |
| By: | |
| Matthew D. Serra |
| Chairman of the Board, President and | |
| Chief Executive Officer | |
| Date: April 2, 2007 |
 |  | |||||||||
Matthew D. Serra Chairman of the Board, President and Chief Executive Officer | Robert W. McHugh Senior Vice President and Chief Financial Officer | |||||||||
| /s/ GIOVANNA CIPRIANO | / | / MATTHEW M. MCKENNA | ||||||||
Vice President and Chief Accounting Officer | Matthew M. McKenna Director | |||||||||
| /s/ PURDY CRAWFORD | /s/ JAMES E. PRESTON | |||||||||
| Purdy Crawford Director | ||||||||||
James E. Preston Director | ||||||||||
| /s/ NICHOLAS DIPAOLO | ||||||||||
| /s/ DAVID Y. SCHWARTZ | ||||||||||
| Nicholas DiPaolo Director | David Y. Schwartz Director | |||||||||
| /s/ ALAN D. FELDMAN | ||||||||||
| /s/ CHRISTOPHER A. SINCLAIR | ||||||||||
| Alan D. Feldman Director | Christopher A. Sinclair Director | |||||||||
| /s/ PHILIP H. GEIER JR. | /s/ CHERYL NIDO TURPIN | |||||||||
Philip H. Geier Jr. Director | Cheryl Nido Turpin Director | |||||||||
| /s/ JAROBIN GILBERT JR. | /s/ DONA D. YOUNG | |||||||||
Jarobin Gilbert Jr. Director | Dona D. Young Director | |||||||||
59
66
FOOT LOCKER, INCINC.
INDEX OF EXHIBITS REQUIRED
BY ITEM 15 OF FORM 10-K
AND FURNISHED IN ACCORDANCE
WITH ITEM 601 OF REGULATION S-K
| Exhibit No. in Item 601 of Regulation S-K | Description | ||||||||
| 3(i)(a) | Certificate of Incorporation of the Registrant, as filed by the Department of State of the State of New York on April 7, 1989 (incorporated herein by reference to Exhibit 3(i)(a) to the Quarterly Report on Form 10-Q for the quarterly period ended July 26, 1997, filed by the Registrant with the SEC on September 4, 1997 (the “July 26, 1997 Form 10-Q”)). | ||||||||
| 3(i)(b) | Certificates of Amendment of the Certificate of Incorporation of the Registrant, as filed by the Department of State of the State of New York on (a) July 20, 1989, (b) July 24, 1990, (c) July 9, 1997 (incorporated herein by reference to Exhibit 3(i)(b) to the July 26, 1997 Form 10-Q), (d) June 11, 1998 (incorporated herein by reference to Exhibit 4.2(a) of the Registration Statement on Form S-8 (Registration No. 333-62425), and (e) November 1, 2001 (incorporated herein by reference to Exhibit 4.2 to the Registration Statement on Form S-8 (Registration No. 333-74688) previously filed by the Registrant with the SEC). | ||||||||
| 3(ii) | By-laws of the Registrant, as amended (incorporated herein by reference to Exhibit 10.1 to the Quarterly Report on Form 10-Q for the quarterly period ended May 5, 2001 (the “May 5, 2001 Form 10-Q”), filed by the Registrant with the SEC on June 13, 2001). | ||||||||
| 4.1 | The rights of holders of the Registrant’s equity securities are defined in the Registrant’s Certificate of Incorporation, as amended (incorporated herein by reference to (a) Exhibits 3(i)(a) and 3(i)(b) to the July 26, 1997 Form 10-Q, Exhibit 4.2(a) to the Registration Statement on Form S-8 (Registration No. 333-62425) previously filed by the Registrant with the SEC, and Exhibit 4.2 to the Registration Statement on Form S-8 (Registration No. 333-74688) previously filed by the Registrant with the SEC). | ||||||||
| Indenture dated as of October 10, 1991 (incorporated herein by reference to Exhibit 4.1 to the Registration Statement on Form S-3 (Registration No. 33-43334) previously filed by the Registrant with the SEC). | |||||||||
| 4.3 | Form of | ||||||||
60
| 10.1 | 1986 Foot Locker Stock Option Plan (incorporated herein by reference to Exhibit 10(b) to the Registrant’s Annual Report on Form 10-K for the year ended January 28, 1995, filed by the Registrant with the SEC on April 24, 1995 (the “1994 Form 10-K”)). | |||||
| 10.2 | Amendment to the 1986 Foot Locker Stock Option Plan (incorporated herein by reference to Exhibit 10(a) to the Registrant’s Annual Report on Form 10-K for the year ended January 27, 1996, filed by the Registrant with the SEC on April 26, 1996 (the “1995 Form 10-K”)). | |||||
| 10.3 | Foot Locker 1995 Stock Option and Award Plan (incorporated herein by reference to Exhibit 10(p) to the 1994 Form 10-K). | |||||
| 10.4 | Foot Locker 1998 Stock Option and Award Plan (incorporated herein by reference to Exhibit 10.4 to the Registrant’s Annual Report on Form 10-K for the year ended January 31, 1998, filed by the Registrant with the SEC on April 21, | |||||
| 10.5 | Amendment to the Foot Locker 1998 Stock Option and Award Plan (incorporated herein by reference to Exhibit 10.2 to the Registrant’s Quarterly Report on Form 10-Q for the period ended July 29, 2000, filed by the Registrant with the SEC on September 7, 2000 (the “July 29, 2000 Form 10-Q”)). | |||||
| 10.6 | Executive Supplemental Retirement Plan (incorporated herein by reference to Exhibit 10(d) to the Registration Statement on Form 8-B filed by the Registrant with the SEC on August 7, 1989 (Registration No. 1-10299) (the “8-B Registration Statement”)). | |||||
67
| Exhibit No. in Item 601 of Regulation S-K | Description | |||
| 10.7 | Amendment to the Executive Supplemental Retirement Plan (incorporated herein by reference to Exhibit 10(c)(i) to the 1994 Form 10-K ). | |||
| 10.8 | Amendment to the Executive Supplemental Retirement Plan (incorporated herein by reference to Exhibit 10(d)(ii) to the 1995 Form 10-K). | |||
| 10.9 | Supplemental Executive Retirement Plan, as amended (incorporated herein by reference to Exhibit | |||
| 10.10 | Long-Term Incentive Compensation Plan, as amended and restated (incorporated herein by reference to Exhibit 10(f) to the 1995 Form 10-K). | |||
| 10.11 | Annual Incentive Compensation Plan, as amended (incorporated herein by reference to Exhibit 10.3 to the Quarterly Report on Form 10-Q for the quarterly period ended August 2, 2003 filed by the Registrant with the SEC on September 15, 2003 (the |
61
| 10.12 | Form of indemnification agreement, as amended (incorporated herein by reference to Exhibit 10(g) to the 8-B Registration Statement). | ||||||||
| 10.13 | Amendment to form of indemnification agreement (incorporated herein by reference to Exhibit 10.5 to the Quarterly Report on Form 10-Q for the quarterly period ended May 5, 2001 filed by the Registrant with the SEC on June 13, 2001 (the “May 5, 2001 Form 10-Q”)). | ||||||||
| 10.14 | Foot Locker Voluntary Deferred Compensation Plan (incorporated herein by reference to Exhibit 10(i) to the 1995 Form 10-K). | ||||||||
| 10.15 | Foot Locker Directors Stock Option Plan (incorporated herein by reference to Exhibit 10.1 to the July 29, 2000 Form 10-Q). | ||||||||
| 10.16 | Trust Agreement dated as of November 12, 1987 (“Trust Agreement”), between F.W. Woolworth Co. and The Bank of New York, as amended and assumed by the Registrant (incorporated herein by reference to Exhibit 10(j) to the 8-B Registration Statement). | ||||||||
| 10.17 | Amendment to Trust Agreement made as of April 11, 2001 (incorporated herein by reference to Exhibit 10.4 to May 5, 2001 Form 10-Q). | ||||||||
| 10.18 | Foot Locker Directors’ Retirement Plan, as amended (incorporated herein by reference to Exhibit 10(k) to the 8-B Registration Statement). | ||||||||
| 10.19 | Amendments to the Foot Locker Directors’ Retirement Plan (incorporated herein by reference to Exhibit 10(c) to the Registrant’s Quarterly Report on Form 10-Q for the period ended October 28, 1995, filed by the Registrant with the SEC on December 11, | ||||||||
| 10.20 | Employment Agreement with Matthew D. Serra dated as of | ||||||||
| 10.21 | Amendment of Restricted Stock Agreement | ||||||||
| 10.22 | Amendments to the Credit Agreement (incorporated herein by reference to Exhibits 10.1 to the Current Reports on Form 8-K dated (i) November 13, 2006 filed by the Registrant with the SEC on November 17, 2006, and (ii) March 7, 2007 filed by the Registrant with the SEC on March 12, 2007). | ||||||||
68
| Exhibit No. in Item 601 of Regulation S-K | Description | ||||||
| 10.23 | Restricted Stock Agreement with Matthew D. Serra dated as of February | ||||||
| 10.24 | Foot Locker Executive Severance Pay Plan (incorporated herein by reference to Exhibit 10.1 to the Registrant’s Quarterly Report on Form 10-Q for the period ended October 31, 1998 (the “October 31, | ||||||
| 10.25 | Form of Senior Executive Employment Agreement (incorporated herein by reference to Exhibit 10.23 to the Registrant’s Annual Report on Form 10-K for the year ended January 29, 2000 filed by the Registrant with the SEC on April 21, 2000 (the “1999 Form 10-K”)). | ||||||
62
| 10.26 | Form of Executive Employment Agreement (incorporated herein by reference to Exhibit 10.24 to the 1999 Form 10-K). | ||||||||
| Foot Locker, Inc. Excess Cash Balance Plan (incorporated herein by reference to Exhibit 10(c) to the 1995 Form 10-K). | |||||||||
| 10.28 | Form of Restricted Stock Agreement (incorporated herein by reference to Exhibit 10.30 to the | ||||||||
| 10.29 | |||||||||
| 10.30 | Amendment No. 1 to the Credit Agreement (incorporated herein by reference to Exhibit 10.1 to the Form 8-K filed by the Registrant on May 18, 2005). | ||||||||
| 10.31 | Letter of Credit Agreement dated as of March 19, 1999 (incorporated herein by reference to Exhibit 10.35 to the 1998 Form 10-K). | ||||||||
| 10.32 | Foot Locker 2002 Directors Stock Plan, as amended (incorporated herein by reference to Exhibit 10.1 to the | ||||||||
| 10.33 | Foot Locker 2003 Stock Option and Award Plan (incorporated herein by reference to Exhibit 10.2 to the August 2, 2003 Form 10-Q). | ||||||||
| 10.34 | Automobile Expense Reimbursement Program for Senior Executives (incorporated herein by reference to Exhibit 10.36 to the Annual Report on Form 10-K for the year ended January 29, 2005 filed by the Registrant on March 29, 2005 (the “2004 Form 10-K”). | ||||||||
| 10.35 | Executive Medical Expense Allowance Program for Senior Executives (incorporated herein by reference to Exhibit 10.37 to the 2004 Form 10-K). | ||||||||
| 10.36 | Financial Planning Allowance Program for Senior Executives (incorporated herein by reference to Exhibit 10.38 to the 2004 Form 10-K). | ||||||||
| 10.37 | Form of Nonstatutory Stock Option Award Agreement for Executive Officers (incorporated herein by reference to Exhibit 10.40 to the Annual Report on Form 10-K for the year ended January 28, 2006 filed by the Registrant with the SEC on March 27, 2006 (the “2005 Form 10-K”)). | ||||||||
| 10.38 | Form of Incentive Stock Option Award Agreement for Executive Officers (incorporated herein by reference to Exhibit 10.41 to the 2005 Form 10-K). | ||||||||
| 10.39 | Form of Nonstatutory Stock Option Award Agreement for Non-employee Directors (incorporated herein by reference to Exhibit 10.2 to the July 31, 2004 Form 10-Q). | ||||||||
| 10.40 | Long-term Disability Program for Senior Executives (incorporated herein by reference to Exhibit 10.42 to the 2004 Form 10-K). | ||||||||
69
| Exhibit No. in Item 601 of Regulation S-K | Description | |||
| 12 | Computation of Ratio of Earnings to Fixed Charges. | |||
| 18 | Letter on Change in Accounting Principle (incorporated herein by reference to Exhibit 18 to the 1999 Form 10-K). | |||
| 21 | Subsidiaries of the Registrant. | |||
| 23 | Consent of Independent | |||
| 31.1 | Certification of Chief Executive Officer Pursuant | |||
| 31.2 | Certification of Chief Financial Officer Pursuant | |||
| 32 | Certification of Chief Executive Officer and Chief Financial Officer Pursuant to 18 U.S.C. Section 1350, as adopted pursuant to Section 906 of the |
6370
Exhibits filed with this Form 10-K:
| Exhibit No. in Item 601 of Regulation S-K | Description | |
| 12 | Computation of Ratio of Earnings to Fixed Charges. | |
| 21 | Subsidiaries of the Registrant. | |
| 23 | Consent of Independent Registered Public Accounting Firm. | |
| 31.1 | Certification of Chief Executive Officer Pursuant to Section 302 of the Sarbanes-Oxley Act of 2002. | |
| 31.2 | Certification of Chief Financial Officer Pursuant to Section 302 of the Sarbanes-Oxley Act of 2002. | |
| 32 | Certification of Chief Executive Officer and Chief Financial Officer Pursuant to 18 U.S.C. Section 1350, as adopted pursuant to Section 906 of the Sarbanes-Oxley Act of 2002. |
71