TABLE OF CONTENTS
| PART I | |||||||||||||
| Item | Business | 1 | |||||||||||
| Item | Risk Factors | 2 | |||||||||||
| Item 1B | Unresolved Staff Comments | 4 | |||||||||||
| Item 2 | Properties | 5 | |||||||||||
| Item 3 | Legal Proceedings | 5 | |||||||||||
| Item 4 | Submission of Matters to a Vote of Security Holders | 5 | |||||||||||
| PART II | |||||||||||||
| Item 5 | Market for the Company’s Common Equity, | ||||||||||||
| Purchases of Equity Securities | 6 | ||||||||||||
| Item 6 | Selected Financial Data | 8 | |||||||||||
| Item 7 | Management’s Discussion and Analysis of Financial Condition and Results of Operations | 8 | |||||||||||
| Item 7A | Quantitative and Qualitative Disclosures | 22 | |||||||||||
| Item 8 | Consolidated Financial Statements and Supplementary Data | 23 | |||||||||||
| Item 9 | Changes in and Disagreements with Accountants on Accounting and Financial Disclosure | 64 | |||||||||||
| Item 9A | 64 | ||||||||||||
| Item 9B | Other Information | 64 | |||||||||||
| PART III | |||||||||||||
| Item | Directors, Executive Officers and Corporate Governance | 65 | |||||||||||
| Item 11 | Executive Compensation | 65 | |||||||||||
| Item 12 | Security Ownership of Certain Beneficial Owners and Management and Related | ||||||||||||
| Stockholder Matters | 65 | ||||||||||||
| Item 13 | Certain Relationships and Related Transactions, and Director Independence | 65 | |||||||||||
| Item 14 | Principal Accountant Fees and Services | 65 | |||||||||||
| PART IV | |||||||||||||
| Item 15 | Exhibits and Financial Statement Schedules | 66 | |||||||||||
PART I
Item 1. Business
|
General
Information Regarding Business Segments and Geographic Areas
Employees
Competition
Merchandise Purchases
1
The statements contained in this Annual Report on Form 10-K (“Annual Report”) that are not historical facts, including, but not limited to, statements regarding our expected financial position, business and financing plans found in “Item 1. Business” and “Item 7. Management’s Discussion and Analysis of Financial Condition and Results of Operations,” constitute “forward-looking statements” within the meaning of the Private Securities Litigation Reform Act of 1995. The words “may,” “believes,” “expects,” “plans,” “intends,” “anticipates” and similar expressions identify forward-looking statements. The actual results of the future events described in these forward-looking statements could differ materially from those stated in the forward-looking statements.
Our actual results may differ materially due to the risks and uncertainties discussed in this Annual Report, including those discussed below. Additional risks and uncertainties that we do not presently know about or that we currently consider to be insignificant may also affect our business operations and financial performance. Accordingly, readers of the Annual Report should consider these risks and uncertainties in evaluating the information and are cautioned not to place undue reliance on the forward-looking statements contained herein. We undertake no obligation to update or revise publicly any forward-looking statements, whether as a result of new information, future events or otherwise.
The industry in which we operate is dependent upon fashion trends, customer preferences and other fashion-related factors.
The athletic footwear and apparel industry is subject to changing fashion trends and customer preferences. We cannot guarantee that our merchandise selection will accurately reflect customer preferences when it is offered for sale or that we will be able to identify and respond quickly to fashion changes, particularly given the long lead times for ordering much of our merchandise from vendors. For example, we order the bulk of our athletic footwear four to six months prior to delivery to our stores. If we fail to anticipate accurately either the market for the merchandise in our stores or our customers’ purchasing habits, we may be forced to rely on markdowns or promotional sales to dispose of excess, slow moving inventory, which could have a material adverse effect on our business, financial condition, and results of operations.
A substantial portion of our highest margin sales are to young males (ages 12–25), many of whom we believe purchase athletic footwear and licensed apparel as a fashion statement and are frequent purchasers of athletic footwear. Any shift in fashion trends that would make athletic footwear or licensed apparel less attractive to these customers could have a material adverse effect on our business, financial condition, and results of operations.
The businesses in which we operate are highly competitive.
The retail athletic footwear and apparel business is highly competitive with relatively low barriers to entry. Our athletic footwear and apparel operations compete primarily with athletic footwear specialty stores, sporting goods stores and superstores, department stores, discount stores, traditional shoe stores, and mass merchandisers, many of which are units of national or regional chains that have significant financial and marketing resources. The principal competitive factors in our markets are price, quality, selection of merchandise, reputation, store location, advertising, and customer service. We cannot assure you that we will continue to be able to compete successfully against existing or future competitors. Our expansion into markets served by our competitors and entry of new competitors or expansion of existing competitors into our markets could have a material adverse effect on our business, financial condition, and results of operations.
Although we sell merchandise via the Internet, a significant shift in customer buying patterns to purchasing athletic footwear, athletic apparel, and sporting goods via the Internet could have a material adverse effect on our business results. In addition, some of our vendors distribute products directly through the Internet and others may follow. Some vendors operate retail stores and some have indicated that further retail stores will open. Should this continue to occur, and if our customers decide to purchase directly from our vendors, it could have a material adverse effect on our business, financial condition, and results of operations.
2
We depend on mall traffic and our ability to identify suitable store locations.
Our sales, particularly in the United States and Canada, are dependent in part on a high volume of mall traffic. Our stores are located primarily in enclosed regional and neighborhood malls. Mall traffic may be adversely affected by, among other things, economic downturns, the closing of anchor department stores or changes in customer preferences or acts of terrorism. A decline in the popularity of mall shopping among our target customers could have a material adverse effect on us.
To take advantage of customer traffic and the shopping preferences of our customers, we need to maintain or acquire stores in desirable locations such as in regional and neighborhood malls anchored by major department stores. We cannot be certain that desirable mall locations will continue to be available.
The effects of natural disasters, terrorism, acts of war and retail industry conditions may adversely affect our business.
Natural disasters, including hurricanes, floods, and tornados may affect store and distribution center operations. In addition, acts of terrorism, acts of war, and military action both in the United States and abroad can have a significant effect on economic conditions and may negatively affect our ability to purchase merchandise from vendors for sale to our customers. Any significant declines in general economic conditions, public safety concerns or uncertainties regarding future economic prospects that affect customer spending habits could have a material adverse effect on customer purchases of our products.
A change in the relationship with any of our key vendors or the unavailability of our key products at competitive prices could affect our financial health.
Our business is dependent to a significant degree upon our ability to purchase brand-name merchandise at competitive prices, including the receipt of volume discounts, cooperative advertising, and markdown allowances from our vendors. The Company purchased approximately 77 percent of its merchandise in 2007 from its top five vendors and expects to continue to obtain a significant percentage of its athletic product from these vendors in future periods. Approximately 56 percent was purchased from one vendor — Nike, Inc. (“Nike”). Each of our operating divisions is highly dependent on Nike; they individually purchase 43 to 74 percent of their merchandise from Nike. We have no long-term supply contracts with any of our vendors. Our inability to obtain merchandise in a timely manner from major suppliers (particularly Nike) as a result of business decisions by our suppliers or any disruption in the supply chain could have a material adverse effect on our business, financial condition, and results of operations. Because of our strong dependence on Nike, any adverse development in Nike’s financial condition and results of operations or the inability of Nike to develop and manufacture products that appeal to our target customers could also have an adverse effect on our business, financial condition, and results of operations. We cannot be certain that we will be able to acquire merchandise at competitive prices or on competitive terms in the future.
Merchandise that is high profile and in high demand is allocated by our vendors based upon their internal criteria. Although we have generally been able to purchase sufficient quantities of this merchandise in the past, we cannot be certain that our vendors will continue to allocate sufficient amounts of such merchandise to us in the future. In addition, our vendors provide support to us through cooperative advertising allowances and promotional events. We cannot be certain that such assistance from our vendors will continue in the future. These risks could have a material adverse effect on our business, financial condition, and results of operations.
We may experience fluctuations in and cyclicality of our comparable-store sales results.
Our comparable-store sales have fluctuated significantly in the past, on both an annual and a quarterly basis, and we expect them to continue to fluctuate in the future. A variety of factors affect our comparable-store sales results, including, among others, fashion trends, the highly competitive retail store sales environment, economic conditions, timing of promotional events, changes in our merchandise mix, calendar shifts of holiday periods, and weather conditions.
Many of our products, particularly high-end athletic footwear and licensed apparel, represent discretionary purchases. Accordingly, customer demand for these products could decline in a recession or if our customers develop other priorities for their discretionary spending. These risks could have a material adverse effect on our business, financial condition, and results of operations.
3
Our operations may be adversely affected by economic or political conditions in other countries.
Approximately 27 percent of our sales and a significant portion of our operating results for 2007 were attributable to our sales in Europe, Canada, New Zealand, and Australia. As a result, our business is subject to the risks associated with doing business outside of the United States, such as foreign governmental regulations, foreign customer preferences, political unrest, disruptions or delays in shipments, and changes in economic conditions in countries in which we operate. Although we enter into forward foreign exchange contracts and option contracts to reduce the effect of foreign currency exchange rate fluctuations, our operations may be adversely affected by significant changes in the value of the U.S. dollar as it relates to certain foreign currencies.
In addition, because we and our suppliers have a substantial amount of our products manufactured in foreign countries, our ability to obtain sufficient quantities of merchandise on favorable terms may be affected by governmental regulations, trade restrictions, and economic, labor, and other conditions in the countries from which our suppliers obtain their product.
Our business is subject to economic cycles and retail industry conditions. Purchases of discretionary athletic footwear, apparel, and related products, tend to decline during recessionary periods when disposable income is low and customers are hesitant to use available credit.
Complications in our distribution centers and other factors affecting the distribution of merchandise may affect our business.
We operate four distribution centers worldwide to support our athletic business. In addition to the distribution centers that we operate, we have additional third-party arrangements related to our operations in Canada, Australia and New Zealand. If complications arise with any facility or any facility is severely damaged or destroyed, the other distribution centers may not be able to support the resulting additional distribution demands. This may adversely affect our ability to deliver inventory on a timely basis. We depend upon UPS for shipment of a significant amount of merchandise. An interruption in service by UPS for any reason could cause temporary disruptions in our business, a loss of sales and profits, and other material adverse effects.
Our freight cost is affected by changes in fuel prices through surcharges. Increases in fuel prices and surcharges and other factors may increase freight costs and thereby increase our cost of sales.
A major failure of our information systems could harm our business.
We depend on information systems to process transactions, manage inventory, operate our website, purchase, sell and ship goods on a timely basis and maintain cost-efficient operations. Any material disruption or slowdown of our systems could cause information to be lost or delayed which could have a negative effect on our business. We may experience operational problems with our information systems as a result of system failures, viruses, computer “hackers” or other causes. We cannot be assured that our systems will be adequate to support future growth.
Unauthorized disclosure of sensitive or confidential customer information, whether through a breach of the Company’s computer system or otherwise, could severely harm our business.
As part of the Company’s normal course of business, it collects, processes, and retains sensitive and confidential customer information. Despite the security measurers the Company has in place, its facilities and systems may be vulnerable to security breaches, acts of vandalism, computer viruses, misplaced or lost data, programming and/or human error, or other similar events. Any security breach involving the misappropriation, loss or other unauthorized disclosure of confidential information by the Company could severely damage its reputation, expose it to the risks of litigation and liability, disrupt its operations and harm its business.
Item 1B. Unresolved Staff Comments
None.
4
Item 2. Properties
The properties of the Company and its consolidated subsidiaries consist of land, leased and owned stores, and administrative and distribution facilities. TotalGross operating square footage and total selling area for the Athletic Stores segment at the end of 20042007 was approximately 8.8914.12 and 8.50 million square feet.feet, respectively. These properties, which are primarily leased, are located in the United States, Canada, various European countries, Australia, and New Zealand.
Item 3. Legal Proceedings
Information regarding the Company’s legal proceedings are leased and partly sublet, occupying approximately 0.26 million square feet.
Item 4. Submission of such proceedings will haveMatters to a material effect on the Company’s consolidated financial position, liquidity, or resultsVote of operations.
Executive Officers of the Company
| Chairman of the Board, President and Chief Executive Officer | Matthew D. Serra | |||||
| President and Chief Executive Officer - Foot Locker, Inc. — International | Ronald J. Halls | |||||
| President and Chief Executive Officer - Foot Locker, Inc. — U.S.A. | Richard T. Mina | |||||
| Senior Vice President, General Counsel and Secretary | Gary M. Bahler | |||||
| Senior Vice President — Real Estate | Jeffrey L. Berk | |||||
| Senior Vice President, | Peter D. Brown | |||||
| Senior Vice President and Chief Financial Officer | ||||||
| Senior Vice President — Strategic Planning | Lauren B. Peters | |||||
| Senior Vice President — Human Resources | Laurie J. Petrucci | |||||
| Vice President and Chief Accounting Officer | Giovanna Cipriano | |||||
| Vice President and Treasurer | ||||||
2
5
Robert W. McHugh, age 49, has served as Senior Vice President and Chief Financial Officer since November 2005. He served as Vice President and Chief FinancialAccounting Officer from January 2000 to November 2005.
Lauren B. Peters, age 46, has served as Senior Vice President — Strategic Planning since April 2002. Ms. Peters served as Vice President — Planning from January 2000 to April 2002.
Laurie J. Petrucci, age 49, has served as Senior Vice President — Human Resources since May 2001. Ms. Petrucci served as Senior Vice President — Human Resources of Ladythe Foot Locker Worldwide division from October 1999March 2000 to August 2000.May 2001.
There are no family relationships among the executive officers or directors of the Company.
PART II
| Item 5. | Market for the Company’s Common Equity, Related Stockholder Matters and Issuer Purchases of Equity Securities |
| Total Number of Shares Purchased(1) | Average Price Paid per Share(1) | Total Number of Shares Purchased as Part of Publicly Announced Program(2) | Approximate Dollar Value of Shares that May Yet be Purchased Under the Program(2) | |||||||||||||||
|---|---|---|---|---|---|---|---|---|---|---|---|---|---|---|---|---|---|---|
| Oct. 31, 2004 through Nov. 27, 2004 | — | $ | — | — | $50,000,000 | |||||||||||||
| Nov. 28, 2004 through Jan. 1, 2005 | 6,670 | 26.28 | — | 50,000,000 | ||||||||||||||
| Jan. 2, 2005 through Jan. 29, 2005 | — | — | — | 50,000,000 | ||||||||||||||
| Total | 6,670 | $ | 26.28 | — | ||||||||||||||
6
Performance Graph
The following graph compares the cumulative five-year total return to shareholders on Foot Locker, Inc.’s common stock relative to the total returns of the Russell 2000 Index and a selected peer group, which represents its peers as retailers in the athletic footwear and apparel industry. The peer group comprises:
- Dick’s Sporting Goods, Inc.
- The Finish Line, Inc.
- Hibbett Sporting Goods, Inc., and
- Genesco, Inc., whose business includes operations outside of the athletic footwear and apparel retailing.
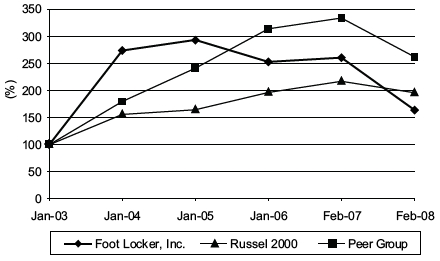
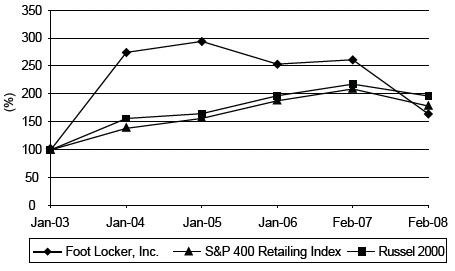
The Company has historically constructed a selected peer group in its performance graph. However, due to the declining number of public company peers in the athletic footwear and apparel industry, the Company has determined it would be more appropriate to use the S&P 400 Retailing Index, rather than the selected peer group. The next graph compares the cumulative five-year total shareholder return on our common stock against the cumulative five-year total return of the S&P 400 Retailing Index and the Russell 2000 Index.
Indexed Share Price Performance
7
Item 6. Selected Financial Data
Item 7. Management’s Discussion and Analysis of Financial Condition and Results of Operations
|
Business Overview
3
including television campaigns and sponsorships of various sporting events, Foot Locker, Inc. reinforces its image with a consistent
Athletic Stores
8
Store Profile
| At | At | |||||||||||||||
| February 3, 2007 | Opened | Closed | February 2, 2008 | |||||||||||||
| Foot Locker | 2,101 | 66 | 161 | 2,006 | ||||||||||||
| Champs Sports | 576 | 22 | 22 | 576 | ||||||||||||
| Footaction | 373 | 6 | 23 | 356 | ||||||||||||
| Lady Foot Locker | 557 | 10 | 41 | 526 | ||||||||||||
| Kids Foot Locker | 335 | 13 | 27 | 321 | ||||||||||||
| Total Athletic Stores | 3,942 | 117 | 274 | 3,785 | ||||||||||||
| At January 31, 2004 | Acquired | Opened | Closed | At January 29, 2005 | |||||||||||||||||||
|---|---|---|---|---|---|---|---|---|---|---|---|---|---|---|---|---|---|---|---|---|---|---|---|
| Foot Locker | 2,088 | 11 | 84 | 48 | 2,135 | ||||||||||||||||||
| Champs Sports | 581 | — | 5 | 16 | 570 | ||||||||||||||||||
| Footaction | — | 349 | 4 | 4 | 349 | ||||||||||||||||||
| Lady Foot Locker | 584 | — | 2 | 19 | 567 | ||||||||||||||||||
| Kids Foot Locker | �� | 357 | — | 1 | 12 | 346 | |||||||||||||||||
| Total Athletic Stores | 3,610 | 360 | 96 | 99 | 3,967 | ||||||||||||||||||
Direct-to-Customers
4
the Amazon.com website and the Foot Locker brands are featured in the Amazon.com specialty stores for apparel and accessories and sporting goods.
Franchise Operations
In March of 2006, the Company entered into a ten-year area development agreement with the Alshaya Trading Co. W.L.L., in which the Company agreed to enter into separate license agreements for the operation of a minimum of 75 Foot Locker stores, subject to certain restrictions, located within the Middle East. Additionally in March 2007, the Company entered into a ten-year agreement with another third party for the exclusive right to open and operate up to 33 Foot Locker stores in the Republic of South Korea. A total of 10 franchised stores were operational at February 2, 2008. Revenue from the 10 franchised stores was not significant for the year-ended February 2, 2008. These stores are not included in the Company’s operating store count above.
Overview of Consolidated Results
The 2007 results represent the 52 weeks ended February 2, 2008 as compared with the prior year which represented the 53 weeks ended February 3, 2007. Income from continuing operations was $49 million or $0.32 per diluted share as compared with the corresponding prior-year period of $247 million or $1.58 per diluted share. Difficult industry trends as well as internal factors affected the 2007 results. Sales of low-profile and casual footwear significantly declined and sales of branded and licensed apparel were weak. Internal factors contributing to the decline included oversupplied inventory, due, in part, to the lack of a clear fashion trend in athletic footwear and apparel, which necessitated higher than normal markdowns.
Executive Summary The following key factors affected the Company’s results in the current year and comparability with the prior year:
- Comparable-store sales declined 6.3 percent.
- Gross margin was negatively affected by higher markdowns primarily to liquidate slow-moving merchandiseand lower vendor allowances.
- Included in 2007 were charges associated with the Company’s store closing program and non-cash impairmentcharges totaling $128 million, pre-tax, or $0.52 per diluted share. Impairment charges totaling $124 million wererecorded to write-down the value of long-lived assets of underperforming stores in the Company’s U.S. retailstore operations and for stores included in the store closing program. The Company
reportedclosed 33 unproductivestores during 2007 as part of the announced store closing program. Included in 2006 was an impairment chargeof $17 million, or $0.08 per diluted share, to write-down long-lived assets of the European operations.
9
- Included in 2007 was a Canadian income tax valuation allowance adjustment that increased net income by$65 million, or $0.42 per diluted share.
- The 53rdweek of 2006 represented $95 million in sales and net income of $18 million, or $0.11 perdiluted share.
Despite the difficult year experienced, the Company ended the year in a strong financial position. Key highlights of the year included:
- Cash and cash equivalents as of February 2, 2008 were $488 million, reflecting cash flow provided by operationsof $283 million.
- Merchandise inventories were reduced by approximately 4 percent, excluding the effect of foreign currencyfluctuations.
- Repaid $2 million of its 5-year term loan, in advance of the regularly scheduled payment date of May 2008.
- Purchased and retired $5 million of the $200 million 8.50 percent debentures payable in 2022, bringing theoutstanding amount to $129 million as of February 2, 2008.
- Dividends totaling $77 million were declared and paid.
- $50 million of common stock was repurchased.
The following table represents a summary of sales and operating results, reconciled to (loss) income from continuing operations before income taxes.
| 2007 | 2006 | 2005 | ||||||||||
| (in millions) | ||||||||||||
| Sales | ||||||||||||
| Athletic Stores | $ | 5,071 | $ | 5,370 | $ | 5,272 | ||||||
| Direct-to-Customers | 364 | 380 | 381 | |||||||||
| Family Footwear | 2 | — | — | |||||||||
| $ | 5,437 | $ | 5,750 | $ | 5,653 | |||||||
| Operating Results | ||||||||||||
| Athletic Stores | $ | (27 | ) | $ | 405 | $ | 419 | |||||
| Direct-to-Customers | 40 | 45 | 48 | |||||||||
| Family Footwear (1) | (6 | ) | — | — | ||||||||
| Division profit | 7 | 450 | 467 | |||||||||
| Restructuring income (charge)(2) | 2 | (1 | ) | — | ||||||||
| Total division profit | 9 | 449 | 467 | |||||||||
| Corporate expense | (59 | ) | (68 | ) | (58 | ) | ||||||
| Total operating (loss) profit | (50 | ) | 381 | 409 | ||||||||
| Other income | 1 | 14 | 6 | |||||||||
| Interest expense, net | 1 | 3 | 10 | |||||||||
| (Loss) income from continuing operations before income taxes | $ | (50 | ) | $ | 392 | $ | 405 | |||||
| (1) | During the first quarter of 2007, the Company launched a new family footwear concept, Footquarters. The concept’s results did not meet the Company’s expectations and, therefore, the Company decided not to further invest in this business. These stores were converted to the Company’s other formats. Included in the operating loss of $6 million, was approximately $2 million of costs associated with the removal of signage and the write-off of unusable fixtures. | |
| (2) | During 2007, the Company adjusted its 1993 Repositioning and 1991 Restructuring reserve by $2 million primarily due to favorable lease terminations. During 2006, the Company recorded a restructuring charge of $1 million, which represented a revision to the original estimate of the lease liability associated with the guarantee of The San Francisco Music Box Company distribution center. These amounts are included in selling, general and administrative expenses in the Consolidated Statements of Operations. | |
On March 11, 2008, we filed a Current Report on Form 8-K, which included a press release announcing our fourth quarter and full year 2007 financial results. In completing our final analysis, we determined that our income tax benefit was overstated by $2 million. While not material to understanding fourth quarter and full year 2007 financial results contained in the March 10, 2008, press release, the amount disclosed above has been recorded in our actual results for the fourth quarter and full year ended January 29, 2005 of $255 million, or $1.64 per diluted share, an increase of 22 percent as compared with 2003. Net income2007. We believe noting this change is beneficial to understanding the actual results for the fourth quarter and full year ended January 29, 2005 increased2007 contained in this financial report. Accordingly, the full year 2007 income tax benefit was reduced from $101 million reported in the press release to $293 million, or $1.88 per diluted share, and includes $0.24 per diluted share from discontinued operations. Earningsa benefit of $99 million. Diluted earnings per share of $0.24 or $38 million in discontinued operations reflectsfor the resolution of U.S. income tax examinations of $37 million, as well as income of $1 million relatedfull year 2007 was changed from $0.34 to a refund of custom duties related to certain of the businesses that comprised the Specialty Footwear segment.
10
Sales
| 2004 | 2003 | 2002 | ||||||||||||||||
|---|---|---|---|---|---|---|---|---|---|---|---|---|---|---|---|---|---|---|
| (in millions) | ||||||||||||||||||
| Athletic Stores | $ | 4,989 | $ | 4,413 | $ | 4,160 | ||||||||||||
| Direct-to-Customers | 366 | 366 | 349 | |||||||||||||||
| $ | 5,355 | $ | 4,779 | $ | 4,509 | |||||||||||||
Sales of the Company’s acquisition of 349 Footaction stores in May 2004 and the acquisition of 11 stores in the Republic of Ireland in late October 2004, which accounted for $332 million and $5$5,750 million in sales, respectively, for 2004. Comparable-store sales2006 increased by 0.9 percent. The remaining increase is a result of the Company’s continuation of the new store-opening program.
Gross Margin
5
Division Profit
| 2004 | 2003 | 2002 | |||||||||||||
|---|---|---|---|---|---|---|---|---|---|---|---|---|---|---|---|
| (in millions) | |||||||||||||||
| Athletic Stores | $ | 420 | $ | 363 | $279 | ||||||||||
| Direct-to-Customers | 45 | 53 | 40 | ||||||||||||
| Division profit | 465 | 416 | 319 | ||||||||||||
Restructuring (charges) income(1) | (2 | ) | (1 | ) | 2 | ||||||||||
| Total division profit | 463 | 415 | 321 | ||||||||||||
| Corporate expense | (74 | ) | (73 | ) | (52 | ) | |||||||||
| Total operating profit | 389 | 342 | 269 | ||||||||||||
Non-operating income(2) | — | — | 3 | ||||||||||||
| Interest expense, net | (15 | ) | (18 | ) | (26) | ||||||||||
| Income from continuing operations before income taxes | $ | 374 | $ | 324 | $ 246 | ||||||||||
Segment Information
Athletic Stores
| 2004 | 2003 | 2002 | |||||||||||||
|---|---|---|---|---|---|---|---|---|---|---|---|---|---|---|---|
| (in millions) | |||||||||||||||
| Sales | $ | 4,989 | $ | 4,413 | $4,160 | ||||||||||
Division profit | |||||||||||||||
| Stores | $ | 420 | $ | 363 | $279 | ||||||||||
| Restructuring income | — | — | 1 | ||||||||||||
| Total division profit | $ | 420 | $ | 363 | $ 280 | ||||||||||
| Sales as a percentage of consolidated total | 93 | % | 92 | % | 92% | ||||||||||
| Number of stores at year end | 3,967 | 3,610 | 3,625 | ||||||||||||
| Selling square footage (in millions) | 8.89 | 7.92 | 8.04 | ||||||||||||
| Gross square footage (in millions) | 14.78 | 13.14 | 13.22 | ||||||||||||
6
2004 compared with 2003
Selling, General and Administrative Expenses
Selling, general and administrative (“SG&A”) expenses increased by $13 million to $1,176 million in 2003.2007, or by 1.1 percent, as compared with 2006. SG&A as a percentage of sales increased to 21.6 percent as compared with 20.2 percent in 2006. The increase in SG&A as a percentage of sales is due to the decline in sales. Excluding the effect of foreign currency fluctuations primarily related to the euro, sales from athletic store formats increased 10.6 percent in 2004. This increase was primarily driven by incremental sales related to the acquisition of the 349 Footaction stores in May 2004 totaling $332 million and the sales of53rd week in 2006, SG&A decreased by $2 million. This decrease primarily reflected savings associated with operating fewer stores, as well as controlling variable expenses as compared with the 11 stores acquired in the Republic of Ireland amounting to $5 million. The balance of the increase primarily reflects new store growth. Total Athletic Stores comparable-store salesprior-year period.
SG&A increased by 1.0 percent in 2004.
2003 compared with 2002
7
Direct-to-Customerspension fund asset performance.
| 2004 | 2003 | 2002 | ||||||||||||||||
|---|---|---|---|---|---|---|---|---|---|---|---|---|---|---|---|---|---|---|
| (in millions) | ||||||||||||||||||
| Sales | $ | 366 | $ | 366 | $ | 349 | ||||||||||||
| Division profit | $ | 45 | $ | 53 | $ | 40 | ||||||||||||
| Sales as a percentage of consolidated total | 7 | % | 8 | % | 8 | % | ||||||||||||
2004 compared with 2003
2003 compared with 2002
Corporate Expense
11
The increase in corporate expense in 20032006 as compared with 2002 was primarily related to increased2005 of $10 million reflects the adoption of SFAS No. 123(R) that resulted in incremental compensation costs for incentive bonuses and increased restricted stock expense from additional grants.
8
Costs and Expenses
Selling, General and Administrative Expenses
Depreciation and Amortization
Interest Expense, Net
| 2004 | 2003 | 2002 | ||||||||||||||||
|---|---|---|---|---|---|---|---|---|---|---|---|---|---|---|---|---|---|---|
| (in millions) | ||||||||||||||||||
| Interest expense | $ | 22 | $ | 26 | $ | 33 | ||||||||||||
| Interest income | (7 | ) | (8 | ) | (7 | ) | ||||||||||||
| Interest expense, net | $ | 15 | $ | 18 | $ | 26 | ||||||||||||
| Weighted-average interest rate (excluding facility fees): | ||||||||||||||||||
| Short-term debt | — | % | — | % | — | % | ||||||||||||
| Long-term debt | 5.2 | % | 6.1 | % | 7.2 | % | ||||||||||||
| Total debt | 5.2 | % | 6.1 | % | 7.2 | % | ||||||||||||
| Short-term debt outstanding during the year: | ||||||||||||||||||
| High | $ | — | $ | — | $ | — | ||||||||||||
| Weighted-average | $ | — | $ | — | $ | — | ||||||||||||
Depreciation and amortization of $175 million term loan that commencedincreased by 2.3 percent in May 2004.
9
Interest Expense, Net
| 2007 | 2006 | 2005 | ||||||||||
| (in millions) | ||||||||||||
| Interest expense | $ | 21 | $ | 23 | $ | 23 | ||||||
| Interest income | (20 | ) | (20 | ) | (13 | ) | ||||||
| Interest expense, net | $ | 1 | $ | 3 | $ | 10 | ||||||
| Weighted-average interest rate (excluding facility fees): | ||||||||||||
| Short-term debt | — | % | — | % | — | % | ||||||
| Long-term debt | 6.8 | % | 7.8 | % | 6.2 | % | ||||||
| Total debt | 6.8 | % | 7.8 | % | 6.2 | % | ||||||
| Short-term debt outstanding during the year: | ||||||||||||
| High | $ | — | $ | — | $ | — | ||||||
| Weighted-average | $ | — | $ | — | $ | — | ||||||
Interest income of $20 million remained unchanged from 2006. Interest income is generated through the investment of cash equivalents, short-term investments, the accretion of the Northern Group note to its face value and accrual of interest on the outstanding principal, as well as interest onthe effect of the Company’s cross currency swaps. Interest income tax refunds. The decrease in interest income of $1related to cash, cash equivalents and short-term investments was $16 million in 2004 was primarily related to2007 and $14 million in 2006. Interest income on the reduction of interest income earned on tax refunds and settlements as they were received during 2003. The Northern Group note was recorded in the fourth quarter of 2002 and interest income amounted to $2 million in both 20042007 and 2003.2006. The cross currency swaps income totaled $1 million in 2007 as compared with $3 million in 2006.
Interest expense of $23 million in 2006 remained unchanged from 2005. Interest rate swap agreements did not significantly affect interest expense in 2006.
The increase in interest income of $7 million in 2006 as compared with 2005 was primarily related to increased interest income earned on cash, cash equivalents, and short-term investments. Interest income related to cash, cash equivalents and short-term investments was $5$14 million in 20042006 and 2003.
12
Other Income
In 2007, other income included a $1 million gain related to a final settlement with the Company’s insurance carriers of a claim related to a store damaged by a fire in 2006. Additionally, the Company sold two of its lease interests in Europe for a gain of $1 million. These gains were offset primarily by premiums paid for foreign currency option contracts. The 2006 amounts included a net gain of $4 million from the termination of two of the Company’s leases for approximately $5 million and insurance claims related to Hurricane Katrina that resulted in a gain of $8 million, which represented amounts in excess of losses. Also during 2006, the Company purchased and retired $38 million of long-term debt at a discount from face value of $2 million. Interest income of $1 million and $2 million was related to tax refunds and settlements in 2003 and 2002, respectively.
Income Taxes
The effective tax rate for 2006 was principally36.9 percent as compared with 35.0 percent in the prior year. The increase in the rate is primarily due to the change in the mix of U.S. and international profits and the $17 million impairment charge relating to the Company’s European operations, as well as a $6 million valuation allowance adjustment recorded in 2005.
Segment Information
The Company evaluates performance based on several factors, the primary financial measure of which is division profit. Division profit (loss) reflects income (loss) from continuing operations before income taxes, corporate expense, non-operating income, and net interest expense.
Athletic Stores
| 2007 | 2006 | 2005 | ||||||||||
| (in millions) | ||||||||||||
| Sales | $ | 5,071 | $ | 5,370 | $ | 5,272 | ||||||
| Division (loss) profit | $ | (27 | ) | $ | 405 | $ | 419 | |||||
| Sales as a percentage of consolidated total | 93 | % | 93 | % | 93 | % | ||||||
| Division (loss) profit margin | (0.5 | )% | 7.5 | % | 7.9 | % | ||||||
| Number of stores at year end | 3,785 | 3,942 | 3,921 | |||||||||
| Selling square footage (in millions) | 8.50 | 8.74 | 8.71 | |||||||||
| Gross square footage (in millions) | 14.12 | 14.55 | 14.48 | |||||||||
2007 compared with 2006
Athletic Stores sales of $5,071 million decreased 5.6 percent in 2007, as compared with $5,370 million in 2006. Excluding the effect of foreign currency fluctuations, primarily related to the euro, sales from athletic store formats decreased by 7.8 percent in 2007. The decline in sales for the year ended February 2, 2008 was primarily related to the domestic operations. Sales in the U.S. were negatively affected by a lower ratecontinuing weakening in consumer spending, unseasonable warmer weather, and a lack of tax onclear fashion trend in athletic footwear and apparel. Internationally, comparable-store sales declined mid-single digits. In Europe, sales of low-profile footwear styles declined, while the sales trend of higher priced technical footwear was higher than the prior year. Comparable-store sales for the Athletic Stores segment decreased by 6.6 percent in 2007.
Athletic Stores reported a loss of $27 million in 2007 as compared with a profit of $405 million in 2006. The decrease in division profit was attributable to the U.S operations. The decline in the U.S. operations was offset, in part, by increases in most international formats. Included in the Athletic Stores division results for 2007 are non-cash impairment charges of $117 million to write-down long-lived assets such as store fixtures and leasehold improvements for 1,395 stores at the Company’s foreignU.S. store operations and the settlement of tax examinations.
13
the Company also came toevaluated the recoverability of long-lived assets considering the revised estimated future cash flows. The Company recorded an agreement on the pre-filing reviewadditional non-cash impairment charge of the Company’s income tax return for 2003. As$7 million as a result of these actions bythis analysis. Exit costs related to 33 stores that closed during 2007, comprising primarily lease termination costs of $4 million, were recognized in accordance with SFAS No. 146, “Accounting for Costs Associated with Exit or Disposal Activities.”
2006 compared with 2005
Athletic Stores sales of $5,370 million increased 1.9 percent in 2006, as compared with $5,272 million in 2005. Excluding the IRS, the Company reduced its income tax provision for continuing operations by $7 million and discontinued operations by $37 million. During the third quartereffect of 2004 the IRS completed its post-filing review of the Company’s income tax return for 2003 resulting in a $2 million reductionforeign currency fluctuations, primarily related to the income tax provision. During the fourth quarter of 2004 the Company completed an analysis ofeuro, and the effect of the completion53rd week, sales from athletic store formats decreased by 0.6 percent in 2006. Footaction and Champs Sports significantly increased sales, primarily from the sale of marquee basketball and running footwear. This was offset primarily by decreased sales in Foot Locker Europe. Foot Locker Europe’s sales declined due to the IRS’s examinationcontinued difficult athletic retail environment, particularly in France, the U.K. and reviewItaly. Comparable-store sales for the Athletic Stores segment decreased by 1.1 percent in 2006.
Division profit from Athletic Stores decreased by 3.3 percent to $405 million in 2006 from $419 million in 2005. Division profit as a percentage of sales decreased to 7.5 percent. The decrease in division profit is primarily attributable to the Foot Locker Europe division due to the fashion shift from higher priced marquee footwear to lower priced low-profile footwear styles and a highly competitive retail environment, particularly for the sale of low-profile footwear styles. Included in the Athletic Stores division profit for 2006 is an impairment charge of $17 million related to the Company’s income tax returns. This analysis resultedEuropean operations, consistent with the Company’s recoverability of long-lived assets policy. The charge was comprised primarily of stores located in a reduction to the income tax provision of $3 million.
Direct-to-Customers
| 2007 | 2006 | 2005 | ||||||||||
| (in millions) | ||||||||||||
| Sales | $ | 364 | $ | 380 | $ | 381 | ||||||
| Division profit | $ | 40 | $ | 45 | $ | 48 | ||||||
| Sales as a percentage of consolidated total | 7 | % | 7 | % | 7 | % | ||||||
| Division profit margin | 11.0 | % | 11.8 | % | 12.6 | % | ||||||
2007 compared with 2006
Direct-to-Customers sales decreased 4.2 percent to $364 million in 2007, as compared with $380 million in 2006. Internet sales increased by 6.3 percent to $287 million, as compared with 2006. Catalog sales decreased by 30.0 percent to $77 million in 2007 from $110 million in 2006. Management believes that the decrease in catalog sales, which was substantially offset by the increase in Internet sales, is a result of customers browsing and selecting products through its catalogs and then making their purchases via the Internet. Sales were negatively affected by reduced sales from third party arrangements, as well as weakened consumer spending for athletic footwear and apparel.
The Direct-to-Customers business generated division profit of $40 million in 2007, as compared with $45 million in 2006. Division profit, as a percentage of sales, decreased to 11.0 percent in 2002.2007 from 11.8 percent in 2006. The increased tax rate was primarily duedecline in division profit is a result of lower sales.
2006 compared with 2005
Direct-to-Customers sales decreased to the Company recording tax benefits of $5$380 million in 20032006, as compared to $9with $381 million in 2002. In addition2005. Internet sales increased to $270 million, increasing by 11.1 percent as compared with 2005. Catalog sales decreased by 20.3 percent to $110 million in 2006 from $138 million in 2005. Management believes that the rate increased due todecrease in catalog sales, which was substantially offset by the increase in Internet sales, is a shift in taxable income from lower to higher tax jurisdictions. During 2003,result of customers browsing and selecting products through its catalogs and then making their purchases via the Company recordedInternet. Sales for the Direct-to-Customer business were negatively affected by the termination of a $1 million tax benefit related to state tax law changes, a $2 million tax benefit related to a reductionthird party arrangement in the valuation allowance for deferred tax assets relatedearly part of 2006.
14
The Direct-to-Customers business generated division profit of $45 million in 2006, as compared with $48 million in 2005. Division profit, as a percentage of sales, decreased to 11.8 percent in 2006 from 12.6 percent in 2005. Several initiatives were implemented to mitigate the loss of revenue from the cancelled third party contract, such as expanding the ESPN offerings. However, these initiatives did not fully offset the loss in profit which resulted in a multi-state tax planning strategy, a $1 million tax benefit related to a reductiondecline in the valuation allowance for foreign tax loss carryforwards, and a tax benefit of $1 million related to the settlement of tax examinations.
10
Liquidity and Capital Resources
Liquidity
Planned capital expenditures for 2008 are approximately $158 million, of which $135 million relates to modernizations of existing stores and 13 percentnew store openings, and 14 percent from another in 2004$23 million reflects the development of information systems and 2003, respectively.
Cash Flow
Net cash provided by investing activities of the Company’s continuing operations was $117 million in 2007 as compared with $108 million used in investing activities in 2006. During 2007, the Company liquidated most of its short-term investments, which represented auction rate securities, due to issues in the global credit and capital markets. Capital expenditures of $148 million in 2007 and $165 million in 2006 primarily related to store remodeling and new stores. During 2007, the Company received $21 million representing the maturity of an investment of $14 million and the repayment of a note of $7 million.
Net cash used in investing activities of the Company’s continuing operations was $424$108 million in 20042006 as compared with $265$182 million in 2003. During 2004, the Company paid $226 million for the purchase of 349 Footaction stores from Footstar, Inc. and paid €13 million (approximately $17 million, of which $1 million remains to be paid) for the purchase of 11 stores in the Republic of Ireland.2005. The Company’s purchase of short-term investments, net of sales, increaseddecreased by $9$49 million in 20042006 as compared with an increase of $106$31 million in 2003.2005. Capital expenditures of $156$165 million in 20042006 and $144$155 million in 20032005 primarily related to store remodelingsremodeling and new stores. Lease acquisition costs, primarilyDuring 2006, the Company received net proceeds of $4 million as a result a lease termination. The Company also received $4 million of insurance proceeds from its insurance carriers related to securethe final settlement of the property and extend leasesequipment claims for prime locations in Europe, were $17 million and $15 million in 2004 and 2003, respectively.
11
Capital Structure
In October 2007, the Company amended its revolving credit agreement thereby, extendingto provide for a one-year extension of the maturity daterevolving credit facility to May 2009 from July 2006. On January 31, 2005,19, 2010 and a reduction in the fixed charge coverage ratio to no less than 1.25:1 for the fourth quarter of 2007 and the first quarter of 2008, increasing to 2.0:1 by the first quarter of 2010. The amendment also permits the payment of dividends by the Company prepaidof up to $90 million in 2008 and up to $100 million for each year thereafter. On February 19, 2008, the first principal payment of $18Company further amended its revolving credit facility to increase the amount permitted to be paid as dividends in 2008 to $95 million. With regard to stock repurchases, the amendment provides that not more than $50 million which would have been due in May 2005.the aggregate may be expended after October 26, 2007 unless the fixed charge coverage ratio is at least 2.0:1 for the quarter immediately preceding any such repurchase and the Company has delivered its annual audited financial statements with respect to 2007. The agreement includes various restrictive financial covenants with which the Company was in compliance on January 29, 2005.
Credit Rating
12
Debt Capitalization and Equity
| 2007 | 2006 | |||||||
| (in millions) | ||||||||
| Long-term debt and obligations under capital lease | $ | 221 | $ | 234 | ||||
| Present value of operating leases | 2,126 | 2,069 | ||||||
| Total debt including the present value of operating leases | 2,347 | 2,303 | ||||||
| Less: | ||||||||
| Cash and cash equivalents | 488 | 221 | ||||||
| Short-term investments | 5 | 249 | ||||||
| Total net debt including the present value of operating leases | 1,854 | 1,833 | ||||||
| Shareholders’ equity | 2,271 | 2,295 | ||||||
| Total capitalization | $ | 4,125 | $ | 4,128 | ||||
| Total net debt capitalization percent including the present value of | ||||||||
| operating leases | 44.9 | % | 44.4 | % | ||||
| Net debt capitalization percent | — | % | — | % | ||||
| 2004 | 2003 | ||||||||||
|---|---|---|---|---|---|---|---|---|---|---|---|
| (in millions) | |||||||||||
| Cash, cash equivalents and short-term investments, net of debt | |||||||||||
| and capital lease obligations | $ | 131 | $ | 112 | |||||||
| Present value of operating leases | 1,989 | 1,683 | |||||||||
| Total net debt | 1,858 | 1,571 | |||||||||
| Shareholders’ equity | 1,830 | 1,375 | |||||||||
| Total capitalization | $ | 3,688 | $ | 2,946 | |||||||
| Net debt capitalization percent | 50.4 | % | 53.3 | % | |||||||
| Net debt capitalization percent without operating leases | — | % | — | % | |||||||
13
17
Contractual Obligations and Commitments
| Payments Due by Period | |||||||||||||||||||||||
|---|---|---|---|---|---|---|---|---|---|---|---|---|---|---|---|---|---|---|---|---|---|---|---|
| Contractual Cash Obligations | Total | Less than 1 Year | 2 – 3 Years | 4 – 5 Years | After 5 Years | ||||||||||||||||||
| (in millions) | |||||||||||||||||||||||
| Long-term debt | $ | 351 | $ | 18 | $ | 44 | $ | 113 | $ | 176 | |||||||||||||
| Operating leases | 2,723 | 449 | 806 | 578 | 890 | ||||||||||||||||||
| Capital lease obligations | 14 | — | 14 | — | — | ||||||||||||||||||
Other long-term liabilities(1) | — | — | — | — | — | ||||||||||||||||||
| Total contractual cash obligations | $ | 3,088 | $ | 467 | $ | 864 | $ | 691 | $ | 1,066 | |||||||||||||
| Payments Due by Period | ||||||||||||||||||||
| Less than | 2 – 3 | 3 – 5 | After 5 | |||||||||||||||||
| Contractual Cash Obligations | Total | 1 Year | Years | Years | Years | |||||||||||||||
| (in millions) | ||||||||||||||||||||
| Long-term debt(1) | $ | 221 | $ | — | $ | 88 | $ | — | $ | 133 | ||||||||||
| Operating leases(2) | 2,793 | 487 | 832 | 651 | 823 | |||||||||||||||
| Other long-term liabilities(3) | — | — | — | — | — | |||||||||||||||
| Total contractual cash obligations | $ | 3,014 | $ | 487 | $ | 920 | $ | 651 | $ | 956 | ||||||||||
| (1) | The amounts presented above represent the contractual maturities of the Company’s long-term debt, excluding interest. Additional information is included in the “Long-Term Debt and Obligations under Capital Leases” footnote under “Item 8. Consolidated Financial Statements and Supplementary Data.” | |
| (2) | The amounts presented represent the future minimum lease payments under non-cancelable operating leases. In addition to minimum rent, certain of the Company’s leases require the payment of additional costs for insurance, maintenance, and other costs. These costs have historically represented approximately 25 to 30 percent of the minimum rent amount. These additional amounts are not included in the table of contractual commitments as the timing and/or amounts of such payments are unknown. | |
| (3) | The Company’s other liabilities in the Consolidated Balance Sheet as of | |
| Amount of Commitment Expiration by Period | |||||||||||||||||||||||
|---|---|---|---|---|---|---|---|---|---|---|---|---|---|---|---|---|---|---|---|---|---|---|---|
| Other Commercial Commitments | Total Amounts Committed | Less than 1 Year | 2 – 3 Years | 4 – 5 Years | After 5 Years | ||||||||||||||||||
| (in millions) | |||||||||||||||||||||||
| Line of credit | $ | 175 | $ | — | $ | — | $ | 175 | $ | — | |||||||||||||
| Stand-by letters of credit | 25 | — | — | 25 | — | ||||||||||||||||||
Purchase commitments(2) | 1,696 | 1,686 | 6 | 4 | — | ||||||||||||||||||
Other(3) | 131 | 41 | 58 | 28 | 4 | ||||||||||||||||||
| Total commercial commitments | $ | 2,027 | $ | 1,727 | $ | 64 | $ | 232 | $ | 4 | |||||||||||||
| Total | Amount of Commitment Expiration by Period | |||||||||||||||||||||
| Amounts | Less than | 2 – 3 | 3 – 5 | After 5 | ||||||||||||||||||
| Contractual Cash Obligations | Committed | 1 Year | Years | Years | Years | |||||||||||||||||
| (in millions) | ||||||||||||||||||||||
| Line of credit | $ | 189 | $ | — | $ | 189 | $ | — | $ | — | ||||||||||||
| Stand-by letters of credit | 11 | — | 11 | — | — | |||||||||||||||||
| Purchase commitments(4) | 1,453 | 1,450 | 3 | — | — | |||||||||||||||||
| Other(5) | 57 | 19 | 33 | 5 | — | |||||||||||||||||
| Total commercial commitments | $ | 1,710 | $ | 1,469 | $ | 236 | $ | 5 | $ | — | ||||||||||||
| Represents open purchase orders, as well as minimum required purchases under merchandise contractual agreements, at |
| (5) | Represents payments required by non-merchandise purchase agreements and minimum royalty requirements. | |
18
Critical Accounting Policies
14
Business Combinations
Merchandise Inventories
Vendor Reimbursements
Impairment of Long-Lived Assets
19
future cash flows by store, which is generally measured by discounting the expected future cash flows at the Company’s weighted-average cost of capital. Management believes its policy is reasonable and is consistently applied. Future expected cash flows are based upon estimates that, if not achieved, may result in significantly different results. Long-lived tangible
During 2007, the Company recorded non-cash impairment charges totaling $124 million primarily to write-down long-lived assets such as store fixtures and intangible assets with finite lives primarily include property and equipment and intangible lease acquisition costs.
The fair value of each of the Company’s reporting units exceeded its carrying value as of February 1, 2004.the beginning of the year. The Company used a combination of a discounted cash flow approach and market-based approach to determine the
15
fair value of a reporting unit. The latter requires judgment and uses one or more methods to compare the reporting unit with similar businesses, business ownership interests or securities that have been sold.
During the third and fourth quarters of 2007, the Company performed reviews of its U.S. Athletic stores’ goodwill, as a result of the SFAS No. 144 recoverability analysis. These analyses did not result in an impairment charge.
Share-Based Compensation
The Company estimates the fair value of options granted using the Black-Scholes option pricing model. The Company estimates the expected term of options granted using its historical exercise and post-vesting employment termination patterns, which the Company believes are representative of future behavior. Changing the expected term by one year changes the fair value by 10 to 15 percent depending if the change was an increase or decrease to the expected term. The Company estimates the expected volatility of its common stock at the grant date using a weighted-average of the Company’s historical volatility and implied volatility from traded options on the Company’s common stock. A 50 basis point change in volatility would have a 1 percent change to the fair value. The risk-free interest rate assumption is determined using the Federal Reserve nominal rates for U.S. Treasury zero-coupon bonds with maturities similar to those of the expected term of the award being valued. The expected dividend yield is derived from the Company’s historical experience. A 50 basis point change to the dividend yield would change the fair value by approximately 5 percent. The Company records stock-based compensation expense only for those awards expected to vest using an estimated forfeiture rate based on its historical pre-vesting forfeiture data, which it believes are representative of future behavior, and periodically will revise those estimates in subsequent periods if actual forfeitures differ from those estimates.
The Black-Scholes option valuation model requires the use of subjective assumptions. Changes in these assumptions can materially affect the fair value of the options. The Company may elect to use different assumptions under the Black-Scholes option pricing model in the future if there is a difference between the assumptions used in determining stock-based compensation cost and the actual factors that become known over time.
Pension and Postretirement Liabilities
Long-Term Rate of Return Assumption - The expected long-term rate of return on invested pension plan assets is a component of pension expense and theexpense. The rate is based on the plans’ weighted-average target asset allocation, of 64 percent equity securities and 36 percent fixed income investments, as well as historical and future expected performance of those assets. The target asset allocation is selected to obtain an investment return that is sufficient to cover the expected benefit payments based on the timing of settlements and to reduce future contributions by the Company. The Company’s common stock represented approximately 21 percent of the total pension plans’ assets at January 29, 2005.February 2, 2008.
20
The weighted-average long-term rate of return used to determine 2007 pension expense was 8.85 percent. A decrease of 50 basis points in the weighted-average expected long-term rate of return would have increased 20042007 pension expense by approximately $3 million. The actual return on plan assets in a given year may differ from the expected long-term rate of return and the resulting gain or loss is deferred and amortized into the plans’ performanceexpense over time.
Discount Rate - An assumed discount rate is used to measure the present value of future cash flow obligations of the plans and the interest cost component of pension expense and postretirement income. The discount rate selected to measure the present value of the Company’s U.S. benefit obligations as of February 2, 2008 was derived using a cash flow matching method whereby the Company compares the plans’ projected payment obligations by year with the corresponding yield on the Citibank Pension Discount Curve. The cash flows are then discounted to their present value and an overall discount rate is determined. The discount rate selected with reference to measure the Aa long-term corporatepresent value of the Company’s Canadian benefit obligations as of February 2, 2008 was developed by using the plan’s bond yield.portfolio indices which match the benefit obligations.
A decrease of 50 basis points in the weighted-average discount rate would have increased the accumulated benefit obligation as of January 29, 2005February 2, 2008 of the pension and postretirement plans by approximately $30$27 million and approximately $1 million, respectively.the effect on the postretirement plan would not be significant. Such a decrease would not have significantly changed 20042007 pension expense or postretirement income.
There is limited risk to the Company for increases in healthcarehealth care costs related to the postretirement plan as, beginning in 2001, new retirees have assumed the full expected costs and existingthen-existing retirees and future retirees have assumed all increases in such costs since the beginning of fiscal year 2001. The additional minimum liability included in shareholders’ equity at January 29, 2005 for the pension plans represented the amount by which the accumulated benefit obligation exceeded the fair market value of the plan assets. The Company contributed $44 million to the U.S. qualified pension plan and contributed $6 million to the Canadian qualified pension plan in February 2004. In addition, $56 million was contributed to the U.S. qualified pension plan in September 2004.
Income Taxes
16
Discontinued, Repositioning and Restructuring Reserves
21
and Disclosure Regarding Discontinued Operations,” which requires changes in the carrying value of assets received as consideration from the disposal of a discontinued operation to be classified within continuing operations. The purchaser has made all payments required under the terms of the Note,note; however, the business has sustained unexpected operating losses during the past fiscal year. The Company has evaluated the projected performance of the business and will continue to monitor its results during the coming year. At January 29, 2005, $9February 2, 2008, CAD$15.5 million remains outstanding on the Note.
Disclosure Regarding Forward-Looking Statements
Information regarding interest rate risk management and foreign exchange risk management is included in the “Financial Instruments and Risk Management” footnote under “Item 8. Consolidated Financial Statements and Supplementary Data.”
17
22
Item 8. Consolidated Financial Statements and Supplementary Data
|
MANAGEMENT’S REPORT
  |   | |||||||||
| MATTHEW D. SERRA, | ROBERT W. MCHUGH, | |||||||||
| Chairman of the Board, | Senior Vice President and | |||||||||
| President and Chief Executive Officer | Chief Financial Officer | |||||||||
| March 31, 2008 | ||||||||||
March 28, 2005
18
23
MANAGEMENT’S REPORT ON INTERNAL CONTROL OVER FINANCIAL REPORTING
| | |||||||||
| MATTHEW D. SERRA, | ROBERT W. MCHUGH, | |||||||||
| Chairman of the Board, | Senior Vice President and | |||||||||
| President and Chief Executive Officer | Chief Financial Officer | |||||||||
| March 31, 2008 | ||||||||||
March 28, 2005
19
24
REPORT OF INDEPENDENT REGISTERED PUBLIC ACCOUNTING FIRM
Foot Locker, Inc.
We conducted our audits in accordance with the standards of the Public Company Accounting Oversight Board (United States). Those standards require that we plan and perform the audit to obtain reasonable assurance about whether the financial statements are free of material misstatement. An audit also includes examining, on a test basis, evidence supporting the amounts and disclosures in the financial statements. An audit also includesstatements, assessing the accounting principles used and significant estimates made by management, as well as evaluating the overall financial statement presentation. We believe that our audits provide a reasonable basis for our opinion.
In our opinion, the consolidated financial statements referred to above present fairly, in all material respects, the financial position of Foot Locker, Inc. and subsidiaries as of January 29, 2005February 2, 2008 and January 31, 2004,February 3, 2007, and the results of their operations and their cash flows for each of the years in the three-year period ended January 29, 2005,February 2, 2008 in conformity with U.S. generally accepted accounting principles.
As discussed in the Notes to Consolidated Financial Statements, effective February 4, 2007, the Company adopted Statement of Financial Accounting Standards Interpretation (“FIN”) No. 48, “Accounting for Uncertainty in Income Taxes.” Effective February 3, 2007, the Company adopted Statement of Financial Accounting Standards (“SFAS”) No 158, “Employers’ Accounting for Defined Benefit Pension and Other Post Retirement Plans – An Amendment of FASB Statements No. 87, 88, 106, and 132(R).” In addition, effective January 29, 2006, the Company adopted SFAS No. 123(R), “Share-Based Payment,” and SFAS No. 151, “Inventory Costs – An Amendment of ARB No. 43, Chapter 4,” as well as changed their method for quantifying errors based on SEC Staff Accounting Bulletin No. 108, “Considering the Effects of Prior Year Misstatements when Quantifying Misstatements in Current Year Financial Statements.”
We also have audited, in accordance with the standards of the Public Company Accounting Oversight Board (United States), the effectiveness of Foot Locker, Inc.’s internal control over financial reporting as of January 29, 2005,February 2, 2008, based on criteria established in Internal Control —– Integrated Framework issued by the Committee of Sponsoring Organizations of the Treadway Commission (COSO), and our report dated March 28, 200531, 2008 expressed an unqualified opinion on management’s assessment of, and the effective operationeffectiveness of internal control over financial reporting.
March
20
25
REPORT OF INDEPENDENT REGISTERED PUBLIC ACCOUNTING FIRM ON
INTERNAL CONTROL OVER FINANCIAL REPORTING
Foot Locker, Inc.
We conducted our audit in accordance with the standards of the Public Company Accounting Oversight Board (United States). Those standards require that we plan and perform the audit to obtain reasonable assurance about whether effective internal control over financial reporting was maintained in all material respects. Our audit included obtaining an understanding of internal control over financial reporting, evaluating management’s assessment,assessing the risk that a material weakness exists, and testing and evaluating the design and operating effectiveness of internal control andbased on the assessed risk. Our audit also included performing such other procedures as we considered necessary in the circumstances. We believe that our audit provides a reasonable basis for our opinion.
A company’s internal control over financial reporting is a process designed to provide reasonable assurance regarding the reliability of financial reporting and the preparation of financial statements for external purposes in accordance with U.S. generally accepted accounting principles. A company’s internal control over financial reporting includes those policies and procedures that (1) pertain to the maintenance of records that, in reasonable detail, accurately and fairly reflect the transactions and dispositions of the assets of the company; (2) provide reasonable assurance that transactions are recorded as necessary to permit preparation of financial statements in accordance with U.S. generally accepted accounting principles, and that receipts and expenditures of the company are being made only in accordance with authorizations of management and directors of the company; and (3) provide reasonable assurance regarding prevention or timely detection of unauthorized acquisition, use, or disposition of the company’s assets that could have a material effect on the financial statements.
Because of its inherent limitations, internal control over financial reporting may not prevent or detect misstatements. Also, projections of any evaluation of effectiveness to future periods are subject to the risk that controls may become inadequate because of changes in conditions, or that the degree of compliance with the policies or procedures may deteriorate.
In our opinion, management’s assessment that Foot Locker, Inc. maintained effective internal control over financial reporting as of January 29, 2005, is fairly stated, in all material respects, based on criteria established in Internal Control — Integrated Framework issued by the Committee of Sponsoring Organizations of the Treadway Commission (COSO). Also, in our opinion, Foot Locker, Inc. maintained, in all material respects, effective internal control over financial reporting as of January 29, 2005,February 2, 2008, based on criteria established in Internal Control —- Integrated Framework issued by the Committee of Sponsoring Organizations of the Treadway Commission (COSO).Commission.
We also have audited, in accordance with the standards of the Public Company Accounting Oversight Board (United States), the consolidated balance sheets of Foot Locker, Inc. and subsidiaries as of January 29, 2005February 2, 2008 and January 31, 2004,February 3, 2007, and the related consolidated statements of operations, comprehensive income, shareholders’ equity, and cash flows for each of the years in the three-year period ended January 29, 2005,February 2, 2008, and our report dated March 28, 200531, 2008 expressed an unqualified opinion on those consolidated financial statements.
March
21
26
CONSOLIDATED STATEMENTS OF OPERATIONS
| 2004 | 2003 | 2002 | |||||||||||||
|---|---|---|---|---|---|---|---|---|---|---|---|---|---|---|---|
| (in millions, except per share amounts) | |||||||||||||||
Sales | $ | 5,355 | $ | 4,779 | $ | 4,509 | |||||||||
| Costs and expenses | |||||||||||||||
| Cost of sales | 3,722 | 3,297 | 3,161 | ||||||||||||
| Selling, general and administrative expenses | 1,088 | 987 | 928 | ||||||||||||
| Depreciation and amortization | 154 | 152 | 153 | ||||||||||||
| Restructuring charges (income) | 2 | 1 | (2 | ) | |||||||||||
| Interest expense, net | 15 | 18 | 26 | ||||||||||||
| 4,981 | 4,455 | 4,266 | |||||||||||||
| Other income (expense) | — | — | (3 | ) | |||||||||||
| 4,981 | 4,455 | 4,263 | |||||||||||||
| Income from continuing operations before income taxes | 374 | 324 | 246 | ||||||||||||
| Income tax expense | 119 | 115 | 84 | ||||||||||||
Income from continuing operations | 255 | 209 | 162 | ||||||||||||
| Income (loss) on disposal of discontinued operations, net of income tax benefit of $37, $4, and $2, respectively | 38 | (1 | ) | (9 | ) | ||||||||||
| Cumulative effect of accounting change, net of income tax benefit of $ — | — | (1 | ) | — | |||||||||||
Net income | $ | 293 | $ | 207 | $ | 153 | |||||||||
| Basic earnings per share: | |||||||||||||||
| Income from continuing operations | $ | 1.69 | $ | 1.47 | $ | 1.15 | |||||||||
| Income (loss) from discontinued operations | 0.25 | (0.01 | ) | (0.06 | ) | ||||||||||
| Cumulative effect of accounting change | — | — | — | ||||||||||||
| Net income | $ | 1.94 | $ | 1.46 | $ | 1.09 | |||||||||
| Diluted earnings per share: | |||||||||||||||
| Income from continuing operations | $ | 1.64 | $ | 1.40 | $ | 1.10 | |||||||||
| Income (loss) from discontinued operations | 0.24 | (0.01 | ) | (0.05 | ) | ||||||||||
| Cumulative effect of accounting change | — | — | — | ||||||||||||
| Net income | $ | 1.88 | $ | 1.39 | $ | 1.05 | |||||||||
| 2007 | 2006 | 2005 | ||||||||||
| (in millions, except per share amounts) | ||||||||||||
| Sales | $ | 5,437 | $ | 5,750 | $ | 5,653 | ||||||
| Costs and expenses | ||||||||||||
| Cost of sales | 4,017 | 4,014 | 3,944 | |||||||||
| Selling, general and administrative expenses | 1,176 | 1,163 | 1,129 | |||||||||
| Depreciation and amortization | 166 | 175 | 171 | |||||||||
| Impairment charges and store closing program costs | 128 | 17 | — | |||||||||
| Interest expense, net | 1 | 3 | 10 | |||||||||
| 5,488 | 5,372 | 5,254 | ||||||||||
| Other income | (1 | ) | (14 | ) | (6 | ) | ||||||
| 5,487 | 5,358 | 5,248 | ||||||||||
| (Loss) Income from continuing operations before income taxes | (50 | ) | 392 | 405 | ||||||||
| Income tax (benefit) expense | (99 | ) | 145 | 142 | ||||||||
| Income from continuing operations | 49 | 247 | 263 | |||||||||
| Income on disposal of discontinued operations, | ||||||||||||
| net of income tax expense (benefit) of $1, $1, and $(3), respectively | 2 | 3 | 1 | |||||||||
| Cumulative effect of accounting change, | ||||||||||||
| net of income tax benefit of $ — | — | 1 | — | |||||||||
| Net income | $ | 51 | $ | 251 | $ | 264 | ||||||
| Basic earnings per share: | ||||||||||||
| Income from continuing operations | $ | 0.32 | $ | 1.59 | $ | 1.70 | ||||||
| Income from discontinued operations | 0.01 | 0.02 | 0.01 | |||||||||
| Cumulative effect of accounting change | — | 0.01 | — | |||||||||
| Net income | $ | 0.33 | $ | 1.62 | $ | 1.71 | ||||||
| Diluted earnings per share: | ||||||||||||
| Income from continuing operations | $ | 0.32 | $ | 1.58 | $ | 1.67 | ||||||
| Income from discontinued operations | 0.01 | 0.02 | 0.01 | |||||||||
| Cumulative effect of accounting change | — | — | — | |||||||||
| Net income | $ | 0.33 | $ | 1.60 | $ | 1.68 | ||||||
See Accompanying Notes to Consolidated Financial Statements.
27
CONSOLIDATED STATEMENTS OF COMPREHENSIVE INCOME
| 2007 | 2006 | 2005 | |||||||||
| (in millions) | |||||||||||
| Net income | $ | 51 | $ | 251 | $ | 264 | |||||
| Other comprehensive income, net of tax | |||||||||||
| Foreign currency translation adjustment: | |||||||||||
| Translation adjustment arising during the period, net of tax | 60 | 27 | (25 | ) | |||||||
| Cash flow hedges: | |||||||||||
| Change in fair value of derivatives, net of income tax | 1 | — | 2 | ||||||||
| Reclassification adjustments, net of income tax | — | — | (1 | ) | |||||||
| Net change in cash flow hedges: | 1 | — | 1 | ||||||||
| Minimum pension liability adjustment: | |||||||||||
| Minimum pension liability adjustment, net of deferred tax expense | |||||||||||
| of $-, $120 and $10 million, respectively | — | 181 | 15 | ||||||||
| Pension and postretirement plan adjustments, net of income tax | |||||||||||
| benefit of $11 million | (20 | ) | — | — | |||||||
| Unrealized loss on available-for-sale securities | (2 | ) | — | — | |||||||
| Comprehensive income | $ | 90 | $ | 459 | $ | 255 | |||||
See Accompanying Notes to Consolidated Financial Statements.
28
CONSOLIDATED BALANCE SHEETS
| 2007 | 2006 | |||||
| (in millions) | ||||||
| ASSETS | ||||||
| Current assets | ||||||
| Cash and cash equivalents | $ | 488 | $ | 221 | ||
| Short-term investments | 5 | 249 | ||||
| Merchandise inventories | 1,281 | 1,303 | ||||
| Other current assets | 290 | 261 | ||||
| 2,064 | 2,034 | |||||
| Property and equipment, net | 521 | 654 | ||||
| Deferred taxes | 243 | 109 | ||||
| Goodwill | 266 | 264 | ||||
| Intangible assets, net | 96 | 105 | ||||
| Other assets | 58 | 83 | ||||
| $ | 3,248 | $ | 3,249 | |||
| LIABILITIES AND SHAREHOLDERS’ EQUITY | ||||||
| Current liabilities | ||||||
| Accounts payable | $ | 233 | $ | 256 | ||
| Accrued and other liabilities | 268 | 246 | ||||
| Current portion of long-term debt and obligations under capital leases | — | 14 | ||||
| 501 | 516 | |||||
| Long-term debt and obligations under capital leases | 221 | 220 | ||||
| Other liabilities | 255 | 218 | ||||
| Total liabilities | 977 | 954 | ||||
| Shareholders’ equity | 2,271 | 2,295 | ||||
| $ | 3,248 | $ | 3,249 | |||
See Accompanying Notes to Consolidated Financial Statements.
29
CONSOLIDATED STATEMENTS OF SHAREHOLDERS’ EQUITY
| 2007 | 2006 | 2005 | |||||||||||||||||||
| Shares | Amount | Shares | Amount | Shares | Amount | ||||||||||||||||
| (shares in thousands, amounts in millions) | |||||||||||||||||||||
| Common Stock and Paid-In Capital | |||||||||||||||||||||
| Par value $0.01 per share, 500 million shares authorized | |||||||||||||||||||||
| Issued at beginning of year | 157,810 | $ | 653 | 157,280 | $ | 635 | 156,155 | $ | 608 | ||||||||||||
| Restricted stock issued under stock option and award plans | 513 | — | — | (3 | ) | 225 | — | ||||||||||||||
| Forfeitures of restricted stock | — | — | — | — | — | 2 | |||||||||||||||
| Share-based compensation expense | — | 10 | — | 10 | — | 6 | |||||||||||||||
| Issued under director and employee stock plans, net of tax | 674 | 13 | 530 | 11 | 900 | 19 | |||||||||||||||
| Issued at end of year | 158,997 | 676 | 157,810 | 653 | 157,280 | 635 | |||||||||||||||
| Common stock in treasury at beginning of year | (2,107 | ) | (47 | ) | (1,776 | ) | (38 | ) | (64 | ) | (2 | ) | |||||||||
| Reissued under employee stock plans | — | — | 122 | 3 | 90 | 2 | |||||||||||||||
| Restricted stock issued under stock option and award plans | — | — | 157 | 3 | — | — | |||||||||||||||
| Forfeitures/cancellations of restricted stock | (25 | ) | — | (30 | ) | (1 | ) | (135 | ) | (2 | ) | ||||||||||
| Shares of common stock used to satisfy tax | |||||||||||||||||||||
| withholding obligations | (95 | ) | (2 | ) | (241 | ) | (6 | ) | (49 | ) | (1 | ) | |||||||||
| Stock repurchases | (2,283 | ) | (50 | ) | (334 | ) | (8 | ) | (1,590 | ) | (35 | ) | |||||||||
| Exchange of options | (13 | ) | — | (5 | ) | — | (28 | ) | — | ||||||||||||
| Common stock in treasury at end of year | (4,523 | ) | (99 | ) | (2,107 | ) | (47 | ) | (1,776 | ) | (38 | ) | |||||||||
| 154,474 | 577 | 155,703 | 606 | 155,504 | 597 | ||||||||||||||||
| Retained Earnings | |||||||||||||||||||||
| Balance at beginning of year | 1,785 | 1,601 | 1,386 | ||||||||||||||||||
| Cumulative effect of adjustments resulting from | |||||||||||||||||||||
| the adoption of SAB 108, net of tax (see note 3) | — | (6 | ) | — | |||||||||||||||||
| Cumulative effect of adjustments resulting from | |||||||||||||||||||||
| the adoption of FIN 48, net of tax (see note 1) | 1 | — | — | ||||||||||||||||||
| Adjusted balance at beginning of year | 1,786 | 1,595 | 1,386 | ||||||||||||||||||
| Net income | 51 | 251 | 264 | ||||||||||||||||||
| Cash dividends declared on common stock | |||||||||||||||||||||
| $0.50, $0.40 and $0.32 per share, respectively | (77 | ) | (61 | ) | (49 | ) | |||||||||||||||
| Balance at end of year | 1,760 | 1,785 | 1,601 | ||||||||||||||||||
| Accumulated Other Comprehensive Loss | |||||||||||||||||||||
| Foreign Currency Translation Adjustment | |||||||||||||||||||||
| Balance at beginning of year | 37 | 10 | 35 | ||||||||||||||||||
| Translation adjustment arising during the period, net of tax | 60 | 27 | (25 | ) | |||||||||||||||||
| Balance at end of year | 97 | 37 | 10 | ||||||||||||||||||
| Cash Flow Hedges | |||||||||||||||||||||
| Balance at beginning of year | — | — | (1 | ) | |||||||||||||||||
| Change during year, net of tax | 1 | — | 1 | ||||||||||||||||||
| Balance at end of year | 1 | — | — | ||||||||||||||||||
| Minimum Pension Liability Adjustment | |||||||||||||||||||||
| Balance at beginning of year | — | (181 | ) | (196 | ) | ||||||||||||||||
| Change during year, net of tax | — | 181 | 15 | ||||||||||||||||||
| Balance at end of year | — | — | (181 | ) | |||||||||||||||||
| Pension Adjustments | |||||||||||||||||||||
| Balance at beginning of year | (133 | ) | — | — | |||||||||||||||||
| Adoption of SFAS No. 158 | — | (133 | ) | — | |||||||||||||||||
| Change during year, net of tax | (29 | ) | — | — | |||||||||||||||||
| Balance at end of year | (162 | ) | (133 | ) | — | ||||||||||||||||
| Unrealized loss on available-for-sale securities | (2 | ) | — | — | |||||||||||||||||
| Total Accumulated Other Comprehensive Loss | (66 | ) | (96 | ) | (171 | ) | |||||||||||||||
| Total Shareholders’ Equity | $ | 2,271 | $ | 2,295 | $ | 2,027 | |||||||||||||||
See Accompanying Notes to Consolidated Financial Statements.
30
CONSOLIDATED STATEMENTS OF CASH FLOWS
| 2007 | 2006 | 2005 | ||||||||||
| (in millions) | ||||||||||||
| From Operating Activities | ||||||||||||
| Net income | $ | 51 | $ | 251 | $ | 264 | ||||||
| Adjustments to reconcile net income to net cash provided by operating | ||||||||||||
| activities of continuing operations: | ||||||||||||
| Income on disposal of discontinued operations, net of tax | (2 | ) | (3 | ) | (1 | ) | ||||||
| Non-cash impairment charges and store closing program costs | 124 | 17 | — | |||||||||
| Cumulative effect of accounting change, net of tax | — | (1 | ) | — | ||||||||
| Depreciation and amortization | 166 | 175 | 171 | |||||||||
| Share-based compensation expense | 10 | 10 | 6 | |||||||||
| Deferred income taxes | (129 | ) | 21 | 24 | ||||||||
| Change in assets and liabilities: | ||||||||||||
| Merchandise inventories | 55 | (38 | ) | (111 | ) | |||||||
| Accounts payable and other accruals | (36 | ) | (103 | ) | 14 | |||||||
| Qualified pension plan contributions | — | (68 | ) | (26 | ) | |||||||
| Income taxes | — | (3 | ) | (8 | ) | |||||||
| Other, net | 44 | (69 | ) | 16 | ||||||||
| Net cash provided by operating activities of continuing operations | 283 | 189 | 349 | |||||||||
| From Investing Activities | ||||||||||||
| Acquisitions | — | — | 1 | |||||||||
| Gain from lease termination | 1 | 4 | — | |||||||||
| Gain from insurance recoveries | 1 | 4 | 3 | |||||||||
| Purchases of short-term investments | (1,378 | ) | (1,992 | ) | (2,798 | ) | ||||||
| Sales of short-term investments | 1,620 | 2,041 | 2,767 | |||||||||
| Capital expenditures | (148 | ) | (165 | ) | (155 | ) | ||||||
| Proceeds from investment and note | 21 | — | — | |||||||||
| Net cash provided by (used in) investing activities of continuing operations | 117 | (108 | ) | (182 | ) | |||||||
| From Financing Activities | ||||||||||||
| Reduction in long-term debt | (7 | ) | (86 | ) | (35 | ) | ||||||
| Repayment of capital lease | (14 | ) | (1 | ) | — | |||||||
| Dividends paid on common stock | (77 | ) | (61 | ) | (49 | ) | ||||||
| Issuance of common stock | 9 | 9 | 12 | |||||||||
| Treasury stock reissued under employee stock plans | — | 3 | 2 | |||||||||
| Purchase of treasury shares | (50 | ) | (8 | ) | (35 | ) | ||||||
| Tax benefit on stock compensation | 1 | 2 | — | |||||||||
| Net cash used in financing activities of continuing operations | (138 | ) | (142 | ) | (105 | ) | ||||||
| Net Cash Used In operating activities of Discontinued Operations | — | (8 | ) | — | ||||||||
| Effect of Exchange Rate Fluctuations on Cash and Cash Equivalents | 5 | 1 | 2 | |||||||||
| Net Change in Cash and Cash Equivalents | 267 | (68 | ) | 64 | ||||||||
| Cash and Cash Equivalents at Beginning of Year | 221 | 289 | 225 | |||||||||
| Cash and Cash Equivalents at End of Year | $ | 488 | $ | 221 | $ | 289 | ||||||
| Cash Paid During the Year: | ||||||||||||
| Interest | $ | 18 | $ | 20 | $ | 21 | ||||||
| Income taxes | $ | 52 | $ | 133 | $ | 93 | ||||||
See Accompanying Notes to Consolidated Financial Statements.
22
31
CONSOLIDATED STATEMENTS OF COMPREHENSIVE INCOME
| 2004 | 2003 | 2002 | |||||||||||||
|---|---|---|---|---|---|---|---|---|---|---|---|---|---|---|---|
| (in millions) | |||||||||||||||
Net income | $ | 293 | $ | 207 | $ | 153 | |||||||||
Other comprehensive income, net of tax | |||||||||||||||
Foreign currency translation adjustment: | |||||||||||||||
| Translation adjustment arising during the period | 19 | 31 | 38 | ||||||||||||
Cash flow hedges: | |||||||||||||||
| Change in fair value of derivatives, net of income tax | (1 | ) | — | — | |||||||||||
| Reclassification adjustments, net of income tax expense (benefit) of $1, ($1), and $—, respectively | 1 | (1 | ) | — | |||||||||||
Net change in cash flow hedges | — | (1 | ) | — | |||||||||||
Minimum pension liability adjustment: | |||||||||||||||
| Minimum pension liability adjustment, net of deferred tax expense (benefit) of $(9), $10 and $(56), respectively | (14 | ) | 16 | (83 | ) | ||||||||||
Comprehensive income | $ | 298 | $ | 253 | $ | 108 | |||||||||
See Accompanying Notes to Consolidated Financial Statements.
23
CONSOLIDATED BALANCE SHEETS
| 2004 | 2003 | ||||||||||
|---|---|---|---|---|---|---|---|---|---|---|---|
| (in millions) | |||||||||||
ASSETS | |||||||||||
Current assets | |||||||||||
| Cash and cash equivalents | $ | 225 | $ | 190 | |||||||
| Short-term investments | 267 | 258 | |||||||||
| Total cash, cash equivalents and short-term investments | 492 | 448 | |||||||||
| Merchandise inventories | 1,151 | 920 | |||||||||
| Assets of discontinued operations | 1 | 2 | |||||||||
| Other current assets | 188 | 149 | |||||||||
| 1,832 | 1,519 | ||||||||||
Property and equipment, net | 715 | 668 | |||||||||
Deferred taxes | 180 | 194 | |||||||||
Goodwill | 271 | 136 | |||||||||
Intangible assets, net | 135 | 96 | |||||||||
Other assets | 104 | 100 | |||||||||
| $ | 3,237 | $ | 2,713 | ||||||||
LIABILITIES AND SHAREHOLDERS’ EQUITY | |||||||||||
Current liabilities | |||||||||||
| Accounts payable | $ | 381 | $ | 234 | |||||||
| Accrued liabilities | 275 | 300 | |||||||||
| Liabilities of discontinued operations | 2 | 2 | |||||||||
| Current portion of repositioning and restructuring reserves | 1 | 1 | |||||||||
| Current portion of reserve for discontinued operations | 7 | 8 | |||||||||
| Current portion of long-term debt and obligations under capital leases | 18 | — | |||||||||
| 684 | 545 | ||||||||||
Long-term debt and obligations under capital leases | 347 | 335 | |||||||||
Other liabilities | 376 | 458 | |||||||||
Total liabilities | 1,407 | 1,338 | |||||||||
Shareholders’ equity | 1,830 | 1,375 | |||||||||
| $ | 3,237 | $ | 2,713 | ||||||||
See Accompanying Notes to Consolidated Financial Statements.
24
CONSOLIDATED STATEMENTS OF SHAREHOLDERS’ EQUITY
| 2004 | 2003 | 2002 | |||||||||||||||||||||||||
|---|---|---|---|---|---|---|---|---|---|---|---|---|---|---|---|---|---|---|---|---|---|---|---|---|---|---|---|
| Shares | Amount | Shares | Amount | Shares | Amount | ||||||||||||||||||||||
| (shares in thousands, amounts in millions) | |||||||||||||||||||||||||||
Common Stock and Paid-In Capital | |||||||||||||||||||||||||||
| Par value $0.01 per share, 500 million shares authorized | |||||||||||||||||||||||||||
| Issued at beginning of year | 144,009 | $ | 411 | 141,180 | $ | 378 | 139,981 | $ | 363 | ||||||||||||||||||
| Restricted stock issued under stock option and award plans | 400 | — | 845 | — | 60 | — | |||||||||||||||||||||
| Forfeitures of restricted stock | — | 2 | — | 1 | — | 1 | |||||||||||||||||||||
| Amortization of stock issued under restricted stock option plans | — | 8 | — | 4 | — | 2 | |||||||||||||||||||||
| Conversion of convertible debt | 9,490 | 150 | — | — | — | — | |||||||||||||||||||||
| Reclassification of convertible debt issuance costs | — | (3 | ) | — | — | — | — | ||||||||||||||||||||
| Issued under director and employee stock plans, net of tax | 2,256 | 40 | 1,984 | 28 | 1,139 | 12 | |||||||||||||||||||||
| Issued at end of year | 156,155 | 608 | 144,009 | 411 | 141,180 | 378 | |||||||||||||||||||||
| Common stock in treasury at beginning of year | (57 | ) | (1 | ) | (105 | ) | (1 | ) | (70 | ) | — | ||||||||||||||||
| Reissued under employee stock plans | 260 | 5 | 152 | 1 | — | — | |||||||||||||||||||||
| Restricted stock issued under stock option and award plans | — | — | — | — | 30 | — | |||||||||||||||||||||
| Forfeitures/cancellations of restricted stock | (100 | ) | (2 | ) | (80 | ) | (1 | ) | (60 | ) | (1 | ) | |||||||||||||||
| Shares of common stock used to satisfy tax withholding obligations | (137 | ) | (3 | ) | — | — | — | — | |||||||||||||||||||
| Exchange of options | (30 | ) | (1 | ) | (24 | ) | — | (5 | ) | — | |||||||||||||||||
| Common stock in treasury at end of year | (64 | ) | (2 | ) | (57 | ) | (1 | ) | (105 | ) | (1 | ) | |||||||||||||||
| 156,091 | 606 | 143,952 | 410 | 141,075 | 377 | ||||||||||||||||||||||
Retained Earnings | |||||||||||||||||||||||||||
| Balance at beginning of year | 1,132 | 946 | 797 | ||||||||||||||||||||||||
| Net income | 293 | 207 | 153 | ||||||||||||||||||||||||
| Cash dividends declared on common stock $0.26, $0.15 and $0.03 per share, respectively | (39 | ) | (21 | ) | (4 | ) | |||||||||||||||||||||
| Balance at end of year | 1,386 | 1,132 | 946 | ||||||||||||||||||||||||
| Accumulated Other Comprehensive Loss | |||||||||||||||||||||||||||
Foreign Currency Translation Adjustment | |||||||||||||||||||||||||||
| Balance at beginning of year | 16 | (15 | ) | (53 | ) | ||||||||||||||||||||||
| Translation adjustment arising during the period | 19 | 31 | 38 | ||||||||||||||||||||||||
| Balance at end of year | 35 | 16 | (15 | ) | |||||||||||||||||||||||
Cash Flow Hedges | |||||||||||||||||||||||||||
| Balance at beginning of year | (1 | ) | — | — | |||||||||||||||||||||||
| Change during year, net of tax | — | (1 | ) | — | |||||||||||||||||||||||
| Balance at end of year | (1 | ) | (1 | ) | — | ||||||||||||||||||||||
Minimum Pension Liability Adjustment | |||||||||||||||||||||||||||
| Balance at beginning of year | (182 | ) | (198 | ) | (115 | ) | |||||||||||||||||||||
| Change during year, net of tax | (14 | ) | 16 | (83 | ) | ||||||||||||||||||||||
| Balance at end of year | (196 | ) | (182 | ) | (198 | ) | |||||||||||||||||||||
Total Accumulated Other Comprehensive Loss | (162 | ) | (167 | ) | (213 | ) | |||||||||||||||||||||
Total Shareholders’ Equity | $ | 1,830 | $ | 1,375 | $ | 1,110 | |||||||||||||||||||||
See Accompanying Notes to Consolidated Financial Statements.
25
CONSOLIDATED STATEMENTS OF CASH FLOWS
| 2004 | 2003 | 2002 | |||||||||||||
|---|---|---|---|---|---|---|---|---|---|---|---|---|---|---|---|
| (in millions) | |||||||||||||||
From Operating Activities | |||||||||||||||
| Net income | $ | 293 | $ | 207 | $ | 153 | |||||||||
| Adjustments to reconcile net income to net cash provided by operating activities of continuing operations: | |||||||||||||||
| (Income) loss on disposal of discontinued operations, net of tax | (38 | ) | 1 | 9 | |||||||||||
| Restructuring charges (income) | 2 | 1 | (2 | ) | |||||||||||
| Cumulative effect of accounting change, net of tax | — | 1 | — | ||||||||||||
| Depreciation and amortization | 154 | 152 | 153 | ||||||||||||
| Impairment of long-lived assets | — | — | 7 | ||||||||||||
| Restricted stock compensation expense | 8 | 4 | 2 | ||||||||||||
| Tax benefit on stock compensation | 10 | 2 | 2 | ||||||||||||
| Gains on sales of real estate and assets | — | — | (3 | ) | |||||||||||
| Deferred income taxes | 50 | (5 | ) | 38 | |||||||||||
| Change in assets and liabilities, net of dispositions: | |||||||||||||||
| Merchandise inventories | (183 | ) | (63 | ) | (22 | ) | |||||||||
| Accounts payable and other accruals | 157 | (17 | ) | (22 | ) | ||||||||||
| Repositioning and restructuring reserves | (1 | ) | (1 | ) | (3 | ) | |||||||||
| Pension contribution | (106 | ) | (50 | ) | — | ||||||||||
| Income taxes | — | 9 | 42 | ||||||||||||
| Other, net | (57 | ) | 23 | (7 | ) | ||||||||||
| Net cash provided by operating activities of continuing operations | 289 | 264 | 347 | ||||||||||||
From Investing Activities | |||||||||||||||
| Acquisitions | (242 | ) | — | — | |||||||||||
| Purchases of short-term investments | (2,884 | ) | (1,546 | ) | (536 | ) | |||||||||
| Sales of short-term investments | 2,875 | 1,440 | 384 | ||||||||||||
| Lease acquisition costs | (17 | ) | (15 | ) | (18 | ) | |||||||||
| Capital expenditures | (156 | ) | (144 | ) | (150 | ) | |||||||||
| Proceeds from sales of real estate and assets | — | — | 6 | ||||||||||||
| Net cash used in investing activities of continuing operations | (424 | ) | (265 | ) | (314 | ) | |||||||||
From Financing Activities | |||||||||||||||
| Debt issuance costs | (2 | ) | — | — | |||||||||||
| Increase (reduction) in long-term debt | 175 | (19 | ) | (41 | ) | ||||||||||
| Reduction in capital lease obligations | — | — | (1 | ) | |||||||||||
| Dividends paid on common stock | (39 | ) | (21 | ) | (4 | ) | |||||||||
| Issuance of common stock | 33 | 27 | 10 | ||||||||||||
| Net cash provided by (used in) financing activities of continuing operations | 167 | (13 | ) | (36 | ) | ||||||||||
Net Cash Provided by (Used in) Discontinued Operations | 1 | 7 | (10 | ) | |||||||||||
Effect of Exchange Rate Fluctuations on Cash and Cash Equivalents | 2 | (8 | ) | 3 | |||||||||||
Net Change in Cash and Cash Equivalents | 35 | (15 | ) | (10 | ) | ||||||||||
Cash and Cash Equivalents at Beginning of Year | 190 | 205 | 215 | ||||||||||||
Cash and Cash Equivalents at End of Year | $ | 225 | $ | 190 | $ | 205 | |||||||||
Cash Paid During the Year: | |||||||||||||||
| Interest | $ | 23 | $ | 25 | $ | 27 | |||||||||
| Income taxes | $ | 121 | $ | 77 | $ | 39 | |||||||||
Non-cash Financing Activities: | |||||||||||||||
| Common stock issued upon conversion of convertible debt | $ | 150 | $ | — | $ | — | |||||||||
| Debt issuance costs reclassified to equity upon conversion of convertible debt | $ | 3 | $ | — | $ | — | |||||||||
See Accompanying Notes to Consolidated Financial Statements.
26
NOTES TO CONSOLIDATED FINANCIAL STATEMENTS
1. Summary of Significant Accounting Policies
|
Basis of Presentation
Reporting Year
Revenue Recognition
Gift Cards
The Company sells gift cards to its customers; the cards do not have expiration dates. Revenue from Internet and cataloggift card sales is recognizedrecorded when the productgift cards are redeemed or when the likelihood of the gift card being redeemed by the customer is shippedremote and there is no legal obligation to customers. Sales include shippingremit the value of unredeemed gift cards to the relevant jurisdictions. The Company has determined its gift card breakage rate based upon historical redemption patterns. Historical experience indicates, that after 12 months, the likelihood of redemption is deemed to be remote. Gift card breakage income is included in selling, general and handling fees foradministrative expenses and totaled $4 million in 2007, $7 million in 2006, and $2 million in 2005. Unredeemed gift cards are recorded as a current liability.
Statement of Cash Flows
The Company has selected to present the operations of the discontinued business as one line in the Consolidated Statements of Cash Flows. For all the periods presented.
Store Pre-Opening and Closing Costs
Advertising Costs and Sales Promotion
32
is incurred. In accordance with EITF Issue No. 02-16, “Accounting by a Reseller for Cash Consideration from a Vendor,” the Company accounts for reimbursements received in excess of expenses incurred related to specific, incremental advertising, as a reduction to the cost of merchandise and is reflected in cost of sales as the merchandise is sold.
| 2007 | 2006 | 2005 | ||||||||||
| (in millions) | ||||||||||||
| Advertising expenses | $ | 105.9 | $ | 92.5 | $ | 99.0 | ||||||
| Cooperative advertising reimbursements | (34.8 | ) | (23.0 | ) | (21.2 | ) | ||||||
| Net advertising expense | $ | 71.1 | $ | 69.5 | $ | 77.8 | ||||||
| 2004 | 2003 | 2002 | |||||||||||||
|---|---|---|---|---|---|---|---|---|---|---|---|---|---|---|---|
| (in millions) | |||||||||||||||
| Advertising expenses | $ | 102.5 | $ | 97.5 | $ | 89.2 | |||||||||
| Cooperative advertising reimbursements | (24.8 | ) | (23.4 | ) | (15.4 | ) | |||||||||
| Net advertising expense | $ | 77.7 | $ | 74.1 | $ | 73.8 | |||||||||
27
Catalog Costs
| 2007 | 2006 | 2005 | ||||||||||
| (in millions) | ||||||||||||
| Catalog costs | $ | 45.6 | $ | 47.0 | $ | 48.2 | ||||||
| Cooperative reimbursements | (3.8 | ) | (3.5 | ) | (3.0 | ) | ||||||
| Net catalog expense | $ | 41.8 | $ | 43.5 | $ | 45.2 | ||||||
| 2004 | 2003 | 2002 | |||||||||||||
|---|---|---|---|---|---|---|---|---|---|---|---|---|---|---|---|
| (in millions) | |||||||||||||||
| Catalog costs | $ | 50.3 | $ | 42.4 | $ | 41.9 | |||||||||
| Cooperative reimbursements | (2.9 | ) | (3.5 | ) | (2.9 | ) | |||||||||
| Net catalog expense | $ | 47.4 | $ | 38.9 | $ | 39.0 | |||||||||
Earnings Per Share
| 2007 | 2006 | 2005 | |||||||
| (in millions) | |||||||||
| Net income from continuing operations | $ | 49 | $ | 247 | $ | 263 | |||
| Weighted-average common shares outstanding | 154.0 | 155.0 | 155.1 | ||||||
| Effect of Dilution: | |||||||||
| Stock options and awards | 1.6 | 1.8 | 2.5 | ||||||
| Weighted-average common shares outstanding | �� | ||||||||
| assuming dilution | 155.6 | 156.8 | 157.6 | ||||||
| 2004 | 2003 | 2002 | |||||||||||||
|---|---|---|---|---|---|---|---|---|---|---|---|---|---|---|---|
| (in millions) | |||||||||||||||
| Income from continuing operations | $ | 255 | $ | 209 | $ | 162 | |||||||||
Effect of Dilution: | |||||||||||||||
| Convertible debt | 2 | 5 | 5 | ||||||||||||
| Income from continuing operations assuming dilution | $ | 257 | $ | 214 | $ | 167 | |||||||||
| Weighted-average common shares outstanding | 150.9 | 141.6 | 140.7 | ||||||||||||
Effect of Dilution: | |||||||||||||||
| Stock options and awards | 3.0 | 1.8 | 0.6 | ||||||||||||
| Convertible debt | 3.2 | 9.5 | 9.5 | ||||||||||||
| Weighted-average common shares outstanding assuming dilution | 157.1 | 152.9 | 150.8 | ||||||||||||
33
Stock-BasedShare-Based Compensation
Prior to January 29, 2006, the Company accounted for these stock-based compensation plans in accordance with APB No. 25 and related interpretations. This method did not resultedresult in compensation cost for stock options and shares purchased under employee stock purchase plans. No compensation expense for employee stock options is reflected in net income,was recorded, as all stock options granted under thosethe stock option plans had an exercise price that was not less than the quoted market price at the date of grant. The marketCompensation expense was also not recorded for employee purchases of stock under the employee stock purchase plans as it was considered non-compensatory under APB No. 25. Prior to the Company’s adoption of SFAS No. 123(R), as required under the disclosure provisions of SFAS No. 123, as amended, the Company provided pro forma net income and earnings per common share for each period as if it had applied the fair value at datemethod to measure stock-based compensation expense.
During 2006, the Company recorded a cumulative effect of granta change in accounting of $1 million to reflect estimated forfeitures for prior periods related to the Company’s nonvested restricted stock awards. Prior to the adoption of SFAS No. 123(R), the Company recognized compensation cost of restricted stock isawards over the vesting term based upon the fair value of the Company’s common stock at the date of grant. Forfeitures were recorded as they occurred, however under SFAS No. 123(R) an estimate of forfeitures is required to be included over the vesting term. Under SFAS No. 123(R), the Company will continue to recognize compensation expense over the periodvesting term, net of vesting.
28
SFAS No. 123(R) requires the benefits associated with tax deductions in excess of recognized compensation cost to be reported as a financing cash flow rather than as an operating cash flow as previously required. For 2007 and 2006, the Company recorded an excess tax benefit of $1 million and $2 million, respectively, as a financing cash flow as required by the standard.
Upon exercise of stock options, issuance of restricted stock or issuance of shares under the employee stock purchase plan, the Company will issue authorized but unissued common stock or use common stock held in treasury. The Company may make repurchases of its common stock from time to time, subject to legal and contractual restrictions, market conditions and other factors.
34
| 2005 | ||||
| Net income: | ||||
| As reported | $ | 264 | ||
| Compensation expense included in reported net income, | ||||
| net of income tax benefit | 4 | |||
| Total compensation expense under fair value method for | ||||
| all awards, net of income tax benefit | (9 | ) | ||
| Pro forma | $ | 259 | ||
| Basic earnings per share: | ||||
| As reported | $ | 1.71 | ||
| Pro forma | $ | 1.67 | ||
| Diluted earnings per share: | ||||
| As reported | $ | 1.68 | ||
| Pro forma | $ | 1.64 | ||
| 2004 | 2003 | 2002 | |||||||||||||
|---|---|---|---|---|---|---|---|---|---|---|---|---|---|---|---|
| (in millions, except per share amounts) | |||||||||||||||
| Net income: | |||||||||||||||
| As reported | $ | 293 | $ | 207 | $ | 153 | |||||||||
| Compensation expense included in reported net income, net of income tax benefit | 5 | 2 | 1 | ||||||||||||
| Total compensation expense under fair value method for all awards, net of income tax benefit | (13 | ) | (7 | ) | (6 | ) | |||||||||
| Pro forma | $ | 285 | $ | 202 | $ | 148 | |||||||||
| Basic earnings per share: | |||||||||||||||
| As reported | $ | 1.94 | $ | 1.46 | $ | 1.09 | |||||||||
| Pro forma | $ | 1.89 | $ | 1.43 | $ | 1.05 | |||||||||
| Diluted earnings per share: | |||||||||||||||
| As reported | $ | 1.88 | $ | 1.39 | $ | 1.05 | |||||||||
| Pro forma | $ | 1.83 | $ | 1.36 | $ | 1.02 | |||||||||
Cash and Cash Equivalents
Short-Term Investments
Merchandise Inventories and Cost of Sales
Cost of sales is comprised of the cost of merchandise, occupancy, buyers’ compensation and shipping and handling costs. The cost of merchandise is recorded net of amounts received from vendors for damaged product returns, markdown allowances and volume rebates, as well as cooperative advertising reimbursements received in excess of specific, incremental advertising expenses. Occupancy reflects the amortization of amounts received from landlords for tenant improvements.
Property and Equipment
Property and equipment are recorded at cost, less accumulated depreciation and amortization. Significant additions and improvements to property and equipment are capitalized. Maintenance and repairs are charged to current operations as incurred. Major renewals or replacements that substantially extend the useful life of an asset are capitalized and depreciated. Owned property and equipment is depreciated on a straight-line basis over the estimated useful lives of the assets: maximum of 50 years for buildings and 3 to 10 years for furniture, fixtures and equipment. Property and equipment
29
under capital leases and improvements to leased premises are generally amortized on a straight-line basis over the shorter of the estimated useful life of the asset or the remaining lease term. Capitalized software reflects certain costs related to software developed for internal use that are capitalized and amortized. After substantial completion of the project, the costs are amortized on a straight-line basis over a 2 to
Recoverability of Long-Lived Assets
Goodwill and Intangible Assets
The Company performs its annual impairment review as of the beginning of each fiscal year. The fair value of each reporting unit evaluated as of the beginning of each year,is determined using a combination of market and discounted cash flow approaches, exceededapproaches. During the carrying valuethird and fourth quarters of each respective reporting unit.
Derivative Financial Instruments
36
The effective portion of the gain or loss on hedges of foreign net investments is generally not reclassified to earnings unless the net investment is disposed of. To the extent derivatives do not qualify as hedges, or are ineffective, their changes in fair value are recorded in earnings immediately, which may subject the Company to increased earnings volatility.
Fair Value of Financial Instruments
30
contracts. Discounted cash flows are used to determine the fair value of long-term investments and notes receivable if quoted market prices on these instruments are unavailable.
Income Taxes
The Company determines its deferred tax provision under the liability method, whereby deferred tax assets and liabilities are recognized for the expected tax consequences of temporary differences between the tax bases of assets and liabilities and their reported amounts using presently enacted tax rates. Deferred tax assets are recognized for tax credits and net operating loss carryforwards, reduced by a valuation allowance, which is established when it is more likely than not that some portion or all of the deferred tax assets will not be realized. The effect on deferred tax assets and liabilities of a change in tax rates is recognized in income in the period that includes the enactment date.
Pension and Postretirement Obligations
The discount rate selected to measure the present value of the Company’s U.S. benefit obligations as of February 2, 2008 was derived using a cash flow matching method whereby the Company compares the plans’ projected payment obligations by year with the corresponding yield on the Citibank Pension Discount Curve. The cash flows are then discounted to their present value and an overall discount rate is determined. The discount rate selected to measure the present value of the Company’s Canadian benefit obligations as of February 2, 2008 was developed by using the plan’s bond portfolio indices which match the benefit obligations.
Insurance Liabilities
37
Accounting for Leases
Foreign Currency Translation
Reclassifications
31
Recent Accounting Pronouncements Not Previously Discussed Herein
In December 2007, the FASB issued SFAS No. 141 (Revised 2007), “Business Combinations,” (“SFAS No. 141(R)”). This standard will significantly change the accounting for business combinations. Under SFAS No. 141(R), an acquiring entity will be required to recognize all the assets acquired and liabilities assumed in a transaction at the acquisition-date fair value with limited exceptions. SFAS No. 141(R) also includes a substantial number of new disclosure requirements. SFAS No. 141(R) applies prospectively to business combinations for which the acquisition date is on or after the beginning of the first annual reporting period beginning on or after December 15, 2008.
In December 2007, the FASB issued SFAS No. 160, “Noncontrolling Interests in Consolidated Financial Statements - An Amendment of ARB No. 51” (“SFAS No. 160”), which establishes new accounting and reporting standards for the noncontrolling interest in a subsidiary and for the deconsolidation of a subsidiary. Specifically, this statement requires the recognition of a noncontrolling interest (minority interest) as equity in the consolidated financial statements and separate from the parent’s equity. SFAS No. 160 is effective for fiscal years, and interim periods within those fiscal years, beginning on or after December 15, 2008. This standard does not currently affect the Company.
2. Impairment of Long-Lived Assets and Store Closing Program
During 2007, the Company concluded that triggering events had occurred at its U.S. retail store divisions, comprising Foot Locker, Lady Foot Locker, Kids Foot Locker, Footaction, and Champs Sports. Accordingly, the Company evaluated the long-lived assets of those operations for impairment and recorded non-cash impairment charges of $117 million primarily to write-down long-lived assets such as store fixtures and leasehold improvements for 1,395 stores at the Company’s U.S. store operations pursuant to SFAS No. 144.
38
Additionally, in the third quarter of 2007, the Company identified 66 unproductive stores for closure. Accordingly, the Company evaluated the recoverability of long-lived assets considering the revised estimated future cash flows. The Company recorded an additional non-cash impairment charge of $7 million as a result of this Statementanalysis. Of the total stores identified for closure in the third quarter of 2007, 13 will have a material effect on its financial position and results of operationsremain in operation as the Company doeswas able to negotiate more favorable lease terms. Exit costs related to 33 stores which closed during 2007, comprising primarily lease termination costs of $4 million, were recognized in accordance with SFAS No. 146, “Accounting for Costs Associated with Exit or Disposal Activities.” During 2008, the Company currently expects to close the remaining 20 unproductive stores prior to normal lease expiration, depending on the Company’s success in negotiating agreements with its landlords. The lease exit costs associated with these remaining closures is expected to total $5 million to $10 million. These charges will be recorded during 2008 in accordance with SFAS No. 146. The cash impact of the 2008 store closings is expected to be minimal, as the related cash lease costs are expected to be offset by associated inventory reductions. Under SFAS No. 144, store closings may constitute discontinued operations if migration of customers and cash flows are not currently have any exchanges of nonmonetary assets.
Footaction
Included in line with the Company’s strategic priorities, including the acquisition of compatible athletic footwear and apparel retail companies. The Company’s consolidated results of operations include those of Footaction beginning with the date that the acquisition was consummated.
3. Staff Accounting Bulletin No. 108
In September 2006, the purchase priceSEC issued Staff Accounting Bulletin No. 108 (“SAB 108”) “Considering the Effects of approximately $226 million based,Prior Year Misstatements when Quantifying Misstatements in part, upon internal estimates of cash flows, recoverability and independent appraisals, and may be revised as more definitive facts and evidence become available. Pro formaCurrent Year Financial Statements,” that provides interpretive guidance on how the effects of the acquisition have notcarryover or reversal of prior year misstatements should be considered in quantifying a current year misstatement. There are two widely recognized methods for quantifying the effects of financial statement misstatements: the “rollover” or income statement method and the “iron curtain” or balance sheet method. The SEC staff believes that registrants should quantify errors using both a balance sheet and an income statement approach (“dual method”) and evaluate whether either approach results in quantifying a misstatement that, when all relevant quantitative and qualitative factors are considered, is material. The Company had historically evaluated uncorrected misstatements using the “rollover” method. SAB 108 permits companies to apply its provisions initially by either (i) restating prior financial statements as if the provisions had always been presented,applied or (ii) recording the cumulative effect of initially applying SAB 108 as their effects were not significantadjustments to the consolidated resultscarrying value of operations. The allocationassets and liabilities as of the purchase price is detailed below:beginning of 2006 with an offsetting adjustment recorded to the opening balance of shareholders’ equity.
The Company believes its prior period assessments of uncorrected misstatements and the conclusions reached regarding its quantitative and qualitative assessments of materiality of such items, both individually and in the aggregate, were appropriate. These items did not significantly affect 2005 as these items originated in earlier periods. In accordance with SAB 108, the Company has adjusted its opening retained earnings for 2006 for the items described below.
| Adjustment | ||||||
| at Jan. 29, | ||||||
| (in millions) | 2006 | |||||
| Accrued liabilities(1) | $ | 3.4 | ||||
| Revenue recognition(2) | 2.8 | |||||
| Inventory valuation(3) | 4.2 | |||||
| 10.4 | ||||||
| Provision for income taxes | 4.1 | |||||
| Decrease to shareholders’ equity | $ | 6.3 | ||||
| ____________________ | ||||||
|---|---|---|---|---|---|---|
| (1) | ||
| (2) | Revenue recognition – The Company had historically recorded revenue from its catalog and Internet operations when the product was shipped to | |
| (3) | Inventory valuation – The | |
32
39
The Republic of Ireland
The accounting policies of $1 millionboth segments are the same as those described in the “Summary of direct costs related toSignificant Accounting Policies.” The Company evaluates performance based on several factors, of which the acquisition, based, in part, upon internal estimates of cash flows, recoverabilityprimary financial measure is division results. Division profit reflects (loss) income from continuing operations before income taxes, corporate expense, non-operating income, and independent appraisals, and may be revised as more definitive facts and evidence become available. Pro forma effects of the acquisition have not been presented, as their effects were not significant to the consolidated results of operations.
Sales
| 2007 | 2006 | 2005 | |||||||
| (in millions) | |||||||||
| Athletic Stores | $ | 5,071 | $ | 5,370 | $ | 5,272 | |||
| Direct-to-Customers | 364 | 380 | 381 | ||||||
| Family Footwear | 2 | — | — | ||||||
| Total sales | $ | 5,437 | $ | 5,750 | $ | 5,653 | |||
Operating Results
| |||||||||||||||||||||||||||||||||||||||||||||||||||||||||||||||||||||||||||||||||||||||||||||||||||||||||||||||||||||||||||||||||||||||||||||||||||||||||||||||||||||||||||||||
|---|---|---|---|---|---|---|---|---|---|---|---|---|---|---|---|---|---|---|---|---|---|---|---|---|---|---|---|---|---|---|---|---|---|---|---|---|---|---|---|---|---|---|---|---|---|---|---|---|---|---|---|---|---|---|---|---|---|---|---|---|---|---|---|---|---|---|---|---|---|---|---|---|---|---|---|---|---|---|---|---|---|---|---|---|---|---|---|---|---|---|---|---|---|---|---|---|---|---|---|---|---|---|---|---|---|---|---|---|---|---|---|---|---|---|---|---|---|---|---|---|---|---|---|---|---|---|---|---|---|---|---|---|---|---|---|---|---|---|---|---|---|---|---|---|---|---|---|---|---|---|---|---|---|---|---|---|---|---|---|---|---|---|---|---|---|---|---|---|---|---|---|---|---|---|---|
| (1) |
| (2) | During 2007, the Company adjusted its 1993 Repositioning and 1991 Restructuring reserve by $2 million primarily due to favorable lease terminations. During 2006, the Company recorded a restructuring charge of $1 million, which represented a revision to the original estimate of the lease liability associated with the guarantee of The San Francisco Music Box Company distribution center. These amounts are included in selling, general and administrative expenses in the Condensed Consolidated Statements of Operations. | |
| (3) | 2007 includes $1 million gain related to a final settlement with the Company’s insurance carriers of a claim related to a store damaged by fire in 2006 and $1 million gain on the sale of two of its lease interests in Europe. These gains were offset primarily by premiums paid for foreign currency option contracts. | |
| 2006 includes $4 million gain on lease terminations; $8 million of insurance proceeds related to the 2005 hurricane; and $2 million gain on debt repurchase. | ||
| 2005 includes a $3 million gain from insurance recoveries associated with Hurricane Katrina. Additionally, $3 million represented a net gain on foreign currency option contracts that were entered into by the Company to mitigate the effect of fluctuating foreign exchange rates on the reporting of euro dominated earnings. | ||
40
| Depreciation and | |||||||||||||||||||||||||||
| Amortization | Capital Expenditures | Total Assets | |||||||||||||||||||||||||
| 2007 | 2006 | 2005 | 2007 | 2006 | 2005 | 2007 | 2006 | 2005 | |||||||||||||||||||
| (in millions) | |||||||||||||||||||||||||||
| Athletic Stores | $ | 146 | $ | 147 | $ | 141 | $ | 125 | $ | 135 | $ | 137 | $ | 2,298 | $ | 2,374 | $ | 2,322 | |||||||||
| Direct-to-Customers | 6 | 6 | 6 | 7 | 4 | 6 | 197 | 195 | 196 | ||||||||||||||||||
| 152 | 153 | 147 | 132 | 139 | 143 | 2,495 | 2,569 | 2,518 | |||||||||||||||||||
| Corporate | 14 | 22 | 24 | 16 | 26 | 12 | 753 | 680 | 794 | ||||||||||||||||||
| Total Company | $ | 166 | $ | 175 | $ | 171 | $ | 148 | $ | 165 | $ | 155 | $ | 3,248 | $ | 3,249 | $ | 3,312 | |||||||||
Sales
| 2007 | 2006 | 2005 | |||||||
| (in millions) | |||||||||
| United States | $ | 3,991 | $ | 4,356 | $ | 4,257 | |||
| International | 1,446 | 1,394 | 1,396 | ||||||
| Total sales | $ | 5,437 | $ | 5,750 | $ | 5,653 | |||
Long-Lived Assets
| 2007 | 2006 | 2005 | |||||||
| (in millions) | |||||||||
| United States | $ | 368 | $ | 504 | $ | 523 | |||
| International | 153 | 150 | 152 | ||||||
| Total long-lived assets | $ | 521 | $ | 654 | $ | 675 | |||
5. Other Income
Other income was $1 million, $14 million and $6 million for 2007, 2006 and 2005, respectively. Included in other income are non-operating items, such as the effect of foreign currency option contracts, sales of lease interests and insurance proceeds.
In 2007, other income includes a $1 million gain related to a final settlement with the Company’s insurance carriers of a claim related to a store damaged by fire in 2006. Additionally, the Company sold two of its lease interests in Europe for a gain of $1 million. These gains were offset primarily by premiums paid for foreign currency option contracts.
In 2006, other income includes a gain of $8 million related to a final settlement with the Company’s insurance carriers of claims related to Hurricane Katrina, income of $2 million related to the Athletic Stores segment was $191purchase and retirement of debt and lease termination income of $4 million. The Company purchased and retired $38 million of its $200 million 8.50 percent debentures payable in 2022, at January 29,a $2 million discount from face value. During 2006, the Company terminated two of its leases and recorded a net gain of $4 million.
In 2005, the Company recorded a net gain of $3 million related to foreign currency option contracts that were entered into by the Company to mitigate the effect of fluctuating foreign exchange rates on the reporting of euro denominated earnings. Additionally, the Company recorded a gain of $3 million of insurance recoveries in excess of losses associated with Hurricane Katrina.
41
6. Short-Term Investments
The Company’s auction rate security investments are accounted for as available-for-sale securities. The following represents the composition of the Company’s auction rate securities by underlying investment.
| 2007 | 2006 | |||||
| (in millions) | ||||||
| Tax exempt municipal bonds | $ | — | $ | 44 | ||
| Equity securities | 5 | 205 | ||||
| $ | 5 | $ | 249 | |||
With the liquidity issues experienced in the global credit and $56 million at January 31, 2004. The carryingcapital markets, the Company’s preferred stock auction rate security, having a face value of $7 million, has experienced failed auctions. The Company determined that a temporary impairment has occurred and therefore has recorded a charge of $2 million, with no tax benefit, to accumulated other comprehensive loss as of February 2, 2008. This security will continue to accrue interest at the contractual rate and will be auctioned every 90 days until the auction succeeds. Based on the relatively small size of this investment and the Company’s ability to access cash and other short-term investments, and expected operating cash flows, we do not anticipate the lack of liquidity on this investment will affect our ability to operate our business as usual.
7. Merchandise Inventories
| 2007 | 2006 | |||||
| (in millions) | ||||||
| LIFO inventories | $ | 907 | $ | 967 | ||
| FIFO inventories | 374 | 336 | ||||
| Total merchandise inventories | $ | 1,281 | $ | 1,303 | ||
The value of the Company’s LIFO inventories, as calculated on a LIFO basis, approximates their value as calculated on a FIFO basis.
8. Other Current Assets
| 2007 | 2006 | |||||
| (in millions) | ||||||
| Net receivables | $ | 50 | $ | 59 | ||
| Prepaid expenses and other current assets | 34 | 36 | ||||
| Prepaid rent | 65 | 62 | ||||
| Prepaid income taxes | 70 | 67 | ||||
| Deferred taxes | 53 | 21 | ||||
| Investments | — | 14 | ||||
| Northern Group note receivable | 14 | 1 | ||||
| Current tax asset | 1 | — | ||||
| Fair value of derivative contracts | 3 | 1 | ||||
| $ | 290 | $ | 261 | |||
42
9. Property and Equipment, Net
| 2007 | 2006 | |||||||
| (in millions) | ||||||||
| Land | $ | 3 | $ | 3 | ||||
| Buildings: | ||||||||
| Owned | 30 | 30 | ||||||
| Furniture, fixtures and equipment: | ||||||||
| Owned | 1,117 | 1,139 | ||||||
| Leased | — | 14 | ||||||
| 1,150 | 1,186 | |||||||
| Less: accumulated depreciation | (903 | ) | (870 | ) | ||||
| 247 | 316 | |||||||
| Alterations to leased and owned buildings, | ||||||||
| net of accumulated amortization | 274 | 338 | ||||||
| $ | 521 | $ | 654 | |||||
10. Goodwill
| 2007 | 2006 | |||||
| (in millions) | ||||||
| Athletic Stores | $ | 186 | $ | 184 | ||
| Direct-to-Customers | 80 | 80 | ||||
| $ | 266 | $ | 264 | |||
The effect of foreign exchange fluctuations for the fiscal year ended February 2, 2008 increased goodwill relatedby $2 million, resulting from the strengthening of the euro in relation to the Direct-to-Customers segment was $80 million at January 29, 2005U.S. dollar. During the third and January 31, 2004.
| Jan. 31, 2004 | Acquisitions(1) | Additions | Other(2) | Jan. 29, 2005 | |||||||||||||||||||
|---|---|---|---|---|---|---|---|---|---|---|---|---|---|---|---|---|---|---|---|---|---|---|---|
| (in millions) | |||||||||||||||||||||||
| Goodwill | $ | 136 | 134 | — | 1 | $ | 271 | ||||||||||||||||
11. Intangible Assets, net
| February 2, 2008 | February 3, 2007 | ||||||||||||||||||||||
| Net | Wtd. Avg. | Net | |||||||||||||||||||||
| Gross | Accum. | Value | Useful Life | Gross | Accum. | Value | |||||||||||||||||
| (in millions) | value | amort. | (1) | in Years | value | amort. | (1) | ||||||||||||||||
| Finite life intangible assets | |||||||||||||||||||||||
| Lease acquisition costs | $ | 198 | $ | (125 | ) | $ | 73 | 11.9 | $ | 178 | $ | (98 | ) | $ | 80 | ||||||||
| Trademark | 21 | (4 | ) | 17 | 20.0 | 21 | (3 | ) | 18 | ||||||||||||||
| Loyalty program | 1 | (1 | ) | — | 2.0 | 1 | (1 | ) | — | ||||||||||||||
| Favorable leases | 10 | (7 | ) | 3 | 3.7 | 9 | (5 | ) | 4 | ||||||||||||||
| Total finite life intangible assets | 230 | (137 | ) | 93 | 12.3 | 209 | (107 | ) | 102 | ||||||||||||||
| Intangible assets not subject to | |||||||||||||||||||||||
| amortization | 3 | — | 3 | 3 | — | 3 | |||||||||||||||||
| Total intangible assets | $ | 233 | $ | (137 | ) | $ | 96 | $ | 212 | $ | (107 | ) | $ | 105 | |||||||||
| (1) |
| Includes effect of foreign currency |
4 Intangible Assets, net
| 2004 | 2003 | ||||||||||
|---|---|---|---|---|---|---|---|---|---|---|---|
| (in millions) | |||||||||||
| Intangible assets not subject to amortization | $ | 4 | $ | 2 | |||||||
| Intangible assets subject to amortization (net of accumulated amortization of $70 and $51, respectively) | 131 | 94 | |||||||||
| $ | 135 | $ | 96 | ||||||||
33
| 2003 | Acquisitions(1) | Additions | Amortization / Other(2) | 2004 | Wtd. Avg. Useful Life in Years | ||||||||||||||||||||||
|---|---|---|---|---|---|---|---|---|---|---|---|---|---|---|---|---|---|---|---|---|---|---|---|---|---|---|---|
| (in millions) | |||||||||||||||||||||||||||
Finite life intangible assets | |||||||||||||||||||||||||||
| Lease acquisition costs | $ | 94 | $ | — | $ | 17 | $ | (9 | ) | $ | 102 | 12.2 | |||||||||||||||
| Trademark | — | 21 | — | (1 | ) | 20 | 20.0 | ||||||||||||||||||||
| Loyalty program | — | �� | 1 | — | — | 1 | 2.0 | ||||||||||||||||||||
| Favorable leases | — | 9 | — | (1 | ) | 8 | 4.1 | ||||||||||||||||||||
| Total | $ | 94 | $ | 31 | $ | 17 | $ | (11 | ) | $ | 131 | 12.6 | |||||||||||||||
Amortization expense for the intangibles subject to amortization was approximately $17 million, $11 million and $8$19 million for 2004, 2003both 2007 and 2002, respectively.2006, and $18 for 2005. Annual estimated amortization expense for finite life intangible assets is expected to approximate $19 million for 2005, $18 million for 2006, $162008, $17 million for 2007, $142009, $15 million for 2008 and $132010, $12 million for 2009.2011 and $9 million for 2012.
12. Other Assets
| 2007 | 2006 | |||||
| (in millions) | ||||||
| Deferred tax costs | $ | 9 | $ | 21 | ||
| Prepaid income taxes | 6 | — | ||||
| Income tax asset | 2 | — | ||||
| Investments and note receivable | — | 7 | ||||
| Northern Group note receivable, net of current portion | — | 10 | ||||
| Fair value of derivative contracts | 4 | — | ||||
| Pension benefits | — | 8 | ||||
| Other | 37 | 37 | ||||
| $ | 58 | $ | 83 | |||
| 2007 | 2006 | |||||
| (in millions) | ||||||
| Pension and postretirement benefits | $ | 4 | $ | 4 | ||
| Incentive bonuses | 5 | 12 | ||||
| Other payroll and payroll related costs, excluding taxes | 52 | 46 | ||||
| Taxes other than income taxes | 44 | 46 | ||||
| Property and equipment | 23 | 24 | ||||
| Customer deposits(1) | 34 | 33 | ||||
| Income taxes payable | 7 | 2 | ||||
| Fair value of derivative contracts | — | 2 | ||||
| Current deferred tax liabilities | 13 | 4 | ||||
| Sales return reserve | 4 | 4 | ||||
| Current portion of repositioning and restructuring reserves | — | 1 | ||||
| Current portion of reserve for discontinued operations | 14 | 3 | ||||
| Other operating costs | 68 | 65 | ||||
| $ | 268 | $ | 246 | |||
| 2004 | 2003 | 2002 | |||||||||||||
|---|---|---|---|---|---|---|---|---|---|---|---|---|---|---|---|
| (in millions) | |||||||||||||||
| Athletic Stores | $ | 4,989 | $ | 4,413 | $ | 4,160 | |||||||||
| Direct-to-Customers | 366 | 366 | 349 | ||||||||||||
| Total sales | $ | 5,355 | $ | 4,779 | $ | 4,509 | |||||||||
34
| 2004 | 2003 | 2002 | |||||||||||||
|---|---|---|---|---|---|---|---|---|---|---|---|---|---|---|---|
| (in millions) | |||||||||||||||
Athletic Stores(1) | $ | 420 | $ | 363 | $ | 280 | |||||||||
| Direct-to-Customers | 45 | 53 | 40 | ||||||||||||
| 465 | 416 | 320 | |||||||||||||
All Other(2) | (2 | ) | (1 | ) | 1 | ||||||||||
| Division profit | 463 | 415 | 321 | ||||||||||||
Corporate expense(3) | (74 | ) | (73 | ) | (52 | ) | |||||||||
| Operating profit | 389 | 342 | 269 | ||||||||||||
Non-operating income(4) | — | — | 3 | ||||||||||||
| Interest expense, net | (15 | ) | (18 | ) | (26 | ) | |||||||||
| Income from continuing operations before income taxes | $ | 374 | $ | 324 | $ | 246 | |||||||||
| (1) |
| Depreciation and Amortization | Capital Expenditures | Total Assets | |||||||||||||||||||||||||||||||||||||
|---|---|---|---|---|---|---|---|---|---|---|---|---|---|---|---|---|---|---|---|---|---|---|---|---|---|---|---|---|---|---|---|---|---|---|---|---|---|---|---|
| 2004 | 2003 | 2002 | 2004 | 2003 | 2002 | 2004 | 2003 | 2002 | |||||||||||||||||||||||||||||||
| (in millions) | |||||||||||||||||||||||||||||||||||||||
| Athletic Stores | $ | 126 | $ | 123 | $ | 123 | $ | 139 | $ | 126 | $ | 124 | $ | 2,335 | $ | 1,739 | $ | 1,591 | |||||||||||||||||||||
| Direct-to-Customers | 5 | 4 | 4 | 8 | 6 | 8 | 190 | 183 | 177 | ||||||||||||||||||||||||||||||
| 131 | 127 | 127 | 147 | 132 | 132 | 2,525 | 1,922 | 1,768 | |||||||||||||||||||||||||||||||
| Corporate | 23 | 25 | 26 | 9 | 12 | 18 | 711 | 789 | 744 | ||||||||||||||||||||||||||||||
| Discontinued operations | 1 | 2 | 2 | ||||||||||||||||||||||||||||||||||||
| Total Company | $ | 154 | $ | 152 | $ | 153 | $ | 156 | $ | 144 | $ | 150 | $ | 3,237 | $ | 2,713 | $ | 2,514 | |||||||||||||||||||||
At February 1, 2003 are presented below. Sales are attributed to the country in which the sales originate, which is where the legal subsidiary is domiciled. Long-lived assets reflect property and equipment. No individual country included in the International category is significant.
Sales
| 2004 | 2003 | 2002 | |||||||||||||
|---|---|---|---|---|---|---|---|---|---|---|---|---|---|---|---|
| (in millions) | |||||||||||||||
| United States | $ | 3,982 | $ | 3,597 | $ | 3,639 | |||||||||
| International | 1,373 | 1,182 | 870 | ||||||||||||
| Total sales | $ | 5,355 | $ | 4,779 | $ | 4,509 | |||||||||
Long-Lived Assets
| 2004 | 2003 | 2002 | |||||||||||||
|---|---|---|---|---|---|---|---|---|---|---|---|---|---|---|---|
| (in millions) | |||||||||||||||
| United States | $ | 547 | $ | 525 | $ | 544 | |||||||||
| International | 168 | 143 | 120 | ||||||||||||
| Total long-lived assets | $ | 715 | $ | 668 | $ | 664 | |||||||||
35
| 2004 | 2003 | ||||||||||
|---|---|---|---|---|---|---|---|---|---|---|---|
| (in millions) | |||||||||||
| Tax exempt municipal bonds | $ | 50 | $ | 44 | |||||||
| Taxable bonds | 40 | — | |||||||||
| Equity securities | 177 | 214 | |||||||||
| $ | 267 | $ | 258 | ||||||||
| 2004 | 2003 | ||||||||||
|---|---|---|---|---|---|---|---|---|---|---|---|
| (in millions) | |||||||||||
| LIFO inventories | $ | 856 | $ | 651 | |||||||
| FIFO inventories | 295 | 269 | |||||||||
| Total merchandise inventories | $ | 1,151 | $ | 920 | |||||||
| 2004 | 2003 | ||||||||||
|---|---|---|---|---|---|---|---|---|---|---|---|
| (in millions) | |||||||||||
| Net receivables | $ | 47 | $ | 41 | |||||||
| Prepaid expenses and other current assets | 47 | 45 | |||||||||
| Prepaid income taxes | 40 | — | |||||||||
| Deferred taxes | 53 | 60 | |||||||||
| Current portion of Northern Group note receivable | 1 | 2 | |||||||||
| Fair value of derivative contracts | — | 1 | |||||||||
| $ | 188 | $ | 149 | ||||||||
| 2004 | 2003 | ||||||||||
|---|---|---|---|---|---|---|---|---|---|---|---|
| (in millions) | |||||||||||
Land | $ | 3 | $ | 3 | |||||||
Buildings: | |||||||||||
| Owned | 31 | 32 | |||||||||
Furniture, fixtures and equipment: | |||||||||||
| Owned | 1,072 | 1,015 | |||||||||
| Leased | 14 | 14 | |||||||||
| 1,120 | 1,064 | ||||||||||
| Less: accumulated depreciation | (755 | ) | (706 | ) | |||||||
| 365 | 358 | ||||||||||
Alterations to leased and owned buildings, net of accumulated amortization | 350 | 310 | |||||||||
| $ | 715 | $ | 668 | ||||||||
36
| 2004 | 2003 | ||||||||||
|---|---|---|---|---|---|---|---|---|---|---|---|
| (in millions) | |||||||||||
| Deferred tax costs | $ | 25 | $ | 35 | |||||||
| Investments and notes receivable | 22 | 23 | |||||||||
| Northern Group note receivable, net of current portion | 8 | 6 | |||||||||
| Income taxes receivable | — | 1 | |||||||||
| Fair value of derivative contracts | 2 | — | |||||||||
| Other | 47 | 35 | |||||||||
| $ | 104 | $ | 100 | ||||||||
| 2004 | 2003 | ||||||||||
|---|---|---|---|---|---|---|---|---|---|---|---|
| (in millions) | |||||||||||
| Pension and postretirement benefits | $ | 30 | $ | 57 | |||||||
| Incentive bonuses | 34 | 38 | |||||||||
| Other payroll and payroll related costs, excluding taxes | 51 | 44 | |||||||||
| Taxes other than income taxes | 45 | 44 | |||||||||
| Property and equipment | 22 | 32 | |||||||||
| Gift cards and certificates | 22 | 16 | |||||||||
| Income taxes payable | 9 | 9 | |||||||||
| Fair value of derivative contracts | 3 | 3 | |||||||||
| Current deferred tax liabilities | 1 | — | |||||||||
| Other operating costs | 58 | 57 | |||||||||
| $ | 275 | $ | 300 | ||||||||
44
Deferred financing fees as well as new up-front fees paid, and direct costs incurred, to amend the agreement are amortized over the life of the facility on a straight-line basis, which is comparable to the interest method, totalingmethod. The unamortized balance at February 2, 2008 is approximately $4 million at January 29, 2005.$1.4 million. Interest is determined at the time of borrowing based on variable rates and the Company’s fixed charge coverage ratio, as defined in the agreement. The rates range from LIBOR plus 1.3750.875 percent to LIBOR plus 2.251.625 percent. In addition, theThe quarterly facility fees paid on the unused portion during 2004,2007 and 2006, which isare also based on the Company’s fixed charge coverage ratio, ranged from 0.25 percent in the earlier part of 2004 to 0.175 percent by the end of 2004, which was based on the Company’s third quarter fixed charge coverage ratio. Quarterly facility fees paid in 2003 ranged from 0.50 percent, in the earlier part, to 0.25 percent during the fourth quarter of 2003, also based on the Company’s improved fixed charge coverage ratio.0.500 percent. There were no short-term borrowings during 20042007 or 2003.
15. Long-Term Debt and 2002.
37
During 2007, the Company’s $14 million Industrial Revenue Bond, which was accounted for as a capital lease matured. Accordingly, the Company repaid this amount.
Following is a summary of long-term debt and obligations under capital leases:
| 2007 | 2006 | |||||
| (in millions) | ||||||
| 8.50% debentures payable 2022 | $ | 133 | $ | 130 | ||
| $175 million term loan | 88 | 90 | ||||
| Total long-term debt | 221 | 220 | ||||
| Obligations under capital leases | — | 14 | ||||
| 221 | 234 | |||||
| Less: Current portion | — | 14 | ||||
| $ | 221 | $ | 220 | |||
| 2004 | 2003 | ||||||||||
|---|---|---|---|---|---|---|---|---|---|---|---|
| (in millions) | |||||||||||
| 8.50% debentures payable 2022 | $ | 176 | $ | 171 | |||||||
| $175 million term loan | 175 | — | |||||||||
| 5.50% convertible notes | — | 150 | |||||||||
| Total long-term debt | 351 | 321 | |||||||||
| Obligations under capital leases | 14 | 14 | |||||||||
| 365 | 335 | ||||||||||
| Less: Current portion | 18 | — | |||||||||
| $ | 347 | $ | 335 | ||||||||
38
| Long-Term | |||||
| Debt | |||||
| (in millions) | |||||
| 2008 | $ | — | |||
| 2009 | 88 | ||||
| 2010 -2012 | — | ||||
| Thereafter | 133 | ||||
| Less: Current portion | — | ||||
| $ | 221 | ||||
| Long-Term Debt | Capital Leases | Total | |||||||||||||
|---|---|---|---|---|---|---|---|---|---|---|---|---|---|---|---|
| (in millions) | |||||||||||||||
| 2005 | $ | 18 | $ | — | $ | 18 | |||||||||
| 2006 | 18 | — | 18 | ||||||||||||
| 2007 | 26 | 14 | 40 | ||||||||||||
| 2008 | 26 | — | 26 | ||||||||||||
| 2009 | 87 | — | 87 | ||||||||||||
| Thereafter | 176 | — | 176 | ||||||||||||
| 351 | 14 | 365 | |||||||||||||
| Less: Current portion | 18 | — | 18 | ||||||||||||
| $ | 333 | $ | 14 | $ | 347 | ||||||||||
Interest expense related to long-term debt and capital lease obligations, including the effect of the interest rate swaps and the amortization of the associated debt issuance costs was $19$18 million in 2004, $222007 and $20 million in 2003both 2006 and $282005. The effect of the interest rate swaps was not significant for the years ended February 2, 2008 and February 3, 2007. The effect of the interest rate swaps resulted in a combined reduction in interest expense of $1 million in 2002.
1416. Leases
| 2007 | 2006 | 2005 | ||||||||||
| (in millions) | ||||||||||||
| Minimum rent | $ | 521 | $ | 496 | $ | 489 | ||||||
| Other occupancy expenses | 151 | 145 | 141 | |||||||||
| Contingent rent based on sales | 17 | 21 | 13 | |||||||||
| Sublease income | (1 | ) | (1 | ) | (1 | ) | ||||||
| Total rent expense | $ | 688 | $ | 661 | $ | 642 | ||||||
| 2004 | 2003 | 2002 | |||||||||||||
|---|---|---|---|---|---|---|---|---|---|---|---|---|---|---|---|
| (in millions) | |||||||||||||||
| Rent | $ | 605 | $ | 532 | $ | 491 | |||||||||
| Contingent rent based on sales | 11 | 11 | 11 | ||||||||||||
| Sublease income | (1 | ) | (1 | ) | (1 | ) | |||||||||
| Total rent expense | $ | 615 | $ | 542 | $ | 501 | |||||||||
| (in millions) | |||||
| 2008 | $ | 487 | |||
| 2009 | 434 | ||||
| 2010 | 398 | ||||
| 2011 | 354 | ||||
| 2012 | 297 | ||||
| Thereafter | 823 | ||||
| Total operating lease commitments | $ | 2,793 | |||
| (in millions) | ||||||
|---|---|---|---|---|---|---|
| 2005 | $ | 449 | ||||
| 2006 | 423 | |||||
| 2007 | 383 | |||||
| 2008 | 322 | |||||
| 2009 | 256 | |||||
| Thereafter | 890 | |||||
| Total operating lease commitments | $ | 2,723 | ||||
| Present value of operating lease commitments | $ | 1,989 | ||||
3917. Other Liabilities
| 2007 | 2006 | |||||
| (in millions) | ||||||
| Pension benefits | $ | 35 | $ | 21 | ||
| Postretirement benefits | 9 | 11 | ||||
| Straight-line rent liability | 99 | 91 | ||||
| Income taxes | 29 | 24 | ||||
| Deferred taxes | 15 | 21 | ||||
| Workers’ compensation / general liability reserves | 13 | 12 | ||||
| Reserve for discontinued operations | 9 | 12 | ||||
| Repositioning and restructuring reserves | 2 | 3 | ||||
| Fair value of derivatives | 32 | 12 | ||||
| Unfavorable leases | 2 | 2 | ||||
| Other | 10 | 9 | ||||
| $ | 255 | $ | 218 | |||
46
| 2004 | 2003 | ||||||||||
|---|---|---|---|---|---|---|---|---|---|---|---|
| (in millions) | |||||||||||
| Pension benefits | $ | 130 | $ | 175 | |||||||
| Postretirement benefits | 95 | 113 | |||||||||
| Straight-line rent liability | 77 | 67 | |||||||||
| Income taxes | 29 | 62 | |||||||||
| Workers’ compensation / general liability reserves | 11 | 12 | |||||||||
| Reserve for discontinued operations | 11 | 11 | |||||||||
| Repositioning and restructuring reserves | 3 | 2 | |||||||||
| Fair value of derivatives | — | 1 | |||||||||
| Unfavorable leases | 3 | — | |||||||||
| Other | 17 | 15 | |||||||||
| $ | 376 | $ | 458 | ||||||||
On January 23, 2001, the Company announced that it was exiting its 694-store Northern Group segment. During the second quarter of 2001, the Company completed the liquidation of the 324 stores in the United States. On September 28, 2001, the Company completed the stock transfer of the 370 Northern Group stores in Canada, through one of its wholly owned subsidiaries for approximately CAD$59 million, (approximately US$38 million), which was paid in the form of a note. Over the last several years, the note (the “Note”). Another wholly owned subsidiaryhas been amended and payments have been received, however the interest and payment terms remained unchanged. The note is required to be repaid upon the occurrence of the Company was the assignor of the store leases involved“payment events,” as defined in the transaction and therefore retains potential liability for such leases.purchase agreement, but no later than September 28, 2008. As of February 2, 2008, CAD$15.5 million remains outstanding on the note. The net amount of the assets and liabilities of the former operations was written down to the estimated fair value of the Note. The transaction was accounted for pursuant to SEC Staff Accounting Bulletin Topic 5:E “Accounting for Divestiture of a Subsidiary or Other Business Operation,”note at February 2, 2008 is $14 million which is classified as a “transfer ofcurrent receivable. At February 3, 2007, $1 million was classified as a current receivable with the remainder classified as long-term within other assets and liabilities under contractual arrangement” as no cash proceeds were received and the consideration comprised the Note, the repayment of which was dependent on the future successful operations of the business.
40
41
| 2004 | 2005 | 2006 | 2007 | ||||||||||||||||||||||||||||||||||||||||||||||
| Charge/ | Net | Charge/ | Net | Charge/ | Net | ||||||||||||||||||||||||||||||||||||||||||||
| Balance | (Income) | Usage(1) | Balance | (Income) | Usage(1) | Balance | (Income) | Usage(1) | Balance | ||||||||||||||||||||||||||||||||||||||||
| (in millions) | |||||||||||||||||||||||||||||||||||||||||||||||||
| Northern Group | $ | 3 | $ | — | $ | 2 | $ | 5 | $ | (2 | ) | $ | (1 | ) | $ | 2 | $ | — | $ | 10 | $ | 12 | |||||||||||||||||||||||||||
| International General Merchandise | 5 | 2 | 1 | 8 | (2 | ) | — | 6 | (3 | ) | 1 | 4 | |||||||||||||||||||||||||||||||||||||
| Specialty Footwear | 2 | — | (1 | ) | 1 | — | — | 1 | — | (1 | ) | — | |||||||||||||||||||||||||||||||||||||
| Domestic General Merchandise | 8 | — | — | 8 | — | (2 | ) | 6 | — | 1 | 7 | ||||||||||||||||||||||||||||||||||||||
| Total | $ | 18 | $ | 2 | $ | 2 | $ | 22 | $ | (4 | ) | $ | (3 | ) | $ | 15 | $ | (3 | ) | $ | 11 | $ | 23 | ||||||||||||||||||||||||||
(1) Net usage includes effect of foreign exchange translation adjustments.
Northern Group
| 2001 | 2002 | 2003 | 2004 | ||||||||||||||||||||||||||||||||||||||||
|---|---|---|---|---|---|---|---|---|---|---|---|---|---|---|---|---|---|---|---|---|---|---|---|---|---|---|---|---|---|---|---|---|---|---|---|---|---|---|---|---|---|---|---|
| Balance | Charge/ (Income) | Net Usage* | Balance | Charge/ (Income) | Net Usage* | Balance | Charge/ (Income) | Net Usage* | Balance | ||||||||||||||||||||||||||||||||||
| (in millions) | |||||||||||||||||||||||||||||||||||||||||||
| Asset write-offs & impairments | $ | — | $ | 18 | $ | (18) | $ | — | $ | — | $ | — | $ | — | $ | — | $ | — | $ | — | |||||||||||||||||||||||
| Recognition of note receivable | — | (10) | 10 | — | — | — | — | — | — | — | |||||||||||||||||||||||||||||||||
| Real estate & lease liabilities | 6 | 1 | (1 | ) | 6 | 1 | (7 | ) | — | — | — | — | |||||||||||||||||||||||||||||||
| Severance & personnel | 2 | — | (2 | ) | — | — | — | — | — | — | — | ||||||||||||||||||||||||||||||||
| Operating losses & other costs | 3 | — | (2 | ) | 1 | — | 1 | 2 | — | 1 | 3 | ||||||||||||||||||||||||||||||||
| Total | $ | 11 | $ | 9 | $ | (13 | ) | $ | 7 | $ | 1 | $ | (6 | ) | $ | 2 | $ | — | $ | 1 | $ | 3 | |||||||||||||||||||||
International General Merchandise
| 2001 | 2002 | 2003 | 2004 | ||||||||||||||||||||||||||||||||||||||||
|---|---|---|---|---|---|---|---|---|---|---|---|---|---|---|---|---|---|---|---|---|---|---|---|---|---|---|---|---|---|---|---|---|---|---|---|---|---|---|---|---|---|---|---|
| Balance | Charge/ (Income) | Net Usage* | Balance | Charge/ (Income) | Net Usage* | Balance | Charge/ (Income) | Net Usage* | Balance | ||||||||||||||||||||||||||||||||||
| (in millions) | |||||||||||||||||||||||||||||||||||||||||||
| Woolco | $ | — | $ | 1 | $ | — | $ | 1 | $ | — | $ | (1 | ) | $ | — | $ | — | $ | — | $ | — | ||||||||||||||||||||||
| The Bargain! Shop | 6 | — | — | 6 | — | (1 | ) | 5 | — | — | 5 | ||||||||||||||||||||||||||||||||
| Total | $ | 6 | $ | 1 | $ | — | $ | 7 | $ | — | $ | (2 | ) | $ | 5 | $ | — | $ | — | $ | 5 | ||||||||||||||||||||||
Specialty Footwear
| 2001 | 2002 | 2003 | 2004 | ||||||||||||||||||||||||||||||||||||||||
|---|---|---|---|---|---|---|---|---|---|---|---|---|---|---|---|---|---|---|---|---|---|---|---|---|---|---|---|---|---|---|---|---|---|---|---|---|---|---|---|---|---|---|---|
| Balance | Charge/ (Income) | Net Usage | Balance | Charge/ (Income) | Net Usage | Balance | Charge/ (Income) | Net Usage | Balance | ||||||||||||||||||||||||||||||||||
| (in millions) | |||||||||||||||||||||||||||||||||||||||||||
| Lease liabilities | $ | 7 | $ | (4) | $ | (1) | $ | 2 | $ | — | $ | — | $ | 2 | $ | — | $ | — | $ | 2 | |||||||||||||||||||||||
| Operating losses & other costs | 2 | — | (1 | ) | 1 | — | (1 | ) | — | (1 | ) | 1 | — | ||||||||||||||||||||||||||||||
| Total | $ | 9 | $ | (4 | ) | $ | (2 | ) | $ | 3 | $ | — | $ | (1 | ) | $ | 2 | $ | (1 | ) | $ | 1 | $ | 2 | |||||||||||||||||||
Domestic General Merchandise
| 2001 | 2002 | 2003 | 2004 | ||||||||||||||||||||||||||||||||||||||||
|---|---|---|---|---|---|---|---|---|---|---|---|---|---|---|---|---|---|---|---|---|---|---|---|---|---|---|---|---|---|---|---|---|---|---|---|---|---|---|---|---|---|---|---|
| Balance | Charge/ (Income) | Net Usage | Balance | Charge/ (Income) | Net Usage | Balance | Charge/ (Income) | Net Usage | Balance | ||||||||||||||||||||||||||||||||||
| (in millions) | |||||||||||||||||||||||||||||||||||||||||||
| Lease liabilities | $ | 10 | $ | — | $ | (3 | ) | $ | 7 | $ | — | $ | (1 | ) | $ | 6 | $ | — | $ | — | $ | 6 | |||||||||||||||||||||
| Legal and other costs | 2 | 5 | (4 | ) | 3 | 4 | (3 | ) | 4 | — | (2 | ) | 2 | ||||||||||||||||||||||||||||||
| Total | $ | 12 | $ | 5 | $ | (7 | ) | $ | 10 | $ | 4 | $ | (4 | ) | $ | 10 | $ | — | $ | (2 | ) | $ | 8 | ||||||||||||||||||||
42
47
1719. Repositioning and Restructuring Reserves
1999 Restructuring
1993 Repositioning and 1991 Restructuring
Total Repositioning and Restructuring Reserves
| 2001 | 2002 | 2003 | 2004 | ||||||||||||||||||||||||||||||||||||||||
|---|---|---|---|---|---|---|---|---|---|---|---|---|---|---|---|---|---|---|---|---|---|---|---|---|---|---|---|---|---|---|---|---|---|---|---|---|---|---|---|---|---|---|---|
| Balance | Charge/ (Income) | Net Usage | Balance | Charge/ (Income) | Net Usage | Balance | Charge/ (Income) | Net Usage | Balance | ||||||||||||||||||||||||||||||||||
| (in millions) | |||||||||||||||||||||||||||||||||||||||||||
| Real estate | $ | 3 | $ | — | $ | (1 | ) | $ | 2 | $ | 1 | $ | (1 | ) | $ | 2 | $ | 2 | $ | (1 | ) | $ | 3 | ||||||||||||||||||||
| Other disposition costs | 5 | (2 | ) | (2 | ) | 1 | — | — | 1 | — | — | 1 | |||||||||||||||||||||||||||||||
| Total | $ | 8 | $ | (2 | ) | $ | (3 | ) | $ | 3 | $ | 1 | $ | (1 | ) | $ | 3 | $ | 2 | $ | (1 | ) | $ | 4 | |||||||||||||||||||
Following are the domestic and international components of pre-tax (loss) income from continuing operations:
| 2007 | 2006 | 2005 | ||||||||
| (in millions) | ||||||||||
| Domestic | $ | (131 | ) | $ | 320 | $ | 309 | |||
| International | 81 | 72 | 96 | |||||||
| Total pre-tax (loss) income | $ | (50 | ) | $ | 392 | $ | 405 | |||
| The income tax (benefit) provision consists of the following: | ||||||||||
| 2007 | 2006 | 2005 | ||||||||
| (in millions) | ||||||||||
| Current: | ||||||||||
| Federal | $ | (4 | ) | $ | 93 | $ | 72 | |||
| State and local | (4 | ) | 14 | 11 | ||||||
| International | 38 | 17 | 35 | |||||||
| Total current tax provision | 30 | 124 | 118 | |||||||
| Deferred: | ||||||||||
| Federal | (58 | ) | 10 | 22 | ||||||
| State and local | — | 6 | 7 | |||||||
| International | (71 | ) | 5 | (5 | ) | |||||
| Total deferred tax (benefit) provision | (129 | ) | 21 | 24 | ||||||
| Total income tax (benefit) provision | $ | (99 | ) | $ | 145 | $ | 142 | |||
| 2004 | 2003 | 2002 | |||||||||||||
|---|---|---|---|---|---|---|---|---|---|---|---|---|---|---|---|
| (in millions) | |||||||||||||||
| Domestic | $ | 222 | $ | 186 | $ | 160 | |||||||||
| International | 152 | 138 | 86 | ||||||||||||
| Total pre-tax income | $ | 374 | $ | 324 | $ | 246 | |||||||||
43
| 2004 | 2003 | 2002 | |||||||||||||
|---|---|---|---|---|---|---|---|---|---|---|---|---|---|---|---|
| (in millions) | |||||||||||||||
Current: | |||||||||||||||
| Federal | $ | 11 | $ | 48 | $ | 16 | |||||||||
| State and local | 6 | 14 | 5 | ||||||||||||
| International | 52 | 58 | 25 | ||||||||||||
| Total current tax provision | 69 | 120 | 46 | ||||||||||||
Deferred: | |||||||||||||||
| Federal | 43 | 11 | 31 | ||||||||||||
| State and local | 8 | (6 | ) | — | |||||||||||
| International | (1 | ) | (10 | ) | 7 | ||||||||||
| Total deferred tax provision | 50 | (5 | ) | 38 | |||||||||||
| Total income tax provision | $ | 119 | $ | 115 | $ | 84 | |||||||||
A reconciliation of the significant differences between the federal statutory income tax rate and the effective income tax rate on pre-tax (loss) income from continuing operations is as follows:
| 2007 | 2006 | 2005 | ||||||
| Federal statutory income tax rate | (35.0 | )% | 35.0 | % | 35.0 | % | ||
| State and local income taxes, net of federal tax benefit | (13.8 | ) | 3.3 | 2.8 | ||||
| International income taxed at varying rates | 8.3 | (0.9 | ) | 0.8 | ||||
| Foreign tax credit utilization | (53.1 | ) | (1.2 | ) | (3.1 | ) | ||
| (Decrease) increase in valuation allowance | (125.7 | ) | 0.1 | (1.5 | ) | |||
| Federal/foreign tax settlements | — | (0.1 | ) | 0.4 | ||||
| Tax exempt obligations | (3.7 | ) | (0.5 | ) | (0.4 | ) | ||
| Federal tax credits | (1.6 | ) | (0.2 | ) | (0.2 | ) | ||
| Foreign dividends and gross-up | 25.4 | — | — | |||||
| Other, net | 1.2 | 1.4 | 1.2 | |||||
| Effective income tax rate | (198.0 | )% | 36.9 | % | 35.0 | % | ||
| 2004 | 2003 | 2002 | ||||||||||||
|---|---|---|---|---|---|---|---|---|---|---|---|---|---|---|
| Federal statutory income tax rate | 35.0 | % | 35.0 | % | 35.0 | % | ||||||||
| State and local income taxes, net of federal tax benefit | 2.3 | 2.4 | 2.0 | |||||||||||
| International income taxed at varying rates | (0.6 | ) | 0.5 | 1.0 | ||||||||||
| Foreign tax credit utilization | (2.5 | ) | (1.0 | ) | (1.2 | ) | ||||||||
| Increase (decrease) in valuation allowance | 0.1 | (1.5 | ) | (2.0 | ) | |||||||||
| Federal/foreign tax settlements | (3.3 | ) | — | — | ||||||||||
| State and local tax settlements | — | (0.2 | ) | (0.3 | ) | |||||||||
| Tax exempt obligations | (0.2 | ) | (0.2 | ) | (0.1 | ) | ||||||||
| Work opportunity tax credit | (0.2 | ) | (0.1 | ) | (0.3 | ) | ||||||||
| Other, net | 1.1 | 0.6 | 0.1 | |||||||||||
| Effective income tax rate | 31.7 | % | 35.5 | % | 34.2 | % | ||||||||
| 2007 | 2006 | ||||||
| (in millions) | |||||||
| Deferred tax assets: | |||||||
| Tax loss/credit carryforwards | $ | 68 | $ | 56 | |||
| Employee benefits | 33 | 26 | |||||
| Reserve for discontinued operations | 5 | 6 | |||||
| Repositioning and restructuring reserves | 1 | 2 | |||||
| Property and equipment | 165 | 116 | |||||
| Allowance for returns and doubtful accounts | 3 | 4 | |||||
| Straight-line rent | 25 | 24 | |||||
| Other | 17 | 21 | |||||
| Total deferred tax assets | 317 | 255 | |||||
| Valuation allowance | (14 | ) | (105 | ) | |||
| Total deferred tax assets, net | $ | 303 | $ | 150 | |||
| Deferred tax liabilities: | |||||||
| Inventories | $ | 19 | $ | 24 | |||
| Goodwill | 11 | 13 | |||||
| Other | 5 | 8 | |||||
| Total deferred tax liabilities | $ | 35 | $ | 45 | |||
| Net deferred tax asset | $ | 268 | $ | 105 | |||
| Balance Sheet caption reported in: | |||||||
| Deferred taxes | $ | 243 | $ | 109 | |||
| Other current assets | 53 | 21 | |||||
| Other current liabilities | (13 | ) | (4 | ) | |||
| Other liabilities | (15 | ) | (21 | ) | |||
| $ | 268 | $ | 105 | ||||
| 2004 | 2003 | ||||||||||
|---|---|---|---|---|---|---|---|---|---|---|---|
| (in millions) | |||||||||||
Deferred tax assets: | |||||||||||
| Tax loss/credit carryforwards | $ | 89 | $ | 99 | |||||||
| Employee benefits | 116 | 135 | |||||||||
| Reserve for discontinued operations | 5 | 8 | |||||||||
| Repositioning and restructuring reserves | 3 | 2 | |||||||||
| Property and equipment | 89 | 81 | |||||||||
| Allowance for returns and doubtful accounts | 7 | 10 | |||||||||
| Straight-line rent | 19 | 17 | |||||||||
| Goodwill | — | 1 | |||||||||
| Other | 17 | 22 | |||||||||
| Total deferred tax assets | 345 | 375 | |||||||||
| Valuation allowance | (124 | ) | (122 | ) | |||||||
| Total deferred tax assets, net | $ | 221 | $ | 253 | |||||||
44
| 2004 | 2003 | ||||||||||
|---|---|---|---|---|---|---|---|---|---|---|---|
| (in millions) | |||||||||||
Deferred tax liabilities: | |||||||||||
| Inventories | $ | 8 | $ | 13 | |||||||
| Goodwill | 2 | — | |||||||||
| Other | 1 | 1 | |||||||||
| Total deferred tax liabilities | 11 | 14 | |||||||||
| Net deferred tax asset | $ | 210 | $ | 239 | |||||||
Balance Sheet caption reported in: | |||||||||||
| Deferred taxes | $ | 180 | $ | 194 | |||||||
| Other current assets | 53 | 60 | |||||||||
| Other current liabilities | (1 | ) | — | ||||||||
| Other liabilities | (22 | ) | (15 | ) | |||||||
| $ | 210 | $ | 239 | ||||||||
The Company’s U.S. Federal income tax filings have been examined by the Internal Revenue Service (the “IRS”) through 2003. The IRS has begun a voluntary pre-filing review process for 2004. The pre-filing review process is expected to conclude during 2005.2006. The Company has also agreed to participateis participating in the IRS’IRS’s Compliance Assurance Process (“CAP”) for 2005.
The Company adopted FIN No. 48, “Accounting for Uncertainty in Income Taxes” effective February 4, 2007, that resulted in the recognition of an additional $1 million of previously unrecognized tax benefits, which was reflected as an adjustment to opening retained earnings. The Company had U.S. Federal alternative minimum$33 million of gross unrecognized tax creditsbenefits, $30 million of net unrecognized tax benefits, as of February 4, 2007. The Company has classified certain income tax liabilities as current or noncurrent based on management’s estimate of when these liabilities will be settled. Interest expense and Canadian capital loss carryforwardspenalties related to unrecognized tax benefits are classified as income tax expense. During the year ended February 2, 2008, the Company recognized $1 million of approximately $17interest expense. The total amount of accrued interest and penalties was $5 million and $4 million of interest and no penalties in 2007 and 2006, respectively.
The following table summarizes the activity related to unrecognized tax benefits:
| ( in millions) | |||||
| Balance as of February 4, 2007 | $ | 33 | |||
| Increases related to current year tax positions | 4 | ||||
| Increases related to prior period tax positions | 35 | ||||
| Decreases related to prior period tax positions | — | ||||
| Settlements | — | ||||
| Lapse of statute of limitations | (1 | ) | |||
| Balance as of February 2, 2008 | $ | 71 |
50
Of the unrecognized tax benefits, $68 million would, if recognized, affect the Company’s annual effective tax rate. It is reasonably possible that the liability associated with the Company’s unrecognized tax benefits will increase or decrease within the next twelve months. These changes may be the result of ongoing audits or the expiration of statutes of limitations. Settlements could increase earnings in an amount ranging from $0 to $10 million respectively, which dobased on current estimates. Audit outcomes and the timing of audit settlements are subject to significant uncertainty. Although management believes that adequate provision has been made for such issues, the ultimate resolution of such issues could have an adverse effect on the earnings of the Company. Conversely, if these issues are resolved favorably in the future, the related provision would be reduced, generating a positive effect on earnings. Due to the uncertainty of amounts and in accordance with its accounting policies, the Company has not expire.
45
21. Financial Instruments and Risk Management
|
Foreign Exchange Risk Management — Derivative Holdings Designated as Hedges
For a derivative to qualify as a hedge at inception and throughout the hedged period, the Company formally documents the nature of the hedged items and the relationships between the hedging instruments and the hedged items, as well as its risk-management objectives, strategies for undertaking the various hedge transactions, and the methods of assessing hedge effectiveness and hedge ineffectiveness. Additionally, for hedges of forecasted transactions, the significant characteristics and expected terms of a forecasted transaction must be specifically identified, and it must be probable that each forecasted transaction would occur. If it were deemed probable that the forecasted transaction would not occur, the gain or loss would be recognized in earnings immediately. No such gains or losses were recognized in earnings during 2004 or 2003.
The Company has designated these hedging instruments as hedges of the net investments in foreign subsidiaries, and will use the spot rate method of accounting to value changes of the hedging instrument attributable to currency rate fluctuations. As such, adjustments in the fair market value of the hedging instrument due to changes in the spot rate will be recorded in other comprehensive income and are expected to offset changes in the euro-denominated net investment. Amounts recorded to foreign currency translation within accumulated other comprehensive loss will remain there until the net investment is disposed of. The amount recorded within the foreign currency translation adjustment included in accumulated other comprehensive loss on the Consolidated Balance Sheet decreased shareholders’ equity
51
by $20 million and $5 million, net of tax at February 2, 2008 and February 3, 2007. At January 28, 2006, the amount recorded to foreign currency translation was not significant. The effect on the Consolidated Statements of Operations related to the net investments hedges was income of $1 million for 2007 and $3 million for 2006.
Foreign Exchange Risk Management — Derivative Holdings Designated as Non-Hedges
The Company mitigates the effect of fluctuating foreign exchange rates on the reporting of foreign currency denominated earnings by entering into a variety of derivative instruments including option currency contracts. Changes in the fair value of forward contracts andthese foreign currency option contracts, that do not qualifywhich are designated as hedgesnon-hedges, are recorded in earnings. In 2004,earnings immediately. The premiums paid and changes in the fair market value recorded in the Consolidated Statement of Operations were not significant for the years ended February 2, 2008 and February 3, 2007, respectively.
The Company enteredalso enters into certain forward foreign exchange contracts to hedge intercompany foreign-currency denominated firm commitmentsmerchandise purchases and recorded lossesintercompany transactions. Net changes in the fair value of approximately $2 millionforeign exchange derivative financial instruments designated as non-hedges were substantially offset by the changes in value of the underlying transactions, which were recorded in selling, general and administrative expenses to reflect their fair value. These losses were offset by the foreign exchange gains on the revaluation of the underlying commitments, which were expected to be settled in 2004 and 2005.
46
Foreign Currency Exchange Rates
| Fair Value | Contract Value | Weighted-Average | |||||||||
| (US in millions) | (US in millions) | Exchange Rate | |||||||||
| Inventory | |||||||||||
| Buy €/Sell British £ | $ | 2 | $ | 48 | .7239 | ||||||
| Earnings | |||||||||||
| Buy CAD$/Sell $US | $ | — | $ | 7 | 1.0000 | ||||||
| Buy €/Sell $US | — | 34 | 1.4200 | ||||||||
| Intercompany | |||||||||||
| Buy US/Sell € | $ | — | $ | — | .6808 | ||||||
| Buy €/ Sell British £ | 1 | 16 | .6918 | ||||||||
| Buy €/Sell SEK | — | 1 | 9.4712 | ||||||||
| Buy AUD/Sell NZD | — | 2 | .8883 | ||||||||
| Buy US/Sell CAD$ | — | 6 | .9861 | ||||||||
| Buy CAD$/Sell US | — | 6 | .9971 | ||||||||
| Fair Value (US in millions) | Contract Value (US in millions) | Weighted-Average Exchange Rate | ||||||||||||
|---|---|---|---|---|---|---|---|---|---|---|---|---|---|---|
Inventory | ||||||||||||||
| Buy €/Sell British £ | $ | — | $ | 59 | 0.6996 | |||||||||
Intercompany | ||||||||||||||
| Buy €/Sell $US | $ | — | $ | 6 | 1.2290 | |||||||||
| Buy $US/Sell € | (3 | ) | 69 | 1.2432 | ||||||||||
| Buy €/Sell British £ | — | 17 | 0.7187 | |||||||||||
| $ | (3 | ) | $ | 151 | ||||||||||
Interest Rate Risk Management
| 2007 | 2006 | 2005 | |||||||||
| (in millions) | |||||||||||
| Interest Rate Swaps: | |||||||||||
| Fixed to Variable ($US) — notional amount | $ | 100 | $ | 100 | $ | 100 | |||||
| Average pay rate | 6.22 | % | 8.53 | % | 8.00 | % | |||||
| Average receive rate | 8.50 | % | 8.50 | % | 8.50 | % | |||||
| Variable to variable ($US) — notional amount | $ | 100 | $ | 100 | $ | 100 | |||||
| Average pay rate | 3.39 | % | 5.57 | % | 4.82 | % | |||||
| Average receive rate | 3.02 | % | 5.32 | % | 4.79 | % | |||||
52
Fair Value
The following represents the fair value of the Company’s derivative holdings:
| 2007 | 2006 | ||||
| (in millions) | |||||
| Current assets | $ | 3 | $ | 1 | |
| Non-current assets | 4 | — | |||
| Current liabilities | — | 2 | |||
| Non-current liabilities | 32 | 12 | |||
| 2004 | 2003 | 2002 | |||||||||||||
|---|---|---|---|---|---|---|---|---|---|---|---|---|---|---|---|
| ($ in millions) | |||||||||||||||
| Interest Rate Swaps: | |||||||||||||||
| Fixed to Variable ($US) | $ | 100 | $ | 100 | $ | 50 | |||||||||
| Average pay rate | 6.46 | % | 5.07 | % | 4.53 | % | |||||||||
| Average receive rate | 8.50 | % | 8.50 | % | 8.50 | % | |||||||||
| Variable to variable ($US) | $ | 100 | $ | — | $ | — | |||||||||
| Average pay rate | 2.73 | % | — | % | — | % | |||||||||
| Average receive rate | 3.25 | % | — | % | — | % | |||||||||
Interest Rates
| 2005 | 2006 | 2007 | 2008 | 2009 | Thereafter | Jan. 29, 2005 Total | Jan. 31, 2004 Total | ||||||||||||||||||||||||||||
|---|---|---|---|---|---|---|---|---|---|---|---|---|---|---|---|---|---|---|---|---|---|---|---|---|---|---|---|---|---|---|---|---|---|---|---|
| ($ in millions) | |||||||||||||||||||||||||||||||||||
| Long-term debt | $ | 18 | 18 | 26 | 26 | 87 | 193 | $ | 368 | $ | 435 | ||||||||||||||||||||||||
| Weighted-average interest rate | 5.2 | % | 5.3 | % | 5.4 | % | 5.6 | % | 6.6 | % | 6.9 | % | |||||||||||||||||||||||
| Feb. 2, | Feb. 3 | |||||||||||||||||||||||
| 2008 | 2007 | |||||||||||||||||||||||
| 2008 | 2009 | 2010 | 2011 | 2012 | Thereafter | Total | Total | |||||||||||||||||
| ($ in millions) | ||||||||||||||||||||||||
| Long-term debt | $ | — | 88 | — | — | — | 128 | $ | 216 | $ | 222 | |||||||||||||
| Weighted-average interest rate | 6.8 | % | 6.8 | % | 7.0 | % | 7.0 | % | 7.0 | % | 7.0 | % | ||||||||||||
47
Fair Value of Financial Instruments
Business Risk
22. Retirement Plans and Other Benefits
|
Pension and Other Postretirement Plans
In September 2006, the FASB issued SFAS No. 158, “Employers’ Accounting for Defined Benefit Pension and Other Postretirement Plans- An Amendment of FASB Statements No. 87, 88, 106, and 132(R),” (“SFAS No. 158”). This standard requires an employer to: recognize in its statement of financial position an asset for a plan’s overfunded status or a liability for a plan’s underfunded status; measure a plan’s assets and its obligations that determine its funded status as of the end of the employer’s fiscal year (with limited exceptions); and recognize changes in the funded status of a defined benefit postretirement plan in the year in which the changes occur. Those changes will be reported in accumulated comprehensive loss. The initial effect of the standard, due to unrecognized prior service cost and net actuarial gains or losses, as well as subsequent changes in the funded status, is recognized as a component of accumulated comprehensive income/loss within shareholders’ equity. Additional minimum pension liabilities (“AML”) and related intangible assets are derecognized upon the adoption of SFAS No. 158. The Company adopted this standard as of February 3, 2007.
The following tables set forth the plans’ changes in benefit obligations and plan assets, funded status and amounts recognized in the Consolidated Balance Sheets, measured at January 29, 2005February 2, 2008 and January 31, 2004:February 3, 2007:
| Postretirement | |||||||||||||||
| Pension Benefits | Benefits | ||||||||||||||
| 2007 | 2006 | 2007 | 2006 | ||||||||||||
| (in millions) | |||||||||||||||
| Change in benefit obligation | |||||||||||||||
| Benefit obligation at beginning of year | $ | 662 | $ | 689 | $ | 13 | $ | 17 | |||||||
| Service cost | 10 | 10 | — | — | |||||||||||
| Interest cost | 36 | 36 | — | 1 | |||||||||||
| Plan participants’ contributions | — | — | 4 | 5 | |||||||||||
| Actuarial gain | (13 | ) | (12 | ) | (2 | ) | (3 | ) | |||||||
| Foreign currency translation adjustments | 15 | (2 | ) | — | — | ||||||||||
| Plan amendment | — | 1 | — | — | |||||||||||
| Benefits paid | (61 | ) | (60 | ) | (5 | ) | (7 | ) | |||||||
| Benefit obligation at end of year | $ | 649 | $ | 662 | $ | 10 | $ | 13 | |||||||
| Change in plan assets | |||||||||||||||
| Fair value of plan assets at beginning of year | $ | 647 | $ | 579 | |||||||||||
| Actual return on plan assets | 11 | 60 | |||||||||||||
| Employer contribution | — | 70 | |||||||||||||
| Foreign currency translation adjustments | 14 | (2 | ) | ||||||||||||
| Benefits paid | (61 | ) | (60 | ) | |||||||||||
| Fair value of plan assets at end of year | $ | 611 | $ | 647 | |||||||||||
| Funded status | $ | (38 | ) | $ | (15 | ) | $ | (10 | ) | $ | (13 | ) | |||
| Balance Sheet caption reported in: | |||||||||||||||
| Other assets | $ — | $ | 8 | $ | — | $ | — | ||||||||
| Accrued and other liabilities | (3 | ) | (2 | ) | (1 | ) | (2 | ) | |||||||
| Other liabilities | (35 | ) | (21 | ) | (9 | ) | (11 | ) | |||||||
| $ | (38 | ) | $ | (15 | ) | $ | (10 | ) | $ | (13 | ) | ||||
At February 2, 2008, the aggregate amount of accumulated benefit obligations which exceed plan assets totaled $648 million representing both the qualified and non qualified pension plans. At February 3, 2007, the accumulated benefit obligations which exceed plan assets totaled $23 million representing the Company’s non qualified pension plans. The Company’s qualified pension plans were fully funded as of February 3, 2007.
| Pension Benefits | Postretirement Benefits | ||||||||||||||||||
|---|---|---|---|---|---|---|---|---|---|---|---|---|---|---|---|---|---|---|---|
| 2004 | 2003 | 2004 | 2003 | ||||||||||||||||
| (in millions) | |||||||||||||||||||
Change in benefit obligation | |||||||||||||||||||
| Benefit obligation at beginning of year | $ | 697 | $ | 685 | $ | 27 | $ | 30 | |||||||||||
| Service cost | 9 | 8 | — | — | |||||||||||||||
| Interest cost | 39 | 43 | 1 | 1 | |||||||||||||||
| Plan participants’ contributions | — | — | 5 | 5 | |||||||||||||||
| Actuarial loss | 16 | 18 | — | 1 | |||||||||||||||
| Foreign currency translation adjustments | 5 | 11 | — | — | |||||||||||||||
| Benefits paid | (63 | ) | (68 | ) | (9 | ) | (10 | ) | |||||||||||
| Benefit obligation at end of year | $ | 703 | $ | 697 | $ | 24 | $ | 27 | |||||||||||
Change in plan assets | |||||||||||||||||||
| Fair value of plan assets at beginning of year | $ | 474 | $ | 380 | |||||||||||||||
| Actual return on plan assets | 28 | 101 | |||||||||||||||||
| Employer contribution | 108 | 54 | |||||||||||||||||
| Foreign currency translation adjustments | 4 | 7 | |||||||||||||||||
| Benefits paid | (63 | ) | (68 | ) | |||||||||||||||
| Fair value of plan assets at end of year | $ | 551 | $ | 474 | |||||||||||||||
48
54
| Pension Benefits | Postretirement Benefits | ||||||||||||||||||
|---|---|---|---|---|---|---|---|---|---|---|---|---|---|---|---|---|---|---|---|
| 2004 | 2003 | 2004 | 2003 | ||||||||||||||||
| (in millions) | |||||||||||||||||||
Funded status | |||||||||||||||||||
| Funded status | $ | (152 | ) | $ | (223 | ) | $ | (24 | ) | $ | (27 | ) | |||||||
| Unrecognized prior service cost (benefit) | 4 | 5 | (10 | ) | (11 | ) | |||||||||||||
| Unrecognized net (gain) loss | 324 | 296 | (67 | ) | (80 | ) | |||||||||||||
| Prepaid asset (accrued liability) | $ | 176 | $ | 78 | $ | (101 | ) | $ | (118 | ) | |||||||||
Balance Sheet caption reported in: | |||||||||||||||||||
| Intangible assets | $ | 1 | $ | 2 | $ | — | $ | — | |||||||||||
| Accrued liabilities | (24 | ) | (52 | ) | (6 | ) | (5 | ) | |||||||||||
| Other liabilities | (130 | ) | (175 | ) | (95 | ) | (113 | ) | |||||||||||
| Accumulated other comprehensive loss, pre-tax | 329 | 303 | — | — | |||||||||||||||
| $ | 176 | $ | 78 | $ | (101 | ) | $ | (118 | ) | ||||||||||
| Pension | Postretirement | |||||||||
| Benefits | Benefits | |||||||||
| (in millions) | ||||||||||
| Net actuarial loss (gain) at beginning of year | $ | 274 | $ | (53 | ) | |||||
| Amortization of net (loss) gain | (11 | ) | 8 | |||||||
| Loss (gain) arising during the year | 35 | (2 | ) | |||||||
| Translation loss | 7 | �� | — | |||||||
| Net actuarial loss (gain) at end of year | $ | 305 | $ | (47 | ) | |||||
| Net prior service cost (benefit) at beginning of year | $ | 4 | $ | (7 | ) | |||||
| Amortization of prior service (cost) benefit | (1 | ) | 1 | |||||||
| Net prior service cost (benefit) at end of year | $ | 3 | $ | (6 | ) | |||||
| Total amount recognized | $ | 308 | $ | (53 | ) | |||||
| Postretirement | |||||||||||
| Pension | Benefits | Total | |||||||||
| (in millions) | |||||||||||
| Amortization of prior service cost (benefit) | $ | 1 | $ | (1 | ) | $ | — | ||||
| Amortization of net loss (gain) | $ | 12 | $ | (7 | ) | $ | 5 | ||||
The following represents the change to the Consolidated Balance Sheet as of February 3, 2007 as a result of the adoption of SFAS No. 158:
| Prior to | |||||||||||||||
| AML and | Effect of | Post AML and | |||||||||||||
| Statement | Adoption | Statement | |||||||||||||
| No. 158 | AML | Statement | No. 158 | ||||||||||||
| Adjustments | Adjustment | No. 158 | Adjustments | ||||||||||||
| (in millions) | |||||||||||||||
| Current assets | $ | 2,034 | $ | — | $ | — | $ | 2,034 | |||||||
| Deferred taxes | 144 | (120 | ) | 85 | 109 | ||||||||||
| Intangible assets | 106 | (1 | ) | — | 105 | ||||||||||
| Other assets | 75 | — | 8 | 83 | |||||||||||
| Total assets | 3,277 | (121 | ) | 93 | 3,249 | ||||||||||
| Accrued liabilities | 246 | — | — | 246 | |||||||||||
| Total current liabilities | 516 | — | — | 516 | |||||||||||
| Other liabilities | 300 | (308 | ) | 226 | 218 | ||||||||||
| Other comprehensive loss | (150 | ) | 187 | (133 | ) | (96 | ) | ||||||||
| Total shareholders’ equity | 2,323 | (121 | ) | 93 | 2,295 | ||||||||||
| Total liabilities and shareholders’ equity | $ | 3,277 | $ | (121 | ) | $ | 93 | $ | 3,249 | ||||||
| Postretirement | |||||||||||
| Pension Benefits | Benefits | ||||||||||
| 2007 | 2006 | 2007 | 2006 | ||||||||
| Discount rate | 5.84 | % | 5.68 | % | 6.10 | % | 5.80 | % | |||
| Rate of compensation increase | 3.72 | % | 3.76 | % | |||||||
| Pension Benefits | Postretirement Benefits | ||||||||||||||||||
|---|---|---|---|---|---|---|---|---|---|---|---|---|---|---|---|---|---|---|---|
| 2004 | 2003 | 2004 | 2003 | ||||||||||||||||
| Discount rate | 5.50 | % | 5.90 | % | 5.50 | % | 5.90 | % | |||||||||||
| Rate of compensation increase | 3.79 | % | 3.72 | % | |||||||||||||||
The components of net benefit expense (income) are:
| Pension Benefits | Postretirement Benefits | ||||||||||||||||||||||
| 2007 | 2006 | 2005 | 2007 | 2006 | 2005 | ||||||||||||||||||
| (in millions) | |||||||||||||||||||||||
| Service cost | $ | 10 | $ | 10 | $ | 9 | $ | — | $ | — | $ | — | |||||||||||
| Interest cost | 36 | 36 | 36 | — | 1 | 1 | |||||||||||||||||
| Expected return on plan assets | (56 | ) | (56 | ) | (49 | ) | — | — | — | ||||||||||||||
| Amortization of prior service cost (benefit) | 1 | 1 | 1 | (1 | ) | (1 | ) | (1 | ) | ||||||||||||||
| Amortization of net loss (gain) | 11 | 12 | 13 | (8 | ) | (10 | ) | (12 | ) | ||||||||||||||
| Net benefit expense (income) | $ | 2 | $ | 3 | $ | 10 | $ | (9 | ) | $ | (10 | ) | $ | (12 | ) | ||||||||
| Pension Benefits | Postretirement Benefits | ||||||||||||||||||||||||||
|---|---|---|---|---|---|---|---|---|---|---|---|---|---|---|---|---|---|---|---|---|---|---|---|---|---|---|---|
| 2004 | 2003 | 2002 | 2004 | 2003 | 2002 | ||||||||||||||||||||||
| (in millions) | |||||||||||||||||||||||||||
| Service cost | $ | 9 | $ | 8 | $ | 8 | $ | — | $ | — | $ | — | |||||||||||||||
| Interest cost | 39 | 43 | 44 | 1 | 2 | 2 | |||||||||||||||||||||
| Expected return on plan assets | (48 | ) | (46 | ) | (50 | ) | — | — | — | ||||||||||||||||||
| Amortization of prior service cost (benefit) | 1 | — | 1 | (1 | ) | (1 | ) | (1 | ) | ||||||||||||||||||
| Amortization of net (gain) loss | 11 | 9 | 3 | (13 | ) | (16 | ) | (12 | ) | ||||||||||||||||||
| Net benefit expense (income) | $ | 12 | $ | 14 | $ | 6 | $ | (13 | ) | $ | (15 | ) | $ | (11 | ) | ||||||||||||
| Pension Benefits | Postretirement Benefits | ||||||||||||||||
| 2007 | 2006 | 2005 | 2007 | 2006 | 2005 | ||||||||||||
| Discount rate | 5.66 | % | 5.44 | % | 5.50 | % | 5.80 | % | 5.50 | % | 5.50 | % | |||||
| Rate of compensation increase | 3.75 | % | 3.76 | % | 3.77 | % | |||||||||||
| Expected long-term rate of return on assets | 8.85 | % | 8.87 | % | 8.88 | % | |||||||||||
| Pension Benefits | Postretirement Benefits | ||||||||||||||||||||||||||
|---|---|---|---|---|---|---|---|---|---|---|---|---|---|---|---|---|---|---|---|---|---|---|---|---|---|---|---|
| 2004 | 2003 | 2002 | 2004 | 2003 | 2002 | ||||||||||||||||||||||
| Discount rate | 5.90 | % | 6.50 | % | 7.00 | % | 5.90 | % | 6.50 | % | 7.00 | % | |||||||||||||||
| Rate of compensation increase | 3.79 | % | 3.72 | % | 3.53 | % | |||||||||||||||||||||
| Expected long-term rate of return on assets | 8.89 | % | 8.88 | % | 8.87 | % | �� | ||||||||||||||||||||
In 2002, based on historical experience,August 2006, the drop out rate assumptionPension Protection Act of 2006 was increased forsigned into law. The major provisions of the medical plan, therebystatute have taken effect January 1, 2008. Among other things, the statute is designed to ensure timely and adequate funding of pension plans by shortening the expected amortizationtime period within which decreasedemployers must fully fund pension benefits. The Company is currently evaluating the accumulated postretirement benefit obligation at February 1, 2003 by approximately $6 million, and increased postretirement benefit income by approximately $3 million in 2002.
49
| 2007 | 2006 | ||||
| Asset Category | |||||
| Equity securities | 55 | % | 64 | % | |
| Foot Locker, Inc. common stock | 1 | % | 1 | % | |
| Debt securities | 42 | % | 33 | % | |
| Real estate | 1 | % | 1 | % | |
| Other | 1 | % | 1 | % | |
| Total | 100 | % | 100 | % | |
| 2004 | 2003 | |||||||||
|---|---|---|---|---|---|---|---|---|---|---|
Asset Category | ||||||||||
| Equity securities | 63 | % | 63 | % | ||||||
| Foot Locker, Inc. common stock | 2 | % | 2 | % | ||||||
| Debt securities | 33 | % | 33 | % | ||||||
| Real estate | 1 | % | 1 | % | ||||||
| Other | 1 | % | 1 | % | ||||||
| Total | 100 | % | 100 | % | ||||||
The U.S. defined benefit plan held 396,000 shares of Foot Locker, Inc. common stock as of January 29, 2005February 2, 2008 and January 31, 2004.February 3, 2007. Currently, the target composition of the weighted-averageU.S. plan assets is 6465 percent equity and 3635 percent fixed income securities, although the Company may alter the targets from time to time depending on market conditions and the funding requirements of the pension plans.plan. Due to market conditions and other factors, actual asset allocations may vary from the target allocation outlined above. The Company believes that plan assets are invested in a prudent manner with an objective of providing a total return that, over the long term, provides sufficient assets to fund benefit obligations, taking into account the Company’s expected contributions and the level of risk deemed appropriate. The Company’s investment strategy is to utilize asset classes with differing rates of return, volatility and correlation to reduce risk by providing diversification relative to equities. Diversification within asset classes is also utilized to reduce the effect that the return of any single investment may have on the entire portfolio.
In late January 2008, the Company modified the actual asset allocations for its Canadian pension plan. Effective with the beginning of 2008, the target allocation for the Canadian plan is 95 percent debt securities and 5 percent equity. The bond portfolio is comprised of government and corporate bonds chosen to match the pension plan’s benefit payment obligations. This change will reduce future volatility with regard to the funded status of the plan. This change will, however, result in higher pension expense due to the lower long-term rate of return associated with debt securities. In 2008, the Company currently expectsis required to contribute $22make a contribution of approximately $6 million to its Canadian pension plans during 2005 to the extent that the contributions are tax deductible. However, this is subject to change, and is based upon the Company’s overall financial performance as well as plan asset performance significantly above or below the assumed long-term rate of return.
| Pension | Postretirement | ||||||
| Benefits | Benefits | ||||||
| (in millions) | |||||||
| 2008 | $ | 64 | $ 2 | ||||
| 2009 | 64 | 2 | |||||
| 2010 | 60 | 2 | |||||
| 2011 | 58 | 1 | |||||
| 2012 | 57 | 1 | |||||
| 2013–2017 | 255 | 4 | |||||
| Pension Benefits | Postretirement Benefits | ||||||||||
|---|---|---|---|---|---|---|---|---|---|---|---|
| (in millions) | |||||||||||
| 2005 | $63 | $5 | |||||||||
| 2006 | 62 | 4 | |||||||||
| 2007 | 60 | 3 | |||||||||
| 2008 | 58 | 3 | |||||||||
| 2009 | 58 | 2 | |||||||||
| 2010–2014 | 266 | 8 | |||||||||
In February 2007, the Company and its U.S. pension plan, the Foot Locker Retirement Plan, were named as defendants in a class action in federal court in New York. The Complaint alleged that the Company’s pension plan violated the Employee Retirement Income Security Act of 1974, including, without limitation, its age discrimination and notice provisions, as a result of the Company’s conversion of its defined benefit plan to a defined benefit pension plan with a cash balance feature in 1996. The Company is defending the action vigorously.
Savings Plans
The Company has two qualified savings plans, a 401(k) Plan that is available to employees whose primary place of employment is the U.S., and an 1165 (e) Plan, which began during 2004 that is available to employees whose primary place of employment is in Puerto Rico. Both plans require that the employees have attained at least the age of twenty-one and have completed one year of service consisting of at least 1,000 hours. The savings plans allow eligible employees to contribute up to 25 percent and 10 percent, for the U.S. and Puerto Rico plans, respectively, of their compensation on a pre-tax basis. The Company matches 25 percent of the first 4 percent of the employees’ contributions with Company stock and such matching Company contributions are vested incrementally over 5 years for both plans. The charge to operations for the Company’s matching contribution for the U.S. plan was $1.3$1.8 million, $1.9 million, and $1.6 million in 2007, 2006 and $1.4 million in 2004, 2003 and 2002,2005, respectively.
50
23. Share-Based Compensation
21 Stock PlansOptions
Under the 20032007 Stock Option Plan, stock options, restricted stock, stock appreciation rights (SARs), or other stock-based awards may be granted to officers and other employees at not less thanof the market price onCompany, including our subsidiaries and operating divisions worldwide. Nonemployee directors are also eligible to receive awards under this plan. Options for employees become exercisable in substantially equal annual installments over a three-year period, beginning with the first anniversary of the date of grant of the grant. Unlessoption, unless a shorter or longer or shorter periodduration is established at the time of the option grant, generally, one-third of each stock option grant becomesgrant. Options for nonemployee directors become exercisable on each of the first three anniversary dates ofone year from the date of grant. The maximum number of shares of stock reserved for issuance pursuant toall awards under the 20032007 Stock Option Plan is 4,000,000 shares.6,000,000. The number of shares reserved for issuance as restricted stock and other stock-based awards cannot exceed 1,000,0001,500,000 shares. The Company adoptedoptions terminate up to ten years from the date of grant.
57
Under the Company’s 2003 Stock PurchaseOption Plan whose terms are substantiallyand the same as the 1994 Employees Stock Purchase1998 Plan, (the “1994 Stock Purchase Plan”) which expired in June 2004. Under the 2003 Stock Purchase Plan, 3,000,000 shares of common stock will be available for purchase beginning June 2005.
Employee Stock Purchase Plan
Under the Company’s 19942003 Employees Stock Purchase Plan (the “2003 Employee Stock Purchase Plan”), participating employees wereare able to contribute up to 10 percent of their annual compensation through payroll deductions to acquire shares of the Company’s common stock at 85 percent of the lower market price on one of two specified dates in each plan year. Under the 2003 Employee Stock Purchase Plan, 3,000,000 shares of common stock are authorized for purchase beginning June 2005. Of the 8,000,0003,000,000 shares of common stock authorized for purchase under this plan, 1,552723 participating employees purchased 593,91398,449 shares in 2004. A2007, and 806 participating employees purchased 105,123 shares in 2006. To date, a total of 2,222,089440,925 shares werehave been purchased under this plan. No further shares may be issued
Valuation Model and Assumptions
The Company uses a Black-Scholes option-pricing model to estimate the fair value of share-based awards under thisSFAS No. 123(R), which is the same valuation technique it previously used for pro forma disclosures under SFAS No. 123. The Black-Scholes option-pricing model incorporates various and highly subjective assumptions, including expected term and expected volatility.
The Company estimates the expected term of share-based awards granted using the Company’s historical exercise and post-vesting employment termination patterns, which it believes are representative of future behavior. The expected term for the Company’s employee stock purchase plan after June 1, 2004.
| Stock Option Plans | Stock Purchase Plan | ||||||||||||||||||||||||||
|---|---|---|---|---|---|---|---|---|---|---|---|---|---|---|---|---|---|---|---|---|---|---|---|---|---|---|---|
| 2004 | 2003 | 2002 | 2004 | 2003 | 2002 | ||||||||||||||||||||||
| Weighted-average risk free rate of interest | 2.57 | % | 2.26 | % | 4.17 | % | 1.33 | % | 1.11 | % | 2.59 | % | |||||||||||||||
| Expected volatility | 33 | % | 37 | % | 42 | % | 32 | % | 31 | % | 35 | % | |||||||||||||||
| Weighted-average expected award life | 3.7 | years | 3.4 | years | 3.5 | years | .7 | years | .7 | years | .7 | years | |||||||||||||||
| Dividend yield | 1.1 | % | 1.2 | % | 1.2 | % | — | — | — | ||||||||||||||||||
| Weighted-average fair value | $ | 6.51 | $ | 2.90 | $ | 5.11 | $ | 11.44 | $ | 14.15 | $ | 4.23 | |||||||||||||||
51
Additionally, SFAS No. 123(R) requires the characteristicsCompany to estimate pre-vesting option forfeitures at the time of traded options,grant and periodically revise those estimates in subsequent periods if actual forfeitures differ from those estimates. The Company records stock-based compensation expense only for those awards expected to vest using an estimated forfeiture rate based on its historical pre-vesting forfeiture data. Previously, the option valuation models do not necessarily provide a reliable measureCompany accounted for forfeitures as they occurred under the pro forma disclosure provisions of SFAS No. 123 for periods prior to 2006.
58
The following table shows the fair value of its options.Company’s assumptions used to compute the stock-based compensation expense and pro forma information:
| Stock Option Plans | Stock Purchase Plan | |||||||||||||||||
| 2007 | 2006 | 2005 | 2007 | 2006 | 2005 | |||||||||||||
| Weighted-average risk free rate | ||||||||||||||||||
| of interest | 4.43 | % | 4.68 | % | 3.99 | % | 5.00 | % | 4.39 | % | 4.19 | % | ||||||
| Expected volatility | 28 | % | 30 | % | 28 | % | 22 | % | 22 | % | 25 | % | ||||||
| Weighted-average expected | ||||||||||||||||||
| award life | 4.2 years | 4.0 years | 3.8 years | 1.0 year | 1.0 years | .7 years | ||||||||||||
| Dividend yield | 2.3 | % | 1.5 | % | 1.1 | % | 2.0 | % | 1.4 | % | — | |||||||
| Weighted-average fair value | $5.28 | $6.36 | $6.69 | $4.96 | $4.71 | $5.54 | ||||||||||||
| 2007 | 2006 | 2005 | |||||||||||||||||
| Weighted- | Weighted- | Weighted- | |||||||||||||||||
| Number | Average | Number | Average | Number | Average | ||||||||||||||
| of | Exercise | of | Exercise | of | Exercise | ||||||||||||||
| Shares | Price | Shares | Price | Shares | Price | ||||||||||||||
| (in thousands, except prices per share) | |||||||||||||||||||
| Options outstanding at beginning | |||||||||||||||||||
| of year | 6,048 | $ | 19.15 | 5,962 | $ | 18.45 | 5,909 | $ | 16.69 | ||||||||||
| Granted | 778 | $ | 22.38 | 858 | $ | 23.98 | 1,014 | $ | 27.42 | ||||||||||
| Exercised | (474 | ) | $ | 15.29 | (459 | ) | $ | 15.12 | (682 | ) | $ | 15.03 | |||||||
| Expired or cancelled | (375 | ) | $ | 23.99 | (313 | ) | $ | 24.83 | (279 | ) | $ | 22.11 | |||||||
| Options outstanding at end of year | 5,977 | $ | 19.57 | 6,048 | $ | 19.15 | 5,962 | $ | 18.45 | ||||||||||
| Options exercisable at end of year | 4,530 | $ | 18.27 | 4,455 | $ | 16.94 | 4,042 | $ | 16.00 | ||||||||||
| Options available for future grant at end | |||||||||||||||||||
| of year | 5,804 | 4,931 | 5,768 | ||||||||||||||||
The total intrinsic value of options exercised for 2007 and 2006 was $2.7 million and $4.0 million, respectively. The aggregate intrinsic value for stock options outstanding and for stock options exercisable as of February 2, 2008 was $4.8 million. The intrinsic value for stock options outstanding and exercisable is calculated as the difference between the fair market value as the end of the period and the exercise price of the shares. The Company received $6.9 million and $6.8 million in cash from option exercises for 2007 and 2006, respectively. The tax benefit realized by the Company on the stock option exercises for 2007 was approximately $1 million.
| 2004 | 2003 | 2002 | |||||||||||||||||||||||||
|---|---|---|---|---|---|---|---|---|---|---|---|---|---|---|---|---|---|---|---|---|---|---|---|---|---|---|---|
| Number of Shares | Weighted- Average Exercise Price | Number of Shares | Weighted- Average Exercise Price | Number of Shares | Weighted- Average Exercise Price | ||||||||||||||||||||||
| (in thousands, except prices per share) | |||||||||||||||||||||||||||
| Options outstanding at beginning of year | 6,886 | $ | 14.73 | 7,676 | $ | 15.18 | 7,557 | $ | 14.63 | ||||||||||||||||||
| Granted | 1,183 | $ | 25.20 | 1,439 | $ | 10.81 | 1,640 | $ | 15.72 | ||||||||||||||||||
| Exercised | 1,853 | $ | 14.43 | 1,830 | $ | 12.50 | 783 | $ | 6.67 | ||||||||||||||||||
| Expired or canceled | 307 | $ | 19.13 | 399 | $ | 19.55 | 738 | $ | 19.80 | ||||||||||||||||||
| Options outstanding at end of year | 5,909 | $ | 16.69 | 6,886 | $ | 14.73 | 7,676 | $ | 15.18 | ||||||||||||||||||
| Options exercisable at end of year | 3,441 | $ | 15.34 | 4,075 | $ | 15.99 | 4,481 | $ | 15.94 | ||||||||||||||||||
| Options available for future grant at end of year | 7,464 | 8,780 | 6,739 | ||||||||||||||||||||||||
February 2, 2008:
| Options Outstanding | Options Exercisable | ||||||||||||||||||
| Weighted- | |||||||||||||||||||
| Average | Weighted- | Weighted- | |||||||||||||||||
| Remaining | Average | Average | |||||||||||||||||
| Number | Contractual | Exercise | Number | Exercise | |||||||||||||||
| Range of Exercise Prices | Outstanding | Life | Price | Exercisable | Price | ||||||||||||||
| (in thousands, except prices per share) | |||||||||||||||||||
| $4.53 to $11.91 | 1,397 | 3.71 | $ | 10.72 | 1,397 | $ | 10.72 | ||||||||||||
| $12.31 to $16.19 | 1,258 | 4.27 | $ | 15.07 | 1,193 | $ | 15.12 | ||||||||||||
| $16.20 to $23.92 | 1,453 | 8.48 | $ | 23.34 | 325 | $ | 23.13 | ||||||||||||
| $24.04 to $27.01 | 1,309 | 5.16 | $ | 25.53 | 1,224 | $ | 25.54 | ||||||||||||
| $27.10 to $28.50 | 560 | 6.97 | $ | 28.09 | 391 | $ | 28.06 | ||||||||||||
| $4.53 to $28.50 | 5,977 | 5.61 | $ | 19.57 | 4,530 | $ | 18.27 | ||||||||||||
| Options Outstanding | Options Exercisable | ||||||||||||||||||||||
|---|---|---|---|---|---|---|---|---|---|---|---|---|---|---|---|---|---|---|---|---|---|---|---|
| Range of Exercise Prices | Shares | Weighted- Average Remaining Contractual Life | Weighted- Average Exercise Price | Shares | Weighted- Average Exercise Price | ||||||||||||||||||
| (in thousands, except prices per share) | |||||||||||||||||||||||
| $ 4.53 to $10.75 | 1,230 | 7.7 | $ | 9.85 | 483 | $ | 9.25 | ||||||||||||||||
| $10.78 to $15.75 | 1,529 | 5.9 | 12.53 | 1,487 | 12.51 | ||||||||||||||||||
| $15.85 to $21.88 | 1,318 | 7.0 | 16.55 | 772 | 16.70 | ||||||||||||||||||
| $22.19 to $28.13 | 1,832 | 6.7 | 24.84 | 699 | 24.09 | ||||||||||||||||||
| $ 4.53 to $28.13 | 5,909 | 6.8 | $ | 16.69 | 3,441 | $ | 15.34 | ||||||||||||||||
59
Changes in the Company’s nonvested options at February 2, 2008 are summarized as follows:
| Weighted- | |||||||
| Average Grant - | |||||||
| Number of | Date Fair Value | ||||||
| Shares | per Share | ||||||
| (in thousands) | |||||||
| Nonvested at February 4, 2007 | 1,593 | $ | 25.33 | ||||
| Granted | 778 | 22.38 | |||||
| Vested | (549 | ) | 26.51 | ||||
| Expired or Cancelled | (375 | ) | 23.99 | ||||
| Nonvested at February 2, 2008 | 1,447 | 23.65 | |||||
As of February 2, 2008, there was $2.6 million of total unrecognized compensation cost related to nonvested stock options, which is expected to be recognized over a weighted-average period of 1 year.
Restricted Shares and Units
Restricted shares of the Company’s common stock may be awarded to certain officers and key employees of the Company. There were 330,000, 845,000 and 90,000 restricted shares of common stock granted in 2004, 2003 and 2002, respectively. In 2004, 72,005 restricted stock units were granted to certainFor executives located outside of the United States; eachStates, the Company issues restricted stock units. Each restricted stock unit represents the right to receive one share of the Company’s common stock, provided that the vesting conditions are satisfied. TheIn 2007, 2006 and 2005, there were 90,000, 20,000 and 50,870 restricted stock units outstanding, respectively. Compensation expense is recognized using the fair market values of the shares and unitsvalue at the date of grant amounted to $10.2 million in 2004, $9.8 million in 2003 and $1.3 million in 2002. The market values are recorded within shareholders’ equity and areis amortized as compensation expense over the related vesting periods.period, provided the recipient continues to be employed by the Company. These awards fully vest after the passage of a restriction period,time, generally three years, except for certain grants in 2004 and 2003. The Company granted 75,000 sharesyears. Restricted stock is considered outstanding at the time of grant, as the holders of restricted stock in 2004,are entitled to receive dividends and have voting rights.
Restricted shares and units activity for the years-ended February 2, 2008, February 3, 2007, and January 28, 2006 is summarized as follows:
| Number of Shares and Units | |||||||||||
| 2007 | 2006 | 2005 | |||||||||
| (in thousands) | |||||||||||
| Outstanding at beginning of the year | 537 | 1,041 | 1,177 | ||||||||
| Granted | 583 | 157 | 245 | ||||||||
| Vested | (285 | ) | (600 | ) | (205 | ) | |||||
| Cancelled or forfeited | (25 | ) | (61 | ) | (176 | ) | |||||
| Outstanding at end of year | 810 | 537 | 1,041 | ||||||||
| Aggregate value (in millions) | $ | 19.0 | $ | 13.6 | $ | 18.0 | |||||
| Weighted average remaining contractual life | 1.77 years | 0.93 years | 0.69 years | ||||||||
The weighted average grant-date fair value per share was $22.95, $24.08 and $26.55 for 2007, 2006 and 2005, respectively. The total value of awards for which vest over 13 monthsrestrictions lapsed during the year-ended February 2, 2008, February 3, 2007 and in 2003 granted 200,000 sharesJanuary 28, 2006 was $7.3 million, $6.7 million and $4.0 million, respectively. As of February 2, 2008, there was $9.8 million of total unrecognized compensation cost, related to nonvested restricted stock that vested 50 percent one year following the date of grant and 50 percent will vest two years from the date of grant. During 2004, 2003 and 2002, respectively, 30,000, 80,000 and 60,000 restricted shares were forfeited. The deferred compensation balance, reflected as a reduction to shareholders’ equity, was $9.0 million, $7.1 million and $2.4 million as of January 29, 2005, January 31, 2004 and February 1, 2003, respectively.awards. The Company recorded compensation expense related to restricted shares, net of forfeitures, of $8.0$5.6 million in 2004, $4.12007, $4.0 million in 20032006 and $1.9$6.1 million in 2002.
52
24. Legal Proceedings
60
nonexempt, unpaid overtime, meal and rest breaks, and uniforms. Management does not believe that the outcome of such proceedings willwould have a material adverse effect on the Company’s consolidated financial position, liquidity, or results of operations.
In connection with the sale of various businesses and assets, the Company may be obligated for certain lease commitments transferred to third parties and pursuant to certain normal representations, warranties, or indemnifications entered into with the purchasers of such businesses or assets. Although the maximum potential amounts for such obligations cannot be readily determined, management believes that the resolution of such contingencies will not have a material effect on the Company’s consolidated financial position, liquidity, or results of operations. The Company is also operating certain stores and making rental payments for which lease agreements are in the process of being negotiated with landlords. Although there is no contractual commitment to make these payments, it is likely that a lease will be executed.
Foot Locker, Inc. common stock is listed on The New York Stock Exchange as well as on the böerse-stuttgart stock exchange in Germany and the Elektronische Börse Schweiz (EBS) stock exchange in Switzerland. In addition, the stock is traded on the Cincinnati stock exchange. Effective March 31, 2003, the ticker symbol for the Company’s common stock was changed to “FL” from “Z.”
| 2007 | 2006 | ||||||||
| High | Low | High | Low | ||||||
| Common Stock | |||||||||
| Quarter | |||||||||
| 1stQ | $24.78 | $21.28 | $ | 24.39 | $ | 22.26 | |||
| 2ndQ | 24.15 | 17.00 | 28.00 | 21.50 | |||||
| 3rdQ | 17.60 | 13.70 | 27.80 | 22.34 | |||||
| 4thQ | 15.14 | 9.05 | 24.92 | 21.10 | |||||
| 2004 | 2003 | ||||||||||||||||||
|---|---|---|---|---|---|---|---|---|---|---|---|---|---|---|---|---|---|---|---|
| High | Low | High | Low | ||||||||||||||||
Common Stock | |||||||||||||||||||
Quarter | |||||||||||||||||||
1st Q | $ | 27.59 | $ | 21.75 | $ | 11.40 | $ | 9.28 | |||||||||||
2nd Q | 25.03 | 19.97 | 15.20 | 10.10 | |||||||||||||||
3rd Q | 24.80 | �� | 19.98 | 18.20 | 13.85 | ||||||||||||||
4th Q | 27.26 | 22.75 | 25.97 | 18.01 | |||||||||||||||
53
61
27. Quarterly Results (Unaudited)
| 1stQ | 2ndQ | 3rdQ | 4thQ | Year | ||||||||||
| (in millions, except per share amounts) | ||||||||||||||
| Sales | ||||||||||||||
| 2007 | $ | 1,316 | 1,283 | 1,356 | 1,482 | 5,437 | ||||||||
| 2006(a) | 1,365 | 1,303 | 1,430 | 1,652 | 5,750 | |||||||||
| Gross margin(b) | ||||||||||||||
| 2007 | $ | 360 | 302 | 381 | 377 | 1,420 | ||||||||
| 2006(a) | 419 | 361 | 422 | 534 | 1,736 | |||||||||
| Operating profit (loss)(c) | ||||||||||||||
| 2007 | $ | 27 | (28 | ) | (58 | ) | 9 | (d) | (50 | ) | ||||
| 2006(a) | 93 | 27 | 94 | 167 | 381 | |||||||||
| Income (loss) from continuing operations | ||||||||||||||
| 2007 | $ | 17 | (18 | ) | (34 | ) | 84 | (e) | 49 | |||||
| 2006(a) | 58 | 14 | 65 | 110 | 247 | |||||||||
| Net income (loss) | ||||||||||||||
| 2007 | $ | 17 | (18 | ) | (33 | ) | 85 | 51 | ||||||
| 2006(a) | 59 | 14 | 65 | 113 | 251 | |||||||||
| Basic earnings (loss) per share: | ||||||||||||||
| 2007 | ||||||||||||||
| Income (loss) from continuing operations | $ | 0.11 | (0.12 | ) | (0.22 | ) | 0.54 | 0.32 | ||||||
| Income from discontinued operations | — | — | — | 0.01 | 0.01 | |||||||||
| Net income (loss) | 0.11 | (0.12 | ) | (0.22 | ) | 0.55 | 0.33 | |||||||
| 2006(a) | ||||||||||||||
| Income from continuing operations | $ | 0.37 | 0.09 | 0.42 | 0.71 | 1.59 | ||||||||
| Income from discontinued operations | — | — | — | 0.02 | 0.02 | |||||||||
| Cumulative effect of accounting change | 0.01 | — | — | — | 0.01 | |||||||||
| Net income | 0.38 | 0.09 | 0.42 | 0.73 | 1.62 | |||||||||
| Diluted earnings (loss) per share: | ||||||||||||||
| 2007 | ||||||||||||||
| Income (loss) from continuing operations | $ | 0.11 | (0.12 | ) | (0.22 | ) | 0.54 | 0.32 | ||||||
| Income from discontinued operations | — | — | — | 0.01 | 0.01 | |||||||||
| Net income (loss) | 0.11 | (0.12 | ) | (0.22 | ) | 0.55 | 0.33 | |||||||
| 2006(a) | ||||||||||||||
| Income from continuing operations | $ | 0.37 | 0.09 | 0.42 | 0.70 | 1.58 | ||||||||
| Income from discontinued operations | — | — | — | 0.02 | 0.02 | |||||||||
| Cumulative effect of accounting change | 0.01 | — | — | — | — | |||||||||
| Net income | 0.38 | 0.09 | 0.42 | 0.72 | 1.60 | |||||||||
| 1st Q | 2nd Q | 3rd Q | 4th Q | Year | |||||||||||||||||||
|---|---|---|---|---|---|---|---|---|---|---|---|---|---|---|---|---|---|---|---|---|---|---|---|
| (in millions, except per share amounts) | |||||||||||||||||||||||
| Sales | |||||||||||||||||||||||
| 2004 | $ | 1,186 | 1,268 | 1,366 | 1,535 | 5,355 | |||||||||||||||||
| 2003 | 1,128 | 1,123 | 1,194 | 1,334 | 4,779 | ||||||||||||||||||
Gross margin(a) | |||||||||||||||||||||||
| 2004 | $ | 361 | 369 | 426 | 477 | 1,633 | |||||||||||||||||
| 2003 | 346 | 332 | 390 | 414 | 1,482 | ||||||||||||||||||
Operating profit(b) | |||||||||||||||||||||||
| 2004 | $ | 78 | 61 | 117 | 133 | 389 | |||||||||||||||||
| 2003 | 67 | 59 | 102 | 114 | 342 | ||||||||||||||||||
| Income from continuing operations | |||||||||||||||||||||||
| 2004 | $ | 47 | 45 | 74 | 89 | 255 | |||||||||||||||||
| 2003 | 39 | 37 | 62 | 71 | 209 | ||||||||||||||||||
| Net income | |||||||||||||||||||||||
| 2004 | $ | 48 | 82 | 74 | 89 | 293 | |||||||||||||||||
| 2003 | 38 | 36 | 62 | 71 | 207 | ||||||||||||||||||
| Basic earnings per share: | |||||||||||||||||||||||
| 2004 | |||||||||||||||||||||||
| Income from continuing operations | $ | 0.33 | 0.30 | 0.47 | 0.58 | 1.69 | |||||||||||||||||
| Income from discontinued operations | — | 0.25 | — | — | 0.25 | ||||||||||||||||||
| Net income | 0.33 | 0.55 | 0.47 | 0.58 | 1.94 | ||||||||||||||||||
| 2003 | |||||||||||||||||||||||
| Income from continuing operations | $ | 0.28 | 0.26 | 0.43 | 0.50 | 1.47 | |||||||||||||||||
| Loss from discontinued operations | — | (0.01 | ) | — | — | (0.01 | ) | ||||||||||||||||
Cumulative effect of accounting change(c) | (0.01 | ) | — | — | — | — | |||||||||||||||||
| Net income | 0.27 | 0.25 | 0.43 | 0.50 | 1.46 | ||||||||||||||||||
| Diluted earnings per share: | |||||||||||||||||||||||
| 2004 | |||||||||||||||||||||||
| Income from continuing operations | $ | 0.31 | 0.29 | 0.47 | 0.57 | 1.64 | |||||||||||||||||
| Income from discontinued operations | — | 0.24 | — | — | 0.24 | ||||||||||||||||||
| Net income | 0.31 | 0.53 | 0.47 | 0.57 | 1.88 | ||||||||||||||||||
| 2003 | |||||||||||||||||||||||
| Income from continuing operations | $ | 0.27 | 0.25 | 0.41 | 0.47 | 1.40 | |||||||||||||||||
| Loss from discontinued operations | — | (0.01 | ) | — | — | (0.01 | ) | ||||||||||||||||
Cumulative effect of accounting change(c) | (0.01 | ) | — | — | — | — | |||||||||||||||||
| Net income | 0.26 | 0.24 | 0.41 | 0.47 | 1.39 | ||||||||||||||||||
| (a) | The fourth quarter of 2006 represents the 14 weeks ended February 3, 2007. | |
| (b) | Gross margin represents sales less cost of sales. | |
| (c) | Operating profit (loss) represents income (loss) from continuing operations before income taxes, interest expense, net and non-operating income. | |
| (d) | ||
| (e) | Net income includes an income tax benefit of $65 million representing a reduction of a Canadian income tax valuation allowance primarily related to income tax deductions that the Company now expects will be utilized. | |
54
62
FIVE YEARFIVE-YEAR SUMMARY OF SELECTED FINANCIAL DATA
| 2004 | 2003 | 2002 | 2001 | 2000 | ||||||||||||||||||
|---|---|---|---|---|---|---|---|---|---|---|---|---|---|---|---|---|---|---|---|---|---|---|
| ($ in millions, except per share amounts) | | | | | | |||||||||||||||||
Summary of Continuing Operations | ||||||||||||||||||||||
| Sales | $ | 5,355 | 4,779 | 4,509 | 4,379 | 4,356 | ||||||||||||||||
Gross margin(1) | 1,633 | 1,482 | 1,348 | 1,312 | 1,312 | |||||||||||||||||
| Selling, general and administrative expenses | 1,088 | 987 | 928 | 923 | 975 | |||||||||||||||||
| Restructuring charges (income) | 2 | 1 | (2 | ) | 34 | 1 | ||||||||||||||||
Depreciation and amortization(1) | 154 | 152 | 153 | 158 | 154 | |||||||||||||||||
| Interest expense, net | 15 | 18 | 26 | 24 | 22 | |||||||||||||||||
| Other (income) expense | — | — | (3 | ) | (2 | ) | (16 | ) | ||||||||||||||
| Income from continuing operations | 255 | 209 | 162 | 111 | (3) | 107 | (3) | |||||||||||||||
Cumulative effect of accounting change(2) | — | (1 | ) | — | — | (1 | ) | |||||||||||||||
| Basic earnings per share from continuing operations | 1.69 | 1.47 | 1.15 | 0.79 | (3) | 0.78 | (3) | |||||||||||||||
| Basic earnings per share from cumulative effect of accounting change | — | — | — | — | (0.01 | ) | ||||||||||||||||
| Diluted earnings per share from continuing operations | 1.64 | 1.40 | 1.10 | 0.77 | (3) | 0.77 | (3) | |||||||||||||||
| Diluted earnings per share from cumulative effect of accounting change | — | — | — | — | (0.01 | ) | ||||||||||||||||
| Common stock dividends declared | 0.26 | 0.15 | 0.03 | — | — | |||||||||||||||||
| Weighted-average common shares outstanding (in millions) | 150.9 | 141.6 | 140.7 | 139.4 | 137.9 | |||||||||||||||||
| Weighted-average common shares outstanding assuming dilution (in millions) | 157.1 | 152.9 | 150.8 | 146.9 | 139.1 | |||||||||||||||||
Financial Condition | ||||||||||||||||||||||
| Cash, cash equivalents and short-term investments | $ | 492 | 448 | 357 | 215 | 109 | ||||||||||||||||
| Merchandise inventories | 1,151 | 920 | 835 | 793 | 730 | |||||||||||||||||
Property and equipment, net(4) | 715 | 668 | 664 | 665 | 712 | |||||||||||||||||
Total assets(4) | 3,237 | 2,713 | 2,514 | 2,328 | 2,306 | |||||||||||||||||
| Short-term debt | — | — | — | — | — | |||||||||||||||||
| Long-term debt and obligations under capital leases | 365 | 335 | 357 | 399 | 313 | |||||||||||||||||
| Total shareholders’ equity | 1,830 | 1,375 | 1,110 | 992 | 1,013 | |||||||||||||||||
Financial Ratios | ||||||||||||||||||||||
| Return on equity (ROE) | 15.9 | % | 16.8 | 15.4 | 11.1 | 10.0 | ||||||||||||||||
| Operating profit margin | 7.3 | % | 7.2 | 6.0 | 4.5 | 4.2 | ||||||||||||||||
| Income from continuing operations as a percentage of sales | 4.8 | % | 4.4 | 3.6 | 2.5 | (3) | 2.5 | (3) | ||||||||||||||
Net debt capitalization percent(5) | 50.4 | % | 53.3 | 58.6 | 61.1 | 60.9 | ||||||||||||||||
Net debt capitalization percent (without present value of operating leases)(5) | — | — | — | 15.6 | 16.8 | |||||||||||||||||
| Current ratio | 2.7 | 2.8 | 2.2 | 2.0 | 1.5 | |||||||||||||||||
Other Data | ||||||||||||||||||||||
| Capital expenditures | $ | 156 | 144 | 150 | 116 | 94 | ||||||||||||||||
| Number of stores at year end | 3,967 | 3,610 | 3,625 | 3,590 | 3,752 | |||||||||||||||||
| Total selling square footage at year end (in millions) | 8.89 | 7.92 | 8.04 | 7.94 | 8.09 | |||||||||||||||||
| Total gross square footage at year end (in millions) | 14.78 | 13.14 | 13.22 | 13.14 | 13.32 | |||||||||||||||||
| 2007 | 2006(1) | 2005 | 2004 | 2003 | |||||||||||
| ($ in millions, except per share amounts) | |||||||||||||||
| Summary of Continuing Operations | |||||||||||||||
| Sales | $ | 5,437 | 5,750 | 5,653 | 5,355 | 4,779 | |||||||||
| Gross margin(2) | 1,420 | 1,736 | 1,709 | 1,633 | 1,482 | ||||||||||
| Selling, general and administrative expenses | 1,176 | 1,163 | 1,129 | 1,090 | 988 | ||||||||||
| Impairment charges and store closing program costs | 128 | 17 | — | — | — | ||||||||||
| Depreciation and amortization(2) | 166 | 175 | 171 | 154 | 152 | ||||||||||
| Interest expense, net | 1 | 3 | 10 | 15 | 18 | ||||||||||
| Other income | (1 | ) | (14 | ) | (6 | ) | — | — | |||||||
| Income from continuing operations | 49 | 247 | 263 | 255 | 209 | ||||||||||
| Cumulative effect of accounting change(3) | — | 1 | — | — | (1 | ) | |||||||||
| Basic earnings per share from continuing operations | 0.32 | 1.59 | 1.70 | 1.69 | 1.47 | ||||||||||
| Basic earnings per share from cumulative effect of accounting change | — | 0.01 | — | — | — | ||||||||||
| Diluted earnings per share from continuing operations | 0.32 | 1.58 | 1.67 | 1.64 | 1.40 | ||||||||||
| Diluted earnings per share from cumulative effect of accounting change | — | — | — | — | — | ||||||||||
| Common stock dividends declared per share | 0.50 | 0.40 | 0.32 | 0.26 | 0.15 | ||||||||||
| Weighted-average common shares outstanding (in millions) | 154.0 | 155.0 | 155.1 | 150.9 | 141.6 | ||||||||||
| Weighted-average common shares outstanding assuming dilution (in millions) | 155.6 | 156.8 | 157.6 | 157.1 | 152.9 | ||||||||||
| Financial Condition | |||||||||||||||
| Cash, cash equivalents and short-term investments | $ | 493 | 470 | 587 | 492 | 448 | |||||||||
| Merchandise inventories | 1,281 | 1,303 | 1,254 | 1,151 | 920 | ||||||||||
| Property and equipment, net(4) | 521 | 654 | 675 | 715 | 668 | ||||||||||
| Total assets(4) | 3,248 | 3,249 | 3,312 | 3,237 | 2,713 | ||||||||||
| Short-term debt | — | — | — | — | — | ||||||||||
| Long-term debt and obligations under capital leases | 221 | 234 | 326 | 365 | 335 | ||||||||||
| Total shareholders’ equity | 2,271 | 2,295 | 2,027 | 1,830 | 1,375 | ||||||||||
| Financial Ratios | |||||||||||||||
| Return on equity (ROE) | 2.1 | % | 11.5 | 13.6 | 15.9 | 16.8 | |||||||||
| Operating (loss) profit margin | (0.9 | )% | 6.6 | 7.2 | 7.3 | 7.2 | |||||||||
| Income from continuing operations as a percentage of sales | 0.9 | % | 4.3 | 4.7 | 4.8 | 4.4 | |||||||||
| Net debt capitalization percent(5) | 44.9 | % | 44.4 | 45.2 | 50.4 | 53.3 | |||||||||
| Net debt capitalization percent (without present value of operating leases)(5) | — | — | — | — | — | ||||||||||
| Current ratio | 4.1 | 3.9 | 2.8 | 2.7 | 2.8 | ||||||||||
| Other Data | |||||||||||||||
| Capital expenditures | $ | 148 | 165 | 155 | 156 | 144 | |||||||||
| Number of stores at year end | 3,785 | 3,942 | 3,921 | 3,967 | 3,610 | ||||||||||
| Total selling square footage at year end (in millions) | 8.50 | 8.74 | 8.71 | 8.89 | 7.92 | ||||||||||
| Total gross square footage at year end (in millions) | 14.12 | 14.55 | 14.48 | 14.78 | 13.14 | ||||||||||
| (1) | 2006 represents the 53 weeks ended February 3, 2007. | |
| (2) | Gross margin and depreciation expense include the effects of the reclassification of tenant allowances as deferred credits, which are amortized as a reduction of rent expense as a component of costs of sales. Gross margin was reduced by $5 million in 2004 and 2003 | |
| (3) | 2006 relates to the adoption of SFAS No. 123(R), “Share-Based Payment.” 2003 relates to adoption of SFAS No. 143, “Accounting for Asset Retirement | ||
| (4) | Property and equipment, net and total assets include the reclassification of tenant allowances as deferred credits, which were previously recorded as a reduction to the cost of property and equipment, and are now classified as part of the deferred rent liability. Property and equipment, net and total assets were increased by $22 million in 2004 and $24 million in |
| (5) | Represents total debt, net of cash, cash equivalents and short-term investments and |
55
63
There were no disagreements between the Company and its independent registered public accounting firm on matters of accounting principles or practices.
Item 9A. Controls and Procedures
| (a) | Evaluation of Disclosure Controls and Procedures. |
| The Company’s management performed an evaluation under the supervision and with the participation of the Company’s Chief Executive Officer (“CEO”) and Chief Financial Officer (“CFO”), and completed an evaluation as of February 2, 2008 of the effectiveness of the design and operation of the Company’s disclosure controls and procedures (as that term is defined in Rules 13a-15(e) and 15d-15(e) under the Securities Exchange Act of 1934, as amended (the “Exchange Act”)). Based on that evaluation, the Company’s CEO and CFO concluded that the Company’s disclosure controls and procedures were effective to ensure that information relating to the Company that is required to be disclosed in the reports that we file or submit under the Exchange Act is recorded, processed, summarized and reported, within the time periods specified in the SEC rules and form, and is accumulated and communicated to management, including the CEO and CFO, as appropriate to allow timely decisions regarding required disclosure. | |||
| (b) | Management’s Annual Report on Internal Control over Financial Reporting. | ||
| The Company’s management is responsible for establishing and maintaining adequate internal control over financial reporting (as that term is defined in Exchange Act Rules 13a-15(f) and 15d-15(f)). To evaluate the effectiveness of the Company’s internal control over financial reporting, the Company uses the framework in Internal Control-Integrated Framework issued by the Committee of Sponsoring Organizations of the Treadway Commission (the “COSO Framework”). Using the COSO Framework, the Company’s management, including the CEO and CFO, evaluated the Company’s internal control over financial reporting and concluded that the Company’s internal control over financial reporting was effective as of February 2, 2008. KPMG LLP, the independent registered public accounting firm that audits the Company’s consolidated financial statements included in this annual report, has issued an attestation report on the Company’s effectiveness of internal control over financial reporting, which is included herein under the caption “Management’s Report on Internal Control over Financial Reporting” in “Item 8. Consolidated Financial Statements and Supplementary Data.” | |||
| (c) | Attestation Report of the Independent Registered Public Accounting Firm. | ||
| KPMG’s attestation report on the effectiveness of our internal control over financial reporting is included in “Item 8. Consolidated Financial Statements and Supplementary Data.” | |||
| (d) | Changes in Internal Control over Financial Reporting. | ||
| During the Company’s last fiscal quarter there were no changes in internal control over financial reporting that materially affected, or is reasonably likely to materially affect, the Company’s internal control over financial reporting. | |||
None.
64
PART III
Item 10. Directors, Executive Officers and Corporate Governance
| (a) | Directors of the Company | ||
| Information relative to directors of the Company is set forth under the section captioned “Proposal 1- Election of Directors” in the Proxy Statement and is incorporated herein by reference. | ||||
| (b) | Executive Officers of the Company | |||
| Information with respect to executive officers of the Company is set forth immediately following Item 4 in Part I. | ||||
| (c) | Information with respect to compliance with Section 16(a) of the Securities Exchange Act of 1934 is set forth under the section captioned “Section 16(a) Beneficial Ownership Reporting Compliance” in the Proxy Statement and is incorporated herein by reference. | |||
| (d) | Information on our audit committee and the audit committee financial expert is contained in the Proxy Statement under the section captioned “Committees of the Board of Directors” and is incorporated herein by reference. | |||
| (e) | Information about the Code of Business Conduct governing our employees, including our Chief Executive Officer, Chief Financial Officer, Chief Accounting Officer, and the Board of Directors, is set forth under the heading “Code of Business Conduct” under the Corporate Governance Information section of the Proxy Statement and is incorporated herein by reference. | |||
56
Item 11. Executive Compensation
Information set forth in the Proxy Statement under the sections captioned “Equity Compensation Plan Information” and “Beneficial Ownership of the Company’s Stock” is incorporated herein by reference.
Information set forth in the Proxy Statement under the section captioned “Transactions with Management“Related Person Transactions” and Others”under the section captioned “Directors’ Independence” is incorporated herein by reference.
Information about the principal accountant fees and services is set forth under the section captioned “Audit and Non-Audit Fees” in the Proxy Statement and is incorporated herein by reference. Information about the Audit Committee’s pre-approval policies and procedures is set forth in the section captioned “Audit Committee Pre-Approval Policies and Procedures” in the Proxy Statement and is incorporated herein by reference.
65
PART IV
Item 15. Exhibits and Financial Statement Schedules
| (a)(1)(a)(2) Financial Statements | ||
The list of financial statements required by this item is set forth in Item 8. “Consolidated Financial Statements and | ||
| (a)(3) and (c) Exhibits | ||
An index of the exhibits which are required by this item and which are included or incorporated herein by reference in this report appears on pages 68 through 71. The exhibits filed with this report immediately follow the index. | ||
57
66
SIGNATURES
FOOT LOCKER, INC. |
By: |
| Matthew D. Serra |
| Chairman of the Board, President and |
| Chief Executive Officer |
Date: March 31, 2008 |

Pursuant to the requirements of the Securities Exchange Act of 1934, this report has been signed below on March 28, 2005,31, 2008, by the following persons on behalf of the Company and in the capacities indicated.
 |  | |||||||||
| Matthew D. Serra | Robert W. McHugh | |||||||||
| Chairman of the Board, | Senior Vice President and | |||||||||
| President and | Chief Financial Officer | |||||||||
| Chief Executive Officer | | |||||||||
/s/ GIOVANNA CIPRIANO | /s/ JAMES E. PRESTON | |||||||||
| Giovanna Cipriano | James E. Preston | |||||||||
| Vice President and Chief Accounting Officer | Director | |||||||||
/s/ NICHOLAS DIPAOLO | /s/ DAVID Y. SCHWARTZ | |||||||||
| Nicholas DiPaolo | David Y. Schwartz | |||||||||
| Director | Director | |||||||||
/s/ ALAN D. FELDMAN | /s/ CHRISTOPHER A. SINCLAIR | |||||||||
| Alan D. Feldman | Christopher A. Sinclair | |||||||||
| Director | Director | |||||||||
/s/ JAROBIN GILBERT JR. | /s/ CHERYL NIDO TURPIN | |||||||||
| Jarobin Gilbert Jr. | Cheryl Nido Turpin | |||||||||
| Director | Director | |||||||||
/s/ MATTHEW M. MCKENNA | /s/ DONA D. YOUNG | |||||||||
| Matthew M. McKenna | Dona D. Young | |||||||||
| Director | Director | |||||||||
5867
FOOT LOCKER, INC.
INDEX OF EXHIBITS REQUIRED
BY ITEM 15 OF FORM 10-K
AND FURNISHED IN ACCORDANCE
WITH ITEM 601 OF REGULATION S-K
| Exhibit No. | ||||||||
| in Item 601 of | ||||||||
| Regulation S-K | Description | |||||||
| 3(i)(a) | Certificate of Incorporation of the Registrant, as filed by the Department of State of the State of New York on April 7, 1989 (incorporated herein by reference to Exhibit 3(i)(a) to the Quarterly Report on Form 10-Q for the quarterly period ended July 26, 1997, filed by the Registrant with the SEC on September 4, 1997 (the “July 26, 1997 Form 10-Q”)). | |||||||
| 3(i)(b) | Certificates of Amendment of the Certificate of Incorporation of the Registrant, as filed by the Department of State of the State of New York on (a) July 20, 1989, (b) July 24, 1990, (c) July 9, 1997 (incorporated herein by reference to Exhibit 3(i)(b) to the July 26, 1997 Form 10-Q), (d) June 11, 1998 (incorporated herein by reference to Exhibit 4.2(a) of the Registration Statement on Form S-8 (Registration No. 333-62425), and (e) November 1, 2001 (incorporated herein by reference to Exhibit 4.2 to the Registration Statement on Form S-8 (Registration No. 333-74688) previously filed by the Registrant with the SEC). | |||||||
| 3(ii) | By-laws of the Registrant, as amended (incorporated herein by reference to Exhibit 10.1 to the | |||||||
| 4.1 | The rights of holders of the Registrant’s equity securities are defined in the Registrant’s Certificate of Incorporation, as amended (incorporated herein by reference to (a) Exhibits 3(i)(a) and 3(i)(b) to the July 26, 1997 Form 10-Q, Exhibit 4.2(a) to the Registration Statement on Form S-8 (Registration No. 333-62425) previously filed by the Registrant with the SEC, and Exhibit 4.2 to the Registration Statement on Form S-8 (Registration No. 333-74688) previously filed by the Registrant with the SEC). | |||||||
| 4.2 | Indenture dated as of October 10, 1991 (incorporated herein by reference to Exhibit 4.1 to the Registration Statement on Form S-3 (Registration No. 33-43334) previously filed by the Registrant with the SEC). | |||||||
| 4.3 | Form of | |||||||
| 10.1 | ||||||||
| 10.2 | ||||||||
| Foot Locker 1998 Stock Option and Award Plan (incorporated herein by reference to Exhibit 10.4 to the Registrant’s Annual Report on Form 10-K for the year ended January 31, 1998, filed by the Registrant with the SEC on April 21, | ||||||||
59
| 10.3 | Amendment to the Foot Locker 1998 Stock Option and Award Plan (incorporated herein by reference to Exhibit 10.2 to the Registrant’s Quarterly Report on Form 10-Q for the period ended July 29, 2000, filed by the Registrant with the SEC on September 7, 2000 (the “July 29, 2000 Form 10-Q”)). | ||||||||
| 10.4 | Executive Supplemental Retirement Plan (incorporated herein by reference to Exhibit 10(d) to the Registration Statement on Form 8-B filed by the Registrant with the SEC on August 7, 1989 (Registration No. 1-10299) (the “8-B Registration Statement”)). | ||||||||
| Amendment to the Executive Supplemental Retirement Plan (incorporated herein by reference to Exhibit 10(c)(i) to the 1994 Form 10-K ). | |||||||||
68
| Exhibit No. | ||||
| Regulation S-K | Description | |||
| 10.6 | Amendment to the Executive Supplemental Retirement Plan (incorporated herein by reference to Exhibit 10(d)(ii) to the | |||
| 10.7 | Supplemental Executive Retirement Plan, as Amended and Restated (incorporated herein by reference to Exhibit | |||
| 10.8 | Long-Term Incentive Compensation Plan, as amended and restated (incorporated herein by reference to Exhibit 10(f) to the Registrant’s 1995 Form 10-K). | |||
| 10.9 | Annual Incentive Compensation Plan, as amended (incorporated herein by reference to Exhibit 10.3 to the Quarterly Report on Form 10-Q for the quarterly period ended August 2, 2003 filed by the Registrant with the SEC on September 15, 2003 (the “August 2, 2003 Form 10-Q”)). | |||
| 10.10 | Form of indemnification agreement, as amended (incorporated herein by reference to Exhibit 10(g) to the 8-B Registration Statement). | |||
| 10.11 | Amendment to form of indemnification agreement (incorporated herein by reference to Exhibit 10.5 to the Quarterly Report on Form 10-Q for the quarterly period ended May 5, 2001 filed by the Registrant with the SEC on June 13, 2001 (the “May 5, 2001 Form 10-Q”)). | |||
| 10.12 | Foot Locker Voluntary Deferred Compensation Plan (incorporated herein by reference to Exhibit 10(i) to the 1995 Form 10-K). | |||
| 10.13 | Foot Locker Directors Stock Option Plan (incorporated herein by reference to Exhibit 10.1 to the July 29, 2000 Form 10-Q). | |||
| 10.14 | Trust Agreement dated as of November 12, 1987 (“Trust Agreement”), between F.W. Woolworth Co. and The Bank of New York, as amended and assumed by the Registrant (incorporated herein by reference to Exhibit 10(j) to the 8-B Registration Statement). | |||
| 10.15 | Amendment to Trust Agreement made as of April 11, 2001 (incorporated herein by reference to Exhibit 10.4 to May 5, 2001 Form 10-Q). | |||
| 10.16 | Foot Locker Directors’ Retirement Plan, as amended (incorporated herein by reference to Exhibit 10(k) to the 8-B Registration Statement). | |||
| 10.17 | Amendments to the Foot Locker Directors’ Retirement Plan (incorporated herein by reference to Exhibit 10(c) to the Registrant’s Quarterly Report on Form 10-Q for the period ended October 28, 1995, filed by the Registrant with the SEC on December 11, | |||
| 10.18 | Employment Agreement with Matthew D. Serra dated as of | |||
60
| Amendment of Restricted Stock Agreement | |||||||||
| 10.20 | Amendments to the Credit Agreement (incorporated herein by reference to Exhibits 10.1 to the Current Reports on Form | ||||||||
| 10.21 | Restricted Stock Agreement with Matthew D. Serra dated as of February 9, 2005 (incorporated herein by reference to Exhibit 10.2 to the February 9, 2005 Form 8-K). | ||||||||
69
| in Item 601 of | ||||||
| Description | ||||||
| 10.23 | Form of Executive Employment Agreement (incorporated herein by reference to Exhibit 10.24 to the 1999 Form 10-K). | |||||
| 10.24 | Foot Locker, Inc. Excess Cash Balance Plan (incorporated herein by reference to Exhibit 10(c) to the 1995 Form 10-K). | |||||
| 10.25 | Form of Restricted Stock Agreement (incorporated herein by reference to Exhibit 10.30 to the | |||||
| 10.26 | Fifth Amended and Restated Credit Agreement dated as of April 9, 1997, amended and restated as of May 19, 2004 (“Credit Agreement”) (incorporated herein by reference to Exhibit 10.1 to the Quarterly Report on Form 10-Q for the period ended July 31, 2004, filed by the Registrant with the SEC on September 8, | |||||
| Amendment No. 1 to the Credit Agreement (incorporated herein by reference to Exhibit 10.1 to the Form 8-K filed dated May 17, 2005 on May 18, 2005). | ||||||
| 10.28 | Letter of Credit Agreement dated as of March 19, 1999 (incorporated herein by reference to Exhibit 10.35 to the 1998 Form 10-K). | |||||
| 10.29 | Foot Locker 2002 Directors Stock Plan, as amended (incorporated herein by reference to Exhibit 10.1 to the Current Report on Form 8-K dated February | |||||
| 10.30 | Foot Locker 2003 Stock Option and Award Plan (incorporated herein by reference to Exhibit 10.2 to the August 2, 2003 Form 10-Q). | |||||
| 10.31 | Automobile Expense Reimbursement Program for Senior Executives (incorporated herein by reference to Exhibit 10.36 to the Annual Report on Form 10-K for the year ended January 29, 2005 filed by the Registrant on March 29, 2005 (the “2004 Form 10-K”). | |||||
| 10.32 | Executive Medical Expense Allowance Program for Senior Executives (incorporated herein by reference to Exhibit 10.37 to the 2004 Form 10-K). | |||||
| 10.33 | Financial Planning Allowance Program for Senior Executives (incorporated herein by reference to Exhibit 10.38 to the 2004 Form 10-K). | |||||
| 10.34 | Form of Nonstatutory Stock Option Award Agreement for Executive Officers | |||||
61
| (incorporated herein by reference to Exhibit | ||||||
|---|---|---|---|---|---|---|
| 10.5 | Form of Incentive Stock Option Award Agreement for Executive Officers (incorporated herein by reference to Exhibit 10.41 to the 2005 Form 10-K). | |||||
| 10.36 | Form of Nonstatutory Stock Option Award Agreement for Non-employee Directors (incorporated herein by reference to Exhibit 10.2 to the July 31, 2004 Form 10-Q). | |||||
| 10.37 | Long-term Disability Program for Senior Executives (incorporated herein by reference to Exhibit 10.42 to the 2004 Form 10-K). | |||||
| Amendment to the Credit Agreement (incorporated herein by reference to Exhibit 10.1 to the Registrant’s Current Report on Form 8-K dated October 26, 2007 filed by the Registrant with the SEC on October 31, 2007). | ||||||
| 10.39 | Amendment to the Credit Agreement (incorporated herein by reference to Exhibit 10.1 to the Registrant’s Current Report on Form 8-K dated February 19, 2008 filed by the Registrant with the SEC on February 21, 2008). | |||||
| 10.40 | Foot Locker 2007 Stock Incentive Plan (incorporated herein by reference to Exhibit 10.1 to the Registrant’s Current Report on Form 8-K dated May 30, 2007 filed by the Registrant with the SEC on June 5, 2007). | |||||
70
| Exhibit No. | ||||||
| in Item 601 of | ||||||
| Regulation S-K | Description | |||||
| 12 | Computation of Ratio of Earnings to Fixed Charges.* | |||||
| 21 | Subsidiaries of the Registrant.* | |||||
| 23 | Consent of Independent Registered Public Accounting Firm.* | |||||
| 31.1 | Certification of Chief Executive Officer Pursuant to Section 302 of the Sarbanes-Oxley Act of 2002.* | |||||
| 31.2 | Certification of Chief Financial Officer Pursuant to Section 302 of the Sarbanes-Oxley Act of 2002.* | |||||
| 32 | Certification of Chief Executive Officer and Chief Financial Officer Pursuant to 18 U.S.C. Section 1350, as adopted pursuant to Section 906 of the Sarbanes-Oxley Act of 2002.* | |||||
62
Exhibits filed with this Form 10-K:
| Exhibits filed with this Form | ||||||
63
71