ENTERPRISE FINANCIAL SERVICES CORP20052006 ANNUAL REPORT ON FORM 10-K
|
| Page | |
|
| ||
|
| ||
|
|
| |
Item 1: | 1 | ||
|
|
| |
Item 1A: | 6 | ||
|
|
| |
Item 1B: | 8 | ||
|
|
| |
Item 2: | 8 | ||
|
|
| |
Item 3: | 8 | ||
|
|
| |
Item 4: | 8 | ||
|
|
| |
|
| ||
|
|
| |
Item 5: | 9 | ||
|
|
| |
Item 6: |
| 11 | |
|
|
| |
Item 7: | Management’s Discussion and Analysis of Financial Condition and Results of Operations |
| 12 |
|
|
| |
Item 7A: | 36 | ||
|
|
| |
Item 8: | 36 | ||
|
|
| |
Item 9: | Changes in and Disagreements with Accountants on Accounting and Financial Disclosure | 36 | |
|
|
| |
Item 9A: | 36 | ||
|
|
| |
Item 9B: | 36 | ||
|
|
| |
|
| ||
|
|
| |
Item 10: | Directors, | 37 | |
|
|
| |
Item 11: | 37 | ||
|
|
| |
Item 12: | Security Ownership of Certain Beneficial Owners and Management and Related Stockholder Matters | 37 | |
|
|
| |
Item 13: | Certain Relationships and Related | 37 | |
|
|
| |
Item 14: | 37 | ||
|
|
| |
|
| ||
|
|
| |
Item 15: |
| 37 | |
|
|
| |
| Management’s Report on Internal Control over Financial Reporting |
| 38 |
|
|
| |
|
| 39 | |
|
|
| |
|
| 41 | |
|
|
| |
| 74 | ||
|
|
| |
| 75 | ||
Safe Harbor Statement Under the Private Securities Litigation Reform Act of 1995
Readers should note that in addition to the historical information contained herein, some of the information in this report contains forward-looking statements within the meaning of the federal securities laws. Forward-looking statements typically are identified with use of terms such as “may,” “will,” “expect,” “anticipate,” “estimate”“estimate,” “potential,” “could”: and similar words, although some forward-looking statements are expressed differently. You should be aware that Enterprise Financial Services Corp’sthe Company’s actual results could differ materially from those contained in the forward-looking statements due to a number of factors, including: burdens imposed by federal and state regulation, including changes in accounting regulation or standards;standards of banks,banks; credit risk; exposure to general and local economic conditions; risks associated with rapid increase or decrease in prevailing interest rates; consolidation within the banking industry; competition from banks and other financial institutions; our ability to attract and retain relationship officers and other key personnel and technological developments; all of which could cause Enterprise Financial Services Corp’sthe Company’s actual results to differ from those set forth in the forward-looking statements.
Other factors that could cause results to differ from expected results include the acquisition of Millennium, the integration of our recent acquisition of NorthStar and our recent acquisition of Clayco, all of which could result in costs and expenses that are greater, or benefits that are less, than we currently anticipate, or the assumption of unanticipated liabilities.
Readers are cautioned not to place undue reliance on our forward-looking statements, which reflect management’s analysis only as of the date of the statements. The Company does not intend to publicly revise or update forward-looking statements to reflect events or circumstances that arise after the date of this report. Readers should carefully review all disclosures we file from time to time with the Securities and Exchange Commission which are available on our website at www.enterprisebank.com.
General
Enterprise Financial Services Corp (“EFSC” or “the Company”), a Delaware corporation, is a financial holding company headquartered in St. Louis, Missouri. At December 31, 2005,2006, our wholly owned subsidiary, Enterprise Bank & Trust (“Enterprise” or “the Bank”), a Missouri chartered trust company with banking powers, was the largest publicly held bank, in asset size, headquartered in St. Louis, Missouri, with $1.3$1.5 billion in assets. Enterprise is a regional bank primarily serving the St. Louis and Kansas City metropolitan areas.
The Company’s stated mission is “to guide our clients to a lifetime of financial success.” We have established an accompanying corporate vision “to build an exceptional company that clients value, shareholders prize and where our associates flourish.” These tenets are fundamental to the Company’s business strategies and operations.
Enterprise is highly focused on serving the needs of private businesses, their owner families and other professionals. This is achieved through two primary lines of business: commercial banking and wealth management. We compete withoffer full product lines in each line of business. We believe our technology combined with the associates who deliver products and services to our clients offer meaningful advantages in product value, product selection and customer service, all of which advance our objectives of enhancing our business model, gaining market share and improving profitability.
The commercial banking line of business offers a broad range of business and personal banking services. Lending services include commercial, commercial real estate, financial and industrial development, real estate construction and development, residential real estate, and consumer loans. A wide variety of deposit products and a complete suite of treasury management services supplementcomplement our lending capabilities.
The wealth management line of business provides fee-based corporate and personal financial consulting, advisory and trust services to our target market.markets. Corporate consulting services are focused in the areas of retirement plans, management compensation and management succession planning. Personal financial consulting includes estate planning, investment management and retirement planning. On October 21,In 2005, we acquired controlling interest in Millennium Brokerage Group, LLC (“Millennium”), a life insurance advisory and brokerage operation serving life agents, banks, CPA firms, property and casualty groups and financial advisors. Millennium’s capabilities, market reach and industry presence have significantly enhancesenhanced our wealth management productbusiness line and opensopened new wholesale marketing opportunities for the Company while strengtheningexpanding our fee income sources.
Our executive offices are located at 150 North Meramec, Clayton, MO 63105 and our telephone number is (314) 725-5500.
1
Available Information
The Company’s Internet website is www.enterprisebank.com. We make available free of charge on or through our website, variousVarious reports that we file with or furnishprovided to the Securities and Exchange Commission (“SEC”), including our annual reports, quarterly reports, current reports and proxy statements.statements are available free of charge on our website. These reports are made available as soon as reasonably practicable after they are filed with or furnished to the SEC.
2006 Acquisitions
1
Acquisition
On October 13, 2005,July 5, 2006, the Company through its new wholly-owned subsidiary, Millenium Holding Company, Inc., executed a Membership Interest Purchase Agreement providing forcompleted the acquisition of Millennium. Millennium is headquarteredNorth Star Bancshares, Inc. and its wholly owned subsidiary, NorthStar Bank N.A. (“NorthStar”), a $187.5 million banking company in Nashville, Tennessee and operates life insurance advisory and brokerage operations from thirteen offices serving life agents, banks, CPA firms, property & casualty groups, and financial advisorsKansas City, MO, for $36.0 million in 49 states. The transaction is structured as a step acquisition with an initial payout of $15 million, 65% cash and 35% company stock, for 60% of Millennium’s membership interests with two subsequent payouts in years 2008 and 2010 for the remaining interests. The consideration mix betweenEFSC stock and cash for subsequent payouts are atcash. NorthStar Bancshares, Inc. was merged into Enterprise Financial Services Corp on the Company’s discretion withacquisition date. In October 2006, we successfully integrated NorthStar’s systems and accounts into Enterprise Bank & Trust’s and converted four of five NorthStar branches to Enterprise branches. One NorthStar branch was closed.
As a maximum of 70% stock. Future payouts are conditioned upon certain pre-tax income performance targets up to a maximum of $36 million, inclusiveresult of the initial $15NorthStar acquisition, at December 31, 2006 the Bank’s assets in the Kansas City market grew to approximately $400.0 million, payout. EFSC is contractually entitled to a priority return on its investment of 23.1% (pre-tax) before additional distributions to the Millennium principals. Please refer to the Form 8-K filed byoperating from six branches.
On November 22, 2006, the Company on October 13, 2005entered into a definitive agreement to acquire Kansas City-based Clayco Banc Corporation (“Clayco”) for more information. Additional information can also be found$37.0 million in Note 2 toEFSC stock and cash. Clayco is the consolidated financial statements laterparent company of the $201.9 million Great American Bank (“Great American”) with branches in this document.DeSoto, KS and Claycomo, MO. The transaction closed on October 21,February 28, 2007. We do not expect to integrate Great American into Enterprise Bank & Trust until early 2008.
With the acquisition of Clayco, assets in the Kansas City market will total approximately $600.0 million – roughly a threefold increase since year-end 2005.
See Note 2 – Acquisitions and Note 4 - Subsequent Events in this filing for more information.
Business Strategy
Business Strategy
Our general business strategy is to generate superior shareholder returns by concentrating on private businesses, their owner families and other success-minded individuals and providing comprehensive financial services through our banking and wealth management lines of business.
Key success factors in pursuing this strategy include a focused and relationship oriented direct and wholesalerelationship-oriented distribution and sales approach, emphasis on growing wealth management revenues, aggressive credit and interest rate risk management, advanced technology and tightly managed expense growth.
Building long-term client relationships – The Bank’s historical growth strategy has been both client and assetrelationship driven. The Bank continuously seeks to add clients who fit our target market of business owners and associated families. Those relationships are maintained, cultivated and expanded over time. This strategy enables the Bank to attract clients with significant and growing borrowing needs, in tandem with the Bank’s increasing capacity to fund client loan requests. The Bank’s officers are typically highly experienced and trained to establish and develop long-term relationships. As a result of its long-term relationship orientation, the Bank is able to fund loan growth primarily with core deposits from its business and professional clients. This is supplemented by borrowing from the Federal Home Loan Bank, and by issuing brokered certificates of deposits, priced at or below the Bank’s alternative cost of funds.
Growing wealth managementTrust business – Enterprise Trust, a division of the Bank, has grown to $1.4$1.6 billion in assets under administration in 7eight years by offering primarily fiduciary and financial advisory services. We staffemploy a full complement of attorneys, certified financial planners, estate planning professionals, as well as other investment professionals who offer a broad range of services for business owners and other high net worth individuals. Employing an intensive, personalized methodology, Enterprise Trust representatives assist clients in defining lifetime goals and buildingdesigning plans for achievingto achieve them. Consistent with the Company’s long-term relationship strategy, Trust representatives maintain close contact with clients ensuring follow up, discipline, and appropriate adjustments as circumstances change. The results have been excellent, as measured by client satisfaction, rapid growth, and contributions to Company earnings.
Wholesale distribution opportunities – Historically, we have distributed products and services directly to clients through local offices of the Bank. However, the application of newer technologies to the delivery of bank and trust products, coupled with the increasing trend toward consolidation of financial services, has created an opportunity for the Company to pursue a wholesale distribution strategy to complement our direct operations. In a wholesale arrangement, Enterprise distributes products and services indirectly to clients through an intermediary, such as another bank, financial services firm or financial advisor.
2
Our acquisition of Millennium is one example of how we are executing our wholesale strategy. Millennium provides life insurance products and related consulting services to other independent life insurance agents, CPA firms, banks, property & casualty insurance agents and financial advisors.
As another component of this wholesale strategy, the Company has applied to the Office of Thrift Supervision for a federal savings bank charter with trust-only authority. This charter, if approved, will allow the Company to offer its trust advisory and fiduciary services, through both direct and wholesale distribution, on a nationwide basis.
The Bank also offers selected deposit products through several existing wholesale distribution arrangements.
Capitalizing on technology – We view our technological capabilities to be a competitive advantage. Our systems provide Internet banking, expanded treasury management products, checks and document imaging, as well as a 24-hour24–hour voice response system. Other services currently offered by the Bank include controlled disbursements, repurchase agreements and sweep investment accounts. Our treasury management suite of products blends advanced technology and personal service, often creating a competitive advantage over larger, nationwide banks. Technology is also utilized extensively in internal systems, operational support functions to improve customer service, and management reporting and analysis.
Maintaining asset quality and controlling interest rate risk – OurSenior Management and the head of Credit administration monitor our asset quality is monitored through regular reviews of loans by the loan officers.loans. In addition, the loan portfolio is subject to ongoing monitoring by a loan review officer whofunction that reports directly to the audit committee of our board of directors. At December 31, 2005, our ratio of non-performing loans to total loans was 0.12%, compared to 0.20% at December 31, 2004, which is significantly better than industry standards.
The Bank’s investment policy is designed to enhance its net income and return on equity through: prudent management of risk; ensuring liquidity to meet cash-flow requirements; managing interest rate risk:risk; ensuring availability of collateral for public deposits, advances and repurchase agreements; and to seek asset diversification. Through our Asset/Liability Management Committee (“ALCO”), Bank liquidity is managed by structuring the maturity dates of investments to maintain an appropriate relationship between assets and liabilities while maximizing interest rate spreads.
2
Accordingly, the ALCO monitors the sensitivity of assets and liabilities with respect to changes in interest rates and maturities and directs the overall acquisition and allocation of funds. ALCO also utilizes derivative financial instruments to assist in the management of interest rate sensitivity by modifying the re-pricing, maturity and option characteristics of certain assets and liabilities.
Expense management – The Company is focused on leveraging its current expense base and measures the “efficiency ratio” as a benchmark for improvement. The efficiency ratio is equal to noninterest expense divided by total revenue (net interest income plus noninterestno interest income). This ratio was 64% in 2005, improved from 67% in 2004. Continued improvement is targeted to maintain strong earnings per share growth and generate higher returns on equity.
Wholesale distribution opportunities – Historically, we have distributed products and services directly to clients through local offices of the Bank. However, the application of newer technologies to new Bank products and services, such as Health Savings Accounts, has enabled us to pursue a wholesale distribution strategy to complement our direct operations. In a wholesale arrangement, Enterprise distributes products and services indirectly to clients through an intermediary, such as another bank, financial services firm, advisor or Company subsidiary.
Our recent acquisition of Millennium is one example of how we are executing our wholesale strategy. Millennium provides life insurance products and related consulting services to other independent life insurance agents, CPA firms, banks, property & casualty insurance agents and financial advisors. Millennium is expected to generate substantial fee income and also to serve as an additional distribution platform for trust and banking services.
Market Areas and Approach to Geographic ExpansionIn the
The Bank has four banking facilities in St. Louis metropolitan area,area. The St. Louis region enjoys a stable, diverse economic base and is ranked the Bank has facilities in Clayton, St. Peters, St. Charles and Sunset Hills, Missouri. The Bank also has facilities in Johnson County, Kansas and an office18th largest MSA in the Country Club Plaza districtUnited States. It is an attractive market for us with nearly 60,000 privately held businesses and over 80,000 households with investible assets of $1.0 million or more. As noted previously, we are the largest publicly-held, locally headquartered bank in this market.
In 2006 the Company substantially strengthened its market position in Kansas City. Kansas City is also a rich private company market with over 48,000 businesses and over 54,000 households with investible assets of $1.0 million or more. As mentioned previously, the Company almost doubled its size in Kansas City Missouri.in 2006. The Company choseplanned acquisition of Clayco Banc Corporation will increase the Company’s assets in the Kansas City market to locateroughly $600.0 million on a pro-forma basis, making Enterprise one of the fastest growing banks in each of these markets based on high growth potential, high concentration of closely-held businesses and the large number of professionals and executives.
|
|
| Kansas City |
The Company, as part of its expansion effort, plans to continue its strategy of operating relatively fewer offices with a larger asset base per office, emphasizing commercial banking and wealth management and employing experienced staff who are compensated on the basis of performance and customer service. In addition, we are now employing a national
By virtue of its Millennium subsidiary and other wholesale strategy made possible bydistribution operations, subject to applicable regulatory restrictions, the Millennium distribution platform.Company provides services beyond St. Louis and Kansas City in markets across the United States.
3
Competition
The Company and its subsidiaries operate in highly competitive markets. Our geographic markets are served by a number of large multi-bank holding companies with substantial capital resources and lending capacity. Many of the larger banks have established specialized units, which target private businesses and high net worth individuals. In addition,Also, both the St. Louis and Kansas City markets are experiencing an increase in de novo banks, which have either opened or are in the application stage. In addition to other financial holding companies and commercial banks, we compete with credit unions, investment managers, brokerage firms, money managers and other providers of financial services and products.
Supervision and Regulation
The Company and the Bank are subject to state and federal banking laws and regulations which impose specific requirements or restrictions on and provide for general regulatory oversight with respect to virtually all aspects of operations. These laws and regulations are intended to protect depositors, not shareholders.and shareholders to some extent. To the extent that the following summary describes statutory or regulatory provisions, it is qualified in its entirety by reference to the particular statutory and regulatory provisions. Any change in applicable laws or regulations may have a material effect on the business and prospects of the Company. The numerous regulations and policies promulgated by the regulatory authorities create a difficult and ever-changing atmosphere in which to operate. The Company and the Bank commit substantial resources in order to comply with these statutes, regulations and policies. The Company is unable to predict the nature or the extent of the effect on its business and earnings that fiscal or monetary policies, economic control, or new federal or state legislation may have in the future.
3
Millennium and the investment management industry in general are subject to extensive regulation in the United States at both the federal and state level, as well as by self-regulatory organizations such as the National Association of Securities Dealers, Inc. (“NASD”). The Securities and Exchange Commission is the federal agency that is primarily responsible for the regulation of investment advisers. Millennium is licensed to sell insurance, including variable insurance policies, in various states and is subject to regulation by the NASD. This regulation includes supervisory and organizational procedures intended to assure compliance with securities laws, including qualification and licensing of supervisory and sales personnel and rules designed to promote high standards of commercial honorintegrity and justfair and equitable principles of trade.
The Holding Company
The Company is a financial holding company registered under the Bank Holding Company Act of 1956, as amended (“BHCA”). As a financial holding company, the Company is subject to regulation and examination by the Federal Reserve Board, and is required to file periodic reports of its operations and such additional information as the Federal Reserve may require. In order to remain a financial holding company, the Company must continue to be considered well managed and well capitalized by the Federal Reserve and have at least a “satisfactory” rating under the Community Reinvestment Act. See “Capital Resources” in the Management Discussion and Analysis for more information on our capital adequacy and “The“Enterprise Bank – Community Reinvestment Act” below for more information on Community Reinvestment.
Acquisitions: With certain limited exceptions, the BHCA requires every financial holding company or bank holding company to obtain the prior approval of the Federal Reserve before (i) acquiring substantially all the assets of any bank, (ii) acquiring direct or indirect ownership or control of any voting shares of any bank if, after such acquisition, it would own or control more than 5% of the voting shares of such bank (unless it already owns or controls the majority of such shares), or (iii) merging or consolidating with another bank holding company. Federal legislation permits bank holding companies to acquire control of banks throughout the United States.
Permissible Activities: The Gramm-Leach-Bliley Act of 1999 (“GLBA”) eliminates many of the restrictions placed on the activities of certain qualified financial or bank holding companies. A financial holding company such as EFSC can expand into wide variety of financial services, including securities activities, insurance and merchant banking without the prior approval of the Federal Reserve.
Privacy Regulation: GLBA also imposes restrictions on the Company and the Bank regarding the sharing of customer non-public personal information with non-affiliated third parties unless the customer has had an opportunity to opt out of the disclosure. GLBA also imposes periodic disclosure requirements concerning the Company and the Bank policies and practices regarding data sharing with affiliated and non-affiliated parties.
Source of Strength; Cross-Guarantee. In accordance with Federal Reserve policy, we are expected to act as a source of financial strength to the Bank and to commit resources to support the Bank. The Federal Reserve takes the position that in implementing this policy, it may require us to provide financial support when we otherwise would not consider ourselves able to do so.
4
Sarbanes-Oxley Act. On July 30, 2002, President Bush signed into law the Sarbanes-Oxley Act of 2002 (“SOX”). The stated goals of SOX are to increase corporate responsibility, to provide for enhanced penalties for accounting and auditing improprieties at publicly traded companies and to protect investors by improving the accuracy and reliability of corporate disclosures made pursuant to the securities laws. The proposed changes are intended to allow shareholders to monitor the performance of companies and directors more easily and efficiently.
SOX generally applies to all companies, both U.S. and non-U.S., that file or are required to file periodic reports with the SEC under the Securities Exchange Act of 1934 and includes specific additional disclosure requirements and new corporate governance rules. The Act addresses, among other matters, (i) certification of financial statements by the chief executive officer and the chief financial officer, (ii) management assessment of internal controls with the issuer’s auditor attesting to and reporting on such assessment, (iii) the forfeiture of certain bonuses in the event of a restatement of financial results. In addition, public companies whose securities are listed on a national securities exchange must satisfy the following additional requirements: (i) the company’s audit committee must appoint and oversee the company’s auditors, (ii) each member of the company’s audit committee must be independent, (iii) the company’s audit committee must establish procedures for receiving complaints regarding accounting, internal accounting controls and audit-related matters, (iv) the company’s audit committee must have the authority to engage independent advisors and (v) the company must provide appropriate funding to its audit committee, as determined by the audit committee. SOX also requires the registered public accounting firm that issues the audit report to issue a report on management’s attestation on internal control over financial reporting.
4
TheEnterprise Bank
& Trust
The Bank is a Missouri trust company with banking powers. It is not a member of the Federal Reserve system.System. The Missouri Division of Finance and the FDICFederal Deposit Insurance Corporation (“FDIC”) are primary regulators for the Bank. These regulatory authorities regulate or monitor all areas of the Bank’s operations, including security devices and procedures, adequacy of capitalization and loss reserves, loans, investments, borrowings, deposits, mergers, issuance of securities, payment of dividends, interest rates payable on deposits, interest rates or fees chargeable on loans, establishment of branches, corporate reorganizations, maintenance of books and records, and adequacy of staff training to carry on safe lending and deposit gathering practices. The Bank must maintain certain capital ratios and is subject to limitations on aggregate investments in real estate, bank premises, and furniture and fixtures.
Transactions with Affiliates and Insiders: The Bank is subject to the provisions of Regulation W promulgated by the Federal Reserve, which encompasses Sections 23A and 23B of the Federal Reserve Act. Regulation W places limits and conditions on the amount of loans or extensions of credit to, investments in, or certain other transactions with, affiliates and on the amount of advances to third parties collateralized by the securities or obligations of affiliates. Regulation W also prohibits, among other things, an institution from engaging in certain transactions with certain affiliates unless the transactions are on terms substantially the same, or at least as favorable to such institution or its subsidiaries, as those prevailing at the time for comparable transactions with nonaffiliated companies.
Community Reinvestment Act: The Community Reinvestment Act (“CRA”) requires that, in connection with examinations of financial institutions within its jurisdiction, the FDIC shall evaluate the record of the financial institutions in meeting the credit needs of their local communities, including low and moderate income neighborhoods, consistent with the safe and sound operation of those institutions. These factors are also considered in evaluating mergers, acquisitions, and applications to open a branch or facility. The Company has a satisfactory rating under CRA.
USA Patriot Act: On October 26, 2001, President Bush signed into law the Uniting and Strengthening America by Providing Appropriate Tools Required to Intercept and Obstruct Terrorism Act of 2001 (the “USA PATRIOT Act”). Among its other provisions, the USA PATRIOT Act requires each financial institution to: (i) establish an anti-money laundering program; (ii) establish due diligence policies, procedures and controls with respect to its private banking accounts and correspondent banking accounts involving foreign individuals and certain foreign banks; and (iii) implement certain due diligence policies, procedures and controls with regard to correspondent accounts in the United States for, or on behalf of, a foreign bank that does not have a physical presence in any country. In addition, the USA PATRIOT Act contains a provision encouraging cooperation among financial institutions, regulatory authorities and law enforcement authorities with respect to individuals, entities and organizations engaged in, or reasonably suspected of engaging in, terrorist acts or money laundering activities.
Check 21: The Check Clearing for the 21st Century Act (“Check 21”) was signed into law on October 28, 2003, and became effective on October 28, 2004. Check 21 is designed to foster innovation in the payments system and to enhance its efficiency by reducing some of the legal impediments to check clearing. The law facilitates check clearing by creating a new negotiable instrument called a substitute check, which permits banks to clear original checks, to process check information electronically, and to deliver substitute checks to banks that want to continue
5
receiving paper checks. A substitute check is the legal equivalent of the original check and includes all the information contained on the original check. The law does not require banks to accept checks in electronic form nor does it require banks to use the new authority granted by the ActCheck 21 to create substitute checks.
Limitations on Loans and Transaction: The Federal Reserve Act generally imposes certain limitations on extensions of credit and other transactions by and between banks that are members of the Federal Reserve and other affiliates (which includes any holding company of which a bank is a subsidiary and any other non-bank subsidiary of such holding company). Banks that are not members of the Federal Reserve are also subject to these limitations. Further, federal law prohibits a bank holding company and its subsidiaries from engaging in certain tie-in arrangements in connection with any extension of credit, lease or sale of property or the furnishing of services.
Other Regulations: Interest and certain other charges collected or contracted for by the Bank are subject to state usury laws and certain federal laws concerning interest rates. The Bank’s loan operations are also subject to certain federal laws applicable to credit transactions, such as the federal Truth-In-Lending Act governing disclosures of credit terms to consumer borrowers; the Home Mortgage Disclosure Act of 1975 requiring financial institutions to provide information to enable the public and public officials to determine whether a financial institution is fulfilling its obligation to help meet the housing needs of the community it serves; the Equal Credit Opportunity Act
5
prohibiting discrimination on the basis of race, creed or other prohibited factors in extending credit; the Fair Credit Reporting Act of 1978 governing these and provision of information to credit reporting agencies; the Fair Debt Collection Act governing the manner in which consumer debts may be collected by collection agencies; the Soldiers’ and Sailors Civil Relief Act of 1940, governing the repayment terms of, and property rights underlying obligations of persons in military service; and the rules and regulations of the various federal agencies charged with the responsibility of implementing such federal laws. The deposit operations of the Bank are also subject to the Right to Financial Privacy Act, which imposes a duty to maintain confidentiality of consumer financial records and prescribes procedures for complying with administrative subpoenas of financial records, and the Electronic Funds Transfer Act and Regulation E issued by the Federal Reserve Board to implement that act, which governs automatic deposits to and withdrawals from deposit accounts and customers’ rights and liabilities arising from the use of automated teller machines and other electronic banking services.
Deposit Insurance: The deposits of the Bank are currently insured by the FDIC to a maximum of $100,000 per depositor, subject to certain aggregation rules. The FDIC establishes rates for the payment of premiums by federally insured banks for deposit insurance. An insurance fund is maintained for commercial banks, with insurance premiums from the industry used to offset losses from insurance payouts when banks and thrifts fail. The FDIC has adopted a risk-based deposit insurance premium system for all insured depository institutions, including the Bank, which requires premiums from a depository institution based upon its capital levels and risk profile, as determined by its primary federal regulator on a semiannual basis.
At any given time, the Company is subject to any number of risk factors that may affect the market price of the Company���sCompany’s stock. Some of the specific risks include the following:
Falling interest rates may reduce our net income and future cash flows. Since June 30, 2004, the U.S. Federal Reserve has increased its target for the federal funds rate fourteen times to 4.50%. If interest rates would start to fall, and if rates on the Bank’s loans and investments reprice downwards faster than the rates on the deposits and borrowings, we would experience compression of our interest rate spread and net interest margin, which would have a negative effect on our profitability.
Recent and possible future acquisitions could involve risks and challenges that could adversely affect our ability to achieve our profitability goals for acquired businesses or realize anticipated benefits of those acquisitions. We have experienced strong growth in the past several years and our strategy of future growth, while not dependent on, might include the acquisition of banking branches, other financial institutions and other wealth management companies. Most recently, we completed a partial acquisition of Millennium Brokerage Group LLC. However, we cannot assure investors that it will be able to identify suitable future acquisition opportunities or finance and complete any particular acquisition, combination or other transaction on acceptable terms and prices. There can be no assurance that the Company will be able to develop and integrate acquired businesses without adversely affecting the Company’s financial performance. In addition, all acquisitions involve a number of risks and challenges that could adversely affect our ability to achieve anticipated benefits of acquisitions.
The Bank’s allowance for loan losses may be inadequate, which could impair our earnings. The Bank’s allowance for loan losses may not be adequate to cover actual loan losses and if the Bank is required to increase its reserve, current earnings maywill be reduced. Our experience shows that some borrowers either will not pay on time or will not pay at all, which will require the Bank to “charge-off”charge-off the defaulted loan or loans. We provide for losses by reserving what we believe to be an adequate amount to absorb any probable inherent losses. A “charge-off”charge-off reduces the Bank’s allowance for loan losses. If the Bank’s reserves were insufficient, it would be required to increase reserves by recording a larger provision for loan losses, which would reduce earnings for that period.
Changes in economic conditions could cause an increase in delinquencies and non-performing assets, including loan charge-offs, which in turn may negatively affect the Company’s income and growth. The Bank’s loan portfolio includes many real estate securedDemand for loans demand for which may decrease during economic downturns as a result of, among other things, an increase in unemployment, a decrease in real estate values or increases in interest rates. These factors could depress our earnings and consequently our financial condition because:
| • | customers may not want or need the Company’s products and services; |
| • | borrowers may not be able to repay their loans; |
| • | the value of the collateral securing the Bank’s loans to borrowers may decline; and |
| • | the quality of the Bank’s loan portfolio may decline. |
6
Any of the latter threethese scenarios could cause an increase in delinquencies and non-performing assets or require us to “charge-off”charge-off a percentage of loans and/or increase the provisions for loan losses, which would reduce our earnings.
A prolonged flat or inverted yield curve may reduce our net income and cash flows. The interest rate yield curve is normally upward sloping where absolute interest rates are higher as the maturity of the financial instrument lengthens. During 2006, the curve became inverted where rates were lower on longer-term maturities. If this condition persists throughout 2007, we will likely experience continued compression of our interest rate spread and related net interest rate margin, which would have a negative impact on our profitability.
Because the Bank competes primarily on the basis of the interest rates it offers depositors and the terms of loans it offers borrowers, the Bank’s margins could decrease if it were required to increase deposit rates or lower interest rates on loans in response to competitive pressure. The Bank faces intense competition both in making loans and attracting deposits. It competes primarily on the basis of its depository rates, the terms of the loans it originates and the quality of its financial and depository services. This competition has made it more difficult for the Bank to make new loans and at times has forced us to offer higher deposit rates in our market areas. We expect competition to increase in the future as a result of legislative, regulatory and technological changes and the continuing trend of consolidation in the financial services industry. Technological advances, for example, have lowered barriers to market entry, enabled banks to expand their geographic reach by providing services over the Internet and enabled non-depository institutions to offer products and services that traditionally have been provided by banks. Recent changes in federal banking law permit affiliation among banks, securities firms and insurance companies, which also will change the competitive environment in which we conduct business. Some of the institutions with which we compete are significantly larger than us and, therefore, have significantly greater resources.
A real estate downturn in our geographic markets could hurt our business because a majority of our loans are secured by real estate. If real estate prices decline the value of real estate collateral securing our loans could be reduced. Our ability to recover on defaulted loans by foreclosing and selling real estate collateral would be diminished and we would likely suffer losses on defaulted loans. As of December 31, 2006, approximately 60% of the book value of our loan portfolio consisted of loans collateralized by various types of real estate. Substantially all of our real property collateral is located in Missouri and Kansas. Any such downturn could have a material adverse effect on our business, financial condition and results of operations.
Recent supervisory guidance on commercial real estate concentrations could restrict our activities and impose financial requirements or limitations on the conduct of business. The office of the Comptroller of the Currency, The Board of Governors of the Federal Reserve System and the FDIC recently finalized joint supervisory guidance on sound risk management practices for concentrations in commercial real estate lending. The guidance is intended to help ensure that institutions pursuing a significant commercial real estate lending strategy remain healthy and profitable while continuing to serve the credit needs of the community.
Our commercial real estate portfolio as of December 31, 2006 meets the definition of a commercial real estate concentration as set forth in the guidelines. If our risk management practices are found to be deficient, it could result in increased reserves and capital costs.
Recent and possible future acquisitions could involve risks and challenges that could adversely affect our ability to achieve our profitability goals for acquired businesses or realize anticipated benefits of those acquisitions. We have experienced strong growth in the past several years and our strategy of future growth, while not dependent on, might include the acquisition of banking branches, other financial institutions and other wealth management companies. However, we cannot assure investors that we will be able to identify suitable future acquisition opportunities or finance and complete any particular acquisition, combination or other transaction on acceptable terms and prices. There can be no assurance that we will be able to develop and integrate acquired businesses without adversely affecting our financial performance. In addition, all acquisitions involve a number of risks and challenges that could adversely affect our ability to achieve anticipated benefits of acquisitions.
Business Continuity Plans may not adequately anticipate all risks. We are subject to events that could impact or disrupt our business, although our goal is to ensure continuous service delivery to our customers. We have undertaken an enterprise-wide Business Continuity Plan in order to respond to and guard against this risk. However, no plan can fully eliminate such risk and there can be no assurance that our Plan will be successful.
Future Government Regulation Could Hinder Future Performance. The Company is a registered bankfinancial holding company under the Bank Holding Company Act of 1956. Accordingly, both the Company and the Bank are subject to extensive government regulation, legislation and control. These laws limit the manner in which the Company operates. Management cannot predict whether, or the extent to which, the government and governmental organizations may change any of these laws or controls. Changes in authoritative accounting guidance by the
7
Financial Accounting Standards Board or other regulatory agencies could affect the Company in ways that are not currently determinable. Management cannot predict how any of these changes would adversely affect the Company’s business.
Federal and state law limits the Company’s ability to declare and pay dividends. In addition, the Board of Governors of the Federal Reserve System may impose restrictions on the Company’s ability to declare and pay dividends on its common stock.
Employees
At December 31, 20052006 we had approximately 261329 full-time equivalent employees (including Millennium).employees. None of the Company’s employees is covered by a collective bargaining agreement. Management believes that its relationship with its employees is good.
7
ITEM 1B: UNRESOLVED SEC COMMENTS
Not applicable.
Banking facilitiesAs of December 31, 2005, we had five banking locations in Missouri and one in Kansas.
Our executive offices are located at 150 North Meramec, Clayton, Missouri, 63105. As of December 31, 2006, we had four banking locations in the St. Louis metropolitan area and six banking locations in the Kansas City metropolitan area. The Bank owns two of the banking facilities and leases the remainder. In addition,March 2006, the Bank leases our Operations CenterCompany purchased its operations center located in St. Louis County, Missouri. The terms of the leases expire between 20102009 and 2017 and most of the leases include one or more renewal options of 5 years. All the leases are classified as operating leases. We believe all our properties are in good condition.
In January 2006, the Company entered into an agreement to purchase the Operations Center location. We expect the purchase to close in first quarter 2006.
The following table sets forth specific information on each banking location.
|
|
| ||
|
|
| ||
|
|
| ||
|
|
| ||
|
|
| ||
|
|
| ||
|
|
|
Wealth management facilities
Enterprise Trust, a division of the Bank has offices in St. Louis and Kansas City. The St. Louis office is located at the Clayton branch and the Kansas City office is located at the Overland Park branch. Expenses related to the space used by Enterprise Trust are allocated to the Wealth Management segment.
As of December 31, 2005,2006, Millennium had 13 locations in 11 states throughout the United States. The executive offices are located in Nashville, TN. None of the locations areis owned by Millennium. The leases are classified as operating leases and expire in various years through 2009.2011.
The Company and its subsidiaries are, from time to time, parties to various legal proceedings arising out of their businesses. Management believes that there are no such proceedings pending or threatened against the Company or its subsidiaries which, if determined adversely, would have a material adverse effect on the business, financial condition, results of operations or cash flows of the Company or any of its subsidiaries.
ITEM 4: SUBMISSION OF MATTERS TO VOTE OF SECURITY HOLDERS
No matters were submitted to a vote of security holders in the quarter ended December 31, 2005.2006.
8
ITEM 5: MARKET FOR COMMON STOCK AND RELATED STOCKHOLDER MATTERS AND
ISSUER PURCHASE OF EQUITY SECURITIES
Effective February 8, 2005, the Company’s common stock began trading on the NASDAQ National Market under the symbol “EFSC”. Prior to that date, the common stock was not traded on an exchange but was traded on the Over-The-Counter Bulletin Board. Below are the dividends declared by quarter along with what the Company believes are the high and low closing sales prices for the common stock. There may have been other transactions at prices not known to the Company. As of February 22, 2006,21, 2007, the Company had 707835 common stock shareholders of record and a market price of $26.50$29.75 per share.
|
| Market Price |
|
|
|
| ||||
|
|
| Dividends |
| ||||||
|
| High |
| Low |
|
| ||||
|
|
|
|
| ||||||
2005 |
|
|
|
|
|
|
|
|
|
|
Fourth Quarter |
| $ | 23.17 |
| $ | 19.58 |
| $ | 0.0350 |
|
Third Quarter |
|
| 25.87 |
|
| 20.77 |
| $ | 0.0350 |
|
Second Quarter |
|
| 24.71 |
|
| 18.80 |
| $ | 0.0350 |
|
First Quarter |
|
| 20.75 |
|
| 18.17 |
| $ | 0.0350 |
|
2004 |
|
|
|
|
|
|
|
|
|
|
Fourth Quarter |
| $ | 19.80 |
| $ | 14.50 |
| $ | 0.0250 |
|
Third Quarter |
|
| 15.00 |
|
| 14.00 |
| $ | 0.0250 |
|
Second Quarter |
|
| 15.25 |
|
| 13.40 |
| $ | 0.0250 |
|
First Quarter |
|
| 14.10 |
|
| 13.15 |
| $ | 0.0250 |
|
The Company has authorizednumber of holders of record does not represent the repurchaseactual number of upbeneficial owners of our common stock because securities dealers and others frequently hold shares in “street name” for the benefit of individual owners who have the right to 500,000 shares of its common stock. In the quarter ended December 31, 2005, the Company repurchased no shares of its common stock.vote shares.
|
| 2006 |
| 2005 |
| ||||||||||||||||||||
|
|
|
| ||||||||||||||||||||||
|
| 4th Qtr |
| 3rd Qtr |
| 2nd Qtr |
| 1st Qtr |
| 4th Qtr |
| 3rd Qtr |
| 2nd Qtr |
| 1st Qtr |
| ||||||||
|
|
|
|
|
|
|
|
|
| ||||||||||||||||
High |
| $ | 33.87 |
| $ | 31.29 |
| $ | 28.49 |
| $ | 27.40 |
| $ | 23.17 |
| $ | 25.87 |
| $ | 24.71 |
| $ | 20.75 |
|
Low |
|
| 29.54 |
|
| 25.46 |
|
| 24.88 |
|
| 22.73 |
|
| 19.58 |
|
| 20.77 |
|
| 18.80 |
|
| 18.17 |
|
Dividends declared |
|
| 0.045 |
|
| 0.045 |
|
| 0.045 |
|
| 0.045 |
|
| 0.035 |
|
| 0.035 |
|
| 0.035 |
|
| 0.035 |
|
Dividends
The holders of shares of common stock of the Company are entitled to receive dividends when declared by the Company’s Board of Directors out of funds legally available for the purpose of paying dividends. The amount of dividends, if any, that may be declared by the Company will be dependent on many factors, including future earnings, bank regulatory capital requirements and business conditions as they affect the Bank. As a result, no assurance can be given that dividends will be paid in the future with respect to the Company’s common stock. In addition, the Company currently plans to retain most of its earnings for growth.
Common Stock
The authorized capital stock of the Company consists of 20,000,000 shares of common stock, par value $.01$0.01 per share. The Company has asked the shareholders to increase the number of authorized common shares to 30,000,0000. The shareholders will vote on this matter at the 2007 Annual Meeting. Please see the Company’s Proxy Statement for its 2007 annual meeting to be held on Wednesday, April 18, 2007 for more information.
Holders of the common stock are entitled to one vote per share on all matters on which the holders of common stock are entitled to vote. In all elections of directors, holders of common stock have the right to cast votes equaling the number of shares of common stock held by such stockholder multiplied by the number of directors to be elected. All of such votes may be cast for a single director or may be distributed among the number of directors to be elected, or any two or more directors, as such stockholder elects. Holders of common stock have no preemptive, conversion, redemption, or sinking fund rights. In the event of a liquidation, dissolution or winding-up of the Company, holders of common stock are entitled to share equally and ratably in the assets of the Company, if any, remaining after the payment of all liabilities of the Company.
The Company has authorized the repurchase of up to 500,000 shares of its common stock. In the quarter ended December 31, 2006, the Company repurchased no shares of its common stock.
See Note 17 – Compensation Plans in this filing for information about securities authorized for issuance under equity compensation plans.
9
The following Stock Performance Graph and related information should not be deemed “soliciting material” or to be “filed” with the Securities and Exchange Commission nor shall such performance be incorporated by reference into any future filings under the Securities Act of 1933 or Securities Exchange Act of 1934, each as amended, except to the extent that the Company specifically incorporates it by reference into such filing.
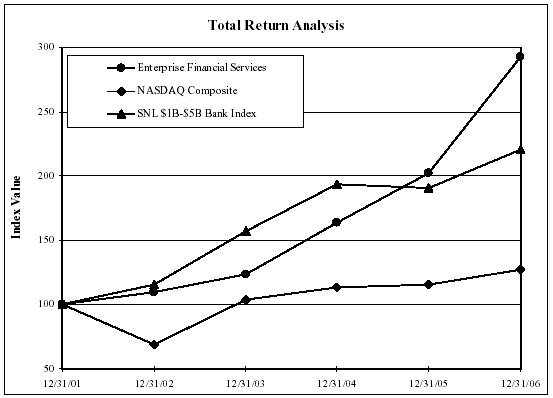
9The following graph compares the Company’s cumulative total shareholder return on its common stock from December 31, 2001 through December 31, 2006. The graph compares the Company’s common stock with the NASDAQ Composite and the SNL $1B-$5B Bank Index. The graph assumes an investment of $100.00 in the Company’s common stock and each index on December 31, 2001 and reinvestment of all quarterly dividends. The investment is measured as of each subsequent fiscal year end. There is no assurance that the Company’s common stock performance will continue in the future with the same or similar results as shown in the graph.
STOCK PERFORMANCE GRAPH
|
| Period Ending |
| ||||||||||||||||
|
|
| |||||||||||||||||
Index |
| 12/31/01 |
| 12/31/02 |
| 12/31/03 |
| 12/31/04 |
| 12/31/05 |
| 12/31/06 |
| ||||||
|
|
|
|
|
|
| |||||||||||||
Enterprise Financial Services |
|
| 100.00 |
|
| 109.41 |
|
| 123.27 |
|
| 163.97 |
|
| 202.36 |
|
| 292.56 |
|
NASDAQ Composite |
|
| 100.00 |
|
| 68.76 |
|
| 103.67 |
|
| 113.16 |
|
| 115.57 |
|
| 127.58 |
|
SNL $1B-$5B Bank Index |
|
| 100.00 |
|
| 115.44 |
|
| 156.98 |
|
| 193.74 |
|
| 190.43 |
|
| 220.36 |
|
10
ITEM 6: SELECTED FINANCIAL DATA
The following table summarizesconsolidated selected financial data is derived from the Company’s audited financial statements as of and for the Company for the periods indicated.five years ended December 31, 2006. This information should be read in connection with our audited consolidated financial statements, related notes and “Management’s Discussion and Analysis of Financial Condition and Results of Operations” appearing elsewhere in this report.
|
| Year ended December 31, |
|
| Year ended December 31, |
| ||||||||||||||||||||||||||
|
|
|
|
| ||||||||||||||||||||||||||||
(in thousands, except per share data) |
| 2005 |
| 2004 |
| 2003 |
| 2002 |
| 2001 |
|
| 2006 |
| 2005 |
| 2004 |
| 2003 |
| 2002 |
| ||||||||||
|
|
|
|
|
|
|
|
|
|
|
| |||||||||||||||||||||
EARNINGS SUMMARY: |
|
|
|
|
|
|
|
|
|
|
|
|
|
|
|
|
|
|
|
|
|
|
|
|
|
|
|
| ||||
Interest income |
| $ | 68,108 |
| $ | 48,893 |
| $ | 43,245 |
| $ | 45,207 |
| $ | 52,612 |
|
| $ | 94,418 |
| $ | 68,108 |
| $ | 48,893 |
| $ | 43,245 |
| $ | 45,207 |
|
Interest expense |
|
| 23,541 |
| 12,169 |
| 10,544 |
| 14,343 |
| 23,810 |
|
|
| 43,141 |
| 23,541 |
| 12,169 |
| 10,544 |
| 14,343 |
| ||||||||
|
|
|
|
|
|
|
|
|
|
|
|
| ||||||||||||||||||||
Net interest income |
|
| 44,567 |
| 36,724 |
| 32,701 |
| 30,864 |
| 28,802 |
|
|
| 51,277 |
| 44,567 |
| 36,724 |
| 32,701 |
| 30,864 |
| ||||||||
Provision for loan losses |
|
| 1,490 |
| 2,212 |
| 3,627 |
| 2,251 |
| 3,230 |
|
|
| 2,127 |
| 1,490 |
| 2,212 |
| 3,627 |
| 2,251 |
| ||||||||
Noninterest income |
|
| 8,964 |
| 7,122 |
| 10,091 |
| 5,366 |
| (2,035 | ) |
|
| 16,916 |
| 8,967 |
| 7,122 |
| 10,091 |
| 5,366 |
| ||||||||
Noninterest expense |
|
| 34,321 |
| 29,331 |
| 28,215 |
| 27,364 |
| 24,830 |
|
|
| 41,394 |
| 34,324 |
| 29,331 |
| 28,215 |
| 27,364 |
| ||||||||
Minority interest in net income of consolidated subsidiary |
|
| (113 | ) |
| — |
| — |
| — |
| — |
|
|
| (875 | ) |
| (113 | ) |
| — |
| — |
| — |
| |||||
Income before income taxes |
|
| 17,607 |
| 12,303 |
| 10,950 |
| 6,615 |
| (1,293 | ) |
|
| 23,797 |
| 17,607 |
| 12,303 |
| 10,950 |
| 6,615 |
| ||||||||
Income taxes |
|
| 6,312 |
| 4,088 |
| 4,025 |
| 1,614 |
| 1,242 |
|
|
| 8,325 |
| 6,312 |
| 4,088 |
| 4,025 |
| 1,614 |
| ||||||||
|
|
|
|
|
|
|
|
|
|
|
|
| ||||||||||||||||||||
NET INCOME (loss) |
| $ | 11,295 |
| $ | 8,215 |
| $ | 6,925 |
| $ | 5,001 |
| $ | (2,535 | ) | ||||||||||||||||
NET INCOME |
| $ | 15,472 |
| $ | 11,295 |
| $ | 8,215 |
| $ | 6,925 |
| $ | 5,001 |
| ||||||||||||||||
|
|
|
|
|
|
|
|
|
|
|
|
| ||||||||||||||||||||
PER SHARE DATA: |
|
|
|
|
|
|
|
|
|
|
|
|
|
|
|
|
|
|
|
|
|
|
|
| ||||||||
Net income (loss) per share-basic |
| $ | 1.12 |
| $ | 0.85 |
| $ | 0.72 |
| $ | 0.53 |
| $ | (0.28 | ) | ||||||||||||||||
Net income (loss) per share-diluted |
|
| 1.05 |
| 0.82 |
| 0.70 |
| 0.52 |
| (0.28 | ) | ||||||||||||||||||||
Net income per share-basic |
| $ | 1.41 |
| $ | 1.12 |
| $ | 0.85 |
| $ | 0.72 |
| $ | 0.53 |
| ||||||||||||||||
Net income per share-diluted |
|
| 1.36 |
| 1.05 |
| 0.82 |
| 0.70 |
| 0.52 |
| ||||||||||||||||||||
Cash dividends per share |
|
| 0.14 |
| 0.10 |
| 0.08 |
| 0.07 |
| 0.06 |
|
|
| 0.18 |
| 0.14 |
| 0.10 |
| 0.08 |
| 0.07 |
| ||||||||
Book value per share |
|
| 8.85 |
| 7.44 |
| 6.80 |
| 6.19 |
| 5.60 |
|
|
| 11.52 |
| 8.85 |
| 7.44 |
| 6.80 |
| 6.19 |
| ||||||||
BALANCE SHEET DATA: |
|
|
|
|
|
|
|
|
|
|
|
|
|
|
|
|
|
|
|
|
|
|
|
| ||||||||
Year end balances: |
|
|
|
|
|
|
|
|
|
|
|
|
|
|
|
|
|
|
|
|
|
|
|
| ||||||||
Loans |
| $ | 1,002,379 |
| $ | 898,505 |
| $ | 783,878 |
| $ | 679,799 |
| $ | 602,747 |
|
| $ | 1,311,723 |
| $ | 1,002,379 |
| $ | 898,505 |
| $ | 783,878 |
| $ | 679,799 |
|
Allowance for loan losses |
| 12,990 |
| 11,665 |
| 10,590 |
| 8,600 |
| 7,296 |
|
| 16,988 |
| 12,990 |
| 11,665 |
| 10,590 |
| 8,600 |
| ||||||||||
Goodwill |
| 29,983 |
| 12,042 |
| 1,938 |
| 1,938 |
| 1,938 |
| |||||||||||||||||||||
Intangibles, net |
| 5,789 |
| 4,548 |
| 135 |
| 315 |
| 475 |
| |||||||||||||||||||||
Assets held for sale |
| — |
| — |
| — |
| 36,401 |
| 40,575 |
|
| — |
| — |
| — |
| — |
| 36,401 |
| ||||||||||
Assets |
| 1,286,968 |
| 1,059,950 |
| 907,726 |
| 877,251 |
| 795,590 |
|
| 1,535,587 |
| 1,286,968 |
| 1,059,950 |
| 907,726 |
| 877,251 |
| ||||||||||
Deposits |
| 1,116,244 |
| 939,628 |
| 796,400 |
| 716,314 |
| 655,553 |
|
| 1,315,508 |
| 1,116,244 |
| 939,628 |
| 796,400 |
| 716,314 |
| ||||||||||
Subordinated debentures |
| 30,930 |
| 20,620 |
| 15,464 |
| 15,464 |
| 11,340 |
|
| 35,054 |
| 30,930 |
| 20,620 |
| 15,464 |
| 15,464 |
| ||||||||||
Borrowings |
| 36,931 |
| 20,164 |
| 24,147 |
| 31,823 |
| 15,399 |
|
| 40,752 |
| 36,931 |
| 20,164 |
| 24,147 |
| 31,823 |
| ||||||||||
Liabilities held for sale |
| — |
| — |
| — |
| 50,053 |
| 58,800 |
|
| — |
| — |
| — |
| — |
| 50,053 |
| ||||||||||
Shareholders’ equity |
| 92,605 |
| 72,726 |
| 65,388 |
| 58,810 |
| 51,897 |
|
| 132,994 |
| 92,605 |
| 72,726 |
| 65,388 |
| 58,810 |
| ||||||||||
Average balances: |
|
|
|
|
|
|
|
|
|
|
|
|
|
|
|
|
|
|
|
|
|
|
|
| ||||||||
Loans |
| 964,259 |
| 847,270 |
| 738,572 |
| 693,551 |
| 613,539 |
|
| 1,159,110 |
| 964,259 |
| 847,270 |
| 738,572 |
| 693,551 |
| ||||||||||
Earning assets |
| 1,100,559 |
| 967,854 |
| 825,973 |
| 779,194 |
| 701,582 |
|
| 1,300,378 |
| 1,100,559 |
| 967,854 |
| 825,973 |
| 779,194 |
| ||||||||||
Assets |
| 1,148,691 |
| 1,008,022 |
| 868,303 |
| 820,730 |
| 743,503 |
|
| 1,385,726 |
| 1,148,691 |
| 1,008,022 |
| 868,303 |
| 820,730 |
| ||||||||||
Interest-bearing liabilities |
| 859,912 |
| 748,434 |
| 647,087 |
| 629,651 |
| 583,343 |
|
| 1,055,520 |
| 859,912 |
| 748,434 |
| 647,087 |
| 629,651 |
| ||||||||||
Shareholders’ equity |
| 81,511 |
| 68,854 |
| 63,175 |
| 55,361 |
| 56,623 |
|
| 113,000 |
| 81,511 |
| 68,854 |
| 63,175 |
| 55,361 |
| ||||||||||
SELECTED RATIOS: |
|
|
|
|
|
|
|
|
|
|
|
|
|
|
|
|
|
|
|
|
|
|
|
| ||||||||
Return on average equity |
|
| 13.86 | % |
| 11.93 | % |
| 10.96 | % |
| 9.03 | % |
| N/A | % |
|
| 13.69 | % |
| 13.86 | % |
| 11.93 | % |
| 10.96 | % |
| 9.03 | % |
Return on average assets |
|
| 0.98 |
| 0.81 |
| 0.80 |
| 0.61 |
| N/A |
|
|
| 1.12 |
| 0.98 |
| 0.81 |
| 0.80 |
| 0.61 |
| ||||||||
Efficiency ratio |
|
| 64.11 |
| 66.90 |
| 65.94 |
| 75.53 |
| 92.76 |
|
|
| 60.70 |
| 64.12 |
| 66.90 |
| 65.94 |
| 75.53 |
| ||||||||
Average equity to average assets |
|
| 7.10 |
| 6.83 |
| 7.28 |
| 6.75 |
| 7.62 |
|
|
| 8.15 |
| 7.10 |
| 6.83 |
| 7.28 |
| 6.75 |
| ||||||||
Yield on average interest-earning assets |
|
| 6.25 |
| 5.10 |
| 5.29 |
| 5.84 |
| 7.52 |
|
|
| 7.33 |
| 6.25 |
| 5.10 |
| 5.29 |
| 5.84 |
| ||||||||
Cost of interest-bearing liabilities |
|
| 2.74 |
| 1.63 |
| 1.63 |
| 2.28 |
| 4.09 |
|
|
| 4.09 |
| 2.74 |
| 1.63 |
| 1.63 |
| 2.28 |
| ||||||||
Net interest rate spread |
|
| 3.51 |
| 3.47 |
| 3.66 |
| 3.56 |
| 3.43 |
|
|
| 3.24 |
| 3.51 |
| 3.47 |
| 3.66 |
| 3.56 |
| ||||||||
Net interest rate margin |
|
| 4.11 |
| 3.84 |
| 4.01 |
| 4.00 |
| 4.12 |
|
|
| 4.01 |
| 4.11 |
| 3.84 |
| 4.01 |
| 4.00 |
| ||||||||
Nonperforming loans to total loans |
|
| 0.14 |
| 0.20 |
| 0.20 |
| 0.57 |
| 0.62 |
|
|
| 0.49 |
| 0.14 |
| 0.20 |
| 0.20 |
| 0.57 |
| ||||||||
Nonperforming assets to total assets |
|
| 0.11 |
| 0.18 |
| 0.17 |
| 0.46 |
| 0.49 |
|
|
| 0.52 |
| 0.11 |
| 0.18 |
| 0.17 |
| 0.46 |
| ||||||||
Net chargeoffs to average loans |
|
| 0.02 |
| 0.13 |
| 0.22 |
| 0.14 |
| 0.49 |
|
|
| 0.10 |
| 0.02 |
| 0.13 |
| 0.22 |
| 0.14 |
| ||||||||
Allowance for loan losses to total loans |
|
| 1.30 |
| 1.30 |
| 1.35 |
| 1.27 |
| 1.21 |
|
|
| 1.30 |
| 1.30 |
| 1.30 |
| 1.35 |
| 1.27 |
| ||||||||
Dividend payout ratio - basic |
|
| 12.58 |
| 11.76 |
| 11.11 |
| 13.21 |
| N/A |
|
|
| 12.78 |
| 12.58 |
| 11.76 |
| 11.11 |
| 13.21 |
| ||||||||
1011
ITEM 7: MANAGEMENT’S DISCUSSION AND ANALYSIS OF FINANCIAL CONDITION AND
RESULTS OF OPERATIONS
Introduction
INTRODUCTION
The following discussion and analysisobjective of this section is intended to review the significant factorsprovide an overview of the financial condition and results of operations of the Company for the three-year periodthree years ended December 31, 2005.2006. It should be read in conjunction with the accompanying consolidated financial statementsConsolidated Financial Statements, Notes and the selectedother financial data presented elsewhere in this report.
The Company has prepared all of the consolidated financial information in this report, in accordance with U.S. generally accepted accounting principles (“U.S. GAAP”). In preparing the consolidated financial statements in accordance with U.S. GAAP, the Company makes estimates and assumptions that affect the reported amount of assets and liabilities, disclosure of contingent assets and liabilities at the date of the consolidated financial statements, and the reported amounts of revenue and expenses during the reporting period. There can be no assurances that actual results will not differ from those estimates.
EXECUTIVE SUMMARYThis overview of management’s discussion and analysis highlights selected information in this document and may not contain all ofparticularly the information that is important to you. For a more complete understanding of trends, events, commitments, uncertainties, liquidity, capital resources and critical accounting estimates, you should carefully read this entire document.
Net income increased 37% to $11.3 million or $1.05 per fully diluted share compared to $8.2 million or $0.82 per fully diluted share in 2004.
Our banking line of business posted strong loan and deposit growth. Average earning assets increased by $132.7 million or 14%. Portfolio loans grew by $104 million, or 12% and ended the year at $1 billion. The investment portfolio grew to $136 million, a $14 million or 11% increase over 2004. Deposits grew 19%, or $177 million and the bank was able to maintain an attractive deposit mix, with 20% of the total held in interest free demand deposits.
Asset quality remained strong. Non-performing loans were just $1.4 million or 0.14% of portfolio loans and net charge-offs represented only 0.02% of average loans for the year. The allowance for loan losses was $13.0 million or 1.30% of portfolio loans vs. $11.7 million (also 1.30%) at the end of 2004. The increase in the allowance was the net result of $1.5 million of provision for loan losses slightly offset by $200,000 of net loan charge-offs in the year. In 2004, the provision for loan losses was $2.2 million and net loan charge-offs were $1.1 million. The decline in the provision for loan losses was due to lower non-performing loan levels, continued strengthening of the St. Louis and Kansas City economies and continued low delinquency rates.
The Company’s fully tax-equivalent net interest rate margin increased from 3.84% to 4.11%, year-to-year. The 27 basis point improvement in net interest rate margin was primarily due to rising interest rates and the greater benefit of free balances (demand deposits and shareholders’ equity). In 2005, the net interest spread improved 4 basis points to 3.51% as increases in earning asset yields were largely offset by increases in the cost of interest-bearing liabilities.
Deposit service charges of $2.1 million were essentially flat with those posted in 2004. A rising earnings credit rate throughout 2005 offset much of the benefit of the growth in numbers of accounts and services provided during the year.
Total Wealth Management income increased by 53%, or $2.3 million, to $6.5 million during the year driven by strong growth in the company’s Trust and Wealth Products Groups. This included $780,000 of commission income earned by Millennium, which was acquired in October 2005. Factoring out the benefit of the Millennium acquisition, the company’s Wealth Management business increased its income by $1.5 million or 35% for the year. Assets under administration increased almost $225 million in 2005 as the result of a 25% increase in the net number of Trust client relationships. This increase was offset by $250 million of assets managed in a special common trust fund account which were distributed to clients as called for by contact in the fourth quarter of 2005.
During the late third and throughout the fourth quarter of 2005, the Company elected to reposition a portion of its investment portfolio and recognized net losses of $494,000. Increases in market rates for the two through four-year maturity ranges and the company’s overall interest rate sensitivity presented an opportunity to strengthen the expected total return on portfolio investments for 2006 and 2007.
11
Whileregarding the Company’s long range business model (see Form 8-K filing dated July 22, 2005) calls for noninterest expenses to grow on average 10% or less per year through 2010, these expenses grew 17% or $5 millionoperations described in 2005 over the $29.3 million reported in 2004. Excluding expenses incurred by Millennium of $504,000 and $152,000 of amortization expenses related to that acquisition, noninterest expenses increased $4.3 million or 15%. Our three-year compound annual growth rate (ending 2005) in noninterest expenses was 8%, still well under our 10% goal, and expense management remains a priority for us. The Company’s efficiency ratio improved from 67% to 64% in 2005.
Employee compensation and benefits represent the largest expense increase. This was primarily due to increased payouts under the Company’s incentive bonus programs, including the 401(k) match program, which are tied to performance targets. See “NonInterest Expense” below for more information.
For the year ended December 31, 2005, the effective tax rate for the Company was 35.8%, an increase from the 33.2% rate in 2004. During 2004 the Company recognized a $241,000 reversal of the remaining deferred tax valuation allowance related to Merchant Banking losses in 2001 and the Company recognized state income tax refunds of $163,000 related to amendments of prior state income tax returns. See “Income Taxes” below for more information. Item 1.
CRITICAL ACCOUNTING POLICIES
The following accounting policies are considered most critical to the understanding of the Company’s financial condition and results of operations. These critical accounting policies require management’s most difficult, subjective and complex judgments about matters that are inherently uncertain. Because these estimates and judgments are based on current circumstances, they may change over time or prove to be inaccurate based on actual experiences. In the event that different assumptions or conditions were to prevail, and depending upon the severity of such changes, the possibility of a materially different financial condition and/or results of operations could reasonably be expected. The impact and any associated risks related to our critical accounting policies on our business operations are discussed throughout “Management’s Discussion and Analysis of Financial Condition and Results of Operations,” where such policies affect our reported and expected financial results. For a detailed discussion on the application of these and other accounting policies, see Note 1 to our Consolidated Financial Statements.– Significant Accounting Policies in this filing.
The Company has prepared all of the consolidated financial information in this report in accordance with U.S. generally accepted accounting principles (“U.S. GAAP”). The Company makes estimates and assumptions that affect the reported amount of assets and liabilities, disclosure of contingent assets and liabilities at the date of the consolidated financial statements, and the reported amounts of revenue and expenses during the reporting period. There can be no assurances that actual results will not differ from those estimates.
Allowance for Loan LossesSubject to the use of estimates, assumptions, and judgments, management’s evaluation process used to determine the adequacy of the
The Company maintains an allowance for loan losses combines several factors:(“the allowance”), which is intended to be management’s ongoingbest estimate of probable inherent losses in the outstanding loan portfolio. The allowance is based on management’s continuing review and evaluation of the loan portfolio;portfolio. The review and evaluation combines several factors including: consideration of past loan loss experience; trends in past due and nonperforming loans; risk characteristics of the various classifications of loans; existing economic conditions; the fair value of underlying collateral; and other qualitative and quantitative factors which could affect probable credit losses.
Because current economic conditions can change and future events are inherently difficult to predict, the anticipated amount of estimated loan losses, and therefore the adequacy of the allowance, could change significantly. As an integral part of their examination process, various regulatory agencies also review the allowance for loan losses. SuchThese agencies may require that certain loan balances be charged off when their credit evaluations differ from those of management, based on their judgments about information available to them at the time of their examination. The Company believes the allowance for loan losses is adequate and properly recorded in the consolidated financial statements.
Derivative Financial Instruments
The Company employsuses derivative financial instruments to assist in its management ofmanaging interest rate sensitivity by modifyingsensitivity. The derivative financial instruments used are interest rate swaps. Derivative financial instruments are required to be measured at fair value and recognized as either assets or liabilities in the repricing, maturityconsolidated financial statements. Fair value represents the payment the Company would receive or pay if the item were sold or bought in a current transaction. Fair values are generally based on market quotes. The accounting for changes in fair value (gains or losses) of a derivative depends on whether the derivative is designated and option characteristicsqualifies for “hedge accounting.” In accordance with Statement of certain assetsFinancial Accounting Standards No. 133 (“SFAS No. 133”) Accounting for Derivative Instruments and liabilities. Hedging Activities, the Corporation assigns derivatives to one of these categories at the purchase date:
Cash Flow Hedges – Derivatives designated as cash flow hedges are accounted for at fair value. The effective portion of the change in fair value is recorded net of taxes as a component of other comprehensive income (“OCI”) in shareholders’ equity. Amounts recorded in OCI are subsequently reclassified into interest expense when the underlying transaction affects earnings. The ineffective portion of the change in fair value is recorded in noninterest income. The swap agreements are accounted for on an accrual basis with the net interest differential being recognized as an adjustment to interest income or interest expense of the related asset or liability.
12
• | Fair Value Hedges – Derivatives designated as fair value hedges, the fair value of the derivative instrument and related hedged item are recognized through the related interest income or expense, as applicable, except for the ineffective portion, which is recorded in noninterest income. All changes in fair value are measured on a quarterly basis. The swap agreement is accounted for on an accrual basis with the net interest differential being recognized as an adjustment to interest income or interest expense of the related asset or liability. |
• | Non-Designated Hedges – Certain economic hedges are not designated as cash flow or as fair value hedges for accounting purposes. These non-designated derivatives were entered into to provide interest rate protection on net interest income but do not meet hedge accounting treatment. Changes in the fair value of these instruments are recorded in interest income at the end of each reporting period. |
The judgments and assumptions that are most critical to the application of this critical accounting policy are those affecting the estimation of fair value and hedge effectiveness. Fair value is based on quoted market prices. Factors that affect hedge effectiveness include the initial selection of the derivative that will be used as a hedge and how well changes in its cash flow or fair value has correlated and is expected to correlate with change in the cash flow or fair value of the underlying hedged asset or liability. Past correlation is easy to demonstrate, but expected correlation depends upon projections and trends that may not always hold true with acceptable limits. Changes in assumptions and conditions could result in greater than expected inefficiencies that, if large enough, could reduce or eliminate the economic benefits anticipated when the hedges were established and/or invalidate continuation of hedge accounting. The consequence of greaterGreater inefficiency and discontinuation of hedge accounting resultscan result in increased volatility in reported earnings. For cash flow hedges, this would result in more or all of the change in the fair value of the affected derivative being reported in income. For fair value hedges, this would result in less or none of the change in the fair value of the derivative being offset by changes in the fair value of the underlying hedged asset or liability.
12
Deferred Tax Assets
The Company recognizes deferredaccounts for income taxes under the asset/liability method. Deferred tax assets and liabilities are recognized for the estimated future tax effects of temporary differences, net operating loss carryforwardscarry forwards and tax credits. Deferred tax assets are recognized subject to management’s judgment based upon available evidence that realization is more likely than not. Deferred tax assets are reduced if necessary, by a deferred tax asset valuation allowance. InA valuation allowance is established when in the eventjudgment of management, it is more likely than not that management determines it would not be able to realize all or part of netsuch deferred tax assets in the future,will not become realizable. In this case, the Company would need to adjust the recorded value of our deferred tax assets, which would result in a direct charge to income tax expense in the period that suchthe determination is made. Likewise, the Company would reverse the valuation allowance when realization of the deferred tax asset is expected.
Goodwill and Other Intangible Assets
The Company adopted the provisions ofaccounts for goodwill and intangible assets according to Statement of Financial Accounting Standards (“SFAS”) No. 142 “Goodwill and other Intangible AssetsAssets.”” on January 1, 2002. Under this accounting standard, amortization of goodwill ceased and instead the asset is periodically tested for impairment. The Company tests goodwill and intangible assets for impairment utilizing the methodology and guidelines established in SFAS No. 142 on an annual basis. This methodology involves assumptions includingSuch tests involve the valuationuse of the business segments that contain the acquired entities.estimates and assumptions. Management believes that the assumptions utilized are reasonable. However, the Company may incur impairment charges related to goodwill in the future due to changes in business prospects or other matters that could affect our valuation assumptions. Intangible assets other than goodwill, such as trade namecore deposit intangibles, whichthat are determined to have finite lives are amortized over their estimated remaining useful lives of approximately five years.lives.
We conducted our annualThe 2006 impairment evaluation of our reporting units as of December 31, 2005. As discussedthe goodwill and intangible balances did not identify any potential impairment; therefore, no goodwill or intangible impairment was recorded in 2006. See Note 9 – Goodwill and Intangible Assets in this filing for more information.
EXECUTIVE SUMMARY
This overview of management’s discussion and analysis highlights selected information in this document and may not contain all of the information that is important to you. For a more complete understanding of trends, events, commitments, uncertainties, liquidity, capital resources and critical accounting estimates, you should carefully read this entire document.
Net income increased 37% to $15.5 million, or $1.36 per fully diluted share compared to $11.3 million or $1.05 per fully diluted share in 2005. Our four-year annual compound growth rate in earnings per share exceeded 27%.
Banking – During 2006, our banking line of business posted strong loan and deposit growth. We believe this is especially impressive in light of the intense banking competition in St. Louis and Kansas City. As some of the newer banks struggled to gain momentum and the larger banks sought to retain market share, we saw a good deal of aggressive loan and deposit pricing. Throughout 2006, we remained disciplined in our pricing practices in order to maintain our interest rate margin above 4.0%. We are confident in our ability to compete successfully in this increasingly competitive environment.
13
While organic growth remains our primary objective, during 2006, we announced two acquisitions: | ||
• | NorthStar Bancshares, Inc. – On July 5, 2006 the Company completed its acquisition of NorthStar Bancshares, Inc. and it’s wholly owned subsidiary, NorthStar Bank, N.A. On October 6, 2006, NorthStar Bank was merged into the Bank. The NorthStar purchase expanded our footprint in Kansas City, which was essential for us to become a larger “participant” in that market. Subsequent to announcing the acquisition, two senior bankers in the Kansas City market agreed to join our team. The NorthStar acquisition contributed $154 million in loans and $146 million in deposits. | |
• | Clayco Banc Corporation – On November 22, 2006 the Company executed an agreement to acquire Clayco Banc Corporation and its wholly owned banking subsidiary, Great American Bank for approximately $37.0 million in cash and stock. Clayco is headquartered in DeSoto, Kansas and operates two banking offices, one in DeSoto, Kansas and one in Claycomo, Missouri. The transaction closed on February 28, 2007. | |
The staffs and branches of these organizations are expected to provide a stronger platform for our banking and wealth management businesses in Kansas City. Please refer to Note 2 – Acquisitions and Note 4 – Subsequent Events in this filing for more information related to the Consolidated Financial Statements, for the period ending December 31, 2005 the estimated fair valueacquisitions.
Below is a summary of all reporting units exceeded their carrying values and goodwill impairment was not deemed to exist. 2006 banking highlights:
• | Loans – Total portfolio loans grew by $309 million, or 31% and ended the year at $1.3 billion. During 2006, organic loan growth (from original units of the Bank) grew $155 million – 50% higher than 2005 loan growth of $104 million. | |
• | Deposits – Total deposits grew $199 million, or 18% and the bank was able to maintain an attractive deposit mix, with 18% of the total held in interest free demand deposits. Core deposit growth in 2006 was in line with our expectations and reflected management’s decision to de-emphasize higher rate certificates of deposit. Instead, we pursued lower cost transaction and relationship-based accounts primarily through our Treasury management products and services | |
• | Asset quality – Asset quality was solid. In 2006, we incurred $1.2 million of net charge-offs, or 0.10% of average loans. Non-performing loans were $6.5 million or 0.49% of portfolio loans. Nine of twelve non-performing relationships related to the NorthStar acquisition. The allowance for loan losses was $17.0 million, or 1.30%, of portfolio loans vs. $13.0 million (also 1.30%) at the end of 2005. | |
• | Net Interest Rate Margin – During 2006, average interest-earning assets increased $200 million, or 18%. The fully tax-equivalent net interest rate margin was 4.01% for 2006 versus 4.11% for 2005. The decline in the net interest rate margin was primarily due to the increasing cost of deposits that more than offset higher earning asset yields. In addition, a portion of the decline was due to the slightly dilutive impact of NorthStar’s net interest rate margin. |
Wealth Management – In 2006, the Wealth Management line of business delivered strong growth in revenues and earnings. | ||
• | Revenue – Wealth Management revenue increased by $7.3 million, or 112%, due to $6.2 million of incremental revenue from Millennium. Factoring out Millennium, the Trust business increased income by $1.0 million or 14% for the year. Assets under administration were $1.635 billion at December 31, 2006, an 18% increase over December 31, 2005. The growth in Wealth Management revenue improved our ratio of fee income to revenue from 17% in 2005 to 25% in 2006, consistent with our strategy of steadily diversifying our revenue sources. | |
• | Earnings – Pre-tax earnings of our Trust business were $1.3 million, an increase of 38% over 2005. Millennium, in its first full year with Enterprise, accounted for $0.08 of 2006 fully diluted earnings per share including the cost of acquisition-related debt issued at the Company. Millennium generated $3.5 million of pre-tax earnings before intangible amortization and debt costs. | |
RESULTS OF OPERATIONS ANALYSIS
Net Interest Income
Comparison of 20052006 vs. 2004
2005
Net interest income is the primary source of the Company’s revenue. Net interest income is the difference between interest income on earning assets, such as loans and securities, and the interest expense on interest-bearing deposits and other borrowings, used to fund interest earning and other assets. The amount of net interest income is affected by changes in interest rates and by the amount and composition of interest-earning assets and interest-bearing liabilities. Additionally, net interest income is impacted by the sensitivity of the balance sheet to changes in interest rates, which factors in characteristicsliabilities, such as the mix of fixed orvs. variable nature of the financial instruments, contractual maturities,rate loans. When and repricing frequencies. how often loans and deposits mature and reprice also impacts net interest income.
14
Net interest spread and net interest rate margin are utilized to measure and explain changes in net interest income. Interest rate spread is the difference between the yield on interest-earning assets and the rate paid for interest-bearing liabilities that fund those assets. The net interest rate margin is expressed as the percentage of net interest income to average interest-earning assets. The net interest rate margin exceeds the interest rate spread because noninterest-bearing sources of funds (net free funds), principally demand deposits and shareholders’ equity, also support earning assets.
ChangesThe Company’s balance sheet and resulting net interest income is essentially neutral to changes in interest rates. The shift in our loan portfolio over the past year toward a more balanced split between fixed and floating rate loans, along with higher levels of variable rate liabilities, has naturally increased our protection against significant interest rate changes, which management deems prudent given the current economic environment.
Net interest income (on a tax equivalent basis) was $52.2 million for 2006, compared to $45.2 million for 2005, an increase of $7.0 million, or 15%. Total interest income increased $26.6 million while total interest expense increased $19.6 million.
Average interest-earning assets were $1.3 billion, an increase of $200 million, or 18% over $1.1 billion, for the same period in 2005. Average loans increased 20%, or $195 million to $1.159 billion from $964 million. For 2006, interest income on loans increased $14.1 million from growth and $11.1 million due to the impact of the rate environment, for a net increase of $25.2 million versus 2005 (see “Rate/Volume” below.)
Average interest-bearing liabilities increased $196 million, or 23% to $1.056 billion compared to $860 million for 2005. The growth in interest-bearing liabilities resulted from a $172 million increase in interest-bearing deposits, a $10.0 million increase in subordinated debentures, and a $14 million increase in borrowed funds including Federal Home Loan Bank (“FHLB”) advances. We intentionally did not pursue higher rate certificates of deposit in our markets given the current interest rate environment, but continue to pursue lower cost transaction and relationship-based accounts primarily through our treasury management products and services. This resulted in lower deposit growth than in the fed fundsprior year. The combined bank deposit mix remains favorable with demand deposit accounts, that are non interest-bearing, representing 18% of average total deposits in a competitive deposit rate hasenvironment. For 2006, interest expense on interest-bearing liabilities increased $6.9 million due to this growth while the impact of rising rates increased interest expense on interest-bearing liabilities by $12.7 million versus 2005.
Net interest rate margin (on a direct correlation on changestax equivalent basis) for 2006 was 4.01%, compared to 4.11% in 2005. Competitor pricing and the interest rate environment drove up the cost of interest-bearing liabilities from 2.74% in 2005 to 4.09% in 2006. The net interest rate margin increases were primarily in money market and consumer certificates of deposit rates. A portion of the decline in the primemargin was due to the slightly dilutive impact of NorthStar’s net interest rate the underlying indexmargin.
Comparison of 2005 vs. 2004
Net interest income (on a tax equivalent basis) was $45.2 million for most2005, an increase of the variable rate loans issued by the Bank.$8.0 million or 22% from 2004. Throughout 2005, slightly less than two-thirds of the loan portfolio floated with the prime rate. HistoricallyThroughout 2005, we have beenwere asset-sensitive, which means our assets generally re-pricere-priced faster than our liabilities. Therefore, the 13 consecutiveThe fed funds rate increases sinceduring late 2004 and 2005 by the Federal Open Markets Committee (“FOMC”) have had a positive influence on our net interest income and margin.
Net interest income (presented on a tax equivalent basis) was $45.2 million for 2005, an increase of $8.0 million or 21.5% from 2004. The increase in net interest income was attributable to a higher level of interest-earning assets combined with higher interest-earning asset yields partially offset by higher volumes and rates of interest-bearing liabilities.
Average interest-earning assets were $1.1 billion in 2005, an increase of $132.7$133 million or 13.7%14% from 2004. Loans accounted for the majority of the growth, , increasing by $117 million or almost 14% to $964.3$964 million on average in 2005. For 2005, interest income on loans increased $7.0 million from growth and $10.7 million due to the impact of the rate environment, (as noted above), for a net increase of $17.7 million versus 2004 (see “Rate/Volume” below).2004.
13
Average interest-bearing liabilities were $859.9$860 million in 2005, an increase of $111.5$112 million or 14.9%15% from 2004. The growth in interest-bearing liabilities resulted from an $84.5$85 million increase in interest-bearing deposits, a $3.9$4 million increase in subordinated debentures, and a $23.1$23 million increase in borrowed funds including Federal Home Loan Bank (“FHLB”)FHLB advances. The growth in earning assets was also supported by a $15.9$16 million or 8.7%9% increase in average noninterest-bearing deposits (a component of net free funds).deposits. For 2005, interest expense on interest-bearing liabilities increased $2.4 million due to this growth and the impact of rising rates increased interest expense on interest-bearing liabilities by $8.9 million versus 2004.
The net interest rate margin for 2005 was 4.11%, compared to 3.84% in 2004. The yield on interest-earning assets increased 115 basis point (“bp”)1.15% from 5.10% to 6.25%. The average loan yield increased 117 bp to 6.65%. The yield on securities and short-term investments combined was up 98 bp to 3.43%. The cost of interest-bearing liabilities increased from 1.63% in 2004 to 2.74%. The increase in cost of funds was primarily due to increases in money market and certificate of deposit rates given competitor pricing and the increasing interest rate environment.
Comparison of 2004 vs. 2003Net interest income (presented on a tax equivalent basis) was $37.2 million for 2004, an increase of $4.1 million or 12.3% from 2003. The net interest rate margin for 2004 was 3.84%, compared to 4.01% in 2003. The 17 bp decrease in net interest rate margin is attributable to a 19 bp decrease in interest rate spread (the net of a 19 bp lower yield on earning assets and no change in the cost of interest-bearing liabilities), and a 2 bp higher contribution from net free funds. Lower re-pricing on fixed rate loan maturities, a less favorable earning asset mix, less interest income from cash flow hedges and price competition for new loans were the main factors responsible for the declining interest-earning asset yield.
For 2004, the cost of interest-bearing liabilities remained level with 2003 at 1.63%. Higher rates paid on interest-bearing transaction accounts and money market accounts were offset by lower rates paid on certificates of deposit, subordinated debentures, and other borrowed funds. The rates on interest-bearing transaction accounts and money market accounts tend to track with treasury bill rates and national money market funds, both of which were rising in 2004. The Company’s certificate of deposit portfolio repriced to lower rates during the year as renewals reflected lower rates for these products in our local markets.
For 2004, the yield on interest-earning assets fell 19 bp to 5.10%, driven by a 15 bp decline in the loan yield. The average loan yield was 5.48%. Competitive pricing pressures, refinancing to lower fixed rates and less interest income from cash flow hedges put downward pressure on loan yields in 2004. The yield on securities and short-term investments combined was up 12 bp to 2.45%. The interest-earning asset rate changes reduced interest income by $1.0 million, a combination of $1.2 million lower interest on loans and $0.2 million higher interest on securities and short-term investments combined.
From a volume perspective, the growth and composition change of interest-earning assets in 2004 contributed an additional $6.7 million to net interest income, while the growth and composition of interest-bearing liabilities cost an additional $1.6 million, netting a $5.1 million increase in net interest income.
Average interest-earning assets were $967.9 million in 2004, an increase of $141.9 million or 17.2% from 2003. Loans accounted for the majority of the growth in interest-earning assets, increasing by $108.7 million or 14.7% to $847.3 million on average in 2004 and representing 87.5% of average interest-earning assets compared to 89.4% in 2003. For 2004, interest income on loans increased $6.0 million from growth, but decreased $1.2 million from the impact of the rate environment (as noted above), for a net increase of $4.8 million versus 2003.
Average interest-bearing liabilities were $748.4 million in 2004, an increase of $101.3 million or 15.7% from 2003. The growth in earning assets was also supported by a $33.0 million or 21.8% increase in average noninterest-bearing deposits (a component of net free funds). The growth in interest-bearing liabilities came from a $101.8 million increase in interest-bearing deposits, a $3.5 million increase in subordinated debentures, offset by a $4.0 million decrease in borrowed funds (includes Federal Home Loan Bank advances). For 2004, interest expense on interest-bearing liabilities increased $1.6 million due to this growth.
14
Average Balance Sheet
The following table presents, for the periods indicated, certain information related to our average interest-earning assets and interest-bearing liabilities, as well as, the corresponding interest rates earned and paid, all on a tax equivalent basis.
In April 2003, we sold three bank branches in Southeast Kansas. The balance of loans and deposits associated with the Southeast Kansas branchesNorthStar are included in the following table for approximately threesix months of 2003.2006.
|
| For the years ended December 31, |
|
| For the years ended December 31, |
| ||||||||||||||||||||||||||||||||||||||||||||||||||
|
|
|
|
| ||||||||||||||||||||||||||||||||||||||||||||||||||||
|
| 2005 |
| 2004 |
| 2003 |
|
| 2006 |
| 2005 |
| 2004 |
| ||||||||||||||||||||||||||||||||||||||||||
|
|
|
|
|
|
|
|
| ||||||||||||||||||||||||||||||||||||||||||||||||
(in thousands) |
| Average |
| Interest |
| Average |
| Average |
| Interest |
| Average |
| Average |
| Interest |
| Average |
|
| Average |
| Interest |
| Average |
| Average |
| Interest |
| Average |
| Average |
| Interest |
| Average |
| ||||||||||||||||||
|
|
|
|
|
|
|
|
|
|
|
|
|
|
|
|
|
|
|
| |||||||||||||||||||||||||||||||||||||
Assets |
|
|
|
|
|
|
|
|
|
|
|
|
|
|
|
|
|
|
|
|
|
|
|
|
|
|
|
|
|
|
|
|
|
|
|
|
|
|
|
| ||||||||||||||||
Interest-earning assets: |
|
|
|
|
|
|
|
|
|
|
|
|
|
|
|
|
|
|
|
|
|
|
|
|
|
|
|
|
|
|
|
|
|
|
|
|
|
|
|
| ||||||||||||||||
Taxable loans (1) |
| $ | 944,009 |
| $ | 62,318 |
| 6.60 | % | $ | 830,267 |
| $ | 45,082 |
| 5.43 | % | $ | 723,752 |
| $ | 40,451 |
| 5.59 | % |
| $ | 1,130,482 |
| $ | 86,893 |
| 7.69 | % | $ | 944,009 |
| $ | 62,318 |
| 6.60 | % | $ | 830,267 |
| $ | 45,082 |
| 5.43 | % | ||||||
Tax-exempt loans(2) |
| 20,250 |
| 1,766 |
| 8.72 |
| 17,003 |
| 1,325 |
| 7.79 |
| 14,820 |
| 1,167 |
| 7.87 |
| |||||||||||||||||||||||||||||||||||||
Tax-exempt loans (2) |
| 28,628 |
| 2,412 |
| 8.43 |
| 20,250 |
| 1,766 |
| 8.72 |
| 17,003 |
| 1,325 |
| 7.79 |
| |||||||||||||||||||||||||||||||||||||
|
|
|
|
|
|
|
|
|
|
|
|
|
|
|
|
|
|
|
|
|
|
|
|
|
|
| ||||||||||||||||||||||||||||||
Total loans |
|
| 964,259 |
| 64,084 |
| 6.65 |
| 847,270 |
| 46,407 |
| 5.48 |
| 738,572 |
| 41,618 |
| 5.63 |
|
| 1,159,110 |
| 89,305 |
| 7.70 |
| 964,259 |
| 64,084 |
| 6.65 |
| 847,270 |
| 46,407 |
| 5.48 |
| |||||||||||||||||
Taxable investments in debt and equity securities |
| 99,284 |
| 3,340 |
| 3.36 |
| 81,949 |
| 2,374 |
| 2.90 |
| 64,915 |
| 1,802 |
| 2.78 |
|
| 111,811 |
| 4,530 |
| 4.05 |
| 99,284 |
| 3,340 |
| 3.36 |
| 81,949 |
| 2,374 |
| 2.90 |
| ||||||||||||||||||
Non-taxable investments in debt and equity securities(2) |
| 1,514 |
| 61 |
| 4.03 |
| 1,639 |
| 62 |
| 3.78 |
| 939 |
| 35 |
| 3.73 |
| |||||||||||||||||||||||||||||||||||||
Non-taxable investments in debt and equity securities (2) |
| 1,140 |
| 55 |
| 4.82 |
| 1,514 |
| 61 |
| 4.03 |
| 1,639 |
| 62 |
| 3.78 |
| |||||||||||||||||||||||||||||||||||||
Short-term investments |
| 35,502 |
| 1,280 |
| 3.61 |
| 36,996 |
| 522 |
| 1.41 |
| 21,547 |
| 198 |
| 0.92 |
|
| 28,317 |
| 1,416 |
| 5.00 |
| 35,502 |
| 1,280 |
| 3.61 |
| 36,996 |
| 522 |
| 1.41 |
| ||||||||||||||||||
|
|
|
|
|
|
|
|
|
|
|
|
|
|
|
|
|
|
|
|
|
|
|
|
|
|
| ||||||||||||||||||||||||||||||
Total securities and short-term investments |
| 136,300 |
| 4,681 |
| 3.43 |
| 120,584 |
| 2,958 |
| 2.45 |
| 87,401 |
| 2,035 |
| 2.33 |
|
| 141,268 |
| 6,001 |
| 4.25 |
| 136,300 |
| 4,681 |
| 3.43 |
| 120,584 |
| 2,958 |
| 2.45 |
| ||||||||||||||||||
|
|
|
|
|
|
|
|
|
|
|
|
|
|
|
|
|
|
|
|
|
|
|
|
|
|
| ||||||||||||||||||||||||||||||
Total interest-earning assets |
|
| 1,100,559 |
| 68,765 |
| 6.25 |
| 967,854 |
| 49,365 |
| 5.10 |
| 825,973 |
| 43,653 |
| 5.29 |
|
|
| 1,300,378 |
| 95,306 |
| 7.33 |
| 1,100,559 |
| 68,765 |
| 6.25 |
| 967,854 |
| 49,365 |
| 5.10 |
| ||||||||||||||||
Non-interest-earning assets: |
|
|
|
|
|
|
|
|
|
|
|
|
|
|
|
|
|
|
|
|
|
|
|
|
|
|
|
|
|
|
|
|
|
|
|
|
|
|
|
| ||||||||||||||||
Cash and due from banks |
| 35,603 |
|
|
|
|
| 30,031 |
|
|
|
|
| 29,068 |
|
|
|
|
|
| 42,282 |
|
|
|
|
| 35,603 |
|
|
|
|
| 30,031 |
|
|
|
|
| ||||||||||||||||||
Other assets |
| 25,275 |
|
|
|
|
| 21,392 |
|
|
|
|
| 22,989 |
|
|
|
|
|
| 58,649 |
|
|
|
|
| 25,275 |
|
|
|
|
| 21,392 |
|
|
|
|
| ||||||||||||||||||
Allowance for loan losses |
| (12,746 | ) |
|
|
|
|
| (11,255 | ) |
|
|
|
|
| (9,727 | ) |
|
|
|
|
|
| (15,583 | ) |
|
|
|
|
| (12,746 | ) |
|
|
|
|
| (11,255 | ) |
|
|
|
|
| ||||||||||||
|
|
|
|
|
|
|
|
|
|
|
|
|
|
|
|
|
|
|
|
|
|
|
|
|
|
|
|
|
|
|
|
| ||||||||||||||||||||||||
Total assets |
| $ | 1,148,691 |
|
|
|
|
| $ | 1,008,022 |
|
|
|
|
| $ | 868,303 |
|
|
|
|
|
| $ | 1,385,726 |
|
|
|
|
| $ | 1,148,691 |
|
|
|
|
| $ | 1,008,022 |
|
|
|
|
| ||||||||||||
|
|
|
|
|
|
|
|
|
|
|
|
|
|
|
|
|
|
|
|
|
|
|
|
|
|
|
|
|
|
|
|
| ||||||||||||||||||||||||
Liabilities and Shareholders’ Equity |
|
|
|
|
|
|
|
|
|
|
|
|
|
|
|
|
|
|
|
|
|
|
|
|
|
|
|
|
|
|
|
|
|
|
|
|
|
|
|
| ||||||||||||||||
Interest-bearing liabilities: |
|
|
|
|
|
|
|
|
|
|
|
|
|
|
|
|
|
|
|
|
|
|
|
|
|
|
|
|
|
|
|
|
|
|
|
|
|
|
|
| ||||||||||||||||
Interest-bearing transaction accounts |
| $ | 87,560 |
| $ | 1,035 |
| 1.18 | % | $ | 71,568 |
| $ | 320 |
| 0.45% |
| $ | 54,742 |
| $ | 169 |
| 0.31 | % |
| $ | 102,327 |
| $ | 2,332 |
| 2.28 | % | $ | 87,560 |
| $ | 1,035 |
| 1.18 | % | $ | 71,568 |
| $ | 320 |
| 0.45 | % | ||||||
Money market accounts |
| 437,346 |
| 10,761 |
| 2.46 |
| 403,363 |
| 4,614 |
| 1.14 |
| 357,497 |
| 3,475 |
| 0.97 |
|
| 496,590 |
| 19,213 |
| 3.87 |
| 437,346 |
| 10,761 |
| 2.46 |
| 403,363 |
| 4,614 |
| 1.14 |
| ||||||||||||||||||
Savings |
| 4,435 |
| 31 |
| 0.70 |
| 4,254 |
| 14 |
| 0.33 |
| 5,499 |
| 24 |
| 0.44 |
|
| 4,164 |
| 57 |
| 1.37 |
| 4,435 |
| 31 |
| 0.70 |
| 4,254 |
| 14 |
| 0.33 |
| ||||||||||||||||||
Certificates of deposit |
| 259,852 |
| 8,647 |
| 3.33 |
| 225,529 |
| 5,050 |
| 2.24 |
| 185,175 |
| 4,532 |
| 2.45 |
|
| 357,706 |
| 16,230 |
| 4.54 |
| 259,852 |
| 8,647 |
| 3.33 |
| 225,529 |
| 5,050 |
| 2.24 |
| ||||||||||||||||||
|
|
|
|
|
|
|
|
|
|
|
|
|
|
|
|
|
|
|
|
|
|
|
|
|
|
| ||||||||||||||||||||||||||||||
Total interest-bearing deposits |
|
| 789,193 |
| 20,474 |
| 2.59 |
| 704,714 |
| 9,998 |
| 1.42 |
| 602,913 |
| 8,200 |
| 1.36 |
|
| 960,787 |
| 37,832 |
| 3.94 |
| 789,193 |
| 20,474 |
| 2.59 |
| 704,714 |
| 9,998 |
| 1.42 |
| |||||||||||||||||
Subordinated debentures |
| 22,936 |
| 1,348 |
| 5.88 |
| 19,022 |
| 1,405 |
| 7.39 |
| 15,464 |
| 1,270 |
| 8.21 |
|
| 32,704 |
| 2,343 |
| 7.16 |
| 22,936 |
| 1,348 |
| 5.88 |
| 19,022 |
| 1,405 |
| 7.39 |
| ||||||||||||||||||
Borrowed funds |
| 47,783 |
| 1,719 |
| 3.60 |
| 24,698 |
| 766 |
| 3.10 |
| 28,710 |
| 1,074 |
| 3.74 |
|
| 62,029 |
| 2,966 |
| 4.78 |
| 47,783 |
| 1,719 |
| 3.60 |
| 24,698 |
| 766 |
| 3.10 |
| ||||||||||||||||||
|
|
|
|
|
|
|
|
|
|
|
|
|
|
|
|
|
|
|
|
|
|
|
|
|
|
| ||||||||||||||||||||||||||||||
Total interest-bearing liabilities |
|
| 859,912 |
| 23,541 |
| 2.74 |
| 748,434 |
| 12,169 |
| 1.63 |
| 647,087 |
| 10,544 |
| 1.63 |
|
|
| 1,055,520 |
| 43,141 |
| 4.09 |
| 859,912 |
| 23,541 |
| 2.74 |
| 748,434 |
| 12,169 |
| 1.63 |
| ||||||||||||||||
Noninterest-bearing liabilities: |
|
|
|
|
|
|
|
|
|
|
|
|
|
|
|
|
|
|
|
|
|
|
|
|
|
|
|
|
|
|
|
|
|
|
|
|
|
|
|
| ||||||||||||||||
Demand deposits |
| 200,054 |
|
|
|
|
| 184,116 |
|
|
|
|
| 151,140 |
|
|
|
|
|
| 207,328 |
|
|
|
|
| 200,054 |
|
|
|
|
| 184,116 |
|
|
|
|
| ||||||||||||||||||
Other liabilities |
| 7,214 |
|
|
|
|
| 6,618 |
|
|
|
|
| 6,901 |
|
|
|
|
|
| 9,878 |
|
|
|
|
| 7,214 |
|
|
|
|
| 6,618 |
|
|
|
|
| ||||||||||||||||||
|
|
|
|
|
|
|
|
|
|
|
|
|
|
|
|
|
|
|
|
|
|
|
|
|
|
|
|
|
|
|
|
| ||||||||||||||||||||||||
Total liabilities |
| 1,067,180 |
|
|
|
|
| 939,168 |
|
|
|
|
| 805,128 |
|
|
|
|
|
| 1,272,726 |
|
|
|
|
| 1,067,180 |
|
|
|
|
| 939,168 |
|
|
|
|
| ||||||||||||||||||
Shareholders’ equity |
| 81,511 |
|
|
|
|
| 68,854 |
|
|
|
|
| 63,175 |
|
|
|
|
|
| 113,000 |
|
|
|
|
| 81,511 |
|
|
|
|
| 68,854 |
|
|
|
|
| ||||||||||||||||||
|
|
|
|
|
|
|
|
|
|
|
|
|
|
|
|
|
|
|
|
|
|
|
|
|
|
|
|
|
|
|
|
| ||||||||||||||||||||||||
Total liabilities & shareholders’ equity |
| $ | 1,148,691 |
|
|
|
|
| $ | 1,008,022 |
|
|
|
|
| $ | 868,303 |
|
|
|
|
|
| $ | 1,385,726 |
|
|
|
|
| $ | 1,148,691 |
|
|
|
|
| $ | 1,008,022 |
|
|
|
|
| ||||||||||||
|
|
|
|
|
|
|
|
|
|
|
|
|
|
|
|
|
|
|
|
|
|
|
|
|
|
|
|
|
|
|
|
| ||||||||||||||||||||||||
Net interest income |
|
|
|
| $ | 45,224 |
|
|
|
|
| $ | 37,196 |
|
|
|
|
| $ | 33,109 |
|
|
|
|
|
|
| $ | 52,165 |
|
|
|
|
| $ | 45,224 |
|
|
|
|
| $ | 37,196 |
|
|
| ||||||||||
|
|
|
|
|
|
|
|
|
|
|
|
|
|
|
|
|
|
|
|
|
|
|
|
|
|
|
|
|
|
| ||||||||||||||||||||||||||
Net interest spread |
|
|
|
|
|
| 3.51 | % |
|
|
|
|
| 3.47 | % |
|
|
|
|
| 3.66 | % |
|
|
|
|
|
| 3.24 | % |
|
|
|
|
| 3.51 | % |
|
|
|
|
| 3.47 | % | ||||||||||||
Net interest rate margin(3) |
|
|
|
|
|
| 4.11 | % |
|
|
|
|
| 3.84 | % |
|
|
|
|
| 4.01 | % | ||||||||||||||||||||||||||||||||||
Net interest rate margin (3) |
|
|
|
|
|
| 4.01 |
|
|
|
|
| 4.11 |
|
|
|
|
| 3.84 |
| ||||||||||||||||||||||||||||||||||||
|
|
|
|
|
|
|
|
|
|
|
|
|
|
|
|
|
|
|
|
|
|
|
|
|
|
|
|
|
|
|
|
|
|
| ||||||||||||||||||||||
(1) | Average balances include non-accrual loans. The income on such loans is included in interest but is recognized only upon receipt. |
Loan fees, prior to deferral adjustment, included in interest income are approximately | |
(2) | Non-taxable income is presented on a fully tax-equivalent basis using the combined statutory federal and state income tax rate in effect for each year. |
The tax-equivalent adjustments reflected in the above table is approximately $888,000, $658,000, | |
(3) | Net interest income divided by average total interest-earning assets. |
1516
Rate/Volume
The following table sets forth, on a tax-equivalent basis for the periods indicated, a summary of the changes in interest income and interest expense resulting from changes in yield/rates and volume.
In April 2003, we sold three bank branches in Southeast Kansas. The balance of loans and deposits associated with the Southeast Kansas branchesNorthStar are included in the following table for approximately threesix months of 2003.2006.
|
| 2005 Compared to 2004 |
| 2004 Compared to 2003 |
|
| 2006 compared to 2005 |
| 2005 compared to 2004 |
| ||||||||||||||||||||||||||||
|
|
|
|
|
|
| ||||||||||||||||||||||||||||||||
(in thousands) |
| Volume(1) |
| Rate(2) |
| Total |
| Volume(1) |
| Rate(2) |
| Total |
|
| Volume (1) |
| Rate (2) |
| Net |
| Volume (1) |
| Rate (2) |
| Net |
| ||||||||||||
|
|
|
|
|
|
|
|
|
|
|
|
|
| |||||||||||||||||||||||||
Interest earned on: |
|
|
|
|
|
|
|
|
|
|
|
|
|
|
|
|
|
|
|
|
|
|
|
|
|
|
|
|
|
|
|
|
| |||||
Loans |
| $ | 6,694 |
| $ | 10,542 |
| $ | 17,236 |
| $ | 5,811 |
| $ | (1,180 | ) | $ | 4,631 |
|
| $ | 13,414 |
| $ | 11,161 |
| $ | 24,575 |
| $ | 6,694 |
| $ | 10,542 |
| $ | 17,236 |
|
Nontaxable loans (3) |
|
| 271 |
| 170 |
| 441 |
| 170 |
| (12 | ) |
| 158 |
|
| 708 |
| (62 | ) |
| 646 |
| 271 |
| 170 |
| 441 |
| |||||||||
Taxable investments in debt and equity securities |
|
| 548 |
| 418 |
| 966 |
| 490 |
| 82 |
| 572 |
|
| 454 |
| 736 |
| 1,190 |
| 548 |
| 418 |
| 966 |
| |||||||||||
Nontaxable investments in debt and equity securities (3) |
|
| (5 | ) |
| 4 |
| (1 | ) |
| 26 |
| 1 |
| 27 |
|
| (17 | ) |
| 11 |
| (6 | ) |
| (5 | ) |
| 4 |
| (1 | ) | ||||||
Short-term investments |
|
| (22 | ) |
| 780 |
| 758 |
| 186 |
| 138 |
| 324 |
|
|
| (293 | ) |
| 429 |
| 136 |
| (22 | ) |
| 780 |
| 758 |
| |||||||
|
|
|
|
|
|
|
|
|
|
|
|
|
|
| ||||||||||||||||||||||||
Total interest-earning assets |
| $ | 7,486 |
| $ | 11,914 |
| $ | 19,400 |
| $ | 6,683 |
| $ | (971 | ) | $ | 5,712 |
|
| $ | 14,266 |
| $ | 12,275 |
| $ | 26,541 |
| $ | 7,486 |
| $ | 11,914 |
| $ | 19,400 |
|
|
|
|
|
|
|
|
|
|
|
|
|
|
|
| ||||||||||||||||||||||||
Interest paid on: |
|
|
|
|
|
|
|
|
|
|
|
|
|
|
|
|
|
|
|
|
|
|
|
|
|
|
|
| ||||||||||
Interest-bearing transaction accounts |
| $ | 86 |
| $ | 629 |
| $ | 715 |
| $ | 61 |
| $ | 90 |
| $ | 151 |
|
| $ | 200 |
| $ | 1,097 |
| $ | 1,297 |
| $ | 86 |
| $ | 629 |
| $ | 715 |
|
Money market accounts |
|
| 420 |
| 5,727 |
| 6,147 |
| 479 |
| 660 |
| 1,139 |
|
| 1,618 |
| 6,834 |
| 8,452 |
| 420 |
| 5,727 |
| 6,147 |
| |||||||||||
Savings |
|
| 1 |
| 16 |
| 17 |
| (5 | ) |
| (5 | ) |
| (10 | ) |
| (2 | ) |
| 28 |
| 26 |
| 1 |
| 16 |
| 17 |
| ||||||||
Certificates of deposit |
|
| 858 |
| 2,739 |
| 3,597 |
| 928 |
| (410 | ) |
| 518 |
|
| 3,858 |
| 3,725 |
| 7,583 |
| 858 |
| 2,739 |
| 3,597 |
| ||||||||||
Subordinated debentures |
|
| 259 |
| (316 | ) |
| (57 | ) |
| 272 |
| (137 | ) |
| 135 |
|
| 657 |
| 338 |
| 995 |
| 259 |
| (316 | ) |
| (57 | ) | |||||||
Borrowed funds |
|
| 813 |
| 140 |
| 953 |
| (138 | ) |
| (169 | ) |
| (307 | ) |
| 593 |
| 654 |
| 1,247 |
| 813 |
| 140 |
| 953 |
| |||||||||
|
|
|
|
|
|
|
|
|
|
|
|
|
|
| ||||||||||||||||||||||||
Total interest-bearing liabilities |
|
| 2,437 |
| 8,935 |
| 11,372 |
| 1,597 |
| 29 |
| 1,626 |
|
| 6,924 |
| 12,676 |
| 19,600 |
| 2,437 |
| 8,935 |
| 11,372 |
| |||||||||||
|
|
|
|
|
|
|
|
|
|
|
|
|
|
| ||||||||||||||||||||||||
Net interest income (loss) |
| $ | 5,049 |
| $ | 2,979 |
| $ | 8,028 |
| $ | 5,086 |
| $ | (1,000 | ) | $ | 4,086 |
| |||||||||||||||||||
Net interest income |
| $ | 7,342 |
| $ | (401 | ) | $ | 6,941 |
| $ | 5,049 |
| $ | 2,979 |
| $ | 8,028 |
| |||||||||||||||||||
|
|
|
|
|
|
|
|
|
|
|
|
|
|
| ||||||||||||||||||||||||
(1) | Change in volume multiplied by yield/rate of prior period. |
(2) | Change in yield/rate multiplied by volume of prior period. |
(3) |
|
NOTE: | The change in interest due to both rate and volume has been allocated to rate and volume changes in |
Provision for loan losses. The provision for loan losses was $2.1 million for 2006 compared to $1.5 million for 2005. The increase was due to stronger loan growth and higher non-performing loan levels.
The provision for loan losses was $1.5 million for 2005 compared to $2.2 million for 2004. The $722,000 decrease from 2005 to 2004in the provision for loan losses was due to lower non-performing loan levels, continued strengthening local economies and continued low delinquency rates.
The provision for loan losses was $2.2 million for 2004 compared to $3.6 million for 2003. The $1.4 million decrease in the provision for loan losses from 2003 to 2004 was due to stable and low non-performing loan levels, strengthening local economies and favorable delinquency trends. See the sections below captioned “Loans” And “Allowance for Loan Losses” for more information on our loan portfolio and asset quality.
1617
Noninterest Income
The following table presents a comparative summary of the major components of noninterest income.
|
| Years ended December 31, |
|
|
|
|
|
|
| |||||||
|
|
| Change 2006 |
| Change 2005 |
| ||||||||||
(in thousands) |
| 2006 |
| 2005 |
| 2004 |
|
|
| |||||||
|
|
|
|
|
| |||||||||||
Wealth Management income |
| $ | 13,809 |
| $ | 6,525 |
| $ | 4,264 |
| $ | 7,284 |
| $ | 2,261 |
|
Service charges on deposit accounts |
|
| 2,228 |
|
| 2,065 |
|
| 2,032 |
|
| 163 |
|
| 33 |
|
Other service charges and fee income |
|
| 617 |
|
| 464 |
|
| 396 |
|
| 153 |
|
| 68 |
|
Gain on sale of mortgage loans |
|
| 230 |
|
| 281 |
|
| 262 |
|
| (51 | ) |
| 19 |
|
Gain on sale of other real estate |
|
| 2 |
|
| 91 |
|
| — |
|
| (89 | ) |
| 91 |
|
(Loss) gain on sale of securities |
|
| — |
|
| (494 | ) |
| 126 |
|
| 494 |
|
| (620 | ) |
Miscellaneous income |
|
| 30 |
|
| 35 |
|
| 42 |
|
| (5 | ) |
| (7 | ) |
|
|
|
|
|
|
| ||||||||||
Total noninterest income |
| $ | 16,916 |
| $ | 8,967 |
| $ | 7,122 |
| $ | 7,949 |
| $ | 1,845 |
|
|
|
|
|
|
|
| ||||||||||
Comparison of2006 vs. 2005 vs. 2004
|
| Years ended December 31, |
| |||||||
|
|
| ||||||||
(in thousands) |
| 2005 |
| 2004 |
| $ Change |
| |||
|
|
|
| |||||||
Wealth Management income |
| $ | 6,522 |
| $ | 4,264 |
| $ | 2,258 |
|
Service charges on deposit accounts |
|
| 2,065 |
|
| 2,032 |
|
| 33 |
|
Other service charges and fee income |
|
| 464 |
|
| 396 |
|
| 68 |
|
Gain on sale of mortgage loans |
|
| 281 |
|
| 262 |
|
| 19 |
|
Gain on Sale of other real estate |
|
| 91 |
|
| — |
|
| 91 |
|
(Loss) gain on sale of securities |
|
| (494 | ) |
| 126 |
|
| (620 | ) |
Miscellaneous income |
|
| 35 |
|
| 42 |
|
| (7 | ) |
|
|
|
|
| ||||||
Total noninterest income |
| $ | 8,964 |
| $ | 7,122 |
| $ | 1,842 |
|
|
|
|
|
| ||||||
Total Wealth Management income increased 112% during 2006. This includes an incremental increase of $6.2 million of commission income earned by Millennium. Excluding Millennium, Trust revenue increased $1.0 million, or 14% for the year. Our ratio of fee income to total revenue at December 31, 2006 was 25% compared to 17% in 2005. This increase is consistent with our strategy of steadily diversifying our revenue sources. Assets under administration increased to $1.635 billion in 2006, an 18% increase over 2005.
Increases in Service charges on deposit accounts were basically unchanged year over yearprimarily due to NorthStar activity along with increased account activity. These increases were somewhat offset by a rising earnings credit rate on commercial accounts. Higher fee volumes on debit cards, merchant processing and health savings accounts which was offsetalong with NorthStar deposit fee income contributed to the increase in Other service charges and fee income.
During the second half of 2005, we elected to reposition a portion of our investment portfolio by increased account activity.selling and reinvesting approximately $29.0 million of investments. We realized losses of $494,000 on these sales. Increases in market rates for the two through four-year maturity ranges and the company’s overall interest rate sensitivity presented an opportunity to strengthen the expected total return on portfolio investments for 2006 and 2007.
The Company sold a foreclosed real estate property during the third quarter of 2005 for a gain of $91,000.
Comparison 2005 vs. 2004
Total Wealth Management incomerevenue increased 53% during 2005. The increase includes $780,000 of commission income earned by Millennium sincein 2005 after the acquisition in October.October acquisition. Excluding Millennium, Wealth Management incomeTrust revenue increased $1.5 million, or 35% for the year. The increase was the result of a 25% growth rate in net Trust client relationships as well as having a full year of revenue generated from the Wealth Products Group (“WPG”) unit. Favorable market conditions and client mix also factored in this growth. Assets under administration increased almost $225$225.0 million in 2005, but were offset by $250$250.0 million of assets managed in a special common trust fund account which were distributed to clients as called for by contactcontract in the fourth quarter of 2005.
During the second half of 2005, we elected to reposition a portion of our investment portfolio by selling and reinvesting approximately $29 million of investments. Increases in market rates for the two through four-year maturity ranges and the company’s overall interest rate sensitivity presented an opportunity to strengthen the expected total return on portfolio investments for 2006 and 2007.
The Company sold a foreclosed real estate property during the third quarter of 2005 for a gain of $91,000.
Comparison of 2004 vs. 2003
|
| Years ended December 31, |
| |||||||
|
|
| ||||||||
(in thousands) |
| 2004 |
| 2003 |
| $ Change |
| |||
|
|
|
| |||||||
Wealth Management income |
| $ | 4,264 |
| $ | 3,622 |
| $ | 642 |
|
Service charges on deposit accounts |
|
| 2,032 |
|
| 1,782 |
|
| 250 |
|
Other service charges and fee income |
|
| 396 |
|
| 369 |
|
| 27 |
|
Gain on sale of mortgage loans |
|
| 262 |
|
| 927 |
|
| (665 | ) |
Gain on sale of securities |
|
| 126 |
|
| 78 |
|
| 48 |
|
Gain on sale of branches |
|
| — |
|
| 2,938 |
|
| (2,938 | ) |
Miscellaneous income |
|
| 42 |
|
| 375 |
|
| (333 | ) |
|
|
|
|
| ||||||
Total noninterest income |
| $ | 7,122 |
| $ | 10,091 |
| $ | (2,969 | ) |
|
|
|
|
| ||||||
2004 noninterest income decreased 29% from 2003. Excluding the $2.9 million gain on the sale of Southeast Kansas branches in 2003, total noninterest income decreased $31,000.
The increase in serviceService charges on deposit accounts were basically unchanged year over year due to a rising earnings credit rate on commercial accounts, which was the result of an increase in the number of accounts and balances outstanding, an increase in the fee schedule and better collection efforts of non-sufficient fund charges in 2004.offset by increased account activity.
The increase in Wealth Management income was the result of increased assets under administration, a more favorable mix of managed versus custodial assets, and the introduction of the Company’s new WPG unit in March of 2004. Assets under administration in Enterprise Trust were $1.33 billion at December 31, 2004 versus $1.15 billion at December 31, 2003. WPG had revenue of $309,000 in 2004.
1718
The decrease in gain on the sale of mortgage loans was due to lower levels of refinancing activities in 2004 as compared to 2003. During 2004 securities were sold to slightly adjust the interest rate risk profile of the Company’s consolidated balance sheet in anticipation of higher rates.
During 2003 the Company recognized a $3.1 million gain on the sale of the Southeast Kansas branches, less a $150,000 write-off of related goodwill. Also, in 2003, the Company recognized $375,000 of miscellaneous income from a lawsuit settlement in connection with, but not directly related to, a charged-off loan in 2002.
Noninterest ExpenseComparison of 2005 vs. 2004Our efficiency ratio, which expresses non-interest expense as a percentage of tax-equivalent net interest income and other income, was 64% for 2005, improved from 67% in 2004. The improved efficiency ratio was due to revenue growth and cost management across all lines of business. Noninterest expense for 2005 includes three months of Millennium operations subsequent to the acquisition.
The following table summarizespresents a comparative summary of the major components of noninterest expense for 2005 and 2004.expenses.
|
| December 31, |
|
| Years ended December 31, |
|
|
|
|
| ||||||||||||||||
|
|
|
|
| Change 2006 |
| Change 2005 |
| ||||||||||||||||||
(in thousands) |
| 2005 |
| 2004 |
| $ Change |
|
| 2006 |
| 2005 |
| 2004 |
| ||||||||||||
|
|
|
|
|
|
|
|
|
| |||||||||||||||||
Noninterest expense: |
|
|
|
|
|
|
|
|
|
|
|
| ||||||||||||||
Employee compensation and benefits |
| $ | 22,130 |
| $ | 18,553 |
| $ | 3,577 |
|
| $ | 25,247 |
| $ | 22,130 |
| $ | 18,553 |
| $ | 3,117 |
| $ | 3,577 |
|
Occupancy |
|
| 2,327 |
| 2,090 |
| 237 |
|
| 2,966 |
| 2,327 |
| 2,090 |
| 639 |
| 237 |
| |||||||
Furniture, equipment and data processing |
|
| 1,839 |
| 1,517 |
| 322 |
| ||||||||||||||||||
Correspondent bank charges |
|
| 318 |
| 270 |
| 47 |
| ||||||||||||||||||
Professional, legal and consulting |
|
| 1,348 |
| 955 |
| 392 |
| ||||||||||||||||||
Other losses and settlement |
|
| 6 |
| 63 |
| (56 | ) | ||||||||||||||||||
Postage, courier and armored car |
|
| 719 |
| 659 |
| 60 |
| ||||||||||||||||||
Meals, entertainment, and travel |
|
| 1,004 |
| 664 |
| 340 |
| ||||||||||||||||||
Stationary and office supplies |
|
| 351 |
| 344 |
| 7 |
| ||||||||||||||||||
Furniture and equipment |
| 1,028 |
| 821 |
| 720 |
| 207 |
| 101 |
| |||||||||||||||
Data processing |
| 1,431 |
| 1,018 |
| 797 |
| 413 |
| 221 |
| |||||||||||||||
Communications |
|
| 295 |
| 245 |
| 50 |
|
| 546 |
| 295 |
| 245 |
| 251 |
| 50 |
| |||||||
Director related expense |
| 508 |
| 542 |
| 167 |
| (34 | ) |
| 375 |
| ||||||||||||||
Meals and entertainment |
| 1,744 |
| 1,181 |
| 800 |
| 563 |
| 381 |
| |||||||||||||||
Marketing and public relations |
|
| 631 |
| 552 |
| 79 |
|
| 985 |
| 736 |
| 661 |
| 249 |
| 75 |
| |||||||
Director related expense |
|
| 542 |
| 167 |
| 375 |
| ||||||||||||||||||
Noncompete expense |
|
| 154 |
| 180 |
| (26 | ) | ||||||||||||||||||
FDIC and other insurance |
|
| 519 |
| 417 |
| 102 |
|
| 574 |
| 519 |
| 417 |
| 55 |
| 102 |
| |||||||
Amortization of debt issuance costs |
|
| 11 |
| 599 |
| (589 | ) | ||||||||||||||||||
Amortization of intangibles |
| 1,128 |
| 346 |
| 180 |
| 782 |
| 166 |
| |||||||||||||||
Postage, courier, armored car |
| 845 |
| 719 |
| 659 |
| 126 |
| 60 |
| |||||||||||||||
Professional, legal, consulting |
| 1,102 |
| 1,237 |
| 831 |
| (135 | ) |
| 406 |
| ||||||||||||||
Other taxes |
| 437 |
| 279 |
| 271 |
| 158 |
| 8 |
| |||||||||||||||
Other |
|
| 2,127 |
| 2,056 |
| 72 |
|
| 2,853 |
| 2,174 |
| 2,940 |
| 679 |
| (766 | ) | |||||||
|
|
|
|
|
|
|
|
|
|
| ||||||||||||||||
Total noninterest expense |
| $ | 34,321 |
| $ | 29,331 |
| $ | 4,990 |
|
| $ | 41,394 |
| $ | 34,324 |
| $ | 29,331 |
| $ | 7,070 |
| $ | 4,993 |
|
|
|
|
|
|
|
|
|
|
|
| ||||||||||||||||
Expense management remains a priority for the Company. Our organic growth model calls for noninterestThe Company’s efficiency ratio improved from 64% to 61% in 2006. Noninterest expenses to grow on average 10%increased 21% or less per year through 2010. These expenses grew 17% or $5$7.1million in 2006. Approximately $3.0 million in 2005 over 2004. Excluding expenses incurred for Millennium of $504,000 and $152,000 of amortization expensesthis increase is related to the acquisition,addition of Millennium, which was acquired in October 2005. Noninterest expense also includes $2.5 million of NorthStar expenses incurred since the July 2006 acquisition. Excluding these amounts, noninterest expenses increased $4.3only $1.6 million or 15%5%. Our three-year compound annual growth rate (ending 2005) in noninterest expenses was 8%, still well under our 10% goal.
Comparison of 2006 vs. 2005
Employee compensation and benefits. Our compensation programs reflect our philosophy that carefully selected associates who are properly trained, directed and motivated will dramatically impact our performance and represent a sustaining competitive advantage. We compensate our associates in ways to attract and retain top performers, and to provide base salary, incentives and rewards that incent the behaviors consistent with a high-performing company. Over the last threefour years, we have implemented a disciplined process for managing the performance of our associates against defined business goals and results. The process includes frequent and candid performance feedback, measures individual contributions, differentiates individual performance and reinforces contribution with highly differentiated rewards. Two major components of our compensation program are the variable-pay incentive bonus pool and the Long-Term Incentive Plan (“LTIP”).
Effective January 1, 2005, the Board of Directors adopted a new LTIP. Under the terms of the plan, the Company awards restricted share units (“RSU’s”) to selected personnel based on the Company’s three year rolling average increase in earnings per share in comparison to a peer group of approximately 150 financial institutions. RSU’s are expensed annually as they vest.
Millennium employee compensation and benefits increased $1.3 million over 2005 amounts due to a full year of expenses versus only two months in 2005. Employee compensation and benefits includes $1.3 million for NorthStar in 2006. Excluding Millennium and NorthStar, employee compensation and benefits increased 3% or $543,000. The increase is due to increased salary and related benefits, including LTIP expenses, of existing associates along with expenses related to new senior level banking associates and new associates in various areas of our organization including marketing, wealth management and other support areas. These increases were offset by declines in wealth management commissions and the deferral of direct loan origination costs.
All other expense categories. All other expense categories include $1.2 million for NorthStar in 2006. All other expense categories include $1.7 million of incremental expenses related to Millennium. Excluding Millennium and NorthStar, all other noninterest expenses increased $1.1 million, or 9% over 2005.
The addition of Millennium and NorthStar contributed $169,000 and $236,000, respectively, to the increase in occupancy expense. Occupancy expense also includes scheduled rent increases on various Company facilities and related leasehold improvements completed at the Operations Center. In December 2006, the Bank’s Kansas City Plaza location moved. This resulted in $200,000 of leasehold improvement write-offs, which were recorded in Occupancy expense.
19
Furniture and equipment increases were due to the new St. Charles bank location, Millennium, NorthStar and the expansion of the Operations Center.
Data processing expenses increased due to upgrades to the Company’s AS400, licensing fee increases for our core banking system as a result of our increased asset size and increased maintenance fees for various Company systems. In addition, several new systems designed to improve efficiency in various support areas, such as Finance and Human Resources, were purchased and implemented in 2006. Expenses incurred to convert NorthStar technology to our platform have been capitalized and will be amortized according to the Company’s depreciation policies.
Communication expenses increased $100,000 due to Millennium and $71,000 due to NorthStar.
Meals and entertainment increases of $136,000 were related to Millennium. An additional $71,000 was related to NorthStar. The remaining increase was due to increased travel between St. Louis and Kansas City along with additional client meetings, including Enterprise University classes, which were held offsite.
Amortization of intangibles related to Millennium was $912,000 in 2006 compared to $152,000 in 2005. In 2006, NorthStar intangible amortization was $216,000. In 2005, the Company also recognized non-compete expenses related to the former CEO, who resigned in 2002. See Note 9 – Goodwill and Intangible Assets in this filing for more information related to the intangible amortization.
Other noninterest expense includes increases in charitable contributions and loan-related expenses along with increases in general operating expenses such as supplies, publications, and employee education.
Comparison of 2005 vs. 2004
Our efficiency ratio, which expresses noninterest expense, as a percentage of tax-equivalent net interest income and other income, was 64% for 2005, improved from 67% in 2004. The improved efficiency ratio was due to revenue growth and cost management across all lines of business. Noninterest expense for 2005 includes three months of Millennium operations subsequent to the acquisition.
Noninterest expenses grew 17% or $5 million in 2005 over 2004. Excluding expenses incurred for Millennium of $504,000 and $152,000 of amortization expenses related to the acquisition, noninterest expenses increased $4.3 million, or 15%.
Employee compensation and benefits. 2005 expenses under the Company’s incentive bonus programs, including the 401(k) match program, which is tied to performance targets, increased $1.3 million over 2004 from $2.9 million to $4.2 million. Driving this increase were the Company’s EPS growth in 2005, asset quality statistics, and growth in deposits and wealth management revenue and referrals.
18
On January 1, 2005, the Board of Directors adopted a Long Term Incentive Plan. Under terms of the plan, the Company will award restricted share units (“RSU’s”) to selected personnel based on the Company’s three year rolling average increase in earnings per share in comparison to a peer group of approximately 150 financial institutions. RSU’s will be expensed annually as they vest and will impact earnings per share accordingly in 2005 and beyond. The amount expensed is easily determinable based on the number of RSU’s times the stock price at award date. This is in direct contrast to options where multiple levels of inputs and potentially multiple models would be necessary. Compensation expense related to the RSUsRSU’s was $483,000 in 2005.
Growth in wealth management revenues increased commissions by $594,000. Salaries and benefits of new associates, annual merit increases, along with increases in medical and disability insurance costs contributed $784,000 to the increase. Recruiting fees increased $115,000 over 2004. Actual expenses related to the 2004 acceleration of vesting on stock options were $15,000. The remaining increase was attributable to Millennium.
All other expense categories. Excluding the increase in employee compensation and benefits and Millennium, all other noninterest expenses increased $1 million, or 9% over 2004.
Occupancy expense increases were due to scheduled rent increases on various Company facilities along with a full year of rent for additional space leased at the Company’s Operation Center and related leasehold improvements completed at the Operations Center. The new St. Charles City banking location and the addition of Millennium also contributed to the increase.
Data processing expenses increased due to upgrades to our AS400 computer system, licensing fee increases for our core banking system as a result of our increased asset size and increased maintenance fees for various Company systems. Furniture &and equipment increases were due to the new St. Charles bank location, Millennium and the expansion of the Operations Center.
20
The increase in professional, legal and consulting includes acquisition related activities, as well as, expenses for the further development of our business continuity plan, development of bank products, human resource consulting, investment management consulting and various legal issues.
Meals and entertainment increases were due to the addition of Millennium, various client related events and more employee travel between the St. Louis and Kansas City banking locations.
In 2005, director compensation was restructured to more competitive levels including restricted stock units granted to the directors. Mark to market adjustments for outstanding Stock Appreciation Rights (SARs) paid to the directors also increased over 2004.
In 2005 and 2004, the Company recognized non-compete expenses related to the former CEO, who resigned in 2002.
In the first quarter ofDuring 2005, our Directorsdirectors and Officersofficers liability insurance coverage was renewed which resulted in increased coverage amounts and insurance premiums. During the renewal, based on our increased asset size and the current business environment, we increased the amount of insurance coverage. The growth in Bank deposits also increased FDIC insurance expenses.
In 2004, we expensed unamortized debt issuance costs related to the refinancing of $11$11.0 million of Trust Preferred Securities (“TRUPS”).
19
Comparison of 2004 vs. 2003The following table depicts noninterest expense categories for 2004 and 2003:
|
| December 31, |
| |||||||
|
|
| ||||||||
(in thousands) |
| 2004 |
| 2003 |
| $ Change |
| |||
|
|
|
| |||||||
Employee compensation and benefits |
| $ | 18,553 |
| $ | 17,698 |
| $ | 855 |
|
Occupancy |
|
| 2,090 |
|
| 1,974 |
|
| 116 |
|
Furniture, equipment and data processing |
|
| 1,517 |
|
| 1,774 |
|
| (256 | ) |
Correspondent bank charges |
|
| 270 |
|
| 350 |
|
| (79 | ) |
Professional, legal and consulting |
|
| 955 |
|
| 1,052 |
|
| (97 | ) |
Other losses and settlement |
|
| 63 |
|
| 81 |
|
| (18 | ) |
Postage, courier and armored car |
|
| 659 |
|
| 669 |
|
| (10 | ) |
Meals, entertainment, and travel |
|
| 664 |
|
| 656 |
|
| 8 |
|
Stationary and office supplies |
|
| 344 |
|
| 325 |
|
| 19 |
|
Communications |
|
| 245 |
|
| 302 |
|
| (58 | ) |
Marketing and public relations |
|
| 552 |
|
| 318 |
|
| 234 |
|
Director related expense |
|
| 167 |
|
| 449 |
|
| (283 | ) |
Noncompete expense |
|
| 180 |
|
| 380 |
|
| (200 | ) |
FDIC and other insurance |
|
| 417 |
|
| 420 |
|
| (2 | ) |
Amortization of debt issuance costs |
|
| 599 |
|
| 41 |
|
| 559 |
|
Other |
|
| 2,056 |
|
| 1,728 |
|
| 327 |
|
|
|
|
|
| ||||||
Total noninterest expense |
| $ | 29,331 |
| $ | 28,215 |
| $ | 1,116 |
|
|
|
|
|
| ||||||
Noninterest expense increased 4% over 2003. Excluding the $554,000 charge taken in the 4th quarter of 2004 for unamortized debt issuance costs associated with the refinancing of subordinated debentures, noninterest expense was up 2%.
Employee compensation and benefits increased as the result of several items. Annual merit increases and higher compensation of new middle and senior management hired during 2003 and 2004 represent $705,000 of the increase. Payouts under the Company’s incentive bonus program and 401(k) match benefit, both of which are tied to performance targets increased $118,000. As a result of the higher compensation, payroll taxes increased $94,000. Employee benefits increased $151,000 due to increased medical and disability insurance expenses and additional expenses related to life insurance and other benefits such as car allowances. Compensation expense increased $146,000 due to the accelerating of the vesting on the Company’s outstanding stock options. These increases were partially offset by $329,000 in lower commission expenses related to our Wealth Management operations.
Historically the Company had used stock options as the long-term incentive component of many officers’ total compensation. These equity instruments helped align officer and shareholder interests and have proven to be an attractive tool for both recruiting and retaining talented officers. Beginning in late 2003 and during 2004, the Board and its Compensation Committee, like many others in public companies, became increasingly uncomfortable with the level of uncertainty and judgments required in valuing and expensing these options, since they are not publicly traded, and then having to record such uncertain amounts in future years. In addition, the Board and management were interested in tying long term incentives even more directly to the Company’s earning per share growth rates, while retaining the recruiting and retention power of equity-based compensation.
Based on the valuation and accounting uncertainties under proposed accounting treatment for stock options at the time, and the fact that no associates had been awarded any long term incentive for eighteen months in the midst of a very competitive environment for banking talent, the Board of Directors accelerated the vesting on the Company’s outstanding stock options during the fourth quarter of 2004.
This action resulted in two financial reporting impacts. First, the remaining fair value of all outstanding stock options was recognized in 2004 as part of the pro-forma footnote disclosures. Secondly, the Company recognized $146,000 of compensation expense in the fourth quarter of 2004 based on the product of the number of outstanding unvested options times the spread between their weighted average stock price and the Company stock price on October 1, 2004 times the estimated option forfeiture rate of 9.5%. The forfeiture rate is based on the Company’s history over the past several years, but actual forfeiture effects in the future are measured and recognized in expense for any differences versus the estimate.
20
In summary, the acceleration of the options vesting 1) assisted in the transition with officers to an even more closely aligned business metric, 2) eliminated uncertain long-term incentive plan expense impacts on future earnings, and 3) rewarded officers for the performance of the past two years.
Occupancy expense increased due to scheduled rent increases on various Company facilities and additional space leased at the Company’s Operation Center.
The decrease in furniture, equipment and data processing is related to lower depreciation expense as some assets became fully depreciated.
The decrease in professional, legal and consulting expenses were related to non-recurring 2003 expenses related to non-performing loan legal issues and other special matters, as well as, legal issues and other special matters related to the 2003 sale of Southeast Kansas branches. The decrease was offset by additional expenses related to Sarbanes-Oxley 404 compliance and outside consulting for the Company’s compensation committee. The remaining decrease was due to less work on special matters such as human resource consulting, tax consulting and various legal issues.
Losses and settlements in both 2004 and 2003 include expenses for a legal settlement related to a loan dispute with another financial institution.
Historically, we did not invest in marketing campaigns. During 2003, we began several initiatives to increase its presence in its two markets, including sponsoring a “university” for private business owners, soliciting customer surveys, and advertising in local business periodicals aimed at the Company’s target market. These efforts continued in 2004 and expanded to include radio and television spots, which increased the cost of the campaign.
The decrease in Director related expenses was related to director incentive and appreciation programs earned in 2003 including fewer outstanding Stock Appreciation Rights (“SARs”), (which require marking to market) in 2004 versus 2003. Prior to 2001, SARs were used as compensation for director time.
In 2004, we recognized non-compete expenses related to the former CEO, who resigned in 2002. In 2003, the Company recognized non-compete expenses related to the former CEO and another former employee.
In 2004, we wrote-off $554,000 of unamortized debt issuance costs related to the refinancing of $11 million of TRUPS.
The increase in other expenses is due to $163,000 of expenses related to a nonperforming loan and $150,000 write-down on a foreclosed real estate property.
Minority Interest in Net Income of Consolidated Subsidiary
On October 21, 2005, the Company acquired a 60% controlling interest in Millennium. The Company records itsthe 40% non-controlling interest in Millennium, related to Millennium’s results of operations, in minority interest on the consolidated statementstatements of income. ForContractually, the year ended December 31, 2005, we recorded $113,000Company is entitled to a priority return of 23.1% pre-tax on its current $15.0 million investment in Millennium. During 2006, the Company adjusted minority interest.interest by $861,000 to recognize its priority return in line with its contractual rights.
Income Taxes
Income Taxes
In 2005,2006, the Company recorded income tax expense of $6.3$8.3 million on pre-tax income of $17.6$23.8 million, an effective tax rate of 35.8%35.0%. During 2006, $230,000 of tax reserves were reversed through Income tax expense was $4.1 million and $4.0 millionexpenses related to certain state tax positions taken in 2002. The expiration of the statute of limitations for 2004 and 2003, respectively. the 2002 tax year warranted this release.
The 2005 effective tax rates were 33.2% and 36.7%rate for 2004 and 2003, respectively. In 2001, a valuation allowance was established in the amount of $1.0 million related to capital losses on certain merchant banking investments. As of December 31, 2001, the Company had determined it was more likely than not that certain of the deferred tax assets related35.8% compared to the capital losses would not be realized. Due to the availability of certain tax planning strategies33.2% in the fourth quarter of 2002 (i.e. the sale of the branches which would generate significant capital gains), the Company reversed $800,000 of the valuation allowance recorded in 2001.2004. During 2004 the Company reversedrecognized a $241,000 reversal of the remaining $241,000 of thedeferred tax valuation allowance. The nature and deductibility of theseallowance related to Merchant Banking losses were finally determined when the Company filed its 2003 income tax returns during 2004. Also,in 2001. In addition during 2004, the Company recognized state income tax refunds of $163,000 related to amendments of prior state income tax returns. Exclusive of these non-recurring items, the effective tax rate in 2004 would have been approximately 36.5%.
21
FINANCIAL CONDITION
Comparison for the years ended December 31, 20052006 and 2004
2005
Total assets at December 31, 20052006 were $1.3$1.5 billion, an increase of $227$249 million, or 21%19%, over total assets of $1.1$1.3 billion at December 31, 2004.2005. The increase in total assets was related to growthdriven by a $309 million, or 31%, increase in loans and investment securities. Loanswith $154 million of the loan increase due to the NorthStar acquisition.
Investment securities were $1.002 billion, an increase of $104 million, or 12%, over total loans of $899$111 million at December 31, 2004. While new loan originations were strong during the year the Bank experienced a higher than normal level of refinance activity as clients took advantage of the relatively flat yield curve2006 compared to refinance floating rate debt to the fixed rate permanent markets. Management does not currently believe that it is in the Company’s long-term best interest to compete aggressively for longer term fixed rate loans at these pricing levels.
Investment securities were $136 million, an increase of $14 million, or 11%, from a comparable balance of $122 million at December 31, 2004.2005. At December 31, 2005, investment securities included $40 million of short-term discount agency securities, which matured in January 2006 compared to $30 million in short-term discount agency securities, which matured in January 2005. These investmentsand were used as an alternative to overnight funds to obtain higher yield. During 2005, we sold $29.0 million of investment securities and reinvested the proceeds to reposition the portfolio. Realized losses of $506,000 were recorded. The realized losses were slightly offset by $12,000 of realized gains on the sale of equity securities.not replaced.
Goodwill and intangible assets were $16.6$36 million at December 31, 2006, compared to $17 million at December 31, 2005, compared to $2.1 million at December 31, 2004, an increase of $14.5$19 million. The increase in goodwill and intangible assets was primarily related to the purchase of Millennium.NorthStar. See Note 7 to the Consolidated Financial Statements9 – Goodwill and Intangible Assets in this filing for more information.
The growth in loans was primarily funded by increases in deposits and advances from the Federal Home Loan Bank (“FHLB”). Total deposits atAt December 31, 20052006, deposits were $1.1$1.3 billion, an increase of $177$199 million, or 19%18%, overfrom $1.1 billion at December 31, 2005. NorthStar added $146 million, including $61.0 million of Brokered CD’s. Total Brokered CD’s at December 31, 2006 were $104 million. During 2006, we did not pursue client-based higher rate certificate of deposits in our markets given the current interest rate environment, and instead pursued lower cost transaction and relationship-based accounts primarily through our treasury management products and services. This resulted in lower deposit growth than in prior years. The combined bank deposit mix remains favorable with demand deposits accounts representing 18% of total deposits in a competitive deposit rate environment.
21
We plan to continue utilizing FHLB advances and brokered certificates of $940deposit to fund shortfalls due to loan demand. At December 31, 2006, FHLB advances were $27.0 million compared to $28.6 million at December 31, 2004. The deposit growth was recorded across all deposit categories, except savings, as a result of new client relationships and increased sales penetration of existing clients.
Early in 2005, to take advantage of lower rates, we executed $30 million of Brokered CD’s to replace the same amount that was maturing later in the year. As our asset growth continued, in mid-year we entered into $22 million of long-term FHLB advances at a weighted-average rate of 4.50% with a weighted-average term of 8 years. The FHLB advances were available at more attractive rates than the Broker CD market. At December 31, 2005, FHLB advances were $28.6 million, an $18.3 million increase over December 31, 2004.2005. There were no short-term FHLB advances outstanding at December 31, 2006 or 2005.
Junior subordinated debentures increased by $10.3$4.1 million due to a pooled trust offering that was issuedclosed on October 11, 2005 thoughJuly 29, 2006 through a statutory trust established by the Company. In conjunction with the issuance of the trust preferred offering, the Company issued $10.0$4.0 million in junior subordinated debentures to the trust. The issuance of the additional junior subordinated debentures was to partially fund the acquisition of Millennium.NorthStar. The Company also borrowed $4.0 million against its line of credit with U.S. Bank to help fund the acquisition of NorthStar.
Federal funds (“Fed funds”) sold were $7.1 million at December 31, 2006 compared to $65 million at December 31, 2005 compared to $6.3 million of fed funds purchased2005. Strong loan fundings near year-end reduced our overall liquidity levels at December 31, 2004. Stronger deposit growth relative to loan growth during 2005 resulted in higher liquidity levels. Given our outlook for the first quarter2006.
Fourth Quarter 2006 we expect to utilize most of this liquidity after our seasonal deposit runoff for loan volume.Discussion
22
4th Quarter 2005 Discussion
The Company earned $2.9$4.4 million in net income for the fourth quarter ended December 31, 2005,2006, a $1.1$1.6 million increase over net income of $1.8$2.8 million for the same period in 2004. 2005.
The tax-equivalent net interest rate margin was 4.06%3.98% for the fourth quarter of 20052006 as compared to 3.85%4.06% for the same period in 2004.2005. Net interest income in the fourth quarter of 20052006 increased $1.8$2.2 million from the fourth quarter of 2004.2005. This increase in net interest income was the result of a $5.9$7.4 million increase in interest income offset by a $4.0$5.2 million increase in interest expense. The yield on average interest-earning assets increased to 6.66%7.57% during the fourth quarter of 20052006 as compared to 5.25%6.66% during the same period in 2004. The increase in asset yield was due to several prime rate increases during 2005. The cost of interest-bearing liabilities increased to 3.27%4.42% for the fourth quarter of 20052006 from 1.82%3.27% for the same period in 2004.2005. This increase is attributed mainly to an increase in money market interest rates and certificates of deposit due to the rate environment.
The provision for loan losses was $70,000$350,000 in the fourth quarter of 20052006 versus $775,000$70,000 in 2004.2005. The decrease of $705,000increase was due to lowerstronger loan growth and higher non-performing loan levels, continued strengthening local economies and continued low delinquency rates.levels.
Noninterest income was $2.6$4.7 million during the fourth quarter of 2005, a $700,000$2.1 million increase over $1.9 million in noninterest income duringof $2.6 million for the same period in 2004. The increase includes $780,0002005. Millennium earned $1.9 million of commission income earned by Millennium sinceduring fourth quarter 2006 compared to $780,000 during the acquisition in Octoberfourth quarter of 2005. In the fourth quarter of 2005, offset by $408,000 of net realized losses from the sale of securities.securities were recognized. The remaining increase is due to increased incomerevenues from the Trust division of the Bank.Bank and higher fee volumes associated with debit cards, merchant processing, health savings accounts and other products.
Noninterest expense was $9.9expenses were $11.8 million during the fourth quarter of 20052006 versus $8.3$9.9 million during the same period in 2004. This represents2005, a $1.6$1.9 million increase. TheApproximately $530,000 of the increase includes $655,000 of expense incurred by Millennium since the acquisition in October of 2005 including $152,000 of amortization of intangibleswas related to the acquisition.addition of Millennium in late October 2005. Millennium increases included one additional month of expenses (three months during 2006 versus only two months in 2005) along with increases in salaries, performance-based variable compensation and various operating expenses. An additional $1.2 million of the increase was related to NorthStar (including $215,000 of intangible amortization.) The remaining increase was primarily due to additional compensation expense tied to the our incentive bonus programs, including the 401(k) match program, which is tied to performance targets such as EPS growth, deposit and loan growth, asset quality statistics, and growthincreases in deposits and wealth management revenue and referrals.
Income tax expense was $1.6$2.1 million during the fourth quarter of 20052006 versus $1.1$1.6 million in the same period in 2004.2005. The effective tax rates were 36.0% and 36.6%, respectivelyrate was 32.2% for the fourth quarter of 2005 and 2004, respectively. 2006 compared to 36.0% for the fourth quarter of 2005. During the fourth quarter of 2006, we released $230,000 of state tax reserves where the statute of limitations had expired.
22
Loans
Total loans, less unearned loan fees, increased $104$309 million, or 12%30.1% during 2005.2006. This includes $154 million in loans from the acquisition of NorthStar. The Company’s lending strategy emphasizes commercial, residential real estate, real estate construction and commercial real estate loans to small and medium sized businesses and their owners in the St. Louis and Kansas City metropolitan markets. Consumer lending is minimal. A common underwriting policy is employed throughout the Company. Lending to these small and medium sized businesses are riskier from a credit perspective than lending to larger companies, but the risk tends to be offset with higher loan pricing and ancillary income from cash management activities.
The Company has implemented a targeted hiring program designed to attract and retain experienced commercial middle market bankers in both the St. Louis and Kansas City markets. As a result of this strategy the Company has targeted, and will continuecontinued to target larger and more sophisticated commercial and industrial and commercial real estate clients. It is expected that the Company’s average relationship size will continue to increase, resulting in greater efficiencies, as the same level of cost can originate and service larger average relationships and their related higher revenues. In addition, it is anticipated that the characteristics of the credit requirements of these clients will require a heavier underwriting emphasis on cash flows as the primary credit granting criteria.
23
The following table sets forth the composition of the Company’s loan portfolio by type of loans (based on call report classifications) at the dates indicated:
|
| December 31, |
|
| December 31, |
| ||||||||||||||||||||||||||
|
|
|
|
| ||||||||||||||||||||||||||||
(in thousands) |
| 2005 |
| 2004 |
| 2003 |
| 2002 |
| 2001 |
|
| 2006 |
| 2005 |
| 2004 |
| 2003 |
| 2002 |
| ||||||||||
|
|
|
|
|
|
|
|
|
|
|
| |||||||||||||||||||||
Commercial and industrial |
| $ | 265,488 |
| $ | 253,594 |
| $ | 209,928 |
| $ | 167,842 |
| $ | 160,218 |
|
| $ | 352,914 |
| $ | 265,488 |
| $ | 253,594 |
| $ | 209,928 |
| $ | 167,842 |
|
Real estate: |
|
|
|
|
|
|
|
|
|
|
|
|
|
|
|
|
|
|
|
|
|
|
|
| ||||||||
Commercial |
| 410,382 |
| 328,986 |
| 257,202 |
| 187,044 |
| 167,378 |
|
| 576,172 |
| 410,382 |
| 328,986 |
| 257,202 |
| 187,044 |
| ||||||||||
Construction |
| 138,318 |
| 127,180 |
| 130,074 |
| 139,319 |
| 123,788 |
|
| 196,851 |
| 138,318 |
| 127,180 |
| 130,074 |
| 139,319 |
| ||||||||||
Residential |
| 151,575 |
| 149,293 |
| 150,371 |
| 189,613 |
| 162,100 |
|
| 150,244 |
| 151,575 |
| 149,293 |
| 150,371 |
| 189,613 |
| ||||||||||
Consumer and other |
|
| 36,616 |
| 39,452 |
| 36,303 |
| 31,275 |
| 28,570 |
|
|
| 35,542 |
| 36,616 |
| 39,452 |
| 36,303 |
| 31,275 |
| ||||||||
Less: Portfolio loans held for sale |
|
| — |
| — |
| — |
| (35,294 | ) |
| (39,307 | ) |
|
| — |
| — |
| — |
| — |
| (35,294 | ) | |||||||
|
|
|
|
|
|
|
|
|
|
|
|
| ||||||||||||||||||||
Total Loans |
| $ | 1,002,379 |
| $ | 898,505 |
| $ | 783,878 |
| $ | 679,799 |
| $ | 602,747 |
|
| $ | 1,311,723 |
| $ | 1,002,379 |
| $ | 898,505 |
| $ | 783,878 |
| $ | 679,799 |
|
|
|
|
|
|
|
|
|
|
|
|
|
| ||||||||||||||||||||
|
|
|
|
|
| |||||||||||||||||||||||||||
|
|
|
| December 31, |
| |||||||||||||||||||||||||||
|
| December 31, |
|
|
| |||||||||||||||||||||||||||
|
|
|
| 2006 |
| 2005 |
| 2004 |
| 2003 |
| 2002 |
| |||||||||||||||||||
|
| 2005 |
| 2004 |
| 2003 |
| 2002 |
| 2001 |
|
|
|
|
|
|
| |||||||||||||||
|
|
|
|
|
|
| ||||||||||||||||||||||||||
Commercial and industrial |
|
| 26.5 | % |
| 28.2 | % |
| 26.8 | % |
| 24.7 | % |
| 26.6 | % |
|
| 26.9 | % |
| 26.5 | % |
| 28.2 | % |
| 26.8 | % |
| 24.7 | % |
Real estate: |
|
|
|
|
|
|
|
|
|
|
|
|
|
|
|
|
|
|
|
|
|
|
|
| ||||||||
Commercial |
| 40.9 | % |
| 36.6 | % |
| 32.8 | % |
| 27.5 | % |
| 27.8 | % |
| 43.9 | % |
| 40.9 | % |
| 36.6 | % |
| 32.8 | % |
| 27.5 | % | ||
Construction |
| 13.8 | % |
| 14.2 | % |
| 16.6 | % |
| 20.5 | % |
| 20.5 | % |
| 15.0 | % |
| 13.8 | % |
| 14.2 | % |
| 16.6 | % |
| 20.5 | % | ||
Residential |
| 15.1 | % |
| 16.6 | % |
| 19.2 | % |
| 27.9 | % |
| 26.9 | % |
| 11.5 | % |
| 15.1 | % |
| 16.6 | % |
| 19.2 | % |
| 27.9 | % | ||
Consumer and other |
|
| 3.7 | % |
| 4.4 | % |
| 4.6 | % |
| 4.6 | % |
| 4.7 | % |
|
| 2.7 | % |
| 3.7 | % |
| 4.4 | % |
| 4.6 | % |
| 4.6 | % |
Less: Portfolio loans held for sale |
|
| — |
| — |
| — |
| -5.2 | % |
| -6.5 | % |
|
| — |
| — |
| — |
| — |
| -5.2 | % | |||||||
|
|
|
|
|
|
|
|
|
|
|
|
| ||||||||||||||||||||
Total Loans |
| 100.0 | % |
| 100.0 | % |
| 100.0 | % |
| 100.0 | % |
| 100.0 | % |
| 100.0 | % |
| 100.0 | % |
| 100.0 | % |
| 100.0 | % |
| 100.0 | % | ||
|
|
|
|
|
|
|
|
|
|
|
|
| ||||||||||||||||||||
Commercial and industrial loans include loans to a diverse range of industries that are made based on the borrowers’borrower’s character, experience, general credit strength, and ability to generate cash flows for repayment from income sources, even though such loans may also be secured by real estate or other assets. The credit risk related to commercial loans is largely influenced by general economic conditions and the resulting impact on a borrower’s operations. Commercial and industrial loans are primarily made to borrowers operating within the manufacturing industry. This industry sector represents approximately $114 million, or approximately 9% of the Bank’s loan portfolio at December 31, 2006. The largest component within this industry sector are loans to aerospace product and parts manufacturers.
Real estate loans are also based on the borrowers’borrower’s character, but more emphasis is placed on the estimated collateral values. Real estate commercial loans are mainly for owner-occupied business and industrial properties, multifamily properties, and other commercial properties on which income from the property is the primary source of repayment. Credit risk on these loan types is managed in a similar manner to commercial loans and real estate construction loans by employing sound underwriting guidelines, lending to borrowers in local markets, and formally reviewing the borrower’s financial soundness and relationship on an ongoing basis. In many cases the Company will take additionalguidelines. As of December 31, 2006, approximately $285 million of real estate collateralloans, or 22% of the Bank’s loan portfolio are secured by commercial and multi-family properties that are located within the Bank’s two primary metropolitan markets. These loans are underwritten based on the cash flow coverage of the property, typically meet the Bank’s loan to further securevalue guidelines, and generally require either the overall lending relationship.limited or full guaranty of principal sponsors of the credit.
23
Real estate construction loans, relating to residential and commercial properties, represent financing secured by real estate under construction for eventual sale. Real estate constructionAt December 31, 2006, the largest component of this category consists of loans to residential builders. These loans represent $107 million, or 8%, of the Bank’s total loans. The majority of these loans are madegranted to developers and project managers whobuilders within the Bank’s primary markets. The loans are well known to the Company, have prior successful project experience,secured by single family residences, of which, approximately $20 million, are constructed for display or inventory and are well capitalized. Projects undertaken by these developers are carefully reviewed bynot pre-sold. The Bank requires third party disbursement on the Company to ensure that they are economically viable. The credit risk associated with real estate construction loans is confined to specific geographic areas, but is also influenced by general economic conditions. The Company controlsmajority of its builder portfolio and the credit risk on these types of loans by making loans in the Company’s primary markets to local developers with which the Company has a strong relationship. In addition, the CompanyBank reviews the merits of each individual project andprojects regularly monitors projectfor progress and construction advances.status.
Real estate residential loans include residential mortgages (which consist of loans that, due to size, do not qualify for conventional home mortgages, that the Company sells into the secondary market and second mortgages) and home equity lines. Residential mortgage loans are usually limited to a maximum of 80% of collateral value.
Consumer and other loans represent loans to individuals on both a secured by personal assets such as automobiles or investment securities.and unsecured nature. Credit risk is controlled by thoroughly reviewing the creditworthiness of the borrowers as well as taking appropriate collateral and guaranty positions on such loans.a case-by-case basis.
24
Portfolio loans held for sale relate to loans originated by the Southeast Kansas branches that were sold on April 4, 2003.
Factors that are critical to managing overall credit quality are sound loan underwriting and administration, systematic monitoring of existing loans and commitments, effective loan review on an ongoing basis, early identification of potential problems, an adequate allowance for loan losses, and sound nonaccrualnon-accrual and charge-off policies.
Significant loan concentrations are considered to exist for a financial institution when there are amounts loaned to numerous borrowers engaged in similar activities that would cause them to be similarly impacted by economic or other conditions. At December 31, 2005,2006, no significant concentrations exceeding 10% of total loans existed in the Company’s loan portfolio, in excess of 10% of loans.except as described above.
24
Loans at December 31, 20052006 mature or reprice as follows:
|
| Loans Maturing or Repricing |
|
| Loans Maturing or Repricing |
| ||||||||||||||||||||
|
|
|
|
| ||||||||||||||||||||||
(in thousands) |
| In One |
| After One |
| After |
| Total |
|
| In One |
| After One |
| After |
| Total |
| ||||||||
|
|
|
|
|
|
|
|
|
| |||||||||||||||||
Fixed Rate Loans (1) |
|
|
|
|
|
|
|
|
|
|
|
|
|
|
|
|
|
|
|
|
|
|
| |||
Commercial and industrial |
| $ | 21,150 |
| $ | 52,124 |
| $ | 711 |
| $ | 73,985 |
|
| $ | 37,372 |
| $ | 90,831 |
| $ | 4,546 |
| $ | 132,749 |
|
Real estate: |
|
|
|
|
|
|
|
|
|
|
|
|
|
|
|
|
|
|
|
| ||||||
Commercial |
| 32,640 |
| 158,413 |
| 20,953 |
| 212,006 |
|
| 76,441 |
| 269,822 |
| 35,734 |
| 381,997 |
| ||||||||
Construction |
| 5,416 |
| 15,602 |
| 2,557 |
| 23,575 |
|
| 47,190 |
| 22,917 |
| 7,324 |
| 77,431 |
| ||||||||
Residential |
| 9,603 |
| 28,040 |
| 140 |
| 37,783 |
|
| 16,124 |
| 29,865 |
| — |
| 45,989 |
| ||||||||
Consumer and other |
|
| 1,412 |
| 4,421 |
| 6,549 |
| 12,382 |
|
|
| 4,744 |
| 6,391 |
| 3,240 |
| 14,375 |
| ||||||
|
|
|
|
|
|
|
|
|
|
| ||||||||||||||||
Total |
| $ | 70,221 |
| $ | 258,600 |
| $ | 30,910 |
| $ | 359,731 |
|
| $ | 181,871 |
| $ | 419,826 |
| $ | 50,844 |
| $ | 652,541 |
|
|
|
|
|
|
|
|
|
|
|
| ||||||||||||||||
Variable Rate Loans (1) (2) |
|
|
|
|
|
|
|
|
|
|
|
|
|
|
|
|
|
|
|
| ||||||
Commercial and industrial |
| $ | 217,066 |
| $ | — |
| $ | — |
| $ | 217,066 |
|
| $ | 220,165 |
| $ | — |
| $ | — |
| $ | 220,165 |
|
Real estate: |
|
|
|
|
|
|
|
|
|
|
|
|
|
|
|
|
|
|
|
| ||||||
Commercial |
| 172,813 |
| — |
| — |
| 172,813 |
|
| 194,175 |
| — |
| — |
| 194,175 |
| ||||||||
Construction |
| 114,743 |
| — |
| — |
| 114,743 |
|
| 119,420 |
| — |
| — |
| 119,420 |
| ||||||||
Residential |
| 113,792 |
| — |
| — |
| 113,792 |
|
| 104,255 |
| — |
| — |
| 104,255 |
| ||||||||
Consumer and other |
|
| 24,234 |
| — |
| — |
| 24,234 |
|
|
| 21,167 |
| — |
| — |
| 21,167 |
| ||||||
|
|
|
|
|
|
|
|
|
|
| ||||||||||||||||
Total |
| $ | 642,648 |
| $ | — |
| $ | — |
| $ | 642,648 |
|
| $ | 659,182 |
| $ | — |
| $ | — |
| $ | 659,182 |
|
|
|
|
|
|
|
|
|
|
|
| ||||||||||||||||
Loans (1) (2) |
|
|
|
|
|
|
|
|
|
|
|
|
|
|
|
|
|
|
|
| ||||||
Commercial and industrial |
| $ | 238,216 |
| $ | 52,124 |
| $ | 711 |
| $ | 291,051 |
|
| $ | 257,537 |
| $ | 90,831 |
| $ | 4,546 |
| $ | 352,914 |
|
Real estate: |
|
|
|
|
|
|
|
|
|
|
|
|
|
|
|
|
|
|
|
| ||||||
Commercial |
| 205,453 |
| 158,413 |
| 20,953 |
| 384,819 |
|
| 270,616 |
| 269,822 |
| 35,734 |
| 576,172 |
| ||||||||
Construction |
| 120,159 |
| 15,602 |
| 2,557 |
| 138,318 |
|
| 166,610 |
| 22,917 |
| 7,324 |
| 196,851 |
| ||||||||
Residential |
| 123,395 |
| 28,040 |
| 140 |
| 151,575 |
|
| 120,379 |
| 29,865 |
| — |
| 150,244 |
| ||||||||
Consumer and other |
|
| 25,646 |
| 4,421 |
| 6,549 |
| 36,616 |
|
|
| 25,911 |
| 6,391 |
| 3,240 |
| 35,542 |
| ||||||
|
|
|
|
|
|
|
|
|
|
| ||||||||||||||||
Total |
| $ | 712,869 |
| $ | 258,600 |
| $ | 30,910 |
| $ | 1,002,379 |
|
| $ | 841,053 |
| $ | 419,826 |
| $ | 50,844 |
| $ | 1,311,723 |
|
|
|
|
|
|
|
|
|
|
|
| ||||||||||||||||
(1) Loan balances are shown net of unearned loan fees. |
(2) Not adjusted for impact of interest rate swap agreements. |
As indicated in the above maturity table, mosthalf of ourthe lending business is done on a variable-ratevariable rate basis based on prime.prime or the London Interbank Offered Rate (“LIBOR”.) In addition, most loan originations have one to three year maturities. While the loan relationship has a much longer life, the shorter maturities allow the Company to revisit the underwriting and pricing on each relationship periodically.
Fixed rate loans comprise 36%approximately 50% of the loan portfolio at December 31, 20052006 versus 27%36% at the end of 2004.2005. This trend is consistent with the recentflat to inverted yield curve environment, as borrowers are choosing fixed rate loans with one to three year terms that have lower interest rates than variable rate environment, especially with a flat yield curve.alternatives. Management monitors this mix as part of its interest rate risk management. See “Interest Rate Risk” section.
25
Allowance for Loan Losses
The loan portfolio is the primary asset subject to credit risk. Credit risk is controlled and monitored through the use of lending standards, a thorough review of potential borrowers, and ongoing review of loan payment performance. Active asset quality administration, including early problem loan identification and timely resolution of problems, further ensures appropriate management of credit risk and minimization of loan losses. Credit risk management for each loan type is discussed briefly in the section entitled “Loans.”
The allowance for loan losses represents management’s estimate of an amount adequate to provide for probable credit losses in the loan portfolio at the balance sheet date. Management’s evaluation of the adequacy of the allowance for loan losses is based on management’s ongoing review and grading of the loan portfolio, consideration of past loss experience, trends in past due and nonperforming loans, risk characteristics of the various classifications of loans, existing economic conditions, the fair value of underlying collateral, and other factors that could affect probable credit losses. Assessing these numerous factors involves significant judgment. Management considers the allowance for loan losses a critical accounting policy (see section “Critical Accounting Policies”).
25
The following table summarizes changes in the allowance for loan losses arising from loans charged off and recoveries on loans previously charged off, by loan category, and additions to the allowance charged to expense.
|
| At December 31, |
|
| At December 31, |
| ||||||||||||||||||||||||||
|
|
|
|
| ||||||||||||||||||||||||||||
(in thousands) |
| 2005 |
| 2004 |
| 2003 |
| 2002 |
| 2001 |
|
| 2006 |
| 2005 |
| 2004 |
| 2003 |
| 2002 |
| ||||||||||
|
|
|
|
|
|
|
|
|
|
|
| |||||||||||||||||||||
Allowance at beginning of period |
| $ | 11,665 |
| $ | 10,590 |
| $ | 8,600 |
| $ | 7,296 |
| $ | 7,097 |
|
| $ | 12,990 |
| $ | 11,665 |
| $ | 10,590 |
| $ | 8,600 |
| $ | 7,296 |
|
Acquired allowance for loan losses |
|
| 3,069 |
| — |
| — |
| — |
| — |
| ||||||||||||||||||||
Loans charged off: |
|
|
|
|
|
|
|
|
|
|
|
|
|
|
|
|
|
|
|
|
|
|
|
| ||||||||
Commercial and industrial |
| 171 |
| 425 |
| 1,492 |
| 700 |
| 2,538 |
|
| 1,067 |
| 171 |
| 425 |
| 1,492 |
| 700 |
| ||||||||||
Real estate: |
|
|
|
|
|
|
|
|
|
|
|
|
|
|
|
|
|
|
|
|
|
| ||||||||||
Commercial |
| 424 |
| 577 |
| — |
| 25 |
| 279 |
|
| 25 |
| 424 |
| 577 |
| — |
| 25 |
| ||||||||||
Construction |
| — |
| — |
| — |
| — |
| — |
|
| — |
| — |
| — |
| — |
| — |
| ||||||||||
Residential |
| — |
| 100 |
| 335 |
| 417 |
| 165 |
|
| 504 |
| — |
| 100 |
| 335 |
| 417 |
| ||||||||||
Consumer and other |
| 49 |
| 194 |
| 77 |
| 104 |
| 170 |
|
| 2 |
| 49 |
| 194 |
| 77 |
| 104 |
| ||||||||||
|
|
|
|
|
|
|
|
|
|
|
|
| ||||||||||||||||||||
Total loans charged off |
| 644 |
| 1,296 |
| 1,904 |
| 1,246 |
| 3,152 |
|
| 1,598 |
| 644 |
| 1,296 |
| 1,904 |
| 1,246 |
| ||||||||||
|
|
|
|
|
|
|
|
|
|
|
|
| ||||||||||||||||||||
Recoveries of loans previously charged off: |
|
|
|
|
|
|
|
|
|
|
|
|
|
|
|
|
|
|
|
|
|
|
|
| ||||||||
Commercial and industrial |
| 209 |
| 92 |
| 107 |
| 55 |
| 38 |
|
| 362 |
| 209 |
| 92 |
| 107 |
| 55 |
| ||||||||||
Real estate: |
|
|
|
|
|
|
|
|
|
|
|
|
|
|
|
|
|
|
|
|
|
| ||||||||||
Commercial |
| 74 |
| — |
| 66 |
| 8 |
| 25 |
|
| 1 |
| 74 |
| — |
| 66 |
| 8 |
| ||||||||||
Construction |
| — |
| — |
| — |
| — |
| — |
|
| — |
| — |
| — |
| — |
| — |
| ||||||||||
Residential |
| 177 |
| 42 |
| 38 |
| 192 |
| 52 |
|
| 31 |
| 177 |
| 42 |
| 38 |
| 192 |
| ||||||||||
Consumer and other |
| 19 |
| 25 |
| 56 |
| 44 |
| 6 |
|
| 6 |
| 19 |
| 25 |
| 56 |
| 44 |
| ||||||||||
|
|
|
|
|
|
|
|
|
|
|
|
| ||||||||||||||||||||
Total recoveries of loans |
| 479 |
| 159 |
| 267 |
| 299 |
| 121 |
|
| 400 |
| 479 |
| 159 |
| 267 |
| 299 |
| ||||||||||
|
|
|
|
|
|
|
|
|
|
|
|
| ||||||||||||||||||||
Net loans charged off |
|
| 165 |
| 1,137 |
| 1,637 |
| 947 |
| 3,031 |
|
|
| 1,198 |
| 165 |
| 1,137 |
| 1,637 |
| 947 |
| ||||||||
|
|
|
|
|
|
|
|
|
|
|
|
| ||||||||||||||||||||
Provision for loan losses |
|
| 1,490 |
| 2,212 |
| 3,627 |
| 2,251 |
| 3,230 |
|
|
| 2,127 |
| 1,490 |
| 2,212 |
| 3,627 |
| 2,251 |
| ||||||||
|
|
|
|
|
|
|
|
|
|
|
|
| ||||||||||||||||||||
Allowance at end of period |
| $ | 12,990 |
| $ | 11,665 |
| $ | 10,590 |
| $ | 8,600 |
| $ | 7,296 |
|
| $ | 16,988 |
| $ | 12,990 |
| $ | 11,665 |
| $ | 10,590 |
| $ | 8,600 |
|
|
|
|
|
|
|
|
|
|
|
|
|
| ||||||||||||||||||||
Average loans |
| $ | 964,259 |
| $ | 847,270 |
| $ | 738,572 |
| $ | 693,551 |
| $ | 613,539 |
|
| $ | 1,159,110 |
| $ | 964,259 |
| $ | 847,270 |
| $ | 738,572 |
| $ | 693,551 |
|
Total loans |
|
| 1,002,379 |
| 898,505 |
| 783,878 |
| 679,799 |
| 602,747 |
|
|
| 1,311,723 |
| 1,002,379 |
| 898,505 |
| 783,878 |
| 679,799 |
| ||||||||
Nonperforming loans |
|
| 1,421 |
| 1,827 |
| 1,548 |
| 3,888 |
| 3,749 |
|
|
| 7,975 |
| 1,421 |
| 1,827 |
| 1,548 |
| 3,888 |
| ||||||||
Net charge-offs to average loans |
|
| 0.02 | % |
| 0.13 | % |
| 0.22 | % |
| 0.14 | % |
| 0.49 |
|
|
| 0.10 | % |
| 0.02 | % |
| 0.13 | % |
| 0.22 | % |
| 0.14 | % |
Allowance for loan losses to loans |
|
| 1.30 |
| 1.30 |
| 1.35 |
| 1.27 |
| 1.21 |
|
|
| 1.30 |
| 1.30 |
| 1.30 |
| 1.35 |
| 1.27 |
| ||||||||
At the acquisition date, the NorthStar allowance for loan losses was $3.1 million or 1.85% of total loans. This percentage, along with existence of the Reserved Credit Escrow (described in Note 2 – Acquisitions in this filing), demonstrates the higher level of credit risk inherent in that loan portfolio.
Loans charged off are subject to continuous review, and specific efforts are taken to achieve maximum recovery of principal, accrued interest, and related expenses.
The Company’s credit management policies and procedures focus on identifying, measuring, and controlling credit exposure. These procedures employ a lender-initiated system of rating credits, which is ratified in the loan approval process and subsequently tested in internal loan reviews and regulatory bank examinations. The system requires rating all loans at the time they are made, at each renewal date and as conditions warrant.
26Adversely rated credits, including loans requiring close monitoring, which would normally not be considered criticized credits by regulators, are included on a monthly loan watch list. Other loans are added whenever any adverse circumstances are detected which might affect the borrower’s ability to meet the terms of the loan. This could be initiated by any of the following:
| ||
| 1) | delinquency of a scheduled loan payment, |
| 2) | deterioration in the borrower’s financial condition identified in a review of periodic financial statements, |
| 3) | decrease in the value of collateral securing the loan, or |
| 4) | change in the economic environment in which the borrower operates. |
26
Loans on the watch list require detailed loan status reports, including recommended corrective actions, prepared by the responsible loan officer every three months. These reports are then discussed in formal meetings with the Senior Credit Administration Officer, Chief Credit Officer and Chief Executive Officer of the Bank.
Downgrades of loan risk ratings may be initiated by the responsible loan officer, internal loan review, or the credit analyst department at any time. Upgrades of certain risk ratings may only be made with the concurrence of the Senior Credit Administration Officer, Chief Credit Officer and Loan Review Officer.
In determining the allowance and the related provision for loan losses, three principal elements are considered: | ||
| 1) | specific allocations based upon probable losses identified during a |
| 2) | allocations based principally on the Company’s risk rating formulas, and |
| 3) | an unallocated allowance based on subjective factors. |
The first element reflects management’s estimate of probable losses based upon a systematic review of specific loans considered to be impaired. These estimates are based upon collateral exposure, if they are collateral dependent for collection. Otherwise, discounted cash flows are estimated and used to assign loss.
The second element reflects the application of our loan rating system. This rating system is similar to those employed by state and federal banking regulators. Loans are rated and assigned a loss allocation factor for each category that is consistent with our historical losses, adjusted for environmental factors. The higher the rating assigned to a loan, the greater the allocation percentage that is applied.
The unallocated allowance is based on management’s evaluation of conditions that are not directly reflected in the determination of the formula and specific allowances. The evaluation of the inherent loss with respect to these conditions is subject to a higher degree of uncertainty because they may not be identified with specific problem credits or portfolio segments. The conditions evaluated in connection with the unallocated allowance include the following: | ||
| • | general economic and business conditions affecting our key lending areas; |
| • | credit quality trends (including trends in nonperforming loans expected to result from existing conditions); |
| • | collateral values; |
| • | loan volumes and concentrations; |
| • | competitive factors resulting in shifts in underwriting criteria; |
| • | specific industry conditions within portfolio segments; |
| • | recent loss experience in particular segments of the portfolio; |
| • | bank regulatory examination results; and |
| • | findings of our internal loan review department. |
Executive management reviews these conditions quarterly in discussion with our entire lending staff. To the extent that any of these conditions is evidenced by a specifically identifiable problem credit or portfolio segment as of the evaluation date, management’s estimate of the effect of such conditions may be reflected as a specific allowance, applicable to such credit or portfolio segment. Where any of these conditions is not evidenced by a specifically identifiable problem credit or portfolio segment as of the evaluation date, management’s evaluation of the probable loss related to such condition is reflected in the unallocated allowance.
Based on this quantitative and qualitative analysis, provisions are made to the allowance for loan losses. Such provisions are reflected in our consolidated statements of income.
The allocation of the allowance for loan losses by loan category is a result of the analysis above. The allocation methodology applied by the Company, designed to assess the adequacy of the allowance for loan losses, focuses on changes in the size and character of the loan portfolio, changes in levels of impaired and other nonperforming loans, the risk inherent in specific loans, concentrations of loans to specific borrowers or industries, existing economic conditions, and historical losses on each portfolio category. Because each of the criteria used is subject to change, the allocation of the allowance for loan losses is made for analytical purposes and is not necessarily indicative of the trend of future loan losses in any particular loan category.
27
The total allowance is available to absorb losses from any segment of the portfolio. Management continues to target and maintain the allowance for loan losses equal to the allocation methodology plus an unallocated portion, as determined by economic conditions and other qualitative and quantitative factors affecting the Company’s borrowers, as described above.
27
The following table is a summary of the allocation of the allowance for loan losses for the five years ended December 31, 2005:2006:
|
| December 31, |
|
| December 31, |
| ||||||||||||||||||||||||||||||||||||||||||||||||||||||||
|
|
|
|
| ||||||||||||||||||||||||||||||||||||||||||||||||||||||||||
|
| 2005 |
| 2004 |
| 2003 |
| 2002 |
| 2001 |
|
| 2006 |
| 2005 |
| 2004 |
| 2003 |
| 2002 |
| ||||||||||||||||||||||||||||||||||||||||
|
|
|
|
|
|
|
|
|
|
|
|
| ||||||||||||||||||||||||||||||||||||||||||||||||||
(in thousands) |
| Allowance |
| Percent by |
| Allowance |
| Percent by |
| Allowance |
| Percent by |
| Allowance |
| Percent by |
| Allowance |
| Percent by |
|
| Allowance |
| Percent by |
| Allowance |
| Percent by |
| Allowance |
| Percent by |
| Allowance |
| Percent by |
| Allowance |
| Percent by |
| ||||||||||||||||||||
|
|
|
|
|
|
|
|
|
|
|
|
|
|
|
|
|
|
|
|
|
| |||||||||||||||||||||||||||||||||||||||||
Commercial and industrial |
| $ | 3,172 |
| 26.5 | % | $ | 2,948 |
| 28.2 | % | $ | 2,948 |
| 26.8 | % | $ | 2,846 |
| 24.7 | % | $ | 2,366 |
| 26.6 | % |
| $ | 3,485 |
| 26.9 | % | $ | 3,172 |
| 26.5 | % | $ | 2,948 |
| 28.2 | % | $ | 2,948 |
| 26.8 | % | $ | 2,846 |
| 24.7 | % | ||||||||||
Real estate: |
|
|
|
|
|
|
|
|
|
|
|
|
|
|
|
|
|
|
|
|
|
|
|
|
|
|
|
|
|
|
|
|
|
|
|
|
|
|
|
|
|
|
|
| ||||||||||||||||||
Commercial |
| 4,245 |
| 40.9 |
| 3,671 |
| 36.6 |
| 3,715 |
| 32.8 |
| 1,903 |
| 27.5 |
| 1,915 |
| 27.8 |
|
| 5,710 |
| 43.9 |
| 4,245 |
| 40.9 |
| 3,671 |
| 36.6 |
| 3,715 |
| 32.8 |
| 1,903 |
| 27.5 |
| ||||||||||||||||||||
Construction |
| 1,048 |
| 13.8 |
| 1,037 |
| 14.2 |
| 1,099 |
| 16.6 |
| 1,062 |
| 20.5 |
| 932 |
| 20.5 |
|
| 2,927 |
| 15.0 |
| 1,048 |
| 13.8 |
| 1,037 |
| 14.2 |
| 1,099 |
| 16.6 |
| 1,062 |
| 20.5 |
| ||||||||||||||||||||
Residential |
| 1,774 |
| 15.1 |
| 1,903 |
| 16.6 |
| 2,093 |
| 19.2 |
| 2,369 |
| 27.9 |
| 1,625 |
| 26.9 |
|
| 2,056 |
| 11.5 |
| 1,774 |
| 15.1 |
| 1,903 |
| 16.6 |
| 2,093 |
| 19.2 |
| 2,369 |
| 27.9 |
| ||||||||||||||||||||
Consumer and other |
|
| 313 |
| 3.7 |
| 283 |
| 4.4 |
| 245 |
| 4.6 |
| 244 |
| 4.6 |
| 198 |
| 4.7 |
|
|
| 513 |
| 2.7 |
| 313 |
| 3.7 |
| 283 |
| 4.4 |
| 245 |
| 4.6 |
| 244 |
| 4.6 |
| ||||||||||||||||||
Loans held for sale |
|
| — |
| — |
| — |
| — |
| — |
| — |
| — |
| (5.2 | ) |
| — |
| (6.5 | ) |
|
| — |
| — |
| — |
| — |
| — |
| — |
| — |
| — |
| — |
| (5.2 | ) | |||||||||||||||||
Not allocated |
|
| 2,439 |
|
|
| 1,823 |
|
|
| 490 |
|
|
| 176 |
|
|
| 260 |
|
|
|
|
| 2,296 |
|
|
| 2,439 |
|
|
| 1,823 |
|
|
| 490 |
|
|
| 176 |
|
|
| ||||||||||||||||||
|
|
|
|
|
|
|
|
|
|
|
|
|
|
|
|
|
|
|
|
|
|
|
|
|
|
|
|
|
|
|
|
| ||||||||||||||||||||||||||||||
Total allowance |
| $ | 12,990 |
| 100.0 | % | $ | 11,665 |
| 100.0 | % | $ | 10,590 |
| 100.0 | % | $ | 8,600 |
| 100.0 | % | $ | 7,296 |
| 100.0 | % |
| $ | 16,988 |
| 100.0 | % | $ | 12,990 |
| 100.0 | % | $ | 11,665 |
| 100.0 | % | $ | 10,590 |
| 100.0 | % | $ | 8,600 |
| 100.0 | % | ||||||||||
|
|
|
|
|
|
|
|
|
|
|
|
|
|
|
|
|
|
|
|
|
|
| ||||||||||||||||||||||||||||||||||||||||
Prior to 2004, the methods of calculating the allowance requirements had not changed significantly over time. The reallocations among different categories of loans that appear between periods were the result of the redistribution of the individual loans that comprise the aggregate portfolio due to the factors listed above. However, the perception of risk with respect to particular loans within the portfolio will change over time as a result of the characteristics and performance of those loans, overall economic and market trends, and the actual and expected trends in nonperforming loans. Consequently, while there are no specific allocations of the allowance resulting from economic or market conditions or actual or expected trends in nonperforming loans, these factors are considered in the initial assignment of risk ratings to loans, subsequent changes to those risk ratings and to a lesser extent in the size of the unallocated allowance amount.
Beginning in 2004, as a part of an overall effort to further improve its risk assessment; the Company refined its methodology with special attention to the unallocated allowance. The unallocated allowance is based on factors that cannot necessarily be associated with a specific loan or loan category. In its 2004 assessment, management focused on the following factors and conditions: | ||||||||||||||||||||||||||||||||||||||||||||||||||||||||||||||||||||
| • | There is a level of imprecision necessarily inherent in the estimates of expected loan losses, and the unallocated reserve gives reasonable assurance that this level of imprecision in our formula methodologies is adequately provided for. |
| • | With respect to the real estate sector, management considered the continued weakness in the commercial office market with vacancy rates continuing to remain high and rents continuing to remain soft. |
| • | Pressures to maintain and grow the loan portfolio in a slower economic environment with increasing competition from de novo institutions and larger competitors have to some degree affected credit granting criteria adversely. The Company monitors the disposition of all credits, which have been approved through its Executive Loan Committee in order to better understand competitive shifts in underwriting criteria. |
| • | While the Bank’s target client has not changed, the Bank is focusing more of its calling efforts on larger middle market commercial and industrial companies. This move “up market” results in larger average loans per client, and generally more complex credit structures. |
While the Company has no significant specific industry concentration risk, analysis at the time showed that over 60% of the loan portfolio was dependent on real estate collateral. The Company has policies, guidelines, and individual risk ratings in place to control this exposure at the transaction level. However, the percentage of the portfolio secured by commercial real estate increased from 27.5%28% at December 31, 2002 to 36.6%37% at December 31, 2004. Given the trend of rising rates inherent in the current economic cycle and the likely adverse impacts on borrowers’ debt service coverage ratios, management believed it was prudent to increase the unallocated allowance component.
Additionally, the Company continues to be committed to a strategy of acquiring relationships with larger commercial and industrial companies. The percentage of the portfolio represented by these clients increased from 24.7%25% at December 31, 2002 to 28.2%28% at December 31, 2004. Management believed it was prudent to increase the percentage of the unallocated allowance to cover the risks inherent in the higher average loan size of these relationships.
28
Finally, management believed that the level of competition for credit relationships had increased substantially over the prior year in both of our primary markets. During 2004, the entry of National City Bank into the St. Louis market along with six new banking charters are examples of the increased level of competition. To the extent that substantially increased levels of competition for credit may inherently result in an increased level of credit risk, management believed it was prudent to increase the Company’s unallocated allowance component.
28
As a result of the above analysis, management increased the unallocated allowance by $1.3 million from 2003 to 2004. The factors noted for 2004 arewere still applicable at December 31, 2005.2005 and 2006. Additionally, the residential real estate markets in both St. Louis and Kansas City are experiencing a slow down in new home sales, thus affecting both builder profitability and the level of unsold inventory on the market. The increasepotential risks of softening residential real estate markets have been offset in part by a strengthening commercial and industrial real estate market in both St. Louis and Kansas City, and the relatively static levels of interest rates in the second half of 2006. The unallocated allowancereserve amount as a percentage of the total reserve has ranged from 200414% to 2005 is primarily due to19% in the increase in loan balances andlast three years, consistent with the continued increase in interest rate levels and their impact on borrower cash flows and real estate values.various factors noted above.
Nonperforming assets include nonaccrualnon-accrual loans, loans with payments past due 90 days or more and still accruing interest, restructured loans and foreclosed real estate. The following table presents the categories of nonperforming assets and certain ratios as of the dates indicated:
|
| At December 31, |
|
| At December 31, |
| ||||||||||||||||||||||||||
|
|
|
|
| ||||||||||||||||||||||||||||
(in thousands) |
| 2005 |
| 2004 |
| 2003 |
| 2002 |
| 2001 |
|
| 2006 |
| 2005 |
| 2004 |
| 2003 |
| 2002 |
| ||||||||||
|
|
|
|
|
|
|
|
|
|
|
| |||||||||||||||||||||
Non-accrual loans |
| $ | 1,421 |
| $ | 1,827 |
| $ | 1,548 |
| $ | 2,212 |
| $ | 2,506 |
|
| $ | 6,363 |
| $ | 1,421 |
| $ | 1,827 |
| $ | 1,548 |
| $ | 2,212 |
|
Loans past due 90 days or more and still accruing interest |
|
| — |
| — |
| — |
| — |
| — |
|
|
| 112 |
| — |
| — |
| — |
| — |
| ||||||||
Restructured loans |
|
| — |
| — |
| — |
| 1,676 |
| 1,243 |
|
|
| — |
| — |
| — |
| — |
| 1,676 |
| ||||||||
|
|
|
|
|
|
|
|
|
|
|
|
| ||||||||||||||||||||
Total noperforming loans |
| 1,421 |
| 1,827 |
| 1,548 |
| 3,888 |
| 3,749 |
| |||||||||||||||||||||
Total nonperforming loans |
|
| 6,475 |
| 1,421 |
| 1,827 |
| 1,548 |
| 3,888 |
| ||||||||||||||||||||
Foreclosed property |
|
| — |
| 123 |
| — |
| 125 |
| 138 |
|
|
| 1,500 |
| — |
| 123 |
| — |
| 125 |
| ||||||||
|
|
|
|
|
|
|
|
|
|
|
|
| ||||||||||||||||||||
Total non performing assets |
| $ | 1,421 |
| $ | 1,950 |
| $ | 1,548 |
| $ | 4,013 |
| $ | 3,887 |
| ||||||||||||||||
Total nonperforming assets |
| $ | 7,975 |
| $ | 1,421 |
| $ | 1,950 |
| $ | 1,548 |
| $ | 4,013 |
| ||||||||||||||||
|
|
|
|
|
|
|
|
|
|
|
|
| ||||||||||||||||||||
Total assets |
| $ | 1,286,968 |
| $ | 1,059,950 |
| $ | 907,726 |
| $ | 875,987 |
| $ | 795,250 |
|
| $ | 1,535,587 |
| $ | 1,286,968 |
| $ | 1,059,950 |
| $ | 907,726 |
| $ | 875,987 |
|
Total loans |
|
| 1,002,379 |
| 898,505 |
| 783,878 |
| 679,799 |
| 602,747 |
|
|
| 1,311,723 |
| 1,002,379 |
| 898,505 |
| 783,878 |
| 679,799 |
| ||||||||
Total loans plus foreclosed property |
|
| 1,002,379 |
| 898,628 |
| 783,878 |
| 679,924 |
| 602,885 |
|
|
| 1,313,223 |
| 1,002,379 |
| 898,628 |
| 783,878 |
| 679,924 |
| ||||||||
Nonperforming loans to loans |
|
| 0.14 | % |
| 0.20 | % |
| 0.20 | % |
| 0.57 | % |
| 0.62 | % |
|
| 0.49 | % |
| 0.14 | % |
| 0.20 | % |
| 0.20 | % |
| 0.57 | % |
Nonperforming assets to loans plus foreclosed property |
|
| 0.14 |
| 0.22 |
| 0.20 |
| 0.59 |
| 0.64 |
|
|
| 0.61 |
| 0.14 |
| 0.22 |
| 0.20 |
| 0.59 |
| ||||||||
Nonperforming assets to total assets |
|
| 0.11 |
| 0.18 |
| 0.17 |
| 0.46 |
| 0.49 |
|
|
| 0.52 |
| 0.11 |
| 0.18 |
| 0.17 |
| 0.46 |
| ||||||||
Allowance for loan losses to non-performing loan |
|
| 914.00 | % |
| 639.00 | % |
| 684.00 | % |
| 221.00 | % |
| 195.00 | % | ||||||||||||||||
Allowance for loan losses to nonperforming loans |
|
| 264.00 | % |
| 914.00 | % |
| 639.00 | % |
| 684.00 | % |
| 221.00 | % | ||||||||||||||||
Nonperforming loans are defined as loans on nonaccrualnon-accrual status, loans 90 days or more past due but still accruing, and restructured loans. Loans are placed on nonaccrualnon-accrual status when contractually past due 90 days or more as to interest or principal payments. Additionally, whenever management becomes aware of facts or circumstances that may adversely impact the collectibility of principal or interest on loans, it is management’s practice to place such loans on nonaccrualnon-accrual status immediately, rather than delaying such action until the loans become 90 days past due. Previously accrued and uncollected interest on such loans is reversed and income is recorded only to the extent that interest payments are subsequently received in cash and a determination has been made that the principal balance of the loan is collectible. If collectibility of the principal is in doubt, payments received are applied to loan principal.
Loans past due 90 days or more but still accruing interest are also included in nonperforming loans. Loans past due 90due90 days or more but still accruing are classified as such where the underlying loans are both well secured (the collateral value is sufficient to cover principal and accrued interest) and are in the process of collection. Also included in nonperforming loans are “restructured” loans. Restructured loans involve the granting of some concession to the borrower involving the modification of terms of the loan, such as changes in payment schedule or interest rate.
Nonperforming loans were $1.4$6.5 million at December 31, 2006, an increase of $5.1 million over 2005. The decreaseTwo loans in nonperforming loans from the prior year was due to successful effortsKansas City market secured by relationship managers to encourage customers to either refinancereal estate represent $3.6 million of this increase. Six of the creditremaining ten relationships on non-accrual at another financial institution or liquidate collateralDecember 31, 2006 and reduce our exposure. In some other cases,approximately 50% of the nonperforming loans were charged off orloan balances relate to smaller relationships acquired in the assets securing the loan were foreclosed and the recovery process begun. NorthStar transaction.
At December 31, 2005, the nonperforming loans consisted of five accounts. Two of the accounts accountedwith two credits accounting for 68% of the total nonperforming loans.total. At December 31, 2004 and 2003, approximately 36% and 37%, respectively, of the nonperforming loans related to a printing company and the remainder consistsconsisted of five and eight different borrowers, respectively.
At December 31, 2001 and 2002, $1.2 million of the restructured loans related to an auto dealership that had financial difficulties. At December 31, 2001, $1.9 million or 75% of the nonaccrual totals related to the owner of a large distribution company that filed bankruptcy. The remainder of the balances in 2001 and 2002 represent ten to twenty different borrowers.
29
Foreclosed real estate valued at $1.5 million represents several single family residences and lots in Kansas City that were former NorthStar loan relationships. All properties are presently being marketed for resale either by residential real estate firms or through our network of residential builders.
The Company’s nonaccrualnon-accrual loans and restructured loans meet the definition of “impaired loans” under U.S. GAAP. As of December 31, 2006, 2005 2004 and 2003,2004, the Company had 5, 8,twelve, five, and 11eight impaired loans,loan relationships, respectively, all of which are considered potential problem loans as well.
Management believes that the allowance for loan losses is adequate.
Investment Securities
At December 31, 2005,2006, the investment securities portfolio was $136$111.2 million, or 10.5%7% of total assets. Our debt securities portfolio is primarily comprised of U.S. government agency obligations, mortgage-backed pools, collateralized mortgage obligations and municipal bonds. Our equity investments primarily consist of equity investmentsstock in the FHLB (Des Moines).of Des Moines. The size of the investment portfolio is generally 5-10% of total assets and will vary within that range based on liquidity. Typically, management classifies securities as available for sale to maximize management flexibility, although securities may be purchased with the intention of holding to maturity. Securities available-for-sale are carried at fair value, with related unrealized net gains or losses, net of deferred income taxes, recorded as an adjustment to equity capital.
The table below sets forth the carrying value of investment securities held by the Company at the dates indicated:
|
| December 31, |
|
| December 31, |
| ||||||||||||||||||||||||||||||||
|
|
|
|
| ||||||||||||||||||||||||||||||||||
|
| 2005 |
| 2004 |
| 2003 |
|
| 2006 |
| 2005 |
| 2004 |
| ||||||||||||||||||||||||
|
|
|
|
|
|
|
|
| ||||||||||||||||||||||||||||||
(in thousands) |
| Amount |
| Percent |
| Amount |
| Percent |
| Amount |
| Percent |
|
| Amount |
| Percent Of Total Securities |
| Amount |
| Percent Of Total Securities |
| Amount |
| Percent Of Total Securities |
| ||||||||||||
|
|
|
|
|
|
|
|
|
|
|
|
|
| |||||||||||||||||||||||||
U.S. Treasury securities and obligations of U.S. government corporations and agencies |
| $ | 117,326 |
|
| 86.5 | % | $ | 98,944 |
|
| 81.4 | % | $ | 51,869 |
|
| 61.8 | % | |||||||||||||||||||
Obligations of U.S. government agencies |
| $ | 95,452 |
| 85.8 | % | $ | 117,326 |
| 86.5 | % | $ | 98,944 |
| 81.4 | % | ||||||||||||||||||||||
Mortgage-backed securities |
|
| 12,953 |
| 9.6 | % |
| 18,514 |
| 15.2 | % |
| 27,814 |
| 33.1 | % |
|
| 9,617 |
| 8.6 | % |
| 12,953 |
| 9.6 | % |
| 18,514 |
| 15.2 | % | ||||||
Municipal Bonds |
|
| 1,231 |
| 0.9 | % |
| 1,616 |
| 1.3 | % |
| 1,658 |
| 2.0 | % | ||||||||||||||||||||||
Municipal bonds |
|
| 1,111 |
| 1.0 | % |
| 1,231 |
| 0.9 | % |
| 1,616 |
| 1.3 | % | ||||||||||||||||||||||
Equity securities |
|
| 4,049 |
| 3.0 | % |
| 2,564 |
| 2.1 | % |
| 2,608 |
| 3.1 | % |
|
| 5,030 |
| 4.6 | % |
| 4,049 |
| 3.0 | % |
| 2,564 |
| 2.1 | % | ||||||
|
|
|
|
|
|
|
|
|
|
|
|
|
|
| ||||||||||||||||||||||||
|
| $ | 135,559 |
| 100.0 | % | $ | 121,638 |
| 100.0 | % | $ | 83,949 |
| 100.0 | % |
| $ | 111,210 |
| 100.0 | % | $ | 135,559 |
| 100.0 | % | $ | 121,638 |
| 100.0 | % | ||||||
|
|
|
|
|
|
|
|
|
|
|
|
|
|
| ||||||||||||||||||||||||
Included in US Treasury securities and obligationsAt December 31, 2005, Obligations of U.S. government corporations and agencies were $40included $40.0 million of short-term discount agency notes that matured in January 2006. These investments were used as an alternative to overnight funds to obtain higher yield given the excess liquidity.
The Company had no securities classified as trading at December 31, 2006, 2005 2004 or 2003.2004.
The following table summarizes expected maturity and yield information on the investment portfolio at December 31, 2005:2006:
|
| Within 1 year |
| 1 to 5 years |
| 5 to 10 years |
| 10 or more years |
| No Stated Maturity |
| Total |
|
| Within 1 year |
| 1 to 5 years |
| 5 to 10 years |
| No Stated Maturity |
| Total |
| ||||||||||||||||||||||||||||||||||||||||||||
|
|
|
|
|
|
|
|
|
|
|
|
|
| |||||||||||||||||||||||||||||||||||||||||||||||||||||||
(in thousands) |
| Amount |
| Yield |
| Amount |
| Yield |
| Amount |
| Yield |
| Amount |
| Yield |
| Amount |
| Yield |
| Amount |
| Yield |
|
| Amount |
| Yield |
| Amount |
| Yield |
| Amount |
| Yield |
| Amount |
| Yield |
| Amount |
| Yield |
| ||||||||||||||||||||||
|
|
|
|
|
|
|
|
|
|
|
|
|
|
|
|
|
|
|
|
|
|
|
| |||||||||||||||||||||||||||||||||||||||||||||
U.S. Treasury securities and obligations of U.S. government corporations and agencies |
| $ | 42,702 |
|
| 4.08 | % | $ | 74,624 |
|
| 3.84 | % | $ | — |
|
| 0.00 | % | $ | — |
|
| 0.00 | % | $ | — |
|
| 0.00 | % | $ | 117,326 |
|
| 3.93 | % | |||||||||||||||||||||||||||||||
Obligations of U.S. government agencies |
| $ | 35,540 |
| 3.15 | % | $ | 59,912 |
| 4.66 | % | $ | — |
| 0.00 | % | $ | — |
| 0.00 | % | $ | 95,452 |
| 4.10 | % | ||||||||||||||||||||||||||||||||||||||||||
Mortgage-backed securities |
|
| 1,531 |
| 2.68 | % |
| 10,979 |
| 3.30 | % |
| 243 |
| 4.56 | % |
| 200 |
| 5.41 | % |
| — |
| 0.00 | % |
| 12,953 |
| 3.29 | % |
|
| 518 |
| 2.93 | % |
| 8,449 |
| 3.79 | % |
| 650 |
| 3.76 | % |
| — |
| 0.00 | % |
| 9,617 |
| 3.74 | % | |||||||||||
Municipal Bonds |
|
| 481 |
| 2.82 | % |
| 286 |
| 4.37 | % |
| 464 |
| 5.55 | % |
| — |
| 0.00 | % |
| — |
| 0.00 | % |
| 1,231 |
| 4.21 | % | |||||||||||||||||||||||||||||||||||||
Municipal bonds |
|
| 365 |
| 2.97 | % |
| 281 |
| 4.37 | % |
| 465 |
| 5.55 | % |
| — |
| 0.00 | % |
| 1,111 |
| 4.40 | % | ||||||||||||||||||||||||||||||||||||||||||
Equity securities |
|
| — |
| 0.00 | % |
| — |
| 0.00 | % |
| — |
| 0.00 | % |
| — |
| 0.00 | % |
| 4,049 |
| 4.01 | % |
| 4,049 |
| 4.01 | % |
|
| — |
| 0.00 | % |
| — |
| 0.00 | % |
| — |
| 0.00 | % |
| 5,030 |
| 5.54 | % |
| 5,030 |
| 5.54 | % | |||||||||||
|
|
|
|
|
|
|
|
|
|
|
|
|
|
|
|
|
|
|
|
|
|
|
|
|
|
|
|
|
|
|
|
|
|
|
| |||||||||||||||||||||||||||||||||
Total |
| $ | 44,714 |
| 4.02 | % | $ | 85,889 |
| 3.77 | % | $ | 707 |
| 5.21 | % | $ | 200 |
| 5.41 | % | $ | 4,049 |
| 4.01 | % | $ | 135,559 |
| 3.87 | % |
| $ | 36,423 |
| 3.15 | % | $ | 68,642 |
| 4.55 | % | $ | 1,115 |
| 4.51 | % | $ | 5,030 |
| 5.54 | % | $ | 111,210 |
| 4.14 | % | |||||||||||
|
|
|
|
|
|
|
|
|
|
|
|
|
|
|
|
|
|
|
|
|
|
|
|
|
|
|
|
|
|
|
|
|
|
|
| |||||||||||||||||||||||||||||||||
Yields on tax exempt securities are computed on a taxable equivalent basis using a tax rate of 36%. Expected maturities will differ from contractual maturities, as borrowers may have the right to call on repay obligations with or without prepayment penalties.
30
Deposits
The following table shows, for the periods indicated, the average annual amount and the average rate paid by type of deposit:
|
| For the year ended December 31, |
|
| For the year ended December 31, |
| ||||||||||||||||||||||||||||||||
|
|
|
|
| ||||||||||||||||||||||||||||||||||
|
| 2005 |
| 2004 |
| 2003 |
|
| 2006 |
| 2005 |
| 2004 |
| ||||||||||||||||||||||||
|
|
|
|
|
|
|
|
| ||||||||||||||||||||||||||||||
(in thousands) |
| Average |
| Weighted |
| Average |
| Weighted |
| Average |
| Weighted |
|
| Average balance |
| Weighted average rate |
| Average balance |
| Weighted average rate |
| Average balance |
| Weighted average rate |
| ||||||||||||
|
|
|
|
|
|
|
|
|
|
|
|
|
| |||||||||||||||||||||||||
Interest-bearing transaction accounts |
| $ | 87,560 |
|
| 1.18 | % | $ | 71,568 |
|
| 0.45 | % | $ | 54,742 |
|
| 0.31 | % |
| $ | 102,327 |
| 2.28 | % | $ | 87,560 |
| 1.18 | % | $ | 71,568 |
| 0.45 | % | |||
Money market accounts |
|
| 437,346 |
| 2.46 | % |
| 403,363 |
| 1.14 | % |
| 357,497 |
| 0.97 | % |
|
| 496,590 |
| 3.87 | % |
| 437,346 |
| 2.46 | % |
| 403,363 |
| 1.14 | % | ||||||
Savings accounts |
|
| 4,435 |
| 0.70 | % |
| 4,254 |
| 0.33 | % |
| 5,499 |
| 0.44 | % |
|
| 4,164 |
| 1.37 | % |
| 4,435 |
| 0.70 | % |
| 4,254 |
| 0.33 | % | ||||||
Certificates of deposit |
|
| 259,852 |
| 3.33 | % |
| 225,529 |
| 2.24 | % |
| 185,175 |
| 2.45 | % |
|
| 357,706 |
| 4.54 | % |
| 259,852 |
| 3.33 | % |
| 225,529 |
| 2.24 | % | ||||||
|
|
|
|
|
|
|
|
|
|
|
|
|
|
| ||||||||||||||||||||||||
|
|
| 789,193 |
| 2.59 | % |
| 704,714 |
| 1.42 | % |
| 602,913 |
| 1.36 | % |
|
| 960,787 |
| 3.94 | % |
| 789,193 |
| 2.59 | % |
| 704,714 |
| 1.42 | % | ||||||
Noninterest-bearing demand deposits |
|
| 200,054 |
| — |
| 184,116 |
| — |
| 151,140 |
| — |
|
|
| 207,328 |
| — |
| 200,054 |
| — |
| 184,116 |
| — |
| ||||||||||
|
|
|
|
|
|
|
|
|
|
|
|
|
|
| ||||||||||||||||||||||||
|
| $ | 989,247 |
| 2.07 | % | $ | 888,830 |
| 1.12 | % | $ | 754,053 |
| 1.09 | % |
| $ | 1,168,115 |
| 3.24 | % | $ | 989,247 |
| 2.07 | % | $ | 888,830 |
| 1.12 | % | ||||||
|
|
|
|
|
|
|
|
|
|
|
|
|
|
|
|
|
|
|
|
| ||||||||||||||||||
We continued to experience rapid loan and deposit growth due to aggressive direct calling efforts of relationship officers. Management has pursued closely-held businesses whose management desires a close working relationship with a locally-managed, full-service bank. Due to the relationships developed with these customers, management views large deposits from this source as a stable deposit base. In 2002, theThe Company began using brokered certificates of deposit to help fund its growth. In the future, the Bank expects to continue to usealso uses certificates of deposit sold to retail customers of regional and national brokerage firms (i.e. brokered certificates of deposit). to help fund its growth. At December 31, 20052006 and 2004,2005, the Company had $104 million and $64 million in brokered certificates of deposit.deposit, respectively.
Maturities of certificates of deposit of $100,000 or more are as follows:
(in thousands) |
| Total |
|
| Total |
| ||
|
|
|
| |||||
Three months or less |
| $ | 67,757 |
|
| $ | 97,002 |
|
Over three through six months |
| 30,655 |
|
| 50,382 |
| ||
Over six through twelve months |
| 52,373 |
|
| 75,388 |
| ||
Over twelve months |
| 79,054 |
|
| 74,144 |
| ||
|
|
|
|
| ||||
Total |
| $ | 229,839 |
|
| $ | 296,916 |
|
|
|
|
|
| ||||
Liquidity and Capital Resources
The objective of liquidity management is to ensure the Company has the ability to generate sufficient cash or cash equivalents in a timely and cost-effective manner to meet its commitments as they become due. Funds are available from a number of sources, such as from the core deposit base and from loans and securities repayments and maturities. Additionally, liquidity is provided from sales of the securities portfolio, lines of credit with major banks, the Federal Reserve and the Federal Home Loan Bank,FHLB, the ability to acquire large and brokered deposits and the ability to sell loan participations to other banks.
The Company’s liquidity management framework includes measurement of several key elements, such as the loan to deposit ratio, wholesale deposits as a percentage of total deposits, and various dependency ratios used by banking regulators. The Company’s liquidity framework also incorporates contingency planning to assess the nature and volatility of funding sources and to determine alternatives to these sources.
Strong capital ratios, credit quality and core earnings are essential to retaining cost-effective access to the wholesale funding markets. Deterioration in any of these factors could have an impact on the Company’s ability to access these funding sources and, as a result, these factors are monitored on an ongoing basis as part of the liquidity management process.
While core deposits and loan and investment repayments are principal sources of liquidity, funding diversification is another key element of liquidity management. Diversity is achieved by strategically varying depositor types, terms, funding markets, and instruments.
31
We manage the parent company’sCompany’s liquidity to provide the funds necessary to pay dividends to shareholders, service debt, invest in the Bank as necessary, and satisfy other operating requirements. The parent company’sCompany’s primary funding sources to meet its liquidity requirements are dividends from subsidiaries, borrowings against its $15$11 million line of credit with a major bank, and proceeds from the issuance of equity (i.e. stock option exercises).
31
The Bank is subject to regulations and, among other things, may be limited in its ability to pay dividends or transfer funds to the parent company.Company. Accordingly, consolidated cash flows as presented in the consolidated statements of cash flows may not represent cash immediately available for the payment of cash dividends to the Company’s shareholders or for other cash needs.
Another source of funding for the parent company includes the issuance of subordinated debentures. In October of 2005, the Company issued $10.0 million of additional subordinated debentures as part of a Trust Preferred Securities Pool (“TRUPS”)TRUPS at a fixed rate of 6.14% for five years. Following the five-year period, the TRUPS will pay a variable rate of three-month LIBOR plus 144 bp1.44% that reprices quarterly. These securitiesIn July of 2006, the Company issued $4.0 million of subordinated debentures as part of a TRUPS at a floating rate equal to three-month LIBOR + 1.60%. The TRUPS are classified as debtsubordinated debentures, but countqualify as regulatory capital and thecapital. The related interest expense is tax-deductible which makes them very attractive. and is recorded as interest expense in the Company’s consolidated financial statements. See Note 11 – Subordinated Debentures in this filing for more information.
Investment securities are an important tool to the Company’s liquidity objective. As of December 31, 2005,2006, the entire investment portfolio was available for sale. Of the $136$111 million investment portfolio available for sale, $18$32 million was pledged as collateral for public deposits, treasury, tax and loan notes, and other requirements. The remaining securities could be pledged or sold to enhance liquidity, if necessary.
The Bank has a variety of funding sources (in addition to key liquidity sources, such as core deposits, loan repayments, loan participations sold, and investment portfolio sales) available to increase financial flexibility. At December 31, 2005,2006, the Bank had $132$130 million available from the Federal Home Loan BankFHLB of Des Moines under a blanket loan pledge, absentsubject to the Bank not being in default ofon its credit agreement, and $168$165 million available from the Federal Reserve Bank under a pledged loan agreement. The Bank also has access to over $70 million in overnight federal funds lines purchased from various banking institutions. Finally, because the Bank planscontinues to remainbe a “well-capitalized” institution, it has the ability to sell certificates of deposit through various national or regional brokerage firms, if needed.
Over the normal course of business, the Company enters into certain forms of off-balance sheet transactions, including unfunded loan commitments and letters of credit. These transactions are managed through the Company’s various risk management processes. Management considers both on-balance sheet and off-balance sheet transactions in its evaluation of the Company’s liquidity. The Company has $346$480 million in unused loan commitments as of December 31, 2005.2006. While this commitment level would be very difficult to fund given the Company’s current liquidity resources, we know that the nature of these commitments areis such that the likelihood of such a funding demand is very low.
For the year ended December 31, 20052006 and 2004,2005, net cash provided by operating activities was materially consistent. Net cash used in investing activities was $123 million in 2006 versus $132 million in 2005 versus $158 million in 2004.2005. The decrease of $26$9 million was primarily due to a reduction in investment security activity. Net cash provided by financing activities was $37 million in 2006 versus $206 million in 2005 versus $145 million2005. The change in 2004. This increase consisted of greatercash provided by financing activities is due to less deposit growth in 2005, the issuance2006 and pay downs of subordinated debentures and additional long-term Federal Home Loan Bank advances.
Risk-based capital guidelines were designed to relate regulatory capital requirements to the risk profile of the specific institution and to provide for uniform requirements among the various regulators. Currently, the risk-based capital guidelines require the Company to meet a minimum total capital ratio of 8.0% of which at least 4.0% must consist of Tier 1 capital. Tier 1 capital consists of (a) common shareholders’ equity (excluding the unrealized market value adjustments on the available-for-sale securities and cash flow hedges), (b) qualifying perpetual preferred stock and related additional paid in capital subject to certain limitations specified by the FDIC, and (c) minority interests in the equity accounts of consolidated subsidiaries less (d) goodwill, (e) mortgage servicing rights within certain limits, and (f) any other intangible assets and investments in subsidiaries that the FDIC determines should be deducted from Tier 1 capital. The FDIC also requires a minimum leverage ratio of 3.0%, defined as the ratio of Tier 1 capital to average total assets for banking organizations deemed the strongest and most highly rated by banking regulators. A higher minimum leverage ratio is required of less highly rated banking organizations. Total capital, a measure of capital adequacy, includes Tier 1 capital, allowance for loan losses, and subordinated debentures.
32
The following table summarizes the Company’s risk-based capital and leverage ratios at the dates indicated:
|
| At December 31, |
|
| At December 31, |
| ||||||||||||||
|
|
|
|
| ||||||||||||||||
(in thousands) |
| 2005 |
| 2004 |
| 2003 |
|
| 2006 |
| 2005 |
| 2004 |
| ||||||
|
|
|
|
|
|
|
| |||||||||||||
Tier I capital to risk weighted assets |
|
| 10.31 | % |
| 9.94 | % |
| 9.77 | % |
|
| 9.60 | % |
| 10.31 | % |
| 9.94 | % |
Total capital to risk weighted assets |
|
| 11.55 | % |
| 11.19 | % |
| 11.02 | % |
|
| 10.83 | % |
| 11.55 | % |
| 11.19 | % |
Leverage ratio (Tier I capital to average assets) |
|
| 8.75 | % |
| 8.44 | % |
| 8.67 | % |
|
| 8.87 | % |
| 8.75 | % |
| 8.44 | % |
Tangible capital to tangible assets |
|
| 5.98 | % |
| 6.68 | % |
| 7.00 | % |
|
| 6.48 | % |
| 5.98 | % |
| 6.68 | % |
Tier I capital |
| $ | 107,538 |
| $ | 92,096 |
| $ | 77,981 |
|
| $ | 131,869 |
| $ | 107,538 |
| $ | 92,096 |
|
Total risk-based capital |
| $ | 120,528 |
| $ | 103,673 |
| $ | 87,970 |
|
| $ | 148,856 |
| $ | 120,528 |
| $ | 103,673 |
|
Risk Management
Market risk arises from exposure to changes in interest rates and other relevant market rate or price risk. The Company faces market risk in the form of interest rate risk through transactions other than trading activities. Market risk from these activities, in the form of interest rate risk, is measured and managed through a number of methods. The Company uses financial modeling techniques to measure interest rate risk. These techniques measure the sensitivity of future earnings due to changing interest rate environments. Guidelines established by the Company’s Asset/Liability Management Committee and approved by the Company’s Board of Directors are used to monitor exposure of earnings at risk. General interest rate movements are used to develop sensitivity as the Company feels it has no primary exposure to a specific point on the yield curve. These limits are based on the Company’s exposure to a 100 bpbasis points and 200 bpbasis points immediate and sustained parallel rate move, either upward or downward.
Interest Rate Risk
In order to measure earnings sensitivity to changing rates, the Company uses a static gap analysis and earnings simulation model.
The static gap analysis starts with contractual repricing information for assets, liabilities, and off-balance sheet instruments. These items are then combined with repricing estimations for administered rate (interest-bearing demand deposits, savings, and money market accounts) and non-rate related products (demand deposit accounts, other assets, and other liabilities) to create a baseline repricing balance sheet. In addition, mortgage-backed securities are adjusted based on industry estimates of prepayment speeds.
33
The following table represents the estimated interest rate sensitivity and periodic and cumulative gap positions calculated as of December 31, 2005.2006. Significant assumptions used for this table included: loans will repay at historic repayment rates; interest-bearing demand accounts and savings accounts are interest sensitive due to immediate repricing, and fixed maturity deposits will not be withdrawn prior to maturity. A significant variance in actual results from one or more of these assumptions could materially affect the results reflected in the table.
(in thousands) |
| Year 1 |
| Year 2 |
| Year 3 |
| Year 4 |
| Year 5 |
| Beyond |
| Total |
|
| Year 1 |
| Year 2 |
| Year 3 |
| Year 4 |
| Year 5 |
| Beyond |
| Total |
| ||||||||||||||
|
|
|
|
|
|
|
|
|
|
|
|
|
|
|
| |||||||||||||||||||||||||||||
Interest-Earning Assets |
|
|
|
|
|
|
|
|
|
|
|
|
|
|
|
|
|
|
|
|
|
|
|
|
|
|
|
|
|
|
|
|
|
|
|
|
|
| ||||||
Investments in debt and equity securities |
| $ | 44,449 |
| $ | 40,072 |
| $ | 29,378 |
| $ | 16,697 |
| $ | 7 |
| $ | 4,956 |
| $ | 135,559 |
|
| $ | 36,261 |
| $ | 35,618 |
| $ | 27,680 |
| $ | 3,580 |
| $ | 1,927 |
| $ | 6,144 |
| $ | 111,210 |
|
Interest-bearing deposits |
|
| 84 |
| — |
| — |
| — |
| — |
| — |
| 84 |
|
|
| 1,669 |
| — |
| — |
| — |
| — |
| — |
| 1,669 |
| ||||||||||||
Federal Funds Sold |
|
| 64,709 |
| — |
| — |
| — |
| — |
| — |
| 64,709 |
| ||||||||||||||||||||||||||||
Federal funds sold |
|
| 7,066 |
| — |
| — |
| — |
| — |
| — |
| 7,066 |
| ||||||||||||||||||||||||||||
Loans (1) |
|
| 712,869 |
| 77,713 |
| 96,941 |
| 29,806 |
| 54,140 |
| 30,910 |
| 1,002,379 |
|
|
| 867,820 |
| 149,855 |
| 103,611 |
| 87,806 |
| 56,573 |
| 46,058 |
| 1,311,723 |
| ||||||||||||
Loans held for sale |
|
| 2,761 |
| — |
| — |
| — |
| — |
| — |
| 2,761 |
|
|
| 2,602 |
| — |
| — |
| — |
| — |
| — |
| 2,602 |
| ||||||||||||
|
|
|
|
|
|
|
|
|
|
|
|
|
|
|
|
| ||||||||||||||||||||||||||||
Total interest-earning assets |
| $ | 824,872 |
| $ | 117,785 |
| $ | 126,319 |
| $ | 46,503 |
| $ | 54,147 |
| $ | 35,866 |
| $ | 1,205,492 |
|
| $ | 915,418 |
| $ | 185,473 |
| $ | 131,291 |
| $ | 91,386 |
| $ | 58,500 |
| $ | 52,202 |
| $ | 1,434,270 |
|
|
|
|
|
|
|
|
|
|
|
|
|
|
|
|
|
| ||||||||||||||||||||||||||||
Interest-Bearing Liabilities |
|
|
|
|
|
|
|
|
|
|
|
|
|
|
|
|
|
|
|
|
|
|
|
|
|
|
|
|
|
|
|
| ||||||||||||
Savings, NOW and Money market deposits |
| $ | 591,898 |
| $ | — |
| $ | — |
| $ | — | �� | $ | — |
| $ | — |
| $ | 591,898 |
|
| $ | 668,672 |
| $ | — |
| $ | — |
| $ | — |
| $ | — |
| $ | — |
| $ | 668,672 |
|
Certificates of deposit (1) |
|
| 202,422 |
| 69,810 |
| 21,004 |
| 679 |
| 1,106 |
| — |
| 295,021 |
|
|
| 315,851 |
| 47,046 |
| 24,297 |
| 21,675 |
| 2,718 |
| 400 |
| 411,987 |
| ||||||||||||
Subordinated debentures |
|
| 20,620 |
| — |
| — |
| — |
| 10,310 |
| — |
| 30,930 |
|
|
| 24,744 |
| — |
| — |
| — |
| 10,310 |
| — |
| 35,054 |
| ||||||||||||
Other borrowings |
|
| 9,872 |
| 1,250 |
| 650 |
| 1,050 |
| 5,800 |
| 18,309 |
| 36,931 |
|
|
| 11,007 |
| 650 |
| 5,050 |
| 5,800 |
| 300 |
| 17,945 |
| 40,752 |
| ||||||||||||
|
|
|
|
|
|
|
|
|
|
|
|
|
|
|
|
| ||||||||||||||||||||||||||||
Total interest-bearing liabilities |
| $ | 824,812 |
| $ | 71,060 |
| $ | 21,654 |
| $ | 1,729 |
| $ | 17,216 |
| $ | 18,309 |
| $ | 954,780 |
|
| $ | 1,020,274 |
| $ | 47,696 |
| $ | 29,347 |
| $ | 27,475 |
| $ | 13,328 |
| $ | 18,345 |
| $ | 1,156,465 |
|
|
|
|
|
|
|
|
|
|
|
|
|
|
|
|
|
| ||||||||||||||||||||||||||||
Interest-sensitivity GAP |
|
|
|
|
|
|
|
|
|
|
|
|
|
|
|
|
|
|
|
|
|
|
|
|
|
|
|
|
|
|
|
| ||||||||||||
GAP by period |
| $ | 60 |
| $ | 46,725 |
| $ | 104,665 |
| $ | 44,774 |
| $ | 36,931 |
| $ | 17,557 |
| $ | 250,712 |
|
| $ | (104,856 | ) | $ | 137,777 |
| $ | 101,944 |
| $ | 63,911 |
| $ | 45,172 |
| $ | 33,857 |
| $ | 277,805 |
|
|
|
|
|
|
|
|
|
|
|
|
|
|
|
|
|
| ||||||||||||||||||||||||||||
Cumulative GAP |
| $ | 60 |
| $ | 46,785 |
| $ | 151,450 |
| $ | 196,224 |
| $ | 233,155 |
| $ | 250,712 |
| $ | 250,712 |
|
| $ | (104,856 | ) | $ | 32,921 |
| $ | 134,865 |
| $ | 198,776 |
| $ | 243,948 |
| $ | 277,805 |
| $ | 277,805 |
|
|
|
|
|
|
|
|
|
|
|
|
|
|
|
|
|
| ||||||||||||||||||||||||||||
Ratio of interest-earning assets to interest-bearing liabilities |
|
|
|
|
|
|
|
|
|
|
|
|
|
|
|
|
|
|
|
|
|
|
|
|
|
|
|
|
|
|
|
| ||||||||||||
Periodic |
| 1.00 |
| 1.66 |
| 5.83 |
| 26.90 |
| 3.15 |
| 1.96 |
| 1.26 |
|
| 0.90 |
| 3.89 |
| 4.47 |
| 3.33 |
| 4.39 |
| 2.85 |
| 1.24 |
| ||||||||||||||
Cumulative GAP |
| 1.00 |
| 1.05 |
| 1.17 |
| 1.21 |
| 1.25 |
| 1.26 |
| 1.26 |
|
| 0.90 |
| 1.03 |
| 1.12 |
| 1.18 |
| 1.21 |
| 1.24 |
| 1.24 |
| ||||||||||||||
|
|
|
|
|
|
|
|
|
|
|
|
|
|
|
|
| ||||||||||||||||||||||||||||
(1) | Adjusted for the impact of the interest rate swaps. |
At December 31, 2005,2006, the Company was asset sensitive on a cumulative basis for all periods except 1 year based on contractual maturities. Asset sensitive means that assets will reprice faster than liabilities.
Along with the static gap analysis, determining the sensitivity of short-term future earnings to a hypothetical plus or minus 100 and 200 basis point parallel rate shock can be accomplished through the use of simulation modeling. In addition to the assumptions used to create the static gap, simulation of earnings includes the modeling of the balance sheet as an ongoing entity. Future business assumptions involving administered rate products, prepayments for future rate-sensitive balances, and the reinvestment of maturing assets and liabilities are included. These items are then modeled to project net interest income based on a hypothetical change in interest rates. The resulting net interest income for the next 12-month period is compared to the net interest income amount calculated using flat rates. This difference represents the Company’s earnings sensitivity to a plus or minus 100 basis points parallel rate shock.
The resulting simulations for December 31, 2005,2006, projected that net interest income would increase by approximately 4.0%0.4% if rates rose by a 100 basis point parallel rate shock, and projected that the net interest incomein come would decrease by approximately 7.0%2.6% if rates fell by a 100 basis point parallel rate shock.
The Company uses interest rate derivative financial instruments as an asset/liability management tool to hedge mismatches in interest rate exposure indicated by the net interest income simulation described above. They are used to modify the Company’s exposures to interest rate fluctuations and provide more stable spreads between loan yields and the rate on their funding sources. At December 31, 2005,2006, the Company had $100$17 million in notional amount of outstanding interest rate swaps to reduce interest rate risk. Derivative financial instruments are also discussed in Note 7 to the Consolidated Financial Statements. – Derivatives in this filing.
34
Contractual Obligations, Off-Balance Sheet Risk, and Contingent Liabilities
Through the normal course of operations, the Company has entered into certain contractual obligations and other commitments. Such obligations relate to funding of operations through deposits or debt issuances, as well as leases for premises and equipment. As a financial services provider, the Company routinely enters into commitments to extend credit. While contractual obligations represent future cash requirements of the Company, a significant portion of commitments to extend credit may expire without being drawn upon. Such commitments are subject to the same credit policies and approval process accorded to loans made by the Company.
The required contractual obligations and other commitments at December 31, 20052006 were as follows:
(in thousands) |
| Total |
| Less Than |
| Over 1 Year |
| Over |
|
| Total |
| Less Than 1 Year |
| Over 1 Year Less than 5 Years |
| Over 5 Years |
| ||||||||
|
|
|
|
|
|
|
|
|
| |||||||||||||||||
Operating leases |
| $ | 11,590 |
| $ | 1,673 |
| $ | 6,712 |
| $ | 3,205 |
|
| $ | 10,822 |
| $ | 1,924 |
| $ | 6,935 |
| $ | 1,963 |
|
Certificates of deposit |
|
| 295,021 |
| 192,422 |
| 102,599 |
| — |
|
|
| 411,987 |
| 315,851 |
| 96,136 |
| — |
| ||||||
Subordinated debentures |
|
| 30,930 |
| — |
| — |
| 30,930 |
|
|
| 35,054 |
| — |
| — |
| 35,054 |
| ||||||
Federal Home Loan Bank advances |
|
| 28,584 |
| 1,525 |
| 8,750 |
| 18,309 |
|
|
| 26,995 |
| 1,250 |
| 7,800 |
| 17,945 |
| ||||||
Commitments to extend credit |
|
| 346,205 |
| 283,585 |
| 32,917 |
| 29,703 |
|
|
| 480,071 |
| 379,407 |
| 61,292 |
| 39,372 |
| ||||||
Standby letters of credit |
|
| 28,013 |
| 28,013 |
| — |
| — |
|
|
| 39,587 |
| 39,587 |
| — |
| — |
| ||||||
Private equity bank fund |
|
| 250 |
| — |
| 250 |
| — |
| ||||||||||||||||
The Company also enters into derivative contracts under which the Company is required to either receivereceives cash from or paypays cash to counterparties depending on changes in interest rates. Derivative contracts are carried at fair value on the consolidated balance sheet with the fair value representing the net present value of expected future cash receipts or payments based on market interest rates as of the balance sheet date. The fair value of these contracts changes daily as market interest rates change. Derivative liabilities are not included as contractual cash obligations as their fair value does not represent the amounts that may ultimately be paid under these contracts.
Effects of New Accounting Standards
OnIn July 14, 2005,2006, the Financial Accounting Standards Board (“FASB”) issued an exposure draft for Interpretation No. 48, Accounting for Uncertain Tax Positions,Uncertainty in Income Taxes, an Interpretation of FAS No. 109, Accounting for Income Taxes. The proposed interpretation would clarifydefines the accountingthreshold for recognizing the financial impact of uncertain tax positions in accordance with FAS 109. An enterprise would beA company is required to recognize, in its financial statements, the best estimate of the impact of a tax position only if that position is probable“more-likely-than-not” of being sustained on audit based solely on the technical merits of the position.position on the reporting date. In evaluating whether the probable“more-likely-than-not” recognition threshold has been met, this proposedthe Interpretation would requirerequires the presumptionassumption that the tax position will be evaluated during an audit by taxing authorities. The term probable“more-likely-than-not” is used in this proposed Interpretation consistent with its use in FASB Statement No. 5, Accounting for Contingencies, to mean “the future event or events that are likely to occur.”defined as a likelihood of more than 50 percent. Individual tax positions that fail to meet the probable recognition threshold will generally result in either (a) a reduction in the deferred tax asset or an increase in a deferred tax liability or (b) an increase in a liability for income taxes payable or the reduction of an income tax refund receivable. The impact may also include both (a) and (b). This proposed Interpretation also would provideprovides guidance on disclosure, accrual of interest and penalties, accounting in interim periods, and transition. If approved, theThe Interpretation would be effective as of the end of the first fiscal year ending after December 15, 2005. The FASB comment period ended on September 12, 2005. We are waiting on the final decision related to this Interpretation by FASB and are presently unable to determine its overall impact on our consolidated financial statements or results of operations.
On May 5, 2005, the Financial Accounting Standards Board (“FASB”) issued FAS No. 154, Statement Accounting Changes and Error Corrections—a replacement of APB Opinion No. 20 and FASB Statement No. 3. FAS 154 requires retrospective application for voluntary changes in accounting principles unless it is impracticable to do so. FAS 154 is effective for accounting changes and corrections of errors in fiscal years beginning after December 15, 2005. Early application is permitted for accounting changes and corrections of errors during fiscal years beginning after June 1, 2005. We have evaluated the requirements of SFAS No.154 and expect the implementation will have no material effect on our consolidated financial condition or results of operations.
In December 2004, FASB issued FAS No. 123(R), Share-Based Payment (“SFAS No. 123(R)”). FAS No. 123(R) replaces SFAS No. 123, Accounting for Stock-Based Compensation, and supersedes APB Opinion No. 25, Accounting for Stock Issued to Employees. FAS No. 123(R) requires compensation costs related to share-based payment transactions to be recognized in the financial statements over the period that an employee provides service in exchange for the award. The accounting provisions of FAS 123(R) are effective for annual reporting periods beginning after June 15, 2005, therefore, we will be required to adopt FAS 123R in the first quarter of fiscal 2006.
35
The pro forma disclosures previously permitted under FAS 123 will no longer be an alternative to financial statement recognition. The pro forma net income and net income per share amounts (based on a fair-value method similar to the methods required under FAS123R to measure compensation expense for employee stock incentive awards) are shown in Note 1 to the Consolidated Financial Statements. We expect the implementation of FAS 123R will have less than $0.01 effect on our earnings per share in 2006.
In March 2004, the Emerging Issues Task Force (“EITF”) reached a consensus on criteria to evaluate whether to record a loss and disclose additional information about unrealized losses relating to debt and equity securities under EITF Issue No. 03-1, The Meaning of Other-Than-Temporary Impairment and Its Application to Certain Investments. The consensus applies to investments in debt and marketable equity securities that are accounted under FAS 115, Accounting for Certain Investments in Debt and Equity Securities. After many organizations, including banks, which could be impacted by this guidance, asked for clarification on the meaning of other-than-temporary impairment and its application to certain investments, the FASB postponed the implementation. In July 2005, the FASB decided not to provide additional guidance on the meaning of other-than-temporary impairment, but instead issued FASB staff position (“FSP”) EITF 03-1-a, Implementation Guidance for the Application of Paragraph 16 of EITF Issue No. 03-1, as final. The final position supersedes several previously issued EITF topics and replaces guidance set forth in several others. The final position, titled FAS 115-1, The Meaning of Other-Than-Temporary Impairment and Its Application to Certain Investments, codifies guidance set forth in EITF Topic D-44, Recognition of Other-Than-Temporary Impairment upon the Planned Sale of a Security Whose Cost Exceeds Fair Value, and clarifies that an investor should recognize an impairment loss no later than when the impairment is deemed other than temporary, even if a decision to sell has not been made. The effective date of the FSP will be reporting periods beginning after December 15, 2005. We have evaluated the impact of the final rule and2006. The Company does not expect the implementation of FAS 115-1 will notFASB Interpretation No. 48 to have a material effectimpact on our consolidatedthe Company’s financial position or results of operations.
In September 2006, the Securities and Exchange Commission (“SEC”) issued Staff Accounting Bulletin No. 108 (“SAB No. 108”) to clarify consideration of the effects of prior year errors when quantifying misstatements in current year financial statements for the purpose of quantifying materiality. SAB No. 108 requires issuers to quantify misstatements using both the “rollover” and “iron curtain” approaches and requires an adjustment to the current year financial statements in the event that after the application of either approach and consideration of all relevant quantitative and qualitative factors, a misstatement is determined to be material. SAB No. 108 is effective for fiscal years beginning after November 15, 2006. We are in the process of determining the effect, if any, that SAB 108 will have on our consolidated financial statements. The Company’s analysis under SAB No. 108 of prior year and current year misstatements did not result in any adjustment to prior year or current year financial statements.
In September 2006, the FASB issued FAS No. 157, Fair Value Measurements. FAS No. 157 defines fair value, establishes a framework for measuring fair value in generally accepted accounting standards, and expands disclosures about fair value measurements. FAS No. 157 is effective for financial statements issued for fiscal years beginning after November 15, 2007, and interim periods within those fiscal years. We do not expect that the adoption of FAS No. 157 will have a material impact on our financial condition or results of operations.
35
ITEM 7A: QUANTITATIVE AND QUALITATIVE DISCLOSURES ABOUT MARKET RISK
Please refer to “Risk Factors” included in Item 1A and “Market Risk” included in Management’s Discussion and Analysis under Item 7.
ITEM 8: FINANCIAL STATEMENTS AND SUPPLEMENTARY DATA
Please refer to Item 15 below.
ITEM 9: CHANGES IN AND DISAGREEMENTS WITH ACCOUNTANTS ON ACCOUNTING AND
FINANCIAL DISCLOSURE
NONE
ITEM 9A: CONTROLS AND PROCEDURES
Disclosure Controls and Procedures
As of December 31, 2005,2006, under the supervision and with the participation of the Company’s Chief Executive Officer (CEO)(“CEO”) and the Chief Financial Officer (CFO)(“CFO”), management has evaluated the effectiveness of the design and operation of the Company’s disclosure controls and procedures pursuant to Exchange Act Rule 13a-15. Based on that evaluation, the CEO and CFO concluded that the Company’s disclosure controls and procedures were effective as of December 31, 2005,2006, to ensure that information required to be disclosed in the Company’s periodic SEC filings is processed, recorded, summarized and reported when required. There were no significant changes in the Company’s internal controls or in the other factors that could significantly affect those controls subsequent to the date of the evaluation.
Under the supervision and with the participation of the Company’s CEO and CFO, management has excluded the internal controlsManagement’s Report on Internal Control over Financial Reporting
Management’s Report on Internal Controls over financial reporting associated with Millennium Brokerage Group, LLC from itsand the audit report of KPMG, the Company’s independent registered accounting firm, on management’s assessment of the effectiveness of internal control over financial reporting asare included in Item 15 of December 31, 2005.the report and are incorporated in this Item 9A by reference.
The Company is not aware of any information required to be disclosed in a report on Form 8-K during the fourth quarter covered by their Form 10-K, but not reported, whether or not otherwise required by this Form 10-K.
36
ITEM 10: DIRECTORS, AND EXECUTIVE OFFICERS OF THE REGISTRANTAND CORPORATE GOVERNANCE
The information required by this item is incorporated herein by reference to the Company’s Proxy Statement for its annual meeting to be held on Wednesday, April 19, 2006.18, 2007.
ITEM 11: EXECUTIVE COMPENSATION
The information required by this item is incorporated herein by reference to the Company’s Proxy Statement for its annual meeting to be held on Wednesday, April 19, 2006.18, 2007.
ITEM 12: SECURITY OWNERSHIP OF CERTAIN BENEFICIAL OWNERS AND MANAGEMENT AND RELATED STOCKHOLDER MATTERS
The information required by this item is incorporated herein by reference to the Company’s Proxy Statement for its annual meeting to be held on Wednesday, April 19, 2006.18, 2007.
ITEM 13: CERTAIN RELATIONSHIPS AND RELATED PARTY TRANSACTIONS AND DIRECTOR INDEPENDENCE
The Company and the Bank have, and expect to continue to have, banking and other transactions in the ordinary course of business with directors and executive officers of the Company and their affiliates, including members of their families or corporations, partnerships or other organizations in which such directors or executive officers have a controlling interest, on substantially the same terms (including price, or interest rates and collateral) as those prevailing at the time for comparable transactions with unrelated parties. Such transactions are not expected to involve more than the normal risk of collectibility nor present other unfavorable termsinformation required by this item is incorporated herein by reference to the Company and the Bank. The Bank is subjectCompany’s Proxy Statement for its annual meeting to limitsbe held on the aggregate amount it can lend to the Bank’s and the Company’s directors and officers as a group. This limit is currently equal to the entity’s unimpaired capital plus reserve for loan losses. Loans to individual directors and officers must also comply with the Bank’s lending policies and statutory lending limits, and directors with a personal interest in any loan application are excluded from the consideration of such loan application.Wednesday, April 18, 2007.
ITEM 14: PRINCIPAL ACCOUNTANT FEES AND SERVICES
The information required by this item is incorporated by reference to the Company’s Proxy Statement for its annual meeting to be held on Wednesday, April 19, 2006.18, 2007.
37
ITEM 15: EXHIBITS, FINANCIAL STATEMENT SCHEDULES
| (a) The following documents are filed or incorporated by reference as part of this Report: | |||||||||||||||||||||||||||||||||||||
Enterprise Financial Services Corp and subsidiaries | ||||||||||||||||||||||||||||||||||||||
|
| Page Number | ||||
|
| |||||
1. | Financial Statements: |
| ||||
|
|
| ||||
| Management’s Report on Internal Control over Financial Reporting |
| ||||
|
| |||||
| Consolidated Balance Sheets at December 31, |
| ||||
| Consolidated Statements of Income for the years ended December 31, 2006, 2005, |
| ||||
|
| |||||
| 44 | |||||
45 | ||||||
|
|
| ||||
|
| |||||
2. | Financial Statement Schedules |
| ||||
| None other than those included in the Notes to Consolidated Financial Statements. |
| ||||
|
|
| ||||
3. | Exhibits |
| ||||
| See Exhibit Index |
| ||||
3837
Management’s Report on Internal Control over Financial Reporting
The Company’s management is responsible for establishing and maintaining adequate internal control over financial reporting. The Company’s internal control over financial reporting is a process designed under the supervision of the CEO and CFO to provide reasonable assurance regarding reliability of financial reporting and preparation of the Company’s financial statements for external reporting purposes in accordance with U.S. GAAP.
The Company’s management assessed the effectiveness of the Company’s internal control over financial reporting as of December 31, 2005,2006, based on the criteria set forth by the Committee of Sponsoring Organization of the TreadwayTread way Commission (COSO) in “Internal Control-Integrated Framework.” Based on the assessment, management determined that, as of December 31, 2005,2006, the Company’s internal control over financial reporting was effective based on these criteria.
On October 21, 2005, the Company and its wholly-owned subsidiary, Millennium Holding Company, Inc., acquired 60 percent of the membership interests of Millennium Brokerage Group, LLC. Management has excluded the internal controls over financial reporting associated with Millennium Brokerage Group LLC from its assessment of the effectiveness of internal control over financial reporting as of December 31, 2005. As of December 31, 2005 the assets associated with Millennium Brokerage Group, LLC, represented less than 1% of the total assets of the Company. Total revenue, defined as net interest income and noninterest income, associated with Millennium Brokerage Group, LLC, included in the Company’s total revenue for the year ended December 31, 2005 was limited to the period from October 22, 2005 through December 31, 2005, and represented 1.5% of the Company’s total revenue for the year ended December 31, 2005.
Management’s assessment of the effectiveness of the Company’s internal control over financial reporting as of December 31, 20052006 has been audited by KPMG LLP, an independent registered public accounting firm, as stated in their report included in this Form 10-K.
3938
Report of Independent Registered Public Accounting Firm
The Board of Directors and Shareholders
Enterprise Financial Services Corp:
We have audited management’s assessment, included in the accompanying Management’s Report on Internal Control over Financial Reporting, that Enterprise Financial Services Corp and subsidiaries (the Company) maintained effective internal control over financial reporting as of December 31, 2005,2006, based on criteria established in Internal Control—Integrated Framework issued by the Committee of Sponsoring Organizations of the Treadway Commission (COSO). The Company’s management is responsible for maintaining effective internal control over financial reporting and for its assessment of the effectiveness of internal control over financial reporting. Our responsibility is to express an opinion on management’s assessment and an opinion on the effectiveness of the Company’s internal control over financial reporting based on our audit.
We conducted our audit in accordance with the standards of the Public Company Accounting Oversight Board (United States). Those standards require that we plan and perform the audit to obtain reasonable assurance about whether effective internal control over financial reporting was maintained in all material respects. Our audit included obtaining an understanding of internal control over financial reporting, evaluating management’s assessment, testing and evaluating the design and operating effectiveness of internal control, and performing such other procedures as we considered necessary in the circumstances. We believe that our audit provides a reasonable basis for our opinion.
A company’s internal control over financial reporting is a process designed to provide reasonable assurance regarding the reliability of financial reporting and the preparation of financial statements for external purposes in accordance with generally accepted accounting principles. A company’s internal control over financial reporting includes those policies and procedures that (1) pertain to the maintenance of records that, in reasonable detail, accurately and fairly reflect the transactions and dispositions of the assets of the company; (2) provide reasonable assurance that transactions are recorded as necessary to permit preparation of financial statements in accordance with generally accepted accounting principles, and that receipts and expenditures of the company are being made only in accordance with authorizations of management and directors of the company; and (3) provide reasonable assurance regarding prevention or timely detection of unauthorized acquisition, use, or disposition of the company’s assets that could have a material effect on the financial statements.
Because of its inherent limitations, internal control over financial reporting may not prevent or detect misstatements. Also, projections of any evaluation of effectiveness to future periods are subject to the risk that controls may become inadequate because of changes in conditions, or that the degree of compliance with the policies or procedures may deteriorate.
In our opinion, management’s assessment that Enterprise Financial Services Corpthe Company maintained effective internal control over financial reporting as of December 31, 2005,2006, is fairly stated, in all material respects, based on criteria established inInternal Control—Integrated Framework issued by COSO. Also, in our opinion, Enterprise Financial Services Corpthe Company maintained, in all material respects, effective internal control over financial reporting as of December 31, 2005,2006, based on criteria established in Internal Control—Integrated Frameworkissued by COSO.
The Company acquired Millennium Brokerage Group, LLC during 2005, and management excluded from its assessment of the effectiveness of the Company’s internal control over financial reporting as of December 31, 2005, Millennium Brokerage Group LLC’s internal control over financial reporting. As of December 31, 2005, the assets associated with Millennium Brokerage Group, LLC represented less than 1% of the total assets of the Company. Total revenue, defined as net interest income and noninterest income, associated with Millennium Brokerage Group, LLC for the period from October 22, 2005 through December 31, 2005 represented approximately 1.5% of the Company’s total revenue for the year ended December 31, 2005. Our audit of internal control over financial reporting of the Company also excluded an evaluation of the internal control over financial reporting of Millennium Brokerage Group, LLC.
We also have audited, in accordance with the standards of the Public Company Accounting Oversight Board (United States), the consolidated balance sheets of Enterprise Financial Services Corpthe Company as of December 31, 20052006 and 2004,2005, and the related consolidated statements of income, shareholders’ equity and comprehensive income, and cash flows for each of the years in the three-year period ended December 31, 2005,2006, and our report dated March 1, 200612, 2007 expressed an unqualified opinion on those consolidated financial statements.

St. Louis, Missouri
March 1, 200612, 2007
4039
Report of Independent Registered Public Accounting Firm
The Board of Directors and Shareholders
Enterprise Financial Services Corp:
We have audited the accompanying consolidated balance sheets of Enterprise Financial Services Corp and subsidiaries (the Company) as of December 31, 20052006 and 2004,2005, and the related consolidated statements of income, shareholders’ equity and comprehensive income, and cash flows for each of the years in the three-year period ended December 31, 2005.2006. These consolidated financial statements are the responsibility of the Company’s management. Our responsibility is to express an opinion on these consolidated financial statements based on our audits.
We conducted our audits in accordance with the standards of the Public Company Accounting Oversight Board (United States). Those standards require that we plan and perform the audit to obtain reasonable assurance about whether the financial statements are free of material misstatement. An audit includes examining, on a test basis, evidence supporting the amounts and disclosures in the financial statements. An audit also includes assessing the accounting principles used and significant estimates made by management, as well as evaluating the overall financial statement presentation. We believe that our audits provide a reasonable basis for our opinion.
In our opinion, the consolidated financial statements referred to above present fairly, in all material respects, the financial position of Enterprise Financial Services Corp and subsidiariesthe Company as of December 31, 20052006 and 2004,2005, and the results of theirits operations and theirits cash flows for each of the years in the three-year period ended December 31, 2005,2006, in conformity with U.S. generally accepted accounting principles.
We also have audited, in accordance with the standards of the Public Company Accounting Oversight Board (United States), the effectiveness of Enterprise Financial Services Corp’sthe Company’s internal control over financial reporting as of December 31, 2005,2006, based on criteria established inInternal Control—Integrated Frameworkissued by the Committee of Sponsoring Organizations of the Treadway Commission, and our report dated March 1, 200612, 2007 expressed an unqualified opinion on management’s assessment of, and the effective operation of, internal control over financial reporting.
| |
| |
|
41![]()
St. Louis, Missouri
March 12, 2007
40
ENTERPRISE FINANCIAL SERVICES CORP AND SUBSIDIARIES
Consolidated Balance Sheets
As of December 31, 2006, 2005
|
| December 31, |
| ||||
|
|
| |||||
(In thousands) |
| 2006 |
| 2005 |
| ||
|
|
| |||||
Assets |
|
|
|
|
|
|
|
Cash and due from banks |
| $ | 41,558 |
| $ | 54,118 |
|
Federal funds sold |
|
| 7,066 |
|
| 64,709 |
|
Interest-bearing deposits |
|
| 1,669 |
|
| 84 |
|
|
|
|
| ||||
Total cash and cash equivalents |
|
| 50,293 |
|
| 118,911 |
|
|
|
|
| ||||
Investments in debt and equity securities available for sale, at estimated fair value |
|
| 111,210 |
|
| 135,559 |
|
Loans held for sale |
|
| 2,602 |
|
| 2,761 |
|
Portfolio loans |
|
| 1,311,723 |
|
| 1,002,379 |
|
Less: Allowance for loan losses |
|
| 16,988 |
|
| 12,990 |
|
|
|
|
| ||||
Portfolio loans, net |
|
| 1,294,735 |
|
| 989,389 |
|
|
|
|
| ||||
Other real estate |
|
| 1,500 |
|
| — |
|
Fixed assets, net |
|
| 17,050 |
|
| 10,276 |
|
Accrued interest receivable |
|
| 7,995 |
|
| 5,598 |
|
Goodwill |
|
| 29,983 |
|
| 12,042 |
|
Intangibles, net |
|
| 5,789 |
|
| 4,548 |
|
Prepaid expenses and other assets |
|
| 14,430 |
|
| 7,884 |
|
|
|
|
| ||||
Total assets |
| $ | 1,535,587 |
| $ | 1,286,968 |
|
|
|
|
| ||||
Liabilities and Shareholders’ Equity |
|
|
|
|
|
|
|
Deposits: |
|
|
|
|
|
|
|
Demand |
| $ | 234,849 |
| $ | 229,325 |
|
Interest-bearing transaction accounts |
|
| 111,725 |
|
| 108,712 |
|
Money market accounts |
|
| 553,251 |
|
| 479,507 |
|
Savings |
|
| 3,696 |
|
| 3,679 |
|
Certificates of deposit: |
|
|
|
|
|
|
|
$100 and over |
|
| 296,916 |
|
| 229,839 |
|
Other |
|
| 115,071 |
|
| 65,182 |
|
|
|
|
| ||||
Total deposits |
|
| 1,315,508 |
|
| 1,116,244 |
|
Subordinated debentures |
|
| 35,054 |
|
| 30,930 |
|
Federal Home Loan Bank advances |
|
| 26,995 |
|
| 28,584 |
|
Other borrowings |
|
| 9,757 |
|
| 6,847 |
|
Notes payable |
|
| 4,000 |
|
| 1,500 |
|
Accrued interest payable |
|
| 3,468 |
|
| 2,704 |
|
Accounts payable and accrued expenses |
|
| 7,811 |
|
| 7,221 |
|
|
|
|
| ||||
Total liabilities |
|
| 1,402,593 |
|
| 1,194,030 |
|
|
|
|
| ||||
Minority interest in equity of consolidated subsidiary |
|
| — |
|
| 333 |
|
Shareholders’ equity: |
|
|
|
|
|
|
|
Common stock, $.01 par value; authorized 20,000,000 shares; issued and outstanding 11,539,539 shares at December 31, 2006 and 10,458,852 at December 31, 2005. |
|
| 115 |
|
| 105 |
|
Additional paid in capital |
|
| 78,026 |
|
| 53,218 |
|
Unearned compensation |
|
| — |
|
| (1,531 | ) |
Retained earnings |
|
| 55,445 |
|
| 41,950 |
|
Accumulated other comprehensive loss |
|
| (592 | ) |
| (1,137 | ) |
|
|
|
| ||||
Total shareholders’ equity |
|
| 132,994 |
|
| 92,605 |
|
|
|
|
| ||||
Total liabilities and shareholders’ equity |
| $ | 1,535,587 |
| $ | 1,286,968 |
|
|
|
|
| ||||
See accompanying notes to consolidated financial statements
41
ENTERPRISE FINANCIAL SERVICES CORP AND SUBSIDIARIES
Consolidated Statements of Income
Years ended December 31, 2006, 2005 and 2004
|
| December 31, |
| ||||
|
|
| |||||
(In thousands) |
| 2005 |
| 2004 |
| ||
|
|
| |||||
Assets |
|
|
|
|
|
|
|
Cash and due from banks |
| $ | 54,118 |
| $ | 28,324 |
|
Federal funds sold |
|
| 64,709 |
|
| — |
|
Interest-bearing deposits |
|
| 84 |
|
| 156 |
|
|
|
|
| ||||
Total cash and cash equivalents |
|
| 118,911 |
|
| 28,480 |
|
|
|
|
| ||||
Investments in debt and equity securities: |
|
|
|
|
|
|
|
Available for sale, at estimated fair value |
|
| 135,559 |
|
| 121,630 |
|
Held to maturity, at amortized cost (estimated fair value of $8 at December 31, 2004) |
|
| — |
|
| 8 |
|
|
|
|
| ||||
Total investments in debt and equity securities |
|
| 135,559 |
|
| 121,638 |
|
|
|
|
| ||||
Loans held for sale |
|
| 2,761 |
|
| 2,376 |
|
Loans, less unearned loan fees |
|
| 1,002,379 |
|
| 898,505 |
|
Less: Allowance for loan losses |
|
| 12,990 |
|
| 11,665 |
|
|
|
|
| ||||
Loans, net |
|
| 989,389 |
|
| 886,840 |
|
|
|
|
| ||||
Other real estate |
|
| — |
|
| 123 |
|
Fixed assets, net |
|
| 10,276 |
|
| 8,044 |
|
Accrued interest receivable |
|
| 5,598 |
|
| 4,238 |
|
Goodwill |
|
| 12,042 |
|
| 1,938 |
|
Intangibles |
|
| 4,548 |
|
| 135 |
|
Prepaid expenses and other assets |
|
| 7,884 |
|
| 6,138 |
|
|
|
|
| ||||
Total assets |
| $ | 1,286,968 |
| $ | 1,059,950 |
|
|
|
|
| ||||
Liabilities and Shareholders’ Equity |
|
|
|
|
|
|
|
Deposits: |
|
|
|
|
|
|
|
Demand |
| $ | 229,325 |
| $ | 197,283 |
|
Interest-bearing transaction accounts |
|
| 108,712 |
|
| 85,523 |
|
Money market accounts |
|
| 479,507 |
|
| 432,340 |
|
Savings |
|
| 3,679 |
|
| 3,919 |
|
Certificates of deposit: |
|
|
|
|
|
|
|
$100 and over |
|
| 229,839 |
|
| 178,851 |
|
Other |
|
| 65,182 |
|
| 41,712 |
|
|
|
|
| ||||
Total deposits |
|
| 1,116,244 |
|
| 939,628 |
|
Subordinated debentures |
|
| 30,930 |
|
| 20,620 |
|
Federal Home Loan Bank advances |
|
| 28,584 |
|
| 10,299 |
|
Other borrowings |
|
| 6,847 |
|
| 9,616 |
|
Notes payable |
|
| 1,500 |
|
| 250 |
|
Accrued interest payable |
|
| 2,704 |
|
| 1,665 |
|
Accounts payable and accrued expenses |
|
| 7,221 |
|
| 5,146 |
|
|
|
|
| ||||
Total liabilities |
|
| 1,194,030 |
|
| 987,224 |
|
|
|
|
| ||||
Minority interest in equity of consolidated subsidiary |
|
| 333 |
|
| — |
|
|
|
|
| ||||
Shareholders’ equity: |
|
|
|
|
|
|
|
Common stock, $.01 par value; authorized 20,000,000 shares; issued and outstanding 10,458,852 shares at December 31, 2005 and 9,778,357 at December 31, 2004. |
|
| 105 |
|
| 98 |
|
Additional paid in capital |
|
| 53,218 |
|
| 41,326 |
|
Unearned compensation |
|
| (1,531 | ) |
| — |
|
Retained earnings |
|
| 41,950 |
|
| 32,075 |
|
Accumulated other comprehensive loss |
|
| (1,137 | ) |
| (773 | ) |
|
|
|
| ||||
Total shareholders’ equity |
|
| 92,605 |
|
| 72,726 |
|
|
|
|
| ||||
Total liabilities and shareholders’ equity |
| $ | 1,286,968 |
| $ | 1,059,950 |
|
|
|
|
| ||||
|
| Years ended December 31, |
| |||||||
|
|
| ||||||||
(In thousands, except per share data) |
| 2006 |
| 2005 |
| 2004 |
| |||
|
|
|
| |||||||
Interest income: |
|
|
|
|
|
|
|
|
|
|
Interest and fees on loans |
| $ | 88,437 |
| $ | 63,448 |
| $ | 45,956 |
|
Interest on debt and equity securities: |
|
|
|
|
|
|
|
|
|
|
Taxable |
|
| 4,246 |
|
| 3,192 |
|
| 2,274 |
|
Nontaxable |
|
| 35 |
|
| 39 |
|
| 41 |
|
Interest on federal funds sold |
|
| 1,340 |
|
| 1,267 |
|
| 520 |
|
Interest on interest-bearing deposits |
|
| 76 |
|
| 13 |
|
| 2 |
|
Dividends on equity securities |
|
| 284 |
|
| 149 |
|
| 100 |
|
|
|
|
|
| ||||||
Total interest income |
|
| 94,418 |
|
| 68,108 |
|
| 48,893 |
|
|
|
|
|
| ||||||
Interest expense: |
|
|
|
|
|
|
|
|
|
|
Interest-bearing transaction accounts |
|
| 2,332 |
|
| 1,035 |
|
| 320 |
|
Money market accounts |
|
| 19,213 |
|
| 10,761 |
|
| 4,614 |
|
Savings |
|
| 57 |
|
| 31 |
|
| 14 |
|
Certificates of deposit: |
|
|
|
|
|
|
|
|
|
|
$100 and over |
|
| 12,386 |
|
| 6,925 |
|
| 3,993 |
|
Other |
|
| 3,844 |
|
| 1,722 |
|
| 1,057 |
|
Subordinated debentures |
|
| 2,343 |
|
| 1,348 |
|
| 1,405 |
|
Federal Home Loan Bank borrowings |
|
| 2,523 |
|
| 1,581 |
|
| 725 |
|
Notes payable and other borrowings |
|
| 443 |
|
| 138 |
|
| 41 |
|
|
|
|
|
| ||||||
Total interest expense |
|
| 43,141 |
|
| 23,541 |
|
| 12,169 |
|
|
|
|
|
| ||||||
Net interest income |
|
| 51,277 |
|
| 44,567 |
|
| 36,724 |
|
Provision for loan losses |
|
| 2,127 |
|
| 1,490 |
|
| 2,212 |
|
|
|
|
|
| ||||||
Net interest income after provision for loan losses |
|
| 49,150 |
|
| 43,077 |
|
| 34,512 |
|
|
|
|
|
| ||||||
Noninterest income: |
|
|
|
|
|
|
|
|
|
|
Wealth Management income |
|
| 13,809 |
|
| 6,525 |
|
| 4,264 |
|
Service charges on deposit accounts |
|
| 2,228 |
|
| 2,065 |
|
| 2,032 |
|
Other service charges and fee income |
|
| 617 |
|
| 464 |
|
| 396 |
|
Gain on sale of mortgage loans |
|
| 230 |
|
| 281 |
|
| 262 |
|
Gain on sale of other real estate |
|
| 2 |
|
| 91 |
|
| — |
|
(Loss) gain on sale of securities |
|
| — |
|
| (494 | ) |
| 126 |
|
Miscellaneous income |
|
| 30 |
|
| 35 |
|
| 42 |
|
|
|
|
|
| ||||||
Total noninterest income |
|
| 16,916 |
|
| 8,967 |
|
| 7,122 |
|
|
|
|
|
| ||||||
Noninterest expense: |
|
|
|
|
|
|
|
|
|
|
Employee compensation and benefits |
|
| 25,247 |
|
| 22,130 |
|
| 18,553 |
|
Occupancy |
|
| 2,966 |
|
| 2,327 |
|
| 2,090 |
|
Furniture and equipment |
|
| 1,028 |
|
| 821 |
|
| 720 |
|
Data processing |
|
| 1,431 |
|
| 1,018 |
|
| 797 |
|
Other |
|
| 10,722 |
|
| 8,028 |
|
| 7,171 |
|
|
|
|
|
| ||||||
Total noninterest expense |
|
| 41,394 |
|
| 34,324 |
|
| 29,331 |
|
|
|
|
|
| ||||||
Minority interest in net income of consolidated subsidiary |
|
| (875 | ) |
| (113 | ) |
| — |
|
|
|
|
|
| ||||||
Income before income tax expense |
|
| 23,797 |
|
| 17,607 |
|
| 12,303 |
|
Income tax expense |
|
| 8,325 |
|
| 6,312 |
|
| 4,088 |
|
|
|
|
|
| ||||||
Net income |
| $ | 15,472 |
| $ | 11,295 |
| $ | 8,215 |
|
|
|
|
|
| ||||||
Per share amounts: |
|
|
|
|
|
|
|
|
|
|
Basic earnings per share |
| $ | 1.41 |
| $ | 1.12 |
| $ | 0.85 |
|
Basic weighted average common shares outstanding |
|
| 10,964 |
|
| 10,103 |
|
| 9,696 |
|
Diluted earnings per share |
| $ | 1.36 |
| $ | 1.05 |
| $ | 0.82 |
|
Diluted weighted average common shares outstanding |
|
| 11,387 |
|
| 10,747 |
|
| 10,055 |
|
See accompanying notes to consolidated financial statements.
42
ENTERPRISE FINANCIAL SERVICES CORP AND SUBSIDIARIES
Consolidated Statements of Shareholders’ Equity and Comprehensive Income
Years ended December 31, 2004, 2005, 2004 and 20032006
|
| Years ended December 31, |
| |||||||
|
|
| ||||||||
(In thousands, except per share data) |
| 2005 |
| 2004 |
| 2003 |
| |||
|
|
|
| |||||||
Interest income: |
|
|
|
|
|
|
|
|
|
|
Interest and fees on loans |
| $ | 63,448 |
| $ | 45,956 |
| $ | 41,221 |
|
Interest on debt and equity securities: |
|
|
|
|
|
|
|
|
|
|
Taxable |
|
| 3,192 |
|
| 2,274 |
|
| 1,691 |
|
Nontaxable |
|
| 39 |
|
| 41 |
|
| 23 |
|
Interest on federal funds sold |
|
| 1,267 |
|
| 520 |
|
| 196 |
|
Interest on interest-bearing deposits |
|
| 13 |
|
| 2 |
|
| 2 |
|
Dividends on equity securities |
|
| 149 |
|
| 100 |
|
| 112 |
|
|
|
|
|
| ||||||
Total interest income |
|
| 68,108 |
|
| 48,893 |
|
| 43,245 |
|
|
|
|
|
| ||||||
Interest expense: |
|
|
|
|
|
|
|
|
|
|
Interest-bearing transaction accounts |
|
| 1,035 |
|
| 320 |
|
| 169 |
|
Money market accounts |
|
| 10,761 |
|
| 4,614 |
|
| 3,475 |
|
Savings |
|
| 31 |
|
| 14 |
|
| 24 |
|
Certificates of deposit: |
|
|
|
|
|
|
|
|
|
|
$100 and over |
|
| 6,925 |
|
| 3,993 |
|
| 2,972 |
|
Other |
|
| 1,722 |
|
| 1,057 |
|
| 1,560 |
|
Subordinated debentures |
|
| 1,348 |
|
| 1,405 |
|
| 1,270 |
|
Federal Home Loan Bank borrowings |
|
| 1,581 |
|
| 725 |
|
| 1,033 |
|
Notes payable and other borrowings |
|
| 138 |
|
| 41 |
|
| 41 |
|
|
|
|
|
| ||||||
Total interest expense |
|
| 23,541 |
|
| 12,169 |
|
| 10,544 |
|
|
|
|
|
| ||||||
Net interest income |
|
| 44,567 |
|
| 36,724 |
|
| 32,701 |
|
Provision for loan losses |
|
| 1,490 |
|
| 2,212 |
|
| 3,627 |
|
Net interest income after provision for loan losses |
|
| 43,077 |
|
| 34,512 |
|
| 29,074 |
|
|
|
|
|
| ||||||
Noninterest income: |
|
|
|
|
|
|
|
|
|
|
Service charges on deposit accounts |
|
| 2,065 |
|
| 2,032 |
|
| 1,782 |
|
Wealth Management income |
|
| 6,522 |
|
| 4,264 |
|
| 3,622 |
|
Other service charges and fee income |
|
| 464 |
|
| 396 |
|
| 369 |
|
Gain on sale of branches |
|
| — |
|
| — |
|
| 2,938 |
|
Gain on sale of mortgage loans |
|
| 281 |
|
| 262 |
|
| 927 |
|
Gain on sale of other real estate |
|
| 91 |
|
| — |
|
| — |
|
(Loss) gain on sale of securities |
|
| (494 | ) |
| 126 |
|
| 78 |
|
Miscellaneous income |
|
| 35 |
|
| 42 |
|
| 375 |
|
|
|
|
|
| ||||||
Total noninterest income |
|
| 8,964 |
|
| 7,122 |
|
| 10,091 |
|
|
|
|
|
| ||||||
Noninterest expense: |
|
|
|
|
|
|
|
|
|
|
Employee compensation and benefits |
|
| 22,130 |
|
| 18,553 |
|
| 17,698 |
|
Occupancy |
|
| 2,327 |
|
| 2,090 |
|
| 1,974 |
|
Furniture and equipment |
|
| 821 |
|
| 720 |
|
| 841 |
|
Data processing |
|
| 1,018 |
|
| 797 |
|
| 932 |
|
Other |
|
| 8,025 |
|
| 7,171 |
|
| 6,770 |
|
|
|
|
|
| ||||||
Total noninterest expense |
|
| 34,321 |
|
| 29,331 |
|
| 28,215 |
|
|
|
|
|
| ||||||
Minority interest in net income of consolidated subsidiary |
|
| (113 | ) |
| — |
|
| — |
|
|
|
|
|
| ||||||
Income before income tax expense |
|
| 17,607 |
|
| 12,303 |
|
| 10,950 |
|
Income tax expense |
|
| 6,312 |
|
| 4,088 |
|
| 4,025 |
|
|
|
|
|
| ||||||
Net income |
| $ | 11,295 |
| $ | 8,215 |
| $ | 6,925 |
|
|
|
|
|
| ||||||
Per share amounts: |
|
|
|
|
|
|
|
|
|
|
Basic earnings per share |
| $ | 1.12 |
| $ | 0.85 |
| $ | 0.72 |
|
Basic weighted average common shares outstanding |
|
| 10,103,074 |
|
| 9,695,500 |
|
| 9,566,059 |
|
Diluted earnings per share |
| $ | 1.05 |
| $ | 0.82 |
| $ | 0.70 |
|
Diluted weighted average common shares outstanding |
|
| 10,747,097 |
|
| 10,054,691 |
|
| 9,875,141 |
|
|
| Common Stock |
| Additional Paid in Capital |
| Retained earnings |
| Accumulated other comprehensive income (loss) |
| Total shareholders’ equity |
| ||||||||
|
|
|
|
|
|
| |||||||||||||
(in thousands, except shares) |
| Shares |
| Amount |
|
|
|
|
| ||||||||||
|
|
|
|
|
|
| |||||||||||||
Balance December 31, 2003 |
|
| 9,618,482 |
| $ | 96 |
| $ | 39,841 |
| $ | 24,832 |
| $ | 618 |
| $ | 65,387 |
|
Net income |
|
| — |
|
| — |
|
| — |
|
| 8,214 |
|
| — |
|
| 8,214 |
|
Change in fair value of investment securities, net of tax |
|
| — |
|
| — |
|
| — |
|
| — |
|
| (418 | ) |
| (418 | ) |
Reclassification adjustment for gains realized in net income, net of tax |
|
| — |
|
| — |
|
| — |
|
| — |
|
| (83 | ) |
| (83 | ) |
Change in fair value of cash flow hedges, net of tax |
|
| — |
|
| — |
|
| — |
|
| — |
|
| (890 | ) |
| (890 | ) |
|
|
|
|
|
|
|
|
|
|
|
|
|
|
|
|
|
| ||
Total comprehensive income |
|
|
|
|
|
|
|
|
|
|
|
|
|
|
|
|
| 6,823 |
|
|
|
|
|
|
|
|
|
|
|
|
|
|
|
|
|
|
| ||
Dividends declared ($0.10 per share) |
|
| — |
|
| — |
|
| — |
|
| (971 | ) |
| — |
|
| (971 | ) |
Common stock issued under stock option plans |
|
| 159,875 |
|
| 2 |
|
| 1,240 |
|
| — |
|
| — |
|
| 1,242 |
|
Income tax benefit from stock options exercised |
|
| — |
|
| — |
|
| 11 |
|
| — |
|
| — |
|
| 11 |
|
Noncash compensation attributed to stock option grants |
|
| — |
|
| — |
|
| 234 |
|
| — |
|
| — |
|
| 234 |
|
|
|
|
|
|
|
|
| ||||||||||||
Balance December 31, 2004 |
|
| 9,778,357 |
| $ | 98 |
| $ | 41,326 |
| $ | 32,075 |
| $ | (773 | ) | $ | 72,726 |
|
|
|
|
|
|
|
|
| ||||||||||||
Net income |
|
| — |
|
| — |
|
| — |
|
| 11,295 |
|
| — |
|
| 11,295 |
|
Change in fair value of investment securities, net of tax |
|
| — |
|
| — |
|
| — |
|
| — |
|
| (648 | ) |
| (648 | ) |
Reclassification adjustment for losses realized in net income, net of tax |
|
| — |
|
| — |
|
| — |
|
| — |
|
| 201 |
|
| 201 |
|
Change in fair value of cash flow hedges, net of tax |
|
| — |
|
| — |
|
| — |
|
| — |
|
| 83 |
|
| 83 |
|
|
|
|
|
|
|
|
|
|
|
|
|
|
|
|
|
|
| ||
Total comprehensive income |
|
|
|
|
|
|
|
|
|
|
|
|
|
|
|
|
| 10,931 |
|
|
|
|
|
|
|
|
|
|
|
|
|
|
|
|
|
|
| ||
Dividends declared ($0.14 per share) |
|
| — |
|
| — |
|
| — |
|
| (1,420 | ) |
| — |
|
| (1,420 | ) |
Common stock issued under stock option plans, net of restricted share unit cancellations |
|
| 431,334 |
|
| 5 |
|
| 3,634 |
|
| — |
|
| — |
|
| 3,639 |
|
Income tax benefit from stock options exercised and vesting of restricted share units |
|
| — |
|
| — |
|
| 831 |
|
| — |
|
| — |
|
| 831 |
|
Acquisition of Millennium Brokerage Group, LLC |
|
| 249,161 |
|
| 2 |
|
| 5,247 |
|
| — |
|
| — |
|
| 5,249 |
|
Noncash compensation attributed to stock option grants |
|
| — |
|
| — |
|
| 49 |
|
| — |
|
| — |
|
| 49 |
|
Amortization of unearned compensation |
|
| — |
|
| — |
|
| 600 |
|
| — |
|
| — |
|
| 600 |
|
|
|
|
|
|
|
|
| ||||||||||||
Balance December 31, 2005 |
|
| 10,458,852 |
| $ | 105 |
| $ | 51,687 |
| $ | 41,950 |
| $ | (1,137 | ) | $ | 92,605 |
|
|
|
|
|
|
|
|
| ||||||||||||
Net income |
|
| — |
|
| — |
|
| — |
|
| 15,472 |
|
| — |
|
| 15,472 |
|
Change in fair value of investment securities, net of tax |
|
| — |
|
| — |
|
| — |
|
| — |
|
| 282 |
|
| 282 |
|
Change in fair value of cash flow hedges, net of tax |
|
| — |
|
| — |
|
| — |
|
| — |
|
| 263 |
|
| 263 |
|
|
|
|
|
|
|
|
|
|
|
|
|
|
|
|
|
|
| ||
Total comprehensive income |
|
|
|
|
|
|
|
|
|
|
|
|
|
|
|
|
| 16,017 |
|
|
|
|
|
|
|
|
|
|
|
|
|
|
|
|
|
|
| ||
Dividends declared ($0.18 per share) |
|
| — |
|
| — |
|
| — |
|
| (1,977 | ) |
| — |
|
| (1,977 | ) |
Common stock issued under stock option plans, net of restricted share unit cancellations |
|
| 163,162 |
|
| 1 |
|
| 1,188 |
|
| — |
|
| — |
|
| 1,189 |
|
Income tax benefit from stock options exercised and vesting of restricted share units |
|
| — |
|
| — |
|
| 525 |
|
| — |
|
| — |
|
| 525 |
|
Acquisition of NorthStar Bancshares, Inc. |
|
| 914,144 |
|
| 9 |
|
| 23,473 |
|
| — |
|
| — |
|
| 23,482 |
|
Issuance of common stock shares |
|
| 3,381 |
|
| — |
|
| 86 |
|
| — |
|
| — |
|
| 86 |
|
Noncash compensation attributed to stock option grants |
|
| — |
|
| — |
|
| 38 |
|
| — |
|
| — |
|
| 38 |
|
Noncash compensation attributed to restricted share units |
|
| — |
|
| — |
|
| 1,029 |
|
| — |
|
| — |
|
| 1,029 |
|
|
|
|
|
|
|
|
| ||||||||||||
Balance December 31, 2006 |
|
| 11,539,539 |
| $ | 115 |
| $ | 78,026 |
| $ | 55,445 |
| $ | (592 | ) | $ | 132,994 |
|
|
|
|
|
|
|
|
| ||||||||||||
See accompanying notes to consolidated financial statements.
43
ENTERPRISE FINANCIAL SERVICES CORP AND SUBSIDIARIES
Consolidated Statements of Shareholders’ Equity and Comprehensive IncomeCash Flows
Years ended December 31, 2003,2006, 2005 & 2004 and 2005
|
| Common Stock |
| Additional Paid |
| Unearned |
| Retained |
| Accumulated |
| Total |
| |||||||||
|
|
|
|
|
|
|
| |||||||||||||||
(in thousands, except shares) |
| Shares |
| Amount |
|
|
|
|
|
| ||||||||||||
|
|
|
|
|
|
|
| |||||||||||||||
Balance December 31, 2002 |
|
| 9,497,794 |
| $ | 95 |
| $ | 38,402 |
| $ | — |
| $ | 18,674 |
| $ | 1,639 |
| $ | 58,810 |
|
Net income |
|
| — |
|
| — |
|
| — |
|
| — |
|
| 6,925 |
|
| — |
|
| 6,925 |
|
Unrealized loss on securities, net of tax |
|
| — |
|
| — |
|
| — |
|
| — |
|
| — |
|
| (180 | ) |
| (180 | ) |
Reclassification adjustment for gains realized in net income, net of tax |
|
| — |
|
| — |
|
| — |
|
| — |
|
| — |
|
| (52 | ) |
| (52 | ) |
Unrealized loss on cash flow hedges, net of tax |
|
| — |
|
| — |
|
| — |
|
| — |
|
| — |
|
| (789 | ) |
| (789 | ) |
|
|
|
|
|
|
|
|
|
|
|
|
|
|
|
|
|
|
|
|
| ||
Total comprehensive income |
|
|
|
|
|
|
|
|
|
|
|
|
|
|
|
|
|
|
|
| 5,904 |
|
|
|
|
|
|
|
|
|
|
|
|
|
|
|
|
|
|
|
|
|
| ||
Dividends declared ($0.08 per share) |
|
| — |
|
| — |
|
| — |
|
| — |
|
| (767 | ) |
| — |
|
| (767 | ) |
Stock options exercised, including related tax benefit |
|
| 120,688 |
|
| 1 |
|
| 1,150 |
|
| — |
|
| — |
|
| — |
|
| 1,151 |
|
Noncash compensation attributed to stock option grants |
|
| — |
|
| — |
|
| 289 |
|
| — |
|
| — |
|
| — |
|
| 289 |
|
|
|
|
|
|
|
|
|
| ||||||||||||||
Balance December 31, 2003 |
|
| 9,618,482 |
| $ | 96 |
| $ | 39,841 |
| $ | — |
| $ | 24,832 |
| $ | 618 |
| $ | 65,387 |
|
|
|
|
|
|
|
|
|
| ||||||||||||||
Net income |
|
| — |
|
| — |
|
| — |
|
| — |
|
| 8,214 |
|
| — |
|
| 8,214 |
|
Unrealized loss on securities, net of tax |
|
| — |
|
| — |
|
| — |
|
| — |
|
| — |
|
| (418 | ) |
| (418 | ) |
Reclassification adjustment for gains realized in net income, net of tax |
|
| — |
|
| — |
|
| — |
|
| — |
|
| — |
|
| (83 | ) |
| (83 | ) |
Unrealized loss on cash flow hedges, net of tax |
|
| — |
|
| — |
|
| — |
|
| — |
|
| — |
|
| (890 | ) |
| (890 | ) |
|
|
|
|
|
|
|
|
|
|
|
|
|
|
|
|
|
|
|
|
| ||
Total comprehensive income |
|
|
|
|
|
|
|
|
|
|
|
|
|
|
|
|
|
|
|
| 6,823 |
|
|
|
|
|
|
|
|
|
|
|
|
|
|
|
|
|
|
|
|
|
| ||
Dividends declared ($0.10 per share) |
|
| — |
|
| — |
|
| — |
|
| — |
|
| (971 | ) |
| — |
|
| (971 | ) |
Stock options exercised, including related tax benefit |
|
| 159,875 |
|
| 2 |
|
| 1,251 |
|
| — |
|
| — |
|
| — |
|
| 1,253 |
|
Noncash compensation attributed to stock option grants |
|
| — |
|
| — |
|
| 234 |
|
| — |
|
| — |
|
| — |
|
| 234 |
|
|
|
|
|
|
|
|
|
| ||||||||||||||
Balance December 31, 2004 |
|
| 9,778,357 |
| $ | 98 |
| $ | 41,326 |
| $ | — |
| $ | 32,075 |
| $ | (773 | ) | $ | 72,726 |
|
|
|
|
|
|
|
|
|
| ||||||||||||||
Net income |
|
| — |
|
| — |
|
| — |
|
| — |
|
| 11,295 |
|
| — |
|
| 11,295 |
|
Unrealized loss on securities, net of tax |
|
| — |
|
| — |
|
| — |
|
| — |
|
| — |
|
| (648 | ) |
| (648 | ) |
Reclassification adjustment for losses realized in net income, net of tax |
|
| — |
|
| — |
|
| — |
|
| — |
|
| — |
|
| 201 |
|
| 201 |
|
Unrealized gain on cash flow hedges, net of tax |
|
| — |
|
| — |
|
| — |
|
| — |
|
| — |
|
| 83 |
|
| 83 |
|
|
|
|
|
|
|
|
|
|
|
|
|
|
|
|
|
|
|
|
|
| ||
Total comprehensive income |
|
|
|
|
|
|
|
|
|
|
|
|
|
|
|
|
|
|
|
| 10,931 |
|
|
|
|
|
|
|
|
|
|
|
|
|
|
|
|
|
|
|
|
|
| ||
Dividends declared ($0.14 per share) |
|
| — |
|
| — |
|
| — |
|
|
|
|
| (1,420 | ) |
| — |
|
| (1,420 | ) |
Stock options exercised, including related tax benefit |
|
| 400,078 |
|
| 5 |
|
| 4,465 |
|
| — |
|
| — |
|
| — |
|
| 4,470 |
|
Restricted stock unit activity |
|
| 31,256 |
|
| — |
|
| — |
|
| — |
|
| — |
|
| — |
|
| — |
|
Acquisition of Millennium Brokerage Group, LLC |
|
| 249,161 |
|
| 2 |
|
| 5,247 |
|
| — |
|
| — |
|
| — |
|
| 5,249 |
|
Noncash compensation attributed to stock option grants |
|
| — |
|
| — |
|
| 49 |
|
| — |
|
| — |
|
| — |
|
| 49 |
|
Unearned compensation |
|
| — |
|
| — |
|
| 2,131 |
|
| (2,131 | ) |
| — |
|
| — |
|
| — |
|
Amortization of unearned compensation |
|
| — |
|
| — |
|
| — |
|
| 600 |
|
| — |
|
| — |
|
| 600 |
|
|
|
|
|
|
|
|
|
| ||||||||||||||
Balance December 31, 2005 |
|
| 10,458,852 |
| $ | 105 |
| $ | 53,218 |
| $ | (1,531 | ) | $ | 41,950 |
| $ | (1,137 | ) | $ | 92,605 |
|
|
|
|
|
|
|
|
|
| ||||||||||||||
|
| Years ended December 31, |
| |||||||
|
|
| ||||||||
(in thousands) |
| 2006 |
| 2005 |
| 2004 |
| |||
|
|
|
| |||||||
Cash flows from operating activities: |
|
|
|
|
|
|
|
|
|
|
Net income |
| $ | 15,472 |
| $ | 11,295 |
| $ | 8,215 |
|
Adjustments to reconcile net income to net cash from operating activities: |
|
|
|
|
|
|
|
|
|
|
Depreciation |
|
| 1,901 |
|
| 1,272 |
|
| 996 |
|
Provision for loan losses |
|
| 2,127 |
|
| 1,490 |
|
| 2,212 |
|
Net amortization of debt and equity securities |
|
| 39 |
|
| 342 |
|
| 1,817 |
|
Amortization of intangible assets |
|
| 1,128 |
|
| 287 |
|
| 180 |
|
Loss (gain) on sale of available for sale investment securities |
|
| — |
|
| 494 |
|
| (126 | ) |
Mortgage loans originated |
|
| (57,184 | ) |
| (65,891 | ) |
| (60,263 | ) |
Proceeds from mortgage loans sold |
|
| 57,822 |
|
| 65,787 |
|
| 60,998 |
|
Gain on sale of mortgage loans |
|
| (230 | ) |
| (281 | ) |
| (262 | ) |
Decrease in settlement accrual of disputed note |
|
| — |
|
| — |
|
| (575 | ) |
Gain on sale of other real estate |
|
| (2 | ) |
| (91 | ) |
| — |
|
Excess tax benefits of share-based compensation |
|
| (525 | ) |
| 831 |
|
| 11 |
|
Stock based compensation |
|
| 786 |
|
| 649 |
|
| 234 |
|
Changes in: |
|
|
|
|
|
|
|
|
|
|
Accrued interest receivable |
|
| (1,601 | ) |
| (1,360 | ) |
| (959 | ) |
Accrued interest payable and other liabilities |
|
| 327 |
|
| 1,699 |
|
| 589 |
|
Other, net |
|
| (2,663 | ) |
| (360 | ) |
| 2,015 |
|
|
|
|
|
| ||||||
Net cash provided by operating activities |
|
| 17,397 |
|
| 16,163 |
|
| 15,082 |
|
|
|
|
|
| ||||||
Cash flows from investing activities: |
|
|
|
|
|
|
|
|
|
|
Cash paid for acquisition, net of cash and cash equivalents received |
|
| (4,078 | ) |
| (8,882 | ) |
| — |
|
Net increase in loans |
|
| (145,218 | ) |
| (104,518 | ) |
| (116,046 | ) |
Purchases of available for sale debt and equity securities |
|
| (40,676 | ) |
| (165,944 | ) |
| (351,696 | ) |
Proceeds from sales of available for sale debt securities |
|
| — |
|
| 39,040 |
|
| 62,766 |
|
Proceeds from redemption of equity securities |
|
| 6,904 |
|
| 4,672 |
|
| 2,534 |
|
Proceeds from maturities and principal paydowns on available for sale debt and equity securities |
|
| 66,722 |
|
| 106,786 |
|
| 246,244 |
|
Proceeds from sales of other real estate |
|
| 167 |
|
| 229 |
|
| — |
|
Recoveries of loans previously charged off |
|
| 399 |
|
| 479 |
|
| 159 |
|
Purchases of fixed assets |
|
| (7,591 | ) |
| (3,505 | ) |
| (1,723 | ) |
|
|
|
|
| ||||||
Net cash used in investing activities |
|
| (123,371 | ) |
| (131,643 | ) |
| (157,762 | ) |
|
|
|
|
| ||||||
Cash flows from financing activities: |
|
|
|
|
|
|
|
|
|
|
Net (decrease) increase in non-interest bearing deposit accounts |
|
| (11,785 | ) |
| 32,042 |
|
| 32,331 |
|
Net increase in interest bearing deposit accounts |
|
| 53,261 |
|
| 144,574 |
|
| 110,897 |
|
Proceeds from issuance of subordinated debentures |
|
| 4,124 |
|
| 10,310 |
|
| 16,496 |
|
Paydown of subordinated debentures |
|
| — |
|
| — |
|
| (11,340 | ) |
Proceeds from Federal Home Loan Bank advances |
|
| 723,534 |
|
| 301,200 |
|
| 55,000 |
|
Repayments of Federal Home Loan Bank advances |
|
| (725,121 | ) |
| (282,915 | ) |
| (59,201 | ) |
Decrease in other borrowings |
|
| (6,015 | ) |
| (2,768 | ) |
| (31 | ) |
Proceeds from notes payable |
|
| 10,000 |
|
| 1,500 |
|
| 350 |
|
Paydowns on notes payable |
|
| (10,745 | ) |
| (250 | ) |
| (100 | ) |
Cash dividends paid on common stock |
|
| (1,977 | ) |
| (1,420 | ) |
| (971 | ) |
Excess tax benefits of share-based compensation |
|
| 525 |
|
| — |
|
| — |
|
Proceeds from the issuance of common stock |
|
| 86 |
|
| — |
|
| — |
|
Proceeds from the exercise of common stock options |
|
| 1,470 |
|
| 3,638 |
|
| 1,241 |
|
|
|
|
|
| ||||||
Net cash provided by financing activities |
|
| 37,357 |
|
| 205,911 |
|
| 144,672 |
|
|
|
|
|
| ||||||
Net (decrease) increase in cash and cash equivalents |
|
| (68,618 | ) |
| 90,431 |
|
| 1,992 |
|
Cash and cash equivalents, beginning of year |
|
| 118,911 |
|
| 28,480 |
|
| 26,488 |
|
|
|
|
|
| ||||||
Cash and cash equivalents, end of period |
| $ | 50,293 |
| $ | 118,911 |
| $ | 28,480 |
|
|
|
|
|
| ||||||
Supplemental disclosures of cash flow information: |
|
|
|
|
|
|
|
|
|
|
Cash paid during the period for: |
|
|
|
|
|
|
|
|
|
|
Interest |
| $ | 42,377 |
| $ | 22,502 |
| $ | 11,655 |
|
Income taxes |
|
| 7,896 |
|
| 6,456 |
|
| 3,280 |
|
|
|
|
|
| ||||||
Noncash transactions: |
|
|
|
|
|
|
|
|
|
|
Transfer to other real estate owned in settlement of loans |
| $ | — |
| $ | — |
| $ | 273 |
|
Common stock issued for acquisition of business |
|
| 23,482 |
|
| 5,249 |
|
| — |
|
See accompanying notes to consolidated financial statements.
44
ENTERPRISE FINANCIAL SERVICES CORP AND SUBSIDIARIESConsolidated Statements of Cash FlowsYears ended December 31, 2005, 2004 & 2003
|
| Years ended December 31, |
| |||||||
|
|
| ||||||||
(in thousands) |
| 2005 |
| 2004 |
| 2003 |
| |||
|
|
|
| |||||||
Cash flows from operating activities: |
|
|
|
|
|
|
|
|
|
|
Net income |
| $ | 11,295 |
| $ | 8,215 |
| $ | 6,925 |
|
Adjustments to reconcile net income to net cash from operating activities: |
|
|
|
|
|
|
|
|
|
|
Depreciation |
|
| 1,272 |
|
| 996 |
|
| 1,231 |
|
Provision for loan losses |
|
| 1,490 |
|
| 2,212 |
|
| 3,627 |
|
Net amortization of debt and equity securities |
|
| 342 |
|
| 1,817 |
|
| 907 |
|
Net amortization of intangible assets |
|
| 287 |
|
| 180 |
|
| 160 |
|
Loss (gain) on sale of available for sale investment securities |
|
| 494 |
|
| (126 | ) |
| (78 | ) |
Mortgage loans originated |
|
| (65,891 | ) |
| (60,263 | ) |
| (115,308 | ) |
Proceeds from mortgage loans sold |
|
| 65,787 |
|
| 60,998 |
|
| 120,378 |
|
Gain on sale of mortgage loans |
|
| (281 | ) |
| (262 | ) |
| (927 | ) |
Decrease in settlement accrual of disputed note |
|
| — |
|
| (575 | ) |
| (725 | ) |
Gain on sale of other real estate |
|
| (91 | ) |
| — |
|
| — |
|
Noncash compensation for stock option grants & restricted share units |
|
| 649 |
|
| 234 |
|
| 289 |
|
Tax benefit for nonqualified stock options |
|
| 831 |
|
| 11 |
|
| — |
|
Gain on sale of branches |
|
| — |
|
| — |
|
| (2,938 | ) |
Changes in: |
|
|
|
|
|
|
|
|
|
|
Accrued interest receivable |
|
| (1,360 | ) |
| (959 | ) |
| 180 |
|
Accrued interest and other liabilities |
|
| 1,699 |
|
| 589 |
|
| 2,196 |
|
Other, net |
|
| (360 | ) |
| 2,015 |
|
| 63 |
|
|
|
|
|
| ||||||
Net cash provided by operating activities |
|
| 16,163 |
|
| 15,082 |
|
| 15,980 |
|
|
|
|
|
| ||||||
Cash flows from investing activities: |
|
|
|
|
|
|
|
|
|
|
Cash paid in sale of branches |
|
| — |
|
| — |
|
| (16,741 | ) |
Purchase of business, net of cash acquired |
|
| (8,882 | ) |
| — |
|
| — |
|
Net increase in loans |
|
| (104,518 | ) |
| (116,046 | ) |
| (98,197 | ) |
Purchases of available for sale debt and equity securities |
|
| (165,944 | ) |
| (351,696 | ) |
| (81,786 | ) |
Proceeds from sales of available for sale debt securities |
|
| 39,040 |
|
| 62,766 |
|
| 11,193 |
|
Proceeds from redemption of equity securities |
|
| 4,672 |
|
| 2,534 |
|
| 605 |
|
Proceeds from maturities and principal paydowns on available for sale debt and equity securities |
|
| 106,786 |
|
| 246,244 |
|
| 51,939 |
|
Proceeds from sales of other real estate |
|
| 229 |
|
| — |
|
| 451 |
|
Recoveries of loans previously charged off |
|
| 479 |
|
| 159 |
|
| 267 |
|
Purchases of fixed assets |
|
| (3,505 | ) |
| (1,723 | ) |
| (953 | ) |
|
|
|
|
| ||||||
Net cash used in investing activities |
|
| (131,643 | ) |
| (157,762 | ) |
| (133,222 | ) |
|
|
|
|
| ||||||
Cash flows from financing activities: |
|
|
|
|
|
|
|
|
|
|
Net increase in non-interest bearing deposit accounts |
|
| 32,042 |
|
| 32,331 |
|
| 8,671 |
|
Net increase in interest bearing deposit accounts |
|
| 144,574 |
|
| 110,897 |
|
| 69,901 |
|
Proceeds from issuance of subordinated debentures |
|
| 10,310 |
|
| 16,496 |
|
| — |
|
Paydown of subordinated debentures |
|
| — |
|
| (11,340 | ) |
| — |
|
Proceeds from Federal Home Loan Bank advances |
|
| 301,200 |
|
| 55,000 |
|
| 130,000 |
|
Repayments of Federal Home Loan Bank advances |
|
| (282,915 | ) |
| (59,201 | ) |
| (144,964 | ) |
(Decrease) increase in federal funds purchased |
|
| (6,333 | ) |
| (2,047 | ) |
| 8,381 |
|
Increase in customer repurchase agreements |
|
| 3,565 |
|
| 3,086 |
|
| — |
|
Proceeds from notes payable |
|
| 1,500 |
|
| 350 |
|
| 100 |
|
Paydowns on notes payable |
|
| (250 | ) |
| (100 | ) |
| (100 | ) |
Decrease in other borrowings |
|
| — |
|
| (1,070 | ) |
| (1,092 | ) |
Cash dividends paid on common stock |
|
| (1,420 | ) |
| (971 | ) |
| (767 | ) |
Proceeds from the exercise of common stock options |
|
| 3,638 |
|
| 1,241 |
|
| 1,115 |
|
|
|
|
|
| ||||||
Net cash provided by financing activities |
|
| 205,911 |
|
| 144,672 |
|
| 71,245 |
|
|
|
|
|
| ||||||
Net increase in cash and cash equivalents |
|
| 90,431 |
|
| 1,992 |
|
| (45,997 | ) |
Cash and cash equivalents, beginning of year |
|
| 28,480 |
|
| 26,488 |
|
| 72,485 |
|
|
|
|
|
| ||||||
Cash and cash equivalents, end of year |
| $ | 118,911 |
| $ | 28,480 |
|
| 26,488 |
|
|
|
|
|
| ||||||
Supplemental disclosures of cash flow information: |
|
|
|
|
|
|
|
|
|
|
Cash paid during the period for: |
|
|
|
|
|
|
|
|
|
|
Interest |
| $ | 22,502 |
| $ | 11,655 |
| $ | 10,658 |
|
Income taxes |
|
| 6,456 |
|
| 3,280 |
|
| 4,517 |
|
|
|
|
|
| ||||||
Noncash transactions: |
|
|
|
|
|
|
|
|
|
|
Transfer to other real estate owned in settlement of loans |
| $ | — |
| $ | 273 |
| $ | 345 |
|
Writeoff of goodwill associated with sale of branches |
|
| — |
|
| — |
|
| 150 |
|
Stock issued for acquisition of business |
|
| 5,249 |
|
| — |
|
| — |
|
See accompanying notes to consolidated financial statements.
45
NOTE 1—SUMMARY OF SIGNIFICANT ACCOUNTING POLICIES
The more significant accounting policies used by the Company in the preparation of the consolidated financial statements are summarized below:
Business
Enterprise Financial Services Corp (the “Company” or “EFSC”) is a financial holding company that provides a full range of banking and wealth management services to individual and corporate customers located in the St. Louis and Kansas City metropolitan markets through its subsidiary, Enterprise Bank & Trust (the “Bank”). In addition, as of October 21, 2005, the Company owns 60% of Millennium Brokerage Group, LLC (“Millennium”) through its wholly-owned subsidiary, Millennium Holding Company, Inc. Millennium is headquartered in Nashville, Tennessee and operates life insurance advisory and brokerage operations from 13 offices serving life agents, banks, CPA firms, property &and casualty groups, and financial advisors in 49 states. Millennium is included in the Wealth Management segment along with Enterprise Trust, a division of the Bank, which provides fee-based trust, personal financial planning, estate planning, and corporate planning services to the Company’s target market.
The Company is subject to competition from other financial and nonfinancial institutions providing financial services in the markets served by the Company’s subsidiary. Additionally, the Company and the Bank are subject to the regulations of certain federal and state agencies and undergo periodic examinations by those regulatory agencies. Millennium and the investment management industry in general are subject to extensive regulation in the United States at both the federal and state level, as well as by self-regulatory organizations such as the National Association of Securities Dealers, Inc. The Securities and Exchange Commission is the federal agency that is primarily responsible for the regulation of investment advisers.
Basis of Financial Statement Presentation
The consolidated financial statements of the Company and its subsidiaries have been prepared in conformity with U.S. Generally Accepted Accounting Principles (“U.S. GAAP”) and conform to predominant practices within the banking industry. In preparing the consolidated financial statements, management is required to make estimates and assumptions, which significantly affect the reported amounts in the consolidated financial statements. Estimates that are particularly susceptible to significant change in a short period of time include the determination of the allowance for loan losses, derivative financial instruments, deferred tax assets and goodwill. Actual amounts could differ from those estimates.
Consolidation
Consolidation
The consolidated financial statements include the accounts of the Company, Bank (100% owned) and Millennium (60% owned). Acquired businesses are included in the consolidated financial statements from the date of acquisition. All material intercompany accounts and transactions have been eliminated. Minority ownership interests are reported in our Consolidated Balance Sheets as a liability. The minority ownership interest of our earnings or loss, net of tax, is classified as “Minority interest in net income of consolidated subsidiary” in our Consolidated Statements of Income. For more information, please refer to “Minority Interest in Net Income of Consolidated Subsidiary” discussed in Item 2 – Management’s Discussion and Analysis of Financial Condition and Results of Operations included in this filing.
Investments in Debt and Equity Securities
The Company currently classifies investments in debt and equity securities as follows:
|
|
|
|
| Available for sale - includes debt and marketable equity securities not |
Debt securities classified as held to maturity are carried at amortized cost, adjusted foror trading (i.e., investments which the amortization or accretion of premiums or discounts. Unrealized holding gains and losses for heldCompany has no present plans to maturity securities are excluded from earnings and shareholders’ equity. sell but may be sold in the future under different circumstances).
Debt and equity securities classified as available for sale are carried at estimated fair value. Unrealized holding gains and losses for available for sale securities are excluded from earnings and reported as a net amount in a separate component of shareholders’ equity until realized. All previous fair value adjustments included in the separate component of shareholders’ equity are reversed upon sale. Debt and equity securities classified as trading are carried at estimated fair value. The realized and unrealized gains and losses on trading securities are included in noninterest income.
46
A decline in the market value of any available for sale or held to maturity security below cost that is deemed other than temporaryother-than-temporary results in a charge to earnings and the establishment of a new cost basis for the security. The impairment is charged to earnings and a new cost basis for the security is established. To determine whether an impairment is other-than-temporary, the Company considers whether it has the ability and intent to hold the investment until a market price recovery and considers whether evidence indicating cost of the investment is recoverable outweighs evidence to the contrary. Evidence considered in this assessment includes the reasons for the impairment, the severity and duration of the impairment, changes in value subsequent to year-end, and forecasted performance of the investee.
45
For securities in the held to maturity and available for sale categories,securities, premiums and discounts are amortized or accreted over the lives of the respective securities as an adjustment to yield using the interest method. Dividend and interest income is recognized when earned. Realized gains and losses for securities classified as trading, available for sale and held to maturity are included in earnings and are derived using the specific identification method for determining the cost of securities sold.
Cash and Cash Equivalents
At December 31, 2006 and 2005, approximately $8,200,000 and $12,600,000, respectively, of cash and due from banks represented required reserves on deposits maintained by the Bank in accordance with Federal Reserve Bank requirements.
Loans Held for Sale
The Company provides long-term financing of one to four-familyone-to-four-family residential real estate by originating fixed and variable rate loans. Long-term, fixed and variable rate loans are sold into the secondary market without recourse. Upon receipt of an application for a real estate loan, the Company determines whether the loan will be sold into the secondary market or retained in the Company’s loan portfolio. The interest rates on the loans sold are locked with the buyer and the Company bears no interest rate risk related to these loans. Mortgage loans that are sold in the secondary market are sold principally under programs with the Government National Mortgage Association (“GNMA”) or the Federal National Mortgage Association (“FNMA”). Mortgage loans held for sale are carried at the lower of cost or fair value, which is determined on a specific identification method. The Company does not retain servicing on any loans sold, nor did the Company have any capitalized mortgage servicing rights at December 31, 20052006 and 2004.2005. Gains on the sale of loans held for sale are reported net of direct origination fees and costs in the Company’s consolidated statements of income.
Interest and Fees on Loans
Interest income on loans is accrued to income based on the principal amount outstanding. The recognition of interest income is discontinued when a loan becomes 90 days past due or a significant deterioration in the borrower’s credit has occurred which, in management’s opinion, negatively impacts the collectibility of the loan. Subsequent interest payments received on such loans are applied to principal if any doubt exists as to the collectibility of such principal; otherwise, such receipts are recorded as interest income. Loans are returned to accrual status when management believes full collectibility of principal and interest is expected.
Loan origination fees and direct origination costs are deferred and recognized over the lives of the related loans as a yield adjustment using a method, which approximates the interest method.
Allowance For Loan Losses
The allowance for loan losses is increased by provisions charged to expense and is available to absorb charge offs, net of recoveries. Management utilizes a systematic, documented approach in determining the appropriate level of the allowance for loan losses. Management’s approach, which provides for general and specific allowances, is based on current economic conditions, past losses, collection experience, risk characteristics of the portfolio, assessments of collateral values by obtaining independent appraisals for significant properties, and such other factors which, in management’s judgment, deserve current recognition in estimating loan losses.
Management believes the allowance for loan losses is adequate to absorb probable losses in the loan portfolio. While management uses available information to recognize losses on loans, future additions to the allowance may be necessary based on changes in economic conditions and other factors. In addition, various regulatory agencies, as an integral part of the examination process, periodically review the Bank’s loan portfolio. Such agencies may require the Bank to add to the allowance for loan losses based on their judgments and interpretations of information available to them at the time of their examinations.
Accounting for Impaired Loans
A loan is considered impaired when it is probable the Bank will be unable to collect all amounts due, both principal and interest, according to the contractual terms of the loan agreement. The Bank’s non-accrual loans, loans past due greater than 90 days and still accruing, and restructured loans qualify as “impaired loans.” When measuring impairment, the expected future cash flows of an impaired loan are discounted at the loan’s effective interest rate. Alternatively, impairment is measured by reference to an observable market price, if one exists, or the fair value of the collateral for a collateral-dependent loan. Interest income on impaired loans is recorded when cash is received and only if principal is considered to be fully collectible.
4746
Other Real Estate
Other real estate represents property acquired through foreclosure or deeded to the Bank in lieu of foreclosure on loans on which the borrowers have defaulted as to the payment of principal and interest. Other real estate is recorded on an individual asset basis at the lower of cost or fair value less estimated costs to sell. Subsequent reductions in fair value are expensed or recorded in a valuation reserve account through a provision against income. Subsequent increases in the fair value are recorded through a reversal of the valuation reserve.
Gains and losses resulting from the sale of other real estate are credited or charged to current period earnings. Costs of maintaining and operating other real estate are expensed as incurred, and expenditures to complete or improve other real estate properties are capitalized if the expenditures are expected to be recovered upon ultimate sale of the property.
Fixed Assets
Buildings, leasehold improvements, and furniture, fixtures, and equipment are stated at cost less accumulated depreciation and amortization is computed using the straight-line method over their respective estimated useful lives. Furniture, fixtures and equipment is depreciated over three to ten years and buildings and leasehold improvements over ten to forty years based upon lease obligation periods.
Goodwill and Other Intangible Assets
Goodwill represents the excess of costs over fair value of assets of businesses acquired. The Company adopted the provisions of Statement of Financial Accounting Standards (“SFAS”) No. 142, Goodwill and Other Intangible Assets, as of January 1, 2002. Goodwill and intangible assets acquired in a purchase business combination and determined to have an indefinite useful life are not amortized, but instead tested for impairment at least annually in accordance with the provisions of SFAS No. 142. SFAS No.142 also requires that intangibleannually. Intangible assets with estimable useful lives beare amortized over their respective estimated useful lives to their estimated residual values, and reviewreviewed for impairment in accordance with SFAS No. 144, Accounting for Impairment or Disposal of Long-Lived Assets.impairment.
Other intangible assets consistIntangibles, consisting of customer lists trade names and agreements not to compete. Intangiblescompete, are amortized using the straight-line method over the estimated useful lives of approximately 5 years. Core deposit intangibles are amortized using an accelerated method over an estimated useful life of approximately 10 years.
Impairment of Long-Lived AssetsSFAS No. 144 provides a single accounting model for long-lived assets to be disposed of. SFAS No. 144 also changes the criteria for classifying an asset as held for sale; and broadens the scope of businesses to be disposed of that qualify for reporting as discontinued operations and changes the timing of recognizing losses on such operations. The Company adopted SFAS No. 144 on January 1, 2002. The adoption of SFAS No. 144 was considered in the accounting and disclosure of the Company’s April 2003 sale of the Southeast Kansas branches.
In accordance with SFAS No. 144, long-livedLong-lived assets, such as fixed assets, and purchased intangibles subject to amortization, are reviewed for impairment whenever events or changes in circumstances indicate that the carrying amount of an asset may not be recoverable. Recoverability of assets to be held and used is measured by a comparison of the carrying amount of an asset to estimated undiscounted future cash flows expected to be generated by the asset. If the carrying amount of an asset exceeds its estimated future cash flows, an impairment charge is recognized by the amount by which the carrying amount of the asset exceeds the fair value of the asset. Assets to be disposed of are separately presented in the balance sheet and reported at the lower of the carrying amount or fair value less costs to sell, and are no longer depreciated. The assets and liabilities of a disposed group classified as held for sale are presented separately in the appropriate asset and liability sections of the balance sheet.
Goodwill and intangible assets not subject to amortization are tested annually for impairment, and are tested for impairment more frequently if events and circumstances indicate that the asset might be impaired. An impairment loss is recognized to the extent that the carrying amount exceeds the asset’s fair value.
Derivative Instruments and Hedging Activities
The Company began utilizinguses derivative instruments to assist in the management of interest rate sensitivity and to modify the repricing, maturity and option characteristics of certain assets and liabilities. Generally, the only derivative instruments used by the Company are interest rate swaps. Derivative instruments are required to be measured at fair value and recognized as either assets or liabilities in 2002.the financial statements. Fair value represents the payment the Company would receive or pay if the item were sold or bought in a current transaction. Fair values are generally based on market quotes. The accounting for changes in fair value (gains or losses) of a hedged item is dependent on whether the related derivative is designated and qualifies for “hedge accounting.” In accordance with Statement of Financial Accounting Standards No. 133, (“FAS No. 133”) Accounting for Derivative Instruments and Hedging Activities, the Company uses suchassigns derivatives to one of these categories at the purchase date: fair value hedge, cash flow hedge or non-designated derivatives. FAS No. 133 requires an assessment of the expected and ongoing hedge effectiveness of any derivative instruments solely to reduce its interest rate exposure. designated a fair value hedge or cash flow hedge. Derivatives are included in other assets and other liabilities in the Consolidated Statements of Condition.
The following is a summary of the Company’s accounting policies for derivative instruments and hedging activities under SFAS No. 133, Accounting for Derivative Instruments and Hedging Activities, as amended.activities.
Interest Rate Swap Agreements – Cash Flow Hedges. Interest rate swap agreementsHedges – Derivatives designated as cash flow hedges are accounted for at fair value. The effective portion of the change in the cash flow hedge’s gain or lossfair value is initially reportedrecorded net of taxes as a component of other comprehensive income net of taxes and(“OCI”) in shareholders’ equity. Amounts recorded in OCI are subsequently reclassified into
48
noninterest income interest expense when the underlying transaction affects earnings. The ineffective portion of the change in the cash flow hedge’s gain or lossfair value is recorded in earnings on each quarterly measurement date.noninterest income. The swap agreements are accounted for on an accrual basis with the net interest differential being recognized as an adjustment to interest income or interest expense of the related asset or liability.
Interest Rate Swap Agreements – Fair Value Hedges. Interest rate swap agreements designated as fair value hedges are accounted for at fair value. Changes in the fair value of the swap agreements are recognized currently in noninterest income. The change in the fair value on the underlying hedged item attributable to the hedged risk adjusts the carrying amount of the underlying hedged item and is also recognized currently in noninterest income. All changes in fair value are measured on a quarterly basis. The swap agreement is accounted for on an accrual basis with the net interest differential being recognized as an adjustment to interest income or interest expense of the related asset or liability. 47
• | Fair Value Hedges – Derivatives designated as fair value hedges, the fair value of the derivative instrument and related hedged item are recognized through the related interest income or expense, as applicable, except for the ineffective portion, which is recorded in noninterest income. All changes in fair value are measured on a quarterly basis. The swap agreement is accounted for on an accrual basis with the net interest differential being recognized as an adjustment to interest income or interest expense of the related asset or liability. |
• | Non-Designated Hedges – Certain economic hedges are not designated as cash flow or as fair value hedges for accounting purposes. These non-designated derivatives represent interest rate protection on net interest income but do not meet hedge accounting treatment. Changes in the fair value of these instruments are recorded in interest income at the end of each reporting period. |
Income Taxes
The Company and its subsidiaries file consolidated federal income tax returns. Deferred tax assets and liabilities are recognized for the estimated future tax consequences attributable to differences between the financial statement carrying amounts of existing assets and liabilities and their respective tax bases. Deferred tax assets and liabilities are measured using enacted tax rates in effect for the year in which those temporary differences are expected to be recovered or settled. A valuation allowance is recognized if the Company determines it is more likely than not that all or some portion of the deferred tax asset will not be recognized. In estimating accrued taxes, the Company assesses the relative merits and risks of the appropriate tax treatment considering statutory, judicial and regulatory guidance in the context of the tax position. Because of the complexity of tax laws and regulations, interpretation can be difficult and subject to legal judgment given specific facts and circumstances. It is possible that others, given the same information, may at any point in time reach different reasonable conclusions regarding the estimated amounts of accrued taxes.
Stock-Based Compensation
Stock Options
The Company appliesmaintains a number of stock-based incentive programs, which are discussed in more detail in Note 17 – Compensation Plans in this filing. Prior to 2006, the intrinsic-value-basedCompany applied the intrinsic value-based method, of accounting prescribed byas outlined in Accounting Principles Board (“APB”) Opinion No. 25, Accounting for Stock Issued to Employees,, (“APB No. 25”) and related interpretations, including Financial Accounting Standards Board (“FASB”) Interpretation No. 44, Accountingin accounting for Certain Transactions involving Stock Compensation, an interpretation of APB Opinion No. 25, issued in March 2000, to account for its fixed-plan stock options.options granted under these programs. Under thisthe intrinsic value-based method, no compensation expense is recorded on the date of grant onlywas recognized if the currentexercise price of the Company’s employee stock options was equal to or greater than the market price of the underlying stock exceededon the date of the grant. Accordingly, prior to 2006, no compensation cost was recognized in the consolidated statements of income on stock options granted to employees, since all options granted under the Company’s share incentive programs had an exercise price. SFASprice equal to the market value of the underlying common stock on the date of the grant.
In 2005, the Company began awarding restricted stock units (“RSU’s”) as part of a new long-term incentive plan. Beginning in 2005, compensation expense, based on grant date fair value of the RSU’s, is recognized in the consolidated statements of income over the vesting period.
Effective January 1, 2006, the Company adopted Statement of Financial Accounting Standards No. 123(R) (“FAS No. 123(R)”) Share-based Payment. This statement replaces FAS No. 123, Accounting for Stock-Based Compensation, established accounting and disclosure requirementssupersedes APB No. 25. FAS No. 123(R) requires that all stock-based compensation be recognized as an expense in the financial statements and that such cost be measured at the grant date fair value for all equity classified awards. The Company adopted this statement using a fair-value-basedthe modified prospective method, of accounting for stock-based employee compensation plans. As allowed by SFAS No. 123,which requires the Company has elected to continuerecognize compensation expense on a prospective basis for all outstanding unvested awards. Therefore, prior period financial statements have not been restated. Under this method, in addition to applyreflecting compensation expense for share-based awards granted after the intrinsic-value-based methodadoption date, expense is also recognized to reflect the remaining service period of accounting described above,awards that had been included in pro forma disclosures in prior periods. FAS No. 123(R) also requires that excess tax benefits related to stock option exercises be reflected as financing cash inflows. Therefore, excess tax benefits related to stock option exercises in 2005 and has adopted the disclosure only requirements of SFAS No. 148, Accounting2004 are reflected in operating activities. The total income tax benefit recognized for Stock-Based Compensation – Transition and Disclosure, an Amendment of FASB Statement No. 123. share-based compensation arrangements was $525,000 in 2006.
48
The following table illustrates the effect on net income if the fair-value-based method had been applied to all outstanding and unvested awards in each period. The impact of adopting FAS 123(R) increased the compensation expense in 2006 by $57,000 before income taxes, and had less than a $0.01 impact on basic and diluted earnings per share.
|
| Years ended December 31, |
|
| Years ended December 31, |
| |||||||||||
|
|
|
|
| |||||||||||||
(In thousands, except per share data) |
| 2005 |
| 2004 |
| 2003 |
|
| 2005 |
| 2004 |
| |||||
|
|
|
|
|
|
| |||||||||||
Net income, as reported |
| $ | 11,295 |
| $ | 8,215 |
| $ | 6,925 |
|
| $ | 11,295 |
| $ | 8,215 |
|
Add total stock-based employee compensation expense included in reported net income, net of tax |
|
| 393 |
| 93 |
| — |
|
|
| 393 |
| 93 |
| |||
Deduct total stock-based employee compensation expense determined under fair-value-based method for all awards, net of tax |
|
| (400 | ) |
| (3,391 | ) |
| (959 | ) | |||||||
|
|
|
|
|
|
| (400 | ) |
| (3,391 | ) | ||||||
Pro forma net income |
| $ | 11,288 |
| $ | 4,917 |
| $ | 5,966 |
| |||||||
|
|
|
| ||||||||||||||
Deduct total stock-based employee compensation expense determined under fair-value-based method for all awards, net of tax Pro forma net income |
| $ | 11,288 |
| $ | 4,917 |
| ||||||||||
|
|
|
|
|
|
|
| ||||||||||
Earnings per share: |
|
|
|
|
|
|
|
|
|
|
|
|
|
| |||
Basic: |
|
|
|
|
|
|
|
|
|
|
|
| |||||
As reported |
| $ | 1.12 |
| $ | 0.85 |
| $ | 0.72 |
|
| $ | 1.12 |
| $ | 0.85 |
|
Pro forma |
| 1.12 |
| 0.51 |
| 0.62 |
|
| 1.12 |
| 0.51 |
| |||||
Diluted: |
|
|
|
|
|
|
|
|
|
|
|
| |||||
As reported |
| $ | 1.05 |
| $ | 0.82 |
| $ | 0.70 |
|
| $ | 1.05 |
| $ | 0.82 |
|
Pro forma |
| 1.05 |
| 0.49 |
| 0.60 |
|
| 1.05 |
| 0.49 |
| |||||
49
Based on the valuation and accounting uncertainties that outstanding options presented under proposed accounting treatment at the time, and the transition issues associated with the Company’s new Long Term Incentive Plan (“LTIP”), the Board of Directors accelerated the vesting on the Company’s outstanding stock options during the 4thfourth quarter of 2004. This action resulted in two financial reporting impacts. First, the remaining fair value of all outstanding stock options was recognized in 2004 as part of the pro-forma footnote disclosures above. Secondly, the Company recognized $146,000 of compensation expense in the fourth quarter of 2004 based on the product of the number of outstanding unvested options times the spread between their weighted average stock price and the Company stock price on October 1, 2004 times the estimated option forfeiture rate of 9.5%. The forfeiture rate is based on the Company’s history over the past several years, but actual forfeiture effects in the future are measured and recognized in expense for any differences versus the estimate.
Cash Flow Information
For purposes of reporting cash flows, the Company considers cash and due from banks, interest-bearing deposits and any federal funds sold to be cash and cash equivalents.
Reclassification
Reclassification
Certain reclassifications have been made to the 20042005 and 20032004 amounts to conform to the presentcurrent year presentation. Such reclassifications had no effect on previously reported consolidated net income or shareholders’ equity.
New Accounting StandardsOn
In July 14, 2005,2006, the Financial Accounting Standards Board (“FASB”) issued an exposure draft for Interpretation No. 48, Accounting for Uncertain Tax Positions,Uncertainty in Income Taxes, an Interpretation of FAS No. 109, Accounting for Income Taxes. The proposed interpretation would clarifydefines the accountingthreshold for recognizing the financial impact of uncertain tax positions in accordance with FAS 109. An enterprise would beA company is required to recognize, in its financial statements, the best estimate of the impact of a tax position only if that position is probable“more-likely-than-not” of being sustained on audit based solely on the technical merits of the position.position on the reporting date. In evaluating whether the probable“more-likely-than-not” recognition threshold has been met, this proposedthe Interpretation would requirerequires the presumptionassumption that the tax position will be evaluated during an audit by taxing authorities. The term probable“more-likely-than-not” is used in this proposed Interpretation consistent with its use in FASB Statement No. 5, Accounting for Contingencies, to mean “the future event or events are likely to occur.”defined as a likelihood of more than 50 percent. Individual tax positions that fail to meet the probable recognition threshold will generally result in either (a) a reduction in the deferred tax asset or an increase in a deferred tax liability or (b) an increase in a liability for income taxes payable or the reduction of an income tax refund receivable. The impact may also include both (a) and (b). This proposed Interpretation also would provideprovides guidance on disclosure, accrual of interest and penalties, accounting in interim periods, and transition. If approved, theThe Interpretation would be effective as of the end of the first fiscal year ending after December 15, 2005. The FASB comment period ended on September 12, 2005. The Company is waiting on the final decision related to this Interpretation by FASB and are presently unable to determine its overall impact on the Company’s consolidated financial statements or results of operations.
On May 5, 2005, the Financial Accounting Standards Board (“FASB”) issued FAS No. 154, Statement Accounting Changes and Error Corrections—a replacement of APB Opinion No. 20 and FASB Statement No. 3. FAS 154 requires retrospective application for voluntary changes in accounting principles unless it is impracticable to do so. FAS 154 is effective for accounting changes and corrections of errors in fiscal years beginning after December 15, 2005. Early application is permitted for accounting changes and corrections of errors during fiscal years beginning after June 1, 2005. The Company has evaluated the requirements of SFAS No.154 and expects the implementation will have no material effect on the Company’s consolidated financial condition or results of operations.
In December 2004, FASB issued FAS No. 123(R), Share-Based Payment (“SFAS No. 123(R)”). FAS No. 123(R) replaces SFAS No. 123, Accounting for Stock-Based Compensation, and supersedes APB Opinion No. 25, Accounting for Stock Issued to Employees. FAS No. 123(R) requires compensation costs related to share-based payment transactions to be recognized in the financial statements over the period that an employee provides service in exchange for the award. The accounting provisions of FAS 123(R) are effective for annual reporting periods beginning after June 15, 2005, therefore, the Company will be required to adopt FAS 123R in the first quarter of fiscal 2006. The pro forma disclosures previously permitted under FAS 123 will no longer be an alternative to financial statement recognition. The pro forma net income and net income per share amounts (based on a fair-value method similar to the methods required under FAS 123R to measure compensation expense for employee stock incentive awards) are shown above in the section “Stock Options”. The Company expects the implementation of FAS 123R will have less than $0.01 effect on the Company’s earnings per share in 2006.
In March 2004, the Emerging Issues Task Force (“EITF”) reached a consensus on criteria to evaluate whether to record a loss and disclose additional information about unrealized losses relating to debt and equity securities under EITF Issue No. 03-1, The Meaning of Other-Than-Temporary Impairment and Its Application to Certain Investments. The consensus applies to investments in debt and marketable equity securities that are accounted under
50
FAS 115, Accounting for Certain Investments in Debt and Equity Securities. After many organizations, including banks, which could be impacted by this guidance, asked for clarification on the meaning of other-than-temporary impairment and its application to certain investments, the FASB postponed the implementation. In July 2005, the FASB decided not to provide additional guidance on the meaning of other-than-temporary impairment, but instead issued FASB staff position (“FSP”) EITF 03-1-a, Implementation Guidance for the Application of Paragraph 16 of EITF Issue No. 03-1, as final. The final position supersedes several previously issued EITF topics and replaces guidance set forth in several others. The final position, titled FAS 115-1, The Meaning of Other-Than-Temporary Impairment and Its Application to Certain Investments, codifies guidance set forth in EITF Topic D-44, Recognition of Other-Than-Temporary Impairment upon the Planned Sale of a Security Whose Cost Exceeds Fair Value, and clarifies that an investor should recognize an impairment loss no later than when the impairment is deemed other than temporary, even if a decision to sell has not been made. The effective date of the FSP will be reporting periods beginning after December 15, 2005.2006. The Company has evaluated thedoes not expect FASB Interpretation No. 48 to have a material impact of the final rule and expects the implementation of FAS 115-1 will have no material effect on the Company’s consolidated financial position or results of operations.
49
In September 2006, the Securities and Exchange Commission (“SEC”) issued Staff Accounting Bulletin No. 108 (“SAB No. 108”) to clarify consideration of the effects of prior year errors when quantifying misstatements in current year financial statements for the purpose of quantifying materiality. SAB No. 108 requires issuers to quantify misstatements using both the “rollover” and “iron curtain” approaches and requires an adjustment to the current year financial statements in the event that after the application of either approach and consideration of all relevant quantitative and qualitative factors, a misstatement is determined to be material. SAB No. 108 is effective for fiscal years beginning after November 15, 2006. We are in the process of determining the effect, if any, that SAB 108 will have on our consolidated financial statements. The Company’s analysis under SAB No. 108 of prior year and current year misstatements did not result in any adjustment to prior year or current year financial statements.
In September 2006, the FASB issued FAS No. 157, Fair Value Measurements. FAS No. 157 defines fair value, establishes a framework for measuring fair value in generally accepted accounting standards, and expands disclosures about fair value measurements. FAS No. 157 is effective for financial statements issued for fiscal years beginning after November 15, 2007, and interim periods within those fiscal years. We do not expect that the adoption of FAS No. 157 will have a material impact on our financial condition or results of operations.
NOTE 2—ACQUISITIONS
Acquisition of NorthStar Bancshares
On July 5, 2006, the Company completed its acquisition of 100% of the total outstanding common stock of Kansas City-based NorthStar Bancshares, Inc and its wholly owned subsidiary NorthStar Bank NA (“NorthStar”) for $36,000,000 in EFSC common stock (80%) and cash (20%). The acquisition served to expand the Company’s banking franchise in the greater Kansas City area. The purchase price for the NorthStar business consisted of:
• | $8,000,000 in cash; | |
• | 1,091,500 unregistered shares of EFSC common stock valued at $28,000,000 based on the average closing share price of EFSC common stock, as quoted on NASDAQ, for the 20 trading days ending two days prior to the acquisition date; | |
• | the assumption by EFSC of a line of credit note of NorthStar, in the principal amount of $3,200,000, which was paid in full by EFSC on the closing date. |
While the stated purchase price of NorthStar Bancshares, Inc. was $36,000,000, approximately $4,500,000 of the consideration is considered “contingent” and is held in an escrow account pending the collection of certain loans. This effectively reduced loans and other real estate owned and increased goodwill on the balance sheet by the same amount. In accordance with generally accepted accounting principles, approximately 177,000 shares of EFSC stock in the escrow account have not been credited to shareholders’ equity or in average shares outstanding when reporting fully diluted earnings per share. All shares issued by EFSC were issued in reliance upon exemptions from registration set forth in Section 4(2) of the Securities Act of 1933, as amended, and Rule 506 promulgated under said Act. As a result, the shares issued for the acquisition are “restricted securities” and may not be offered or sold in the United States absent registration or an applicable exemption from registration requirements.
The cash portion of the transaction was funded through internally generated funds and borrowing on the Company’s line of credit. Subsequently, on July 28, 2006, the Company issued $4,000,000 of trust preferred securities (“TRUPS”) through a newly formed affiliated statutory trust, as further discussed in Note 11 – Subordinated Debentures in this filing. The TRUPS proceeds were used to pay off a portion of the line of credit borrowing.
At the time of the acquisition, on a consolidated basis, NorthStar Bancshares, Inc. had assets of $187,500,000, loans, net of unearned discount, of $167,200,000, deposits of $158,500,000 and stockholders’ equity of $18,800,000. The assets acquired and liabilities assumed were recorded at their estimated fair value on the acquisition date. The fair value adjustments represent current estimates and are subject to further adjustments as the valuation data is finalized. Goodwill, which is not deductible for tax purposes, was $17,800,000. Core deposit intangibles were approximately $2,400,000 and will be amortized over ten years utilizing an accelerated method. Core deposit intangibles are not deductible for tax purposes. NorthStar was merged into and with Enterprise Bank & Trust on October 6, 2006. Please refer to the Form 8-K filed by the Company on July 5, 2006 for more information.
50
Acquisition and Integration Costs
As of the consummation date, the Company accrued certain costs associated with the acquisition. As of December 31, 2006, the accrued balance was $30,000 and is primarily related to amounts required to terminate several information technology contracts. As the obligation to make these payments was accrued at the consummation date, such payments will not have any impact on the consolidated statements of income. The acquisition costs are reflected in Accounts payable and accrued expenses in the consolidated balance sheets.
Through December 31, 2006, the Bank has also incurred approximately $145,000 of integration costs associated with the acquisition that have been expensed in the consolidated statements of income. These costs relate principally to additional costs incurred in conjunction with the information technology conversion of NorthStar.
Reserved Credit Escrow
As part of the acquisition agreement, $4,500,000 of the purchase price was deposited into a “Reserved Credit Escrow” account. These funds are being held until the Bank receives principal payments or proceeds from the sale of several identified loans and other real estate. These amounts are considered “contingent consideration” under U.S. GAAP and therefore, were not and will not be recorded in common stock or additional paid in capital until the contingency is resolved. The Reserved Credit Escrow amount was split between Loans and Other real estate. It is considered to be our best estimate, or fair value, of the specific assets. As a result, the Loans and Other real estate amounts in the opening balance sheet were reduced by escrow amounts.
Acquisition of Millennium Brokerage Group
On October 21, 2005, the Company acquired 60% of Millennium, a Tennessee limited liability company. Millennium is a national insurance brokerage firm with headquarters in Nashville, Tennessee. Millennium acts as a wholesale distributor, broker and consultant concerning life insurance products, brokers insurance, and other investments or financial products. The acquisition was accounted for using the purchase method of accounting, and accordingly, the results of Millennium’s operations have been included in the consolidated financial statements since the date of the purchase. The acquisition was completed through Millennium Holding Company, Inc, a wholly-owned subsidiary of EFSC that was created to consummate the transaction. Millennium will continuecontinues to operate under their existing trade name.
The aggregate purchase price was $15,000,000 consisting of 249,161 shares of EFSC common stock valued at $5,249,000 and $9,750,000 in cash. Goodwill of $10,105,000,$10,293,000, which is expected to be deductible for tax purposes, was recorded as part of the purchase price allocation. Intangible assets consisting of customer and trade name totaling $4,700,000 were also recorded with a weighted average useful life of approximately 5 years.
The terms of the agreement call for an additional 20% purchase in 2008 and 2010, respectively, for the remaining interests. The consideration mix between stock and cash for subsequent payouts are at the Company’s discretion with a maximum of 70% stock. Future payouts up to a maximum of $36 million,$36,000,000, inclusive of the initial $15 million$15,000,000 payout, are conditioned upon certain pre-tax income performance targets. EFSC is contractually entitled to a priority return on its investment of 23.1% (pre-tax) before additional distributions to the Millennium principals.
51
NOTE 3—EARNINGS PER SHARE
Basic earnings per share data is calculated by dividing net income by the weighted average number of common shares outstanding during the period. Diluted earnings per share reflects the potential dilution of earnings per share which could occur under the treasury stock method if contracts to issue common stock, such as stock options, were exercised. The following table presents a summary of per share data and amounts for the periods indicated.
|
| Years ended December 31, |
|
| Years ended December 31, |
| ||||||||||||||
|
|
|
|
| ||||||||||||||||
(in thousands, except per share data) |
| 2005 |
| 2004 |
| 2003 |
|
| 2006 |
| 2005 |
| 2004 |
| ||||||
|
|
|
|
|
|
|
| |||||||||||||
Basic |
|
|
|
|
|
|
|
|
|
|
|
|
|
|
|
| ||||
Net income, as reported |
| $ | 11,295 |
| $ | 8,215 |
| $ | 6,925 |
|
| $ | 15,472 |
| $ | 11,295 |
| $ | 8,215 |
|
|
|
|
|
|
|
|
|
| ||||||||||||
Weighted average common shares outstanding |
|
| 10,103 |
| 9,696 |
| 9,566 |
|
|
| 10,964 |
| 10,103 |
| 9,696 |
| ||||
|
|
|
|
|
|
|
|
| ||||||||||||
Basic earnings per share |
| $ | 1.12 |
| $ | 0.85 |
| $ | 0.72 |
|
| $ | 1.41 |
| $ | 1.12 |
| $ | 0.85 |
|
|
|
|
|
|
|
|
|
| ||||||||||||
Diluted |
|
|
|
|
|
|
|
|
|
|
|
|
|
|
|
| ||||
Net income |
| $ | 11,295 |
| $ | 8,215 |
| $ | 6,925 |
|
| $ | 15,472 |
| $ | 11,295 |
| $ | 8,215 |
|
Expense related to dilutive stock options and appreciation rights, net of tax |
| 22 |
| (4 | ) |
| — |
|
| — |
| 22 |
| (4 | ) | |||||
|
|
|
|
|
|
|
|
| ||||||||||||
|
| $ | 11,317 |
| $ | 8,211 |
| $ | 6,925 |
|
| $ | 15,472 |
| $ | 11,317 |
| $ | 8,211 |
|
|
|
|
|
|
|
|
|
| ||||||||||||
Weighted average common shares outstanding |
|
| 10,103 |
| 9,696 |
| 9,566 |
|
|
| 10,964 |
| 10,103 |
| 9,696 |
| ||||
Effect of dilutive stock options and restricted stock units |
|
| 644 |
| 359 |
| 309 |
| ||||||||||||
Effect of dilutive stock options and restricted share units |
|
| 423 |
| 644 |
| 359 |
| ||||||||||||
|
|
|
|
|
|
|
|
| ||||||||||||
Diluted weighted average common shares outstanding |
|
| 10,747 |
| 10,055 |
| 9,875 |
|
|
| 11,387 |
| 10,747 |
| 10,055 |
| ||||
|
|
|
|
|
|
|
|
| ||||||||||||
Diluted earnings per share |
| $ | 1.05 |
| $ | 0.82 |
| $ | 0.70 |
|
| $ | 1.36 |
| $ | 1.05 |
| $ | 0.82 |
|
|
|
|
|
|
|
|
|
| ||||||||||||
As of December 31, 2006, 2005 and 2004, 0, 7,800, and 2003, 7,800, 194,994 and 257,867 options, respectively, were excluded from the earnings per share calculation because their effect was anti-dilutive. The Company recognizes expense for stock options granted to non-employees and Stock Appreciation Rights granted to Directors of the Company.
NOTE 4—RESTRICTIONS ON CASH AND DUE FROM BANKSSUBSEQUENT EVENTS
Acquisition of Clayco Banc Corporation
On February 28, 2007, the Company completed its acquisition of Kansas City-based Clayco Banc Corporation (“Clayco”) and its wholly owned subsidiary, Great American Bank (“Great American”) for $37 million in EFSC common stock (60%) and cash (40%.) The acquisition served to expand the Company’s banking franchise in the greater Kansas City area. All shares issued by EFSC were issued in reliance upon an exemption from registration set forth in Section 4(2) and Rule 506 of the Securities Act of 1933. As a result, the 731,692 EFSC shares issued for the acquisition will be “restricted securities” and may not be offered or sold in the United States absent registration of an applicable exemption from registration requirements. The cash portion of the transaction was funded through internally generated funds and the issuance of a TRUPS, as further discussed below.
At December 31, 2005the time of the acquisition, Clayco had assets of $201,900,000, loans, net of unearned discount, of $167,000,000, deposits of $150,700,000, and 2004,stockholders’ equity of $12,800,000. The assets acquired and liabilities assumed were recorded at their estimated fair value on the acquisition date. The fair value adjustments represent current estimates and are subject to further adjustments as the valuation data is finalized. Preliminary goodwill, which is not deductible for tax purposes, was approximately $12.6 million$26,300,000. Core deposit intangibles were approximately $1,900,000 and $7.1 million, respectively, of cashwill be amortized over ten years utilizing an accelerated method. Core deposit intangibles are not deductible for tax purposes. Great American is expected to be merged with and due from banks represented required reserves on deposits maintained byinto the Bank in accordance with Federal Reserve Bank requirements. 2008. Please refer to the Form 8-K’s filed by the Company on November 22, 2006 and March 1, 2007 for more information.
52
Trust Preferred Securities - EFSC Capital Trust VI
On February 26, 2007, EFSC Statutory Capital Trust VI (“EFSC Trust VI”), a newly formed Delaware statutory trust and subsidiary of EFSC, issued 14,000 floating rate Trust Preferred Securities at $1,000 per share to a Trust Preferred Securities Pool. The fixed rate is equal to 6.573% until March 2012 when the rate floats at three-month London Interbank Offered Rate (“LIBOR”) + 1.60%, and is payable quarterly beginning March 30, 2007. The TRUPS are fully, irrevocably and unconditionally guaranteed on a subordinated basis by the Company. The proceeds were invested in junior subordinated debentures of the Company. The net proceeds to the Company from the sale of the junior subordinated debentures, were approximately $14,000,000. The TRUPS mature on March 30, 2037. The mandatory date may be shortened to a date not earlier than March 30, 2012 if certain conditions are met. The TRUPS are classified as subordinated debentures and the distributions are recorded as interest expense in the Company’s consolidated financial statements. The proceeds from the offering were used to fund the cash portion of the acquisition of Clayco, as discussed above.
NOTE 5—INVESTMENTS IN DEBT AND EQUITY SECURITIES
The amortized cost and estimated fair value of debt and equity securities are summarized below:
|
| 2005 |
|
| 2006 |
| ||||||||||||||||||||
|
|
|
|
| ||||||||||||||||||||||
(in thousands) |
| Amortized |
| Gross |
| Gross |
| Estimated |
|
| Amortized Cost |
| Gross Unrealized Gains |
| Gross Unrealized Losses |
| Estimated Fair Value |
| ||||||||
|
|
|
|
|
|
|
|
|
| |||||||||||||||||
Available for sale securities: |
|
|
|
|
|
|
|
|
|
|
|
|
|
|
|
|
|
|
|
| ||||||
U.S. Treasury securities and government agencies and corporations |
| $ | 118,357 |
| $ | 14 |
| $ | (1,045 | ) | $ | 117,326 |
| |||||||||||||
Obligations of U.S. government agencies |
| $ | 96,110 |
| $ | 59 |
| $ | (717 | ) | $ | 95,452 |
| |||||||||||||
Mortgage-backed securities |
| 13,276 |
| 12 |
| (335 | ) |
| 12,953 |
|
| 9,877 |
| 13 |
| (273 | ) |
| 9,617 |
| ||||||
Municipal bonds |
| 1,243 |
| 2 |
| (14 | ) |
| 1,231 |
|
| 1,115 |
| 5 |
| (9 | ) |
| 1,111 |
| ||||||
Other securities |
| 1,455 |
| — |
| — |
| 1,455 |
|
| 2,024 |
| — |
| — |
| 2,024 |
| ||||||||
Federal Home Loan Bank stock |
| 2,594 |
| — |
| — |
| 2,594 |
|
| 3,006 |
| — |
| — |
| 3,006 |
| ||||||||
|
|
|
|
|
|
|
|
|
|
| ||||||||||||||||
|
| $ | 136,925 |
| $ | 28 |
| $ | (1,394 | ) | $ | 135,559 |
|
| $ | 112,132 |
| $ | 77 |
| $ | (999 | ) | $ | 111,210 |
|
|
|
|
|
|
|
|
|
|
|
| ||||||||||||||||
|
| 2004 |
| ||||||||||
|
|
| |||||||||||
(in thousands) |
| Amortized |
| Gross |
| Gross |
| Estimated |
| ||||
|
|
|
|
| |||||||||
Available for sale securities: |
|
|
|
|
|
|
|
|
|
|
|
|
|
U.S. Treasury securities and government agencies and corporations |
| $ | 99,505 |
| $ | 3 |
| $ | (564 | ) | $ | 98,944 |
|
Mortgage-backed securities |
|
| 18,610 |
|
| 63 |
|
| (167 | ) |
| 18,506 |
|
Municipal bonds |
|
| 1,618 |
|
| 7 |
|
| (9 | ) |
| 1,616 |
|
Other securities |
|
| 895 |
|
| — |
|
| — |
|
| 895 |
|
Federal Home Loan Bank stock |
|
| 1,669 |
|
| — |
|
| — |
|
| 1,669 |
|
|
|
|
|
|
| ||||||||
|
| $ | 122,297 |
| $ | 73 |
| $ | (740 | ) | $ | 121,630 |
|
|
|
|
|
|
| ||||||||
Held to maturity - Mortgage-backed securities |
| $ | 8 |
| $ | — |
| $ | — |
| $ | 8 |
|
|
|
|
|
|
| ||||||||
During 2005, the Company reclassified $8,000 of securities from held to maturity to available for sale. The unrealized gain on the securities was immaterial.
|
| 2005 |
| ||||||||||
|
|
| |||||||||||
(in thousands) |
| Amortized Cost |
| Gross Unrealized Gains |
| Gross Unrealized Losses |
| Estimated Fair Value |
| ||||
|
|
|
|
| |||||||||
Available for sale securities: |
|
|
|
|
|
|
|
|
|
|
|
|
|
Obligations of U.S. government agencies |
| $ | 118,357 |
| $ | 14 |
| $ | (1,045 | ) | $ | 117,326 |
|
Mortgage-backed securities |
|
| 13,276 |
|
| 12 |
|
| (335 | ) |
| 12,953 |
|
Municipal bonds |
|
| 1,243 |
|
| 2 |
|
| (14 | ) |
| 1,231 |
|
Other securities |
|
| 1,455 |
|
| — |
|
| — |
|
| 1,455 |
|
Federal Home Loan Bank stock |
|
| 2,594 |
|
| — |
|
| — |
|
| 2,594 |
|
|
|
|
|
|
| ||||||||
|
| $ | 136,925 |
| $ | 28 |
| $ | (1,394 | ) | $ | 135,559 |
|
|
|
|
|
|
| ||||||||
The amortized cost and estimated fair value of debt and equity securities classified as available for sale at December 31, 2005,2006, by contractual maturity, are shown below. Expected maturities may differ from contractual maturities because borrowers may have the right to call or prepay obligations with or without call or prepayment penalties.
(in thousands) |
| Amortized |
| Estimated |
|
| Amortized |
| Estimated |
| ||||
|
|
|
|
|
| |||||||||
Due in one year or less |
| $ | 43,263 |
| $ | 43,183 |
|
| $ | 36,208 |
| $ | 35,905 |
|
Due after one year through five years |
|
| 75,870 |
| 74,910 |
|
|
| 60,551 |
| 60,193 |
| ||
Due after 5 years through ten years |
|
| 467 |
| 464 |
| ||||||||
Due after ten years |
|
| — |
| — |
| ||||||||
Due after five years through ten years |
|
| 466 |
| 465 |
| ||||||||
Mortgage-backed securities |
|
| 13,276 |
| 12,953 |
|
|
| 9,877 |
| 9,617 |
| ||
Securities with no stated maturity |
|
| 4,049 |
| 4,049 |
|
|
| 5,030 |
| 5,030 |
| ||
|
|
|
|
|
|
| ||||||||
|
| $ | 136,925 |
| $ | 135,559 |
|
| $ | 112,132 |
| $ | 111,210 |
|
|
|
|
|
|
|
| ||||||||
53
During 2006, the Company did not sell any investments in debt and equity securities. During 2005, proceeds from sales of investments in debt and equity securities were $39,040,000, which resulted in gross gains of $12,000 and gross losses of $506,000. During 2004, proceeds from sales of investments in debt and equity securities were $62,766,000, which resulted in gross gains of $131,000 and gross losses of $4,000. During 2003, the Company sold investment securities with proceeds of $11,193,000, which resulted in gross gains of $78,000. Debt and equity securities having a carrying value of $18,365,000$32,084,000 and $13,852,000$18,365,000 at December 31, 20052006 and 2004,2005, respectively, were pledged as collateral to secure public deposits and for other purposes as required by law or contract provisions.
As a member of the Federal Home Loan Bank (“FHLB”) system administered by the Federal Housing Finance Board, the Bank is required to maintain a minimum investment in the capital stock of its respective FHLB consisting of membership stock and activity basedactivity-based stock. At December 31, 2005,2006, the membership stock requirement for the Bank was 0.12% of its total assets subject to a maximum of $10 million. The activity basedactivity-based stock requirement is 4.45% of the Bank’s aggregate outstanding FHLB advances. The FHLB stock is recorded at cost, which represents redemption value. The Bank is a member of the Federal Home Loan BankFHLB of Des Moines.
Provided below is a summary of securities available for-sale which were in an unrealized loss position at December 31, 2006 and 2005. The unrealized losses reported as of December 31, 2006 for obligations of U.S. Treasury and government agencies for 12 months or more includes 1332 FNMA agency notes with estimated maturities or repricings of twoone to threetwo years. The unrealized loss reported for the mortgage-backed securities for 12 months or more includes 2126 securities and primarily relates to Fannie Mae (“FNMA”) or Freddie Mac (“FHLMC”) pools with estimated maturities or repricings of one to threefour years. Fannie Mae or Freddie Mac guarantees the contractual cash flows of these securities. The unrealized losses reported for municipal bonds for 12 months or more includes 5 securities. The Company has the ability and intent to hold these securities until such time as the value recovers or the securities mature. Further, the Company believes the deterioration in value is attributable to changes in market interest rates and not credit quality of the issuer.
|
| Securities Available for Sale |
|
| 2006 |
| ||||||||||||||||||||||||||||||||
|
|
|
|
| ||||||||||||||||||||||||||||||||||
|
| Less than 12 months |
| 12 months or more |
| Total |
|
| Less than 12 months |
| 12 months or more |
| Total |
| ||||||||||||||||||||||||
|
|
|
|
|
|
|
|
| ||||||||||||||||||||||||||||||
(in thousands) |
| Estimated |
| Unrealized |
| Estimated |
| Unrealized |
| Estimated |
| Unrealized |
|
| Estimated |
| Unrealized |
| Estimated |
| Unrealized |
| Estimated |
| Unrealized |
| ||||||||||||
|
|
|
|
|
|
|
|
|
|
|
|
|
| |||||||||||||||||||||||||
U.S. Treasury securities and government agencies and corporations |
| $ | 64,759 |
| $ | 227 |
| $ | 37,526 |
| $ | 818 |
| $ | 102,285 |
| $ | 1,045 |
| |||||||||||||||||||
Obligations of U.S. government agencies |
| $ | 8,197 |
| $ | 34 |
| $ | 82,264 |
| $ | 683 |
| $ | 90,461 |
| $ | 717 |
| |||||||||||||||||||
Mortgage-backed securities |
|
| 2,641 |
| 52 |
| 8,793 |
| 283 |
| 11,434 |
| 335 |
|
|
| — |
| — |
| 8,687 |
| 273 |
| 8,687 |
| 273 |
| ||||||||||
Municipal bonds |
|
| 184 |
| 1 |
| 752 |
| 13 |
| 936 |
| 14 |
|
|
| — |
| — |
| 449 |
| 9 |
| 449 |
| 9 |
| ||||||||||
|
|
|
|
|
|
|
|
|
|
|
|
|
|
| ||||||||||||||||||||||||
|
| $ | 67,584 |
| $ | 280 |
| $ | 47,071 |
| $ | 1,114 |
| $ | 114,655 |
| $ | 1,394 |
|
| $ | 8,197 |
| $ | 34 |
| $ | 91,400 |
| $ | 965 |
| $ | 99,597 |
| $ | 999 |
|
|
|
|
|
|
|
|
|
|
|
|
|
|
|
| ||||||||||||||||||||||||
|
| 2005 |
| ||||||||||||||||
|
|
| |||||||||||||||||
|
| Less than 12 months |
| 12 months or more |
| Total |
| ||||||||||||
|
|
|
|
| |||||||||||||||
(in thousands) |
| Estimated |
| Unrealized |
| Estimated |
| Unrealized |
| Estimated |
| Unrealized |
| ||||||
|
|
|
|
|
|
| |||||||||||||
Obligations of U.S. government agencies |
| $ | 64,759 |
| $ | 227 |
| $ | 37,526 |
| $ | 818 |
| $ | 102,285 |
| $ | 1,045 |
|
Mortgage-backed securities |
|
| 2,641 |
|
| 52 |
|
| 8,793 |
|
| 283 |
|
| 11,434 |
|
| 335 |
|
Municipal bonds |
|
| 184 |
|
| 1 |
|
| 752 |
|
| 13 |
|
| 936 |
|
| 14 |
|
|
|
|
|
|
|
|
| ||||||||||||
|
| $ | 67,584 |
| $ | 280 |
| $ | 47,071 |
| $ | 1,114 |
| $ | 114,655 |
| $ | 1,394 |
|
|
|
|
|
|
|
|
| ||||||||||||
54
NOTE 6—LOANS
A summary of loans by category at December 31, 20052006 and 2004 is as follows:2005:
|
| December 31, |
|
| December 31, |
| ||||||||
|
|
|
|
| ||||||||||
(in thousands) |
| 2005 |
| 2004 |
|
| 2006 |
| 2005 |
| ||||
|
|
|
|
|
| |||||||||
Real Estate Loans: |
|
|
|
|
|
|
|
|
|
|
|
| ||
Construction and land development |
| $ | 138,318 |
| $ | 127,180 |
|
| $ | 196,851 |
| $ | 138,318 |
|
Farmland |
| 7,518 |
| 5,138 |
|
| 8,577 |
| 7,518 |
| ||||
1-4 Family residential |
| 151,575 |
| 135,262 |
|
| 150,244 |
| 151,575 |
| ||||
Multifamily residential |
| 24,927 |
| 14,031 |
|
| 41,412 |
| 24,927 |
| ||||
Other real estate loans |
| 377,937 |
| 323,848 |
|
| 526,183 |
| 377,937 |
| ||||
|
|
|
|
|
|
| ||||||||
Total real estate loans |
| $ | 700,275 |
| $ | 605,459 |
|
| $ | 923,267 |
| $ | 700,275 |
|
Commercial and industrial |
|
| 265,488 |
| 253,594 |
|
|
| 352,914 |
| 265,488 |
| ||
Other |
|
| 36,494 |
| 39,662 |
|
|
| 35,561 |
| 36,494 |
| ||
|
|
|
|
|
|
| ||||||||
Total Loans |
| $ | 1,002,257 |
| $ | 898,716 |
|
| $ | 1,311,742 |
| $ | 1,002,257 |
|
Unearned loan (fees)/costs, net |
|
| 122 |
| (211 | ) | ||||||||
Unearned loan (fees) costs, net |
|
| (19 | ) |
| 122 |
| |||||||
|
|
|
|
|
|
| ||||||||
Total loans, less unearned loan fees |
| $ | 1,002,379 |
| $ | 898,505 |
| |||||||
Total loans, net of unearned loan (fees) cost |
| $ | 1,311,723 |
| $ | 1,002,379 |
| |||||||
|
|
|
|
|
|
| ||||||||
The Bank grants commercial, residential, and consumer loans throughout its service areas, which consists ofprimarily in the immediate area in which the Bank is located.St. Louis and Kansas City metropolitan areas. The Company has a diversified loan portfolio, with no particular concentration of credit in any oneanyone economic sector; however, a substantial portion of the portfolio is concentrated in and secured by real estate. The ability of the Company’s borrowers to honor their contractual obligations is dependent upon the local economy and its effect on the real estate market.
54
Following is a summary of activity for the year ended December 31, 20052006 of loans to executive officers and directors or to entities in which such individuals had beneficial interests as a shareholder, officer, or director. Such loans were made in the normal course of business on substantially the same terms, including interest rates and collateral, as those prevailing at the time for comparable transactions with other customers and did not involve more than the normal risk of collectibility.
(in thousands) |
| Total |
|
| Total |
| ||
|
|
|
| |||||
Balance January 1, 2005 |
| $ | 16,535 |
| ||||
Balance January 1, 2006 |
| $ | 16,859 |
| ||||
New loans and advances |
|
| 6,802 |
|
|
| 3,006 |
|
Payments |
|
| (6,478 | ) |
|
| (9,013 | ) |
|
|
|
|
| ||||
Balance December 31, 2005 |
| $ | 16,859 |
| ||||
Balance December 31, 2006 |
| $ | 10,852 |
| ||||
|
|
|
|
| ||||
A summary of activity in the allowance for loan losses for the years ended December 31, 2006, 2005, and 2004 is A summary of impaired loans at December 31, 2006, 2005, and 20032004 is as follows: December 31, as follows:
(in thousands) |
| 2005 |
| 2004 |
| 2003 |
|
| 2006 |
| 2005 |
| 2004 |
| ||||||
|
|
|
|
|
|
|
| |||||||||||||
Balance at beginning of year |
| $ | 11,665 |
| $ | 10,590 |
| $ | 8,600 |
|
| $ | 12,990 |
| $ | 11,665 |
| $ | 10,590 |
|
Acquired allowance for loan losses |
|
| 3,069 |
| — |
| — |
| ||||||||||||
Provision for loan losses |
|
| 1,490 |
| 2,212 |
| 3,627 |
|
|
| 2,127 |
| 1,490 |
| 2,212 |
| ||||
Loans charged off |
|
| (644 | ) |
| (1,296 | ) |
| (1,904 | ) |
|
| (1,598 | ) |
| (644 | ) |
| (1,296 | ) |
Recoveries of loan previously charged off |
|
| 479 |
| 159 |
| 267 |
|
|
| 400 |
| 479 |
| 159 |
| ||||
|
|
|
|
|
|
|
|
| ||||||||||||
Balance at end of year |
| $ | 12,990 |
| $ | 11,665 |
| $ | 10,590 |
|
| $ | 16,988 |
| $ | 12,990 |
| $ | 11,665 |
|
|
|
|
|
|
|
|
|
| ||||||||||||
55
A summary of impaired loans at December 31, 2006, 2005, 2004, and 20032004 is as follows:
|
| December 31, |
|
| December 31, |
| ||||||||||||||
|
|
|
|
| ||||||||||||||||
(in thousands) |
| 2005 |
| 2004 |
| 2003 |
|
| 2006 |
| 2005 |
| 2004 |
| ||||||
|
|
|
|
|
|
|
| |||||||||||||
Nonaccrual loans |
| $ | 1,421 |
| $ | 1,827 |
| $ | 1,548 |
| ||||||||||
Non-accrual loans |
| $ | 6,363 |
| $ | 1,421 |
| $ | 1,827 |
| ||||||||||
Loans past due 90 days or more and still accruing interest |
|
| 112 |
| — |
| — |
| ||||||||||||
Restructured loans continuing to accrue interest |
|
| — |
| — |
| — |
|
|
| — |
| — |
| — |
| ||||
|
|
|
|
|
|
|
|
| ||||||||||||
Total impaired loans |
| $ | 1,421 |
| $ | 1,827 |
| $ | 1,548 |
|
| $ | 6,475 |
| $ | 1,421 |
| $ | 1,827 |
|
|
|
|
|
|
|
|
|
| ||||||||||||
Allowance for losses on impaired loans |
| $ | 290 |
| $ | 441 |
| $ | 872 |
|
| $ | 2,040 |
| $ | 290 |
| $ | 441 |
|
Impaired loans with no related allowance for loan losses |
|
| — |
| 872 |
| — |
|
|
| 112 |
| — |
| 872 |
| ||||
Average balance of impaired loans during the year |
| $ | 1,981 |
| $ | 1,846 |
| $ | 3,076 |
|
|
| 2,658 |
| 1,981 |
| 1,846 |
| ||
|
|
|
|
| ||||||||||||||||
The Bank had one loan over 90 days past due and still accruing interest at December 2006. This loan paid off on January 5, 2007. There were no loans over 90 days past due and still accruing interest at December 31, 2005 2004, and 2003.2004. If interest on nonaccrualnon-accrual loans had been accrued, such income would have been $218,000, $144,000, $103,000, and $210,000,$103,000 for the years ended December 31, 2006, 2005, 2004, and 2003,2004, respectively. The cash amount recognized as interest income on nonaccrualnon-accrual loans was $75,000, $109,000, $64,000, and $119,000$64,000 for the years ended December 31, 2006, 2005, 2004, and 2003,2004, respectively. The amount recognized as interest income on impaired loans continuing to accrue interest was $0,$3,000, $0, and $38,000$0 for the years ended December 31, 2006, 2005, and 2004, and 2003, respectively.
55
NOTE 7—DERIVATIVE INSTRUMENTS AND HEDGING ACTIVITIES
In 2002, theThe Bank began usingutilizes interest rate swap derivatives as one method to manage some of its interest rate risks from recorded financial assets and liabilities. These derivatives are utilized when they can be demonstrated to effectively hedge a designated asset or liability and such asset or liability exposes the Bank to interest rate risk.
The Bank accounts for its derivatives under SFAS No. 149, Amendment of Statement 133 on Derivative Instruments and Hedging Activities and SFAS No. 133, Accounting for Derivative Instruments and Hedging Activities. These Standards require recognition of all derivatives as either assets or liabilities in the balance sheet and require measurement of those instruments at fair value through adjustments to other comprehensive income, current earnings, or both, as appropriate.
In July 2004, the Derivatives Implementation Group of the FASB issued guidance on FASB Statement No. 133, Accounting for Derivative Instruments and Hedging Activities, Implementation Issue No. G25 (“DIG Issue G25”). DIG Issue G25 clarifies the FASB’s position on the ability of entities to hedge the variability in interest receipts or overall changes in cash flows on a group of prime-rate based loans. Under the new guidance these hedge relationships are allowed the use of the first payments received technique if all other conditions of FASB Statement No. 133 are met. The effective date of DIG Issue G25 was October 1, 2004 and was applied to all hedging relationships as of that date. If a pre-existing cash flow hedging relationship has identified the hedged transactions in a manner inconsistent with the guidance in DIG Issue G25, the hedging relationship must be de-designated at the effective date. Any derivative gains or losses in other comprehensive income related to the de-designated hedging relationships should be accounted for under paragraphs 31 and 32 of Statement 133. The Company had pre-existing cash flow hedging relationships in a manner inconsistent with the guidance in DIG Issue G25 which had a $32,000 loss, net of tax, in other comprehensive income as of September 30, 2004. The Company implemented DIG Issue G25 on October 1, 2004 and de-designated its cash flow hedges, which were inconsistent with the guidance. These cash flow hedges were then re-designated as new cash flow hedging relationships under the new guidance of DIG Issue G25. The implementation of DIG Issue G25 did not have a material effect on the Company’s consolidated financial position or results of operations.
The decision to enter into an interest rate swap is made after considering the asset/liability mix of the Bank, the desired asset/liability sensitivity and by interest rate levels. Prior to entering into a hedge transaction, the Bank formally documents the relationship between hedging instruments and hedged items, as well as the risk management objective for undertaking the various hedge transactions.
The following is a summary of the Company’s accounting policiesBank accounts for derivative instruments and its activitiesderivatives under SFAS No. 149, An Amendment of Statement 133 on Derivative Instruments and Hedging Activities and SFAS No. 133, Accounting for Derivative Instruments and DIG Issue G25.Hedging Activities. These Standards require recognition of all derivatives as either assets or liabilities in the balance sheet and require measurement of those instruments at fair value through adjustments to the hedged item, other comprehensive income, or current earnings, as appropriate.
Cash Flow Hedges – The
Previously, the Bank entered into interest rate swaps to convert floating-rate loan assets to fixed rates. Interest rate swaps with notional amounts of $30,000,000 and $40,000,000 under which the Bank received a fixed rate of 5.3425% and 5.4150% matured in March and April 2006, respectively. As of December 31, 2006, the Bank had no outstanding cash flow hedges.
The swap agreements provideprovided for the Bank to pay a variable rate of interest equivalent to the prime rate and to receive a fixed rate of interest. Under the swap agreements the Bank is to pay or receive interest quarterly. Amounts to be paid or received under these swap agreements arewere accounted for on an accrual basis and recognized as interest income of the related asset. The net cash flows related to cash flow hedges decreased interest income on loans by $410,000 and $539,000 in 2006 and 2005, respectively, and increased interest income on loans by $1,163,000 and $1,796,000 during 2004 and 2003, respectively.in 2004.
Cash flow hedges are accounted for at fair value. The effective portion of the change in the cash flow hedge’s gain or loss is reported as a component of other comprehensive income, net of taxes. The ineffective portion of the change in the cash flow hedge’s gain or loss is recorded in earnings on each quarterly measurement date. At December 31, 2006 and 2005, $0 and 2004, $(263,000) and $(346,000),$263,000, respectively, in deferred losses, net of tax, related to cash flow hedges were recorded in accumulated other comprehensive income. All cash flow hedges were effective,effective; therefore, no gain or loss was recorded in earnings. The maximum term over which the Bank is hedging its exposure to the variability of future cash flows is approximately 3 months. earnings in 2006, 2005 and 2004.
56
Fair Value Hedges -
The Bank has entered into interest rate swap agreements with the objective of converting the fixed interest rate on certain brokered CDs to a variable interest rate. The swap agreements provide for the Bank to pay a variable rate of interest based on a spread to the one or three-month London Interbank Offer Rate (LIBOR)LIBOR and to receive a fixed rate of interest equal to that of the brokered CD (hedged instrument.) Under the swap agreements the Bank is to pay or receive interest semiannually. Fair value hedges are accounted for at fair value. All changes in fair value are measured on a quarterly basis.
Amounts to be paid or received under these swap agreements are accounted for on an accrual basis and recognized as interest expense of the related liability. The net cash flows related to fair value hedges increased interest expense on certificates of deposit by $363,000 and $360,000 duringin 2006 and 2005, respectively, and decreased interest expense by $346,000 in 2004. Two swaps, each with a $10,000,000 notional amount, under which the Bank received a fixed rate of 2.30% and $513,000 during 20042.45% matured in February and 2003,April 2006, respectively. At December 31, 2006, the Bank had one outstanding fair value hedge.
56
Fair value hedges are accounted for at fair value. At inception each hedging transaction is evaluated against the eight criteria applicable to fair value hedges pursuant to paragraph 68 of SFAS No. 133. Based on our evaluation, the swaps qualify for the “shortcut method” under SFAS No. 133; therefore, no ineffectiveness is assumed. As a result, changes in the fair value of the swaps directly offset changes inCD, the fair value of the underlying hedged item (i.e., brokered CDs). All changes in fair value are measured on a quarterly basis.
The Company paid broker placement fees by reducing the proceeds received from the issued CD. The fees did not affect the inception value of the interest rate swap. Placement fees are capitalized and amortized into interest expense over the life of the CD in a manner similar to debt issuance costs.
Non-Designated Hedges
The Bank has entered into interest rate swap agreements with the objective of converting long-term fixed rates on certain loans to a variable interest rate. The swap agreements provide for the Bank to pay a fixed rate of interest equal to that of the loan and to receive a variable rate of interest based on a spread to one-month LIBOR. The non-designated hedges are accounted for at fair value. All changes in fair value are measured on a quarterly basis.
Under the swap agreements the Bank is to pay or receive interest monthly. The net cash flows related to these hedges decreased interest income on loans by $2,100 in 2006. One swap agreement is a forward rate lock hedging against rate increases through August 2007. As a result, the cash flows for this swap will not begin until August 2007.
The following table summarizes the Bank’s derivative instruments at December 31, 20052006 and 2004.2005.
|
| December 31, |
|
| December 31, |
| ||||||||
|
|
|
|
| ||||||||||
(in thousands) |
| 2005 |
| 2004 |
|
| 2006 |
| 2005 |
| ||||
|
|
|
|
|
| |||||||||
Cash Flow Hedges |
|
|
|
|
|
|
|
|
|
|
|
| ||
Notional amount |
| $ | 70,000 |
| $ | 90,000 |
|
| $ | — |
| $ | 70,000 |
|
Weighted average pay rate |
|
| 7.25 | % |
| 5.25 | % |
|
| — | % |
| 7.25 | % |
Weighted average receive rate |
|
| 5.39 | % |
| 5.74 | % |
|
| — | % |
| 5.39 | % |
Weighted average maturity in months |
|
| 3 |
| 12 |
|
|
| — |
| 3 |
| ||
Unrealized loss related to interest rate swaps |
| $ | (395 | ) | $ | (511 | ) |
| $ | — |
| $ | (395 | ) |
Fair Value Hedges |
|
|
|
|
|
|
|
|
|
|
|
| ||
Notional amount |
| $ | 30,000 |
| $ | 40,000 |
|
| $ | 10,000 |
| $ | 30,000 |
|
Weighted average pay rate |
|
| 4.42 | % |
| 2.60 | % |
|
| 5.32 | % |
| 4.42 | % |
Weighted average receive rate |
|
| 2.55 | % |
| 2.34 | % |
|
| 2.90 | % |
| 2.55 | % |
Weighted average maturity in months |
|
| 6 |
| 14 |
|
|
| 2 |
| 6 |
| ||
Unrealized loss related to interest rate swaps |
| $ | (341 | ) | $ | (415 | ) |
| $ | (35 | ) | $ | (341 | ) |
Non-Designated Hedges |
|
|
|
|
|
| ||||||||
Notional amount |
| $ | 7,324 |
| $ | — |
| |||||||
Weighted average pay rate |
|
| 7.96 | % |
| — | % | |||||||
Weighted average receive rate |
|
| 7.95 | % |
| — | % | |||||||
Weighted average maturity in months |
|
| 79 |
| — |
| ||||||||
Unrealized loss related to interest rate swaps |
| $ | (119 | ) | $ | — |
| |||||||
The notional amounts of derivative financial instruments do not represent amounts exchanged by the parties, and therefore, are not a measure of the Bank’s credit exposure through its use of these instruments. The credit exposure represents the accounting loss the Bank would incur in the event the counterparties failed completely to perform
57
according to the terms of the derivative financial instruments and the collateral held to support the credit exposure was of no value. Given the fair value loss associated with the derivatives at December 31, 2005,2006, the Bank had no credit exposure to counterparties. At December 31, 20052006 and 2004,2005, in connection with our interest rate swap agreements we had pledged investment securities available for sale with a fair value of $2.5 million and $3.5 million, respectively.$2,500,000. At December 31, 20052006 and 2004,2005, we had accepted, as collateral in connection with our interest rate swap agreements, cash of $196,300.$196,000.
NOTE 8—FIXED ASSETS
A summary of fixed assets at December 31, 20052006 and 20042005 is as follows:
|
| December 31, |
|
| December 31, |
| ||||||||
|
|
|
|
| ||||||||||
(in thousands) |
| 2005 |
| 2004 |
|
| 2006 |
| 2005 |
| ||||
|
|
|
|
|
| |||||||||
Land |
| $ | 1,545 |
| $ | 1,543 |
|
| $ | 2,089 |
| $ | 1,545 |
|
Buildings and leasehold improvements |
|
| 8,652 |
| 6,563 |
|
|
| 13,763 |
| 8,652 |
| ||
Furniture, fixtures and equipment |
|
| 6,870 |
| 5,574 |
|
|
| 9,344 |
| 6,870 |
| ||
Capitalized software |
|
| 3 |
| — |
| ||||||||
|
|
|
|
|
|
| ||||||||
|
|
| 17,067 |
| 13,680 |
|
|
| 25,199 |
| 17,067 |
| ||
Less accumulated depreciation and amortization |
|
| 6,791 |
| 5,636 |
|
|
| 8,149 |
| 6,791 |
| ||
|
|
|
|
|
|
| ||||||||
Total fixed assets |
| $ | 10,276 |
| $ | 8,044 |
|
| $ | 17,050 |
| $ | 10,276 |
|
|
|
|
|
|
|
| ||||||||
Depreciation and amortization of building, leasehold improvements, and furniture, fixtures and equipment included in noninterest expense amounted to $1,901,000, $1,272,000 and $996,000 in 2006, 2005, and $1,231,000 in 2005, 2004, and 2003, respectively.
57
The Company has facilities leased under agreements that expire in various years through 2017. The Company’s aggregate rent expense totaled $1,724,000, $1,602,000, and $1,504,000 in 2006, 2005, and $1,417,000 in 2005, 2004, and 2003, respectively. Sublease rental income for 2006 was $39,000. There was no sublease rental income in 2005 2004, or 2003.2004. The future aggregate minimum rental commitments (in thousands) required under the leases are as follows:
Year |
| Amount |
|
| Amount |
| ||
|
|
|
|
| ||||
2006 |
| $ | 1,673 |
| ||||
2007 |
| $ | 1,642 |
|
| $ | 1,924 |
|
2008 |
| $ | 1,632 |
|
|
| 1,936 |
|
2009 |
| $ | 1,702 |
|
|
| 1,970 |
|
2010 |
| $ | 1,736 |
|
|
| 1,980 |
|
2011 |
|
| 1,048 |
| ||||
Thereafter |
| $ | 3,205 |
|
|
| 1,963 |
|
|
|
|
|
| ||||
Total |
| $ | 11,590 |
|
| $ | 10,822 |
|
|
|
|
|
| ||||
For leases which renew or are subject to periodic rental adjustments, the monthly rental payments will be adjusted based on then current market conditions and rates of inflation.
58
NOTE 9—GOODWILL AND INTANGIBLE ASSETS
The tables below presents an analysis of the goodwill and intangible activity for the years ended December 31, 20052006 and 2004.2005. There was no change in goodwill during the year ended December 31, 2004.
(in thousands) |
| Goodwill |
|
| Goodwill |
| ||
|
|
|
| |||||
Balance at December 31, 2004 |
| $ | 1,938 |
|
| $ | 1,938 |
|
Goodwill from purchase of Millennium Brokerage Group |
| 10,104 |
|
| 10,104 |
| ||
|
|
|
|
| ||||
Balance at December 31, 2005 |
| $ | 12,042 |
|
|
| 12,042 |
|
Goodwill from purchase of Millennium Brokerage Group |
| 189 |
| |||||
Goodwill from purchase of NorthStar Bancshares, Inc |
| 17,752 |
| |||||
|
|
|
|
| ||||
Balance at December 31, 2006 |
| $ | 29,983 |
| ||||
|
|
| ||||||
(in thousands) |
| Non-compete |
| Customer & |
| Net |
|
| Non-compete Intangible |
| Customer and Trade Name Intangibles |
| Core Deposit Intangible |
| Net Intangible |
| |||||||
|
|
|
|
|
|
|
|
| |||||||||||||||
Balance at January 1, 2004 |
| $ | 315 |
| $ | — |
| $ | 315 |
|
| $ | 315 |
| $ | — |
| $ | — |
| $ | 315 |
|
Amortization expense |
|
| (180 | ) |
| — |
| (180 | ) |
| (180 | ) |
| — |
| — |
| (180 | ) | ||||
|
|
|
|
|
|
|
|
|
| ||||||||||||||
Balance at December 31, 2004 |
|
| 135 |
| — |
| 135 |
|
|
| 135 |
| — |
| — |
| 135 |
| |||||
Intangibles from purchase of Millennium Brokerage Group |
|
| — |
| 4,700 |
| 4,700 |
|
| — |
| 4,700 |
| — |
| 4,700 |
| ||||||
Amortization expense |
|
| (135 | ) |
| (152 | ) |
| (287 | ) |
| (135 | ) |
| (152 | ) |
| — |
| (287 | ) | ||
|
|
|
|
|
|
|
|
|
| ||||||||||||||
Balance at December 31, 2005 |
| $ | — |
| $ | 4,548 |
| $ | 4,548 |
|
|
| — |
| 4,548 |
| — |
| 4,548 |
| |||
Intangibles from purchase of NorthStar Bancshares, Inc |
| — |
| — |
| 2,369 |
| 2,369 |
| ||||||||||||||
Amortization expense |
| — |
| (912 | ) |
| (216 | ) |
| (1,128 | ) | ||||||||||||
|
|
|
|
|
|
|
|
|
| ||||||||||||||
Balance at December 31, 2006 |
| $ | — |
| $ | 3,636 |
| $ | 2,153 |
| $ | 5,789 |
| ||||||||||
|
|
|
|
|
| ||||||||||||||||||
The following table reflects the expected amortization schedule for the customer, and trade name and core deposit intangibles (in thousands) at December 31, 2005. 2006.
Year |
| Amount |
|
| Amount |
| ||
|
|
|
| |||||
2006 |
| $ | 912 |
| ||||
2007 |
| 912 |
|
| $ | 1,321 |
| |
2008 |
| 912 |
|
| 1,278 |
| ||
2009 |
| 912 |
|
| 1,235 |
| ||
2010 |
| 899 |
|
| 1,179 |
| ||
2011 |
| 237 |
| |||||
After 2011 |
|
| 539 |
| ||||
|
|
|
|
| ||||
|
| $ | 4,548 |
|
| $ | 5,789 |
|
|
|
|
|
| ||||
The annual impairment evaluation of the goodwill and intangible balances has not identified any potential impairment; accordingly no goodwill or intangible impairment was recorded in 2005.2006.
5859
NOTE 10—MATURITY OF CERTIFICATES OF DEPOSIT
Following is a summary of certificates of deposit maturities at December 31, 2005:2006:
(in thousands) |
| $100,000 |
| Other |
| Total |
|
| $100,000 |
| Other |
| Total |
| ||||||
|
|
|
|
|
|
|
| |||||||||||||
Less than 1 year |
| $ | 151,014 |
| $ | 41,408 |
| $ | 192,422 |
|
| $ | 222,772 |
| $ | 93,079 |
| $ | 315,851 |
|
Greater than 1 year and less than 2 years |
|
| 60,257 |
| 19,553 |
| 79,810 |
|
|
| 36,635 |
| 10,411 |
| 47,046 |
| ||||
Greater than 2 years and less than 3 years |
|
| 17,225 |
| 3,778 |
| 21,004 |
|
|
| 18,009 |
| 6,289 |
| 24,298 |
| ||||
Greater than 3 years and less than 4 years |
|
| 343 |
| 336 |
| 679 |
|
|
| 17,553 |
| 4,122 |
| 21,675 |
| ||||
Greater than 4 years and less than 5 years |
|
| 1,000 |
| 106 |
| 1,106 |
|
|
| 1,947 |
| 1,170 |
| 3,117 |
| ||||
|
|
|
|
|
|
|
|
| ||||||||||||
|
| $ | 229,839 |
| $ | 65,182 |
| $ | 295,021 |
|
| $ | 296,916 |
| $ | 115,071 |
| $ | 411,987 |
|
|
|
|
|
|
|
|
|
| ||||||||||||
NOTE 11—SUBORDINATED DEBENTURES
The Corporation has four wholly ownedfive wholly-owned statutory business trusts. These trusts issued securities that were sold to third parties. The sole purpose of the trusts was to invest the proceeds in junior subordinated debentures of the Company that have terms identical to the trust securities. The amounts and terms of each respective issuance at December 31 were as follows:
|
| Amount |
|
| Amount |
| ||||||||||||||||||||||||||
|
|
|
|
| ||||||||||||||||||||||||||||
(in thousands) |
| 2005 |
| 2004 |
| Maturity Date |
| Call date |
| Interest Rate |
|
| 2006 |
| 2005 |
| Maturity Date |
| Call date |
| Interest Rate |
| ||||||||||
|
|
|
|
|
|
|
|
|
|
|
| |||||||||||||||||||||
EFSC Capital Trust I |
| $ | 4,124 |
| $ | 4,124 |
| June 2032 |
| June 2007 |
| Floats @ 3MO LIBOR + 3.65% |
|
| $ | 4,124 |
| $ | 4,124 |
| June 2032 |
| June 2007 |
| Floats @ 3MO LIBOR + 3.65% |
| ||||||
EFSC Capital Trust II |
|
| 5,155 |
| 5,155 |
| June 2034 |
| June 2009 |
| Floats @ 3MO LIBOR + 2.65% |
|
|
| 5,155 |
| 5,155 |
| June 2034 |
| June 2009 |
| Floats @ 3MO LIBOR + 2.65 % |
| ||||||||
EFSC Capital Trust III |
|
| 11,341 |
| 11,341 |
| December 2034 |
| December 2009 |
| Floats @ 3MO LIBOR + 1.97% |
|
|
| 11,341 |
| 11,341 |
| December 2034 |
| December 2009 |
| Floats @ 3MO LIBOR + 1.97 % |
| ||||||||
EFSC Capital Trust IV |
|
| 10,310 |
| — |
| December 2035 |
| December 2010 |
| Fixed for 5 years @ 6.14%(1) |
|
|
| 10,310 |
| 10,310 |
| December 2035 |
| December 2010 |
| Fixed for 5 years @ 6.14% (1) |
| ||||||||
EFSC Capital Trust V |
|
| 4,124 |
| — |
| September 2036 |
| September 2011 |
| Floats @ 3MO LIBOR + 1.60% |
| ||||||||||||||||||||
|
|
|
|
|
|
|
|
|
|
|
|
| ||||||||||||||||||||
Total trust preferred securities |
| $ | 30,930 |
| $ | 20,620 |
|
|
|
|
|
|
|
| $ | 35,054 |
| $ | 30,930 |
|
|
|
|
|
|
| ||||||
|
|
|
|
|
|
|
|
|
|
|
|
|
|
|
|
|
|
| ||||||||||||||
(1) | After 5 years, floats @ 3MO LIBOR + 1.44% |
The subordinated debentures, which are the sole assets of the trust, are subordinate and junior in right of payment to all present and future senior and subordinated indebtedness and certain other financial conditions of the Company. The Company fully and unconditionally guarantees each trust’s securities obligations. The trust preferred securities are included in tierTier 1 capital for regulatory capital purposes, subject to certain limitations.
The securities are redeemable in whole or in part on or after their respective call dates. Mandatory redemption dates may be shortened if certain conditions are met. The accrual of interest to be paid on the subordinated debentures held by the trusts is recorded as interest expense in the Company’s consolidated financial statements.
60
NOTE 12—FEDERAL HOME LOAN BANK ADVANCES
As a member of the Federal Home Loan Bank,FHLB, the Bank has access to Federal Home Loan BankFHLB advances. The Federal Home Loan BankFHLB advances at December 31, 20052006 and 20042005 are collateralized by 1-4 family residential real estate loans, business loans and certain commercial real estate loans with a carrying value of $270 million$267,000,000 and $258 million,$270,000,000, respectively, and all stock held in the Federal Home Loan BankFHLB of Des Moines.
59
The following table summarizes the type, maturity and rate of the Company’s Federal Home Loan BankFHLB advances at December 31:
|
| 2005 |
| 2004 |
|
|
| 2006 |
| 2005 |
| |||||||||||||||||||||
|
|
|
|
|
|
|
| |||||||||||||||||||||||||
(in thousands) |
| Term |
| Outstanding |
| Weighted |
| Outstanding |
| Weighted |
|
| Term |
| Outstanding Balance |
| Weighted Rate |
| Outstanding Balance |
| Weighted Rate |
| ||||||||||
|
|
|
|
|
|
|
|
|
|
|
| |||||||||||||||||||||
Long term non-amortized fixed advance |
| less than 1 year |
| $ | 1,525 |
| 4.51 | % | $ | 3,655 |
| 4.45 | % |
|
| less than 1 year |
| $ | 1,250 |
| 4.74 | % | $ | 1,525 |
| 4.51 | % | |||||
Long term non-amortized fixed advance |
| 1 - 2 years |
| 1,250 |
| 4.74 | % |
| 1,525 |
| 4.51 | % |
|
| 1 - 2 years |
| 650 |
| 4.91 | % |
| 1,250 |
| 4.74 | % | |||||||
Long term non-amortized fixed advance |
| 2 - 3 years |
| 650 |
| 4.91 | % |
| 1,250 |
| 4.74 | % |
|
| 2 - 3 years |
| 1,050 |
| 5.40 | % |
| 650 |
| 4.91 | % | |||||||
Long term non-amortized fixed advance |
| 3 - 4 years |
| 1,050 |
| 5.40 | % |
| 650 |
| 4.91 | % |
|
| 3 - 4 years |
| 5,800 |
| 4.48 | % |
| 1,050 |
| 5.40 | % | |||||||
Long term non-amortized fixed advance |
| 4 - 5 years |
| 5,800 |
| 4.48 | % |
| 1,050 |
| 5.40 | % |
|
| 4 - 5 years |
| 300 |
| 6.07 | % |
| 5,800 |
| 4.48 | % | |||||||
Long term non-amortized fixed advance |
| 5 - 10 years |
| 17,300 |
| 4.55 | % |
| 1,100 |
| 5.44 | % |
|
| 5 - 10 years |
| 17,000 |
| 4.53 | % |
| 17,300 |
| 4.55 | % | |||||||
Mortgage matched fixed advance |
| 10 - 15 years |
| 1,009 |
| 5.69 | % |
| 1,069 |
| 5.69 | % |
|
| 10 - 15 years |
| 945 |
| 5.69 | % |
| 1,009 |
| 5.69 | % | |||||||
|
|
|
|
|
|
|
|
|
|
|
|
|
|
|
|
|
|
|
| |||||||||||||
Total Federal Home Loan Bank Advances |
|
|
| $ | 28,584 |
| 4.62 | % | $ | 10,299 |
| 4.85 | % |
|
|
| $ | 26,995 |
| 4.63 | % | $ | 28,584 |
| 4.62 | % | ||||||
|
|
|
|
|
|
|
|
|
|
|
|
|
|
|
|
|
|
|
| |||||||||||||
The majority of these advances were used to match certain fixed rate loans to lock in an interest rate spread. All of the Federal Home Loan BankFHLB advances have fixed interest rates, and $27,575,000$26,050,000 and $9,230,000$27,575,000 at December 31, 20052006 and 2004,2005, respectively, are callable by the Company anytime, subject to prepayment penalties. The remaining borrowings are not callable by the Company. The Bank, which has an investment in the capital stock of the Federal Home Loan Bank,FHLB, maintains a line of credit with the Federal Home Loan BankFHLB and had availability of approximately $132 million$130,000,000 at December 31, 2005.2006.
NOTE 13—OTHER BORROWINGS AND NOTES PAYABLE
A summary of other borrowings is as follows:
|
| December 31, |
|
| December 31, |
| ||||||||
|
|
|
|
| ||||||||||
(in thousands) |
| 2005 |
| 2004 |
|
| 2006 |
| 2005 |
| ||||
|
|
|
|
|
| |||||||||
Securities sold under repurchase agreements |
| $ | 6,650 |
| $ | 3,086 |
|
| $ | 9,561 |
| $ | 6,650 |
|
Federal funds purchased |
|
| — |
| 6,334 |
|
|
| — |
| — |
| ||
Other |
|
| 196 |
| 196 |
|
|
| 196 |
| 196 |
| ||
|
|
|
|
|
|
| ||||||||
Total other borrowings |
| $ | 6,847 |
| $ | 9,616 |
|
| $ | 9,757 |
| $ | 6,847 |
|
|
|
|
|
|
|
| ||||||||
Average balance during the year |
| $ | 6,440 |
| $ | 2,896 |
|
| $ | 7,692 |
| $ | 6,440 |
|
Maximum balance outstanding at any month-end |
|
| 7,674 |
| 9,616 |
|
|
| 9,757 |
| 7,674 |
| ||
Weighted average interest rate during the year |
|
| 2.13 | % |
| 1.30 | % |
|
| 3.07 | % |
| 2.13 | % |
Weighted average interest rate at December 31 |
|
| 2.52 | % |
| 2.26 | % |
|
| 3.33 | % |
| 2.52 | % |
At December 31, 20052006 the Company had a $15 millionan $11,000,000 unsecured bank line of credit and a $4,000,000 term loan that waswere renewed on January 13, 2006 with an outstanding balance of $1,500,000. The line hasDecember 6, 2006. Both instruments have debt covenants, accruesaccrue interest based on LIBOR plus 125 basis points1.25% and isare payable quarterly. At December 31, 2006, outstanding balances on the line of credit and term loan were $0 and $4,000,000, respectively. For the year ended December 31, 2005,2006, the average balance and maximum month-end balance of the note payablethese instruments were $30,000$3,042,000 and $1,500,000,$4,000,000, respectively.
The Company also has a line with the Federal Reserve Bank of St. Louis for back-up liquidity purposes but has not drawn on the line. As of December 31, 20052006 approximately $168 million$165,000,000 was available under this line. This line is secured by a pledge of certain eligible loans.
NOTE 14—MINORITY INTEREST
Minority Interest on the consolidated balance sheets represents the portion of members’ equity of Millennium Brokerage Group, LLC (40%) that is not owned by the Company.
6061
NOTE 14—LITIGATION AND OTHER CLAIMS
Except as noted below, various legal claims have arisen during the normal course of business which, in the opinion of management, after discussion with legal counsel, will not result in any material liability.
In accordance with SFAS No. 5, Accounting for Contingencies, during 2003 the Company recognized $725,000 in expense related to a settlement of a dispute with another financial institution pursuant to an agreement signed in February of 2003. An additional $575,000 was paid on this settlement in 2004.
NOTE 15—INCOME TAXES
The components of income tax expense for the years ended December 31 are as follows:
|
| Years ended December 31, |
|
| Years ended December 31, |
| ||||||||||||||
|
|
|
|
| ||||||||||||||||
(in thousands) |
| 2005 |
| 2004 |
| 2003 |
|
| 2006 |
| 2005 |
| 2004 |
| ||||||
|
|
|
|
|
|
|
| |||||||||||||
Current: |
|
|
|
|
|
|
|
|
|
|
|
|
|
|
|
| ||||
Federal |
| $ | 6,572 |
| $ | 3,612 |
| $ | 4,049 |
|
| $ | 9,023 |
| $ | 6,572 |
| $ | 3,612 |
|
State and local |
| 774 |
| 267 |
| 234 |
|
| 546 |
| 774 |
| 267 |
| ||||||
Deferred |
|
| (1,034 | ) |
| 210 |
| (258 | ) |
|
| (1,244 | ) |
| (1,034 | ) |
| 209 |
| |
|
|
|
|
|
|
|
|
| ||||||||||||
|
| $ | 6,312 |
| $ | 4,089 |
| $ | 4,025 |
|
| $ | 8,325 |
| $ | 6,312 |
| $ | 4,088 |
|
|
|
|
|
|
|
|
|
| ||||||||||||
A reconciliation of expected income tax expense, computed by applying the statutory federal income tax rate of 35% in 2006 and 2005 and 34% in 2004 and 2003 to income before income taxes and the amounts reflected in the consolidated statements of income is as follows:
|
| Years ended December 31, |
|
| Years ended December 31, |
| ||||||||||||||
|
|
|
|
| ||||||||||||||||
(in thousands) |
| 2005 |
| 2004 |
| 2003 |
|
| 2006 |
| 2005 |
| 2004 |
| ||||||
|
|
|
|
|
|
|
| |||||||||||||
Income tax expense at statutory rate |
| $ | 6,162 |
| $ | 4,183 |
| $ | 3,723 |
|
| $ | 8,327 |
| $ | 6,162 |
| $ | 4,183 |
|
Increase (reduction) in income tax resulting from: |
|
|
|
|
|
|
|
|
|
|
|
|
|
|
|
| ||||
Reversal of valuation allowance |
| — |
| (241 | ) |
| — |
|
| — |
| — |
| (241 | ) | |||||
Tax-exempt income |
| (380 | ) |
| (298 | ) |
| (258 | ) |
| (274 | ) |
| (380 | ) |
| (298 | ) | ||
State and local income tax expense |
| 503 |
| 176 |
| 154 |
|
| 355 |
| 503 |
| 176 |
| ||||||
Goodwill amortization |
| — |
| — |
| 51 |
| |||||||||||||
Non-deductible expenses |
| 189 |
| 159 |
| 101 |
|
| 236 |
| 189 |
| 159 |
| ||||||
Other, net |
| (162 | ) |
| 110 |
| 254 |
|
| (319 | ) |
| (162 | ) |
| 109 |
| |||
|
|
|
|
|
|
|
|
| ||||||||||||
Total income tax expense |
| $ | 6,312 |
| $ | 4,089 |
| $ | 4,025 |
|
| $ | 8,325 |
| $ | 6,312 |
| $ | 4,088 |
|
|
|
|
|
|
|
|
|
| ||||||||||||
62
A net deferred income tax asset of $6,064,000$8,773,000 and $4,779,000$6,064,000 is included in prepaid expenses and other assets in the consolidated balance sheets at December 31, 20052006 and 2004,2005, respectively. The tax effect of temporary differences that gave rise to significant portions of the deferred tax assets and deferred tax liabilities is as follows:
|
| Years ended December 31, |
|
| Years ended December 31, |
| ||||||||
|
|
|
|
| ||||||||||
(in thousands) |
| 2005 |
| 2004 |
|
| 2006 |
| 2005 |
| ||||
|
|
|
|
|
| |||||||||
Deferred tax assets: |
|
|
|
|
|
|
|
|
|
|
|
| ||
Allowance for loan losses |
| $ | 4,547 |
| $ | 3,966 |
|
| $ | 6,022 |
| $ | 4,547 |
|
Deferred compensation |
| 802 |
| 625 |
|
| 992 |
| 802 |
| ||||
Merchant banking investments |
| 212 |
| 209 |
|
| 239 |
| 212 |
| ||||
Unrealized losses on securities available for sale |
| 491 |
| 240 |
|
| 371 |
| 491 |
| ||||
Unrealized losses on cash flow derivative instruments |
| 132 |
| 179 |
|
| — |
| 132 |
| ||||
Loans |
| 1,436 |
| — |
| |||||||||
Other |
| 216 |
| 191 |
|
| 581 |
| 216 |
| ||||
|
|
|
|
|
|
| ||||||||
Total deferred tax assets |
| 6,400 |
| 5,410 |
|
| 9,641 |
| 6,400 |
| ||||
|
|
|
|
|
|
| ||||||||
Deferred tax liabilities: |
|
|
|
|
|
|
|
|
|
|
|
| ||
Core deposit intangibles |
| 784 |
| — |
| |||||||||
Office equipment and leasehold improvements |
| 336 |
| 631 |
|
| 84 |
| 336 |
| ||||
|
|
|
|
|
|
| ||||||||
Total deferred tax liabilities |
| 336 |
| 631 |
|
| 868 |
| 336 |
| ||||
|
|
|
|
|
|
| ||||||||
Net deferred tax asset |
| $ | 6,064 |
| $ | 4,779 |
|
| $ | 8,773 |
| $ | 6,064 |
|
|
|
|
|
|
|
| ||||||||
A valuation allowance is provided on deferred tax assets when it is more likely than not that some portion of the assets will not be realized. The Company had established adid not have any valuation allowanceallowances as of December 31, 2001. During 2004,2006 or December 31, 2005. Management believes it is more likely than not that the Company had a $241,000 reversalresults of future operations will generate sufficient taxable income to realize the remaining deferred tax valuation allowance related to Merchant Banking losses in 2001. The nature and deductibility of these losses were finally determined when the Company filed its 2003 income tax returns during 2004. Also, during 2004, the Company recognized state income tax refunds of $163,000 related to amendments of prior state income tax returns.assets above.
61
NOTE 16—REGULATORY MATTERS
The Company and Bank are subject to various regulatory capital requirements administered by the Federal banking agencies. Failure to meet minimum capital requirements can initiate certain mandatory and possible additional discretionary actions by regulators that, if undertaken, could have a direct material effect on the Bank’s financial statements. Under capital adequacy guidelines and the regulatory framework for prompt corrective action, the Company and Bank must meet specific capital guidelines that involve quantitative measures of assets, liabilities, and certain off-balance-sheet items as calculated under regulatory accounting practices. The Bank’s capital amounts and classification are also subject to qualitative judgments by the regulators about components, risk weightings, and other factors.
Quantitative measures established by regulation to ensure capital adequacy require the Company and Bank to maintain minimum amounts and ratios (set forth in the following table) of total and Tier 1 capital to risk-weighted assets, and of Tier 1 capital to average assets. Management believes, as of December 31, 20052006 and 2004,2005, that the Company and Bank meet all capital adequacy requirements to which they are subject.
As of December 31, 20052006 and 2004,2005, the Bank was categorized as “well capitalized” under the regulatory framework for prompt corrective action. To be categorized as “well capitalized” the Bank must maintain minimum total risk-based, Tier 1 risk-based and Tier 1 leverage ratios as set forth in the table.
63
The Company’s and Bank’s actual capital amounts and ratios are also presented in the table.
|
| Actual |
| For Capital |
| To Be Well |
| ||||||||||||
|
|
|
|
| |||||||||||||||
(in thousands) |
| Amount |
| Ratio |
| Amount |
| Ratio |
| Amount |
| Ratio |
| ||||||
|
|
|
|
|
|
| |||||||||||||
As of December 31, 2005: |
|
|
|
|
|
|
|
|
|
|
|
|
|
|
|
|
|
|
|
Total Capital (to Risk Weighted Assets) |
|
|
|
|
|
|
|
|
|
|
|
|
|
|
|
|
|
|
|
Enterprise Financial Services Corp |
| $ | 120,528 |
|
| 11.55 | % | $ | 83,462 |
|
| 8.00 | % | $ | — |
|
| — | % |
Enterprise Bank & Trust |
|
| 115,435 |
|
| 11.08 |
|
| 83,362 |
|
| 8.00 |
|
| 104,202 |
|
| 10.00 |
|
Tier I Capital (to Risk Weighted Assets) |
|
|
|
|
|
|
|
|
|
|
|
|
|
|
|
|
|
|
|
Enterprise Financial Services Corp |
|
| 107,538 |
|
| 10.31 |
|
| 41,731 |
|
| 4.00 |
|
| — |
|
| — |
|
Enterprise Bank & Trust |
|
| 102,445 |
|
| 9.83 |
|
| 41,681 |
|
| 4.00 |
|
| 62,521 |
|
| 6.00 |
|
Tier I Capital (to Average Assets) |
|
|
|
|
|
|
|
|
|
|
|
|
|
|
|
|
|
|
|
Enterprise Financial Services Corp |
|
| 107,538 |
|
| 8.75 |
|
| 36,883 |
|
| 3.00 |
|
| — |
|
| — |
|
Enterprise Bank & Trust |
|
| 102,445 |
|
| 8.33 |
|
| 36,912 |
|
| 3.00 |
|
| 61,521 |
|
| 5.00 |
|
As of December 31, 2004: |
|
|
|
|
|
|
|
|
|
|
|
|
|
|
|
|
|
|
|
Total Capital (to Risk Weighted Assets) |
|
|
|
|
|
|
|
|
|
|
|
|
|
|
|
|
|
|
|
Enterprise Financial Services Corp |
|
| 103,673 |
|
| 11.19 |
|
| 74,086 |
|
| 8.00 |
|
| — |
|
| — |
|
Enterprise Bank & Trust |
|
| 99,545 |
|
| 10.76 |
|
| 74,036 |
|
| 8.00 |
|
| 92,545 |
|
| 10.00 |
|
Tier I Capital (to Risk Weighted Assets) |
|
|
|
|
|
|
|
|
|
|
|
|
|
|
|
|
|
|
|
Enterprise Financial Services Corp |
|
| 92,096 |
|
| 9.94 |
|
| 37,043 |
|
| 4.00 |
|
| — |
|
| — |
|
Enterprise Bank & Trust |
|
| 87,976 |
|
| 9.51 |
|
| 37,018 |
|
| 4.00 |
|
| 55,527 |
|
| 6.00 |
|
Tier I Capital (to Average Assets) |
|
|
|
|
|
|
|
|
|
|
|
|
|
|
|
|
|
|
|
Enterprise Financial Services Corp |
|
| 92,096 |
|
| 8.44 |
|
| 32,725 |
|
| 3.00 |
|
| — |
|
| — |
|
Enterprise Bank & Trust |
|
| 87,976 |
|
| 8.08 |
|
| 32,659 |
|
| 3.00 |
|
| 54,432 |
|
| 5.00 |
|
62
|
| Actual |
| For Capital |
| To Be Well |
| ||||||||||||
|
|
|
|
| |||||||||||||||
(in thousands) |
| Amount |
| Ratio |
| Amount |
| Ratio |
| Amount |
| Ratio |
| ||||||
|
|
|
|
|
|
| |||||||||||||
As of December 31, 2006: |
|
|
|
|
|
|
|
|
|
|
|
|
|
|
|
|
|
|
|
Total Capital (to Risk Weighted Assets) |
|
|
|
|
|
|
|
|
|
|
|
|
|
|
|
|
|
|
|
Enterprise Financial Services Corp |
| $ | 148,856 |
|
| 10.83 | % | $ | 109,935 |
|
| 8.00 | % | $ | — |
|
| — | % |
Enterprise Bank & Trust |
|
| 142,645 |
|
| 10.41 |
|
| 109,640 |
|
| 8.00 |
|
| 137,049 |
|
| 10.00 |
|
Tier I Capital (to Risk Weighted Assets) |
|
|
|
|
|
|
|
|
|
|
|
|
|
|
|
|
|
|
|
Enterprise Financial Services Corp |
|
| 131,869 |
|
| 9.60 |
|
| 54,968 |
|
| 4.00 |
|
| — |
|
| — |
|
Enterprise Bank & Trust |
|
| 125,658 |
|
| 9.17 |
|
| 54,820 |
|
| 4.00 |
|
| 82,230 |
|
| 6.00 |
|
Tier I Capital (to Average Assets) |
|
|
|
|
|
|
|
|
|
|
|
|
|
|
|
|
|
|
|
Enterprise Financial Services Corp |
|
| 131,869 |
|
| 8.87 |
|
| 44,610 |
|
| 3.00 |
|
| — |
|
| — |
|
Enterprise Bank & Trust |
|
| 125,658 |
|
| 8.47 |
|
| 44,509 |
|
| 3.00 |
|
| 74,182 |
|
| 5.00 |
|
As of December 31, 2005: |
|
|
|
|
|
|
|
|
|
|
|
|
|
|
|
|
|
|
|
Total Capital (to Risk Weighted Assets) |
|
|
|
|
|
|
|
|
|
|
|
|
|
|
|
|
|
|
|
Enterprise Financial Services Corp |
|
| 120,528 |
|
| 11.55 |
|
| 83,462 |
|
| 8.00 |
|
| — |
|
| — |
|
Enterprise Bank & Trust |
|
| 115,435 |
|
| 11.08 |
|
| 83,362 |
|
| 8.00 |
|
| 104,202 |
|
| 10.00 |
|
Tier I Capital (to Risk Weighted Assets) |
|
|
|
|
|
|
|
|
|
|
|
|
|
|
|
|
|
|
|
Enterprise Financial Services Corp |
|
| 107,538 |
|
| 10.31 |
|
| 41,731 |
|
| 4.00 |
|
| — |
|
| — |
|
Enterprise Bank & Trust |
|
| 102,445 |
|
| 9.83 |
|
| 41,681 |
|
| 4.00 |
|
| 62,521 |
|
| 6.00 |
|
Tier I Capital (to Average Assets) |
|
|
|
|
|
|
|
|
|
|
|
|
|
|
|
|
|
|
|
Enterprise Financial Services Corp |
|
| 107,538 |
|
| 8.75 |
|
| 36,883 |
|
| 3.00 |
|
| — |
|
| — |
|
Enterprise Bank & Trust |
|
| 102,445 |
|
| 8.33 |
|
| 36,912 |
|
| 3.00 |
|
| 61,521 |
|
| 5.00 |
|
NOTE 17—COMPENSATION PLANS
The Company has adopted several incentive and nonqualified stock optionshare-based compensation plans to reward and provide long-term incentive for directors and key employees of the Company. These plans provide for the granting of stock, stock options, stock appreciation rights, and restricted share units (RSU’s), as designated by the Company’s Board of Directors. Options haveThe Company uses authorized and unissued shares to satisfy share award exercises. During 2006, share-based compensation was issued in the form of stock, stock options and RSU’s. At December 31, 2006, 892,865 shares were available for grant under the various share-based compensation plans. An additional 96,619 shares of stock were available for issuance under the Stock Plan for Non-Management Directors approved by the Shareholders in April 2006. Share-based compensation has been settled with newly issued shares.
The share-based compensation expense that was charged against income was $1,252,000, $690,000 and $228,000 for the years ended December 31, 2006, 2005 and 2004, respectively. The total income tax benefit recognized in the income statement for share-based compensation arrangements was $525,000, $831,000 and $11,000 for the years ended December 31, 2006, 2005 and 2004, respectively.
In determining compensation cost for stock options, the Black-Schools option-pricing model is used to estimate the fair value of options on date of grant. The Black-Schools model is a maximum durationclosed-end model that uses the assumptions in the following table. The risk-free rate for the expected term is based on the U.S. Treasury zero-coupon spot rates in effect at the time of ten years fromgrant. Expected volatility is based on historical volatility of the Company’s stock. The Company uses historical exercise behavior and other factors to estimate the expected term of the options, which represents the period of time that the options granted are expected to be outstanding.
|
| 2006 |
| 2005 |
| 2004 |
| |||
|
|
|
|
| ||||||
Risk-free interest rate |
|
| 4.5 | % |
| 4.5 | % |
| 4.2 | % |
Expected dividend rate |
|
| 0.3 | % |
| 0.6 | % |
| 0.6 | % |
Expected volatility |
|
| 54.6 | % |
| 43.7 | % |
| 45.0 | % |
Expected term (years) |
|
| 9.5 years |
|
| 10 years |
|
| 10 years |
|
64
Employee Stock Options
Stock options were granted to key employees with exercise prices equal to the market price of the Company’s stock at the date of grant. Options typicallygrant and have 10-year contractual terms. Stock options have a vesting schedule of between three to five years. The weighted average grant date fair value of options granted during 2006, 2005 and 2004 was $18.34, $11.62, and $7.80, respectively. Compensation expense related to stock options was $21,000, $15,000, and $146,000 in 2006, 2005, and 2004, respectively. Compensation expense in 2004 was related to the acceleration of outstanding employee stock options as described in Note 1 – Significant Accounting Policies. On a quarterly basis, actual forfeitures are measured and recognized in expense for any differences versus the estimate. In 2006, the difference between actual and estimated forfeitures on the accelerated options decreased compensation expense by $36,000. In 2005, the difference between actual and estimated forfeitures on the accelerated options increased compensation expense by $15,000. The total intrinsic value of options exercised on the date of exercise was $1,750,000, $4,200,000, and $1,135,000 in 2006, 2005 and 2004, respectively. Cash received from the exercise of stock options in 2006 was $1,226,000. At December 31, 2005, 261,093 shares were available for grant under the various2006, there was $189,500 of total unrecognized compensation cost related to stock option plans. Asoptions, which is expected to be recognized over a weighted average period of December 31, 2005, there were no Stock Appreciation Rights granted. See “Restricted Stock Units” below for information on restricted stock unit grants.
In addition, the Company adopted a Stock Appreciation Rights Plan for directors of the Company and its subsidiaries. See “Stock Appreciation Rights” below for more information. The Company also has a stock plan in conjunction with a solicitation and referral agreement with Moneta Group, Inc., a nationally recognized firm in the financial planning industry. See “Moneta Plan” below for more information.
Stock Option Activity
2.7 years. Following is a summary of the variousemployee stock option plan transactions:
|
| 2005 |
| 2004 |
| 2003 |
| ||||||||||||
|
|
|
|
| |||||||||||||||
|
| Shares |
| Weighted Avg |
| Shares |
| Weighted Avg |
| Shares |
| Weighted Avg |
| ||||||
|
|
|
|
|
|
|
| ||||||||||||
Outstanding at beginning of year |
|
| 1,299,321 |
| $ | 11.07 |
|
| 1,510,403 |
| $ | 10.75 |
|
| 1,284,643 |
| $ | 9.90 |
|
Granted |
|
| 10,462 |
|
| 20.41 |
|
| 30,500 |
|
| 13.70 |
|
| 415,962 |
|
| 13.28 |
|
Exercised |
|
| 398,005 |
|
| 9.07 |
|
| 159,875 |
|
| 7.77 |
|
| 120,688 |
|
| 9.24 |
|
Forfeited |
|
| 10,250 |
|
| 13.37 |
|
| 81,707 |
|
| 12.54 |
|
| 69,514 |
|
| 12.93 |
|
|
|
|
|
|
|
|
|
|
|
|
|
|
| ||||||
Outstanding at end of year |
|
| 901,528 |
| $ | 12.03 |
|
| 1,299,321 |
| $ | 11.07 |
|
| 1,510,403 |
| $ | 10.75 |
|
|
|
|
|
|
|
|
|
|
|
|
|
|
| ||||||
Exercisable at end of year |
|
| 891,066 |
| $ | 11.93 |
|
| 1,299,321 |
| $ | 11.07 |
|
| 650,428 |
| $ | 8.80 |
|
Following is a summary of the stock option grants outstanding at December 31, 2005:
|
| Options Outstanding |
| Options Exercisable |
| |||||||||||
|
|
|
| |||||||||||||
Exercise Price Range |
| Number |
| Weighted-Average Exercise Price |
| Weighted-Average |
| Number |
| Weighted-Average Exercise Price |
| |||||
|
|
|
|
|
| |||||||||||
$ 5.33 - $ 9.92 |
|
| 126,055 |
| $ | 8.12 |
|
| 4.76 |
|
| 126,055 |
| $ | 8.12 |
|
$ 10.00 - $ 10.67 |
|
| 179,850 |
|
| 10.12 |
|
| 6.62 |
|
| 179,850 |
|
| 10.12 |
|
$ 11.50 - $ 12.50 |
|
| 150,600 |
|
| 11.82 |
|
| 5.62 |
|
| 150,600 |
|
| 11.82 |
|
$ 13.05 - $ 13.90 |
|
| 327,811 |
|
| 13.35 |
|
| 7.50 |
|
| 327,811 |
|
| 13.35 |
|
$ 14.00 - $ 16.00 |
|
| 95,750 |
|
| 15.01 |
|
| 4.70 |
|
| 95,750 |
|
| 15.01 |
|
$ 18.00 - $ 21.97 |
|
| 21,462 |
|
| 19.17 |
|
| 6.81 |
|
| 11,000 |
|
| 18.00 |
|
|
|
|
|
|
|
|
|
|
|
|
|
| ||||
|
|
| 901,528 |
| $ | 12.03 |
|
| 6.32 |
|
| 891,066 |
| $ | 11.93 |
|
|
|
|
|
|
|
|
|
|
|
|
|
| ||||
63
The Company has elected to continue to accountactivity for its stock options using the intrinsic-value method. Accordingly, no compensation cost has been recognized for its stock option plans. The fair value of each option granted was estimated on the date of the grant using the Black-Scholes option-pricing model with the following weighted-average assumptions for the years ended December 31:2006.
|
| 2005 |
| 2004 |
| 2003 |
| |||
|
|
|
|
| ||||||
Risk-free interest rate |
|
| 4.49 | % |
| 4.15 | % |
| 3.94 | % |
Expected dividend rate |
|
| 0.60 | % |
| 0.60 | % |
| 0.60 | % |
Expected volatility |
|
| 43.70 | % |
| 44.99 | % |
| 52.57 | % |
Expected life (years) |
|
| 10 |
|
| 10 |
|
| 10 |
|
Weighted-average grant-date fair value of options |
| $ | 11.62 |
| $ | 7.80 |
| $ | 8.37 |
|
For federal tax purposes, the Company receives a tax deduction upon the exercise of non-qualified stock options for the difference between the exercise price and the fair value of the stock. The Company recognized a tax benefit of $831,000, $11,000 and $0 in 2005, 2004 and 2003, respectively, related to the exercise of non-qualified stock options as a component of paid-in capital.
(Dollars in thousands, except share data) |
| Shares |
| Weighted Average Exercise Price |
| Weighted Average Remaining Contractual Term |
| Aggregate Intrinsic Value |
| ||||
|
|
|
|
| |||||||||
Outstanding at January 1, 2006 |
|
| 901,528 |
| $ | 12.03 |
|
| — |
|
|
|
|
Granted |
|
| 7,487 |
|
| 27.86 |
|
| — |
|
|
|
|
Exercised |
|
| (103,878 | ) |
| 11.80 |
|
| — |
|
|
|
|
Forfeited |
|
| — |
|
| — |
|
| — |
|
|
|
|
|
|
|
|
|
| ||||||||
Outstanding at December 31, 2006 |
|
| 805,137 |
| $ | 12.21 |
|
| 5.5 years |
| $ | 16,403 |
|
|
|
|
|
|
| ||||||||
Exercisable at December 31, 2006 |
|
| 790,009 |
| $ | 11.98 |
|
| 5.4 years |
| $ | 16,274 |
|
|
|
|
|
|
| ||||||||
Vested and expected to vest at December 31, 2006 |
|
| 805,137 |
| $ | 12.21 |
|
| 5.5 years |
| $ | 16,403 |
|
|
|
|
|
|
| ||||||||
Restricted StockShare Units
In 2005, the Company began awarding nonvested stock, in the form of RSU’s, as part of a new long-term incentive plan. RSU’s awarded 120,300 restricted stock units to employees. In addition, the Company awarded 6,027 restricted stock unitsemployees are subject to continued employment and vest ratably over five years. RSU’s granted to directors of the Company in lieu of cash compensation. Below is a summary of the awards:
Grant Date |
| Shares |
| Price |
| ||
|
|
| |||||
January 2005 |
|
| 113,636 |
| $ | 18.75 |
|
April 2005 |
|
| 2,000 |
|
| 19.00 |
|
May 2005 |
|
| 213 |
|
| 18.78 |
|
August 2005 |
|
| 1,178 |
|
| 23.10-24.63 |
|
October 2005 |
|
| 500 |
|
| 21.22 |
|
November 2005 |
|
| 8,800 |
|
| 22.02 |
|
Restricted share units (“RSU’s”)2005 vested on December 31, 2005. RSU’s do not carry voting or dividend rights.rights until vesting. Sales of the units are restricted prior to vesting. MostCompensation expense related to employee RSU’s granted are subject to continued employmentwas $1,029,000 and vest over five years. RSU’s granted to the directors vested$483,000 in one year on December 31, 2005. One associate was also granted RSU’s that vested in one year on December 31, 2005. RSU’s issued under the plan are recorded at their fair market value on the date of grant with a corresponding charge to deferred compensation. The deferred compensation, a component of shareholders’ equity, is being amortized as compensation2006 and 2005, respectively. In 2005, Other noninterest expense on a straight-line basis over the vesting period. Included in employee compensation and benefits in the consolidated statements of income is compensation expense for restricted shares of $483,000 for 2005. Other expenses in the Consolidated Statements of Income includesincluded $117,000 for the restricted shares grantedRSU’s awarded to the directors of the Company. DuringThe total fair value (at vest date) of shares vested during 2006 and 2005 1,500 restricted shares were forfeited duewas $1,506,000 and $658,000, respectively. At December 31, 2006, there was $3,418,000 of total unrecognized compensation cost related to departuresnonvested RSU’s, which is expected to be recognized over a weighted average period of associates prior to the completion3.5 years. A summary of the vesting period.status of the Company’s restricted share unit awards as of December 31, 2006 and changes during the year then ended is presented below.
|
| Shares |
| Weighted |
| ||
|
|
|
| ||||
Outstanding at January 1, 2006 |
|
| 95,613 |
| $ | 18.80 |
|
Granted |
|
| 115,617 |
|
| 25.56 |
|
Vested |
|
| (46,325 | ) |
| 22.27 |
|
Forfeited |
|
| (4,430 | ) |
| 18.75 |
|
|
|
|
|
|
| ||
Outstanding at December 31, 2006 |
|
| 160,475 |
|
| 22.67 |
|
|
|
|
|
|
| ||
65
Stock Appreciation Rights
On April 1, 1999, the Company adopted a Stock Appreciation Rights (“SAR”SAR’s”) Plan. This Plan replaced the previous form of cash compensation for directors of the Company and its subsidiaries and awardssubsidiaries. Awards vest based upon attendance and unit performance. Under the plan, the Company has the option to pay vested SARsSAR’s either in the form of cash or Company common stock. There were 7,800, 7,800 and 64,000 SARS outstanding at December 31,no SAR’s granted in 2006, 2005 2004 and 2003, respectively.or 2004. For the year ended December 31, 2003,2006 and 2005, the Company recognized $89,000$60,000 and $41,000 of expense to record the marketfair value of the SARS.SAR’s. The Company recognized a reduction to expense of $6,000 to record the marketfair value of the SARsSAR’s for the year ended December 31, 2004. During 2006, the Company paid cash of $19,000 for SAR’s that vested in July and October. In January 2007, the Company paid $118,000 to settle SAR’s that vested on December 31, 2006. At December 31, 2006, there were no other SAR’s outstanding.
Stock Plan for Non-Management Directors
In 2006, the Company adopted a Stock Plan for Non-Management Directors, which provides for issuing shares of common stock to non-employee directors as compensation in lieu of cash. Shares granted under this plan may be subject to resale restrictions (“restricted stock”). The plan was approved by the shareholders and allows up to 100,000 shares to be awarded. In July 2006, the Company issued 3,381 shares of restricted stock at a fair value of $25.45 per share. For the year ended December 31, 2005,2006, the Company recognized $41,000$125,000 of stock-based compensation expense for the directors. At December 31, 2006, there is no unrecognized compensation cost related to record the market value of the SARS.this plan.
Moneta Plan
In 1997, the Company entered into a solicitation and referral agreement with Moneta Group, Inc. (“Moneta”), a nationally recognized firm in the financial planning industry. The Company renegotiated the original agreement on December 24,in 2003. Under the agreements, Moneta had received options for banking business referrals and still receives a portion of the gross margin earned by Trust in the form of cash. The Company recognizes the fair value of theAs a result, there have been no options over the
64
vesting period as expense. The Company recognized $34,000, $88,000, and $289,000 ingranted to Moneta option-related expenses during 2005, 2004 and 2003, respectively.since 2003. The fair value of each Moneta option grant to Moneta was estimated on the date of grant using the Black-Scholes option pricing model.
The Company granted 10,882 options that vested immediately to Moneta on December 24, 2003 upon the closing of the new agreement. The options were granted at $13.65 price per share, a fair value of $8.02, assuming a risk-free interest rate of 4.24%, a dividend yield of 0.60%, expected life of 10 years and volatility of 47.87%. The Company recognized $87,274 in expense for the fair value of the options granted on December 24, 2003.over the vesting period as expense. The Company granted 11,769 options on January 1, 2002 at $11.50 price per share, arecognized $17,000, $34,000, and $88,000 in Moneta option-related expenses during 2006, 2005 and 2004, respectively. As of December 31, 2006, the fair value of $7.34, assuming a risk free interest rate of 5.20%, a dividend yield of 0.60%, vesting period for 5 years, expected life of 8 years and volatility of 59.47%. The Company granted 11,081 options on January 1, 2001 at $10.33 price per share, a fair value of $7.77 per share, assuming a risk free interest rate of 5.20%, a dividend yield of 0.67%, vesting period for 5 years, expected life of 8 years and volatility of 39.79%. The weighted average fair value of the options granted to Moneta was $5.51. In 2005, 2,073all Moneta options were exercised with a weighted average price of $14.18. There werehad been recognized, therefore, there is no Moneta options forfeited in 2005 and 4,363 Moneta options were forfeited in 2004.unrecognized compensation cost.
(Dollars in thousands, except share data) |
| Shares |
| Weighted Average Exercise Price |
| Weighted Average Remaining Contractual Term |
| Aggregate Intrinsic Value |
| ||||
|
|
|
|
| |||||||||
Outstanding at January 1, 2006 |
|
| 188,904 |
| $ | 12.43 |
|
|
|
|
|
|
|
Granted |
|
| — |
|
| — |
|
|
|
|
|
|
|
Exercised |
|
| (23,081 | ) |
| 10.85 |
|
|
|
|
|
|
|
Forfeited |
|
| — |
|
| — |
|
|
|
|
|
|
|
|
|
|
|
|
| ||||||||
Outstanding at December 31, 2006 |
|
| 165,823 |
| $ | 12.66 |
|
| 2.8 years |
| $ | 3,303 |
|
|
|
|
|
|
| ||||||||
Exercisable at December 31, 2006 |
|
| 161,471 |
| $ | 13.02 |
|
| 2.9 years |
| $ | 3,158 |
|
|
|
|
|
|
| ||||||||
Vested and expected to vest at December 31, 2006 |
|
| 165,823 |
| $ | 12.66 |
|
| 2.8 years |
| $ | 3,303 |
|
|
|
|
|
|
| ||||||||
401(k) plans
Effective January 1, 1993, the Company adopted a 401(k) thrift plan which covers substantially all full-time employees of the Bank over the age of 21. In addition, substantially all employees of Millennium can elect to participate in a safe-harbor 401(k) plan. The amount charged to expense for the Company’s contributions, including Millennium, to the plans was $323,000, $843,000, and $476,000 for 2006, 2005, and $428,000 for 2005, 2004, and 2003, respectively.
NOTE 18—LITIGATION AND OTHER CLAIMS
Except as noted below, various legal claims have arisen during the normal course of business which, in the opinion of management, after discussion with legal counsel, will not result in any material liability.
In accordance with SFAS No. 5, Accounting for Contingencies, during 2003 the Company recognized $725,000 in expense related to a settlement of a dispute with another financial institution pursuant to an agreement signed in February of 2003. An additional $575,000 was paid on this settlement in 2004.
NOTE 19—DISCLOSURES ABOUT FINANCIAL INSTRUMENTS
The Bank issues financial instruments with off balance sheet risk in the normal course of the business of meeting the financing needs of its customers. These financial instruments include commitments to extend credit and standby letters of credit. These instruments may involve, to varying degrees, elements of credit and interest-rate risk in excess of the amounts recognized in the consolidated balance sheets.
The Company’s extent of involvement and maximum potential exposure to credit loss in the event of nonperformance by the other party to the financial instrument for commitments to extend credit and standby letters of credit is represented by the contractual amount of these instruments. The Bank uses the same credit policies in making commitments and conditional obligations as it does for financial instruments included on its consolidated balance sheets. At December 31, 2005,2006, no amounts have been accrued for any estimated losses for these financial instruments.
66
The contractual amount of off-balance-sheet financial instruments as of December 31, 20052006 and 20042005 is as follows:
|
| December 31, |
| |||||||||||
|
|
| ||||||||||||
(in thousands) |
| 2005 |
| 2004 |
|
| December 31, |
| December 31, |
| ||||
|
|
|
|
|
| |||||||||
Commitments to extend credit |
| $ | 346,205 |
| $ | 296,561 |
|
| $ | 480,071 |
| $ | 346,205 |
|
Standby letters of credit |
|
| 28,013 |
| 20,263 |
|
|
| 39,587 |
| 28,013 |
| ||
Private equity bank fund |
|
| 250 |
| — |
| ||||||||
Commitments to extend credit are agreements to lend to a customer as long as there is no violation of any condition established in the contract. Commitments usually have fixed expiration dates or other termination clauses and may require payment of a fee. Of the total commitments to extend credit at December 31, 2006 and 2005, approximately $35,900,000 and 2004, approximately $10.5 million and $6.4 million,$10,500,000, respectively, represents fixed rate loan commitments. Since certain of the commitments may expire without being drawn upon, the total commitment amounts do not necessarily represent future cash requirements. The Bank evaluates each customer’s credit worthiness on a case-by-case basis. The amount of collateral obtained, if deemed necessary by the Bank upon extension of credit, is based on management’s credit evaluation of the borrower. Collateral held varies, but may include accounts receivable, inventory, premises and equipment, and real estate.
65
Standby letters of credit are conditional commitments issued by the Bank to guarantee the performance of a customer to a third party. These standby letters of credit are issued to support contractual obligations of the Bank’s customers. The credit risk involved in issuing letters of credit is essentially the same as the risk involved in extending loans to customers. The approximate remaining term of standby letters of credit range from 1 month to 5 years at December 31, 2005.2006.
In 2006, the Company entered into a commitment to invest in a private equity bank fund. The commitment will be drawn down in the next 18 months.
SFAS 107, Disclosures about Fair Value of Financial Instruments, extends existing fair value disclosure for some financial instruments by requiring disclosure of the fair value of such financial instruments, both assets and liabilities recognized and not recognized in the consolidated balance sheets.
Following is a summary of the carrying amounts and fair values of the Company’s financial instruments on the consolidated balance sheets at December 31, 20052006 and 2004:2005:
|
| 2005 |
| 2004 |
|
| 2006 |
| 2005 |
| ||||||||||||||||
|
|
|
|
|
|
| ||||||||||||||||||||
(in thousands) |
| Carrying |
| Estimated |
| Carrying |
| Estimated |
|
| Carrying |
| Estimated |
| Carrying |
| Estimated |
| ||||||||
|
|
|
|
|
|
|
|
|
| |||||||||||||||||
Balance sheet assets |
|
|
|
|
|
|
|
|
|
|
|
|
|
|
|
|
|
|
| |||||||
Cash and due from banks |
| $ | 54,118 |
| $ | 54,118 |
| $ | 28,324 |
| $ | 28,324 |
|
| $ | 41,588 |
| $ | 41,588 |
| $ | 54,118 |
| $ | 54,118 |
|
Federal Funds Sold |
| 64,709 |
| 64,709 |
| — |
| — |
|
| 7,066 |
| 7,066 |
| 64,709 |
| 64,709 |
| ||||||||
Interest-bearing deposits |
| 84 |
| 84 |
| 156 |
| 156 |
|
| 1,669 |
| 1,669 |
| 84 |
| 84 |
| ||||||||
Investments in debt and equity securities |
| 135,559 |
| 135,559 |
| 121,638 |
| 121,639 |
|
| 111,210 |
| 111,210 |
| 135,559 |
| 135,559 |
| ||||||||
Loans held for sale |
| 2,761 |
| 2,761 |
| 2,376 |
| 2,376 |
|
| 2,602 |
| 2,602 |
| 2,761 |
| 2,761 |
| ||||||||
Derivative financial instruments |
| (736 | ) |
| (736 | ) |
| (927 | ) |
| (927 | ) |
| (154 | ) |
| (154 | ) |
| (736 | ) |
| (736 | ) | ||
Loans, net |
| 989,389 |
| 988,645 |
| 886,840 |
| 886,250 |
|
| 1,311,723 |
| 1,308,638 |
| 989,389 |
| 988,645 |
| ||||||||
Accrued interest receivable |
| 5,598 |
| 5,598 |
| 4,238 |
| 4,238 |
|
| 7,995 |
| 7,995 |
| 5,598 |
| 5,598 |
| ||||||||
Balance sheet liabilities |
|
|
|
|
|
|
|
|
|
|
|
|
|
|
|
|
|
|
| |||||||
Deposits |
| 1,116,244 |
| 1,116,593 |
| 939,628 |
| 939,930 |
|
| 1,315,508 |
| 1,315,508 |
| 1,116,244 |
| 1,116,593 |
| ||||||||
Subordinated debentures |
| 30,930 |
| 31,061 |
| 20,620 |
| 20,620 |
|
| 35,054 |
| 35,152 |
| 30,930 |
| 31,061 |
| ||||||||
Other borrowed funds |
| 36,931 |
| 37,195 |
| 20,165 |
| 21,694 |
|
| 40,752 |
| 40,991 |
| 36,931 |
| 37,195 |
| ||||||||
Accrued interest payable |
| 2,704 |
| 2,704 |
| 1,665 |
| 1,665 |
|
| 3,468 |
| 3,468 |
| 2,704 |
| 2,704 |
| ||||||||
67
The following methods and assumptions were used to estimate the fair value of each class of financial instruments for which it is practical to estimate such value:
Cash, Fed Funds Sold, and Other Short-term Instruments
For cash and due from banks, federal funds purchased, interest-bearing deposits, and accrued interest receivable (payable), the carrying amount is a reasonable estimate of fair value, as such instruments repricereprise in a short time period.
Investments in Debt and Equity Securities
Fair values are based on quoted market prices or dealer quotes.
Loans, net
Loans, net
The fair value of adjustable-rate loans approximates cost. The fair value of fixed-rate loans is estimated by discounting the future cash flows using the current rates at which similar loans would be made to borrowers for the same remaining maturities.
Derivative Financial Instruments
The fair value of derivative financial instruments is based on quoted market prices by the counterparty and verified by the Company using public pricing information.
Deposits
Deposits
The fair value of demand deposits, interest-bearing transaction accounts, and money market accounts and savings deposits is the amount payable on demand at the reporting date. The fair value of fixed-maturity certificates of deposit is estimated by discounting the future cash flows using the rates currently offered for deposits of similar remaining maturities.
Subordinated Debentures
66
Subordinated Debentures
Fair value of floating interest rate subordinated debentures is assumed to equal carrying value. Fair value of fixed interest rate subordinated debentures is based on market prices.
Other Borrowed Funds
Other borrowed funds include Federal Home Loan BankFHLB advances, customer repurchase agreements, federal funds purchased, and notes payable. The fair value of Federal Home Loan BankFHLB advances is based on the discounted value of contractual cash flows. The discount rate is estimated using current rates on borrowed money with similar remaining maturities. The fair value of federal funds purchased, customer repurchase agreements and notes payable are assumed to be equal to their carrying amount since they have an adjustable interest rate.
Commitments to Extend Credit and Standby Letters of Credit
The fair value of commitments to extend credit and standby letters of credit are estimated using the fees currently charged to enter into similar agreements, taking into account the remaining terms of the agreements, the likelihood of the counterparties drawing on such financial instruments, and the present creditworthiness of such counterparties. The Company believes such commitments have been made on terms which are competitive in the markets in which it operates; however, no premium or discount is offered thereon and accordingly, the Company has not assigned a value to such instruments for purposes of this disclosure.
Limitations
Limitations
Fair value estimates are made at a specific point in time, based on relevant market information and information about the financial instrument. These estimates do not reflect any premium or discount that could result from offering for sale at one time the Company’s entire holdings of a particular financial instrument. Because no market exists for a significant portion of the Company’s financial instruments, fair value estimates are based on judgments regarding future expected loss experience, current economic conditions, risk characteristics of various financial instruments, and other factors. These estimates are subjective in nature and involve uncertainties and matters of significant judgment, and therefore, cannot be determined with precision. Changes in assumptions could significantly affect the estimates. Fair value estimates are based on existing on-balance and off-balance-sheet financial instruments without attempting to estimate the value of anticipated future business and the value of assets and liabilities that are not considered financial instruments. In addition, the tax ramifications related to the realization of the unrealized gains and losses can have a significant effect on fair value estimates and have not been considered in many of the estimates.
68
NOTE 20—19—SEGMENT REPORTING
Management segregates the Company into three distinct businesses for evaluation purposes. The three segments are Banking, Wealth Management, and Corporate and Intercompany.Inter Company. The segments are evaluated separately on their individual performance, as well as, their contribution to the Company as a whole.
The majority of the Company’s assets and income result from the Banking segment. The Bank is a full-service commercial bank with four St. Louis locations and twosix locations in the Kansas City region.
The Wealth Management segment includes the Trust division of the Bank along with Millennium. The Trust division of the Bank provides estate planning, investment management, and retirement planning as well as, consulting on management compensation, strategic planning and management succession issues. Millennium operates life insurance advisory and brokerage operations from thirteen offices serving life agents, banks, CPA firms, property & casualty groups, and financial advisors in 49 states.
The Corporate and IntercompanyInter company segment includes the holding company and subordinated debentures. The Company incurs general corporate expenses and owns Enterprise Bank & Trust and a controlling ownership of Millennium.
The financial information for each business segment reflects that information which is specifically identifiable or which is allocated based on an internal allocation method.
6769
Following are the financial results for the Company’s operating segments.
|
| Years ended December 31, |
| ||||||||||
|
|
| |||||||||||
(in thousands) |
| Banking |
| Wealth |
| Corporate and |
| Total |
| ||||
|
|
|
|
| |||||||||
Net interest income |
| $ | 45,804 |
| $ | 73 |
| $ | (1,310 | ) | $ | 44,567 |
|
Provision for loan losses |
|
| 1,490 |
|
| — |
|
| — |
|
| 1,490 |
|
Noninterest income |
|
| 2,374 |
|
| 6,522 |
|
| 68 |
|
| 8,964 |
|
Noninterest expense |
|
| 25,242 |
|
| 5,644 |
|
| 3,548 |
|
| 34,434 |
|
|
|
|
|
|
| ||||||||
Income (loss) before income tax expense |
|
| 21,446 |
|
| 951 |
|
| (4,790 | ) |
| 17,607 |
|
Income tax expense (benefit) |
|
| 7,708 |
|
| 342 |
|
| (1,738 | ) |
| 6,312 |
|
|
|
|
|
|
| ||||||||
Net income (loss) |
| $ | 13,738 |
| $ | 609 |
| $ | (3,052 | ) | $ | 11,295 |
|
|
|
|
|
|
| ||||||||
Loans, less unearned loan fees |
| $ | 1,002,379 |
| $ | — |
| $ | — |
| $ | 1,002,379 |
|
Goodwill |
|
| 1,938 |
|
| 10,104 |
|
| — |
|
| 12,042 |
|
Deposits |
|
| 1,117,110 |
|
| — |
|
| (866 | ) |
| 1,116,244 |
|
Borrowings |
|
| 35,431 |
|
| — |
|
| 32,430 |
|
| 67,861 |
|
Total assets |
|
| 1,269,212 |
|
| 16,253 |
|
| 1,502 |
|
| 1,286,968 |
|
|
| 2004 |
| ||||||||||
|
|
| |||||||||||
|
| Banking |
| Wealth |
| Corporate and |
| Total |
| ||||
|
|
|
|
|
| ||||||||
Net interest income |
| $ | 38,011 |
| $ | 80 |
| $ | (1,366 | ) | $ | 36,725 |
|
Provision for loan losses |
|
| 2,212 |
|
| — |
|
| — |
|
| 2,212 |
|
Noninterest income |
|
| 2,812 |
|
| 4,264 |
|
| 46 |
|
| 7,122 |
|
Noninterest expense |
|
| 22,061 |
|
| 3,684 |
|
| 3,586 |
|
| 29,331 |
|
|
|
|
|
|
| ||||||||
Income (loss) before income tax expense |
|
| 16,550 |
|
| 660 |
|
| (4,906 | ) |
| 12,304 |
|
Income tax expense (benefit) |
|
| 5,862 |
|
| 260 |
|
| (2,033 | ) |
| 4,089 |
|
|
|
|
|
|
| ||||||||
Net income (loss) |
| $ | 10,688 |
| $ | 400 |
| $ | (2,873 | ) | $ | 8,215 |
|
|
|
|
|
|
| ||||||||
Loans, less unearned loan fees |
| $ | 898,505 |
| $ | — |
| $ | — |
| $ | 898,505 |
|
Goodwill |
|
| 1,938 |
|
| — |
|
| — |
|
| 1,938 |
|
Deposits |
|
| 939,784 |
|
| — |
|
| (156 | ) |
| 939,628 |
|
Borrowings |
|
| 19,914 |
|
| — |
|
| 20,870 |
|
| 40,784 |
|
Total assets |
|
| 1,058,539 |
|
| 414 |
|
| 997 |
|
| 1,059,950 |
|
|
| 2003 |
|
| Years ended December 31, 2006 |
| ||||||||||||||||||||
|
|
|
|
| ||||||||||||||||||||||
|
| Banking |
| Wealth |
| Corporate and |
| Total |
| |||||||||||||||||
(in thousands) |
| Banking |
| Wealth |
| Corporate and |
| Total |
| |||||||||||||||||
|
|
|
|
|
|
|
|
|
|
| ||||||||||||||||
Net interest income |
| $ | 33,837 |
| $ | 95 |
| $ | (1,231 | ) | $ | 32,701 |
|
| $ | 53,639 |
| $ | 105 |
| $ | (2,467 | ) | $ | 51,277 |
|
Provision for loan losses |
|
| 3,627 |
| — |
| — |
| 3,627 |
|
|
| 2,127 |
| — |
| — |
| 2,127 |
| ||||||
Noninterest income |
|
| 6,483 |
| 3,622 |
| (14 | ) |
| 10,091 |
|
|
| 3,056 |
| 13,809 |
| 51 |
| 16,916 |
| |||||
Noninterest expense |
|
| 21,864 |
| 3,757 |
| 2,594 |
| 28,215 |
| ||||||||||||||||
Non interest expense |
|
| 28,563 |
| 9,207 |
| 3,624 |
| 41,394 |
| ||||||||||||||||
Minority interest |
|
| — |
| (875 | ) |
| — |
| (875 | ) | |||||||||||||||
|
|
|
|
|
|
|
|
|
|
| ||||||||||||||||
Income (loss) before income tax expense |
|
| 14,829 |
| (40 | ) |
| (3,839 | ) |
| 10,950 |
|
|
| 26,005 |
| 3,832 |
| (6,040 | ) |
| 23,797 |
| |||
Income tax expense (benefit) |
|
| 5,455 |
| (15 | ) |
| (1,416 | ) |
| 4,025 |
|
|
| 9,119 |
| 1,379 |
| (2,173 | ) |
| 8,325 |
| |||
|
|
|
|
|
|
|
|
|
|
| ||||||||||||||||
Net income (loss) |
| $ | 9,374 |
| $ | (25 | ) | $ | (2,423 | ) | $ | 6,925 |
|
| $ | 16,886 |
| $ | 2,453 |
| $ | (3,867 | ) | $ | 15,472 |
|
|
|
|
|
|
|
|
|
|
|
| ||||||||||||||||
Loans, less unearned loan fees |
| $ | 783,878 |
| $ | — |
| $ | — |
| $ | 783,878 |
|
| $ | 1,311,723 |
| $ | — |
| $ | — |
| $ | 1,311,723 |
|
Goodwill |
|
| 1,938 |
| — |
| — |
| 1,938 |
|
|
| 19,690 |
| 10,293 |
| — |
| 29,983 |
| ||||||
Intangibles, net |
|
| 2,153 |
| 3,636 |
| — |
| 5,789 |
| ||||||||||||||||
Deposits |
|
| 797,722 |
| — |
| (1,322 | ) |
| 796,400 |
|
|
| 1,319,201 |
| — |
| (3,693 | ) |
| 1,315,508 |
| ||||
Borrowings |
|
| 24,147 |
| — |
| 15,464 |
| 39,611 |
|
|
| 36,752 |
| — |
| 39,054 |
| 75,806 |
| ||||||
Total assets |
|
| 905,007 |
| 428 |
| 2,292 |
| 907,726 |
|
|
| 1,517,617 |
| 16,991 |
| 979 |
| 1,535,587 |
| ||||||
|
|
|
| |||||||||||||||||||||||
|
| 2005 |
| |||||||||||||||||||||||
|
|
| ||||||||||||||||||||||||
|
| Banking |
| Wealth |
| Corporate and |
| Total |
| |||||||||||||||||
|
|
|
|
|
| |||||||||||||||||||||
Net interest income |
| $ | 45,804 |
| $ | 73 |
| $ | (1,310 | ) | $ | 44,567 |
| |||||||||||||
Provision for loan losses |
|
| 1,490 |
| — |
| — |
| 1,490 |
| ||||||||||||||||
Noninterest income |
|
| 2,374 |
| 6,525 |
| 68 |
| 8,967 |
| ||||||||||||||||
Non interest expense |
|
| 25,242 |
| 5,534 |
| 3,548 |
| 34,324 |
| ||||||||||||||||
Minority interest |
|
| — |
| (113 | ) |
| — |
| (113 | ) | |||||||||||||||
|
|
|
|
|
| |||||||||||||||||||||
Income (loss) before income tax expense |
|
| 21,446 |
| 951 |
| (4,790 | ) |
| 17,607 |
| |||||||||||||||
Income tax expense (benefit) |
|
| 7,708 |
| 342 |
| (1,738 | ) |
| 6,312 |
| |||||||||||||||
|
|
|
|
|
| |||||||||||||||||||||
Net income (loss) |
| $ | 13,738 |
| $ | 609 |
| $ | (3,052 | ) | $ | 11,295 |
| |||||||||||||
|
|
|
|
|
| |||||||||||||||||||||
Loans, less unearned loan fees |
| $ | 1,002,379 |
| $ | — |
| $ | — |
| $ | 1,002,379 |
| |||||||||||||
Goodwill |
|
| 1,938 |
| 10,104 |
| — |
| 12,042 |
| ||||||||||||||||
Intangibles, net |
|
| — |
| 4,548 |
| — |
| 4,548 |
| ||||||||||||||||
Deposits |
|
| 1,117,110 |
| — |
| (866 | ) |
| 1,116,244 |
| |||||||||||||||
Borrowings |
|
| 35,431 |
| — |
| 32,430 |
| 67,861 |
| ||||||||||||||||
Total assets |
|
| 1,269,212 |
| 16,253 |
| 1,502 |
| 1,286,968 |
| ||||||||||||||||
|
|
| ||||||||||||||||||||||||
|
| 2004 |
| |||||||||||||||||||||||
|
|
| ||||||||||||||||||||||||
|
| Banking |
| Wealth |
| Corporate and |
| Total |
| |||||||||||||||||
|
|
|
|
|
| |||||||||||||||||||||
Net interest income |
| $ | 38,011 |
| $ | 80 |
| $ | (1,366 | ) | $ | 36,725 |
| |||||||||||||
Provision for loan losses |
|
| 2,212 |
| — |
| — |
| 2,212 |
| ||||||||||||||||
Noninterest income |
|
| 2,812 |
| 4,264 |
| 46 |
| 7,122 |
| ||||||||||||||||
Non interest expense |
|
| 22,061 |
| 3,684 |
| 3,586 |
| 29,331 |
| ||||||||||||||||
|
|
|
|
|
| |||||||||||||||||||||
Income (loss) before income tax expense |
|
| 16,550 |
| 660 |
| (4,906 | ) |
| 12,304 |
| |||||||||||||||
Income tax expense (benefit) |
|
| 5,862 |
| 260 |
| (2,033 | ) |
| 4,089 |
| |||||||||||||||
|
|
|
|
|
| |||||||||||||||||||||
Net income (loss) |
| $ | 10,688 |
| $ | 400 |
| $ | (2,873 | ) | $ | 8,215 |
| |||||||||||||
|
|
|
|
|
| |||||||||||||||||||||
Loans, less unearned loan fees |
| $ | 898,505 |
| $ | — |
| $ | — |
| $ | 898,505 |
| |||||||||||||
Goodwill |
|
| 1,938 |
| — |
| — |
| 1,938 |
| ||||||||||||||||
Intangibles, net |
|
| 135 |
| — |
| — |
| 135 |
| ||||||||||||||||
Deposits |
|
| 939,784 |
| — |
| (156 | ) |
| 939,628 |
| |||||||||||||||
Borrowings |
|
| 19,914 |
| — |
| 20,870 |
| 40,784 |
| ||||||||||||||||
Total assets |
|
| 1,058,539 |
| 414 |
| 997 |
| 1,059,950 |
| ||||||||||||||||
6870
NOTE 21—20—PARENT COMPANY ONLY CONDENSED FINANCIAL STATEMENTS
Condensed Balance Sheets
|
| December 31, |
|
| December 31, |
| ||||||||
|
|
|
|
| ||||||||||
(in thousands) |
| 2005 |
| 2004 |
|
| 2006 |
| 2005 |
| ||||
|
|
|
|
|
| |||||||||
Assets |
|
|
|
|
|
|
|
|
|
|
|
| ||
Cash |
| $ | 866 |
| 143 |
|
| $ | 1,824 |
| $ | 866 |
| |
Investment in Enterprise Bank & Trust |
|
| 103,322 |
| 89,355 |
|
|
| 146,985 |
| 103,322 |
| ||
Investment in Millennium Holding Company |
|
| 15,462 |
| — |
|
|
| 16,385 |
| 15,462 |
| ||
Other assets |
|
| 6,022 |
| 4,433 |
|
|
| 7,497 |
| 6,022 |
| ||
|
|
|
|
|
|
| ||||||||
Total assets |
| $ | 125,672 |
| $ | 93,931 |
|
| $ | 172,691 |
| $ | 125,672 |
|
|
|
|
|
|
|
| ||||||||
Liabilities and Shareholders’ Equity |
|
|
|
|
|
|
|
|
|
|
|
| ||
Subordinated debentures |
| $ | 30,930 |
| 20,620 |
|
| $ | 35,054 |
| $ | 30,930 |
| |
Accounts payable and other liabilities |
|
| 2,137 |
| 585 |
|
|
| 4,643 |
| 2,137 |
| ||
Shareholders’ equity |
|
| 92,605 |
| 72,726 |
|
|
| 132,994 |
| 92,605 |
| ||
|
|
|
|
|
|
| ||||||||
Total liabilities and shareholders’ equity |
| $ | 125,672 |
| $ | 93,931 |
|
| $ | 172,691 |
| $ | 125,672 |
|
|
|
|
|
|
|
| ||||||||
Condensed Statements of Income
|
| Years ended December 31 |
|
| Years ended December 31, |
| ||||||||||||||
|
|
|
|
| ||||||||||||||||
(in thousands) |
| 2005 |
| 2004 |
| 2003 |
|
| 2006 |
| 2005 |
| 2004 |
| ||||||
|
|
|
|
|
|
|
| |||||||||||||
Income: |
|
|
|
|
|
|
|
|
|
|
|
|
|
|
|
| ||||
Dividends from subsidiaries |
| $ | — |
| $ | — |
| $ | 2,000 |
|
| $ | 9,669 |
| $ | — |
| $ | — |
|
Other |
| 107 |
| 88 |
| 25 |
|
| 133 |
| 107 |
| 88 |
| ||||||
|
|
|
|
|
|
|
|
| ||||||||||||
Total income |
|
| 107 |
| 88 |
| 2,025 |
|
|
| 9,802 |
| 107 |
| 88 |
| ||||
|
|
|
|
|
|
|
|
| ||||||||||||
Expenses: |
|
|
|
|
|
|
|
|
|
|
|
|
|
|
|
| ||||
Interest expense-subordinated debentures |
| 1,348 |
| 1,405 |
| 1,270 |
|
| 2,343 |
| 1,348 |
| 1,405 |
| ||||||
Interest expense-notes payable |
| 1 |
| 2 |
| — |
|
| 207 |
| 1 |
| 2 |
| ||||||
Other expenses |
| 3,548 |
| 3,586 |
| 2,594 |
|
| 3,623 |
| 3,548 |
| 3,586 |
| ||||||
|
|
|
|
|
|
|
|
| ||||||||||||
Total expenses |
|
| 4,897 |
| 4,993 |
| 3,864 |
|
|
| 6,173 |
| 4,897 |
| 4,993 |
| ||||
|
|
|
|
|
|
|
|
| ||||||||||||
Net loss before taxes and equity in undistributed earnings of subsidiaries |
|
| (4,790 | ) |
| (4,905 | ) |
| (1,839 | ) | ||||||||||
Net income (loss) before taxes and equity in undistributed earnings of subsidiaries |
|
| 3,629 |
| (4,790 | ) |
| (4,905 | ) | |||||||||||
Income tax benefit |
|
| 1,738 |
| 2,033 |
| 1,415 |
|
|
| 2,173 |
| 1,738 |
| 2,033 |
| ||||
|
|
|
|
|
|
|
|
| ||||||||||||
Net loss before equity in undistributed earnings of subsidiaries |
|
| (3,052 | ) |
| (2,872 | ) |
| (424 | ) | ||||||||||
Net income (loss) before equity in undistributed earnings of subsidiaries |
|
| 5,802 |
| (3,052 | ) |
| (2,872 | ) | |||||||||||
|
|
|
|
|
|
|
|
| ||||||||||||
Equity in undistributed earnings of subsidiaries |
|
| 14,347 |
| 11,087 |
| 7,349 |
|
|
| 9,670 |
| 14,347 |
| 11,087 |
| ||||
|
|
|
|
|
|
|
|
| ||||||||||||
Net income |
| $ | 11,295 |
| $ | 8,215 |
| $ | 6,925 |
|
| $ | 15,472 |
| $ | 11,295 |
| $ | 8,215 |
|
|
|
|
|
|
|
|
|
| ||||||||||||
6971
Condensed Statements of Cash Flow
|
| Years Ended December 31, |
|
| Years Ended December 31, |
| ||||||||||||||
|
|
|
|
| ||||||||||||||||
(in thousands) |
| 2005 |
| 2004 |
| 2003 |
|
| 2006 |
| 2005 |
| 2004 |
| ||||||
|
|
|
|
|
|
|
| |||||||||||||
Cash flows from operating activities: |
|
|
|
|
|
|
|
|
|
|
|
|
|
|
|
| ||||
Net income |
| $ | 11,295 |
| $ | 8,215 |
| $ | 6,925 |
|
| $ | 15,472 |
| $ | 11,295 |
| $ | 8,215 |
|
Adjustments to reconcile net income to net cash provided by operating activities: |
|
|
|
|
|
|
|
|
|
|
|
|
|
| ||||||
Decrease in settlement accrual of disputed note |
| — |
| (575 | ) |
| (725 | ) |
| — |
| — |
| (575 | ) | |||||
Noncash compensation expense attributed to stock option grants |
| 649 |
| 234 |
| 289 |
| |||||||||||||
Stock based compensation |
| 784 |
| 649 |
| 234 |
| |||||||||||||
Net income of subsidiaries |
| (14,347 | ) |
| (11,087 | ) |
| (9,349 | ) |
| (19,339 | ) |
| (14,347 | ) |
| (11,087 | ) | ||
Dividends from subsidiaries |
| — |
| — |
| 2,000 |
|
| 9,669 |
| — |
| — |
| ||||||
Tax benefit for nonqualified stock options |
| 831 |
| 11 |
| — |
| |||||||||||||
Excess tax benefits of stock compensation |
| (525 | ) |
| 831 |
| 11 |
| ||||||||||||
Other, net |
| (2,601 | ) |
| (640 | ) |
| 1,007 |
|
| 10 |
| (2,601 | ) |
| (640 | ) | |||
|
|
|
|
|
|
|
|
| ||||||||||||
Net cash (used in) provided by operating activities |
|
| (4,173 | ) |
| (3,842 | ) |
| 147 |
| ||||||||||
Net cash provided by (used in) operating activities |
|
| 6,071 |
| (4,173 | ) |
| (3,842 | ) | |||||||||||
Cash flows from investing activities: |
|
|
|
|
|
|
|
|
|
|
|
|
|
|
|
| ||||
Cash paid in acquisition, net of cash acquired |
| (8,882 | ) |
| — |
| — |
| ||||||||||||
Cash paid for acquisition, net of cash acquired |
| (8,060 | ) |
| (8,882 | ) |
| — |
| |||||||||||
Purchases of available for sale debt and equity securities |
| (538 | ) |
| — |
| — |
| ||||||||||||
Capital contributions to subsidiaries |
| — |
| (3,000 | ) |
| — |
|
| — |
| — |
| (3,000 | ) | |||||
|
|
|
|
|
|
|
|
| ||||||||||||
Net cash used in investing activities |
|
| (8,882 | ) |
| (3,000 | ) |
| — |
|
|
| (8,598 | ) |
| (8,882 | ) |
| (3,000 | ) |
Cash flows from financing activities: |
|
|
|
|
|
|
|
|
|
|
|
|
|
|
|
| ||||
Proceeds from notes payable |
| 1,500 |
| 350 |
| 100 |
|
| 10,000 |
| 1,500 |
| 350 |
| ||||||
Paydowns of notes payable |
| (250 | ) |
| (100 | ) |
| (100 | ) |
| (10,745 | ) |
| (250 | ) |
| (100 | ) | ||
Proceeds from issuance of subordinated debentures |
| 10,310 |
| 16,496 |
| — |
|
| 4,124 |
| 10,310 |
| 16,496 |
| ||||||
Paydown of subordinated debentures |
| — |
| (11,340 | ) |
| — |
|
| — |
| — |
| (11,340 | ) | |||||
Cash dividends paid |
| (1,420 | ) |
| (971 | ) |
| (767 | ) |
| (1,977 | ) |
| (1,420 | ) |
| (971 | ) | ||
Excess tax benefits of stock compensation |
| 525 |
| — |
| — |
| |||||||||||||
Proceeds from the issuance of common stock |
| 86 |
| — |
| — |
| |||||||||||||
Proceeds from the exercise of common stock options |
| 3,638 |
| 1,241 |
| 1,115 |
|
| 1,472 |
| 3,638 |
| 1,241 |
| ||||||
|
|
|
|
|
|
|
|
| ||||||||||||
Net cash provided by financing activities |
|
| 13,778 |
| 5,676 |
| 348 |
|
|
| 3,485 |
| 13,778 |
| 5,676 |
| ||||
|
|
|
|
|
|
|
|
| ||||||||||||
Net increase (decrease) in cash and cash equivalents |
|
| 723 |
| (1,166 | ) |
| 495 |
|
|
| 958 |
| 723 |
| (1,166 | ) | |||
Cash and cash equivalents, beginning of year |
|
| 143 |
| 1,309 |
| 814 |
|
|
| 866 |
| 143 |
| 1,309 |
| ||||
|
|
|
|
|
|
|
|
| ||||||||||||
Cash and cash equivalents, end of year |
| $ | 866 |
| $ | 143 |
| $ | 1,309 |
|
| $ | 1,824 |
| $ | 866 |
| $ | 143 |
|
|
|
|
|
|
|
|
|
| ||||||||||||
Noncash transactions: |
|
|
|
|
|
|
|
|
|
|
|
|
|
|
|
| ||||
Stock issued for acquisition of business |
| 5,249 |
| — |
| — |
| |||||||||||||
Common stock issued for acquisition of business |
| 23,482 |
| 5,249 |
| — |
| |||||||||||||
7072
NOTE 22—21—QUARTERLY CONDENSED FINANCIAL INFORMATION (Unaudited)
The following table presents the unaudited quarterly financial information for the years ended December 31, 20052006 and 2004.2005.
|
| 2005 |
|
| 2006 |
| ||||||||||||||||||||
|
|
|
|
| ||||||||||||||||||||||
(in thousands, except per share data) |
| 4th |
| 3rd |
| 2nd |
| 1st |
|
| 4th |
| 3rd |
| 2nd |
| 1st |
| ||||||||
|
|
|
|
|
|
|
|
|
| |||||||||||||||||
Interest income |
| $ | 19,611 |
| $ | 17,611 |
| $ | 16,232 |
| $ | 14,654 |
|
| $ | 26,966 |
| $ | 26,364 |
| $ | 21,659 |
| $ | 19,429 |
|
Interest expense |
|
| 7,728 |
| 6,452 |
| 5,230 |
| 4,131 |
|
|
| 12,927 |
| 12,525 |
| 9,517 |
| 8,172 |
| ||||||
|
|
|
|
|
|
|
|
|
|
| ||||||||||||||||
Net interest income |
| 11,883 |
| 11,159 |
| 11,002 |
| 10,523 |
|
| 14,039 |
| 13,839 |
| 12,142 |
| 11,257 |
| ||||||||
Provision for loan losses |
|
| 70 |
| 408 |
| 226 |
| 786 |
|
|
| 350 |
| 240 |
| 737 |
| 800 |
| ||||||
|
|
|
|
|
|
|
|
|
|
| ||||||||||||||||
Net interest income after provision for loan losses |
| 11,813 |
| 10,751 |
| 10,776 |
| 9,737 |
|
| 13,689 |
| 13,599 |
| 11,405 |
| 10,457 |
| ||||||||
Noninterest income |
|
| 2,627 |
| 2,277 |
| 2,225 |
| 1,835 |
|
|
| 4,662 |
| 4,325 |
| 3,952 |
| 3,977 |
| ||||||
Noninterest expense |
|
| 9,909 |
| 8,525 |
| 8,171 |
| 7,716 |
|
|
| 11,828 |
| 10,952 |
| 9,320 |
| 9,294 |
| ||||||
|
|
|
|
|
|
|
|
|
|
| ||||||||||||||||
Minority interest in net income of consolidated subsidiary |
|
| (113 | ) |
| — |
| — |
| — |
|
|
| (48 | ) |
| (434 | ) |
| 60 |
| (453 | ) | |||
Income before income tax expense |
| 4,418 |
| 4,503 |
| 4,830 |
| 3,856 |
|
| 6,475 |
| 6,538 |
| 6,097 |
| 4,687 |
| ||||||||
Income tax expense |
|
| 1,589 |
| 1,625 |
| 1,689 |
| 1,409 |
|
|
| 2,084 |
| 2,356 |
| 2,196 |
| 1,689 |
| ||||||
|
|
|
|
|
|
|
|
|
|
| ||||||||||||||||
Net income |
| $ | 2,829 |
| $ | 2,878 |
| $ | 3,141 |
| $ | 2,447 |
|
| $ | 4,391 |
| $ | 4,182 |
| $ | 3,901 |
| $ | 2,998 |
|
|
|
|
|
|
|
|
|
|
|
| ||||||||||||||||
Earnings per common share |
|
|
|
|
|
|
|
|
|
|
|
|
|
|
|
|
|
|
|
| ||||||
Basic |
| $ | 0.27 |
| $ | 0.29 |
| $ | 0.31 |
| $ | 0.25 |
|
| $ | 0.38 |
| $ | 0.37 |
| $ | 0.37 |
| $ | 0.29 |
|
Diluted |
| 0.26 |
| 0.27 |
| 0.29 |
| 0.23 |
|
| 0.37 |
| 0.35 |
| 0.36 |
| 0.28 |
| ||||||||
|
|
|
|
| ||||||||||||||||||||||
|
| 2004 |
|
| 2005 |
| ||||||||||||||||||||
|
|
|
|
| ||||||||||||||||||||||
(in thousands, except per share data) |
| 4th |
| 3rd |
| 2nd |
| 1st |
|
| 4th Quarter |
| 3rd Quarter |
| 2nd Quarter |
| 1st Quarter |
| ||||||||
|
|
|
|
|
|
|
|
|
| |||||||||||||||||
Interest income |
| $ | 13,698 |
| $ | 12,550 |
| $ | 11,701 |
| $ | 10,944 |
|
| $ | 19,611 |
| $ | 17,611 |
| $ | 16,232 |
| $ | 14,654 |
|
Interest expense |
|
| 3,681 |
| 3,156 |
| 2,778 |
| 2,554 |
|
|
| 7,728 |
| 6,452 |
| 5,230 |
| 4,131 |
| ||||||
|
|
|
|
|
|
|
|
|
|
| ||||||||||||||||
Net interest income |
| 10,017 |
| 9,394 |
| 8,923 |
| 8,390 |
|
| 11,883 |
| 11,159 |
| 11,002 |
| 10,523 |
| ||||||||
Provision for loan losses |
|
| 775 |
| 100 |
| 740 |
| 597 |
|
|
| 70 |
| 408 |
| 226 |
| 786 |
| ||||||
|
|
|
|
|
|
|
|
|
|
| ||||||||||||||||
Net interest income after provision for loan losses |
| 9,242 |
| 9,294 |
| 8,183 |
| 7,793 |
|
| 11,813 |
| 10,751 |
| 10,776 |
| 9,737 |
| ||||||||
Noninterest income |
|
| 1,948 |
| 1,877 |
| 1,818 |
| 1,479 |
|
|
| 2,627 |
| 2,277 |
| 2,225 |
| 1,835 |
| ||||||
Noninterest expense |
|
| 8,277 |
| 7,056 |
| 7,128 |
| 6,870 |
|
|
| 9,909 |
| 8,525 |
| 8,171 |
| 7,716 |
| ||||||
|
|
|
|
|
|
|
|
|
|
| ||||||||||||||||
Minority interest in net income of consolidated subsidiary |
|
| (113 | ) |
| — |
| — |
| — |
| |||||||||||||||
Income before income tax expense |
| 2,913 |
| 4,115 |
| 2,873 |
| 2,402 |
|
| 4,418 |
| 4,503 |
| 4,830 |
| 3,856 |
| ||||||||
Income tax expense |
|
| 1,066 |
| 1,261 |
| 886 |
| 875 |
|
|
| 1,589 |
| 1,625 |
| 1,689 |
| 1,409 |
| ||||||
|
|
|
|
|
|
|
|
|
|
| ||||||||||||||||
Net income |
| $ | 1,847 |
| $ | 2,854 |
| $ | 1,987 |
| $ | 1,527 |
|
| $ | 2,829 |
| $ | 2,878 |
| $ | 3,141 |
| $ | 2,447 |
|
|
|
|
|
|
|
|
|
|
|
| ||||||||||||||||
Earnings per common share |
|
|
|
|
|
|
|
|
|
|
|
|
|
|
|
|
|
|
|
| ||||||
Basic |
| $ | 0.19 |
| $ | 0.29 |
| $ | 0.21 |
| $ | 0.16 |
|
| $ | 0.27 |
| $ | 0.29 |
| $ | 0.31 |
| $ | 0.25 |
|
Diluted |
| 0.18 |
| 0.28 |
| 0.20 |
| 0.15 |
|
| 0.26 |
| 0.27 |
| 0.29 |
| 0.23 |
| ||||||||
7173
Pursuant to the requirements of Section 13 or 15d15(d) of the Securities Act of 1934, the undersigned Registrant has duly caused this report to be signed on its behalf by the undersigned, thereunto duly authorized, in the City of Clayton, State of Missouri, on the 714th of March, 2006.2007.
ENTERPRISE FINANCIAL SERVICES CORP | ||
|
| |
|
|
|
/s/ Kevin C. Eichner |
| /s/ Frank H. Sanfilippo |
| ||
Kevin C. Eichner |
| Frank H. Sanfilippo |
Chief Executive Officer |
| Chief Financial Officer |
Pursuant to the requirements of the Securities Act of 1934, this Report on Form 10-K has been signed by the following persons in the capacities indicated on the 714th of March, 2006.2007.
Signatures |
| Title |
| ||
/s/ Peter F. Benoist* |
| Chairman of the Board of Directors |
|
| |
Peter F. Benoist |
|
|
|
|
|
/s/ James J. |
| Lead Director |
|
| |
James J. Murphy, Jr. |
|
|
|
|
|
/s/ Kevin C. Eichner* |
| Chief Executive Officer, Vice Chairman and Director |
|
| |
Kevin C. Eichner |
|
|
|
|
|
/s/ Paul R. Cahn* |
| Director |
|
| |
Paul R. Cahn |
|
|
|
|
|
/s/ William H. Downey* |
| Director |
|
| |
William H. Downey |
|
|
|
|
|
/s/ Lewis A. Levey* |
| Director |
|
| |
Lewis A. Levey |
|
|
|
|
|
/s/ Robert E. Guest, Jr.* |
| Director |
|
| |
Robert E. Guest, Jr. |
|
|
|
|
|
/s/ Richard S. Masinton* |
| Director |
|
| |
Richard S. Masinton |
|
|
| ||
|
| |
|
|
|
/s/ Birch M. Mullins* |
| Director |
|
| |
Birch M. Mullins |
|
|
|
|
|
/s/ Robert E. Saur* |
| Director |
|
| |
Robert E. Saur |
|
|
|
|
|
/s/ Sandra Van Trease* |
| Director |
|
| |
Sandra Van Trease |
|
|
|
|
|
/s/ Henry D. Warshaw* |
| Director |
|
| |
Henry D. Warshaw |
|
|
* | Signed by Power of Attorney. |
7274
Exhibit |
| Exhibit |
| ||
3.1 |
| Certificate of Incorporation of the Registrant, |
|
|
|
3.2 |
| Amendment to the Certificates of Incorporation of the Registrant (incorporated herein by reference to Exhibit 4.2 to the Registrant’s Registration Statement on Form S-8 dated July 1, 1999 (File No. |
|
|
|
3.3 |
| Amendment to the Certificate of Incorporation of the Registrant (incorporated herein by reference to Exhibit 3.1 of the Registrant’s Quarterly Report on Form 10-Q for the period ending September 30, 1999). |
|
|
|
3.4 |
| Amendment to the Certificate of Incorporation of the Registrant (incorporated herein by reference to Exhibit 99.2 to the Registrant’s Current Report on Form 8-K filed on April 30, 2002). |
|
|
|
3.5 |
| Bylaws of the Registrant, as amended, (incorporated herein by reference to Exhibit 99.1 to the Registrant’s Current Report on Form 8-K filed on October 29, 2004). |
|
|
|
4.1 |
| Enterprise Bank Second Incentive Stock Option Plan (incorporated herein by reference to Exhibit 44.4 of the Registrant’s Registration Statement on Form S-8 dated December 29, 1997 (File No. |
|
|
|
4.2 |
| Enterprise Financial Services Corp Third Incentive Stock Option Plan (incorporated herein by reference to Exhibit 4.5 of the Registrant’s Registration Statement on Form S-8 dated December 29, 1997 (File No. 333-43365)). |
|
|
|
4.3 |
| Enterprise Financial Services Corp, Fourth Incentive Stock Option Plan (incorporated herein by reference to the Registrant’s 1998 Proxy Statement on Form 14-A). |
|
|
|
4.4 |
| Enterprise Financial Services Corp (formerly Commercial Guaranty Bancshares, Inc.) Employee Incentive Stock Option Plan (incorporated herein by reference to the Registrant’s Form S-8 dated |
|
|
|
4.5 |
| Enterprise Financial Services Corp (formerly Commercial Guaranty Bancshares, Inc.) Non-Employee Organizer and Director Incentive Stock Option Plan (incorporated herein by reference to the Registrant’s Form S-8 dated July 25, 2000 (File No. 333-42204)). |
|
|
|
4.6 |
| Enterprise Financial Services Corp Stock Appreciation Rights (SAR) Plan and Agreement (incorporated herein by reference to Exhibit 4.5 of the Registrant’s Quarterly Report on Form 10-Q for the period ended March 31, 1999). |
|
|
|
| Enterprise Financial Services Corp, Stock Plan for Non-Management Directors (incorporated herein by reference to the Registrant’s 2006 Proxy Statement on Form 14-A). | |
4.8 | Enterprise Financial Services Corp, 2002 Stock Incentive Plan, as amended (incorporated herein by reference to the Registrant’s 2006 Proxy Statement on Form 14-A). | |
4.9 | Enterprise Financial Services Corp, Annual Incentive Plan (incorporated herein by reference to the Registrant’s 2006 Proxy Statement on Form 14-A). | |
4.10.1 |
| Indenture dated June 27, 2002 between Registrant and Wells Fargo, National Association, relating to Floating Rate Junior Subordinated Deferrable Interest Debentures due June 30, 2032, (incorporated by reference to exhibit 4.9.1 to Registrant’s Quarterly Report on Form 10-Q for the period ended June 30, 2002). |
|
|
|
|
| Form of Floating Rate Junior Subordinated Deferrable Interest Debenture due June 30, 2032, (incorporated by reference to exhibit 4.9.2 to Registrant’s Quarterly Report on Form 10-Q for the period ended June 30, 2002). |
75
|
| Amended and Restated Trust Agreement of EFSC Capital Trust I dated June 27, 2002, (incorporated by reference to exhibit 4.9.3 to Registrant’s Quarterly Report on Form 10-Q for the period ended June 30, 2002). |
73
| ||
4.10.4 |
| Trust Preferred Securities Guarantee Agreement between Registrant and Wells Fargo, National Association, dated June 27, 2002, (incorporated by reference to exhibit 4.9.4 to Registrant’s Quarterly Report on Form 10-Q for the period ended June 30, 2002.) |
|
|
|
|
| Indenture dated May 11, 2004 between Registrant and Wilmington Trust Company relating to Floating Rate Junior Deferrable Interest due June 17, 2034, (incorporated by reference to exhibit 4.1 to Registrant’s Quarterly Report on Form 10-Q for the period ended June 30, 2004). |
|
|
|
|
| Floating Rate Junior Subordinated Deferrable Interest Debenture due June 17, 2034, (incorporated by reference to exhibit 4.2 to Registrant’s Quarterly Report on Form 10-Q for the period ended June 30, 2004). |
|
|
|
|
| Amended and Restated Declaration of Trust of EFSC Capital Trust II dated May 11, 2004, (incorporated by reference to exhibit 4.3 to Registrant’s Quarterly Report on Form 10-Q for the period ended June 30, 2004). |
|
|
|
|
| Guarantee Agreement between Registrant and Wilmington Trust Company dated May 11, 2004, (incorporated by reference to exhibit 4.4 to Registrant’s Quarterly Report on Form 10-Q for the period ended June 30, 2004). |
|
|
|
|
| Indenture dated December 13, 2004 between Registrant and Wilmington Trust Company relating to Floating Rate Junior Deferrable Interest due December 15, 2034, (incorporated by reference to exhibit 4.9.1 to Registrant’s Report on Form 10-K for the period ended December 31, 2004). |
|
|
|
|
| Floating Rate Junior Subordinated Deferrable Interest Debenture due December 15, 2034, (incorporated by reference to exhibit 4.9.2 to Registrant’s Report on Form 10-K for the period ended December 31, 2004). |
|
|
|
|
| Amended and Restated Declaration of Trust of EFSC Capital Trust III dated December 13, 2004, (incorporated by reference to exhibit 4.9.3 to Registrant’s Report on Form 10-K for the period ended December 31, 2004). |
|
|
|
|
| Guarantee Agreement between Registrant and Wilmington Trust Company dated December 13, 2004, (incorporated by reference to exhibit 4.9.4 to Registrant’s Report on Form 10-K for the period ended December 31, 2004). |
|
|
|
|
| Indenture dated October 11, 2005 between Registrant and Wilmington Trust Company relating to Floating Rate Junior Deferrable Interest due |
|
|
|
|
| Floating Rate Junior Subordinated Deferrable Interest Debenture due October 11, 2035, (incorporated by reference to exhibit 4.10.2 to Registrant’s Report on Form 10-K for the period ended December 31, 2005). |
|
|
|
|
| Amended and Restated Declaration of Trust of EFSC Capital Trust IV dated October 11, |
|
|
|
|
| Guarantee Agreement between Registrant and Wilmington Trust Company dated October 11, |
76
4.14.1 |
| |
|
| |
|
|
|
| Floating Rate Junior Subordinated Deferrable Interest Debenture due September 15, 2036, (incorporated by reference to exhibit 4.2 to Registrant’s Quarterly Report on Form 10-Q for the period ended September 30, 2006). | |
4.14.3 | Amended and Restated Declaration of Trust of EFSC Capital Trust V dated July 28, 2006, (incorporated by reference to exhibit 4.3 to Registrant’s Quarterly Report on Form 10-Q for the period ended September 30, 2006). | |
4.14.4 | Guarantee Agreement between Registrant and Wilmington Trust Company dated July 28, 2006, (incorporated by reference to exhibit 4.4 to Registrant’s Quarterly Report on Form 10-Q for the period ended September 30, 2006). | |
4.15 |
| Enterprise Financial Services Corp, Incentive Stock Purchase Plan (incorporated herein by reference to the Registrant’s Registration Statement on Form S-8 dated October 30, 2002 (File No. 333-100928)). |
|
|
|
10.1 |
| Enterprise Financial Services Corp Deferred Compensation Plan I (incorporated herein by reference to Exhibit 10.1 of the Registrant’s Quarterly Report on Form 10-Q for the period ended March 31, 2000). |
|
|
|
10.2 |
| Form of Key Executive Employment Agreement dated October 15, 2002 between Enterprise Financial Services Corp and James C. Wagner and Jack L. Sutherland filed on Exhibit to Registrant’s Report on Form 10-K for the year ended December 31, 2002. |
74
10.3 |
| Key Executive Employment Agreement dated September 8, 2004 between Enterprise Financial Services Corp and Stephen P. Marsh filed on Exhibit to Registrant’s Quarterly Report on Form 10-Q for the period ended September 20, 2004. |
|
|
|
10.4 |
| Key Executive Employment Agreement dated December 1, 2004 between Enterprise Financial Services Corp and Frank H. Sanfilippo. Filed on Exhibit 10.1 to Registrant’s Current Report on Form 8-K dated December 1, 2004. |
|
|
|
10.5 |
| Key Executive Employment Agreement dated November 14, 2005, between Enterprise Financial Services Corp and Kevin C. Eichner Filed on Exhibit 10.1 to Registrant’s Current Report on Form 8-K dated November 14, 2005. |
|
|
|
10.6 |
| Key Executive Employment Agreement dated January 5, 2006, between Enterprise Financial Services Corp and Peter F. Benoist filed on Exhibit 10.1 to Registrant’s Current Report on Form 8-K dated January 5, 2006. |
|
|
|
10.7 |
| Purchase Agreement dated as of October 13, 2005, by and among Enterprise Financial Services Corp., Millennium Holding Company, Inc., Millennium Brokerage Group, LLC, Millennium Holdings, LLC and the sellers filed on Exhibit 2.1 to Registrant’s Current Report on Form 8-K dated October 13, 2005. |
|
|
|
10.8 |
| Second Amendment and Restated Operating Agreement of Millennium Brokerage Group, LLC, dated October 21, 2005, by and between Millennium Holding Company, Inc. and Millennium Holdings, LLC filed on Exhibit 10.1 to Registrant’s Current Report on Form 8-K dated October 13, 2005. |
|
|
|
10.9 |
| $15,000,000 Amended and Restated Credit Agreement, as modified by the First Modification Agreement dated |
|
|
|
|
|
|
77
10.11 | Merger Agreement dated November 22, 2006 by and among Enterprise Financial Services Corp, Clayco Banc Corporation, Great American Bank, and Jeffrey J. Kieffer, as representative of the sellers, filed on Exhibit 2.1 to Registrant’s Current Report on Form 8-K dated November 22, 2006. | |
|
|
|
14.1 |
| Code of Ethics for the Principal Executive Officer and Senior Financial Officers filed on Exhibit to Registrant’s Report on Form 10-K for the year ended December 31, 2003. |
|
|
|
21.1(1) |
| Subsidiaries of the Registrant. |
|
|
|
23.1(1) |
| Consent of KPMG LLP. |
|
|
|
24.1(1) |
| Power of Attorney |
|
|
|
31.1(1) |
| Chief Executive Officer’s Certification required by Rule 13(a)-14(a). |
|
|
|
31.2(1) |
| Chief Financial Officer’s Certification required by Rule 13(a)-14(a). |
|
|
|
32.1(1) |
| Chief Executive Officer Certification pursuant to 18 U.S.C. § 1350, as adopted pursuant to section § 906 of the Sarbanes-Oxley Act of 2002 |
|
|
|
32.2(1) |
| Chief Financial Officer Certification pursuant to 18 U.S.C. § 1350, as adopted pursuant to section § 906 of the Sarbanes-Oxley Act of 2002 |
(1) Filed herewith |
7578