ITEM 6.SELECTED FINANCIAL DATA.
| Fiscal Years Ended |
| February 3, | | January 28, | | January 29, | | January 31, | | February 1, |
| 2007 | | 2006 | | 2005 | | 2004 | | 2003 |
| (53 weeks) | | (52 weeks) | | (52 weeks) | | (52 weeks) | | (52 weeks) |
| (In millions, except per share amounts) |
| Sales | $ | 66,111 | | $ | 60,553 | | $ | 56,434 | | | $ | 53,791 | | $ | 51,760 | |
| Earnings (loss) before cumulative effect of accounting | | | | | | | | | | | | | | | | |
| change | | 1,115 | | | 958 | | | (104 | ) | | | 285 | | | 1,218 | |
| Cumulative effect of accounting change(1) | | — | | | — | | | — | | | | — | | | (16 | ) |
| Net earnings (loss) | | 1,115 | | | 958 | | | (104 | ) | | | 285 | | | 1,202 | |
| Diluted earnings (loss) per share: | | | | | | | | | | | | | | | | |
| Earnings (loss) before cumulative effect of accounting | | | | | | | | | | | | | | | | |
| change | | 1.54 | | | 1.31 | | | (0.14 | ) | | | 0.38 | | | 1.54 | |
| Cumulative effect of accounting change(1) | | — | | | — | | | — | | | | — | | | (0.02 | ) |
| Net earnings (loss) | | 1.54 | | | 1.31 | | | (0.14 | ) | | | 0.38 | | | 1.52 | |
| Total assets | | 21,215 | | | 20,482 | | | 20,491 | | | | 20,767 | | | 20,349 | |
| Long-term liabilities, including obligations under capital | | | | | | | | | | | | | | | | |
| leases and financing obligations | | 8,711 | | | 9,377 | | | 10,537 | | | | 10,515 | | | 10,569 | |
| Shareowners’ equity | | 4,923 | | | 4,390 | | | 3,619 | | | | 4,068 | | | 3,937 | |
| Cash dividends per common share(2) | | 0.195 | | | — | | | — | | | | — | | | — | |
| | Fiscal Years Ended | |
| | January 31,
2009
(52 weeks) | | February 2,
2008
(52 weeks) | | February 3,
2007
(53 weeks) | | January 28,
2006
(52 weeks) | | January 29,
2005
(52 weeks) | |
| | (In millions, except per share amounts) | |
Sales | | $ | 76,000 | | $ | 70,235 | | $ | 66,111 | | $ | 60,553 | | $ | 56,434 | |
Net earnings (loss) | | 1,249 | | 1,181 | | 1,115 | | 958 | | (104 | ) |
Diluted earnings (loss) per share: | | | | | | | | | | | |
Net earnings (loss) | | 1.90 | | 1.69 | | 1.54 | | 1.31 | | (0.14 | ) |
Total assets | | 23,211 | | 22,293 | | 21,210 | | 20,478 | | 20,491 | |
Long-term liabilities, including obligations under capital leases and financing obligations | | 10,311 | | 8,696 | | 8,711 | | 9,377 | | 10,537 | |
Shareowners’ equity | | 5,176 | | 4,914 | | 4,923 | | 4,390 | | 3,619 | |
Cash dividends per common share | | 0.345 | | 0.29 | | 0.195 | | — | | — | |
| | | | | | | | | | | | | | | | |
10
(1) | | Amounts are net of tax. |
|
(2) | | During the fiscal year ended February 2, 2002, the Company was prohibited from paying cash dividends under the terms of its previous Credit Agreement. On May 22, 2002, the Company entered into a new Credit Agreement, at which time the restriction on payment of cash dividends was eliminated. |
ITEM 7. | | MANAGEMENT’S DISCUSSION AND ANALYSIS OF FINANCIAL CONDITION AND RESULTS OF OPERATION.OPERATIONS. |
OUR BUSINESS
The Kroger Co. was founded in 1883 and incorporated in 1902. It is one of the nation’s largest retailers, as measured by revenue, operating 2,4682,481 supermarket and multi-department stores under two dozen banners including Kroger, Ralphs, Fred Meyer, Food 4 Less, King Soopers, Smith’s, Fry’s, Fry’s Marketplace, Dillons, QFC and City Market. Of these stores, 631 had781 have fuel centers. We also operate 779771 convenience stores and 412385 fine jewelry stores.
Kroger operates 4240 manufacturing plants, primarily bakeries and dairies, which supply approximately 55%40% of the corporate brand units sold in the Company’sour retail outlets.
Our revenues are earned and cash is generated as consumer products are sold to customers in our stores. We earn income predominately by selling products at price levels that produce revenues in excess of ourthe costs we incur to make these products available to our customers. Such costs include procurement and distribution costs, facility occupancy and operational costs, and overhead expenses. Our operations are reported as a single reportable segment: the retail sale of merchandise to individual customers.
OUR 2006 2008 PERFORMANCE
The continued focus
By focusing on the customer through our Customer 1st strategy, we were able to report solid results for fiscal year 2008 in a particularly tough economy. At the beginning of our associates on delivering improved service, product selection and valuethe year, we expected to our customers generated a year of significantly improvedgrow supermarket identical supermarket sales growth, excluding fuel sales, in 2006. Our identical supermarket sales, excluding fuel, sales, grew at 5.6% in 2006. These results followed strong 2005by 3% to 5%. For 2008, supermarket identical supermarket sales, excluding fuel, sales,were 5.0%, meeting the upper end of 3.5% in 2005our original guidance.
At the outset of fiscal year 2008, Kroger’s earnings guidance was a range of $1.83 to $1.90 per diluted share. Our 2008 earnings was $1.90 per diluted share or $1.92 per diluted share, excluding the effect of a $.02 per diluted share charge for damage and 0.8% in 2004.disruption caused by Hurricane Ike. Our 2008 earnings of $1.92 per diluted share, excluding the charge for damage and disruption caused by Hurricane Ike, represents a growth rate of 13.6% over Kroger’s 2007 full-year earnings of $1.69 per diluted share. We believe that this growth plus Kroger’s dividend yield of more than 1%, creates a strong return for shareholders.
Increasing
Our market share helped us achievealso rose in 2008. Based on our results. Our internal data and analysis, showswe estimate that we hold the #1 or #2our market share positionincreased approximately 61 basis points in 38 of2008 across our 4442 major markets. We define a major market as one in which we operate nine or more stores. OurThis is the fourth consecutive year Kroger has achieved significant market share increased in 36 of these 44 major markets, declined in seven and remained unchanged in one. On a volume-weighted basis, our overallgain. Over the past four years combined, Kroger’s market share in these 44our major markets has increased approximately 65225 basis points during 2006.points. Market share is critical to us because it allows us to leverage the fixed costs in our business over a wider revenue base. We hold the number one or number two market share position in 39 of or our 42 major markets. Our fundamental operating philosophy is to maintain and increase market share.
We compete against a total of 1,262 supercenters, an increase of 133 over 2005. There are 34
These market share results demonstrate to us that our long-term strategy is working. As population growth continues in the major markets in which supercenters have achieved at least a #3where we operate, we intend to continue to grow Kroger’s business by maintaining our existing strong market share position. Our overall market share in these 34 major markets,and by building on a volume-weighted basis, increased over 70 basis points during 2006. Our market share increased in 27 of these 34 major markets, declined in six and remained unchanged in one.
All of the market share estimates described above are based on our internal data and analysis.additional opportunities for sales growth. We believe they are reliable but can provide no other assurance of reliability. We believe this market share analysis illustratesestimate that Kroger continued to achieve significant growth in 2006, even in the face of aggressive expansion in the supermarket industry by supercenters, intense price competition, increasing fragmentation of retail formats and market consolidation. Our retail price investments, combined with our service and selling initiatives, led to these market share gains in 2006. We believe there is still significant room for growth. In our 44 major markets, we estimate approximately 47%45% of the share in thoseour major markets continues to be— as much as $100 billion — is held by competitors without ourwho do not have Kroger’s economies of scale. Our economies of scale allow us to deliver increasing value to customers, which is a competitive edge, particularly in today’s economic climate.
We were able to balance our sales growth with earnings growth. Our net earnings increased 16.4% to $1.54 per diluted share in 2006, from $1.31 per diluted share in 2005. Earnings growth was primarily driven by strong identical supermarket sales growth, improving operating margins and fewer shares outstanding. In addition, fiscal 2006 included a 53rd week that benefited the year by an estimated $0.07 per diluted share, adjustments to certain deferred tax balances that benefited the year by $0.03 per diluted share, expense totaling $0.03 per diluted share for increases in legal reserves, and $0.06 per diluted share of expense for the adoption of stock option expensing.
FUTURE EXPECTATIONS
While we were pleased with our 2006 results, we must continue to adjust ourKroger’s business model is structured to meet the changing needs and expectations of our customers. Our plan requires balance between sales growth, earnings growth and profitable capital investment.
We expect to achieve identical supermarket sales growth through merchandising and operating initiatives that improve the shopping experience for our customers and continue building customer loyalty. We expect identical supermarket sales growth, excluding fuel sales, of 3%-5% in 2007.
To the extent that these sales initiatives involve price reductions or additional costs, we expect they will be funded by operating cost reductions and productivity improvements. We expect sales improvements and cost reductions, combined with fewer shares outstanding, to driveproduce sustainable earnings per share growth in 2007.a variety of economic and competitive conditions, primarily through strong identical sales growth. We expectbelieve this is the right approach to produce sustainable earnings per sharegrowth over a long period of time. We recognize that continual investment in 2007 of $1.60-$1.65 per diluted share. This represents earnings per share growth of approximately 9%-12% in 2007, net of the effect of a 53rd week in fiscal 2006 of approximately $0.07 per diluted share.our Customer 1
In addition, on March 15, 2007, the Board of Directors declared an increase in Kroger’s quarterly dividendst strategy is necessary to $0.075 per share.drive strong, sustainable identical sales growth. We believe that this Customer 1st
Further discussion on strategy along with our industry, the current economic environmentfinancial strategies are delivering value to customers, shareholders, bondholders, and our related strategic plans is included in the “Outlook” section.associates, and so we remain committed to our plan.
11
RESULTSOF OPERATIONS
The following discussion summarizes our operating results for 20062008 compared to 20052007 and for 20052007 compared to 2004.2006. Comparability is affected by certain income and expense items that fluctuated significantly between and among the periods, including goodwill and asset impairment charges and a labor dispute in southern California in 2004.periods.
Net Earnings (Loss)
Net earnings totaled $1,115 million$1.2 billion for 2006,2008, compared to net earnings totaling $958 million$1.2 billion in 20052007 and a net loss totaling $104 million$1.1 billion in 2004.2006. The increase in our net earnings for 2006,2008, compared to 20052007 and 2004,2006, resulted from improvements in the southern California market and the leveraging of fixed costs with strong non-fuel identical supermarket sales growth as well as the effect ofand strong fuel results. In addition, 2006 net earnings included a 53rd week in 2006. In addition, 2004 was negatively affected by goodwill charges totaling $904 million, as well as a labor dispute in southern California. week.
Earnings per diluted share totaled $1.54$1.90 or $1.92, excluding the effect of a $.02 per diluted share charge for damage and disruption caused by Hurricane Ike, in 2006,2008, compared to $1.31 per share in 2005 and a net loss of $0.14$1.69 per diluted share in 2004.2007 and $1.54 per diluted share in 2006. Earnings per diluted share increased 13.6% in 2008, excluding the effect of a $.02 per diluted share charge for damage and disruption caused by Hurricane Ike, compared to 2007. Earnings per diluted share increased 15% in 2007, compared to 2006, after adjusting for the extra week in fiscal 2006. Net earnings in 2006 benefited from a 53rd week by $0.07an estimated $.07 per share due to the 53rd week and $0.03 per share from the adjustment of certain deferred tax balances. Net earnings in 2006 also included expense of $0.03 per share recorded for legal reserves. Net earnings were reduced by $1.16 per share in 2004 due to the effects of goodwill impairment charges.share. Our earnings per share growth in 20062008, 2007 and 20052006 resulted from increased net earnings, strong identical sales growth and the repurchase of Kroger stock. During fiscal 2008, we repurchased 24 million shares of Kroger stock for a total investment of $637 million. During fiscal 2007, we repurchased 53 million shares of our stock for a total investment of $1.4 billion. During fiscal 2006, we repurchased 29 million shares of Kroger stock for a total investment of $633 million. During fiscal 2005, we repurchased 15 million shares of
Sales
Total Sales
(in millions)
| | 2008 | | Percentage
Increase | | 2007 | | Percentage
Increase | | 2006 | |
Total food store sales without fuel | | $ | 63,795 | | 6.1 | % | $ | 60,142 | | 4.2 | % | $ | 57,712 | |
Total food store fuel sales | | 7,464 | | 30.0 | % | 5,741 | | 28.9 | % | 4,455 | |
| | | | | | | | | | | |
Total food store sales | | $ | 71,259 | | 8.2 | % | $ | 65,883 | | 6.0 | % | $ | 62,167 | |
Other sales(1) | | 4,741 | | 8.9 | % | 4,352 | | 10.3 | % | 3,944 | |
| | | | | | | | | | | |
Total Sales | | $ | 76,000 | | 8.2 | % | $ | 70,235 | | 6.2 | % | $ | 66,111 | |
(1) Other sales primarily relate to sales at convenience stores, including fuel, jewelry stores and sales by our stock for a total investment of $252 million. During fiscal 2004, we repurchased 20 million shares of Kroger stock for a total investment of $319 million.manufacturing plants to outside customers.
Sales
| Total Sales |
| (in millions) |
| | | | | Percentage | | | | | Percentage | | | |
| | 2006 | | Increase | | 2005 | | Increase | | 2004 |
| Total food store sales without fuel | $ | 57,712 | | 7.9 | % | | $ | 53,472 | | 4.6 | % | | $ | 51,106 |
| Total food store fuel sales | | 4,455 | | 26.3 | % | | | 3,526 | | 53.0 | % | | | 2,305 |
| |
| Total food store sales | $ | 62,167 | | 9.1 | % | | $ | 56,998 | | 6.7 | % | | $ | 53,411 |
| Other sales(1) | | 3,944 | | 10.9 | % | | | 3,555 | | 17.6 | % | | | 3,023 |
| |
| Total Sales | $ | 66,111 | | 9.2 | % | | $ | 60,553 | | 7.3 | % | | $ | 56,434 |
(1) | | Other sales primarily relate to sales at convenience stores, including fuel, jewelry stores and sales by our manufacturing plants to outside firms. |
The growth in our total sales in 2008 over fiscal 2007 was primarily the result of identical storesupermarket sales increases, the addition of a 53rd week in 2006increased fuel gallon sales, and inflation in pharmacyacross most departments. Identical supermarket sales and some perishable commodities. Increasedtotal sales, excluding fuel, increased due to increased transaction count and average transaction size, were both responsible for our increases in identical supermarket sales, excluding retail fuel operations.and inflation across all departments. After adjusting for the extra week in fiscal 2006, total sales increased 7.0%8.2% in 2007 over fiscal 2005.2006.
We define a supermarket as identical when it has been in operation without expansion or relocation for five full quarters. Fuel center discounts received at our fuel centers and earned based on in-store purchases are included in all of the supermarket identical sales results calculations illustrated below. Differences between total supermarket sales and identical supermarket sales primarily relate to changes in supermarket square footage. Annualized identical supermarket sales include all sales at the Fred Meyer multi-department stores. We calculate annualized identical supermarket sales based on a summation ofby adding together four quarters of identical supermarket sales. Our identical supermarket sales results are summarized in the table below, based on the 53-week52-week period of 2006,2008, compared to the same 53-week52-week period of the previous year. The identical store count in the table below represents the total number of identical supermarkets as of January 31, 2009 and February 2, 2008.
12
| Identical Supermarket Sales |
| (in millions) |
| | 2006 | | 2005 |
| Including supermarket fuel centers | $ | 59,592 | | | $ | 55,993 | |
| Excluding supermarket fuel centers | $ | 55,399 | | | $ | 52,483 | |
| |
| Including supermarket fuel centers | | 6.4 | % | | | 5.3 | % |
| Excluding supermarket fuel centers | | 5.6 | % | | | 3.5 | % |
Identical Supermarket Sales
(in millions)
| | 2008 | | 2007 | |
Including supermarket fuel centers | | $ | 67,185 | | $ | 62,878 | |
Excluding supermarket fuel centers | | $ | 60,300 | | $ | 57,416 | |
| | | | | | | |
Including supermarket fuel centers | | 6.9 | % | 6.9 | % |
Excluding supermarket fuel centers | | 5.0 | % | 5.3 | % |
Identical 4th Quarter store count | | 2,369 | | 2,280 | |
We define a supermarket as comparable when it has been in operation for five full quarters, including expansions and relocations. As is the case for identical supermarket sales, fuel center discounts received at our fuel centers and earned based on in-store purchases are included in all of the supermarket comparable sales results calculations illustrated below. Annualized comparable supermarket sales include all Fred Meyer multi-department stores. We calculate annualized comparable supermarket sales based on a summation ofby adding together four quarters of comparable sales. Our annualized comparable supermarket sales results are summarized in the table below, based on the 53-week52-week period of 2006,2008, compared to the same 53-week52-week period of the previous year. The comparable store count in the table below represents the total number of comparable supermarkets as of January 31, 2009 and February 2, 2008.
| Comparable Supermarket Sales |
| (in millions) |
| | 2006 | | 2005 |
| Including supermarket fuel centers | $ | 61,045 | | | $ | 57,203 | |
| Excluding supermarket fuel centers | $ | 56,702 | | | $ | 53,622 | |
| |
| Including supermarket fuel centers | | 6.7 | % | | | 5.9 | % |
| Excluding supermarket fuel centers | | 5.7 | % | | | 3.9 | % |
Comparable Supermarket Sales
(in millions)
| | 2008 | | 2007 | |
Including supermarket fuel centers | | $ | 69,762 | | $ | 65,066 | |
Excluding supermarket fuel centers | | $ | 62,492 | | $ | 59,372 | |
| | | | | | | |
Including supermarket fuel centers | | 7.2 | % | 7.2 | % |
Excluding supermarket fuel centers | | 5.3 | % | 5.5 | % |
Comparable 4th Quarter store count | | 2,444 | | 2,352 | |
FIFO Gross Margin
We calculate First-In, First-Out (“FIFO”) Gross Margin as follows: Salessales minus merchandise costs, plus Last-In, First-Out (“LIFO”) charge (credit). Merchandise costs includeincluding advertising, warehousing and transportation, but excluding the Last-In, First-Out (“LIFO”) charge. Merchandise costs exclude depreciation expense and rent expense. FIFO gross margin is an important measure used by our management to evaluate merchandising and operational effectiveness.
Our FIFO gross margin rates were 24.27%, 24.80%23.20% in 2008, 23.65% in 2007 and 25.38%24.27% in 2006, 2005 and 2004, respectively. Retail2006. Our retail fuel sales loweredreduce our FIFO gross margin rate due to the very low FIFO gross margin on retail fuel sales as compared to non-fuel sales. Excluding the effect of retail fuel operations, our FIFO gross margin rates were 26.43%, 26.69%decreased 15 basis points in 2008, 20 basis points in 2007 and 26.73%26 basis points in 2006, 2005 and 2004, respectively.2006. The decrease in our non-fuel FIFO gross margin rate reflects our continued reinvestment of operating cost savings into lower prices for our customers. In addition, FIFO gross margin in 2008, compared to 2007, decreased due to high inflation in product costs.
LIFO Charge
The LIFO charge was $196 million in 2008, $154 million in 2007 and $50 million in 2006. Like many food retailers, we continued to experience product cost inflation in 2008 at levels that have not occurred for several years. This increase in product cost inflation caused the increase in the LIFO charge in 2008, compared to 2007 and 2006. In addition, product cost inflation in 2007, compared to 2006, caused the increase in the LIFO charge in 2007 compared to 2006.
Operating, General and Administrative Expenses
Operating, general and administrative (“OG&A”) expenses consist primarily of employee-related costs such as wages, health care benefit costs and retirement plan costs. Among other items, rentcosts, utilities and credit card fees. Rent expense, depreciation and amortization expense, and interest expense are not included in OG&A.
13
OG&A expenses, as a percent of sales, were 17.91%, 18.21%16.95% in 2008, 17.31% in 2007 and 18.76%17.91% in 2006, 2005 and 2004, respectively.2006. The growth in our retail fuel sales lowersreduces our OG&A rate due to the very low OG&A rate on retail fuel sales as compared to non-fuel sales. Excluding the effect of retail fuel operations, our OG&A expenses, as a percent of sales were 19.59%, 19.68%excluding fuel, decreased 3 basis points in 2008, 33 basis points in 2007 and 19.81%9 basis points in 2006, 2005 and 2004, respectively. Excluding2006. The decrease in our OG&A rate in 2008, excluding the effect of retail fuel operations, expenses recorded for legal reserveswas primarily the result of increased identical supermarkets sales growth and stock option expense,a settlement received from credit card processers, partially offset by the $25 million charge related to Hurricane Ike and increases in credit card fees and health care costs. The decrease in our OG&A rate declined 28 basis points in 2006. This decrease2007, excluding the effect of retail fuel operations, was driven byprimarily the result of strong identical store sales growth, by increasing store laborincreased productivity, and by progress we havethat was made in 2007 in controlling our utility, health care and pension costs. These improvements were partially offset by increases in pension expense and credit card fees. Excluding the effect of retail fuel operations and expenses recorded for one-time legal reserves, our OG&A rate declined 16 basis points in 2006.
Rent Expense
Rent expense was $659 million in 2008, as compared to $644 million in 2007 and $649 million in 2006, as compared to $661 million and $680 million in 2005 and 2004, respectively.2006. Rent expense, as a percent of sales, was 0.98%0.87% in 2006,2008, as compared to 1.09%0.92% in 20052007 and 1.21%0.98% in 2004.2006. The decrease in rent expense, as a percent of sales, reflects our increasing sales leverage and our continued emphasis on ownership of real estate when available, as well as decreased charges for closed-store future rent liabilities in 2006 and 2005 compared to 2004.owning rather than leasing whenever possible.
Depreciation and Amortization Expense
Depreciation and amortization expense was $1,272 million, $1,265 million$1.4 billion in 2008, $1.4 billion in 2007 and $1,256 million for 2006, 2005 and 2004, respectively.$1.3 billion in 2006. The increases in depreciation and amortization expense were the result of capital expenditures totaling $1,777 million, $1,306 million$2.2 billion in 2008, $2.1 billion in 2007 and $1,634 million$1.8 billion in 2006, 2005 and 2004, respectively.2006. Depreciation and amortization expense, as a percent of sales, was 1.92%, 2.09%1.90% in 2008, 1.93% in 2007 and 2.23%1.92% in 2006, 2005 and 2004, respectively.2006. The decrease in our depreciation and amortization expense in 2008, compared to 2007, as a percent of sales, is primarily the result of totalincreasing sales. The increase in our depreciation and amortization expense in 2007, compared to 2006, as a percent of sales, increases.is due to an annual depreciation charge in both years with 2006 containing 53 weeks of sales due to the structure of our fiscal calendar.
Interest Expense
Net interest expense totaled $485 million in 2008, $474 million in 2007 and $488 million $510 million and $557 millionin 2006. The increase in interest expense in 2008, compared to 2007, was primarily the result of an increase in the average total debt balance for 2006, 2005 and 2004, respectively.the year, partially offset by interest income related to the mark-to-market of ineffective fair value swaps. The decrease in interest expense in 2007, compared to 2006, was the result of replacing borrowings with new borrowings at a lower interest rate. The average borrowings. During 2006, we reduced total debt $173 million from $7.2 billion as of January 28, 2006,balance in 2007 was comparable to $7.1 billion as of February 3, 2007. Interest expense in 2004 included $25 million related to the early retirement of debt.2006.
Income Taxes
Our effective income tax rate was 36.2%, 37.2%36.5% in 2008, 35.4% in 2007 and 136.4% for 2006, 2005 and 2004, respectively.36.2% in 2006. The effective tax rates for 2006 and 2005 differthose years differed from the federal statutory rate primarily due to the effect of state income taxes. In addition, the effective tax rate for 2004 due to the impairment of non-deductible goodwill in 2004. The effective income tax rates also differ2007 differs from the expected federal statutory rate in all years presented due to the effectresolution of state taxes as well as thesome tax issues. The effective rate in 2006 includes an adjustment of certainsome deferred tax balancesbalances.
During the third quarter of 2007, we resolved favorably some outstanding tax issues. This resulted in 2006.a 2007 tax benefit of approximately $40 million and reduced our effective tax rate by 1.9%.
During
In 2006, during the reconciliation of our deferred tax balances, and after the filing of our annual federal and state tax returns, we identified adjustments to be made in the previousprior years’ deferred tax reconciliation. We corrected these deferred tax balances in our Consolidated Financial Statements for the year ended February 3, 2007, which resulted in a reduction of our fiscal 2006 provision for income tax expense of approximately $21 million and reduced the rate by 120 basis points.1.2%. We do not believe these adjustments are material to our Consolidated Financial Statements for the year ended February 3, 2007, or to any prior years’ Consolidated Financial Statements. As a result, we have not restated any prior year amounts.
14
COMMON STOCK REPURCHASE PROGRAM
We maintain a stock repurchase programprograms that compliescomply with Securities Exchange Act Rule 10b5-1 toand allow for the orderly repurchase of our common stock, from time to time. We made open market purchases totaling $448 million in 2008, $1.2 billion in 2007 and $374 million $239 million and $291 millionin 2006 under thisthese repurchase program during fiscal 2006, 2005 and 2004, respectively.programs. In addition to thisthese repurchase program,programs, in December 1999 we began a program to repurchase common stock to reduce dilution resulting from our employee stock option plans. This program is solely funded by proceeds from stock option exercises, includingand the tax benefit from these exercises. We repurchased approximately $189 million in 2008, $270 million in 2007 and $259 million $13 million and $28 millionin 2006 under the stock option programprograms.
In 2008, to preserve liquidity and financial flexibility, we reduced the amount of stock repurchased during 2006, 2005 and 2004, respectively.the year, decreasing the cash used for stock purchases in 2008, compared to 2007.
CAPITAL EXPENDITURES
Capital expenditures, including changes in construction-in-progress payablepayables and excluding acquisitions, totaled $1,777 million$2.2 billion in 20062008 compared to $1,306 million$2.1 billion in 20052007 and $1,634 million$1.8 billion in 2004.2006. The declineincrease in 2005capital spending in 2008 compared to 2007 and 2006 was the result of our emphasis on the tightening of capital and increasing our focus on remodels, merchandising and productivity projects. The table below shows our supermarket storing activity and our total food store square footage:
| Supermarket Storing Activity |
| | 2006 | | 2005 | | 2004 |
| Beginning of year | 2,507 | | | 2,532 | | | 2,532 | |
| Opened | 20 | | | 28 | | | 41 | |
| Opened (relocation) | 17 | | | 12 | | | 20 | |
| Acquired | 1 | | | 1 | | | 15 | |
| Acquired (relocation) | — | | | — | | | 3 | |
| Closed (operational) | (60 | ) | | (54 | ) | | (56 | ) |
| Closed (relocation) | (17 | ) | | (12 | ) | | (23 | ) |
| |
| End of year | 2,468 | | | 2,507 | | | 2,532 | |
| |
| Total food store square footage (in millions) | 142 | | | 142 | | | 141 | |
Supermarket Storing Activity
| | 2008 | | 2007 | | 2006 | |
Beginning of year | | 2,486 | | 2,468 | | 2,507 | |
Opened | | 21 | | 23 | | 20 | |
Opened (relocation) | | 14 | | 9 | | 17 | |
Acquired | | 6 | | 38 | | 1 | |
Acquired (relocation) | | 3 | | 1 | | — | |
Closed (operational) | | (32 | ) | (43 | ) | (60 | ) |
Closed (relocation) | | (17 | ) | (10 | ) | (17 | ) |
| | | | | | | |
End of year | | 2,481 | | 2,486 | | 2,468 | |
| | | | | | | |
Total food store square footage (in millions) | | 147 | | 145 | | 142 | |
CRITICAL ACCOUNTING POLICIES
We have chosen accounting policies that we believe are appropriate to report accurately and fairly our operating results and financial position, and we apply those accounting policies in a consistent manner. Our significant accounting policies are summarized in Note 1 to the Consolidated Financial Statements.
The preparation of financial statements in conformity with generally accepted accounting principles (“GAAP”) requires us to make estimates and assumptions that affect the reported amounts of assets, liabilities, revenues, and expenses, and related disclosures of contingent assets and liabilities. We base our estimates on historical experience and other factors we believe to be reasonable under the circumstances, the results of which form the basis for making judgments about the carrying values of assets and liabilities that are not readily apparent from other sources. Actual results could differ from those estimates.
We believe that the following accounting policies are the most critical in the preparation of our financial statements because they involve the most difficult, subjective or complex judgments about the effect of matters that are inherently uncertain.
15
Self-Insurance Costs
We primarily are self-insured for costs related to workers’ compensation and general liability claims. The liabilities represent our best estimate, using generally accepted actuarial reserving methods, of the ultimate obligations for reported claims plus those incurred but not reported for all claims incurred through February 3, 2007. CaseJanuary 31, 2009. We establish case reserves are established for reported claims using case-basis evaluation of the underlying claim data and are updatedwe update as information becomes known.
For both workers’ compensation and general liability claims, we have purchased stop-loss coverage to limit our exposure to any significant exposure on a per claim basis. We are insured for covered costs in excess of these per claim limits. TheWe account for the liabilities for workers’ compensation claims are accounted for on a present value basis utilizing a risk-adjusted discount rate. A 25 basis point decrease in our discount rate would increase our liability by approximately $3$4 million. General liability claims are not discounted.
We are also similarly self-insured for property-related losses. We have purchased stop-loss coverage to limit our exposure to losses in excess of $25 million on a per claim basis, except in the case of an earthquake, for which stop-loss coverage is in excess of $50 million per claim, up to $200 million per claim in California and $300 million outside of California.
The assumptions underlying the ultimate costs of existing claim losses are subject to a high degree of unpredictability, which can affect the liability recorded for such claims. For example, variability in inflation rates of health care costs inherent in these claims can affect the amounts realized. Similarly, changes in legal trends and interpretations, as well as a change in the nature and method of how claims are settled can affect ultimate costs. Our estimates of liabilities incurred do not anticipate significant changes in historical trends for these variables, and any changes could have a considerable effect uponon future claim costs and currently recorded liabilities.
Impairments of Long-Lived Assets
In accordance with Statement of Financial Accounting Standards (“SFAS”) No. 144, Accounting for the Impairment or Disposal of Long-Lived Assets, we monitor the carrying value of long-lived assets for potential impairment each quarter based on whether certain trigger events have occurred. These events include current period losses combined with a history of losses or a projection of continuing losses or a significant decrease in the market value of an asset. When a trigger event occurs, we perform an impairment calculation, comparing projected undiscounted cash flows, utilizing current cash flow information and expected growth rates related to specific stores, to the carrying value for those stores. If we identify impairment for long-lived assets to be held and used, we compare the assets’ current carrying value to the assets’ fair value. Fair value is determined based on market values or discounted future cash flows to the asset’s current carrying value.flows. We record impairment when the carrying value exceeds the discounted cash flows.fair market value. With respect to owned property and equipment held for disposal, we adjust the value of the property and equipment to reflect recoverable values based on our previous efforts to dispose of similar assets and current economic conditions. We recognize impairment for the excess of the carrying value over the estimated fair market value, reduced by estimated direct costs of disposal. We recorded asset impairments in the normal course of business totaling $26 million in 2008, $24 million in 2007 and $61 million in 2006. We record costs to reduce the carrying value of long-lived assets in the Consolidated Statements of Operations as “Operating, general and administrative” expense.
The factors that most significantly affect the impairment calculation are our estimates of future cash flows. Our cash flow projections look several years into the future and include assumptions on variables such as inflation, the economy and market competition. Application of alternative assumptions and definitions, such as reviewing long-lived assets for impairment at a different organizational level, could produce significantly different results.
Goodwill
Goodwill
We review goodwill for impairment during the fourth quarter of each year, and also upon the occurrence of trigger events. TheWe perform reviews are performed at the operating division level. Generally, fair value representsis determined using a multiple of earnings, or discounted projected future cash flows, and we compare fair value to the carrying value of a division for purposes of identifying potential impairment. We base projected future cash flows on management’s knowledge of the current operating environment and expectations for the future. If we identify potential for impairment, we measure the fair value of a division against the fair value of its underlying assets and liabilities, excluding goodwill, to estimate an implied fair value of the division’s goodwill. We recognize goodwill impairment for any excess of the carrying value of the division’s goodwill over the implied fair value. If actual results differ significantly from anticipated future results for certain reporting units, we would need to recognize an impairment loss for any excess of the carrying value of the division’s goodwill over the implied fair value. Results of the goodwill impairment reviews performed during 2006, 20052008, 2007 and 20042006 are summarized in Note 2 to the Consolidated Financial Statements.
16
The annual impairment review requires the extensive use of accounting judgment and financial estimates. Application of alternative assumptions and definitions, such as reviewing goodwill for impairment at a different organizational level, could produce significantly different results. Similar to our policy on impairment of long-lived assets, the cash flow projections embedded in our goodwill impairment reviews can be affected by several items such as inflation, business valuations in the market, the economy and market competition.
Intangible Assets
In addition to goodwill, we have recorded intangible assets totaling $26 million, $22 million and $28 million for leasehold equities, liquor licenses and pharmacy prescription file purchases, respectively, at February 3, 2007. Balances at January 28, 2006, were $35 million, $20 million and $30 million for lease equities, liquor licenses and pharmacy prescription files, respectively. We amortize leasehold equities over the remaining life of the lease. We do not amortize owned liquor licenses, however, we amortize liquor licenses that must be renewed over their useful lives. We amortize pharmacy prescription file purchases over seven years. We consider these assets annually during our testing for impairment.
Store Closing Costs
We provide for closed store liabilities relating to the present value of the estimated remaining noncancellable lease payments after the closing date, net of estimated subtenant income. We estimate the net lease liabilities using a discount rate to calculate the present value of the remaining net rent payments on closed stores. TheWe usually pay closed store lease liabilities usually are paid over the lease terms associated with the closed stores, which generally have remaining terms ranging from one to 20 years. Adjustments to closed store liabilities primarily relate to changes in subtenant income and actual exit costs differing from original estimates. Adjustments are madeWe make adjustments for changes in estimates in the period in which the change becomes known. We review store closing liabilities quarterly to ensure that any accrued amount that is not a sufficient estimate of future costs, or that no longer is needed for its originally intended purpose, is adjusted to incomeearnings in the proper period.
We estimate subtenant income, future cash flows and asset recovery values based on our experience and knowledge of the market in which the closed store is located, our previous efforts to dispose of similar assets and current economic conditions. The ultimate cost of the disposition of the leases and the related assets is affected by current real estate markets, inflation rates and general economic conditions.
We reduce owned stores held for disposal to their estimated net realizable value. We account for costs to reduce the carrying values of property, equipment and leasehold improvements in accordance with our policy on impairment of long-lived assets. We classify inventory write-downs in connection with store closings, if any, in “Merchandise costs.” We expense costs to transfer inventory and equipment from closed stores as they are incurred.
Post-Retirement Benefit Plans,” Kroger contributes to several multi-employer pension plans based on obligations arising under collective bargaining agreements with unions representing employees covered by those agreements. The funding status of most of those pension funds has deteriorated, and it is probable that the Company’s contributions to those funds will increase significantly over the next several years. Despite the fact that the pension obligations of these funds are not the liability or responsibility of the Company, there is a risk that the agencies that rate Kroger’s outstanding debt instruments could view the underfunded nature of these plans unfavorably when determining their ratings on our debt securities. Any downgrading of Kroger’s debt ratings likely would increase Kroger’s cost of borrowing.
INSURANCE
We use a combination of insurance and self-insurance to provide for potential liability for workers’ compensation, automobile and general liability, property, director and officers’ liability, and employee health care benefits. Any actuarial projection of losses is subject to a high degree of variability. Changes in legal trends and interpretations, variability in inflation rates, changes in the nature and method of claims settlement, benefit level changes due to changes in applicable laws, insolvency or insurance carriers, and changes in discount rates could all affect ultimate settlements of claims.
CURRENT ECONOMIC CONDITIONS
The global economy and financial markets have declined and experienced volatility due to uncertainties related to energy prices, availability of credit, difficulties in the banking and financial services sectors, the decline in the housing market, diminished market liquidity, falling consumer confidence and rising unemployment rates. As a result, consumers are more cautious. This could lead to reduced consumer spending, to consumers switching to a less expensive mix of products, or to consumers trading down to discounters for grocery items, all of which could affect our sales growth. We are unable to predict when the global economy and financial markets will improve. If the global economy and financial markets do not improve, our results of operations and financial condition could be adversely affected.
ITEM 1B.UNRESOLVED STAFF COMMENTS.
None.
5
ITEM 2.PROPERTIES.
As of January 31, 2009, the Company operated more than 3,600 owned or leased supermarkets, convenience stores, fine jewelry stores, distribution warehouses and food processing facilities through divisions, subsidiaries or affiliates. These facilities are located throughout the United States. A majority of the properties used to conduct the Company’s business are leased.
The Company generally owns store equipment, fixtures and leasehold improvements, as well as processing and manufacturing equipment. The total cost of the Company’s owned assets and capitalized leases at January 31, 2009, was $23.9 billion while the accumulated depreciation was $10.7 billion.
Leased premises generally have base terms ranging from ten-to-twenty years with renewal options for additional periods. Some options provide the right to purchase the property after conclusion of the lease term. Store rentals are normally payable monthly at a stated amount or at a guaranteed minimum amount plus a percentage of sales over a stated dollar volume. Rentals for the distribution, manufacturing and miscellaneous facilities generally are payable monthly at stated amounts. For additional information on lease obligations, see Note 8 to the Consolidated Financial Statements.
ITEM 3.LEGAL PROCEEDINGS.
On October 6, 2006, the Company petitioned the Tax Court (In Re: Ralphs Grocery Company and Subsidiaries, formerly known as Ralphs Supermarkets, Inc., Docket No. 20364-06) for a redetermination of deficiencies set by the Commissioner of Internal Revenue. The dispute at issue involves a 1992 transaction in which Ralphs Holding Company acquired the stock of Ralphs Grocery Company and made an election under Section 338(h)(10) of the Internal Revenue Code. The Commissioner has determined that the acquisition of the stock was not a purchase as defined by Section 338(h)(3) of the Internal Revenue Code and that the acquisition does not qualify as a purchase. The Company believes that it has strong arguments in favor of its position and believes it is more likely than not that its position will be sustained. However, due to the inherent uncertainty involved in the litigation process, there can be no assurances that the Tax Court will rule in favor of the Company. As of January 31, 2009, an adverse decision would require a cash payment of up to approximately $436 million, including interest.
On February 2, 2004, the Attorney General for the State of California filed an action in Los Angeles federal court (California, ex rel Lockyer v. Safeway, Inc. dba Vons, a Safeway Company; Albertson’s, Inc. and Ralphs Grocery Company, a division of The Kroger Co., United States District Court Central District of California, Case No. CV04-0687) alleging that the Mutual Strike Assistance Agreement (the “Agreement”) between the Company, Albertson’s, Inc. and Safeway Inc. (collectively, the “Retailers”), which was designed to prevent the union from placing disproportionate pressure on one or more of the Retailers by picketing such Retailer(s) but not the other Retailer(s) during the labor dispute in southern California, violated Section 1 of the Sherman Act. The lawsuit seeks declarative and injunctive relief. On May 28, 2008, pursuant to a stipulation between the parties, the court entered a final judgment in favor of the defendants. As a result of the stipulation and final judgment, there are no further claims to be litigated at the trial court level. The Attorney General has appealed a trial court ruling to the Ninth Circuit Court of Appeals and the defendants are appealing a separate ruling. Although this lawsuit is subject to uncertainties inherent in the litigation process, based on the information presently available to the Company, management does not expect that the ultimate resolution of this action will have a material adverse effect on the Company’s financial condition, results of operations or cash flows.
Various claims and lawsuits arising in the normal course of business, including suits charging violations of certain antitrust, wage and hour, or civil rights laws, are pending against the Company. Some of these suits purport or have been determined to be class actions and/or seek substantial damages. Any damages that may be awarded in antitrust cases will be automatically trebled. Although it is not possible at this time to evaluate the merits of all of these claims and lawsuits, nor their likelihood of success, the Company is of the belief that any resulting liability will not have a material adverse effect on the Company’s financial position.
The Company continually evaluates its exposure to loss contingencies arising from pending or threatened litigation and believes it has made adequate provisions therefor. Nonetheless, assessing and predicting the outcomes of these matters involve substantial uncertainties. It remains possible that despite management’s current belief, material differences in actual outcomes or changes in management’s evaluation or predictions could arise that could have a material adverse impact on the Company’s financial condition or results of operation.
6
ITEM 4.SUBMISSION OF MATTERS TO A VOTE OF SECURITY HOLDERS.
None.
PART II
ITEM 5. | MARKET FOR REGISTRANT’S COMMON EQUITY, RELATED STOCKHOLDER MATTERS AND ISSUER PURCHASES OF EQUITY SECURITIES. |
(a)
COMMON STOCK PRICE RANGE
| | 2008 | | 2007 | |
Quarter | | High | | Low | | High | | Low | |
1st | | $ | 28.13 | | $ | 23.39 | | $ | 30.43 | | $ | 24.74 | |
2nd | | $ | 30.99 | | $ | 25.86 | | $ | 31.94 | | $ | 23.95 | |
3rd | | $ | 29.91 | | $ | 22.30 | | $ | 30.00 | | $ | 25.30 | |
4th | | $ | 29.03 | | $ | 22.40 | | $ | 29.35 | | $ | 24.23 | |
Main trading market: New York Stock Exchange (Symbol KR)
Number of shareholders of record at year-end 2008: 45,939
Number of shareholders of record at March 27, 2009: 45,712
During fiscal 2006, the Company’s Board of Directors adopted a dividend policy and paid three quarterly dividends of $0.065 per share. During fiscal 2007, the Company paid one quarterly dividend of $0.065 and three quarterly dividends of $0.075. During fiscal 2008, the Company paid one quarterly dividend of $0.075 and three quarterly dividends of $0.09. On March 1, 2009, the Company paid a quarterly dividend of $0.09 per share. On March 12, 2009, the Company announced that its Board of Directors has declared a quarterly dividend of $0.09 per share, payable on June 1, 2009, to shareholders of record at the close of business on May 15, 2009.
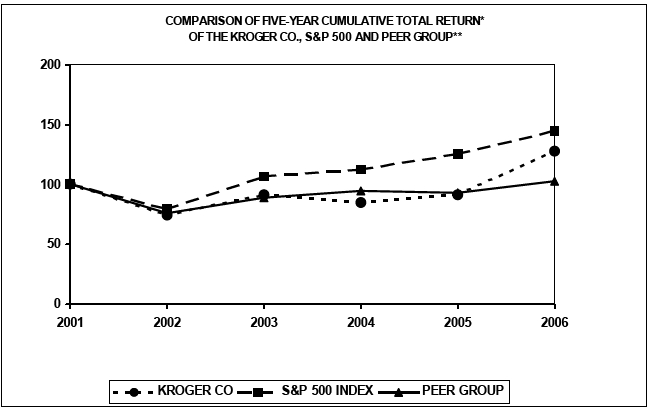
PERFORMANCE GRAPH
Set forth below is a line graph comparing the five-year cumulative total shareholder return on Kroger’s common stock, based on the market price of the common stock and assuming reinvestment of dividends, with the cumulative total return of companies in the Standard & Poor’s 500 Stock Index, a peer group composed of food and drug companies and a former peer group.
Historically, our peer group has consisted of the major food store companies. In recent years there have been significant changes in the industry, including consolidation and increased competition from supercenters, drug chains, and discount stores. As a result, several years ago we changed our peer group (the “Former Peer Group”) to include companies operating supermarkets, supercenters and warehouse clubs in the United States as well as the major drug chains with which Kroger competes. This year, we changed our peer group (the “Peer Group”) once again to add Tesco plc, as it has become a significant competitor in the U.S. market.
7
| | Base
Period | | INDEXED RETURNS
Years Ending | |
Company Name/Index | | 2003 | | 2004 | | 2005 | | 2006 | | 2007 | | 2008 | |
The Kroger Co. | | 100 | | 93.04 | | 100.22 | | 140.78 | | 143.01 | | 125.42 | |
S&P 500 Index | | 100 | | 105.34 | | 117.59 | | 135.22 | | 132.78 | | 80.51 | |
Peer Group | | 100 | | 108.99 | | 107.87 | | 122.24 | | 125.95 | | 102.29 | |
Former Peer Group | | 100 | | 107.06 | | 104.95 | | 115.57 | | 119.97 | | 96.11 | |
Kroger’s fiscal year ends on the Saturday closest to January 31.
* Total assumes $100 invested on February 1, 2004, in The Kroger Co., S&P 500 Index, the Peer Group and the Former Peer Group with reinvestment of dividends.
** The Peer Group consists of Albertson’s, Inc., Costco Wholesale Corp., CVS Corp, Delhaize Group SA (ADR), Great Atlantic & Pacific Tea Company, Inc., Koninklijke Ahold NV (ADR), Marsh Supermarkets Inc. (Class A), Safeway, Inc., Supervalu Inc., Target Corp., Tesco plc, Wal-Mart Stores Inc., Walgreen Co., Whole Foods Market Inc. and Winn-Dixie Stores, Inc. Albertson’s, Inc., was substantially acquired by Supervalu in July 2006, and is included through 2005. Marsh Supermarkets was acquired by Marsh Supermarkets Holding Corp. in September 2006, and is included through 2005. Winn-Dixie emerged from bankruptcy in 2006 as a new issue and returns for the old and new issue were calculated then weighted to determine the 2006 return.
*** The Former Peer Group consists of Albertson’s, Inc., Costco Wholesale Corp., CVS Corp, Delhaize Group SA (ADR), Great Atlantic & Pacific Tea Company, Inc., Koninklijke Ahold NV (ADR), Marsh Supermarkets Inc. (Class A), Safeway, Inc., Supervalu Inc., Target Corp., Wal-Mart Stores Inc., Walgreen Co., Whole Foods Market Inc. and Winn-Dixie Stores, Inc. Albertson’s, Inc., was substantially acquired by Supervalu in July 2006, and is included through 2005. Marsh Supermarkets was acquired by Marsh Supermarkets Holding Corp. in September 2006, and is included through 2005. Winn-Dixie emerged from bankruptcy in 2006 as a new issue and returns for the old and new issue were calculated then weighted to determine the 2006 return.
Data supplied by Standard & Poor’s.
The foregoing Performance Graph will not be deemed incorporated by reference into any other filing, absent an express reference thereto.
8
(c)
ISSUER PURCHASES OF EQUITY SECURITIES
Period (1) | | Total Number
of Shares
Purchased | | Average
Price Paid
Per Share | | Total Number of
Shares
Purchased as
Part of Publicly
Announced
Plans or
Programs (2) | | Maximum Dollar
Value of Shares
that May Yet Be
Purchased Under
the Plans or
Programs (3)
(in millions) | |
First period - four weeks | | | | | | | | | |
November 9, 2008 to December 6, 2008 | | 13,315 | | $ | 28.63 | | — | | $ | 493 | |
Second period - four weeks | | | | | | | | | |
December 7, 2008 to January 3, 2009 | | 479,385 | | $ | 25.62 | | 450,500 | | $ | 493 | |
Third period – four weeks | | | | | | | | | |
January 4, 2009 to January 31, 2009 | | 164 | | $ | 24.77 | | — | | $ | 493 | |
| | | | | | | | | |
Total | | 492,864 | | $ | 25.70 | | 450,500 | | $ | 493 | |
(1) | The reported periods conform to the Company’s fiscal calendar composed of thirteen 28-day periods. The fourth quarter of 2008 contained three 28-day periods. |
| |
(2) | Shares were repurchased under a program announced on December 6, 1999, to repurchase common stock to reduce dilution resulting from our employee stock option plans. The program is limited to proceeds received from exercises of stock options and the tax benefits associated therewith. The program has no expiration date but may be terminated by the Board of Directors at any time. Total shares purchased include shares that were surrendered to the Company by participants in the Company’s long-term incentive plans to pay for taxes on restricted stock awards. |
| |
(3) | Amounts shown in this column reflect amounts remaining under the $1 billion stock repurchase program, authorized by the Board of Directors on January 18, 2008. The program has no expiration date but may be terminated by the Board of Directors at any time. Amounts to be invested under the program utilizing option exercise proceeds are dependent upon option exercise activity. |
9
ITEM 6. SELECTED FINANCIAL DATA.
| | Fiscal Years Ended | |
| | January 31,
2009
(52 weeks) | | February 2,
2008
(52 weeks) | | February 3,
2007
(53 weeks) | | January 28,
2006
(52 weeks) | | January 29,
2005
(52 weeks) | |
| | (In millions, except per share amounts) | |
Sales | | $ | 76,000 | | $ | 70,235 | | $ | 66,111 | | $ | 60,553 | | $ | 56,434 | |
Net earnings (loss) | | 1,249 | | 1,181 | | 1,115 | | 958 | | (104 | ) |
Diluted earnings (loss) per share: | | | | | | | | | | | |
Net earnings (loss) | | 1.90 | | 1.69 | | 1.54 | | 1.31 | | (0.14 | ) |
Total assets | | 23,211 | | 22,293 | | 21,210 | | 20,478 | | 20,491 | |
Long-term liabilities, including obligations under capital leases and financing obligations | | 10,311 | | 8,696 | | 8,711 | | 9,377 | | 10,537 | |
Shareowners’ equity | | 5,176 | | 4,914 | | 4,923 | | 4,390 | | 3,619 | |
Cash dividends per common share | | 0.345 | | 0.29 | | 0.195 | | — | | — | |
| | | | | | | | | | | | | | | | |
10
ITEM 7. | MANAGEMENT’S DISCUSSION AND ANALYSIS OF FINANCIAL CONDITION AND RESULTS OF OPERATIONS. |
OUR BUSINESS
The Kroger Co. was founded in 1883 and incorporated in 1902. It is one of the nation’s largest retailers, as measured by revenue, operating 2,481 supermarket and multi-department stores under two dozen banners including Kroger, Ralphs, Fred Meyer, Food 4 Less, King Soopers, Smith’s, Fry’s, Fry’s Marketplace, Dillons, QFC and City Market. Of these stores, 781 have fuel centers. We also operate 771 convenience stores and 385 fine jewelry stores.
Kroger operates 40 manufacturing plants, primarily bakeries and dairies, which supply approximately 40% of the corporate brand units sold in our retail outlets.
Our revenues are earned and cash is generated as consumer products are sold to customers in our stores. We earn income predominately by selling products at price levels that produce revenues in excess of the costs we incur to make these products available to our customers. Such costs include procurement and distribution costs, facility occupancy and operational costs, and overhead expenses. Our operations are reported as a single reportable segment: the retail sale of merchandise to individual customers.
OUR 2008 PERFORMANCE
By focusing on the customer through our Customer 1st strategy, we were able to report solid results for fiscal year 2008 in a particularly tough economy. At the beginning of the year, we expected to grow supermarket identical sales, excluding fuel, by 3% to 5%. For 2008, supermarket identical sales, excluding fuel, were 5.0%, meeting the upper end of our original guidance.
At the outset of fiscal year 2008, Kroger’s earnings guidance was a range of $1.83 to $1.90 per diluted share. Our 2008 earnings was $1.90 per diluted share or $1.92 per diluted share, excluding the effect of a $.02 per diluted share charge for damage and disruption caused by Hurricane Ike. Our 2008 earnings of $1.92 per diluted share, excluding the charge for damage and disruption caused by Hurricane Ike, represents a growth rate of 13.6% over Kroger’s 2007 full-year earnings of $1.69 per diluted share. We believe that this growth plus Kroger’s dividend yield of more than 1%, creates a strong return for shareholders.
Our market share also rose in 2008. Based on our internal data and analysis, we estimate that our market share increased approximately 61 basis points in 2008 across our 42 major markets. We define a major market as one in which we operate nine or more stores. This is the fourth consecutive year Kroger has achieved significant market share gain. Over the past four years combined, Kroger’s market share in our major markets has increased approximately 225 basis points. Market share is critical to us because it allows us to leverage the fixed costs in our business over a wider revenue base. We hold the number one or number two market share position in 39 of or our 42 major markets. Our fundamental operating philosophy is to maintain and increase market share.
These market share results demonstrate to us that our long-term strategy is working. As population growth continues in the major markets where we operate, we intend to continue to grow Kroger’s business by maintaining our existing strong market share and by building on additional opportunities for sales growth. We estimate that approximately 45% of the share in our major markets — as much as $100 billion — is held by competitors who do not have Kroger’s economies of scale. Our economies of scale allow us to deliver increasing value to customers, which is a competitive edge, particularly in today’s economic climate.
Kroger’s business model is structured to produce sustainable earnings per share growth in a variety of economic and competitive conditions, primarily through strong identical sales growth. We believe this is the right approach to produce sustainable earnings growth over a long period of time. We recognize that continual investment in our Customer 1st strategy is necessary to drive strong, sustainable identical sales growth. We believe that this Customer 1st strategy along with our financial strategies are delivering value to customers, shareholders, bondholders, and our associates, and so we remain committed to our plan.
11
RESULTS OF OPERATIONS
The following discussion summarizes our operating results for 2008 compared to 2007 and for 2007 compared to 2006. Comparability is affected by certain income and expense items that fluctuated significantly between and among the periods.
Net Earnings
Net earnings totaled $1.2 billion for 2008, compared to net earnings totaling $1.2 billion in 2007 and $1.1 billion in 2006. The increase in our net earnings for 2008, compared to 2007 and 2006, resulted from strong non-fuel identical supermarket sales growth and strong fuel results. In addition, 2006 net earnings included a 53rd week.
Earnings per diluted share totaled $1.90 or $1.92, excluding the effect of a $.02 per diluted share charge for damage and disruption caused by Hurricane Ike, in 2008, compared to $1.69 per diluted share in 2007 and $1.54 per diluted share in 2006. Earnings per diluted share increased 13.6% in 2008, excluding the effect of a $.02 per diluted share charge for damage and disruption caused by Hurricane Ike, compared to 2007. Earnings per diluted share increased 15% in 2007, compared to 2006, after adjusting for the extra week in fiscal 2006. Net earnings in 2006 benefited from a 53rd week by an estimated $.07 per share. Our earnings per share growth in 2008, 2007 and 2006 resulted from increased net earnings, strong identical sales growth and the repurchase of Kroger stock. During fiscal 2008, we repurchased 24 million shares of Kroger stock for a total investment of $637 million. During fiscal 2007, we repurchased 53 million shares of our stock for a total investment of $1.4 billion. During fiscal 2006, we repurchased 29 million shares of Kroger stock for a total investment of $633 million.
Sales
Total Sales
(in millions)
| | 2008 | | Percentage
Increase | | 2007 | | Percentage
Increase | | 2006 | |
Total food store sales without fuel | | $ | 63,795 | | 6.1 | % | $ | 60,142 | | 4.2 | % | $ | 57,712 | |
Total food store fuel sales | | 7,464 | | 30.0 | % | 5,741 | | 28.9 | % | 4,455 | |
| | | | | | | | | | | |
Total food store sales | | $ | 71,259 | | 8.2 | % | $ | 65,883 | | 6.0 | % | $ | 62,167 | |
Other sales(1) | | 4,741 | | 8.9 | % | 4,352 | | 10.3 | % | 3,944 | |
| | | | | | | | | | | |
Total Sales | | $ | 76,000 | | 8.2 | % | $ | 70,235 | | 6.2 | % | $ | 66,111 | |
(1) Other sales primarily relate to sales at convenience stores, including fuel, jewelry stores and sales by our manufacturing plants to outside customers.
The growth in our total sales in 2008 over fiscal 2007 was primarily the result of identical supermarket sales increases, increased fuel gallon sales, and inflation across most departments. Identical supermarket sales and total sales, excluding fuel, increased due to increased transaction count and average transaction size, and inflation across all departments. After adjusting for the extra week in fiscal 2006, total sales increased 8.2% in 2007 over fiscal 2006.
We define a supermarket as identical when it has been in operation without expansion or relocation for five full quarters. Fuel center discounts received at our fuel centers and earned based on in-store purchases are included in all of the supermarket identical sales results calculations illustrated below. Differences between total supermarket sales and identical supermarket sales primarily relate to changes in supermarket square footage. Annualized identical supermarket sales include all sales at the Fred Meyer multi-department stores. We calculate annualized identical supermarket sales by adding together four quarters of identical supermarket sales. Our identical supermarket sales results are summarized in the table below, based on the 52-week period of 2008, compared to the 52-week period of the previous year. The identical store count in the table below represents the total number of identical supermarkets as of January 31, 2009 and February 2, 2008.
12
Identical Supermarket Sales
(in millions)
| | 2008 | | 2007 | |
Including supermarket fuel centers | | $ | 67,185 | | $ | 62,878 | |
Excluding supermarket fuel centers | | $ | 60,300 | | $ | 57,416 | |
| | | | | | | |
Including supermarket fuel centers | | 6.9 | % | 6.9 | % |
Excluding supermarket fuel centers | | 5.0 | % | 5.3 | % |
Identical 4th Quarter store count | | 2,369 | | 2,280 | |
We define a supermarket as comparable when it has been in operation for five full quarters, including expansions and relocations. As is the case for identical supermarket sales, fuel center discounts received at our fuel centers and earned based on in-store purchases are included in all of the supermarket comparable sales results calculations illustrated below. Annualized comparable supermarket sales include all Fred Meyer multi-department stores. We calculate annualized comparable supermarket sales by adding together four quarters of comparable sales. Our annualized comparable supermarket sales results are summarized in the table below, based on the 52-week period of 2008, compared to the same 52-week period of the previous year. The comparable store count in the table below represents the total number of comparable supermarkets as of January 31, 2009 and February 2, 2008.
Comparable Supermarket Sales
(in millions)
| | 2008 | | 2007 | |
Including supermarket fuel centers | | $ | 69,762 | | $ | 65,066 | |
Excluding supermarket fuel centers | | $ | 62,492 | | $ | 59,372 | |
| | | | | | | |
Including supermarket fuel centers | | 7.2 | % | 7.2 | % |
Excluding supermarket fuel centers | | 5.3 | % | 5.5 | % |
Comparable 4th Quarter store count | | 2,444 | | 2,352 | |
FIFO Gross Margin
We calculate First-In, First-Out (“FIFO”) Gross Margin as sales minus merchandise costs, including advertising, warehousing and transportation, but excluding the Last-In, First-Out (“LIFO”) charge. Merchandise costs exclude depreciation and rent expense. FIFO gross margin is an important measure used by management to evaluate merchandising and operational effectiveness.
Our FIFO gross margin rates were 23.20% in 2008, 23.65% in 2007 and 24.27% in 2006. Our retail fuel sales reduce our FIFO gross margin rate due to the very low FIFO gross margin on retail fuel sales as compared to non-fuel sales. Excluding the effect of retail fuel operations, our FIFO gross margin rates decreased 15 basis points in 2008, 20 basis points in 2007 and 26 basis points in 2006. The decrease in our non-fuel FIFO gross margin rate reflects our continued reinvestment of operating cost savings into lower prices for our customers. In addition, FIFO gross margin in 2008, compared to 2007, decreased due to high inflation in product costs.
LIFO Charge
The LIFO charge was $196 million in 2008, $154 million in 2007 and $50 million in 2006. Like many food retailers, we continued to experience product cost inflation in 2008 at levels that have not occurred for several years. This increase in product cost inflation caused the increase in the LIFO charge in 2008, compared to 2007 and 2006. In addition, product cost inflation in 2007, compared to 2006, caused the increase in the LIFO charge in 2007 compared to 2006.
Operating, General and Administrative Expenses
Operating, general and administrative (“OG&A”) expenses consist primarily of employee-related costs such as wages, health care benefit costs and retirement plan costs, utilities and credit card fees. Rent expense, depreciation and amortization expense, and interest expense are not included in OG&A.
13
OG&A expenses, as a percent of sales, were 16.95% in 2008, 17.31% in 2007 and 17.91% in 2006. The growth in our retail fuel sales reduces our OG&A rate due to the very low OG&A rate on retail fuel sales as compared to non-fuel sales. OG&A expenses, as a percent of sales excluding fuel, decreased 3 basis points in 2008, 33 basis points in 2007 and 9 basis points in 2006. The decrease in our OG&A rate in 2008, excluding the effect of retail fuel operations, was primarily the result of increased identical supermarkets sales growth and a settlement received from credit card processers, partially offset by the $25 million charge related to Hurricane Ike and increases in credit card fees and health care costs. The decrease in our OG&A rate in 2007, excluding the effect of retail fuel operations, was primarily the result of strong identical sales growth, increased productivity, and progress that was made in 2007 in controlling our utility, health care and pension costs. These improvements were partially offset by increases in credit card fees. Excluding the effect of retail fuel operations and expenses recorded for one-time legal reserves, our OG&A rate declined 16 basis points in 2006.
Rent Expense
Rent expense was $659 million in 2008, as compared to $644 million in 2007 and $649 million in 2006. Rent expense, as a percent of sales, was 0.87% in 2008, as compared to 0.92% in 2007 and 0.98% in 2006. The decrease in rent expense, as a percent of sales, reflects our increasing sales and our continued emphasis on owning rather than leasing whenever possible.
Depreciation and Amortization Expense
Depreciation expense was $1.4 billion in 2008, $1.4 billion in 2007 and $1.3 billion in 2006. The increases in depreciation and amortization expense were the result of capital expenditures totaling $2.2 billion in 2008, $2.1 billion in 2007 and $1.8 billion in 2006. Depreciation and amortization expense, as a percent of sales, was 1.90% in 2008, 1.93% in 2007 and 1.92% in 2006. The decrease in depreciation and amortization expense in 2008, compared to 2007, as a percent of sales, is primarily the result of increasing sales. The increase in our depreciation and amortization expense in 2007, compared to 2006, as a percent of sales, is due to an annual depreciation charge in both years with 2006 containing 53 weeks of sales due to the structure of our fiscal calendar.
Interest Expense
Net interest expense totaled $485 million in 2008, $474 million in 2007 and $488 million in 2006. The increase in interest expense in 2008, compared to 2007, was primarily the result of an increase in the average total debt balance for the year, partially offset by interest income related to the mark-to-market of ineffective fair value swaps. The decrease in interest expense in 2007, compared to 2006, was the result of replacing borrowings with new borrowings at a lower interest rate. The average total debt balance in 2007 was comparable to 2006.
Income Taxes
Our effective income tax rate was 36.5% in 2008, 35.4% in 2007 and 36.2% in 2006. The effective tax rates for those years differed from the federal statutory rate primarily due to the effect of state income taxes. In addition, the effective tax rate for 2007 differs from the expected federal statutory rate due to the resolution of some tax issues. The effective rate in 2006 includes an adjustment of some deferred tax balances.
During the third quarter of 2007, we resolved favorably some outstanding tax issues. This resulted in a 2007 tax benefit of approximately $40 million and reduced our effective tax rate by 1.9%.
In 2006, during the reconciliation of our deferred tax balances, and after the filing of our annual federal and state tax returns, we identified adjustments to be made in prior years’ deferred tax reconciliation. We corrected these deferred tax balances in our Consolidated Financial Statements for the year ended February 3, 2007, which resulted in a reduction of our fiscal 2006 provision for income tax expense of approximately $21 million and reduced the rate by 1.2%. We do not believe these adjustments are material to our Consolidated Financial Statements for the year ended February 3, 2007, or to any prior years’ Consolidated Financial Statements. As a result, we have not restated any prior year amounts.
14
COMMON STOCK REPURCHASE PROGRAM
We maintain stock repurchase programs that comply with Securities Exchange Act Rule 10b5-1 and allow for the orderly repurchase of our common stock, from time to time. We made open market purchases totaling $448 million in 2008, $1.2 billion in 2007 and $374 million in 2006 under these repurchase programs. In addition to these repurchase programs, in December 1999 we began a program to repurchase common stock to reduce dilution resulting from our employee stock option plans. This program is solely funded by proceeds from stock option exercises, and the tax benefit from these exercises. We repurchased approximately $189 million in 2008, $270 million in 2007 and $259 million in 2006 under the stock option programs.
In 2008, to preserve liquidity and financial flexibility, we reduced the amount of stock repurchased during the year, decreasing the cash used for stock purchases in 2008, compared to 2007.
CAPITAL EXPENDITURES
Capital expenditures, including changes in construction-in-progress payables and excluding acquisitions, totaled $2.2 billion in 2008 compared to $2.1 billion in 2007 and $1.8 billion in 2006. The increase in capital spending in 2008 compared to 2007 and 2006 was the result of increasing our focus on remodels, merchandising and productivity projects. The table below shows our supermarket storing activity and our total food store square footage:
Supermarket Storing Activity
| | 2008 | | 2007 | | 2006 | |
Beginning of year | | 2,486 | | 2,468 | | 2,507 | |
Opened | | 21 | | 23 | | 20 | |
Opened (relocation) | | 14 | | 9 | | 17 | |
Acquired | | 6 | | 38 | | 1 | |
Acquired (relocation) | | 3 | | 1 | | — | |
Closed (operational) | | (32 | ) | (43 | ) | (60 | ) |
Closed (relocation) | | (17 | ) | (10 | ) | (17 | ) |
| | | | | | | |
End of year | | 2,481 | | 2,486 | | 2,468 | |
| | | | | | | |
Total food store square footage (in millions) | | 147 | | 145 | | 142 | |
CRITICAL ACCOUNTING POLICIES
We have chosen accounting policies that we believe are appropriate to report accurately and fairly our operating results and financial position, and we apply those accounting policies in a consistent manner. Our significant accounting policies are summarized in Note 1 to the Consolidated Financial Statements.
The preparation of financial statements in conformity with generally accepted accounting principles (“GAAP”) requires us to make estimates and assumptions that affect the reported amounts of assets, liabilities, revenues, and expenses, and related disclosures of contingent assets and liabilities. We base our estimates on historical experience and other factors we believe to be reasonable under the circumstances, the results of which form the basis for making judgments about the carrying values of assets and liabilities that are not readily apparent from other sources. Actual results could differ from those estimates.
We believe that the following accounting policies are the most critical in the preparation of our financial statements because they involve the most difficult, subjective or complex judgments about the effect of matters that are inherently uncertain.
15
Self-Insurance Costs
We primarily are self-insured for costs related to workers’ compensation and general liability claims. The liabilities represent our best estimate, using generally accepted actuarial reserving methods, of the ultimate obligations for reported claims plus those incurred but not reported for all claims incurred through January 31, 2009. We establish case reserves for reported claims using case-basis evaluation of the underlying claim data and we update as information becomes known.
For both workers’ compensation and general liability claims, we have purchased stop-loss coverage to limit our exposure to any significant exposure on a per claim basis. We are insured for covered costs in excess of these per claim limits. We account for the liabilities for workers’ compensation claims on a present value basis utilizing a risk-adjusted discount rate. A 25 basis point decrease in our discount rate would increase our liability by approximately $4 million. General liability claims are not discounted.
We are also similarly self-insured for property-related losses. We have purchased stop-loss coverage to limit our exposure to losses in excess of $25 million on a per claim basis, except in the case of an earthquake, for which stop-loss coverage is in excess of $50 million per claim, up to $200 million per claim in California and $300 million outside of California.
The assumptions underlying the ultimate costs of existing claim losses are subject to a high degree of unpredictability, which can affect the liability recorded for such claims. For example, variability in inflation rates of health care costs inherent in these claims can affect the amounts realized. Similarly, changes in legal trends and interpretations, as well as a change in the nature and method of how claims are settled can affect ultimate costs. Our estimates of liabilities incurred do not anticipate significant changes in historical trends for these variables, and any changes could have a considerable effect on future claim costs and currently recorded liabilities.
Impairments of Long-Lived Assets
In accordance with Statement of Financial Accounting Standards (“SFAS”) No. 144, Accounting for the Impairment or Disposal of Long-Lived Assets, we monitor the carrying value of long-lived assets for potential impairment each quarter based on whether certain trigger events have occurred. These events include current period losses combined with a history of losses or a projection of continuing losses or a significant decrease in the market value of an asset. When a trigger event occurs, we perform an impairment calculation, comparing projected undiscounted cash flows, utilizing current cash flow information and expected growth rates related to specific stores, to the carrying value for those stores. If we identify impairment for long-lived assets to be held and used, we compare the assets’ current carrying value to the assets’ fair value. Fair value is determined based on market values or discounted future cash flows. We record impairment when the carrying value exceeds fair market value. With respect to owned property and equipment held for disposal, we adjust the value of the property and equipment to reflect recoverable values based on our previous efforts to dispose of similar assets and current economic conditions. We recognize impairment for the excess of the carrying value over the estimated fair market value, reduced by estimated direct costs of disposal. We recorded asset impairments in the normal course of business totaling $26 million in 2008, $24 million in 2007 and $61 million in 2006. We record costs to reduce the carrying value of long-lived assets in the Consolidated Statements of Operations as “Operating, general and administrative” expense.
The factors that most significantly affect the impairment calculation are our estimates of future cash flows. Our cash flow projections look several years into the future and include assumptions on variables such as inflation, the economy and market competition. Application of alternative assumptions and definitions, such as reviewing long-lived assets for impairment at a different organizational level, could produce significantly different results.
Goodwill
We review goodwill for impairment during the fourth quarter of each year, and also upon the occurrence of trigger events. We perform reviews at the operating division level. Generally, fair value is determined using a multiple of earnings, or discounted projected future cash flows, and we compare fair value to the carrying value of a division for purposes of identifying potential impairment. We base projected future cash flows on management’s knowledge of the current operating environment and expectations for the future. If we identify potential for impairment, we measure the fair value of a division against the fair value of its underlying assets and liabilities, excluding goodwill, to estimate an implied fair value of the division’s goodwill. We recognize goodwill impairment for any excess of the carrying value of the division’s goodwill over the implied fair value. If actual results differ significantly from anticipated future results for certain reporting units, we would need to recognize an impairment loss for any excess of the carrying value of the division’s goodwill over the implied fair value. Results of the goodwill impairment reviews performed during 2008, 2007 and 2006 are summarized in Note 2 to the Consolidated Financial Statements.
16
The annual impairment review requires the extensive use of accounting judgment and financial estimates. Application of alternative assumptions and definitions, such as reviewing goodwill for impairment at a different organizational level, could produce significantly different results. Similar to our policy on impairment of long-lived assets, the cash flow projections embedded in our goodwill impairment reviews can be affected by several items such as inflation, business valuations in the market, the economy and market competition.
Store Closing Costs
We provide for closed store liabilities relating to the present value of the estimated remaining noncancellable lease payments after the closing date, net of estimated subtenant income. We estimate the net lease liabilities using a discount rate to calculate the present value of the remaining net rent payments on closed stores. We usually pay closed store lease liabilities over the lease terms associated with the closed stores, which generally have remaining terms ranging from one to 20 years. Adjustments to closed store liabilities primarily relate to changes in subtenant income and actual exit costs differing from original estimates. We make adjustments for changes in estimates in the period in which the change becomes known. We review store closing liabilities quarterly to ensure that any accrued amount that is not a sufficient estimate of future costs, or that no longer is needed for its originally intended purpose, is adjusted to earnings in the proper period.
We estimate subtenant income, future cash flows and asset recovery values based on our experience and knowledge of the market in which the closed store is located, our previous efforts to dispose of similar assets and current economic conditions. The ultimate cost of the disposition of the leases and the related assets is affected by current real estate markets, inflation rates and general economic conditions.
We reduce owned stores held for disposal to their estimated net realizable value. We account for costs to reduce the carrying values of property, equipment and leasehold improvements in accordance with our policy on impairment of long-lived assets. We classify inventory write-downs in connection with store closings, if any, in “Merchandise costs.” We expense costs to transfer inventory and equipment from closed stores as they are incurred.
Post-Retirement Benefit Plans
(a) Company-sponsored defined benefit Pension Plans
Effective February 3, 2007, we adoptedWe account for our defined benefit pension plans using the recognition and disclosure provisions of SFAS No. 158,Employers’ Accounting for Defined Benefit Pension and Other Postretirement Plans-an amendment of FASB Statements No. 87, 99, 106 and 123(R)132(R) (SFAS 158), which requiredrequire the recognition of the funded status of its retirement plans on the Consolidated Balance Sheet. We are now required to record, as a component of Accumulated Other Comprehensive Income (“AOCI”), actuarial gains or losses, prior service costs or credits and transition obligations that have not yet been recognized. We adopted the measurement date provisions of SFAS 158 effective February 3, 2008. The majority of our pension and postretirement plans previously used a December 31 measurement date. All plans are now measured as of our fiscal year end. The non-cash effect of the adoption of the measurement date provisions of SFAS 158 decreased shareowners’ equity by approximately $5 million ($3 million after-tax) and increased long-term liabilities by approximately $5 million. There was no effect on our results of operations.
The determination of our obligation and expense for Company-sponsored pension plans and other post-retirement benefits is dependent upon our selection of assumptions used by actuaries in calculating those amounts. Those assumptions are described in Note 1413 to the Consolidated Financial Statements and include, among others, the discount rate, the expected long-term rate of return on plan assets, average life expectancy and the rate of increases in compensation and health care costs. Actual results that differ from our assumptions are accumulated and amortized over future periods and, therefore, generally affect our recognized expense and recorded obligation in future periods. While we believe that our assumptions are appropriate, significant differences in our actual experience or significant changes in our assumptions, including the discount rate used and the expected return on plan assets, may materially affect our pension and other post-retirement obligations and our future expense. Note 1413 to the Consolidated Financial Statements discusses the effect of a 1% change in the assumed health care cost trend rate on other post-retirement benefit costs and the related liability.
17
The objective of our discount rate assumption is to reflect the rate at which the pension benefits could be effectively settled. In making this determination, we take into account the timing and amount of benefits that would be available under the plans. Our methodology for selecting the discount rate as of year-end 20062008 was to match the plan’s cash flows to that of a yield curve that provides the equivalent yields on zero-coupon corporate bonds for each maturity. Benefit cash flows due in a particular year can be “settled” theoretically by “investing” them in the zero-coupon bond that matures in the same year. The discount rate is the single rate that produces the same present value of cash flows. The selection of the 5.90%7.00% discount rate as of year-end 20062008 represents the equivalent single rate under a broad-market AA yield curve constructed by ouran outside consultant, Mercer Human Resource Consulting.consultant. We utilized a discount rate of 5.70%6.50% for year-end 2005.2007. The 2050 basis point increase in the discount rate decreased the projected pension benefit obligation as of February 3, 2007,January 31, 2009, by approximately $68$147 million.
To determine the expected return on pension plan assets, we consider current and forecasted plan asset allocations as well as historical and forecasted returns on various asset categories. For 20062008 and 2005,2007, we assumed a pension plan investment return rate of 8.5%. Our pension plan’s average return was 9.7%4.1% for the 10 calendar years ended December 31, 2006,2008, net of all investment management fees and expenses. Our actual return forexpenses, primarily due to the poor performance of the financial markets in 2008. The value of all investments in our Company-sponsored defined benefit pension planplans during the calendar year ending December 31, 2006, on that same basis, was 13.4%2008, net of investment management fees and expenses declined 26.1%. We believe theour 8.5% pension return assumption is appropriate because we do not expect that future returns will achieve the same level of performanceperformances as the very long-term historical average annual return.return (for example, the S&P 500 Index has returned 8.4% annually on a compound basis for the 20 years ending December 31, 2008) for the various markets in which the plan invests. We have been advised that during 2007 and 2008, the trustees plan to reduce from 50% to 42% the allocation of pension plan assets to domestic and international equities and increase from 18% to 27% the allocation to non-core assets, including inflation-linked bonds, commodities, hedge funds and real estate. Furthermore, in order to augment the return on domestic equities and investment grade debt securities during 2007 and 2008,2009, the trustees plan to increase hedge funds within these sectors from 7% to 22%.the allocation of non-core assets, including high yield debt securities, commodities and real estate. Collectively, these changes should improve the diversification of pension plan assets. The trustees have advised us that they expect these changes will have little effect on the total returnportfolio risk but will reduceincrease the likelihood of achieving the 8.5% expected volatilityrate of the return. See Note 1413 to the Consolidated Financial Statements for more information on the asset allocations of pension plan assets.
Sensitivity to changes in the major assumptions used in the calculation of Kroger’s pension plan liabilities for the Qualified Plansqualified plans is illustrated below (in millions).
|
| Percentage
Point Change |
| Projected Benefit
Obligation
Decrease/(Increase) |
| Expense
Decrease/(Increase) | |
|
| Percentage | | Obligation | | Expense |
| Point Change | | Decrease/(Increase) | | Decrease/(Increase) |
Discount Rate | | +/- 1.0 | % | $ | 257/$(309 | 350/($306) | ) $ | 13/$(28 | $ | 38/($36 | ) |
Expected Return on Assets | | +/- 1.0 | % | — | | $ | 21/$(21 | ) |
| | | — | | | $ | 21/($21 | ) | | | |
In 2005, we updated the mortality table used to determine average life expectancy in the calculation of our pension obligation to the RP-2000 Projected to 2015 mortality table. The change in this assumption increased our projected benefit obligation by approximately $93 million at the time of the change, and is reflected in unrecognized actuarial (gain) loss as of the measurement date.
We contributed $20 million in 2008, $52 million in 2007 and $150 million $300 million and $35 millionin 2006 to our Company-sponsored defined benefit pension plans in 2006, 2005 and 2004, respectively.plans. Although we areKroger is not required to make cash contributions to ourits Company-sponsored defined benefit pension plans during fiscal 2007,2009, we contributed $50made a $200 million to the planscash contribution on February 5, 2007. We may elect to make additional voluntary contributions to our Company-sponsored pension plans in order to maintain our desired funding status.2, 2009. Additional contributions may be made if our cash flows from operations exceed our expectations.required under the Pension Protection Act to avoid any benefit restrictions. We expect any electivevoluntary contributions made during 20072009 will decreasereduce our minimum required contributions in future years. Among other things, investment performance of plan assets, the interest rates required to be used to calculate the pension obligations, and future changes in legislation, will determine the amounts of any additional contributions.
Effective January 1,
Net periodic benefit cost decreased in 2008 and 2007 compared to 2006 due to participants in the Cash Balance formula of the Consolidated Retirement Benefit Plan was replaced withbeing moved to a defined contribution 401(k) Retirement Savings Account Plan, whichretirement savings account plan effective January 1, 2007. Participants under that formula continue to earn interest on prior contributions but no additional pay credits will providebe earned. The 401(k) retirement savings plan provides to eligible employees both Company matching contributions and other Companyautomatic contributions from Kroger based uponon participant contributions, plan compensation, and length of service, to eligible employees.service. We expect to make matching contributionscontributed and expensed $92 million in 2008 and $90 million in 2007 of approximately 75 million.to employee 401(k) retirement savings accounts.
(b) Multi-Employer Plans
We also contribute to various multi-employer pension plans based on obligations arising from most of our collective bargaining agreements. These plans provide retirement benefits to participants based on their service to contributing employers. The benefits are paid from assets held in trust for that purpose. Trustees are appointed in equal number by employers and unions. The trustees typically are responsible for determining the level of benefits to be provided to participants as well as for such matters as the investment of the assets and the administration of the plans.
18
We recognize expense in connection with these plans as contributions are funded, in accordance with GAAP. We made contributions to these plans, and recognized expense, of $219 million in 2008, $207 million in 2007, and $204 million in 2006, $196 million in 2005, and $180 million in 2004. We estimate we would have contributed an additional $2 million in 2004 but our obligation to contribute was suspended during the southern California labor dispute.2006.
Based on the most recent information available to us, we believe that the present value of actuarially accrued liabilities in most or all of these multi-employer plans substantially exceeds the value of the assets held in trust to pay benefits. We have attempted to estimate the amount by which these liabilities exceed the assets, (i.e., the amount of underfunding), as of December 31, 2006.Because2008. Because Kroger is only one of a number of employers contributing to these plans, we also have attempted to estimate the ratio of Kroger’s contributions to the total of all contributions to these plans in a year as a way of assessing Kroger’s “share” of the underfunding. Nonetheless, the underfunding is not a direct obligation or liability of Kroger or of any employer. As of December 31, 2006,2008, we estimate that Kroger’s share of the underfunding of multi-employer plans to which Kroger contributes was $600 million to $800 million,$3.0 billion, pre-tax, or $375 million to $500 million,$1.9 billion, after-tax. This represents a decreasean increase in the amount of underfunding estimated as of December 31, 2005. This decrease2008, compared to December 31, 2007. The increase in the amount of underfunding is attributable to among other things, the continuing benefit of plan design changes and the investment returns on assets held in trust for the plans during 2006.recent market downturn. Our estimate is based on the best information available to us including actuarial evaluations and other data (that include the estimates of others), and such information may be outdated or otherwise unreliable. Our estimate is imprecise and not necessarily reliable.
We have made and disclosed this estimate not because this underfunding is a direct liability of Kroger. Rather, we believe the underfunding is likely to have important consequences. We expect our contributions to these multi-employer plans will continue to increase each year, and therefore the expense we recognize under GAAP will increase. In 2006,2008, our contributions to these plans increased approximately 4%6% over the prior year and have grown at a compound annual rate of approximately 6% since 2003.2004. We do not expect a significant increase in our contributions to increase by approximately 1.0%multi-employer pension plans in 2007. The amount of increases in 20072009, compared to 2008, subject to collective bargaining and beyond has been favorably affected by significant improvement incapital market conditions. We believe our contributions to multi-employer pension plans could as much as double over the values of assets held in trusts, by the labor agreements negotiated in southern California and elsewhere in recentnext several years, and by related trustee actions. Although underfunding can result in the imposition of excise taxes on contributing employers, increased contributions canafter 2009, to reduce underfunding so that excise taxes are not triggered. Our estimate of future contribution increases takes into account the avoidance of those taxes.this underfunding. Finally, underfunding means that, in the event we were to exit certain markets or otherwise cease making contributions to these funds, we could trigger a substantial withdrawal liability. Any adjustment for withdrawal liability will be recorded when it is probable that a liability exists and can be reasonably estimated, in accordance with SFAS No. 87, Employers’ Accounting for Pensions.
The amount of underfunding described above is an estimate and is disclosed forcould change based on contract negotiations, returns on the purpose described.assets held in the multi-employer plans and benefit payments. The amount could decline, and Kroger’s future expense would be favorably affected, if the values of netthe assets held in the trust significantly increase or if further changes occur through collective bargaining, trustee action or favorable legislation. On the other hand, Kroger’s share of the underfunding wouldcould increase and Kroger’s future expense could be adversely affected if netthe asset values decline, if employers currently contributing to these funds cease participation or if changes occur through collective bargaining, trustee action or adverse legislation.
Deferred Rent
We recognize rent holidays, including the time period during which we have access to the property for construction of buildings or improvements, as well as construction allowances and escalating rent provisions on a straight-line basis over the term of the lease. The deferred amount is included in Other Current Liabilities and Other Long-Term Liabilities on the Consolidated Balance Sheets.
Fair Value of Financial Instruments
Tax Contingencies
In September 2006, the FASB issued SFAS No. 157, Fair Value Measurements (SFAS 157), which defines fair value, establishes a market-based framework for measuring fair value and expands disclosures about fair value measurements. SFAS 157 does not expand or require any new fair value measurements. SFAS 157 is effective for financial assets and financial liabilities for fiscal years beginning after November 15, 2007. FASB Staff Position (FSP) 157-2 Partial Deferral of the Effective Date of Statement No. 157 (FSP 157-2), deferred the effective date of SFAS 157 for most non-financial assets and non-financial liabilities to fiscal years beginning after November 15, 2008. Effective February 3, 2008, we adopted SFAS 157, except for non-financial assets and non-financial liabilities which are deferred until February 1, 2009 by FSP 157-2.
Various taxing authorities periodically audit
19
SFAS 157 establishes a fair value hierarchy that prioritizes the inputs used to measure fair value. The three levels of the fair value hierarchy defined by SFAS 157 are as follows:
Level 1 — Quoted prices are available in active markets for identical assets or liabilities;
Level 2 — Pricing inputs are other than quoted prices in active markets included in Level 1, which are either directly or indirectly observable;
Level 3 — Unobservable pricing inputs in which little or no market activity exists, therefore requiring an entity to develop its own assumptions about the assumptions that market participants would use in pricing an asset or liability.
For those financial instruments carried at fair value in the consolidated financial statements, the following table summarizes the fair value of these instruments at January 31, 2009:
Fair Value Measurements Using
(in millions)
| | Quoted Prices in
Active Markets
for Identical
Assets
(Level 1) | | Significant Other
Observable Inputs
(Level 2) | | Significant
Unobservable
Inputs
(Level 3) | | Total | |
Available-for-Sale Securities | | $ | 11 | | $ | — | | $ | — | | $ | 11 | |
| | | | | | | | | | | | | |
Variable Interest Entities
In December 2008, the FASB issued FAS 140-4 and FIN 46(R)-8, Disclosures by Public Entities (Enterprises) about Transfers of Financial Assets and Interests in Variable Interest Entities (FAS 140-4 and FIN 46(R)-8).FAS 140-4 and FIN 46(R)-8 require additional disclosures about an entity’s involvement with variable interest entities and transfers of financial assets. Effective January 31, 2009, we adopted FAS 140-4 and FIN 46(R)-8.
In the first quarter of 2008, we made an investment in The Little Clinic LLC (“TLC”). TLC operates supermarket walk-in medical clinics in seven states, primarily in the Midwest and Southeast. At the date of investment, TLC was determined to be a variable-interest entity (“VIE”) under FASB Interpretation No. 46R, Consolidation of Variable Interest Entities (FIN 46R), with Kroger being the primary beneficiary. We were deemed the primary beneficiary due to our income tax returns. These audits include questions regardingcurrent ownership interest and half of our tax filing positions, includingwritten put options being at a floor price. As a result, we consolidated TLC in accordance with FIN 46R. The minority interest was recorded at fair value on the timing andacquisition date. The fair value of TLC was determined based on the amount of deductionsthe investment made by Kroger and the allocationpercentage acquired. Our assessment of incomegoodwill represents the excess of this amount over the fair value of TLC’s net assets as of the investment date. Creditors of TLC have no recourse to various tax jurisdictions.the general credit of Kroger. Conversely, creditors of Kroger have no recourse to the assets of TLC. In evaluatingaddition, if requested by TLC’s Board of Directors by January 1, 2010, we have agreed to make a pro rata portion of an additional capital contribution.
20
The table below shows the exposures connected with these various tax filing positions, including stateunaudited amounts of assets and local taxes,liabilities from TLC included in our consolidated results, after eliminating intercompany items, as of January 31, 2009 (in millions of dollars):
| | 2008 | |
Current assets | | $ | 31 | |
Property, plant and equipment, net | | 7 | |
Goodwill | | 102 | |
Other assets | | 1 | |
| | | |
Total Assets | | $ | 141 | |
| | | |
Current liabilities | | $ | 4 | |
| | | |
Minority interests | | $ | 82 | |
In the fourth quarter of 2008, we record allowances for probable exposures. A numberbecame the primary beneficiary of years may elapse beforei-wireless, LLC a particular matter, forVIE in which we have established an allowance, is auditeda 25% ownership interest. We were deemed the primary beneficiary due to our current ownership interest, $25 million line of credit guarantee, and fully resolved. As$8 million loan to i-wireless, LLC. We became the primary beneficiary, in the fourth quarter of February 3, 2007, tax years 2002 through 2004 were undergoing examination by the Internal Revenue Service.
2008, under FIN 46R after lending $8 million to i-wireless, LLC. i-wireless, LLC sells prepaid phones primarily in our stores. The establishmentminority interest was recorded at fair value. The fair value of our tax contingency allowances reliesi-wireless, LLC was determined based on the judgmentamount of management to estimate the exposures associated with our various filing positions. Although management believes those estimatesinvestment made by Kroger in the fourth quarter of 2007 and judgments are reasonable, actual results could differ, resulting in gains or losses that may be material to our Consolidated Statementsthe percentage acquired. Our assessment of Operations.
Togoodwill represents the extent that we prevail in matters for which allowances have been established, or are required to pay amounts in excess of these allowances, our effective tax rate in any given financial statement period could be materially affected. An unfavorable tax settlement could require usethis amount over the fair value of cash and result in an increasei-wireless, LLC net assets as of the date of the loan. We have guaranteed the indebtedness of i-wireless, LLC, up to $25 million, which is collateralized by $8 million of inventory located in our effective tax rate instores. The creditors of Kroger have no recourse to the yearassets of resolution. A favorable tax settlement would be recognized as a reductioni-wireless, LLC.
The table below shows the preliminary and unaudited amounts of assets and liabilities from i-wireless, LLC included in our effective tax rate in the yearconsolidated results, after eliminating intercompany items, as of resolution.January 31, 2009 (in millions of dollars):
| | 2008 | |
Current assets | | $ | 10 | |
Property, plant and equipment, net | | 2 | |
Goodwill | | 25 | |
Other assets | | 5 | |
| | | |
Total Assets | | $ | 42 | |
| | | |
Current liabilities | | $ | 5 | |
| | | |
Long-term debt | | $ | 30 | |
| | | |
Minority interests | | $ | 1 | |
Share-Based Compensation Expense
Effective January 29, 2006, we adoptedWe account for stock options under the fair value recognition provisions of SFAS No. 123(R),Share-Based Payment, using the modified prospective transition method and, therefore, have not restated results for prior periods. (SFAS 123(R)). Under this method, we recognize compensation expense for all share-based payments granted on or after January 29, 2006, as well as all share-based payments granted prior to, but not yet vested as of, January 29, 2006, in accordance with SFAS No. 123(R). Under the fair value recognition provisions of SFAS No. 123(R), we recognize share-based compensation expense, net of an estimated forfeiture rate, over the requisite service period of the award.
Prior to the adoption of In addition, we account for restricted stock awards under SFAS No. 123(R), we accounted for share-based payments under Accounting Principles Board (“APB”) Opinion No. 25,Accounting for Stock Issued to Employees and the disclosure provisions of SFAS No. 123, as amended.. We recognized compensation expense for all share-based awards described above using the straight-line attribution method applied to the fair value of each option grant, over the requisite service period associated with each award. The requisite service period is typically consistent with the vesting period, except as noted below. Because awards typically vest evenly over the requisite service period, compensation cost recognized in 2006 is at least equal to the grant-date fair value of the vested portion of all outstanding options.
The weighted-average fair value of stock options granted during 2006, 2005 and 2004 was $6.90, $7.70 and $7.91, respectively. The fair value of each stock option grant was estimated on the date of grant using the Black-Scholes option-pricing model, based on the assumptions shown in the table below. The Black-Scholes model utilizes extensive accounting judgment and financial estimates, including the term employees are expected to retain their stock options before exercising them, the volatility of our stock price over that expected term, the dividend yield over the term and the number of awards expected to be forfeited before they vest. Using alternative assumptions in the calculation of fair value would produce fair values for stock option grants that could be different than those used to record share-based compensation expense in the Consolidated Statements of Operations.
The following table reflects the weighted-average assumptions used for grants awarded to option holders.
| | 2006 | | 2005 | | 2004 |
| Weighted average expected volatility | 27.60 | % | | 30.83 | % | | 30.13 | % |
| Weighted average risk-free interest rate | 5.07 | % | | 4.11 | % | | 3.99 | % |
| Expected dividend yield | 1.50 | % | | N/A | | | N/A | |
| Expected term | 7.5 years | | | 8.7 years | | | 8.7 years | |
The weighted-average risk-free interest rate was based on the yield of a treasury note as of the grant date, continuously compounded, which matures at a date that approximates the expected term of the options. Prior to 2006, we did not pay a dividend, so an expected dividend rate was not included in the determination of fair value for options granted during fiscal year 2005. Using a dividend yield of 1.50% to value options issued in 2005 would have decreased the fair value of each option by approximately $1.60. We determined expected volatility based upon historical stock volatilities. We also considered implied volatility. We determined expected term based upon a combination of historical exercise and cancellation experience, as well as estimates of expected future exercise and cancellation experience.
Under SFAS No. 123(R), we record expense for restricted stock awards in an amount equal to the fair market value of the underlying stock on the grant date of the award.
In 2006, we recognized total stock compensation expense of $72 million. This included $50 million for stock options and $22 million for restricted shares. A total of $18 million of the restricted stock expense was attributable to the wider distribution of restricted shares incorporated into the first quarter 2006 grant of share-based awards (as described in Note 10 to the Consolidated Financial Statements), and the remaining $4 million of restricted stock expense related to previously issued restricted stock awards. The incremental compensation expense attributable to the adoption of SFAS No. 123(R) in 2006 was $68 million, pre-tax, or $43 million and $0.06 per diluted share, after tax. In 2005, we recognized stock compensation cost of $7 million, pre-tax, related entirely to restricted stock grants.
These costs were recognized as operating, general and administrative costs in our Company’s Consolidated Statements of Operations. The cumulative effect of applying a forfeiture rate to unvested restricted shares at January 29, 2006 was not material. The pro forma earnings effect of stock options in prior years, in accordance with SFAS No. 123, is described below:
| (in millions, except per share amounts) | 2005 | | 2004 |
| Net earnings (loss), as reported | $ | 958 | | | $ | (104 | ) |
| Stock-based compensation expense included in net earnings, net of | | | | | | | |
| income tax benefits | | 5 | | | | 8 | |
| Total stock-based compensation expense determined under fair value | | | | | | | |
| method for all awards, net of income tax benefits(1) | | (34 | ) | | | (48 | ) |
| Pro forma net earnings (loss) | $ | 929 | | | $ | (144 | ) |
| |
| Earnings (loss) per basic common share, as reported | $ | 1.32 | | | $ | (0.14 | ) |
| Pro forma earnings (loss) per basic common share | $ | 1.28 | | | $ | (0.20 | ) |
| Earnings (loss) per diluted common share, as reported | $ | 1.31 | | | $ | (0.14 | ) |
| Pro forma earnings (loss) per diluted common share | $ | 1.27 | | | $ | (0.20 | ) |
(1) | | Refer to Note 10 of our Consolidated Financial Statements for a summary of the assumptions used for options issued in each year at an option price equal to the fair market value of the stock at the date of the grant. |
As of February 3, 2007, we had $92 million of total unrecognized compensation expense related to non-vested share-based compensation arrangements granted under equity award, plans. We expected to recognize this cost over a weighted-average period of approximately one year. The total fair value of options that vested in 2006 was $44 million.
For share-based awards granted prior to the adoption of SFAS No. 123(R), the Company’s stock option grants generally contained retirement-eligibility provisions that caused the options to vest upon the earlier of the stated vesting date or retirement. We calculated compensation expense over the stated vesting periods, regardless of whether certain employees became retirement-eligible duringperiod the respective vesting periods. Upon the adoption of SFAS No. 123(R), we continued this method of recognizing compensation expense of awards granted prior to the adoption of SFAS No. 123(R). For awards granted on or after January 29, 2006,options vest based on the stated vesting date, even if an employee retires prior to the vesting date. However, the requisite service period ends on the employee’s retirement-eligible date. As a result, we recognize expense for stock option grants containing such retirement-eligibility provisions over the shorter of the vesting period or the period until employees become retirement-eligible (the requisite service period). As a result of retirement eligibility provisions in stock option awards granted on or after January 29, 2006, we recognized approximately $6 million of compensation expense in 2006 prior to the completion of stated vesting periods.lapse.
Shares issued as a result of stock option exercises may be newly issued shares or reissued treasury shares. We expect to reissue shares held in treasury upon exercise of these options.
Inventories21
Inventories
Inventories are stated at the lower of cost (principally on a LIFO basis) or market. In total, approximately 98% in 2008 and 97% in 2007 of inventories for 2006 and 2005, respectively, were valued using the LIFO method. Cost for the balance of the inventories was determined using the first-in, first-out (“FIFO”)FIFO method. Replacement cost was higher than the carrying amount by $450$800 million at January 31, 2009, and by $604 million at February 3, 2007, and by $400 million at January 28, 2006.2, 2008. We follow the Link-Chain, Dollar-Value LIFO method for purposes of calculating our LIFO charge or credit.
The
We follow the item-cost method of accounting to determine inventory cost before the LIFO adjustment is followed for substantially all store inventories at our supermarket divisions. This method involves counting each item in inventory, assigning costs to each of these items based on the actual purchase costs (net of vendor allowances and cash discounts) of each item and recording the actual cost of items sold. The item-cost method of accounting allows for more accurate reporting of periodic inventory balances and enables management to more precisely manage inventory and purchasing levels when compared to the methodology followed under the retail method of accounting.
We evaluate inventory shortages throughout the year based on actual physical counts in our facilities. We record allowances for inventory shortages based on the results of recent physical counts to provide for estimated shortages from the last physical count to the financial statement date.
Vendor Allowances
We recognize all vendor allowances as a reduction in merchandise costs when the related product is sold. In most cases, vendor allowances are applied to the related product by item, and therefore reduce the carrying value of inventory by item. When it is not practicable to allocate vendor allowances to the product by item, we recognize vendor allowances are recognized as a reduction in merchandise costs based on inventory turns and recognized as the product is sold. We recognized approximately $3.5 billion in 2008, $3.6 billion in 2007 and $3.3 billion $3.2 billion and $3.1 billionin 2006 of vendor allowances as a reduction in merchandise costs in 2006, 2005 and 2004, respectively.costs. We recognized more than 80%85% of all vendor allowances in the item cost with the remainder being based on inventory turns.
22
LIQUIDITYAND CAPITAL RESOURCES
Cash Flow Information
Net cash provided by operating activities
We generated $2,351 million$2.9 billion of cash from operations in 20062008 compared to $2,192 million$2.6 billion in 20052007 and $2,330 million$2.4 billion in 2004.2006. The increase in cash generated from operating activities was primarily due to strong operating results adjusted for non-cash expenses. In addition, to changes in net earnings, changes in our operating assets and liabilities also affectaffected the amount of cash provided by our operating activities. During 2006, weWe realized a $129 million decreasedecreases in cash from changes in operating assets and liabilities of $411 million in 2008, $164 million in 2007 and $129 million in 2006. The increase in the change in operating assets and liabilities in 2008, compared to a $121 million2007, is primarily due to an increase in income taxes receivable. The increase in the change in operating assets and a $116 million decrease during 2005 and 2004, respectively.liabilities in 2007, compared to 2006, is primarily attributable to an increase in forward inventory buying activity. These amounts are also net of cash contributions to our Company-sponsored defined benefit pension plans totaling $150$20 million in 2006, $3002008, $52 million in 20052007, and $35 million$150 in 2004.2006.
The amount of cash paid for income taxes in 2006 was higher than the amounts paid in 2005 and 2004 due to higher net earnings. In addition, the bonus depreciation provision, which expired in December 2004, reduced our cash taxes by approximately $90 million in 2004. This benefit reversed in 2005 and increased our cash taxes by approximately $71 and $108 million in 2006 and 2005, respectively.
Net cash used by investing activities
Cash used by investing activities was $1,587 million$2.2 billion in 2006,2008, compared to $1,279 million$2.2 billion in 20052007 and $1,608 million$1.6 billion in 2004.2006. Our use of cash for investing activities was consistent in 2008, compared to 2007. The amount of cash used by investing activities increased in 2007, compared to 2006, due primarily to increasedhigher capital spending partially offset by higher proceeds from the sale of assets.and payments for two acquisitions. Capital expenditures, including changes in construction-in-progress payables and excluding acquisitions, were $1,777 million, $1,306 million and $1,634$2.2 billion in 2006, 20052008, $2.1 billion in 2007 and 2004, respectively.$1.8 billion in 2006. Refer to the Capital Expenditures section for an overview of our supermarket storing activity during the last three years.
Net cash used by financing activities
Financing activities used $785$769 million of cash in 20062008 compared to $847$310 million in 20052007 and $737$785 million in 2004. Lower2006. The increase in the amount of cash used in 2008, compared to 2007, was primarily a result of payments for debt reduction in 2006 were partiallyon long term-debt and the bank revolver, offset by increaseddecreased stock repurchase activitiesrepurchases. The decrease in the amount of cash used in 2007, compared to 2006, was primarily a result of proceeds received from the issuance of long term-debt, offset by greater stock repurchases and dividend payments in 2006.dividends paid. We repurchased $633$637 million of Kroger stock in 20062008 compared to $252$1.4 billion in 2007 and $633 million in 2005 and $3192006. We paid dividends totaling $227 million in 2004, and paid dividends totaling2008, $202 million in 2007and $140 million in 2006.
Debt Management
Total debt, including both the current and long-term portions of capital leases and financing obligations, decreased $173$59 million to $8.1 billion as of year-end 2008 from $8.1 billion as of year-end 2007. The slight decrease in 2008, compared to 2007, resulted from the issuance of $400 million of senior notes bearing an interest rate of 5.00%, $375 million of senior notes bearing an interest rate of 6.90% and $600 million of senior notes bearing an interest rate of 7.50%, offset by decreased commercial paper, the payments on the bank revolver, the repayment of $200 million of senior notes bearing an interest rate of 6.375% and $750 million of senior notes bearing an interest rate of 7.45% that came due in 2008. Total debt increased to $8.1 billion as of year-end 2007 from $7.1 billion as of year-end 2006. The increases in 2007, compared to 2006, resulted from $7.2 billion asthe issuance of year-end 2005. Total debt decreased $739$600 million to $7.2 billion as of year-end 2005 from $8.0 billion assenior notes bearing an interest rate of year-end 2004. The decreases were primarily6.4%, $750 million of senior notes bearing an interest rate of 6.15% and borrowings under the resultbank credit facility in 2007, offset by the repayment of using cash flow from operations to reduce outstanding debt.$200 million of senior notes bearing an interest rate of 7.65% and $300 million of senior notes bearing an interest rate of 7.80% that came due in 2007.
Our total debt balances were also affected by our prefunding of employee benefit costs and by the mark-to-market adjustments necessary to record fair value interest rate hedges of our fixed rate debt, pursuant to SFAS No. 133 Accounting for Derivative Investments and Hedging Activities, as amended. We had prefunded employee benefit costs of $300 million at year-end 2006, 2005in each of the three years ended 2008, 2007 and 2004.2006. The mark-to-market adjustments increased the carrying value of our debt by $17$45 million $27in 2008 and $44 million and $70 million as of year-end 2006, 2005 and 2004, respectively.in 2007.
23
Factors Affecting Liquidity
We currently borrow on a daily basis approximately $170$250 million under our F2/P2/A3 rated commercial paper (“CP”) program. These borrowings are backed by our credit facility, and reduce the amount we can borrow under the credit facility. We have capacity available under our credit facility to backstop all CP amounts outstanding. If our credit rating declineddeclines below its current level of BBB/Baa2/BBB-, the ability to borrow under our current CP program could be adversely affected for a period of time immediately following the reduction of our credit rating. This could require us to borrow additional funds under the credit facility, under which we believe we have sufficient capacity. Borrowings under the credit facility may be more costly than the money we borrow under our current CP program, depending on the current interest rate environment. However, in the event of a ratings decline, we do not anticipate that access to the CP markets currently available to us would be significantly limited for an extended period of time (i.e., in excess of 30 days). Although our ability to borrow under the credit facility is not affected by our credit rating, the interest cost on borrowings under the credit facility wouldcould be affected by a decrease in our credit rating or a decrease in our Applicable Percentage Ratio.
Our credit facility also requires the maintenance of a Leverage Ratio and a Fixed Charge Coverage Ratio (our “financial covenants”). A failure to maintain our financial covenants would impair our ability to borrow under the credit facility. These financial covenants and ratios are described below:
·Our Applicable Percentage Ratio (the ratio of Consolidated EBITDA to Consolidated Total Interest Expense, as definedindefined in the credit facility) was 7.508.59 to 1 as of February 3, 2007. Upon furnishing notice toJanuary 31, 2009. Our current borrowing rates are determined from the lenders, this ratio will entitle usto a 0.05% reduction in fees underbetter of our Applicable Percentage Ratio or our credit ratings as defined by the credit facility. Although our current borrowing rate is determined based on ourApplicable Percentage Ratio, under certain circumstances that borrowing rate could be determined by reference to our
·credit ratings.
- Our Leverage Ratio (the ratio of Net Debt to Consolidated EBITDA, as defined in the credit facility) was
2.042.02 to 1 as ofFebruary 3, 2007.of January 31, 2009. If this ratio exceeded 3.50 to 1, we would be in default of our credit facility and our ability to borrowunder the facility would be impaired.
·
- Our Fixed Charge Coverage Ratio (the ratio of Consolidated EBITDA plus Consolidated Rental Expense
toConsolidatedto Consolidated Cash Interest Expense plus Consolidated Rental Expense, as defined in the credit facility) was 3.664.12 to 1 asof February 3, 2007.as of January 31, 2009. If this ratio fell below 1.70 to 1, we would be in default of our credit facility and our ability toborrowto borrow under the facility would be impaired.
Consolidated EBITDA, as defined in our credit facility, includes an adjustment for unusual gains and losses. Our credit agreement is more fully described in Note 5 to the Consolidated Financial Statements. We were in compliance with our financial covenants at year-end 2006.2008.
24
The tables below illustrate our significant contractual obligations and other commercial commitments, based on year of maturity or settlement, as of February 3, 2007January 31, 2009 (in millions of dollars):
| | 2007 | | 2008 | | 2009 | | 2010 | | 2011 | | Thereafter | | Total |
| Contractual Obligations | | | | | | | | | | | | | | | | | | | | | |
| Long-term debt | | $ | 878 | | $ | 993 | | $ | 912 | | $ | 42 | | $ | 537 | | $ | 3,219 | | $ | 6,581 |
| Interest on long-term debt(1) | | | 428 | | | 332 | | | 304 | | | 250 | | | 222 | | | 1,712 | | | 3,248 |
| Capital lease obligations | | | 57 | | | 54 | | | 52 | | | 51 | | | 49 | | | 294 | | | 557 |
| Operating lease obligations | | | 778 | | | 734 | | | 690 | | | 642 | | | 587 | | | 4,118 | | | 7,549 |
| Low-income housing obligations | | | 6 | | | 2 | | | — | | | — | | | — | | | — | | | 8 |
| Financed lease obligations | | | 11 | | | 11 | | | 11 | | | 11 | | | 11 | | | 157 | | | 212 |
| Construction commitments | | | 190 | | | — | | | — | | | — | | | — | | | — | | | 190 |
| Purchase obligations | | | 431 | | | 56 | | | 46 | | | 34 | | | 23 | | | 16 | | | 606 |
| |
| Total | | $ | 2,779 | | $ | 2,182 | | $ | 2,015 | | $ | 1,030 | | $ | 1,429 | | $ | 9,516 | | $ | 18,951 |
| |
| Other Commercial Commitments | | | | | | | | | | | | | | | | | | | | | |
| Credit facility | | $ | 352 | | $ | — | | $ | — | | $ | — | | $ | — | | $ | — | | $ | 352 |
| Standby letters of credit | | | 331 | | | — | | | — | | | — | | | — | | | — | | | 331 |
| Surety bonds | | | 53 | | | — | | | — | | | — | | | — | | | — | | | 53 |
| Guarantees | | | 6 | | | — | | | — | | | — | | | — | | | — | | | 6 |
| |
| Total | | $ | 742 | | $ | — | | $ | — | | $ | — | | $ | — | | $ | — | | $ | 742 |
| | 2009 | | 2010 | | 2011 | | 2012 | | 2013 | | Thereafter | | Total | |
Contractual Obligations(1) (2) | | | | | | | | | | | | | | | |
Long-term debt (5) | | $ | 528 | | $ | 542 | | $ | 544 | | $ | 1,414 | | $ | 1,019 | | $ | 3,550 | | $ | 7,597 | |
Interest on long-term debt (3) | | 479 | | 426 | | 398 | | 350 | | 286 | | 2,442 | | 4,381 | |
Capital lease obligations | | 53 | | 51 | | 57 | | 48 | | 45 | | 219 | | 473 | |
Operating lease obligations | | 778 | | 738 | | 674 | | 624 | | 575 | | 3,274 | | 6,663 | |
Low-income housing obligations | | 2 | | — | | — | | — | | — | | — | | 2 | |
Financed lease obligations | | 13 | | 13 | | 13 | | 13 | | 13 | | 172 | | 237 | |
Self-insurance liability (4) | | 192 | | 110 | | 73 | | 45 | | 26 | | 22 | | 468 | |
Construction commitments | | 128 | | — | | — | | — | | — | | — | | 128 | |
Purchase obligations | | 394 | | 87 | | 63 | | 51 | | 28 | | 19 | | 642 | |
| | | | | | | | | | | | | | | |
Total | | $ | 2,567 | | $ | 1,967 | | $ | 1,822 | | $ | 2,545 | | $ | 1,992 | | $ | 9,698 | | $ | 20,591 | |
| | | | | | | | | | | | | | | |
Other Commercial Commitments | | | | | | | | | | | | | | | |
Credit facility(5) | | $ | 129 | | $ | — | | $ | — | | $ | — | | $ | — | | $ | — | | $ | 129 | |
Standby letters of credit | | 344 | | — | | — | | — | | — | | — | | 344 | |
Surety bonds | | 106 | | — | | — | | — | | — | | — | | 106 | |
Guarantees | | 27 | | — | | — | | — | | — | | — | | 27 | |
| | | | | | | | | | | | | | | |
Total | | $ | 606 | | $ | — | | $ | — | | $ | — | | $ | — | | $ | — | | $ | 606 | |
(1) | The contractual obligations table excludes funding of pension and other postretirement benefit obligations, which totaled approximately $45 million in 2008. This table also excludes contributions under various multi-employer pension plans, which totaled $219 million in 2008. |
(2) | We adopted FIN 48 on February 4, 2007. See Note 4 to our Consolidated Financial Statements for information regarding the adoption of FIN 48. The liability related to unrecognized tax benefits has been excluded from the contractual obligations table because a reasonable estimate of the timing of future tax settlements cannot be determined. |
(3) | Amounts include contractual interest payments using the interest rate as of February 3, 2007January 31, 2009 applicable to our variable interest debt instruments, excluding commercial paper borrowings due to the short-term nature of these borrowings, and stated fixed and swapped interest rates, if applicable, for all other debt instruments. |
(4) | The amounts included in the contractual obligations table for self-insurance liability have been stated on a present value basis. |
(5) | Long-term debt includes amounts under our credit facility which are also included in the Other Commercial Commitments table. |
Our construction commitments include funds owed to third parties for projects currently under construction. These amounts are reflected in other current liabilities in our Consolidated Balance Sheets.
Our purchase obligations include commitments to be utilized in the normal course of business, such as several contracts to purchase raw materials utilized in our manufacturing plants and several contracts to purchase energy to be used in our stores and manufacturing facilities. Our obligations also include management fees for facilities operated by third parties. Any upfront vendor allowances or incentives associated with outstanding purchase commitments are recorded as either current or long-term liabilities in our Consolidated Balance Sheets.
As of February 3, 2007,January 31, 2009, we maintained a $2.5 billion, five-year revolving credit facility totaling $2.5 billion, whichthat, unless extended, terminates in 2011. Outstanding borrowings under the credit agreement and commercial paper borrowings, and some outstanding letters of credit, reduce funds available under the credit facility.agreement. In addition to the credit facility,agreement, we maintain a $50 millionmaintained three uncommitted money market line, borrowings under which also reducelines totaling $75 million in the funds available under our credit facility.aggregate. The money market line borrowingslines allow us to borrow from banks at mutually agreed upon rates, usually at rates below the rates offered under the credit agreement. As of February 3, 2007,January 31, 2009, we had outstandingno borrowings totaling $352 million under our credit agreement and net outstanding commercial paper program. Weof $90 million, that reduced amounts available under our credit agreement. In addition, as of January 31, 2009, we had no borrowings under theour money market line as of February 3, 2007.lines totaling $39 million. The outstanding letters of credit that reduced thereduce funds available under our credit facilityagreement totaled $331$337 million as of February 3, 2007.January 31, 2009.
25
In addition to the available credit mentioned above, as of February 3, 2007,January 31, 2009, we had availableauthorized for issuance $1.2$1.4 billion of securities under a shelf registration statement filed with the SEC and declared effective on December 9, 2004.20, 2007.
We also maintain surety bonds related primarily to our self-insured workers compensation claims. These bonds are required by most states in which we are self-insured for workers’ compensation and are placed with third-party insurance providers to insure payment of our obligations in the event we are unable to meet our claim payment obligations up to our self-insured retention levels. These bonds do not represent liabilities of Kroger, as we already have reserves on our books for the claims costs. Market changes may make the surety bonds more costly and, in some instances, availability of these bonds may become more limited, which could affect our costs of, or access to, such bonds. Although we do not believe increased costs or decreased availability would significantly affect our ability to access these surety bonds, if this does become an issue, we would issue letters of credit, in states where allowed, against our credit facility to meet the state bonding requirements. This could increase our cost and decrease the funds available under our credit facility.
Most of our outstanding public debt is jointly and severally, fully and unconditionally guaranteed by The Kroger Co. and some of our subsidiaries. See Note 1716 to the Consolidated Financial Statements for a more detailed discussion of those arrangements. In addition, we have guaranteed half of the indebtedness of threetwo real estate joint venturesentities in which we are a partner withhave 50% ownership.ownership interest. Our share of the responsibility for this indebtedness, should the partnershipsentities be unable to meet their obligations, totals approximately $6$7 million. Based on the covenants underlying this indebtedness as of February 3, 2007,January 31, 2009, it is unlikely that we will be responsible for repayment of these obligations. We have also agreed to guarantee, up to $25 million, the indebtedness of an entity of which we have 25% ownership interest. Our share of the responsibility, as of January 31, 2009, should the entity be unable to meet its obligations, totals approximately $25 million and is collateralized by approximately $8 million of inventory located in our stores. In addition, we have guaranteed half of the lease payments of a location leased by an entity in which we have a 50% ownership interest. The net present value of the guaranteed rental payments is approximately $6 million.
We also are contingently liable for leases that have been assigned to various third parties in connection with facility closings and dispositions. We could be required to satisfy obligations under the leases if any of the assignees are unable to fulfill their lease obligations. Due to the wide distribution of our assignments among third parties, and various other remedies available to us, we believe the likelihood that we will be required to assume a material amount of these obligations is remote. We have agreed to indemnify certain third-party logistics operators for certain expenses, including pension trust fund contribution obligations and withdrawal liabilities.
In addition to the above, we enter into various indemnification agreements and take on indemnification obligations in the ordinary course of business. Such arrangements include indemnities against third party claims arising out of agreements to provide services to Kroger; indemnities related to the sale of our securities; indemnities of directors, officers and employees in connection with the performance of their work; and indemnities of individuals serving as fiduciaries on benefit plans. While Kroger’s aggregate indemnification obligation could result in a material liability, we are not aware of noany current matter that we expect tocould result in a material liabilityliability.
RECENTLY ADOPTED ACCOUNTING STANDARDS
In December 2004, the FASB issued SFAS No. 123 (Revised 2002),Share-Based Payment (“SFAS No. 123(R)”), which replaced SFAS No. 123, superseded APB No. 25Effective January 31, 2009, we adopted FAS 140-4 and related interpretationsFIN 46(R)-8, Disclosures by Public Entities (Enterprises) about Transfers of Financial Assets and amended SFAS No. 95,Interests in Variable Interest Entities (FAS 140-4 and FIN 46(R)-8).StatementFAS 140-4 and FIN 46(R)-8 require additional disclosures about an entity’s involvement with variable interest entities and transfers of Cash Flows. SFAS No 123(R) requires all share-based payments to employees, including grants of employee stock options, to be recognized in the financial statements as compensation cost based on their fair value on the date of grant. We adopted the provisions of SFAS No. 123(R) in the first quarter of 2006. The implementation of SFAS No. 123(R) reduced our net earnings $0.06 per diluted share in 2006.assets. See Note 102 to ourthe Consolidated Financial Statements for further discussion of the effectadoption of FAS 140-4 and FIN 46(R)-8.
Effective February 3, 2008, we adopted SFAS No. 157, Fair Value Measurements (SFAS 157), except for non-financial assets and non-financial liabilities as deferred until February 1, 2009 by FASB Staff Position (FSP) 157-2 Partial Deferral of the Effective Date of Statement No. 157 (FSP 157-2). SFAS 157 defines fair value, establishes a market-based framework for measuring fair value and expands disclosures about fair value measurements. SFAS 157 does not expand or require any new fair value measurements. FSP 157-2 deferred the effective date of SFAS 157 for most non-financial assets and non-financial liabilities to fiscal years beginning after November 15, 2008. See Note 7 to the Consolidated Financial Statements for further discussion of the adoption of SFAS No. 123(R) had on our Consolidated Financial Statements.
In September 2006, the FASB issued SFAS No. 158,Employers’ Accounting for Defined Benefit Pension and Other Postretirement Plans-an amendment of FASB Statements No. 87, 99, 106, and 123(R).SFAS No. 158 requires an employer that sponsors one or more single-employer defined benefit plans to recognize in its statement of financial position an asset for a plan’s overfunded status or a liability for a plan’s underfunded status. In addition, SFAS No. 158 requires an employer to measure a plan’s assets and obligations and determine its funded status as of the end of the employer’s fiscal year and recognize changes in the funded status of a defined benefit postretirement plan in the year the changes occur and that those changes be recorded in comprehensive income, net of tax, as a separate component of shareowners’ equity. SFAS No. 158 also requires additional footnote disclosure. The recognition and disclosure provisions of SFAS No. 158 became effective for us on February 3, 2007. The measurement date provisions of SFAS No. 158 will become effective for our fiscal year beginning February 1, 2009. See Note 14 to our Consolidated Financial Statements for the effects the implementation of SFAS No. 158 had on our Consolidated Financial Statements.
RECENTLY ISSUED ACCOUNTING STANDARDS157.
26
In June 2006, theEffective February 4, 2007, we adopted FASB issued Interpretation (“FIN”) No. 48,Accounting for Uncertainty in Income Taxes-anTaxes — an interpretation of FASB Statement No. 109.109FIN (FIN No. 4848), which prescribes a recognition threshold and measurement attribute for the financial statement recognition and measurement of a tax position taken or expected to be taken in a tax return. This Interpretationinterpretation also provides guidance on derecognition, classification, interest and penalties, accounting in interim periods, disclosure, and transition. See Note 4 to the Consolidated Financial Statements for further discussion of the adoption of FIN No. 48 becomes48.
Effective February 3, 2007, we adopted the recognition and disclosure provisions (except for the measurement date change) of SFAS No. 158, Employers’ Accounting for Defined Benefit Pension and Other Postretirement Plans-an amendment of FASB Statement No. 87, 99, 106 and 132(R) (SFAS 158), which requires the recognition of the funded status of our retirement plans on the Consolidated Balance Sheet. Actuarial gains or losses, prior service costs or credits and transition obligations that have not yet been recognized are required to be recorded as a component of AOCI. We adopted the measurement date provisions of SFAS 158 effective forFebruary 3, 2008. The majority of our pension and postretirement plans previously used a December 31 measurement date. All plans are now measured as of our fiscal year beginning February 4, 2007. We are evaluatingend. The non-cash effect of the effectadoption of the implementationmeasurement date provisions of FIN No. 48 will haveSFAS 158 decreased shareowners’ equity by approximately $5 million ($3 million after-tax) and increased long-term liabilities by approximately $5 million. There was no effect on our results of operations. See Note 13 to the Consolidated Financial Statements.Statements for further discussion of the adoption of this standard.
RECENTLY ISSUED ACCOUNTING STANDARDS
In September 2006,December 2007, the FASB issued SFAS No. 157,160, Fair Value MeasurementNoncontrolling Interests in Consolidated Financial Statements-an amendment of ARB No. 51 (SFAS 160). SFAS No. 157 defines fair value, establishes160 will require the consolidation of noncontrolling interests as a framework for measuring fair value in GAAP and expands disclosures about fair value measurement.component of equity. SFAS No. 157 does not require any new fair value measurements. SFAS No. 157160 will become effective for our fiscal year beginning February 3, 2008. We are evaluating the effect the implementation of SFAS No. 157 will have on our Consolidated Financial Statements.
In February 2007, the FASB issued SFAS No. 159,The Fair Value Option for Financial Assets and Financial Liabilities-Including an amendment of FASB Statement No. 115.SFAS No. 159 permits entities to make an irrevocable election to measure certain financial instruments and other assets and liabilities at fair value on an instrument-by-instrument basis. Unrealized gains and losses on items for which the fair value option has been elected should be recognized into net earnings at each subsequent reporting date. SFAS No. 159 will be become effective for our fiscal year beginning February 3, 2008.1, 2009. We are currently evaluating the effect the adoption of SFAS No. 159160 will have on our Consolidated Financial Statements.
In June 2006,December 2007, the FASB ratifiedissued SFAS No. 141 (Revised 2007), Business Combinations (SFAS 141R), which replaces SFAS No. 141. SFAS 141R further expands the consensusdefinitions of Emerging Issues Task Force (“EITF”) issue No. 06-03,How Taxes Get Collected from Customersa business and Remitted to Governmental Authorities Should Be Presentedthe fair value measurement and reporting in the Income Statement (That Is, Gross versus Net Presentation).EITF No. 06-03 indicates that the income statement presentation of taxes within the scope of the Issue on either a gross basis or a net basis is an accounting policy decision that should be disclosed pursuant to Opinion 22. EITF No. 06-03 becomesbusiness combination. SFAS 141R will become effective for our fiscal year beginning February 4, 2007.1, 2009. Because the standard will only impact transactions entered into after February 1, 2009, SFAS 141R will not effect our Consolidated Financial Statements upon adoption.
In March 2008, the FASB issued SFAS No. 161, Disclosures about Derivative Instruments and Hedging Activities (SFAS 161). SFAS 161 requires enhanced disclosures of an entity’s derivative and hedging activities. SFAS 161 will become effective for our fiscal year beginning February 1, 2009. We do not expectare currently evaluating the effect the adoption of EITF No. 06-03 toSFAS 161 will have a material effect on our Consolidated Financial Statements.
In June 2008, the FASB issued FSP No. EITF 03-6-1, Determining Whether Instruments Granted in Share-Based Payment Transactions Are Participating Securities (FSP No. EITF 03-6-1).FSP No. EITF 03-6-1 clarifies that share-based payment awards that entitle their holders to receive nonforfeitable dividends before vesting should be considered participating securities and included in the calculation of basic EPS. FSP No. EITF 03-6-1 will become effective for our fiscal year beginning February 1, 2009. We are currently evaluating the effect the adoption of FSP No. EITF 03-6-1 will have on our Consolidated Financial Statements.
27
OUTLOOK
This discussion and analysis contains certain forward-looking statements about Kroger’s future performance. These statements are based on management’s assumptions and beliefs in light of the information currently available. Such statements relate to, among other things: projected change in net earnings; identical sales growth; expected pension plan contributions; our ability to generate operating cash flow; projected capital expenditures; square footage growth; opportunities to reduce costs; cash flow requirements; and our operating plan for the future; and are indicated by words such as “comfortable,” “committed,” “will,” “expect,” “goal,” “should,” “intend,” “target,” “believe,” “anticipate,” and similar words or phrases. These forward-looking statements are subject to uncertainties and other factors that could cause actual results to differ materially.
Statements elsewhere in this report and below regarding our expectations, projections, beliefs, intentions or strategies are forward-looking statements within the meaning of Section 21 E of the Securities Exchange Act of 1934. While we believe that the statements are accurate, uncertainties about the general economy, our labor relations, our ability to execute our plans on a timely basis and other uncertainties described below could cause actual results to differ materially.
We expect earnings per share in the range of $1.60-$1.65 for 2007. This represents earnings per share growth ofapproximately 9%-12% in 2007, net of the effect of a 53rdweek in fiscal 2006 of approximately $0.07 per diluted share.
We anticipate earnings per share growth rates in the 1stand 4thquarters of 2007 will be less than the annual growth rate, and the 2ndand 3rdquarter growth rates will be higher than the annual growth rate.
We expect identical food store sales growth, excluding fuel sales, of 3%-5% in 2007.
In fiscal 2007, we will continue to focus on driving sales growth and balancing investments in gross margin andimproved customer service with operating cost reductions to provide a better shopping experience for our customers.We expect operating margins to improve slightly in 2007.
We plan to use, over the long-term, one-third of cash flow for debt reduction and two-thirds for stock repurchase andpayment of a cash dividend.
We expect to obtain sales growth from new square footage, as well as from increased productivity from existinglocations.
Capital expenditures reflect our strategy of growth through expansion and acquisition, as well as focusing onproductivity increase from our existing store base through remodels. In addition, we will continue our emphasis on self-development and ownership of real estate, logistics and technology improvements. The continued capital spending intechnology is focused on improving store operations, logistics, manufacturing procurement, category management,merchandising and buying practices, and should reduce merchandising costs. We intend to continue using cash flowfrom operations to finance capital expenditure requirements. We expect capital investment for 2007 to be in the range of$1.9-$2.1 billion, excluding acquisitions. Total food store square footage is expected to grow approximately 2% beforeacquisitions and operational closings.
Based on current operating trends, we believe that cash flow from operations and other sources of liquidity, includingborrowings under our commercial paper program and bank credit facility, will be adequate to meet anticipatedrequirements for working capital, capital expenditures, interest payments and scheduled principal payments for theforeseeable future. We also believe we have adequate coverage of our debt covenants to continue to respond effectivelyto competitive conditions.
We expect that our OG&A results will be affected by increased costs, such as higher energy costs, pension costs andcredit card fees, as well as any future labor disputes, offset by improved productivity from process changes, cost savingsnegotiated in recently completed labor agreements and leverage gained through sales increases.
We expect that our effective tax rate for 2007 will be approximately 38%, excluding any effects from the implementationof FIN No. 48.
We expect rent expense, as a percent of total sales and excluding closed-store activity, will decrease due to the emphasisour current strategy places on ownership of real estate.
We believe that in 2007 there will be opportunities to reduce our operating costs in such areas as administration, labor,shrink, warehousing and transportation. These savings will be invested in our core business to drive profitable salesgrowth and offer improved value and shopping experiences for our customers.
Although we are not required to make cash contributions during fiscal 2007, we made a $50 million cash contribution toour Company-sponsored pension plans on February 5, 2007. Additional voluntary contributions may be made if ourcash flows from operations exceed our expectations. We expect any additional elective contributions made during 2007will reduce our contributions in future years. Among other things, investment performance of plan assets, the interestrates required to be used to calculate pension obligations and future changes in legislation will determine the amounts ofany additional contributions. In addition, we expect to make automatic and matching cash contributions to the 401(k) Retirement SavingsAccount Plan totaling $75 million in 2007.
We expect our contributions to multi-employer pension plans to increase at 1.0% over the $204 million we contributedduring 2006.
· | We expect earnings per diluted share in the range of $2.00-$2.05 for 2009. This represents earnings per share growth of approximately 4%-7% in 2009, excluding the $0.02 per diluted share charge in 2008 related to Hurricane Ike. In addition, our shareholder return is enhanced by our dividend by over 1%. |
| |
· | We expect identical supermarket sales growth, excluding fuel sales, of 3%-4% in 2009, assuming product cost inflation of 1%-2%. |
| |
· | In 2009, we will continue to focus on driving sales growth and balancing investments in gross margin and improved customer service to provide a better shopping experience for our customers. We expect to finance these investments with operating cost reductions. We expect non-fuel operating margins to improve slightly in 2009, excluding the benefit of an expected lower LIFO charge. |
| |
· | In 2009, we expect fuel margins to be approximately $0.11 per gallon, as well as continued strong growth in gallons sold. |
| |
· | In 2009, we expect the LIFO charge to be $75 million, assuming product cost inflation of 1%-2%. |
| |
· | We plan to use cash flow primarily for capital investments, debt reduction and to pay cash dividends. As market conditions change, we plan to re-evaluate the above uses of cash flow and our stock repurchase activity. |
| |
· | We expect to obtain sales growth from new square footage, as well as from increased productivity from existing locations. |
| |
· | Capital expenditures reflect our strategy of growth through expansion, as well as focusing on productivity increase from our existing store base through remodels. In addition, we will continue our emphasis on self-development and ownership of real estate, logistics and technology improvements. The continued capital spending in technology is focused on improving store operations, logistics, manufacturing procurement, category management, merchandising and buying practices, and should reduce merchandising costs. We intend to continue using cash flow from operations to finance capital expenditure requirements. We expect capital investment for 2009 to be in the range of $1.9-$2.1 billion, excluding acquisitions. Total food store square footage is expected to grow approximately1.5%-2.0% before acquisitions and operational closings. |
| |
· | Based on current operating trends, we believe that cash flow from operations and other sources of liquidity, including borrowings under our commercial paper program and bank credit facility, will be adequate to meet anticipated requirements for working capital, capital expenditures, interest payments and scheduled principal payments for the foreseeable future. We also believe we have adequate coverage of our debt covenants to continue to respond effectively to competitive conditions. |
| |
· | We believe we have adequate sources of cash if needed under our credit agreement. |
28
· | We expect that our OG&A results will be affected by increased costs, such as higher pension costs and credit card fees, as well as any potential future labor disputes, offset by improved productivity from process changes and leverage gained through sales increases. |
| |
· | We expect that our effective tax rate for 2009 will be approximately 37%. |
| |
· | We expect rent expense, as a percent of total sales and excluding closed-store activity, will decrease due to the emphasis our current strategy places on ownership of real estate. |
| |
· | We believe that in 2009 there will be opportunities to reduce our operating costs in such areas as administration, productivity improvements, shrink, warehousing and transportation. These savings will be invested in our core business to drive profitable sales growth and offer improved value and shopping experiences for our customers. |
| |
· | Although we were not required to make cash contributions to Company-sponsored defined benefit pension plans during 2008 and do not anticipate being required to do so in 2009, we contributed $20 million to these plans in 2008 and we made a $200 million contribution in 2009 on February 2, 2009. We expect any elective contributions made during 2009 will decrease our required contributions in future years. Among other things, investment performance of plan assets, the interest rates required to be used to calculate the pension obligations, and future changes in legislation, will determine the amounts of any additional contributions. We also expect 2009 expense for Company-sponsored defined benefit pension plans to be comparable to 2008. In addition, we expect our cash contributions and expense to the 401(k) Retirement Savings Account Plan from automatic and matching contributions to participants to increase in 2009, compared to 2008. |
| |
· | We do not expect a significant increase in our contributions to multi-employer pension plans in 2009 compared to 2008 subject to collective bargaining and capital market conditions. In addition, we believe our contributions to multi-employer pension plans could as much as double over the next several years after 2009. |
| |
· | We expect our expense from the credit extended to our customers through our company branded credit card in 2009 to be comparable to 2008 of $14 million. The 2008 expense represents an increase in net charge-offs of approximately $8 million, compared to 2007, due to the weak economy, higher outstanding balances, and portfolio maturation. This rate is still below the credit card industry average and the credit portfolio continues to have an above-average credit score. |
Various uncertainties and other factors could cause us to fail to achieve our goals. These include:
We have various labor agreements expiring in 2007, covering associates in southern California, Cincinnati, Detroit,Houston, Memphis, Toledo, Seattle and West Virginia. We are currently operating under a contract extension insouthern California. In all of these contracts, rising health care and pension costs will continue to be an important issuein negotiations. Third parties who operate a distribution facility for us in Louisville, Kentucky, are operating without a laboragreement, and the union representing employees there may call a strike if an agreement is not reached. A prolongedwork stoppage affecting a substantial number of locations could have a material effect on our results.
Our ability to achieve sales and earnings goals may be affected by: labor disputes; industry consolidation; pricing andpromotional activities of existing and new competitors, including non-traditional competitors; our response to theseactions; the state of the economy, including the inflationary and deflationary trends in certain commodities; stockrepurchases; and the success of our future growth plans.
In addition to the factors identified above, our identical store sales growth could be affected by increases in Krogerprivate label sales, the effect of our “sister stores” (new stores opened in close proximity to an existing store) andreductions in retail pricing.
Our operating margins could fail to improve as expected if we are unsuccessful at containing our operating costs.
We have estimated our exposure to the claims and litigation arising in the normal course of business, as well as inmaterial litigation facing Kroger, and believe we have made adequate provisions for them where it is reasonably possibleto estimate and where we believe an adverse outcome is probable. Unexpected outcomes in these matters, however,could result in an adverse effect on our earnings.
The proportion of cash flow used to reduce outstanding debt, repurchase common stock and pay a cash dividend may beaffected by the amount of outstanding debt available for pre-payments, changes in borrowing rates and the market priceof Kroger common stock.
Consolidation in the food industry is likely to continue and the effects on our business, either favorable or unfavorable,cannot be foreseen.
Rent expense, which includes subtenant rental income, could be adversely affected by the state of the economy,increased store closure activity and future consolidation.
Depreciation expense, which includes the amortization of assets recorded under capital leases, is computed principallyusing the straight-line method over the estimated useful lives of individual assets, or the remaining terms of leases. Useof the straight-line method of depreciation creates a risk that future asset write-offs or potential impairment chargesrelated to store closings would be larger than if an accelerated method of depreciation was followed.
Our effective tax rate may differ from the expected rate due to changes in laws, the status of pending items with varioustaxing authorities and the deductibility of certain expenses.
The amount of our matching cash contributions under our 401(k) Retirement Savings Account Plan will be affected by the actual amounts contributed by participants.
We believe the multi-employer pension funds to which we contribute are substantially underfunded. Should asset valuesin these funds deteriorate, or if employers withdraw from these funds without providing for their share of the liability, orshould our estimates prove to be understated, our contributions could increase more rapidly than we have anticipated.
The grocery retail industry continues to experience fierce competition from other traditional food retailers, supercenters,mass merchandisers, club or warehouse stores, drug stores and restaurants. Our continued success is dependent upon ourability to compete in this industry and to reduce operating expenses, including managing health care and pension costscontained in our collective bargaining agreements. The competitive environment may cause us to reduce our prices inorder to gain or maintain share of sales, thus reducing margins. While we believe our opportunities for sustainedprofitable growth are considerable, unanticipated actions of competitors could adversely affect our sales.
Changes in laws or regulations, including changes in accounting standards, taxation requirements and environmentallaws may have a material effect on our financial statements.
Changes in the general business and economic conditions in our operating regions, including the rate of inflation,population growth and employment and job growth in the markets in which we operate, may affect our ability to hire andtrain qualified employees to operate our stores. This would negatively affect earnings and sales growth. Generaleconomic changes may also affect the shopping habits of our customers, which could affect sales and earnings.
Changes in our product mix may negatively affect certain financial indicators. For example, we continue to addsupermarket fuel centers to our store base. Since gasoline generates low profit margins, including generating decreasedmargins as the market price increases, we expect to see our FIFO gross profit margins decline as gasoline sales increase.Although this negatively affects our FIFO gross margin, gasoline sales provide a positive effect on operating, generaland administrative expenses as a percent of sales.
Our ability to integrate any companies we acquire or have acquired, and achieve operating improvements at thosecompanies, will affect our operations.
Our capital expenditures, expected square footage growth, and number of store projects completed during the year coulddiffer from our estimate if we are unsuccessful in acquiring suitable sites for new stores, if development costs vary fromthose budgeted or if our logistics and technology projects are not completed in the time frame expected or on budget.
Interest expense could be adversely affected by the interest rate environment, changes in the Company’s credit ratings,fluctuations in the amount of outstanding debt, decisions to incur prepayment penalties on the early redemption of debtand any factor that adversely affects our operations that results in an increase in debt.
Adverse weather conditions could increase the cost our suppliers charge for their products, or may decrease the customerdemand for certain products. Additionally, increases in the cost of inputs, such as utility costs or raw material costs,could negatively affect financial ratios and earnings.
Although we presently operate only in the United States, civil unrest in foreign countries in which our suppliers dobusiness may affect the prices we are charged for imported goods. If we are unable to pass on these increases to ourcustomers, our FIFO gross margin and net earnings will suffer.
· | The extent to which our sources of liquidity are sufficient to meet our requirements may be affected by the state of the financial markets and the impact that such condition has on our ability to issue commercial paper at acceptable rates. Our ability to borrow under our committed lines of credit, including our bank credit facilities, could be impaired if one or more of our lenders under those lines is unwilling or unable to honor its contractual obligation to lend to us. |
| |
· | We have various labor agreements that will be negotiated in 2009, covering associates in Albuquerque, Arizona, Atlanta, Dallas, Dayton, Denver and Portland. In all of these store contracts, rising health care and pension costs will continue to be an important issue in negotiations. A prolonged work stoppage affecting a substantial number of locations could have a material effect on our results. |
| |
· | If market conditions change, it could affect our uses of cash flow. |
| |
· | Our ability to achieve sales and earnings goals may be affected by: labor disputes; industry consolidation; pricing and promotional activities of existing and new competitors, including non-traditional competitors; our response to these actions; the state of the economy, including the inflationary and deflationary trends in certain commodities; trends in consumer spending; stock repurchases; and the success of our future growth plans. |
| |
· | Our estimate of product cost inflation could be affected by general economic conditions, weather, availability of raw materials and ingredients in the products that we sell and their packaging, and other factors beyond our control. |
| |
· | The timing of our recognition of LIFO expense will be affected primarily by expected food inflation during the year. |
| |
· | If actual results differ significantly from anticipated future results for certain reporting units and variable interest entities, an impairment loss for any excess of the carrying value of the division’s goodwill over the implied fair value would need to be recognized. |
29
· | In addition to the factors identified above, our identical store sales growth could be affected by increases in Kroger private label sales, the effect of our “sister stores” (new stores opened in close proximity to an existing store) and reductions in retail pricing. |
| |
· | Our operating margins, without fuel, could fail to slightly improve as expected if we are unable to pass on any cost increases, fail to deliver the cost savings contemplated or if changes in the cost of our inventory and the timing of those changes differs from our expectations. |
| |
· | Our expected operating margin per gallon of fuel and fuel gallons sold could be affected by changes in the price of fuel or a change in our operating costs. |
| |
· | We have estimated our exposure to the claims and litigation arising in the normal course of business, as well as to the material litigation facing Kroger, and believe we have made adequate provisions for them where it is reasonably possible to estimate and where we believe an adverse outcome is probable. Unexpected outcomes in these matters, however, could result in an adverse effect on our earnings. |
| |
· | Consolidation in the food industry is likely to continue and the effects on our business, either favorable or unfavorable, cannot be foreseen. |
| |
· | Rent expense, which includes subtenant rental income, could be adversely affected by the state of the economy, increased store closure activity and future consolidation. |
| |
· | Depreciation expense, which includes the amortization of assets recorded under capital leases, is computed principally using the straight-line method over the estimated useful lives of individual assets, or the remaining terms of leases. Use of the straight-line method of depreciation creates a risk that future asset write-offs or potential impairment charges related to store closings would be larger than if an accelerated method of depreciation was followed. |
| |
· | Our effective tax rate may differ from the expected rate due to changes in laws, the status of pending items with various taxing authorities and the deductibility of certain expenses. |
| |
· | The actual amount of automatic and matching cash contributions to our 401(k) Retirement Savings Account Plan will depend on the number of participants, savings rate, plan compensation, and length of service of participants. |
| |
· | Our contributions and recorded expense related to multi-employer pension funds could increase more than anticipated. Should asset values in these funds further deteriorate, if employers withdraw from these funds without providing for their share of the liability, or should our estimates prove to be understated, our contributions could increase more rapidly than we have anticipated, after 2009. |
| |
· | If weakness in the financial markets continues or worsens, our contributions to Company-sponsored defined benefit pension plans could increase more than anticipated. |
| |
· | Changes in laws or regulations, including changes in accounting standards, taxation requirements and environmental laws may have a material effect on our financial statements. |
| |
· | Changes in the general business and economic conditions in our operating regions, including the rate of inflation, population growth and employment and job growth in the markets in which we operate, may affect our ability to hire and train qualified employees to operate our stores. This would negatively affect earnings and sales growth. General economic changes may also affect the shopping habits of our customers, which could affect sales and earnings. |
| |
· | Changes in our product mix may negatively affect certain financial indicators. For example, we continue to add supermarket fuel centers to our store base. Since gasoline generates low profit margins, we expect to see our FIFO gross profit margins decline as gasoline sales increase. Although this negatively affects our FIFO gross margin, gasoline sales provide a positive effect on OG&A expense as a percent of sales. |
30
· | Our capital expenditures, expected square footage growth, and number of store projects completed during the year could differ from our estimate if we are unsuccessful in acquiring suitable sites for new stores, if development costs vary from those budgeted or if our logistics and technology projects are not completed in the time frame expected or on budget. |
| |
· | Interest expense could be adversely affected by the interest rate environment, changes in the Company’s credit ratings, fluctuations in the amount of outstanding debt, decisions to incur prepayment penalties on the early redemption of debt and any factor that adversely affects our operations and results in an increase in debt. |
| |
· | Impairment losses could be affected by changes in our assumptions of future cash flows or market values. Our cash flow projections include several years of projected cash flows and include assumptions on variables such as inflation, the economy and market competition. |
| |
· | Our estimated expense and obligation for Company-sponsored pension plans and other post-retirement benefits could be affected by changes in the assumptions used in calculating those amounts. These assumptions include, among others, the discount rate, the expected long-term rate of return on plan assets, average life expectancy and the rate of increases in compensation and health care costs. |
| |
· | Adverse weather conditions could increase the cost our suppliers charge for their products, or may decrease the customer demand for certain products. Increases in demand for certain commodities could also increase the cost our suppliers charge for their products. Additionally, increases in the cost of inputs, such as utility costs or raw material costs, could negatively affect financial ratios and earnings. |
| |
· | Although we presently operate only in the United States, civil unrest in foreign countries in which our suppliers do business may affect the prices we are charged for imported goods. If we are unable to pass on these increases to our customers, our FIFO gross margin and net earnings will suffer. |
Other factors and assumptions not identified above could also cause actual results to differ materially from those set forth in the forward-looking information. Accordingly, actual events and results may vary significantly from those included in, contemplated or implied by forward-looking statements made by us or our representatives.
31
ITEM 7A. QUANTITATIVE AND QUALITATIVE DISCLOSURES ABOUT MARKET RISK.
Financial Risk Management
We use derivative financial instruments primarily to manage our exposure to fluctuations in interest rates and, to a lesser extent, adverse fluctuations in commodity prices and other market risks. We do not enter into derivative financial instruments for trading purposes. As a matter of policy, all of our derivative positions are intended to reduce risk by hedging an underlying economic exposure. Because of the high correlation between the hedging instrument and the underlying exposure, fluctuations in the value of the instruments generally are offset by reciprocal changes in the value of the underlying exposure. The interest rate derivatives we use are straightforward instruments with liquid markets.
We manage our exposure to interest rates and changes in the fair value of our debt instruments primarily through the strategic use of variable and fixed rate debt, and interest rate swaps. Our current program relative to interest rate protection contemplates both fixing the rates on variable rate debt and hedging the exposure to changes in the fair value of fixed-rate debt attributable to changes in interest rates. To do this, we use the following guidelines: (i) use average daily bank balanceoutstanding borrowings to determine annual debt amounts subject to interest rate exposure, (ii) limit the average annual amount of debt subject to interest rate reset and the amount of floating rate debt to a combined total of $2.5 billion or less, (iii) include no leveraged products, and (iv) hedge without regard to profit motive or sensitivity to current mark-to-market status.
As of February 3, 2007,January 31, 2009, we maintained sixdid not have any outstanding interest rate swap agreements, with notional amounts totaling approximately $1,050 million, to manage our exposure to changes in the fair value of our fixed rate debt resulting from interest rate movements by effectively converting a portion of our debt from fixed to variable rates. These agreements mature at varying times between March 2008 and January 2015. Variable rates for our agreements are based on U.S. dollar London Interbank Offered Rate (“LIBOR”). The differential between fixed and variable rates to be paid or received is accrued as interest rates change in accordance with the agreements and is recognized over the life of the agreements as an adjustment to interest expense. These interest rate swap agreements are being accounted forswaps designated as fair value or cash flow hedges. As of February 3, 2007, other long-term liabilities totaling $28 million were recorded to reflect the
In 2008, we terminated nine fair value interest rate swaps with a total notional amount of $900 million. Three of these agreements, offset by decreasesterminated interest rate swaps were purchased and became ineffective fair value hedges in 2008. The proceeds received at termination were credited to interest expense in the amount of $15 million. We have unamortized proceeds from twelve interest rate swaps once classified as fair value hedges totaling approximately $45 million. The unamortized proceeds are recorded as adjustments to the carrying values of the underlying debt and are being amortized over the remaining term of the debt.
In addition as of February 3, 2007,to the interest rate swaps noted above, in 2005 we maintainedentered into three forward-starting interest rate swap agreements with a notional amountsamount totaling $750 million, to manage our exposure to changes in future benchmark interest rates.million. A forward-starting interest rate swap is an agreement that effectively hedges future benchmark interest rates including general corporate spreads, on debt for an established period of time. We entered into the forward-starting interest rate swaps in order to lock ininto fixed interest rates on our forecasted issuances of debt in fiscal 2007 and 2008. Accordingly,In 2007, we terminated two of these instrumentsforward-starting interest rate swaps with a notional amount of $500 million. In 2008, we terminated the remaining forward interest rate swap with a notional amount of $250 million. The unamortized payments and proceeds on these terminated forward-starting interest rate swaps have been designated as cash flow hedges for our forecasted debt issuances. Tworecorded net of these swaps have ten-year terms, with the remaining swap having a twelve-year term, beginning with the issuance of the debt. The average fixed rate for these instruments is 5.14%,tax in other comprehensive income and the variable rate will be determined atamortized to earnings as the inception datepayments of interest to which the swap.hedge relates are made. As of February 3, 2007, we had2, 2008, other long-term liabilities totaling $18 million were recorded an other asset totaling $12 million to reflect the fair value of these agreements.
During 2003, we terminated six interest rate swap agreements that we accounted for as fair value hedges. We recorded approximately $114 million of proceeds received as a result of these terminations as adjustments to the carrying values of the underlying debt and they are being amortized over the remaining lives of the debt. As of February 3, 2007, the unamortized balances totaled approximately $46 million.
Annually, we review with the Financial Policy Committee of our Board of Directors compliance with the guidelines. The guidelines may change as our business needs dictate.
The tablestable below provideprovides information about our interest rate derivatives and underlying debt portfolio as of February 3, 2007.January 31, 2009. The amounts shown for each year represent the contractual maturities of long-term debt, excluding capital leases and the average outstanding notional amounts of interest rate derivatives as of February 3, 2007.January 31, 2009. Interest rates reflect the weighted average rate for the outstanding instruments. The variable component of each interest rate derivative and the variable rate debt is based on the U.S. dollar LIBOR using the forward yield curve as of February 3, 2007.January 31, 2009. The Fair-Value column includes the fair-value of our debt instruments and interest rate derivatives as of February 3, 2007.January 31, 2009. Refer to Notes 5, 6 and 7 toof our Consolidated Financial Statements:
| | Expected Year of Maturity |
| | | | | | | | | | | | | | | | | | | | | | | | | | | | | | Fair |
| | 2007 | | 2008 | | 2009 | | 2010 | | 2011 | | Thereafter | | Total | | Value |
| | (In millions) |
| Debt | | | | | | | | | | | | | | | | | | | | | | | | | | | | | | | | |
| Fixed rate | | $ | (526 | ) | | $ | (993 | ) | | $ | (897 | ) | | $ | (35 | ) | | $ | (488 | ) | | $ | (3,160 | ) | | $ | (6,099 | ) | | $ | (6,377 | ) |
| Average interest rate | | | 7.01 | % | | | 6.94 | % | | | 6.83 | % | | | 7.85 | % | | | 6.64 | % | | | 6.62 | % | | | | | | | | |
| Variable rate | | $ | (352 | ) | | $ | — | | | $ | (15 | ) | | $ | (7 | ) | | $ | (49 | ) | | $ | (59 | ) | | $ | (482 | ) | | $ | (482 | ) |
| Average interest rate | | | 5.47 | % | | | 3.55 | % | | | 3.54 | % | | | 3.59 | % | | | 3.64 | % | | | 4.02 | % | | | | | | | | |
| |
| | Average Notional Amounts Outstanding |
| | | | | | | | | | | | | | | | | | | | | | | | | | | | | | Fair |
| | 2007 | | 2008 | | 2009 | | 2010 | | 2011 | | Thereafter | | Total | | Value |
| | | | | | | | | | | | | | | (In millions) | | | | | | | | | | | | | |
| Interest Rate Derivatives | | | | | | | | | | | | | | | | | | | | | | | | | | | | | | | | |
| Variable to fixed | | $ | — | | | $ | — | | | $ | — | | | $ | — | | | $ | — | | | $ | — | | | $ | — | | $ | — | |
| Average pay rate | | | | | | | | | | | | | | | | | | | | | | | | | | | | | | | | |
| Average receive rate | | | | | | | | | | | | | | | | | | | | | | | | | | | | | | | | |
| Fixed to variable | | $ | 1,050 | | | $ | 363 | | | $ | 300 | | | $ | 300 | | | $ | 300 | | | $ | 300 | | | $ | 1,050 | | $ | (28 | ) |
| Average pay rate | | | 8.07 | % | | | 5.96 | % | | | 5.39 | % | | | 5.46 | % | | | 5.52 | % | | | 5.57 | % | | | | | | | | |
| Average receive rate | | | 6.74 | % | | | 5.38 | % | | | 4.95 | % | | | 4.95 | % | | | 4.95 | % | | | 4.95 | % | | | | | | | | |
| | Expected Year of Maturity | |
| | 2009 | | 2010 | | 2011 | | 2012 | | 2013 | | Thereafter | | Total | | Fair
Value | |
| | (In millions) | |
Debt | | | | | | | | | | | | | | | | | |
Fixed rate | | $ | (384 | ) | $ | (535 | ) | $ | (490 | ) | $ | (1,359 | ) | $ | (1,008 | ) | $ | (3,538 | ) | $ | (7,314 | ) | $ | (7,637 | ) |
Average interest rate | | 6.78 | % | 6.67 | % | 6.57 | % | 6.61 | % | 6.68 | % | 6.77 | % | | | | |
Variable rate | | $ | (144 | ) | $ | (7 | ) | $ | (54 | ) | $ | (55 | ) | $ | (11 | ) | $ | (12 | ) | $ | (283 | ) | $ | (283 | ) |
Average interest rate | | 2.27 | % | 5.14 | % | 4.35 | % | 7.27 | % | 7.72 | % | 8.10 | % | | | | |
32
Commodity Price Protection
We enter into purchase commitments for various resources, including raw materials utilized in our manufacturing facilities and energy to be used in our stores, warehouses, manufacturing facilities and administrative offices. We enter into commitments expecting to take delivery of and to utilize those resources in the conduct of normal business. Those commitments for which we expect to utilize or take delivery in a reasonable amount of time in the normal course of business qualify as normal purchases and normal sales. For any commitments for which we do not expect to take delivery and, as a result, will require net settlement, the contracts are marked to fair value on a quarterly basis.purchases.
Some of the product we purchase is shipped in corrugated cardboard packaging. We sell corrugated cardboard when it is economical to do so. As of February 3, 2007,January 31, 2009, we maintained sevena derivative instrumentsinstrument to protect us from decliningmanage exposure to changes in corrugated cardboard prices. These derivatives containThis derivative has a three-year term. None of the contracts, either individually or in the aggregate, hedge more than 50% of our expected corrugated cardboard sales. The instruments doinstrument does not qualify for hedge accounting, in accordance with SFAS No. 133, Accounting for Derivative Investments and Hedging Activities, as amended. Accordingly, changesthe change in the fair value of these instruments arethis instrument is marked-to-market in our Consolidated Statements of Operations in OG&A expenses. As of February 3, 2007, an accrued expense totaling $0.2 million had been recorded forJanuary 31, 2009, the instruments.fair value of this instrument was insignificant.
33
ITEM 8.FINANCIAL STATEMENTS AND SUPPLEMENTARY DATA.
Report of Independent Registered Public Accounting Firm
To the Shareowners and Board of Directors of
The Kroger Co.:
We have completed integrated audits of The Kroger Co.’sconsolidated financial statements and of its internal control over financial reporting as of February 3, 2007, in accordance with the standards of the Public Company Accounting Oversight Board (United States). Our opinions, based on our audits, are presented below.
Consolidated financial statements
In our opinion, the accompanying consolidated financialbalance sheets and the related consolidated statements of operations, cash flows and changes in shareowners’ equity present fairly, in all material respects, the financial position of The Kroger Co. and its subsidiaries at January 31, 2009 and February 3, 2007 and January 28, 2006,2, 2008, and the results of their operations and their cash flows for each of the three years in the period ended February 3, 2007January 31, 2009 in conformity with accounting principles generally accepted in the United States of America. TheseAlso in our opinion, the Company maintained, in all material respects, effective internal control over financial reporting as of January 31, 2009, based on criteria established in Internal Control - Integrated Framework issued by the Committee of Sponsoring Organizations of the Treadway Commission (COSO). The Company’s management is responsible for these financial statements, are the responsibilityfor maintaining effective internal control over financial reporting and for its assessment of the Company’s management.effectiveness of internal control over financial reporting, included in Management’s Report on Internal Control over Financial Reporting appearing under Item 9A. Our responsibility is to express an opinionopinions on these financial statements and on the Company’s internal control over financial reporting based on our integrated audits. We conducted our audits of these statements in accordance with the standards of the Public Company Accounting Oversight Board (United States). Those standards require that we plan and perform the auditaudits to obtain reasonable assurance about whether the financial statements are free of material misstatement. An auditmisstatement and whether effective internal control over financial reporting was maintained in all material respects. Our audits of the financial statements includesincluded examining, on a test basis, evidence supporting the amounts and disclosures in the financial statements, assessing the accounting principles used and significant estimates made by management, and evaluating the overall financial statement presentation. Our audit of internal control over financial reporting included obtaining an understanding of internal control over financial reporting, assessing the risk that a material weakness exists, and testing and evaluating the design and operating effectiveness of internal control based on the assessed risk. Our audits also included performing such other procedures as we considered necessary in the circumstances. We believe that our audits provide a reasonable basis for our opinion.opinions.
As discussed in Note 1514 to the consolidated financial statements, the Company adopted the provisionsmeasurement date provision of Statement of Financial Accounting Standards No. 123(R),158, Share-Based Payment, as of January 29, 2006 and the recognition and disclosure provisions of Statement of Financial Accounting Standards No. 158,Employers'Employers’ Accounting for Defined Benefit Pension and Other Postretirement Plans, as of January 31, 2009, the provisions of Statement of Financial Accounting Standards No. 157, Fair Value Measurements, for financial assets and financial liabilities as of February 3, 2008, the provisions of Financial Accounting Standards Board Interpretation No. 48, Accounting for Uncertainty in Income Taxes, as of February 4, 2007 and the recognition and disclosure provisions of SFAS No. 158 as of February 3, 2007.
Internal control over financial reporting
Also, in our opinion, management’s assessment, included in Management's Report on Internal Control Over Financial Reporting appearing under Item 9A, that the Company maintained effective internal control over financial reporting as of February 3, 2007 based on criteria established inInternal Control - Integrated Framework issued by the Committee of Sponsoring Organizations of the Treadway Commission (COSO), is fairly stated, in all material respects, based on those criteria. Furthermore, in our opinion, the Company maintained, in all material respects, effective internal control over financial reporting as of February 3, 2007, based on criteria established inInternal Control - Integrated Framework issued by the COSO. The Company’s management is responsible for maintaining effective internal control over financial reporting and for its assessment of the effectiveness of internal control over financial reporting. Our responsibility is to express opinions on management’s assessment and on the effectiveness of theCompany’s internal control over financial reporting based on our audit. We conducted our audit of internal control over financial reporting in accordance with the standards of the Public Company Accounting Oversight Board (United States). Those standards require that we plan and perform the audit to obtain reasonable assurance about whether effective internal control over financial reporting was maintained in all material respects. An audit of internal control over financial reporting includes obtaining an understanding of internal control over financial reporting, evaluating management’s assessment, testing and evaluating the design and operating effectiveness of internal control, and performing such other procedures as we consider necessary in the circumstances. We believe that our audit provides a reasonable basis for our opinions.
A company’s internal control over financial reporting is a process designed to provide reasonable assurance regarding the reliability of financial reporting and the preparation of financial statements for external purposes in accordance with generally accepted accounting principles. A company’s internal control over financial reporting includes those policies and procedures that (i) pertain to the maintenance of records that, in reasonable detail, accurately and fairly reflect the transactions and dispositions of the assets of the company; (ii) provide reasonable assurance that transactions are recorded as necessary to permit preparation of financial statements in accordance with generally accepted accounting principles, and that receipts and expenditures of the company are being made only in accordance with authorizations of management and directors of the company; and (iii) provide reasonable assurance regarding prevention or timely detection of unauthorized acquisition, use, or disposition of the company’s assets that could have a material effect on the financial statements.
Because of its inherent limitations, internal control over financial reporting may not prevent or detect misstatements. Also, projections of any evaluation of effectiveness to future periods are subject to the risk that controls may become inadequate because of changes in conditions, or that the degree of compliance with the policies or procedures may deteriorate.
/s/ PricewaterhouseCoopers LLP Cincinnati, Ohio March 31, 2009 34
| | |
Cincinnati, Ohio | |
April 4, 2007 | |
THE KROGER CO.
CONSOLIDATED BALANCE SHEETS
| | February 3, | | January 28, |
| (In millions - except par value) | | 2007 | | 2006 |
| ASSETS | | | | | | | | |
| Current assets | | | | | | | | |
| Cash and temporary cash investments | | $ | 189 | | | $ | 210 | |
| Deposits in-transit | | | 614 | | | | 488 | |
| Receivables | | | 773 | | | | 680 | |
| Receivables - taxes | | | 5 | | | | 6 | |
| FIFO inventory | | | 5,059 | | | | 4,886 | |
| LIFO credit | | | (450 | ) | | | (400 | ) |
| Prefunded employee benefits | | | 300 | | | | 300 | |
| Prepaid and other current assets | | | 265 | | | | 296 | |
| |
| Total current assets | | | 6,755 | | | | 6,466 | |
| Property, plant and equipment, net | | | 11,779 | | | | 11,365 | |
| Goodwill | | | 2,192 | | | | 2,192 | |
| Other assets | | | 489 | | | | 459 | |
| |
| Total Assets | | $ | 21,215 | | | $ | 20,482 | |
| |
| LIABILITIES | | | | | | | | |
| Current liabilities | | | | | | | | |
| Current portion of long-term debt including obligations under capital leases and financing | | | | | | | | |
| obligations | | $ | 906 | | | $ | 554 | |
| Accounts payable | | | 3,804 | | | | 3,546 | |
| Accrued salaries and wages | | | 796 | | | | 780 | |
| Deferred income taxes | | | 268 | | | | 217 | |
| Other current liabilities | | | 1,807 | | | | 1,618 | |
| |
| Total current liabilities | | | 7,581 | | | | 6,715 | |
| Long-term debt including obligations under capital leases and financing obligations | | | | | | | | |
| Face value long-term debt including obligations under capital leases and financing | | | | | | | | |
| obligations | | | 6,136 | | | | 6,651 | |
| Adjustment to reflect fair value interest rate hedges | | | 18 | | | | 27 | |
| |
| Long-term debt including obligations under capital leases and financing obligations | | | 6,154 | | | | 6,678 | |
| Deferred income taxes | | | 722 | | | | 843 | |
| Other long-term liabilities | | | 1,835 | | | | 1,856 | |
| |
| Total Liabilities | | | 16,292 | | | | 16,092 | |
| |
| Commitments and Contingencies (See Note 11) | | | | | | | | |
| SHAREOWNERS’ EQUITY | | | | | | | | |
| Preferred stock, $100 par, 5 shares authorized and unissued | | | — | | | | — | |
| Common stock, $1 par, 1,000 shares authorized: 937 shares issued in 2006 and 927 shares | | | | | | | | |
| issued in 2005 | | | 937 | | | | 927 | |
| Additional paid-in capital | | | 2,755 | | | | 2,536 | |
| Accumulated other comprehensive loss | | | (259 | ) | | | (243 | ) |
| Accumulated earnings | | | 5,501 | | | | 4,573 | |
| Common stock in treasury, at cost, 232 shares in 2006 and 204 shares in 2005 | | | (4,011 | ) | | | (3,403 | ) |
| |
| Total Shareowners’ Equity | | | 4,923 | | | | 4,390 | |
| |
| Total Liabilities and Shareowners’ Equity | | $ | 21,215 | | | $ | 20,482 | |
CONSOLIDATED BALANCE SHEETS
(In millions, except par values) | | January 31,
2009 | | February 2,
2008 | |
ASSETS | | | | | |
Current assets | | | | | |
Cash and temporary cash investments | | $ | 263 | | $ | 242 | |
Deposits in-transit | | 631 | | 676 | |
Receivables | | 944 | | 786 | |
FIFO Inventory | | 5,659 | | 5,453 | |
LIFO credit | | (800 | ) | (604 | ) |
Prefunded employee benefits | | 300 | | 300 | |
Prepaid and other current assets | | 209 | | 255 | |
Total current assets | | 7,206 | | 7,108 | |
| | | | | |
Property, plant and equipment, net | | 13,161 | | 12,498 | |
Goodwill | | 2,271 | | 2,144 | |
Other assets | | 573 | | 543 | |
| | | | | |
Total Assets | | $ | 23,211 | | $ | 22,293 | |
| | | | | |
LIABILITIES | | | | | |
Current liabilities | | | | | |
Current portion of long-term debt including obligations under capital leases and financing obligations | | $ | 558 | | $ | 1,592 | |
Trade accounts payable | | 3,822 | | 3,867 | |
Accrued salaries and wages | | 828 | | 815 | |
Deferred income taxes | | 344 | | 239 | |
Other current liabilities | | 2,077 | | 2,170 | |
| | | | | |
Total current liabilities | | 7,629 | | 8,683 | |
| | | | | |
Long-term debt including obligations under capital leases and financing obligations | | | | | |
Face value long-term debt including obligations under capital leases and financing obligations | | 7,460 | | 6,485 | |
Adjustment to reflect fair value interest rate hedges | | 45 | | 44 | |
| | | | | |
Long-term debt including obligations under capital leases and financing obligations | | 7,505 | | 6,529 | |
| | | | | |
Deferred income taxes | | 384 | | 367 | |
Pension and postretirement benefit obligations | | 1,174 | | 554 | |
Other long-term liabilities | | 1,248 | | 1,246 | |
| | | | | |
Total Liabilities | | 17,940 | | 17,379 | |
| | | | | |
Minority interests | | 95 | | — | |
| | | | | |
Commitments and Contingencies (See Note 11) | | | | | |
SHAREOWNERS’ EQUITY | | | | | |
Preferred stock, $100 par, 5 shares authorized and unissued | | — | | — | |
Common stock, $1 par, 1,000 shares authorized: 955 shares issued in 2008 and 947 shares issued in 2007 | | 955 | | 947 | |
Additional paid-in capital | | 3,266 | | 3,031 | |
Accumulated other comprehensive loss | | (495 | ) | (122 | ) |
Accumulated earnings | | 7,489 | | 6,480 | |
Common stock in treasury, at cost, 306 shares in 2008 and 284 shares in 2007 | | (6,039 | ) | (5,422 | ) |
| | | | | |
Total Shareowners’ Equity | | 5,176 | | 4,914 | |
| | | | | |
Total Liabilities and Shareowners’ Equity | | $ | 23,211 | | $ | 22,293 | |
The accompanying notes are an integral part of the consolidated financial statements.
35
THE KROGER CO.
CCONSOLIDATED STATEMENTS OF OPERATIONSONSOLIDATED STATEMENTSOF OPERATIONS
Years Ended January 31, 2009, February 2, 2008 and February 3, 2007 January 28, 2006, and January 29, 2005
| | 2006 | | 2005 | | 2004 |
| (In millions, except per share amounts) | | (53 weeks) | | (52 weeks) | | (52 weeks) |
| Sales | | $ | 66,111 | | $ | 60,553 | | $ | 56,434 | |
| Merchandise costs, including advertising, warehousing, and transportation, | | | | | | | | | | |
| excluding items shown separately below | | | 50,115 | | | 45,565 | | | 42,140 | |
| Operating, general and administrative | | | 11,839 | | | 11,027 | | | 10,611 | |
| Rent | | | 649 | | | 661 | | | 680 | |
| Depreciation and amortization | | | 1,272 | | | 1,265 | | | 1,256 | |
| Goodwill impairment charge | | | — | | | — | | | 904 | |
| |
| Operating Profit | | | 2,236 | | | 2,035 | | | 843 | |
| Interest expense | | | 488 | | | 510 | | | 557 | |
| |
| Earnings before income tax expense | | | 1,748 | | | 1,525 | | | 286 | |
| Income tax expense | | | 633 | | | 567 | | | 390 | |
| |
| Net earnings (loss) | | $ | 1,115 | | $ | 958 | | $ | (104 | ) |
| |
| Net earnings (loss) per basic common share | | $ | 1.56 | | $ | 1.32 | | $ | (0.14 | ) |
| |
| Average number of common shares used in basic calculation | | | 715 | | | 724 | | | 736 | |
| Net earnings (loss) per diluted common share | | $ | 1.54 | | $ | 1.31 | | $ | (0.14 | ) |
| |
| Average number of common shares used in diluted calculation | | | 723 | | | 731 | | | 736 | |
(In millions, except per share amounts) | | 2008
(52 weeks) | | 2007
(52 weeks) | | 2006
(53 weeks) | |
Sales | | $ | 76,000 | | $ | 70,235 | | $ | 66,111 | |
Merchandise costs, including advertising, warehousing, and transportation, excluding items shown separately below | | 58,564 | | 53,779 | | 50,115 | |
Operating, general and administrative | | 12,884 | | 12,155 | | 11,839 | |
Rent | | 659 | | 644 | | 649 | |
Depreciation and amortization | | 1,442 | | 1,356 | | 1,272 | |
| | | | | | | |
Operating Profit | | 2,451 | | 2,301 | | 2,236 | |
Interest expense | | 485 | | 474 | | 488 | |
| | | | | | | |
Earnings before income tax expense | | 1,966 | | 1,827 | | 1,748 | |
Income tax expense | | 717 | | 646 | | 633 | |
| | | | | | | |
Net earnings | | $ | 1,249 | | $ | 1,181 | | $ | 1,115 | |
| | | | | | | |
Net earnings per basic common share | | $ | 1.92 | | $ | 1.71 | | $ | 1.56 | |
| | | | | | | |
Average number of common shares used in basic calculation | | 652 | | 690 | | 715 | |
| | | | | | | |
Net earnings per diluted common share | | $ | 1.90 | | $ | 1.69 | | $ | 1.54 | |
| | | | | | | |
Average number of common shares used in diluted calculation | | 659 | | 698 | | 723 | |
| | | | | | | |
Dividends declared per common share | | $ | .36 | | $ | .30 | | $ | .26 | |
The accompanying notes are an integral part of the consolidated financial statements.
36
| THE KROGER CO. |
| CONSOLIDATEDSTATEMENTS OFCASHFLOWS |
| |
| Years Ended February 3, 2007, January 28, 2006 and January 29, 2005 | | | | | | | | | | | |
| | 2006 | | 2005 | | 2004 |
| (In millions) | (53 weeks) | | (52 weeks) | | (52 weeks) |
| Cash Flows From Operating Activities: | | | | | | | | | | | |
| Net earnings (loss) | $ | 1,115 | | | $ | 958 | | | $ | (104 | ) |
| Adjustments to reconcile net earnings (loss) to net cash provided by operating activities: | | | | | | | | | | | |
| Depreciation and amortization | | 1,272 | | | | 1,265 | | | | 1,256 | |
| LIFO charge | | 50 | | | | 27 | | | | 49 | |
| Stock option expense | | 72 | | | | 7 | | | | 13 | |
| Expense for Company-sponsored pension plans | | 161 | | | | 138 | | | | 117 | |
| Goodwill impairment charge | | — | | | | — | | | | 861 | |
| Deferred income taxes | | (60 | ) | | | (63 | ) | | | 230 | |
| Other | | 20 | | | | 39 | | | | 59 | |
| Changes in operating assets and liabilities net of effects from acquisitions of businesses: | | | | | | | | | | | |
| Store deposits in-transit | | (125 | ) | | | 18 | | | | 73 | |
| Inventories | | (173 | ) | | | (157 | ) | | | (236 | ) |
| Receivables | | (90 | ) | | | (19 | ) | | | 13 | |
| Prepaid expenses | | (43 | ) | | | 31 | | | | (31 | ) |
| Accounts payable | | 256 | | | | (80 | ) | | | 167 | |
| Accrued expenses | | 98 | | | | 155 | | | | (23 | ) |
| Income taxes receivable (payable) | | (4 | ) | | | 200 | | | | (86 | ) |
| Contribution to Company-sponsored pension plans | | (150 | ) | | | (300 | ) | | | (35 | ) |
| Other | | (48 | ) | | | (27 | ) | | | 7 | |
| |
| Net cash provided by operating activities | | 2,351 | | | | 2,192 | | | | 2,330 | |
| |
| Cash Flows From Investing Activities: | | | | | | | | | | | |
| Capital expenditures, excluding acquisitions | | (1,683 | ) | | | (1,306 | ) | | | (1,634 | ) |
| Proceeds from sale of assets | | 143 | | | | 69 | | | | 86 | |
| Payments for acquisitions, net of cash acquired | | — | | | | — | | | | (25 | ) |
| Other | | (47 | ) | | | (42 | ) | | | (35 | ) |
| |
| Net cash used by investing activities | | (1,587 | ) | | | (1,279 | ) | | | (1,608 | ) |
| |
| Cash Flows From Financing Activities: | | | | | | | | | | | |
| Proceeds from issuance of long-term debt | | 10 | | | | 14 | | | | 616 | |
| Proceeds from lease-financing transactions | | 15 | | | | 76 | | | | 6 | |
| Payments on long-term debt | | (556 | ) | | | (103 | ) | | | (701 | ) |
| Borrowings (payments) on bank revolver | | 352 | | | | (694 | ) | | | (309 | ) |
| Debt prepayment costs | | — | | | | — | | | | (25 | ) |
| Proceeds from issuance of capital stock | | 168 | | | | 78 | | | | 25 | |
| Treasury stock purchases | | (633 | ) | | | (252 | ) | | | (319 | ) |
| Dividends paid | | (140 | ) | | | — | | | | — | |
| Other | | (1 | ) | | | 34 | | | | (30 | ) |
| |
| Net cash used by financing activities | | (785 | ) | | | (847 | ) | | | (737 | ) |
| |
| Net increase (decrease) in cash and temporary cash investments | | (21 | ) | | | 66 | | | | (15 | ) |
| |
| Cash and temporary cash investments: | | | | | | | | | | | |
| Beginning of year | | 210 | | | | 144 | | | | 159 | |
| End of year | $ | 189 | | | $ | 210 | | | $ | 144 | |
| |
| Reconciliation of capital expenditures | | | | | | | | | | | |
| Payments for property and equipment | $ | (1,683 | ) | | $ | (1,306 | ) | | $ | (1,634 | ) |
| Changes in construction-in-progress payables | | (94 | ) | | | — | | | | — | |
| |
| Total capital expenditures | $ | (1,777 | ) | | $ | (1,306 | ) | | $ | (1,634 | ) |
| |
| Disclosure of cash flow information: | | | | | | | | | | | |
| Cash paid during the year for interest | $ | 514 | | | $ | 511 | | | $ | 590 | |
| Cash paid during the year for income taxes | $ | 615 | | | $ | 431 | | | $ | 206 | |
THE KROGER CO.
CONSOLIDATED STATEMENTS OF CASH FLOWS
Years Ended January 31, 2009, February 2, 2008 and February 3, 2007
(In millions) | | 2008
(52 weeks) | | 2007
(52 weeks) | | 2006
(53 weeks) | |
Cash Flows From Operating Activities: | | | | | | | |
Net earnings | | $ | 1,249 | | $ | 1,181 | | $ | 1,115 | |
Adjustments to reconcile net earnings to net cash provided by operating activities: | | | | | | | |
Depreciation and amortization | | 1,442 | | 1,356 | | 1,272 | |
LIFO charge | | 196 | | 154 | | 50 | |
Stock-based employee compensation | | 91 | | 87 | | 72 | |
Expense for Company-sponsored pension plans | | 44 | | 67 | | 161 | |
Deferred income taxes | | 341 | | (86 | ) | (60 | ) |
Other | | (36 | ) | 37 | | 20 | |
Changes in operating assets and liabilities net of effects from acquisitions of businesses: | | | | | | | |
Store deposits in-transit | | 45 | | (62 | ) | (125 | ) |
Inventories | | (193 | ) | (381 | ) | (173 | ) |
Receivables | | (28 | ) | (17 | ) | (90 | ) |
Prepaid expenses | | 47 | | 3 | | (43 | ) |
Accounts payable | | (53 | ) | 165 | | 220 | |
Accrued expenses | | (33 | ) | 174 | | 134 | |
Income taxes receivable (payable) | | (206 | ) | 43 | | (4 | ) |
Contribution to Company-sponsored pension plans | | (20 | ) | (51 | ) | (150 | ) |
Other | | 10 | | (89 | ) | (48 | ) |
| | | | | | | |
Net cash provided by operating activities | | 2,896 | | 2,581 | | 2,351 | |
| | | | | | | |
Cash Flows From Investing Activities: | | | | | | | |
Payments for capital expenditures | | (2,149 | ) | (2,126 | ) | (1,683 | ) |
Proceeds from sale of assets | | 59 | | 49 | | 143 | |
Payments for acquisitions | | (80 | ) | (90 | ) | — | |
Other | | (9 | ) | (51 | ) | (47 | ) |
| | | | | | | |
Net cash used by investing activities | | (2,179 | ) | (2,218 | ) | (1,587 | ) |
| | | | | | | |
Cash Flows From Financing Activities: | | | | | | | |
Proceeds from issuance of long-term debt | | 1,377 | | 1,372 | | 10 | |
Payments on long-term debt | | (1,048 | ) | (560 | ) | (556 | ) |
Borrowings (payments) on bank revolver | | (441 | ) | 218 | | 352 | |
Excess tax benefits on stock-based awards | | 15 | | 36 | | 38 | |
Proceeds from issuance of capital stock | | 172 | | 188 | | 168 | |
Treasury stock purchases | | (637 | ) | (1,421 | ) | (633 | ) |
Dividends paid | | (227 | ) | (202 | ) | (140 | ) |
Increase in book overdrafts | | 2 | | 61 | | 1 | |
Other | | 18 | | (2 | ) | (25 | ) |
| | | | | | | |
Net cash used by financing activities | | (769 | ) | (310 | ) | (785 | ) |
| | | | | | | |
Net increase (decrease) in cash and temporary cash investments | | (52 | ) | 53 | | (21 | ) |
| | | | | | | |
Cash from Consolidated Variable Interest Entity | | 73 | | — | | — | |
| | | | | | | |
Cash and temporary cash investments: | | | | | | | |
Beginning of year | | 242 | | 189 | | 210 | |
End of year | | $ | 263 | | $ | 242 | | $ | 189 | |
| | | | | | | |
Reconciliation of capital expenditures: | | | | | | | |
Payments for capital expenditures | | $ | (2,149 | ) | $ | (2,126 | ) | $ | (1,683 | ) |
Changes in construction-in-progress payables | | (4 | ) | 66 | | (94 | ) |
| | | | | | | |
Total capital expenditures | | $ | (2,153 | ) | $ | (2,060 | ) | $ | (1,777 | ) |
| | | | | | | |
Disclosure of cash flow information: | | | | | | | |
Cash paid during the year for interest | | $ | 485 | | $ | 477 | | $ | 514 | |
Cash paid during the year for income taxes | | $ | 641 | | $ | 640 | | $ | 615 | |
The accompanying notes are an integral part of the consolidated financial statements.
37
| THE KROGER CO. |
| CONSOLIDATEDSTATEMENT OFCHANGES INSHAREOWNERS’EQUITY |
| |
| Years Ended February 3, 2007, January 28, 2006 and January 29, 2005 | | | | | | | | | | | | | | | | | | | | |
| | | | | | | | | | | | | | | | | | | | | Accumulated | | | | | | | | |
| | | | | | | | | | Additional | | | | | | | | | Other | | | | | | | | |
| | | Common Stock | | Paid-In | | Treasury Stock | | Comprehensive | | Accumulated | | | | |
| (In millions) | | Shares | | Amount | | Capital | | Shares | | Amount | | Gain (Loss) | | Earnings | | Total |
| Balances at January 31, 2004 | | 913 | | | $ | 913 | | | $ | 2,382 | | | 170 | | | $ | (2,827 | ) | | $ | (124 | ) | | $ | 3,724 | | | $ | 4,068 | |
| Issuance of common stock: | | | | | | | | | | | | | | | | | | | | | | | | | | | | | | |
| Stock options and warrants exercised | | 4 | | | | 4 | | | | 25 | | | — | | | | — | | | | — | | | | — | | | | 29 | |
| Restricted stock issued | | 1 | | | | 1 | | | | 9 | | | — | | | | — | | | | — | | | | — | | | | 10 | |
| Treasury stock activity: | | | | | | | | | | | | | | | | | | | | | | | | | | | | | | |
| Treasury stock purchases, at cost | | — | | | | — | | | | — | | | 18 | | | | (294 | ) | | | — | | | | — | | | | (294 | ) |
| Stock options and restricted stock exchanged | | — | | | | — | | | | — | | | 2 | | | | (28 | ) | | | — | | | | — | | | | (28 | ) |
| Tax benefits from exercise of stock options and warrants | | — | | | | — | | | | 16 | | | — | | | | — | | | | — | | | | — | | | | 16 | |
| Other comprehensive gain, net of income tax of $47 | | — | | | | — | | | | — | | | — | | | | — | | | | (78 | ) | | | — | | | | (78 | ) |
| Net loss | | — | | | | — | | | | — | | | — | | | | — | | | | — | | | | (104 | ) | | | (104 | ) |
| |
| Balances at January 29, 2005 | | 918 | | | | 918 | | | | 2,432 | | | 190 | | | | (3,149 | ) | | | (202 | ) | | | 3,620 | | | | 3,619 | |
| Issuance of common stock: | | | | | | | | | | | | | | | | | | | | | | | | | | | | | | |
| Stock options and warrants exercised | | 8 | | | | 8 | | | | 57 | | | — | | | | — | | | | — | | | | — | | | | 65 | |
| Restricted stock issued | | 1 | | | | 1 | | | | 13 | | | — | | | | — | | | | — | | | | — | | | | 14 | |
| Treasury stock activity: | | | | | | | | | | | | | | | | | | | | | | | | | | | | | | |
| Treasury stock purchases, at cost | | — | | | | — | | | | — | | | 14 | | | | (239 | ) | | | — | | | | — | | | | (239 | ) |
| Stock options and restricted stock exchanged | | — | | | | — | | | | — | | | — | | | | (15 | ) | | | — | | | | — | | | | (15 | ) |
| Tax benefits from exercise of stock options and warrants | | — | | | | — | | | | 34 | | | — | | | | — | | | | — | | | | — | | | | 34 | |
| Other comprehensive loss net of income tax of $26 | | — | | | | — | | | | — | | | — | | | | — | | | | (41 | ) | | | — | | | | (41 | ) |
| Other | | — | | | | — | | | | — | | | — | | | | — | | | | — | | | | (5 | ) | | | (5 | ) |
| Net earnings | | — | | | | — | | | | — | | | — | | | | — | | | | — | | | | 958 | | | | 958 | |
| |
| Balances at January 28, 2006 | | 927 | | | | 927 | | | | 2,536 | | | 204 | | | | (3,403 | ) | | | (243 | ) | | | 4,573 | | | | 4,390 | |
| Issuance of common stock: | | | | | | | | | | | | | | | | | | | | | | | | | | | | | | |
| Stock options and warrants exercised | | 9 | | | | 9 | | | | 95 | | | (1 | ) | | | 30 | | | | — | | | | — | | | | 134 | |
| Restricted stock issued | | 1 | | | | 1 | | | | 13 | | | — | | | | (5 | ) | | | — | | | | — | | | | 9 | |
| Treasury stock activity: | | | | | | | | | | | | | | | | | | | | | | | | | | | | | | |
| Treasury stock purchases, at cost | | — | | | | — | | | | — | | | 18 | | | | (374 | ) | | | — | | | | — | | | | (374 | ) |
| Stock options and restricted stock exchanged | | — | | | | — | | | | — | | | 11 | | | | (259 | ) | | | — | | | | — | | | | (259 | ) |
| Tax benefits from exercise of stock options and warrants | | — | | | | — | | | | 39 | | | — | | | | — | | | | — | | | | — | | | | 39 | |
| Share-based employee compensation | | — | | | | — | | | | 72 | | | — | | | | — | | | | — | | | | — | | | | 72 | |
| Other comprehensive gain net of income tax of $(63) | | — | | | | — | | | | — | | | — | | | | — | | | | 102 | | | | — | | | | 102 | |
| SFAS No. 158 adjustment net of income tax of $71 | | — | | | | — | | | | — | | | — | | | | — | | | | (120 | ) | | | — | | | | (120 | ) |
| Other | | — | | | | — | | | | — | | | — | | | | — | | | | 2 | | | | — | | | | 2 | |
| Cash dividends declared ($0.26 per common share) | | — | | | | — | | | | — | | | — | | | | — | | | | — | | | | (187 | ) | | | (187 | ) |
| Net earnings | | — | | | | — | | | | — | | | — | | | | — | | | | — | | | | 1,115 | | | | 1,115 | |
| |
| Balances at February 3, 2007 | | 937 | | | $ | 937 | | | $ | 2,755 | | | 232 | | | $ | (4,011 | ) | | $ | (259 | ) | | $ | 5,501 | | | $ | 4,923 | |
| | 2006 | | 2005 | | 2004 |
| Net earnings (loss) | $ | 1,115 | | | $ | 958 | | | $ | (104 | ) |
| Reclassification adjustment for losses included in net earnings (loss) | | — | | | | — | | | | — | |
| Unrealized gain (loss) on hedging activities, net of income tax of $(5) in 2006 $(1) in 2005 and $1 | | | | | | | | | | | |
| in 2004 | | 7 | | | | 1 | | | | (1 | ) |
| Additional minimum pension liability adjustment, net of income tax of $(58) in 2006, $26 in 2005 | | | | | | | | | | | |
| and $46 in 2004 | | 95 | | | | (42 | ) | | | (77 | ) |
| |
| Comprehensive income (loss) | $ | 1,217 | | | $ | 917 | | | $ | (182 | ) |
THE KROGER CO.
CONSOLIDATED STATEMENT OF CHANGES IN SHAREOWNERS’ EQUITY
Years Ended January 31, 2009, February 2, 2008 and February 3, 2007
| | | | | | | | | | | | Accumulated | | | | | |
| | | | | | Additional | | | | | | Other | | | | | |
| | Common Stock | | Paid-In | | Treasury Stock | | Comprehensive | | Accumulated | | | |
(In millions, except per share amounts) | | Shares | | Amount | | Capital | | Shares | | Amount | | Gain (Loss) | | Earnings | | Total | |
Balances at January 28, 2006 | | 927 | | $ | 927 | | $ | 2,536 | | 204 | | $ | (3,403 | ) | $ | (243 | ) | $ | 4,573 | | $ | 4,390 | |
Issuance of common stock: | | | | | | | | | | | | | | | | | |
Stock options and warrants exercised | | 9 | | 9 | | 95 | | (1 | ) | 30 | | — | | — | | 134 | |
Restricted stock issued | | 1 | | 1 | | 13 | | — | | (5 | ) | — | | — | | 9 | |
Treasury stock activity: | | | | | | | | | | | | | | | | | |
Treasury stock purchases, at cost | | — | | — | | — | | 18 | | (374 | ) | — | | — | | (374 | ) |
Stock options and restricted stock exchanged | | — | | — | | — | | 11 | | (259 | ) | — | | — | | (259 | ) |
Tax benefits from exercise of stock options and warrants | | — | | — | | 39 | | — | | — | | — | | — | | 39 | |
Share-based employee compensation | | — | | — | | 72 | | — | | — | | — | | — | | 72 | |
Other comprehensive gain net of income tax of $63 | | — | | — | | — | | — | | — | | 102 | | — | | 102 | |
SFAS No. 158 adjustment net of income tax of $(71) | | — | | — | | — | | — | | — | | (120 | ) | — | | (120 | ) |
Other | | — | | — | | — | | — | | — | | 2 | | | | 2 | |
Cash dividends declared ($0.26 per common share) | | — | | — | | — | | — | | — | | — | | (187 | ) | (187 | ) |
Net earnings | | — | | — | | — | | — | | — | | — | | 1,115 | | 1,115 | |
| | | | | | | | | | | | | | | | | |
Balances at February 3, 2007 | | 937 | | 937 | | 2,755 | | 232 | | (4,011 | ) | (259 | ) | 5,501 | | 4,923 | |
Issuance of common stock: | | | | | | | | | | | | | | | | | |
Stock options exercised | | 10 | | 10 | | 175 | | — | | 3 | | — | | — | | 188 | |
Restricted stock issued | | — | | — | | (25 | ) | (1 | ) | 11 | | — | | — | | (14 | ) |
Treasury stock activity: | | | | | | | | | | | | | | | | | |
Treasury stock purchases, at cost | | — | | — | | — | | 43 | | (1,151 | ) | — | | — | | (1,151 | ) |
Stock options and restricted stock exchanged | | — | | — | | — | | 10 | | (270 | ) | — | | — | | (270 | ) |
Tax benefits from exercise of stock options | | — | | — | | 35 | | — | | — | | — | | — | | 35 | |
Share-based employee compensation | | — | | — | | 87 | | — | | — | | — | | — | | 87 | |
Other comprehensive gain net of income tax of $82 | | — | | — | | — | | — | | — | | 137 | | — | | 137 | |
Other | | — | | — | | 4 | | — | | (4 | ) | — | | 4 | | 4 | |
Cash dividends declared ($0.30 per common share) | | — | | — | | — | | — | | — | | — | | (206 | ) | (206 | ) |
Net earnings | | — | | — | | — | | — | | — | | — | | 1,181 | | 1,181 | |
| | | | | | | | | | | | | | | | | |
Balances at February 2, 2008 | | 947 | | 947 | | 3,031 | | 284 | | (5,422 | ) | (122 | ) | 6,480 | | 4,914 | |
Issuance of common stock: | | | | | | | | | | | | | | | | | |
Stock options exercised | | 8 | | 8 | | 162 | | — | | 3 | | — | | — | | 173 | |
Restricted stock issued | | — | | — | | (46 | ) | (1 | ) | 30 | | — | | — | | (16 | ) |
Treasury stock activity: | | | | | | | | | | | | | | | | | |
Treasury stock purchases, at cost | | — | | — | | — | | 16 | | (448 | ) | — | | — | | (448 | ) |
Stock options and restricted stock exchanged | | — | | — | | — | | 7 | | (189 | ) | — | | — | | (189 | ) |
Tax benefits from exercise of stock options | | — | | — | | 15 | | — | | — | | — | | — | | 15 | |
Share-based employee compensation | | — | | — | | 91 | | — | | — | | — | | — | | 91 | |
Other comprehensive loss net of income tax of $(224) | | — | | — | | — | | — | | — | | (373 | ) | — | | (373 | ) |
Other | | — | | — | | 13 | | — | | (13 | ) | — | | (3 | ) | (3 | ) |
Cash dividends declared ($0.36 per common share) | | — | | — | | — | | — | | — | | — | | (237 | ) | (237 | ) |
Net earnings | | — | | — | | — | | — | | — | | — | | 1,249 | | 1,249 | |
| | | | | | | | | | | | | | | | | |
Balances at January 31, 2009 | | 955 | | $ | 955 | | $ | 3,266 | | 306 | | $ | (6,039 | ) | $ | (495 | ) | $ | 7,489 | | $ | 5,176 | |
Comprehensive income:
| | 2008 | | 2007 | | 2006 | |
Net earnings | | $ | 1,249 | | $ | 1,181 | | $ | 1,115 | |
Unrealized gain (loss) on hedging activities, net of income tax of $2 in 2008, $(13) in 2007 and $5 in 2006 | | 3 | | (21 | ) | 7 | |
Amortization of unrealized gains and losses on hedging activities, net of income tax of $(2) | | (3 | ) | — | | — | |
Additional minimum pension liability adjustment, net of income tax of $58 in 2006 | | — | | — | | 95 | |
Change in pension and other postretirement defined benefit plans, net of income tax of $(224) in 2008 and $95 in 2007 | | (373 | ) | 158 | | — | |
| | | | | | | |
Comprehensive income | | $ | 876 | | $ | 1,318 | | $ | 1,217 | |
The accompanying notes are an integral part of the consolidated financial statements.
38
NNOTES TO CONSOLIDATED FINANCIAL STATEMENTSOTESTO CONSOLIDATED FINANCIAL STATEMENTS
All dollar amounts are in millions except share and per share amounts.
Certain prior-year amounts have been reclassified to conform to current year presentation.
1. ACCOUNTINGACCOUNTING POLICIES
The following is a summary of the significant accounting policies followed in preparing these financial statements.
Description of Business, Basis of Presentation and Principles of Consolidation
The Kroger Co. (the “Company”) was founded in 1883 and incorporated in 1902. As of February 3, 2007,January 31, 2009, the Company was one of the largest retailers in the United States based on annual sales. The Company also manufactures and processes food for sale by its supermarkets. The accompanying financial statements include the consolidated accounts of the Company, its wholly-owned subsidiaries and its subsidiaries.the Variable Interest Entities (“VIE”) in which the Company is the primary beneficiary. Significant intercompany transactions and balances have been eliminated.
Fiscal Year
The Company’s fiscal year ends on the Saturday nearest January 31. The last three fiscal years consist of the 52-week period ended January 31, 2009, the 52-week period ended February 2, 2008, and the 53-week period ended February 3, 2007, the 52-week period ended January 28, 2006, and the 52-week period ended January 29, 2005.2007.
Pervasiveness of Estimates
The preparation of financial statements in conformity with generally accepted accounting principles (“GAAP”) requires management to make estimates and assumptions that affect the reported amounts of assets and liabilities. Disclosure of contingent assets and liabilities as of the date of the consolidated financial statements and the reported amounts of consolidated revenues and expenses during the reporting period also is required. Actual results could differ from those estimates.
Cash and temporary cash investments
Inventories
Cash and temporary cash investments represent store cash, escrow deposits and Euros held to settle Euro-denominated contracts. In accordance with Statement of Financial Accounting Standards (“SFAS”) No. 52, Foreign Currency Translation, the Company valued its carrying amount of Euros at the spot rates as of January 31, 2009 and February 2, 2008.
Inventories
Inventories are stated at the lower of cost (principally on a last-in, first-out “LIFO” basis) or market. In total, approximately 98% and 97% of inventories for 20062008 and 20052007, respectively, were valued using the LIFO method. Cost for the balance of the inventories, including substantially all fuel inventories, was determined using the first-in, first-out (“FIFO”) method. Replacement cost was higher than the carrying amount by $450$800 at January 31, 2009 and $604 at February 3, 2007 and $400 at January 28, 2006.2, 2008. The Company follows the Link-Chain, Dollar-Value LIFO method for purposes of calculating its LIFO charge or credit.
The item-cost method of accounting to determine inventory cost before the LIFO adjustment is followed for substantially all store inventories at the Company’s supermarket divisions. This method involves counting each item in inventory, assigning costs to each of these items based on the actual purchase costs (net of vendor allowances and cash discounts) of each item and recording the actual cost of items sold. The item-cost method of accounting allows for more accurate reporting of periodic inventory balances and enables management to more precisely manage inventory when compared to the retail method of accounting.
The Company evaluates inventory shortages throughout the year based on actual physical counts in its facilities. Allowances for inventory shortages are recorded based on the results of these counts to provide for estimated shortages as of the financial statement date.
39
Property, Plant and Equipment
Generally, property,
Property, plant and equipment are recorded at cost. Depreciation expense, which includes the amortization of assets recorded under capital leases, is computed principally using the straight-line method over the estimated useful lives of individual assets. Leasehold improvements are depreciated over the shorter of the remaining life of the lease term or the useful life of the asset. Buildings and land improvements are depreciated based on lives varying from 10 to 40 years. All new purchases of store equipment are assigned lives varying from three to nine years. Some store equipment acquired as a result of the Fred Meyer merger was assigned a 15-year life. The life of this equipment was not changed. All new purchases of store equipment are assigned lives varying from three to nine years. Leasehold improvements are amortized over the shorter of the lease term to which they relate, which varies from four to 25 years, or the useful life of the asset. Manufacturing plant and distribution center equipment is depreciated over lives varying from three to 15 years. Information technology assets are generally depreciated over five years. Depreciation and amortization expense was $1,442 in 2008, $1,356 in 2007 and $1,272 in 2006, $1,265 in 2005 and $1,256 in 2004.2006.
Interest costs on significant projects constructed for the Company’s own use are capitalized as part of the costs of the newly constructed facilities. Upon retirement or disposal of assets, the cost and related accumulated depreciation are removed from the balance sheet and any gain or loss is reflected in net earnings.
Deferred Rent
The Company recognizes rent holidays, including the time period during which the Company has access to the property for construction of buildings or improvements as well as construction allowances and escalating rent provisions on a straight-line basis over the term of the lease. The deferred amount is included in Other Current Liabilities and Other Long-Term Liabilities on the Company’s Consolidated Balance Sheets.
Goodwill
The Company reviews goodwill for impairment during the fourth quarter of each year, and also upon the occurrence of trigger events. The reviews are performed at the operating division level. Generally, fair value representsis determined using a multiple of earnings, or discounted projected future cash flows, and is compared to the carrying value of a division for purposes of identifying potential impairment. Projected future cash flows are based on management’s knowledge of the current operating environment and expectations for the future. If potential for impairment is identified, the fair value of a division is measured against the fair value of its underlying assets and liabilities, excluding goodwill, to estimate an implied fair value of the division’s goodwill. Goodwill impairment is recognized for any excess of the carrying value of the division’s goodwill over the implied fair value. Results of the goodwill impairment reviews performed during 2006, 20052008, 2007 and 20042006 are summarized in Note 2 to the Consolidated Financial Statements.
Intangible Assets
In addition to goodwill, the Company has recorded intangible assets totaling $26, $22 and $28 for leasehold equities, liquor licenses and pharmacy prescription file purchases, respectively at February 3, 2007. Balances at January 28, 2006 were $35, $20 and $30 for leasehold equities, liquor licenses and pharmacy prescription files, respectively. Leasehold equities are amortized over the remaining life of the lease. Owned liquor licenses are not amortized, while liquor licenses that must be renewed are amortized over their useful lives. Pharmacy prescription file purchases are amortized over seven years. These assets are considered annually during the Company’s testing for impairment.
Impairment of Long-Lived Assets
In accordance with Statement of Financial Accounting Standards (“SFAS”)SFAS No. 144, Accounting for the Impairment or Disposal of Long-Lived Assets, the Company monitors the carrying value of long-lived assets for potential impairment each quarter based on whether certain trigger events have occurred. These events include current period losses combined with a history of losses or a projection of continuing losses or a significant decrease in the market value of an asset. When a trigger event occurs, an impairment calculation is performed, comparing projected undiscounted future cash flows, utilizing current cash flow information and expected growth rates related to specific stores, to the carrying value for those stores. If the Company identifies impairment is identified for long-lived assets to be held and used, the Company compares the assets’ current carrying value to the assets’ fair value. Fair value is determined based on market values or discounted future cash flows are compared to the asset’s current carrying value. Impairment is recordedflows. The Company records impairment when the carrying value exceeds the discounted cash flows.fair market value. With respect to owned property and equipment held for sale, the value of the property and equipment is adjusted to reflect recoverable values based on previous efforts to dispose of similar assets and current economic conditions. Impairment is recognized for the excess of the carrying value over the estimated fair market value, reduced by estimated direct costs of disposal. The Company recorded asset impairments in the normal course of business totaling $26, $24 and $61 $48in 2008, 2007 and $24 in 2006, 2005 and 2004.respectively. Costs to reduce the carrying value of long-lived assets for each of the years presented have been included in the Consolidated Statements of Operations as “Operating, general and administrative” expense.
40
Store Closing Costs
All closed store liabilities related to exit or disposal activities initiated after December 31, 2002, are accounted for in accordance with SFAS No. 146, Accounting for Costs Associated with Exit or Disposal Activities. The Company provides for closed store liabilities relating to the present value of the estimated remaining noncancellable lease payments after the closing date, net of estimated subtenant income. The Company estimates the net lease liabilities using a discount rate to calculate the present value of the remaining net rent payments on closed stores. The closed store lease liabilities usually are paid over the lease terms associated with the closed stores, which generally have remaining terms ranging from one to 20 years. Adjustments to closed store liabilities primarily relate to changes in subtenant income and actual exit costs differing from original estimates. Adjustments are made for changes in estimates in the period in which the change becomes known. Store closing liabilities are reviewed quarterly to ensure that any accrued amount that is not a sufficient estimate of future costs, or that no longer is needed for its originally intended purpose, is adjusted to income in the proper period.
Owned stores held for disposal are reduced to their estimated net realizable value. Costs to reduce the carrying values of property, equipment and leasehold improvements are accounted for in accordance with ourthe Company’s policy on impairment of long-lived assets. Inventory write-downs, if any, in connection with store closings, are classified in “Merchandise costs.” Costs to transfer inventory and equipment from closed stores are expensed as incurred.
The following table summarizes accrual activity for future lease obligations of stores closed that were closed in the normal course of business, not part of a coordinated closing.business:
| Future Lease |
| Obligations |
Balance at January 29, 2005 | $ | 65 | |
Additions | | 10 | |
Payments | | (8 | ) |
Adjustments | | (2 | ) |
|
Balance at January 28, 2006 | | 65 | |
Additions | | 9 | |
Payments | | (14 | ) |
Adjustments | | (27 | ) |
|
Balance at February 3, 2007 | $ | 33 | |
In addition, as of February 3, 2007, the Company maintained a $48 liability for facility closure costs, representing the present value of lease obligations remaining through 2019 for locations closed in California prior to the Fred Meyer merger in 1999, and an $8 liability for store closing costs related to two distinct, formalized plans that coordinated the closing of several locations over relatively short periods of time in 2000 and 2001.
| | Future Lease
Obligations | |
Balance at February 3, 2007 | | $ | 89 | |
Additions | | 8 | |
Payments | | (16 | ) |
Adjustments | | (7 | ) |
| | | |
Balance at February 2, 2008 | | 74 | |
Additions | | 4 | |
Payments | | (13 | ) |
| | | |
Balance at January 31, 2009 | | $ | 65 | |
Interest Rate Risk Management
The Company uses derivative instruments primarily to manage its exposure to changes in interest rates. The Company’s current program relative to interest rate protection and the methods by which the Company accounts for its derivative instruments are described in Note 6.
Commodity Price Protection
The Company enters into purchase commitments for various resources, including raw materials utilized in its manufacturing facilities and energy to be used in its stores, manufacturing facilities and administrative offices. The Company enters into commitments expecting to take delivery of and to utilize those resources in the conduct of the normal course of business. The Company’s current program relative to commodity price protection and the methods by which the Company accounts for its purchase commitments are described in Note 6.
41
Benefit Plans
Effective February 3, 2007, the Company adopted the recognition and disclosure provisions (except for the measurement date change) of SFAS No. 158,Employers’ Accounting for Defined Benefit Pension and Other Postretirement Plans-an amendment of FASB StatementsStatement No. 87, 99, 106 and 123(R)132(R) (SFAS 158), which requiredrequires the recognition of the funded status of its retirement plans on the Consolidated Balance Sheet. Actuarial gains or losses, prior service costs or credits and transition obligations that have not yet been recognized are now required to be recorded as a component of Accumulated Other Comprehensive Income (“AOCI”). The Company adopted the measurement date provisions of SFAS 158 effective February 3, 2008. The majority of our pension and postretirement plans previously used a December 31 measurement date. All plans are now measured as of the Company’s fiscal year end. The non-cash effect of the adoption of the measurement date provisions of SFAS 158 decreased shareholders’ equity by approximately $5 ($3 after-tax) and increased long-term liabilities by approximately $5. There was no effect on the Company’s results of operations.
The determination of the obligation and expense for Company-sponsored pension plans and other post-retirement benefits is dependent on the selection of assumptions used by actuaries and the Company in calculating those amounts. Those assumptions are described in Note 1413 and include, among others, the discount rate, the expected long-term rate of return on plan assets and the rates of increase in compensation and health care costs. Actual results that differ from the assumptions are accumulated and amortized over future periods and, therefore, generally affect the recognized expense and recorded obligation in future periods. While the Company believes that the assumptions are appropriate, significant differences in actual experience or significant changes in assumptions may materially affect the pension and other post-retirement obligations and future expense.
The Company also participates in various multi-employer plans for substantially all union employees. Pension expense for these plans is recognized as contributions are funded. Refer to Note 1413 for additional information regarding the Company’s benefit plans.
Stock Option PlansBased Compensation
Effective January 29, 2006, theThe Company adoptedaccounts for stock options under the fair value recognition provisions of SFAS No. 123(R),Share-Based Payment using the modified prospective transition method and, therefore, has not restated results for prior periods. (SFAS 123(R)). Under this method, the Company recognizes compensation expense for all share-based payments granted after January 29, 2006, as well as all share-based payments granted prior to, but not yet vested as of, January 29, 2006, in accordance with SFAS No. 123(R). Under the fair value recognition provisions of SFAS No. 123(R), the Company recognizes share-based compensation expense, net of an estimated forfeiture rate, over the requisite service period of the award. PriorIn addition, the Company accounts for restricted stock awards under SFAS 123(R). The Company records expense for restricted stock awards in an amount equal to the adoption of SFAS No. 123(R), the Company accounted for share-based payments under Accounting Principles Board Opinion No. 25,Accounting for Stock Issued to Employees, (“APB No. 25”) and the disclosure provisions of SFAS No. 123. The Company also elected the alternative transition method for calculating windfall tax benefits available asfair market value of the adoptionunderlying stock on the grant date of SFAS No. 123(R). For further information regarding the adoption of SFAS No. 123(R), see Note 10 toaward, over the Consolidated Financial Statements.period the awards lapse.
Deferred Income Taxes
Deferred income taxes are recorded to reflect the tax consequences of differences between the tax basis of assets and liabilities and their financial reporting basis. Refer to Note 4 for the types of differences that give rise to significant portions of deferred income tax assets and liabilities. Deferred income taxes are classified as a net current or noncurrent asset or liability based on the classification of the related asset or liability for financial reporting purposes. A deferred tax asset or liability that is not related to an asset or liability for financial reporting is classified according to the expected reversal date.
Uncertain Tax ContingenciesPositions
Effective February 4, 2007, the Company adopted FASB Interpretation No. 48, Accounting for Uncertainty in Income Taxes — an interpretation of FASB Statement No. 109 (“FIN No. 48”), which prescribes a recognition threshold and measurement attribute for the financial statement recognition and measurement of a tax position taken or expected to be taken in a tax return. This interpretation also provides guidance on derecognition, classification, interest and penalties, accounting in interim periods, disclosure, and transition.
Various taxing authorities periodically audit the Company’s income tax returns. These audits include questions regarding the Company’s tax filing positions, including the timing and amount of deductions and the allocation of income to various tax jurisdictions. In evaluating the exposures connected with these various tax filing positions, including state and local taxes, the Company records allowances for probable exposures. A number of years may elapse before a particular matter, for which an allowance has been established, is audited and fully resolved. As of February 3, 2007, tax years 2002 through 2004 were undergoingJanuary 31, 2009, the most recent examination concluded by the Internal Revenue Service.Service covered the years 2002 through 2004.
42
The establishmentassessment of the Company’s tax contingency allowancesposition relies on the judgment of management to estimate the exposures associated with the Company’s various filing positions.
Self-Insurance Costs
The Company primarily is self-insured for costs related to workers’ compensation and general liability claims. Liabilities are actuarially determined and are recognized based on claims filed and an estimate of claims incurred but not reported. The liabilities for workers’ compensation claims are accounted for on a present value basis. The Company has purchased stop-loss coverage to limit its exposure to any significant exposure on a per claim basis. The Company is insured for covered costs in excess of these per claim limits.
The following table summarizes the changes in the Company’s self-insurance liability through January 31, 2009.
| | 2008 | | 2007 | | 2006 | |
Beginning balance | | $ | 470 | | $ | 440 | | $ | 445 | |
Expense | | 189 | | 215 | | 196 | |
Claim payments | | (191 | ) | (185 | ) | (201 | ) |
Ending balance | | 468 | | 470 | | 440 | |
Less current portion | | (192 | ) | (183 | ) | (165 | ) |
Long-term portion | | $ | 276 | | $ | 287 | | $ | 275 | |
The current portion of the self-insured liability is included in “Other current liabilities”, and the long-term portion is included in “Other long-term liabilities” in the Consolidated Balance Sheets.
The Company is also similarly self-insured for property-related losses. The Company has purchased stop-loss coverage to limit its exposure to losses in excess of $25 on a per claim basis, except in the case of an earthquake, for which stop-loss coverage is in excess of $50 per claim, up to $200 per claim in California and $300 outside of California.
Revenue Recognition
Revenues from the sale of products are recognized at the point of sale of the Company’s products. Discounts provided to customers by the Company at the time of sale, including those provided in connection with loyalty cards, are recognized as a reduction in sales as the products are sold. Discounts provided by vendors, usually in the form of paper coupons, are not recognized as a reduction in sales provided the coupons are redeemable at any retailer that accepts coupons. Pharmacy sales are recorded when picked up byprovided to the customer. Sales taxes are not recorded as a component of sales. The Company does not recognize a sale when it sells gift cards and gift certificates. Rather, a sale is recognized when the gift card or gift certificate is redeemed to purchase the Company’s products.
Merchandise Costs
In addition to
The “Merchandise costs” line item of the Consolidated Statements of Operations includes product costs, net of discounts and allowances; advertising costs (see separate discussion below); inbound freight charges; warehousing costs, including receiving and inspection costs; transportation costs; and manufacturing production and operational costs are included in the “Merchandise costs” line item of the Consolidated Statements of Operations.costs. Warehousing, transportation and manufacturing management salaries are also included in the “Merchandise costs” line item; however, purchasing management salaries and administration costs are included in the “Operating, general, and administrative” line item along with most of the Company’s other managerial and administrative costs. Rent expense and depreciation expense are shown separately in the Consolidated Statements of Operations.
Warehousing and transportation costs include distribution center direct wages, repairs and maintenance, utilities, inbound freight and, where applicable, third party warehouse management fees, as well as transportation direct wages and repairs and maintenance. These costs are recognized in the periods the related expenses are incurred.
43
The Company believes the classification of costs included in merchandise costs could vary widely throughout the industry. The Company’s approach is to include in the “Merchandise costs” line item the direct, net costs of acquiring products and making them available to customers in its stores. The Company believes this approach most accurately presents the actual costs of products sold.
The Company recognizes all vendor allowances as a reduction in merchandise costs when the related product is sold. When possible, vendor allowances are applied to the related product by item and, therefore, reduce the carrying value of inventory by item. When the items are sold, the vendor allowance is recognized. When it is not possible, due to systems constraints, to allocate vendor allowances to the product by item, vendor allowances are recognized as a reduction in merchandise costs based on inventory turns and, therefore, recognized as the product is sold.
Advertising Costs
The Company’s advertising costs are recognized in the periods the related expenses are incurred and are included in the“Merchandise “Merchandise costs” line item of the Consolidated Statements of Operations. The Company’s pre-tax advertising costs totaled $532 in 2008, $506 in 2007 and $508 in 2006, $498 in 2005 and $528 in 2004.2006. The Company does not record vendor allowances for co-operative advertising as a reduction of advertising expense.
Deposits In-Transit
Deposits in-transit generally represent funds deposited to the Company’s bank accounts at the end of the quarteryear related to sales, a majority of which were paid for with credit cards and checks, to which the Company does not have immediate access.
Consolidated Statements of Cash Flows
For purposes of the Consolidated Statements of Cash Flows, the Company considers all highly liquid debt instruments purchased with an original maturity of three months or less to be temporary cash investments. Book overdrafts, which are included in accounts payable, represent disbursements that are funded as the item is presented for payment. Book overdrafts totaled $600, $596$663, $661 and $562$600 as of January 31, 2009, February 2, 2008, and February 3, 2007, January 28, 2006, and January 29, 2005, respectively, and are reflected as a financing activity in the Consolidated Statements of Cash Flows.
Segments
Segments
The Company operates retail food and drug stores, multi-department stores, jewelry stores, and convenience stores throughout the United States. The Company’s retail operations, which represent substantially all of the Company’s consolidated sales, are its only reportable segment. All of the Company’s operations are domestic.
44
2. GOODWILLGOODWILL
The annual evaluation of goodwill performed during the fourth quarter of 20062008, 2007 and 20052006 did not result in impairment.
The annual evaluation of goodwill performed during the fourth quarter of 2004 resulted in a $904 pre-tax, non-cash impairment charge related to goodwill at the Company’s Ralphs and Food 4 Less divisions. The divisions’ operating performance suffered due to the intense competitive environment during the 2003 southern California labor dispute and recovery period after the labor dispute. The decreased operating performance was the result of the investments in personnel, training and price reductions necessary to help regain Ralphs’ business lost during the labor dispute. As a result of this decline and the decline in future expected operating performance, the divisions’ carrying value of goodwill exceeded its implied fair value resulting in the impairment charge. Most of the impairment charge was non-deductible for income tax purposes. At February 3, 2007 and January 28, 2006, the Company maintained $1,458 of goodwill for the Ralphs and Food 4 Less divisions.
The following table summarizes the changes in the Company’s net goodwill balance through February 3, 2007.January 31, 2009.
| | Goodwill | |
Balance at January 28, 2006 | | $ | 2,192 | |
Goodwill recorded | | — | |
Purchase accounting adjustments | | — | |
| | | |
Balance at February 3, 2007 | | 2,192 | |
Goodwill recorded | | 23 | |
Effect of FIN 48 adoption | | (71 | ) |
| | | |
Balance at February 2, 2008 | | 2,144 | |
Goodwill recorded | | 127 | |
Purchase accounting adjustments | | — | |
| | | |
Balance at January 31, 2009 | | $ | 2,271 | |
In December 2008, the FASB issued FAS 140-4 and FIN 46(R)-8, Disclosures by Public Entities (Enterprises) about Transfers of Financial Assets and Interests in Variable Interest Entities (FAS 140-4 and FIN 46(R)-8).FAS 140-4 and FIN 46(R)-8 require additional disclosures about an entity’s involvement with variable interest entities and transfers of financial assets. Effective January 31, 2009, the Company has adopted FAS 140-4 and FIN 46(R)-8 .
In the first quarter of 2008, the Company made an investment in The Little Clinic LLC (“TLC”). TLC operates supermarket walk-in medical clinics in seven states, primarily in the Midwest and Southeast. At the date of investment, TLC was determined to be a variable-interest entity (“VIE”) under FASB Interpretation No. 46R, Consolidation of Variable Interest Entities (FIN 46R), with the Company being the primary beneficiary. The Company was deemed the primary beneficiary due to its current ownership interest and half of its written put options being at a floor price. As a result, the Company consolidated TLC in accordance with FIN 46R. The minority interest was recorded at fair value on the acquisition date. The fair value of TLC was determined based on the amount of the investment made by the Company and the percentage acquired. The Company’s assessment of goodwill represents the excess of this amount over the fair value of TLC’s net assets as of the investment date. Creditors of TLC have no recourse to the general credit of the Company. Conversely, creditors of the Company have no recourse to the assets of TLC. In addition, if requested by TLC’s Board of Directors by January 1, 2010, the Company has agreed to make a pro rata portion of an additional capital contribution.
The table below shows the unaudited amounts of assets and liabilities from TLC included in the Company’s consolidated results, after eliminating intercompany items, as of January 31, 2009:
| | 2008 | |
Current assets | | $ | 31 | |
Property, plant and equipment, net | | 7 | |
Goodwill | | 102 | |
Other assets | | 1 | |
| | | |
Total Assets | | $ | 141 | |
| | | |
Current liabilities | | $ | 4 | |
| | | |
Minority interests | | $ | 82 | |
45
| Goodwill |
Balance at January 31, 2004 | $ | 3,138 | |
Goodwill impairment charge | | (904 | ) |
Goodwill recorded | | 6 | |
Purchase accounting adjustments | | (49 | ) |
|
Balance at January 29, 2005 | | 2,191 | |
Goodwill impairment charge | | — | |
Goodwill recorded | | — | |
Purchase accounting adjustments | | 1 | |
|
Balance at January 28, 2006 | | 2,192 | |
Goodwill impairment charge | | — | |
Goodwill recorded | | — | |
Purchase accounting adjustments | | — | |
|
Balance at February 3, 2007 | $ | 2,192 | |
In the fourth quarter of 2008, the Company became the primary beneficiary of i-wireless, LLC a VIE in which the Company has a 25% ownership interest. The Company was deemed the primary beneficiary due to its current ownership interest, $25 line of credit guarantee, and $8 loan to i-wireless, LLC. The Company became the primary beneficiary, in the fourth quarter of 2008, under FIN 46R after lending $8 to i-wireless, LLC. i-wireless, LLC sells prepaid phones primarily in Company stores. The minority interest was recorded at fair value. The fair value of i-wireless, LLC was determined based on the amount of the investment made by the Company in the fourth quarter of 2007 and the percentage acquired. The Company’s assessment of goodwill represents the excess of this amount over the fair value of i-wireless, LLC’s net assets as of the date of the loan. The Company has guaranteed the indebtedness of i-wireless, LLC, up to $25, which is collateralized by $8 of inventory located in the Company’s stores. The creditors of the Company have no recourse to the assets of i-wireless, LLC.
The table below shows the preliminary and unaudited amounts of assets and liabilities from i-wireless, LLC included in the Company’s consolidated results, after eliminating intercompany items, as of January 31, 2009:
| | 2008 | |
Current assets | | $ | 10 | |
Property, plant and equipment, net | | 2 | |
Goodwill | | 25 | |
Other assets | | 5 | |
| | | |
Total Assets | | $ | 42 | |
| | | |
Current liabilities | | $ | 5 | |
| | | |
Long-term debt | | $ | 30 | |
| | | |
Minority interests | | $ | 1 | |
The proforma effects of these acquisitions are not material to previously reported results.
3. PROPERTY,, PLANT AND EANDQUIPMENT, E NQUIPMENTET
, NET
Property, plant and equipment, net consists of:
| | 2006 | | 2005 |
| Land | $ | 1,690 | | | $ | 1,675 | |
| Buildings and land improvements | | 5,402 | | | | 5,142 | |
| Equipment | | 8,255 | | | | 7,980 | |
| Leasehold improvements | | 4,221 | | | | 3,917 | |
| Construction-in-progress | | 822 | | | | 511 | |
| Leased property under capital leases and financing obligations | | 592 | | | | 561 | |
| |
| Total property, plant and equipment | | 20,982 | | | | 19,786 | |
| Accumulated depreciation and amortization | | (9,203 | ) | | | (8,421 | ) |
| |
| Property, plant and equipment, net | $ | 11,779 | | | $ | 11,365 | |
| | 2008 | | 2007 | |
Land | | $ | 1,944 | | $ | 1,779 | |
Buildings and land improvements | | 6,457 | | 5,875 | |
Equipment | | 8,993 | | 8,620 | |
Leasehold improvements | | 5,076 | | 4,626 | |
Construction-in-progress | | 880 | | 965 | |
Leased property under capital leases and financing obligations | | 550 | | 571 | |
| | | | | |
Total property, plant and equipment | | 23,900 | | 22,436 | |
Accumulated depreciation and amortization | | (10,739 | ) | (9,938 | ) |
| | | | | |
Property, plant and equipment, net | | $ | 13,161 | | $ | 12,498 | |
Accumulated depreciation for leased property under capital leases was $288$283 at January 31, 2009, and $286 at February 3, 2007,2, 2008.
Approximately $396 and $263 at January 28, 2006.
Approximately $566 and $798,$540, original cost, of Property, Plant and Equipment collateralized certain mortgages at January 31, 2009 and February 3, 2007, and January 28, 2006,2, 2008, respectively.
46
4. TAXESTAXES BASED ON ION INCOME
The provision for taxes based on income consists of:
| | 2006 | | 2005 | | 2004 |
| Federal | | | | | | | | | | | |
| Current | $ | 652 | | | $ | 609 | | | $ | 96 | |
| Deferred | | (52 | ) | | | (79 | ) | | | 258 | |
| |
| | | 600 | | | | 530 | | | | 354 | |
| State and local | | | | | | | | | | | |
| Current | | 55 | | | | 42 | | | | 25 | |
| Deferred | | (22 | ) | | | (5 | ) | | | 11 | |
| |
| | | 33 | | | | 37 | | | | 36 | |
| |
| Total | $ | 633 | | | $ | 567 | | | $ | 390 | |
| |
| A reconciliation of the statutory federal rate and the effective rate follows: | | | | | | | | | | | |
| |
| | 2006 | | 2005 | | 2004 |
| Statutory rate | | 35.0 | % | | | 35.0 | % | | | 35.0 | % |
| State income taxes, net of federal tax benefit | | 1.9 | % | | | 1.6 | % | | | 2.6 | % |
| Non-deductible goodwill | | — | | | | — | | | | 101.7 | % |
| Deferred tax adjustment | | (1.2 | )% | | | — | | | | — | |
| Other changes, net | | 0.5 | % | | | 0.6 | % | | | (2.9 | )% |
| |
| | | 36.2 | % | | | 37.2 | % | | | 136.4 | % |
| | 2008 | | 2007 | | 2006 | |
Federal | | | | | | | |
Current | | $ | 304 | | $ | 661 | | $ | 652 | |
Deferred | | 331 | | (62 | ) | (52 | ) |
| | | | | | | |
| | 635 | | 599 | | 600 | |
State and local | | | | | | | |
Current | | 46 | | 71 | | 55 | |
Deferred | | 36 | | (24 | ) | (22 | ) |
| | | | | | | |
| | 82 | | 47 | | 33 | |
| | | | | | | |
Total | | $ | 717 | | $ | 646 | | $ | 633 | |
A reconciliation of the statutory federal rate and the effective rate follows:
| | 2008 | | 2007 | | 2006 | |
Statutory rate | | 35.0 | % | 35.0 | % | 35.0 | % |
State income taxes, net of federal tax benefit | | 2.7 | % | 1.7 | % | 1.9 | % |
Credits | | (1.0 | )% | (0.9 | )% | (0.8 | )% |
Favorable resolution of issues | | — | | (1.9 | )% | — | |
Deferred tax adjustment | | — | | — | | (1.2 | )% |
Other changes, net | | (0.2 | )% | 1.5 | % | 1.3 | % |
| | | | | | | |
| | 36.5 | % | 35.4 | % | 36.2 | % |
During the third quarter of 2007, the Company resolved favorably certain tax issues. This resulted in a 2007 tax benefit of approximately $40.
In 2006, during the reconciliation of the Company’s deferred tax balances, after the filing of annual federal and state tax returns, the Company identified adjustments to be made in the prior years’ deferred tax reconciliation. These deferred tax balances were corrected in the Company’s Consolidated Financial Statements for the year ended February 3, 2007, which resulted in a reduction of the Company’s 2006 provision for income tax expense of approximately $21. The Company does not believe these adjustments are material to its Consolidated Financial Statements for the year ended February 3, 2007, or to any prior years’ Consolidated Financial Statements. As a result, the Company has not restated any prior year amounts.
47
The tax effects of significant temporary differences that comprise tax balances were as follows:
| | 2006 | | 2005 |
| Current deferred tax assets: | | | | | | | |
| Net operating loss carryforwards | $ | 17 | | | $ | 18 | |
| Compensation related costs | | 32 | | | | — | |
| Other | | 4 | | | | 42 | |
| |
| Total current deferred tax assets | | 53 | | | | 60 | |
| Current deferred tax liabilities: | | | | | | | |
| Compensation related costs | | — | | | | (2 | ) |
| Insurance related costs | | (109 | ) | | | (107 | ) |
| Inventory related costs | | (212 | ) | | | (168 | ) |
| |
| Total current deferred tax liabilities | | (321 | ) | | | (277 | ) |
| |
| Current deferred taxes | $ | (268 | ) | | $ | (217 | ) |
| |
| Long-term deferred tax assets: | | | | | | | |
| Compensation related costs | $ | 332 | | | $ | 290 | |
| Insurance related costs | | — | | | | 9 | |
| Lease accounting | | 122 | | | | 106 | |
| Closed store reserves | | 96 | | | | 95 | |
| Net operating loss carryforwards | | 29 | | | | 26 | |
| Other | | 47 | | | | 21 | |
| |
| Long-term deferred tax assets, net | | 626 | | | | 547 | |
| Long-term deferred tax liabilities: | | | | | | | |
| Depreciation | | (1,114 | ) | | | (1,193 | ) |
| Insurance related costs | | (33 | ) | | | — | |
| Deferred income | | (201 | ) | | | (197 | ) |
| |
| Total long-term deferred tax liabilities | | (1,348 | ) | | | (1,390 | ) |
| |
| Long-term deferred taxes | $ | (722 | ) | | $ | (843 | ) |
| | 2008 | | 2007 | |
Current deferred tax assets: | | | | | |
Net operating loss and credit carryforwards | | $ | 2 | | $ | 16 | |
Compensation related costs | | 43 | | 53 | |
Other | | — | | 8 | |
| | | | | |
Total current deferred tax assets | | 45 | | 77 | |
Current deferred tax liabilities: | | | | | |
Insurance related costs | | (104 | ) | (104 | ) |
Inventory related costs | | (242 | ) | (212 | ) |
Other | | (43 | ) | — | |
| | | | | |
Total current deferred tax liabilities | | (389 | ) | (316 | ) |
| | | | | |
Current deferred taxes | | $ | (344 | ) | $ | (239 | ) |
| | | | | |
Long-term deferred tax assets: | | | | | |
Compensation related costs | | $ | 461 | | $ | 268 | |
Lease accounting | | 100 | | 102 | |
Closed store reserves | | 65 | | 68 | |
Insurance related costs | | 64 | | 64 | |
Net operating loss and credit carryforwards | | 51 | | 35 | |
Other | | 13 | | 23 | |
| | | | | |
Long-term deferred tax assets, net | | 754 | | 560 | |
Long-term deferred tax liabilities: | | | | | |
Depreciation | | (1,138 | ) | (926 | ) |
Other | | — | | (1 | ) |
| | | | | |
Total long-term deferred tax liabilities | | (1,138 | ) | (927 | ) |
| | | | | |
Long-term deferred taxes | | $ | (384 | ) | $ | (367 | ) |
At February 3, 2007, the Company had net operating loss carryforwards for federal income tax purposes of $74 that expire from 2010 through 2018. In addition,January 31, 2009, the Company had net operating loss carryforwards for state income tax purposes of $733$451 that expire from 20102009 through 2025.2028. The utilization of certain of the Company’s net operating loss carryforwards may be limited in a given year.
At February 3, 2007,January 31, 2009, the Company had stateState credits of $23 that$20, some of which expire from 20072009 through 2020.2027. The utilization of certain of the Company’s credits may be limited in a given year.
48
The amountsCompany adopted the provisions of cash paidFIN No. 48, Accounting for income taxesUncertainty in 2004Income Taxes on February 4, 2007. As of adoption, the total amount of gross unrecognized tax benefits for uncertain tax positions, including positions impacting only the timing of tax benefits, was reduced by approximately $90$694. A reconciliation of the beginning and ending amount of unrecognized tax benefits as of January 31, 2009 and February 2, 2008 is a result of federal bonus depreciation. This benefit began reversingfollows:
| | 2008 | | 2007 | |
Beginning balance | | $ | 469 | | $ | 694 | |
Additions based on tax positions related to the current year | | 53 | | 49 | |
Reductions based on tax positions related to the current year | | (6 | ) | (32 | ) |
Additions for tax positions of prior years | | 4 | | 11 | |
Reductions for tax positions of prior years | | (11 | ) | (162 | ) |
Settlements | | (17 | ) | (90 | ) |
Reductions due to lapse of statute of limitations | | — | | (1 | ) |
Ending balance | | $ | 492 | | $ | 469 | |
The Company does not anticipate that changes in 2005 and increased the amount of cash paidunrecognized tax benefits over the next twelve months will have a significant impact on its results of operations or financial position.
As of January 31, 2009 and February 2, 2008, the amount of unrecognized tax benefits that, if recognized, would impact the effective tax rate was $116 and $120, respectively.
To the extent interest and penalties would be assessed by taxing authorities on any underpayment of income tax, such amounts have been accrued and classified as a component of income tax expense. During the years ended January 31, 2009 and February 2, 2008, the Company recognized approximately $6 and $(11), respectively, in interest and penalties. The Company had accrued approximately $99 and $101 for income taxes by approximately $71the payment of interest and penalties as of January 31, 2009 and February 2, 2008, respectively.
The IRS concluded a field examination of the Company’s 2002 — 2004 U.S. tax returns during the third quarter of 2007 and is currently auditing years 2005 — 2007. The audit is not expected to be completed in 2006the next twelve months. Additionally, the Company has a case in the U.S. Tax Court. A decision on this case is not expected within the next 12 months. In connection with this case, the Company has extended the statute of limitations on our tax years after 1991 and $108 in 2005, respectively.those years remain open to examination. States have a limited time frame to review and adjust federal audit changes reported. Assessments made and refunds allowed are generally limited to the federal audit changes reported.
5. DEBT OBLIGATIONS
Long-term debt consists of:
| | 2008 | | 2007 | |
Credit facility, commercial paper and money market borrowings | | $ | 129 | | $ | 570 | |
4.95% to 9.20% Senior notes and debentures due through 2038 | | 7,186 | | 6,766 | |
5.00% to 9.95% Mortgages due in varying amounts through 2034 | | 119 | | 166 | |
Other | | 163 | | 137 | |
| | | | | |
Total debt | | 7,597 | | 7,639 | |
Less current portion | | (528 | ) | (1,564 | ) |
| | | | | |
Total long-term debt | | $ | 7,069 | | $ | 6,075 | |
In 2007, the Company issued $600 of senior notes bearing an interest rate of 6.4% due in 2017 and $750 of senior notes bearing an interest rate of 6.15% due in 2020.
In 2008, the Company issued $400 of senior notes bearing an interest rate of 5.0% due in 2013, $375 of senior notes bearing an interest rate of 6.9% due in 2038 and $600 of senior notes bearing an interest rate of 7.5% due in 2014.
49
| | 2006 | | 2005 |
| Credit facility | $ | 352 | | | $ | — | |
| 4.95% to 9.20% Senior notes and debentures due through 2031 | | 5,916 | | | | 6,390 | |
| 5.00% to 9.95% mortgages due in varying amounts through 2034 | | 169 | | | | 179 | |
| Other | | 144 | | | | 178 | |
| |
| Total debt | | 6,581 | | | | 6,747 | |
| Less current portion | | (878 | ) | | | (527 | ) |
| |
| Total long-term debt | $ | 5,703 | | | $ | 6,220 | |
As of February 3, 2007,January 31, 2009, the Company had a $2,500 Five-Year Credit Agreement maturing in 2011, unless earlier terminated by the Company. Borrowings under the credit agreement bear interest at the option of the Company at a rate equal to either (i) the highest, from time to time of (A) the base rate of JP Morgan Chase Bank, N.A., (B) ½% over a moving average of secondary market morning offering rates for three-month certificates of deposit adjusted for reserve requirements, and (C) ½% over the federal funds rate or (ii) an adjusted Eurodollar rate based upon the London Interbank Offered Rate (“Eurodollar Rate”) plus an Applicable Margin.applicable margin. In addition, the Company pays a Facility Feefacility fee in connection with the credit agreement. Both the Applicable Marginapplicable margin and the Facility Feefacility fee vary based upon the Company’s achievement of a financial ratio or credit rating. At February 3, 2007,January 31, 2009, the Applicable Marginapplicable margin was 0.27%0.19%, and the Facility Feefacility fee was 0.08%0.06%. The credit facility contains covenants, which, among other things, require the maintenance of certain financial ratios, including fixed charge coverage and leverage ratios. The Company may prepay the credit agreement in whole or in parts,part, at any time, without a prepayment penalty. In addition to the credit agreement, the Company maintained three uncommitted money market lines totaling $75 in the aggregate. The money market lines allow the Company to borrow from banks at mutually agreed upon rates, usually at rates below the rates offered under the credit agreement. As of February 3, 2007,January 31, 2009, the Company had $352no borrowings under its credit agreement and net outstanding commercial paper of $90, that reduced amounts available under the Company’s credit agreement. In addition, as of January 31, 2009, the Company had borrowings under its money market lines totaling $39. The weighted average interest rate on the amounts outstanding under the credit agreement was 5.47% at February 3, 2007.
At February 3, 2007, the Company had borrowings totaling $352 under its P2/F2/A3 rated commercial paper program. Any borrowings under this program are backed by the Company’s credit facility and reduce the amount available under the credit facility.
At February 3, 2007, the Company also maintained a $50 money market line. In addition to credit agreement borrowings, borrowings under the Company’s money market line and somelines was 1.89% at January 31, 2009. The outstanding letters of credit that reduce funds available under the Company’s credit agreement. At February 3, 2007, these lettersagreement totaled $337 as of credit totaled $331. The Company had no borrowings under the money market line at February 3, 2007.January 31, 2009.
Most of the Company’s outstanding public debt is subject to early redemption at varying times and premiums, at the option of the Company. In addition, subject to certain conditions, some of the Company’s publicly issued debt will be subject to redemption, in whole or in part, at the option of the holder upon the occurrence of a redemption event, upon not less than five days’ notice prior to the date of redemption, at a redemption price equal to the default amount, plus a specified premium. “Redemption Event” is defined in the indentures as the occurrence of (i) any person or group, together with any affiliate thereof, beneficially owning 50% or more of the voting power of the Company, or (ii) any one person or group, or affiliate thereof, succeeding in having a majority of its nominees elected to the Company’s Board of Directors, in each case, without the consent of a majority of the continuing directors of the Company.Company or (iii) both a change of control and a below investment grade rating.
The aggregate annual maturities and scheduled payments of long-term debt, as of year-end 2006,2008, and for the years subsequent to 20062008 are:
| 2007 | $ | 878 | |
| 2008 | | 993 | |
| 2009 | | 912 | |
| 2010 | | 42 | |
| 2011 | | 537 | |
| Thereafter | | 3,219 | |
| | |
| Total debt | $ | 6,581 | |
2009 | | $ | 528 | |
2010 | | 542 | |
2011 | | 544 | |
2012 | | 1,414 | |
2013 | | 1,019 | |
Thereafter | | 3,550 | |
| | | |
Total debt | | $ | 7,597 | |
6. FINANCIALDerivative FINANCIAL INSTRUMENTS
Interest Rate Risk Management
The Company historically has used derivatives to manage its exposure to changes in interest rates. The interest differential to be paid or received is accrued as interest expense. SFAS No. 133,Accounting for Derivative Instruments and Hedging Activities, as amended, defines derivatives, requires that derivatives be carried at fair value on the balance sheet and provides for hedge accounting when certain conditions are met. In accordance with this standard, the Company’s derivative financial instruments are recognized on the balance sheet at fair value. Changes in the fair value of derivative instruments designated as “cash flow” hedges, to the extent the hedges are highly effective, are recorded in other comprehensive income, net of tax effects. Ineffective portions of cash flow hedges, if any, are recognized in current period earnings. Other comprehensive income or loss is reclassified into current period earnings when the hedged transaction affects earnings. Changes in the fair value of derivative instruments designated as “fair value” hedges, along with corresponding changes in the fair values of the hedged assets or liabilities, are recorded in current period earnings. Ineffective portions of fair value hedges, if any, are recognized in current period earnings.
50
The Company assesses, both at the inception of the hedge and on an ongoing basis, whether derivatives used as hedging instruments are highly effective in offsetting the changes in the fair value or cash flow of the hedged items. If it is determined that a derivative is not highly effective as a hedge or ceases to be highly effective, the Company discontinues hedge accounting prospectively.
The Company’s current program relative to interest rate protection contemplates both fixing the rates on variable rate debt and hedging the exposure to changes in the fair value of fixed-rate debt attributable to changes in interest rates. To do this, the Company uses the following guidelines: (i) use average daily bank balanceoutstanding borrowings to determine annual debt amounts subject to interest rate exposure, (ii) limit the average annual amount subject to interest rate reset and the amount of floating rate debt to a combined total of $2.5 billion$2,500 million or less, (iii) include no leverage products, and (iv) hedge without regard to profit motive or sensitivity to current mark-to-market status.
Annually, the Company reviews with the Financial Policy Committee of the Board of Directors compliance with the guidelines. These guidelines may change as the Company’s needs dictate.
The table below summarizes the outstanding interest rate swaps designated as fair value hedges as of January 31, 2009, and February 3, 2007, and January 28, 2006. The variable component2, 2008.
| | 2008 | | 2007 | |
| | Pay
Floating | | Pay
Fixed | | Pay
Floating | | Pay
Fixed | |
Notional amount | | $ | — | | $ | — | | $ | 1,050 | | $ | — | |
Number of contracts | | — | | — | | 6 | | — | |
Duration in years | | — | | — | | 2.07 | | — | |
Average variable rate | | — | | — | | 5.97 | % | — | |
Average fixed rate | | — | | — | | 6.74 | % | — | |
Maturity | | | | | | Between March 2008 and
January 2015 | |
| | | | | | | | | | | | | |
As of eachFebruary 2, 2008, other long-term assets totaling $11 were recorded to reflect the fair value of these agreements, offset by increases in the fair value of the underlying debt.
In 2008, the Company terminated nine fair value interest rate swap outstanding at February 3, 2007, was based on LIBOR asswaps with a total notional amount of February 3, 2007. The variable component$900. Three of eachthese terminated interest rate swap outstandingswaps were purchased and became ineffective fair value hedges in 2008. The proceeds received at January 28, 2006, was based on LIBORtermination were credited to interest expense in the amount of $15. The Company has unamortized proceeds from twelve interest rate swaps once classified as fair value hedges totaling approximately $45. The unamortized proceeds are recorded as adjustments to the carrying values of January 28, 2006.the underlying debt and are being amortized over the remaining term of the debt.
| | 2006 | | 2005 |
| | Pay | | Pay | | Pay | | Pay |
| | Floating | | Fixed | | Floating | | Fixed |
| Notional amount | $ | 1,050 | | | $ | — | | $ | 1,375 | | | $ | — | |
| Duration in years | | 3.08 | | | | — | | | 3.28 | | | | — | |
| Average variable rate | | 8.07 | % | | | — | | | 8.14 | % | | | — | |
| Average fixed rate | | 6.74 | % | | | — | | | 6.98 | % | | | — | |
In addition to the interest rate swaps noted above, in 2005 the Company entered into three forward-starting interest rate swap agreements with a notional amount totaling $750 million.$750. A forward-starting interest rate swap is an agreement that effectively hedges future benchmark interest rates including general corporate spreads, on debt for an established period of time. The Company entered into the forward-starting interest rate swaps in order to lock ininto fixed interest rates on its forecasted issuances of debt in fiscal 2007 and 2008. Accordingly,In 2007, the Company terminated two of these instrumentsforward-starting interest rate swaps with a notional amount of $500. In 2008, the Company terminated the remaining forward-starting interest rate swap with a notional amount of $250. The unamortized payments and proceeds on these terminated forward-starting interest rate swaps have been designatedrecorded net of tax in other comprehensive income and will be amortized to earnings as cash flow hedges for the Company’s forecasted debt issuances. Twopayments of interest to which the swaps have ten-year terms, withhedge relates are made. As of February 2, 2008, other long-term liabilities totaling $18 were recorded to reflect the remaining swap having a twelve-year term, beginning with the issuancefair value of the debt. The average fixed rate for these instruments is 5.14%.agreements.
Commodity Price Protection
The Company enters into purchase commitments for various resources, including raw materials utilized in its manufacturing facilities and energy to be used in its stores, warehouses, manufacturing facilities and administrative offices. The Company enters into commitments expecting to take delivery of and to utilize those resources in the conduct of normal business. Those commitments for which the Company expects to utilize or take delivery in a reasonable amount of time in the normal course of business qualify as normal purchases and normal sales. Any commitments for which the Company does not expect to take delivery, and, as a result will require net settlement, are marked to fair value on a quarterly basis.
51
Some of the product the Company purchases is shipped in corrugated cardboard packaging. The corrugated cardboard is sold when it is economical to do so. As of February 3, 2007,January 31, 2009, the Company maintained sevena derivative instrumentsinstrument to protect it from decliningmanage exposure to changes in corrugated cardboard prices. These derivatives containThis derivative has a three-year term. None of the contracts, either individually or in the aggregate, hedge more than 50% of the Company’s expected corrugated cardboard sales. The instruments doinstrument does not qualify for hedge accounting, in accordance with SFAS No. 133, Accounting for Derivative Investments and Hedging Activities, as amended. Accordingly, changesthe change in the fair value of these instruments arethis instrument is marked-to-market in the Company’s Consolidated Statements of Operations as operating, general and administrative (“OG&A”) expenses.expense. As of January 31, 2009, the fair value of this instrument was insignificant.
7.FAIR VALUE OF FINANCIAL INSTRUMENTS
In September 2006, the FASB issued SFAS No. 157, Fair Value Measurements (SFAS 157), which defines fair value, establishes a market-based framework for measuring fair value and expands disclosures about fair value measurements. SFAS 157 does not expand or require any new fair value measurements. SFAS 157 is effective for financial assets and financial liabilities for fiscal years beginning after November 15, 2007. FASB Staff Position (FSP) 157-2 Partial Deferral of the Effective Date of Statement No. 157 (FSP 157-2), deferred the effective date of SFAS No. 157 for most non-financial assets and non-financial liabilities to fiscal years beginning after November 15, 2008. Effective February 3, 2007,2008, the Company adopted SFAS 157, except for non-financial assets and non-financial liabilities as deferred until February 1, 2009 by FSP 157-2.
SFAS 157 establishes a fair value hierarchy that prioritizes the inputs used to measure fair value. The three levels of the fair value hierarchy defined by SFAS 157 are as follows:
Level 1 — Quoted prices are available in active markets for identical assets or liabilities;
Level 2 — Pricing inputs are other than quoted prices in active markets included in Level 1, which are either directly or indirectly observable;
Level 3 — Unobservable pricing inputs in which little or no market activity exists, therefore requiring an accrued liability totaling $0.2 had been recordedentity to reflectdevelop its own assumptions about the assumptions that market participants would use in pricing an asset or liability.
For those financial instruments carried at fair value in the consolidated financial statements, the following table summarizes the fair value of these instruments.instruments at January 31, 2009:
7. FFair Value Measurements UsingAIR VALUEOF FINANCIAL INSTRUMENTS
| | Quoted Prices in
Active Markets
for Identical
Assets
(Level 1) | | Significant Other
Observable Inputs
(Level 2) | | Significant
Unobservable
Inputs
(Level 3) | | Total | |
Available-for-Sale Securities | | $ | 11 | | $ | — | | $ | — | | $ | 11 | |
| | | | | | | | | | | | | |
Fair Value of Other Financial Instruments
Current and Long-term Debt
The following methods and assumptionsfair value of the Company’s long-term debt, including current maturities, was estimated based on the quoted market price for the same or similar issues adjusted for illiquidity based on available market evidence. If quoted market prices were used to estimatenot available, the fair value was based upon the net present value of the future cash flow using the forward interest rate yield curve in effect at the respective year-ends. At January 31, 2009, the fair value of each classtotal debt was $7,920 compared to a carrying value of financial instrument for which it$7,597. At February 2, 2008, the fair value of total debt was practicable$7,973 compared to estimate that value:a carrying value of $7,639.
52
Cash and Temporary Cash Investments, Store Deposits In-Transit, Receivables, Prepaid and Other Current Assets, Accounts Payable, Accrued Salaries and Wages and Other Current Liabilities
The carrying amounts of these items approximated fair value.
Long-term Investments
The fair values of these investments were estimated based on quoted market prices for those or similar investments.
Long-term Debt
Theinvestments, or estimated cash flows, if appropriate. At January 31, 2009 and February 2, 2008, the carrying and fair value of the Company’spracticable long-term debt, including the current portion thereofinvestments was $67 and excluding borrowings under the credit facility, was estimated based on the quoted market price for the same or similar issues. If quoted market prices were not available, the fair value was based upon the net present value of the future cash flows using the forward interest rate yield curve in effect at the respective year-ends. The carrying values of long-term debt outstanding under the Company’s credit facility approximated fair value.
Interest Rate Protection Agreements$75, respectively.
The fair value of these agreements was based on the net present value of the future cash flows using the forward interest rate yield curve in effect at the respective year-ends.
The estimated fair values of the Company’s financial instruments are as follows:
| | 2006 | | 2005 |
| | Carrying | | Estimated | | Carrying | | Estimated |
| | Value | | Fair Value | | Value | | Fair Value |
| Cash and temporary cash investments | | $ | 189 | | | $ | 189 | | | $ | 210 | | | $ | 210 | |
| Store deposits in-transit | | $ | 614 | | | $ | 614 | | | $ | 488 | | | $ | 488 | |
| Long-term investments for which it is | | | | | | | | | | | | | | | | |
| Practicable | | $ | 152 | | | $ | 152 | | | $ | 118 | | | $ | 118 | |
| Not Practicable | | $ | — | | | $ | — | | | $ | 1 | | | $ | — | |
| Debt for which it is(1) | | | | | | | | | | | | | | | | |
| Practicable | | $ | (6,581 | ) | | $ | (6,859 | ) | | $ | (6,747 | ) | | $ | (7,038 | ) |
| Not Practicable | | $ | — | | | $ | — | | | $ | — | | | $ | — | |
| Interest Rate Protection Agreements | | | | | | | | | | | | | | | | |
| Receive fixed swaps asset/(liability)(2) | | $ | (28 | ) | | $ | (28 | ) | | $ | (34 | ) | | $ | (34 | ) |
| Forward-starting swap asset/(liability)(3) | | $ | 12 | | | $ | 12 | | | $ | (2 | ) | | $ | (2 | ) |
| Corrugated Cardboard Price Protection Agreements(4) | | $ | — | | | $ | — | | | $ | 3 | | | $ | 3 | |
| (1) | | Excludes capital lease and lease-financing obligations. |
| |
| (2) | | As of February 3, 2007, the Company maintained six interest rate swap agreements, with notional amounts totaling $1,050, to manage its exposure to changes in the fair value of its fixed rate debt resulting from interest rate movements by effectively converting a portion of the Company’s debt from fixed to variable rates. These agreements mature at varying times between March 2008 and January 2015. Variable rates for these agreements are based on U.S. dollar London Interbank Offered Rate (“LIBOR”). The differential between fixed and variable rates to be paid or received is accrued as interest rates change in accordance with the agreements and is recognized over the life of the agreements as an adjustment to interest expense. These interest rate swap agreements are being accounted for as fair value hedges. As of February 3, 2007, other long-term liabilities totaling $28 were recorded to reflect the fair value of these agreements, offset by decreases in the fair value of the underlying debt. |
| |
| (3) | | As of February 3, 2007, the Company maintained three forward-starting interest rate swap agreements, with notional amounts totaling $750, to manage its exposure to changes in future benchmark interest rates. A forward-starting interest rate swap is an agreement that effectively hedges future benchmark interest rates, including general corporate spreads, on debt for an established period of time. The Company entered into the forward-starting interest rate swaps in order to lock in fixed interest rates on the Company’s forecasted issuance of debt in fiscal 2007 and 2008. As of February 3, 2007, other long-term assets totaling $12 were recorded to reflect the fair value of these agreements. |
| |
| (4) | | See Note 6 for a description of the corrugated cardboard price protection agreements. |
8. LEASESLEASES AND LEASEEASE-FINANCED-F TINANCED TRANSACTIONS
The Company operates primarily in leased facilities. Lease terms generally range from 10 to 20 years with options to renew for varying terms. Terms of certain leases include escalation clauses, percentage rent based on sales or payment of executory costs such as property taxes, utilities or insurance and maintenance. Rent expense for leases with escalation clauses capital improvement funding or other lease concessions isare accounted for on a straight-line basis beginning with the earlier of the lease commencement date or the date the Company takes possession. Portions of certain properties are subleased to others for periods generally ranging from one to 20 years.
Rent expense (under operating leases) consists of:
| | 2006 | | 2005 | | 2004 |
| Minimum rentals | | $ | 753 | | | $ | 760 | | | $ | 772 | |
| Contingent payments | | | 10 | | | | 8 | | | | 9 | |
| Sublease income | | | (114 | ) | | | (107 | ) | | | (101 | ) |
| |
| Total rent expense | | $ | 649 | | | $ | 661 | | | $ | 680 | |
| | 2008 | | 2007 | | 2006 | |
Minimum rentals | | $ | 762 | | $ | 747 | | $ | 753 | |
Contingent payments | | 12 | | 11 | | 10 | |
Tenant income | | (115 | ) | (114 | ) | (114 | ) |
| | | | | | | |
Total rent expense | | $ | 659 | | $ | 644 | | $ | 649 | |
Minimum annual rentals and payments under capital leases and lease-financed transactions for the five years subsequent to 20062008 and in the aggregate are:
| | | | | | | | | Lease- |
| | Capital | | Operating | | Financed |
| | Leases | | Leases | | Transactions |
| 2007 | | $ | 57 | | | $ | 778 | | $ | 3 |
| 2008 | | | 54 | | | | 734 | | | 3 |
| 2009 | | | 52 | | | | 690 | | | 4 |
| 2010 | | | 51 | | | | 642 | | | 4 |
| 2011 | | | 49 | | | | 587 | | | 4 |
| Thereafter | | | 294 | | | | 4,118 | | | 93 |
| |
| | | 557 | | | $ | 7,549 | | $ | 111 |
| |
| Less estimated executory costs included in capital leases | | | (3 | ) | | | | | | |
| |
| Net minimum lease payments under capital leases | | | 554 | | | | | | | |
| Less amount representing interest | | | (237 | ) | | | | | | |
| |
| Present value of net minimum lease payments under capital leases | | $ | 317 | | | | | | | |
| | Capital
Leases | | Operating
Leases | | Lease
Financed
Transactions | |
2009 | | $ | 53 | | $ | 778 | | $ | 4 | |
2010 | | 51 | | 738 | | 4 | |
2011 | | 57 | | 674 | | 5 | |
2012 | | 48 | | 624 | | 5 | |
2013 | | 45 | | 575 | | 5 | |
Thereafter | | 219 | | 3,274 | | 111 | |
| | | | | | | |
| | 473 | | $ | 6,663 | | $ | 134 | |
| | | | | | | |
Less estimated executory costs included in capital leases | | (1 | ) | | | | |
| | | | | | | |
Net minimum lease payments under capital leases | | 472 | | | | | |
Less amount representing interest | | (185 | ) | | | | |
| | | | | | | |
Present value of net minimum lease payments under capital leases | | $ | 287 | | | | | |
Total future minimum rentals under noncancellable subleases at February 3, 2007,January 31, 2009, were $444.$334.
53
9. EARNINGSEPERARNINGS C POMMONER COMMON SHARE (“EPS”)
Basic earnings (loss) per common share equals net earnings (loss) divided by the weighted average number of common shares outstanding. Diluted earnings per common share equals net earnings (loss) divided by the weighted average number of common shares outstanding after giving effect to dilutive stock options and warrants.
The following table provides a reconciliation of earnings and shares used in calculating basic earnings per share to those used in calculating diluted earnings per share.
| | For the year ended | | For the year ended | | For the year ended |
| | February 3, 2007 | | January 28, 2006 | | January 29, 2005 |
| | Earnings | | Shares | | Per | | Earnings | | Shares | | Per | | Loss | | Shares | | Per |
| | (Numer- | | (Denomi- | | Share | | (Numer- | | (Denomi- | | Share | | (Numer- | | (Denomi- | | Share |
| (in millions, except per share amounts) | | ator) | | nator) | | Amount | | ator) | | nator) | | Amount | | ator) | | nator) | | Amount |
| Basic EPS | | $ | 1,115 | | 715 | | $ | 1.56 | | $ | 958 | | 724 | | $ | 1.32 | | $ | (104) | | 736 | | $ | (0.14 | ) |
| Dilutive effect of stock option | | | | | | | | | | | | | | | | | | | | | | | | | |
| awards and warrants | | | | | 8 | | | | | | | | 7 | | | | | | | | — | | | | |
| |
| Diluted EPS | | $ | 1,115 | | 723 | | $ | 1.54 | | $ | 958 | | 731 | | $ | 1.31 | | $ | (104) | | 736 | | $ | (0.14 | ) |
| | For the year ended
January 31, 2009 | | For the year ended
February 2, 2008 | | For the year ended
February 3, 2007 | |
(in millions, except per share amounts) | | Earnings
(Numer-
ator) | | Shares
(Denomi-
nator) | | Per
Share
Amount | | Earnings
(Numer-
ator) | | Shares
(Denomi-
nator) | | Per
Share
Amount | | Earnings
(Numer-
ator) | | Shares
(Denomi-
nator) | | Per
Share
Amount | |
Basic EPS | | $ | 1,249 | | 652 | | $ | 1.92 | | $ | 1,181 | | 690 | | $ | 1.71 | | $ | 1,115 | | 715 | | $ | 1.56 | |
Dilutive effect of stock option awards and warrants | | | | 7 | | | | | | 8 | | | | | | 8 | | | |
| | | | | | | | | | | | | | | | | | | |
Diluted EPS | | $ | 1,249 | | 659 | | $ | 1.90 | | $ | 1,181 | | 698 | | $ | 1.69 | | $ | 1,115 | | 723 | | $ | 1.54 | |
For the years ended January 31, 2009, February 2, 2008 and February 3, 2007, January 28, 2006 and January 29, 2005, there were options outstanding for approximately 25.411.8 million, 24.62.0 million and 61.525.4 million shares of common stock, respectively, that were excluded from the computation of diluted EPS. These shares were excluded because their inclusion would have had an anti-dilutive effect on EPS.
10. STOCKSTOCK OPTION PLANS
Prior to January 29, 2006, the Company applied APB No. 25, and related interpretations, in accounting for its stock option plans and provided the pro-forma disclosures required by SFAS No. 123. APB No. 25 provided for recognition of compensation expense for employee stock awards based on the intrinsic value of the award on the grant date.
The Company grants options for common stock (“stock options”) to employees, as well as to its non-employee directors, under various plans at an option price equal to the fair market value of the stock at the date of grant. Although equityThe Company accounts for stock options under the fair value recognition provisions of SFAS No. 123(R), Share-Based Payment (SFAS 123(R)). Under this method, the Company recognizes compensation expense for all share-based payments granted after January 29, 2006, as well as all share-based payments granted prior to, but not yet vested as of, January 29, 2006, in accordance with SFAS 123(R). Under the fair value recognition provisions of SFAS 123(R), the Company recognizes share-based compensation expense, net of an estimated forfeiture rate, over the requisite service period of the award. Equity awards may be made throughout the year, it has beenat one of four meetings of its Board of Directors occurring shortly after the Company’s practice typically to make an annualrelease of quarterly earnings. The 2008 primary grant was made in conjunction with the MayJune meeting of itsthe Company’s Board of Directors.
Stock options typically expire 10 years from the date of grant. Stock options vest between one and five years from the date of grant, or for certain stock options, the earlier of the Company’s stock reaching certain pre-determined and appreciated market prices or nine years and six months from the date of grant. Under APB No.At January 31, 2009, approximately 25 the Company did not recognize compensation expense for these stock option grants. At February 3, 2007, approximately 18 million shares of common stock were available for future optionsoption grants under these plans.
In addition to the stock options described above, the Company awards restricted stock to employees under various plans. The restrictions on these awards generally lapse between one and five years from the date of the awards and expense is recognized over the lapsing cycle. awards. Under APB No. 25,SFAS 123(R), the Company generally recordedrecords expense for restricted stock awards in an amount equal to the fair market value of the underlying stock on the grant date of award. the award, over the period the awards lapse. As of February 3, 2007,January 31, 2009, approximately sixone million shares of common stock were available for future restricted stock awards under the 2005 Long-Term Incentive Plan (the “Plan”). The Company has the ability to convert shares available for stock options under the Plan to shares available for restricted stock awards. Four shares available for common stock option awards can be converted into one share available for restricted stock awards.
All awards become immediately exercisable upon certain changes of control of the Company.
Historically, stock option awards were granted to various employees throughout the organization. Restricted stock awards, however, were limited to approximately 150 associates, including members of the Board of Directors and certain members of senior management. Beginning in 2006, the Company began issuing a combination of stock option and restricted stock awards to those employees who previously received only stock option awards, in an effort to further align those employees’ interests with those of the Company’s non-employee shareholders. As a result, the number of stock option awards granted in 2006 decreased and the number of restricted stock awards granted increased.
54
Stock Options
Changes in options outstanding under the stock option plans are summarized below:
| | Shares | | Weighted- |
| | subject | | average |
| | to option | | exercise |
| | (in millions) | | price |
| Outstanding, year-end 2003 | | 60.1 | | | $ | 17.62 |
| Granted | | 6.7 | | | $ | 17.28 |
| Exercised | | (4.2 | ) | | $ | 7.29 |
| Canceled or Expired | | (1.1 | ) | | $ | 20.99 |
| |
| Outstanding, year-end 2004 | | 61.5 | | | $ | 18.20 |
| Granted | | 6.8 | | | $ | 16.50 |
| Exercised | | (7.7 | ) | | $ | 9.81 |
| Canceled or Expired | | (1.3 | ) | | $ | 20.92 |
| |
| Outstanding, year-end 2005 | | 59.3 | | | $ | 19.03 |
| Granted | | 3.2 | | | $ | 20.05 |
| Exercised | | (9.5 | ) | | $ | 13.34 |
| Canceled or Expired | | (1.1 | ) | | $ | 21.01 |
| |
| Outstanding, year-end 2006 | | 51.9 | | | $ | 20.09 |
| | Shares
subject
to option
(in millions) | | Weighted-
average
exercise
price | |
Outstanding, year-end 2005 | | 59.3 | | $ | 19.03 | |
Granted | | 3.2 | | $ | 20.05 | |
Exercised | | (9.5 | ) | $ | 13.34 | |
Canceled or Expired | | (1.1 | ) | $ | 21.01 | |
| | | | | |
Outstanding, year-end 2006 | | 51.9 | | $ | 20.09 | |
Granted | | 3.4 | | $ | 28.21 | |
Exercised | | (10.1 | ) | $ | 19.05 | |
Canceled or Expired | | (0.4 | ) | $ | 20.79 | |
| | | | | |
Outstanding, year-end 2007 | | 44.8 | | $ | 20.94 | |
Granted | | 3.5 | | $ | 28.49 | |
Exercised | | (8.3 | ) | $ | 21.04 | |
Canceled or Expired | | (0.3 | ) | $ | 23.08 | |
| | | | | |
Outstanding, year-end 2008 | | 39.7 | | $ | 21.58 | |
A summary of options outstanding and exercisable at February 3, 2007January 31, 2009 follows:
| | | | Weighted- | | | | | | | | |
| | | | average | | Weighted- | | | | Weighted- |
| | Number | | remaining | | average | | Options | | average |
| Range of Exercise Prices | | outstanding | | contractual life | | exercise price | | exercisable | | exercise price |
| | (in millions) | | (in years) | | | | | (in millions) | | | |
| $9.90 - $14.93 | | 7.9 | | 4.51 | | $ | 14.45 | | 7.1 | | $ | 14.39 |
| $14.94 - $16.39 | | 6.1 | | 8.16 | | $ | 16.35 | | 2.2 | | $ | 16.31 |
| $16.40 - $17.31 | | 10.4 | | 5.32 | | $ | 16.97 | | 7.1 | | $ | 16.90 |
| $17.32 - $22.99 | | 9.2 | | 4.24 | | $ | 20.96 | | 5.0 | | $ | 21.40 |
| $23.00 - $31.91 | | 18.3 | | 3.76 | | $ | 25.13 | | 15.0 | | $ | 25.20 |
| |
| $9.90 - $31.91 | | 51.9 | | 4.79 | | $ | 20.09 | | 36.4 | | $ | 20.42 |
Range of Exercise Prices | | Number
outstanding | | Weighted-
average
remaining
contractual life | | Weighted-
average
exercise price | | Options
exercisable | | Weighted-
average
exercise price | |
| | (in millions) | | (in years) | | | | (in millions) | | | |
$13.78 - $14.93 | | 4.2 | | 3.86 | | $ | 14.91 | | 4.2 | | $ | 14.91 | |
$14.94 - $16.39 | | 4.6 | | 6.16 | | $ | 16.35 | | 3.3 | | $ | 16.34 | |
$16.40 - $17.31 | | 7.6 | | 3.42 | | $ | 16.98 | | 6.2 | | $ | 17.00 | |
$17.32 - $22.99 | | 7.4 | | 4.74 | | $ | 21.72 | | 5.3 | | $ | 21.93 | |
$23.00 - $31.91 | | 15.9 | | 4.51 | | $ | 26.99 | | 9.8 | | $ | 26.38 | |
$13.78 - $31.91 | | 39.7 | | 4.47 | | $ | 21.58 | | 28.8 | | $ | 20.71 | |
The weighted-average remaining contractual life for options exercisable at February 3, 2007,January 31, 2009, was approximately 4.13.6 years.
55
Restricted stock
| | Restricted | | | |
| | shares | | Weighted-average |
| | outstanding | | grant-date |
| | (in millions) | | fair value |
| Outstanding, year-end 2005 | | 0.7 | | | $ | 17.85 |
| Granted | | 2.2 | | | $ | 20.16 |
| Lapsed | | (0.4 | ) | | $ | 17.46 |
| Canceled or Expired | | (0.1 | ) | | $ | 19.41 |
| |
| Outstanding, year-end 2006 | | 2.4 | | | $ | 20.02 |
Adoption of SFAS No. 123(R)
Effective January 29, 2006, the Company adopted the provisions of SFAS No. 123(R),Share-Based Payment, using the modified-prospective method. Under this method, the Company recognize compensation expense for all share-based awards granted prior to, but not yet vested as of, January 29, 2006, based on the grant date fair value estimated in accordance with the original provisions of SFAS No. 123,Accounting for Stock-Based Compensation.For all share-based awards granted on or after January 29, 2006, the Company recognizes compensation expense based on the grant date fair value estimated in accordance with the provisions of SFAS No. 123(R).
| | Restricted
shares
outstanding
(in millions) | | Weighted-average
grant-date
fair value | |
Outstanding, year-end 2005 | | 0.7 | | $ | 17.85 | |
Granted | | 2.2 | | $ | 20.16 | |
Lapsed | | (0.4 | ) | $ | 17.46 | |
Canceled or Expired | | (0.1 | ) | $ | 19.41 | |
| | | | | |
Outstanding, year-end 2006 | | 2.4 | | $ | 20.02 | |
Granted | | 2.5 | | $ | 28.20 | |
Lapsed | | (1.4 | ) | $ | 19.90 | |
Canceled or Expired | | (0.1 | ) | $ | 22.69 | |
| | | | | |
Outstanding, year-end 2007 | | 3.4 | | $ | 25.89 | |
Granted | | 2.5 | | $ | 28.42 | |
Lapsed | | (1.7 | ) | $ | 26.48 | |
Canceled or Expired | | (0.1 | ) | $ | 25.70 | |
| | | | | |
Outstanding, year-end 2008 | | 4.1 | | $ | 27.22 | |
In accordance with the provisions of the modified-prospective transition method, results for prior periods have not been restated. Compensation expense for all share-based awards described above was recognized using the straight-line attribution method applied to the fair value of each option grant, over the requisite service period associated with each award. The requisite service period is typically consistent with the vesting period, except as noted below. Because awards typically vest evenly over the requisite service period, compensation cost recognized through February 3, 2007, is at least equal to the grant-date fair value of the vested portion of all outstanding awards. All of the Company stock-based incentive plans are considered equity plans under SFAS No. 123(R).
The weighted-average fair value of stock options granted during 2008, 2007 and 2006 2005was $8.65, $9.66 and 2004 was $6.90, $7.70 and $7.91, respectively. The fair value of each stock option grant was estimated on the date of grant using the Black-Scholes option-pricing model, based on the assumptions shown in the table below. The Black-Scholes model utilizes extensive accounting judgment and financial estimates, including the term employees are expected to retain their stock options before exercising them, the volatility of the Company’s stock price over that expected term, the dividend yield over the term and the number of awards expected to be forfeited before they vest. Using alternative assumptions in the calculation of fair value would produce fair values for stock option grants that could be different than those used to record stock-based compensation expense in the Consolidated Statements of Operations.
The following table reflects the weighted-average assumptions used for grants awarded to option holders:
| | 2006 | | 2005 | | 2004 |
| Weighted average expected volatility (based on historical volatility) | | 27.60 | % | | 30.83 | % | | 30.13 | % |
| Weighted average risk-free interest rate | | 5.07 | % | | 4.11 | % | | 3.99 | % |
| Expected dividend yield | | 1.50 | % | | N/A | | | N/A | |
| Expected term (based on historical results) | | 7.5 years | | | 8.7 years | | | 8.7 years | |
| | 2008 | | 2007 | | 2006 | |
Weighted average expected volatility | | 27.89 | % | 29.23 | % | 27.60 | % |
Weighted average risk-free interest rate | | 3.63 | % | 5.06 | % | 5.07 | % |
Expected dividend yield | | 1.50 | % | 1.40 | % | 1.50 | % |
Expected term (based on historical results) | | 6.8 years | | 6.9 years | | 7.5 years | |
The weighted-average risk-free interest rate was based on the yield of a treasury note as of the grant date, continuously compounded, which matures at a date that approximates the expected term of options. During the years presented, prior to 2006, the Company did not pay a dividend, so an expected dividend rate was not included in the determination of fair value for options granted during those years. Using aThe dividend yield was based on our history and expectation of 1.50% to value options issued in 2005 would have decreased the fair value of each option by approximately $1.60.dividend payouts. Expected volatility was determined based upon historical stock volatilities. Impliedvolatilities; however, implied volatility was also considered. Expected term was determined based upon a combination of historical exercise and cancellation experience as well as estimates of expected future exercise and cancellation experience.
Under SFAS No. 123(R), the Company records expense for restricted stock awards in an amount equal to the fair market value of the underlying stock on the grant date of the award, over the period the awards lapse.
Total stock compensation recognized in 2008, 2007 and 2006 was $72. This included$91, $87 and $72, respectively. Stock option compensation recognized in 2008, 2007 and 2006 was $35, $51 and $50, for stock optionsrespectively. Restricted shares compensation recognized in 2008, 2007 and 2006 was $56, $36 and $22 for restricted shares. A total of $18 of the restricted stock expense was attributable to the wider distribution of restricted shares incorporated into the first quarter 2006 grant of share-based awards, and the remaining $4 of restricted stock expense related to previously issued restricted stock awards. The incremental compensation expense attributable to the adoption of SFAS No. 123(R) in 2006 was $68, pre-tax, or $43 and $0.06 per basic and diluted share, after tax. Stock compensation cost recognized in 2005, related entirely to restricted stock grants, was $7, pre-tax. These costs were recognized as operating, general and administrative expense in the Company’s Consolidated Statements of Operations. The cumulative effect of applying a forfeiture rate to unvested restricted shares at January 29, 2006 was not material.respectively.
If compensation cost for the Company’s stock option plans for the years ended January 28, 2006 and January 29, 2005 had been determined based upon the fair value at the grant date for awards under these plans consistent with the methodology prescribed under SFAS No. 123, the net earnings and diluted earnings per common share would have been reduced to the pro forma amounts below:
| | 2005 | | 2004 |
| Net earnings (loss), as reported | | $ | 958 | | | $ | (104 | ) |
| Stock-based compensation expense included in net earnings, net of | | | | | | | | |
| income tax benefits | | | 5 | | | | 8 | |
| Total stock-based compensation expense determined under fair value | | | | | | | | |
| method for all awards, net of income tax benefits | | | (34 | ) | | | (48 | ) |
| Pro forma net earnings (loss) | | $ | 929 | | | $ | (144 | ) |
|
| Earnings (loss) per basic common share, as reported | | $ | 1.32 | | | $ | (0.14 | ) |
| Pro forma earnings (loss) per basic common share | | $ | 1.28 | | | $ | (0.20 | ) |
| Earnings (loss) per diluted common share, as reported | | $ | 1.31 | | | $ | (0.14 | ) |
| Pro forma earnings (loss) per diluted common share | | $ | 1.27 | | | $ | (0.20 | ) |
The total intrinsic value of options exercised was $18, $33 and $79 in 2008, 2007 and 2006, was $79.respectively. The total amount of cash received in 2008 by the Company from the exercise of options granted under share-based payment arrangements was $126.$172. As of February 3, 2007,January 31, 2009, there was $92$118 of total unrecognized compensation expense remaining related to non-vested share-based compensation arrangements granted under the Company’s equity award plans. This cost is expected to be recognized over a weighted-average period of approximately one year. The total fair value of options that vested was $53, $53 and $44 in 2008, 2007 and 2006, was $44.respectively.
56
Shares issued as a result of stock option exercises may be newly issued shares or reissued treasury shares. Proceeds received from the exercise of options, and the related tax benefit, aremay be utilized to repurchase shares of the Company’s stock under a stock repurchase program adopted by the Company’s Board of Directors. During 2006,2008, the Company repurchased approximately 11seven million shares of stock in such a manner.
For share-based awards granted prior to the adoption of SFAS No. 123(R), the Company’s stock option grants generally contained retirement-eligibility provisions that caused the options to vest upon the earlier of the stated vesting date or retirement. Compensation expense was calculated over the stated vesting periods, regardless of whether certain employees became retirement-eligible during the respective vesting periods. Upon the adoption of SFAS No. 123(R), the Company continued this method of recognizing compensation expense for awards granted prior to the adoption of SFAS No. 123(R). For awards granted on or after January 29, 2006, options vest based on the stated vesting date, even if an employee retires prior to the vesting date. The requisite service period ends, however, on the employee’s retirement-eligible date. As a result, the Company recognizes expense for stock option grants containing such retirement-eligibility provisions over the shorter of the vesting period or the period until employees become retirement-eligible (the requisite service period). As a result of retirement eligibility provisions in stock option awards granted on or after January 29, 2006, approximately $6$9 of compensation expense was recognized in 20062008 prior to the completion of stated vesting periods.
11. COMMITMENTSCOMMITMENTS AND CONTINGENCIES
The Company continuously evaluates contingencies based upon the best available evidence.
The Company believes that allowances for loss have been provided to the extent necessary and that its assessment of contingencies is reasonable. To the extent that resolution of contingencies results in amounts that vary from the Company’s estimates, future earnings will be charged or credited.
The principal contingencies are described below:
Insurance — The Company’s workers’ compensation risks are self-insured in certain states. In addition, other workers’ compensation risks and certain levels of insured general liability risks are based on retrospective premium plans, deductible plans, and self-insured retention plans. The liability for workers’ compensation risks is accounted for on a present value basis. Actual claim settlements and expenses incident thereto may differ from the provisions for loss. Property risks have been underwritten by a subsidiary and are reinsured with unrelated insurance companies. Operating divisions and subsidiaries have paid premiums, and the insurance subsidiary has provided loss allowances, based upon actuarially determined estimates.
Litigation –— On October 6, 2006, the Company petitioned the Tax Court (In Re: Ralphs Grocery Company and Subsidiaries, formerly known as Ralphs Supermarkets, Inc., Docket No. 20364-06) for a redetermination of deficiencies set by the Commissioner of Internal Revenue. The dispute at issue involves a 1992 transaction in which Ralphs Holding Company acquired the stock of Ralphs Grocery Company and made an election under Section 338(h)(10) of the Internal Revenue Code. The Commissioner has determined that the acquisition of the stock was not a purchase as defined by Section 338(h)(3) of the Internal Revenue Code and that the acquisition does not qualify as a purchase. The Company believes that it has strong arguments in favor of its position butand believes it is more likely than not that its position will be sustained. However, due to the inherent uncertainty involved in the litigation process, an adverse decisionthere can be no assurances that could have a material adverse effect on the Company’s financial results is a possible outcome.Tax Court will rule in favor of the Company. As of February 3, 2007,January 31, 2009, an adverse decision would require a cash payment ofup to approximately $363,$436, including interest.
On February 2, 2004, the Attorney General for the State of California filed an action in Los Angeles federal court (California, ex rel Lockyer v. Safeway, Inc. dba Vons, a Safeway Company; Albertson’s, Inc. and Ralphs Grocery Company, a division of The Kroger Co., United States District Court Central District of California, Case No. CV04-0687) alleging that the Mutual Strike Assistance Agreement (the “Agreement”) between the Company, Albertson’s, Inc. and Safeway Inc. (collectively, the “Retailers”), which was designed to prevent the union from placing disproportionate pressure on one or more of the Retailers by picketing such Retailer(s) but not the other Retailer(s) during the labor dispute in southern California, violated Section 1 of the Sherman Act. The lawsuit seeks declarative and injunctive relief. On May 25, 2005,28, 2008, pursuant to a stipulation between the Court deniedparties, the court entered a motion for a summaryfinal judgment filed byin favor of the defendants. RalphsAs a result of the stipulation and final judgment, there are no further claims to be litigated at the other defendants filedtrial court level. The Attorney General has appealed a notice of an interlocutory appealtrial court ruling to the United StatesNinth Circuit Court of Appeals forand the Ninth Circuit. On November 29, 2005, the appellate court dismissed the appeal. On December 7, 2006, the Court denieddefendants are appealing a motion for summary judgment filed by the State of California. The Company continues to believe it has strong defenses against this lawsuit and is vigorously defending it.separate ruling. Although this lawsuit is subject to uncertainties inherent toin the litigation process, based on the information presently available to the Company, management does not expect that the ultimate resolution of this action will have a material adverse effect on the Company’s financial condition, results of operations or cash flows.
Ralphs Grocery Company is the defendant in a group of civil actions initially filed in 2003 and for which a coordination order was issued on January 20, 2004 inThe Great Escape Promotion Cases pending in the Superior Court of California, County of Los Angeles, Case No. JCCP No. 4343. The plaintiffs allege that Ralphs violated various laws protecting consumers in connection with a promotion pursuant to which Ralphs offered travel awards to customers. On February 22, 2006, the Court inThe Great Escape Promotion Casesissued an Order granting preliminary approval of the class action settlement. Notice of the class action settlement was sent to class members, and the Court issued an Order finally approving the class action settlement on August 25, 2006. The settlement involved the issuance of coupons and gift cards. While the ultimate cost of the settlement to Ralphs is largely dependent on the rate of coupon redemption, management does not expect that the ultimate resolution of this action will have a material adverse effect on the Company’s financial condition, results of operations or cash flows.
On August 12, 2000, Ralphs Grocery Company, along with several other potentially responsible parties, entered into a consent decree with the U. S. Environmental Protection Agency surrounding the purported release of volatile organic compounds in connection with industrial operations at a property located in Los Angeles, California. The consent decree followed the EPA’s earlier Administrative Order No. 97-18 in which the EPA sought remedial action pursuant to its authority under the Comprehensive Environmental Remediation, Compensation and Liability Act. Under the consent decree, Ralphs contributes a share of the costs associated with groundwater extraction and treatment. The treatment process is expected to continue until at least 2012.57
Various claims and lawsuits arising in the normal course of business, including suits charging violations of certain antitrust, wage and hour, or civil rights laws, are pending against the Company. Some of these suits purport or have been determined to be class actions and/or seek substantial damages. Any damages that may be awarded in antitrust cases will be automatically trebled. Although it is not possible at this time to evaluate the merits of all of these claims and lawsuits, nor their likelihood of success, the Company is of the belief that any resulting liability will not have a material adverse effect on the Company’s financial position.
The Company continually evaluates its exposure to loss contingencies arising from pending or threatened litigation and believes it has made adequate provisions therefor. Nonetheless, assessing and predicting the outcomes of these matters involve substantial uncertainties. It remains possible that despite management’s current belief, material differences in actual outcomes or changes in management’s evaluation or predictions could arise that could have a material adverse impacteffect on the Company’s financial condition or results of operation.
Guarantees –— The Company periodically enters intohas guaranteed half of the indebtedness of two real estate joint venturesentities in connection with the development of certain properties.which Kroger has a 50% ownership interest. The Company usually sells its interests in such partnerships upon completionCompany’s share of the projects. As of February 3, 2007,responsibility for this indebtedness, should the Company was a partner with 50% ownership in three real estate joint ventures for which it has guaranteedentities be unable to meet their obligations, totals approximately $6 of debt incurred by the ventures.$7. Based on the covenants underlying this indebtedness as of February 3, 2007,January 31, 2009 it is unlikely that the Company will be responsible for repayment of these obligations. The Company also agreed to guarantee, up to $25, the indebtedness of an entity in which Kroger has a 25% ownership interest. The Company’s share of the responsibility, as of January 31, 2009, should the entity be unable to meet its obligations, totals approximately $25 and is collateralized by approximately $8 of inventory located in the Company’s stores. In addition, the Company has guaranteed half of the lease payments of a location leased by an entity in which Kroger has a 50% ownership interest. The net present value of the guaranteed rental payments is approximately $6.
Assignments –— The Company is contingently liable for leases that have been assigned to various third parties in connection with facility closings and dispositions. The Company could be required to satisfy the obligations under the leases if any of the assignees areis unable to fulfill theirits lease obligations. Due to the wide distribution of the Company’s assignments among third parties, and various other remedies available, the Company believes the likelihood that it will be required to assume a material amount of these obligations is remote.
12. SUBSEQUENT ESVENTSTOCK
On March 15, 2007, the Company announced its Board of Directors declared the payment of a quarterly dividend of $0.075 per share, payable on June 1, 2007, to shareholders of record as of the close of business on May 15, 2007.
13. STOCK
Preferred Stock
The Company has authorized 5five million shares of voting cumulative preferred stock; 2two million were available for issuance at February 3, 2007.January 31, 2009. The stock has a par value of $100 per share and is issuable in series.
Common Stock
The Company has authorized 1one billion shares of common stock, $1 par value per share. On May 20, 1999, the shareholders authorized an amendment to the Amended Articles of Incorporation to increase the authorized shares of common stock from 1one billion to 2two billion when the Board of Directors determines it to be in the best interest of the Company.
Common Stock Repurchase Program
The Company maintains a stock repurchase programprograms that compliescomply with Securities Exchange Act Rule 10b5-1 to allow for the orderly repurchase of Kroger stock, from time to time. The Company made open market purchases totaling $448, $1,151 and $374 $239 and $291 under thisthese repurchase programprograms in fiscal 2008, 2007 and 2006, 2005 and 2004.respectively. In addition to thisthese repurchase program,programs, in December 1999, the Company began a program to repurchase common stock to reduce dilution resulting from its employee stock option plans. This program is solely funded by proceeds from stock option exercises, includingand the related tax benefit. The Company repurchased approximately $259, $13$189, $270 and $28$259 under the stock option program during fiscal 2006, 20052008, 2007 and 2004,2006, respectively.
58
14. B13.ENEFITBENEFIT PLANS
The Company administers non-contributory defined benefit retirement plans for substantially all non-union employees and some union-represented employees as determined by the terms and conditions of collective bargaining agreements. These includedinclude several qualified pension plans (the “Qualified Plans”) and a non-qualified plan (the “Non-Qualified Plan”). The Non-Qualified Plan pays benefits to any employee that earns in excess of the maximum allowed for the Qualified Plans by Section 415 of the Internal Revenue Code. The Company only funds obligations under the Qualified Plans. Funding for the pension plans is based on a review of the specific requirements and on evaluation of the assets and liabilities of each plan.
In addition to providing pension benefits, the Company provides certain health care benefits for retired employees. The majority of the Company’s employees may become eligible for these benefits if they reach normal retirement age while employed by the Company. Funding of retiree health care benefits occurs as claims or premiums are paid.
Effective February 3, 2007, the Company adopted the recognition and disclosure provisions (except for the measurement date change) of SFAS No. 158,Employers’ Accounting for Defined Benefit Pension and Other Postretirement Plans-an amendment of FASB Statement No. 87, 99, 106 and 123(R)132(R) (SFAS 158), which requiredrequires the recognition of the funded status of its retirement plans on the Consolidated Balance Sheet. Actuarial gains or losses, prior service costs or credits and transition obligations that have not yet been recognized are now required to be recorded as a component of Accumulated Other Comprehensive Income (“AOCI”). The following table reflectsCompany adopted the effectsmeasurement date provisions of SFAS 158 effective February 3, 2008. The majority of our pension and postretirement plans previously used a December 31 measurement date. All plans are now measured as of the Company’s fiscal year end. The non-cash effect of the adoption of the measurement date provisions of SFAS No. 158 haddecreased shareholders’ equity by approximately $5 ($3 after-tax) and increased long-term liabilities by approximately $5. There was no effect on our Consolidated Balance Sheet asthe Company’s results of February 3, 2007.operations.
| | | | Before | | | | | | After |
| | | Application of | | | | | | Application of |
| February 3, 2007 | | SFAS No. 158 | | Adjustments | | SFAS No. 158 |
| Other assets | | $ | 497 | | | $ | (8 | ) | | $ | 489 | |
| Total assets | | $ | 21,223 | | | $ | (8 | ) | | $ | 21,215 | |
| Deferred income taxes | | $ | 792 | | | $ | (70 | ) | | $ | 722 | |
| Other long-term liabilities | | $ | 1,653 | | | $ | 182 | | | $ | 1,835 | |
| Total liabilities | | $ | 16,180 | | | $ | 112 | | | $ | 16,292 | |
| Accumulated other comprehensive loss | | $ | (139 | ) | | $ | (120 | ) | | $ | (259 | ) |
| Total shareowners’ equity | | $ | 5,043 | | | $ | (120 | ) | | $ | 4,923 | |
| Total liabilities and shareowners’ equity | | $ | 21,223 | | | $ | (8 | ) | | $ | 21,215 | |
Amounts recognized in AOCI as of February 3, 2007January 31, 2009 consist of the following (pre-tax):
| | February 3, 2007 | | Pension Benefits | | Other Benefits | | Total |
| Unrecognized net actuarial loss | | $ | 433 | | | $ | 28 | | | $ | 461 | |
| Unrecognized prior service cost (credit) | | | 7 | | | | (42 | ) | | | (35 | ) |
| Unrecognized transition obligation | | | 1 | | | | — | | | | 1 | |
| |
| Total liabilities | | $ | 441 | | | $ | (14 | ) | | $ | 427 | |
January 31, 2009 | | Pension Benefits | | Other Benefits | | Total | |
Unrecognized net actuarial loss (gain) | | $ | 882 | | $ | (89 | ) | $ | 793 | |
Unrecognized prior service cost (credit) | | 7 | | (28 | ) | (21 | ) |
Unrecognized transition obligation | | 1 | | — | | 1 | |
| | | | | | | |
Total liabilities | | $ | 890 | | $ | (117 | ) | $ | 773 | |
Amounts in AOCI expected to be recognized as components of net periodic pension or postretirement benefit costs in 20072009 are as follows (pre-tax):
| | February 3, 2007 | | Pension Benefits | | Other Benefits | | Total |
| Net actuarial loss | | $ | 35 | | $ | — | | | $ | 35 | |
| Prior service cost | | | 2 | | | (6 | ) | | | (4 | ) |
| |
| Total liabilities | | $ | 37 | | $ | (6 | ) | | $ | 31 | |
January 31, 2009 | | Pension Benefits | | Other Benefits | | Total | |
Net actuarial loss (gain) | | $ | 8 | | $ | (5 | ) | $ | 3 | |
Prior service cost (credit) | | 2 | | (6 | ) | (4 | ) |
| | | | | | | |
Total liabilities | | $ | 10 | | $ | (11 | ) | $ | (1 | ) |
Other changes recognized in other comprehensive income in 2008 are as follows (pre-tax):
January 31, 2009 | | Pension Benefits | | Other Benefits | | Total | |
Incurred prior service cost | | $ | 3 | | $ | — | | $ | 3 | |
Incurred net actuarial loss (gain) | | 660 | | (54 | ) | 606 | |
Amortization of prior service credit (cost) | | (2 | ) | 7 | | 5 | |
Amortization of net actuarial gain (loss) | | (19 | ) | 3 | | (16 | ) |
Total recognized in other comprehensive income | | 642 | | (44 | ) | 598 | |
| | | | | | | |
Total recognized in net periodic benefit cost and other comprehensive income | | $ | 687 | | $ | (26 | ) | $ | 661 | |
59
Information with respect to change in benefit obligation, change in plan assets, the funded status of the plans recorded in the Consolidated Balance Sheets, net amounts recognized at end of fiscal years, weighted average assumptions and components of net periodic benefit cost follow:
| | Pension Benefits | | | | | | | | |
| | Qualified Plans | | Non-Qualified Plan | | Other Benefits |
| | 2006 | | 2005 | | 2006 | | 2005 | | 2006 | | 2005 |
| Change in benefit obligation: | | | | | | | | | | | | | | | | | | | | | | | | |
| Benefit obligation at beginning of fiscal year | | $ | 2,284 | | | $ | 2,019 | | | $ | 105 | | | $ | 113 | | | $ | 356 | | | $ | 366 | |
| Service cost | | | 123 | | | | 118 | | | | 2 | | | | 1 | | | | 13 | | | | 12 | |
| Interest cost | | | 130 | | | | 113 | | | | 6 | | | | 6 | | | | 20 | | | | 19 | |
| Plan participants’ contributions | | | — | | | | — | | | | — | | | | — | | | | 11 | | | | 9 | |
| Amendments | | | — | | | | — | | | | | | | | 3 | | | | — | | | | 4 | |
| Actuarial (gain) loss | | | (4 | ) | | | 145 | | | | 7 | | | | (12 | ) | | | 4 | | | | (22 | ) |
| Benefits paid | | | (114 | ) | | | (111 | ) | | | (7 | ) | | | (6 | ) | | | (31 | ) | | | (32 | ) |
| |
| Benefit obligation at end of fiscal year | | $ | 2,419 | | | $ | 2,284 | | | $ | 113 | | | $ | 105 | | | $ | 373 | | | $ | 356 | |
| |
| Change in plan assets: | | | | | | | | | | | | | | | | | | | | | | | | |
| Fair value of plan assets at beginning of fiscal year | | $ | 1,814 | | | $ | 1,458 | | | $ | — | | | $ | — | | | $ | — | | | $ | — | |
| Actual return on plan assets | | | 248 | | | | 167 | | | | — | | | | — | | | | — | | | | — | |
| Employer contributions | | | 150 | | | | 300 | | | | 7 | | | | 6 | | | | 20 | | | | 23 | |
| Plan participants’ contributions | | | — | | | | — | | | | — | | | | — | | | | 11 | | | | 9 | |
| Benefits paid | | | (114 | ) | | | (111 | ) | | | (7 | ) | | | (6 | ) | | | (31 | ) | | | (32 | ) |
| |
| Fair value of plan assets at end of fiscal year | | $ | 2,098 | | | $ | 1,814 | | | $ | — | | | $ | — | | | $ | — | | | $ | — | |
| |
| Funded status at end of fiscal year | | $ | (321 | ) | | $ | (470 | ) | | $ | (113 | ) | | $ | (105 | ) | | $ | (373 | ) | | $ | (356 | ) |
| |
| |
| | Pension Benefits | | | | | | | | |
| | Qualified Plans | | Non-Qualified Plan | | Other Benefits |
| | 2006(1) | | 2005 | | 2006(1) | | 2005 | | 2006(1) | | 2005 |
| Funded status at end of year | | $ | (321 | ) | | $ | (470 | ) | | $ | (113 | ) | | $ | (105 | ) | | $ | (373 | ) | | $ | (356 | ) |
| Unrecognized actuarial (gain) loss | | | — | | | | 541 | | | | — | | | | 27 | | | | — | | | | 23 | |
| Unrecognized prior service cost | | | — | | | | 9 | | | | — | | | | 8 | | | | — | | | | (49 | ) |
| Unrecognized net transition (asset) obligation | | | — | | | | (1 | ) | | | — | | | | 1 | | | | — | | | | 1 | |
| |
| Net asset (liability) recognized at end of fiscal year | | $ | (321 | ) | | $ | 79 | | | $ | (113 | ) | | $ | (69 | ) | | $ | (373 | ) | | $ | (381 | ) |
| |
| Accrued benefit liability | | $ | (321 | ) | | $ | (217 | ) | | $ | (113 | ) | | $ | (112 | ) | | $ | (386 | ) | | $ | (381 | ) |
| Additional minimum liability | | | — | | | | (80 | ) | | | — | | | | 12 | | | | — | | | | — | |
| Intangible asset | | | — | | | | 10 | | | | — | | | | 8 | | | | — | | | | — | |
| Accumulated other comprehensive loss | | | — | | | | 366 | | | | — | | | | 23 | | | | 14 | | | | — | |
| |
| Net asset (liability) recognized at end of fiscal year | | $ | (321 | ) | | $ | 79 | | | $ | (113 | ) | | $ | (69 | ) | | $ | (372 | ) | | $ | (381 | ) |
| (1) | | Effective February 3, 2007, the Company adopted SFAS No. 158. |
| | Pension Benefits | | | | | |
| | Qualified Plans | | Non-Qualified Plan | | Other Benefits | |
| | 2008 | | 2007 | | 2008 | | 2007 | | 2008 | | 2007 | |
Change in benefit obligation: | | | | | | | | | | | | | |
Benefit obligation at beginning of fiscal year | | $ | 2,342 | | $ | 2,419 | | $ | 139 | | $ | 113 | | $ | 320 | | $ | 373 | |
Service cost | | 39 | | 42 | | 2 | | 2 | | 10 | | 10 | |
Interest cost | | 151 | | 141 | | 10 | | 9 | | 18 | | 19 | |
Plan participants’ contributions | | 1 | | 1 | | — | | — | | 8 | | 9 | |
Amendments | | — | | 2 | | 3 | | — | | — | | — | |
Actuarial (gain) loss | | (148 | ) | (143 | ) | 12 | | 23 | | (55 | ) | (65 | ) |
Benefits paid | | (123 | ) | (120 | ) | (8 | ) | (8 | ) | (26 | ) | (26 | ) |
Other | | 4 | | — | | 2 | | — | | 3 | | — | |
| | | | | | | | | | | | | |
Benefit obligation at end of fiscal year | | $ | 2,266 | | $ | 2,342 | | $ | 160 | | $ | 139 | | $ | 278 | | $ | 320 | |
| | | | | | | | | | | | | |
Change in plan assets: | | | | | | | | | | | | | |
Fair value of plan assets at beginning of fiscal year | | $ | 2,230 | | $ | 2,098 | | $ | — | | $ | — | | $ | — | | $ | — | |
Actual return on plan assets | | (619 | ) | 200 | | — | | — | | — | | — | |
Employer contributions | | 20 | | 51 | | 8 | | 8 | | 17 | | 17 | |
Plan participants’ contributions | | 1 | | 1 | | — | | — | | 9 | | 9 | |
Benefits paid | | (123 | ) | (120 | ) | (8 | ) | (8 | ) | (26 | ) | (26 | ) |
Other | | 4 | | — | | — | | — | | — | | — | |
| | | | | | | | | | | | | |
Fair value of plan assets at end of fiscal year | | $ | 1,513 | | $ | 2,230 | | $ | — | | $ | — | | $ | — | | $ | — | |
Funded status at end of fiscal year | | $ | (753 | ) | $ | (112 | ) | $ | (160 | ) | $ | (139 | ) | $ | (278 | ) | $ | (320 | ) |
Net liability recognized at end of fiscal year | | $ | (753 | ) | $ | (112 | ) | $ | (160 | ) | $ | (139 | ) | $ | (278 | ) | $ | (320 | ) |
Other current liabilities as of both January 31, 2009 and February 2, 2008 include $17 of net liability recognized.
As of January 31, 2009 and February 3, 2007,2, 2008, pension plan assets included no shares of The Kroger Co. common stock. Pension plan assets included $52, or 2.7 million shares, of common stock of The Kroger Co. at January 28, 2006.
| | Pension Benefits | | Other Benefits |
| Weighted average assumptions | | 2006 | | 2005 | | 2004 | | 2006 | | 2005 | | 2004 |
| Discount rate – Benefit obligation | | 5.90 | % | | 5.70 | % | | — | | | 5.90 | % | | 5.70 | % | | — | |
| Discount rate – Net periodic benefit cost | | 5.70 | % | | 5.75 | % | | 6.25 | % | | 5.70 | % | | 5.75 | % | | 6.25 | % |
| Expected return on plan assets | | 8.50 | % | | 8.50 | % | | 8.50 | % | | | | | | | | | |
| Rate of compensation increase | | 3.50 | % | | 3.50 | % | | 3.50 | % | | | | | | | | | |
| | Pension Benefits | | Other Benefits | |
Weighted average assumptions | | 2008 | | 2007 | | 2006 | | 2008 | | 2007 | | 2006 | |
Discount rate — Benefit obligation | | 7.00 | % | 6.50 | % | 5.90 | % | 7.00 | % | 6.50 | % | 5.90 | % |
Discount rate — Net periodic benefit cost | | 6.50 | % | 5.90 | % | 5.70 | % | 6.50 | % | 5.90 | % | 5.70 | % |
Expected return on plan assets | | 8.50 | % | 8.50 | % | 8.50 | % | | | | | | |
Rate of compensation increase — Net periodic benefit cost | | 2.99 | % | 3.56 | % | 3.50 | % | | | | | | |
Rate of compensation increase — Benefit Obligation | | 2.92 | % | 2.99 | % | 3.56 | % | | | | | | |
The Company’s discount rate assumption was intended to reflect the rate at which the pension benefits could be effectively settled. It takes into account the timing and amount of benefits that would be available under the plan. The Company’s methodology for selecting the discount rate as of year-end 20062008 was to match the plan’s cash flows to that of a yield curve that provides the equivalent yields on zero-coupon corporate bonds for each maturity. Benefit cash flows due in a particular year can theoretically be “settled” theoretically by “investing” them in the zero-coupon bond that matures in the same year. The discount rate is the single rate that produces the same present value of cash flows. The selection of the 5.90%7.00% discount rate as of year-end 20062008 represents the equivalent single rate under a broad-market AA yield curve constructed by the Company’san outside consultant, Mercer Human Resource Consulting.consultant. We utilized a discount rate of 5.70%6.50% for year-end 2005.2007. The 2050 basis point increase in the discount rate decreased the projected pension benefit obligation as of February 3, 2007,January 31, 2009, by approximately $68 million.$147.
60
To determine the expected return on pension plan assets, the Company contemplates current and forecasted plan asset allocations as well as historical and forecasted returns on various asset categories. The average annual return on pension plan assets was 9.7%4.1% for the ten calendar years ended December 31, 2006,2008, net of all fees and expenses. Our actual return for the pension plan calendar year ending December 31, 2006,2008, on that same basis, was 13.4%(26.1)%. The Company utilized a pension return assumption of 8.5% in 2008, 2007 and 2006 2005 and 2004.based on the assumption that future returns will achieve the same level of performance as the long-term historical average annual return for the various markets in which the plan invests.
In 2005,
The fair value of plan assets decreased in 2008 compared to 2007 due to deteriorating conditions in the global financial markets. This decrease caused the Company’s underfunded status to increase at January 31, 2009.
The Company updateduses the RP-2000 projected 2015 mortality table used to determine average life expectancy in calculating the calculation of its pension obligation to the RP-2000 Projected to 2015 mortality table. The change in this assumption increased the projected benefit obligation approximately $93, at the time of the change, and is reflected in unrecognized actuarial (gain) loss as of the measurement date.obligation.
| | Pension Benefits | | | | | | | | | | | | |
| | Qualified Plans | | Non-Qualified Plan | | Other Benefits |
| | 2006 | | 2005 | | 2004 | | 2006 | | 2005 | | 2004 | | 2006 | | 2005 | | 2004 |
| Components of net periodic benefit cost: | | | | | | | | | | | | | | | | | | | | | | | | | | | | | | | | | |
| Service cost | | $ | 123 | | | $ | 118 | | | $ | 106 | | | $ | 2 | | $ | 1 | | $ | 1 | | $ | 13 | | | $ | 12 | | | $ | 10 | |
| Interest cost | | | 130 | | | | 113 | | | | 109 | | | | 6 | | | 6 | | | 6 | | | 20 | | | | 19 | | | | 21 | |
| Expected return on plan assets | | | (152 | ) | | | (130 | ) | | | (121 | ) | | | — | | | — | | | — | | | — | | | | — | | | | — | |
| Amortization of: | | | | | | | | | | | | | | | | | | | | | | | | | | | | | | | | | |
| Transition asset | | | (1 | ) | | | (1 | ) | | | (1 | ) | | | — | | | — | | | — | | | — | | | | — | | | | — | |
| Prior service cost | | | 3 | | | | 3 | | | | 3 | | | | 2 | | | 2 | | | 2 | | | (7 | ) | | | (7 | ) | | | (5 | ) |
| Actuarial (gain) loss | | | 41 | | | | 24 | | | | 9 | | | | 2 | | | 2 | | | 3 | | | — | | | | — | | | | — | |
| Curtailment charge | | | 5 | | | | — | | | | — | | | | — | | | — | | | — | | | — | | | | — | | | | — | |
| |
| Net periodic benefit cost | | $ | 149 | | | $ | 127 | | | $ | 105 | | | $ | 12 | | $ | 11 | | $ | 12 | | $ | 26 | | | $ | 24 | | | $ | 26 | |
| | Pension Benefits | | | | | | | |
| | Qualified Plans | | Non-Qualified Plan | | Other Benefits | |
| | 2008 | | 2007 | | 2006 | | 2008 | | 2007 | | 2006 | | 2008 | | 2007 | | 2006 | |
Components of net periodic benefit cost: | | | | | | | | | | | | | | | | | | | |
Service cost | | $ | 39 | | $ | 42 | | $ | 123 | | $ | 2 | | $ | 2 | | $ | 2 | | $ | 10 | | $ | 10 | | $ | 13 | |
Interest cost | | 151 | | 141 | | 130 | | 10 | | 9 | | 6 | | 18 | | 19 | | 20 | |
Expected return on plan assets | | (178 | ) | (165 | ) | (152 | ) | — | | — | | — | | — | | — | | — | |
Amortization of: | | | | | | | | | | | | | | | | | | | |
Transition asset | | — | | — | | (1 | ) | — | | — | | — | | — | | — | | — | |
Prior service cost | | — | | 1 | | 3 | | 2 | | 2 | | 2 | | (7 | ) | (6 | ) | (7 | ) |
Actuarial (gain) loss | | 11 | | 31 | | 41 | | 8 | | 6 | | 2 | | (3 | ) | — | | — | |
Curtailment charge | | — | | — | | 5 | | — | | — | | — | | — | | — | | — | |
| | | | | | | | | | | | | | | | | | | |
Net periodic benefit cost | | $ | 23 | | $ | 50 | | $ | 149 | | $ | 22 | | $ | 19 | | $ | 12 | | $ | 18 | | $ | 23 | | $ | 26 | |
The following table provides the projected benefit obligation (“PBO”), accumulated benefit obligation (“ABO”) and the fair value of plan assets for all Company-sponsored pension plans.
| | Qualified Plans | | Non-Qualified Plan |
| | 2006 | | 2005 | | 2006 | | 2005 |
| PBO at end of fiscal year | | $ | 2,419 | | $ | 2,284 | | $ | 113 | | $ | 105 |
| ABO at end of fiscal year | | $ | 2,232 | | $ | 2,111 | | $ | 103 | | $ | 100 |
| Fair value of plan assets at end of year | | $ | 2,098 | | $ | 1,814 | | $ | — | | $ | — |
| | Qualified Plans | | Non-Qualified Plan | |
| | 2008 | | 2007 | | 2008 | | 2007 | |
PBO at end of fiscal year | | $ | 2,266 | | $ | 2,342 | | $ | 160 | | $ | 139 | |
ABO at end of fiscal year | | $ | 2,096 | | $ | 2,144 | | $ | 138 | | $ | 118 | |
Fair value of plan assets at end of year | | $ | 1,513 | | $ | 2,230 | | $ | — | | $ | — | |
The following table provides information about the Company’s estimated future benefit payments.
| | Pension | | Other |
| | Benefits | | Benefits |
| 2007 | $ | 139 | | $ | 22 |
| 2008 | $ | 138 | | $ | 23 |
| 2009 | $ | 145 | | $ | 24 |
| 2010 | $ | 142 | | $ | 26 |
| 2011 | $ | 137 | | $ | 27 |
| 2012 - 2016 | $ | 775 | | $ | 152 |
| | Pension
Benefits | | Other
Benefits | |
2009 | | $ | 118 | | $ | 19 | |
2010 | | $ | 125 | | $ | 20 | |
2011 | | $ | 132 | | $ | 21 | |
2012 | | $ | 142 | | $ | 21 | |
2013 | | $ | 153 | | $ | 22 | |
2014 — 2018 | | $ | 922 | | $ | 133 | |
The Company discontinued the accrual of additional benefits under the Company’s cash balance formula of the Consolidated Retirement Benefit Plan (the “Cash Balance Plan”) effective January 1, 2007. Participants in the Cash Balance Plan will continue to earn interest credits on their accrued benefit balance as of December 31, 2006, based on average Treasury rates, but will no longer accrue cash balance pay credits under the Cash Balance Plan after December 31, 2006. Projected pension benefit payments, as noted above, are lower than estimates in prior years as a result of the discontinuation of benefit accruals under the Cash Balance Plan. As a result of the decision to discontinue accruing additionalcurtail benefits under the Cash Balance Plan, the Company recorded a charge totaling $5, pre-tax, in fiscal 2006, which represented the previously unrecognized prior service costs.
Effective January 1,
61
Net periodic benefit cost decreased in 2008 and 2007 compared to 2006 due to participants in the Cash Balance formula of the Consolidated Retirement Benefit Plan was replaced withbeing moved to a 401(k) Retirement Savings Account Plan, whichretirement savings account plan effective January 1, 2007. Participants under that formula continue to earn interest on prior contributions but no additional pay credits will providebe earned. The 401(k) retirement savings plan provides to eligible employees both Company matching contributions and otherautomatic contributions from the Company based on participant contributions, based uponplan compensation, and length of service,service. The Company contributed and expensed $92 and $90 to eligible employees.employee 401(k) retirement savings accounts in 2008 and 2007, respectively.
The following table provides information about the target and actual pension plan asset allocations. Allocation percentages are shown as of December 31 for each respective year. The pension plan measurement date is the December 31st nearest the fiscal year-end.
| | Target | | Actual |
| | allocations | | allocations |
| | 2006 | | 2006 | | 2005 |
| Pension plan asset allocation, as of December 31: | | | | | | | | |
| Domestic equity securities | 21.4 | % | | 21.1 | % | | 36.1 | % |
| International equity securities | 24.5 | | | 27.5 | | | 25.2 | |
| Investment grade debt securities | 25.0 | | | 23.3 | | | 17.8 | |
| High yield debt securities | 8.0 | | | 7.7 | | | 7.6 | |
| Private equity | 5.0 | | | 4.9 | | | 4.2 | |
| Hedge funds | 7.6 | | | 7.4 | | | 3.8 | |
| Real estate | 1.5 | | | 1.4 | | | 1.1 | |
| Other | 7.0 | | | 6.7 | | | 4.3 | |
| |
| Total | 100.0 | % | | 100.0 | % | | 100.0 | % |
| | Target
allocations | | Actual
allocations | |
| | 2008 | | 2008 | | 2007 | |
Pension plan asset allocation, as of December 31: | | | | | | | |
Domestic equity securities | | 15.6 | % | 11.0 | % | 15.2 | % |
International equity securities | | 16.4 | | 13.9 | | 21.4 | |
Investment grade debt securities | | 16.0 | | 17.9 | | 21.6 | |
High yield debt securities | | 10.0 | | 12.7 | | 9.9 | |
Private equity | | 5.5 | | 9.2 | | 5.9 | |
Hedge funds | | 22.0 | | 22.9 | | 17.2 | |
Real estate | | 3.0 | | 3.2 | | 1.7 | |
Other | | 11.5 | | 9.2 | | 7.1 | |
| | | | | | | |
Total | | 100.0 | % | 100.0 | % | 100.0 | % |
Investment objectives, policies and strategies are set by the Pension Investment Committee (the “Committee”) appointed by the CEO. The primary objectives include holding, protecting and investing the assets and distributing benefits to participants and beneficiaries of the pension plans. Investment objectives have been established based on a comprehensive review of the capital markets and each underlying plan’s current and projected financial requirements. The time horizon of the investment objectives is long-term in nature and plan assets are managed on a going-concern basis.
Investment objectives and guidelines specifically applicable to each manager of assets are established and reviewed annually. Derivative instruments may be used for specified purposes.purposes, including rebalancing exposures to certain asset classes. Any use of derivative instruments for a purpose or in a manner not specifically authorized is prohibited, unless approved in advance by the Committee.
The current target allocations shown represent 20062008 targets that were originally established in 2005.2007 and modified during 2008. To maintain actual asset allocations consistent with target allocations, assets are reallocated or rebalanced periodically. CashIn addition, cash flow from employer contributions and participant benefit payments iscan be used to fund underweight asset classes and divest overweight asset classes, as appropriate. The Company expects that cash flow will be sufficient to meet most rebalancing needs. The Company made cash contributions of $150, $300 and $35 in 2006, 2005 and 2004, respectively. Although the Company is not required to make any cash contributions to its Company-sponsored pension plans during fiscal 2007,2009, it made a $50$200 cash contribution to its plans on February 5, 2007.2, 2009. Additional contributions may be made if required under the Company’s cash flow from operations exceeds its expectations.Pension Protection Act to avoid any benefit restrictions. The Company expects any voluntary contributions made during 20072009 will reduce its minimum required contributions in future years.
The measurement date for post-retirement benefit obligations is the December 31st nearest the fiscal year-end.
Assumed health care cost trend rates have a significant effect on the amounts reported for the health care plans. The Company used a 9.00%7.80% initial health care cost trend rate and a 5.00%4.50% ultimate health care cost trend rate to determine its expense. A one-percentage-point change in the assumed health care cost trend rates would have the following effects:
| | 1% Point | | 1% Point |
| | Increase | | Decrease |
| Effect on total of service and interest cost components | $ | 5 | | $ | (4 | ) |
| Effect on postretirement benefit obligation | $ | 45 | | $ | (39 | ) |
On December 8, 2003, the President signed into law the Medicare Prescription Drug Improvement and Modernization Act of 2003. The law provides for a federal subsidy to sponsors of retiree health care benefit plans that provide a benefit at least actuarially equivalent to the benefit established by the law. We have concluded that our plan is at least “actuarially equivalent” to the Medicare Part D plan for certain covered groups only, and will be eligible for the subsidy for those groups. The effect of the subsidy reduced our postretirement benefit obligation $6 at both February 3, 2007, and January 28, 2006, and did not have a material effect on our net periodic benefit cost in either of those years. The remaining groups’ benefits are not “actuarially equivalent” to the Medicare Part D plan and we have made the decision to pay as secondary coverage to Medicare Part D for those groups.
| | 1% Point
Increase | | 1% Point
Decrease | |
Effect on total of service and interest cost components | | $ | 4 | | $ | (3 | ) |
Effect on postretirement benefit obligation | | $ | 29 | | $ | (24 | ) |
62
The Company also contributes to various multi-employer pension plans based on obligations arising from most of its collective bargaining agreements. These plans provide retirement benefits to participants based on their service to contributing employers. The benefits are paid from assets held in trust for that purpose. Trustees are appointed in equal number by employers and unions. The trustees typically are responsible for determining the level of benefits to be provided to participants as well as for such matters as the investment of the assets and the administration of the plans.
The Company recognizes expense in connection with these plans as contributions are funded, in accordance with GAAP. The Company made contributions to these plans,funds, and recognized expense, of $219 in 2008, $207 in 2007, and $204 in 2006, $196 in 2005, and $180 in 2004. The Company estimates it would have contributed an additional $2 million in 2004, but its obligation to contribute was suspended during the labor dispute in southern California.2006.
Based on the most recent information available to it, the Company believes that the present value of actuarial accrued liabilities in most or all of these multi-employer plans substantially exceeds the value of the assets held in trust to pay benefits. Although underfunding can result in the imposition of excise taxes on contributing employers, factors such as increased contributions, increased asset values or future service benefit changes can reduce underfunding so that excise taxes are not triggered. Moreover, if the Company were to exit certain markets or otherwise cease making contributions to these funds, the Company could trigger a substantial withdrawal liability. Any adjustment for withdrawal liability will be recorded when it is probable that a liability exists and can be reasonably estimated, in accordance with GAAP.
The Company also administers certainother defined contribution plans for eligible union and non-union employees. The cost of these plans for 2008, 2007 and 2006 2005 and 2004 was $8, $8 and $12, respectively.$8.
15. R14.ECENTLY ADOPTED ACCOUNTING STANDARDSRECENTLY ADOPTED ACCOUNTING STANDARDS
In December 2004,Effective January 31, 2009, the FASB issued SFAS No. 123 (Revised 2002),Share-Based Payment (“SFAS No. 123(R)”), which replaced SFAS No. 123, superseded APB No. 25 and related interpretations and amended SFAS No. 95,Statement of Cash Flows. SFAS No 123(R) requires all share-based payments to employees, including grants of employee stock options, to be recognized in the financial statements as compensation cost based on their fair value on the date of grant. The Company adopted the provisionsFAS 140-4 and FIN 46(R)-8, Disclosures by Public Entities (Enterprises) about Transfers of SFAS No. 123(R)Financial Assets and Interests in the first quarterVariable Interest Entities (FAS 140-4 and FIN 46(R)-8).FAS 140-4 and FIN 46(R)-8 require additional disclosures about an entity’s involvement with variable interest entities and transfers of 2006. The implementation of SFAS No. 123(R) reduced net earnings $0.06 per diluted share in 2006.financial assets. See Note 102 for further discussion of the effectadoption of FAS 140-4 and FIN 46(R)-8.
Effective February 3, 2008, the Company adopted SFAS No. 157, Fair Value Measurements (SFAS 157), except for non-financial assets and non-financial liabilities as deferred until February 1, 2009 by FASB Staff Position (FSP) 157-2 Partial Deferral of the Effective Date of Statement No. 157 (FSP 157-2). SFAS 157 defines fair value, establishes a market-based framework for measuring fair value and expands disclosures about fair value measurements. SFAS 157 does not expand or require any new fair value measurements. FSP 157-2 deferred the effective date of SFAS 157 for most non-financial assets and non-financial liabilities to fiscal years beginning after November 15, 2008. See Note 7 for further discussion of the adoption of SFAS No. 123(R) had on the Company’s Consolidated Financial Statements.157.
In September 2006, the FASB issued SFAS No. 158,Employers’ Accounting for Defined Benefit Pension and Other Postretirement Plans-an amendment of FASB Statements No. 87, 99, 106, and 123(R).SFAS No. 158 requires an employer that sponsors one or more single-employer defined benefit plans to recognize in its statement of financial position an asset for a plan’s overfunded status or a liability for a plan’s underfunded status. In addition, SFAS No. 158 requires an employer to measure a plan’s assets and obligations and determine its funded states as of the end of the employer’s fiscal year and recognize changes in the funded status of a defined benefit postretirement plan in the year the changes occur and that those changes be recorded in comprehensive income, net of tax, as a separate component shareowners’ equity. SFAS No. 158 also requires additional footnote disclosure. The recognition and disclosure provisions of SFAS No. 158 became effective forEffective February 4, 2007, the Company on February 3, 2007. The measurement date provisions of SFASadopted FASB Interpretation No. 158 will become effective for the Company’s fiscal year beginning on February 1, 2009. See Note 14 for the effects the implementation of SFAS No. 158 had on the Company’s Consolidated Financial Statements.
16. RECENTLY ISSUED ACCOUNTING STANDARDS
In June 2006, the FASB issued Interpretation (“FIN”) No. 48,Accounting for Uncertainty in Income Taxes-anTaxes — an interpretation of FASB Statement No. 109.109FIN (FIN No. 4848), which prescribes a recognition threshold and measurement attribute for the financial statement recognition and measurement of a tax position taken or expected to be taken in a tax return. This Interpretationinterpretation also provides guidance on derecognition, classification, interest and penalties, accounting in interim periods, disclosure, and transition. See Note 4 for further discussion of the adoption of FIN No. 48 becomes48.
Effective February 3, 2007, the Company adopted the recognition and disclosure provisions (except for the measurement date change) of SFAS No. 158, Employers’ Accounting for Defined Benefit Pension and Other Postretirement Plans-an amendment of FASB Statement No. 87, 99, 106 and 132(R) (SFAS 158), which requires the recognition of the funded status of its retirement plans on the Consolidated Balance Sheet. Actuarial gains or losses, prior service costs or credits and transition obligations that have not yet been recognized are required to be recorded as a component of Accumulated Other Comprehensive Income (“AOCI”). The Company adopted the measurement date provisions of SFAS 158 effective forFebruary 3, 2008. The majority of the Company’s pension and postretirement plans previously used a December 31 measurement date. All plans are now measured as of the Company’s fiscal year beginning February 4, 2007.end. The Company is evaluatingnon-cash effect of the adoption of the measurement date provisions of SFAS 158 decreased shareholders’ equity by approximately $5 ($3 after-tax) and increased long-term liabilities by approximately $5. There was no effect on the implementationCompany’s results of FIN No. 48 will have on its Consolidated Financial Statements.operations. See Note 13 for further discussion of the adoption of this standard.
63
15.RECENTLY ISSUED ACCOUNTING STANDARDS
In September 2006,December 2007, the FASB issued SFAS No. 157,160, Fair Value MeasurementNoncontrolling Interests in Consolidated Financial Statements-an amendment of ARB No. 51 (SFAS 160). SFAS No. 157 defines fair value, establishes160 will require the consolidation of noncontrolling interests as a framework for measuring fair value in GAAP and expands disclosures about fair value measurement.component of equity. SFAS No. 157 does not require any new fair value measurements. SFAS No. 157160 will become effective for the Company’s fiscal year beginning February 3, 2008. The Company is evaluating the effect the implementation of SFAS No. 157 will have on its Consolidated Financial Statements.
In February 2007, the FASB issued SFAS No. 159,The Fair Value Option for Financial Assets and Financial Liabilities-Including an amendment of FASB Statement No. 115.SFAS No. 159 permits entities to make an irrevocable election to measure certain financial instruments and other assets and liabilities at fair value on an instrument-by-instrument basis. Unrealized gains and losses on items for which the fair value option has been elected should be recognized into net earnings at each subsequent reporting date. SFAS No. 159 will be become effective for the Company’s fiscal year beginning February 3, 2008.1, 2009. The Company is currently evaluating the effect the adoption of SFAS No. 159160 will have on its Consolidated Financial Statements.
In June 2006,December 2007, the FASB ratifiedissued SFAS No. 141 (Revised 2007), Business Combinations (SFAS 141R), which replaces SFAS 141. SFAS 141R further expands the consensusdefinitions of Emerging Issues Task Force (“EITF”) issue No. 06-03,How Taxes Get Collected from Customersa business and Remitted to Governmental Authorities Should Be Presentedthe fair value measurement and reporting in the Income Statement (That Is, Gross versus Net Presentation).EITF No. 06-03 indicates that the income statement presentation of taxes within the scope of the Issue on either a gross basis or a net basis is an accounting policy decision that should be disclosed pursuant to Opinion 22. EITF No. 06-03 becomesbusiness combination. SFAS 141R will become effective for the Company’s fiscal year beginning February 4, 2007.1, 2009. Because the standard will only impact transactions entered into after February 1, 2009, SFAS 141R will not effect our Consolidated Financial Statements upon adoption.
In March 2008, the FASB issued SFAS No. 161, Disclosures about Derivative Instruments and Hedging Activities (SFAS 161). SFAS 161 requires enhanced disclosures on an entity’s derivative and hedging activities. SFAS 161 will become effective for the Company’s fiscal year beginning February 1, 2009. The Company does not expectis currently evaluating the effect the adoption of EITF No. 06-03 toSFAS 161 will have a material effect on its Consolidated Financial Statements.
In June 2008, the FASB issued FSP No. EITF 03-6-1, Determining Whether Instruments Granted in Share-Based Payment Transactions Are Participating Securities (FSP No. EITF 03-6-1).FSP No. EITF 03-6-1clarifies that share-based payment awards that entitle their holders to receive nonforfeitable dividends before vesting should be considered participating securities and included in the calculation of basic EPS. FSP No. EITF 03-6-1 will become effective for the Company’s fiscal year beginning February 1, 2009. The Company is currently evaluating the effect the adoption of FSP No. EITF 03-6-1 will have on its Consolidated Financial Statements.
17. G16.UARANTORGUARANTOR SUBSIDIARIES
The Company’s outstanding public debt (the “Guaranteed Notes”) is jointly and severally, fully and unconditionally guaranteed by The Kroger Co. and some of its subsidiaries (the “Guarantor Subsidiaries”). At February 3, 2007,January 31, 2009, a total of approximately $5,916$7,186 of Guaranteed Notes was outstanding. The Guarantor Subsidiaries and non-guarantor subsidiaries are wholly-owned subsidiaries of The Kroger Co. Separate financial statements of The Kroger Co. and each of the Guarantor Subsidiaries are not presented because the guarantees are full and unconditional and the Guarantor Subsidiaries are jointly and severally liable. The Company believes that separate financial statements and other disclosures concerning the Guarantor Subsidiaries would not be material to investors.
The non-guaranteeing subsidiaries represent less than 3% on an individual and aggregate basis of consolidated assets, pre-tax earnings, cash flow, and equity for all periods presented, except for consolidated pre-tax earnings in 2004.equity. Therefore, the non-guarantor subsidiaries’ information is not separately presented in the balance sheets and the statements of cash flows, but rather is included in the column labeled “Guarantor Subsidiaries,” for those periods. The non-guaranteeing subsidiaries represented approximately 10% of 2004 consolidated pre-tax earnings. Therefore, the non-guarantor subsidiaries information is separately presented in the Condensed Consolidated Statements of Operations for 2004.tables below.
There are no current restrictions on the ability of the Guarantor Subsidiaries to make payments under the guarantees referred to above, except, however, the obligations of each guarantor under its guarantee are limited to the maximum amount as will result in obligations of such guarantor under its guarantee not constituting a fraudulent conveyance or fraudulent transfer for purposes of Bankruptcy Law, the Uniform Fraudulent Conveyance Act, the Uniform Fraudulent Transfer Act, or any similar Federal or state law (e.g., adequate capital to pay dividends under corporate laws).
64
The following tables present summarized financial information as of January 31, 2009 and February 3, 2007 and January 28, 20062, 2008 and for the three years ended January 31, 2009.
Condensed Consolidating
Balance Sheets
As of January 31, 2009
| | The Kroger Co. | | Guarantor
Subsidiaries | | Eliminations | | Consolidated | |
Current assets | | | | | | | | | |
Cash and temporary cash investments | | $ | 27 | | $ | 236 | | $ | — | | $ | 263 | |
Deposits in-transit | | 71 | | 560 | | — | | 631 | |
Receivables | | 2,150 | | 765 | | (1,971 | ) | 944 | |
Net inventories | | 384 | | 4,475 | | — | | 4,859 | |
Prepaid and other current assets | | 366 | | 143 | | — | | 509 | |
| | | | | | | | | |
Total current assets | | 2,998 | | 6,179 | | (1,971 | ) | 7,206 | |
Property, plant and equipment, net | | 1,747 | | 11,414 | | — | | 13,161 | |
Goodwill | | 132 | | 2,139 | | — | | 2,271 | |
Adjustment to reflect fair value interest rate hedges | | — | | — | | — | | — | |
Other assets | | 797 | | 1,562 | | (1,786 | ) | 573 | |
Investment in and advances to subsidiaries | | 10,266 | | — | | (10,266 | ) | — | |
| | | | | | | | | |
Total Assets | | $ | 15,940 | | $ | 21,294 | | $ | (14,023 | ) | $ | 23,211 | |
| | | | | | | | | |
Current liabilities | | | | | | | | | |
Current portion of long-term debt including obligations under capital leases and financing obligations | | $ | 558 | | $ | — | | $ | — | | $ | 558 | |
Accounts payable | | 386 | | 3,436 | | — | | 3,822 | |
Other current liabilities | | 879 | | 6,127 | | (3,757 | ) | 3,249 | |
| | | | | | | | | |
Total current liabilities | | 1,823 | | 9,563 | | (3,757 | ) | 7,629 | |
Long-term debt including obligations under capital leases and financing obligations | | | | | | | | | |
Face value long-term debt including obligations under capital leases and financing obligations | | 7,460 | | — | | — | | 7,460 | |
Adjustment to reflect fair value interest rate hedges | | 45 | | — | | — | | 45 | |
| | | | | | | | | |
Long-term debt including obligations under capital leases and financing obligations | | 7,505 | | — | | — | | 7,505 | |
Other long-term liabilities | | 1,341 | | 1,465 | | — | | 2,806 | |
| | | | | | | | | |
Total Liabilities | | 10,669 | | 11,028 | | (3,757 | ) | 17,940 | |
| | | | | | | | | |
Minority interests | | 95 | | — | | — | | 95 | |
| | | | | | | | | |
Shareowners’ Equity | | 5,176 | | 10,266 | | (10,266 | ) | 5,176 | |
| | | | | | | | | |
Total Liabilities and Shareowners’ equity | | $ | 15,940 | | $ | 21,294 | | $ | (14,023 | ) | $ | 23,211 | |
65
Condensed Consolidating
Balance Sheets
As of February 2, 2008
| | The Kroger Co. | | Guarantor
Subsidiaries | | Eliminations | | Consolidated | |
Current assets | | | | | | | | | |
Cash and temporary cash investments | | $ | 26 | | $ | 216 | | $ | — | | $ | 242 | |
Deposits in-transit | | 76 | | 600 | | — | | 676 | |
Receivables | | 2,033 | | 634 | | (1,881 | ) | 786 | |
Net inventories | | 420 | | 4,429 | | — | | 4,849 | |
Prepaid and other current assets | | 373 | | 182 | | — | | 555 | |
| | | | | | | | | |
Total current assets | | 2,928 | | 6,061 | | (1,881 | ) | 7,108 | |
Property, plant and equipment, net | | 1,684 | | 10,814 | | — | | 12,498 | |
Goodwill | | 56 | | 2,088 | | — | | 2,144 | |
Adjustment to reflect fair value interest rate hedges | | 11 | | — | | — | | 11 | |
Other assets | | 1,412 | | 657 | | (1,537 | ) | 532 | |
Investment in and advances to subsidiaries | | 10,098 | | — | | (10,098 | ) | — | |
| | | | | | | | | |
Total Assets | | $ | 16,189 | | $ | 19,620 | | $ | (13,516 | ) | $ | 22,293 | |
| | | | | | | | | |
Current liabilities | | | | | | | | | |
Current portion of long-term debt including obligations under capital leases and financing obligations | | $ | 1,592 | | $ | — | | $ | — | | $ | 1,592 | |
Accounts payable | | 1,822 | | 5,463 | | (3,418 | ) | 3,867 | |
Other current liabilities | | — | | 3,224 | | — | | 3,224 | |
| | | | | | | | | |
Total current liabilities | | 3,414 | | 8,687 | | (3,418 | ) | 8,683 | |
Long-term debt including obligations under capital leases and financing obligations | | | | | | | | | |
Face value long-term debt including obligations under capital leases and financing obligations | | 6,485 | | — | | — | | 6,485 | |
Adjustment to reflect fair value interest rate hedges | | 44 | | �� | | — | | 44 | |
| | | | | | | | | |
Long-term debt including obligations under capital leases and financing obligations | | 6,529 | | — | | — | | 6,529 | |
Other long-term liabilities | | 1,332 | | 835 | | — | | 2,167 | |
| | | | | | | | | |
Total Liabilities | | 11,275 | | 9,522 | | (3,418 | ) | 17,379 | |
Shareowners’ Equity | | 4,914 | | 10,098 | | (10,098 | ) | 4,914 | |
| | | | | | | | | |
Total Liabilities and Shareowners’ equity | | $ | 16,189 | | $ | 19,620 | | $ | (13,516 | ) | $ | 22,293 | |
66
Condensed Consolidating
Statements of Operations
For the Year ended January 31, 2009
| | The Kroger Co. | | Guarantor
Subsidiaries | | Eliminations | | Consolidated | |
Sales | | $ | 9,557 | | $ | 67,715 | | $ | (1,272 | ) | $ | 76,000 | |
Merchandise costs, including warehousing and transportation | | 7,816 | | 52,020 | | (1,272 | ) | 58,564 | |
Operating, general and administrative | | 1,657 | | 11,227 | | — | | 12,884 | |
Rent | | 128 | | 531 | | — | | 659 | |
Depreciation and amortization | | 157 | | 1,285 | | — | | 1,442 | |
| | | | | | | | | |
Operating profit (loss) | | (201 | ) | 2,652 | | — | | 2,451 | |
Interest expense | | 480 | | 5 | | — | | 485 | |
Equity in earnings of subsidiaries | | 2,022 | | — | | (2,022 | ) | — | |
| | | | | | | | | |
Earnings before tax expense | | 1,341 | | 2,647 | | (2,022 | ) | 1,966 | |
Tax expense | | 92 | | 625 | | — | | 717 | |
| | | | | | | | | |
Net earnings | | $ | 1,249 | | $ | 2,022 | | $ | (2,022 | ) | $ | 1,249 | |
Condensed Consolidating
Statements of Operations
For the Year ended February 2, 2008
| | The Kroger Co. | | Guarantor
Subsidiaries | | Eliminations | | Consolidated | |
Sales | | $ | 9,022 | | $ | 62,482 | | $ | (1,269 | ) | $ | 70,235 | |
Merchandise costs, including warehousing and transportation | | 6,877 | | 48,171 | | (1,269 | ) | 53,779 | |
Operating, general and administrative | | 1,666 | | 10,489 | | — | | 12,155 | |
Rent | | 125 | | 519 | | — | | 644 | |
Depreciation and amortization | | 148 | | 1,208 | | — | | 1,356 | |
| | | | | | | | | |
Operating profit | | 206 | | 2,095 | | — | | 2,301 | |
Interest expense | | 468 | | 6 | | — | | 474 | |
Equity in earnings of subsidiaries | | 1,511 | | — | | (1,511 | ) | — | |
| | | | | | | | | |
Earnings before income tax expense | | 1,249 | | 2,089 | | (1,511 | ) | 1,827 | |
Income tax expense | | 68 | | 578 | | — | | 646 | |
| | | | | | | | | |
Net earnings | | $ | 1,181 | | $ | 1,511 | | $ | (1,511 | ) | $ | 1,181 | |
67
Condensed Consolidating
Statements of Operations
For the Year ended February 3, 2007.2007
Condensed Consolidating | |
Balance Sheets | |
As of February 3, 2007 | |
| | | | | | | | | | | | | | | |
| | | | | Guarantor | | | | | | | | |
| The Kroger Co. | | Subsidiaries | | Eliminations | | Consolidated |
| Current assets | | | | | | | | | | | | | | | |
| Cash | $ | 25 | | | $ | 164 | | | $ | — | | | $ | 189 | |
| Store deposits in-transit | | 69 | | | | 545 | | | | — | | | | 614 | |
| Receivables | | 168 | | | | 1,982 | | | | (1,372 | ) | | | 778 | |
| Net inventories | | 406 | | | | 4,203 | | | | — | | | | 4,609 | |
| Prepaid and other current assets | | 371 | | | | 194 | | | | — | | | | 565 | |
| | |
| Total current assets | | 1,039 | | | | 7,088 | | | | (1,372 | ) | | | 6,755 | |
| Property, plant and equipment, net | | 1,429 | | | | 10,350 | | | | — | | | | 11,779 | |
| Goodwill, net | | 56 | | | | 2,136 | | | | — | | | | 2,192 | |
| Other assets | | 647 | | | | 1,149 | | | | (1,307 | ) | | | 489 | |
| Investment in and advances to subsidiaries | | 11,510 | | | | — | | | | (11,510 | ) | | | — | |
| | |
| Total Assets | $ | 14,681 | | | $ | 20,723 | | | $ | (14,189 | ) | | $ | 21,215 | |
| | |
| Current liabilities | | | | | | | | | | | | | | | |
| Current portion of long-term debt including obligations | | | | | | | | | | | | | | | |
| under capital leases and financing obligations | $ | 906 | | | $ | — | | | $ | — | | | $ | 906 | |
| Accounts payable | | 1,614 | | | | 4,869 | | | | (2,679 | ) | | | 3,804 | |
| Other current liabilities | | (537 | ) | | | 3,408 | | | | — | | | | 2,871 | |
| | |
| Total current liabilities | | 1,983 | | | | 8,277 | | | | (2,679 | ) | | | 7,581 | |
| Long-term debt including obligations under capital leases and | | | | | | | | | | | | | | | |
| financing obligations | | | | | | | | | | | | | | | |
| Face value long-term debt including obligations under | | | | | | | | | | | | | | | |
| capital leases and financing obligations | | 6,136 | | | | — | | | | — | | | | 6,136 | |
| Adjustment to reflect fair value interest rate hedges | | 18 | | | | — | | | | — | | | | 18 | |
| | |
| Long-term debt including obligations under capital leases | | | | | | | | | | | | | | | |
| and financing obligations | | 6,154 | | | | — | | | | — | | | | 6,154 | |
| Other long-term liabilities | | 1,621 | | | | 936 | | | | — | | | | 2,557 | |
| | |
| Total Liabilities | | 9,758 | | | | 9,213 | | | | (2,679 | ) | | | 16,292 | |
| Shareowners’ Equity | | 4,923 | | | | 11,510 | | | | (11,510 | ) | | | 4,923 | |
| | |
| Total Liabilities and Shareowners’ equity | $ | 14,681 | | | $ | 20,723 | | | $ | (14,189 | ) | | $ | 21,215 | |
| | The Kroger Co. | | Guarantor
Subsidiaries | | Eliminations | | Consolidated | |
Sales | | $ | 8,731 | | $ | 58,383 | | $ | (1,003 | ) | $ | 66,111 | |
Merchandise costs, including warehousing and transportation | | 6,630 | | 44,488 | | (1,003 | ) | 50,115 | |
Operating, general and administrative | | 1,697 | | 10,142 | | — | | 11,839 | |
Rent | | 132 | | 517 | | — | | 649 | |
Depreciation and amortization | | 136 | | 1,136 | | — | | 1,272 | |
| | | | | | | | | |
Operating profit | | 136 | | 2,100 | | — | | 2,236 | |
Interest expense | | 480 | | 8 | | — | | 488 | |
Equity in earnings of subsidiaries | | 1,843 | | — | | (1,843 | ) | — | |
| | | | | | | | | |
Earnings before income tax expense | | 1,499 | | 2,092 | | (1,843 | ) | 1,748 | |
Income tax expense | | 384 | | 249 | | — | | 633 | |
| | | | | | | | | |
Net earnings | | $ | 1,115 | | $ | 1,843 | | $ | (1,843 | ) | $ | 1,115 | |
68
Condensed Consolidating | |
Balance Sheets | |
As of January 28, 2006 | |
| | |
| | | | | | Guarantor | | | | | | | | |
| | The Kroger Co. | | Subsidiaries | | Eliminations | | Consolidated |
| Current assets | | | | | | | | | | | | | | | |
| Cash | $ | 39 | | | $ | 171 | | | $ | — | | | $ | 210 | |
| Store deposits in-transit | | 46 | | | | 442 | | | | — | | | | 488 | |
| Receivables | | 1,088 | | | | 526 | | | | (928 | ) | | | 686 | |
| Net inventories | | 460 | | | | 4,026 | | | | — | | | | 4,486 | |
| Prepaid and other current assets | | 355 | | | | 241 | | | | — | | | | 596 | |
| | |
| Total current assets | | 1,988 | | | | 5,406 | | | | (928 | ) | | | 6,466 | |
| Property, plant and equipment, net | | 1,255 | | | | 10,110 | | | | — | | | | 11,365 | |
| Goodwill, net | | 56 | | | | 2,136 | | | | — | | | | 2,192 | |
| Other assets | | (509 | ) | | | 968 | | | | — | | | | 459 | |
| Investment in and advances to subsidiaries | | 10,808 | | | | — | | | | (10,808 | ) | | | — | |
| | |
| Total Assets | $ | 13,598 | | | $ | 18,620 | | | $ | (11,736 | ) | | $ | 20,482 | |
| | |
| Current liabilities | | | | | | | | | | | | | | | |
| Current portion of long-term debt including obligations | | | | | | | | | | | | | | | |
| under capital leases and financing obligations | $ | 554 | | | $ | — | | | $ | — | | | $ | 554 | |
| Accounts payable | | 263 | | | | 4,215 | | | | (928 | ) | | | 3,550 | |
| Other current liabilities | | (151 | ) | | | 2,762 | | | | — | | | | 2,611 | |
| | |
| Total current liabilities | | 666 | | | | 6,977 | | | | (928 | ) | | | 6,715 | |
| Long-term debt including obligations under capital leases and | | | | | | | | | | | | | | | |
| financing obligations | | | | | | | | | | | | | | | |
| Face value long-term debt including obligations under | | | | | | | | | | | | | | | |
| capital leases and financing obligations | | 6,651 | | | | — | | | | — | | | | 6,651 | |
| Adjustment to reflect fair value interest rate hedges | | 27 | | | | — | | | | — | | | | 27 | |
| | |
| Long-term debt including obligations under capital leases | | | | | | | | | | | | | | | |
| and financing obligations | | 6,678 | | | | — | | | | — | | | | 6,678 | |
| Other long-term liabilities | | 1,864 | | | | 835 | | | | — | | | | 2,699 | |
| | |
| Total Liabilities | | 9,208 | | | | 7,812 | | | | (928 | ) | | | 16,092 | |
| Shareowners’ Equity | | 4,390 | | | | 10,808 | | | | (10,808 | ) | | | 4,390 | |
| | |
| Total Liabilities and Shareowners’ equity | $ | 13,598 | | | $ | 18,620 | | | $ | (11,736 | ) | | $ | 20,482 | |
| Condensed Consolidating |
| Statements of Operations |
| For the Year ended February 3, 2007 |
| |
| | | | | | Guarantor | | | | | | | | |
| | The Kroger Co. | | Subsidiaries | | Eliminations | | Consolidated |
| Sales | $ | 8,731 | | | $ | 58,383 | | | $ | (1,003 | ) | | $ | 66,111 | |
| Merchandise costs, including warehousing and transportation | | 6,630 | | | | 44,488 | | | | (1,003 | ) | | | 50,115 | |
| Operating, general and administrative | | 1,697 | | | | 10,142 | | | | — | | | | 11,839 | |
| Rent | | 132 | | | | 517 | | | | — | | | | 649 | |
| Depreciation and amortization | | 136 | | | | 1,136 | | | | — | | | | 1,272 | |
| | |
| Operating profit | | 136 | | | | 2,100 | | | | — | | | | 2,236 | |
| Interest expense | | 480 | | | | 8 | | | | — | | | | 488 | |
| Equity in earnings of subsidiaries | | 1,843 | | | | — | | | | (1,843 | ) | | | — | |
| | |
| Earnings before tax expense | | 1,499 | | | | 2,092 | | | | (1,843 | ) | | | 1,748 | |
| Tax expense | | 384 | | | | 249 | | | | — | | | | 633 | |
| | |
| Net earnings | $ | 1,115 | | | $ | 1,843 | | | $ | (1,843 | ) | | $ | 1,115 | |
| | |
| Condensed Consolidating |
| Statements of Operations |
| For the Year ended January 28, 2006 |
| | |
| | | | | | Guarantor | | | | | | | | |
| | The Kroger Co. | | Subsidiaries | | Eliminations | | Consolidated |
| Sales | $ | 8,693 | | | $ | 52,822 | | | $ | (962 | ) | | $ | 60,553 | |
| Merchandise costs, including warehousing and transportation | | 6,502 | | | | 40,021 | | | | (958 | ) | | | 45,565 | |
| Operating, general and administrative | | 1,657 | | | | 9,368 | | | | 2 | | | | 11,027 | |
| Rent | | 165 | | | | 502 | | | | (6 | ) | | | 661 | |
| Depreciation and amortization | | 139 | | | | 1,126 | | | | — | | | | 1,265 | |
| | |
| Operating profit | | 230 | | | | 1,805 | | | | — | | | | 2,035 | |
| Interest expense | | 498 | | | | 12 | | | | — | | | | 510 | |
| Equity in earnings of subsidiaries | | 1,164 | | | | — | | | | (1,164 | ) | | | — | |
| | |
| Earnings before tax expense | | 896 | | | | 1,793 | | | | (1,164 | ) | | | 1,525 | |
| Tax expense (benefit) | | (62 | ) | | | 629 | | | | — | | | | 567 | |
| | |
| Net earnings | $ | 958 | | | $ | 1,164 | | | $ | (1,164 | ) | | $ | 958 | |
| Condensed Consolidating |
| Statements of Operations |
| For the Year ended January 29, 2005 |
| |
| | | | | Guarantor | | Non-Guarantor | | | | | | | | |
| The Kroger Co. | | Subsidiaries | | Subsidiaries | | Eliminations | | Consolidated |
| Sales | $ | 8,003 | | | $ | 49,432 | | | $ | 41 | | | $ | (1,042 | ) | | $ | 56,434 | |
| Merchandise costs, including warehousing and | | | | | | | | | | | | | | | | | | | |
| transportation | | 6,420 | | | | 36,721 | | | | — | | | | (1,001 | ) | | | 42,140 | |
| Operating, general and administrative | | 1,126 | | | | 9,494 | | | | (9 | ) | | | — | | | | 10,611 | |
| Rent | | 194 | | | | 527 | | | | — | | | | (41 | ) | | | 680 | |
| Depreciation and amortization | | 110 | | | | 1,142 | | | | 4 | | | | — | | | | 1,256 | |
| Goodwill impairment charge | | — | | | | 904 | | | | — | | | | — | | | | 904 | |
| |
| Operating profit | | 153 | | | | 644 | | | | 46 | | | | — | | | | 843 | |
| Interest expense | | 529 | | | | 6 | | | | 22 | | | | — | | | | 557 | |
| Equity in earnings of subsidiaries | | 430 | | | | — | | | | — | | | | (430 | ) | | | — | |
| |
| Earnings before tax expense | | 54 | | | | 638 | | | | 24 | | | | (430 | ) | | | 286 | |
| Tax expense | | 158 | | | | 231 | | | | 1 | | | | — | | | | 390 | |
| |
| Net earnings (loss) | $ | (104 | ) | | $ | 407 | | | $ | 23 | | | $ | (430 | ) | | $ | (104 | ) |
| Condensed Consolidating |
| Statements of Operations |
| For the Year ended February 3, 2007 |
| | | | | | Guarantor | | | | |
| | The Kroger Co. | | Subsidiaries | | Consolidated |
| Net cash provided by operating activities | $ | 152 | | | $ | 2,199 | | | $ | 2,351 | |
| |
| Cash flows from investing activities: | | | | | | | | | | | |
| Capital expenditures | | (143 | ) | | | (1,540 | ) | | | (1,683 | ) |
| Other | | 56 | | | | 40 | | | | 96 | |
| |
| Net cash used by investing activities | | (87 | ) | | | (1,500 | ) | | | (1,587 | ) |
| |
| Cash flows from financing activities: | | | | | | | | | | | |
| Proceeds from issuance of long-term debt | | 362 | | | | — | | | | 362 | |
| Reductions in long-term debt | | (556 | ) | | | — | | | | (556 | ) |
| Proceeds from issuance of capital stock | | 168 | | | | — | | | | 168 | |
| Capital stock reacquired | | (633 | ) | | | — | | | | (633 | ) |
| Dividends paid | | (140 | ) | | | — | | | | (140 | ) |
| Other | | 18 | | | | (4 | ) | | | 14 | |
| Net change in advances to subsidiaries | | 702 | | | | (702 | ) | | | — | |
| |
| Net cash used by financing activities | | (79 | ) | | | (706 | ) | | | (785 | ) |
| |
| Net decrease in cash and temporary cash investments | | (14 | ) | | | (7 | ) | | | (21 | ) |
| Cash and temporary investments: | | | | | | | | | | | |
| Beginning of year | | 39 | | | | 171 | | | | 210 | |
| |
| End of year | $ | 25 | | | $ | 164 | | | $ | 189 | |
| Condensed Consolidating |
| Statements of Operations |
| For the Year ended January 28, 2006 |
| | | | | | Guarantor | | | | |
| | The Kroger Co. | | Subsidiaries | | Consolidated |
| Net cash provided by operating activities | $ | 1,171 | | | $ | 1,021 | | | $ | 2,192 | |
| |
| Cash flows from investing activities: | | | | | | | | | | | |
| Capital expenditures | | (188 | ) | | | (1,118 | ) | | | (1,306 | ) |
| Other | | 11 | | | | 16 | | | | 27 | |
| |
| Net cash used by investing activities | | (177 | ) | | | (1,102 | ) | | | (1,279 | ) |
| |
| Cash flows from financing activities: | | | | | | | | | | | |
| Proceeds from issuance of long-term debt | | 14 | | | | — | | | | 14 | |
| Reductions in long-term debt | | (764 | ) | | | (33 | ) | | | (797 | ) |
| Proceeds from issuance of capital stock | | 78 | | | | — | | | | 78 | |
| Capital stock reacquired | | (252 | ) | | | — | | | | (252 | ) |
| Other | | 77 | | | | 33 | | | | 110 | |
| Net change in advances to subsidiaries | | (140 | ) | | | 140 | | | | — | |
| |
| Net cash provided (used) by financing activities | | (987 | ) | | | 140 | | | | (847 | ) |
| |
| Net increase in cash and temporary cash investments | | 7 | | | | 59 | | | | 66 | |
| Cash and temporary investments: | | | | | | | | | | | |
| Beginning of year | | 32 | | | | 112 | | | | 144 | |
| |
| End of year | $ | 39 | | | $ | 171 | | | $ | 210 | |
| Condensed Consolidating |
| Statements of Operations |
| For the Year ended January 29, 2005 |
| | | | | | Guarantor | | | | |
| | The Kroger Co. | | Subsidiaries | | Consolidated |
| Net cash provided by operating activities | $ | (890 | ) | | $ | 3,220 | | | $ | 2,330 | |
| |
| Cash flows from investing activities: | | | | | | | | | | | |
| Capital expenditures | | (161 | ) | | | (1,473 | ) | | | (1,634 | ) |
| Other | | 22 | | | | 4 | | | | 26 | |
| |
| Net cash used by investing activities | | (139 | ) | | | (1,469 | ) | | | (1,608 | ) |
| |
| Cash flows from financing activities: | | | | | | | | | | | |
| Proceeds from issuance of long-term debt | | 616 | | | | — | | | | 616 | |
| Reductions in long-term debt | | (724 | ) | | | (286 | ) | | | (1,010 | ) |
| Proceeds from issuance of capital stock | | 25 | | | | — | | | | 25 | |
| Capital stock reacquired | | (319 | ) | | | — | | | | (319 | ) |
| Other | | (27 | ) | | | (22 | ) | | | (49 | ) |
| Net change in advances to subsidiaries | | 1,464 | | | | (1,464 | ) | | | — | |
| |
| Net cash provided (used) by financing activities | | 1,035 | | | | (1,772 | ) | | | (737 | ) |
| |
| Net (decrease) increase in cash and temporary cash investments | | 6 | | | | (21 | ) | | | (15 | ) |
| Cash and temporary investments: | | | | | | | | | | | |
| Beginning of year | | 26 | | | | 133 | | | | 159 | |
| |
| End of year | $ | 32 | | | $ | 112 | | | $ | 144 | |
18. QCondensed Consolidating
Statements of Cash Flows
For the Year ended January 31, 2009
| | The Kroger Co. | | Guarantor
Subsidiaries | | Consolidated | |
Net cash provided by operating activities | | $ | (852 | ) | $ | 3,748 | | $ | 2,896 | |
| | | | | | | |
Cash flows from investing activities: | | | | | | | |
Payments for capital expenditures | | (257 | ) | (1,892 | ) | (2,149 | ) |
Other | | (39 | ) | 9 | | (30 | ) |
| | | | | | | |
Net cash used by investing activities | | (296 | ) | (1,883 | ) | (2,179 | ) |
| | | | | | | |
Cash flows from financing activities: | | | | | | | |
Proceeds from issuance of long-term debt | | 1,377 | | — | | 1,377 | |
Payments on long-term debt | | (1,048 | ) | — | | (1,048 | ) |
Proceeds from issuance of capital stock | | 187 | | — | | 187 | |
Treasury stock purchases | | (637 | ) | — | | (637 | ) |
Dividends paid | | (227 | ) | — | | (227 | ) |
Other | | (430 | ) | 9 | | (421 | ) |
Net change in advances to subsidiaries | | 1,854 | | (1,854 | ) | — | |
| | | | | | | |
Net cash (used) provided by financing activities | | 1,076 | | (1,845 | ) | (769 | ) |
| | | | | | | |
Net increase (decrease) in cash and temporary cash investments | | (72 | ) | 20 | | (52 | ) |
| | | | | | | |
Cash from consolidated Variable Interest Entity | | 73 | | — | | 73 | |
| | | | | | | |
Cash and temporary cash investments: | | | | | | | |
Beginning of year | | 26 | | 216 | | 242 | |
| | | | | | | |
End of year | | $ | 27 | | $ | 236 | | $ | 263 | |
69
Condensed Consolidating
Statements of Cash Flows
For the Year ended February 2, 2008
| | The Kroger Co. | | Guarantor
Subsidiaries | | Consolidated | |
Net cash (used) provided by operating activities | | $ | (941 | ) | $ | 3,522 | | $ | 2,581 | |
| | | | | | | |
Cash flows from investing activities: | | | | | | | |
Payments for capital expenditures | | (210 | ) | (1,916 | ) | (2,126 | ) |
Other | | (29 | ) | (63 | ) | (92 | ) |
| | | | | | | |
Net cash used by investing activities | | (239 | ) | (1,979 | ) | (2,218 | ) |
| | | | | | | |
Cash flows from financing activities: | | | | | | | |
Proceeds from issuance of long-term debt | | 1,372 | | — | | 1,372 | |
Payments on long-term debt | | (560 | ) | — | | (560 | ) |
Proceeds from issuance of capital stock | | 224 | | — | | 224 | |
Treasury stock purchases | | (1,421 | ) | — | | (1,421 | ) |
Dividends paid | | (202 | ) | — | | (202 | ) |
Other | | 218 | | 59 | | 277 | |
Net change in advances to subsidiaries | | 1,550 | | (1,550 | ) | — | |
| | | | | | | |
Net cash (used) provided by financing activities | | 1,181 | | (1,491 | ) | (310 | ) |
| | | | | | | |
Net increase in cash and temporary cash investments | | 1 | | 52 | | 53 | |
| | | | | | | |
Cash and temporary cash investments: | | | | | | | |
Beginning of year | | 25 | | 164 | | 189 | |
| | | | | | | |
End of year | | $ | 26 | | $ | 216 | | $ | 242 | |
70
Condensed Consolidating
Statements of Cash Flows
For the Year ended February 3, 2007
| | The Kroger Co. | | Guarantor
Subsidiaries | | Consolidated | |
Net cash provided by operating activities | | $ | (755 | ) | $ | 3,106 | | $ | 2,351 | |
| | | | | | | |
Cash flows from investing activities: | | | | | | | |
Payments for capital expenditures | | (143 | ) | (1,540 | ) | (1,683 | ) |
Other | | 56 | | 40 | | 96 | |
| | | | | | | |
Net cash used by investing activities | | (87 | ) | (1,500 | ) | (1,587 | ) |
| | | | | | | |
Cash flows from financing activities: | | | | | | | |
Proceeds from issuance of long-term debt | | 10 | | — | | 10 | |
Payments on long-term debt | | (556 | ) | — | | (556 | ) |
Proceeds from issuance of capital stock | | 206 | | — | | 206 | |
Treasury stock purchases | | (633 | ) | — | | (633 | ) |
Dividends Paid | | (140 | ) | — | | (140 | ) |
Other | | 355 | | (27 | ) | 328 | |
Net change in advances to subsidiaries | | 1,586 | | (1,586 | ) | — | |
| | | | | | | |
Net cash used by financing activities | | 828 | | (1,613 | ) | (785 | ) |
| | | | | | | |
Net decrease in cash and temporary cash investments | | (14 | ) | (7 | ) | (21 | ) |
Cash and temporary cash investments: | | | | | | | |
Beginning of year | | 39 | | 171 | | 210 | |
| | | | | | | |
End of year | | $ | 25 | | $ | 164 | | $ | 189 | |
The above February 2, 2008 condensed consolidating balance sheet and 2007 and 2006 condensed consolidating cash flow statements have been adjusted to conform to current year presentation and properly reflect intra-company receivables.
71
17.UARTERLYQUARTERLY DATA (UNAUDITED)
| | | Quarter | | | |
| | | First | | Second | | Third | | Fourth | | Total Year |
| 2006 | | (16 Weeks) | | (12 Weeks) | | (12 Weeks) | | (13 Weeks) | | (53 Weeks) |
| Sales | | $ | 19,415 | | $ | 15,138 | | $ | 14,699 | | $ | 16,859 | | $ | 66,111 |
| Net earnings | | $ | 306 | | $ | 209 | | $ | 215 | | $ | 385 | | $ | 1,115 |
| Net earnings per basic common share | | $ | 0.42 | | $ | 0.29 | | $ | 0.30 | | $ | 0.55 | | $ | 1.56 |
| Average number of shares used in basic calculation | | | 722 | | | 719 | | | 712 | | | 706 | | | 715 |
| Net earnings per diluted common share | | $ | 0.42 | | $ | 0.29 | | $ | 0.30 | | $ | 0.54 | | $ | 1.54 |
| Average number of shares used in diluted calculation | | | 729 | | | 725 | | | 720 | | | 715 | | | 723 |
| |
| | | Quarter | | | |
| | | First | | Second | | Third | | Fourth | | Total Year |
| 2005 | | (16 Weeks) | | (12 Weeks) | | (12 Weeks) | | (12 Weeks) | | (52 Weeks) |
| Sales | | $ | 17,948 | | $ | 13,865 | | $ | 14,020 | | $ | 14,720 | | $ | 60,553 |
| Net earnings | | $ | 294 | | $ | 196 | | $ | 185 | | $ | 283 | | $ | 958 |
| Net earnings per basic common share | | $ | 0.40 | | $ | 0.27 | | $ | 0.26 | | $ | 0.39 | | $ | 1.32 |
| Average number of shares used in basic calculation | | | 727 | | | 722 | | | 724 | | | 724 | | | 724 |
| Net earnings per diluted common share | | $ | 0.40 | | $ | 0.27 | | $ | 0.25 | | $ | 0.39 | | $ | 1.31 |
| Average number of shares used in diluted calculation | | | 732 | | | 730 | | | 732 | | | 730 | | | 731 |
| | Quarter | | | |
2008 | | First
(16 Weeks) | | Second
(12 Weeks) | | Third
(12 Weeks) | | Fourth
(12 Weeks) | | Total Year
(52 Weeks) | |
Sales | | $ | 23,107 | | $ | 18,053 | | $ | 17,580 | | $ | 17,260 | | $ | 76,000 | |
Net earnings | | $ | 386 | | $ | 277 | | $ | 237 | | $ | 349 | | $ | 1,249 | |
Net earnings per basic common share | | $ | 0.59 | | $ | 0.42 | | $ | 0.37 | | $ | 0.54 | | $ | 1.92 | |
Average number of shares used in basic calculation | | 657 | | 651 | | 649 | | 648 | | 652 | |
Net earnings per diluted common share | | $ | 0.58 | | $ | 0.42 | | $ | 0.36 | | $ | 0.53 | | $ | 1.90 | |
Average number of shares used in diluted calculation | | 664 | | 659 | | 656 | | 655 | | 659 | |
| | Quarter | | | |
2007 | | First
(16 Weeks) | | Second
(12 Weeks) | | Third
(12 Weeks) | | Fourth
(12 Weeks) | | Total Year
(52 Weeks) | |
Sales | | $ | 20,726 | | $ | 16,139 | | $ | 16,135 | | $ | 17,235 | | $ | 70,235 | |
Net earnings | | $ | 337 | | $ | 267 | | $ | 254 | | $ | 323 | | $ | 1,181 | |
Net earnings per basic common share | | $ | 0.48 | | $ | 0.38 | | $ | 0.37 | | $ | 0.48 | | $ | 1.71 | |
Average number of shares used in basic calculation | | 706 | | 702 | | 678 | | 668 | | 690 | |
Net earnings per diluted common share | | $ | 0.47 | | $ | 0.38 | | $ | 0.37 | | $ | 0.48 | | $ | 1.69 | |
Average number of shares used in diluted calculation | | 715 | | 709 | | 685 | | 676 | | 698 | |
Annual amounts may not sum due to rounding.
72
ITEM 9. | | CHANGES IN AND DISAGREEMENTS WITH ACCOUNTSACCOUNTANTS ON ACCOUNTING AND FINANCIAL DISCLOSURE. |
None.
None.
ITEM 9A.CONTROLS AND PROCEDURES.
As of February 3, 2007,January 31, 2009, the Chief Executive Officer and the Chief Financial Officer, together with a disclosure review committee appointed by the Chief Executive Officer, evaluated Kroger’s disclosure controls and procedures. Based on that evaluation, Kroger’s Chief Executive Officer and Chief Financial Officer concluded that Kroger’s disclosure controls and procedures were effective as of February 3, 2007.January 31, 2009.
CHANGES IN IINNTERNAL I CNTERNALONTROL C OONTROLVER O FVERINANCIAL F RINANCIAL REPORTING
In connection with the evaluation described above, there
There was no change in Kroger’s internal control over financial reporting during the fiscal quarter ended February 3, 2007,January 31, 2009, that has materially affected, or is reasonably likely to materially affect, Kroger’s internal control over financial reporting.
MANAGEMENT’S REPORT ON IONNTERNAL I CNTERNALONTROL C OONTROLVER O FVERINANCIAL F RINANCIAL REPORTING
The management of the Company is responsible for establishing and maintaining adequate internal control over financial reporting for the Company. With the participation of the Chief Executive Officer and the Chief Financial Officer, our management conducted an evaluation of the effectiveness of our internal control over financial reporting based on the framework and criteria established in Internal Control –— Integrated Framework, issued by the Committee of Sponsoring Organizations of the Treadway Commission. Based on this evaluation, our management has concluded that the Company’s internal control over financial reporting was effective as of February 3, 2007.January 31, 2009.
Our management’s assessment of the
The effectiveness of the Company’s internal control over financial reporting as of February 3, 2007,January 31, 2009, has been audited by PricewaterhouseCoopers LLP, an independent registered public accounting firm, as stated in their report, which can be found in Item 8 of this Form 10-K.
ITEM 9B.OTHER INFORMATION.
None.
73
PART III
ITEM 10.DIRECTORS, EXECUTIVE OFFICERS AND CORPORATE GOVERNANCE.
The information required by this Item not otherwise set forth below is set forth under the headings Election of Directors and Information Concerning the Board of Directors in the definitive proxy statement to be filed by the Company with the Securities and Exchange Commission and is hereby incorporated by reference into this Form 10-K.
SECTION 16(a) BENEFICIAL OWNERSHIP REPORTING COMPLIANCE
Based solely on its review of the copies of all Section 16(a) forms received by the Company, or written representations from certain persons that no Forms 5 were required by those persons, the Company believes that during fiscal year 20062008 all filing requirements applicable to its officers, directors and 10% beneficial owners were timely satisfied, with two exceptions. Mr. Jon C. Flora filed a Form 5 reporting a stock sale that inadvertently was not reported in 2006, and Mr. Carver L. Johnson filed a Form 5 reporting three transactions with the Company in which shares were withheld by the Company to pay tax liabilities associated with restricted stock awards.satisfied.
EXECUTIVE OFFICERS OF THE COMPANY
The following is a list of the names and ages of the executive officers and the positions held by each such person or those chosen to become executive officers as of March 30, 2007.31, 2009. Except as otherwise noted, each person has held office for at least five years. Each officer will hold office at the discretion of the Board for the ensuing year until removed or replaced.
Name |
| Age |
| Recent Employment History |
Donald E. Becker | 58 | 60 | | Mr. Becker was elected Executive Vice President on September 16, 2004 and Senior Vice President on January 26, 2000. Prior to his election, Mr. Becker was appointed President of the Company’s Central Marketing Area in 1996. Before this, Mr. Becker served in a number of key management positions in the Company’s Cincinnati/Dayton Marketing Area, including Vice President of Operations and Vice President of Merchandising. He joined the Company in 1969. |
| | | | |
William T. Boehm | 59 | Mr. Boehm was elected Senior Vice President and President, Manufacturing on May 6, 2004. Prior to that he was elected Group Vice President, Logistics effective April 29, 2001. Mr. Boehm joined the Company in 1981 as Director of Economic Research. He was promoted to Vice President, Corporate Planning and Research in 1986. He was named Vice President Grocery Procurement in 1989 and Vice President of Logistics in 1994. |
|
David B. Dillon | 56 | 58 | | Mr. Dillon was elected Chairman of the Board on June 24, 2004 and Chief Executive Officer effective June 26, 2003. Prior to this, he was elected President and Chief Operating Officer effective January 26, 2000. Upon the merger with Fred Meyer, Inc., he was named President of the combined Company. Prior thereto, Mr. Dillon was elected President and Chief Operating Officer of Kroger effective June 18, 1995. Prior to this he was elected Executive Vice President on September 13, 1990, Chairman of the Board of Dillon Companies, Inc. on September 8, 1992, and President of Dillon Companies, Inc. on April 22, 1986. |
| | | | |
Kevin M. Dougherty | 54 | 56 | | Mr. Dougherty was elected Group Vice President, Logistics effective May 6, 2004. Mr. Dougherty joined the Company as Vice President, Supply Chain Operations in 2001. Before joining the Company, he maintained an independent consulting practice focusing on logistics and operational performance. |
| | | | |
Jon C. Flora | 52 | Mr. Flora was elected Senior Vice President effective June 24, 2004. Prior to that, he held a variety of key management positions for the Company including President of the Company’s Michigan Marketing Area and more recently President of the Company’s Great Lakes Marketing Area. He joined the Company in 1971 as a clerk for the Company’s Dillon Stores Division. |
Joseph A. Grieshaber, Jr. | 49 | 51 | | Mr. Grieshaber was elected Group Vice President, Perishables Merchandising and Procurement, effective August 4, 2003. Prior to this, he held a variety of management positions within the Company, most recently serving as Vice President of Merchandising for the Company’s Great Lakes Marketing Area. Mr. Grieshaber joined the Company in 1983. |
| | | | |
Paul W. Heldman | 55 | 57 | | Mr. Heldman was elected Executive Vice President effective May 5, 2006, Senior Vice President effective October 5, 1997, Secretary on May 21, 1992, and Vice President and General Counsel effective June 18, 1989. Prior to his election, he held various positions in the Company’s Law Department. Mr. Heldman joined the Company in 1982. |
74
|
Scott M. Henderson | 51 | 53 | | Mr. Henderson was elected Vice President effective June 26, 2003 and Treasurer effective January 6, 2002. Mr. Henderson joined the Company in 1981 as Manager of Financial Reporting. He held a variety of management positions and was promoted to Vice President of Planning in February 2000. |
| | | | |
Christopher T. Hjelm | 45 | 47 | | Mr. Hjelm joined the Company on August 28, 2005 as Senior Vice President and Chief Information Officer. From February 2005 to July 2005, he was Chief Information Officer of Travel Distribution Services for Cendant Corporation. From July 2003 to November 2004 Mr. Hjelm served as Chief Technology Officer for Orbitz LLC, which was acquired by Cendant Corporation in November 2004. Mr. Hjelm served as Senior Vice President for Technology at eBay Inc. from March 2002 to June 2003, and served as Executive Vice President for Broadband Network Services for At Home Company from June 2001 to February 2002. From January 2000 to June 2001, Mr. Hjelm served as Chairman, President and Chief Executive Officer of ZOHO Corporation. Prior to that, he held various key roles for 14 years with Federal Express Corporation, including that of Senior Vice President and Chief Information Officer. |
| | | | |
Carver L. Johnson | 57 | 59 | | Mr. Johnson was elected Chief Diversity Officer effective June 22, 2006. Prior to his election, Mr. Johnson served as Group Vice President of Management Information Systems. Prior to joining the Company in December 1999, he served as Vice President and Chief Information Officer of Gymboree. From 1993 to 1998, Mr. Johnson was Senior Systems Director of Corporate Services for Sears, Roebuck & Co. He previously held management positions with Jamesway Corp., Linens ‘n Things, and Pay ‘n Save Stores, Inc. |
| | | | |
Calvin J. Kaufman | | 46 | | Mr. Kaufman was elected Group Vice President and President of Kroger Manufacturing on May 8, 2008. Prior to his election, Mr. Kaufman was appointed as Senior Director of Logistics in 2006. He joined the Fred Meyer logistics group in 1994 and was appointed Group Vice President of Logistics in 2002 and Vice President of Distribution Engineering in 1999. Before joining the Company, he worked for United Parcel Service first as operations manager and then as engineering department manager. |
| | | | |
Lynn Marmer | 54 | 56 | | Ms. Marmer was elected Group Vice President, Corporate Affairs effective January 19, 1998. Prior to her election, Ms. Marmer was an attorney in the Company’s Law Department. Ms. Marmer joined the Company in 1997. Before joining the Company she was a partner in the law firm of Dinsmore & Shohl. |
| | | | |
Don W. McGeorge | 52 | 54 | | Mr. McGeorge was elected President and Chief Operating Officer effective June 26, 2003. Prior to that, he was elected Executive Vice President effective January 26, 2000 and Senior Vice President effective August 10, 1997. Before his election, Mr.McGeorge was President of the Company’s Columbus Marketing Area effective December 29, 1996; and prior thereto President of the Company’s Michigan Marketing Area effective June 20, 1993. Before this he served in a number of key management positions with the Company, including Vice President of Merchandising of the Company’s Nashville Marketing Area. Mr. McGeorge joined the Company in 1977. |
| | | | |
W. Rodney McMullen | 46 | 48 | | Mr. McMullen was elected Vice Chairman effective June 26, 2003. Prior to that he was elected Executive Vice President, Strategy, Planning and Finance effective January 26, 2000, Executive Vice President and Chief Financial Officer effective May 20, 1999, Senior Vice President effective October 5, 1997, and Group Vice President and Chief Financial Officer effective June 18, 1995. Before that he was appointed Vice President, Control and Financial Services on March 4, 1993, and Vice President, Planning and Capital Management effective December 31, 1989. Mr. McMullen joined the Company in 1978 as a part-time stock clerk. |
75
|
M. Marnette Perry | 55 | 57 | | Ms. Perry was elected Senior Vice President effective July 20, 2003. Prior to that she was elected Group Vice President of Perishables Merchandising and Procurement on March 3, 2003. Prior to this she held a variety of significant positions with the Company, including President of the Company’s Michigan Marketing Area, and President of the Company’s Columbus Marketing Area. She joined the Company in 1972. |
| | | | |
J. Michael Schlotman | 49 | 51 | | Mr. Schlotman was elected Senior Vice President effective June 26, 2003, and Group Vice President and Chief Financial Officer effective January 26, 2000. Prior to that he was elected Vice President and Corporate Controller in 1995, and served in various positions in corporate accounting since joining the Company in 1985. |
| | | | |
Paul J. Scutt | 58 | 60 | | Mr. Scutt was elected Senior Vice President of Retail Operations on September 16, 2004 and he was elected Group Vice President of Retail Operations effective May 21, 2002. He has held a number of significant positions with the Company including Regional Vice President of the Company’s Hutchinson operations, and most recently as President of the Company’s Central Marketing Area. |
| | | | |
M. Elizabeth Van Oflen | 49 | 51 | | Ms. Van Oflen was elected Vice President and Controller on April 11, 2003. Prior to her election, she held various positions in the Company’s Finance and Tax Departments. Ms. Van Oflen joined the Company in 1982. |
| | | | |
Della Wall | 55 | 57 | | Ms. Wall was elected Group Vice President, Human Resources effective April 9, 2004. Prior to her election, she held various key positions in the Company’s human resources department, manufacturing group and drug store division, most recently serving as Vice President of Human Resources. Ms. Wall joined the Company in 1971. |
| | | | |
R. Pete Williams | | 54 | | Mr. Williams was elected Senior Vice President on August 19, 2007. Prior to his election, Mr. Williams held a variety of key management positions with the Company, including President of the Company’s Mid-Atlantic Marketing Area, Vice President of Operations, Vice President of Merchandising, and Director of Labor Relations. He joined the Company in 1977. |
76
ITEM 11. EXECUTIVE COMPENSATION.
The information required by this Item is set forth in the sections entitled Compensation ofDiscussion and Analysis, Compensation Committee Report, and Executive Officers and Information Concerning the Board of DirectorsCompensation in the definitive proxy statement to be filed by the Company with the Securities and Exchange Commission and is hereby incorporated by reference into this Form 10-K.
ITEM 12. | | SECURITY OWNERSHIP OF CERTAIN BENEFICIAL OWNERS AND MANAGEMENT AND RELATED STOCKHOLDER MATTERS. |
The following table provides information regarding shares outstanding and available for issuance under the Company’s existing equity compensation plans.
Equity Compensation Plan Information
| Plan Category | | (a) | | (b) | | (c) |
| | | | | | | Number of securities |
| | | | | | | remaining for future |
| | Number of securities to | | Weighted-average | | issuance under equity |
| | be issued upon exercise | | exercise price of | | compensation plans |
| | of outstanding options, | | outstanding options, | | excluding securities |
| | warrants and rights | | warrants and rights | | reflected in column (a) |
| Equity compensation plans approved by security holders | | 51,918,179 | | $ | 20.09 | | 17,595,505 |
| Equity compensation plans not approved by security holders | | — | | $ | — | | — |
| |
| Total | | 51,918,179 | | $ | 20.09 | | 17,595,505 |
| | (a) | | (b) | | (c) | |
Plan Category | | Number of securities to
be issued upon exercise
of outstanding options,
warrants and rights | | Weighted-average
exercise price of
outstanding options,
warrants and rights | | Number of securities
remaining for future
issuance under equity
compensation plans
(excluding securities
reflected in column (a)) | |
| | | | | | | |
Equity compensation plans approved by security holders | | 39,739,548 | | $ | 21.58 | | 25,146,026 | |
Equity compensation plans not approved by security holders | | — | | $ | — | | — | |
Total | | 39,739,548 | | $ | 21.58 | | 25,146,026 | |
The remainder of the information required by this Item is set forth in the Beneficial Ownership of Common Stock table in the definitive proxy statement to be filed by the Company with the Securities and Exchange Commission and is hereby incorporated by reference into this Form 10-K.
ITEM 13. | | CERTAIN RELATIONSHIPS AND RELATED TRANSACTIONS, AND DIRECTOR INDEPENDENCE. |
ITEM 13.CERTAIN RELATIONSHIPS AND RELATED TRANSACTIONS, AND DIRECTOR INDEPENDENCE.
This information required by this Item is set forth in the sectionsections entitled Related Person Transactions and Information Concerning the Board of Directors-Independence in the definitive proxy statement to be filed by the Company with the Securities and Exchange Commission and is hereby incorporated by reference into this Form 10-K.
ITEM 14.PRINCIPAL ACCOUNTING FEES AND SERVICES.
The information required by this Item is set forth in the section entitled Selection of Auditors –— Disclosure of Auditor Fees in the definitive proxy statement to be filed by the Company with the Securities and Exchange Commission and is hereby incorporated by reference into this Form 10-K.
77
PART IV
ITEM 15.EXHIBITS, FINANCIAL STATEMENT SCHEDULES.
(a)1. | | Financial Statements: |
| | |
| | Report of Independent Registered Public Accounting Firm
|
| Consolidated Balance Sheets as of January 31, 2009 and February 3, 2007 and January 28, 2006
2, 2008 |
| Consolidated Statements of Operations for the years ended January 31, 2009, February 2, 2008 and February 3, 2007 January 28, 2006 and January 29, 2005
|
| Consolidated Statements of Cash Flows for the years ended January 31, 2009, February 2, 2008 and February 3, 2007 January 28, 2006 and January 29, 2005
|
| Consolidated Statement of Changes in Shareowners Equity
|
| Notes to Consolidated Financial Statements |
| | |
(a)2. | | Financial Statement Schedules: |
| | |
| | There are no Financial Statement Schedules included with this filing for the reason that they are not applicable or are not required or the information is included in the financial statements or notes thereto. |
| | |
(a)3.&(b)(b) | Exhibits |
| | |
3.1 | | Amended Articles of Incorporation are hereby incorporated by reference to Exhibit 3.1 of the Company’s Quarterly Report on Form 10-Q for the quarter ended May 20, 2006, filed with the SEC on June 29, 2006. |
| |
3.2 | | The Company’s regulations are hereby incorporated by reference to Exhibit 3.2 of the Company’s Quarterly Report on Form 10-Q for the quarter ended May 20, 2006,26, 2007, filed with the SEC on June 29, 2006.July 3, 2007. |
| |
4.1 | | Instruments defining the rights of holders of long-term debt of the Company and its subsidiaries are not filed as Exhibits because the amount of debt under each instrument is less than 10% of the consolidated assets of the Company. The Company undertakes to file these instruments with the Commission upon request. |
| | |
10.1* | | Material Contracts - Non-Employee Directors’ Deferred Compensation Plan. Incorporated by reference to Appendix J to Exhibit 99.1 of Fred Meyer, Inc.’s Current Report on Form 8-K dated September 9, 1997, SEC File No. 1-133339. |
| | |
10.2* | | The Kroger Co. Deferred Compensation Plan for Independent Directors. Incorporated by reference to Exhibit 10.3 to the Company’s Form 10-K for the fiscal year ended January 29, 2005. |
| | |
10.3* | | The Kroger Co. Executive Deferred Compensation Plan. Incorporated by reference to Exhibit 10.4 to the Company’s Form 10-K for the fiscal year ended January 29, 2005. |
| | |
10.4* | | The Kroger Co. 401(k) Retirement Savings Account Restoration Plan. Incorporated by reference to Exhibit 10.4 of The Kroger Co.’s Form 10-K for the fiscal year ended February 3, 2007. |
| | |
10.5* | | Dillon Companies, Inc. Excess Benefit Pension Plan. Incorporated by reference to Exhibit 10.5 of The Kroger Co.’s Form 10-K for the fiscal year ended February 3, 2007. |
| | |
10.6* | | The Kroger Co. Supplemental Retirement Plans for Certain Benefit Plan Participants. Incorporated by reference to Exhibit 10.6 of The Kroger Co.’s Form 10-K for the fiscal year ended February 3, 2007. |
| | |
10.7* | | 2006 Long-Term Bonus Plan. Incorporated by reference to Exhibit 99.1 of The Kroger Co.’s Current Report on Form 8-K filed with the SEC on December 14, 2005. |
| | |
10.8* | | The Kroger Co. 2005 Long-Term Incentive Plan. Incorporated by reference to Exhibit 4.2 of The Kroger Co.’s Form S-8 filed with the SEC on June 23, 2005. |
| | |
10.9* | | Form of Restricted Stock Grant Agreement under Long-Term Incentive Plans. Incorporated by reference to Exhibit 10.9 of The Kroger Co.’s Form 10-K for the fiscal year ended February 3, 2007. |
78
10.10* | | |
10.10* | | Form of Non-Qualified Stock Option Grant Agreement under Long-Term Incentive Plans. Incorporated by reference to Exhibit 10.1 of The Kroger Co.’s Form 10-Q for the quarter ended May 24, 2008. |
10.11 | |
10.11 | Five Year Credit Agreement dated as of November 15, 2006, incorporated by reference to Exhibit 99.1 of The Kroger Co.’s Current Report on Form 8-K filed with the SEC on November 20, 2006. |
| | |
10.12 | | 4(2) Commercial Paper Program Dealer Agreement between The Kroger Co., as Issuer and Banc of America Securities, LLC, as Dealer dated as of December 3, 2003, as amended on July 23, 2004, incorporated by reference to Exhibit 10.15 of The Kroger Co.’s Annual Report on Form 10-K for the fiscal year ended January 29, 2005. |
| | |
10.13 | | 4(2) Commercial Paper Program Dealer Agreement between The Kroger Co., as Issuer and Citigroup Global Markets Inc., as Dealer dated as of December 3, 2003, as amended on June 9, 2004, incorporated by reference to Exhibit 10.16 of The Kroger Co.’s Annual Report on Form 10-K for the fiscal year ended January 29, 2005. |
| | |
10.14* | | Disclosure of compensation of non-employee directors. Incorporated by reference to Item 2.02 of The Kroger Co.’s Form 8-K dated December 10, 2004. |
| | |
12.110.15* | The Kroger Co. Employee Protection Plan dated December 13, 2007. Incorporated by reference to Exhibit 10.15 of the Company’s Annual Report on Form 10-K for the fiscal year ended February 2, 2008. |
| |
10.16* | 2008 Long-Term Bonus Plan. Incorporated by reference to Exhibit 10.16 of the Company’s Annual Report on Form 10-K for the fiscal year ended February 2, 2008. |
| |
10.17* | 2008 Long-Term Incentive and Cash Bonus Plan. Incorporated by reference to Exhibit 4.2 of The Kroger Co.’s Form S-8 filed with the SEC on June 26, 2008. |
| |
12.1 | Statement of Computation of Ratio of Earnings to Fixed Charges. |
| |
21.1 | | Subsidiaries of the Registrant. |
| |
23.1 | | Consent of Independent Registered Public Accounting Firm. |
| |
24.1 | | Powers of Attorney. |
| |
31.1 | | Rule 13a-14(a)/15d-14(a) Certification. |
| |
31.2 | | Rule 13a-14(a)/15d-14(a) Certification. |
| |
32.1 | | Section 1350 Certifications |
* Management contract or compensatory plan or arrangement.
79
SIGNATURES
Pursuant to the requirements of Section 13 or 15(d) of the Securities Exchange Act of 1934, the Company has duly caused this report to be signed on its behalf by the undersigned, thereunto duly authorized.
| | THE KROGER CO. |
| |
Dated: April 4, 2007 March 31, 2009 | | By (*David B. Dillon) |
| | David B. Dillon |
| | Chief Executive Officer |
| | (principal executive officer) |
|
Dated: April 4, 2007 | | By (*J. Michael Schlotman) |
| | J. Michael Schlotman |
| | Chief Financial Officer |
| | (principal financial officer) |
|
Dated: April 4, 2007 | | By (*M. Elizabeth Van Oflen) |
| | M. Elizabeth Van Oflen |
| | Vice President & Controller |
| | (principal accounting officer) |
Pursuant to the requirements of the Securities Exchange Act of 1934, this report has been signed below by the following persons on behalf of the Company and in the capacities indicated on the 4th31st of April, 2007.March 2009.
(*Reuben V. Anderson) | | Director |
Reuben V. Anderson | | |
| | |
(*Robert D. Beyer) | | Director |
Robert D. Beyer | | |
| | |
(*John L. Clendenin) | Director |
John L Clendenin | |
|
(*David B. Dillon) | | Chairman, and Chief Executive Officer and Director |
David B. Dillon | | |
| | |
(*Susan J. Kropf) | | Director |
Susan J. Kropf | | |
| | |
(*John T. LaMacchia) | | Director |
John T. LaMacchia | | |
| | |
(*David B. Lewis) | | Director |
David B. Lewis | | |
| | |
(*Don W. McGeorge) | | President, Chief Operating Officer, and Director |
Don W. McGeorge | | |
| | |
(*W. Rodney McMullen) | | Vice Chairman and Director |
W. Rodney McMullen | | |
| | |
(*Jorge P. Montoya) | | Director |
Jorge P. Montoya | | |
| | |
(*Clyde R. Moore) | | Director |
Clyde R. Moore | | |
| | |
| | Director |
Katherine D. Ortega | |
|
(*Susan M. Phillips) | | Director |
Susan M. Phillips | |
(*Steven R. Rogel) | Director |
| | |
| | Director |
Steven R. Rogel | | |
| | |
(*James A. Runde) | | Director |
James A. Runde | | |
| | |
(*Ronald L. Sargent) | | Director |
Ronald L. Sargent | | |
80
(*J. Michael Schlotman) | | Chief Financial Officer |
J. Michael Schlotman | | (Principal Financial Officer) |
| | |
(*Bobby S. Shackouls) | | Director |
Bobby S. Shackouls | |
|
By: | | |
(*M. Elizabeth Van Oflen) | | Vice President & Controller |
M. Elizabeth Van Oflen | | (Principal Accounting Officer) |
| | |
By: | (*Bruce M. Gack) | | |
| Bruce M. Gack | | |
| Attorney-in-fact | | |
81
EXHIBIT INDEX
Exhibit No.
3.1Exhibit No. |
|
|
| | |
3.1 | | Amended Articles of Incorporation are hereby incorporated by reference to Exhibit 3.1 of the Company’s Quarterly Report on Form 10-Q for the quarter ended May 20, 2006, filed with the SEC on June 29, 2006. |
| | |
3.2 | | The Company’s regulations are hereby incorporated by reference to Exhibit 3.2 of the Company’s Quarterly Report on Form 10-Q for the quarter ended May 20, 2006,26, 2007, filed with the SEC on June 29, 2006.July 3, 2007. |
| | |
4.1 | | Instruments defining the rights of holders of long-term debt of the Company and its subsidiaries are not filed as Exhibits because the amount of debt under each instrument is less than 10% of the consolidated assets of the Company. The Company undertakes to file these instruments with the Commission upon request. |
| | |
10.1* | | Material Contracts - Non-Employee Directors’ Deferred Compensation Plan. Incorporated by reference to Appendix J to Exhibit 99.1 of Fred Meyer, Inc.’s Current Report on Form 8-K dated September 9, 1997, SEC File No. 1-133339. |
| | |
10.2* | | The Kroger Co. Deferred Compensation Plan for Independent Directors. Incorporated by reference to Exhibit 10.3 to the Company’s Form 10-K for the fiscal year ended January 29, 2005. |
| | |
10.3* | | The Kroger Co. Executive Deferred Compensation Plan. Incorporated by reference to Exhibit 10.4 to the Company’s Form 10-K for the fiscal year ended January 29, 2005. |
| | |
10.4* | | The Kroger Co. 401(k) Retirement Savings Account Restoration Plan. Incorporated by reference to Exhibit 10.4 of The Kroger Co.’s Form 10-K for the fiscal year ended February 3, 2007. |
| | |
10.5* | | Dillon Companies, Inc. Excess Benefit Pension Plan. Incorporated by reference to Exhibit 10.5 of The Kroger Co.’s Form 10-K for the fiscal year ended February 3, 2007. |
| | |
10.6* | | The Kroger Co. Supplemental Retirement Plans for Certain Benefit Plan Participants. Incorporated by reference to Exhibit 10.6 of The Kroger Co.’s Form 10-K for the fiscal year ended February 3, 2007. |
| | |
10.7* | | 2006 Long Term Bonus Plan. Incorporated by reference to Exhibit 99.1 of The Kroger Co.’s Current Report on Form 8-K filed with the SEC on December 14, 2005. |
| | |
10.8* | | The Kroger Co. 2005 Long-Term Incentive Plan. Incorporated by reference to Exhibit 4.2 of The Kroger Co.’s Form S-8 filed with the SEC on June 23, 2005. |
| | |
10.9* | | Form of Restricted Stock Grant Agreement under Long-Term Incentive Plans. Incorporated by reference to Exhibit 10.9 of The Kroger Co.’s Form 10-K for the fiscal year ended February 3, 2007. |
| | |
10.10* | | Form of Non-Qualified Stock Option Grant Agreement under Long-Term Incentive Plans. Incorporated by reference to Exhibit 10.1 of The Kroger Co.’s Form 10-Q for the quarter ended May 24, 2008. |
| | |
10.11 | | Five Year Credit Agreement dated as of November 15, 2006, incorporated by reference to Exhibit 99.1 of The Kroger Co.’s Current Report on Form 8-K filed with the SEC on November 20, 2006. |
| | |
10.12 | | 4(2) Commercial Paper Program Dealer Agreement between The Kroger Co., as Issuer and Banc of America Securities, LLC, as Dealer dated as of December 3, 2003, as amended on July 23, 2004, incorporated by reference to Exhibit 10.15 of The Kroger Co.’s Annual Report on Form 10-K for the fiscal year ended January 29, 2005. |
| | |
10.13 | | 4(2) Commercial Paper Program Dealer Agreement between The Kroger Co., as Issuer and Citigroup Global Markets Inc., as Dealer dated as of December 3, 2003, as amended on June 9, 2004, incorporated by reference to Exhibit 10.16 of The Kroger Co.’s Annual Report on Form 10-K for the fiscal year ended January 29, 2005. |
82
10.14* | | |
10.14* | | Disclosure of compensation of non-employee directors. Incorporated by reference to Item 2.02 of The Kroger Co.’s Form 8-K dated December 10, 2004. |
| | |
12.110.15* | | The Kroger Co. Employee Protection Plan. Incorporated by reference to Exhibit 10.15 of the Company’s Annual Report on Form 10-K for the fiscal year ended February 2, 2008. |
| | |
10.16* | | 2008 Long-Term Bonus Plan. Incorporated by reference to Exhibit 10.16 of the Company’s Annual Report on Form 10-K for the fiscal year ended February 2, 2008. |
| | |
10.17* | | 2008 Long-Term Incentive and Cash Bonus Plan. Incorporated by reference to Exhibit 4.2 of The Kroger Co.’s Form S-8 filed with the SEC on June 26, 2008. |
| | |
12.1 | | Statement of Computation of Ratio of Earnings to Fixed Charges. |
| | |
21.1 | | Subsidiaries of the Registrant. |
| | |
23.1 | | Consent of Independent Registered Public Accounting Firm. |
24.1 | | |
24.1 | | Powers of Attorney. |
| | |
31.1 | | Rule 13a-14(a)/15d-14(a) Certification. |
| | |
31.2 | | Rule 13a-14(a)/15d-14(a) Certification. |
| | |
32.1 | | Section 1350 Certifications |
* Management contract or compensatory plan or arrangement.
* Management contract or compensatory plan or arrangement. |
83