[X] | Annual Report Pursuant to Section 13 or 15(d) of the Securities and Exchange Act of 1934 | |
For the fiscal year ended December 31, | ||
[ ] | Transition Report Pursuant to Section 13 or 15(d) of the Securities and Exchange Act of 1934 | |
For the transition period from to | ||
Commission file number 001-15373 |
Incorporated in the State of Delaware
I.R.S. Employer Identification # 43-1706259
Address: 150 North Meramec
Clayton, MO 63105
Telephone: (314) 725-5500
Securities registered pursuant to Section 12(b) of the Act:
Securities registered pursuant to Section 12(b) of the Act: | |
(Title of class) | (Name of each exchange on which registered) |
Common Stock, par value $.01 per share | NASDAQ Global Select Market |
proxy statements are available free of charge on our website. These reports are made available as soon as reasonably practicable after they are filed with or furnished to the SEC. Our filings with the SEC are also available on the SEC’s website at http://www.sec.gov. Investment management and fiduciary services are provided to individuals, businesses, institutions and nonprofit organizations. clients. The Company, as part of its expansion effort, plans to continue its strategy of operating relatively fewer offices with a larger asset base per office, emphasizing commercial banking and wealth management and employing experienced staff who are compensated on the basis of performance and customer service. $16.20 per share. The Series A Preferred Stock Enterprise is subject to periodic examination by the FDIC and Missouri Division of Finance. subsequent three years. Deferred income Finally, to the extent that we issue capital stock in connection with transactions, such transactions and related stock issuances may have a dilutive effect on earnings per share of our common stock and share ownership of our stockholders. skilled people in our top management ranks. See “Supervision and Regulation”, “Liquidity and Capital Resources” and Item 8, Note Participation Restatement for more information. attached tables. Unless otherwise noted, this discussion excludes discontinued operations.
NoneLarge accelerated filer: [ ] Accelerated filer: [X] Non-accelerated filer: [ ] Smaller Reporting Company: [ ] (Other than a smaller reporting company) Act.Act Yes [ ] No [X]$104,441,705$123,481,194 based on the closing price of the common stock of $9.06$9.01 on March 2, 2009,1, 2010, as reported by the NASDAQ Global Select Market.2, 2009,1, 2010, the Registrant had 12,831,45714,851,609 shares of common stock outstanding.
Certain information required for Part III of this report is incorporated by reference to the Registrant’s Proxy Statement for the20092010 Annual Meeting of Shareholders, which will be filed within 120 days of December 31, 2008.2009. 20082009ANNUALREPORT ONFORM10-KTABLE OFCONTENTSPage Part I PagePart IItem 1: Business 1 Item 1A: Risk Factors 76 Item 1B: Unresolved SEC Comments 1312 Item 2: Properties 1312 Item 3: Legal Proceedings 1312 Item 4: Submission of Matters to Vote of Security Holders 1312 Part II Item 5: Market for Registrant’s Common Equity, Related Stockholder Matters and Issuer Purchases of Equity Securities 13 Equity Securities14 Item 6: Selected Financial Data 1716 Item 7: Management’s Discussion and Analysis of Financial Condition and Results of Operations 1817 Item 7A: Quantitative and Qualitative Disclosures About Market Risk 4647 Item 8: Financial Statements and Supplementary Data 4748 Item 9: Changes in and Disagreements with Accountants on Accounting and Financial Disclosure 8993 Item 9A: Controls and Procedures 8994 Item 9B: Other Information 96 Part III Item 9B: Other Information 89Part IIIItem 10: Directors, Executive Officers and Corporate Governance 8996 Item 11: Executive Compensation 8996 Item 12: Security Ownership of Certain Beneficial Owners and Management and Related Stockholder Matters 8996 Item 13: Certain Relationships and Related Transactions, and Director Independence 8996 Item 14: Principal Accountant Fees and Services 8996 Part IV Item 15: Exhibits, Financial Statement Schedules 9097 Signatures 93101
Readers should note that in addition to the historical information contained herein, some of the information in this report contains forward-looking statements within the meaning of the federal securities laws. Forward-looking statements typically are identified with use of terms such as “may,” “will,” “expect,” “anticipate,” “estimate,” “potential,” “could” and similar words, although some forward-looking statements are expressed differently. Youshould be aware that the Company’sactual results could differ materially from those contained in the forward-looking statements due to a number of factors, including: burdens imposed by federal and state regulation, changes in accounting regulationregulations or standards of banks; credit risk; exposure to general and local economic conditions; risks associated with rapid increase or decrease in prevailing interest rates; consolidation within the banking industry; competition from banks and other financial institutions; our ability to attract and retain relationship officers and other key personnel; andor technological developments; and other risks discussed in more detail in Item 1A: “Risk Factors”, all of which could cause the Company’s actual results to differ from those set forth in the forward-looking statements.
Enterprise Financial Services Corp (“we” or “the Company” or “EFSC”), a Delaware corporation, is a financial holding company headquartered in St. Louis, Missouri. The Company provides a full range of banking and wealth management services to individuals and business customers located in the St. Louis, and Kansas City and Phoenix metropolitan markets through its banking subsidiary, Enterprise Bank & Trust (“Enterprise” or “the Bank”). Our executive offices are located at 150 North Meramec, Clayton, Missouri 63105 and our telephone number is (314) 725-5500.also operatesentered into a loan production officeloss sharing agreement with the Federal Deposit Insurance Corporation (“FDIC”) and acquired certain assets and assumed certain liabilities of Valley Capital Bank, a full service community bank that was headquartered in Phoenix,Mesa, Arizona. Under the terms of the agreement, we acquired tangible assets with an estimated fair value of approximately $42.4 million and assumed liabilities with an estimated fair value of approximately $43.4 million. Under the loss sharing agreement, Enterprise will share in the losses on assets covered under the agreement (”Covered Assets”). The Company celebratedFDIC has agreed to reimburse Enterprise for 80 percent of the losses on Covered Assets up to $11,000,000 and 95 percent of the losses on Covered Assets exceeding $11,000,000. Reimbursement for losses on single family one-to-four residential mortgage loans are made quarterly until December 31, 2019 and reimbursement for losses on non-single family one-to-four residential mortgage loans are made quarterly until December 31, 2014. The reimbursable losses from the FDIC are based on the book value of the acquired loans and foreclosed assets as determined by the FDIC as of the date of the acquisition, December 11, 2009.years in business in 2008. Our Trust division will celebrate 10 years in business in 2009.In addition, the Company owns2010, we sold our life insurance subsidiary, Millennium Brokerage Group, LLC (“Millennium”)., for $4.0 million in cash. Enterprise acquired 60% of Millennium in October 2005 and acquired the remaining 40% in December 2007. As a result of the sale, Millennium is headquarteredreported as a discontinued operation for all periods presented herein.Nashville, Tennesseea private placement offering. We intend to use the net proceeds of the offering for general corporate purposes, which may include, without limitation, providing capital to support the growth of our subsidiaries and operates life insurance advisoryother strategic business opportunities in our market areas, including FDIC-assisted transactions. We may also seek the approval of our regulators to utilize the proceeds of this offering and brokerage operations from 13 offices serving life agents, banks, CPA firms, propertyother cash available to us to repurchase all or a portion of the securities that we issued to the United States Department of the Treasury (the “U.S. Treasury”).casualty groups,sold to the Treasury for an aggregate purchase price of $35.0 million in cash (i) 35,000 shares of its Fixed Rate Cumulative Perpetual Preferred Stock, Series A, par value $.01 per share, having a liquidation preference of $1,000 per share (the “Series A Preferred Stock”), and financial advisors in 49 states.On July 31, 2008, we sold(ii) a ten-year warrant to purchase up to 324,074 shares of common stock, par value $.01 per share, of EFSC, at an initial exercise price of $16.20 per share, subject to certain anti-dilution and other adjustments (the “Warrant”).
Our website is www.enterprisebank.com. Various reports provided to the SEC including our remaining interests in Great American Bank (“Great American”). See Item 8, Note 2 – Acquisitionsannual reports, quarterly reports, current reports and Divestitures for more information.
Our stated mission is “to guide our clients to a lifetime of financial success.” We have established an accompanying corporate vision “to build an exceptional company that clients value, shareholders prize and where our associates flourish.” These tenets are fundamental to our business strategies and operations.We are highly focused on serving the needsprofessionals. This is achieved through full product offerings in two primary segments: commercial banking and wealth management.Through Enterprise, oursuccess-minded individuals.Millennium.Missouri state tax credit brokerage activities. Enterprise Trust, a division of Enterprise (“Enterprise Trust” or “Trust”) provides financial planning, advisory, investment management and trust services to our target markets. Business financial services are focused in the areas of retirement plans, management compensation and management succession planning. Personal advisory services include estate planning, financial planning, business succession planning and retirement planning services.1Additional information on our operating segments can be found on Pages 19State tax credit brokerage activities consist of the acquisition of Missouri state tax credit assets and 84.Our executive offices are located at 150 North Meramec, Clayton, Missouri 63105 and our telephone number is (314) 725-5500.Available InformationThe Company’s website is www.enterprisebank.com. Various reports providedsale of these tax credits to the Securities and Exchange Commission (“SEC”), including our annual reports, quarterly reports, current reports and proxy statements are available free of charge on our website. These reports are made available as soon as reasonably practicable after they are filed with or furnished to the SEC. Our filings with the SEC are also available on the SEC’s website at http://www.sec.gov.Business StrategyOur general business strategy is to generate superior shareholder returns by providing comprehensive financial services through banking and wealth management lines of business primarily to private businesses, their owner families and other success-minded individuals.thisour strategy include a focused and relationship-oriented distribution and sales approach, emphasis on growing wealth management revenues, aggressive credit and interest rate risk management, advanced technology and tightly managed expense growth.grow in tandem with our increasing capacity to fund client loan needs.grow. Our banking officers are typically highly experienced. As a result of our long-term relationship orientation, we are able to fund loan growth primarily with core deposits from our business and professional clients. This is supplemented by borrowing from the Federal Home Loan Bank of Des Moines (the “FHLB”), the Federal Reserve, and by issuing brokered certificates of deposits, priced at or below alternative cost of funds.Millennium provides additional financial advisory capabilities, insurance product access and market reach that supplement our trust services. This subsidiary has also expanded our fee income sources.Creditcredit administration monitor our asset quality through regular reviews of loans. In addition, the Bank’s loan portfolios for each bank areportfolio is subject to ongoing monitoring by a loan review function that reports directly to the audit committee of our board of directors.2
Enterprise operates in the St. Louis, Kansas City and Phoenix metropolitan areas. Through Millennium, subject to applicable regulatory restrictions, the Company also provides services in markets across the United States.
The Company has four Enterprise banking facilities in the St. Louis metropolitan area. The St. Louis region enjoys a stable, diverse economic base and is ranked the 19th largest metropolitan statistical area in the United States. It is an attractive market for us with nearly 70,000 privately held businesses and over 61,00050,000 households with investible assets of $1.0 million or more. We are the largest publicly-held, locally headquartered bank in this market.Acquisitions in 2006 and 2007 increased the Company’s assets in the market to more than $700.0 million, making us one of the fastest growing banks in the Kansas City market.
At December 31, 2008,2009, the Company had seven banking facilities in the Kansas City Market. Kansas City is also an attractive private company market with over 50,000 privately held businesses and over 42,00035,000 households with investible assets of $1.0 million or more. To more efficiently deploy our resources, during 2007, the Company established a plan to streamline our Kansas City branch network. Onon February 28, 2008, we sold the Enterprise branch in Liberty, Missouri and on July 31, 2008, we sold the Kansas state bank charter of Great American along with the DeSoto, Kansas branch. See Item 8, Note 23 – Acquisitions and Divestitures for more information.In 2007, the Company announced its intent to expand to
On December 11, 2009, Enterprise acquired certain assets and assumed certain liabilities of Valley Capital Bank in Mesa, Arizona and subsequently applied forin an FDIC-assisted transaction. The single location opened on December 14, 2009 as an Enterprise branch. After receiving regulatory approval, Enterprise opened a new Arizona bank charter in 2008. Banking regulators have curtailed new charter approvals as a result of conditionsbranch in the Arizona real estate market. However, the Enterprise loan production office located inwestern suburbs of Phoenix continues to growon February 16, 2010. See Note 3 – Acquisitions and build a client base. Divestitures for more information.81,00072,000 households with investible assets over $1.0 million each.
The Company and its subsidiaries operate in highly competitive markets. Our geographic markets are served by a number of large multi-bank holding companies with substantial capital resources and lending capacity. Many of the larger banks have established specialized units, which target private businesses and high net worth individuals. Also, the St. Louis, Kansas City and Phoenix markets have experienced an increase in de novonumerous small community banks. In addition to other financial holding companies and commercial banks, we compete with credit unions, thrifts, investment managers, brokerage firms, and other providers of financial services and products.GeneralWe are subject to state and federal banking laws and regulations which govern virtually all aspects of operations. These laws and regulations are intended to protect depositors, and to a lesser extent, shareholders. The numerous regulations and policies promulgated by the regulatory authorities create a difficult and ever-changing atmosphere in which to operate. The Company commits substantial resources in order to comply with these statutes, regulations and policies.
The Company is a financial holding company registered under the Bank Holding Company Act of 1956, as amended (“BHCA”). As a financial holding company, the Company is subject to regulation and examination by the Federal Reserve Board, and is required to file periodic reports of its operations and such additional information as the Federal Reserve may require. In order to remain a financial holding company, the Company must continue to be considered well managed and well capitalized by the Federal Reserve and have at least a “satisfactory” rating under the Community Reinvestment Act. See “Liquidity and Capital Resources” in the Management Discussion and Analysis for more information on our capital adequacy and “Bank Subsidiary – Community Reinvestment Act” below for more information on Community Reinvestment.anybank,any bank, (ii) acquiring direct or indirect ownership or control of any voting shares of any bank if, after such acquisition, it would own or control more than 5% of the voting shares of such bank (unless it already owns or controls the majority of such shares), or (iii) merging or consolidating with another bank holding company. The BHCA also prohibits a financial holding company generally from engaging directly or indirectly in activities other than those involving banking, activities closely related to banking that are permitted for a bank holding company, securities, insurance or merchant banking. Federal legislation permits bank holding companies to acquire control of banks throughout the United States.3Emergency Economic Stabilization Act of 2008:In response to recent unprecedented market turmoil, the Emergency Economic Stabilization Act (“EESA”) was enacted on October 3, 2008. EESA authorizes the SecretaryUnited States Department of the Treasury (the “Secretary”) to purchase up to $700 billion in troubled assets from financial institutions underCapital Purchase Program: On December 19, 2008, the Troubled Asset Relief Program (“TARP”.) Troubled assets include residential or commercial mortgages and related instruments originated prior to March 14, 2008 and any other financial instrument that the Secretary determines, after consultation with the ChairmanCompany received an investment of the Board of Governors of the Federal Reserve System, the purchase of which is necessary to promote financial stability. If the Secretary exercises his authority under TARP, EESA directs the Secretary to establish a program to guarantee troubled assets originated or issued prior to March 14, 2008. The Secretary is authorized to purchase up to $250.0 billion in troubled assets immediately and up to $350.0 billion upon certification by the President that such authority is needed. The Secretary’s authority will be increased to $700.0 billion if the President submits a written report to Congress detailing the Secretary’s plans to use such authority unless Congress passes a joint resolution disapproving such amount within 15 days after receipt of the report. The Secretary’s authority under TARP expires on December 31, 2009 unless the Secretary certifies to Congress that extension is necessary provided that his authority may not be extended beyond October 3, 2010.Institutions selling assets under TARP will be required to issue warrants for common or preferred stock or senior debt to the Secretary. If the Secretary purchases troubled assets directly from an institution without a bidding process and acquires a meaningful equity or debt position in the institution as a result or acquires more than $300.0approximately $35.0 million in troubled assets from an institution regardless of method, the institution will be required to meet certain standards for executive compensation and corporate governance. See Item 11 – Executive Compensation.EESA increases the maximum deposit insurance amount up to $250,000 until December 31, 2009 and removes the statutory limits on the FDIC’s ability to borrow from the Treasury during this period. The FDIC may not take the temporary increase in deposit insurance coverage into account when setting assessments. EESA allows financial institutions to treat any loss on the preferred stock of the Federal National Mortgage Association or Federal Home Loan Mortgage Corporation as an ordinary loss for tax purposes.Pursuant to his authority under EESA, the Secretary created the TARP Capital Purchase Program under which the Treasury Department will invest up to $250 billion in senior preferred stock of U.S. banks and savings associations or their holding companies.The Company applied to receive an investment by the Treasury under the Capital Purchase Program and our application was approved in November 2008. On December 19, 2008,. In exchange for the investment, the Company entered into a Letter Agreement and Securities Purchase Agreement (collectively,issued to the “Purchase Agreement”) with the United States Department of theU.S. Treasury (“Treasury”) under the TARP Capital Purchase Program, pursuant to which the Company sold (i) 35,000 shares of EFSC Fixed Rate Cumulative Perpetual Preferred Stock, Series A (the “Series A Preferred Stock”) and (ii) a warrant (the “Warrant”) to purchase 324,074 shares of EFSC common stock, par value $0.01 per share (the “Common Stock”), for an aggregate investment by the Treasury at a price of $35.0 million.will qualifyqualifies as Tier 1 capital and will paypays cumulative dividends at a rate of 5% per annum for the first five years, and 9% per annum thereafter. The Series A Preferred Stock may be redeemed by EFSC after three years. Prior to the end of three years, the Series A Preferred Stock may be redeemed by EFSC only with proceeds from a qualifying sale of common stock of EFSC (a “Qualified Equity Offering”), although amendments to EESA enacted in February 2009 eliminate this restriction on the means of redeeming the Senior Preferred Stock.Purchase Agreement,purchase agreement with the U.S. Treasury, our ability to declare or pay dividends or distributions on, or purchase, redeem or otherwise acquire for consideration, shares of Junior Stock (as defined below)junior stock and Parity Stock (as defined below) will beparity stock is subject to restrictions, including a restriction against increasing dividends from the last quarterly cash dividend per share ($0.0525) declared on the Common Stockcommon stock prior to December 19, 2008. The redemption, purchase or other acquisition of trust preferred securities of EFSC or our affiliates willis also be restricted. These restrictions will terminate on the earlier of (a) the third anniversary of the date of issuance of the Series A Preferred Stock and (b) the date on which the Series A Preferred Stock has been redeemed in whole or U.S. Treasury has transferred all of the Series A Preferred Stock to third parties. The restrictions described in this paragraph are set forth in the Purchase Agreement.4Junior Stock and Parity Stock will beother classes of stock is subject to restrictions in the event that EFSC fails to declare and pay full dividends (or declare and set aside a sum sufficient for payment thereof) on its Series A Preferred Stock.“Junior Stock” meansCommon Stockamount and any other class or seriestype of EFSC stock, the terms of which expresslycompensation that we can pay our employees and are required to provide that it ranks juniormonthly reports to the Series A Preferred Stock as to dividend rights and/or rights on liquidation, dissolution or winding up of EFSC. “Parity Stock” means any class or series of EFSC stock,U.S. Treasury regarding our lending activity during the terms of which do not expressly providetime that such class or series will rank senior or junior to the Series A Preferred Stock as to dividend rights and/or rights on liquidation, dissolution or winding up of EFSC (in each case without regard to whether dividends accrue cumulatively or non-cumulatively.)The Warrant has a 10-year term and is immediately exercisable upon its issuance, with an exercise price, subject to anti-dilution adjustments, equal to $16.20 per share of the Common Stock.U.S. Treasury has agreed not to exercise voting power with respect to anyowns shares of Common Stock issued upon exercise of the Warrant.The Series A Preferred Stock and the Warrant were issued in a private placement exempt from registration pursuant to Section 4(2) of the Securities Act of 1933, as amended. Upon the request of Treasury at any time, EFSC has agreed to promptly enter into a deposit arrangement whereby the Series A Preferred Stock may be deposited and depositary shares (“Depositary Shares”), representing fractional shares of Series A Preferred Stock, may be issued. EFSC agreed to register the Series A Preferred Stock, the Warrant, the shares of Common Stock underlying the Warrant (the “Warrant Shares”) and Depositary Shares, if any, as soon as practicable after the date of the issuance of the Series A Preferred Stock and the Warrant. These shares were registered with the SEC on Form S-3 on January 16, 2009. Neither the Series A Preferred Stock nor the Warrant will be subject to any contractual restrictions on transfer, except that Treasury may only transfer or exercise an aggregate of one-half of the Warrant Shares priorStock.earlier of the redemption of 100% of the shares of Series A Preferred Stock and December 31, 2009.The Purchase Agreement also subjects EFSC to certain of the executive compensation limitations included in the EESA. As a result, as a condition to the closing of the transaction, each of Messrs. Peter F. Benoist, Frank H. Sanfilippo, Stephen P. Marsh and John G. Barry and Ms. Linda M. Hanson, EFSC’s Executive Officers (as defined in the Purchase Agreement) (the “Senior Executive Officers”), (i) executed a waiver (the “Waiver”) voluntarily waiving any claim against the Treasury or EFSC for any changes to such Senior Executive Officer’s compensation or benefits that are required to comply with the regulation issuedrestrictions imposed by the Treasury under the TARP Capital Purchase Program as published in the Federal RegisterCPP on October 20, 2008 and acknowledging that the regulation may require modification of the compensation, bonus, incentive and other benefit plans, arrangements and policies and agreements (including so-called “golden parachute” agreements) (collectively, “Benefit Plans”) as they relate to the period the Treasury holds any equity or debt securities of EFSC acquired through the TARP Capital Purchase Program; and (ii) entered into a letter agreement (the “Letter Agreement”) with EFSC amending the Benefit Plans with respect to such Senior Executive Officer as may be necessary, during the period that the Treasury owns any debt or equity securities of EFSC acquired pursuant to the Purchase Agreement or the Warrant, as necessary to comply with Section 111(b) of the EESA.The American Recovery and Reinvestment Act of 2009 significantly amended Section 111(b) of the EESA and imposed more severe restrictions on the executive compensation while loosening the requirements to redeem the Series A Preferred Stock including a complete prohibition on any severance or other compensation upon termination of employment, significant caps on bonuses, retention payments and executive compensation and a “clawback” requirement requiring the return of any bonus or incentive compensation based on earnings or other financial data that later turn out to be misstated. See Item 11 – Executive Compensation. These executive compensation restrictions may affect our ability to attractpay dividends to holders of our common stock, under Federal Reserve Board policies, bank holding companies may pay cash dividends on common stock only out of income available over the past year and retain key executives.The foregoing descriptiononly if prospective earnings retention is consistent with the organization’s expected future needs and financial condition and if the organization is not in danger of not meeting its minimum regulatory capital requirements. Federal Reserve Board policy also provides that bank holding companies should not maintain a level of cash dividends that undermines the TARP, the Capital Purchase Program and securities covered thereby is qualified inbank holding company’s ability to serve as a source of strength to its entirety by reference to the Letter Agreement – Standard Terms executed and delivered by the Company to the Secretary and the Warrant to Purchase Common Stock, both of which were executed and delivered by the Company and delivered to the Secretary at the closing of the Company’s issuance of Series A Preferred Stock to the Treasury.banking subsidiaries.
At December 31, 2008, we had one wholly owned2009, Enterprise was our only bank subsidiary. Enterprise is a Missouri trust company with banking powers and is subject to supervision and regulation by the Missouri Division of Finance. In addition, as a Federal Reserve non-member bank, it is subject to supervision and regulation by the FDIC. Enterprise is a member of the FHLB of Des Moines.5On October 26, 2001, President Bush signed into law theThe Uniting and Strengthening America by Providing Appropriate Tools Required to Intercept and Obstruct Terrorism Act of 2001 (the "USA PATRIOT Act"). Among its other provisions, the USA PATRIOT Act requires each financial institution to: (i) establish an anti-money laundering program; (ii) establish due diligence policies, procedures and controls with respect to its private banking accounts and correspondent banking accounts involving foreign individuals and certain foreign banks; and (iii) implement certain due diligence policies, procedures and controls with regard to correspondent accounts in the United States for, or on behalf of, a foreign bank that does not have a physical presence in any country. In addition, the USA PATRIOT Act contains a provision encouraging cooperation among financial institutions, regulatory authorities and law enforcement authorities with respect to individuals, entities and organizations engaged in, or reasonably suspected of engaging in, terrorist acts or money laundering activities.Temporary Liquidity Guarantee Program:Pursuant to the Emergency Economic Stabilization Act of 2008, the maximum deposit insurance amount has been increased from $100,000 to $250,000 until December 31, 2009. On October 13, 2008, the FDIC established a Temporary Liquidity Guarantee Program (“TLGP”) under which the FDIC will fully guarantee all non-interest-bearing transaction accounts and all senior unsecured debt of insured depository institutions or their qualified holding companies issued between October 14, 2008 and June 30, 2009. Senior unsecured debt would include federal funds purchased and certificates of deposit outstanding to the credit of the bank. All eligible institutions participated in the program without cost for the first 30 days of the program. After December 5, 2008, institutions will be assessed at the rate of 10 basis points for transaction account balances in excess of $250,000 and at the rate of 75 basis points of the amount of debt issued. Institutions were required to opt out of the Temporary Liquidity Guarantee Program by December 5, 2008 if they did not wish to participate. The Company and Enterprise opted into the TLGP.6 (the “Reform Act”), the FDIC adopted a new risk-based deposit insurance premium system that provides for quarterly assessments. Beginning in 2007, institutions were grouped into one of four categories based on their FDIC ratings and capital ratios. Each institution is assessed for deposit insurance at an annual rate of between 5 and 43 basis points with the assessment rate to be determined according to a formula based on a weighted average of the institution’s individual FDIC component ratings plus either five financial ratios or the average ratings of its long-term debt.has proposed to raiseraised the base annual assessment rate for all institutions by 7in 2009. As a result of this increase, institutions pay an assessment of between 12 and 77.5 basis points fordepending on the first quarterinstitution’s risk classification. Under the new assessment structure, Enterprise’s average annual assessment during 2009 was 15.43 basis points (excluding the special assessment described below). An institution’s risk classification is assigned based on its capital levels and the level of 2009. Assessmentsupervisory concern the institution poses to the regulators. Institutions assigned to higher-risk classifications pay assessments at higher rates for first quarter of 2009 would range from 12 to 50 basis points. For the second quarter of 2009, the proposed initial base assessment rates would range between 10 and 45 basis points. Anthan institutions that pose a lower risk. Each institution’s assessment rate can beis further adjusted up or down as a result of additional proposed risk adjustments based on the following: long-term debt ratings, weighted average FDIC component ratings, various financial ratios, the institution’s reliance on brokered deposits and/or other secured liabilities and the amount of unsecured debt.During 2008, Enterprise had a weighted average assessment rate of 5.9 basis points. Total payments to the FDIC were $1.2 million in 2008. Based on an analysis of the proposed rates, underlying adjustments and our planned deposit base, we expect our FDIC insurance premiums to increase by approximately $1.0 million in 2009.of 20 basis points,equal to $995,000 which will be collectedwas paid in the third quarter of 2009. We are awaitingIn addition, on November 12, 2009, the FDIC adopted a final rulingrule imposing a 13-quarter prepayment of FDIC premiums. As a result, Enterprise prepaid $11.5 million in December 2009. The prepayment will be expensed over the assessment calculation, but our initial expectation is that the one-time assessment could increase our 2009 FDIC insurance premiums by as much as an additional $3.5 million. It is possible this amount may be reduced pending the final FDIC ruling.MillenniumMillennium and the investment management industry in general are subject to extensive regulation in the United States at both the federal and state level, as well as by self-regulatory organizations such as the National Association of Securities Dealers, Inc. ("NASD"). The SEC is the federal agency that is primarily responsible for the regulation of investment advisers. Millennium is licensed to sell insurance, including variable insurance policies, in various states and is subject to regulation by the NASD. This regulation includes supervisory and organizational procedures intended to assure compliance with securities laws, including qualification and licensing of supervisory and sales personnel and rules designed to promote high standards of commercial integrity and fair and equitable principles of trade.
At December 31, 20082009, we had approximately 348308 full-time equivalent employees. None of the Company’s employees are covered by a collective bargaining agreement. Management believes that its relationship with its employees is good. Described below are certain risks and uncertainties that management has identified as material. Before making an investment decision, you should carefully consider the risks and uncertainties described below together with all of the other information included or incorporated by reference in this report. The risks and uncertainties described below are not the only ones we face. Although we have significant risk management policies, procedures and verification processes in place, additional risks and uncertainties that management is not aware of or focused on or that management currently deems immaterial may also materially and adversely impair our business operations.If any of the following risks actually occur, our financial condition and results of operations could be materially and adversely affected. If this were to happen, the The value of our common shares could decline perhaps significantly,due to any of these risks, and you could lose all or part of your investment.7The financial markets in the United States and elsewhere have been experiencing extreme and unprecedented volatility and disruption. We are exposed to significant financial and capital markets risk, including changes in interest rates, credit spreads and equity prices, which may have a material adverse effect on our results of operations, financial condition and liquidity.Our earnings and cash flows are largely dependent upon our net interest income. Net interest income is the difference between interest income earned on interest-earning assets such as loans and securities and interest expense paid on interest-bearing liabilities such as deposits and borrowed funds. Interest rates are highly sensitive to many factors that are beyond our control, including general economic conditions, the competitive environment within our markets, consumer preferences for specific loan and deposit products and policies of various governmental and regulatory agencies and, in particular, the Federal Reserve Board. Changes in monetary policy, including changes in interest rates, influence not only the amount of interest we receive on loans and securities and the amount of interest we pay on deposits and borrowings, but such changes also affect our ability to originate loans and obtain deposits as well as the fair value of our financial assets and liabilities. If the interest we pay on deposits and other borrowings increases at a faster rate than the interest we receive on loans and other investments, our net interest income, and therefore earnings, will be adversely affected. Earnings could also be adversely affected if the interest we receive on loans and other investments falls more quickly than the interest we pay on deposits and other borrowings. Management uses simulation analysis to produce an estimate of interest rate exposure based on assumptions and judgments related to balance sheet growth, customer behavior, new products, new business volume, pricing and anticipated hedging activities. Simulation analysis involves a high degree of subjectivity and requires estimates of future risks and trends. Accordingly, there can be no assurance that actual results will not differ from those derived in simulation analysis due to the timing, magnitude and frequency of interest rate changes, changes in balance sheet composition, and the possible effects of unanticipated or unknown events.Since July 2007, credit markets have experienced difficult conditions, extraordinary volatility and rapidly widening credit spreads and, therefore, have provided significantly reduced availability of liquidity for many borrowers. Uncertainties in these markets present significant challenges, particularly for the financial services industry. Disruptions in the financial markets caused widening credit spreads resulting in markdowns and/or losses by financial institutions from trading, hedging and other market activities. We obtain most of our funding from core deposit relationships with our clients and invest those funds in loans to our clients or government-backed agency securities. Our investment portfolio contains no mortgage-backed securities invested in subprime or alt-A mortgages.Our activities in the national credit markets are limited to funding vehicles such as brokered certificates of deposit and subordinated debentures. We have seen the cost of brokered deposits decline slower than other money market rates due to demand by financial institutions, and the cost and availability of subordinated debentures has been severely and negatively impacted by this adverse environment. It is difficult to predict how long these economic conditions will exist, and which of our markets, products or other businesses will ultimately be affected. In addition, further reductions in market liquidity may make it difficult to value certain of our securities if trading becomes less frequent. As such, valuations may include assumptions or estimates that may be more susceptible to significant period to period changes which could have a material adverse effect on our consolidated results of operations or financial condition.One important exposure to equity risk relates to the potential for lower earnings associated with our Wealth Management business, where fee income is earned based upon the fair value of the assets under management. During 2008, the significant declines in equity markets have negatively impacted assets under management. As a result, fee income earned from those assets has also decreased.If significant, further declines in equity prices, changes in U.S. interest rates and changes in credit spreads individually or in combination, could continue to have a material adverse effect on our consolidated results of operations, financial condition and liquidity both directly and indirectly by creating competition and other pressures such as employee retention issues.Liquidity risk could impair our ability to fund operations and jeopardize our financial condition.Liquidity is essential to our business. An inability to raise funds through deposits, borrowings, the sale of loans and other sources could have a substantial negative effect on our liquidity. Our access to funding sources in amounts adequate to finance our activities or on terms which are acceptable to us could be impaired by factors that affect us specifically or the financial services industry or economy in general. Factors that could detrimentally impact our access to liquidity sources include a decrease in the level of our business activity as a result of a downturn in the markets in which our loans are concentrated or adverse regulatory action against us. Our ability to borrow could also be impaired by factors that are not specific to us, such as a disruption in the financial markets or negative views and expectations about the prospects for the financial services industry in light of the recent turmoil faced by banking organizations and the continued deterioration in credit markets.8The Company depends on payments from Enterprise, including dividends and payments under service agreements and tax sharing agreements, for substantially all of the Company’s revenue. Federal and state regulations limit the amount of dividends and the amount of payments that Enterprise may make to the Company under service and tax sharing agreements. See “Supervision and Regulation”. In the event Enterprise becomes unable to pay dividends to the Company or make payments under the service agreements or tax sharing agreements the Company may not be able to service our debt, pay our other obligations or pay dividends on the Series A Preferred Stock or our common stock. Accordingly, our inability to receive dividends or other payments from the Bank could also have a material adverse effect on our business, financial condition and results of operations and the value of investments in the Series A Preferred Stock or our common stock.At December 31, 2008, the Company had $0 outstanding on its $16.0 million line of credit. While the line of credit does not expire until April 2009, we do not have any current availability under the line due to our noncompliance with a certain covenant regarding classified loans as a percentage of bank equity and loan loss reserves. We may be unable to arrange for a holding company line of credit in 2009 given the uncertainties around bank industry performance. However, we believe our current level of cash at the holding company will be sufficient to meet all projected cash needs in 2009.We believe the level of liquid assets at Enterprise is sufficient to meet current and anticipated funding needs. In addition to amounts currently borrowed, at December 31, 2008, Enterprise could borrow an additional $164.3 million available from the FHLB of Des Moines under blanket loan pledges and an additional $310.5 million available from the Federal Reserve Bank under pledged loan agreements. Enterprise also has access to over $70.0 million in overnight federal funds lines from various correspondent banks. See “Liquidity and Capital Resources” for more information.We are subject to credit and collateral risk.There are inherent risks associated with our lending activities. These risks include, among other things, the impact of changes in interest rates and changes in the economic conditions in the markets where we operate. Increases in interest rates and/or weakening economic conditions could adversely impact the ability of borrowers to repay outstanding loans or the value of the collateral securing these loans. The real estate downturn in our geographic markets has hurt our business because a majority of our loans are secured by real estate. If real estate prices continue to decline, the value of real estate collateral securing our loans will be reduced. Our ability to recover on defaulted loans by foreclosing and selling real estate collateral will be further diminished and we would likely suffer losses on defaulted loans. Substantially all of our real property collateral is located in Missouri and Kansas. Over the past nine months, real estate values, particularly residential real estate values, have deteriorated in our markets. As a result, our 2008 charge-offs were significantly higher than historical levels. During 2008, we incurred $12.7 million of net-charge-offs, or 0.70% of average loans compared to $2.0 million, or 0.14%, of average loans for 2007.
We maintain an allowance for loan losses, which is a reserve established through a provision for loan losses charged to expense, that represents management’s estimate of probable losses within the existing portfolio of loans. The allowance, in the judgment of management, is necessarysufficient to reserve for estimated loan losses and risks inherent in the loan portfolio. The level of the allowance reflects management’s continuing evaluation of industry concentrations; specific credit risks; loan loss experience; current loan portfolio quality; present economic, political and regulatory conditions; and unexpected losses inherent in the current loan portfolio. The determination of the appropriate level of the allowance for loan losses inherently involves a degree of subjectivity and requires that we make significant estimates of current credit risks and future trends, all of which may undergo material changes. TheCompany’s loan loss allowance increased induring the 2008 fiscal year and through 2009 due to changes in economic conditions affecting borrowers, new information regarding existing loans, and identification of additional problem loans. We continue to monitor the adequacy of our loan loss allowance and may need to increase it if factorseconomic conditions continue to deteriorate. In addition, bank regulatory agencies and our independent auditors periodically review our allowance for loan losses and may require an increase in the provision for loan losses or the recognition of further loan charge-offs, based on judgments that can differ somewhat from those of our own management. In addition, if charge-offs in future periods exceed the allowance for loan losses (i.e., if the loan allowance is inadequate), we will need additional loan loss provisions to increase the allowance for loan losses. Additional provisions to increase the allowance for loan losses, should they become necessary, would result in a decrease in net income or an increase in net loss and a reduction in capital, and may have a material adverse effect on our financial condition and results of operations.
Substantially all of our loans are to businesses and individuals in the St. Louis, Kansas City, and Phoenix metropolitan areas. The regional economic conditions in areas where we conduct our business have an impact on the demand for our products and services as well as the ability of our customers to repay loans, the value of the collateral securing loans and the stability of our deposit funding sources.
A significant portion of our portfolio is secured by real estate and thus we have a high degree of risk from a downturn in our real estate markets. If real estate values continue to decline further in our markets, the value of real estate collateral securing our loans could be significantly reduced. Our ability to recover on defaulted loans where the primary reliance for repayment is on the real estate collateral by foreclosing and selling that real estate would then be diminished and we would be more likely to suffer losses on defaulted loans.strong loan growth, an increasethis process, it takes approximately one year for us to foreclose on real estate collateral located in non-performingthe State of Kansas. Our ability to recover on defaulted loans in our Kansas market may be delayed and we would be more likely to suffer losses on defaulted loans in this market.
Liquidity is essential to our business. An inability to raise funds through deposits, borrowings, the sale of loans and other sources could have a substantial material adverse risk rating changes primarilyeffect on our liquidity. Our access to funding sources in amounts adequate to finance our activities could be impaired by factors that affect us specifically or the financial services industry in general. Factors that could detrimentally impact our access to liquidity sources include a decrease in the residential builderlevel of our business activity due to a market downtown, our failure to remain well capitalized, or adverse regulatory action against us. Our ability to acquire deposits or borrow could also be impaired by factors that are not specific to us, such as a severe disruption of the financial markets or negative views and expectations about the prospects for the financial services industry as a whole as the recent turmoil faced by banking organizations in the domestic and worldwide credit markets deteriorates.provisionholding company will be sufficient to meet all projected cash needs in 2010. See “Liquidity and Capital Resources” for more information.
A substantial portion of our income is derived from the differential or “spread” between the interest earned on loans, investment securities and other interest-earning assets, and the interest paid on deposits, borrowings and other interest-bearing liabilities. Because of the differences in the maturities and repricing characteristics of our interest-earning assets and interest-bearing liabilities, changes in interest rates do not produce equivalent changes in interest income earned on interest-earning assets and interest paid on interest-bearing liabilities. Significant fluctuations in market interest rates could materially and adversely affect not only our net interest spread, but also our asset quality and loan losses was $22.5 million for 2008 compared to $4.6 million for 2007.origination volume.9 to recognize an impairment of our goodwill or intangible assets or to establish a valuation allowance against the deferred income tax asset, which could have a material adverse effect on our results of operations and financial condition.Goodwill represents the excess of the amounts we paid to acquire subsidiaries and other businesses over the fair value of their net assets at the date of acquisition. We test goodwill at least annually for impairment. Impairment testing is performed based upon estimates of the fair value of the “reporting unit” to which the goodwill relates. The reporting unit is the operating segment or a business one level below that operating segment if discrete financial information is prepared and regularly reviewed by management at that level. The fair value of the reporting unit is impacted by the performance of the business and could be adversely impacted by any efforts made by the Company to limit risk. If it is determined that the goodwill or other long-term intangible asset has been impaired, the Company must write down the asset by the amount of the impairment, with a corresponding charge to net income. Such writedowns could have a material adverse effect on our results of operations and financial position. During 2008, we took an impairment charge of $9.2 million, pre-tax, with respect to our Millennium reporting unit. At December 31, 2008, the goodwill balance included in the consolidated balance sheet for the Millennium reporting unit was $3.1 million. It is possible that additional impairment at Millennium may occur in 2009.The Company’s 2008 analysis of goodwill at the Banking reporting unit indicated that no impairment existed at December 31, 2008. If current market conditions persist during 2009, in particular, if the EFSC common share price falls and consistently remains below book value per share, the Company may need to test for goodwill impairment at an interim date. Subsequent reviews of goodwill could result in additional impairment of goodwill during 2009.tax representstaxes represent the tax effect of the differences between the book and tax basis of assets and liabilities. Deferred tax assets are assessed periodically by management to determine if they are realizable. If based on available information, it is more likely than not that the deferred income tax asset will not be realized, then a valuation allowance must be established with a corresponding charge to net income. As of December 31, 2008,2009, the Company did not carry a valuation allowance against its deferred tax asset balance of $15.7$18.3 million. Future facts and circumstances may require a valuation allowance. Charges to establish a valuation allowance could have a material adverse effect on our results of operations and financial position.
Under federal and state laws and regulations pertaining to the safety and soundness of insured depository institutions, the Missouri Division of Finance and the Federal Reserve, and separately the FDIC as insurer of the Bank’s deposits, have authority to compel or restrict certain actions if the Bank’s capital should fall below adequate capital standards as a result of future operating losses, or if its bank regulators determine that it has insufficient capital. Among other matters, the corrective actions include but are not limited to requiring affirmative action to correct any conditions resulting from any violation or practice; directing an increase in capital and the maintenance of specific minimum capital ratios; restricting the Bank’s operations; limiting the rate of interest it may pay on brokered deposits; restricting the amount of distributions and dividends and payment of interest on its trust preferred securities; requiring the Bank to enter into informal or formal enforcement orders, including memoranda of understanding, written agreements and consent or cease and desist orders to take corrective action and enjoin unsafe and unsound practices; removing officers and directors and assessing civil monetary penalties; and taking possession and closing and liquidating the Bank. See “Supervision and Regulation”.
Our operations are subject to extensive regulations by federal, state and local governmental authorities. Banking regulations are primarily intended to protect depositors’ funds, federal deposit insurance funds and the banking system as a whole, not stockholders. We are now also subject to supervisions, regulation and investigation by the U.S. Treasury and the Office of the Special Inspector General for the Troubled Asset Relief Program (“TARP”) by virtue of our participation in the Capital Purchase Program. Changes to statutes, regulations or regulatory policies; changes in the interpretation or implementation of statutes, regulations or policies could subject us to additional costs, limit the types of financial services and products that we may offer and/or increase the ability of non-banks to offer competing financial services and products, among other things.
In 2009, the FDIC charged a “special assessment” equal to five basis point special assessment on each insured depository institution’s assets minus Tier 1 capital. Our special assessment amounted to $995,000 and was paid on September 30, 2009. The FDIC also raised our annual assessment rate by 9.11 basis points to an average of 15.43 basis points. It is possible that the FDIC may impose additional special assessments in the future or further increase our annual assessment, which could adversely affect our earnings.
Financial services institutions are interrelated as a result of trading, clearing, counterparty or other relationships. We have exposure to many different industriesinstitutions and counterparties, and routinely execute transactions with various counterparties in the financial services industry, including Federal Home Loanfederal home loan banks, commercial banks, brokers and dealers, investment banks and other institutional clients. Many of these transactions exposeRecent defaults by financial services institutions, and even rumors or questions about one or more financial services institutions or the financial services industry in general, have led to market wide liquidity problems and could lead to losses or defaults by us to credit risk in the event of a defaultor by a counterparty or client. In addition, our credit risk may be exacerbated when the collateral we hold cannot be realized upon or is liquidated at prices not sufficient to recover the full amount of the credit or derivative exposure due to us.other institutions. Any such losses could materially and adversely affect our results of operations.a material adverseengaged in and may continue to engage in further expansion through acquisitions, including FDIC-assisted transactions, which could negatively affect on our business and earnings.
Our earnings, financial condition, and resultsprospects after a merger or acquisition depend in part on our ability to successfully integrate the operations of operations.Our profitability depends significantly on economic conditionsthe acquired company. We may be unable to integrate operations successfully or to achieve expected cost savings. Any cost savings which are realized may be offset by losses in revenues or other charges to earnings.geographic regions in which we operate.The regional economic conditions in areas where we conduct our business have an impact on the demand for our productspayment of a premium over book value, and, services as well as the abilitytherefore, some dilution of our customerstangible book value per common share may occur in connection with any future transaction. Furthermore, failure to repay loans,realize the value of the collateral securing loans and the stability of our deposit funding sources. A significant declineexpected revenue increases, cost savings, increases in general economic conditions caused by inflation, recession, an act of terrorism, outbreak of hostilities geographic or product presence, and/or other international or domestic occurrences, unemployment, changes in securities markets or other factors, such as severe declines in the value of homes and other real estate,projected benefits from an acquisition could also impact these regional economies and, in turn, have a material adverse effect on our financial condition and results of operations.
We face substantial competition in all areas of our operations from a variety of different competitors, many of which are larger and may have more financial resources. Such competitors primarily include national and super-regional banks as well as smaller community banks within the markets in which we operate. However, we also face competition from many other types of financial institutions, including, without limitation, credit unions, mortgage banking companies, mutual funds, insurance companies, investment management firms, and other local, regional and national financial services firms. The financial services industry could become even more competitive as a result of legislative, regulatory and technological changes and continued consolidation. Also, technology has lowered barriers to entry and made it possible for non-banks to offer products and services traditionally provided by banks.10Our ability to compete successfully depends on a numberfactors, including, among other things:ability to develop and execute strategic plans and initiatives;our ability to develop, maintain and build upon long-term client relationships based on quality service, high ethical standards and safe, sound assets;our ability to expand our market position;the scope, relevance and pricing of products and services offered to meet client needs and demands;the rate at which we introduce new products and services relative to our competitors; andindustry and general economic trends.Failure to perform in any of these areas could significantly weaken our competitive position, whichkey employees could adversely affect our growth and profitability, which, in turn, could have a material adverse effect on our financial condition and results of operations.We are subject to extensive government regulation and supervision.business.Banking regulations are primarily intended to protect depositors’ funds, federal deposit insurance funds and the banking system as a whole, not shareholders. These regulations affect our lending practices, capital structure, investment practices, dividend policy and growth, among other things. Congress and federal regulatory agencies continually review banking laws, regulations and policies for possible changes. Changes to statutes, regulations or regulatory policies; changes in the interpretation or implementation of statutes, regulations or policies; and/or continuing to become subject to heightened regulatory practices, requirements or expectations, could affect us in substantial and unpredictable ways. Such changes could subject us to additional costs, limit the types of financial services and products that we may offer and/or increase the ability of non-banks to offer competing financial services and products, among other things. Failure to appropriately comply with laws, regulations or policies (including internal policies and procedures designed to prevent such violations) could result in sanctions by regulatory agencies, civil money penalties and/or reputation damage, which could have a material adverse effect on our business, financial condition and results of operations.Our controls and procedures may fail or be circumvented.Management regularly reviews and updates our internal controls, disclosure controls and procedures, and corporate governance policies and procedures. Any system of controls, however well designed and operated, is based in part on certain assumptions and can provide only reasonable, not absolute, assurances that the objectives of the system are met. Any failure or circumvention of our controls and procedures or failure to comply with regulations related to controls and procedures could have a material adverse effect on our business, results of operations and financial condition.Recent and possible acquisitions may disrupt our business and dilute shareholder value.Acquiring other banks or businesses involves various risks commonly associated with acquisitions, including, among other things:potential exposure to unknown or contingent liabilities of the target company;exposure to potential asset quality issues of the target company;difficulty and expense of integrating the operations and personnel of the target company;potential disruption to our business;potential diversion of our management’s time and attention;the possible loss of key employees and customers of the target company;difficulty in estimating the value (including goodwill) of the target company; andpotential changes in banking or tax laws or regulations that may affect the target company.We periodically evaluate merger and acquisition opportunities and conduct due diligence activities related to possible transactions with other financial institutions and financial services companies. As a result, merger or acquisition discussions and, in some cases, negotiations may take place and future mergers or acquisitions involving cash, debt or equity securities may occur at any time. Acquisitions typically involve the payment of a premium over book and market values, and, therefore, some dilution of our tangible book value and net income per common share may occur in connection with any future transaction. Furthermore, failure to realize the expected revenue increases, cost savings, increases in geographic or product presence, and/or other projected benefits from an acquisition could have a material adverse effect on our financial condition and results of operations.11We may not be able to attract and retain skilled people.
Our success depends, in large part, on our ability to attract and retain key people. Competition for the best people in most activities in which we are engaged can be intense and we may not be able to hire or retain the people we want and/or need. Although we maintain employment agreements with certain key employees, and have incentive compensation plans aimed, in part, at long-term employee retention, the unexpected loss of services of one or more of our key personnel could still occur, and such events may have a material adverse impact on our business because of the loss of the employee’s skills, knowledge of our market, years of industry experiencebusiness relationships and the difficulty of promptly finding qualified replacement personnel.The restrictions onimposed by EESA and ARRA on all participantscorporate governance for the period during which the U.S. Treasury holds the equity issued pursuant to our participation in TARPthe CPP. These standards generally apply to our Chief Executive Officer, Chief Financial Officer and the three next most highly compensated senior executive officers, although certain restrictions apply to as many as twenty-five (25) of our most highly compensated employees. The restrictions severely limit the amount and types of compensation we can pay our executive officers and key employees, including a complete prohibition on any severance or other compensation upon termination of employment, significant caps on bonuses and retention payments and executive compensation and a “clawback” requirement requiring the return of any bonus or incentive compensation based on earnings or other financial data that later turn out to be misstated. Thesepayments. Such restrictions may affectimpede our ability to attract and retain key employees.
We may need to raise additional capital in the future in order to support any additional provisions for loan losses and loan charge-offs, to maintain our capital ratios or for a number of other reasons. The condition of the financial markets may be such that we may not be able to obtain additional capital or the additional capital may only be available on terms that are not attractive to us.
Management regularly reviews and updates our internal controls, disclosure controls and procedures, and corporate governance policies and procedures. Any system of controls, however well designed and operated, is based in part on certain assumptions and can provide only reasonable, not absolute, assurances that the objectives of the system are met. Any failure or circumvention of our controls and procedures or failure to comply with regulations related to controls and procedures could have a material adverse effect on our business, results of operations and financial condition.
We rely heavily on communications and information systems to conduct our business. Any failure, interruption or breach in security of these systems could result in failures or disruptions in our customer relationship management, general ledger, deposit, loan and other systems. While we have policies and procedures designed to prevent or limit the effect of the possible failure, interruption or security breach of our information systems, there can be no assurance that any such failure, interruption or security breach will not occur or, if they do occur, that they will be adequately addressed. The occurrence of any failure, interruption or security breach of our information systems could damage our reputation, result in a loss of customer business, subject us to additional regulatory scrutiny, or expose us to civil litigation and possible financial liability, any of which could have a material adverse effect on our financial condition and results of operations.ShareThe trading price volatility may make it more difficult for you to resell yourof our common stock when you wanthas fluctuated significantly and at prices you find attractive. Our share price can fluctuate significantlymay do so in response tothe future. These fluctuations may result from a varietynumber of factors, including, amongmany of which are outside of our control. The stock market and, in particular, the market for financial institution stocks, has experienced significant volatility recently. In addition, the trading volume in our common stock is lower than for many other things:actual or anticipated variations in quarterly resultspublicly traded companies. As a result of operations;recommendations by securities analysts;operating andthese factors, the market price of our common stock price performance of other companies that investors deem comparable to our business;
may be volatile.news reports relating to trends, concerns and other issues in the financial services industry;perceptions of us and/or our competitors in the marketplace;significant acquisitions or business combinations or capital commitments entered into by us or our competitors; orfailure to integrate acquisitions or realize anticipated benefits from acquisitions.General market fluctuations, market disruption, industry factors and general economic and political conditions and events, such as economic slowdowns or recessions, interest rate changes or credit loss trends, could also cause our share price to decrease regardless of operating results.sharesstock is not an insured deposit.OurAn investment in our common stock is not a savings account, deposit or other obligation of our bank depositsubsidiary, any non-bank subsidiary or any other bank, and therefore, isare not insured against loss by the FDIC, any other deposit insurance fund or by any other public or private entity. Investment in our common stock is inherently risky for the reasons described in this “Risk Factors” section and elsewhere in this report and is subject to the same market forces that affect the price of common stock in any company. As a result, if you acquire our common shares, you may lose some or all of your investment.
Enterprise Financial Services Corp depends on payments from the Bank, including dividends and payments under tax sharing agreements, for substantially all of its revenue. Federal and state regulations limit the amount of dividends and the amount of payments that the Bank may make to Enterprise Financial Services Corp under tax sharing agreements. In certain circumstances, the Missouri Division of Finance, FDIC or Federal Reserve could restrict or prohibit the Bank from distributing dividends or making other payments to us. In the event that the Bank was restricted from paying dividends to Enterprise Financial Services Corp or make payments under the tax sharing agreement, Enterprise Financial Services Corp may not be able to service its debt, pay its other obligations or pay dividends on our Series A Preferred Stock or pay dividends on its common stock. If we are unable or determine not to pay dividends on our common stock, the market price of the common stock could be materially adversely affected.
The terms of our Series A Preferred Stock provide that prior to the earlier of (i) December 19, 2011 and (ii) the date on which all of the shares of the Series A Preferred Stock have been redeemed by us or transferred by the U.S. Treasury to third parties, we may not, without the consent of the U.S. Treasury, (a) increase the cash dividend on our common stock above $0.0525 per share per quarter or (b) subject to limited exceptions, redeem, repurchase or otherwise acquire shares of our common stock or preferred stock other than shares of our Series A Preferred Stock. These restrictions could have a negative effect on the value of our common stock.
The dividends declared and the accretion of discount on our outstanding Series A Preferred Stock reduce the net income available to common stockholders and our earnings per common share. Our outstanding Series A Preferred Stock will also receive preferential treatment in the event of liquidation, dissolution or winding up of the Company.
In the event that we fail to pay dividends on the Series A Preferred Stock for an aggregate of six or more quarters (whether or not consecutive), the authorized number of directors then constituting our board of directors will be increased by two. Holders of the Series A Preferred Stock, together with the holders of any outstanding parity stock with like voting rights voting as a single class, will be entitled to elect the two additional directors at the next annual meeting (or at a special meeting called for the purpose of electing the preferred stock directors prior to the next annual meeting) and at each subsequent annual meeting until all accrued and unpaid dividends for all past dividend periods have been paid in full.
Except as otherwise required by law and in connection with the rights to elect directors as described above, holders of the Series A Preferred Stock have voting rights in certain circumstances. So long as shares of the Series A Preferred Stock are outstanding, in addition to any other vote or consent of shareholders required by law or our amended and restated charter, the vote or consent of holders owning at least 66 2/3% of the shares of Series A Preferred Stock outstanding is required for (1) any authorization or issuance of shares ranking senior to the Series A Preferred Stock; (2) any amendment to the rights of the Series A Preferred Stock so as to adversely affect the rights, preferences, privileges or voting power of the Series A Preferred Stock; or (3) consummation of any merger, share exchange or similar transaction unless the shares of Series A Preferred Stock remain outstanding, or if we are not the surviving entity in such transaction, are converted into or exchanged for preference securities of the surviving entity and the shares of Series A Preferred Stock remaining outstanding or such preference securities have such rights, preferences, privileges and voting power as are not materially less favorable to the holders than the rights, preferences, privileges and voting power of the shares of Series A Preferred Stock.
We are not restricted from issuing additional common stock or preferred stock, including any securities that are convertible into or exchangeable for, or that represent the right to receive, common stock or preferred stock or any substantially similar securities. EFSC’s board of directors has broad discretion regarding the type and price of such securities.authorizes(as amended and together with all certificates of designations) or by-laws. Shares of our common stock are not redeemable and have no subscription or conversion rights.issuanceownership interest of preferredholders of our common stock by our board of directors.Our Certificate of Incorporation authorizescould be diluted to the issuance ofextent the CPP Warrant is exercised for up to 5,000,000324,074 shares of our common stock. Although the U.S. Treasury has agreed not to vote any of the shares of common stock it receives upon exercise of the CPP Warrant, a transferee of any portion of the CPP Warrant or of any shares of common stock acquired upon exercise of the CPP Warrant is not bound by this restriction. In addition, to the extent options to purchase common stock under our employee stock option plans are exercised, holders of our common stock could incur additional dilution. Further, if we sell additional equity or convertible debt securities, such sales could result in increased dilution to our stockholders.stock with designations, powers, preferences, rights, qualificationssecurities to investors.
If we are unable to make payments on any of our subordinated debentures for more than twenty (20) consecutive quarters, we would be in default under the governing agreements for such securities and limitations determinedthe amounts due under such agreements would be immediately due and payable. Additionally, if for any interest payment period we do not pay interest in respect of the subordinated debentures (which will be used to make distributions on the trust preferred securities), or if for any interest payment period we do not pay interest in respect of the subordinated debentures, or if any other event of default occurs, then we generally will be prohibited from time to time by our Board of Directors. Accordingly, our Board of Directors is empowered, without stockholder approval, to issue preferred stock with dividend, liquidation, conversion, voting,declaring or paying any dividends or other rights, which could adversely affectdistributions, or redeeming, purchasing or acquiring, any of our capital securities, including the voting power or other rightscommon stock, during the next succeeding interest payment period applicable to any of the holders ofsubordinated debentures, or next succeeding interest payment period, as the case may be.issuance,our common stock could be materially adversely affected.
Provisions of Delaware law and of our certificate of incorporation, as amended, and bylaws as well as various provisions of federal and Missouri state law applicable to bank and bank holding companies could make it more difficult for a third party to acquire control of us or have the effect of discouraging a third party from attempting to acquire control of us. We are subject to Section 203 of the DGCL, which would make it more difficult for another party to acquire us without the approval of our board of directors. Additionally, our certificate of incorporation, as amended, authorizes our board of directors to issue preferred stock and preferred stock could be utilized, under certain circumstances,issued as a defensive measure in response to a takeover proposal. In the event of a proposed merger, tender offer or other attempt to gain control of the Company, our board of directors would have the ability to readily issue available shares of preferred stock as a method of discouraging, delaying or preventing a change in control of the Company. Such issuance could occur whether or not our stockholders favorably view the merger, tender offer or other attempt to gain control of the Company. These and other provisions could make it more difficult for a third party to acquire us even if an acquisition might be in the best interest of our stockholders. Although we have no present intention to issue any additional shares of its authorized preferred stock, there can be no assurance that the Company will not do so in the future.12
Our executive offices are located at 150 North Meramec, Clayton, Missouri, 63105. As of December 31, 2008,2009, we had four banking locations and a support center in the St. Louis metropolitan area, and seven banking locations in the Kansas City metropolitan area.area, one banking location in Mesa, Arizona and a loan production officer in central Phoenix. We own four of the facilities and lease the remainder. In March 2006, the Company purchased its operations center located in St. Louis County, Missouri. Most of the leases expire between 20092010 and 2017 and include one or more renewal options of 5 years. One lease expires in 2026. All the leases are classified as operating leases. We believe all our properties are in good condition.
In February 2008, we purchased approximately 11,000 square feet of commercial condominium space in Clayton Missouri located approximately two blocks from our executive offices. We relocated the St. Louis-based Trust Advisory operations to this location in the fourth quarter of 2008. Enterprise Trust also has offices in Kansas City. Expenses related to the space used by Enterprise Trust are allocated to the Wealth Management segment.As of December 31, 2008, Millennium had 13 locations in 9 states throughout the United States. The executive offices are located in Nashville, Tennessee. None of the locations are owned by Millennium. The leases are classified as operating leases and expire in various years through 2011.A Special Meeting of Shareholders was held on December 12, 2008. Proxies were solicited pursuant to Regulation 14A of the Securities Exchange Act of 1934. The shareholders were asked to approve an amendment to the Company’s Certificate of Incorporation to authorize the issuance of up to 5,000,000 shares of preferred stock. At the meeting, shareholders approved the amendment by a vote of 7,758,555 “for” the amendment, 1,264,544 “against” the amendment and 54,340 abstaining. Following the filing of the amendment to the Certificate of Incorporation, the Company’s Directors designated 35,000 shares of preferred stock for sale to the Treasury under the TARP program.13
ITEM 5: MARKET FOR COMMON STOCK AND RELATED STOCKHOLDER MATTERS AND
ISSUER PURCHASE OF EQUITY SECURITIES
The Company’s common stock trades on the NASDAQ Global Select Market under the symbol “EFSC”. Below are the dividends declared by quarter along with what the Company believes are the high and low closing sales prices for the common stock. There may have been other transactions at prices not known to the Company. As of March 2, 2009,1, 2010, the Company had 719662 common stock shareholders of record and a market price of $9.06$9.01 per share. The number of holders of record does not represent the actual number of beneficial owners of our common stock because securities dealers and others frequently hold shares in “street name” for the benefit of individual owners who have the right to vote shares. 2008 2007 4th Qtr 3rd Qtr 2nd Qtr 1st Qtr 4th Qtr 3rd Qtr 2nd Qtr 1st Qtr Closing Price $ 15.24 $ 22.56 $ 18.85 $ 25.00 $ 23.81 $ 24.34 $ 24.86 $ 28.00 High 22.49 23.04 25.25 25.00 25.70 26.81 28.15 31.36 Low 11.49 15.95 18.60 18.19 19.97 20.02 24.25 27.73 Cash dividends paid on common shares 0.0525 0.0525 0.0525 0.0525 0.0525 0.0525 0.0525 0.0525 142009 2008 4th Qtr 3rd Qtr 2nd Qtr 1st Qtr 4th Qtr 3rd Qtr 2nd Qtr 1st Qtr Closing Price $ 7.71 $ 9.25 $ 9.09 $ 9.76 $ 15.24 $ 22.56 $ 18.85 $ 25.00 High 9.25 12.24 11.46 14.81 22.49 23.04 25.25 25.00 Low 7.25 8.96 7.88 7.52 11.49 15.95 18.60 18.19 Cash dividends paid on common shares 0.0525 0.0525 0.0525 0.0525 0.0525 0.0525 0.0525 0.0525
The following table provides information as of December 31, 2008,2009, regarding securities issued and to be issued under our equity compensation plans that were in effect during the year ended December 31, 2008:2009: Number of securities remaining available for Number of securities to Weighted-average future issuance under be issued upon exercise exercise price of equity compensation plans of outstanding options, outstanding options, (excluding shares warrants and rights warrants and rights reflected in column (a) Plan Category (a) (b) (c) Equity compensation plans approved by the Company's shareholders 827,471 $17.03 965,869 Equity compensation plans not approved by the Company's shareholders -- -- -- Total 827,471(1) $17.03 965,869(2) Number of securities remaining available for Number of securities to Weighted-average future issuance under be issued upon exercise exercise price of equity compensation plans of outstanding options, outstanding options, (excluding shares warrants and rights warrants and rights reflected in column (a)) Plan Category (a) (b) (c) Equity compensation plans approved by the Company's shareholders 803,735 $16.77 915,063 Equity compensation plans not approved by the Company's shareholders -- -- -- Total 803,735 (1) $16.77 915,063 (2)
190,035185,535 shares of common stock to be issued upon exercise of outstanding stock options under the 1999 Stock Incentive Plan (Plan IV);
198,670196,670 shares of common stock to be issued upon exercise of outstanding stock options under the 2002 Stock Incentive Plan (Plan V);
407,176389,940 shares of common stock used as the base for grants of stock settled stock appreciation rights under the 2002 Stock Incentive Plan (Plan V);
28,800 shares of common stock available for issuance under the 1999 Stock Incentive Plan (Plan IV);856,723849,723 shares of common stock available for issuance under the 2002 Stock Incentive Plan (Plan V);
80,34665,340 shares of common stock available for issuance under the Non-management Director Stock Plan.
The holders of shares of common stock of the Company are entitled to receive dividends when declared by the Company’s Board of Directors out of funds legally available for the purpose of paying dividends. Holders of our Series A Preferred Stock originally issued to the United StatesU.S. Treasury on December 19, 2008, are entitled to cumulative dividends of 5% per annum. Dividends payable on the Series A Preferred Stock are currently payable at the rate of $1.8 million per annum. Dividends on the Series A Preferred Stock are prior to and in preference to any dividends payable on our common stock. Pursuant to the terms of the Purchase Agreementpurchase agreement with the U.S. Treasury under the TARP Capital Purchase Program, prior to December 19, 2011 our ability to declare or pay dividends on junior securities is subject to restrictions, including a restriction against increasing the dividend rate on our common stock from the last quarterly cash dividend per share ($0.0525) declared on the Common Stockour common stock prior to December 19, 2008. The amount of dividends, if any, that may be declared by the Company also depends on many other factors, including future earnings, bank regulatory capital requirements and business conditions as they affect the Company and its subsidiaries. As a result, no assurance can be given that dividends will be paid in the future with respect to the Company’s common stock. In addition, the Company currently plans to retain most of its earnings to strengthen our balance sheet given the weak economic environment.15Repurchases of Common StockOn August 27, 2007, the Company’s Board of Directors authorized a one year stock repurchase program of up to 625,000 shares, or approximately 5.00%, of the Company’s outstanding common stock in the open market or in privately negotiated transactions. No purchases were made in 2008 and the program expired in August 2008 without reauthorization. In addition, participants in TARP are not allowed to repurchase shares of common stock. All repurchased shares are being held as Treasury stock. See Item 8, Note 1 – Significant Accounting Policies for more information.
The following Stock Performance Graph and related information should not be deemed “soliciting material” or to be “filed” with the Securities and Exchange CommissionSEC nor shall such performance be incorporated by reference into any future filings under the Securities Act of 1933 or Securities Exchange Act of 1934, each as amended, except to the extent that the Company specifically incorporates it by reference into such filing.graphgraph* compares the cumulative total shareholder return on the Company’s common stock from December 31, 20032004 through December 31, 2008.2009. The graph compares the Company’s common stock with the NASDAQ Composite and the SNL $1B-$5B Bank Index. The graph assumes an investment of $100.00 in the Company’s common stock and each index on December 31, 20032004 and reinvestment of all quarterly dividends. The investment is measured as of each subsequent fiscal year end. There is no assurance that the Company’s common stock performance will continue in the future with the same or similar results as shown in the graph.
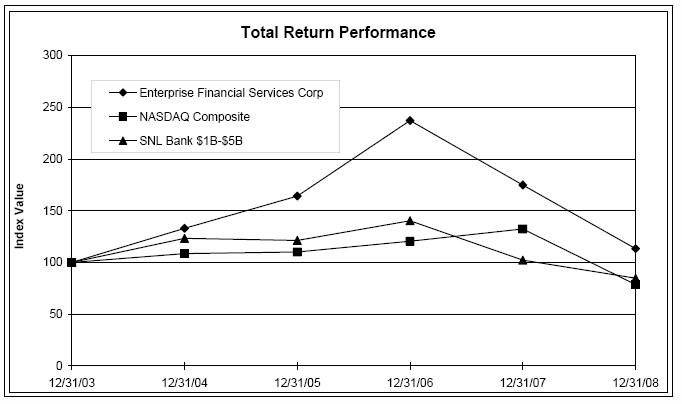
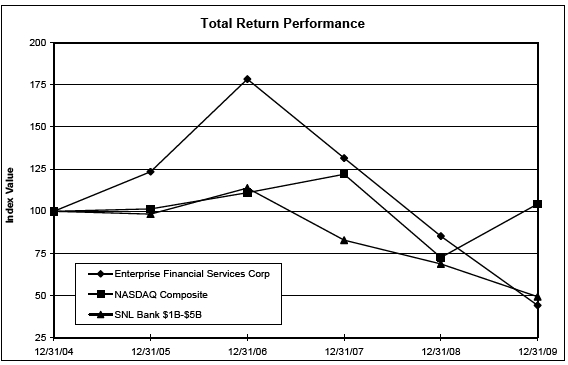
Period Ending Index 12/31/04 12/31/05 12/31/06 12/31/07 12/31/08 12/31/09 Enterprise Financial Services Corp 100.00 123.41 178.43 131.52 85.18 44.08 NASDAQ Composite 100.00 101.37 111.03 121.92 72.49 104.31 SNL Bank $1B-$5B 100.00 98.29 113.74 82.85 68.72 49.26 Period Ending Index 12/31/03 12/31/04 12/31/05 12/31/06 12/31/07 12/31/08 Enterprise Financial Services Corp 100.00 133.02 164.16 237.34 174.94 113.30 NASDAQ Composite 100.00 108.59 110.08 120.56 132.39 78.72 SNL Bank $1B-$5B 100.00 123.42 121.31 140.38 102.26 84.81 162008.2009. This information should be read in connection with our audited consolidated financial statements, related notes and “Management’s Discussion and Analysis of Financial Condition and Results of Operations” appearing elsewhere in this report. See “Loan Participations” in Item 7, Management’s Discussion and Analysis and Item 8, Note 2 – Loan Participation Restatement for more information on the Restated columns. Year ended December 31, (in thousands, except per share data) 2008 2007 2006 2005 2004 EARNINGS SUMMARY: Interest income $ 117,981 $ 122,517 $ 94,418 $ 68,108 $ 48,893 Interest expense 51,258 61,465 43,141 23,541 12,169 Net interest income 66,723 61,052 51,277 44,567 36,724 Provision for loan losses 22,475 4,615 2,127 1,490 2,212 Noninterest income 25,273 19,673 16,916 8,967 7,122 Noninterest expense 63,505 49,516 41,394 34,324 29,331 Minority interest in net income of consolidated consolidated subsidiary - - (875 ) (113 ) - Income before income taxes 6,016 26,594 23,797 17,607 12,303 Income taxes 1,586 9,016 8,325 6,312 4,088 NET INCOME $ 4,430 $ 17,578 $ 15,472 $ 11,295 $ 8,215 PER SHARE DATA: Basic earnings per common share $ 0.35 $ 1.44 $ 1.41 $ 1.12 $ 0.85 Diluted earnings per common share 0.34 1.40 1.36 1.05 0.82 Cash dividends paid on common shares 0.21 0.21 0.18 0.14 0.10 Book value per common share 14.31 13.96 11.52 8.85 7.44 Tangible book value per common share 10.24 8.86 8.43 7.27 7.23 BALANCE SHEET DATA: Year end balances: Loans $ 1,977,175 $ 1,641,432 $ 1,311,723 $ 1,002,379 $ 898,505 Allowance for loan losses 31,309 21,593 16,988 12,990 11,665 Goodwill 48,512 57,177 29,983 12,042 1,938 Intangibles, net 3,504 6,053 5,789 4,548 135 Assets 2,270,174 1,999,118 1,535,587 1,286,968 1,059,950 Deposits 1,792,784 1,585,012 1,315,508 1,116,244 939,628 Subordinated debentures 85,081 56,807 35,054 30,930 20,620 Borrowings 166,117 169,581 40,752 36,931 20,164 Shareholders' equity 217,788 173,149 132,994 92,605 72,726 Average balances: Loans 1,828,434 1,495,807 1,159,110 964,259 847,270 Earning assets 1,952,942 1,619,425 1,300,378 1,100,559 967,854 Assets 2,127,671 1,753,254 1,385,726 1,148,691 1,008,022 Interest-bearing liabilities 1,711,048 1,365,471 1,055,520 859,912 748,434 Shareholders' equity 183,819 161,359 113,000 81,511 68,854 SELECTED RATIOS: Return on average common equity 2.43 % 10.89 % 13.69 % 13.86 % 11.93 % Return on average assets 0.21 1.00 1.12 0.98 0.81 Efficiency ratio 69.03 61.34 60.70 64.12 66.90 Average common equity to average assets 8.58 9.20 8.15 7.10 6.83 Yield on average interest-earning assets 6.09 7.63 7.33 6.25 5.10 Cost of interest-bearing liabilities 3.00 4.50 4.09 2.74 1.63 Net interest rate spread 3.09 3.13 3.24 3.51 3.47 Net interest rate margin 3.47 3.83 4.01 4.11 3.84 Nonperforming loans to total loans 1.50 0.77 0.49 0.14 0.20 Nonperforming assets to total assets 1.92 0.78 0.52 0.11 0.18 Net chargeoffs to average loans 0.70 0.14 0.10 0.02 0.13 Allowance for loan losses to total loans 1.58 1.32 1.30 1.30 1.30 Dividend payout ratio - basic 60.09 15.01 12.78 12.58 11.76 Year ended December 31, Restated Restated Restated Restated (in thousands, except per share data) 2009 2008 2007 2006 2005 EARNINGS SUMMARY: Interest income $ 118,486 $ 127,021 $ 130,249 $ 98,545 $ 71,648 Interest expense 48,845 60,338 69,242 47,308 27,087 Net interest income 69,641 66,683 61,007 51,236 44,561 Provision for loan losses 40,412 26,510 5,120 2,273 1,523 Noninterest income 19,877 20,341 12,852 9,897 8,187 Noninterest expense 98,427 48,776 44,695 37,754 33,667 (Loss) income from continuing operations (49,321 ) 11,738 24,044 21,107 17,558 Income tax (benefit) expense from continuing operations (2,650 ) 3,672 8,098 7,357 6,300 Net (loss) income from continuing operations (46,671 ) 8,066 15,946 13,750 11,258 Net (loss) income $ (47,955 ) $ 1,848 $ 17,255 $ 15,379 $ 11,275 PER SHARE DATA: Basic (loss) earnings per common share: From continuing operations $ (3.82 ) $ 0.63 $ 1.30 $ 1.25 $ 1.12 Total (3.92 ) 0.14 1.41 1.40 1.12 Diluted (loss) earnings per common share: From continuing operations (3.82 ) 0.63 1.27 1.21 1.05 Total (3.92 ) 0.14 1.37 1.35 1.05 Cash dividends paid on common shares 0.21 0.21 0.21 0.18 0.14 Book value per common share 10.25 14.33 13.91 11.50 8.83 Tangible book value per common share 10.05 10.27 8.81 8.40 7.25 BALANCE SHEET DATA: Ending balances: Loans 1,833,260 2,201,457 1,784,278 1,376,452 1,048,302 Allowance for loan losses 42,995 33,808 22,585 17,475 13,332 Goodwill 953 48,512 57,177 29,983 12,042 Intangibles, net 1,643 3,504 6,053 5,789 4,548 Assets 2,365,655 2,493,767 2,141,329 1,600,004 1,332,673 Deposits 1,941,416 1,792,784 1,585,013 1,315,508 1,116,244 Subordinated debentures 85,081 85,081 56,807 35,054 30,930 Borrowings 167,438 392,926 312,427 105,481 82,854 Shareholders' equity 163,912 214,572 172,515 132,683 92,386 Average balances: Loans 2,098,275 2,001,073 1,599,596 1,214,436 1,014,697 Earning assets 2,334,700 2,125,581 1,723,214 1,355,704 1,150,997 Assets 2,462,237 2,298,882 1,856,466 1,440,685 1,198,795 Interest-bearing liabilities 2,025,339 1,883,904 1,469,258 1,110,845 910,348 Shareholders' equity 177,374 182,175 160,783 112,633 81,191 SELECTED RATIOS: Return on average common equity (34.51 ) % 0.98 % 10.73 % 13.65 % 13.89 % Return on average assets (2.05 ) 0.08 0.93 1.07 0.94 Efficiency ratio 109.95 56.05 60.51 61.76 63.83 Average common equity to average assets 5.92 7.89 8.65 7.78 6.77 Yield on average interest-earning assets 5.15 6.04 7.63 7.34 6.28 Cost of interest-bearing liabilities 2.41 3.20 4.71 4.26 2.98 Net interest rate spread 2.74 2.84 2.92 3.08 3.31 Net interest rate margin 3.06 3.20 3.61 3.85 3.93 Nonperforming loans to total loans 2.10 1.61 0.71 0.47 0.14 Nonperforming assets to total assets 2.74 1.98 0.73 0.50 0.11 Net chargeoffs to average loans 1.42 0.76 0.13 0.10 0.02 Allowance for loan losses to total loans 2.35 1.54 1.27 1.27 1.27 Dividend payout ratio - basic (5.62 ) 144.02 15.29 12.85 12.60 17
RESULTS OF OPERATIONS
The objective of this section is to provide an overview of the results of operations and financial condition of the Company for the three years ended December 31, 2008.2009. It should be read in conjunction with the Consolidated Financial Statements, Notes and other financial data presented elsewhere in this report, particularly the information regarding the Company’s business operations described in Item 1.
This overview of management’s discussion and analysis highlights selected information in this document and may not contain all of the information that is important to you. For a more complete understanding of trends, events, commitments, uncertainties, liquidity, capital resources and critical accounting estimates, you should carefully read this entire document.Overeighteenfourteen months, banks and financial institutions of all sizes have been impacted by adverse conditions in the housing and credit markets, and recent bank failures have heightened awareness and concern regarding the safety and soundness of all banks. The Company, including its wholly owned bank subsidiary, Enterprise, are “well-capitalized” under the regulatory guidelines. Since September 2008, we have raised $62.5added $75.0 million in new regulatory capital, raisingincluding $15.0 million from a January 2010 private offering of our risk-based capital ratio to 12.81% - well in excess of the regulatory guidelines. On September 30, 2008, Enterprise completed a $2.5 million private placement of subordinated capital notes. On December 12, 2008, we completed a private placement of $25.0 million in Convertible Trust Preferred Securities that qualify as Tier II regulatory capital until they would convert to EFSC common stock. And finally, on December 19, 2008, we received $35.0 million from the US Treasury under the Capital Purchase Program.113 – Subordinated DebenturesAcquisitions and Divestitures for more information.We are concentrating our resources on growing our core banking wealth management businesses and aggressively managing asset quality through this credit cycle. The additional capital will strengthen our balance sheet and allows us to take advantage of opportunities that may emerge as a result of the current unsettled nature of the financial industry. In addition, please note:We havedid not participateddetect an error in the originationaccounting for loan participations executed subject to its standard participation agreement. This resulted in the restatement of subprime or Alt-A loans.Weour financial results at December 31, 2007, December 31, 2008, each quarter in 2008 and the first and second quarters of 2009. Except for labeling affected prior period financial statements as “Restated,” no further changes are being made to our above described corrected financial statements and no further restatement of our financial statements is anticipated. All prior period results presented have not invested in securities that are secured by subprime loans.We have no common or preferred Federal National Mortgage Association (Fannie Mae) or Federal Homebeen restated for the error. The overall effect of these adjustments from the original period of correction to December 31, 2009 was neutral to the Company’s financial results. See “Loan Participations” below and Item 8, Note 2 – Loan Mortgage Corporation (Freddie Mac) stock.Net income for 2008For 2009, we reported a net loss of $48.0 million compared to a net loss of $1.8 million in 2008. After deducting preferred stock dividends, net loss available to common shareholders was $4.4$50.4 million, or $0.34$3.92 per fully diluted share, compared to $17.6net income available to common shareholders of $1.8 million, or $1.40$0.14 per fully diluted share in 2007.2008. Included in 20082009 results are:9.245.4 million in pre-tax, non-cash goodwill and intangible impairment chargescharge related to Millennium;our Banking reporting unit;
3.41.6 million in pre-tax gainsloss on the sale of non-strategic branchesMillennium;
The goodwill impairment charge is a non-cash accounting adjustment that does not reduce the Company’s regulatory or tangible capital position, liquidity or cash flow and does not impact the Company’s operations. The goodwill impairment charge was primarily driven by the deterioration in the Kansas City market;general economic environment and the resulting decline in the Company’s share price and market capitalization in the first quarter of 2009. See Item 8, Note 10 – Goodwill and Intangible Assets for more information.$1.0On January 20, 2010, we sold Millennium for $4.0 million in cash, resulting in a $1.6 million pre-tax chargeloss on the sale. Millennium financial results are reported as discontinued operations for all periods presented herein. See “Noninterest income” for more information.
During a review of loan participation agreements in the third quarter of 2009, the Company determined that certain of these agreements contained language inconsistent with sale accounting treatment. The agreements provided us with the unilateral ability to repurchase participated loans at their outstanding loan balance plus accrued interest at any time. In effect, the repurchase option afforded us with effective control over the participated portion of the loan, which conflicts with sale accounting treatment.
We reported a net loss from continuing operations of $46.7 million, or $3.82 per diluted share, for 2009, compared to net income of $8.1 million, or $0.63 per diluted share, for 2008. For 2009, net loss from discontinued operations was $1.3 million, or $0.10 per diluted share, compared to a payout under an employee retention agreement.Excluding these non-recurring items,net loss of $6.2 million, or $0.49 per diluted share in 2008.earningsincome from continuing operations was $31.9 million, for the year were $9.12009 compared to $35.2 million or $0.70, per share. in 2008. The reduction in 2009 operating income from continuing operations compared to 2008 is largely attributable to the fair value adjustments on state tax credits held for sale and the related interest rate caps used to hedge market risk along with increases in loan legal and other real estate expenses.operating earnings and loss figures,pre-tax, pre-provision income from continuing operations, which are notis a non-GAAP (Generally Accepted Accounting Principles) financial measures as defined under U.S. GAAP,measure, because we believe adjusting our results to exclude non-recurring itemsdiscontinued operations, loan loss provision expense, impairment charges, special FDIC assessments and unusual gains or losses provides shareholders with a more comparable basis for evaluating our period-to-period operating results and financial performance. Belowresults. A schedule reconciling pre-tax income (loss) from continuing operations to pre-tax, pre-provision income from continuing operations is a reconciliation of U.S. GAAP net (loss) income to operating (loss) earnings for the fourth quarter and year of 2008. 4th Quarter 2008 Total year 2008 (All amounts net of tax, in thousands, except per share data) Net loss Diluted EPS Net income Diluted EPS U.S. GAAP net (loss) income $ (3,952 ) $ (0.32 ) $ 4,430 $ 0.34 Impairment charges related to Millennium 2,112 0.16 5,888 0.46 Gain on sales of Kansas City nonstrategic branches/charter - - (1,880 ) (0.15 ) Employee retention agreement 560 0.04 640 0.05 Operating (loss) earnings $ (1,280 ) $ (0.12 ) $ 9,078 $ 0.70 Our diluted earnings per share are $0.01 less than previously reportedprovided in the press release issued on January 29, 2009 on Form 8-K due to the inclusion of preferred stock dividends that were not declared as of the press release date and not included in the earnings per share calculation at that time.18For the Quarter Ended Restated Restated Dec 31, Sep 30, Jun 30, Mar 31, Total Year (In thousands) 2009 2009 2009 2009 2009 Pre-tax income (loss) from continuing operations $ 8 $ 7,003 $ (1,634 ) $ (54,698 ) $ (49,321 ) Goodwill impairment charge - - - 45,377 45,377 Sales and fair value writedowns of other real estate 1,166 602 508 549 2,825 Sale of securities (3 ) - (636 ) (316 ) (955 ) Gain on extinguishment of debt (2,062 ) (5,326 ) - - (7,388 ) FDIC special assessment (included in Other noninterest expense) - (105 ) 1,100 - 995 (Loss) income before income tax (891 ) 2,174 (662 ) (9,088 ) (8,467 ) Provision for loan losses 8,400 6,480 9,073 16,459 40,412 Pre-tax, pre-provision income from continuing operations $ 7,509 $ 8,654 $ 8,411 $ 7,371 $ 31,945 For the Quarter Ended (Restated) Dec 31, Sep 30, Jun 30, Mar 31, Total Year (In thousands) 2008 2008 2008 2008 2008 Pre-tax (loss) income from continuing operations $ (6,291 ) $ 8,214 $ 4,386 $ 5,429 $ 11,738 Sales and fair value writedowns of other real estate 91 (242 ) (351 ) 9 (492 ) Sale of securities (88 ) - (73 ) - (161 ) Gain on sale of Kansas City nonstrategic branches/charter 0 (2,840 ) 19 (579 ) (3,400 ) Retention payment 875 125 - - 1,000 (Loss) income before income tax (5,413 ) 5,257 3,981 4,859 8,685 Provision for loan losses 16,296 3,007 4,378 2,829 26,510 Pre-tax, pre-provision income from continuing operations $ 10,883 $ 8,264 $ 8,359 $ 7,688 $ 35,195 2021 – Segment Reporting.Our core banking business continuesFor 2009, the Banking segment recorded a net loss of $43.2 million compared to perform relatively well in lightnet income of $10.5 million for 2008. Excluding the unprecedented turmoil innon-tax deductible goodwill impairment of $45.4 million, the financial markets and the continued deteriorationBanking segment recorded net income of the housing market.$2.2 million for 2009. Below is a summary of 2008:2009:growthdemand – At December 31, 2008,2009, portfolio loans were $1.977$1.833 billion, an increasea decrease of $336.0$368.0 million, or 20%17%, from December 31, 2007. The strong net growth in loans is attributable in part to a more favorable competitive environment, with fewer competitors positioned today to capture new business, resulting in both increased volumes and more favorable pricing. More than 60%2008. Net of the net loan growth was relatedparticipations, portfolio loans declined $144.0 million, or 7%.
Loan demand appears to commercialbe soft as business clients postpone expansion efforts and industrial businesses.pare back debt. Our loan portfolio mix at December 31, 2008,2009, from both industry anda collateral perspectives, did not changeperspective, changed significantly from December 31, 2007.2008 in two categories. Construction loans collateralized by real estate totaled $224.4 million or 12% of the portfolio, at December 31, 2009 compared to $378.1 million or 17% of the portfolio at December 31, 2008. This reduction reflects the soft real estate markets and the Company’s intentional efforts to reduce our construction loan exposure. Loans collateralized by commercial real estate totaled $829.0$820.2 million, or 45% of the portfolio at year endDecember 31, 2009 compared to $888.0 million, or 40% of the portfolio at December 31, 2008. Approximately $318.0 million, or 38%39%, of that total, represented real estate that was “owner-occupied” by commercial and industrial businesses.Enterprise continuesbusinesses compared to operate a loan production office in central Phoenix. Through December 2008, the loan production office has generated approximately $22.0 million of commercial and industrial and commercial real estate loans. In 2008, we applied for a de novo Arizona state bank charter. Unfortunately, conditions have led the Arizona regulatory authorities to stop approvals for de novo charters and as a result the most likely option to obtain a charter to operate a bank in Arizona is, through negotiated acquisition or an FDIC-assisted transaction. We continue to believe in the long-term value in the Phoenix market and remain confident in our decision to establish a bank in that region.The Bank has continued its lending activities since the Treasury’s investment on December 19, 2008. From the close of business December 18, 2008 through February 28, 2009, the Bank funded $55.0 million in new loans and advanced another $80.4 million on existing loans. Total portfolio loans, net of payoffs and paydowns, grew $29.1$333.0 million, or roughly 8% annualized between38% at December 18, 2008 and February 28, 2009. 31, 2008.
We continue to see loan opportunities in all our markets. During 2009, we expect ourmodest loan growth percentage to be in the high single digits.
2010 as business activity should improve slightly and additional capacity from new hires and focused sales teams take effect. Deposit growth in 2008 was challenging. Across the financial industry, growing concern over the safety of bank deposits caused some large balance clients to reduce their exposure by spreading funds among numerous financial institutions. Our focus for 2009 iswas to reduce our reliance on brokered deposits, grow our core deposits, and increase our percentage of non-interest bearing deposits. We have adjusted our incentive programs to focus our associates on deposit gathering efforts and will be aggressively managingmanaged deposit rates to achieve this objective.DuringTotal deposits were $1.94 billion at December 31, 2009, an increase of $149.0 million, or 8%, from December 31, 2008. Total deposits increased $88.0 million, or 5%, during the fourth quarter of 2008, we increased core2009. Noninterest-bearing demand deposits $113.0 million, or 8%. While less than our historicalrepresented 15% of total deposits at December 31, 2009 compared to 14% at December 31, 2008. Noninterest-bearing demand deposit growth was particularly strong in the fourth quarter deposit surge, this increase is significant in that it occurred despite a massive investor flight to the Treasury markets driven by the instability and volatility of the financial markets during that period. In 2008, total deposits grew $208.0 million, or 13%, to $1.793 billion. Brokered deposits represented $336.0 million of this total,2009, with an increase of $222.0$32.0 million, overor 12%.
Excluding brokered certificates of deposit, “core” deposits grew $328.0 million, or 23%, from a year ago, and $139.0 million, or 9%, during the fourth quarter of 2009. Core deposits include certificates of deposit sold to clients through the reciprocal CDARS program. As of December 31, 2007. Approximately $37.02009, Enterprise had $135.0 million of reciprocal CDARS deposits were sold as part of the Great American sale. Excluding the impact of the Great American sale and brokeredoutstanding compared to $60.0 million at December 31, 2008.
Brokered deposits core deposits increased $23.0declined $180.0 million, or 2%53%, in 2008.from December 31, 2008 to $156.0 million. For the year ended December 31, 2008,2009, brokered deposits represented 19%8% of total deposits on average compared to 7%19% for the year ended December 31, 2007. Non-interest bearing demand deposits represented 14% of total deposits at December 31, 2008, compared to 18% of total deposits one year ago.2008.In July 2008, Enterprise became a participating depository institution in the Certificate of Deposit Accounts Registry Service, or CDARS, a private network of institutions, which allows us to provide our customers with access to additional levels of FDIC insurance. As of December 31, 2008, Enterprise had $60.0 million of reciprocal CDARS deposits outstanding.We elected to “opt-in” to the expanded FDIC deposit insurance program and the government sponsored debt issuance guaranty program, which represents additional sources of liquidity.19 See “Supervision and Regulation” and “Liquidity and Capital Resources” for more information.thirdfourth year of slow residential housing activity in St. Louis and Kansas City with no significant improvement expected in 2009. During the latter half of 2008, we performed an in-depth review to specifically target our higher riskCity. In addition, commercial real estate loans where repayment is dependent on the sale of the underlying properties. Examples would be residential construction, commercial construction, land acquisition and development, improved lots, and raw-land. The review:determined our geographic distribution of construction projects (those within our primary lending areas compared to those thatmarkets, especially retail, are out-of-market) along with distribution by counties;softening.
determined if we were exposed to concentration risk within residential subdivisions through an excessive number of builders, or excessive number of speculative homes, or lots;assessed the establishment and use of interest reserves by determining if sufficient amounts were structured into the loans at origination and determined if adequate amounts exist to carry the project to completion;assessed the adequacy of financial information and analysis at loan origination or modification; andevaluated disbursing procedures to ensure that loan advances are appropriate to the various stages of the construction project, which minimizes the risk of the bank becoming fully funded on a loan when the project has not reached completion.As a result of the review, we aggressively downgraded risk ratings primarily in the Kansas City region on residential construction loans, which resulted in higher provision expense and loan loss reserves for the year. Although loans to residential builders represent only 12% of our loan portfolio, they represent almost 40% of our nonperforming loans at December 31, 2008.We are closely monitoring our portfolio to determine if the recession is impacting other sectors. We have not seen significant deterioration in the commercial and industrial sector of our portfolio but anticipate continued economic weakness will adversely impact these borrowers in 2009. Commercial construction projects have slowed, but not as severely as in the residential sector. Builders are still working on backlogs, but some projects are being cancelled and it appears 2010 may be slow.Non-performingNonperforming loans were $29.7$38.5 million, or 1.50%2.10%, of portfolio loans at December 31, 2008.2009. The allowance for loan losses was $31.3$43.0 million, or 1.58%2.35%, of portfolio loans vs. $21.6versus $33.8 million, or 1.32%,1.54% of portfolio loans, at the end of 2007.2008. In 2008,2009, we incurred $12.7$29.8 million of net charge-offs, or 0.70%,1.42% of average loans compared to $2.0$15.2 million of net charge-offs, or 0.14%,0.76% of average loans in 2007. See “Allowance for Loan Losses” for more information.2008.
Management expects 2010 nonperforming assets and chargeoff levels to remain elevated.3.47%3.06% for 20082009 versus 3.83%3.20% for 2007.2008. The margin has been compressed as a result of sharply declininglower interest rates, a higher percentage of earning assets in securities and short-term rates, an increased volume of wholesale funding to support loan growth andinvestments, higher average levels of nonperforming loans.loans and a change in core deposit mix from money market deposits to higher rate time deposits. We expect wider margins in 2010 based on better earning asset mix, risk-based pricing, and continued discipline on funding costs.
The Wealth Management segment is comprised of Millennium, Enterprise Trust and our state tax credit brokerage activities. Wealth Management is a strategic line of business consistent with our Company mission of “guiding our clients to a lifetime of financial success.” It is a driver of fee income and is intended to help us diversify our dependency on bank spread incomes.202008,2009, Wealth Management recorded a pre-tax$608,000 net loss of $6.7 million, including $9.2 million of impairment charges relatedfrom continuing operations compared to Millennium. Excluding the Millennium impairment charges, pre-tax net income was $2.5from continuing operations of $1.9 million for 2008, compared to $4.2 million for 2007.in 2008. Revenues for Trust and Millennium are net of commissions and other direct investment expenses such as custody charges and investment management expenses.$1.2$1.4 million, or 17%24%, for the year. The decline in the overall equity markets along with lost advisory revenueswas primarily due to personnel turnover earlier in the year were the primary drivers of the decrease.reduced sales and client attrition related to reorganization and staff changes. Trust assets under administration were $1.2$1.280 billion at December 31, 2008,2009, a 28% decrease5% increase over one year ago. We expect to see demand for our fiduciary services increase in 2009 due to market disruptions resulting from the acquisition of a major St. Louis investment firm. During the fourth quarter of 2008, our Trust operations completed several initiatives designed to enhance client service including implementing a new client account reporting and aggregation system.
2008, we recognized approximately $4.2 million of net2009, gains from state tax credit brokerage activities whereby we sell certain state tax creditswere $1.0 million compared to our clients. Net gains associated with this activity were $792,000$4.2 million in 2007. Of the 2008 total, $3.1 million represented the2008. The net effects from fair value adjustments on the tax credit assets and related interest rate caps used to economically hedge the tax credits. The remaining increase reflects the full yearcredits represents $3.8 million of the brokerage activity compared to a partial year in 2007 and was consistent with the Company’s performance expectations for its first full year of operations.Millennium revenue– Millennium revenues decreased $1.9 million, or 28% for the year. While sales margins rebounded to near expected levels in the fourth quarter of 2008, paid premiums sales were down from 2007 as a result of tighter underwriting standards, continued disruption from the growing influence of aggregators and general turmoil in the financial services industry. We expect earnings before taxes and amortization in 2009 to be flat with 2008.Millennium impairment charges –We evaluated Millennium’s goodwill and intangible assets for impairment during the third quarter of 2008. In connection with these tests, we determined that margin pressures reducingMillennium revenues continue to negatively affect operating performance, thereby reducing the fair value of our investment in Millennium. As a result, the Company recorded a $5.9 million, pre-tax goodwill impairment charge as of September 30, 2008. In the fourth quarter of 2008, due to slower paid premium sales and resulting decreased earnings of Millennium, we identified and recorded an additional pre-tax goodwill impairment of $2.8 million and $500,000 of intangible asset impairment. The charges did not reduce our regulatory capital or cash flow. See “Noninterest Expenses” and Item 8, Note 9 – Goodwill and Intangible Assets for more information.decline.
Comparison of 20082009 vs. 20072008
Net interest income is the primary source of the Company’s revenue. Net interest income is the difference between interest income on earning assets, such as loans and securities, and the interest expense on interest-bearing deposits and other borrowings used to fund interest earning and other assets. The amount of net interest income is affected by changes in interest rates and by the amount and composition of interest-earning assets and interest-bearing liabilities, such as the mix of fixed vs. variable rate loans. When and how often loans and deposits mature and repricere-price also impacts net interest income.The Company’s balance sheet is relatively neutral to rate changes. In response to the federal funds decreases in early 2008, which in turn lowered the prime rate earned on many of our loans, we aggressively reduced deposit rates. This allowed us to partially offset the lower asset yields. Following the December 2008 federal funds decreases, management chose to maintain the Enterprise prime rate at 4%. In addition, we are including interest rate floors in many of our new and renewing variable rate loans.$5.6$3.3 million, or 5%, from $68.1 million for 2008 to $71.4 million for 2009. Total interest income decreased $8.2 million while total interest expense decreased $11.5 million.
Net interest income (on a tax-equivalent basis) increased $5.9 million, or 9%, from $62.1$62.2 million for 2007 to $67.7$68.1 million for 2008. Total interest income decreased $4.6$3.0 million while total interest expense decreased $10.2$8.9 million.21$1.953$2.126 billion in 2008, an increase of $334.0$402.0 million, or 21%23%, from 2007. Loans accounted for the majority of the growth, increasing by $333.0$401.0 million, or 22%25%, to $1.828$2.001 billion. Interest income on loans increased $16.8$27.8 million from growth and decreased by $21.3$30.8 million due to the impact of rates, for a net decrease of $4.5$3.0 million versus 2007.$346.0$415.0 million, or 25%28%, to $1.711$1.884 billion compared to $1.365$1.469 billion for 2007. The growth in interest-bearing liabilities resulted from a $99.0$100.0 million increase in interest-bearing core deposits, a $94.0$93.0 million increase in brokered certificates of deposit, a $5.4$5.0 million increase in subordinated debentures, and a $147.0 million increase in borrowed funds including FHLB advances and federal funds purchased. Secured borrowings related to our loan participations increased $69.0 million. In December 2008, we began utilizing the Federal Reserve discount window, due to its lower borrowing rates. For 2008, interest expense on interest-bearing liabilities increased $9.7$18.1 million due to growth while the impact of declining rates decreased interest expense on interest-bearing liabilities by $19.9$27.0 million, for a net decrease of $10.2$8.9 million versus 2007. See “Liquidity and Capital Resources” for more information.3.47%3.20% compared to 3.83%3.61% for 2007. The margin has beenwas compressed as a result of sharply declining short-term rates along with an increased volume of wholesale funding to support loan growth. Approximately 0.11% of the decline is due togrowth along with higher average levels of nonperforming loans in 2008 versus the prior year. In 2009, we expect margins to remain flat as improved loan pricing is expected to be offset by more aggressive deposit pricing in our markets.Comparison of 2007 vs. 2006Net interest income (on a tax-equivalent basis) increased $9.9 million, or 19%, from $52.2 million for 2006 to $62.1 million for 2007. Total interest income increased $28.2 million while total interest expense increased $18.3 million.Average interest-earning assets were $1.619 billion in 2007, an increase of $319.0 million, or 25%, from 2006. Loans accounted for the majority of the growth, increasing by $337.0 million, or 29%, to $1.496 billion. Average short-term investments declined by $17.0 million due to a decline in federal funds sold. Interest income on loans increased $26.5 million from growth and $2.1 million due to the impact of rates, for a net increase of $28.6 million versus 2006.Average interest-bearing liabilities increased $310.0 million, or 29%, to $1.365 billion compared to $1.056 billion for 2006. The growth in interest-bearing liabilities resulted from a $223.0 million increase in interest-bearing core deposits, a $31.0 million increase in brokered certificates of deposit, a $21.0 million increase in subordinated debentures, and a $35.0 million increase in borrowed funds including FHLB advances. We continue to meet loan funding demands with FHLB advances and brokered certificates of deposit. For 2007, interest expense on interest-bearing liabilities increased $14.4 million due to growth while the impact of rising rates increased interest expense on interest-bearing liabilities by $3.9 million versus 2006.For the year ended December 31, 2007, the tax-equivalent net interest rate margin was 3.83% compared to 4.01% for 2006. Approximately 0.05% of the decline was due to higher average levels of nonperforming loans in 2007 versus the prior year. Additionally, higher levels of subordinated debentures associated with the acquisition of Clayco negatively impacted the margin.22
The following table presents, for the periods indicated, certain information related to our average interest-earning assets and interest-bearing liabilities, as well as, the corresponding interest rates earned and paid, all on a tax equivalent basis.For 2006, loans and deposits associated with NorthStar Bank NA (“NorthStar”) are included for six months. For the years ended December 31, 2008 2007 2006 Interest Average Interest Average Interest
Income/
ExpenseAverage Average Income/ Yield/ Average Income/ Yield/ Average Yield/ (in thousands) Balance Expense Rate Balance Expense Rate Balance Rate Assets Interest-earning assets: Taxable loans (1) $ 1,798,065 $ 110,610 6.15 % $ 1,463,133 $ 115,039 7.86 % $ 1,130,482 $ 86,893 7.69 % Tax-exempt loans (2) 30,369 2,776 9.14 32,674 2,824 8.64 28,628 2,412 8.43 Total loans 1,828,434 113,386 6.20 1,495,807 117,863 7.88 1,159,110 89,305 7.70 Taxable investments in debt and equity securities 111,902 5,268 4.71 111,332 5,093 4.57 111,811 4,530 4.05 Non-taxable investments in debt and equity securities (2) 804 48 5.97 936 53 5.66 1,140 55 4.82 Short-term investments 11,802 295 2.50 11,350 543 4.78 28,317 1,416 5.00 Total securities and short-term investments 124,508 5,611 4.51 123,618 5,689 4.60 141,268 6,001 4.25 Total interest-earning assets 1,952,942 118,997 6.09 1,619,425 123,552 7.63 1,300,378 95,306 7.33 Noninterest-earning assets: Cash and due from banks 40,349 44,417 42,282 Other assets 158,907 108,716 58,649 Allowance for loan losses (24,527 ) (19,304 ) (15,583 ) Total assets $ 2,127,671 $ 1,753,254 $ 1,385,726 Liabilities and Shareholders' Equity Interest-bearing liabilities: Interest-bearing transaction accounts 121,371 1,554 1.28 % 120,418 3,078 2.56 % 102,327 2,332 2.28 % Money market accounts 687,867 13,786 2.00 579,029 23,578 4.07 496,590 19,213 3.87 Savings 9,594 55 0.57 11,126 125 1.12 4,164 57 1.37 Certificates of deposit 588,561 24,525 4.17 503,926 26,083 5.18 357,706 16,230 4.54 Total interest-bearing deposits 1,407,393 39,920 2.84 1,214,499 52,864 4.35 960,787 37,832 3.94 Subordinated debentures 58,851 3,536 6.01 53,500 3,859 7.21 32,704 2,343 7.16 Borrowed funds 244,804 7,802 3.19 97,472 4,742 4.86 62,029 2,966 4.78 Total interest-bearing liabilities 1,711,048 51,258 3.00 1,365,471 61,465 4.50 1,055,520 43,141 4.09 Noninterest-bearing liabilities: Demand deposits 221,925 215,610 207,328 Other liabilities 10,879 10,814 9,878 Total liabilities 1,943,852 1,591,895 1,272,726 Shareholders' equity 183,819 161,359 113,000 Total liabilities & shareholders' equity $ 2,127,671 $ 1,753,254 $ 1,385,726 Net interest income $ 67,739 $ 62,087 $ 52,165 Net interest spread 3.09 % 3.13 % 3.24 % Net interest rate margin (3) 3.47 3.83 4.01 For the years ended December 31, Restated Restated 2009 2008 2007 Interest Average Interest Average Interest Average Average Income/ Yield/ Average Income/ Yield/ Average Income/ Yield/ (in thousands) Balance Expense Rate Balance Expense Rate Balance Expense Rate Assets Interest-earning assets: Taxable loans (1) $ 2,044,449 $ 109,451 5.35 % $ 1,958,806 $ 119,018 6.08 % $ 1,561,851 $ 122,522 7.84 % Tax-exempt loans (2) 53,826 4,868 9.04 42,267 3,850 9.11 37,745 3,287 8.71 Total loans 2,098,275 114,319 5.45 2,001,073 122,868 6.14 1,599,596 125,809 7.87 Taxable investments in debt and equity securities 172,815 5,778 3.34 111,902 5,268 4.71 111,332 5,093 4.57 Non-taxable investments in debt and equity securities (2) 634 37 5.84 804 48 5.97 936 53 5.66 Short-term investments 62,976 136 0.22 11,802 254 2.15 11,350 498 4.39 Total securities and short-term investments 236,425 5,951 2.52 124,508 5,570 4.47 123,618 5,644 4.57 Total interest-earning assets 2,334,700 120,270 5.15 2,125,581 128,438 6.04 1,723,214 131,453 7.63 Noninterest-earning assets: Cash and due from banks 23,959 40,349 44,417 Other assets 146,671 159,832 108,879 Allowance for loan losses (43,093 ) (26,880 ) (20,044 ) Total assets $ 2,462,237 $ 2,298,882 $ 1,856,466 Liabilities and Shareholders' Equity Interest-bearing liabilities: Interest-bearing transaction accounts $ 122,563 $ 662 0.54 % $ 121,371 1,554 1.28 % $ 120,418 3,078 2.56 % Money market accounts 636,350 6,079 0.96 687,867 13,786 2.00 579,029 23,578 4.07 Savings 9,147 35 0.38 9,594 55 0.57 11,126 125 1.12 Certificates of deposit 786,631 23,427 2.98 588,561 24,525 4.17 503,926 26,083 5.18 Total interest-bearing deposits 1,554,691 30,203 1.94 1,407,393 39,920 2.84 1,214,499 52,864 4.35 Subordinated debentures 85,081 5,171 6.08 58,851 3,536 6.01 53,500 3,859 7.21 Borrowed funds 385,567 13,471 3.49 417,660 16,882 4.04 201,260 12,519 6.22 Total interest-bearing liabilities 2,025,339 48,845 2.41 1,883,904 60,338 3.20 1,469,259 69,242 4.71 Noninterest-bearing liabilities: Demand deposits 250,435 221,925 215,610 Other liabilities 9,089 10,878 10,814 Total liabilities 2,284,863 2,116,707 1,695,683 Shareholders' equity 177,374 182,175 160,783 Total liabilities & shareholders' equity $ 2,462,237 $ 2,298,882 $ 1,856,466 Net interest income $ 71,425 $ 68,100 $ 62,211 Net interest spread 2.74 % 2.84 % 2.92 % Net interest rate margin (3) 3.06 3.20 3.61 (1) Average balances include non-accrual loans. The income on such loans is included in interest but is recognized only upon receipt.
Loan fees, net of amortization of deferred loan origination fees and costs, included in interest income are approximately $1,626,000, $1,394,000 $690,000 and $217,000$690,000 for the years ended December 31, 2009, 2008, and 2007, and 2006, respectively.(2) Non-taxable income is presented on a fully tax-equivalent basis using the combined statutory federal and state income tax in effect for the year.
The tax-equivalent adjustments reflected in the above table are approximately $1,016,000, $1,035,000$1,784,000, $1,417,000 and $888,000$1,204,000 for the years ended December 31, 2009, 2008, and 2007, and 2006, respectively.(3) Net interest income divided by average total interest-earning assets. 23
Rate/Volume
The following table sets forth, on a tax-equivalent basis for the periods indicated, a summary of the changes in interest income and interest expense resulting from changes in yield/rates and volume.
For 2006, loans and deposits associated with NorthStar are included for six months.
2008 compared to 2007 | 2007 compared to 2006 | |||||||||||||||||||||||
Increase (decrease) due to | Increase (decrease) due to | |||||||||||||||||||||||
(in thousands) | Volume(1) | Rate(2) | Net | Volume(1) | Rate(2) | Net | ||||||||||||||||||
Interest earned on: | ||||||||||||||||||||||||
Taxable loans | $ | 16,944 | $ | (21,373 | ) | $ | (4,429 | ) | $ | 26,113 | $ | 2,033 | $ | 28,146 | ||||||||||
Nontaxable loans (3) | (161 | ) | 113 | (48 | ) | 349 | 63 | 412 | ||||||||||||||||
Taxable investments in debt | ||||||||||||||||||||||||
and equity securities | 27 | 148 | 175 | (19 | ) | 582 | 563 | |||||||||||||||||
Nontaxable investments in debt | ||||||||||||||||||||||||
and equity securities (3) | (7 | ) | 2 | (5 | ) | (11 | ) | 9 | (2 | ) | ||||||||||||||
Short-term investments | 11 | (259 | ) | (248 | ) | (814 | ) | (59 | ) | (873 | ) | |||||||||||||
Total interest-earning assets | $ | 16,814 | $ | (21,369 | ) | $ | (4,555 | ) | $ | 25,618 | $ | 2,628 | $ | 28,246 | ||||||||||
Interest paid on: | ||||||||||||||||||||||||
Interest-bearing transaction accounts | $ | 12 | $ | (1,536 | ) | $ | (1,524 | ) | $ | 442 | $ | 304 | $ | 746 | ||||||||||
Money market accounts | 2,198 | (11,990 | ) | (9,792 | ) | 3,317 | 1,048 | 4,365 | ||||||||||||||||
Savings | (15 | ) | (55 | ) | (70 | ) | 80 | (12 | ) | 68 | ||||||||||||||
Certificates of deposit | 2,803 | (4,361 | ) | (1,558 | ) | 7,329 | 2,524 | 9,853 | ||||||||||||||||
Subordinated debentures | 240 | (563 | ) | (323 | ) | 1,500 | 16 | 1,516 | ||||||||||||||||
Borrowed funds | 4,485 | (1,425 | ) | 3,060 | 1,724 | 52 | 1,776 | |||||||||||||||||
Total interest-bearing liabilities | 9,723 | (19,930 | ) | (10,207 | ) | 14,392 | 3,932 | 18,324 | ||||||||||||||||
Net interest income | $ | 7,091 | $ | (1,439 | ) | $ | 5,652 | $ | 11,226 | $ | (1,304 | ) | $ | 9,922 |
Restated | ||||||||||||||||||||||||
2009 compared to 2008 | 2008 compared to 2007 | |||||||||||||||||||||||
Increase (decrease) due to | Increase (decrease) due to | |||||||||||||||||||||||
(in thousands) | Volume(1) | Rate(2) | Net | Volume(1) | Rate(2) | Net | ||||||||||||||||||
Interest earned on: | ||||||||||||||||||||||||
Taxable loans | $ | 5,038 | $ | (14,605 | ) | $ | (9,567 | ) | $ | 27,419 | (30,923 | ) | $ | (3,504 | ) | |||||||||
Nontaxable loans (3) | 1,045 | (27 | ) | 1,018 | 407 | 156 | 563 | |||||||||||||||||
Taxable investments in debt | ||||||||||||||||||||||||
and equity securities | 2,326 | (1,816 | ) | 510 | 26 | 149 | 175 | |||||||||||||||||
Nontaxable investments in debt | ||||||||||||||||||||||||
and equity securities (3) | (10 | ) | (1 | ) | (11 | ) | (8 | ) | 3 | (5 | ) | |||||||||||||
Short-term investments | 281 | (399 | ) | (118 | ) | 19 | (263 | ) | (244 | ) | ||||||||||||||
Total interest-earning assets | $ | 8,680 | $ | (16,848 | ) | $ | (8,168 | ) | $ | 27,863 | $ | (30,878 | ) | $ | (3,015 | ) | ||||||||
Interest paid on: | ||||||||||||||||||||||||
Interest-bearing transaction accounts | $ | 15 | $ | (907 | ) | $ | (892 | ) | 24 | (1,548 | ) | (1,524 | ) | |||||||||||
Money market accounts | (964 | ) | (6,743 | ) | (7,707 | ) | 3,824 | (13,616 | ) | (9,792 | ) | |||||||||||||
Savings | (3 | ) | (17 | ) | (20 | ) | (15 | ) | (55 | ) | (70 | ) | ||||||||||||
Certificates of deposit | 6,979 | (8,077 | ) | (1,098 | ) | 3,986 | (5,544 | ) | (1,558 | ) | ||||||||||||||
Subordinated debentures | 1,594 | 41 | 1,635 | 362 | (685 | ) | (323 | ) | ||||||||||||||||
Borrowed funds | (1,233 | ) | (2,178 | ) | (3,411 | ) | 9,905 | (5,542 | ) | 4,363 | ||||||||||||||
Total interest-bearing liabilities | 6,388 | (17,881 | ) | (11,493 | ) | 18,086 | (26,990 | ) | (8,904 | ) | ||||||||||||||
Net interest income | $ | 2,292 | $ | 1,033 | $ | 3,325 | $ | 9,777 | $ | (3,888 | ) | $ | 5,889 | |||||||||||
(1) | Change in volume multiplied by yield/rate of prior period. | |
(2) | ||
Change in yield/rate multiplied by volume of prior period. | ||
(3) | Nontaxable income is presented on a fully tax-equivalent basis using the combined statutory federal and state income tax rate in effect for each year. | |
NOTE: The change in interest due to both rate and volume has been allocated to rate and volume changes in proportion to the relationship of the absolute dollar amounts of the change in each. |
The provision for loan losses was $4.6 million for 2007 compared to $2.1 million for 2006. The increase was due to strong loan growth, higher non-performing loan levels and adverse risk rating changes.
Years ended December 31, | Years ended December 31, | |||||||||||||||||||||||||||||||||||||
Change 2008 | Change 2007 | Change 2009 | Change 2008 | |||||||||||||||||||||||||||||||||||
(in thousands) | 2008 | 2007 | 2006 | over 2007 | over 2006 | 2009 | 2008 | 2007 | over 2008 | over 2007 | ||||||||||||||||||||||||||||
Wealth Management revenue | $ | 10,848 | $ | 13,980 | $ | 13,809 | $ | (3,132 | ) | $ | 171 | $ | 4,524 | $ | 5,916 | $ | 7,159 | $ | (1,392 | ) | $ | (1,243 | ) | |||||||||||||||
Service charges on deposit accounts | 4,376 | 3,228 | 2,228 | 1,148 | 1,000 | 5,012 | 4,376 | 3,228 | 636 | 1,148 | ||||||||||||||||||||||||||||
Other service charges and fee income | 1,000 | 852 | 586 | 148 | 266 | 963 | 1,000 | 852 | (37 | ) | 148 | |||||||||||||||||||||||||||
Gain on sale of branches/charter | 3,400 | - | - | 3,400 | - | |||||||||||||||||||||||||||||||||
Gain (loss) on sale of other real estate | 552 | (48 | ) | 2 | 600 | (50 | ) | |||||||||||||||||||||||||||||||
Gain on state tax credits, net | 4,201 | 792 | - | 3,409 | 792 | |||||||||||||||||||||||||||||||||
Gain on sale of securities | 161 | 233 | - | (72 | ) | 233 | ||||||||||||||||||||||||||||||||
Sale of branches/charter | - | 3,400 | - | (3,400 | ) | 3,400 | ||||||||||||||||||||||||||||||||
Sale of other real estate | (436 | ) | 552 | (48 | ) | (988 | ) | 600 | ||||||||||||||||||||||||||||||
State tax credit activity, net | 1,035 | 4,201 | 792 | (3,166 | ) | 3,409 | ||||||||||||||||||||||||||||||||
Sale of securities | 955 | 161 | 233 | 794 | (72 | ) | ||||||||||||||||||||||||||||||||
Extinguishment of debt | 7,388 | - | - | 7,388 | - | |||||||||||||||||||||||||||||||||
Miscellaneous income | 735 | 636 | 291 | 99 | 345 | 436 | 735 | 636 | (299 | ) | 99 | |||||||||||||||||||||||||||
Total noninterest income | $ | 25,273 | $ | 19,673 | $ | 16,916 | $ | 5,600 | $ | 2,757 | $ | 19,877 | $ | 20,341 | $ | 12,852 | $ | (464 | ) | $ | 7,489 | |||||||||||||||||
24
2007. Employee compensation and benefits increased results. Professional, legal and consulting increased due to the Arizona de novo bank activities, consulting services in Wealth Management and various legal matters.
Noninterest income decreased 2% during 2009.The 2009 results include a $7.4 million pre-tax gain from the extinguishment of debt. See Item 8, Note 2 – Loan Participation Restatement for more information. The 2008 results include a $3.4 million pre-tax gain on the sale of the Great American charter along with the Desoto, Kansas and the Liberty, Missouri branches. Excluding these amounts, noninterest income decreased $4.5 million, or 26%, during 2009. This decrease is mainly due to lower wealth management revenue and lower gains from the state tax credit activities.
Noninterest income increased 28%58% during 2008. Our ratio of noninterest income to total revenue at December 31, 2008 was 27%23%, compared to 24%17% in 2007.$3.1$1.2 million, or 22%17%, from 2007. This decrease is a result of lower revenue and margins from the Trust division and Millennium. Revenues from the Trust division decreased $1.2 million, or 17%, due to the declining market value of assets under management and client attrition related to advisor turnover experienced earlier this year.turnover. Assets under administration were $1.2 billion at December 31, 2008, a 28% decrease from one year ago.Millennium revenues were $4.9 million, a decrease of $1.9 million, or 28%, due to lower levels of paid premium sales and slightly lower sales margins. Producer sales volumes and carrier commission payouts remain constrained due to continued consolidation of distributors in the industry, uncertainty in the financial markets and tougher underwriting for large insurance cases.GainComparison 2007 vs. 2006Noninterest income increased 16% during 2007. Our ratio of fee income to total revenue at December 31, 2007 was 24%, flat with 2006. Wealth Management revenue increased $171,000, or 1% from 2006. This relatively small increase compared to the 2006 increase is the result of lower revenue and margins from Millennium. Revenues from the Trust division increased $370,000, or 5%, while revenues from Millennium decreased by almost $200,000.The decline in Millennium revenue was the result of less favorable carrier mix and higher commission payouts to direct producers.Shift in carrier mix – Throughout 2007, more business was placed with certain carriers whose contractual payouts to Millennium were lower than other carriers, thus impacting Millennium’s revenue on this business. The decision on where to place business was based on several factors, including underwriting, product features, and carrier service levels.Producer mix – During 2007, more production came from producers who earn higher payouts from Millennium, thus lowering Millennium’s net revenue.Assets under administration were $1.7 billion at December 31, 2007, a 4% increase over 2006.Increases in Service charges on deposit accounts were primarily due to incremental activity of Great American along with increased account activity. Other service charges and fee income increases were the result of higher fee volumes on debit cards, merchant processing and health savings accounts along with Great American deposit fee income.25In December 2007, we elected to sell and reinvest a portion of our investment portfolio as part of a restructuring effort to lengthen the portfolio duration and improve our overall expected return. We sold approximately $39.0 million of agency investments realizing a gain of $233,000 on these sales. In December, we reinvested approximately $19.0 million of the proceeds in collateralized mortgage obligations and reinvested the remaining $20.0 million in first quarter of 2008.Miscellaneous income in 2007 includes $268,000 from the sale of a holding company investment in an investment management firm.
The following table presents a comparative summary of the major components of noninterest expenses.expense.Years ended December 31, Change 2008 Change 2007 (in thousands) 2008 2007 2006 over 2007 over 2006 Employee compensation and benefits $ 31,024 $ 29,555 $ 25,247 $ 1,469 $ 4,308 Occupancy 4,246 3,901 2,966 345 935 Furniture and equipment 1,470 1,439 1,028 31 411 Data processing 2,187 1,911 1,431 276 480 Communications 693 668 546 25 122 Director related expense 481 409 508 72 (99 ) Meals and entertainment 1,484 1,878 1,744 (394 ) 134 Marketing and public relations 704 708 985 (4 ) (277 ) FDIC and other insurance 2,055 846 574 1,209 272 Amortization of intangibles 1,444 1,604 1,128 (160 ) 476 Impairment charges related to Millennium Brokerage Group 9,200 - - 9,200 - Postage, courier, and armored car 928 953 845 (25 ) 108 Professional, legal, and consulting 2,021 1,447 1,102 574 345 Loan, legal and Other Real Estate (ORE) 1,717 501 252 1,216 249 Other taxes 568 626 437 (58 ) 189 Other 3,283 3,070 2,601 213 469 Total noninterest expense $ 63,505 $ 49,516 $ 41,394 $ 13,989 $ 8,122 Years ended December 31, Change 2009 Change 2008 (in thousands) 2009 2008 2007 over 2008 over 2007 Employee compensation and benefits $ 25,969 $ 27,656 $ 27,412 $ (1,687 ) $ 244 Occupancy 4,709 3,985 3,651 724 334 Furniture and equipment 1,425 1,390 1,366 35 24 Data processing 2,147 2,139 1,873 8 266 Communications 556 536 502 20 34 Director related expense 459 481 409 (22 ) 72 Meals and entertainment 1,037 1,181 1,317 (144 ) (136 ) Marketing and public relations 504 674 622 (170 ) 52 FDIC and other insurance 4,204 1,617 911 2,587 706 Amortization of intangibles 482 599 692 (117 ) (93 ) Goodwill impairment charges 45,377 - - 45,377 - Postage, courier, and armored car 772 863 891 (91 ) (28 ) Professional, legal, and consulting 2,278 1,971 1,417 307 554 Loan, legal and other real estate expense 4,788 1,717 501 3,071 1,216 Other taxes 566 542 471 24 71 Other 3,154 3,425 2,660 (271 ) 765 Total noninterest expense $ 98,427 $ 48,776 $ 44,695 $ 49,651 $ 4,081 20082009 vs. 20072008
Noninterest expense increased $49.7 million, or 102%, in 2009. The increase was primarily due to a $45.4 million goodwill impairment charge associated with the banking segment. Excluding the goodwill impairment charge, noninterest expenses increased $14.0$4.3 million, or 28%9%. The Company’s efficiency ratio for 2009 was 110%. Excluding the goodwill impairment charge, the efficiency ratio was 59%, compared to 56% in 2008. This increase is mainly due$9.2 millionthe final stock payment pursuant to the expiration of goodwill impairment charges associated with Millennium and a $1.0 millionan executive retention agreement associated with the acquisition of Great American. Excluding these charges, noninterestthis amount, employee compensation and benefits decreased $687,000 or 3%, primarily due to headcount reductions and stringent controls on staffing and compensation levels.$3.8$4.0 million, or 8%.9%, in 2008. The Company’s efficiency ratio for 2008 is 69%. Excluding the impairment charges, the retention payment and the $3.4 million branch sale gains, the efficiency ratio is56% compared to 61%, unchanged from in 2007.We compensate our associates in ways to attract and retain top performers and to provide base salary, incentives and rewards that incent the behaviors consistent with a high-performing company. We have implemented a disciplined process for managing the performance of our associates against defined business goals and results. The process includes frequent and candid performance feedback, measures individual contributions, differentiates individual performance and reinforces contribution with highly differentiated rewards. Two major components of our compensation program are the variable-pay incentive bonus pool and the Long-Term Incentive Plan (“LTIP”.)$1.5 million,$244,000, or 5%1%, over 2007. Included in the increase is $1.0 million related to the final stock payment pursuant to the expiration of an executive retention agreement associated with the acquisition of Great American. The incremental impact of the MillenniumExcluding this charge, employee compensation and benefits decreased $756,000 or 3% due to the December 31, 2007 restructuring and an increase in compensation expense for various stock programs associated with our LTIP also contributed to the increase. Lowerlower variable compensation expenses driven by Company financial results offset these expenses.include $8.7 million for the goodwill impairment charge and a $500,000 impairment charge on the customer related intangible asset associated with Millennium. Excluding these charges, all other expense categories increased $3.3$3.8 million or 17%,22% over 2007.26$1.2 million$706,000 due to higher FDIC insurance premiums (due to a higher rate structure imposed by the FDIC on all insured financial institutions.) See “Supervision and Regulation – Deposit Insurance Fund” in Part I – Item I for more information.OREother real estate expenses were due to increased levels of nonperforming loans and OREother real estate properties.Comparison2007 vs. 2006The Company’s efficiency ratioMillennium for 2007 was 61%, unchanged from 2006. Noninterest expenses increased 20%, or $8.1$4.0 million in 2007. Approximately $2.8cash, resulting in a $1.6 million pre-tax loss. As a result of the sale, we have reclassified the results of Millennium for the current and prior periods to discontinued operations. The amount of the loss on the sale is primarily due to the write-off of the remaining goodwill associated with the Millennium reporting unit.this increase isnet income from discontinued operations in 2007. The 2008 loss includes $9.2 million of pre-tax goodwill impairment charges. Lower levels of paid premium sales and lower sales margins over the last two years significantly reduced Millennium’s operating results.additionsale of Great AmericanMillennium which is reported as discontinued operations for all periods. The following items were included in Income tax (benefit) expense and $2.5 million was due toimpacted the full2009 effective tax rate:impactwarranted the release of NorthStar. Excluding these amounts, noninterest expenses increased $2.8 million, or 7%.
Employee compensation and benefits. Employee compensation and benefits increased $4.3 million. Increases$324,000 of $1.3 million werereserves related to Great American. Excluding these expenses, employee compensation and benefits increased $3.0 million, or 12%. The increase was due to salaries and relatedcertain state tax positions;
All other expense categories.All other expense categories include $1.5 million for Great American in 2007. Excluding Great American, all other expense categories increased $2.3 million, or 15%, over 2006.
Occupancy expense increasescertain federal tax items were due to scheduled rent increases on various Company facilities along with related leasehold improvements completed at the Operations Center.
Furniture and equipment increases were due to expansion at the Operations Center and in the Kansas City region, including Great American.
Data processing expenses increased due to upgrades to the Company’s main operating system, licensing fee increases for our core banking system as a resultreleased;
FDIC and other insurance increased $201,000 due to higher FDIC insurance premiums (due to a higher rate structure imposed by the FDIC on all insured financial institutions.)
Amortizationfederal tax benefits of intangibles$720,000 related to NorthStar was $409,000 in 2007 compared to $215,000 in 2006. In 2007, the amortization on the Great American core deposit intangible was $283,000. See Item 8, Note 9 – Goodwill and Intangible Assets for more information.
Professional, legal and consulting increased due to new business initiatives and the addition of Great American.
Other noninterest expense includes $270,000 for Great American. On September 30, 2007, EFSC Capital Trust I redeemed all of its $4.0 million variable rate trust preferred securities and its variable rate common securities. At the time of the redemption, the Company recognized an $82,000 charge in noninterest expense for unamortized debt issuance costs related to this instrument. The remaining increase is related to amortization on ourlow income housing tax creditcredits from a limited partnership increases in bank charges including ATM charges and other outside services.interest.
27
Minority Interest in Net Income of Consolidated Subsidiary
Effective December 31, 2007, the Company acquired the remaining 40% of Millennium for $1.5 million in cash. See Item 8, Note 2 – Acquisitions and Divestitures for more information.
Income Taxes
the expiration of the statute of limitations for the 2004 tax year warranted the release of $436,000 of reserves related to certain state tax positions;
reserves associated with various tax benefits of $80,000 related to certain federal tax items were released; and
recognition of federal tax benefits of $511,000 related to low income housing tax credits from a limited partnership interest.
In 2007, the effective tax rate
the expirationnet loss available to common shareholders of the statute of limitations$0.28 per diluted share for the 2003 tax year warranted the releasefourth quarter of $375,000 of reserves on certain state tax positions;
reserves related to various tax benefits of $68,000 related to certain federal tax items were released; and
recognition of federal tax benefits of $242,000 related to low income housing tax credits from a limited partnership interest.
Fourth Quarter 2008 Discussion
2008.For the quarter ended December 31, 2008,
fourth quarter of 2008.
The provision for loan losses was $14.1 million forstate tax credit brokerage activities which generated $62,000 in gains in the fourth quarter of 2008 compared with $2.52009 versus $2.6 million in the fourth quarter of 2007. The increase2008. While sales activity remained strong, as the Company generated $975,000 in gains from the provision was due to an increase in nonperforming loans during the quartersale of $6.1 million (versus $4.2 millionstate tax credits in the fourth quarter of 2007), and adverse risk rating changes primarily2009 compared to $708,000 in the residential housing sectorprior year period, recording the tax credit assets and related interest rate hedges to fair value offset $913,000 of our portfolio.
Noninterest income was $7.6 million duringthe sales gains in the fourth quarter ofquarter.
decreases was $2.1 million gain from the extinguishment of debt related to the accounting for loan participations.
28
Income tax benefits were $3.1 million$372,000 during the fourth quarter of 2008 versus income tax expense of $2.02009 compared to $2.9 million in the same period in 2007.2008. The effective tax rate was (44.2%(46.5%) for the fourth quarter of 20082009 compared to 28.9%(45.4%) for the fourth quarter of 2007. The fourth quarter 2008 effective tax rate includes a tax benefit of $436,000 for various tax reserves that were released as a result of the statute of limitations expiring.
2008.
loans.
Goodwill and intangible assets were $52.0 million at December 31, 2008, compared to $63.2 million at December 31, 2007, a decrease of $11.2$49.4 million. The decrease in goodwill and intangible assets was primarily relateddue to $45.4 million of impairment charges related to Millennium.the Banking segment and the write-off of the remaining Millennium goodwill and intangible as a result of the Millennium sale. See Item 8, Note 910 – Goodwill and Intangible Assets for more information.
our Arizona acquisition.
As mentioned previously, while we typically experience a seasonal increase in deposits duringloan participations. These secured borrowings were removed from the fourth quarter, the effect was muted in the fourth quarterbalance sheet as of 2008 due to the investor flight to Treasury markets. Nevertheless, our core deposits increased during the fourth quarter, and our Treasury Management pipelines remain strong.
Through November of 2008, we utilized short-term FHLB advances along with brokered certificates of deposit to fund shortfalls due to loan demand. In December 2008, following the Federal Open Market Committee meeting, we began utilizing the Federal Reserve discount window program which lowered our overnight borrowing rate to 0.50%. As a result, we replaced all short-term FHLB advances with Federal Reserve advances at a lower overall cost. At December 31, 2008, FHLB advances were $120.0 million compared to $153.0 million at December 31, 2007. Federal funds purchased from the Federal Reserve were $19.4 million at December 31, 2008.
During 2008, subordinated debentures increased by $27.5 million. See Item 8, Note 11 – Subordinated Debentures for more information.
2009.
On January 25, 2010, the Company completed the sale of 1,931,610 shares, or $15.0 million of its common stock in a private placement offering.
29
Nearly two-thirds of our Weak loan demand and lower line usage due to the stressed real estate markets, business deleveraging, and lackluster local economies, along with higher net charge-offs all contributed to the decline in loan growth in 2008 was from our St. Louis units and over 60% of the 2008 net growth was to commercial and industrial businesses. balances.
participations purchased, met the definition of a “Shared National Credit”; however, only three of the relationships, or $12.8 million, were considered out of our market.
December 31, | ||||||||||||||||||||
(in thousands) | 2008 | 2007 | 2006 | 2005 | 2004 | |||||||||||||||
Commercial and industrial | $ | 556,210 | $ | 476,184 | $ | 352,914 | $ | 265,488 | $ | 253,594 | ||||||||||
Real estate: | ||||||||||||||||||||
Commercial | 829,476 | 690,868 | 576,172 | 410,382 | 328,986 | |||||||||||||||
Construction | 337,550 | 266,111 | 196,851 | 138,318 | 127,180 | |||||||||||||||
Residential | 228,772 | 170,510 | 150,244 | 151,575 | 149,293 | |||||||||||||||
Consumer and other | 25,167 | 37,759 | 35,542 | 36,616 | 39,452 | |||||||||||||||
Total Loans | $ | 1,977,175 | $ | 1,641,432 | $ | 1,311,723 | $ | 1,002,379 | $ | 898,505 | ||||||||||
December 31, | ||||||||||||||||||||
2008 | 2007 | 2006 | 2005 | 2004 | ||||||||||||||||
Commercial and industrial | 28.1 | % | 29.0 | % | 26.9 | % | 26.5 | % | 28.2 | % | ||||||||||
Real estate: | ||||||||||||||||||||
Commercial | 42.0 | % | 42.1 | % | 43.9 | % | 40.9 | % | 36.6 | % | ||||||||||
Construction | 17.1 | % | 16.2 | % | 15.0 | % | 13.8 | % | 14.2 | % | ||||||||||
Residential | 11.6 | % | 10.4 | % | 11.5 | % | 15.1 | % | 16.6 | % | ||||||||||
Consumer and other | 1.2 | % | 2.3 | % | 2.7 | % | 3.7 | % | 4.4 | % | ||||||||||
Total Loans | 100.0 | % | 100.0 | % | 100.0 | % | 100.0 | % | 100.0 | % |
December 31, | ||||||||||||||||||||
Restated | Restated | Restated | Restated | |||||||||||||||||
(in thousands) | 2009 | 2008 | 2007 | 2006 | 2005 | |||||||||||||||
Commercial and industrial | $ | 558,016 | $ | 675,216 | $ | 549,479 | $ | 380,065 | $ | 278,996 | ||||||||||
Real estate: | ||||||||||||||||||||
Commercial | 820,248 | 887,963 | 720,072 | 597,547 | 424,390 | |||||||||||||||
Construction | 224,389 | 378,092 | 301,710 | 207,189 | 151,185 | |||||||||||||||
Residential | 214,067 | 235,019 | 175,258 | 156,109 | 157,115 | |||||||||||||||
Consumer and other | 16,540 | 25,167 | 37,759 | 35,542 | 36,616 | |||||||||||||||
Total Loans | $ | 1,833,260 | $ | 2,201,457 | $ | 1,784,278 | $ | 1,376,452 | $ | 1,048,302 | ||||||||||
December 31, | ||||||||||||||||||||
Restated | Restated | Restated | Restated | |||||||||||||||||
2009 | 2008 | 2007 | 2006 | 2005 | ||||||||||||||||
Commercial and industrial | 30.4 | % | 30.7 | % | 30.8 | % | 27.6 | % | 26.6 | % | ||||||||||
Real estate: | ||||||||||||||||||||
Commercial | 44.7 | % | 40.3 | % | 40.4 | % | 43.4 | % | 40.5 | % | ||||||||||
Construction | 12.2 | % | 17.2 | % | 16.9 | % | 15.1 | % | 14.4 | % | ||||||||||
Residential | 11.7 | % | 10.7 | % | 9.8 | % | 11.3 | % | 15.0 | % | ||||||||||
Consumer and other | 1.0 | % | 1.1 | % | 2.1 | % | 2.6 | % | 3.5 | % | ||||||||||
Total Loans | 100.0 | % | 100.0 | % | 100.0 | % | 100.0 | % | 100.0 | % | ||||||||||
30
In addition to segmenting the Company’s loan portfolio by collateral or call report code, following
% of portfolio | ||||||
Industry | 2008 | 2007 | ||||
Real Estate: | ||||||
Developers of retail, industrial warehouse and office buildings | 16 | % | 19 | % | ||
Commercial and residential subcontractors | 3 | % | 3 | % | ||
Real estate property managers | 6 | % | 4 | % | ||
Raw land for resale | 2 | % | 2 | % | ||
Other | 2 | % | 2 | % | ||
Total real estate | 29 | % | 30 | % | ||
Services: | ||||||
Financial and insurance companies | 7 | % | 6 | % | ||
Professional service firms | 4 | % | 5 | % | ||
Health care related services | 5 | % | 4 | % | ||
Others | 9 | % | 9 | % | ||
Total services | 25 | % | 24 | % | ||
Construction: | ||||||
Residential | 9 | % | 10 | % | ||
Commercial | 9 | % | 10 | % | ||
Multi-family housing | 2 | % | 2 | % | ||
Total construction | 20 | % | 22 | % | ||
Manufacturing | 10 | % | 10 | % | ||
Wholesale | 5 | % | 5 | % | ||
Retail Trade | 5 | % | 3 | % | ||
Transportation/Warehousing | 3 | % | 3 | % | ||
Other | 3 | % | 3 | % | ||
100 | % | 100 | % |
% of portfolio | ||||||
Restated | ||||||
2009 | 2008 | |||||
Real Estate: | ||||||
Construction & Land Development | 12 | % | 18 | % | ||
Commercial Owner Occupied | ||||||
Commercial & Industrial | 19 | % | 15 | % | ||
Churches/ Schools/ Nursing Homes/ Other | 1 | % | 1 | % | ||
Total | 20 | % | 16 | % | ||
Commercial Non Owner Occupied | ||||||
Retail | 8 | % | 6 | % | ||
Commercial Office | 7 | % | 6 | % | ||
Multi-Family Housing | 5 | % | 4 | % | ||
Industrial/ Warehouse | 3 | % | 3 | % | ||
Churches/ Schools/ Nursing Homes/ Other | 2 | % | 2 | % | ||
Total | 25 | % | 21 | % | ||
Residential: | ||||||
Owner Occupied | 8 | % | 7 | % | ||
Non Owner Occupied | 4 | % | 3 | % | ||
Total | 12 | % | 10 | % | ||
Total Real Estate | 69 | % | 65 | % | ||
Non Real Estate | ||||||
Commercial & Industrial | 30 | % | 34 | % | ||
Consumer & Other | 1 | % | 1 | % | ||
31 | % | 35 | % | |||
100 | % | 100 | % | |||
Note: (%) in
Repayment Within that category, there was $24.1 million of loans related to developerssecured by raw ground, $99.4 million of commercial construction, $99.9 million of residential construction, and $1.0 million of mixed use construction.
In total,St. Louis and Kansas City markets totaled 15.6% and 16.9%, respectively at year end, as compared to the residential real estate represents 12%national commercial office vacancy rate of the Company’s loan portfolio. When calculating this exposure, we include residential construction, the residential land speculators included in raw land and the residential subcontractors included in real estate. The majority of these loans are granted to builders within our primary markets. The Company requires third party disbursement on the majority of its builder portfolio and reviews projects regularly for progress status. Land Acquisition and Development (“LAD”) loans are included in residential (3%) and commercial (5%)16.3%.
Manufacturing industries are diverse, with the largest component being Aerospace Product and Parts Manufacturing (1%). The Wholesale industries are also diverse with the largest being Petroleum and Petroleum Product wholesalers (1%). Air Transportation companies (not rental or leasing) and Truck Transportation (2%) represent the largest portion of the Transportation/Warehousing category.
31
Loans Maturing or Repricing | ||||||||||||
After One | ||||||||||||
In One | Through | After | ||||||||||
(in thousands) | Year or Less | Five Years | Five Years | Total | ||||||||
Fixed Rate Loans(1) | ||||||||||||
Commercial and industrial | $ | 51,085 | $ | 126,321 | $ | 6,348 | $ | 183,754 | ||||
Real estate: | ||||||||||||
Commercial | 111,008 | 382,099 | 38,646 | 531,753 | ||||||||
Construction | 46,183 | 60,700 | 17,257 | 124,140 | ||||||||
Residential | 35,441 | 66,096 | 7,604 | 109,141 | ||||||||
Consumer and other | 8,433 | 2,605 | 1,717 | 12,755 | ||||||||
Total | $ | 252,150 | $ | 637,821 | $ | 71,572 | $ | 961,543 | ||||
Variable Rate Loans(1) (2) | ||||||||||||
Commercial and industrial | $ | 372,456 | $ | - | $ | - | $ | 372,456 | ||||
Real estate: | ||||||||||||
Commercial | 297,723 | - | - | 297,723 | ||||||||
Construction | 213,409 | - | - | 213,409 | ||||||||
Residential | 119,632 | - | - | 119,632 | ||||||||
Consumer and other | 12,412 | - | - | 12,412 | ||||||||
Total | $ | 1,015,632 | $ | - | $ | - | $ | 1,015,632 | ||||
Loans(1) (2) | ||||||||||||
Commercial and industrial | $ | 423,541 | $ | 126,321 | $ | 6,348 | $ | 556,210 | ||||
Real estate: | ||||||||||||
Commercial | 408,731 | 382,099 | 38,646 | 829,476 | ||||||||
Construction | 259,592 | 60,700 | 17,257 | 337,549 | ||||||||
Residential | 155,073 | 66,096 | 7,604 | 228,773 | ||||||||
Consumer and other | 20,845 | 2,605 | 1,717 | 25,167 | ||||||||
Total | $ | 1,267,782 | $ | 637,821 | $ | 71,572 | $ | 1,977,175 |
Loans Maturing or Repricing | ||||||||||||
After One | ||||||||||||
In One | Through | After | ||||||||||
(in thousands) | Year or Less | Five Years | Five Years | Total | ||||||||
Fixed Rate Loans (1) | ||||||||||||
Commercial and industrial | $ | 79,249 | $ | 120,855 | $ | 7,535 | $ | 207,639 | ||||
Real estate: | ||||||||||||
Commercial | 197,842 | 377,561 | 25,046 | 600,449 | ||||||||
Construction | 71,107 | 18,836 | 9,997 | 99,940 | ||||||||
Residential | 49,045 | 70,085 | 854 | 119,984 | ||||||||
Consumer and other | 3,296 | 1,629 | 0 | 4,925 | ||||||||
Total | $ | 400,539 | $ | 588,966 | $ | 43,432 | $ | 1,032,937 | ||||
Variable Rate Loans (1)(2) | ||||||||||||
Commercial and industrial | $ | 350,377 | $ | - | $ | - | $ | 350,377 | ||||
Real estate: | ||||||||||||
Commercial | 219,799 | - | - | 219,799 | ||||||||
Construction | 124,449 | - | - | 124,449 | ||||||||
Residential | 94,083 | - | - | 94,083 | ||||||||
Consumer and other | 11,615 | - | - | 11,615 | ||||||||
Total | $ | 800,323 | $ | - | $ | - | $ | 800,323 | ||||
Loans (1)(2) | ||||||||||||
Commercial and industrial | $ | 429,626 | $ | 120,855 | $ | 7,535 | $ | 558,016 | ||||
Real estate: | ||||||||||||
Commercial | 417,641 | 377,561 | 25,046 | 820,248 | ||||||||
Construction | 195,556 | 18,836 | 9,997 | 224,389 | ||||||||
Residential | 143,128 | 70,085 | 854 | 214,067 | ||||||||
Consumer and other | 14,911 | 1,629 | 0 | 16,540 | ||||||||
Total | $ | 1,200,862 | $ | 588,966 | $ | 43,432 | $ | 1,833,260 |
(1) | Loan balances | |
(2) | Not adjusted for impact of interest rate swap agreements. |
32
1)specific allocations based upon probable losses identified during a quarterly review of the loan portfolio,
2)allocations based principally on the Company’s risk rating formulas, and
3)an unallocated allowance based on subjective factors.
1) | specific allocations based upon probable losses identified during a quarterly review of the loan portfolio, | ||
2) | allocations based principally on the Company’s risk rating formulas, and | ||
3) | an unallocated allowance based on subjective factors. | ||
At December 31, 2009 the allocated allowance for loan losses on individually impaired loans was $8.1 million, or 21% of the total impaired loans, with the largest allocation being $1.5 million on one residential real estate project. At December 31, 2008, the allocated allowance for loan losses on individually impaired loans was $7.4 million, or 22% of the total impaired loans, with the largest allocation being $1.3 million on commercial ground.
loan volumes and concentrations;
specific industry conditions within portfolio segments;
recent loss experience in particular segments of the portfolio;
bank regulatory examination results; and
33
2009.
At December 31, | |||||||||||||||||||||||
(in thousands) | 2008 | 2007 | 2006 | 2005 | 2004 | ||||||||||||||||||
Allowance at beginning of year | $ | 21,593 | $ | 16,988 | $ | 12,990 | $ | 11,665 | $ | 10,590 | |||||||||||||
(Disposed) acquired allowance for loan losses | (50 | ) | 2,010 | 3,069 | - | - | |||||||||||||||||
Loans charged off: | |||||||||||||||||||||||
Commercial and industrial | 3,783 | 238 | 1,067 | 171 | 425 | ||||||||||||||||||
Real estate: | |||||||||||||||||||||||
Commercial | 1,384 | 43 | 25 | 424 | 577 | ||||||||||||||||||
Construction | 5,516 | 705 | - | - | - | ||||||||||||||||||
Residential | 2,367 | 1,418 | 504 | - | 100 | ||||||||||||||||||
Consumer and other | 31 | 125 | 2 | 49 | 194 | ||||||||||||||||||
Total loans charged off | 13,081 | 2,529 | 1,598 | 644 | 1,296 | ||||||||||||||||||
Recoveries of loans previously charged off: | |||||||||||||||||||||||
Commercial and industrial | 64 | 347 | 362 | 209 | 92 | ||||||||||||||||||
Real estate: | |||||||||||||||||||||||
Commercial | - | 15 | 1 | 74 | - | ||||||||||||||||||
Construction | 241 | 25 | - | - | - | ||||||||||||||||||
Residential | 56 | 17 | 31 | 177 | 42 | ||||||||||||||||||
Consumer and other | 11 | 105 | 6 | 19 | 25 | ||||||||||||||||||
Total recoveries of loans | 372 | 509 | 400 | 479 | 159 | ||||||||||||||||||
Net loan chargeoffs | 12,709 | 2,020 | 1,198 | 165 | 1,137 | ||||||||||||||||||
Provision for loan losses | 22,475 | 4,615 | 2,127 | 1,490 | 2,212 | ||||||||||||||||||
Allowance at end of year | $ | 31,309 | $ | 21,593 | $ | 16,988 | $ | 12,990 | $ | 11,665 | |||||||||||||
Average loans | $ | 1,828,434 | $ | 1,495,807 | $ | 1,159,110 | $ | 964,259 | $ | 847,270 | |||||||||||||
Total portfolio loans | 1,977,175 | 1,641,432 | 1,311,723 | 1,002,379 | 898,505 | ||||||||||||||||||
Nonperforming loans | 29,662 | 12,720 | 7,975 | 1,421 | 1,827 | ||||||||||||||||||
Net chargeoffs to average loans | 0.70 | % | 0.14 | % | 0.10 | % | 0.02 | % | 0.13 | ||||||||||||||
Allowance for loan losses to loans | 1.58 | 1.32 | 1.30 | 1.30 | 1.30 |
At December 31, | |||||||||||||||||||
Restated | Restated | Restated | Restated | ||||||||||||||||
(in thousands) | 2009 | 2008 | 2007 | 2006 | 2005 | ||||||||||||||
Allowance at beginning of year | $ | 33,808 | $ | 22,585 | $ | 17,475 | $ | 13,331 | $ | 11,974 | |||||||||
(Disposed) acquired allowance for loan losses | - | (50 | ) | 2,010 | 3,069 | - | |||||||||||||
Release of allowance related to loan participations sold | (1,383 | ) | - | - | - | - | |||||||||||||
Loans charged off: | |||||||||||||||||||
Commercial and industrial | 3,663 | 3,783 | 238 | 1,067 | 171 | ||||||||||||||
Real estate: | |||||||||||||||||||
Commercial | 5,710 | 1,384 | 43 | 25 | 424 | ||||||||||||||
Construction | 15,086 | 8,044 | 705 | - | - | ||||||||||||||
Residential | 5,931 | 2,367 | 1,418 | 504 | - | ||||||||||||||
Consumer and other | 42 | 31 | 125 | 2 | 49 | ||||||||||||||
Total loans charged off | 30,432 | 15,609 | 2,529 | 1,598 | 644 | ||||||||||||||
Recoveries of loans previously charged off: | |||||||||||||||||||
Commercial and industrial | 62 | 64 | 347 | 362 | 209 | ||||||||||||||
Real estate: | |||||||||||||||||||
Commercial | 66 | - | 15 | 1 | 74 | ||||||||||||||
Construction | 28 | 241 | 25 | - | - | ||||||||||||||
Residential | 422 | 56 | 17 | 31 | 177 | ||||||||||||||
Consumer and other | 12 | 11 | 105 | 6 | 19 | ||||||||||||||
Total recoveries of loans | 590 | 372 | 509 | 400 | 479 | ||||||||||||||
Net loan chargeoffs | 29,842 | 15,237 | 2,020 | 1,198 | 165 | ||||||||||||||
Provision for loan losses | 40,412 | 26,510 | 5,120 | 2,273 | 1,522 | ||||||||||||||
Allowance at end of year | $ | 42,995 | $ | 33,808 | $ | 22,585 | $ | 17,475 | $ | 13,331 | |||||||||
Average loans | $ | 2,098,275 | $ | 2,001,073 | $ | 1,599,596 | $ | 1,214,437 | $ | 1,014,697 | |||||||||
Total portfolio loans | 1,833,260 | 2,201,457 | 1,784,278 | 1,376,452 | 1,048,302 | ||||||||||||||
Nonperforming loans | 38,540 | 35,487 | 12,720 | 6,475 | 1,421 | ||||||||||||||
Net chargeoffs to average loans | 1.42 | % | 0.76 | % | 0.13 | % | 0.10 | % | 0.02 | % | |||||||||
Allowance for loan losses to loans | 2.35 | 1.54 | 1.27 | 1.27 | 1.27 |
December 31, | ||||||||||||||||||||||||||||||
2008 | 2007 | 2006 | 2005 | 2004 | ||||||||||||||||||||||||||
Percent by | Percent by | Percent by | Percent by | Percent by | ||||||||||||||||||||||||||
Category to | Category to | Category to | Category to | Category to | ||||||||||||||||||||||||||
(in thousands) | Allowance | Total Loans | Allowance | Total Loans | Allowance | Total Loans | Allowance | Total Loans | Allowance | Total Loans | ||||||||||||||||||||
Commercial and industrial | $ | 5,938 | 28.1 | % | $ | 4,106 | 29.0 | % | $ | 3,485 | 26.9 | % | $ | 3,172 | 26.5 | % | $ | 2,948 | 28.2 | % | ||||||||||
Real estate: | ||||||||||||||||||||||||||||||
Commercial | 10,764 | 42.0 | 7,004 | 42.1 | 5,710 | 43.9 | 4,245 | 40.9 | 3,671 | 36.6 | ||||||||||||||||||||
Construction | 6,482 | 17.1 | 5,241 | 16.2 | 2,927 | 15.0 | 1,048 | 13.8 | 1,037 | 14.2 | ||||||||||||||||||||
Residential | 2,749 | 11.6 | 2,624 | 10.4 | 2,056 | 11.5 | 1,774 | 15.1 | 1,903 | 16.6 | ||||||||||||||||||||
Consumer and other | 188 | 1.2 | 437 | 2.3 | 513 | 2.7 | 313 | 3.7 | 283 | 4.4 | ||||||||||||||||||||
Not allocated | 5,188 | 2,180 | 2,296 | 2,439 | 1,823 | |||||||||||||||||||||||||
Total allowance | $ | 31,309 | 100.0 | % | $ | 21,593 | 100.0 | % | $ | 16,988 | 100.0 | % | $ | 12,990 | 100.0 | % | $ | 11,665 | 100.0 | % |
December 31, | ||||||||||||||||||||||||||||||
Restated | Restated | Restated | Restated | |||||||||||||||||||||||||||
2009 | 2008 | 2007 | 2006 | 2005 | ||||||||||||||||||||||||||
Percent by | Percent by | Percent by | Percent by | Percent by | ||||||||||||||||||||||||||
Category to | Category to | Category to | Category to | Category to | ||||||||||||||||||||||||||
(in thousands) | Allowance | Total Loans | Allowance | Total Loans | Allowance | Total Loans | Allowance | Total Loans | Allowance | Total Loans | ||||||||||||||||||||
Commercial and industrial | $ | 9,715 | 30.4 | % | $ | 6,431 | 30.7 | % | $ | 4,582 | 30.8 | % | $ | 3,673 | 27.6 | % | $ | 3,295 | 26.6 | % | ||||||||||
Real estate: | ||||||||||||||||||||||||||||||
Commercial | 19,600 | 44.8 | 11,085 | 40.3 | 7,229 | 40.4 | 5,900 | 43.4 | 4,315 | 40.5 | ||||||||||||||||||||
Construction | 4,289 | 12.2 | 7,886 | 17.2 | 5,418 | 16.9 | 2,970 | 15.1 | 1,116 | 14.4 | ||||||||||||||||||||
Residential | 3,859 | 11.7 | 2,762 | 10.7 | 2,632 | 9.8 | 2,070 | 11.3 | 1,817 | 15.0 | ||||||||||||||||||||
Consumer and other | 45 | 0.9 | 188 | 1.1 | 438 | 2.1 | 513 | 2.6 | 313 | 3.5 | ||||||||||||||||||||
Not allocated | 5,487 | 5,456 | 2,286 | 2,349 | 2,476 | |||||||||||||||||||||||||
Total allowance | $ | 42,995 | 100.0 | % | $ | 33,808 | 100.0 | % | $ | 22,585 | 100.0 | % | $ | 17,475 | 100.0 | % | $ | 13,332 | 100.0 | % | ||||||||||
34
relationships, respectively.
At December 31, | ||||||||||||||||||||||||||||||||||||||||
At December 31, | Restated | Restated | Restated | Restated | ||||||||||||||||||||||||||||||||||||
(in thousands) | 2008 | 2007 | 2006 | 2005 | 2004 | 2009 | 2008 | 2007 | 2006 | 2005 | ||||||||||||||||||||||||||||||
Non-accrual loans | $ | 29,662 | $ | 12,720 | $ | 6,363 | $ | 1,421 | $ | 1,827 | $ | 37,441 | $ | 35,487 | $ | 12,720 | $ | 6,363 | $ | 1,421 | ||||||||||||||||||||
Loans past due 90 days or more and still accruing interest | - | - | 112 | - | - | |||||||||||||||||||||||||||||||||||
Loans past due 90 days or more | ||||||||||||||||||||||||||||||||||||||||
and still accruing interest | - | - | - | 112 | - | |||||||||||||||||||||||||||||||||||
Restructured loans | - | - | - | - | - | 1,099 | - | - | - | - | ||||||||||||||||||||||||||||||
Total nonperforming loans | 29,662 | 12,720 | 6,475 | 1,421 | 1,827 | 38,540 | 35,487 | 12,720 | 6,475 | 1,421 | ||||||||||||||||||||||||||||||
Foreclosed property | 13,868 | 2,963 | 1,500 | - | 123 | 26,372 | 13,868 | 2,963 | 1,500 | - | ||||||||||||||||||||||||||||||
Total nonperforming assets | $ | 43,530 | $ | 15,683 | $ | 7,975 | $ | 1,421 | $ | 1,950 | $ | 64,912 | $ | 49,355 | $ | 15,683 | $ | 7,975 | $ | 1,421 | ||||||||||||||||||||
Total assets | $ | 2,270,174 | $ | 1,999,118 | $ | 1,535,587 | $ | 1,286,968 | $ | 1,059,950 | $ | 2,365,655 | $ | 2,493,767 | $ | 2,141,329 | $ | 1,600,004 | $ | 1,332,673 | ||||||||||||||||||||
Total loans | 1,977,175 | 1,641,432 | 1,311,723 | 1,002,379 | 898,505 | 1,833,260 | 2,201,457 | 1,784,278 | 1,376,452 | 1,048,302 | ||||||||||||||||||||||||||||||
Total loans plus foreclosed property | 1,991,043 | 1,644,395 | 1,313,223 | 1,002,379 | 898,628 | 1,859,632 | 2,215,325 | 1,787,241 | 1,377,952 | 1,048,302 | ||||||||||||||||||||||||||||||
Nonperforming loans to loans | 1.50 | % | 0.77 | % | 0.49 | % | 0.14 | % | 0.20 | % | 2.10 | % | 1.61 | % | 0.71 | % | 0.47 | % | 0.14 | % | ||||||||||||||||||||
Nonperforming assets to loans plus foreclosed property | 2.19 | 0.95 | 0.61 | 0.14 | 0.22 | |||||||||||||||||||||||||||||||||||
Nonperforming assets to loans plus | ||||||||||||||||||||||||||||||||||||||||
foreclosed property | 3.49 | 2.23 | 0.88 | 0.58 | 0.14 | |||||||||||||||||||||||||||||||||||
Nonperforming assets to total assets | 1.92 | 0.78 | 0.52 | 0.11 | 0.18 | 2.74 | 1.98 | 0.73 | 0.50 | 0.11 | ||||||||||||||||||||||||||||||
Allowance for loan losses to nonperforming loans | 106.00 | % | 170.00 | % | 264.00 | % | 914.00 | % | 639.00 | % | 112.00 | % | 95.00 | % | 178.00 | % | 270.00 | % | 938.00 | % |
Commercial Real Estate | $ | 16.1 | |
Residential Construction/Land Acquisition and Development | 11.8 | ||
Commercial and Industrial | 1.7 | ||
Other | 0.1 | ||
Total | $ | 29.7 |
(in thousands) | Amount | ||
Construction Real Estate/ Land Acquisition and Development | $ | 21,682 | |
Commercial Real Estate | 9,384 | ||
Residential Real Estate | 4,130 | ||
Commercial and Industrial | 3,254 | ||
Consumer & Other | 90 | ||
Total | $ | 38,540 | |
2009 | ||||||||||||||||||||
Restated | Restated | |||||||||||||||||||
(in thousands) | 4th Qtr | 3rd Qtr | 2nd Qtr | 1st Qtr | Total Year | |||||||||||||||
Nonperforming loans beginning of period | $ | 46,982 | $ | 54,699 | $ | 54,421 | $ | 35,487 | $ | 35,487 | ||||||||||
Additions to nonaccrual loans | 16,318 | 17,900 | 26,790 | 31,421 | 92,429 | |||||||||||||||
Additions to restructured loans | 1,099 | - | - | - | 1,099 | |||||||||||||||
Chargeoffs | (11,519 | ) | (6,254 | ) | (5,018 | ) | (7,051 | ) | (29,842 | ) | ||||||||||
Other principal reductions | (559 | ) | (4,113 | ) | (5,252 | ) | (2,596 | ) | (12,520 | ) | ||||||||||
Moved to Other real estate | (11,339 | ) | (9,903 | ) | (11,497 | ) | (978 | ) | (33,717 | ) | ||||||||||
Moved to performing | (2,442 | ) | (5,347 | ) | (4,745 | ) | (1,862 | ) | (14,396 | ) | ||||||||||
Nonperforming loans end of period | $ | 38,540 | $ | 46,982 | $ | 54,699 | $ | 54,421 | $ | 38,540 | ||||||||||
The Company’s nonperforming loans meet the definition of “impaired loans” under U.S. GAAP. As of December 31, 2008, the Company had a loan for $3.6 million, which also came within the definition of impaired loans based upon our expectation that the borrower will be unable or unwilling to pay 100% of future contractual obligations under the contract. As of December 31, 2008, 2007 and 2006, the Company had 26, 19 and 12 impaired loan relationships, respectively.
35
2009 | ||||||||||||||||||||
4th Quarter | 3rd Quarter | 2nd Quarter | 1st Quarter | Year-to-date | ||||||||||||||||
Other real estate at beginning of period | $ | 19,273 | $ | 16,053 | $ | 13,251 | $ | 13,868 | $ | 13,868 | ||||||||||
Additions and expenses capitalized | ||||||||||||||||||||
to prepare property for sale | 11,342 | 9,915 | 11,788 | 1,155 | 34,200 | |||||||||||||||
Addition of Valley Capital ORE | 3,455 | - | - | - | 3,455 | |||||||||||||||
Writedowns in fair value | (587 | ) | (688 | ) | (506 | ) | (608 | ) | (2,389 | ) | ||||||||||
Sales | (7,111 | ) | (6,007 | ) | (8,480 | ) | (1,164 | ) | (22,762 | ) | ||||||||||
Other real estate at end of period | $ | 26,372 | $ | 19,273 | $ | 16,053 | $ | 13,251 | $ | 26,372 | ||||||||||
The severity of the economic downtown resulting from the constraintsfair value were recorded in Loan legal and other real estate owned based on current market activity shown in the financial markets caused us to expand our risk monitoring processes inappraisals. In addition, the fourth quarterCompany realized a net loss of 2008 and into the current year. Increased scrutiny$436,000 on sales of residential builders, commercial developers and commercial and industrial credit was undertaken. Steps taken include reviewing all non-watch list credits related to the residential builder and commercialother real estate developer segmentsand recorded these losses as part of Noninterest income. Management believes it is prudent to assess current cash flow information along with updated and current collateral valuations. For all commercial and industrial credits in excess of $1.0 million of exposure, we are also evaluating current financial information, updated financial projections and cash flow forecastssell these properties, rather than wait for fiscal 2009. Continued declines in the valuations of completed and unsold residential lot inventories due to the slowness of the residential housing markets are noted. Additionally, commercial retail and commercial office development show continuing evidence of weakness. As of February 28, 2009, our nonperforming assets were $56.9 million, a 30% increase from December 31, 2008.
an improved real estate market.
work through this adverse credit cycle so far, we believe that nonperforming asset levels will remain elevated in 2010 but manageable.
December 31, | December 31, | ||||||||||||||||||||||||||||||||||
2008 | 2007 | 2006 | 2009 | 2008 | 2007 | ||||||||||||||||||||||||||||||
(in thousands) | Amount | % | Amount | % | Amount | % | Amount | % | Amount | % | Amount | % | |||||||||||||||||||||||
Obligations of U.S. government agencies | $ | - | 0.0 | % | $ | 28,720 | 34.5 | % | $ | 95,452 | 85.8 | % | |||||||||||||||||||||||
Mortgage-backed securities | 95,659 | 88.4 | % | 41,087 | 49.3 | % | 9,617 | 8.6 | % | ||||||||||||||||||||||||||
Municipal bonds | 772 | 0.7 | % | 949 | 1.1 | % | 1,111 | 1.0 | % | ||||||||||||||||||||||||||
Obligations of U.S. Government agencies | $ | 27,189 | 9.2 | % | $ | - | 0.0 | % | $ | - | 0.0 | % | |||||||||||||||||||||||
Obligations of U.S. Government sponsored enterprises | 75,814 | 25.6 | % | - | 0.0 | % | 28,720 | 34.5 | % | ||||||||||||||||||||||||||
Obligations of states and political subdivisions | 3,408 | 1.2 | % | 772 | 0.7 | % | 949 | 1.1 | % | ||||||||||||||||||||||||||
Residential mortgage-backed securities | 176,050 | 59.5 | % | 95,659 | 88.4 | % | 41,087 | 49.3 | % | ||||||||||||||||||||||||||
FHLB capital stock | 7,517 | 6.9 | % | 9,106 | 10.9 | % | 3,007 | 2.7 | % | 8,476 | 2.9 | % | 7,517 | 6.9 | % | 9,106 | 10.9 | % | |||||||||||||||||
Other investments | 4,367 | 4.0 | % | 3,471 | 4.2 | % | 2,023 | 1.8 | % | 4,713 | 1.6 | % | 4,367 | 4.0 | % | 3,471 | 4.2 | % | |||||||||||||||||
$ | 108,315 | 100.0 | % | $ | 83,333 | 100.0 | % | $ | 111,210 | 100.0 | % | $ | 295,650 | 100.0 | % | $ | 108,315 | 100.0 | % | $ | 83,333 | 100.0 | % | ||||||||||||
During 2008,
the current interest rate environment. We also began to build a portfolio of federally tax free municipal securities.
36
2007.
Within 1 year | 1 to 5 years | 5 to 10 years | Over 10 years | No Stated Maturity | Total | |||||||||||||||||||||||||||||||
(in thousands) | Amount | Yield | Amount | Yield | Amount | Yield | Amount | Yield | Amount | Yield | Amount | Yield | ||||||||||||||||||||||||
Mortgage-backed securities | $ | 4,364 | 3.70 | % | $ | 79,758 | 4.95 | % | $ | 11,350 | 5.45 | % | $ | 187 | 5.21 | % | - | 0.00 | % | $ | 95,659 | 4.95 | % | |||||||||||||
Municipal bonds | 400 | 4.45 | % | 372 | 6.48 | % | - | 0.00 | % | - | 0.00 | % | - | 0.00 | % | 772 | 5.42 | % | ||||||||||||||||||
FHLB capital stock | - | 0.00 | % | - | 0.00 | % | - | 0.00 | % | - | 0.00 | % | 7,517 | 4.44 | % | 7,517 | 4.44 | % | ||||||||||||||||||
Other investments | - | 0.00 | % | - | 0.00 | % | - | 0.00 | % | - | 0.00 | % | 4,367 | 3.13 | % | 4,367 | 3.13 | % | ||||||||||||||||||
Total | $ | 4,764 | 3.76 | % | $ | 80,130 | 4.95 | % | $ | 11,350 | 5.45 | % | $ | 187 | 5.21 | % | $ | 11,884 | 3.96 | % | $ | 108,315 | 4.84 | % |
2009:
Within 1 year | 1 to 5 years | 5 to 10 years | Over 10 years | No Stated Maturity | Total | |||||||||||||||||||||||||||||||
(in thousands) | Amount | Yield | Amount | Yield | Amount | Yield | Amount | Yield | Amount | Yield | Amount | Yield | ||||||||||||||||||||||||
Obligations of U.S. Government agencies | $ | - | 0.00 | % | $ | 19,266 | 2.00 | % | $ | 2,720 | 2.21 | % | $ | 5,203 | 2.04 | % | $ | - | 0.00 | % | $ | 27,189 | 2.03 | % | ||||||||||||
Obligations of U.S. Government sponsored enterprises | 56,281 | 1.22 | % | 14,202 | 1.14 | % | - | 0.00 | % | 5,331 | 3.55 | % | - | 0.00 | % | 75,814 | 1.37 | % | ||||||||||||||||||
Obligations of states and political subdivisions | 280 | 4.40 | % | 298 | 6.07 | % | 310 | 5.94 | % | 2,520 | 0.61 | % | - | 0.00 | % | 3,408 | 1.88 | % | ||||||||||||||||||
Residential mortgage-backed securities | 8,740 | 3.91 | % | 137,459 | 3.53 | % | 24,690 | 3.53 | % | 5,161 | 5.12 | % | - | 0.00 | % | 176,050 | 3.59 | % | ||||||||||||||||||
FHLB capital stock | - | 0.00 | % | - | 0.00 | % | - | 0.00 | % | - | 0.00 | % | 8,476 | 1.78 | % | 8,476 | 1.78 | % | ||||||||||||||||||
Other investments | - | 0.00 | % | - | 0.00 | % | - | 0.00 | % | - | 0.00 | % | 4,713 | 3.57 | % | 4,713 | 3.57 | % | ||||||||||||||||||
Total | $ | 65,301 | 1.59 | % | $ | 171,225 | 3.16 | % | $ | 27,720 | 3.42 | % | $ | 18,215 | 3.15 | % | $ | 13,189 | 2.42 | % | $ | 295,650 | 2.81 | % | ||||||||||||
For the year ended December 31, | ||||||||||||||||||
2008 | 2007 | 2006 | ||||||||||||||||
Average | Weighted | Average | Weighted | Average | Weighted | |||||||||||||
(in thousands) | balance | average rate | balance | average rate | balance | average rate | ||||||||||||
Interest-bearing transaction accounts | $ | 121,371 | 1.28 | % | $ | 120,418 | 2.56 | % | $ | 102,327 | 2.28 | % | ||||||
Money market accounts | 687,867 | 2.00 | % | 579,029 | 4.07 | % | 496,590 | 3.87 | % | |||||||||
Savings accounts | 9,594 | 0.57 | % | 11,126 | 1.12 | % | 4,164 | 1.37 | % | |||||||||
Certificates of deposit | 588,561 | 4.17 | % | 503,926 | 5.18 | % | 357,706 | 4.54 | % | |||||||||
1,407,393 | 2.84 | % | 1,214,499 | 4.35 | % | 960,787 | 3.94 | % | ||||||||||
Noninterest-bearing demand deposits | 221,925 | -- | 215,610 | -- | 207,328 | -- | ||||||||||||
$ | 1,629,318 | 2.45 | % | $ | 1,430,109 | 3.70 | % | $ | 1,168,115 | 3.24 | % |
While we continued aggressive
For the year ended December 31, | ||||||||||||||||||
2009 | 2008 | 2007 | ||||||||||||||||
Weighted | Weighted | Weighted | ||||||||||||||||
(in thousands) | Average balance | average rate | Average balance | average rate | Average balance | average rate | ||||||||||||
Interest-bearing transaction accounts | $ | 122,563 | 0.54 | % | $ | 121,371 | 1.28 | % | $ | 120,418 | 2.56 | % | ||||||
Money market accounts | 636,350 | 0.96 | % | 687,867 | 2.00 | % | 579,029 | 4.07 | % | |||||||||
Savings accounts | 9,147 | 0.38 | % | 9,594 | 0.57 | % | 11,126 | 1.12 | % | |||||||||
Certificates of deposit | 786,631 | 2.98 | % | 588,561 | 4.17 | % | 503,926 | 5.18 | % | |||||||||
1,554,691 | 1.94 | % | 1,407,393 | 2.84 | % | 1,214,499 | 4.35 | % | ||||||||||
Noninterest-bearing demand deposits | 250,435 | -- | 221,925 | -- | 215,610 | -- | ||||||||||||
$ | 1,805,126 | 1.67 | % | $ | 1,629,318 | 2.45 | % | $ | 1,430,109 | 3.70 | % | |||||||
growth was particularly strong in the fourth quarter of 2009, with an increase of $32.0 million, or 12%.
(in thousands) | Total | ||
Three months or less | $ | 134,351 | |
Over three through six months | 101,333 | ||
Over six through twelve months | 137,362 | ||
Over twelve months | 147,151 | ||
Total | $ | 520,197 |
37
On December 12, 2008, we completed a private placement of $25.0 million in Convertible Trust Preferred Securities that qualify as Tier II regulatory capital until they would convert to EFSC common stock. In January, 2010, the Company added $15.0 million in common equity in a private placement offering to accredited investors. On a pro-forma basis, the additional equity increased the Company’s tangible common equity ratio to 6.08% from 5.48% at year end 2009 and its total risk-based regulatory capital ratio to 14.05% from 13.32%, enhancing its already well-capitalized position. A reconciliation of shareholders’ equity to tangible common equity and total assets to tangible assets is provided below in “Capital Resources”. The tangible common equity ratio is widely followed by analysts of bank and financial holding companies and we believe it is an important financial measure of capital strength even though it is considered to be a non-GAAP measure. We may also seek the approval of our regulators to utilize cash available to us to repurchase all or a portion of the securities that we issued to the U. S. Treasury. interest-bearing deposits.(in thousands) Total Three months or less $ 98,862 Over three through six months 113,068 Over six through twelve months 146,102 Over twelve months 85,034 Total $ 443,067
Since September 2008, we have raised $62.5$75.0 million in regulatory capital, raising our risk-based capital ratio to 12.81%13.32% - well in excess of the regulatory guidelines. On September 30, 2008, Enterprise completed a $2.5 million private placement of subordinated capital notes. In October 2008, given the difficult economic environment and the Company’s expectation to continue its growth, the Board approved the addition of $60.0 million in regulatory capital. The Company was approved by the U.S. Treasury for a $62.0 million Capital Purchase Program investment. At the same time, the Company had the opportunity to privately place a Convertible Trust Preferred Security offering. As a result, the Company decided to take advantage of both the private and public capital sources.And onOn December 19, 2008, we received $35.0 million from the U.S. Treasury under the Capital Purchase Program.WeIn December 2008, we also injected $18.0 million into Enterprise to support continued loan growth and bolster its capital ratio.ratios. Subject to other demands for cash, we expect to use the remainingour capital funds to support continuing loan growth and strengthening our capital position as appropriate. Some portion of this additional capital may also be deployed to take advantage of acquisition opportunities that may emerge from the current unsettled nature of the financial industry.
The objective of liquidity management is to ensure we have the ability to generate sufficient cash or cash equivalents in a timely and cost-effective manner to meet itsour commitments as they become due. Typical demands on liquidity are deposit run-off from demand deposits, maturing time deposits which are not renewed, and fundings under credit commitments to customers. Funds are available from a number of sources, such as from the core deposit base and from loans and securities repayments and maturities. Additionally, liquidity is provided from sales of the securities portfolio, fed fund lines with correspondent banks, the Federal Reserve and the FHLB, the ability to acquire large and brokered deposits and the ability to sell loan participations to other banks. These alternatives are an important part of our liquidity plan and provide flexibility and efficient execution of the asset-liability management strategy.liabilities.Ourliquidityliabilities. Our liquidity management framework includes measurement of several key elements, such as the loan to deposit ratio, wholesale deposits as a percentage of total deposits,liquidity ratio, and variousa dependency ratios used by banking regulators.ratio. The Company’s liquidity framework also incorporates contingency planning to assess the nature and volatility of funding sources and to determine alternatives to these sources. While core deposits and loan and investment repayments are principal sources of liquidity, funding diversification is another key element of liquidity management and is achieved by strategically varying depositor types, terms, funding markets, and instruments.2008,2009, net cash provided by operating activities was $4.9$8.5 million lessmore than for 2007.2008. Net cash used in investing activities was $66.0 million for 2009 versus $437.0 million for 2008 versus $151.0 million in 2007.2008. The increasedecrease of $286.0$370.0 million was primarily due an increaseto a decrease in loan volume. Net cash provided by financing activities was $306.0$102.0 million in 20082009 versus $230.0$305.0 million in 2007.2008. The change in cash provided by financing activities is due to increasesa decrease in brokered deposits in 2008, additional federal funds purchased, FHLB advances, additional subordinated debentures and TARP funds.ana negative impact on the Company’s ability to access these funding sources and, as a result, these factors are monitored on an ongoing basis as part of the liquidity management process. Enterprise is subject to regulations and, among other things, may be limited in its ability to pay dividends or transfer funds to the parent Company. Accordingly, consolidated cash flows as presented in the consolidated statements of cash flows may not represent cash immediately available for the payment of cash dividends to the Company’s shareholders or for other cash needs.38
The parent company’s liquidity is managed to provide the funds necessary to pay dividends to shareholders, service debt, invest in subsidiaries as necessary, and satisfy other operating requirements. The parent company had cash and cash equivalents of $19.5 million and $23.8 million, respectively, at December 31, 2009 and 2008. The parent company’s primary funding sources to meet its liquidity requirements are dividends from Enterprise and proceeds from the issuance of equity (i.e. stock option exercises). While our $16.0 million line of credit does not expire until April 2009, we do not have any current availability under the line due to our noncompliance with a certain covenant regarding classified loans as a percentage of bank equity and loan loss reserves. We may be unable to arrange for a holding company line of credit in 2009 given the uncertainties around bank industry performance. However, we believe our current level of cash at the holding company will be sufficient to meet all projected cash needs in 2009. See Item 8, Note 13 – Other borrowings and notes payable for more information regarding the line of credit.2010.2008,2009, the Company had $82.6 million of outstanding subordinated debentures as part of nine Trust Preferred Securities Pools. These securities are classified as debt but are included in regulatory capital and the related interest expense is tax-deductible, which makes them a very attractive source of funding. See Item 8, Note 1112 – Subordinated Debentures for more information.
Enterprise has a variety of funding sources available to increase financial flexibility. In addition to amounts currently borrowed at December 31, 2008,2009, Enterprise could borrow an additional $164.3$118.5 million available from the FHLB of Des Moines under blanket loan pledges and an additional $310.5$279.7 million available from the Federal Reserve Bank under pledged loan agreements. Enterprise has unsecured federal funds lines with fivethree correspondent banks totaling $70.0$30.0 million.the Company’sEnterprise’s liquidity objective. As of December 31, 2008,2009, the entire investment portfolio was available for sale. Of the $96.4$282.5 million investment portfolio available for sale, $72.8$211.6 million was pledged as collateral for public deposits, treasury, tax and loan notes, and other requirements. The remaining debt securities could be pledged or sold to enhance liquidity, if necessary.internal or external financial reports. Enterprise must remain “well-capitalized” in order to utilize the CDARS program. As of December 31, 2008, the Bank2009, Enterprise had $59.0$135.0 million of reciprocal CDARS deposits outstanding. We expect CDARS deposits to increase during 2009.2008,2009, we had no outstanding “one-way buy” deposits.2008,2009, we had $336.0$156.0 million of brokered certificates of deposit outstanding.the CompanyEnterprise enters into certain forms of off-balance sheet transactions, including unfunded loan commitments and letters of credit. These transactions are managed through the Company’s various risk management processes. Management considers both on-balance sheet and off-balance sheet transactions in its evaluation of the Company’sEnterprise’s liquidity. The CompanyEnterprise has $555.0$458.0 million in unused loan commitments as of December 31, 2008.2009. While this commitment level would be very difficult to fund given the Company’sEnterprise’s current liquidity resources, we know that the nature of these commitments is such that the likelihood of funding them is very low.2007, approximately $10,018,000, and $6,400,000, respectively, of cash and due from banks represented required reserves on deposits maintained by the CompanyEnterprise in accordance with Federal Reserve Bank requirements.39
As a financial holding company, the Company is subject to “risk based” capital adequacy guidelines established by the Federal Reserve. Risk-based capital guidelines were designed to relate regulatory capital requirements to the risk profile of the specific institution and to provide for uniform requirements among the various regulators. Currently, the risk-based capital guidelines require the Company to meet a minimum total capital ratio of 8.0% of which at least 4.0% must consist of Tier 1 capital. Tier 1 capital consists of (a) common shareholders’ equity (excluding the unrealized market value adjustments on the available-for-sale securities and cash flow hedges), (b) qualifying perpetual preferred stock and related additional paid in capital subject to certain limitations specified by the FDIC, and (c) minority interests in the equity accounts of consolidated subsidiaries less (d) goodwill, (e) mortgage servicing rights within certain limits, and (f) any other intangible assets and investments in subsidiaries that the FDIC determines should be deducted from Tier 1 capital. The FDIC also requires a minimum leverage ratio of 3.0%, defined as the ratio of Tier 1 capital to average total assets for banking organizations deemed the strongest and most highly rated by banking regulators. A higher minimum leverage ratio is required of less highly rated banking organizations. Total capital, a measure of capital adequacy, includes Tier 1 capital, allowance for loan losses, and subordinated debentures.2007 and 2006.2007. The following table summarizes the Company’s risk-based capital and leverage ratios at the dates indicated:At December 31 At December 31, (Dollars in thousands) 2008 2007 2006 2009 2008 2007 Tier I capital to risk weighted assets 8.89 % 9.32 % 9.60 % Tier 1 capital to risk weighted assets 10.67 % 8.89 % 9.32 % Total capital to risk weighted assets 12.81 % 10.54 % 10.83 % 13.32 % 12.81 % 10.54 % Leverage ratio (Tier I capital to average assets) 8.58 % 8.85 % 8.87 % Leverage ratio (Tier 1 capital to average assets) 8.96 % 8.67 % 8.62 % Tangible common equity to tangible assets 5.90 % 5.68 % 6.48 % 5.48 % 5.38 % 5.24 % Tier I capital $ 190,253 $ 164,957 $ 131,869 Tier 1 capital $ 215,099 $ 190,253 $ 164,957 Total risk-based capital $ 273,978 $ 186,549 $ 148,856 $ 268,454 $ 273,978 $ 186,549
For the years ended December 31, Restated Restated (In thousands) 2009 2008 2007 Shareholders' equity $ 163,912 $ 214,572 $ 172,149 Less: Preferred stock (31,802 ) (31,116 ) - Less: Goodwill (953 ) (48,512 ) (57,177 ) Less: Intangible assets (1,643 ) (3,504 ) (6,053 ) $ 129,515 $ 131,440 $ 108,919 Total assets $ 2,365,655 $ 2,493,767 $ 2,141,329 Less: Goodwill (953 ) (48,512 ) (57,177 ) Less: Intangible assets (1,643 ) (3,504 ) (6,053 ) Tangible assets $ 2,363,059 $ 2,441,751 $ 2,078,099 Tangible common equity to tangible assets 5.48 % 5.38 % 5.24 %
Market risk arises from exposure to changes in interest rates and other relevant market rate or price risk. The Company faces market risk in the form of interest rate risk through transactions other than trading activities. Market risk from these activities, in the form of interest rate risk, is measured and managed through a number of methods. The Company uses financial modeling techniques to measure interest rate risk. These techniques measure the sensitivity of future earnings due to changing interest rate environments. Guidelines established by the Bank’s Asset/Liability Management Committee and approved by the Company’s Board of Directors are used to monitor exposure of earnings at risk. General interest rate movements are used to develop sensitivity as the Company feels it has no primary exposure to a specific point on the yield curve. These limits are based on the Company’s exposure to a 100 basis points and 200 basis points immediate and sustained parallel rate move, either upward or downward.
Our interest rate sensitivity management seeks to avoid fluctuating interest margins to enhance consistent growth of net interest income through periods of changing interest rates. Interest rate sensitivity varies with different types of interest-earning assets and interest-bearing liabilities. We attempt to maintain interest-earning assets, comprised primarily of both loans and investments, and interest-bearing liabilities, comprised primarily of deposits, maturing or repricing in similar time horizons in order to minimize or eliminate any impact from market interest rate changes. In order to measure earnings sensitivity to changing rates, the Company uses a static gap analysis and earnings simulation model.gapGAP analysis starts with contractual repricing information for assets, liabilities, and off-balance sheet instruments. These items are then combined with repricing estimations for administered rate (interest-bearing demand deposits, savings, and money market accounts) and non-rate related products (demand deposit accounts, other assets, and other liabilities) to create a baseline repricing balance sheet. In addition, mortgage-backed securities are adjusted based on industry estimates of prepayment speeds.402008.2009. Significant assumptions used for this table include: loans will repay at historic repayment rates; interest-bearing demand accounts and savings accounts are interest sensitive due to immediate repricing, and fixed maturity deposits will not be withdrawn prior to maturity. A significant variance in actual results from one or more of these assumptions could materially affect the results reflected in the table.Beyond 5 years or no stated (in thousands) Year 1 Year 2 Year 3 Year 4 Year 5 maturity Total Interest-Earning Assets Securities available for sale $ 19,198 $ 15,160 $ 15,751 $ 17,618 $ 27,405 $ 1,299 $ 96,431 Other investments - - - - - 11,884 11,884 Interest-bearing deposits 14,384 - - - - - 14,384 Federal funds sold 2,637 - - - - - 2,637 Loans (1) 1,206,660 252,585 198,435 96,009 151,914 71,572 1,977,175 Loans held for sale 2,632 - - - - - 2,632 Total interest-earning assets $ 1,245,511 $ 267,745 $ 214,186 $ 113,627 $ 179,319 $ 84,755 $ 2,105,143 Interest-Bearing Liabilities Savings, NOW and Money market deposits $ 837,356 $ - $ - $ - $ - $ - $ 837,356 Certificates of deposit 520,432 140,719 44,246 1,775 442 453 708,067 Subordinated debentures 32,064 10,310 - 14,433 28,274 - 85,081 Other borrowings 127,210 20,800 300 7,000 - 10,807 166,117 Total interest-bearing liabilities $ 1,517,062 $ 171,829 $ 44,546 $ 23,208 $ 28,716 $ 11,260 $ 1,796,621 Interest-sensitivity GAP GAP by period $ (271,551 ) $ 95,916 $ 169,640 $ 90,419 $ 150,603 $ 73,495 $ 308,522 Cumulative GAP $ (271,551 ) $ (175,635 ) $ (5,995 ) $ 84,424 $ 235,027 $ 308,522 $ 308,522 Ratio of interest-earning assets to interest-bearing liabilities Periodic 0.82 1.56 4.81 4.90 6.24 7.53 1.17 Cumulative GAP as of December 31, 2008 0.82 0.90 1.00 1.05 1.13 1.17 1.17 Cumulative GAP as of December 31, 2007(2) 0.94 0.98 1.06 1.09 1.13 1.18 1.18 Beyond 5 years or no stated (in thousands) Year 1 Year 2 Year 3 Year 4 Year 5 maturity Total Interest-Earning Assets Securities available for sale $ 118,701 $ 40,556 $ 43,266 $ 17,030 $ 58,897 $ 4,011 $ 282,461 Other investments - - - - 13,189 13,189 Interest-bearing deposits 83,430 - - - - - 83,430 Federal funds sold 7,472 - - - - - 7,472 Loans (1) 1,201,974 187,344 169,030 182,070 92,842 - 1,833,260 Loans held for sale 4,243 - - - - - 4,243 Total interest-earning assets $ 1,415,820 $ 227,900 $ 212,296 $ 199,100 $ 151,739 $ 17,200 $ 2,224,055 Interest-Bearing Liabilities Savings, NOW and Money market deposits $ 841,435 $ - $ - $ - $ - $ - $ 841,435 Certificates of deposit 668,183 89,363 25,059 26,769 949 - 810,323 Subordinated debentures 42,374 - 14,433 25,774 - - 82,581 Other borrowings 60,138 5,300 22,000 - - 80,000 167,438 Total interest-bearing liabilities $ 1,612,130 $ 94,663 $ 61,492 $ 52,543 $ 949 $ 80,000 $ 1,901,777 Interest-sensitivity GAP GAP by period $ (196,310 ) $ 133,237 $ 150,804 $ 146,557 $ 150,790 $ (62,800 ) $ 322,278 Cumulative GAP $ (196,310 ) $ (63,073 ) $ 87,731 $ 234,288 $ 385,078 $ 322,278 $ 322,278 Ratio of interest-earning assets to interest-bearing liabilities Periodic 0.88 2.41 3.45 3.79 159.89 0.22 1.17 Cumulative GAP as of December 31, 2009 0.88 0.96 1.05 1.13 1.21 1.17 1.17 (1)Adjusted for the impact of the interest rate swaps. (2)For comparative purposes
shock, based primarily on the assumption that deposit rates are near a minimum. Given the very low level of short term interest rates, the falling interest rate shock simulations are fairly irrelevant.
41
Over 1 Year | Over 1 Year | ||||||||||||||||||||||
Less Than | Less than | Over | Less Than | Less than | Over | ||||||||||||||||||
(in thousands) | Total | 1 Year | 5 Years | 5 Years | Total | 1 Year | 5 Years | 5 Years | |||||||||||||||
Operating leases | $ | 12,249 | $ | 2,378 | $ | 5,646 | $ | 4,225 | $ | 18,625 | $ | 1,984 | $ | 8,574 | $ | 8,067 | |||||||
Certificates of deposit | 708,067 | 520,432 | 187,182 | 453 | 810,323 | 668,260 | 141,603 | 460 | |||||||||||||||
Subordinated debentures | 85,081 | - | - | 85,081 | 85,081 | - | - | 85,081 | |||||||||||||||
Federal Home Loan Bank advances | 119,957 | 81,050 | 28,100 | 10,807 | 128,100 | 20,800 | 27,300 | 80,000 | |||||||||||||||
Commitments to extend credit | 555,361 | 357,262 | 161,353 | 36,746 | 457,776 | 322,855 | 109,457 | 25,464 | |||||||||||||||
Standby letters of credit | 33,875 | 33,875 | - | - | 32,263 | 32,263 | - | - | |||||||||||||||
Private equity bank fund | 2,842 | - | 2,842 | - |
(1) | In the banking industry, interest-bearing obligations are principally utilized to fund interest-earning assets. As such, interest charges on related contractual obligations were excluded from reported amounts as the potential cash outflows would have corresponding cash inflows from interest-earning assets. |
42
In December 2007, SFAS No. 141 (revised 2007), “Business Combinations” (“SFAS 141(R)”) was issued. This statement replaces SFAS 141, and establishes several new principles and requirements for accounting for business combinations. The new accounting standard is effective for all business combinations consummated on or after December 15, 2008.
SFAS 142 requires that goodwill be
43
Historically, our goodwill impairment tests have been completed as of December 31 each year. Following the annual impairment test for 2006, the Company changed the goodwill impairment test date for the Millennium reporting unit to September 30 of each fiscal year. This change in the testing date was designed to provide sufficient time for independent experts to complete the Millennium reporting unit testing prior to year end reporting. The goodwill impairment test date for the Banking reporting unit did not change.
Under SFAS 142, businesses
SFAS 144 also requires long-lived
Step two of the impairment valuation contemplated a hypothetical acquisition of the assets and liabilities of Millennium. The intangible assets identified were trade name and customer lists. Significant assumptions and estimates used to determine the step two allocation include an expected discount rate, existing customer list and projected revenue from those customers.
In accordance with SFAS 142 and SFAS 144, we evaluated Millennium’sunit’s goodwill and intangible assets were evaluated for impairment as of September 30, 2008.March 31, 2009. In connection with these tests, we determined that margin pressures reducing Millennium revenues continued to negatively affect operating performance, thereby reducing the fair valuedeterioration in the general economic environment and the resulting decline in the Company’s share price and market capitalization in the first quarter of our investment in Millennium.2009 required a goodwill impairment charge. As a result, the Company recorded a $5.9$45.4 million, pre-tax goodwill impairment charge as of September 30, 2008. In the fourth quarter of 2008, due to continued pressuresMarch 31, 2009 thus eliminating all goodwill in the sales margin and resulting decreased earnings of Millennium, we identified and recorded an additional pre-tax goodwill impairment of $2.8 million and $500,000 of intangible asset impairment. Millennium’s goodwill and intangible assets were $3.1 million and $1.4 million, respectively,Banking segment at December 31, 2008. It is possible that additional impairment charges could occur in 2009.
Banking reporting unitAn independent third party performed the valuation of the Banking reporting unit. Step one of the impairment valuation utilized a combination of the income approach and the market approach. The income and market approaches were weighted at 67% and 33%, respectively. The weights reflect the relative importance of the methods used and serve as a means of simulating the thinking of hypothetical investors. Significant assumptions and estimates used to determine the step one impairment value included expected cash flows and annual growth rates, anticipated future earnings, operating margins and other indicators of value derived from market transactions of similar companies.time.
44
There was no goodwill or intangible impairment recorded in 2007 or 2006 for either the Millennium or Banking reporting units.
assets purchased and liabilities assumed.
In 2007, the Company executed an agreement to purchasepurchases the rights to receive 10-year streams of state tax credits at agreed upon discount rates. At December 31, 2007, the Company had purchased $23.0 million ofrates and sells such tax credits to Wealth Management clients. All state tax credits. Upon adoptioncredits purchased prior to 2009 are accounted for at fair value. All state tax credits purchased in 2009 are accounted for at lower of SFAS 157 and SFAS 159, thecost or fair value. The Company elected not to account for the state tax credit assetscredits purchased in 2009 at fair value. As a result,value in order to limit the state tax credits were re-measured to fair value. The effectvolatility of the re-measurement was reported as a cumulative-effect adjustment, which reduced opening retained earnings on January 1, 2008, by $365,000.
fair value changes in our consolidated statements of operations.
hierarchy.
45
Cash Flow Hedges – Derivatives designated as cash flow hedges are recorded at fair value. The effective portion of the change in fair value is recorded (net of taxes) as a component of other comprehensive income (“OCI”) in shareholders’ equity. Amounts recorded in OCI are subsequently reclassified into interest income or expense (depending on whether the hedged item is an asset or liability) when the underlying transaction affects earnings. The ineffective portion of the change in fair value is recorded in noninterest income. Upon dedesignation of a derivative financial instrument from a cash flow hedge relationship, any remaining amounts in OCI are recorded in noninterest income over the expected remaining life of the underlying forecasted hedge transaction. The net interest differential between the hedged item and the hedging derivative financial instrument are recorded as an adjustment to interest income or interest expense of the related asset or liability.
Fair Value Hedges – For derivatives designated as fair value hedges, the change in fair value of the derivative instrument and related hedged item are recorded in the related interest income or expense, as applicable, except for the ineffective portion, which is recorded in noninterest income in the consolidated statements of income.Theincome. The swap agreement is accounted for on an accrual basis with the net interest differential being recognized as an adjustment to interest income or interest expense of the related asset or liability.
Non-Designated Hedges– Certain derivative financial instruments are not designated as cash flow or as fair value hedges for accounting purposes. These non-designated derivatives are entered into to provide interest rate protection on net interest income or noninterest income but do not meet hedge accounting treatment.Changestreatment. Changes in the fair value of these instruments are recorded in interest income or noninterest income in the consolidated statements of incomeoperations depending on the underlying hedged item.
46
Page Number | ||
Report of Independent Registered Public Accounting Firm | 49 | |
Consolidated Balance Sheets at December 31, | ||
Consolidated Statements of | ||
ended December 31, 2009, 2008, | ||
Consolidated Statements of Shareholders’ Equity and Comprehensive (Loss) Income | ||
for the years ended December 31, 2009, 2008, | ||
Consolidated Statements of Cash Flows for the | ||
years ended December 31, 2009, 2008, | ||
Notes to Consolidated Financial Statements |
47
Management’s Report on Internal Control over Financial Reporting
The Company’s management is responsible for establishing and maintaining adequate internal control over financial reporting. The Company’s internal control over financial reporting is a process designed under the supervision of the CEO and CFO to provide reasonable assurance regarding reliability of financial reporting and preparation of the Company’s financial statements for external reporting purposes in accordance with U.S. GAAP.
The Company’s management assessed the effectiveness of the Company’s internal control over financial reporting as of December 31, 2008, based on the criteria set forth by the Committee of Sponsoring Organization of the Treadway Commission (COSO) in “Internal Control-Integrated Framework.” Based on the assessment, management determined that, as of December 31, 2008, the Company’s internal control over financial reporting was effective based on these criteria.
48
correct a misstatement.
Enterprise Financial Services Corp:We have audited Enterprise Financial Services Corp’s (the Company) internal control over financial reporting as of December 31, 2008, based on criteria established in Internal Control – Integrated Framework issued by the Committee of Sponsoring Organizations of the Treadway Commission (COSO). The Company’s management is responsible for maintaining effective internal control over financial reporting and for its assessment of the effectiveness of internal control over financial reporting, included in the accompanyingManagement’s Report on Internal Control over Financial Reporting. Our responsibility is to express an opinion on the Company’s internal control over financial reporting based on our audit.We conducted our audit in accordance with the standards of the Public Company Accounting Oversight Board (United States). Those standards require that we plan and perform the audit to obtain reasonable assurance about whether effective internal control over financial reporting was maintained in all material respects. Our audit included obtaining an understanding of internal control over financial reporting, assessing the risk that a material weakness exists, and testing and evaluating the design and operating effectiveness of internal control based on the assessed risk. Our audit also included performing such other procedures as we considered necessary in the circumstances. We believe that our audit provides a reasonable basis for our opinion.A company’s internal control over financial reporting is a process designed to provide reasonable assurance regarding the reliability of financial reporting and the preparation of financial statements for external purposes in accordance with generally accepted accounting principles. A company’s internal control over financial reporting includes those policies and procedures that (1) pertain to the maintenance of records that, in reasonable detail, accurately and fairly reflect the transactions and dispositions of the assets of the company; (2) provide reasonable assurance that transactions are recorded as necessary to permit preparation of financial statements in accordance with generally accepted accounting principles, and that receipts and expenditures of the company are being made only in accordance with authorizations of management and directors of the company; and (3) provide reasonable assurance regarding prevention or timely detection of unauthorized acquisition, use, or disposition of the company’s assets that could have a material effect on the financial statements.Because of its inherent limitations, internal control over financial reporting may not prevent or detect misstatements. Also, projections of any evaluation of effectiveness to future periods are subject to the risk that controls may become inadequate because of changes in conditions, or that the degree of compliance with the policies or procedures may deteriorate.In our opinion, the Company maintained, in all material respects, effective internal control over financial reporting as of December 31, 2008, based on criteria established inInternal Control – Integrated Framework issued by COSO.We also have audited, in accordance with the standards of the Public Company Accounting Oversight Board (United States), the consolidated balance sheets of the Company as of December 31, 2008 and 2007, and the related consolidated statements of operations, shareholders’ equity and comprehensive income, and cash flows for each of the years in the three-year period ended December 31, 2008, and our report dated March 13, 2009 expressed an unqualified opinion on those consolidated financial statements.St. Louis, MissouriMarch 13, 200949Report of Independent Registered Public Accounting FirmThe Board of Directors and ShareholdersEnterprise Financial Services Corp:20082009 and 2007,2008, and the related consolidated statements of income,operations, shareholders’ equity and comprehensive (loss) income, and cash flows for each of the years in the three-year period ended December 31, 2008.2009. These consolidated financial statements are the responsibility of the Company’s management. Our responsibility is to express an opinion on these consolidated financial statements based on our audits.20082009 and 2007,2008, and the results of itstheir operations and itstheir cash flows for each of the years in the three-year period ended December 31, 2008,2009, in conformity with U.S. generally accepted accounting principles.12 to the consolidated financial statements, the Company adopted the provisions of Statement of Financial Accounting Standards No. 157,Fair Value Measurements,2008 and Statement of Financial Accounting Standards No. 159,The Fair Value Option for Financial Assets and Financial Liabilities, including an amendment2007 financial statements have been restated to FASB Statement No. 115, on January 1, 2008.2008,2009, based on criteria established inInternal Control – Integrated Framework issued by the Committee of Sponsoring Organizations of the Treadway Commission (COSO), and our report dated March 13, 200912, 2010 expressed an unqualified opinion on the effectiveness of the Company’s internal control over financial reporting.St. Louis, MO
March 12, 2010St. Louis, MissouriMarch 13, 200950
Consolidated Balance Sheets
Years ended December 31, 20082009 and 20072008 December 31, (In thousands, except share and per share data) 2008 2007 Assets Cash and due from banks $ 25,626 $ 76,265 Federal funds sold 2,637 75,665 Interest-bearing deposits 14,384 1,719 Total cash and cash equivalents 42,647 153,649 Securities available for sale, at fair value 96,431 70,756 Other investments 11,884 12,577 Loans held for sale 2,632 3,420 Portfolio loans 1,977,175 1,641,432 Less: Allowance for loan losses 31,309 21,593 Portfolio loans, net 1,945,866 1,619,839 Other real estate 13,868 2,963 Fixed assets, net 25,158 22,223 Accrued interest receivable 7,557 8,334 State tax credits, held for sale, at fair value as of December 31, 2008 39,142 23,149 Goodwill 48,512 57,177 Intangibles, net 3,504 6,053 Other assets 32,973 18,978 Total assets $ 2,270,174 $ 1,999,118 Liabilities and Shareholders' Equity Deposits: Demand deposits $ 247,361 $ 278,313 Interest-bearing transaction accounts 126,644 131,141 Money market accounts 702,886 672,577 Savings 7,826 10,343 Certificates of deposit: $100k and over 520,197 347,318 Other 187,870 145,320 Total deposits 1,792,784 1,585,012 Subordinated debentures 85,081 56,807 Federal Home Loan Bank advances 119,957 152,901 Other borrowings 46,160 10,680 Notes payable - 6,000 Accrued interest payable 2,473 3,710 Other liabilities 5,931 10,859 Total liabilities 2,052,386 1,825,969 Shareholders' equity: Preferred stock, $0.01 par value; 5,000,000 shares authorized; 35,000 and 0 shares issued, respectively 31,116 - Common stock, $0.01 par value; 30,000,000 shares authorized; 12,876,981 and 12,482,357 shares issued, respectively 129 125 Treasury stock, at cost; 76,000 shares (1,743 ) (1,743 ) Additional paid in capital 115,111 104,127 Retained earnings 71,927 70,523 Accumulated other comprehensive income 1,248 117 Total shareholders' equity 217,788 173,149 Total liabilities and shareholders' equity $ 2,270,174 $ 1,999,118 December 31, (In thousands, except share and per share data) Restated 2009 2008 Assets Cash and due from banks $ 16,064 $ 25,626 Federal funds sold 7,472 2,637 Interest-bearing deposits 83,430 14,384 Total cash and cash equivalents 106,966 42,647 Securities available for sale 282,461 96,431 Other investments, at cost 13,189 11,884 Loans held for sale 4,243 2,632 Portfolio loans 1,833,260 2,201,457 Less: Allowance for loan losses 42,995 33,808 Portfolio loans, net 1,790,265 2,167,649 Other real estate 26,372 13,868 Fixed assets, net 22,301 25,158 Accrued interest receivable 7,751 7,557 State tax credits, held for sale, including $32,485 and $39,142 carried at fair value, respectively 51,258 39,142 Goodwill 953 48,512 Intangibles, net 1,643 3,504 Assets of discontinued operations held for sale 4,000 - Other assets 54,253 34,783 Total assets $ 2,365,655 $ 2,493,767 Liabilities and Shareholders' Equity Deposits: Demand deposits $ 289,658 $ 247,361 Interest-bearing transaction accounts 142,061 126,644 Money market accounts 690,552 702,886 Savings 8,822 7,826 Certificates of deposit: $100k and over 443,067 520,197 Other 367,256 187,870 Total deposits 1,941,416 1,792,784 Subordinated debentures 85,081 85,081 Federal Home Loan Bank advances 128,100 119,957 Other borrowings 39,338 272,969 Accrued interest payable 2,125 2,473 Other liabilities 5,683 5,931 Total liabilities 2,201,743 2,279,195 Shareholders' equity: Preferred stock, $0.01 par value; 5,000,000 shares authorized; 35,000 shares issued and outstanding 31,802 31,116 Common stock, $0.01 par value; 30,000,000 shares authorized; 12,958,820 and 12,876,981 shares issued, respectively 130 129 Treasury stock, at cost; 76,000 shares (1,743 ) (1,743 ) Additional paid in capital 117,000 115,112 Retained earnings 15,790 68,710 Accumulated other comprehensive income 933 1,248 Total shareholders' equity 163,912 214,572 Total liabilities and shareholders' equity $ 2,365,655 $ 2,493,767 51
Consolidated Statements of IncomeOperations
Years ended December 31, 2009, 2008 2007 and 20062007Years ended December 31, (In thousands, except per share data) 2008 2007 2006 Interest income: Interest and fees on loans $ 112,387 $ 116,847 $ 88,437 Interest on debt and equity securities: Taxable 4,722 4,571 4,246 Nontaxable 31 34 35 Interest on federal funds sold 211 481 1,340 Interest on interest-bearing deposits 83 62 76 Dividends on equity securities 547 522 284 Total interest income 117,981 122,517 94,418 Interest expense: Interest-bearing transaction accounts 1,554 3,078 2,332 Money market accounts 13,786 23,578 19,213 Savings 55 125 57 Certificates of deposit: $100 and over 18,127 18,329 12,386 Other 6,398 7,754 3,844 Subordinated debentures 3,536 3,859 2,343 Federal Home Loan Bank advances 6,649 4,277 2,523 Notes payable and other borrowings 1,153 465 443 Total interest expense 51,258 61,465 43,141 Net interest income 66,723 61,052 51,277 Provision for loan losses 22,475 4,615 2,127 Net interest income after provision for loan losses 44,248 56,437 49,150 Noninterest income: Wealth Management revenue 10,848 13,980 13,809 Service charges on deposit accounts 4,376 3,228 2,228 Other service charges and fee income 1,000 852 586 Gain on sale of branches/charter 3,400 - - Gain (loss) on sale of other real estate 552 (48 ) 2 Gain on state tax credits, net 4,201 792 - Gain on sale of investment securities 161 233 - Miscellaneous income 735 636 291 Total noninterest income 25,273 19,673 16,916 Noninterest expense: Employee compensation and benefits 31,024 29,555 25,247 Occupancy 4,246 3,901 2,966 Furniture and equipment 1,470 1,439 1,028 Data processing 2,187 1,911 1,431 Meals and entertainment 1,484 1,878 1,744 Amortization of intangibles 1,444 1,604 1,128 Impairment charges related to Millennium Brokerage Group 9,200 - - Other 12,450 9,228 7,850 Total noninterest expense 63,505 49,516 41,394 Minority interest in net income of consolidated subsidiary - - (875 ) Income before income tax expense 6,016 26,594 23,797 Income tax expense 1,586 9,016 8,325 Net income $ 4,430 $ 17,578 $ 15,472 Earnings per common share: Basic $ 0.35 $ 1.44 $ 1.41 Diluted $ 0.34 $ 1.40 $ 1.36 Years ended December 31, (In thousands, except per share data) Restated Restated 2009 2008 2007 Interest income: Interest and fees on loans $ 112,548 $ 121,467 $ 124,624 Interest on debt securities: Taxable 5,459 4,722 4,571 Nontaxable 24 31 34 Interest on federal funds sold 6 211 481 Interest on interest-bearing deposits 130 43 17 �� Dividends on equity securities 319 547 522 Total interest income 118,486 127,021 130,249 Interest expense: Interest-bearing transaction accounts 662 1,554 3,078 Money market accounts 6,079 13,786 23,578 Savings 35 55 125 Certificates of deposit: $100 and over 15,592 18,127 18,329 Other 7,835 6,398 7,754 Subordinated debentures 5,171 3,536 3,859 Federal Home Loan Bank advances 4,797 6,649 4,277 Notes payable and other borrowings 8,674 10,233 8,242 Total interest expense 48,845 60,338 69,242 Net interest income 69,641 66,683 61,007 Provision for loan losses 40,412 26,510 5,120 Net interest income after provision for loan losses 29,229 40,173 55,887 Noninterest income: Wealth Management revenue 4,524 5,916 7,159 Service charges on deposit accounts 5,012 4,376 3,228 Other service charges and fee income 963 1,000 852 Sale of branches/charter - 3,400 - Sale of other real estate (436 ) 552 (48 ) State tax credit activity, net 1,035 4,201 792 Sale of investment securities 955 161 233 Extinguishment of debt 7,388 - - Miscellaneous income 436 735 636 Total noninterest income 19,877 20,341 12,852 Noninterest expense: Employee compensation and benefits 25,969 27,656 27,412 Occupancy 4,709 3,985 3,651 Furniture and equipment 1,425 1,390 1,366 Data processing 2,147 2,139 1,873 Amortization of intangibles 482 599 692 Goodwill impairment charge 45,377 - - Loan legal and other real estate expense 4,788 1,717 501 Other 13,530 11,290 9,200 Total noninterest expense 98,427 48,776 44,695 (Loss) income from continuing operations before income tax (benefit) expense (49,321 ) 11,738 24,044 Income tax (benefit) expense (2,650 ) 3,672 8,098 (Loss) income from continuing operations (46,671 ) 8,066 15,946 (Loss) income from discontinued operations before income tax (benefit) expense (408 ) (9,757 ) 2,045 Loss on disposal before income tax benefit (1,587 ) - - Income tax (benefit) expense (711 ) (3,539 ) 736 (Loss) income from discontinued operations (1,284 ) (6,218 ) 1,309 Net (loss) income $ (47,955 ) $ 1,848 $ 17,255 Net (loss) income available to common shareholders $ (50,369 ) $ 1,769 $ 17,255 Basic (loss) earnings per common share: From continuing operations $ (3.82 ) $ 0.63 $ 1.30 From discontinued operations (0.10 ) (0.49 ) 0.11 Total $ (3.92 ) $ 0.14 $ 1.41 Diluted (loss) earnings per common share: From continuing operations $ (3.82 ) $ 0.63 $ 1.27 From discontinued operations (0.10 ) (0.49 ) 0.10 Total $ (3.92 ) $ 0.14 $ 1.37 52
Consolidated Statements of Shareholders’ Equity and Comprehensive (Loss) Income
Years ended December 31, 2006, 2007, 2008, and 20082009Accumulated other Total Preferred Common Treasury Additional paid Retained comprehensive shareholders' (in thousands, except per share data) Stock in capital earnings income (loss) equity Balance December 31, 2005 $ - $ 105 $ - $ 51,687 $ 41,950 $ (1,137 ) $ 92,605 Net income - - - - 15,472 - 15,472 Change in fair value of investment securities, net of tax - - - - - 282 282 Change in fair value of cash flow hedges, net of tax - - - - - 263 263 Total comprehensive income 16,017 Cash dividends paid on common shares, $0.18 per share - - - - (1,977 ) - (1,977 ) Issuance under equity compensation plans, net, 166,543 shares - 1 - 1,274 - - 1,275 Acquisition of NorthStar Bancshares, Inc., 914,144 shares - 9 - 23,473 - - 23,482 Share-based compensation - - - 1,067 - - 1,067 Excess tax benefit related to equity compensation plans - - - 525 - - 525 Balance December 31, 2006 $ - $ 115 $ - $ 78,026 $ 55,445 $ (592 ) $ 132,994 Cumulative effect of adoption of FIN 48 - - - - 138 - 138 Balance January 1, 2007 $ - $ 115 $ - $ 78,026 $ 55,583 $ (592 ) $ 133,132 Net income - - - - 17,578 - 17,578 Change in fair value of investment securities, net of tax - - - - - 858 858 Reclassification adjustment for realized gain on sale of securities included in net income, net of tax - - - - - (149 ) (149 ) Total comprehensive income - 18,287 Cash dividends paid on common shares, $0.21 per share - - - - (2,638 ) - (2,638 ) Issuance under equity compensation plans, net, 194,737 shares - 2 - 1,486 - - 1,488 Purchase of Treasury Stock, 76,000 shares - - (1,743 ) - - - (1,743 ) Acquisition of Clayco Banc Corporation, 698,733 shares - 7 - 21,193 - - 21,200 Additional contingent shares issued in connection with acquisition of NorthStar Bancshares, Inc., 49,348 shares - 1 - 1,281 - - 1,282 Share-based compensation - - - 1,760 - - 1,760 Excess tax benefit related to equity compensation plans - - - 381 - - 381 Balance December 31, 2007 $ - $ 125 $ (1,743 ) $ 104,127 $ 70,523 $ 117 $ 173,149 Cumulative effect of adoption of SFAS No. 159 (see Note 9) - - - (365 ) - (365 ) Balance January 1, 2008 $ - $ 125 $ (1,743 ) $ 104,127 $ 70,158 $ 117 $ 172,784 Net income - - - - 4,430 - 4,430 Change in fair value of available for sale securities, net of tax - - - - - 816 816 Reclassification adjustment for realized gain on sale of securities included in net income, net of tax - - - - - (103 ) (103 ) Change in fair value of cash flow hedges, net of tax - - - - 418 418 Total comprehensive income 5,561 Cash dividends paid on common shares, $0.21 per share - - - - (2,661 ) - (2,661 ) Issuance of preferred stock and associated warrants, 35,000 shares 31,116 - - 3,884 - - 35,000 Issuance under equity compensation plans, net, 361,665 shares - 4 - 3,555 - - 3,559 Additional share-based compensation in connection with acquisition of Clayco Banc Corporation, 32,959 shares - - - 1,000 - - 1,000 Share-based compensation - - - 2,085 - - 2,085 Excess tax benefit related to equity compensation plans - - - 460 - - 460 Balance December 31, 2008 $ 31,116 $ 129 $ (1,743 ) $ 115,111 $ 71,927 $ 1,248 $ 217,788 Accumulated other Total Preferred Common Treasury Additional paid Retained comprehensive shareholders' (in thousands, except per share data) Stock in capital earnings income (loss) equity Balance December 31, 2006 (Restated) $ - $ 115 $ - $ 78,026 $ 55,133 $ (592 ) $ 132,682 Cumulative effect of adoption of FIN 48 - - - - 138 - 138 Balance January 1, 2007 (Restated) $ - $ 115 $ - $ 78,026 $ 55,271 $ (592 ) $ 132,820 Net income (Restated) - - - - 17,255 - 17,255 Change in fair value of investment securities, net of tax - - - - - 858 858 Reclassification adjustment for realized gain on sale of securities included in net income, net of tax - - - - - (149 ) (149 ) Total comprehensive income (Restated) 17,964 Cash dividends paid on common shares, $0.21 per share - - - - (2,638 ) - (2,638 ) Issuance under equity compensation plans, net, 194,737 shares - 2 - 1,486 - - 1,488 Purchase of Treasury Stock, 76,000 shares - - (1,743 ) - - - (1,743 ) Acquisition of Clayco Banc Corporation, 698,733 shares - 7 - 21,193 - - 21,200 Additional contingent shares issued in connection with acquisition of NorthStar Bancshares, Inc., 49,348 shares - 1 - 1,281 - - 1,282 Share-based compensation - - - 1,760 - - 1,760 Excess tax benefit related to equity compensation plans - - - 381 - - 381 Balance December 31, 2007 (Restated) $ - $ 125 $ (1,743 ) $ 104,127 $ 69,888 $ 117 $ 172,514 Cumulative effect of adoption of SFAS No. 159 - - - (365 ) - (365 ) Balance January 1, 2008 (Restated) $ - $ 125 $ (1,743 ) $ $ 69,523 $ 117 $ 172,149 Net income (Restated) - - - - 1,848 - 1,848 Change in fair value of available for sale securities, net of tax - - - - - 816 816 Reclassification adjustment for realized gain on sale of securities included in net income, net of tax - - - - - (103 ) (103 ) Change in fair value of cash flow hedges, net of tax - - - - 418 418 Total comprehensive income (Restated) 2,979 Cash dividends paid on common shares, $0.21 per share - - - - (2,661 ) - (2,661 ) Issuance of preferred stock and associated warrants, 35,000 shares 31,116 - - 3,884 - - 35,000 Issuance under equity compensation plans, net 361,665 shares - 4 - 3,555 - - 3,559 Additional share-based compensation in connection with acquisition of Clayco Banc Corporation, 32,959 shares - - - 1,000 - - 1,000 Share-based compensation - - - 2,085 - - 2,085 Excess tax benefit related to equity compensation plans - - - 460 - - 460 Balance December 31, 2008 (Restated) $ 31,116 $ 129 $ (1,743 ) $ 115,112 $ 68,710 $ 1,248 $ 214,572 Net loss - - - - (47,955 ) - (47,955 ) Change in fair value of available for sale securities, net of tax - - - - - 455 455 Reclassification adjustment for realized gain on sale of securities included in net income, net of tax - - - - - (611 ) (611 ) Reclassification of cash flow hedge, net of tax - - - - - (159 ) (159 ) Total comprehensive loss (48,270 ) Cash dividends paid on common shares, $0.21 per share - - - - (2,694 ) - (2,694 ) Cash dividends paid on preferred stock - - - - (1,585 ) - (1,585 ) Preferred stock accretion of discount and issuance cost 686 - - (130 ) (686 ) - (130 ) Issuance under equity compensation plans, net, 81,839 shares - 1 - 322 - - 323 Share-based compensation - - - 2,034 - - 2,034 Excess tax expense on additional share-based compensation in connection with acquisition of Clayco Banc Corporation - - - (364 ) - - (364 ) Excess tax benefit related to equity compensation plans - - - 26 - - 26 Balance December 31, 2009 $ 31,802 $ 130 $ (1,743 ) $ 117,000 $ 15,790 $ 933 $ 163,912 53ENTERPRISE FINANCIAL SERVICES CORP AND SUBSIDIARIESConsolidated Statements of Cash FlowsYears ended December 31, 2008, 2007 & 2006
Years ended December 31, | ||||||||||||
(in thousands) | 2008 | 2007 | 2006 | |||||||||
Cash flows from operating activities: | ||||||||||||
Net income | $ | 4,430 | $ | 17,578 | $ | 15,472 | ||||||
Adjustments to reconcile net income to net cash | ||||||||||||
from operating activities: | ||||||||||||
Depreciation | 2,690 | 2,465 | 1,901 | |||||||||
Provision for loan losses | 22,475 | 4,615 | 2,127 | |||||||||
Deferred income taxes | (6,246 | ) | 747 | (1,244 | ) | |||||||
Net amortization (accretion) of debt and equity securities | 545 | (195 | ) | 39 | ||||||||
Amortization of intangible assets | 1,444 | 1,604 | 1,128 | |||||||||
Gain on sale of investment securities | (161 | ) | (233 | ) | - | |||||||
Mortgage loans originated | (46,416 | ) | (81,221 | ) | (57,184 | ) | ||||||
Proceeds from mortgage loans sold | 47,300 | 80,551 | 57,822 | |||||||||
(Gain) loss on sale of other real estate | (552 | ) | 48 | (2 | ) | |||||||
Gain on state tax credits, net | (4,201 | ) | (792 | ) | - | |||||||
Additional share-based compensation from acquisition of Clayco | 1,000 | - | - | |||||||||
Excess tax benefits of share-based compensation | (460 | ) | (381 | ) | (525 | ) | ||||||
Share-based compensation | 2,255 | 1,944 | 1,153 | |||||||||
Gain on sale of branches/charter | (3,400 | ) | - | - | ||||||||
Impairment charges related to Millennium Brokerage Group | 9,200 | - | - | |||||||||
Changes in: | ||||||||||||
Accrued interest receivable and income tax receivable | (3,054 | ) | 720 | (1,601 | ) | |||||||
Accrued interest payable and other liabilities | (2,203 | ) | (1,013 | ) | 327 | |||||||
Other, net | (4,356 | ) | (1,220 | ) | (1,651 | ) | ||||||
Net cash provided by operating activities | 20,290 | 25,217 | 17,762 | |||||||||
Cash flows from investing activities: | ||||||||||||
Cash paid in sale of branch/charter, net of cash and cash equivalents received | (20,736 | ) | - | - | ||||||||
Cash paid for acquisitions, net of cash and cash equivalents received | - | (9,375 | ) | (4,078 | ) | |||||||
Net increase in loans | (370,963 | ) | (168,032 | ) | (145,218 | ) | ||||||
Proceeds from the sale/maturity/redemption/recoveries of: | ||||||||||||
Debt and equity securities, available for sale | 62,721 | 115,834 | 73,626 | |||||||||
State tax credits held for sale | 4,422 | 4,578 | - | |||||||||
Other real estate | 8,593 | 5,260 | 167 | |||||||||
Loans previously charged off | 372 | 509 | 400 | |||||||||
Payments for the purchase/origination of: | ||||||||||||
Available for sale debt and equity securities | (93,372 | ) | (67,726 | ) | (40,676 | ) | ||||||
Limited partnership interests | (5,034 | ) | (1,171 | ) | - | |||||||
State tax credits held for sale | (15,271 | ) | (27,726 | ) | - | |||||||
Fixed assets | (7,467 | ) | (3,379 | ) | (7,591 | ) | ||||||
Net cash used in investing activities | (436,735 | ) | (151,228 | ) | (123,370 | ) | ||||||
Cash flows from financing activities: | ||||||||||||
Net (decrease) increase in noninterest-bearing deposit accounts | (28,868 | ) | 28,313 | (11,785 | ) | |||||||
Net increase in interest-bearing deposit accounts | 273,312 | 90,092 | 53,261 | |||||||||
Proceeds from issuance of subordinated debentures | 28,274 | 18,557 | 4,124 | |||||||||
Paydown of subordinated debentures | - | (4,124 | ) | - | ||||||||
Proceeds from Federal Home Loan Bank advances | 2,442,872 | 1,242,875 | 723,534 | |||||||||
Repayments of Federal Home Loan Bank advances | (2,475,815 | ) | (1,146,572 | ) | (725,121 | ) | ||||||
Net proceeds from federal funds purchased | 19,400 | - | - | |||||||||
Net increase (decrease) in other borrowings | 16,080 | 923 | (6,015 | ) | ||||||||
Proceeds from notes payable | 15,000 | 6,750 | 10,000 | |||||||||
Repayments on notes payable | (21,000 | ) | (4,751 | ) | (10,745 | ) | ||||||
Cash dividends paid on common stock | (2,661 | ) | (2,638 | ) | (1,977 | ) | ||||||
Excess tax benefits of share-based compensation | 460 | 381 | 525 | |||||||||
Issuance of preferred stock and warrants | 35,000 | - | - | |||||||||
Repurchase of common stock | - | (1,743 | ) | - | ||||||||
Proceeds from the exercise of common stock options | 3,389 | 1,304 | 1,189 | |||||||||
Net cash provided by financing activities | 305,443 | 229,367 | 36,990 | |||||||||
Net (decrease) increase in cash and cash equivalents | (111,002 | ) | 103,356 | (68,618 | ) | |||||||
Cash and cash equivalents, beginning of year | 153,649 | 50,293 | 118,911 | |||||||||
Cash and cash equivalents, end of year | $ | 42,647 | $ | 153,649 | $ | 50,293 | ||||||
Supplemental disclosures of cash flow information: | ||||||||||||
Cash paid during the year for: | ||||||||||||
Interest | $ | 52,495 | $ | 61,223 | $ | 42,377 | ||||||
Income taxes | 11,579 | 7,854 | 7,896 | |||||||||
Noncash transactions: | ||||||||||||
Common stock issued for acquisitions | $ | - | $ | 22,482 | $ | 23,482 | ||||||
Transfer to other real estate owned in settlement of loans | 18,432 | 5,979 | - |
Years ended December 31, | |||||||||||
Restated | Restated | ||||||||||
(in thousands) | 2009 | 2008 | 2007 | ||||||||
Cash flows from operating activities: | |||||||||||
Net (loss) income | $ | (47,955 | ) | $ | 1,848 | $ | 17,255 | ||||
Adjustments to reconcile net (loss) income to net cash from operating activities | |||||||||||
Depreciation | 3,595 | 2,690 | 2,465 | ||||||||
Provision for loan losses | 40,412 | 26,510 | 5,120 | ||||||||
Deferred income taxes | (2,545 | ) | (7,699 | ) | 565 | ||||||
Net amortization of debt securities | 1,415 | 545 | (195 | ) | |||||||
Amortization of intangible assets | 1,078 | 1,444 | 1,604 | ||||||||
Gain on sale of investment securities | (955 | ) | (161 | ) | (233 | ) | |||||
Mortgage loans originated | (91,884 | ) | (46,416 | ) | (81,221 | ) | |||||
Proceeds from mortgage loans sold | 89,636 | 47,300 | 80,551 | ||||||||
Loss (gain) on sale of other real estate | 436 | (552 | ) | 48 | |||||||
Gain on state tax credits, net | (1,035 | ) | (4,201 | ) | (792 | ) | |||||
Additional share-based compensation from acquisition of Clayco | - | 1,000 | - | ||||||||
Excess tax expense on additional share-based compensation from acquisition of Clayco | 364 | - | - | ||||||||
Excess tax benefits of share-based compensation | (26 | ) | (460 | ) | (381 | ) | |||||
Share-based compensation | 2,202 | 2,255 | 1,944 | ||||||||
Gain on sale of branches/charter | - | (3,400 | ) | - | |||||||
Loss on disposal of Millennium Brokerage Group | 1,587 | - | - | ||||||||
Goodwill impairment charge | 45,377 | 9,200 | - | ||||||||
Changes in: | |||||||||||
Accrued interest receivable and income tax receivable | 2,230 | (3,054 | ) | 720 | |||||||
Accrued interest payable and other liabilities | (214 | ) | (2,203 | ) | (1,013 | ) | |||||
Prepaid FDIC insurance | (11,472 | ) | - | - | |||||||
Other, net | (3,498 | ) | (4,356 | ) | (1,220 | ) | |||||
Net cash provided by operating activities | 28,748 | 20,290 | 25,217 | ||||||||
Cash flows from investing activities: | |||||||||||
Cash paid in sale of branch/charter, net of cash and cash equivalents received | - | (20,736 | ) | (9,375 | ) | ||||||
Cash received from acquisition | 15,105 | - | - | ||||||||
Net decrease (increase) in loans | 98,239 | (369,123 | ) | (168,032 | ) | ||||||
Proceeds from the sale/maturity/redemption/recoveries of: | |||||||||||
Debt and equity securities, available for sale | 85,377 | 41,505 | 104,212 | ||||||||
Other investments | 426 | 21,216 | 11,622 | ||||||||
State tax credits held for sale | 7,709 | 4,422 | 4,578 | ||||||||
Other real estate | 16,034 | 6,753 | 5,260 | ||||||||
Loans previously charged off | 590 | 372 | 509 | ||||||||
Payments for the purchase/origination of: | |||||||||||
Available for sale debt and equity securities | (271,954 | ) | (71,699 | ) | (67,066 | ) | |||||
Other investments | (2,184 | ) | (26,707 | ) | (1,831 | ) | |||||
State tax credits held for sale | (15,227 | ) | (15,271 | ) | (27,726 | ) | |||||
Fixed assets | (552 | ) | (7,467 | ) | (3,379 | ) | |||||
Net cash used in investing activities | (66,437 | ) | (436,735 | ) | (151,228 | ) | |||||
Cash flows from financing activities: | |||||||||||
Net increase (decrease) in noninterest-bearing deposit accounts | 39,592 | (28,868 | ) | 28,313 | |||||||
Net increase in interest-bearing deposit accounts | 65,686 | 273,312 | 90,092 | ||||||||
Proceeds from issuance of subordinated debentures | - | 28,274 | 18,557 | ||||||||
Paydown of subordinated debentures | - | - | (4,124 | ) | |||||||
Net proceeds from Federal Home Loan Bank advances | 8,143 | (32,943 | ) | 96,303 | |||||||
Net proceeds from federal funds purchased | (19,400 | ) | 19,400 | - | |||||||
Net increase in other borrowings | 12,578 | 16,080 | 923 | ||||||||
Net proceeds from notes payable | - | (6,000 | ) | 1,999 | |||||||
Cash dividends paid on common stock | (2,694 | ) | (2,661 | ) | (2,638 | ) | |||||
Excess tax expense on additional share-based compensation from acquisition of Clayco | (364 | ) | - | - | |||||||
Excess tax benefits of share-based compensation | 26 | 460 | 381 | ||||||||
Issuance of preferred stock and warrants | - | 35,000 | - | ||||||||
Cash dividends paid on preferred stock | (1,585 | ) | - | - | |||||||
Preferred stock issuance cost | (130 | ) | - | - | |||||||
Repurchase of common stock | - | - | (1,743 | ) | |||||||
Proceeds from the exercise of common stock options | 156 | 3,389 | 1,304 | ||||||||
Net cash provided by financing activities | 102,008 | 305,443 | 229,367 | ||||||||
Net increase (decrease) in cash and cash equivalents | 64,319 | (111,002 | ) | 103,356 | |||||||
Cash and cash equivalents, beginning of period | 42,647 | 153,649 | 50,293 | ||||||||
Cash and cash equivalents, end of period | $ | 106,966 | $ | 42,647 | $ | 153,649 | |||||
Supplemental disclosures of cash flow information: | |||||||||||
Cash (received) paid during the period for: | |||||||||||
Interest | $ | 49,193 | $ | 52,495 | $ | 61,223 | |||||
Income taxes | (2,817 | ) | 11,579 | 7,854 | |||||||
Noncash transactions: | |||||||||||
Common stock issued for acquisitions | $ | - | $ | - | $ | 22,482 | |||||
Transfer to other real estate owned in settlement of loans | 33,717 | 18,432 | 5,979 | ||||||||
Sales of other real estate financed | 6,258 | 1,840 | - |
54
Paragraph structure.
A decline
55
issuer or issuers, (4) structure of the security, and (5) the intent to sell the security or whether its more likely than not that the Company would be required to sell the security before its anticipated recovery in market value.
Cash and Cash EquivalentsAt December 31, 2008 and 2007, approximately $10,018,000 and $6,400,000, respectively, of cash and due from banks represented required reserves on deposits maintained by the Company in accordance with Federal Reserve Bank requirements.
LoanLoans acquired through the completion of a transfer, including loans acquired in a business combination, that have evidence of deterioration of credit quality since origination fees and direct origination costsfor which it is probable, at acquisition, that the Company will be unable to collect all contractually required payments receivable are deferredinitially recorded at fair value (as determined by the present value of expected future cash flows) with no valuation allowance. The difference between the undiscounted cash flows expected at acquisition and the investment in the loans, or the “accretable yield,” is recognized as interest income on a level-yield method over the liveslife of the related loansloans. Contractually required payments for interest and principal that exceed the undiscounted cash flows expected at acquisition, or the “nonaccretable difference,” are not recognized as a yield adjustment usingor as a method,loss accrual or a valuation allowance. Increases in expected cash flows subsequent to the initial investment are recognized prospectively through adjustment of the yield on the loans over their remaining lives. Decreases in expected cash flows are recognized as impairment. Valuation allowances on these impaired loans reflect only losses incurred after the acquisition (meaning the present value of all cash flows expected at acquisition that ultimately are not to be received).
allowance for loan losses, while recoveries of amounts previously charged off are credited to the allowance for loan losses.
Accounting for Impaired Loans
56
When measuring impairment, the expected future cash flows of an impaired loan are discounted at the loan’s effective interest rate. Alternatively, impairment is measured by reference to an observable market price, if one exists, or the fair value of the collateral for a collateral-dependent loan. Interest income on impaired loans is recorded when cash is received and only if principal is considered to be fully collectible. Loans and leases, which are deemed uncollectible, are charged off and deducted from the allowance for loan losses, while recoveries of amounts previously charged off are credited to the allowance for loan losses.
The Company utilizes a discounted cash flow analysis (income approach)elected not to determine the fair value ofaccount for the state tax credits. Thecredits purchased in 2009 at fair value measurement is calculated using an internal valuation model. The inputsin order to limit the fair value calculation include: the amount of tax credits generated each year, the anticipated sale price of the tax credit, the timing of the sale and a discount rate. The discount rate is defined as the LIBOR swap curve at a point equal to the remaining life in years of credits plus a risk premium spread. With the exception of the discount rate, the inputs to the fair value calculation are observable and readily available. The discount rate is an “unobservable input” and is based on the Company’s assumptions. As a result, fair value measurement for these instruments fall within Level 3volatility of the fair value hierarchychanges in the Company’s consolidated statements of SFAS 157.
operations.
Historically, our goodwill impairment tests have been completed as of December 31 each year. Following the annual impairment test for 2006, the Company changed the goodwill and intangible asset impairment test date for the Millennium reporting unit to September 30 of each fiscal year. This change in the testing date was designed to provide sufficient time for independent experts to complete the Millennium reporting unit testing prior to year end reporting. The goodwill and other intangible impairment test date for the Banking segment did not change.
57
Under SFAS 142, businesses
caps.
Cash Flow Hedges – Derivatives designated as cash flow hedges are recorded at fair value. The effective portion of the change in fair value is recorded (net of taxes) as a component of other comprehensive income (“OCI”) in shareholders’ equity. Amounts recorded in OCI are subsequently reclassified into interest income or expense (depending on whether the hedged item is an asset or liability) when the underlying transaction affects earnings. The ineffective portion of the change in fair value is recorded in noninterest income. Upon dedesignation of a derivative financial instrument from a cash flow hedge relationship, any remaining amounts in OCI are recorded in noninterest income over the expected remaining life of the underlying forecasted hedge transaction. The net interest differential between the hedged item and the hedging derivative financial instrument are recorded as an adjustment to interest income or interest expense of the related asset or liability.
Fair Value Hedges – For derivatives designated as fair value hedges, the change in fair value of the derivative instrument and related hedged item are recorded in the related interest income or expense, as applicable, except for the ineffective portion, which is recorded in noninterest income in the consolidated statements of income.Theincome. The swap agreement is accounted for on an accrual basis with the net interest differential being recognized as an adjustment to interest income or interest expense of the related asset or liability.
Non-Designated Hedges– Certain derivative financial instruments are not designated as cash flow or as fair value hedges for accounting purposes. These non-designated derivatives are intended to provide interest rate protection on net interest income or noninterest income but do not meet hedge accounting treatment. Customer accommodation interest rate swap contracts are not designated as hedging instruments. Changes in the fair value of these instruments are recorded in interest income or noninterest income in the consolidated statements of income depending on the underlying hedged item.
58
The Company and its subsidiaries file consolidated federal income tax returns. Deferred tax assets and liabilities are recognized for the estimated future tax consequences attributable to differences between the financial statement carrying amounts of existing assets and liabilities and their respective tax bases. Deferred tax assets and liabilities are measured using enacted tax rates in effect for the year in which those temporary differences are expected to be recovered or settled. A valuation allowance is recognized if the Company determines it is more likely than not that all or some portion of the deferred tax asset will not be recognized. In estimating accrued taxes, the Company assesses the relative merits and risks of the appropriate tax treatment considering statutory, judicial and regulatory guidance in the context of the tax position. Because of the complexity of tax laws and regulations, interpretation can be difficult and subject to legal judgment given specific facts and circumstances. It is possible that others, given the same information, may at any point in time reach different reasonable conclusions regarding the estimated amounts of accrued taxes.Treasury StockOn August 27, 2007, the Company’s Board of Directors authorized a one-year stock repurchase program of up to 625,000 shares, or approximately 5.00%, of the Company’s outstanding common stock in the open market or in privately negotiated transactions. No purchases were made in 2008 and the program expired in August 2008 without reauthorization. In addition, participants in TARP are not allowed to repurchase shares of common stock. At December 31, 2008, the Company has 76,000 shares of Treasury stock. All repurchased shares are being held as Treasury stock for general corporate purposes. Treasury shares are accounted for under the cost method and are included as a component of shareholders’ equity.Effective January 1, 2006, the Company adopted SFAS No. 123(R),Share-based Payment(“SFAS 123(R)”.) This statement requires that all stock-basedStock-based compensation beis recognized as an expense in the financial statements and that such cost be measured at the grant date fair value for all equity classified awards. The Company adopted this statement using the modified prospective method, which required the Company to recognize compensation expense on a prospective basis for all outstanding unvested awards.In accordance with SFAS No. 141,Business Combinations(“SFAS 141”), theThe Company has accountedaccounts for business combinations using the purchase method of accounting. Accordingly, the assets and liabilities of the acquired entities have been recorded at their estimated fair values at the date of acquisition. Goodwill represents the excess of the purchase price over the fair value of net assets, including the amount assigned to identifiable intangible assets. The Company has one year to finalize the fair values and resulting goodwill resulting from any business combination.has includedincludes that adjustment in the cost of the combination when the contingent consideration is determinable beyond a reasonable doubt and can be reliably estimated and should not otherwise be expensed according to the provisions of SFAS 141.estimated. The results of operations of the acquired business are included in the Company’s consolidated financial statements from the respective date of acquisition. As a general rule, goodwill established in connection with a stock purchase is nondeductible for tax purposes.Theaccounts for divestitures under SFAS 144, which requires an entity to measuremeasures an asset (disposal group) classified as held for sale at the lower of its carrying value at the date the asset is initially classified as held for sale or its fair value less costs to sell. It also requires an entity to report in discontinued operationsThe Company reports the results of operations of a component that either has been disposed of or held to sale as discontinued operations if:
59
Cash Flow InformationFor purposes
ReclassificationCertain reclassificationsthe December 31, 2008 consolidated balance sheet presented herein have been maderestated to correct the 2007 and 2006 immaterial amounts to conform to the current year presentation. Such reclassifications had no effect on previously reported consolidated net income or shareholders’ equity.
New Accounting Standardserror.
For the Year ended December 31, | ||||||||||||
2008 | 2007 | |||||||||||
(in thousands, except per share data) | As reported | As restated | As reported | As restated | ||||||||
Income Statement: | ||||||||||||
Total interest income | $ | 117,981 | $ | 127,021 | $ | 122,517 | $ | 130,249 | ||||
Total interest expense | 51,258 | 60,338 | 61,465 | 69,242 | ||||||||
Provision for loan losses | 22,475 | 26,510 | 4,615 | 5,120 | ||||||||
Income tax expense | 1,586 | 133 | 9,016 | 8,834 | ||||||||
Net income | 4,430 | 1,848 | 17,578 | 17,255 | ||||||||
Net income available to common shareholders | 4,351 | 1,769 | 17,578 | 17,255 | ||||||||
Earnings per share: | ||||||||||||
Basic earnings per share | 0.35 | 0.14 | 1.44 | 1.41 | ||||||||
Diluted earnings per share | 0.34 | 0.14 | 1.40 | 1.37 |
At December 31, 2008 | ||||||
(in thousands) | As reported | As restated | ||||
Portfolio loans | $ | 1,977,175 | $ | 2,201,457 | ||
Allowance for loan losses | 31,309 | 33,808 | ||||
Other assets | 32,973 | 34,783 | ||||
Total assets | 2,270,174 | 2,493,767 | ||||
Loan participations (included in Other Borrowings) | - | 226,809 | ||||
Total liabilities | 2,052,386 | 2,279,195 | ||||
Shareholders' equity | 217,788 | 214,572 |
In December 2007, the Financial Accounting Standards Boardand assumed certain liabilities of Valley Capital Bank NA (“FASB”Valley”) issued SFAS No. 141(R),Business Combinations — a replacementfull service community bank that was headquartered in Mesa, Arizona.
(in thousands) | Amount | |||
Cash and cash equivalents | $ | 3,542 | ||
Federal funds sold | 11,563 | |||
Other investments | 59 | |||
Portfolio loans | 14,730 | |||
Other real estate | 3,455 | |||
FDIC indemnification asset | 8,519 | |||
Other assets | 567 | |||
Total deposits | (43,355 | ) | ||
Other liabilities | (33 | ) | ||
Goodwill | $ | (953 | ) | |
In December 2007, the FASB issued SFAS No. 160,Noncontrolling Interests in Consolidated Financial Statements - an amendmentliquidation of ARB No. 51(“SFAS 160”). SFAS 160 amends Accounting Research Bulletin No. 51, “Consolidated Financial Statements,”underlying collateral.
In March 2008, the FASB issued SFAS No. 161,Disclosures about Derivative Instruments and Hedging Activities — an Amendment of FASB Statement No. 133(“SFAS 161”.) SFAS 161 expands disclosure requirements regarding an entity’s derivative instruments and hedging activities. Expanded qualitative disclosures that will be required under SFAS 161 include: (1) how and why an entity uses derivative instruments; (2) how derivative instruments and related hedged items are accounted for under SFAS 133,Accounting for Derivative Instruments and Hedging Activities,and related interpretations; and (3) how derivative instruments and related hedged items affect an entity’s financial position, financial performance, and cash flows. SFAS 161 also requires additional quantitative disclosures in financial statements. SFAS 161 will be effective for the Company on January 1, 2009. Management does not expect that the adoption of the provisions of SFAS 161 will have a material impact on the Company’s financial statements.
60
In October 2008, the FASB issued Financial Accounting Standards Board Staff Position (“FSP”) FAS No. 157-3,Determining the Fair Value of a Financial Asset When the Market for That Asset Is Not Active(“FSP FAS 157-3”.) The FSP clarifies the application of SFAS 157,Fair Value Measurements, in a market that is not active and provides an example to illustrate key considerations in determining the fair value of aeach of these assets as of the date of acquisition. However, the amount that Enterprise realizes on these assets could differ materially from the carrying value reflected in these financial statements, based upon the timing and amount of collections on the acquired loans in future periods. Because of the loss sharing agreement with the FDIC on these assets, Enterprise should not incur any significant losses. To the extent the actual values realized for the acquired loans are different from the estimate, the indemnification asset whenwill generally be affected in an offsetting manner due to the market for that financial asset is not active. The FSP was effective immediately thereforeloss sharing support from the FDIC.
NOTE 2—ACQUISITIONS AND DIVESTITURES
2009, the Company presented the remaining assets of Millennium of $4,000,000 as Assets of discontinued operations held for sale in the consolidated balance sheet. The Company will not have any direct significant continuing involvement with Millennium.
At the time of acquisition, 32,959 shares valued at $1,000,000 were deposited into an escrow account as part of an executive retention agreement. At December 31, 2008 the contingency was resolved, the shares were released to the executive, and the Company recorded additional compensation expense of $1,000,000.
Pro forma (unaudited)The following pro forma consolidated amounts give effect to the Company’s acquisitions of NorthStar and Clayco as if they had occurred January 1, 2006. The pro forma consolidated amounts presented below are based on continuing operations. The pro forma consolidated amounts are not necessarily indicative of the operating results that would have been achieved had the transactions been in effect and should not be construed as being representative of future operating results.
Year ended December 31, | ||||||
(in thousands, except per share data) | 2007 | 2006 | ||||
Revenues(1) | $ | 81,871 | $ | 78,001 | ||
Net income | 17,789 | 16,376 | ||||
Net income per share: | ||||||
Basic | 1.44 | 1.35 | ||||
Diluted | 1.40 | 1.30 | ||||
Weighted average shares used in calculation: | ||||||
Basic | 12,383 | 12,175 | ||||
Diluted | 12,706 | 12,598 | ||||
(1) Revenues include net interest income and noninterest income. |
On February 28, 2008, the Company sold its Enterprise banking branch located in Liberty, Missouri to an unaffiliated bank. Deposit liabilities of $7,358,000 were transferred and approximately $158,000 of fixed assets were sold. Goodwill and core deposit intangibles related to Liberty of $97,000 and $269,000, respectively, were written off on the sale date. The gain on the sale was $550,000.61
On June 26, 2008, the Company transferred the assets and deposit liabilities of the Great American Claycomo branch along with certain other assets and liabilities of Great American to Enterprise. Approximately $168,000,000 of assets and $126,000,000 of liabilities were transferred to Enterprise.Acquisition of Millennium Brokerage GroupOn October 13, 2005, the Company acquired 60% of Millennium, a Tennessee limited liability company, for total consideration of $15,000,000, consisting of $9,750,000 in cash and 249,161 shares of common stock valued at $5,250,000. The original agreement provided that the Company would purchase the remaining 40% interest in Millennium in two tranches of 20% each in 2008 and 2010, respectively. However, on December 31, 2007, the Company accelerated the acquisition timetable and purchased the remaining 40% interest. The acquisition was accelerated to accommodate a change in the Millennium partner compensation plan and equity incentives and to recognize the effects of the decline in Millennium’s margins on valuing the remaining ownership interests pursuant to the original buyout terms. As a result, Millennium became a wholly owned subsidiary of the Company. The Company acquired the remaining 40% interest in Millennium for cash of $1,500,000. The additional purchase was accounted for as a step acquisition and as such, was considered additional purchase price and recorded as goodwill. In addition, subsequent annual payments of up to $2,000,000 each year for four years are contingent upon Millennium’s achievement of certain pre-taxtargets. No incremental amounts were paid in 2008.NOTE 3—EARNINGS PER SHAREBasic earnings(loss) per common share is calculated by dividing net income (loss) available to common shareholders by the weighted average number of common shares outstanding during the period. Diluted earnings per common share gives effect to all dilutive potential common shares outstanding during the period using the treasury stock method and convertible preferred stock using the if-converted method. The following table presents a summary of per share data and amounts for the periods indicated.Years ended December 31, (in thousands, except per share data) 2008 2007 2006 Basic Net income, as reported $ 4,430 $ 17,578 $ 15,472 Preferred stock dividend (undeclared) (58 ) - - Amortization of preferred stock discount (21 ) - - Net income available to common shareholders $ 4,351 $ 17,578 $ 15,472 Weighted average common shares outstanding 12,589 12,239 10,964 Basic earnings per common share $ 0.35 $ 1.44 $ 1.41 Diluted Net income available to common shareholders $ 4,351 $ 17,578 $ 15,472 Weighted average common shares outstanding 12,589 12,239 10,964 Effect of dilutive stock options and restricted share units 146 323 423 Diluted weighted average common shares outstanding 12,735 12,562 11,387 Diluted earnings per common share $ 0.34 $ 1.40 $ 1.36 Years ended December 31, Restated Restated (in thousands, except per share data) 2009 2008 2007 Net (loss) income from continuing operations $ (46,671 ) $ 8,066 $ 15,946 Net (loss) income from discontinued operations (1,284 ) (6,218 ) 1,309 Net (loss) income (47,955 ) 1,848 17,255 Preferred stock dividend (1,750 ) (58 ) - Accretion of preferred stock discount (664 ) (21 ) - Net (loss) income available to common shareholders $ (50,369 ) $ 1,769 $ 17,255 Weighted average common shares outstanding 12,833 12,589 12,239 Additional dilutive common stock equivalents - - 323 Diluted common shares outstanding 12,833 12,589 12,562 Basic (loss) earnings per common share: From continuing operations $ (3.82 ) $ 0.63 $ 1.30 From discontinued operations (0.10 ) (0.49 ) 0.11 From continuing and discontinued operations $ (3.92 ) $ 0.14 $ 1.41 Diluted (loss) earnings per common share: From continuing operations $ (3.82 ) $ 0.63 $ 1.27 From discontinued operations (0.10 ) (0.49 ) 0.10 From continuing and discontinued operations $ (3.92 ) $ 0.14 $ 1.37
62
For the years ended December 31, 2008, 2007 and 2006, there
Preferred EquityThe Company’s Articles of Incorporation, as amended, authorize the issuance of 5,000,000 shares of preferred stock at a par value of $0.01 per share.
Assumptions were used in estimating the fair value of common stock warrants. The weighted average expected life of the common stock warrant represents the period of time that common stock warrants are expected to be outstanding. The risk-free interest rate iswas based on the U.S. Treasury yield curve in effect at the time of grant. The expected volatility iswas based on the historical volatility of the Company’s stock. The following assumptions were used in estimating the fair value for the common stock warrants: a weighted average expected life of 10 years, a risk-free interest rate of 3.1%, an expected volatility of 47.3%, and a dividend yield of 5%. Based on these assumptions, the estimated fair value of the common stock warrants was $2,972,000. As previously noted, based on the warrants’ fair value relative to the senior preferred stock fair value, $3,884,000 of the $35,000,000 of proceeds was recorded to Additional paid in capital in the December 31, 2009 and 2008 consolidated balance sheet.
63
sheets.
December 31, 2009 | |||||||||||||
Gross | Gross | ||||||||||||
Amortized | Unrealized | Unrealized | |||||||||||
(in thousands) | Cost | Gains | Losses | Fair Value | |||||||||
Available for sale securities: | |||||||||||||
Obligations of U.S. Government agencies | $ | 26,940 | $ | 249 | $ | - | $ | 27,189 | |||||
Obligations of U.S. Government sponsored enterprises | 75,880 | 115 | (181 | ) | 75,814 | ||||||||
Obligations of states and political subdivisions | 3,868 | 10 | (471 | ) | 3,408 | ||||||||
Residential mortgage-backed securities | 174,562 | 1,960 | (471 | ) | 176,050 | ||||||||
$ | 281,250 | $ | 2,334 | $ | (1,123 | ) | $ | 282,461 | |||||
| |||||||||||||
December 31, 2008 | |||||||||||||
Gross | Gross | ||||||||||||
Amortized | Unrealized | Unrealized | |||||||||||
(in thousands) | Cost | Gains | Losses | Fair Value | |||||||||
Available for sale securities: | |||||||||||||
Obligations of states and political subdivisions | $ | 765 | $ | 7 | $ | - | $ | 772 | |||||
Residential mortgage-backed securities | 94,368 | 1,438 | (147 | ) | 95,659 | ||||||||
$ | 95,133 | $ | 1,445 | $ | (147 | ) | $ | 96,431 |
2008 | |||||||||||||
Gross | Gross | ||||||||||||
Amortized | Unrealized | Unrealized | Estimated | ||||||||||
(in thousands) | Cost | Gains | Losses | Fair Value | |||||||||
Available for sale securities: | |||||||||||||
Mortgage-backed securities | $ | 94,368 | $ | 1,438 | $ | (147 | ) | $ | 95,659 | ||||
Municipal bonds | 765 | 7 | - | 772 | |||||||||
$ | 95,133 | $ | 1,445 | $ | (147 | ) | $ | 96,431 | |||||
2007 | |||||||||||||
Gross | Gross | ||||||||||||
Amortized | Unrealized | Unrealized | Estimated | ||||||||||
(in thousands) | Cost | Gains | Losses | Fair Value | |||||||||
Available for sale securities: | |||||||||||||
Obligations of U.S. government agencies | $ | 28,531 | $ | 193 | $ | (4 | ) | $ | 28,720 | ||||
Mortgage-backed securities | 41,107 | 82 | (102 | ) | 41,087 | ||||||||
Municipal bonds | 947 | 5 | (3 | ) | 949 | ||||||||
$ | 70,585 | $ | 280 | $ | (109 | ) | $ | 70,756 |
Amortized | Estimated | |||||
(in thousands) | Cost | Fair Value | ||||
Due in one year or less | $ | 400 | $ | 400 | ||
Due after one year through five years | 365 | 372 | ||||
Mortgage-backed securities | 94,368 | 95,659 | ||||
$ | 95,133 | $ | 96,431 |
During 2008, proceeds from the sales and calls
Amortized | Estimated | |||||
(in thousands) | Cost | Fair Value | ||||
Due in one year or less | $ | 56,461 | $ | 56,562 | ||
Due after one year through five years | 33,569 | 33,766 | ||||
Due after five years through ten years | 3,198 | 3,030 | ||||
Due after ten years | 13,460 | 13,053 | ||||
Mortgage-backed securities | 174,562 | 176,050 | ||||
$ | 281,250 | $ | 282,461 | |||
December 31, 2009 | ||||||||||||||||||
Less than 12 months | 12 months or more | Total | ||||||||||||||||
Unrealized | Unrealized | Unrealized | ||||||||||||||||
(in thousands) | Fair Value | Losses | Fair Value | Losses | Fair Value | Losses | ||||||||||||
Obligations of U.S. government sponsored agencies | $ | 29,557 | $ | 181 | $ | - | $ | - | $ | 29,557 | $ | 181 | ||||||
Obligations of the state and political subdivisions | 2,830 | 471 | - | - | 2,830 | 471 | ||||||||||||
Residential mortgage-backed securities | 74,625 | 471 | - | - | 74,625 | 471 | ||||||||||||
$ | 107,012 | $ | 1,123 | $ | - | $ | - | $ | 107,012 | $ | 1,123 | |||||||
December 31, 2008 | ||||||||||||||||||
Less than 12 months | 12 months or more | Total | ||||||||||||||||
Unrealized | Unrealized | Unrealized | ||||||||||||||||
(in thousands) | Fair Value | Losses | Fair Value | Losses | Fair Value | Losses | ||||||||||||
Residential mortgage-backed securities | $ | 21,709 | $ | 144 | $ | 628 | $ | 3 | $ | 22,337 | $ | 147 | ||||||
64
Provided below is a summary of securities available for-sale which were in an unrealized loss position at December 31, 2008 and 2007. The unrealized losses reported as of December 31, 2008 for the mortgage-backed securities for 12 months or less includes 13 securities and primarily relates to FNMA or Federal Home Loan Mortgage Corporation (“FHLMC”) pools with estimated maturities or repricings of three to four years. FNMA or FHLMC guarantees the contractual cash flows of these securities. The Company has the ability and intent to hold these securities until such time as the value recovers or the securities mature. Further, the Company believes the deterioration in value is attributable to changes in market interest rates and not credit qualitysince the securities were purchased. Management systematically evaluates investment securities for other-than-temporary declines in fair value on a quarterly basis. This analysis requires management to consider various factors, which include (1) the present value of the issuer.
2008 | ||||||||||||||||||
Less than 12 months | 12 months or more | Total | ||||||||||||||||
Estimated | Unrealized | Estimated | Unrealized | Estimated | Unrealized | |||||||||||||
(in thousands) | Fair Value | Losses | Fair Value | Losses | Fair Value | Losses | ||||||||||||
Mortgage-backed securities | $ | 21,709 | $ | 144 | $ | 628 | $ | 3 | $ | 22,337 | $ | 147 | ||||||
2007 | ||||||||||||||||||
Less than 12 months | 12 months or more | Total | ||||||||||||||||
Estimated | Unrealized | Estimated | Unrealized | Estimated | Unrealized | |||||||||||||
(in thousands) | Fair Value | Losses | Fair Value | Losses | Fair Value | Losses | ||||||||||||
Obligations of U.S. government agencies | $ | - | $ | - | $ | 3,991 | $ | 4 | $ | 3,991 | $ | 4 | ||||||
Mortgage-backed securities | 4,285 | 13 | 6,303 | 89 | 10,588 | 102 | ||||||||||||
Municipal bonds | - | - | 273 | 3 | 273 | 3 | ||||||||||||
$ | 4,285 | $ | 13 | $ | 10,567 | $ | 96 | $ | 14,852 | $ | 109 |
December 31, | ||||||
(in thousands) | 2009 | 2008 | ||||
Gross gains realized | $ | 955 | $ | 226 | ||
Gross losses realized | - | 65 | ||||
Net gains realized | $ | 955 | $ | 161 | ||
December 31, | |||||||
(in thousands) | 2008 | 2007 | |||||
Real Estate Loans: | |||||||
Construction and land development | $ | 337,550 | $ | 266,111 | |||
Farmland | 7,583 | 6,699 | |||||
1-4 Family residential | 228,772 | 163,256 | |||||
Multifamily residential | 43,610 | 46,937 | |||||
Other real estate loans | 778,283 | 644,486 | |||||
Total real estate loans | $ | 1,395,798 | $ | 1,127,489 | |||
Commercial and industrial | 556,210 | 476,184 | |||||
Other | 25,716 | 37,725 | |||||
Total Loans | $ | 1,977,724 | $ | 1,641,398 | |||
Unearned loan (fees) costs, net | (549 | ) | 34 | ||||
Total loans, net of unearned loan (fees) costs | $ | 1,977,175 | $ | 1,641,432 |
December 31, | |||||||
Restated | |||||||
(in thousands) | 2009 | 2008 | |||||
Real Estate Loans: | |||||||
Construction and land development | $ | 224,390 | $ | 378,092 | |||
Farmland | 6,681 | 7,583 | |||||
1-4 Family residential | 214,066 | 235,019 | |||||
Multifamily residential | 87,865 | 66,421 | |||||
Other real estate loans | 725,701 | 813,959 | |||||
Total real estate loans | $ | 1,258,703 | $ | 1,501,074 | |||
Commercial and industrial | 558,017 | 675,216 | |||||
Other | 16,387 | 25,716 | |||||
Total Loans | $ | 1,833,107 | $ | 2,202,006 | |||
Unearned loan (fees) costs, net | 153 | (549 | ) | ||||
Total loans, including unearned loan (fees) costs | $ | 1,833,260 | $ | 2,201,457 | |||
65
(in thousands) | Total | |||
Balance January 1, 2009 | $ | 6,047 | ||
New loans and advances | 5,571 | |||
Payments | (2,378 | ) | ||
Balance December 31, 2009 | $ | 9,240 | ||
Restated | Restated | |||||||||||||||||||||||
(in thousands) | 2008 | 2007 | 2006 | 2009 | 2008 | 2007 | ||||||||||||||||||
Balance at beginning of year | $ | 21,593 | $ | 16,988 | $ | 12,990 | $ | 33,808 | $ | 22,585 | $ | 17,475 | ||||||||||||
(Disposed) acquired allowance for loan losses | (50 | ) | 2,010 | 3,069 | - | (50 | ) | 2,010 | ||||||||||||||||
Release of allowance related to loan participations | (1,383 | ) | - | - | ||||||||||||||||||||
Provision for loan losses | 22,475 | 4,615 | 2,127 | 40,412 | 26,510 | 5,120 | ||||||||||||||||||
Loans charged off | (13,081 | ) | (2,529 | ) | (1,598 | ) | (30,432 | ) | (15,609 | ) | (2,529 | ) | ||||||||||||
Recoveries of loans previously charged off | 372 | 509 | 400 | 590 | 372 | 509 | ||||||||||||||||||
Balance at end of year | $ | 31,309 | $ | 21,593 | $ | 16,988 | $ | 42,995 | $ | 33,808 | $ | 22,585 | ||||||||||||
December 31, | |||||||||
(in thousands) | 2008 | 2007 | 2006 | ||||||
Non-accrual loans | $ | 29,662 | $ | 12,720 | $ | 6,363 | |||
Performing loans | 3,660 | - | - | ||||||
Loans past due 90 days or more | |||||||||
and still accruing interest | - | - | 112 | ||||||
Restructured loans continuing to | |||||||||
accrue interest | - | - | - | ||||||
Total impaired loans | $ | 33,322 | $ | 12,720 | $ | 6,475 | |||
Allowance for losses on impaired loans | $ | 7,380 | $ | 3,515 | $ | 2,040 | |||
Impaired loans with no related | |||||||||
allowance for loan losses | - | - | 112 | ||||||
Average balance of impaired | |||||||||
loans during the year | 17,364 | 11,268 | 2,658 |
December 31, | |||||||||
Restated | Restated | ||||||||
(in thousands) | 2009 | 2008 | 2007 | ||||||
Non-accrual loans | $ | 37,441 | $ | 35,487 | $ | 12,720 | |||
Performing loans | - | 3,660 | - | ||||||
Loans past due 90 days or more and still accruing interest | - | - | - | ||||||
Restructured loans | 1,099 | - | - | ||||||
Total impaired loans | $ | 38,540 | $ | 39,147 | $ | 12,720 | |||
Allowance for losses on impaired loans | $ | 8,099 | $ | 8,545 | $ | 3,515 | |||
Impaired loans with no related allowance for loan losses | 3,514 | - | 204 | ||||||
Average balance of impaired loans during the year | 44,407 | 17,364 | 11,268 |
66
Historically, Enterprise has utilized
The Company accounts for its derivatives under SFAS No. 133, as amended, which, requires recognition of all derivatives as eitherhedged assets or liabilities due to changes in interest rates. Interest rate option contracts consist of caps and provide for the transfer or reduction of interest rate risk in exchange for a fee.
a hedge and qualifies for hedge accounting.
The Company’s
At December 31, 2008, the Company had recorded $1,291,000 in Other assets in the consolidated balance sheet related to the fair value of the interest rate swaps. The effective portion of the change in the derivatives’ gain or loss iswas reported as a component of Accumulated other comprehensive income, net of taxes. The ineffective portion of the change in the cash flow hedge’s gain or loss iswas recorded in earnings.operations. On December 16, 2008, the prime rate used to determine the variable rate payments Enterprise would be makingmade to its counterparty was lowered to a rate less than the Enterprise prime rate which iswas used to determine the variable rate receipts from the prime based borrowers. As a result of the variable rate differential, the Company concluded that the cash flow hedges would not be prospectively effective and dedesignated the related interest rate swaps.
The Company used the Hypothetical Derivative Method to measure ineffectiveness. As a result, at December 31, 2008, the Company reclassified $638,500 from Accumulated other comprehensive income in the consolidated statement of shareholders’ equity and comprehensive income and into Noninterest income in the consolidated statement of incomeoperations for the year then ended.
The amount of gain or loss associated withended December 31, 2008. During 2009, the cash flow hedge remaining in other comprehensive income of $652,500 will beCompany reclassified into earnings as the underlying loans are repaid. The Company expects to reclassify $248,000 of remaining hedge-related amounts from Accumulated other comprehensive income to earningsoperations. At December 31, 2009, the amount remaining in Accumulated other comprehensive income was $404,000. The Company expects to reclassify $242,000 of remaining hedge-related amounts from Accumulated other comprehensive income to operations over the next twelve months.
On February 4, 2009, the swaps were terminated. The Company received cash of $861,000, and recordedrealized a loss of $530,000.
67
All cash flow hedges in 2006 were effective, and therefore, no gain or The loss was recordedincluded in earningsMiscellaneous income in 2006. There werethe 2009 consolidated statement of operations. As a result, Enterprise had no cash flow hedges outstanding during any period in 2007.
at December 31, 2009.
One swap with a notional amount of $10,000,000, under which Enterprise received a fixed rate of 2.90%, matured in February 2007. The fair value of the swap was ($35,000) at December 31, 2006. Two swaps, each with a $10,000,000 notional amount, under which Enterprise received fixed rates of 2.30% and 2.45%, matured in February and April 2006, respectively.
Amounts paid or received were accounted for on an accrual basis and recognized as interest expense of the related hedged instrument. The net cash flows related to fair value hedges increased interest expense on certificates of deposit by $0, $41,000 in 2007. For 2007, all fair value hedges were effective, and $363,000 in 2008, 2007therefore, the amounts recorded to interest expense for the derivative instrument and 2006, respectively.
At inceptionrelated hedged item were entirely offset.
Asset Derivatives | Liability Derivatives | |||||||||||||||||
(Other Assets) | (Other Liabilities) | |||||||||||||||||
Notional Amount | Fair Value | Fair Value | ||||||||||||||||
December 31, | December 31, | December 31, | December 31, | December 31, | December 31, | |||||||||||||
(in thousands) | 2009 | 2008 | 2009 | 2008 | 2009 | 2008 | ||||||||||||
Non-designated hedging instruments | ||||||||||||||||||
Interest rate cap contracts | $ | 84,050 | $ | 188,050 | $ | 1,117 | $ | 544 | $ | - | $ | - | ||||||
Cash flow hedging instruments | ||||||||||||||||||
Interest rate swap contracts | $ | - | $ | 80,000 | $ | - | $ | 1,291 | $ | - | $ | - |
Amount of Gain or (Loss) | ||||||||||
Location of Gain or (Loss) | Recognized in Operations on | |||||||||
Recognized in Operations on | Derivative | |||||||||
(in thousands) | Derivative | 2009 | 2008 | |||||||
Non-designated hedging instruments | ||||||||||
Interest rate cap contracts | State tax credit activity, net | $ | 573 | $ | (1,538 | ) | ||||
Interest rate swap contracts | Miscellaneous income | $ | (282 | ) | $ | - |
Non-Designated HedgesInterest rate swapsAt December 31, 2008 and 2007, the Company had interest rate swap agreements with notional amounts aggregating $17,476,000 and $5,397,000, respectively. The swaps economically hedge changes in fair value of a group of fixedcertain loans. In addition, the Company also offers an interest-rate hedge program that includes interest rate loans.swaps to assist its customers in managing their interest-rate risk profile. In order to eliminate the interest-rate risk associated with offering these products, the Company enters into derivative contracts with third parties to offset the customer contracts. The related loans are also carried attable below summarizes the notional amounts and fair value. These swap agreements provide for Enterprise to pay a fixed rate of interest equal to thatvalues of the underlying fixed rate loansclient-related derivative instruments.
Asset Derivatives | Liability Derivatives | |||||||||||||||||
(Other Assets) | (Other Liabilities) | |||||||||||||||||
Notional Amount | Fair Value | Fair Value | ||||||||||||||||
December 31, | December 31, | December 31, | December 31, | December 31, | December 31, | |||||||||||||
(in thousands) | 2009 | 2008 | 2009 | 2008 | 2009 | 2008 | ||||||||||||
Non-designated hedging instruments | ||||||||||||||||||
Interest rate swap contracts | $ | 30,279 | $ | 17,429 | $ | 120 | $ | - | $ | 1,105 | $ | 1,467 |
Interest rate caps2008.
Amount of Gain or (Loss) | ||||||||||
Location of Gain or (Loss) | Recognized in Operations on | |||||||||
Recognized in Operations on | Derivative | |||||||||
(in thousands) | Derivative | 2009 | 2008 | |||||||
Non-designated hedging instruments | ||||||||||
Interest rate swap contracts | Interest and fees on loans | $ | (579 | ) | $ | (229 | ) |
68
core deposit intangibles for impairment and determined there was no impairment. 2009. 31, 2009. loans aggregating approximately $430,000,000. NOTE 16—REGULATORY MATTERS Stock-settled Stock Appreciation Rights 2009. 2009. The following table presents the changes in Level 3 financial instruments measured at fair value as of December 31, of Millennium. The Corporate segment’s principal activities include the direct ownership of the Company’s banking and non-banking subsidiaries and the issuance of debt and equity. Its principal second quarters of 2009 and all quarters of 2008 have been restated to reflect the loan participation adjustment. The sum of the quarterly EPS amounts may not equal the full year amounts due to rounding. As of December 31, the error, including as of December 31, 2008 and December 31, 2007. The Company’s management concluded that the material weakness was the Company’s lack of a formal process to periodically review existing contracts and agreements with continuing accounting significance. To remediate this material weakness, during the fourth quarter of 2009 the Company implemented a formal process to review all contracts and agreements with continuing accounting significance on an annual basis. As a result of the review conducted in the fourth quarter, management did not identify any other errors in its previous accounting for such contracts or agreements. Management believes that this new process has remediated the material weakness in the Company’s internal control over financial reporting. 29, 2010. 29, 2010. 29, 2010. 29, 2010. Note: In accordance with Item 601 (b) (4) (iii) of Regulation S-K, Registrant hereby agrees to furnish to the 2010.8—9—FIXED ASSETS20082009 and 20072008 is as follows:December 31, (in thousands) 2008 2007 Land $ 2,249 $ 2,299 Buildings and leasehold improvements 22,726 18,827 Furniture, fixtures and equipment 12,658 11,617 Capitalized software 214 84 37,847 32,827 Less accumulated depreciation and amortization 12,689 10,604 Total fixed assets $ 25,158 $ 22,223 December 31, (in thousands) 2009 2008 Land $ 2,249 $ 2,249 Buildings and leasehold improvements 21,798 22,726 Furniture, fixtures and equipment 12,095 12,658 Capitalized software 263 214 36,405 37,847 Less accumulated depreciation and amortization 14,105 12,689 Total fixed assets $ 22,301 $ 25,158 $2,690,000, $2,465,000$3,550,000, $2,512,000, and $1,901,000$2,197,000 in 2009, 2008, and 2007, and 2006, respectively.$1,724,000 in 2008, 2007, and 2006, respectively. Sublease rental income was $110,236,$122,500, $110,200 and $37,000 for 2009, 2008, and $39,000 for 2008, 2007 and 2006.2007. The future aggregate minimum rental commitments (in thousands) required under the leases are as follows:Year Amount 2009 2,378 2010 2,388 2011 1,392 2012 1,318 2013 549 Thereafter 4,225 Total $ 12,249 Year Amount 2010 1,984 2011 1,951 2012 1,924 2013 1,170 2014 1,151 Thereafter 8,067 Total $ 16,247 699—10—GOODWILL AND INTANGIBLE ASSETS2007 and 2006.2007. Reporting Unit (in thousands) Millennium Bank Total Balance at December 31, 2005 $ 10,104 $ 1,938 $ 12,042 Acquisition-related adjustments (1) 189 - 189 Goodwill from purchase of NorthStar Bancshares, Inc - 17,752 17,752 Balance at December 31, 2006 10,293 19,690 29,983 Acquisition-related adjustments (1) - 481 481 Goodwill from purchase of Clayco Banc Corporation - 25,208 25,208 Goodwill from purchase of 40% of Millennium Brokerage Group 1,505 - 1,505 Balance at December 31, 2007 11,798 45,379 57,177 Acquisition-related adjustments (1) 36 776 812 Goodwill write-off related to sale of Liberty branch - (97 ) (97 ) Goodwill write-off related to sale of DeSoto branch - (680 ) (680 ) Goodwill impairment related to Millennium Brokerage Group (8,700 ) - (8,700 ) Balance at December 31, 2008 $ 3,134 $ 45,378 $ 48,512 Reporting Unit (in thousands) Millennium Banking Total Balance at December 31, 2006 $ 10,293 $ 19,690 $ 29,983 Acquisition-related adjustments (1) - 481 481 Goodwill from purchase of Clayco Banc Corporation - 25,208 25,208 Goodwill from purchase of 40% of Millennium Brokerage Group 1,505 - 1,505 Balance at December 31, 2007 11,798 45,379 57,177 Acquisition-related adjustments (1) 36 776 812 Goodwill write-off related to sale of Liberty branch - (97 ) (97 ) Goodwill write-off related to sale of DeSoto branch - (680 ) (680 ) Goodwill impairment related to Millennium Brokerage Group (8,700 ) - (8,700 ) Balance at December 31, 2008 3,134 45,378 48,512 Goodwill impairment related to Banking segment - (45,378 ) (45,378 ) Goodwill from purchase of Valley Capital Bank - 953 953 Reclassification to assets held for sale (3,134 ) - (3,134 ) Balance at December 31, 2009 $ - $ 953 $ 953 (1) Includes additional purchase accounting adjustments on the Millennium, NorthStar and Clayco acquisitions necessary to reflect additional valuation data since the respective acquisition dates. See Note 23 – Acquisitions and Divestitures for more information. Customer and Customer and Trade Name Core Deposit Trade Name Core Deposit (in thousands) Intangibles Intangible Net Intangible Intangibles Intangible Net Intangible Balance at December 31, 2005 $ 4,548 $ - $ 4,548 Intangibles from purchase of NorthStar Bancshares, Inc - 2,369 2,369 Amortization expense (912 ) (216 ) (1,128 ) Balance at December 31, 2006 3,636 2,153 5,789 $ 3,636 $ 2,153 $ 5,789 Intangibles from purchase of Clayco Banc Corporation - 1,868 1,868 - 1,868 1,868 Amortization expense (912 ) (692 ) (1,604 ) (912 ) (692 ) (1,604 ) Balance at December 31, 2007 2,724 3,329 6,053 2,724 3,329 6,053 Amortization expense (845 ) (599 ) (1,444 ) (845 ) (599 ) (1,444 ) Intangible write-off related to sale of Liberty branch - (269 ) (269 ) - (269 ) (269 ) Intangible write-off related to sale of DeSoto branch/Great American charter - (336 ) (336 ) - (336 ) (336 ) Intangible write-off related to Millennium (500 ) - (500 ) (500 ) - (500 ) Balance at December 31, 2008 $ 1,379 $ 2,125 $ 3,504 1,379 2,125 3,504 Reclassification to assets held for sale (783 ) - (783 ) Amortization expense (596 ) (482 ) (1,078 ) Balance at December 31, 2009 $ - $ 1,643 $ 1,643 customer, trade name and core deposit intangiblesintangible (in thousands) at December 31, 2008.2009.Year Amount 2009 $ 1,077 2010 1,015 2011 371 2012 309 2013 247 After 2013 485 $ 3,504 Historically, the goodwill impairment tests have been completed as of December 31 each year. Following the annual impairment test for 2006, the Company changed the goodwill impairment test date for the Millennium reporting unit to September 30 of each fiscal year. This change in the testing date was designed to provide sufficient time for independent experts to complete the Millennium reporting unit testing prior to year end reporting. Core Deposit Year Intangible 2010 $ 420 2011 358 2012 296 2013 234 2014 172 After 2014 163 $ 1,643 impairment test date forassociated with the Banking reporting unit did not change.70The goodwill associated with Millennium was evaluated in accordance with SFAS 142,Goodwill and Other Intangible Assets.at March 31, 2009. Due primarily to continued pressuresthe deterioration in the sales margingeneral economic environment and the resulting earnings of Millennium,decline in the Company’s wholesale insurance brokerage business,share price and market capitalization, this analysis determined that the carrying value of the reporting unit was higher than the fair value of the reporting unit, which resulted in a non-cash goodwill impairment charge of $8,700,000$45,377,000 at March 31, 2009, thus eliminating all goodwill in 2008. The Millennium intangible assets are related to their customer lists and tradename. The Company also tested the Millennium intangible assets forBanking segment at that time. This impairment in conformity with SFAS 144,Accounting for the Impairment or Disposal of Long-Lived Asset, and determined that the customer related intangible was impaired by $500,000. These impairment chargescharge did not reduce the Company’s regulatory capital or cash flow.flows. The carrying value of the Millennium customer lists and tradename, were $1,165,000 and $214,000, respectively, as of December 31, 2008.The annual goodwill impairment evaluation in 2008 did not identify any impairment atCompany also tested the Banking unit. However, paragraph 28 of SFAS 142 requires that the goodwill impairment analysis be conducted when events or circumstances occur that would more likely than not reduce the fair value of a reporting unit below its carrying amount. An example of such an event includes significant adverse changes in the business climate, such as a significant decline in the Company’s market capitalization.10—11—MATURITY OF CERTIFICATES OF DEPOSIT2008:2009: $100,000 (in thousands) and Over Other Total Less than 1 year $ 373,045 $ 147,387 $ 520,432 Greater than 1 year and less than 2 years 112,953 27,766 140,719 Greater than 2 years and less than 3 years 33,064 11,182 44,246 Greater than 3 years and less than 4 years 596 1,179 1,775 Greater than 4 years and less than 5 years 100 342 442 Over 5 years 439 14 453 $ 520,197 $ 187,870 $ 708,067 $100,000 (in thousands) and Over Other Total Less than 1 year $ 358,032 $ 310,228 $ 668,260 Greater than 1 year and less than 2 years 49,087 40,206 89,293 Greater than 2 years and less than 3 years 10,065 14,980 25,045 Greater than 3 years and less than 4 years 25,312 1,458 26,770 Greater than 4 years and less than 5 years 111 384 495 Over 5 years 460 - 460 $ 443,067 $ 367,256 $ 810,323 11—12—SUBORDINATED DEBENTURES The notes mature in 2018, pay a fixed rate of interest at 10%, and are callable by Enterprise in five years.On December 12, 2008, the Company closed an offering of $25,000,000 in convertible trust preferred securities through EFSC Capital Trust VIII, a statutory business trust sponsored by the Company. The proceeds from the offering were used to provide additional parent company liquidity and regulatory capital. The securities have a 9% coupon, mature in 30 years and are callable by the Company after 5 years. They are convertible to 1,439,263 of the Company’s common stock. The Company may terminate the conversion rights, subject to certain limitations, after a two-year lockout period, if the Company’s price per share exceeds $22.58 for twenty consecutive trading days.On September 20, 2007, the Company issued EFSC Capital Trust VII. The proceeds from the offering were used to refinance EFSC Capital Trust I, which was redeemed on September 30, 2007. EFSC Capital Trust I redeemed all of its $4,000,000 variable rate trust preferred securities and its $124,000 of variable rate common securities. At the time of the redemption, the Company recognized an $82,000 charge in noninterest expense for unamortized debt issuance costs related to this instrument.On February 26, 2007 the Company issued EFSC Capital Trust VI to partially fund the Clayco acquisition. On February 28, 2007, as part of the Clayco acquisition, the Company acquired Clayco Trust I and Clayco Trust II.71Amount (in thousands) 2008 2007 Maturity Date Call date Interest Rate EFSC Clayco Trust I $ 3,196 $ 3,196 December 17, 2033 December 17, 2008 Floats @ 3MO LIBOR + 2.85% EFSC Capital Trust II 5,155 5,155 June 17, 2034 June 17, 2009 Floats @ 3MO LIBOR + 2.65% EFSC Capital Trust III 11,341 11,341 December 15, 2034 December 15, 2009 Floats @ 3MO LIBOR + 1.97% EFSC Clayco Trust II 4,124 4,124 September 15, 2035 September 15, 2010 Floats @ 3MO LIBOR + 1.83% EFSC Capital Trust IV 10,310 10,310 December 15, 2035 December 15, 2010 Fixed for 5 years @ 6.14%(1) EFSC Capital Trust V 4,124 4,124 September 15, 2036 September 15, 2011 Floats @ 3MO LIBOR + 1.60% EFSC Capital Trust VI 14,433 14,433 March 30, 2037 March 30, 2012 Fixed for 5 years @ 6.573%(2) EFSC Capital Trust VII 4,124 4,124 December 15, 2037 December 15, 2012 Floats @ 3MO LIBOR + 2.25% EFSC Capital Trust VIII 25,774 - December 15, 2038 December 15, 2013 (3) Fixed @ 9% Total trust preferred securities 82,581 56,807 Enterprise Subordinated Notes 2,500 - October 1, 2018 October 1, 2013 Fixed @ 10% Total Subordinated Debentures $ 85,081 $ 56,807 Amount (in thousands) 2009 2008 Maturity Date Call date Interest Rate EFSC Clayco Trust I $ 3,196 $ 3,196 December 17, 2033 December 17, 2008 Floats @ 3MO LIBOR + 2.85% EFSC Capital Trust II 5,155 5,155 June 17, 2034 June 17, 2009 Floats @ 3MO LIBOR + 2.65% EFSC Capital Trust III 11,341 11,341 December 15, 2034 December 15, 2009 Floats @ 3MO LIBOR + 1.97% EFSC Clayco Trust II 4,124 4,124 September 15, 2035 September 15, 2010 Floats @ 3MO LIBOR + 1.83% EFSC Capital Trust IV 10,310 10,310 December 15, 2035 December 15, 2010 Fixed for 5 years @ 6.14%(1) EFSC Capital Trust V 4,124 4,124 September 15, 2036 September 15, 2011 Floats @ 3MO LIBOR + 1.60% EFSC Capital Trust VI 14,433 14,433 March 30, 2037 March 30, 2012 Fixed for 5 years @ 6.573%(2) EFSC Capital Trust VII 4,124 4,124 December 15, 2037 December 15, 2012 Floats @ 3MO LIBOR + 2.25% EFSC Capital Trust VIII 25,774 25,774 December 15, 2038 December 15, 2013 (3) Fixed @ 9% Total trust preferred securities 82,581 82,581 Enterprise Subordinated notes 2,500 2,500 October 1, 2018 October 1, 2013 Fixed @ 10% Total Subordinated debentures $ 85,081 $ 85,081 (1) After October 2010, floats @ 3MO LIBOR + 1.44% (2) After February 2012, floats @ 3MO LIBOR + 1.60% (3) Convertible to EFSC common stock at a conversion price of $17.37. Forced conversion by EFSC if EFSC common stock trades at greater than or equal to $22.58 for twenty consecutive trading days after two years. income.operations. The Company’s investment in these trusts are included in other investments in the consolidated balance sheets.12—13—FEDERAL HOME LOAN BANK ADVANCES20082009 and 20072008 the carrying value of the loans pledged to the FHLB of Des Moines was $462,000,000 and $465,000,000, and $336,000,000, respectively.a $7,517,000an $8,476,000 investment in the capital stock of the FHLB of Des Moines and maintains a secured line of credit that had availability of approximately $164,300,000$118,504,000 at December 31, 2008.2008 2007 Outstanding Weighted Outstanding Weighted (in thousands) Term Balance Rate Balance Rate Long term non-amortizing fixed advance less than 1 year $ 81,050 3.48% $ 58,387 3.76% Long term non-amortizing fixed advance 1 - 2 years 20,800 4.19% 55,536 4.05% Long term non-amortizing fixed advance 2 - 3 years 300 6.07% 20,800 4.19% Long term non-amortizing fixed advance 3 - 4 years 7,000 4.52% 300 6.07% Long term non-amortizing fixed advance 4 - 5 years - - 7,000 4.52% Long term non-amortizing fixed advance 5 - 10 years 10,000 4.53% 10,000 4.53% Mortgage matched fixed advance 10 - 15 years 807 5.69% 878 5.69% Total Federal Home Loan Bank Advances $ 119,957 3.77% $ 152,901 4.02% 722009 2008 Outstanding Weighted Outstanding Weighted (in thousands) Term Balance Rate Balance Rate Long term non-amortizing fixed advance less than 1 year $ 20,800 4.19% $ 81,050 3.48% Long term non-amortizing fixed advance 1 - 2 years 5,300 2.04% 20,800 4.19% Long term non-amortizing fixed advance 2 - 3 years 22,000 2.90% 300 6.07% Long term non-amortizing fixed advance 3 - 4 years - - 7,000 4.52% Long term non-amortizing fixed advance 4 - 5 years - - - - Long term non-amortizing fixed advance 5 - 10 years 80,000 3.51% 10,000 4.53% Mortgage matched fixed advance 10 - 15 years - - 807 5.69% Total Federal Home Loan Bank Advances $ 128,100 3.45% $ 119,957 3.77% 2008, $50,000,0002009, $58,100,000 of the advances are prepayable by the Company at anytime, subject to prepayment penalties. Of the advances with a term of less than one year, at December 31, 2008, $20,000,000, $25,000,000, and $25,000,000 isfive to ten years, $70,000,000 were callable by the FHLB beginning on the option date in February 2009, March 2009 andas of December 2009, respectively, and quarterly thereafter.13—14—OTHER BORROWINGS AND NOTES PAYABLEDecember 31, December 31, Restated (in thousands) 2008 2007 2009 2008 Federal funds purchased $ 19,400 $ 1,784 $ - $ 19,400 Securities sold under repurchase agreements 26,760 8,896 39,338 26,760 Secured borrowings - 226,809 Total $ 46,160 $ 10,680 $ 39,338 $ 272,969 Average balance during the year $ 35,781 $ 8,068 $ 254,217 $ 208,637 Maximum balance outstanding at any month-end 55,232 10,782 404,134 272,969 Weighted average interest rate during the year 1.81 % 3.32 % 3.41 % 4.66 % Weighted average interest rate at December 31 0.38 % 3.17 % 0.55 % 3.42 %
In connection with the loan participation correction, the Company recorded the participated portion of such loans as portfolio loans, along with a secured borrowing liability to finance the loans. The Company also recorded incremental interest income on the loans offset by incremental interest expense on the secured borrowing. The average balance outstanding during 2009 and 2008 was $182,800,000 and $172,900,000, respectively. For the twelve months ended December 31, 2009 and 2008, the maximum balance outstanding at any month-end was $236,100,000 and $226,800,000. The weighted average interest rate on these borrowings was 4.53% and 5.25% for the years ended December 31, 2009 and 2008. The weighted average interest rate at December 31, 2008 was 4.00%. See Note 2 –Loan Participation Restatement for more information.
Enterprise also has a line with the Federal Reserve Bank of St. Louis for back-up liquidity purposes. As of December 31, 2008,2009, approximately $310,500,000$279,700,000 was available under this line. This line is secured by a pledge of certain eligible loans.
At December 31, 2008 the Company had a $16,000,000 unsecured bank line of credit and a $4,000,000 term loan that expireexpired on April 30, 2009. As of September 30, 2008, the Company became noncompliant with certain covenants regarding classified loans as a percentage of bank equity and loan loss reserves. As a result, theThe Company repaid all outstanding balances on the line of credit and term loan in December 2008. The Company doesdid not expect to renew this arrangement at maturity. Both the line of credit and term loan accrueaccrued interest based on LIBOR plus 1.25% and arewere payable quarterly. For the year ended December 31, 2008, the average balance and maximum month-end balance of these instruments was $12,849,000 and $20,000,000, respectively.14—15—LITIGATION AND OTHER CLAIMSNOTE 15—INCOME TAXESThe components of income tax expense for the years ended December 31 are as follows:Years ended December 31, (in thousands) 2008 2007 2006 Current: Federal $ 7,599 $ 7,637 $ 9,023 State and local 233 632 546 Deferred (6,246 ) 747 (1,244 ) $ 1,586 $ 9,016 $ 8,325 73A reconciliation of expected income tax expense, computed by applying the statutory federal income tax rate of 35% in 2008, 2007, and 2006 to income before income taxes and the amounts reflected in the consolidated statements of income is as follows:Years ended December 31, (in thousands) 2008 2007 2006 Income tax expense at statutory rate $ 2,106 $ 9,308 $ 8,327 Increase (reduction) in income tax resulting from: Tax-exempt income (401 ) (303 ) (274 ) State and local income tax expense 151 411 355 Non-deductible expenses 208 258 236 Other, net (478 ) (658 ) (319 ) Total income tax expense $ 1,586 $ 9,016 $ 8,325 A net deferred income tax asset of $13,225,000 and $7,492,000 is included in other assets in the consolidated balance sheets at December 31, 2008 and 2007, respectively. The tax effect of temporary differences that gave rise to significant portions of the deferred tax assets and deferred tax liabilities is as follows:Years ended December 31, (in thousands) 2008 2007 Deferred tax assets: Allowance for loan losses $ 11,292 $ 7,693 Deferred compensation 824 897 Merchant banking investments 239 239 Loans 21 102 Intangible assets 3,244 - Other 75 - Total deferred tax assets 15,695 8,931 Deferred tax liabilities: Unrealized gains on securities available for sale 467 24 State tax credits, net 1,056 - Core deposit intangibles 774 1,212 Office equipment and leasehold improvements 173 203 Total deferred tax liabilities 2,470 1,439 Net deferred tax asset $ 13,225 $ 7,492 A valuation allowance is provided on deferred tax assets when it is more likely than not that some portion of the assets will not be realized. The Company did not have any valuation allowances as of December 31, 2008 or December 31, 2007. Management believes it is more likely than not that the results of future operations will generate sufficient taxable income to realize the deferred tax assets above.The Company, or one of its subsidiaries, files income tax returns in the U.S. federal jurisdiction and in seven states. With few exceptions, the Company is no longer subject to U.S. federal, state or local income tax audits by tax authorities for years before 2005. The Company is not currently under audit by any taxing jurisdiction.The Company recognizes interest and penalties related to uncertain tax positions in income tax expense and classifies such interest and penalties in the liability for unrecognized tax benefits. As of December 31, 2008, the Company had approximately $230,000 accrued for interest and penalties.The Company adopted the provisions of Financial Accounting Standards Board Interpretation No. 48,Accounting forUncertainty in Income Taxes, an Interpretation of FAS No. 109,Accounting for Income Taxeson January 1, 2007. As a result of the implementation, the Company recognized a $138,000 decrease in the liability for unrecognized tax benefits, which was accounted for as an increase to the January 1, 2007 balance of retained earnings. The Company recognizes interest and penalties related to uncertain tax positions in income tax expense and classifies such interest and penalties in the liability for unrecognized tax benefits.74As of December 31, 2008, the gross amount of unrecognized tax benefits was $1,690,000 and the total amount of unrecognized tax benefits that would impact the effective tax rate, if recognized, was $1,200,000. The Company believes it is reasonably possible that an additional $430,000 in unrecognized tax benefits related to certain federal and state tax items will be recognized during 2009 as a result of the expiration of certain statues of limitations.The activity in the accrued liability for unrecognized tax benefits was as follows:(in thousands) 2008 2007 Balance at beginning of year $ 2,412 $ 2,430 Additions based on tax positions related to the current year 245 484 Additions for tax positions of prior years 241 112 Reductions for tax positions of prior years (491 ) - Settlements of lapse of exposure (717 ) (614 ) Balance at end of year $ 1,690 $ 2,412 each of its bank subsidiariesEnterprise are subject to various regulatory capital requirements administered by the Federal banking agencies. Failure to meet minimum capital requirements can initiate certain mandatory and possible additional discretionary actions by regulators that, if undertaken, could have a direct material effect on the financial statements of the Company and its banking subsidiaries.Enterprise. Under capital adequacy guidelines and the regulatory framework for prompt corrective action, the Company and each bankEnterprise must meet specific capital guidelines that involve quantitative measures of assets, liabilities, and certain off-balance-sheet items as calculated under regulatory accounting practices. Each bank’sEnterprise’s capital amounts and classification are also subject to qualitative judgments by the regulators about components, risk weightings, and other factors.each bankEnterprise to maintain minimum amounts and ratios (set forth in the following table) of total and Tier 1 capital to risk-weighted assets, and of Tier 1 capital to average assets. Management believes, as of December 31, 20082009 and 2007,2008, that the Company and bankEnterprise meet all capital adequacy requirements to which they are subject.and 2007, the bankEnterprise was categorized as “well capitalized” under the regulatory framework for prompt corrective action. To be categorized as “well capitalized” each bankEnterprise must maintain minimum total risk-based, Tier 1 risk-based and Tier 1 leverage ratios as set forth in the table.75table.table below. To Be Well To Be Well Capitalized Under Capitalized Under For Capital Applicable For Capital Applicable Actual Adequacy Purposes Action Provisions Actual Adequacy Purposes Action Provisions (in thousands) Amount Ratio Amount Ratio Amount Ratio Amount Ratio Amount Ratio Amount Ratio As of December 31, 2009: Total Capital (to Risk Weighted Assets) Enterprise Financial Services Corp $ 268,454 13.32 % $ 161,231 8.00 % $ - - % Enterprise Bank & Trust 226,372 11.37 159,278 8.00 199,098 10.00 Tier 1 Capital (to Risk Weighted Assets) Enterprise Financial Services Corp 215,099 10.67 80,616 4.00 - - Enterprise Bank & Trust 198,761 9.98 79,639 4.00 119,459 6.00 Tier 1 Capital (to Average Assets) Enterprise Financial Services Corp 215,099 8.96 72,018 3.00 - - Enterprise Bank & Trust 198,761 8.38 71,185 3.00 118,642 5.00 As of December 31, 2008: Total Capital (to Risk Weighted Assets) Enterprise Financial Services Corp $ 273,978 12.81 % $ 171,136 8.00 % $ - - % $ 273,978 12.81 % $ 171,136 8.00 % $ - - % Enterprise Bank & Trust 230,008 10.86 169,479 8.00 211,848 10.00 230,008 10.86 169,479 8.00 211,849 10.00 Tier I Capital (to Risk Weighted Assets) Tier 1 Capital (to Risk Weighted Assets) Enterprise Financial Services Corp 190,253 8.89 85,568 4.00 - - 190,253 8.89 85,568 4.00 - - Enterprise Bank & Trust 200,968 9.49 84,739 4.00 127,109 6.00 200,968 9.49 84,739 4.00 127,109 6.00 Tier I Capital (to Average Assets) Tier 1 Capital (to Average Assets) Enterprise Financial Services Corp 190,253 8.40 67,961 3.00 - - 190,253 8.67 71,788 3.00 - - Enterprise Bank & Trust 200,968 8.95 67,392 3.00 112,319 5.00 200,968 8.45 71,352 3.00 118,920 5.00 As of December 31, 2007: Total Capital (to Risk Weighted Assets) Enterprise Financial Services Corp $ 186,549 10.54 % $ 141,534 8.00 % $ - - % Enterprise Bank & Trust 160,862 10.02 128,463 8.00 160,579 10.00 Great American Bank 18,381 11.80 12,457 8.00 15,571 10.00 Tier I Capital (to Risk Weighted Assets) Enterprise Financial Services Corp 164,957 9.32 70,767 4.00 - - Enterprise Bank & Trust 141,259 8.80 64,231 4.00 96,347 6.00 Great American Bank 16,434 10.55 6,229 4.00 9,343 6.00 Tier I Capital (to Average Assets) Enterprise Financial Services Corp 164,957 8.85 55,938 3.00 - - Enterprise Bank & Trust 141,259 8.32 50,959 3.00 84,931 5.00 Great American Bank 16,434 8.14 55,938 3.00 10,094 5.00 RSU’s”RSUs”), as designated by the Company’s Board of Directors. The Company uses authorized and unissued shares to satisfy share award exercises. During 2008,2009, share-based compensation was issued in the form of stock stock options,and stock-settled stock appreciation rights and RSU’s.(“SSAR”). At December 31, 2008,2009, there were 885,523849,723 shares available for grant under the various share-based compensation plans. An additional 80,34665,340 shares of stock were available for issuance under the Stock Plan for Non-Management Directors approved by the Shareholders in April 2006.The$1,906,000 and $1,252,000$1,906,000 for the years ended December 31, 2009, 2008, 2007 and 2006,2007, respectively. The total income tax (expense) benefit recognized in the income statementAdditional paid in capital for share-based compensation arrangements was ($338,000), $460,000, $381,000 and $525,000$381,000 for the years ended December 31, 2009, 2008, and 2007, respectively.2006, respectively. of options on date of grant. The Black-Scholes model is a closed-end model that uses the assumptions in the following table. The risk-free rate for the expected term is based on the U.S. Treasury zero-coupon spot rates in effect at the time of grant. Expected volatility is based on historical volatility of the Company’s common stock. The Company uses historical exercise behavior and other factors to estimate the expected term of the options, which represents the period of time that the options granted are expected to be outstanding. 2008 2007 2006 2009 2008 2007 Risk-free interest rate 3.9% 5.2% 4.5% 2.5% 3.9% 5.2% Expected dividend rate 0.6% 0.6% 0.3% 0.6% 0.6% 0.6% Expected volatility 39.4% 36.0% 54.6% 54.8% 39.4% 36.0% Expected term 6 years 6 years 9.5 years 6 years 6 years 6 years 76Employee Stock Options and Stock-settled Stock Appreciation Rightswerehave been granted to key employees with exercise prices equal to the market price of the Company’s common stock at the date of grant and have 10-year contractual terms. Stock options have a vesting schedule of between three to five years. In 2007, the Company began granting stock-settled stock appreciation rights (“SSAR”)SSARs to key employees. The SSAR’sSSARs are subject to continued employment, have a 10-year contractual term and vest ratably over five years. Neither stock options nor SSAR’sSSARs carry voting or dividend rights until exercised. At December 31, 2008,2009, there was $32,000$35,000 and $2,883,000$2,026,000 of total unrecognized compensation cost related to stock options and SSAR’s,SSARs, respectively, which is expected to be recognized over a weighted average period of 1.31 year and 2.7 years, respectively. Various information related to the stock options and 3.6 years, respectively.SSARs is shown below.(in thousands, except grant date fair value) 2008 2007 2006 2009 2008 2007 Weighted average grant date fair value of options $ 8.27 $ 10.69 $ 18.34 Weighted average grant date fair value of options and SSARs $ 8.99 $ 8.27 $ 10.69 Compensation expense 705 452 21 896 705 452 Intrinsic value of option exercises on date of exercise 2,177 1,961 1,750 1 2,177 1,961 Cash received from the exercise of stock options 3,148 1,233 1,226 15 3,148 1,233 2008.2009. Weighted Weighted Average Average Remaining Aggregate Exercise Contractual Intrinsic (Dollars in thousands, except share data) Shares Price Term Value Outstanding at December 31, 2007 891,816 $ 15.42 Granted 305,198 19.79 Exercised (265,779 ) 11.84 Forfeited (103,764 ) 24.58 Outstanding at December 31, 2008 827,471 $ 17.03 6.5 years $ (1,484 ) Exercisable at December 31, 2008 485,274 $ 14.24 4.5 years $ 485 Vested and expected to vest at December 31, 2008 765,457 $ 16.47 6.5 years $ (941 ) Weighted Weighted Average Average Remaining Aggregate Exercise Contractual Intrinsic (Dollars in thousands, except share data) Shares Price Term Value Outstanding at December 31, 2008 827,471 $ 17.03 Granted 7,000 8.99 Exercised (1,500 ) 10.00 Forfeited (29,236 ) 22.65 Outstanding at December 31, 2009 803,735 $ 16.77 5.5 years $ - Exercisable at December 31, 2009 559,065 $ 15.20 4.2 years $ - Vested and expected to vest at December 31, 2009 734,721 $ 16.23 5.5 years $ -
As part of a long-term incentive plan, the Company awards nonvested stock, in the form of RSU’sRSUs to employees. RSU’sRSUs are subject to continued employment and vest ratably over five years. RSU’sRSUs do not carry voting or dividend rights until vested. Sales of the units are restricted prior to vesting. Various information related to the RSUs is shown below.(in thousands) 2008 2007 2006 2009 2008 2007 Compensation expense $ 1,380 $ 1,308 $ 1,029 $ 1,138 $ 1,380 $ 1,308 Total fair value at vesting date 765 1,384 1,421 417 765 1,384 Total unrecognized compensation cost for nonvested stock units 3,038 3,441 3,418 Total unrecognized compensation cost for nonvested stock units 1,879 3,038 3,441 Expected years to recognize unearned compensation 3.0 years 3.1 years 3.5 years 2.2 years 3.0 years 3.1 years restricted stock unitRSU awards as of December 31, 20082009 and changes during the year then ended is presented below. Weighted Weighted Average Average Grant Date Grant Date Shares Fair Value Shares Fair Value Outstanding at December 31, 2007 168,286 $ 23.74 Outstanding at December 31, 2008 150,463 $ 22.89 Granted 95,067 21.39 - - Vested (59,510 ) 22.63 (54,074 ) 22.53 Forfeited (53,385 ) 23.20 (18,239 ) 23.29 Outstanding at December 31, 2008 150,458 $ 22.89 Outstanding at December 31, 2009 78,150 $ 23.05 77
In 2006, the Company adopted a Stock Plan for Non-Management Directors, which provides for issuing shares of common stock to non-employee directors as compensation in lieu of cash. The plan was approved by the shareholders and allows up to 100,000 shares to be awarded. Shares are issued twice a year and compensation expense is recorded as the shares are earned, therefore, there is no unrecognized compensation cost related to this plan. In 2009, the Company issued 17,015 shares of stock at a weighted average fair value of $9.86 per share. In 2008, the Company issued 9,544 shares of stock at a weighted average fair value of $17.83 per share. In 2007, the Company issued 6,729 shares of stock at a weighted average fair value of $27.40 per share. The Company recognized $170,000$168,000 and $146,000$170,000 of stock-based compensation expense for the shares issued to the directors in 2009 and 2008, and 2007, respectively.
In 1997, the Company entered into a solicitation and referral agreement with Moneta Group, Inc. (“Moneta”), a nationally recognized firm in the financial planning industry. There have been no options granted to Moneta under the agreement since 2003. The fair value of each option granted to Moneta was estimated on the date of grant using the Black-Scholes option pricing model. The Company recognized the fair value of the options over the vesting period as expense. As of December 31, 2006, the fair value of all Moneta options had been recognized. The Company recognized $17,000 in Moneta option-related expenses during 2006.2008. Weighted Weighted Average Average Remaining Aggregate Exercise Contractual Intrinsic (Dollars in thousands, except share data) Shares Price Term Value Outstanding at December 31, 2007 137,098 $ 12.62 Granted - - Exercised (53,680 ) 10.34 Forfeited (4,169 ) 15.32 Outstanding at December 31, 2008 79,249 $ 14.02 1.4 years $ 97 Exercisable at December 31, 2008 79,249 $ 14.02 1.4 years $ 97 Weighted Weighted Average Average Remaining Aggregate Exercise Contractual Intrinsic (Dollars in thousands, except share data) Shares Price Term Value Outstanding at December 31, 2008 91,001 $ 13.55 Granted - - Exercised (22,462 ) 10.33 Forfeited (39,193 ) 14.98 Outstanding at December 31, 2009 29,346 $ 14.10 1.9 years $ - Exercisable at December 31, 2009 29,346 $ 14.10 1.9 years $ -
Effective January 1, 1993, the Company adopted a 401(k) thrift plan which covers substantially all full-time employees over the age of 21. In addition, substantially all employees of Millennium can elect to participate in a safe-harbor 401(k) plan. The amount charged to expense for the Company’s contributions to the plansplan was $529,000, $447,000$349,000, $496,000 and $323,000$421,000 for 2009, 2008, and 2007, and 2006, respectively.Years ended December 31, Restated Restated (in thousands) 2009 2008 2007 Current: Federal $ (383 ) $ 7,599 $ 7,637 State and local (433 ) 233 632 Deferred (2,545 ) (7,699 ) 565 Total income tax (benefit) expense $ (3,361 ) $ 133 $ 8,834 Income tax (benefit) expense is included in the financial statements as follows: Continuing operations $ (2,650 ) $ 3,672 $ 8,098 Discontinued operations (711 ) (3,539 ) 736 Total income tax (benefit) expense $ (3,361 ) $ 133 $ 8,834 Years ended December 31, Restated Restated (in thousands) 2009 2008 2007 Income tax (benefit) expense at statutory rate $ (17,961 ) $ 653 $ 9,126 Increase (reduction) in income tax resulting from: Tax-exempt income (597 ) (401 ) (303 ) Goodwill write off 15,882 - - State and local income tax expense (282 ) 151 411 Non-deductible expenses 187 208 258 Other, net (590 ) (478 ) (658 ) Total income tax (benefit) expense $ (3,361 ) $ 133 $ 8,834 Years ended December 31, Restated (in thousands) 2009 2008 Deferred tax assets: Allowance for loan losses $ 15,631 $ 13,123 Deferred compensation 1,298 824 Intangible assets 3,473 3,244 Tax credit carryforwards 806 - Other, net 517 314 Total deferred tax assets $ 21,725 $ 17,505 Deferred tax liabilities: Unrealized gains on securities available for sale $ 537 $ 467 State tax credits held for sale, net of economic hedge 1,216 1,056 Core deposit intangibles 598 774 Office equipment and leasehold improvements 1,114 173 Total deferred tax liabilities 3,465 2,470 Net deferred tax asset $ 18,260 $ 15,035 (in thousands) 2009 2008 Balance at beginning of year $ 1,690 $ 2,412 Additions based on tax positions related to the current year 142 245 Additions for tax positions of prior years 180 241 Reductions for tax positions of prior years - (491 ) Settlements of lapse of exposure (675 ) (717 ) Balance at end of year $ 1,337 $ 1,690 2008,2009, no amounts have been accrued for any estimated losses for these financial instruments.20082009 and 20072008 is as follows: December 31, December 31, (in thousands) 2008 2007 Commitments to extend credit $ 555,361 $ 535,227 Standby letters of credit 33,875 36,464 December 31, December 31, (in thousands) 2009 2008 Commitments to extend credit $ 457,777 $ 555,361 Standby letters of credit 32,263 33,875 782007, approximately $131,000,000, and $61,181,000, respectively, represents fixed rate loan commitments. Since certain of the commitments may expire without being drawn upon, the total commitment amounts do not necessarily represent future cash requirements. The Company evaluates each customer’s credit worthiness on a case-by-case basis. The amount of collateral obtained, if deemed necessary by the bank upon extension of credit, is based on management’s credit evaluation of the borrower. Collateral held varies, but may include accounts receivable, inventory, premises and equipment, and real estate.2008.19—20—FAIR VALUE MEASUREMENTSEffective January 1, 2008, the Company adopted SFAS 157,Fair Value Measurements,for financial assets and financial liabilities. In accordance with FSP 157-2,Effective Date of FASB Statement No. 157(“FSP 157-2”), the Company will delay application of SFAS 157 for non-financial assets and non-financial liabilities, until January 1, 2009. SFAS 157 definesestablishes a framework for measuring fair value in generally accepted accounting principles and expands disclosures about fair value measurements.SFAS 157 defines fair value asof an asset or liability is the price that would be received to sell anthat asset or paid to transfer athat liability in an orderly transaction between market participants. A fair value measurement assumes that the transaction to sell the asset or transfer the liability occursoccurring in the principal market for the asset or liability or,(or most advantageous market in the absence of a principal market, the most advantageous marketmarket) for thesuch asset or liability. The price in the principal (or most advantageous) market used to measure theIn estimating fair value, of the asset or liability shall not be adjusted for transaction costs. An orderly transaction is a transaction that assumes exposure to the market for a period prior to the measurement date to allow for marketing activities that are usual and customary for transactions involving such assets and liabilities; it is not a forced transaction. Market participants are buyers and sellers in the principal market that are (i) independent, (ii) knowledgeable, (iii) able to transact and (iv) willing to transact.SFAS 157 requires the use ofCompany utilizes valuation techniques that are consistent with the market approach, the income approach and/or the cost approach. The market approach uses prices and other relevant information generated by market transactions involving identical or comparable assets and liabilities. The income approach usesSuch valuation techniques to convert future amounts, such as cash flows or earnings, to a single present amount on a discounted basis. The cost approach is based on the amount that currently would be required to replace the service capacity of an asset (replacement cost). Valuation techniques should beare consistently applied. Inputs to valuation techniques refer toinclude the assumptions that market participants would use in pricing thean asset or liability. Inputs may be observable, meaning those that reflect the assumptions market participants would use in pricing the asset or liability developed based on market data obtained from independent sources, or unobservable, meaning those that reflect the reporting entity's own assumptions about the assumptions market participants would use in pricing the asset or liability developed based on the best information available in the circumstances. In that regard, SFAS 157ASC Topic 820, “Fair Value Measurements and Disclosures,” establishes a fair value hierarchy for valuation inputs that gives the highest priority to quoted prices in active markets for identical assets or liabilities and the lowest priority to unobservable inputs. The fair value hierarchy is as follows:
79In general,is based upon quoted market prices, where available. If such quoted market prices are not available, fair value is based upon internally developed models that primarily use,on a recurring basis as of December 31, 2009, segregated by the level of the valuation inputs observable market-based parameters. Valuation adjustments may be made to ensure that financial instruments are recorded at fair value. These adjustments may include amounts to reflect counterparty credit quality, the Company's creditworthiness, among other things, as well as unobservable parameters. Any such valuation adjustments are applied consistently over time. The Company's valuation methodologies may produce a fair value calculation that may not be indicative of net realizable value or reflective of future fair values. While management believes the Company's valuation methodologies are appropriate and consistent with other market participants, the use of different methodologies or assumptions to determinewithin the fair value of certain financial instruments could result in a different estimate ofhierarchy utilized to measure fair value at the reporting date. These valuation methodologies were applied to all of the Company's financial assets and financial liabilities carried at fair value effective January 1, 2008.value:Quoted Prices in Active Significant Markets for Other Significant Identical Observable Unobservable Assets Inputs Inputs Total Fair (in thousands) (Level 1) (Level 2) (Level 3) Value Assets Securities available for sale $ - $ 279,631 $ 2,830 $ 282,461 State tax credits held for sale - - 32,485 32,485 Derivative financial instruments - 1,237 - 1,237 Portfolio loans - 17,226 - 17,226 Total assets $ - $ 298,094 $ 35,315 $ 333,409 Liabilities Derivative financial instruments $ - $ 1,105 $ - $ 1,105 Total liabilities $ - $ 1,105 $ - $ 1,105 September 30, 2008,December 31, 2009, Level 3 securities available for sale included a Federal Home Loan Mortgage Corporation pool. This security was sold during the fourth quarter of 2008.include three Auction Rate Securities.
Pursuant toAt December 31, 2009, of the provisions$51,258,000 of SFAS 159, the Company elected to record its state tax credits held for sale on the consolidated balance sheet, approximately $32,485,000 were carried at fair value. The cumulative effect adjustment necessaryremaining $18,773,000 of state tax credits were accounted for at the lower of cost or fair value. The Company elected not to carryaccount for the state tax credits on handpurchased in 2009 atJanuary 1, 2008 was $570,000, which was recorded, net fair value in order to limit the volatility of tax as an adjustment to retained earnings asthe fair value changes in our consolidated statements of January 1, 2008.operations.2008,2009, the discount rates utilized in our state tax credits fair value calculation ranged from 3.80%2.30% to 4.61%6.01%. Resulting changes in the fair value of the state tax credits held for sale of $4,635,000 were reported indecreased Gain on state tax credits in the consolidated statement of incomeoperations by $1,304,000 for the year ended December 31, 2008.
2009.OtherliabilitiesOther liabilities in the consolidated balance sheets. Derivatives with positive fair value are included in Other assets in the consolidated balance sheets.80The following table summarizes financial instruments measured at fair value on a recurring basis as of December 31, 2008, segregated by the level of the valuation inputs within the fair value hierarchy utilized to measure fair value: Level 1 Level 2 Level 3 Total Fair (in thousands) Inputs Inputs Inputs Value Assets Securities available for sale $ - $ 96,431 $ - $ 96,431 State tax credits held for sale - - 39,142 39,142 Derivative financial instruments - 1,835 - 1,835 Portfolio loans - 18,875 - 18,875 Total assets $ - $ 117,141 $ 39,142 $ 156,283 Liabilities Derivative financial instruments $ - $ 1,467 $ - $ - Total liabilities $ - $ 1,467 $ - $ - 2008. Securities available for sale, at fair State tax credits (in thousands) value held for sale Balance at January 1, 2008 $ - $ 22,547 Total gains or losses (realized and unrealized): Included in earnings - 5,740 Included in other comprehensive income (37 ) - Purchases, sales, issuances and settlements, net 37 10,855 Transfer in and/or out of Level 3 - - Balance at December 31, 2008 $ - $ 39,142 Change in unrealized gains or losses relating to assets still held at the reporting date $ - $ 4,635 Securities available for sale, at fair State tax credits (in thousands) value held for sale Balance at December 31, 2008 $ - $ 39,142 Total gains or losses (realized and unrealized): Included in earnings - 444 Included in other comprehensive income (470 ) - Purchases, sales, issuances and settlements, net 3,300 (7,102 ) Transfer in and/or out of Level 3 - - Balance at December 31, 2009 $ 2,830 $ 32,485 Change in unrealized gains or losses relating to assets still held at the reporting date $ (470 ) $ (1,304 )
loans.loans. Impaired loans are included as Portfolio loans on the Company’s consolidated balance sheet with amounts specifically reserved for credit impairment in the Allowance for loan losses. TheFrom time to time, fair value ofadjustments are recorded on impaired loans isto reflect (1) partial write-downs that are based on the current appraised or market-quoted value of the underlying collateral. These assetscollateral or (2) the full charge-off of the loan carrying value. In some cases, the properties for which market quotes or appraised values have been obtained are located in areas where comparable sales data is limited, outdated, or unavailable. In addition, the Company may adjust the valuations based on other relevant market conditions or information. Accordingly, fair value estimates, including those obtained from real estate brokers or other third-party consultants, for collateral-dependent impaired loans are classified asin Level 2.3 of the valuation hierarchy.
23 inputs.812008.2009. Level 1 Level 2 Level 3 Total Fair (in thousands) Input Input Input Value Loans held for sale $ - $ 2,632 $ - $ 2,632 Impaired loans - 33,322 - 33,322 Other real estate - 13,868 - 13,868 Total $ - $ 49,822 $ - $ 49,822 Certain non-financial assets and non-financial liabilitiesQuoted Prices in Active Significant Markets for Other Significant Identical Observable Unobservable Total gains (losses) for Total Fair Assets Inputs Inputs the years ended (in thousands) Value (Level 1) (Level 2) (Level 3) December 31, 2009 Impaired loans (1) $ 7,590 $ - $ - $ 7,590 $ (17,596 ) Other real estate (1) 6,955 - - 6,955 (2,389 ) Goodwill - - - - (45,377 ) Total $ 14,545 $ - $ - $ 14,545 $ (65,361 ) on a recurring basis include reporting units measured at fair value induring the first step of a goodwill impairment test. Certain non-financial assets measured at fair value on a non-recurring basis include non-financial assetsperiod and non-financial liabilities measured at fair value in the second step of a goodwill impairment test,still held as well as intangible assets and other non-financial long-lived assets measured at fair value for impairment assessment. As stated above, FSP 157-2 will be applicable to these fair value measurements beginning January 1, 2009.Effective January 1, 2008, the Company adopted the provisions of SFAS No. 159,The Fair Value Option for Financial Assets and Financial Liabilities - Including an amendment of FASB Statement No. 115.There were no valuation allowances related to the state tax credits held for sale that were impacted by the adoption of SFAS 159. Below is a summary of the impact of the initial implementation of the FVO.reporting date. January 1, 2008 December 31, 2007 Cumulative effect of fair value (carrying (carrying value prior adjustment at value after (in thousands) to adoption) January 1, 2008 adoption) State tax credits held for sale $ 23,117 $ (570 ) $ 22,547 Pretax cumulative effect of adoption of the fair value option (570 ) Increase in deferred tax asset 205 Cumulative effect of adoption of the fair value option (charge to retained earnings) $ (365 ) SFAS 107,Disclosures about Fair Value of Financial Instruments, extends existing fair value disclosure for some financial instruments by requiring disclosure of the fair value of such financial instruments, both assets and liabilities recognized and not recognized in the consolidated balance sheets.8220082009 and 2007:2008:2008 2007 December 31, 2009 December 31, 2008 (Restated) Carrying Estimated Carrying Estimated Carrying Estimated Carrying Estimated (in thousands) Amount fair value Amount fair value Amount fair value Amount fair value Balance sheet assets Cash and due from banks $ 25,626 $ 25,626 $ 76,265 $ 76,265 $ 16,064 $ 16,064 $ 25,626 $ 25,626 Federal Funds Sold 2,637 2,637 75,665 75,665 Federal funds sold 7,472 7,472 2,637 2,637 Interest-bearing deposits 14,384 14,384 1,719 1,719 83,430 83,430 14,384 14,384 Securities available for sale 96,431 96,431 70,756 70,756 282,461 282,461 96,431 96,431 Other investments 11,884 11,884 12,577 12,577 13,189 13,189 11,884 11,884 Loans held for sale 2,632 2,632 3,420 3,420 4,243 4,243 2,632 2,632 Derivative financial instruments 1,835 1,835 300 300 1,237 1,237 1,835 1,835 Loans, net of allowance for loan losses 1,945,866 1,991,183 1,619,839 1,622,977 Portfolio loans, net 1,790,265 1,794,633 2,167,649 2,212,966 State tax credits, held for sale 39,142 39,142 23,149 23,149 51,258 51,258 39,142 39,142 Accrued interest receivable 7,557 7,557 8,334 8,334 7,751 7,751 7,557 7,557 Balance sheet liabilities Deposits 1,792,784 1,800,958 1,585,012 1,588,539 1,941,416 1,944,910 1,792,784 1,800,958 Subordinated debentures 85,081 71,393 56,807 57,050 85,081 43,060 85,081 71,394 Federal Home Loan Bank advances 128,100 138,688 119,957 134,691 Other borrowed funds 166,117 180,864 169,580 182,065 39,338 39,360 272,969 272,982 Derivative financial instruments 1,467 1,467 - - 1,105 1,105 1,467 1,467 Accrued interest payable 2,473 2,473 3,710 3,710 2,125 2,125 2,473 2,473
For cash and due from banks, federal funds purchased, interest-bearing deposits, and accrued interest receivable (payable), the carrying amount is a reasonable estimate of fair value, as such instruments reprice in a short time period.
The Company obtains fair value measurements for available for sale debt instruments from an independent pricing service. The fair value measurements consider observable data that may include dealer quotes, market spreads, cash flows, the U.S. Treasury yield curve, live trading levels, trade execution data, market consensus prepayment speeds, credit information and the bond's terms and conditions.
Other investments, which primarily consists of membership stock in the FHLB is reported at cost, which approximates fair value.Loans,Portfolio loans, net of allowance for loan losses
The fair value of adjustable-rate loans approximates cost. The fair value of fixed-rate loans is estimated by discounting the future cash flows using the current rates at which similar loans would be made to borrowers for the same remaining maturities. The fair value of the Valley Capital loans is based on the present value of expected future cash flows. The fair value of loans sold under participation agreements (see Note 2 – Loan Participation Restatement) is estimated to equal their carrying value, given our ability to settle at carrying value. As described in Note 2, all of the participation agreements were modified in 2009. The method of estimating fair value does not incorporate the exit-price concept of fair value prescribed by ASC Topic 820.
The fair value of state tax credits held for sale is calculated using an internal valuation model with unobservable market data including discounted cash flows based upon the terms and conditions of the tax credits.
The fair value of derivative financial instruments is based on quoted market prices by the counterparty and verified by the Company using public pricing information.
The fair value of demand deposits, interest-bearing transaction accounts, money market accounts and savings deposits is the amount payable on demand at the reporting date. The fair value of fixed-maturity certificates of deposit is estimated by discounting the future cash flows using the rates currently offered for deposits of similar remaining maturities. The fair value of the Valley Capital deposits is estimated to equal their carrying value.83
Fair value of floating interest rate subordinated debentures is assumed to equal carrying value. Fair value of fixed interest rate subordinated debentures is based on discounting the future cash flows using rates currently offered for financial instruments of similar remaining maturities.Other borrowed fundsFederal Home Loan Bank advancesOther borrowed funds include FHLB advances, customer repurchase agreements, federal funds purchased, and notes payable. The fair value of the FHLB advances is based on the discounted value of contractual cash flows. The discount rate is estimated using current rates on borrowed money with similar remaining maturities.
Other borrowed funds include customer repurchase agreements, federal funds purchased, notes payable, and secured borrowings related to loan participations. The fair value of federal funds purchased, customer repurchase agreements and notes payable are assumed to be equal to their carrying amount since they have an adjustable interest rate. The fair value of the secured borrowings related to the loan participations (see Note 2 – Loan Participation Restatement) is estimated to equal the carrying value of the participated loans, given our ability to settle at carrying value.
The fair value of commitments to extend credit and standby letters of credit would be estimated using the fees currently charged to enter into similar agreements, taking into account the remaining terms of the agreements, the likelihood of the counterparties drawing on such financial instruments, and the present creditworthiness of such counterparties. The Company believes such commitments have been made on terms which are competitive in the markets in which it operates; however, no premium or discount is offered thereon and accordingly, the Company has not assigned a value to such instruments for purposes of this disclosure.
Fair value estimates are made at a specific point in time, based on relevant market information and information about the financial instrument. These estimates are subjective in nature and involve uncertainties and matters of significant judgment, and therefore, cannot be determined with precision. Such estimates include the valuation of loans, goodwill, intangible assets, and other long-lived assets, along with assumptions used in the calculation of income taxes, among others. These estimates and assumptions are based on management’s best estimates and judgment. Management evaluates its estimates and assumptions on an ongoing basis using historical experience and other factors, including the current economic environment, which management believes to be reasonable under the circumstances. We adjust such estimates and assumptions when facts and circumstances dictate. Decreasing real estate values, illiquid credit markets, volatile equity markets, and declines in consumer spending have combined to increase the uncertainty inherent in such estimates and assumptions. As future events and their effects cannot be determined with precision, actual results could differ significantly from these estimates. Changes in estimates resulting from continuing changes in the economic environment will be reflected in the financial statement in future periods. In addition, these estimates do not reflect any premium or discount that could result from offering for sale at one time the Company’s entire holdings of a particular financial instrument. Fair value estimates are based on existing on-balance and off-balance-sheet financial instruments without attempting to estimate the value of anticipated future business and the value of assets and liabilities that are not considered financial instruments. In addition, the tax ramifications related to the realization of the unrealized gains and losses can have a significant effect on fair value estimates and have not been considered in many of the estimates.20—21—SEGMENT REPORTING
The Company has two primary operating segments, Banking and Wealth Management, which are delineated by the products and services that each segment offers. The segments are evaluated separately on their individual performance, as well as, their contribution to the Company as a whole.and Kansas City and a loan production office in Phoenix, Arizona. The majority of the Company’s assets and income result from the Banking segment. With the exception of the loan production office in Phoenix, all banking locations have the same product and service offerings, have similar types and classes of customers and utilize similar service delivery methods. Pricing guidelines and operating policies for products and services are the same across all regions.activities, and Millennium.activities. The Trust division provides estate planning, investment management, and retirement planning as well as consulting on management compensation, strategic planning and management succession issues. State tax credits are part of a fee initiative designed to augment the Company’s wealth management segment and banking lines of business. Millennium operates life insurance advisory and brokerageAlso included in the Wealth Management segment are the discontinued operations from thirteen offices serving life agents, banks, CPA firms, property & casualty groups, and financial advisors in 49 states.84sourcesources of revenue isare dividends from its subsidiaries and stock option exercises.Years ended December 31, Years ended December 31, 2008 2009 Wealth Corporate and Wealth Corporate and (in thousands) Banking Management Intercompany Total Banking Management Intercompany Total Net interest income (expense) $ 71,628 $ (1,043 ) $ (3,862 ) $ 66,723 $ 75,505 $ (1,095 ) $ (4,769 ) $ 69,641 Provision for loan losses 22,475 - - 22,475 40,412 - - 40,412 Noninterest income 10,027 15,049 197 25,273 14,263 5,559 55 19,877 Non interest expense 38,851 11,536 3,918 54,305 Impairment charges related to Millennium Brokerage Group - 9,200 - 9,200 Income (loss) before income tax expense 20,329 (6,730 ) (7,583 ) 6,016 Noninterest expense 42,143 6,442 4,465 53,050 Goodwill impairment 45,377 - - 45,377 Loss from continuing operations before income tax expense (38,164 ) (1,978 ) (9,179 ) (49,321 ) Income tax expense (benefit) 7,296 (2,447 ) (3,263 ) 1,586 4,997 (1,370 ) (6,277 ) (2,650 ) Net income (loss) $ 13,033 $ (4,283 ) $ (4,320 ) $ 4,430 Net loss from continuing operations (43,161 ) (608 ) (2,902 ) (46,671 ) Loss from discontinued operations before income tax - (1,995 ) - (1,995 ) Income tax benefit - (711 ) - (711 ) Net loss from discontinued operations - (1,284 ) - (1,284 ) Total net loss $ (43,161 ) $ (1,892 ) $ (2,902 ) $ (47,955 ) Loans, less unearned loan fees $ 1,977,175 $ - $ - $ 1,977,175 Portfolio loans, net $ 1,833,260 $ - $ - $ 1,833,260 Goodwill 45,378 3,134 - 48,512 953 - - 953 Intangibles, net 2,126 1,378 - 3,504 1,644 - - 1,644 Deposits 1,818,514 - (25,730 ) 1,792,784 1,960,942 - (19,526 ) 1,941,416 Borrowings 168,617 - 82,581 251,198 121,442 48,496 82,581 252,519 Total assets 2,204,341 48,775 17,058 2,270,174 2,287,936 59,225 18,494 2,365,655 2007 2008 Wealth Corporate and Restated Wealth Corporate and Restated Banking Management Intercompany Total Banking Management Intercompany Total Net interest income (expense) $ 64,840 $ 138 $ (3,926 ) $ 61,052 $ 71,628 $ (1,083 ) $ (3,862 ) $ 66,683 Provision for loan losses 4,615 - - 4,615 26,510 - - 26,510 Noninterest income 4,472 14,772 429 19,673 10,027 10,117 197 20,341 Non interest expense 35,483 10,674 3,359 49,516 Income (loss) before income tax expense 29,214 4,236 (6,856 ) 26,594 Noninterest expense 38,851 6,007 3,918 48,776 Goodwill impairment - - - - Income (loss) from continuing operations before income tax expense 16,294 3,027 (7,583 ) 11,738 Income tax expense (benefit) 10,283 1,525 (2,792 ) 9,016 5,843 1,092 (3,263 ) 3,672 Net income (loss) $ 18,931 $ 2,711 $ (4,064 ) $ 17,578 Net income (loss) from continuing operations 10,451 1,935 (4,320 ) 8,066 Loss from discontinued operations before income tax - (9,757 ) - (9,757 ) Income tax benefit - (3,539 ) - (3,539 ) Net loss from discontinued operations - (6,218 ) - (6,218 ) Total net income (loss) $ 10,451 $ (4,283 ) $ (4,320 ) $ 1,848 Loans, less unearned loan fees $ 1,641,432 $ - $ - $ 1,641,432 Portfolio loans, net $ 2,201,457 $ - $ - $ 2,201,457 Goodwill 45,379 11,798 - 57,177 45,378 3,134 - 48,512 Intangibles, net 3,330 2,723 - 6,053 2,126 1,378 - 3,504 Deposits 1,588,963 - (3,951 ) 1,585,012 1,818,514 - (25,730 ) 1,792,784 Borrowings 163,581 - 62,807 226,388 360,349 35,077 82,581 478,007 Total assets 1,952,495 42,542 4,081 1,999,118 2,427,934 48,775 17,058 2,493,767 2006 2007 Wealth Corporate and Restated Wealth Corporate and Restated Banking Management Intercompany Total Banking Management Intercompany Total Net interest income (expense) $ 53,639 $ 105 $ (2,467 ) $ 51,277 $ 64,840 $ 93 $ (3,926 ) $ 61,007 Provision for loan losses 2,127 - - 2,127 5,120 - - 5,120 Noninterest income 3,056 13,809 51 16,916 4,472 7,951 429 12,852 Non interest expense 28,563 9,207 3,624 41,394 Minority interest - (875 ) - (875 ) Income (loss) before income tax expense 26,005 3,832 ( 6,040 ) 23,797 Noninterest expense 35,483 5,853 3,359 44,695 Goodwill impairment - - - - Income (loss) from continuing operations before income tax expense 28,709 2,191 (6,856 ) 24,044 Income tax expense (benefit) 9,119 1,379 ( 2,173 ) 8,325 10,101 789 (2,792 ) 8,098 Net income (loss) $ 16,886 $ 2,453 $ (3,867 ) $ 15,472 Net income (loss) from continuing operations 18,608 1,402 (4,064 ) 15,946 Income from discontinued operations before income tax - 2,045 - 2,045 Income tax expense - 736 - 736 Net income from discontinued operations - 1,309 - 1,309 Total net income (loss) $ 18,608 $ 2,711 $ (4,064 ) $ 17,255 Loans, less unearned loan fees $ 1,311,723 $ - $ - $ 1,311,723 Portfolio loans, net $ 1,784,278 $ - $ - $ 1,784,278 Goodwill 19,690 10,293 - 29,983 45,379 11,798 - 57,177 Intangibles, net 2,153 3,636 - 5,789 3,330 2,723 - 6,053 Deposits 1,319,201 - (3,693 ) 1,315,508 1,588,963 - (3,951 ) 1,585,012 Borrowings 36,752 - 39,054 75,806 283,278 23,149 62,807 369,234 Total assets 1,517,617 16,991 979 1,535,587 2,094,706 42,542 4,081 2,141,329 8521—22—PARENT COMPANY ONLY CONDENSED FINANCIAL STATEMENTSDecember 31, (in thousands) 2008 2007 Assets Cash $ 23,840 $ 487 Investment in Enterprise Bank & Trust 249,662 162,881 Investment in Millennium Holding Company 8,861 17,754 Investment in Great American Bank - 43,570 Other assets 18,947 14,519 Total assets $ 301,310 $ 239,211 Liabilities and Shareholders' Equity Subordinated debentures $ 82,581 $ 56,807 Notes payable - 6,000 Accounts payable and other liabilities 941 3,255 Shareholders' equity 217,788 173,149 Total liabilities and shareholders' equity $ 301,310 $ 239,211 December 31, Restated (in thousands) 2009 2008 Assets Cash $ 19,474 $ 23,840 Investment in Enterprise Bank & Trust 202,361 246,445 Investment in Millennium Holding Company 6,777 8,861 Other assets 18,546 18,947 Total assets $ 247,158 $ 298,093 Liabilities and Shareholders' Equity Subordinated debentures $ 82,581 $ 82,581 Accounts payable and other liabilities 665 940 Shareholders' equity 163,912 214,572 Total liabilities and shareholders' equity $ 247,158 $ 298,093 IncomeOperationsYears ended December 31, (in thousands) 2008 2007 2006 Income: Dividends from subsidiaries $ 45,811 $ 8,440 $ 9,669 Other 3,162 559 133 Total income 48,973 8,999 9,802 Expenses: Interest expense-subordinated debentures 3,471 3,859 2,343 Interest expense-notes payable 507 197 207 Other expenses 4,918 3,359 3,623 Total expenses 8,896 7,415 6,173 Net income before taxes and equity in undistributed earnings of subsidiaries 40,077 1,584 3,629 Income tax benefit 2,338 2,792 2,173 Net income before equity in undistributed earnings of subsidiaries 42,415 4,376 5,802 Equity in undistributed earnings of subsidiaries (37,985 ) 13,202 9,670 Net income $ 4,430 $ 17,578 $ 15,472 Years ended December 31, Restated Restated (in thousands) 2009 2008 2007 Income: Dividends from subsidiaries $ 800 $ 45,811 $ 8,440 Other 203 3,162 559 Total income 1,003 48,973 8,999 Expenses: Interest expense-subordinated debentures 4,918 3,471 3,859 Interest expense-notes payable - 507 197 Other expenses 4,465 4,918 3,359 Total expenses 9,383 8,896 7,415 Net (loss) income before taxes and equity in undistributed earnings of subsidiaries (8,380 ) 40,077 1,584 Income tax benefit 6,277 2,338 2,792 Net (loss) income before equity in undistributed earnings of subsidiaries (2,103 ) 42,415 4,376 Equity in undistributed earnings of subsidiaries (45,852 ) (40,567 ) 12,879 Net (loss) income $ (47,955 ) $ 1,848 $ 17,255 86Years Ended December 31, (in thousands) 2008 2007 2006 Cash flows from operating activities: Net income $ 4,430 $ 17,578 $ 15,472 Adjustments to reconcile net income to net cash provided by operating activities: Gain on sale of charter (2,850 ) - - Share-based compensation 2,255 1,944 1,153 Net income of subsidiaries (7,826 ) (21,642 ) (19,339 ) Dividends from subsidiaries 45,811 8,440 9,669 Excess tax benefits of share-based compensation (460 ) (381 ) (525 ) Additional share-based compensation from acquisition of Clayco 1,000 - - Other, net (28 ) (2,096 ) 10 Net cash provided by operating activities 42,332 3,843 6,440 Cash flows from investing activities: Cash contributions to subsidiaries (73,988 ) - - Cash received in sale of charter, net of cash and cash equivalents paid 5,575 - - Cash paid for acquisitions, net of cash acquired - (17,085 ) (8,060 ) Purchases of available for sale debt securities (1,494 ) (784 ) (538 ) Proceeds from maturities and principal paydowns on available for sale debt securities - 124 - Purchase of limited partnership interests (5,034 ) (1,171 ) - Net cash used in investing activities (74,941 ) (18,916 ) (8,598 ) Cash flows from financing activities: Proceeds from notes payable 15,000 6,750 10,000 Paydowns of notes payable (21,000 ) (4,751 ) (10,745 ) Proceeds from issuance of subordinated debentures 25,774 18,557 4,124 Paydown of subordinated debentures - (4,124 ) - Cash dividends paid (2,661 ) (2,638 ) (1,977 ) Excess tax benefits of share-based compensation 460 381 525 Issuance of preferred stock and warrants 35,000 - - Common stock repurchased - (1,743 ) - Proceeds from the exercise of common stock options 3,389 1,304 1,189 Net cash provided by financing activities 55,962 13,736 3,116 Net increase (decrease) in cash and cash equivalents 23,353 (1,337 ) 958 Cash and cash equivalents, beginning of year 487 1,824 866 Cash and cash equivalents, end of year $ 23,840 $ 487 $ 1,824 Noncash transactions: Common stock issued for acquisitions of businesses $ - $ 22,482 $ 5,249 Years Ended December 31, Restated Restated (in thousands) 2009 2008 2007 Cash flows from operating activities: Net (loss) income $ (47,955 ) $ 1,848 $ 17,255 Adjustments to reconcile net income to net cash provided by operating activities: Gain on sale of charter - (2,850 ) - Share-based compensation 2,202 2,255 1,944 Net loss (income) of subsidiaries 45,052 (5,244 ) (21,319 ) Dividends from subsidiaries 800 45,811 8,440 Excess tax benefits of share-based compensation (26 ) (460 ) (381 ) Additional share-based compensation from acquisition of Clayco - 1,000 - Excess tax expense on additional share-based compensation from acquisition of Clayco 364 - - Other, net 587 (28 ) (2,096 ) Net cash provided by operating activities 1,024 42,332 3,843 Cash flows from investing activities: Cash contributions to subsidiaries - (73,988 ) - Cash received in sale of charter, net of cash and cash equivalents paid - 5,575 - Cash paid for acquisitions, net of cash acquired - - (17,085 ) Purchases of other investments (287 ) (1,494 ) (784 ) Proceeds from maturities and principal paydowns on other investments - - 124 Purchase of limited partnership interests (512 ) (5,034 ) (1,171 ) Net cash used in investing activities (799 ) (74,941 ) (18,916 ) Cash flows from financing activities: Proceeds from notes payable - 15,000 6,750 Paydowns of notes payable - (21,000 ) (4,751 ) Proceeds from issuance of subordinated debentures - 25,774 18,557 Paydown of subordinated debentures - - (4,124 ) Cash dividends paid (2,694 ) (2,661 ) (2,638 ) Excess tax expense on additional share-based compensation from acquisition of Clayco (364 ) - - Excess tax benefits of share-based compensation 26 460 381 Issuance of preferred stock and warrants - 35,000 - Dividends paid on preferred stock (1,585 ) - - Preferred Stock accretion of discount and issuance cost (130 ) - - Common stock repurchased - - (1,743 ) Proceeds from the exercise of common stock options 156 3,389 1,304 Net cash (used in) provided by financing activities (4,591 ) 55,962 13,736 Net (decrease) increase in cash and cash equivalents (4,366 ) 23,353 (1,337 ) Cash and cash equivalents, beginning of year 23,840 487 1,824 Cash and cash equivalents, end of year $ 19,474 $ 23,840 $ 487 Noncash transactions: Common stock issued for acquisitions of businesses $ - $ - $ 22,482 8722—23—QUARTERLY CONDENSED FINANCIAL INFORMATION (Unaudited)2009 Restated Restated 4th 3rd 2nd 1st (in thousands, except per share data) Quarter Quarter Quarter Quarter Interest income $ 28,013 $ 30,314 $ 30,341 $ 29,818 Interest expense 10,098 12,931 12,846 12,970 Net interest income 17,915 17,383 17,495 16,848 Provision for loan losses 8,400 6,480 9,073 16,459 Net interest income after provision for loan losses 9,515 10,903 8,422 389 Noninterest income 4,225 9,073 3,748 2,831 Noninterest expense 13,732 12,973 13,805 57,917 Income (loss) from continuing operations before income tax (benefit) expense 8 7,003 (1,635 ) (54,697 ) Income tax (benefit) expense (372 ) 2,245 (1,673 ) (2,850 ) Income (loss) from continuing operations 380 4,758 38 (51,847 ) (Loss) income from discontinued operations before income tax (benefit) expense (315 ) (129 ) (442 ) 478 Loss on disposal before income tax benefit (1,587 ) - - - Income tax (benefit) expense (668 ) (58 ) (103 ) 118 (Loss) income from discontinued operations (1,234 ) (71 ) (339 ) 360 Net (loss) income $ (854 ) $ 4,687 $ (301 ) $ (51,487 ) Net (loss) income available to common shareholders $ (1,462 ) $ 4,082 $ (903 ) $ (52,086 ) Basic (loss) earnings per common share: Basic from continuing operations $ (0.02 ) $ 0.33 $ (0.04 ) $ (4.09 ) Basic from discontinued operations (0.10 ) (0.01 ) (0.03 ) 0.03 Basic from continuing operations and discontinued operation $ (0.12 ) $ 0.32 $ (0.07 ) $ (4.06 ) Diluted (loss) earnings per common share: Diluted from continuing operations $ (0.02 ) $ 0.32 $ (0.04 ) $ (4.09 ) Diluted from discontinued operations (0.10 ) (0.01 ) (0.03 ) 0.03 Diluted from continuing operations and discontinued operation $ (0.12 ) $ 0.31 $ (0.07 ) $ (4.06 ) 2008 (Restated) 4th 3rd 2nd 1st (in thousands, except per share data) Quarter Quarter Quarter Quarter Interest income $ 31,486 $ 31,450 $ 31,478 $ 32,607 Interest expense 14,294 14,870 14,686 16,488 Net interest income 17,192 16,580 16,792 16,119 Provision for loan losses 16,296 3,007 4,378 2,829 Net interest income after provision for loan losses 896 13,573 12,414 13,290 Noninterest income 6,083 6,444 3,370 4,444 Noninterest expense 13,270 11,803 11,397 12,306 (Loss) income from continuing operations before income tax (benefit) expense (6,291 ) 8,214 4,387 5,428 Income tax (benefit) expense (2,853 ) 3,113 1,487 1,925 (Loss) income from continuing operations (3,438 ) 5,101 2,900 3,503 (Loss) income from discontinued operations before income tax (benefit) expense (2,972 ) (6,130 ) (240 ) (415 ) Income tax (benefit) expense (1,069 ) (2,231 ) (88 ) (151 ) (Loss) income from discontinued operations (1,903 ) (3,899 ) (152 ) (264 ) Net (loss) income $ (5,341 ) $ 1,202 $ 2,748 $ 3,239 Net (loss) income available to common shareholders $ (5,420 ) $ 1,202 $ 2,748 $ 3,239 Basic (loss) earnings per common share: Basic from continuing operations $ (0.28 ) $ 0.40 $ 0.23 $ 0.28 Basic from discontinued operations (0.15 ) (0.31 ) (0.01 ) (0.02 ) Basic from continuing operations and discontinued operation $ (0.43 ) $ 0.09 $ 0.22 $ 0.26 Diluted (loss) earnings per common share: Diluted from continuing operations $ (0.28 ) $ 0.40 $ 0.23 $ 0.28 Diluted from discontinued operations (0.15 ) (0.31 ) (0.01 ) (0.02 ) Diluted from continuing operations and discontinued operation $ (0.43 ) $ 0.09 $ 0.22 $ 0.26 2007.2008 4th 3rd 2nd 1st (in thousands, except per share data) Quarter Quarter Quarter Quarter Interest income $ 29,163 $ 29,289 $ 29,283 $ 30,246 Interest expense 11,963 12,705 12,481 14,109 Net interest income 17,200 16,584 16,802 16,137 Provision for loan losses 14,125 2,825 3,200 2,325 Net interest income after provision for loan losses 3,075 13,759 13,602 13,812 Noninterest income 7,650 7,641 4,444 5,538 Noninterest expense 17,817 19,133 12,723 13,832 Income before income tax expense (7,092 ) 2,267 5,323 5,518 Income tax expense (3,140 ) 948 1,823 1,955 Net income $ (3,952 ) $ 1,319 $ 3,500 $ 3,563 Earnings per common share: Basic $ (0.32 ) $ 0.10 $ 0.28 $ 0.29 Diluted (0.32 ) 0.10 0.27 0.28 2007 4th 3rd 2nd 1st (in thousands, except per share data) Quarter Quarter Quarter Quarter Interest income $ 31,916 $ 31,807 $ 30,946 $ 27,848 Interest expense 15,713 16,002 15,821 13,929 Net interest income 16,203 15,805 15,125 13,919 Provision for loan losses 2,450 600 715 850 Net interest income after provision for loan losses 13,753 15,205 14,410 13,069 Noninterest income 6,230 4,638 4,906 3,899 Noninterest expense 13,083 12,202 12,370 11,861 Minority interest in net income of consolidated subsidiary - - 157 (157 ) Income before income tax expense 6,900 7,641 7,103 4,950 Income tax expense 1,994 2,642 2,588 1,792 Net income $ 4,906 $ 4,999 $ 4,515 $ 3,158 Earnings per common share Basic $ 0.40 $ 0.40 $ 0.37 $ 0.27 Diluted 0.39 0.40 0.36 0.26 882009 As reported As reported 2nd 1st (in thousands, except per share data) Quarter Quarter Interest income $ 27,755 $ 27,323 Interest expense 10,260 10,475 17,495 16,848 Provision for loan losses 8,000 15,100 9,495 1,748 Noninterest income 3,747 2,832 Noninterest expense 13,804 57,918 (562 ) (53,338 ) (1,287 ) (2,361 ) 725 (50,977 ) (442 ) 478 - - (103 ) 118 (339 ) 360 $ 386 $ (50,617 ) $ (216 ) $ (51,216 ) Basic (loss) earnings per common share: $ 0.01 $ (4.02 ) (0.03 ) 0.03 $ (0.02 ) $ (3.99 ) Diluted (loss) earnings per common share: $ 0.01 $ (4.02 ) (0.03 ) 0.03 $ (0.02 ) $ (3.99 ) 2008 (As reported) 4th 3rd 2nd 1st (in thousands, except per share data) Quarter Quarter Quarter Quarter Interest income $ 29,159 $ 29,283 $ 29,271 $ 30,227 Interest expense 11,963 12,705 12,481 14,109 17,196 16,578 16,790 16,118 Provision for loan losses 14,125 2,825 3,200 2,325 3,071 13,753 13,590 13,793 Noninterest income 6,079 6,446 3,370 4,446 Noninterest expense 13,270 11,802 11,398 12,306 (4,120 ) 8,397 5,562 5,933 (2,071 ) 3,179 1,910 2,106 (2,049 ) 5,218 3,652 3,827 (2,972 ) (6,130 ) (240 ) (415 ) (1,069 ) (2,231 ) (88 ) (151 ) (1,903 ) (3,899 ) (152 ) (264 ) $ (3,952 ) $ 1,319 $ 3,500 $ 3,563 $ (4,031 ) $ 1,319 $ 3,500 $ 3,563 Basic (loss) earnings per common share: $ (0.17 ) $ 0.41 $ 0.29 $ 0.31 (0.15 ) (0.31 ) (0.01 ) (0.02 ) $ (0.32 ) $ 0.10 $ 0.28 $ 0.29 Diluted (loss) earnings per common share: $ (0.17 ) $ 0.41 $ 0.28 $ 0.30 (0.15 ) (0.31 ) (0.01 ) (0.02 ) $ (0.32 ) $ 0.10 $ 0.27 $ 0.28
FINANCIAL DISCLOSURE2008,2009, under the supervision and with the participation of the Company’s Chief Executive Officer (“CEO”) and the Chief Financial Officer (“CFO”), management has evaluated the effectiveness of the design and operation of the Company’s disclosure controls and procedures pursuant to Exchange Act Rule 13a-15. Based on that evaluation, the CEO and CFO concluded that the Company’s disclosure controls and procedures were effective as of December 31, 2008,2009, to ensure that information required to be disclosed in the Company’s periodic SEC filings is processed, recorded, summarized and reported when required. There were no significant changes
The Company’s management is responsible for establishing and maintaining adequate internal control over financial reporting. The Company’s internal control over financial reporting is a process designed under the supervision of the Company’s CEO and CFO to provide reasonable assurance regarding reliability of financial reporting and preparation of the Company’s financial statements for external reporting purposes in accordance with U.S. GAAP.controls or in the other factors that could significantly affect those controls subsequent to the date of the evaluation.Management’s Report on Internal Control over Financial ReportingManagement’s Report on Internal Controlscontrol over financial reporting andas of December 31, 2009, based on the audit reportcriteria set forth by the Committee of Sponsoring Organization of the Treadway Commission (COSO) in “Internal Control-Integrated Framework.” Based on the assessment, management determined that, as of December 31, 2009, the Company’s internal control over financial reporting was effective based on these criteria.
There were no changes in the Company’s internal controls over financial reporting that have materially affected or are includedreasonably likely to materially affect the Company’s internal controls over financial reporting, except as discussed below with respect to remediation of a material weakness that was identified during 2009.
In connection with the identification of the loan participation accounting error described in Item 7, Management Discussion & Analysis and in Item 8, and are incorporatedNote 2 of the consolidated financial statements elsewhere in this Item 9AForm 10K, the Company also determined that a material weakness in its internal controls over financial reporting existed during the periods affected by reference.
Enterprise Financial Services Corp:
March 12, 201030, 2009.29, 2010. The Company’s executive officers consist of the named executive officers disclosed in the Compensation Discussion and Analysis Section of the Proxy Statement.30, 2009.
RELATED STOCKHOLDER MATTERS30, 2009.
INDEPENDENCE30, 2009.30, 2009.89
No.3.1 Certificate of Incorporation of Registrant, (incorporated herein by reference to Exhibit 3.1 of Registrant’s Registration Statement on Form S-1 filed on December 19, 1996 (File No. 333-14737)). 3.2 Amendment to the Certificates of Incorporation of Registrant (incorporated herein by reference to Exhibit 4.2 to Registrant’s Registration Statement on Form S-8 filed on July 1, 1999 (File No. 333-82087)). 3.3 Amendment to the Certificate of Incorporation of Registrant (incorporated herein by reference to Exhibit 3.1 to Registrant’s Quarterly Report on Form 10-Q for the period ending September 30, 1999). 3.4 Amendment to the Certificate of Incorporation of Registrant (incorporated herein by reference to Exhibit 99.2 to Registrant’s Current Report on Form 8-K filed on April 30, 2002). 3.5 Amendment to the Certificate of Incorporation of Registrant (incorporated herein by reference to Appendix A to Registrant’s Proxy Statement on Form 14-A filed on November 20, 2008). 3.6 Certificate of Designations of Registrant for Fixed Rate Cumulative Perpetual Preferred Stock, Series A, dated December 17, 2008 (incorporated herein by reference to Exhibit 3.1 to Registrant’s Current Report on Form 8-K filed on December 23, 2008). 3.7 Bylaws of Registrant, as amended, (incorporated herein by reference to Exhibit 3.1 to Registrant’s Current Report on Form 8-K filed on October 2, 2007). 10.110.1*Key Executive Employment Agreement dated effective as of July 1, 2008 by and between Registrant and Stephen P. Marsh (incorporated herein by reference to Exhibit 99.1 to Registrant’s Current Report on Form 8-K filed on November 25, 2008), and amended by that First Amendment of Executive Employment Agreement dated as of December 19, 2008 (incorporated herein by reference to Exhibit 99.6 to Registrant’s Current Report on Form 8-K filed on December 23, 2008). 10.210.2*Key Executive Employment Agreement dated effective as of December 1, 2004 by and between Registrant and Frank H. Sanfilippo (incorporated herein by reference to Exhibit 10.1 to Registrant’s Current Report on Form 8-K filed on December 1, 2004), and amended by that First Amendment of Executive Employment Agreement dated as of December 19, 2008 (incorporated herein by reference to Exhibit 99.5 to Registrant’s Current Report on Form 8-K filed on December 23, 2008). 10.310.3*Key Executive Employment Agreement dated effective as of September 24, 2008, by and between Registrant and Peter F. Benoist (incorporated herein by reference to Exhibit 10.1 to Registrant’s Current Report on Form 8-K filed on September 30, 2008), and amended by that First Amendment ofExecutive Employment Agreement dated as of December 19, 2008 (incorporated herein by reference to Exhibit 99.3 to Registrant’s Current Report on Form 8-K filed on December 23, 2008). 9010.410.4*Key Executive Employment Agreement dated effective as of November 1, 2004, by and between Registrant and Linda M. Hanson (incorporated herein by reference to Exhibit 10.14 to Registrant’s Report on Form 10-K for the year ended December 31, 2007), and amended by that First Amendment of Executive Employment Agreement dated as of December 19, 2008 (incorporated herein by reference to Exhibit 99.4 to Registrant’s Current Report on Form 8-K filed on December 23, 2008). 10.510.5*Key Executive Employment Agreement dated effective as of October 5, 2007, by and among Registrant, Enterprise Bank & Trust, and John G. Barry (filed herewith), and amended by that First Amendment of Executive Employment Agreement dated as of December 19, 2008 (incorporated herein by reference to Exhibit 99.7 to Registrant’s Current Report on Form 8-K filed on December 23, 2008). 10.6 Waiver executed by each of Peter F. Benoist, Frank H. Sanfilippo, Linda M. Hanson, Stephen P. Marsh and John G. Barry (incorporated herein by reference to Exhibit 99.2 to Registrant’s Current Report on Form 8-K filed on December 23, 2008). 10.710.7*Consulting Agreement dated May 1, 2008, by and between Registrant and Kevin C. Eichner (incorporated herein by reference to Exhibit 10.1 to Registrant’s Current Report on Form 8-K filed on March 3, 2008).10.8Enterprise Financial Services Corp Deferred Compensation Plan I (incorporated herein by reference to Exhibit 10.1 of Registrant’s Quarterly Report on Form 10-Q for the period ended March 31, 2000). 10.9(1)10.8*2008.2008 (incorporated by reference to Exhibit 10.9 to Registrant’s Report on Form 10-K for the year ended December 31, 2008). 10.1010.9*Enterprise Financial Services Corp, Third Incentive Stock Option Plan (incorporated herein by reference to Exhibit 4.5 to Registrant’s Registration Statement on Form S-8 filed on December 29, 1997 (File No. 333-43365)). 10.1110.10*Enterprise Financial Services Corp, Fourth Incentive Stock Option Plan (incorporated herein by reference to Registrant’s 1998 Proxy Statement on Form 14-A). 10.1210.11*Enterprise Financial Services Corp, Stock Plan for Non-Management Directors (incorporated herein by reference to Registrant’s Proxy Statement on Form 14-A filed on March 7, 2006). 10.1310.12*Enterprise Financial Services Corp, 2002 Stock Incentive Plan, as amended (incorporated herein by reference to Registrant’s Proxy Statement on Form 14-A, filed on March 17, 2008). 10.1410.13*Enterprise Financial Services Corp, Annual Incentive Plan (incorporated herein by reference to Registrant’s Proxy Statement on Form 14-A, filed on March 7, 2006). 10.1510.14*Enterprise Financial Services Corp, Incentive Stock Purchase Plan (incorporated herein by reference to Exhibit 4.6 to Registrant’s Registration Statement on Form S-8 filed on November 1, 2002 (File No. 333-100928)). 10.1610.15.1 10.16.1(1)10.15.2$20,000,000 Amended and Restated Credit Agreement, as modified by the Fourth, Fifth and Sixth Modification Agreements dated April 30, 2008, June 30, 2008, and December 11, 2008, by and between Registrant and U.S. Bank National Association.Association (incorporated herein by reference to Exhibit 10.16.1 to Registrant’s Report on Form 10-K for the year ended December 31, 2008).9110.1710.16Stock Purchase Agreement dated February 5, 2008 between Registrant and First Financial Bancshares, Inc. (incorporated herein by reference to Exhibit 2.1 to Registrant’s Current Report on Form 8-K filed on February 6, 2008). 10.18Membership Interest Purchase Agreement (Second Installment Closing) by and among Registrant, Millennium Holding Company, Inc., and Millennium Brokerage Group, LLC, et al. dated December 31, 2007 (incorporated herein by reference to Exhibit 2.1 to Registrant’s Current Report on Form 8-K filed on January 7, 2008).10.1910.17Condominium Sale Contract, dated October 3, 2007, by and between Enterprise Bank & Trust and Maryland Walk LLC (incorporated herein by reference to Exhibit 10.1 to Registrant’s Current Report on Form 8-K dated October 9, 2007). 10.2010.18Indenture dated December 12, 2008, by and between Registrant and Wilmington Trust Company (incorporated herein by reference to Exhibit 4.1 to Registrant’s Current Report on Form 8-K filed on December 15, 2008). 10.2110.19Amended and Restated Declaration of Trust dated December 12, 2008, by and among Registrant, Wilmington Trust Company, and each of the Administrators named therein (incorporated herein by reference to Exhibit 4.2 to Registrant’s Current Report on Form 8-K filed on December 15, 2008). 10.2210.20Guarantee dated December 12, 2008, by and between Registrant and Wilmington Trust Company (incorporated herein by reference to Exhibit 4.3 to Registrant’s Current Report on Form 8-K filed on December 15, 2008). 10.23(1)10.21First Amendment to Amended and Restated Declaration of Trust No. 2 dated January 9, 2009 by and among Registrant, Wilmington Trust Company and each of the Administrators named therein.therein (incorporated herein by reference to Exhibit 10.23 to Registrant’s Report on Form 10-K for the year ended December 31, 2008). 10.2410.22Warrant to Purchase Shares of Common Stock dated December 19, 2008, by Registrant in favor of the United States Department of the Treasury (incorporated herein by reference to Exhibit 4.1 to Registrant’s Current Report on Form 8-K filed on December 23, 2008). 10.2510.23Letter Agreement dated December 19, 2008, including Securities Purchase Agreement – Standard Terms incorporated by reference therein, by and between Registrant and the United States Department of the Treasury (incorporated herein by reference to Exhibit 99.1 to Registrant’s Current Report on Form 8-K filed on December 23, 2008). 14.1Code of Ethics for the Principal Executive Officer and Senior Financial Officers (incorporated herein by reference to Exhibit 14.1 to Registrant’s Report on Form 10-K for the year ended December 31, 2003).21.1 (1)Subsidiaries of Registrant. 23.1 (1)Consent of KPMG LLP. 24.1 (1)Power of AttorneyAttorney. 31.1 (1)Chief Executive Officer’s Certification required by Rule 13(a)-14(a). 31.2 (1)Chief Financial Officer’s Certification required by Rule 13(a)-14(a). 32.1 (1)Chief Executive Officer Certification pursuant to 18 U.S.C. § 1350, as adopted pursuant to section § 906 of the Sarbanes-Oxley Act of 20022002. 32.2 (1)Chief Financial Officer Certification pursuant to 18 U.S.C. § 1350, as adopted pursuant to section § 906 of the Sarbanes-Oxley Act of 20022002.99.1 Certification of Chief Executive Officer pursuant to Section III(b)(4) of the Emergency Economic Stabilization Act of 2008. 99.2 Certification of Chief Financial Officer pursuant to Section III(b)(4) of the Emergency Economic Stabilization Act of 2008. (1) Filed herewith Commission,SEC, upon its request, the instruments defininga copy of any instrument that defines the rights of holders of each issue of long-term debt of Registrant and its consolidated subsidiaries.922009./s/ Peter F. Benoist /s/ Frank H. Sanfilippo Peter F. Benoist Frank H. Sanfilippo Chief Executive Officer Chief Financial Officer 2009.2010.Signatures Title /s/ Peter F. Benoist* Peter F. Benoist President and Chief Executive Officer and Director /s/ James J. Murphy, Jr.* James J. Murphy, Jr. Chairman of the Board of Directors /s/ Kevin C. Eichner* Kevin C. Eichner Vice Chairman and Director /s/ Michael A. DeCola* Michael A. DeCola Director /s/ William H. Downey* William H. Downey Director /s/ Robert E. Guest, Jr.* Robert E. Guest, Jr. Director /s/ Lewis A. Levey* Lewis A. Levey Director /s/ Birch M. Mullins* Birch M. Mullins Director /s/ Brenda D. Newberry* Brenda D. Newberry Director /s/ Robert E. Saur* Robert E. Saur Director /s/ Sandra A. Van Trease* Sandra A. Van Trease Director /s/ Henry D. Warshaw* Henry D. Warshaw Director *Signed by Power of Attorney. 93