| x | ANNUAL REPORT PURSUANT TO SECTION 13 OR 15(d) OF THE SECURITIES EXCHANGE ACT OF 1934 | |
| FOR THE FISCAL YEAR ENDED DECEMBER 31, | ||
| OR | ||
| o | TRANSITION REPORT PURSUANT TO SECTION 13 OR 15(d) OF THE SECURITIES EXCHANGE ACT OF 1934 | |
| FOR THE TRANSITION PERIOD FROM_____TO_____ | ||
| New York | 0-6890 | 14-1462255 | ||
| (State or Other Jurisdiction | (Commission File Number) | (IRS Employer | ||
| of Incorporation) | Identification No.) |
| Securities Registered Pursuant to Section 12(b) of the Act: | |
| Title of each class | Name of each exchange on which registered |
| None | None |
| Large Accelerated Filero | Accelerated Filero | Non-Accelerated Filero | Smaller reporting companyx |
INDEX TO FORM 10-K
| PART I | |||
| Page | |||
| Item 1. | Business | 3 | |
| Item 1A. | Risk Factors | 12 | |
| Item 1B. | Unresolved Staff Comments | 18 | |
| Item 2. | Properties | 18 | |
| Item 3. | Legal Proceedings | 18 | |
| Item 4. | Mine Safety Disclosure | 18 | |
| PART II | |||
| Item 5. | Market for Registrant’s Common Equity, Related Stockholder Matters and Issuer Purchases of Equity Securities | 19 | |
| Item 6. | Selected Financial Data | 20 | |
| Item 7. | Management’s Discussion and Analysis of Financial Condition and Results of Operations | 21 | |
| Item 7A. | Quantitative and Qualitative Disclosures About Market Risk | 30 | |
| Item 8. | Financial Statements and Supplementary Data | 30 | |
| Item 9. | Changes in and Disagreements with Accountants on Accounting and Financial Disclosure | 31 | |
| Item 9A. | Controls and Procedures | 31 | |
| Item 9B. | Other Information | 32 | |
| PART III | |||
| Item 10. | Directors, Executive Officers and Corporate Governance | 32 | |
| Item 11. | Executive Compensation | 32 | |
| Item 12. | Security Ownership of Certain Beneficial Owners and Management and Related Stockholder Matters | 32 | |
| Item 13. | Certain Relationships and Related Transactions, and Director Independence | 33 | |
| Item 14. | Principal Accounting Fees and Services | 33 | |
| PART IV | |||
| Item 15. | Exhibits, Financial Statement Schedules | 34 | |
PART I
Item 1: Business
Unless the context requires otherwise in this Annual Report on Form 10-K, the terms “we”, “us” and “our” refer to Mechanical Technology, Incorporated, “MTI Instruments” refers to MTI Instruments, Inc., and “MTI Micro” refers to MTI MicroFuel Cells, Inc., and “MTI Instruments” refers to MTI Instruments, Inc. We have a registered trademark in the United States for “Mobion”. Other trademarks, trade names, and service marks used in this Annual Report on Form 10-K are the property of their respective owners.
Mechanical Technology, Incorporated, (“MTI”(MTI or the “Company”)Company), a New York corporation, was incorporated in 1961. MTI operates in two segments, the New Energy segment which is conducted through MTI MicroFuel Cells Inc. (“MTI Micro”), a majority-owned subsidiary, andsegments: the Test and Measurement Instrumentation segment, which is conducted through MTI Instruments, Inc. (“MTI Instruments”)(MTI Instruments), a wholly-owned subsidiary.
MTI Instruments was incorporated in New York on March 8, 2000. MTI Instruments2000 and is a worldwide supplier of precision non-contact physical measurement solutions, condition based monitoring systems, portable balance equipment and wafer inspection tools. MTI Instrument’s products use a comprehensive array of technologies to solve complex, real world applications in numerous industries including manufacturing, semiconductor, solar, commercial and military aviation, automotive and data storage. OurMTI Instruments’ products consist of electronic gauging instruments for position, displacement and vibration application within the design, manufacturing/production, test and research market; wafer characterization of semi-insulating and semi-conducting wafers within both the semiconductor and solar industries; tensile stage systems for materials testing at academic and industrial settings; and engine vibration analysis systems for both military and commercial aircraft.
MTI Micro iswas incorporated in Delaware on March 26, 2001, and has been developing and commercializing off-the-grid power solutions for various portable electronic devices. Our patented proprietary direct methanol fuel cell technology platform called Mobion converts 100% methanol fuel®, a handheld energy-generating device to usable electricity capable of providing continuous power as long as necessary fuel flows are maintained. Our proprietary fuel cell power solution consists of two primary components integrated into an easily manufactured device: the direct methanol fuel cell power engine, which we refer to as our Mobion Chip, and methanol fuel cartridges. Our current Mobion Chip weighs less than one ounce and is small enough to fit in the palm of one’s hand. The methanol used by the technology is fully biodegradable. We have demonstrated power density of over 84 mW/cm2, while producing more than 1,800 Wh/kg or 1.4 Wh/cc of fuel from its direct methanol fuel feed. For these reasons, we believe our technology offers a superior power solution compared toreplace current lithium-ion and similar rechargeable battery systems currently used by original equipment manufacturers and branded partners, or OEMs, in many handheld electronic devices such as smart phones, mobile phone accessories, digital cameras, portable gaming devices, e-readers and other portable devices. We believe our platform will facilitate further developments of numerous electronic product advantages, including smaller size, environmental friendliness, greatly extended run-time of current portable devices, and simplicity of design, all critical for commercialization in the consumer market. We also believe our platform can be implemented as three different product options: a handheld power generator for consumer electronic devices, a snap-on or attached power accessory, or an embedded fuel cell on handheld devices. We have strategic agreements with a global Japanese consumer electronics company, with a U.S. based developer and marketer of universal chargers, with a global power tool manufacturer and a letter of intent with Duracell, part of the Procter & Gamble Company. Our goal is to become the leading provider of portable power for various types of electronic devices and, assuming available financing, we intend to commercialize Mobion products in 2010.


Sample Mobion attached power source camera-grip prototype


 |  |
 |
MTI Instruments is a worldwide supplier of metrology, portable balancing equipment and inspection systems for semiconductor wafers.systems. Our products use state-of-the-art technology to solve complex real world applications in numerous industries including automotive, semiconductor, solar cell manufacturing, material testing, commercial and military aviation and data storage. We are continuously working on ways to expand our sales reach, including expanded sales coverage inthroughout Europe and the Far East,Asia, as well as a focus on internet marketing. We have industry recognized customer service and have worked with hundreds of companies worldwide.
Products
Our test and measurement segment has three product groups: general dimensional gauging, semiconductor/solarPrecision Instruments, Semiconductor and aviation.Solar Metrology Systems and Aviation Balancing Systems. Our products consist of electronic, computerized gauging instruments for position, displacement and vibration applications for the design, manufacturingmanufacturing/production and test and research markets; metrology tools for wafer characterization of semiconductor and solar wafers; tensile stage systems for materials testing in research and industrial settings; and engine balancing and vibration analysis systems for both military and commercial aircraft.
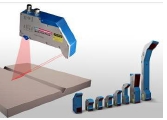
General Dimensional Gauging:Precision Instruments: The Precision Instruments employgroup employs capacitance, laser and fiber optic laser and capacitance technologies to make nano-accurate measurements in product designmeasurements. These advanced sensing and quality related processes. Gaugingphysical measurement technologies are used to produce products include laser, fiber-opticthat range from basic sensors to complete, fully integrated measurement systems, and capacitanceare available as single sensors for integration into existing data acquisition systems or as complete system level solutions that measurecan be further integrated into a variety of parameters including displacement, position, vibration and dimension.facility wide communication backbone.
Listed below are selected MTI Instruments’ Precision Instruments product offerings:
Accumeasure Family:
The Accumeasure family of products is designed to address the needs of product developers, process engineers, researchers, designers, and others who need precise, reliable, non-contact measurements.
MTI Instruments has a large installed base of Accumeasure products around the world, and offers off-the-shelf as well as custom capacitance amplifiers designed per customer specifications. Additionally, MTI Instruments has developed state-of-the-art unique designs to more accurately measure targets that cannot easily be grounded called “push-pull”. The market appeal for the Accumeasure family of products is based in part on the strategically offered single/dual channel systems for simple general displacement and position applications, as well as multiple-channel systems for more complex applications, including process control monitoring, differential measurements and profiling. The Accumeasureproducts have fast response time and extremely low noise levels making them ideal for critical measurements of targets such as rotating spindles, disks, tires, precision X-Y stages and piezoelectric elements. |
|
Microtrak Family:
MTI Instrument's Microtrak family of laser triangulation sensors offers high speed, high resolution displacement, position and vibration measurements. The Microtrak features state-of-the-art complementary metal oxide semiconductors with charged coupled device (CMOS – CCD) laser triangulation technology, which is ideal for solving tough in-process, production and quality control sensing applications. The large variety of laser triangulation sensors provides operating distances to 300mm, measurement ranges to 200mm and measurement resolution to less than 1 micron. Our Laser triangulation sensors contain a solid-state laser light source and a CMOS detector.
Microtrak II Series:
The Microtrak II comes standard with an interface controller that provides a convenient digital display of the target position, alarm set points and connections for analog and RS-485 outputs.
To complement the laser product offerings, MTI Instruments also offers the performance of the standard Microtrak II Laser Triangulation System in a versatile high speed stand-alone configuration for measuring displacement, position, vibration and thickness. Unaffected by surface texture, color or stray light, the Microtrak II is ideal for solving tough production measurement applications throughout a variety of industries. The Microtrak II Stand-Alone Laser Head also uses CMOS - CCD detection technology for accurate and reliable measurements making it ideal for high volume original equipment manufactures (OEMs), production and quality control applications. Configuration of system parameters such as measurement units, frequency response and limits are easily accomplished through a laptop or desktop using the included MTI Instrument’s proprietary remote control software program. | ||
|
|
Microtrak Pro-2D:
In the summer of 2011, MTII launched its new Microtrak PRO-2D laser triangulation scanners, which provide high speed profile, displacement and dimensional information in real time.
| As technological advances are made in manufacturing, process and quality control, customers encounter more and more critical measurement applications that can only be solved with non-contact 2D and 3D technology; we believe our Microtrak PRO-2D fulfills many of these application requirements. Unlike some competitor’s products, the Microtrak PRO-2D is unaffected by surface texture, color or stray light, and is ideal for solving tough production and quality control applications throughout a wide variety of industries. For example, the Microtrak PRO-2D can be used in manufacturing applications like welding and glue dispersion, as well as demanding roboticand motion control applications. Laser head electronics have been specially designed to protect against high shock and vibration. Additionally, by using multiple heads, customers have the ability to expand the system measurement capabilities and perform 3-D analysis. The Microtrak PRO-2D uses the triangulation principle to obtain a two dimensional height profile of target surfaces. |
MTI-2100 Fotonic Sensor Series:
The MTI-2100 features advanced fiber-optic and electronic technologies for precise measurements of displacement, position andvibration. It achieves such precision | ||||
| by measuring changes in light intensity reflected from a target. Light is emitted from a tungsten halogen lamp through a fiber optic probe which also receives light from the target reflection. The MTI-2100’s modular design has the flexibility to be tailored to specific requirements through the use of a wide range of interchangeable and custom fiber-optic probes. These probes are immune to electromagnetic interference and operate on almost any type of surface: metallic, composite, plastic, glass, ceramic or liquid. | ||||
|
MTI Tensile Stages:
MTI Instruments’ miniature tensile, compression and bend testing machines are specifically designed for use in scanning electron microscopes, atomic force microscopes, and light microscopes. These are used by industrial and research institutions to investigate how different materials perform under certain conditions. Material specimens are placed within the jaws of the tensile stage and compressive or expansive load forces are applied. Additional stimuli such as heating or cooling can be directed at the sample during the test in order to gather data under various conditions. |
|
Semiconductor and Solar:Solar Metrology Systems: Our family of wafer metrology systems range from manually operated units to fully automatedincludes manual and semi-automated systems which test key wafer characteristics critical to producing high quality chipsintegrated circuits. Primarily used in the semiconductor industry. These units are used as quality control tools deliveringapplications, these systems provide highly precise measurements forof thickness variations,variation, bow, warp, resistivity, and flatness. These systems can be used on substrates varying widely in size and materials. In addition usingto MTI Instrument’s push/pull capacitance probe technology, we have expanded our line of products to include product offerings tofor the solar industry, forincluding the measurement of solar wafer thickness.
The semiconductorSemiconductor and solar metrology systemsSolar Metrology Systems include the following products:
Proforma 200SA/300SA:
| Microchips drive the sophisticated electronic devices we use today. These tiny chips are created from larger wafers, which must meet high quality standards. Our Proforma series of products quickly analyze wafer quality to help improve process line efficiency. The Proforma 200SA/300SA is a semi-automated thickness measurement system capable of handling state-of-the-art 200 mm and 300mm wafers using defined and ASTM/SEMI standard patterns. Summary information is provided in standard export formats along with 3-dimensional images of the wafers for advanced analysis. This series of products is built around MTI Instrument’s exclusive push-pull measurement technology which we believe produces more accurate results than other methods. Our thickness measurements on silicon wafers can be faster than many other technologies, and are a good fit for front-end semiconductor processes. Additionally,the Proforma 300SA comes with an easy to use and set-up Windows® user interface. |
Proforma 300:
The Proforma 300 is an easy-to-use, manual tool that accepts any wafer size and can measure a number of different materials without recalibrating or electrically grounding the wafers.
Portable and easy to set up, the Proforma 300 provides the user precise non-contact measurements at critical points throughout the wafer |
|
PV-1000:
The PV-1000 series brings our 40+ years of precision measurement experience to a line of products specifically designed for the photovoltaic/solar industry.
| ||||
The PV-1000 is incorporated into solar cell production lines to help manufacturers quickly determine quality control issues. The PV-1000 is used for both process development and production environments, the PV-1000 solar wafer measurement | ||||
 |
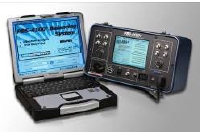
Aviation: Aviation Balancing Systems:The computer-based PBSportable balancing systems (PBS) products automatically collect and record aircraft engine vibration data, identify vibration or balance trouble in an engine, and calculate a solution to the problem. These units are used and recommended by major aircraft engine manufacturers and are also used extensively by the U.S. Air Force, other military and commercial airlines, and gas turbine manufacturers.
Our aviation and industrial vibration measurementbalancing systems products include vibration analysis and engine trim balance instruments and accessories for commercial and military jets. These products are designed to quickly pinpoint engine problems and eliminate unnecessary engine removals. Selected products in this area include:
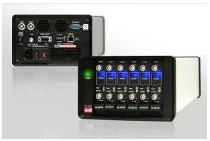
PBS-4100+ /4100R+ Portable Balancing System:
 | The The PBS-4100R+ rack mounted system |
|
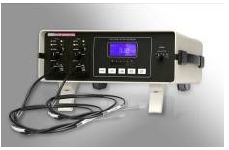
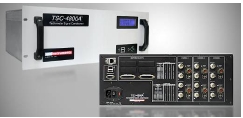
TSC-4800A Tachometer Signal Conditioner:
Targeted for operators of Engine Test cells, where accurate and reliable conditioning of speed signals is essential, MTI Instruments has designed the TSC-4800A Tachometer Signal Conditioner to detect and condition signals for monitoring, measuring, and indicating engine speeds.
| During the testing of advanced aircraft engines, speed signals are monitored and recorded by a large number of different instruments. The TSC-4800A features multiple output circuits that provide more than 10 different signals types for the monitoring devices. The TSC-4800A Tachometer Conditioner leverages design technologies developed for the PBS-4100R+ systems and |
1510A Calibrator:
The PBS family of products includes a 1510A calibrator – a product that automatically performs a complete calibration check of the PBS unit which otherwise would take hours. The 1510A calibrator emits, National Institute of Standards and Technology (NIST) traceable, output voltage signals, including voltage levels, frequency, waveshape and phase that allow for easy calibration of the PBS-4100+. If the PBS unit is out of tolerance, the calibration function automatically performs a second set of tests to determine calibration factors, which are automatically stored in the instrument. Due to its versatile functionality, the 1510A calibrator was introduced into the general gauging market in 2011. | |||||
| |||||
Marketing and Sales
We market our products and services using channels of distribution specific to each of our product groups and customer base. The general dimensional gauging productprecision instruments group markets it products through a combination of manufacturer representatives in the United States and distributors overseas. The semiconductor productand solar metrology systems group markets its products directly to end customers in the United States and internationally through distributors, while the aviation balancing systems group primarily sells direct to the end user.
To supplement these efforts, the company utilizes both commercial and industrial search engines, targeted newsletters and appropriate trade shows to identify and expand its customer base.
Comparisons of sales by class of products which account for over 10 percent of MTII’sMTI Instrument’s sales are shown below for the years ended December 31:
| 2009 | 2008 | 2007 | ||||||||||||||||||
| (Dollars in thousands) | Sales | % | Sales | % | Sales | % | ||||||||||||||
| Aviation | $ | 2,768 | 44.19 | % | $ | 1,977 | 31.76 | % | $ | 3,664 | 40.58 | % | ||||||||
| General Gauging | 2,619 | 41.81 | 2,983 | 47.93 | 4,490 | 49.73 | ||||||||||||||
| Semiconductor and Solar | 876 | 14.00 | 1,264 | 20.31 | 874 | 9.69 | ||||||||||||||
| Total | $ | 6,263 | 100.00 | % | $ | 6,224 | 100.00 | % | $ | 9,028 | 100.00 | % | ||||||||
| 2011 | 2010 | 2009 | ||||||||||||||||
| (Dollars in thousands) | Sales | % | Sales | % | Sales | % | ||||||||||||
| Aviation Balancing Systems | $ | 5,359 | 52.1 | % | $ | 3,007 | 41.9 | % | $ | 2,768 | 44.2 | % | ||||||
| Precision Instruments | 3,983 | 38.8 | 2,804 | 39.1 | 2,619 | 41.8 | ||||||||||||
| Semiconductor and Solar Metrology | 938 | 9.1 | 1,368 | 19.0 | 876 | 14.0 | ||||||||||||
| Total | $ | 10,280 | 100.0 | % | $ | 7,179 | 100.0 | % | $ | 6,263 | 100.0 | % | ||||||
Product Development and Manufacturing
MTI Instruments conducts research and develops technology to support its existing products and develop new products.ones. Management believes that theMTI Instruments’ success of the enterprise depends to a large extent upon innovation, technological expertise and new product development.
Our most recent product offerings include:
We seek to achieve a competitive position by continuously advancing our technology, rather than relying on patent protection. MTI Instruments has one patent supporting its semiconductor line.
MTI Instruments assembles and tests its products at its facilitiesfacility located in Albany, New York. Management believes that most of the raw materials used in our products are readily available from a variety of vendors.
Intellectual Property and Proprietary Rights
We rely on trade secret laws and patents to establish and protect the proprietary rights of our products. In addition, we enter into standard confidentiality agreements with our employees and consultants and seek to control access to and distribution of our proprietary information. Even with these precautions, it may be possible for a third party to copy or otherwise obtain and use our products or technology without authorization or to develop similar technology independently. In addition, effective patent and trade secret protection may be unavailable or limited in certain foreign countries. We have one patent issued supporting our semiconductor product line.
Significant Customers
MTI Instruments’ largest customer is the U.S. Air Force. We also have strong relationships with companies in the manufacturing, semiconductor, automotive, aerospace, aircraft and research industries. In the Test and Measurement Instrumentation Segment, in 2009,2011, the U.S. Air Force accounted for $1,188 thousand$2.3 million or 19.0%22.4% of product revenues; in 2008,2010, it accounted for $974 thousand$1.6 million or 15.7%22.3% of product revenues; and in 2007, the2009, it accounted for $1.2 million, or 19.2%, of product revenue. The largest commercial customer in 2011 was a Southeast Asian distributor, who accounted for $1.1 million or 10.7% of total product revenue in 2011. The largest commercial customer in 2010 was a Chinese distributor, who accounted for $560 thousand, or 7.8% of total product revenue in 2010. The largest commercial customer in 2009 was a domestic US defense contractor, who accounted for $618 thousand or 9.9% of total product revenue in 2009.
Recent Contracts
In 2011, MTI Instruments was awarded a $4.1 million multi-year U.S. Air Force accountedcontract for $2.4 million, or 26.3%,the purchase of product revenue.
In 2009, MTI Instruments was awarded a multi-year U.S. Air Force contract to service and repair its existing fleet of PBS-4100 jet engine balancing systems with the latest diagnostic and balancing technology, which could potentially generate up to a total of $6,500 thousand$6.5 million in sales for the Company between the years 2009 and 2014. As of December 31, 2009,2011, MTI Instruments had recorded $439 thousand$2.9 million in orders, approximately 6.8%44.6% of the five-year contract’s total value.
Competition
We are subject to competition from several companies, many of which are larger than MTI Instruments and have greater financial resources. MTI Instruments’ competitors include KLA-Tencor, Sigma Tech Corporation, E+H Eichhorn+Hausmann GmbH,Chadwick-Helmuth Company, Inc., ACES Systems, Micro-Epsilon, and Keyence Corporation.
The primary competitive considerations in MTI Instruments’ markets are product quality, performance, price, timely delivery, and the ability to identify, pursue and bringobtain new customers. MTI Instruments believes that its employees, product development skills, sales and marketing systems and reputation are competitive advantages.
The New Energy Segment
Technological advances in semiconductor manufacturing, LCD displays, memory costs and Development
MTI Micro’s research and development team is responsibleMicro has been developing an off-the-grid power solution for advanced research, product planning, design and development, and quality assurance. Through our supply chain, wevarious portable electronic devices to address this power gap. Our patented proprietary DMFC technology platform, called Mobion®, converts methanol fuel to usable electricity capable of providing continuous power as long as necessary fuel flows are also working with subcontractors in developing specificmaintained. Our proprietary fuel cell power solution consists of two primary components of our technologies. The primary objective of our research and development program is to advanceintegrated into an easily manufactured device: the development of our direct methanol fuel cell power engine, which we refer to as our Mobion® Chip, and methanol fuel cartridges. Our current Mobion® Chip is small enough to fit in the palm of one’s hand. The methanol used by the technology is fully biodegradable.
Although MTI Micro continues to enhancebelieve in the commercial valuepotential of its Mobion® based power solutions, operations have been suspended at MTI Micro until such time as market demand and other deciding factors, including obtaining additional external financing, the successful completion of customer trials, a new development program with a government agency, and/or a customer order, come to fruition. Currently, MTI Micro has no employees and projects to spend between $5 and $10 thousand per month for operating activities including rent, preparing prototypes for customer demonstrations, minimal sales efforts, and patent fees to keep its patent portfolio current and minimal consultant costs to perform these initiatives. MTI Micro will continue to seek additional capital from external sources to resume operations and fund future development, if any. If MTI Micro is unable to secure additional financing, a new development program or customer order, the MTI Micro board of directors will assess other options for MTI Micro, including the sale of MTI Micro’s intellectual property portfolio and other assets.
MTI Micro’s Solution
At the core of MTI Micro’s solution is its proprietary Mobion® Chip engine, a design architecture that embodies a reduction in the size, complexity, and cost of fuel cell construction, which results in a reliable, manufacturable, and affordable power solution that we believe provides higher energy density and portability over competing portable power technologies. MTI Micro’s proprietary fuel cell power solution consists of two primary components integrated in an easily manufactured device: the direct methanol fuel cell power engine, which MTI Micro refers to as the Mobion® Chip, and methanol replacement cartridges. The Mobion® Chip is small enough to fit in the palm of one’s hand. For these reasons, MTI Micro believes that its Mobion® platform is ideally suited to provide a replacement or go along with rechargeable batteries. Based upon MTI Micro’s ability to provide a compact, efficient, clean, safe, and long-lasting power source, MTI Micro intends to initially target power solutions for applications such as universal handheld chargers, military equipment, power tools, remote sensors, mobile phones, digital cameras, portable gaming devices, e-readers and other portable devices.
MTI Micro’s Strategy
Although MTI Micro has suspended its operations, if/when those operations are able to resume, its goals remain the same, to become a leading provider of portable power for various electronic devices. Key elements of MTI Micro’s strategy would include:
Additionally, MTI Micro’s board of directors will assess other options for MTI Micro including the sale of MTI Micro’s intellectual property portfolio and other assets.
Products
MTI Micro is pursuing the development of an external power charger product as a standalone device that uses a standard and widely used Universal Serial Bus (USB) interface as a power output connector that can be used to recharge handheld mobile devices. Our current design for the device is roughly the size of two decks of playing cards (see photo to the right) and employs a methanol fuel cartridge. For each removable cartridge, our current prototype external power charger provides up to one month of power for the typical mobile phone. Our device is designed to provide 2.5 watts of power output from its USB interface and also offer fast charge, ultra-long run time and self-charging modes. |
|
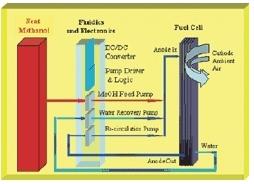
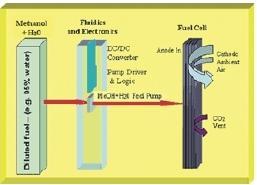
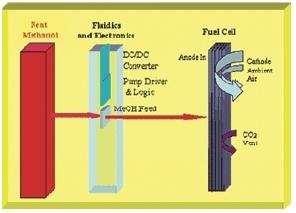
Technology
A fuel cell is an electrochemical energy conversion device, which is similar to a battery that produces electricity from a liquid or gaseous fuel, such as wellmethanol, and an oxidant, such as oxygen. Fuel cells are different from batteries in that they consume a reactant that can be replenished, while batteries store electrical energy chemically in a closed system.
Generally, the reactants flow in and reaction products flow out of the fuel cell. While the electrodes within a battery react and change as a battery is charged or discharged, a fuel cell’s electrodes are catalytic and relatively stable.
A direct methanol fuel cell relies upon the reaction of water with methanol at the catalytic anode layer to release protons and electrons and to form carbon dioxide. The electrons pass through a circuit and generate electricity that can be used to power external devices. The protons generated through this reaction pass through the proton exchange membrane to the cathode, where they combine to form water. The anode and cathode layers of a direct methanol fuel cell are usually made of platinum ruthenium particles and platinum particles embedded on either side of a proton exchange membrane.
Strategic Agreements
On October 26, 2010, MTI Micro was awarded a $100 thousand firm fixed contract from a United States Department of Defense (DOD) agency for the development of proof of concept fuel cells for technical testing and subsequent demonstration in a capabilities based experiment. The total contract was billed and paid as of December 31, 2011.
On July 28, 2010, MTI Micro was awarded a cost share funding grant of $296 thousand from the New York State Energy Research and Development Authority (NYSERDA). The total contract was billed and paid as of December 31, 2011.
On April 16, 2009, we entered into a $4.8 million cost-shared development contract with the Department of Energy (DOE), for the commercialization of our Mobion® product solutions, with $2.4 million in funds available under this program. On April 30, 2010, MTI Micro was approved for an extension of this grant with additional funds available of $594 thousand. As of April 25, 2011, all amounts awarded have been billed and paid by the DOE under this grant. During the first quarter of 2011, we completed the work required under this DOE grant. The objective of the grant was to demonstrate and field test a commercially viable one watt DMFC charger for consumer electronic devices. As part of this objective, MTI Micro field tested 75 units to various users, including 17 OEM’s, 33 individuals, 21 military agencies and four governmental agencies. We have achieved all technical performance targets required by the DOE under this grant; this field testing has concluded and the final report to the DOE may be found at http://www.mtimicrofuelcells.com/news/events.asp. Additional experimental testing was conducted at the DOD since the fourth quarter of 2010 that resulted in product improvements in the third quarter of 2011. Further testing by the DOD of our Mobion® fuel cell charger commenced in October 2011. If approval is granted, this may result in the signing of a commercialization contract or purchase orders for final production. To date, no approval has been granted and there is no clear indication as to develop next generationwhen MTI Micro will be notified.
Intellectual Property and Proprietary Rights
We rely on a combination of patents (both national and international), trade secrets, trademarks, and copyrights to protect our intellectual property. Our strategy is to apply for patent protection for all significant design requirements. Additionally, we systematically analyze the existing intellectual property landscape for direct methanol fuel cells to determine where the greatest opportunities for developing intellectual property exist. We also enter into standard confidentiality agreements with our employees, consultants, vendors, partners and potential customers and seek to control access to and distribution of our proprietary information.
As of December 31, 2011, MTI Micro’s Mobion® Technology had filed over 106 U.S. patent applications, 54 of which have been awarded. Of the awarded patents, 44 are assigned to us and 10 are assigned to Duracell. We have filed 33 Patent Cooperation Treaty Applications in multiple countries, 5 of which have been issued. We have developed a portfolio of patent applications in areas including fuel cell products.
Research and Development
MTI Instruments conducts research and develops technology to support its existing products and develop new products. Management believes that the success of the enterpriseMTI Instruments depends to a large extent upon innovation, technological expertise and new product development.
MTI, through its subsidiariesMTI Instruments and MTI Micro, and MTI Instruments has incurred research and development costs of approximately $11.8$1.5 million, $8.3$3.9 million and $3.3$5.4 million for the years ended December 31, 2007, 2008,2011, 2010, and 2009, respectively. We expect to continue to invest in research and development in the future.future in our MTI Instruments segment.
Employees
As of December 31, 2009,2011, we had 5243 employees including 42 full-time employees. Of these employees, 21 were involved in our new energy segment and 31 were involved in our test and measurement instrumentation business. Two of our employees are also involved in corporate functions.
Availability of Information
We make available through our website(http://www.mechtech.com), free of charge, our Annual Reports on Form 10-K, Quarterly Reports on Form 10-Q, Current Reports on Form 8-K, and amendments to those reports, filed or furnished pursuant to Section 13(a) or 15(d) of the Securities Exchange Act of 1934, as amended, as soon as reasonably practicable after such reports are electronically filed with, or furnished to, the SEC.Securities and Exchange Commission (SEC). These reports may be accessed through our website’s Investor Relations page.
The public may read and copy any materials we file with the SEC at the SECSEC’s Public Reference Room at 100 F Street, NE, Room 1580, Washington, DC 20549. The public may also obtain information on the operation of the Public Reference Room by calling the SEC at 1-800-SEC-0330. We file electronically with the SEC and the SEC maintains an Internetinternet site (http://www.sec.gov) that contains reports, proxy and information statements, and other information regarding issuers that file electronically with the SEC.
Item 1A: Risk Factors
Factors Affecting Future Results
This Annual Report on Form 10-K and the documents we have filed with the SEC that are incorporated by reference into this Annual Report on Form 10-K contain forward-looking statements that involve risks and uncertainties.uncertainties within the meaning of Section 27A of the Securities Act and Section 21E of the Securities Exchange Act of 1934, as amended, or the Exchange Act. Any statements contained, or incorporated by reference, in this Annual Report on Form 10-K that are not statements of historical fact may be forward-looking statements. When we use the words “anticipate,” “estimate,” “plans,” “projects,” “continuing,” “ongoing,” “expects,” “management believes,” “we believe,” “we intend,” “should,” “could,” “may,” “will” and similar words or phrases, we are identifying forward-looking statements. Forward-looking statements involve risks, uncertainties, estimates and assumptions which may cause our actual results, performance or achievements to be materially different from those expressed or implied by forward-looking statements. These factors include, among others:
Except as may be required by applicable law, we do not undertake or intend to update or revise our forward-looking statements, and we assume no obligation to update any forward-looking statements contained in, or incorporated by reference into, this Annual Report on Form 10-K as a result of new information or future events or developments. Thus, assumptions should not be made that our silence over time means that actual events are bearing out as expressed or implied in such forward-looking statements.
Risk Factors
Set forth below are certain risks and uncertainties that could adversely affect our results of operations or financial condition and cause our actual results to differ materially from those expressed in our forward-looking statements. Also refer to Factorsthe heading “Factors Affecting Future Results.
We currently derive all of our product revenue from our test and measurement instrumentation business.
Our test and measurement instrumentation business is subject to a number of risks, including the following:
In addition, our test and measurement instrumentation products can be sold in quantity to a relatively few number of customers, resulting in a customer concentration risk. This business experienced a significant decline in sales in 2008 and sales were comparable in 2009. The further loss of any significant portion of such customers or a material adverse change in the financial condition of any one of these customers could have a material adverse effect on our business.
Since we are required to discontinue our portable power source businesshave suspended operations for MTI Micro due to lack of funding, all of our corporate overhead costs wouldmust be allocated tofunded by the test and measurement instrumentation business.
Variability of customer requirements resulting in cancellations, reductions, or delays may adversely affect our operating results.
We will beare required to provide rapid product turnaround and respond to short lead times. A variety of conditions, both specific to individual customers and generally affecting the demand for OEMs’ products, may cause customers to cancel, reduce, or delay orders. Cancellations, reductions, or delays by a significant customer or by a group of customers could adversely affect our operating results. Customers may require rapid increases in production, which could strain our resources and reduce our margins.
If we are unable to adequately protect our intellectual property, our competitors and other third parties could produce products based on our intellectual property, which would substantially impair our ability to compete.
Our success and ability to compete depends in part upon our ability to maintain the proprietary nature of our technologies. We rely on a combination of patent, trade secret, copyright, and trademark law and license agreements, as well as nondisclosure agreements, to protect our intellectual property. These legal means, however, afford only limited protection and may not be adequate to protect our intellectual property rights. We cannot be certain that we were the first creator of inventions covered by pending patent applications or the first to file patent applications on these inventions. In addition, we cannot be sure that any of our pending patent applications will issue. The United States Patent and Trademark Office or other foreign patent and trademark offices may deny or significantly narrow claims made under our patent applications and, even if issued, these patents may be successfully challenged, designed around, or may otherwise not provide us with any commercial protection.
We may in the future need to assert claims of infringement against third parties to protect our intellectual property. Regardless of the final outcome, any litigation to enforce our intellectual property rights in patents, copyrights, or trademarks could be highly unpredictable and result in substantial costs and diversion of resources, which could have a material and adverse effect on our business and financial condition. In the event of an adverse judgment, a court could hold that some or all of our asserted intellectual property rights are not infringed, or are invalid or unenforceable, and could award attorneys’ fees to the other party.
We may become subject to claims of infringement or misappropriation of the intellectual property rights of others, which could prohibit us from selling our products, require us to obtain licenses from third parties or to develop non-infringing alternatives, and subject us to substantial monetary damages and injunctive relief.
We may receive notices from third parties that the manufacture, use, or sale of any products we develop infringes upon one or more claims of their patents. Moreover, because patent applications can take many years to issue, there may be currently pending applications, unknown to us, which may later result in issued patents that materially and adversely affect our business. Third parties could also assert infringement or misappropriation claims against us with respect to our future product offerings, if any. Whether or not such claims are valid, we cannot be certain that we have not infringed the intellectual property rights of such third parties. Any infringement or misappropriation claim could result in significant costs, substantial damages, and our inability to manufacture, market, or sell any of our product offerings that are found to infringe. Even if we were to prevail in any such action, the litigation could result in substantial cost and diversion of resources that could materially and adversely affect our business. If a court determined, or if we independently discovered, that our product offerings violated third-party proprietary rights, there can be no assurance that we would be able to re-engineer our product offerings to avoid those rights or obtain a license under those rights on commercially reasonable terms, if at all. As a result, we could be prohibited from selling products that are found to infringe upon the rights of others. Even if obtaining a license were feasible, it may be costly and time-consuming. A court could also enter orders that temporarily, preliminarily, or permanently enjoin us from making, using, selling, offering to sell, or importing our portable power source products, or could enter orders mandating that we undertake certain remedial activities. Further, a court could order us to pay compensatory damages for such infringement, plus prejudgment interest, and could in addition treble the compensatory damages and award attorneys’ fees. These damages could materially and adversely affect our business and financial condition.
Confidentiality agreements with employees and others may not adequately prevent disclosure of our trade secrets and other proprietary information, which could limit our ability to compete.
We rely on trade secrets to protect our proprietary technology and processes. Trade secrets are difficult to protect. We enter into confidentiality and intellectual property assignment agreements with our employees, consultants, and other advisors. These agreements generally require that the other party keep confidential and not disclose to third parties confidential information developed by the party or made known to the party by us during the course of the party’s relationship with us. However, these agreements may not be honored and enforcing a claim that a party illegally obtained and is using our trade secrets is difficult, expensive and time-consuming, and the outcome is unpredictable. The failure to obtain and maintain trade secret protection could adversely affect our competitive position.
Our efforts to develop new technologies may not result in commercial success, which could cause a decline in our revenue and could harm our business.
Our research and development efforts with respect to our technologies may not result in customer or market acceptance. Some or all of those technologies may not successfully make the transition from the research and development lab to cost-effective production as a result of technology problems, competitive cost issues, yield problems, and other factors. Even when we successfully complete a research and development effort with respect to a particular technology, our customers may decide not to introduce or may terminate products utilizing the technology for a variety of reasons, including the following:
The nature of our business will require us to make continuing investments for new technologies. Significant expenses relating to one or more new technologies that ultimately prove to be unsuccessful for any reason could have a material adverse effect on us. In addition, any investments or acquisitions made to enhance our technologies may prove to be unsuccessful. If our efforts are unsuccessful, our business could be harmed.
We may not be able to enhance our product solutions and develop new product solutions in a timely manner.
Our future operating results will depend to a significant extent on our ability to provide new portable power source products that compare favorably with alternative solutions on the basis of time to introduction, cost, performance, and end-user preferences. Our success in attracting and maintaining customers and developing business will depend on various factors, including the following:
Our inability to commercialize our proposed portable power source solutions and develop new product solutions on a timely basis could harm our operating results and impede our growth.
If we do not keep pace with technological innovations, our products may not be competitive and our revenue and operating results may suffer.
The electronic, semiconductor, solar, automotive and general instrumentation industries are subject to constant technological change. Our future success will depend on our ability to respond appropriately to changing technologies and changes in product function and quality. If we rely on products and technologies that are not attractive to end users, we may not be successful in capturing or retaining any significant market share. In addition, anyTechnological advances, the introduction of new products, and new design techniques could adversely affect our business prospects unless we are able to adapt to the changing conditions. Technological advances could render our products obsolete, and we may not be able to respond effectively to the technological requirements of evolving markets. As a result, we will be required to expend substantial funds for and commit significant resources to:
Our business could be harmed if we are unable to develop and utilize new technologies utilized inthat address the needs of our portable power source products may not perform as expectedcustomers, or as desired, in which event our adoption of such products or technologies may harm our business.competitors do so more effectively than we do.
International sales and manufacturing risks could adversely affect our operating results.
Having a worldwide distribution network for our portable power source products will be conducted primarily in Asia by manufacturing subcontractors. We also believe that many of our OEM customers will be located and much of our sales and distribution operations will be conducted in Asia. These international operations will exposeexposes us to various economic, political, and other risks that could adversely affect our operations and operating results, including the following:
The risks associated with international operationssales could negatively affect our operating results.
Our business may suffer if international trade is hindered, disrupted, or economically disadvantaged.
Prior to 2011, when we generated net income of $2.4 million primarily attributable to the reversal of a portion of the deferred tax asset’s valuation reserve of $1.5 million, representing the portion of the Company’s deferred tax asset that management has estimated is more likely than not to be realized and MTI Instrument’s strong performance, we had incurred recurring net losses, including net losses of $1.8 million in 2010, and $3.1 million in 2009. As a result of historic operating losses, we had an accumulated deficit of approximately $120.1 million as of December 31, 2011. MTI Micro suspended its operations at the end of 2011 and, therefore, expects to incur minimal ongoing operating expenses unless additional funding becomes available to fund its operations in the current tariff structures, export or import compliance laws, or other trade policies,future. If MTI Micro is unable to secure additional financing, MTI Micro could adversely affect our abilitybe forced to sell our portable power source productsassets at unfavorable prices; or merge, consolidate, or combine with a company with greater financial resources in foreign marketsa transaction that may be unfavorable to us.
Since the Company no longer expects to fund MTI Micro, MTI Micro has sought and will continue to obtain materials or equipment from foreign suppliers.
Our operating results could be adversely affected by fluctuations in the value of the U.S. dollar against foreign currencies.
We transact our business predominantly in U.S. dollars and bill and collect our sales in U.S. dollars. In 2009,2011, approximately 38%33.3% of our revenue was from customers outside of the United States. A weakening of the dollar could cause our overseas vendors to require renegotiation of either the prices or currency we pay for their goods and services. Similarly, a strengthening of the dollar could cause our products to be more expensive for our international customers, which could cause the demand for our products and our revenue to decline.
In the future, customers may negotiate pricing and make payments in non-U.S. currencies. If our overseas vendors or customers require us to transact business in non-U.S. currencies, fluctuations in foreign currency exchange rates could affect our cost of goods, operating expenses, and operating margins and could result in exchange losses. In addition, currency devaluation can result in a loss to us if we hold deposits of that currency. Hedging foreign currencies can be difficult, especially if the currency is not freely traded. We cannot predict the impact of future exchange rate fluctuations on our operating results.
We expect that a majorityContinuing uncertainty of the U.S. economy may have serious implications for the growth and stability of our manufacturing subcontractors will be located in Asia, increasing the risk that a natural disaster, labor strike, war, or political unrest in those countries would disruptbusiness and may negatively affect our operations.stock price.
The revenue growth and profitability of our manufacturing subcontractorsbusiness will depend significantly on the overall demand for test and measurement instrumentations as well as electronic devices. Softening demand in these markets caused by ongoing economic uncertainty may result in decreased revenue or earnings levels. The U.S. economy has been historically cyclical and market conditions continue to be locatedchallenging, which has resulted in Asia. Events outindividuals and companies delaying or reducing expenditures. Further delays or reductions in spending could have a material adverse effect on demand for our products, and consequently on our business, financial condition, results of operations, prospects, stock price, and ability to continue to operate.
Our common stock was delisted from the NASDAQ Stock Market, which has adversely affected the price of our control, such as earthquakes, fires, floods, or other natural disasters, or political unrest, war, labor strikes, or work stoppages in Asia could disrupt their operations, which would impact our business. In addition, there is political tension between Taiwanstock and China that could lead to hostilities. If any of these events occur, we may not be able to obtain alternative manufacturing capacity. Failure to secure alternative manufacturing capacity could cause a delay in the shipmentability of our products,stockholders to trade in our stock.
In April 2009, we voluntarily delisted our common stock from the NASDAQ Stock Market to reduce expenses and to avoid a likely involuntary delisting for failure to comply with the continued listing requirements. Our common stock subsequently began trading on the Pink Sheets under the symbol “MKTY PK.” As a result of the delisting, the liquidity in our stock has decreased, which would causeadversely affected the price of our revenuestock, which may make it more difficult for you to fluctuate or decline.
The electronics industry is cyclical and may result in fluctuations in our operating results.
The electronics industry has experienced significant economic downturns at various times. These downturns are characterized by diminished product demand, accelerated erosion of average selling prices, and production overcapacity. In addition, the electronics industry is cyclical in nature. We will seek to reduce our exposure to industry downturns and cyclicality by providing design and production services for leading companies in rapidly expanding industry segments. We may, however, experience substantial period-to-period fluctuations in future operating results because of general industry conditions or events occurring in the general economy.
Our strategic alliances may not achieve their objectives, and their failure to do so could impede our growth.
We plan to explore additional strategic alliances designed to enhance or complement our technology or to work in conjunction with our technology; to provide necessary know-how, components, or supplies; and to develop, introduce, and distribute products utilizing our technology. Any strategic alliances may not achieve their intended objectives, may be cancelled by either party and parties to our strategic alliances may not perform as contemplated. The failure of our current alliances or our inability to form additional alliances may impede our ability to introduce new products and enter new markets.
We depend on key personnel who would be difficult to replace, and our business will likely be harmed if we lose their services or cannot hire additional qualified personnel.
Our success will dependdepends substantially on the efforts and abilities of our senior management and key personnel. The competition for qualified management and key personnel, especially engineers, is intense. Although we maintain non-competition and non-disclosure covenants with most of our key personnel, we do not have employment agreements with most of them. The loss of services of one or more of our key employees or the inability to hire, train, and retain key personnel, especially engineers, technical support personnel, and capable sales and customer-support employees outside the United States, could delay the development and sale of our products, disrupt our business, and interfere with our ability to execute our business plan.
Our operating results may experience significant fluctuations.
In addition to the variability resulting from the short-term nature of our customers’ commitments, other factors will contribute to significant periodic and seasonal quarterly fluctuations in our results of operations. These factors include the following:
Accordingly, you should not rely on period-to-period comparisons as an indicator of our future performance. Negative or unanticipated fluctuations in our operating results may result in a decline in the price of our stock.
We have experienced an ownership change in MTI Micro that has resulted in a limitation of the use of their net operating losses, and we may experience further ownership changes in both MTI and MTI Micro which would result in a further limitation of the use of our net operating losses.
As of December 31, 2011, it is estimated that MTI has net operating loss (NOL) carryforwards of approximately $50.4 million and MTI Micro has NOL carryforwards of approximately $16.5 million. As a result of the conversion of the bridge notes in December 2009, MTI no longer maintained an 80% or greater ownership in MTI Micro. Thus, MTI Micro is no longer included in Mechanical Technology, Incorporated and Subsidiaries' consolidated federal and combined New York State tax returns, effective December 9, 2009. Pursuant to the Internal Revenue Service's consolidated tax return regulations (IRS Regulation Section 1.1502-36), upon MTI Micro leaving the Mechanical Technology, Incorporated and Subsidiaries’ consolidated group, MTI elected to reduce a portion of its stock tax basis in MTI Micro by "reattributing" a portion of MTI Micro's NOL carryforwards to MTI, for an amount equivalent to its built-in loss amount in MTI's investment in MTI Micro's stock. As the result of MTI making this election with its December 31, 2009 tax return, MTI reattributed approximately $45.2 million of MTI Micro's NOLs (reducing its tax basis in MTI Micro's stock by the same amount), leaving MTI Micro with approximately $13 million of separate company NOL carryforwards at the time of conversion of the Bridge Notes.
The Company and its subsidiaries have undergone a formal Section 382 study. A corporation generally undergoes an “ownership change” when the ownership of its stock, by value, changes by more than 50 percentage points over any three-year testing period. In the event of an ownership change, Section 382 of the Internal Revenue Code of 1986 imposes an annual limitation on the amount of post-ownership change taxable income a corporation may offset with pre-ownership change NOL carryforwards and certain recognized built-in losses. As a result of MTI Micro’s issuance of stock between 2009 and 2011, MTI Micro has experienced a Section 382 ownership change, which has reduced their NOLs by an estimated $14.6 million.
Our ability to utilize the MTI and remaining MTI Micro NOL carryforwards, including any future NOL carryforwards that may arise, may be limited by Section 382, if we or MTI Micro undergo any further “ownership changes” as a result of subsequent changes in the ownership of our outstanding common stock pursuant to the exercise of the MTI Micro warrants, MTI or MTI Micro options outstanding, additional financings obtained, or otherwise.
Our ownership position in MTI Micro has been reduced as a result of external financing for MTI Micro's operations, which could limit our ability to control the operations.
As of December 31, 2011, we owned approximately 47.6% of MTI Micro’s Common Stock issued. Between September 2008 and September 2011, MTI Micro entered into numerous debt and equity financings with third parties, primarily, Dr. Walter L. Robb, a member of the Company’s and MTI Micro’s boards of directors, and Counter Point Ventures Fund II, LP (Counter Point). Counter Point is a venture capital fund sponsored and managed by Dr. Robb. After these series of transactions, MTI now holds an aggregate of approximately 47.6% of the outstanding common stock of MTI Micro or 53.3% of the outstanding common stock and warrants issued of MTI Micro, and Dr. Robb and Counter Point hold approximately 5.1% and 45.2%, respectively of the outstanding common stock of MTI Micro or 4.3% and 40.3%, respectively of the outstanding common stock and warrants issued of MTI Micro. Since no entity of the related parties has power but, as a group, the Company and its related parties have the power, then the party within the related party group that is most closely associated with the VIE, MTI Micro, is the primary beneficiary. Even though Dr. Robb and Counterpoint combined control a majority of the outstanding common stock, and they have the ability to elect the directors of MTI Micro and decide whether to continue to seek business opportunities for MTI Micro or instead seek opportunities to sell the intellectual property, they have not elected to do so. The Company continues to oversee the day to day operations, exercise management decision making, seek opportunities to sell intellectual properties, and have a vested interest in the commercialization of MTI Micro’s fuel cell technology. Since inception in 2001, the Company has made the largest investment and been the principal funder of MTI Micro. The Company has also been exposed to losses and has the ability to benefit from MTI Micro. Considering the facts and circumstances, management believes the Company is most closely associated with the VIE, MTI Micro, and therefore, it is the primary beneficiary of MTI Micro. Should there be a change in the facts and circumstances (such as a change in governance or a change to the related party group) management will reassess whether they act as the primary beneficiary and should continue to include MTI Micro in the Company’s consolidated results of operations.
MTI Micro currently does not have sufficient funds to commercialize its portable power source products.
In order to resume operations and continue full commercialization of its micro fuel cell solution, MTI Micro will need to do one or more of the following to raise additional resources, or reduce its cash requirements:
There is no guarantee that resources will be available to MTI Micro on terms acceptable to it, or at all, or that such resources will be received in a timely manner, if at all, or that MTI Micro will be able to resume operations or reduce its expenditure run-rate further. MTI Micro had cash and cash equivalents of $110 thousand as of December 31, 2011. Since 2008, MTI Micro has raised $5.4 million in external debt and equity financing. At the end of 2011, MTI Micro suspended its operations while additional necessary funding is being pursued. If MTI Micro raises additional funds by issuing equity securities, MTI Micro’s stockholders, including MTI, will experience further dilution. Additional debt financing, if available, may involve restrictive covenants. There is no assurance that funds raised in any future debt financing or additional equity financing arrangements will be sufficient, that the financing will be available on terms favorable to MTI Micro or to existing stockholders and at such times as required, or that MTI Micro will be able to obtain the additional financing required to resume the operation of its business. If MTI Micro raises additional funds through collaboration and licensing arrangements with third parties, it may be necessary to relinquish some rights to MTI Micro’s technologies or its products, or grant licenses on terms that are not favorable to MTI Micro. If MTI Micro is unable to secure additional financing, MTI Micro could be forced to sell assets at unfavorable prices; or merge, consolidate, or combine with a company with greater financial resources in a transaction that may be unfavorable to us.
MTI Micro’s portable power source products may not be accepted by the market.
Any portable power source products that MTI Micro develops may not achieve market acceptance. The development of a successful market for MTI Micro’s proposed portable power source products and the ability to sell those products at favorable prices may be adversely affected by a number of factors, many of which are beyond MTI Micro’s control, including the following:
Target markets for MTI Micro’s proposed portable power source products, such as those for mobile phones (including smart phones) and mobile phone accessories, digital cameras, portable media players, PDAs, and GPS devices, are volatile, cyclical, and rapidly changing and could continue to utilize existing technology or adopt other new competing technologies. The market for certain of these products depends in part upon the development and deployment of wireless and other technologies, which may or may not address the needs of users of these new products.
Many manufacturers of portable electronic devices have well-established relationships with competitive suppliers. Penetrating these markets will require MTI Micro to offer better performance alternatives to existing solutions at competitive costs. The failure of any of the target markets to continue to expand, or the failure to penetrate these markets to a significant extent, will impede MTI Micro’s potential sales growth. We cannot predict the growth rate of these markets or the market share MTI Micro will achieve in these markets in the future.
If MTI Micro’s proposed portable power source products do not achieve market acceptance, it could materially and adversely affect MTI Micro’s business and financial condition.
Item 1B: Unresolved Staff Comments
None.
Item 2: Properties
We lease office, manufacturing and research and development space in the following locations:
| Approximate Number of | |||||
| Location | Segment | Primary Use | Square Feet | Lease Expiration | |
| Albany, NY | Test and Measurement | Manufacturing, office and sales | 17,424 | 2014 | |
| Instrumentation | |||||
| Albany, NY | New Energy | Corporate headquarters, office and | 20,000 | 2010 | |
| research and development | |||||
| Shanghai, | New Energy | Representative office | 310 | 2010 | |
| China | |||||
| Approximate Number of | ||||||||||
| Location | Segment | Primary Use | Square Feet | Lease Expiration | ||||||
| Albany, NY | Test and Measurement | Corporate headquarters, manufacturing, | 17,400 | November, 2014 | ||||||
| Instrumentation | office and sales | |||||||||
| Albany, NY | New Energy | Office and research and development | 20,000 | April, 2012 | ||||||
| Shanghai, | New Energy | Representative office | 300 | March, 2012 | ||||||
| China | ||||||||||
We believe our facilities are generally well maintained and adequate for our current needs and for expansion, if required. We further believe that aThe New Energy lease renewal on reasonable terms for these properties may be achieved.
Item 3: Legal Proceedings
At any point in time, we may be involved in various lawsuits or other legal proceedings. Such lawsuits could arise from the sale of products or services or from other matters relating to its regular business activities, compliance with various governmental regulations and requirements, or other transactions or circumstances. We do not believe there are any such proceedings presently pending which could have a material adverse effect on our financial condition.
Item 4: Reserved
Not applicable.
PART II
Item 5: Market for Registrant’s Common Equity, Related Stockholder Matters and Issuer Purchases of Equity Securities
Price Range of Common Stock
Our common stock is traded on the OTCover the counter (OTC) Markets at PinkSheets.com under the symbol “MKTY.PK”. The following table sets forth the high and low sale prices of our common stock as reported by Pink Sheets for the periods indicated (for periods prior to May 16, 2008, such pricesindicated:
| High | Low | ||||
| Fiscal Year Ended December 31, 2011 | |||||
| First Quarter | $ | .95 | $ | .59 | |
| Second Quarter | .95 | .69 | |||
| Third Quarter | .72 | .41 | |||
| Fourth Quarter | .59 | .41 | |||
| Fiscal Year Ended December 31, 2010 | |||||
| First Quarter | $ | 1.13 | $ | .66 | |
| Second Quarter | .90 | .42 | |||
| Third Quarter | .80 | .25 | |||
| Fourth Quarter | .89 | .55 | |||
Dividend Policy
We have been derived by multiplying the actual prices by eight to reflect the reverse split ofnever declared or paid dividends on our common stock that was approved by our stockholders at a meeting heldand do not anticipate or contemplate paying cash dividends on May 15, 2008, pursuant to which every eight shares of our common stock were combined into one sharein the foreseeable future. We currently intend to use all available funds to develop our business. We can give no assurances that we will ever have excess funds available to pay dividends. Any future determination as to the payment of dividends will depend upon critical requirements and limitations imposed by our common stock):
| High | Low | ||||
| Fiscal Year Ended December 31, 2008 | |||||
| First Quarter | $ | 7.44 | $ | 3.77 | |
| Second Quarter | 7.80 | 1.11 | |||
| Third Quarter | 5.50 | .79 | |||
| Fourth Quarter | 1.93 | .75 | |||
| Fiscal Year Ended December 31, 2009 | |||||
| First Quarter | $ | 1.87 | $ | .75 | |
| Second Quarter | 1.00 | .10 | |||
| Third Quarter | 1.90 | .51 | |||
| Fourth Quarter | 1.54 | .30 | |||
Equity Compensation Plan Information
See also Part III Item 12 in this Annual Report on Form 10-K for additional detail related to security ownership and related stockholder matters, and for additional detail on equity compensation plan matters.
Item 6: Selected Financial Data
The following table sets forth our summary consolidated financial data for the fiscal years ended December 31, 2007, 2008,2011, 2010 and 2009 which was derived from our audited consolidated financial statements included elsewhere in this Annual Report on Form 10-K. We derived our summary consolidated financial data for the years ended December 31, 20052008 and 20062007 set forth in the following table from our audited consolidated financial statementstatements not included in this report. You should read the following summary consolidated financial data together with the information under “Management’s Discussion and Analysis of Financial Condition and Results of Operations” and our consolidated financial statements, including the related notes thereto.
| (In thousands, except per share data) | Years Ended December 31, | ||||||||||||||||||
| 2005 | 2006 | 2007 | 2008 | 2009 | |||||||||||||||
| Statement of Operations Data | |||||||||||||||||||
| Product revenue | $ | 6,012 | $ | 7,667 | $ | 9,028 | $ | 6,224 | $ | 6,263 | |||||||||
| Funded research and development revenue | 1,829 | 489 | 1,556 | 1,154 | 2,043 | ||||||||||||||
| Gain (loss) on derivatives | (10,407 | ) | 182 | 2,967 | 655 | (29 | ) | ||||||||||||
| Net gain (loss) on sale of securities available for sale | 10,125 | 4,289 | 2,549 | 1,018 | — | ||||||||||||||
| (Loss) income from continuing operations before income taxes, | |||||||||||||||||||
| equity in holdings’ losses and non controlling interest | (14,949 | ) | (12,980 | ) | (7,609 | ) | (10,760 | ) | (3,572 | ) | |||||||||
| Income tax (expense) benefit | (1,587 | ) | (1,895 | ) | (2,548 | ) | (2,004 | ) | 208 | ||||||||||
| Non controlling interests in losses of consolidated subsidiary | 1,442 | 1,208 | 582 | 260 | 265 | ||||||||||||||
| Net loss | (15,094 | ) | (13,667 | ) | (9,575 | ) | (12,504 | ) | (3,099 | ) | |||||||||
| Basic and Diluted (Loss) Earnings Per Share | |||||||||||||||||||
| Loss from continuing operations | $ | (3.93 | ) | $ | (3.46 | ) | $ | (2.01 | ) | $ | (2.62 | ) | $ | (0.65 | ) | ||||
| Loss per share | $ | (3.93 | ) | $ | (3.46 | ) | $ | (2.01 | ) | $ | (2.62 | ) | $ | (0.65 | ) | ||||
| Balance Sheet Data (as of period end): | |||||||||||||||||||
| Working capital | $ | 33,045 | $ | 23,076 | $ | 11,347 | $ | 252 | $ | 1,233 | |||||||||
| Securities available for sale | 18,947 | 10,075 | 4,492 | — | — | ||||||||||||||
| Total assets | 41,267 | 33,811 | 18,716 | 5,511 | 3,741 | ||||||||||||||
| Total long-term obligations | — | 3,664 | 904 | 254 | 70 | ||||||||||||||
| Total stockholders' equity (deficit) before noncontrolling interest | 32,916 | 22,871 | 13,803 | 1,515 | (1,135 | ) | |||||||||||||
| (In thousands, except per share data) | Years Ended December 31, | |||||||||||||||||
| 2011 | 2010 | 2009 | 2008 | 2007 | ||||||||||||||
| Statement of Operations Data | ||||||||||||||||||
| Product revenue | $ | 10,280 | $ | 7,179 | $ | 6,263 | $ | 6,224 | $ | 9,028 | ||||||||
| Funded research and development revenue | 13 | 1,234 | 2,043 | 1,154 | 1,556 | |||||||||||||
| Gain (loss) on derivatives | 73 | (3 | ) | (29 | ) | 655 | 2,967 | |||||||||||
| Net gain on sale of securities available for sale | — | — | — | 1,018 | 2,549 | |||||||||||||
| Income (loss) before income taxes and non-controlling interest | 100 | (3,392 | ) | (3,572 | ) | (10,760 | ) | (7,609 | ) | |||||||||
| Income tax benefit (expense) | 1,548 | (4 | ) | 208 | (2,004 | ) | (2,548 | ) | ||||||||||
| Net income (loss), net of tax | 1,648 | (3,396 | ) | (3,364 | ) | (12,764 | ) | (10,157 | ) | |||||||||
| Plus: Net loss attributed to non-controlling interest | 738 | 1,638 | 265 | 260 | 582 | |||||||||||||
| Net income (loss) attributed to MTI | 2,386 | (1,758 | ) | (3,099 | ) | (12,504 | ) | (9,575 | ) | |||||||||
| Basic and Diluted Income (Loss) Per Share | ||||||||||||||||||
| Income (loss) per share, basic and diluted | $ | 0.48 | $ | (0.37 | ) | $ | (0.65 | ) | $ | (2.62 | ) | $ | (2.01 | ) | ||||
| Weighted average number of common shares outstanding | 5,001,934 | 4,771,658 | 4,771,658 | 4,772,359 | 4,763,547 | |||||||||||||
| Balance Sheet Data (as of period end): | ||||||||||||||||||
| Working capital | $ | 3,142 | $ | 1,534 | $ | 1,163 | $ | 252 | $ | 11,347 | ||||||||
| Securities available for sale | — | — | — | — | 4,492 | |||||||||||||
| Total assets | 6,402 | 3,601 | 3,741 | 5,511 | 18,716 | |||||||||||||
| Total long-term obligations | — | — | — | 254 | 904 | |||||||||||||
| Total MTI stockholders' equity (deficit) | 1,601 | (1,446 | ) | (1,135 | ) | 1,515 | 13,803 | |||||||||||
Item 7: Management’s Discussion and Analysis of Financial Condition and Results of Operations
The following discussion of our financial condition and results of operations should be read in conjunction with our Consolidated Financial Statements and the related notes included elsewhere in this Annual Report. This discussion contains forward-looking statements, which involve risk and uncertainties. Our actual results could differ materially from those anticipated in the forward-looking statements as a result of certain factors, including those discussed in Item 1A: “Risk Factors” and elsewhere in this Annual Report.
Overview
MTI operates in two segments,segments: the Test and Measurement Instrumentation segment, which is conducted through MTI Instruments, Inc. (MTI Instruments), a wholly-owned subsidiary, and the New Energy segment, which is conducted through MTI MicroFuel Cells, Inc. (MTI Micro), a variable interest entity (VIE) as of December 31, 2011. MTI and MTI Micro currently share the same board of directors, while MTI also continues to oversee the day to day operations, exercise management decision making, seek opportunities to sell intellectual properties, and have a vested interest in the commercialization of MTI Micro’s fuel cell technology. Since inception in 2001, MTI has made the largest investment and been the principal funder of MTI Micro. MTI has also been exposed to losses and has the ability to benefit from MTI Micro. Considering the facts and circumstances, management believes MTI is most closely associated with the VIE, MTI Micro, and therefore, it is the primary beneficiary. Should there be a change in the facts and circumstances (such as a change in governance or a change to the related party group) management will reassess whether they act as the primary beneficiary and should continue to include MTI Micro in MTI’s consolidated results of operations.
Test and Measurement Instrumentation segment, throughSegment – MTI Instruments Inc. (MTI Instruments).
Our test and measurement segment has three product groups: Precision Instruments, Semiconductor and Solar Metrology Systems, and Aviation Balancing Systems. Our products consist of electronic, computerized gauging instruments for position, displacement and vibration applications for the design, manufacturing/production and test and research markets; metrology tools for wafer characterization of semiconductor and solar wafers; tensile stage systems for materials testing in research and industrial settings; and engine balancing and vibration analysis systems for both military and commercial aircraft.
In 2011, MTI Instruments was awarded a $4.1 million multi-year U.S. Air Force contract for the purchase of PBS4100+ portable aircraft engine balancing systems. As of December 31, 2011, MTI Instruments had recorded $684 thousand in orders, approximately 16.7% of the total contract’s total value. MTI Instruments also has a multi-year U.S. Air Force contract to service and repair its existing fleet of PBS-4100/+ jet engine balancing systems with the latest diagnostic and balancing technology, which could potentially generate up to a total of $6.5 million in sales for the Company between 2009 and 2014. As of December 31, 2011, MTI Instruments had recorded $2.9 million in orders, approximately 44.6% of the contract’s total value.
New Energy Segment - MTI Micro ishas been developing and commercializingan off-the-grid power solutions for various portable electronic devices. Our patented proprietary direct methanol fuel cell (DMFC) technology platform, called Mobion®, converts 100% methanol fuel to usable electricity capable of providing continuous power as long as necessary fuel flows are maintained. Our proprietary fuel cell power solution consists of two primary components integrated ininto an easily manufactured device: the direct methanol fuel cell power engine, which we refer to as our Mobion® Chip, and methanol fuel cartridges. Our current Mobion Chip weighs less than one ounce and is small enough to fit in the palm of one’s hand. The methanol used by the technology is fully biodegradable. We
Although MTI Micro continues to believe in the potential of its Mobion® based power solutions, operations have demonstrated power density of over 84 mW/cm2, while producing more than 1,800 Wh/kg or 1.4 Wh/cc of fuel from its direct methanol fuel feed. For these reasons, we believe our technology offers a superior power solution compared to current lithium-ion and similar rechargeable battery systems currently used by original equipment manufacturers and branded partners, or OEMs, in many handheld electronic devices,been suspended at MTI Micro until such time as smart phones, mobile phone accessories, digital cameras, portable gaming devices, e-readersmarket demand and other portable devices. We believe our platformdeciding factors, including obtaining additional external financing, the successful completion of customer trials, a new development program with a government agency, and/or a customer order come to fruition. Currently, MTI Micro has no employees and projects to spend between $5 and $10 thousand per month for operating activities including rent, preparing prototypes for customer demonstrations, minimal sales efforts, and patent fees to keep its patent portfolio current and minimal consultant costs to perform these initiatives. MTI Micro will facilitate further developmentscontinue to seek additional capital from external sources to resume operations and fund future development, if any. If MTI Micro is unable to secure additional financing, a new development program or customer order, the MTI Micro board of numerous electronic product advantages,directors will assess other options for MTI Micro including smaller size, environmental friendliness, greatly extended run-timethe sale of current portable devicesMTI Micro’s intellectual property portfolio and simplicityother assets.
In the second half of design, all critical2010, we entered into a firm fixed price contract for commercialization in the consumer market,development of proof of concept fuel cells for technical testing with a United States Department of Defense (DOD) agency. Additionally, during the first quarter of 2011, we completed the work required under the United States Department of Energy (DOE) grant awarded for the period January 8, 2009 through March 30, 2011. The objective of the grant was to demonstrate and can be implemented as three different product options:field test a handheld power generatorcommercially viable one watt DMFC charger for consumer electronic devices, a snap-on or attached power accessory, or an embeddeddevices. As part of this objective, MTI Micro field tested 75 units to various users, including 17 OEM’s, 33 individuals, 21 military agencies and four governmental agencies. We have achieved all technical performance targets required by the DOE under this grant; this field testing has concluded and the final report to the DOE may be found athttp://www.mtimicrofuelcells.com/news/events.asp. Additional experimental testing was conducted at the DOD since the fourth quarter of 2010 that resulted in product improvements in the third quarter of 2011. Further testing by the DOD of our Mobion® fuel cell charger commenced in handheld devices. We have strategic agreements withOctober 2011. If approval is granted, this may result in the signing of a global Japanese consumer electronics company, with a U.S. based developercommercialization contract or purchase orders for final production. To date, no such approval has been granted and marketer of universal chargers, with a global power tool manufacturer, and a letter of intent with Duracell, part of the Procter & Gamble Company. Our goalthere is no clear indication as to become the leading provider of portable power for various types of electronic devices and, assuming available financing, we intend to commercialize Mobion products in 2010.
Recent Developments
Material Agreements–On February 9, 2011, Amendment No. 1 to the following table:
| (Dollars in thousands) | Years ended December 31, | |||||||||||
| 2007 | 2008 | 2009 | ||||||||||
| Cash and cash equivalents | $ | 7,650 | $ | 1,662 | $ | 785 | ||||||
| Securities available for sale | 4,492 | — | — | |||||||||
| Working capital | 11,347 | 252 | 1,233 | |||||||||
| Net loss | (9,575 | ) | (12,504 | ) | (3,099 | ) | ||||||
| Net cash used in operating activities | (11,683 | ) | (10,346 | ) | (2,170 | ) | ||||||
| Purchase of property, plant and equipment | (414 | ) | (181 | ) | (7 | ) | ||||||
On September 23, 2011, Amendment No. 2 to the Purchase Agreement was entered into between MTI Micro may issue and sell toCounter Point. The total $84 thousand of Amendment No. 2 has been drawn down as of December 31, 2011. In exchange, Counter Point up to 28,571,429received 1,200,000 shares of common stock, par value $0.01 per share (the “Micro Common Stock”), at a purchase price per share of $0.070, over a period of twelve (12) months, and warrants (“Warrants”) to purchase shares of Micro Common Stock equal to 20% of the shares of Micro Common Stock purchased under the Purchase Agreement at an exercise price of $0.070 per share. The sale and issuance of theMTI Micro Common Stock and Warrants shall occur over multiple closings (each, a “Closing”) occurring over two (2) one month closing periods and five (5) two-month closing periods (each, a “Closing Period”). Three Closings have occurred through March 15, 2010, with240,000 MTI Micro raising $660,000Warrants. See Note 10 in the consolidated financial statements for further discussion of this transaction.
Line of Credit –On September 20, 2011, MTI Instruments entered into a working capital line of credit with First Niagara Bank, N.A. Pursuant to the Demand Grid Note, MTI Instruments may borrow from time to time up to $400 thousand to support its working capital needs. The note is payable upon demand, and the saleinterest rate on the note is equal to the prime rate with a floor of 9,428,571 shares4.0% per annum. The note is secured by a lien on all of Micro Common Stockthe assets of MTI Instruments and Warrantsis guaranteed by the Company. The line of credit is subject to purchase 1,885,714 sharesa review date of Micro Common StockJune 30, 2012. Under the line of credit, MTI Instruments is required to Counter Point. Subsequent Closings may occur thereafter at MTI Micro’s sole discretionhold a line balance of $0 for 30 consecutive days out during the Closing Periods upon deliveryeach consecutive year. As of written notice by MTI Micro to Counter Point of its desire to consummate a Closing, and Counter Point’s acceptance of such offerDecember 31, 2011, there were no amounts outstanding under the Purchase Agreement on the terms agreed upon with MTI Micro. In the event the terms and conditionsline of the Purchase Agreement no longer reflect current market conditions or otherwise, either party may elect not to participate in a Subsequent Closing(s) or the parties may amend the Purchase Agreement on mutually agreeable terms with respect to such Subsequent Closing(s). If MTI Micro were to issue and sell the remainder of the 28,571,429 shares under the Purchase Agreement, the Company would continue to hold an aggregate of 55.8% of the fully-diluted capital stock of MTI Micro.
In order to conserve cash and extend operations while we pursue any additional necessary financing, we would be required to reduce operating expenses. There is no assurance that funds raised in any such a financing will be sufficient, that the financing will be available on terms favorable to us or to existing stockholders and at such times as required, or that we will be able to obtain the additional financing required for the continued operation and growth of our business. During the last sixteen months, MTI Micro has raised $3.1 million in external debt and equity financing. If we raise additional funds by issuing equity securities, MTI Micro’s stockholders will experience further dilution. Additional debt financing, if available, may involve restrictive covenants. Any debt financing or additional equity financing may contain terms that are not favorable to us or our stockholders. If we raise additional funds through collaboration and licensing arrangements with third parties, it may be necessary to relinquish some rights to our technologies or our products, or grant licenses on terms that are not favorable to us. If we are unable to raise adequate funds, we may have to liquidate some or all of our assets or delay, reduce the scope of or eliminate some or all of our research and development programs, or discontinue our portable power source business. Without other resources, management currently believes it will need to make significant changes to its operations during April 2010.
Results of Operations for the Year Ended December 31, 20092011 Compared to December 31, 2008.2010.
Test and Measurement Instrumentation Segment
Product Revenue:Product revenue in our test and measurement instrumentation business rose slightly from $6.22segment for the year ended December 31, 2011 increased by $3.1 million, or 43.2%, to $10.3 million in 2008 to $6.262011 from $7.2 million in 2009; an2010. This increase of less than 1%.in product revenue was due to a $2.6 million rise in new aviation balancing equipment sales and higher capacitance product sales. These product revenue increases were partially offset by a decline in wafer metrology tool shipments. As with the prior year, the U.S.US Air Force remainedwas the toplargest customer for the segment,segment; accounting for 19.0%$2.3 million, or 22.4%, of the total year product revenue, as compared to $1.6 million, or 22.3%, of the total product revenue in 2009 and 15.6% in 2008. In addition, during 2009, a single U.S. based2010. The segment’s largest commercial customer in 2011 was a Southeast Asian distributor, who accounted for 9.9%$1.1 million, or 10.7%, of the total product revenue, versus 2008 whenas compared to the largest commercial customer in the prior year who was a single Japanese based commercialChinese distributor, who accounted for 13.9%$560 thousand, or 7.8%, of the total product revenue.revenue in 2010.
Information regarding government contracts included in product revenue is as follows:
| (Dollars in thousands) | Revenue | Total Contract | |||||||||||||
| Year Ended | Revenue | Orders Received | |||||||||||||
| December 31, | Contract to Date | to Date | |||||||||||||
| Contract(1) | Expiration | 2008 | 2009 | Dec. 31, 2009 | Dec. 31, 2009 | ||||||||||
| $2.3 million Air Force New PBS-4100 Systems | 07/28/2010 | (2) | $ | — | $ | 513 | $ | 2,109 | $ | 2,109 | |||||
| $8.8 million Air Force Retrofit and Maintenance of PBS-4100 Systems | 06/19/2008 | (3) | $ | 594 | $ | 50 | $ | 8,009 | $ | 8,009 | |||||
| $6.5 million Air Force Retrofit and Maintenance of PBS-4100 Systems | 09/27/2014 | (4) | $ | — | $ | 439 | $ | 439 | $ | 439 | |||||
| (Dollars in thousands) | Revenues for the | Total Contract | ||||||||||||
| Twelve Months Ended | Revenue | Orders Received | ||||||||||||
| December 31, | Contract to Date | to Date | ||||||||||||
| Contract(1) | Expiration | 2011 | 2010 | December 31, 2011 | December 31, 2011 | |||||||||
| $2.3 million Air Force New PBS-4100 Systems | 07/28/2010 | (2) | $ | — | $ | 57 | $ | 2,166 | $ | 2,166 | ||||
| $6.5 million Air Force Retrofit and Maintenance of PBS-4100 Systems | 09/27/2014 | (3) | $ | 1,080 | $ | 1,386 | $ | 2,905 | $ | 2,936 | ||||
| $4.1 million Air Force New PBS-4100 Systems | 08/29/2015 | (4) | $ | 684 | $ | — | $ | 684 | $ | 684 | ||||
| (1) | Contract values represent maximum potential values and may not be representative of actual results. | |
| (2) | Date represents expiration of contract after all three annual option extensions. | |
| (3) | Date represents expiration of contract, including all four potential option extensions. | |
| (4) | Date represents expiration of contract, including all four potential option extensions. |
Cost of Product Revenue:Cost of product revenue in our test and measurement instrumentation segment for the year ended December 31, 2011 increased by $851 thousand, or 29.1%, to $3.8 million in 2011 from $2.9 million in 2010 in conjunction with the aforementioned 43.2% increase in product revenue. Gross profit, as a percentage of product revenue, increased to 63.2%, compared to 59.2% for the same period in 2010 due to reductions in material component costs and warranty repairs.
Unfunded Research and Product Development Expenses: Unfunded research and product development expenses in our test and measurement instrumentation segment for the year ended December 31, 2011 increased by $284 thousand, or 29.6%, to $1.2 million in 2011 from $959 thousand in 2010. This increase is attributable to higher material spending on current development projects throughout the year, along with additional personnel costs in the segment’s engineering department.
Selling, General and Administrative Expenses:Selling, general and administrative expenses in our test and measurement instrumentation segment for the year ended December 31, 2011 increased by $322 thousand, or 16.2%, to $2.3 million in 2011 from $2.0 million in 2010. This increase is the result of additional staffing in the segment’s sales and business development departments along with higher consultant costs.
New Energy Segment
Funded Research and Development Revenue:Funded research and development revenue in our new energy segment for the year ended December 31, 2011 decreased $1.2 million, or 99.0%, to $13 thousand in 2011 from $1.2 million in 2010. The decrease in funded research and development revenue was primarily the result of the work performed under the DOE and NYSERDA contracts being substantially completed in 2010 for the commercialization of our fuel cell product. Final billings for these grants occurred in the first quarter of 2011, and no further grants have been received.
Information regarding government contracts included in funded research and development revenue is as follows:
| (Dollars in thousands) | Revenue for the Year | Revenue for the Year | ||||||||
| Ended | Ended | Revenue | ||||||||
| Contract | Expiration(1) | December 31, 2011 | December 31, 2010 | Contract to Date | ||||||
| $2.99 million DOE(2) | 03/31/11 | $ | 7 | $ | 944 | $ | 2,994 | |||
| $296 thousand NYSERDA | 12/31/10 | 6 | 290 | 296 | ||||||
| Total | $ | 13 | $ | 1,234 | $ | 3,290 | ||||
| (1) | Dates represent expiration of contract, not date of final billing. | |
| (2) | The DOE contract was initially awarded for $2.4 million, effective for January 2009 through March 31, 2010. An extension to this was granted in April 2010, increasing total funding to $2.99 million and an expiration date of 3/31/2011. The DOE contract was a cost share contract. |
Funded Research and Product Development Expenses: Funded research and product development expenses in our new energy segment for the year ended December 31, 2011 decreased by $2.5 million, or 99.0%, to $25 thousand in 2011 from $2.5 million in 2010. This decrease is a result of the majority of the work being performed in 2010 for the DOE and NYSERDA contracts, whose contracts concluded in the first quarter of 2011, as discussed in funded research and development revenue above.
Unfunded Research and Product Development Expenses: Unfunded research and product development in our new energy segment for the year ended December 31, 2011 decreased by $160 thousand, or 44.7%, to $199 thousand in 2011 from $358 thousand in 2010. This decrease from the prior year was due to staff reductions and substantial cut backs in external development spending throughout 2011.
Selling, General and Administrative Expenses:Selling, general and administrative expenses in our new energy segment for the year ended December 31, 2011 decreased by $957 thousand, or 49.1%, to $993 thousand in 2011 from $1.9 million in 2010. This decrease was primarily the result of a significant decrease in personnel costs and benefits of $2.1 million, a reduction in rent and other facility costs of $256 thousand, travel expense reductions of $28 thousand, depreciation expense reductions of $174 thousand and a reduction in China operations of $81 thousand for the year. These reductions in expense were offset by a reduction in the allocation of costs to research and development of $1.7 million.
Results of Consolidated Operations
Operating Income (Loss): Operating income for the year ended December 31, 2011 was $52 thousand compared to an operating loss of $3.4 million for the year ended December 31, 2010. This decrease in operating loss was a result of the factors noted above.
Gain (loss) on Derivatives: We recorded a gain on derivative accounting of $73 thousand for the year ended December 31, 2011 and a loss of $3 thousand on derivative accounting for the year ended December 31, 2010. Both the 2011 gain and 2010 loss are the result of derivative treatment of the freestanding warrants issued to investors in conjunction with our December 2006 capital raise. These warrants expired on December 19, 2011.
Income Tax Benefit (Expense): Income tax benefit for the year ended December 3, 2011 was $1.5 million compared to income tax expense of $4 thousand for the same period in 2010. Our income tax rate for the years ended December 31, 2011 and 2010 was 1,548% and 0%, respectively. The 2011 tax rate was primarily the result of the reversal of a portion of the valuation allowance toreflect the portion of the Company’s deferred tax asset that management has estimated is more likely than not to be realized. The 2010 tax rate was primarily the result of losses generated by operations, changes in the valuation allowance, state true-ups upon tax return filings, and permanent deductible differences for the derivative valuation. The valuation allowance against our deferred tax assets at December 31, 2011 and at December 31, 2010 was $19.8 million and $27.8 million, respectively.
Net Losses Attributed to Non-Controlling Interests (of MTI Micro): The net loss attributed to non-controlling interests for the year ended December 31, 2011 decreased by $900 thousand, or 55.0%, to $738 thousand in 2011 from $1.6 million in 2010. This is the result of a decrease in the net loss of MTI Micro from $3.6 million in 2010 to $1.5 million in 2011, offset in part, by an increase in the percentage of ownership of the non-controlling interest of MTI Micro in 2011.
Net Income (Loss):Net income for the year ended December 31, 2011 was $2.4 million compared to a net loss of $1.8 million for the same period in 2010. The increase in net income of $4.1 million for the year ended December 31, 2011 as compared to the same period in 2010 is primarily attributed to the reversal of a portion of the deferred tax asset’s valuation reserve of $1.5 million, representing the portion of the Company’s deferred tax asset that management has estimated is more likely than not to be realized, an increase of MTI Instruments yearly net income of $1.6 million, a reduction of the yearly net loss of MTI Micro of $2.2 million, and a reduction in the net loss attributed to non-controlling interests of $900 thousand. These are a result of the factors discussed above.
Results of Operations for the Year Ended December 31, 2010 Compared to December 31, 2009.
Test and Measurement Instrumentation Segment
Product Revenue:Product revenue in our test and measurement instrumentation segment for the year ended December 31, 2010 increased by $915 thousand, or 14.6%, in comparison to 2009, to $7.2 million. As with the prior year, the US Air Force was the top customer for the segment; accounting for $1.6 million, or 22.0%, of the total year revenue, as compared to $1.2 million, or 19.0%, of the total revenue in 2009. The segment’s top commercial customer in 2010 accounted for $560 thousand, or 7.8%, of the annual revenue, as compared to the top commercial customer last year accounting for $618 thousand, or 9.9%, of the total 2009 revenue.
Information regarding government contracts included in product revenue is as follows:
| (Dollars in thousands) | Revenues for the | Total Contract | |||||||||||||
| Twelve Months Ended | Revenue | Orders Received | |||||||||||||
| December 31, | Contract to Date | to Date | |||||||||||||
| Contract(1) | Expiration | 2010 | 2009 | December 31, 2010 | December 31, 2010 | ||||||||||
| $2.3 million Air Force New PBS-4100 Systems | 07/28/2010 | (2) | $ | 57 | $ | 513 | $ | 2,166 | $ | 2,166 | |||||
| $8.8 million Air Force Retrofit and Maintenance of PBS-4100 Systems | 06/19/2008 | (3) | $ | — | $ | 50 | $ | 8,009 | $ | 8,009 | |||||
| $6.5 million Air Force Retrofit and Maintenance of PBS-4100 Systems | 09/27/2014 | (4) | $ | 1,386 | $ | 439 | $ | 1,825 | $ | 1,828 | |||||
| (1) | Contract values represent maximum potential values and may not be representative of actual results. | |
| (2) | Date represents expiration of contract, including all three potential option extensions. | |
| (3) | The contract expiration date has | |
| (4) | Date represents expiration of contract, including all four potential option extensions. |
Cost of Product Revenue:Cost of product revenue in our test and measurement instrumentation segment for the year ended December 31, 2010 increased in comparison to 2009 by $265 thousand, or 9.9%, to $2.9 million in conjunction with the aforementioned 14.6% increase in product revenue. Gross profit, as a percentage of product revenue, rose two points to 59% in 2010 due to a reduction in expense for potentially obsolete and slow-moving inventory.
Unfunded Research and Product Development Expenses: Unfunded research and product development expenses in our test and measurement segment for the year ended December 31, 2010 decreased by $6 thousand, or 0.6%, to $959 thousand from $965 thousand in 2009. This decrease is attributable to lower personnel costs in the segment’s engineering department during the year, which were partially offset by increases in material spending for new product development and existing product support.
Selling, General and Administrative Expenses:Selling, general and administrative expenses in our test and measurement segment increased for the year ended December 31, 2010 by $162 thousand, or 8.2%, to $1.98 million from $1.82 million for 2009. This increase is primarily the result of additional staffing in the segment’s sales and business development departments.
New Energy Segment
Funded Research and Development Revenue:Funded research and development revenue in our new energy segment increaseddecreased by $890$810 thousand, or 77%40%, to $1.23 million for the year ended December 31, 2010 from $2.04 million for the year ended December 31, 2009 from $1.15 million for the year ended December 31, 2008.2009. The increasedecrease in revenue was primarily the result of the full year of recognitionresearch and development performed under the new DOE contract awarded in 2009 for the commercialization of our fuel cell product, and an increasewhile billing in 2010 has been substantially less as we entered into the market test phase of the commercialization.
Information regarding our cost reimbursement rates, whilecontracts included in 2008, the DOE contract was forfunded research and development costs.
| (Dollars in thousands) | Revenue Year Ended | Revenue Year Ended | Revenue | ||||||||
| Contract | Expiration | December 31, 2008 | December 31, 2009 | Contract to Date | |||||||
| $3.0 million DOE(2) | 03/31/09 | $ | 1,154 | $ | -0- | $ | 3,000 | ||||
| $2.4 million DOE(3) | 03/31/10 | -0- | 2,043 | 2,043 | |||||||
| Total | $ | 1,154 | $ | 2,043 | $ | 5,043 | |||||
| (Dollars in thousands) | Revenue for the Year | Revenue for the Year | |||||||||
| Ended | Ended | Revenue | |||||||||
| Contract | Expiration(1) | December 31, 2010 | December 31, 2009 | Contract to Date | |||||||
| $2.99 million DOE(2) | 03/31/11 | $ | 944 | $ | 2,043 | $ | 2,987 | ||||
| $296 thousand NYSERDA | 12/31/10 | 290 | — | 290 | |||||||
| Total | $ | 1,234 | $ | 2,043 | $ | 3,277 | |||||
| (1) | Dates represent expiration of contract, not date of final billing. | |
| (2) | The DOE contract was | |
| 3/31/2011. The DOE contract is a cost share contract. |
Cost ofFunded Research and Product Revenue: Development Expenses:Cost of Funded research and product revenuedevelopment expenses in our test and measurement instrumentation business decreased by $516,000, or 16.2%, to $2.7 million during the year ended December 31, 2009 from $3.2 millionnew energy segment for the year ended December 31, 2008. As2010 decreased by $1.56 million or 38% to $2.54 million from $4.1 million in 2009. This is a percentageresult of product revenue, the annual costmajority of product revenue decreased eight percentage points (43%the work being performed in 2009 compared to 51%for the DOE contract, as discussed in 2008). Margin improvements were attributed to a $406,000 (33%) decrease in manufacturing overhead costsfunded research and a $322,000 decrease in the annual inventory reserve expense. These were partially offset by a one percentage point drop in product margins due to the 2009 product mix.development revenue above.
Unfunded Research and Product Development Expenses: Unfunded research and product development decreased by $4.5 million, or 76%, to $1.3 million in 2009. Of this, theour new energy segment decreased by $3.8 million and$26 thousand, or 7%, to $358 thousand for the test and measurement instrumentation segment decreased by $685 thousandyear ended December 31, 2010 compared to 2009. This decrease from the prior year was due to staff reductions and substantial cut backs in external development spending.
Selling, General and Administrative Expenses:Selling, general and administrative expenses decreased by $5.1 million, or 40%, to $3.3 millionin our new energy segment for the year ended December 31, 20092010 increased by $1.85 million, or 1,758%, to $1.95 million in 2010 from $8.4 million for the year ended December 31, 2008.$105 thousand in 2009. This decreaseincrease was primarily the result of (a) a $1.5 million overall decrease in payroll costs duestock option expense on MTI and MTI Micro Options awarded to staff reductions in 2008, with a full year impactemployees increasing from $428 thousand in 2009 offset slightly by an increaseto $1.4 million in salary allocated to funded research2010 and development (b) $568,000 in corresponding decreases in benefit related costs, bonuses and commissions (c) a $715,000 decrease in stock compensation related expenses (d) a $531,000 decrease in legal fees (e) a $329,000 decrease in travel expenditures (f) a decrease in $300,000 for outside consultantsthe allocation of costs to research and audit fees and (g) the decreases in general operating expenses representing management efforts to reduce expenditures due to decreases in funding sources.development.
Results of Consolidated Operations
Operating Loss:Operating loss for the year ended December 31, 20092010 compared with the operating loss for the year ended December 31, 2008 decreased2009 increased by $9.35 million$305 thousand to $3.1$3.4 million, a 76% decrease,10% increase, as a result of the factors noted above.
Gain (loss) on Derivatives: We recorded a loss on derivative accounting of $29$3 thousand for the year ended December 31, 20092010 and a gainloss of $655$29 thousand on derivative accounting for the year ended December 31, 2008.2009. Both the 20092010 loss and 2008 gain2009 loss are the result of derivative treatment of the freestanding warrants issued to investors in conjunction with our December 2006 capital raise.
Income Tax (Expense) Benefit: Income tax benefit went from a benefit of $208 thousand in 2009 to an expense of $4 thousand for 2010. This is primarily the result of a reversal of an uncertain tax position in 2009 of $194 thousand that was recorded in 2008 and settled in 2009. Our income tax rate for the year ended December 31, 2010 was 0%, while the income tax rate for the year ended December 31, 2009 was 6%, while the income tax rate for the year ended December 31, 2008 was (19%). These tax rates were primarily the result of losses generated by operations, changes in the valuation allowance, state true-ups upon tax return filings, and permanent deductible differences for the derivative valuation, and disproportionate effects of reclassification of gains on Plug Power security sales included in operating loss.valuation.
The valuation allowance against our deferred tax assets at December 31, 20092010 was $26.4$27.8 million and at December 31, 20082009 was $27.9$26.4 million. We determined that it was more likely than not that the ultimate recognition of certain deferred tax assets would not be realized.
Results of OperationsNet Losses Attributed to Non-Controlling Interests (of MTI Micro): The net loss attributed to non-controlling interests increased from $265 thousand for the Year Ended December 31, 2008 Compared2009 to December 31, 2007.
| (Dollars in thousands) | Revenue | Total Contract | |||||||||||||
| Year Ended | Revenue | Orders Received | |||||||||||||
| December 31, | Contract to Date | to Date | |||||||||||||
| Contract(1) | Expiration | 2007 | 2008 | Dec. 31, 2008 | Dec. 31, 2008 | ||||||||||
| $2.3 million Air Force New PBS-4100 Systems | 07/28/2010 | (2) | $ | 1,596 | $ | 0 | $ | 1,596 | $ | 1,881 | |||||
| $8.8 million Air Force Retrofit and Maintenance | |||||||||||||||
| of PBS-4100 Systems | 06/19/2008 | (3) | $ | 738 | $ | 594 | $ | 7,959 | $ | 7,959 | |||||
| (Dollars in thousands) | Revenue | ||||||||||
| Revenue Year Ended | Revenue Year Ended | Contract to Date | |||||||||
| Contract | Expiration( | December 31, 2007 | December 31, 2008 | Dec. 31, 2008 | |||||||
| $3.0 million DOE(2) | 03/31/09 | $ | 675 | $ | 1,154 | $ | 3,000 | ||||
| $1.0 million Samsung(3) | 07/31/07 | 448 | 875 | ||||||||
| $418,000 SAFT(4) | 12/31/06 | 418 | 418 | ||||||||
| $15,000 NCMS(5) | 06/30/07 | 15 | 15 | ||||||||
| Total | $ | 1,556 | $ | 1,154 | $ | 4,308 | |||||
Unfunded Research and Product Development Expenses:Net Income (Loss): Unfunded research and product development expenses decreased $4.0 million, or 41%, to $5.9 million for the year ended December 31, 2008 from $9.9 million for the year ended December 31, 2007. This decrease is attributable to three factors (a) a $0.5 million decrease in development costs that were related to the DOE contract that was in effect for the entire year, which relates to the increase in funded research and product development expenses, (b) the maturity of development of our principle product for the new energy business line and (c) continued cost reductions by management due to decreases in funding.
Liquidity and Capital Resources
Several key indicators of our liquidity are summarized in the following table:
| (Dollars in thousands) | Years ended December 31, | |||||||||||
| 2011 | 2010 | 2009 | ||||||||||
| Cash and cash equivalents | $ | 1,669 | $ | 1,118 | $ | 785 | ||||||
| Working capital | 3,142 | 1,534 | 1,163 | |||||||||
| Net income (loss) attributed to MTI | 2,386 | (1,758 | ) | (3,099 | ) | |||||||
| Net cash provided by (used in) operating activities | 67 | (1,506 | ) | (2,170 | ) | |||||||
| Purchase of property, plant and equipment | (175 | ) | (47 | ) | (7 | ) | ||||||
The Company has historically incurred significant losses, the majority stemming from the direct methanol fuel cell product development and commercialization programs of MTI Micro, and had a consolidated accumulated deficit of $120.1 million as of December 31, 2011. During 2011, the Company generated net income attributed to MTI of $2.4 million and had working capital at December 31, 2011 of $3.1 million, a $1.6 million increase from $1.5 million at December 31, 2010. This increase was primarily attributed to the reversal of a portion of the deferred tax asset’s valuation reserve of $1.5 million, representing the portion of the Company’s deferred tax asset that management has estimated is more likely than not to be realized, the improved result of operations for MTI Instruments, a continued hold on expenses, and capital raised through the issuance of MTI Micro stock. The Company had an operating cash surplus of $67 thousand in 2011 and currently has no debt. While it cannot be assured, management believes that MTI Instruments will continue to generate positive cash flows and be able to fund the Company’s operations for at least the next twelve months.
Although MTI Micro continues to believe in the potential of its Mobion® based power solutions, operations have been suspended at MTI Micro until such time as market demand and other deciding factors, including obtaining additional external financing, the successful completion of customer trials, a new development program with a government agency, and/or a customer order, come to fruition. MTI Micro had cash and cash equivalents as of December 31, 2011 of $110 thousand. Currently, MTI Micro has no employees and projects to spend between $5 and $10 thousand per month for operating activities including rent, preparing prototypes for customer demonstrations, minimal sales efforts, patent fees to keep its patent portfolio current and minimal consultant costs to perform these initiatives. MTI Micro will continue to seek additional capital from external sources to resume operations and fund future development, if any. If MTI Micro is unable to secure additional financing, a new development program or customer order, the MTI Micro board of directors will assess other options for MTI Micro, including the sale of MTI Micro’s intellectual property portfolio and other assets.
During the year ended December 31, 2011, cash provided by operating lossactivities was $67 thousand, consisting of net income of $1.6 million, non-cash expenses of $(617) thousand (primarily including $307 thousand for depreciation, $661 thousand for stock based compensation, and a $(1.5) million income tax benefit), and other changes in operating assets and liabilities of $(964) thousand (primarily due to the increase in accounts receivable at year end). Cash used by investing activities for the year ended December 31, 2007 decreased2011 was $163 thousand, comprised primarily of purchases of property, plant and equipment primarily for MTI Instruments related to computers and laboratory and demo equipment. We had no outstanding commitments for capital expenditures as of December 31, 2011. Cash provided by $0.9 million to $12.5 million, a 7% decrease, as a result of the factors noted above.
As of December 31, 2008,2011, we no longer own any Plug Power common stock.
Line of Credit
On September 20, 2011, MTI Instruments entered into a working capital line of credit with First Niagara Bank, N.A. Pursuant to the Demand Grid Note, MTI Instruments may also seekborrow from time to supplement our resources through additional debt or equity financings, salestime up to $400 thousand to support its working capital needs. The note is payable upon demand, and the interest rate on the note is equal to the prime rate with a floor of 4.0% per annum. The note is secured by a lien on all of the assets (includingof MTI Micro orInstruments and is guaranteed by the Company. The line of credit is subject to a review date of June 30, 2012. Under the line of credit, MTI Instruments), and additional government funding.
Backlog, Inventory and capital raised through the Bridge Note.
At December 31, 2009,2011, the Company’s order backlog was $419$861 thousand, compared to $1.3$2.1 million at December 31, 2008.
Our inventory turnover ratios and average accounts receivable days sales outstanding for the years ended December 31, 20082011 and 20092010 and their changes are as follows:
| Years Ended December 31, | |||||||
| 2008 | 2009 | Change | |||||
| Inventory turnover | 1.5 | 2.0 | 0.5 | ||||
| Average accounts receivable days sales outstanding | 48 | 38 | (10 | ) | |||
| Years Ended December 31, | ||||||
| 2011 | 2010 | Change | ||||
| Inventory turnover | 4.0 | 3.7 | .3 | |||
| Average accounts receivable days sales outstanding | 42 | 42 | — | |||
The positive increase in inventory turnover is driven by a 23% decrease in the average inventory balances increasing 27% on a comparable43% higher annual sales volume in 2008.
The decrease in average accounts receivable days sales outstanding remained consistent in 20092011 compared with 2008 was primarily attributable to our decision to grant our largest commercial customer 90-day payment terms during 2007. This customer accounted for 14% of our total product revenue in 2008. These extended payment terms were eliminated in conjunction with the expiration of our formal distribution agreement in September 2008 and the customer is now back to net 30 payment terms.
Off-Balance Sheet Arrangements
There wereare no off balance sheet arrangements.
Contractual Payment Obligations
We have entered into various agreements with non-cancelable terms that result in contractual payment obligations in future years. These contracts include financing arrangements for current manufacturing, laboratory and office facility lease agreements.agreements as well as purchase commitments for general operations of the Company. The following table summarizes cash payments that we are committed to make under the existing terms of contracts to which we are a party as of December 31, 2009.2011. This table does not include contingencies.
| Less | More | |||||||||||||
| Contractual Payment Obligations | Than 1 | 1-3 | 3-5 | Than 5 | ||||||||||
| (in thousands) | Year | Years | Years | Years | Total | |||||||||
| Operating lease obligations | $ | 27 | $ | 564 | $ | 266 | $ | — | $ | 857 | ||||
| Purchase obligations | 376 | 14 | — | — | 390 | |||||||||
| Total Contractual Payment Obligations | $ | 403 | $ | 578 | $ | 266 | $ | — | $ | 1,247 | ||||
| Less | More | ||||||||||||||
| Contractual Payment Obligations | Than 1 | 1-3 | 3-5 | Than 5 | |||||||||||
| (in thousands) | Year | Years | Years | Years | Total | ||||||||||
| Operating Leases / Total Contractual Payment Obligations | $ | 441 | $ | 828 | $ | 269 | $ | — | $ | 1,538 | |||||
Market Risk
Market risk is the risk that changes in market conditions will adversely affect earnings or cashflow. We categorize our market risks as interest rate risk and credit risk. Immediately below are detailed descriptions of the market risks and explanations as to how each of these risks are managed.
Interest Rate Risk. Interest rate risk is the risk that changes in interest rates could adversely affect earnings or cashflows. The Company’s cash equivalents are sensitive to changes in interest rates. Interest rate changes would result in a change in interest income due to the difference between the current interest rates on cash. Interest rate risk sensitivity analysis is used to measure interest rate risk by computing estimated changes in cashflow as a result of assumed changes in market interest rates. A 10% decrease in 20092011 interest rates would be immaterial to the Company’s consolidated financial statements.
Credit Risk. Credit risk is the risk of loss we would incur if counterparties fail to perform their contractual obligations. Financial instruments that subject the Company to concentrations of credit risk principally consist of cash equivalents, marketable securities, trade accounts receivable and unbilled contract costs.
Our trade accounts receivable and unbilled contract costs and fees are primarily from sales to commercial customers, the U.S. government and state agencies. We do not require collateral and have not historically experienced significant credit losses related to receivablestoreceivables or unbilled contract costs and fees from individual customers or groups of customers in any particular industry or geographic area.
Our deposits are primarily in cash and investments in marketable securities, primarily deposited in commercial banks and investment companies. Credit exposure to any one entity is limited by Company policy.
Critical Accounting Policies and Significant Judgments and Estimates
The following discussion and analysis of our financial condition and results of operations is based upon our consolidated financial statements, which have been prepared in accordance with accounting principles generally accepted in the United States of America. Note 2 toof the consolidated audited financial statementsConsolidated Financial Statements in Part II, Item 8 of this Annual Report on Form 10-K includes a summary of our most significant accounting policies. The preparation of these consolidated financial statements requires usmanagement to make estimates and judgments that affect the reported amounts of assets, liabilities, revenue, and expenses, and related disclosure of assets and liabilities. On an ongoing basis, we evaluate our estimates and judgments, including those related to revenue recognition, inventories, securities available for sale, income taxes, share-based compensation and derivatives. We base our estimates on historical experience and on various other factors that are believed to be reasonable under the circumstances, the results of which form the basis for making judgments about the carrying values of assets and liabilities that are not readily apparent from other sources. Actual results may differ from these estimates under different assumptions or conditions. Periodically, we review our critical accounting estimates with the Audit Committee of our Board of Directors.
The significant accounting policies that we believe are most critical to aid in fully understanding and evaluating our consolidated financial statements include the following:
Revenue Recognition.We recognize product revenue when there is persuasive evidence of an arrangement, delivery of the product to the customer or distributor has occurred, at which time title generally is passed to the customer or distributor, and we have determined that collection of a fixed fee is probable, all of which occur upon shipment of the product. If the product requires installation to be performed by us, all revenue related to the product is deferred and recognized upon the completion of the installation.
We recognize revenue from development contracts based upon the relationship of actual costs to estimated costs to complete the contract. These types of contracts typically provide development services to achieve a specific scientific result relating to direct methanol fuel cell technology. Some of these contracts require us to contribute to the development effort. The customers for these contracts are commercial customers and various state and federal government agencies. While government agencies are providing revenue, we do not expect the government to be a significant end user of the resulting products. Therefore, we do not reduce funded research and product development expense by the funding received. When it appears probable that estimated costs will exceed available funding on fixed price contracts and we are not successful in securing additional funding, we record the estimated additional expense before it is incurred.
We apply accounting guidance on Revenue Recognitionrevenue recognition in the evaluation of commercially funded fuel cell research and prototype agreements to determine when to properly recognize income. Payments received in connection with commercial research and prototype agreements are deferred and recognized on a straight-line basis over the term of the agreement for service-related payments.
Inventory. Inventory is valued at the lower of cost or the current estimated market value of the inventory. We periodically review inventory quantities on hand and record a provision for excess or obsolete inventory based primarily on our estimated forecast of product demand, as well as based on historical usage. Demand and usage for products and materials can fluctuate significantly. A significant decrease in demand for our products could result in a short-term increase in the cost of inventory purchases and an increase of excess inventory quantities on hand. Therefore, although we make every effort to assure the accuracy of our forecasts of future product demand, any significant unanticipated changes in demand could have a significant impact on the value of our inventory and our reported operating results.
Share-Based Payments. We grant options to purchase our common stock and award restricted stock to our employees and directors under our equity incentive plans. The benefits provided under these plans are share-based payments subject to the appropriate accounting provisions regarding Share-Based Payments. Effective January 1, 2006, we use the fair value method of accounting with the modified prospective application, which provides for certain changes to the method for valuing share-based compensation. The valuation provisions apply to new awards and to awards that are outstanding on the effective date and subsequently modified. Under the modified prospective application, prior periods are not revised for comparative purposes. Share-based compensation expense recognized under these accounting methods for the year ended December 31, 20092011 was $0.5 million.$661 thousand. At December 31, 2009,2011, total unrecognized estimated compensation expense related to non-vested awards granted prior to that date was $0.1 million,$104 thousand, which is expected to be recognized over a weighted average period of 1.24.87 years.
We began estimatingestimate the fair value of share-based awards on the date of grant using a Black-Scholes option-pricing model effective January 1, 2006. Prior to this adoption, the value of each share-based award was estimated on the date of grant using the Black-Scholes model for the pro forma information required to be disclosed.model. The determination of the fair value of share-based payment awards on the date of grant using an option-pricing model is affected by our stock price as well as assumptions regarding a number of complex and subjective variables. These variables include our expected stock price volatility over the term of the awards, actual and projected employee stock option exercise behaviors, risk-free interest rate, and expected dividends.
If factors change and we employ different assumptions for the accounting methodology during future periods, the compensation expense that we record may differ significantly from what we have recorded in the current period. Therefore, we believe it is important for investors to be aware of the high degree of subjectivity involved when using option-pricing models to estimate share-based compensation. Option-pricing models were developed for use in estimating the value of traded options that have no vesting or hedging restrictions, are fully transferable and do not cause dilution. Because our share-based payments have characteristics significantly different from those of freely traded options, and because changes in the subjective input assumptions can materially affect our estimates of fair values, in our opinion, existing valuation models, including the Black-Scholes Option Pricing model, may not provide reliable measures of the fair values of our share-based compensation. Consequently, there is a risk that our estimates of the fair values of our share-based compensation awards on the grant dates may bear little resemblance to the intrinsic values realized upon the exercise, expiration, cancellation, or forfeiture of those share-based payments in the future. Certain share-based payments, such as employee stock options, may expire worthless or otherwise result in zero intrinsic value as compared to the fair values originally estimated on the grant date and expensed in our financial statements. Alternatively, value may be realized from these instruments that are significantly in excess of the fair values originally estimated on the grant date and expensed in our financial statements. There currently is neither a market-based mechanism nor other practical application to verify the reliability and accuracy of the estimates stemming from these valuation models, nor a way to compare and adjust the estimates to actual values. Although the fair value of employee share-based awards is determined using a qualified option-pricing model, that value may not be indicative of the fair value observed in a willing buyer/willing seller market transaction. Estimates of share-based compensation expenses are significant to our financial statements, but these expenses are based on the aforementioned option valuation model and will never result in the payment of cash by us.
Theoretical valuation models and market-based methods are evolving and may result in lower or higher fair value estimates for share-based compensation. The timing, readiness, adoption, general acceptance, reliability, and testing of these methods is uncertain. Sophisticated mathematical models may require voluminous historical information, modeling expertise, financial analyses, correlation analyses, integrated software and databases, consulting fees, customization, and testing for adequacy of internal controls.
For purposes of estimating the fair value of stock options granted during the twelve months ended December 31, 20092011 using the Black-Scholes model, we used the historical volatility of our stock for the expected volatility assumption input to the Black-Scholes model, consistent with the proper accounting guidance. The risk-free interest rate is based on the risk-free zero-coupon rate for a period consistent with the expected option term at the time of grant. We do not currently pay nor do we anticipate paying dividends, but we are required to assume a dividend yield as an input to the Black-Scholes model. As such, we use a zero dividend rate. The expected option term is estimated using both historical term measures and projected termination estimates.
Income Taxes. As part of the process of preparing our consolidated financial statements, we are required to estimate ourcalculate income taxes infor each of the jurisdictions in which we operate. This process involves the estimation of ourestimating actual current tax exposuretaxes due together with assessing temporary differences resulting from differing treatment of items for tax and accounting purposes. Included in this assessment is the determination ofpurposes that are recorded as deferred tax assets and liabilities. We periodically evaluate deferred tax assets, net operating loss carry forwards. These differences result in a net deferredcarryforwards and tax asset. We must assess the likelihood thatcredit carryforwards to determine their recoverability based primarily on our deferred tax assets will be recovered fromability to generate future taxable income and, to the extent that we believe that recovery is not likely, we must establish a valuation allowance.income.
Significant management judgment is required in determining our provision for income taxes, our deferred tax assets and liabilities, and any valuation allowance recorded against our net deferred tax assets. We have recordedconsidered all available evidence, both positive and negative, such as historical levels of income and future forecasts of taxable income amongst other items in determining whether a full or partial release of our valuation allowance is required. In addition, our assessment requires us to schedule future taxable income in accordance with accounting standards that address income taxes to assess the appropriateness of a valuation allowance, aswhich further requires the exercise of significant management judgment.
As a result of uncertaintiesour analyses in 2011, we released a portion of our abilityvaluation allowance against our deferred tax assets. The partial release of the valuation allowance caused an incremental tax benefit of $1.5 million to realize certain netbe recognized in the fourth quarter of 2011. For our analysis, we projected our pre-tax earnings utilizing a combination of historical and projected results, taking into consideration existing levels of permanent differences, non-deductible expense and the reversal of significant temporary differences. We need to generate approximately $225 thousand of taxable income in each year over the next twenty years to ensure the realizability of the $1.5 million of deferred tax assets primarily consisting of net operating losses being carried forward.recorded on our balance sheet at December 31, 2011. In the event that actual results differ from these estimates or we adjust these estimates in future periods, we may need to adjust the recorded valuation allowance, which could materially impact our financial position and results of operations. We have recorded a fullThe remaining valuation allowance againstat December 31, 2011 is $19.8 million and relates primarily to net operating losses and stock based compensation. We will continue to evaluate the ability to realize our net deferred tax assets of $26.4 millionand related valuation allowance on a quarterly basis.
Our Federal net operating loss carryforwards as of December 31, 2009.
We account for taxes in accordance with the asset and liability method of accounting standards on Accounting for Uncertainty in Income Taxes were released, which became effective for us beginning in fiscal 2007. This methodology addresses the determination of how tax benefits claimed or expected to be claimed on a tax return should be recorded in the financial statements.income taxes. Under this methodology,method, we must recognize the tax benefit from an uncertain tax position only if it is more likely than not that the tax position will be sustained on examination by the taxing authorities, based on the technical merits of the position. The tax benefits recognized in the financial statements from such a position are measured based on the largest benefit that has a greater than 50% likelihood of being realized upon ultimate resolution. The impact of our reassessment of our tax positions for these standards did not have a material impact on our results of operations, financial condition, or liquidity.
Derivative Instruments. We account for derivative instruments and embedded derivative instruments in accordance with the accounting standard for Accounting for Derivative Instruments and Hedging Activities, as amended. The amended standard requires an entity to recognize all derivatives as either assets or liabilities in the statement of financial position and measure these instruments at fair value. Fair value is estimated using the Black-Scholes Pricing model. We also follow accounting standards for the Accounting for Derivative Financial Instruments Indexed to and Potentially Settled in, a Company’s Own Stock, which requires freestanding contracts that are settled in a company’s own stock, including common stock warrants, to be designated as an equity instrument, asset or a liability. Under these provisions a contract designated as an asset or a liability must be carried at fair value, with any changes in fair value recorded in the results of operations. A contract designated as an equity instrument can be included in equity, with no fair value adjustments required.
The asset/liability derivatives are valued on a quarterly basis using the Black-Scholes Pricing model. Significant assumptions used in the valuation included exercise dates, closing prices for our common stock, volatility of our common stock, and a proxy risk-free interest rate. Gains (losses) on derivatives are included in “Gain (loss) on derivatives” in our consolidated statement of operations.
Effect of Recent Accounting Pronouncements:
A discussion of recently adopted and new accounting but it changed the method of applying the acquisition methodpronouncements is included in a number of significant aspects. The guidance is effective on a prospective basis for all business combinations for which the acquisition date is on or after the beginningNote 2 of the first annual period subsequent to December 15, 2008, with the exception of the accounting for valuation allowances on deferred taxes and acquired tax contingencies. Adjustments made to valuation allowances on deferred taxes and acquired tax contingencies associated with acquisitions that closed prior to the effective date of the policy would also apply the provisionsConsolidated Financial Statements in Part II, Item 8 of this policy. The Company’s adoption of this guidanceAnnual Report on January 1, 2009 did not have a material effect on its financial statements.
Item 7A. Quantitative and Qualitative Disclosures About Market Risk
The Company is exposed to market risk from changes in interest rates and credit risk, which could affect its future results of operations and financial condition. We manage our exposure to these risks through regular operating and financing activities. (See “Market Risk”,See Market Risk, included in Part II, Item 7 above, Management’s Discussion and Analysis of Financial Condition and Results of Operations above.)
Item 8: Financial Statements and Supplementary Data
The financial statements filed herewith are set forth on the Index toCompany’s Consolidated Financial Statements on Pagefiled herewith beginning at page F-1 and are incorporated hereinin this Item 8 by reference.
Selected Quarterly Financial Data
| (Unaudited and in thousands except per share amounts) | Q1 | Q2 | Q3 | Q4 | |||||||||||
| 2011 | |||||||||||||||
| Product revenue | $ | 2,539 | $ | 2,140 | $ | 2,326 | $ | 3,275 | |||||||
| Funded research and development revenue | 13 | — | — | — | |||||||||||
| Gross profit – product revenue | 1,600 | 1,290 | 1,465 | 2,145 | |||||||||||
| Gross loss – funded research and development | (12 | ) | — | — | — | ||||||||||
| Net income (loss) attributed to MTI | $ | 194 | $ | (97 | ) | $ | (101 | ) | $ | 2,390 | |||||
| Net Income (Loss) per Share (Basic and Diluted): | |||||||||||||||
| Net income (loss) per share attributed to MTI | $ | 0.04 | $ | (0.02 | ) | $ | (0.02 | ) | $ | 0.45 | |||||
| Selected Quarterly Financial Data | ||||||||||||||||
| (Unaudited and in thousands except per share amounts) | Q1 | Q2 | Q3 | Q4 | ||||||||||||
| 2008 | ||||||||||||||||
| Product revenue | $ | 1,980 | $ | 1,720 | $ | 1,400 | $ | 1,124 | ||||||||
| Funded research and development revenue | 173 | 309 | 399 | 273 | ||||||||||||
| Gross profit – product revenue | 1,140 | 894 | 565 | 444 | ||||||||||||
| Gross loss – funded research and development | (183 | ) | (325 | ) | (420 | ) | (327 | ) | ||||||||
| Net loss | $ | (3,187 | ) | $ | (3,278 | ) | $ | (4,016 | ) | $ | (2,023 | ) | ||||
| Loss per Share (Basic and Diluted): | ||||||||||||||||
| Net loss | $ | (0.67 | ) | $ | (0.69 | ) | $ | (0.84 | ) | $ | (0.42 | ) | ||||
| 2009 | ||||||||||||||||
| Product revenue | $ | 1,550 | $ | 1,309 | $ | 1,439 | $ | 1,965 | ||||||||
| Funded research and development revenue | 517 | 542 | 526 | 458 | ||||||||||||
| Gross profit – product revenue | 885 | 681 | 855 | 1,177 | ||||||||||||
| Gross loss – funded research and development | (518 | ) | (545 | ) | (528 | ) | (461 | ) | ||||||||
| Net loss | $ | (742 | ) | $ | (946 | ) | $ | (882 | ) | $ | (529 | ) | ||||
| Loss per Share (Basic and Diluted): | ||||||||||||||||
| Net loss | $ | (0.15 | ) | $ | (0.20 | ) | $ | (0.19 | ) | $ | (0.11 | ) | ||||
Selected Quarterly Financial Data
| (Unaudited and in thousands except per share amounts) | Q1 | Q2 | Q3 | Q4 | |||||||||||
| 2010 | |||||||||||||||
| Product revenue | $ | 1,267 | $ | 1,627 | $ | 1,646 | $ | 2,639 | |||||||
| Funded research and development revenue | 357 | 418 | 334 | 125 | |||||||||||
| Gross profit – product revenue | 723 | 901 | 984 | 1,641 | |||||||||||
| Gross loss – funded research and development | (413 | ) | (409 | ) | (203 | ) | (279 | ) | |||||||
| Net (loss) income attributed to MTI | $ | (1,234 | ) | $ | (437 | ) | $ | (366 | ) | $ | 279 | ||||
| Net (Loss) Income per Share (Basic and Diluted): | |||||||||||||||
| Net (loss) income per share attributed to MTI | $ | (.26 | ) | $ | (.09 | ) | $ | (.08 | ) | $ .06 | |||||
As a result of rounding and quarterly calculations, the sum of the quarters may not agree to the year to date results.
Item 9: Changes in and Disagreements with Accountants on Accounting and Financial Disclosure
None.
Item 9A: Controls and Procedures
(a) Evaluation of Disclosure Controls and ProceduresEvaluation of Disclosure Controls and Procedures: Our management, with the participation of our chief executive officer and acting chief financial officer, evaluated the effectiveness of MTI’s disclosure controls and procedures as of December 31, 2009.2011. The term “disclosure controls and procedures,” as defined in Rules 13a-15(e) and 15d-15(e) under the Exchange Act, means controls and other procedures of a company that are designed to ensure that information required to be disclosed by a company in the reports that it files or submits under the Exchange Act is recorded, processed, summarized and reported, within the time periods specified in the SEC’s rules and forms. Disclosure controls and procedures include, without limitation, controls and procedures designed to ensure that information required to be disclosed by a company in the reports that it files or submits under the Exchange Act is accumulated and communicated to the company’s management, including its principal executive and principal financial officers, as appropriate to allow timely decisions regarding required disclosure. We recognize that any controls and procedures, no matter how well designed and operated, can provide only reasonable assurance of achieving their objectives and we necessarily apply our judgment in evaluating the cost-benefit relationship of possible controls and procedures. Based on the valuation of our disclosure controls and procedures as of December 31, 2009,2011, our chief executive officer and acting chief financial officer concluded that, as of such date, our disclosure controls and procedures were effective at the reasonable assurance level.
(b) Management’s Report on Internal Control Over Financial Reporting
Management of our Company is responsible for establishing and maintaining adequate internal control over financial reporting, as that term is defined in Exchange Act Rules 13a-15(f) and 15d-15(f). Our internal control over financial reporting is a process designed to provide reasonable assurance regarding the reliability of financial reporting and the preparation of financial statements for external purposes in accordance with generally accepted accounting principles.
Because of its inherent limitations, internal control over financial reporting may not prevent or detect misstatements. Also, projections of any evaluation of effectiveness to future periods are subject to the risk that controls may become inadequate because of changes in conditions, or that the degree of compliance with the policies or procedures may deteriorate.
Under the supervision and with the participation of our management, including the principal executive officer and principal financial officer, we conducted an evaluation of the effectiveness of our internal control over financial reporting using the criteria set forth in Internal Control—Integrated Framework issued by the Committee of Sponsoring Organizations of the Treadway Commission. We determined that we had a material weakness in our internal control over financial reporting for the year ended December 31, 2008 because of staffing turnover in our finance area and lack of resources necessary to maintain effective controls. The Company has corrected this material weakness by retaining an outside consulting firm to provide controllership and chief financial officer related services. Additionally, on June 18, 2009, the Company appointed an Acting Chief Financial Officer. Based on our evaluation using the criteria set forth in Internal Control—Integrated Framework, Management has concluded that our internal control over financial reporting was effective as of December 31, 2009.2011.
This annual report does not include an attestation report of our registered public accounting firm regarding internal control over financial reporting. Our report was not subject to attestation by our independent registered public accounting firm pursuant to temporary rules of the SEC that permit us to provide only Management’s Report in this annual report.
| /s/ Peng K. Lim | /s/ Frederick W. Jones | ||
| Chief Executive Officer | |||
| (Principal Executive Officer) | (Principal Financial Officer) | ||
(c) Changes in Internal Control over Financial Reporting
There have been no changes in our internal control over financial reporting, as such term is defined in Rules 13a-15(f) and 15d-15(1) under the Exchange Act, during our fiscal quarter ended December 31, 20092011 that have materially affected, or are reasonable likely to materially affect our internal control over financial reporting.
Item 9B: Other Information
No information was required to be disclosed in a current Report on Form 8-K during the fourth quarter of the fiscal year covered by this Annual Report on Form 10-K which has not been reported.
PART III
Item 10: Directors, Executive Officers and Corporate Governance
(a) Directors
Incorporated herein by reference is the information appearing under the captions “Information about our Directors” and “Compliance with Section 16(a) of the Securities Exchange Act of 1934” in our definitive Proxy Statement for our 20102012 Annual Meeting of Stockholders to be filed with the SEC.SEC on or before April 29, 2012.
(b) Executive Officers
Incorporated herein by reference is the information appearing under the captions “Executive Officers” and “Compliance with Section 16(a) of the Securities Exchange Act of 1934” in our definitive Proxy Statement for our 20102012 Annual Meeting of Stockholders to be filed with the SEC.SEC on or before April 29, 2012.
Incorporated herein by reference is the information appearing under the caption “Board of Director Meetings and Committees – Audit Committee” in our definitive Proxy Statement for our 20102012 Annual Meeting of Stockholders to be filed with the SEC.
Code of Ethics: We have adopted a Code of Ethics for employees, officers and directors. The Code of Ethics is intended to comply with Item 406 of Regulation S-K of the Securities Exchange Act of 1934. A copy may be obtained at no charge by written request to the attention of our Secretary at 431 New Karner Road,325 Washington Avenue Extension, Albany, New York 12205. A copy of the Code of Ethics is also available on our website at http://www.mechtech.com.www.mechtech.com under Investor Relations, Corporate Governance.
Item 11: Executive Compensation
Incorporated herein by reference is the information appearing under the caption “Executive Compensation” in the Company’s definitive Proxy Statement for our 20102012 Annual Meeting of Stockholders to be filed with the SEC.
Item 12: Security Ownership of Certain Beneficial Owners and Management and Related Stockholder Matters
Incorporated herein by reference is the information appearing under the caption “Principal Stockholders” in our definitive Proxy Statement for our 20102012 Annual Meeting of Stockholders to be filed with the SEC.
Equity Compensation Plans
As of December 31, 2009,2011, we have three equity compensation plans, each of which was originally approved by our stockholders; the Mechanical Technology, Incorporated 1996 Stock Incentive Plan (the “1996 Plan”)1996 Plan), 1999 Employee Stock Incentive Plan (the “1999 Plan”)1999 Plan) and 2006 Equity Incentive Plan (the “2006 Plan”)2006 Plan). The 2006 planPlan was amended and restated and approved by our Board of Directors in 2011 and 2009. We refer collectively to these as the Plans. See Note 13 toof the Consolidated Financial Statements referred to in Part II, Item 8 of this Annual Report on Form 10-K for a description of these Plans.
The following table presents information regarding these plans:
| Number of Securities Remaining | ||||||||||||
| Available for Future Issuance | ||||||||||||
| Number of Securities To Be | Under | |||||||||||
| Issued Upon Exercise of | Weighted Average Exercise | Equity Compensation Plans | ||||||||||
| Outstanding | Price of Outstanding | (excluding securities reflected in | ||||||||||
| Options, Warrants, Rights(1) | Options, Warrants, Rights | column (a)) | ||||||||||
| Plan Category | (a) | (b) | (c) | |||||||||
| Equity compensation plans | ||||||||||||
| approved by security holders | 438,869 | $23.22 | -0- | |||||||||
| Equity compensation plans | ||||||||||||
| not approved by security holders | 277,534 | 4.51 | 316,216 | |||||||||
| Number of Securities Remaining | |||||||
| Available for Future Issuance | |||||||
| Number of Securities To Be | Under | ||||||
| Issued Upon Exercise of | Weighted Average Exercise | Equity Compensation Plans | |||||
| Outstanding | Price of Outstanding | (excluding securities reflected in | |||||
| Options, Warrants, Rights(1) | Options, Warrants, Rights | column (a)) | |||||
| Plan Category | (a) | (b) | (c) | ||||
| Equity compensation plans | |||||||
| approved by security holders | 348,513 | $ | 21.24 | -0- | |||
| Equity compensation plans | |||||||
| not approved by security holders | 448,924 | 2.28 | 261,601 | ||||
| (1) | Under the 1996, 1999 and 2006 Plans, the securities available under the Plans for issuance and issuable pursuant to exercises of outstanding options may be adjusted in the event of a change in outstanding stock by reason of stock dividend, stock splits, reverse stock splits, etc. |
Item 13: Certain Relationships and Related Transactions, and Director Independence
Incorporated herein by reference is the information appearing under the caption “Certain Relationships and Related Transactions” in our definitive Proxy Statement for the 20102012 Annual Meeting of Stockholders to be filed with the SEC.
Item 14: Principal AccountantAccounting Fees and Services
Incorporated herein by reference is the information appearing under the caption “Independent Accountants” in our definitive Proxy Statement for the 20102012 Annual Meeting of Stockholders to be filed with the Securities and Exchange Commission.
PART IV
Item 15: Exhibits, Financial Statement Schedules
15(a) (1) Financial Statements: The financial statements filed herewith are set forth on the Index to Consolidated Financial Statements on page F-1 of the separate financial section which accompanies this Report, which is incorporated herein by reference.
15(a) (2) Financial Statement Schedules: The following consolidated financial statement scheduleConsolidated Financial Statement Schedule for the years ended December 31, 2007, 2008,2011, 2010, and 2009 is included pursuant to Item 15(d):
Report of Independent Registered Public Accounting Firm on Financial Statements Schedule;
Schedule II - Valuation and Qualifying Accounts.
All other financial statement schedules not listed have been omitted because they are either not required, not applicable, or the information has been included elsewhere in the consolidated financial statements or notes thereto.
15(a) (3) Exhibits: The exhibits listed in the Exhibit Index immediately preceding the exhibitsbelow are filed as part of this Annual Report on Form 10-K.
Exhibit | |||||||
Number | Description | ||||||
| 3.1 | Certificate of Incorporation of the registrant, as amended and | ||||||
| 3.2 | Certificate of Amendment of the Certificate of Incorporation of the | ||||||
| 3.3 | Amended and Restated By-Laws of the registrant | ||||||
| 10.1 | |||||||
| Mechanical Technology, Incorporated 1996 Stock Incentive | |||||||
| Mechanical Technology, Incorporated 1999 Employee Stock Incentive | |||||||
| Lease dated August 10, 1999 between Carl E. Touhey and Mechanical Technology, Inc. | |||||||
| Lease dated April 2, 2001 between Kingfisher, LLC and Mechanical Technology, Inc. | |||||||
| First Amendment to lease dated March 13, 2003 between Kingfisher, LLC and Mechanical Technology, Inc. | |||||||
| Second Amendment to lease dated December 12, 2005 between Kingfisher, LLC and Mechanical Technology, | |||||||
| Employment Agreement dated May 4, 2006 between Peng K. Lim and | |||||||
| Form of Restricted Stock Agreement for the 1996 and 1999 Mechanical Technology, Inc. Stock Incentive | |||||||
| Third Amendment to lease dated August 7, 2006 between Kingfisher, LLC and Mechanical Technology, | |||||||
| 10.10 | |||||||
| Fourth Amendment to lease dated August 6, 2007 between Kingfisher LLC and Mechanical Technology, | |||||||
| Employment Agreement dated April 3, 2006 between James K. Prueitt and MTI MicroFuel Cells Inc | |||||||
| Form of Convertible Note and Warrant Purchase Agreement dated September 18, 2008 | ||||||
| Amended and Restated Employment Agreement dated December 30, 2008 between James K. Prueitt and MTI MicroFuel Cells Inc. | ||||||
| Amended and Restated Employment Agreement dated December 31, 2008 between Peng K. Lim and Mechanical Technology, Inc. | ||||||
| 10.15 | |||||
| Amendment No. 1 to Convertible Note and Warrant Purchase Agreement, Security Agreement and Secured Convertible Promissory Notes and Consent dated February 20, 2009 | |||||
| Letter Agreement dated February 24, 2009 between Peng K. Lim and Mechanical Technology, Inc. | |||||
| Letter Agreement dated February 24, 2009 between James K. Prueitt and MTI MicroFuel Cells Inc. | |||||
| Amendment No. 2 to Convertible Note and Warrant Purchase Agreement, Security Agreement and Secured Convertible Promissory Notes and Consent dated April 15, 2009 | |||||
| Secured Convertible Promissory Note Negotiated Conversion Agreement, dated December 9, 2009, by and among the Company, MTI Micro and the Bridge Investors | |||||
| Form of MTI Micro Common Stock Purchase Warrant | |||||
| Mechanical Technology, Incorporated Amended and Restated 2006 Equity Incentive Plan | |||||
| Fifth Amendment | |||||
| Amendment | |||||
| MTI MicroFuel Cells Inc. 2009 Stock Plan (Incorporated by reference from Exhibit 10.167 of the Company’s Form 10-K Report for the year ended December 31, 2009).* | |||||
| 10.25 | Common Stock and Warrant Purchase Agreement, dated January 11, 2010, by and among MTI MicroFuel Cells Inc. and Counter Point Ventures Fund II, L.P. (Incorporated by reference from Exhibit 10.1 of the Company’s Form 8-K Report filed January 14, 2010). | ||||
| 10.26 | Form of MTI Micro Common Stock Warrant (Incorporated by reference from Exhibit 10.2 of the Company’s Form 8-K Report filed January 14, 2010). | ||||
| 10.27 | Seventh Amendment to Lease Agreement by and between Kingfisher, LLC and Mechanical Technology, Incorporated (Incorporated by reference from Exhibit 10.168 of the Company’s Form 10-Q Report for the quarter ended June 30, 2010). | ||||
| 10.28 | Amendment No. 1, dated February 9, 2011, to the Common Stock and Warrant Purchase Agreement, dated January 11, 2010, by and between MTI MicroFuel Cells Inc. and Counter Point Ventures Fund II, L.P. (Incorporated by reference from Exhibit 10.1 of the Company’s Form 8-K Report filed February 11, 2011). | ||||
| 10.29 | Form of MTI Micro Common Stock Warrant (Incorporated by reference from Exhibit 10.2 of the Company’s Form 8-K Report filed February 11, 2011). | ||||
| 10.30 | Lease Extension and Modification Agreement dated April 19, 2011, between Kingfisher, LLC and MTI MicroFuel Cells, Inc. (Incorporated by reference from Exhibit 10.19 of the Company’s Form 10-Q Report for the quarter ended March 31, 2011). | ||||
| 10.31 | Mechanical Technology, Incorporated Amended and Restated 2006 Equity Incentive Plan (Incorporated by reference from Exhibit 10.1 of the Company’s Form S-8 Registration Statement (File No. 333-175406) filed July 8, 2011).* | ||||
| 10.32 | Form of Restricted Stock Agreement for Mechanical Technology, Incorporated Amended and Restated 2006 Equity Incentive Plan (Incorporated by reference from Exhibit 10.2 of the Company’s Form 8-K Report filed July 11, 2011).* | ||||
| 10.33 | Lease Extension and Modification Agreement II dated July 18, 2011, between Kingfisher, LLC and MTI MicroFuel Cells, Inc. (Incorporated by reference from Exhibit 10.20 of the Company’s Form 10-Q Report for the quarter ended June 30, 2011). | ||||
| 10.34 | Amendment No. 2, dated September 23, 2011, to the Common Stock and Warrant Purchase Agreement, dated January 11, 2010, as amended February 9, 2011, by and between MTI MicroFuel Cells Inc. and Counter Point Ventures Fund II, L.P. (Incorporated by reference from Exhibit 10.1 of the Company’s Form 8-K Report filed September 28, 2011). | ||||
| 10.35 | Supplemental Lease Extension and Modification Agreement dated September 29, 2011, between Kingfisher, LLC and MTI MicroFuel Cells, Inc. (Incorporated by reference from Exhibit 10.1 of the Company’s Form 10-Q Report for the quarter ended September 30, 2011). | ||||
| 10.36 | Demand Grid Note dated September 20, 2011 between MTI Instruments, Inc. and First Niagara Bank, N.A. (Incorporated by reference from Exhibit 10.2 of the Company’s Form 10-Q Report for the quarter ended September 30, 2011). | ||||
| 10.37 | Guaranty Agreement dated September 20, 2011 between Mechanical Technology, Incorporated and First Niagara Bank, N.A. (Incorporated by reference from Exhibit 10.3 of the Company’s Form 10-Q Report for the quarter ended September 30, 2011). | ||||
| 10.38 | Security Agreement dated September 20, 2011 between MTI Instruments, Inc. and First Niagara Bank, N.A. (Incorporated by reference from Exhibit 10.4 of the Company’s Form 10-Q Report for the quarter ended September 30, 2011). | ||||
| 14.1 | Code of | ||||
| 21 | Subsidiaries of the | ||||
| 23.1 | Consent of Independent Registered Public Accounting Firm – PricewaterhouseCoopers LLP. | ||||
| 31.1 | Certification of Chief Executive Officer Pursuant to Section 302 of the Sarbanes-Oxley Act of 2002 | ||||
| 31.2 | Certification of | ||||
| 32.1 | Certification of Chief Executive Officer Pursuant to Section 906 of the Sarbanes-Oxley Act of 2002 | ||||
| 32.2 | Certification of | ||||
All other exhibits for which no other filing information is given are filed herewith:
Signatures
Pursuant to the requirements of Section 13 or 15(d) of the Securities Exchange Act of 1934, the registrant has duly caused this report to be signed on its behalf by the undersigned, thereunto duly authorized.
| MECHANICAL TECHNOLOGY, INCORPORATED | ||||||
| Date: March | By: | /s/ Peng K. Lim | ||||
| Peng K. Lim | ||||||
| Chief Executive Officer | ||||||
Pursuant to the requirements of the Securities Exchange Act of 1934, this report has been signed below by the following persons on behalf of the registrant and in the capacities and on the dates indicated.
| Signature | Title | Date | ||||||
| /s/ Peng K. Lim | Chairman, Chief Executive Officer, | |||||||
| Peng K. Lim | (Principal Executive Officer and Director) | March | ||||||
| /s/ Frederick W. Jones | ||||||||
| Frederick W. Jones | (Principal Financial and Accounting Officer) | March | ||||||
| /s/ Thomas J. Marusak | Director | |||||||
| Thomas J. Marusak | March | |||||||
| /s/ William P. Phelan | Director | |||||||
| William P. Phelan | March | |||||||
| /s/ E. Dennis O’Connor | Director | |||||||
| E. Dennis O’Connor | March | |||||||
| /s/ Walter L. Robb | Director | |||||||
| Dr. Walter L. Robb | March | |||||||
Report of Independent Registered Public Accounting Firm onACCOUNTING FIRM ON FINANCIAL STATEMENT SCHEDULE
To the Board of Directors and Stockholders
of Mechanical Technology, Incorporated:
Our audits of the consolidated financial statements referred to in our report dated March 31, 201027, 2012 appearing on page F-2 of this Form 10-K of Mechanical Technology, Incorporated also included an audit of the financial statement schedule listed in Item 15(a)(2) of this Form 10-K. In our opinion, this financial statement schedule presentspresent fairly, in all material respects, the information set forth therein when read in conjunction with the related consolidated financial statements.
/s/PricewaterhouseCoopers LLP
Albany, New York
March 31, 2010
MECHANICAL TECHNOLOGY, INCORPORATED AND SUBSIDIARIES
VALUATION AND QUALIFYING ACCOUNTS
(DOLLARS IN THOUSANDS)
| Balance at | Additions | ||||||||||||||||
| Beginning of | Additions Charged to | Charged to | Balance at End of | ||||||||||||||
| Description | Period | Costs and Expenses | Other Accounts | Deductions | Period | ||||||||||||
| Allowance for doubtful accounts (accounts receivable) for the years ended: | |||||||||||||||||
| December 31, 2007 | $ | — | $ | — | $ | — | $ | — | $ | — | |||||||
| December 31, 2008 | $ | — | $ | — | $ | — | $ | — | $ | — | |||||||
| December 31, 2009 | $ | — | $ | 92 | $ | — | $ | — | $ | 92 | |||||||
| Valuation allowance for deferred tax assets for the years ended: | |||||||||||||||||
| December 31, 2007 | $ | 18,815 | $ | 3,518 | $ | — | $ | — | $ | 22,333 | |||||||
| December 31, 2008 | $ | 22,333 | $ | 5,547 | $ | — | $ | $ | 27,880 | ||||||||
| December 31, 2009 | $ | 27,880 | $ | (1,495 | ) | $ | $ | $ | 26,385 | ||||||||
| Inventory reserve for the years ended: | |||||||||||||||||
| December 31, 2007 | $ | 150 | $ | 137 | $ | 28 | $ | 133 | $ | 182 | |||||||
| December 31, 2008 | $ | 182 | $ | 446 | $ | (42 | ) | $ | 75 | $ | 511 | ||||||
| December 31, 2009 | $ | 511 | $ | 124 | $ | (48 | ) | $ | 59 | $ | 528 | ||||||
| Balance at | Additions | ||||||||||||||
| Beginning of | Additions Charged to | Charged to | Balance at End of | ||||||||||||
| Description | Period | Costs and Expenses | Other Accounts | Deductions | Period | ||||||||||
| Allowance for doubtful accounts (accounts receivable) for the years ended: | |||||||||||||||
| December 31, 2011 | $ | — | $ | — | $ | — | $ | — | $ | — | |||||
| December 31, 2010 | $ | 92 | $ | — | $ | — | $ | 92 | $ | — | |||||
| December 31, 2009 | $ | — | $ | 92 | $ | — | $ | — | $ | 92 | |||||
MECHANICAL TECHNOLOGY, INCORPORATED AND SUBSIDIARIES
INDEX TO CONSOLIDATED FINANCIAL STATEMENTS
| Page | ||
| Report of Independent Registered Public Accounting Firm | F-2 | |
| Consolidated Financial Statements: | ||
| Balance Sheets as of December 31, | F-3 | |
| Statements of Operations for the Years Ended December 31, | F-4 | |
| Statements of Stockholders’ Equity and Comprehensive | ||
| Years Ended December 31, | F-5 | |
| Statements of Cash Flows for the Years Ended December 31, | F-6 | |
| Notes to Consolidated Financial Statements | F-7 to |
F-1
Report of Independent Registered Public Accounting Firm
To the Board of Directors and Shareholders of
Mechanical Technology, Incorporated:
We have audited the accompanying consolidated balance sheets and the related consolidated statements of operations, shareholders'consolidated statements of stockholder's equity and comprehensive loss,(loss) income, and consolidated statements of cash flows present fairly, in all material respects, the financial position of Mechanical Technology, Incorporated and its subsidiaries atas of December 31, 20092011 and 2008,2010, and the results of their operations and their cash flows for each of the three years in the period ended December 31, 2009 in conformity with accounting principles generally accepted in the United States of America.2011. These financial statements are the responsibility of the Company’s management. Our responsibility is to express an opinion on these financial statements based on our audits.
We conducted our audits of these statements in accordance with the standards of the Public Company Accounting Oversight Board (United(United States). Those standards require that we plan and perform the audit to obtain reasonable assurance about whether the financial statements are free of material misstatement. An audit includes examining, on a test basis, evidence supporting the amounts and disclosures in the financial statements,statements. An audit also includes assessing the accounting principles used and significant estimates made by management, andas well as evaluating the overall financial statement presentation. We believe that our audits provide a reasonable basis for our opinion.
In our opinion, the consolidated financial statements the Company changed the mannerreferred to above present fairly, in which it accounts for noncontrolling interest in 2009.
| /s/ PricewaterhouseCoopers LLP |
| Albany, New York |
| March 27, 2012 |
F-2
MECHANICAL TECHNOLOGY, INCORPORATED AND SUBSIDIARIES
CONSOLIDATED BALANCE SHEETS
December 31, 20082011 and 20092010
| (Dollars in thousands) | December 31, | ||||||
| 2008 | 2009 | ||||||
| Assets | |||||||
| Current Assets: | |||||||
| Cash and cash equivalents | $ | 1,662 | $ | 785 | |||
| Accounts receivable, less allowance for doubtful accounts ($92 in 2009, $-0- in 2008) | 540 | 1,142 | |||||
| Inventories, net | 1,509 | 789 | |||||
| Prepaid expenses and other current assets | 272 | 166 | |||||
| Total Current Assets | 3,983 | 2,882 | |||||
| Property, plant and equipment, net | 1,528 | 859 | |||||
| Total Assets | $ | 5,511 | $ | 3,741 | |||
| Liabilities and Stockholders’ Equity | |||||||
| Current Liabilities: | |||||||
| Accounts payable | $ | 508 | $ | 323 | |||
| Accrued liabilities | 1,648 | 1,290 | |||||
| Deferred revenue | 8 | 16 | |||||
| Bridge note payable – related party, at fair value | 1,544 | — | |||||
| Income taxes payable | 23 | 20 | |||||
| Total Current Liabilities | 3,731 | 1,649 | |||||
| Long-Term Liabilities: | |||||||
| Uncertain tax position liability | 213 | — | |||||
| Derivative liability | 41 | 70 | |||||
| Total Long-Term-Liabilities | 254 | 70 | |||||
| Total Liabilities | 3,985 | 1,719 | |||||
| Stockholders’ Equity: | |||||||
| Common stock, par value $0.01 per share, authorized 75,000,000; | |||||||
| 5,776,750 issued in both 2008 and 2009 | 58 | 58 | |||||
| Paid-in-capital | 132,781 | 133,286 | |||||
| Accumulated deficit | (117,570 | ) | (120,725 | ) | |||
| Common stock in treasury, at cost, 1,005,092 shares in both 2008 and 2009 | (13,754 | ) | (13,754 | ) | |||
| Total MTI stockholders’ equity (deficit) | 1,515 | (1,135 | ) | ||||
| Noncontrolling interest | 11 | 3,157 | |||||
| Total Equity | 1,526 | 2,022 | |||||
| Total Liabilities and Stockholders’ Equity | $ | 5,511 | $ | 3,741 | |||
| (In thousands) | December 31, | |||||||
| 2011 | 2010 | |||||||
| Assets | ||||||||
| Current Assets: | ||||||||
| Cash and cash equivalents | $ | 1,669 | $ | 1,118 | ||||
| Accounts receivable | 1,881 | 1,086 | ||||||
| Inventories | 957 | 844 | ||||||
| Deferred income taxes, net | 20 | — | ||||||
| Prepaid expenses and other current assets | 102 | 128 | ||||||
| Total Current Assets | 4,629 | 3,176 | ||||||
| Deferred income taxes, net | 1,515 | — | ||||||
| Property, plant and equipment, net | 258 | 425 | ||||||
| Total Assets | $ | 6,402 | $ | 3,601 | ||||
| Liabilities and Stockholders’ Equity | ||||||||
| Current Liabilities: | ||||||||
| Accounts payable | $ | 191 | $ | 255 | ||||
| Accrued liabilities | 1,238 | 1,273 | ||||||
| Deferred revenue | 58 | 21 | ||||||
| Derivative liability | — | 73 | ||||||
| Income taxes payable | — | 20 | ||||||
| Total Current Liabilities | 1,487 | 1,642 | ||||||
| Commitments and Contingencies (Note 16) | ||||||||
| Stockholders’ Equity: | ||||||||
| Common stock, par value $0.01 per share, authorized 75,000,000; | ||||||||
| 6,259,975 issued in 2011 and 5,776,750 issued in 2010 | 63 | 58 | ||||||
| Paid-in-capital | 135,389 | 134,733 | ||||||
| Accumulated deficit | (120,097 | ) | (122,483 | ) | ||||
| Common stock in treasury, at cost, 1,005,092 shares in both 2011 and 2010 | (13,754 | ) | (13,754 | ) | ||||
| Total MTI stockholders’ equity (deficit) | 1,601 | (1,446 | ) | |||||
| Non-controlling interest | 3,314 | 3,405 | ||||||
| Total Stockholders’ Equity | 4,915 | 1,959 | ||||||
| Total Liabilities and Stockholders’ Equity | $ | 6,402 | $ | 3,601 | ||||
The accompanying notes are an integral part of the consolidated financial statements.
F-3
MECHANICAL TECHNOLOGY, INCORPORATED AND SUBSIDIARIES
CONSOLIDATED STATEMENTS OF OPERATIONS
For the Years Ended December 31, 2007, 2008,2011, 2010, and 2009
| (Dollars in thousands, except per share) | Years Ended December 31, | ||||||||||
| 2007 | 2008 | 2009 | |||||||||
| Product revenue | $ | 9,028 | $ | 6,224 | $ | 6,263 | |||||
| Funded research and development revenue | 1,556 | 1,154 | 2,043 | ||||||||
| Total revenue | 10,584 | 7,378 | 8,306 | ||||||||
| Operating costs and expenses: | |||||||||||
| Cost of product revenue | 3,430 | 3,181 | 2,665 | ||||||||
| Research and product development expenses: | |||||||||||
| Funded research and product development | 1,891 | 2,409 | 4,095 | ||||||||
| Unfunded research and product development | 9,874 | 5,855 | 1,349 | ||||||||
| Total research and product development expenses | 11,765 | 8,264 | 5,444 | ||||||||
| Selling, general and administrative expenses | 8,738 | 8,369 | 3,284 | ||||||||
| Operating loss | (13,349 | ) | (12,436 | ) | (3,087 | ) | |||||
| Interest expense | — | (44 | ) | (222 | ) | ||||||
| Loss on extinguishment of debt | — | — | (232 | ) | |||||||
| Gain (loss) on derivatives | 2,967 | 655 | (29 | ) | |||||||
| Gain on sale of securities available for sale | 2,549 | 1,018 | — | ||||||||
| Other (expense) income, net | 224 | 47 | (2 | ) | |||||||
| Loss before income taxes and non-controlling interest | (7,609 | ) | (10,760 | ) | (3,572 | ) | |||||
| Income tax benefit (expense) | (2,548 | ) | (2,004 | ) | 208 | ||||||
| Net loss, net of tax | (10,157 | ) | (12,764 | ) | (3,364 | ) | |||||
| Plus: Net loss attributed to noncontrolling interest | 582 | 260 | 265 | ||||||||
| Net loss attributed to MTI | (9,575 | ) | (12,504 | ) | (3,099 | ) | |||||
| Loss per Share (Basic and Diluted): | |||||||||||
| Loss per share (basic and diluted) | $ | (2.01 | ) | $ | (2.62 | ) | $ | (0.65 | ) | ||
| (In thousands, except per share amounts) | Years Ended December 31, | ||||||||||
| 2011 | 2010 | 2009 | |||||||||
| Product revenue | $ | 10,280 | $ | 7,179 | $ | 6,263 | |||||
| Funded research and development revenue | 13 | 1,234 | 2,043 | ||||||||
| Total revenue | 10,293 | 8,413 | 8,306 | ||||||||
| Operating costs and expenses: | |||||||||||
| Cost of product revenue | 3,781 | 2,930 | 2,665 | ||||||||
| Research and product development expenses: | |||||||||||
| Funded research and product development | 25 | 2,538 | 4,095 | ||||||||
| Unfunded research and product development | 1,441 | 1,317 | 1,349 | ||||||||
| Total research and product development expenses | 1,466 | 3,855 | 5,444 | ||||||||
| Selling, general and administrative expenses | 4,994 | 5,020 | 3,284 | ||||||||
| Operating income (loss) | 52 | (3,392 | ) | (3,087 | ) | ||||||
| Interest expense | — | — | (222 | ) | |||||||
| Loss on extinguishment of debt | — | — | (232 | ) | |||||||
| Gain (loss) on derivatives | 73 | (3 | ) | (29 | ) | ||||||
| Other (expense) income, net | (25 | ) | 3 | (2 | ) | ||||||
| Income (loss) before income taxes and non-controlling interest | 100 | (3,392 | ) | (3,572 | ) | ||||||
| Income tax benefit (expense) | 1,548 | (4 | ) | 208 | |||||||
| Net income (loss), net of tax | 1,648 | (3,396 | ) | (3,364 | ) | ||||||
| Plus: Net loss attributed to non-controlling interest | 738 | 1,638 | 265 | ||||||||
| Net income (loss) attributed to MTI | $ | 2,386 | $ | (1,758 | ) | $ | (3,099 | ) | |||
| Net income (loss) per share attributable to MTI (Basic and Diluted) | $ | 0.48 | $ | (0.37 | ) | $ | (0.65 | ) | |||
| Weighted average shares outstanding (Basic and Diluted) | 5,001,934 | 4,771,658 | 4,771,658 | ||||||||
The accompanying notes are an integral part of the consolidated financial statements.
F-4
MECHANICAL TECHNOLOGY, INCORPORATED AND SUBSIDIARIES
CONSOLIDATED STATEMENTS OF STOCKHOLDERS’ EQUITY
AND COMPREHENSIVE LOSS(LOSS) INCOME
For the Years Ended December 31, 2007, 2008,2011, 2010, and 2009
| (Dollars in thousands) | Years Ended December 31, | ||||||||||
| 2007 | 2008 | 2009 | |||||||||
| Common Stock | |||||||||||
| Balance, beginning | $ | 58 | $ | 58 | $ | 58 | |||||
| Balance, ending | $ | 58 | $ | 58 | $ | 58 | |||||
| Paid-In Capital | |||||||||||
| Balance, beginning | $ | 130,968 | $ | 132,065 | $ | 132,781 | |||||
| Issuance of shares – stock options | 60 | — | — | ||||||||
| Stock-based compensation | 1,558 | 844 | 505 | ||||||||
| MTI MicroFuel Cell Investment | (521 | ) | (128 | ) | — | ||||||
| Balance, ending | $ | 132,065 | $ | 132,781 | $ | 133,286 | |||||
| Accumulated Deficit | |||||||||||
| Balance, beginning | $ | (95,385 | ) | $ | (105,066 | ) | $ | (117,570 | ) | ||
| Cumulative effect of adoption of FIN 48 | (106 | ) | — | — | |||||||
| Net loss | (9,575 | ) | (12,504 | ) | (3,099 | ) | |||||
| MTI Micro Warrants issued | — | — | (56 | ) | |||||||
| Balance, ending | $ | (105,066 | ) | $ | (117,570 | ) | $ | (120,725 | ) | ||
| Accumulated Other Comprehensive Income (Loss) | |||||||||||
| Balance, beginning | $ | 984 | $ | 500 | $ | — | |||||
| Change in unrealized (loss) gain on securities available for sale (net of taxes | |||||||||||
| of $0 in 2007, 2008, and 2009) | 68 | — | — | ||||||||
| Less reclassification adjustment for gains included in net income (net of | |||||||||||
| taxes of $2,518 in 2007, $1,971 in 2008 and $-0- in 2009) | (552 | ) | (500 | ) | — | ||||||
| Balance, ending | $ | 500 | $ | — | $ | — | |||||
| Treasury Stock | |||||||||||
| Balance, beginning | $ | (13,754 | ) | $ | (13,754 | ) | $ | (13,754 | ) | ||
| Balance, ending | $ | (13,754 | ) | $ | (13,754 | ) | $ | (13,754 | ) | ||
| Noncontrolling Interest (NCI) | |||||||||||
| Balance, beginning | $ | 205 | $ | 143 | $ | 11 | |||||
| Net loss attributed to NCI | (582 | ) | (260 | ) | (265 | ) | |||||
| Equity contribution | 520 | 128 | 3,411 | ||||||||
| Balance, ending | $ | 143 | $ | 11 | $ | 3,157 | |||||
| Total Stockholders’ Equity | |||||||||||
| Balance, ending | $ | 13,946 | $ | 1,526 | $ | 2,022 | |||||
| Total Comprehensive Loss | |||||||||||
| Net Loss | $ | (9,575 | ) | $ | (12,504 | ) | $ | (3,099 | ) | ||
| Other comprehensive loss: | |||||||||||
| Reclassification adjustment for gains included in net income, net of taxes | (552 | ) | (500 | ) | — | ||||||
| Change in unrealized (loss) gain on securities available for sale, net of taxes | 68 | — | — | ||||||||
| Total comprehensive loss | $ | (10,059 | ) | (13,004 | ) | (3,099 | ) | ||||
| Common Stock | Treasury Stock | |||||||||||||||||||||||||||||
| Total | Total | |||||||||||||||||||||||||||||
| Additional Paid- | Accumulated | Non-Controlling | Stockholders' | Comprehensive | ||||||||||||||||||||||||||
| (Dollars in thousands) | Shares | Amount | in-Capital | Deficit | Shares | Amount | Interest (NCI) | Equity | Loss | |||||||||||||||||||||
| December 31, 2008 | 5,776,750 | $ | 58 | $ | 132,781 | $ | (117,570 | ) | 1,005,092 | $ | (13,754 | ) | $ | 11 | $ | 1,526 | ||||||||||||||
| Net loss | - | - | - | (3,099 | ) | - | - | - | (3,099 | ) | (3,099 | ) | ||||||||||||||||||
| Total comprehensive loss | $ | (3,099 | ) | |||||||||||||||||||||||||||
| Stock based compensation | - | - | 505 | - | - | - | - | 505 | ||||||||||||||||||||||
| MTI Micro warrants issued | - | - | - | (56 | ) | - | - | - | (56 | ) | ||||||||||||||||||||
| Net loss attributed to NCI | - | - | - | - | - | - | (265 | ) | (265 | ) | ||||||||||||||||||||
| Equity contribution to NCI | - | - | - | - | - | - | 3,411 | 3,411 | ||||||||||||||||||||||
| December 31, 2009 | 5,776,750 | $ | 58 | $ | 133,286 | $ | (120,725 | ) | 1,005,092 | $ | (13,754 | ) | $ | 3,157 | $ | 2,022 | ||||||||||||||
| Net loss | - | - | - | (1,758 | ) | - | - | - | (1,758 | ) | (1,758 | ) | ||||||||||||||||||
| Total comprehensive loss | $ | (1,758 | ) | |||||||||||||||||||||||||||
| Stock based compensation | - | - | 1,447 | - | - | - | - | 1,447 | ||||||||||||||||||||||
| Net loss attributed to NCI | - | - | - | - | - | - | (1,638 | ) | (1,638 | ) | ||||||||||||||||||||
| Equity contribution to NCI | - | - | - | - | - | - | 1,886 | 1,886 | ||||||||||||||||||||||
| December 31, 2010 | 5,776,750 | $ | 58 | $ | 134,733 | $ | (122,483 | ) | 1,005,092 | $ | (13,754 | ) | $ | 3,405 | $ | 1,959 | ||||||||||||||
| Net income | - | - | - | 2,386 | - | - | - | 2,386 | 2,386 | |||||||||||||||||||||
| Total comprehensive income | $ | 2,386 | ||||||||||||||||||||||||||||
| Stock based compensation | - | - | 656 | - | - | - | - | 656 | ||||||||||||||||||||||
| Issuance of shares – restricted stock | 483,225 | 5 | - | - | - | - | - | 5 | ||||||||||||||||||||||
| Net loss attributed to NCI | - | - | - | - | - | - | (738 | ) | (738 | ) | ||||||||||||||||||||
| Equity contribution to NCI | - | - | - | - | - | - | 647 | 647 | ||||||||||||||||||||||
| December 31, 2011 | 6,259,975 | $ | 63 | $ | 135,389 | $ | (120,097 | ) | 1,005,092 | $ | (13,754 | ) | $ | 3,314 | $ | 4,915 | ||||||||||||||
The accompanying notes are an integral part of the consolidated financial statements.
F-5
MECHANICAL TECHNOLOGY, INCORPORATED AND SUBSIDIARIES
CONSOLIDATED STATEMENTS OF CASH FLOWS
For the Years Ended December 31, 2007, 2008,2011, 2010, and 2009
| (Dollars in thousands) | Years Ended December 31, | ||||||||||
| 2007 | 2008 | 2009 | |||||||||
| Operating Activities | |||||||||||
| Net (loss) | $ | (10,157 | ) | $ | (12,764 | ) | $ | (3,364 | ) | ||
| Adjustments to reconcile net loss to net cash used by operating activities: | |||||||||||
| (Gain) loss on derivatives | (2,967 | ) | (655 | ) | 29 | ||||||
| Gain on sale of securities available for sale | (2,549 | ) | (1,018 | ) | — | ||||||
| Depreciation and amortization | 1,129 | 819 | 660 | ||||||||
| Loss (gain) on disposal of fixed assets | 39 | (7 | ) | 16 | |||||||
| Deferred income taxes | 2,518 | 1,971 | — | ||||||||
| Stock based compensation | 1,558 | 844 | 505 | ||||||||
| Loss on extinguishment of debt | — | — | 232 | ||||||||
| Provision for doubtful accounts | — | — | 92 | ||||||||
| Provision for inventory obsolescence | 137 | 446 | 124 | ||||||||
| Changes in operating assets and liabilities: | |||||||||||
| Accounts receivable, net | 244 | 829 | (694 | ) | |||||||
| Inventories, net | (294 | ) | (582 | ) | 781 | ||||||
| Prepaid expenses and other current assets | 113 | 57 | 106 | ||||||||
| Accounts payable | (379 | ) | 235 | (186 | ) | ||||||
| Income taxes payable | 23 | 17 | (216 | ) | |||||||
| Deferred revenue | (749 | ) | (109 | ) | 8 | ||||||
| Accrued liabilities | (349 | ) | (429 | ) | (263 | ) | |||||
| Net cash used in operating activities | (11,683 | ) | (10,346 | ) | (2,170 | ) | |||||
| Investing Activities | |||||||||||
| Purchases of property, plant and equipment | (414 | ) | (181 | ) | (7 | ) | |||||
| Proceeds from sale of property, plant and equipment | 12 | — | — | ||||||||
| Proceeds from sale of securities available for sale | 5,130 | 3,039 | — | ||||||||
| Net cash provided by (used in) investing activities | 4,728 | 2,858 | (7 | ) | |||||||
| Financing Activities | |||||||||||
| Proceeds from short-term debt | — | 1,500 | 1,300 | ||||||||
| Proceeds from stock option exercises | 60 | — | — | ||||||||
| Net cash provided by financing activities | 60 | 1,500 | 1,300 | ||||||||
| Decrease in cash and cash equivalents | (6,895 | ) | (5,988 | ) | (877 | ) | |||||
| Cash and cash equivalents - beginning of year | 14,545 | 7,650 | 1,662 | ||||||||
| Cash and cash equivalents - end of year | $ | 7,650 | $ | 1,662 | $ | 785 | |||||
| (In thousands) | Years Ended December 31, | ||||||||||
| 2011 | 2010 | 2009 | |||||||||
| Operating Activities | |||||||||||
| Net income (loss) | $ | 1,648 | $ | (3,396 | ) | $ | (3,364 | ) | |||
| Adjustments to reconcile net income (loss) to net cash provided by (used in) operating activities: | |||||||||||
| (Gain) loss on derivatives | (73 | ) | 3 | 29 | |||||||
| Depreciation | 307 | 481 | 660 | ||||||||
| Loss on disposal of property, plant and equipment | 23 | — | 16 | ||||||||
| Deferred income taxes | (1,535 | ) | — | — | |||||||
| Stock based compensation | 661 | 1,447 | 505 | ||||||||
| Loss on extinguishment of debt | — | — | 232 | ||||||||
| Provision for doubtful accounts | — | — | 92 | ||||||||
| Provision for inventory obsolescence | — | — | 124 | ||||||||
| Changes in operating assets and liabilities: | |||||||||||
| Accounts receivable | (795 | ) | 56 | (694 | ) | ||||||
| Inventories | (113 | ) | (54 | ) | 781 | ||||||
| Prepaid expenses and other current assets | 26 | 38 | 106 | ||||||||
| Accounts payable | (64 | ) | (68 | ) | (186 | ) | |||||
| Income taxes payable | (20 | ) | — | (216 | ) | ||||||
| Deferred revenue | 37 | 5 | 8 | ||||||||
| Accrued liabilities | (35 | ) | (18 | ) | (263 | ) | |||||
| Net cash provided by (used in) operating activities | 67 | (1,506 | ) | (2,170 | ) | ||||||
| Investing Activities | |||||||||||
| Purchases of property, plant and equipment | (175 | ) | (47 | ) | (7 | ) | |||||
| Proceeds from sale of property, plant and equipment | 12 | — | — | ||||||||
| Net cash used in investing activities | (163 | ) | (47 | ) | (7 | ) | |||||
| Financing Activities | |||||||||||
| Proceeds from short-term debt | — | — | 1,300 | ||||||||
| Proceeds from the sale of subsidiary equity and warrants issued | 647 | 1,886 | — | ||||||||
| Net cash provided by financing activities | 647 | 1,886 | 1,300 | ||||||||
| Increase (decrease) in cash and cash equivalents | 551 | 333 | (877 | ) | |||||||
| Cash and cash equivalents - beginning of year | 1,118 | 785 | 1,662 | ||||||||
| Cash and cash equivalents - end of year | $ | 1,669 | $ | 1,118 | $ | 785 | |||||
The accompanying notes are an integral part of the consolidated financial statements.
F-6
MECHANICAL TECHNOLOGY, INCORPORATED AND SUBSIDIARIES
NOTES TO CONSOLIDATED FINANCIAL STATEMENTS
1. Nature of Operations
Description of Business
Mechanical Technology, Incorporated, (“MTI”(MTI or the “Company”)Company), a New York corporation, was incorporated in 1961. MTI operates in two segments, the New Energy segment which is conducted through MTI MicroFuel Cells Inc. (“MTI Micro”), a majority-owned subsidiary, and the Test and Measurement Instrumentation segment, which is conducted through MTI Instruments, Inc. (“MTI Instruments”)(MTI Instruments), a wholly-owned subsidiary.
MTI Instruments was incorporated in New York on March 8, 2000. MTI Instruments2000 and is a worldwide supplier of precision non-contact physical measurement solutions, condition based monitoring systems, portable balance equipment and wafer inspection tools. MTI Instrument’s products use a comprehensive array of technologies to solve complex, real world applications in numerous industries including manufacturing, semiconductor, solar, commercial and military aviation, automotive and data storage. OurMTI Instrument’s products consist of electronic gauging instruments for position, displacement and vibration application within the design, manufacturing/production, test and research market; wafer characterization of semi-insulating and semi-conducting wafers within both the semiconductor and solar industries; tensile stage systems for materials testing at academic and industrial settings; and engine vibration analysis systems for both military and commercial aircraft.
Reverse Stock Split
Liquidity and Going Concern
The Company has historically incurred significant losses, as it continued to fundthe majority stemming from the direct methanol fuel cell product development and commercialization programs of its majority owned subsidiary, MTI Micro, and had a consolidated accumulated deficit of $120,725 thousand$120.1 million as of December 31, 2011. During 2011, the Company generated net income attributed to MTI of $2.4 million and had working capital of $1,233 thousand at December 31, 2009. Because2011 of these losses, limited current cash and cash equivalents, negative cash flows and accumulated deficit, there is substantial doubt about$3.1 million, a $1.6 million increase from $1.5 million at December 31, 2010. This increase was primarily attributed to the reversal of a portion of the deferred tax asset’s valuation reserve of $1.5 million, representing the portion of the Company’s abilitydeferred tax asset that management has estimated is more likely than not to continue asbe realized, the improved result of operations for MTI Instruments, a going concern. These financial statements do not include any adjustments that might result from the outcome of this uncertainty.
Although MTI Micro continues to believe in the subsidiarypotential of its Mobion® based power solutions, it has sought other sources of funding. In September 2008,suspended its MTI Micro closed on $2.2 millionoperations until such time as market demand and other deciding factors, including obtaining additional external financing, the successful completion of funding in the form of convertible secured notes (the “Bridge Notes”)customer trials, a new development program with a government agency, and/or a customer order, come to investors (the “Bridge Investors”), including MTI, Dr. Walter L. Robb, a member of the Company’s and MTI Micro’s Boards of Directors, and Counter Point Ventures Fund II, LP (Counter Point). Counter Point is a venture capital fund sponsored and managed by Dr. Walter L. Robb. General Electric Pension Trust, an employee benefit plan trust, is a passive limited partner in Counter Point. In February 2009, MTI Micro issued additional bridge notes to Counter Point in the amount of $500,000. On April 15, 2009, MTI Micro, Counter Point and an additional investor agreed to additional bridge notes in the amount $800,000 to be drawn down in increments not to exceed $165,000 monthly. The final principal draw down occurred on December 4, 2009. The Bridge Notes carried an annual interest rate of 10%. On December 9, 2009, these bridge notes with the aggregate principal and accrued interest amount of $3,910,510 outstanding were converted into an aggregate of 55,864,425 shares of Common Stock of MTI Micro using a conversion price per share of $0.070 (the “Negotiated Conversion”). See Note 17 for further discussion of this transaction.
As of December 31, 2011, we had approximately $1.7 million of cash and cash equivalents to fund our future operations. During the year ended December 31, 2011, our results of operations resulted in net income after the non-controlling interest allocation of $2.4 million and cash provided by operating activities totaling $67 thousand. We expect to spend approximately $1.4 million in research and development on MTI Instruments’ products during 2012. We expect to continue funding our operations from current cash and cash equivalents, proceeds, if any, from additional debt or equity financings and government funding. We may also seek to supplement our resources through the Agreement,sales of assets (including our investment in MTI Micro). Besides the line of credit at MTI Instruments, we have no other commitments for funding future needs of the organization at this time and the remaining $191 thousand for the DOE contract as work is performed. However, the funds available through the Agreement are onlysuch additional financing during 2012 may not be available to us on acceptable terms, if at increments of $330 thousand bi-monthly. Our next available draw down is May, 2010. Without other resources, management currently believes it will need to make significant changes to its operations in the month of April of 2010.all.
F-7
2. Accounting Policies
Principles of Consolidation
The consolidated financial statements include the accounts of the Company and its majority-owned subsidiaries.its’ wholly-owned subsidiary, MTI Instruments and its’ VIE, MTI Micro. The Company is the primary beneficiary of the VIE. All significant inter-company balances and transactions are eliminated in consolidation.
The Company has performed an analysis under the VIE model and determined that MTI Micro is a VIE. One of the criteria for determining whether an entity is a VIE is determining if the entity, MTI Micro, has equity at risk. Management has concluded that MTI Micro does not have equity at risk to fund operations into its next phase of development. Further, the Company has determined that it is the primary beneficiary of MTI Micro, and therefore should include MTI Micro’s results of operations in the Company’s consolidated financial statements.
The Company's analysis to determine the primary beneficiary of MTI Micro focused primarily on determining which variable interest holder has the power to direct the activities that would have the most significant impact on the financial performance of MTI Micro. MTI Micro is governed by its own board of directors and significant decisions are determined by a majority vote of this board. MTI does not have control of the MTI Micro board of directors; however, at this time, the Company’s board of directors and the MTI Micro board of directors consist of the same members. Under the Articles of Incorporation of MTI Micro, each share of MTI Micro stock is entitled to a vote, and further, holders of a majority of the shares of MTI Micro's common stock have the ability to reconstitute the board. As of December 31, 2011, MTI, Counter Point Ventures Fund II, LP (Counter Point), Dr. Walter L. Robb, a member of the Company’s and MTI Micro’s board of directors, and Peng Lim, CEO and board member own 47.6%, 45.2%, 5.1% and 0.5% of the common shares of MTI Micro, respectively. Counter Point is a venture capital fund sponsored and managed by Dr. Robb. Since no entity of the related parties has power but, as a group, the Company and its related parties have the power, then the party within the related party group that is most closely associated with the VIE, MTI Micro, is the primary beneficiary. Even though Dr. Robb and Counterpoint combined control a majority of the outstanding common stock, and they have the ability to elect the directors of MTI Micro and decide whether to continue to seek business opportunities for MTI Micro or instead seek opportunities to sell the intellectual property, they have not elected to do so. The Company continues to oversee the day to day operations, exercise management decision making, seek opportunities to sell intellectual properties, and have a vested interest in the commercialization of MTI Micro’s fuel cell technology. Since inception in 2001, the Company has made the largest investment and been the principal funder of MTI Micro. The Company has also been exposed to losses and has the ability to benefit from MTI Micro. Considering the facts and circumstances, management believes the Company is most closely associated with the VIE, MTI Micro, and therefore, it is the primary beneficiary.
Should there be a change in the facts and circumstances (such as a change in governance or a change to the related party group) management will reassess whether they act as the primary beneficiary and should continue to include MTI Micro in the Company’s consolidated results of operations.
Non-controlling interest in subsidiaries consists of equity securities issued by a VIE of the Company. Non-controlling interests are now classified as equity in the consolidated financial statements. The consolidated income statement is presented by requiring net income to include the net income for both the parent and the non-controlling interests, with disclosure of both amounts on the consolidated statement of income. The calculation of earnings per share is based on income amounts attributable to the parent.
Use of Estimates
The preparation of the consolidated financial statements isof the Company have been prepared in conformity with accounting principles generally accepted in the United States of America (“U.S. GAAP”)(U.S. GAAP), which requiresrequire management to make estimates and assumptions that affect the reported amounts of assets and liabilities and disclosure of contingent assets and liabilities at the date of the consolidated financial statements and the reported amounts of revenues and expenses during the reporting period. Actual results could differ from those estimates.
Fair Value of Financial Instruments
The Company’s financial instruments consist of cash and cash equivalents, marketable securities, accounts receivable, unbilled contract costs and fees, derivatives and accounts payable. The estimated fair values of these financial instruments approximate their carrying values at December 31, 20082011 and 2009.2010. The estimated fair values have been determined through information obtained from market sources, where available, or Black-Scholes Option Pricing model valuations.
Accounting for Derivative Instruments
The Company recognizes all derivatives as either assets or liabilities in the statement of financial position and measures these instruments at fair value. The fair value of the derivative is recorded in the “Derivative liability” line on the financial statements,consolidated balance sheets, and is valued quarterly using the Black-Scholes Option Pricing Model. The Company also follows the accounting provisions for Accounting for Derivative Financial Instruments Indexed to and Potentially Settled in, a Company’s Own Stock, which requires freestanding contracts that are settled in a company’s own stock, including common stock warrants, to be designated as an equity instrument, asset or a liability. Under these provisions, a contract designated as an asset or a liability must be carried at fair value, with any changes in fair value recorded in the results of operations. A contract designated as an equity instrument can be included in equity, with no fair value adjustments required. Based on the terms and conditions of the warrant of the Company, the instrument does not qualify to be designated as an equity instrument and is therefore recorded as a derivative liability.
F-8
The asset/liability derivatives are valued on a quarterly basis using the Black-Scholes Option Pricing model.Model. Significant assumptions used in the valuation include exercise dates, closing market prices for the Company’s common stock, volatility of the Company’s common stock, and proxy risk-free interest rates. Gains (losses) on derivatives are included in the “Gain (loss) on derivatives” inline on the Consolidated Statementconsolidated statements of Operations.
Accounts Receivable and Allowance for Doubtful Accounts
Trade accounts receivable are recordedstated at the invoiced amount billed to customers and do not bear interest. An allowance for doubtful accounts, if necessary, represents the Company’s best estimate of the amount of probable credit losses in its existing accounts receivable. The Company determines the allowance based on historical write-off experience and current exposures identified. The Company reviews its allowance for doubtful accounts monthly. Past due balances over 90 days and over a specified amount are reviewed individually for collectability. All other balances are reviewed on a pooled basis by type of receivable. Account balances are charged off against the allowance when the Company believes it is probable the receivable will not be recovered. The Company does not have any off-balance-sheet credit exposure related to its customers.
Inventories
Inventories are valued at the lower of cost (first-in, first-out) or market. The Company provides estimated inventory allowances for excess, slow moving and obsolete inventory as well as inventory whose carrying value is in excess of net realizable value.
Property, Plant, and Equipment
Property, plant and equipment are stated at cost and depreciated using primarily the straight-line method over their estimated useful lives:
| Leasehold improvements | Lesser of the life of the lease or the useful life of the improvement |
| Computers and related software | 3 to 5 years |
| Machinery and equipment | 3 to 10 years |
| Office furniture, equipment and fixtures | 2 to 10 years |
Significant additions or improvements extending assets’ useful lives are capitalized; normal maintenance and repair costs are expensed as incurred. The costs of fully depreciated assets remaining in use are included in the respective asset and accumulated depreciation accounts. When items are sold or retired, related gains or losses are included in net (loss) income.
Income Taxes
Deferred tax assets and liability method of accounting for income taxes. Under this method, deferred income taxesliabilities are recognized for the tax consequences of “temporary differences” by applying enacted statutory tax rates applicable for future years totemporary differences between financial statement and income tax bases of existing assets and liabilities. Under the accounting standard, the effect ofliabilities, loss carryforwards, and tax rate changes on deferred taxes is recognized in thecredit carryforwards, for which income tax provisionbenefits are expected to be realized in the period that includes the enactment date. The provision for taxes is reduced by investment and other tax credits in the years such credits become available.future years. A valuation allowance is recordedhas been established to reduce the carrying amounts of deferred tax assets, unless it is more likely than not those assets will be realized.
The Company accounts for uncertain tax positions in accordance with accounting standards that address income taxes. The Company must recognize in its financial statements the impact of a tax position, willif that position is more likely than not to be sustained on an audit, based on the technical merits of the position.
F-9
Fair Value Measurement
The estimated fair value of certain financial instruments, including resolution of related appealscash, cash equivalents and short-term debt approximates their carrying value due to their short maturities and varying interest rates. “Fair value” is the price that would be received to sell an asset or litigation processes, if any. The second step is to measuretransfer a liability in an orderly transaction between market participants at the tax benefit as the largest amount which is more than 50% likely of being realized upon ultimate settlement.measurement date. The Company considers many factors when evaluatingutilizes valuation techniques that maximize the use of observable inputs and estimating its tax positionsminimize the use of unobservable inputs. Based on the observability of the inputs used in the valuation methods, the Company is required to provide the following information according to the fair value accounting standards. These standards established a fair value hierarchy as specified that ranks the quality and tax benefits, which may require periodic adjustmentsreliability of the information used to determine fair values. Financial assets and which may not accurately forecast actual outcomes.
| Level 1: | Quoted market prices in active markets for identical assets or liabilities, which includes listed equities. |
| Level 2: | Observable market based inputs or unobservable inputs that are corroborated by market data. These items are typically priced using models or other valuation techniques. These models are primarily financial industry-standard models that consider various assumptions, including the time value of money, yield curves, volatility factors, as well as other relevant economic measures. |
| Level 3: | These use unobservable inputs that are not corroborated by market data. These values are generally estimated based upon methodologies utilizing significant inputs that are generally less observable from objective sources. |
Revenue Recognition
The Company applies the accounting guidance for revenue recognition in the evaluation of its contracts to determine when to properly recognize revenue. The following outlines the various types of revenue and the determination of the recognition of income for each category:
Product Revenue
Product revenue is recognized when there is persuasive evidence of an arrangement, the collection of a fixed fee is probable or determinable, and delivery of the product to the customer or distributor has occurred, at which time title generally is passed to the customer or distributor. All of these generally occur upon shipment of the product. If the product requires installation to be performed by the Company, all revenue related to the product is deferred and recognized upon the completion of the installation. If the product requires specific customer acceptance, revenue is deferred until customer acceptance occurs or the acceptance provisions lapse, unless the Company can objectively and reliably demonstrate that the criteria specified in the acceptance provisions is satisfied.
MTI Instruments currently has distributor agreements in place for the international sale of general instrument and semiconductor products in certain global regions. Such agreements grant a distributor the right of first refusal to act as distributor for such products in the distributor’s territory. In return, the distributor agrees to not market other products which are considered by MTI Instruments to be in direct competition with MTI Instruments’ products. The distributor is allowed to purchase MTI Instruments’ equipment at a price which is discounted off the published domestic/international list prices. Such list prices can be adjusted by MTI Instruments during the term of the distributor agreement, but MTI Instruments must provide advance notice at least 90 days before the price adjustment goes into effect. Generally, payment terms with the distributor are standard net 30 days; however, on occasion, extended payment terms have been granted. Title and risk of loss of the product passes to the distributor upon delivery to the independent carrier (standard “free-on-board” factory), and the distributor is responsible for any required training and/or service with the end-user. The sale (and subsequent payment) between MTI Instruments and the distributor is not contingent upon the successful resale of the product by the distributor. Distributor sales are covered by MTI Instruments’ standard one-year warranty and there are no special return policies for distributors.
Some of MTI Instruments’ direct sales, particularly sales of semi-automatic and fully-automated semiconductor metrology equipment, or rack-mounted vibration systems, involve on-site customer acceptance and/or installation. In those instances, revenue recognition does not take place at time of shipment. Instead, MTI Instruments recognizes the sale after the unit is installed and/or an on-site acceptance is given by the customer. Agreed-upon acceptance terms and conditions, if any, are negotiated at the time of purchase.
Funded Research and Development Revenue
The Company performs funded research and development for government agencies under both cost reimbursement and fixed-price contracts. Cost reimbursement contracts provide for the reimbursement of allowable costs. On fixed-price contracts, revenue is generally recognized on the percentage of completion method based upon the proportion of costs incurred to the total estimated costs for the contract. Revenue from reimbursement contracts is recognized as the services are performed. In each type of contract, the Company generally receives periodic progress payments or payments upon reaching interim milestones. When the current estimates of total contract revenue for commercial development contracts indicate a loss, a provision for the entire loss on the contract is recorded. Any losses incurred in performing funded research and development projects are recognized as research and development expense as incurred. When government agencies are providing funding they do not expect the government to be the only significant end user of the resulting products. These contracts do not require delivery of products that meet defined performance specifications, but are best efforts arrangements to achieve overall research and development objectives. Included in accounts receivable are billed and unbilled work-in-progress on contracts. Billings in excess of contract revenues earned are recorded as deferred revenue. While the Company’s accounting for government contract costs is subject to audit by the sponsoring entity, in the opinion of management, no material adjustments are expected as a result of such audits. Adjustments are recognized in the period made.
F-10
Commercial Research and Prototype Agreement Income
The Company also applies the proper accounting guidance in the evaluation of commercially funded fuel cell research and prototype agreements in order to determine when to properly recognize income. Payments received in connection with commercial research and prototype agreements are deferred and recognized on a straight-line basis over the term of the agreement for service-related payments, and for milestone and prototype delivery payments, if and when achieved, revenue is deferred and recognized on a straight-line basis over the remaining term of the agreement. Under this policy, when revenue qualifies for recognition it will be recorded in the Consolidated Statements of Operations in the line titled “Funded research and development revenue.” The costs associated with research and prototype-producing activities are expensed as incurred. Expenses in an amount equal to revenues recognized are reclassified from the line titled “Unfunded research and product development” to “Funded research and product development” in the Consolidated Statements of Operations.
Prototype Evaluation Agreements
The Company recognizes income derived from its micro fuel cell prototype evaluation agreements, where the Company receives a lump-sum amount from Original Equipment Manufacturers (“OEMs”)(OEMs) which are testing the Company’s Mobion® prototypes for an OEM-specific application, upon delivery of the evaluation prototypes. These prototypes are returned to the Company once the evaluation period expires. There are no warranties given to any OEM regarding these prototypes, and each evaluation agreement is considered a customer specific arrangement. The costs associated with executing these prototype evaluation arrangements are expensed in research and development expense as they are incurred. Income derived from these arrangements of $45 thousand in 2009 and $23 thousand in 2008 are recorded in the Consolidated Statements of Operations in the line titled “Other“Unfunded research and development expense” as they are incurred and income (expense), net.”
Cost of Product Revenue
Cost of product revenue includes material, labor, overhead and overhead.shipping and handling costs. Costs incurred in connection with funded research and development arrangements are included in funded research and product development expenses.
Deferred Revenue
Deferred revenue consists of payments received from customers in advance of services performed, completed installation or customer acceptance.
Warranty
The Company recordsaccrues a warranty reserveliability at the time product revenue is recorded based on a historical rate.experience. The reserveliability is reviewed during the year and is adjusted, if appropriate, to reflect new product offerings or changes in experience. Actual warranty claims are tracked by product line. Warranty liability was $21$26 thousand and $31$36 thousand at December 31, 20092011 and 2008,2010, respectively.
Accounting for Impairment or Disposal of Long-Lived Assets
The Company accounts for impairment or disposal of long-lived assets in accordance with accounting standards that address the financial accounting and reporting for the impairment or disposal of long-lived assets, specify how impairment will be measured, and how impaired assets will be classified in the consolidated financial statements. On a quarterly basis, the Company analyzes the status of its long-lived assets at each subsidiary for potential impairment. As of December 31, 2009,2011, the Company does not believe that any of its long-lived assets have suffered any type of impairment that would require an adjustment to that asset’s recorded value.
Cash and Cash Equivalents
Cash and cash equivalents consist of cash and highly liquid short-term investments with original maturities of less than three months.
Net LossIncome (Loss) per Common Share
The Company reports net loss percomputes basic and diluted common share in accordance with the accounting standard, which establishes standards for computing and presenting loss per share. Basic lossincome (loss) per common share is computed by dividing net lossincome (loss) by the weighted average number of common shares outstanding during the reporting period. Diluted lossincome (loss) per share reflects the potential dilution, if any, computed by dividing loss income (loss) by the combination of dilutive common share equivalents, comprised of shares issuable under outstanding investment rights, warrants and the Company’s share-based compensation plans, and the weighted average number of common shares outstanding during the reporting period. Dilutive common share equivalents include the dilutive effect of in-the-money stock options, which are calculated based on the average share price for each period using the treasury stock method. Under the treasury stock method, the exercise price of a stock option, the amount of compensation cost, if any, for future service that the Company has not yet recognized, and the amount of windfall tax benefits that would be recorded in additional paid-in capital, if any, when the stock option is exercised are assumed to be used to repurchase shares in the current period.
F-11
Share-Based Payments
The Company accounts for stock based awards exchanged for employee service in accordance with the stock-based payment accounting guidance. The Company has three share-based employee compensation plans and MTI Micro has two share-based employee compensation plans, all of which are described more fully in Note 13, Stock Based Compensation.
Stock-based compensation represents the cost related to stock-based awards granted to employees and directors. The Company measures stock-based compensation cost at grant date based on the estimated fair value of the award, and recognizes the cost as expense on a straight-line basis in accordance with the vesting of the options (net of estimated forfeitures) over the option’s requisite service period. The Company estimates the fair value of stock-based awards using a Black Scholes valuation model. Stock-based compensation expense is recorded in the lines titles “Selling, general and administrative expenses” and “Unfunded research and product development expenses” in the Consolidated Statements of Operations based on the employees’ respective functions.
The Company records deferred tax assets for awards that potentially can result in deductions on the Company’s income tax returns based on the amount of compensation cost that would be recognized upon issuance of the award and the Company’s statutory tax rate. Differences between the deferred tax assets recognized for financial reporting purposes and the actual tax deduction reported on the Company’s income tax return are recorded in Additional Paid-In Capital (if the tax deduction exceeds the deferred tax asset) or in the Consolidated Statement of Operations (if the deferred tax asset exceeds the tax deduction and no historical pool of windfall tax benefits exists). Since the adoption of the revised accounting standard on share-based payments, no tax benefits have been recognized related to share-based compensation since the Company has incurred net operating losses and has established a full valuation allowance to offset all potential tax benefits associated with these deferred tax assets. The Company continues to record the fair market value of stock options and warrants granted to non-employees and non-directors in exchange for services in accordance with the appropriate accounting guidance in the Consolidated Statements of Operations.
Concentration of Credit Risk
Financial instruments that subject the Company to concentrations of credit risk principally consist of cash equivalents, trade accounts receivable and unbilled contract costs. The Company’s trade accounts receivable and unbilled contract costs and fees are primarily from sales to commercial customers, the U.S. government and state agencies. The Company does not require collateral and has not historically experienced significant credit losses related to receivables or unbilled contract costs and fees from individual customers or groups of customers in any particular industry or geographic area.
The Company has cash deposits itsin excess of federally insured limits. The amount of such deposits is essentially all cash in commercial banks. Credit exposure to any one entity is limited by Company policy.
Research and Development Costs
The Company expenses research and development costs as incurred.
Effect of Recent Accounting Pronouncements
In December 2007,September 2011, the FASB revisedissued guidance on the authoritativepresentation of comprehensive income. This guidance for business combinations, which establishes that all business combinations are still requiredeliminates the current option to be accounted for at fair value underreport other comprehensive income and its components in the acquisition methodstatement of accountingchanges in equity. The guidance allows two presentation alternatives: (1) present items of net income and other comprehensive income in one continuous statement, referred to as the statement of comprehensive income; or (2) in two separate, but it changed the methodconsecutive, statements of applying the acquisition method in a number of significant aspects. Thenet income and other comprehensive income. This guidance is effective on a prospective basis for all business combinations for which the acquisition date is on or afteras of the beginning of the first annual period subsequent toa fiscal year that begins after December 15, 2008, with2011. Early adoption is permitted, but full retrospective application is required under both sets of accounting standards. The guidance also previously required the exceptionpresentation of adjustments for items that are reclassified from other comprehensive income to net income in the statement where the components of net income and the components of other comprehensive income are presented; however, this portion of the accounting for valuation allowances on deferred taxes and acquired tax contingencies. Adjustments madeguidance has been deferred. The Company plans to valuation allowances on deferred taxes and acquired tax contingencies associated with acquisitions that closed prior toadopt the effective date ofguidance during the policy would also applyquarter ended March 31, 2012. The Company believes the provisions of this policy. The Company’s adoption of this new guidance on January 1, 2009 didwill not have a material effectimpact on its financial statements.
Reclassifications
Prior period amounts related to noncontrolling interestsinventory have been reclassified to conform to the current period presentation. The Company adopted this guidance on January 1, 2009.
F-12
3. Accounts Receivable and Allowance for Doubtful
Accounts
| 2008 | 2009 | |||||||
| (dollars in thousands) | ||||||||
| U.S. and State Government: | ||||||||
| Amount billable | $ | 102 | $ | 143 | ||||
| Amount billed | 4 | — | ||||||
| Total U.S. and State Government | 106 | 143 | ||||||
| Commercial | 434 | 1,091 | ||||||
| Less: Allowance for doubtful accounts | — | (92 | ) | |||||
| Total | $ | 540 | $ | 1,142 | ||||
| 2011 | 2010 | ||||
| (dollars in thousands) | |||||
| U.S. and State Government: | |||||
| Amount billable | $ | — | $ | 30 | |
| Amount billed | 990 | 313 | |||
| Total U.S. and State Government | 990 | 343 | |||
| Commercial | 891 | 743 | |||
| Total | $ | 1,881 | $ | 1,086 | |
As of December 31, 20082011 and 2009,2010, the Company had a reserveno allowance for doubtful trade accounts receivable of $0 and $92 thousand, respectively.
4. Issuance of Stock by Subsidiary
| MTI | NCI | ||||||||||||
| Average | Ownership | Ownership | |||||||||||
| Price | Shares | % | Shares | % | Total Shares | ||||||||
| Balance at 1/1/2007 | 27,236,896 | 94.0 | 1,750,345 | 6.0 | 28,987.241 | ||||||||
| Stock issued for MTI Options to MFC Employees | $ | 0.69 | 44,960 | 44,960 | |||||||||
| Transfer of Plug Power securities to MFC | $ | 0.69 | 5,680,827 | 5,680,827 | |||||||||
| Conversion of Loan Receivable | $ | 0.70 | 13,067,770 | 13,067,770 | |||||||||
| Balance at 12/31/07 | 46,030,453 | 96.3 | 1,750,345 | 3.7 | 47,780,798 | ||||||||
| Stock issued for MTI Options to MFC Employees. | $ | 0.45 | 31,469 | 31,469 | |||||||||
| Transfer of Plug Power securities to MFC | $ | 0.35 | 7,319,181 | 7,319,181 | |||||||||
| Conversion of Loan Receivable | $ | 0.24 | 10,416,667 | 10,416,667 | |||||||||
| Balance at 12/31/08 | 63,797,770 | 97.3 | 1,750,345 | 2.7 | 65,548,115 | ||||||||
| Stock issued for MTI Options to MFC Employees | $ | 0.14 | 10,501 | 10,501 | |||||||||
| Conversion of Bridge Loan | $ | 0.07 | 11,241,666 | 44,622,759 | 55,864,425 | ||||||||
| Balance at 12/31/09 | 75,049,937 | 61.8 | 46,373,104 | 38.2 | 121,423,041 | ||||||||
Inventories net consist of the following at December 31:
| 2008 | 2009 | |||||
| (dollars in thousands) | ||||||
| Finished goods | $ | 772 | $ | 465 | ||
| Work in process | 449 | 193 | ||||
| Raw materials, net | 288 | 131 | ||||
| $ | 1,509 | $ | 789 | |||
| 2011 | 2010 | ||||
| (dollars in thousands) | |||||
| Finished goods | $ | 310 | $ | 283 | |
| Work in process | 211 | 156 | |||
| Raw materials | 436 | 405 | |||
| $ | 957 | $ | 844 | ||
As of December 31, 2011 and 2010, the Company had an inventory reserve of $243 thousand and $393 thousand, respectively.
5. Property, Plant and Equipment
Property, plant and equipment consist of the following at December 31:
| 2008 | 2009 | |||||
| (dollars in thousands) | ||||||
| Leasehold improvements | $ | 1,213 | $ | 1,213 | ||
| Computers and related software | 2,199 | 2,164 | ||||
| Machinery and equipment | 4,018 | 3,820 | ||||
| Office furniture and fixtures | 299 | 473 | ||||
| 7,729 | 7,670 | |||||
| Less accumulated depreciation | 6,201 | 6,811 | ||||
| $ | 1,528 | $ | 859 | |||
| 2011 | 2010 | ||||
| (dollars in thousands) | |||||
| Leasehold improvements | $ | 1,213 | $ | 1,213 | |
| Computers and related software | 2,130 | 2,164 | |||
| Machinery and equipment | 3,541 | 3,823 | |||
| Office furniture and fixtures | 457 | 473 | |||
| 7,341 | 7,673 | ||||
| Less accumulated depreciation | 7,083 | 7,248 | |||
| $ | 258 | $ | 425 | ||
Depreciation expense was $1,129, $819,$307, $481, and $660 thousand for 2007, 2008,2011, 2010, and 2009, respectively. Repairs and maintenance expense was $82, $57,$39, $18, and $20 thousand for 2007, 2008,2011, 2010, and 2009, respectively.
F-13
6. Income Taxes
Income tax benefit (expense) benefit for each of the years ended December 31 consists of the following:
| 2007 | 2008 | 2009 | |||||||||
| (dollars in thousands) | |||||||||||
| Federal | $ | — | $ | — | $ | 9 | |||||
| State | (30 | ) | (33 | ) | 199 | ||||||
| Deferred | (2,518 | ) | (1,971 | ) | — | ||||||
| Total | $ | (2,548 | ) | $ | (2,004 | ) | $ | 208 | |||
| 2007 | 2008 | 2009 | |||||||||
| (dollars in thousands) | |||||||||||
| Total change in unrealized (gain) loss on securities available for sale: | |||||||||||
| Deferred tax benefit (expense) | $ | 1,201 | $ | 989 | — | ||||||
| Valuation allowance (expense) | (1,201 | ) | (989 | ) | — | ||||||
| Tax effect of reclassification adjustment for gains included in | |||||||||||
| net income (loss) | 2,518 | 1,971 | — | ||||||||
| $ | 2,518 | $ | 1,971 | $ | — | ||||||
| 2011 | 2010 | 2009 | |||||||
| (dollars in thousands) | |||||||||
| Federal | $ | — | $ | — | $ | 9 | |||
| State | 13 | (4 | ) | 199 | |||||
| Deferred | 1,535 | — | — | ||||||
| Total | $ | 1,548 | $ | (4 | ) | $ | 208 | ||
The significant components of deferred income tax (expense) benefit from operations before non controllingnon-controlling interest for each of the years ended December 31 consists of the following:
| 2007 | 2008 | 2009 | ||||||||||
| (dollars in thousands) | ||||||||||||
| Deferred tax benefit (expense) | $ | 1,181 | $ | 721 | $ | 432 | ||||||
| Net operating loss carry forward | 3,069 | 3,837 | (1,927 | ) | ||||||||
| Valuation allowance | (4,250 | ) | (4,558 | ) | 1,495 | |||||||
| Disproportionate tax effect of reclassification adjustment for | ||||||||||||
| gains included in net income (loss) | (2,518 | ) | (1,971 | ) | 0 | |||||||
| $ | (2,518 | ) | $ | (1,971 | ) | $ | 0 | |||||
| 2011 | 2010 | 2009 | |||||||||
| (dollars in thousands) | |||||||||||
| Deferred tax benefit | $ | (402 | ) | $ | 675 | $ | 432 | ||||
| Net operating loss carry forward | (6,035 | ) | 740 | (1,927 | ) | ||||||
| Valuation allowance | 7,972 | (1,415 | ) | 1,495 | |||||||
| $ | 1,535 | $ | — | $ | — | ||||||
The Company’s effective income tax rate from operations before minoritynon-controlling interest differed from the Federal statutory rate for each of the years ended December 31 is as follows:
| 2007 | 2008 | 2009 | |||||||
| Federal statutory tax rate | 34 | % | 34 | % | 34 | % | |||
| State taxes, net of federal tax effect | 1 | 3 | — | ||||||
| Change in valuation allowance | (56 | ) | (42 | ) | 42 | ||||
| Disproportionate tax effect of reclassification | |||||||||
| adjustment for gains included in net income (loss) | (28 | ) | (16 | ) | — | ||||
| Permanent tax difference on derivative valuation | 16 | 2 | — | ||||||
| Loss on extinguishment of debt | — | — | (2 | ) | |||||
| IRC Section 382 Limitation | — | — | (64 | ) | |||||
| Adjustment to opening deferred tax balance | — | — | (3 | ) | |||||
| Other, net | — | — | (1 | ) | |||||
| Tax Rate | (33 | )% | (19 | )% | 6 | % | |||
| 2011 | 2010 | 2009 | ||||||
| Federal statutory tax rate | 34 | % | 34 | % | 34 | % | ||
| State taxes, net of federal tax effect | (45 | ) | 6 | — | ||||
| Impact of adjustments to state tax rates | 3,099 | — | — | |||||
| Change in valuation allowance | (7,972 | ) | (42 | ) | 42 | |||
| Permanent tax difference on derivative valuation | (25 | ) | — | — | ||||
| Loss on extinguishment of debt | — | — | (2 | ) | ||||
| IRC Section 382 Limitation | 3,097 | — | (64 | ) | ||||
| Expiring net operating loss | 3 | (3 | ) | — | ||||
| Adjustment to opening deferred tax balance | 260 | 5 | (3 | ) | ||||
| Other, net | 1 | — | (1 | ) | ||||
| Tax Rate | (1,548 | )% | 0 | % | 6 | % | ||
Pre-tax lossgain (loss) before non controllingnon-controlling interests was $7,609, $10,760,$100 thousand, $(3.4) million, and $3,572 thousand$(3.6) million for 2007, 2008,2011, 2010, and 2009, respectively. The
F-14
Deferred Tax Assets:
Deferred tax assets are determined based on the temporary differences between the financial statement and tax bases of assets and liabilities as measured by the enacted tax rates. Temporary differences, net operating loss carryforwards and tax credit carryforwards that give rise to deferred tax assets and liabilities are summarized as follows as of December 31:
| 2011 | 2010 | ||||||
| (dollars in thousands) | |||||||
| Current deferred tax assets: | |||||||
| Inventory valuation | $ | 84 | $ | 157 | |||
| Inventory capitalization | 11 | 13 | |||||
| Vacation pay | 57 | 77 | |||||
| Warranty and other sale obligations | 9 | 14 | |||||
| Other reserves and accruals | 111 | 63 | |||||
| 272 | 324 | ||||||
| Valuation allowance – current | (252 | ) | (324 | ) | |||
| Net current deferred tax assets | $ | 20 | $ | — | |||
| Noncurrent deferred tax assets: | |||||||
| Net operating loss | $ | 17,654 | $ | 23,688 | |||
| Property, plant and equipment | 53 | 366 | |||||
| Stock options | 2,880 | 2,918 | |||||
| Research and development tax credit | 450 | 450 | |||||
| Alternative minimum tax credit | 54 | 54 | |||||
| 21,091 | 27,476 | ||||||
| Valuation allowance – noncurrent | (19,576 | ) | (27,476 | ) | |||
| Non-current net deferred tax assets | $ | 1,515 | $ | — | |||
As of December 31, consist2011, the Company has approximately $450 thousand of research and development tax credit carry forwards, which begin to expire in 2018, and approximately $54 thousand of alternative minimum tax credit carry forwards, which have no expiration date.
Valuation Allowance:
The Company provides for recognition of deferred tax assets if the realization of such assets is more likely than not to occur in accordance with accounting standards that address income taxes. Significant management judgment is required in determining the period in which the reversal of a valuation allowance should occur. The Company has considered all available evidence, both positive and negative, such as historical levels of income and future forecasts of taxable income amongst other items in determining whether a full or partial release of our valuation allowance is required. In addition, the Company’s assessment requires us to schedule future taxable income in accordance with accounting standards that address income taxes to assess the appropriateness of a valuation allowance which further requires the exercise of significant management judgment.
As a result of our analyses in 2011, the Company released a portion of our valuation allowance against our deferred tax assets. The partial release of the followingvaluation allowance caused an incremental tax effects relatingbenefit of $1.5 million to be recognized in the fourth quarter of 2011. The release of a portion of the valuation allowance was based upon a recent cumulative income history for MTI and Subsidiaries exclusive of MTI Micro (MTI Micro files separate federal and state tax returns) causing the Company to evaluate what portion of the Company's deferred tax assets it believes are more likely that not to be realized. The Company has determined that it will generate sufficient levels of pre-tax earnings in the future to realize the net deferred tax assets recorded on the balance sheet at December 31, 2011. The Company has projected such pre-tax earnings utilizing a combination of historical and projected results, taking into consideration existing levels of permanent differences, non-deductible expense and the reversal of significant temporary differences and carry forwards:
| 2008 | 2009 | |||||||
| (dollars in thousands) | ||||||||
| Current deferred tax (liabilities) assets: | ||||||||
| Inventory valuation | $ | 204 | $ | 211 | ||||
| Inventory capitalization | 13 | 16 | ||||||
| Bad Debt Reserve | — | 37 | ||||||
| Vacation pay | 77 | 82 | ||||||
| Warranty and other sale obligations | 12 | 9 | ||||||
| Other reserves and accruals | 22 | 81 | ||||||
| 328 | 436 | |||||||
| Valuation allowance | (328 | ) | (436 | ) | ||||
| Net current deferred tax liabilities | $ | — | $ | — | ||||
| Noncurrent deferred tax assets (liabilities): | ||||||||
| Net operating loss | $ | 24,874 | $ | 22,947 | ||||
| Property, plant and equipment | 27 | 158 | ||||||
| Stock options | 2,138 | 2,340 | ||||||
| Research and development tax credit | 459 | 459 | ||||||
| Alternative minimum tax credit | 54 | 45 | ||||||
| 27,552 | 25,949 | |||||||
| Valuation allowance | (27,552 | ) | (25,949 | ) | ||||
| Non-current net deferred tax assets | $ | — | $ | — | ||||
The Company believes that the accounting estimate for the valuation of deferred tax assets is a critical accounting estimate because judgment is required in assessing the likely future tax consequences of events that have been recognized in our financial statements or tax returns. The Company based our estimate of deferred tax assets and liabilities on current tax laws and rates and, in certain cases, business plans and other expectations about future outcomes. In the event that actual results differ from these estimates or the Company adjusts these estimates in future periods, the Company may need to adjust the recorded valuation allowance, which could materially impact our financial position and results of operations.
The valuation allowance at December 31, 20082011 and 20092010 was $27,880$19.8 million and $26,385 thousand,$27.8 million, respectively. The net changeActivity in the valuation allowance was $5,547 thousand in 2008 and $(1,495) thousand in 2009. for deferred tax assets is as follows as of December 31:
| 2011 | 2010 | 2009 | ||||||||
| (dollars in thousands) | ||||||||||
| Valuation allowance, beginning of year | $ | 27,800 | $ | 26,385 | $ | 27,880 | ||||
| Deductions resulting in income tax benefit | (1,535 | ) | — | — | ||||||
| Additions charged to other accounts | — | 1,415 | — | |||||||
| Deduction charged to other accounts | (6,437 | ) | — | (1,495 | ) | |||||
| Valuation allowance, end of year | $ | 19,828 | $ | 27,800 | $ | 26,385 | ||||
The remaining valuation allowance at December 31, 20082011 of $19.8 million primarily relates to net operating losses and 2009 reflectsstock based compensation. The Company will continue to evaluate the estimate that it is more likely than not that the netability to realize our deferred tax assets may not be realized.
Net operating losses:
At December 31, 2009,2011, the Company has unused Federal net operating loss carry forwards of approximately $65,384 thousand. Of these$66.9 million.
As a result of the conversion of the Bridge Notes in December of 2009 (see Note 17 for further discussion of the transaction), MTI no longer maintained an 80% or greater ownership in MTI Micro. Thus, MTI Micro is no longer included in Mechanical Technology, Incorporated and Subsidiaries' consolidated federal and combined New York State tax returns, effective December 9, 2009. Pursuant to the Internal Revenue Service's consolidated tax return regulations (IRS Regulation Section 1.1502-36), upon MTI Micro leaving the Mechanical Technology, Incorporated and Subsidiaries’ consolidated group, MTI has elected to reduce a portion of its stock tax basis in MTI Micro by "reattributing" a portion of MTI Micro's net operating loss carryforwards to MTI, for an amount equivalent to its built in loss in MTI's investment in MTI Micro's stock. As the result of MTI making this election with its December 31, 2009 tax return, MTI reattributed approximately $45.2 million of MTI Micro's net operating losses (reducing its tax basis in MTI Micro's stock by the same amount), leaving MTI Micro with approximately $13 million of separate company net operating loss carry forwards $1,325 thousandat the time of conversion of the Bridge Notes.
As of December 31, 2011, it is estimated that MTI has net operating loss carryforwards of approximately $50.4 million and MTI Micro has net operating loss carryforwards of approximately $16.5 million. Of the Company’s carry forwards, $1.3 million represents windfall tax benefits from stock option transactions, the tax effect of which are not included in the Company’s net deferred tax assets. Additionally, it is estimated that $6,691 thousand of these carryforwards will expire prior to utilization due to IRC
In addition, a formal Section 382 limitation described below. This net operating loss limited by IRC Section 382 is not reflected instudy was performed for both the Company’s deferred tax asset as of December 31, 2009. The Federal net operating loss carry forwards, if unused, will begin to expire in 2010.
The balance of the Mechanical Technology, Inc. and Subsidiaries consolidated group, MTI is permitted to elect to reduce a portionCompany’s net operating losses carried forward from 2010 of its stock tax basis$67.2 million was reduced by $8 thousand in MTI Micro by "reattributing" a portion of MTI Micro'sexpired net operating losses. The remaining Federal net operating loss carry forwards, if unused, will continue to MTI,expire beginning in 2020 for an amount equivalent to its built in loss amount in MTI's investment in MTI Micro's stock.
F-16
Unrecognized tax credit carry forwards, which begin to expire in 2018, and approximately $45 thousand of alternative minimum tax credit carry forwards, which have no expiration date. Deferred tax assets and liabilities are determined based on the temporary differences between the financial statement and tax bases of assets and liabilities as measured by the enacted tax rates.
A reconciliation of the beginning and ending amount of unrecognized tax benefits in accordance with ASC 740accounting standards that address income taxes for 2007, 20082011, 2010 and 2009 is as follows:
| 2007 | 2008 | 2009 | |||||||
| (dollars in thousands) | |||||||||
| Balance as of January 1, | $ | 2,024 | $ | 2,044 | $ | 2,049 | |||
| Additions for tax positions of prior years | 20 | 5 | — | ||||||
| Deductions for settlements | — | — | 213 | ||||||
| Balance as of December 31, | $ | 2,044 | $ | 2,049 | $ | 1,836 | |||
| 2011 | 2010 | 2009 | ||||||
| (dollars in thousands) | ||||||||
| Balance as of January 1, | $ | 1,186 | $ | 1,836 | $ | 2,049 | ||
| Deductions for settlements | — | 650 | 213 | |||||
| Balance as of December 31, | $ | 1,186 | $ | 1,186 | $ | 1,836 | ||
In future periods, if $1,836 thousand$1.2 million of these unrecognized benefits become supportable, the Company may not recognize a change in its effective tax rate as long as it remains in a fullpartial valuation allowance position. Additionally the Company does not have uncertain tax positions that it expects will increase or decrease within twelve months of this reporting date. In accordance with the Company’s accounting policy, it recognizes interest and penalties related to uncertain tax positions as a component of tax expense. This policy did not change as a result of the adoption of ASC 704’s accounting guidance for uncertain tax positions. The Company recognizeddid not recognize any interest or penalties in 2011 and penalties expense of $5 thousand in 2008 and interest and penalties income of $47 thousand in 2009 (upon settlement of the NYS audit discussed below). As of2010. For both December 31, 20082011 and 2009,2010, the Company had $54 thousand and $0 of accrued interest and penalties related to uncertain tax positions, respectively.
The Company files income tax returns, including returns for its subsidiaries, with federal and state jurisdictions. The Company is no longer subject to IRS or NYS examinations for its federal and state returns for any periods prior to 2006,2008, although carryforward attributes that were generated prior to 20062008 may still be adjusted upon examination by the IRS if they either have been or will be used in a future period. On February 2, 2009, New York State Department of Taxation and Finance notified the Company that it was no longer going to pursue the issue associated with potentially not permitting the Company to file combined tax returns for the period 2002 through 2004. At December 31, 2008 the Company had recorded a $213 thousand long-term liability for this issue. In the settlement of this issue, the Company paid New York State approximately $19 thousand and recognized the benefit of the reversal of this liability of $194 thousand in the first quarter of 2009.
7. Accrued Liabilities
Accrued liabilities consist of the following at December 31:
| 2008 | 2009 | |||||
| (dollars in thousands) | ||||||
| Salaries, wages and related expenses | $ | 746 | $ | 525 | ||
| Acquisition and disposition costs | 363 | 363 | ||||
| Legal and professional fees | 212 | 183 | ||||
| Warranty and other sale obligations | 31 | 20 | ||||
| Commissions | 33 | 13 | ||||
| Other | 307 | 186 | ||||
| $ | 1,692 | $ | 1,290 | |||
| 2011 | 2010 | ||||
| (dollars in thousands) | |||||
| Salaries, wages and related expenses | $ | 593 | $ | 476 | |
| Liability to shareholders for previous acquisition | 363 | 363 | |||
| Legal and professional fees | 126 | 173 | |||
| Warranty and other sale obligations | 26 | 36 | |||
| Commissions | 21 | 36 | |||
| Other | 109 | 189 | |||
| $ | 1,238 | $ | 1,273 | ||
8. Fair Value Measurement
In determining the appropriate levels, the Company performs a detailed analysis of financial assets and liabilities. At each reporting period, all assets and liabilities for which the fair value measurements are based upon significant unobservable inputs arewere classified as Level 3. The derivative liability iswas valued using the Black-Scholes Option Pricing Model which is based upon unobservable inputs.
F-17
| (Dollars in thousands) | |||||||||||
| Balance at | |||||||||||
| Balance Sheet Classification | Level 1 | Level 2 | Level 3 | December 31, 2009 | |||||||
| Financial Liabilities: | |||||||||||
| Derivative liability | $ | — | $ | — | $ | 70 | $ | 70 | |||
| Total fair value of liabilities | $ | — | $ | — | $ | 70 | $ | 70 | |||
The following is a rollforward of Level 3 fair value instruments for the year ended December 31, 2008:
| (Dollars in thousands) | ||||||||||||
| Total (Gains) / | ||||||||||||
| Beginning | Losses | Purchases, | Ending Balance as | |||||||||
| Balance as of | Realized and | Issuances, Sales | of December 31, | |||||||||
| Instrument | Jan. 1, 2008 | Unrealized | and Settlements | 2008 | ||||||||
| Derivative liability | $ | 696 | $ | (655 | ) | $ | — | $ | 41 | |||
| Total Level 3 instruments | $ | 696 | $ | (655 | ) | $ | — | $ | 41 | |||
(Dollars in thousands) | Total (Gains) / | ||||||||||||
| Beginning | Losses | Purchases, | Ending Balance as of December 31, | ||||||||||
| Balance as of | Realized and | Issuances, Sales | |||||||||||
| Instrument | Jan. 1, 2011 | Unrealized | and Settlements | 2011 | |||||||||
| Derivative liability | $ | 73 | $ | (73 | ) | $ | — | $ | — | ||||
| Total Level 3 instruments | $ | 73 | $ | (73 | ) | $ | — | $ | — | ||||
The following is a rollforward of Level 3 fair value instruments for the year ended December 31, 2009:
| (Dollars in thousands) | Total (Gains) / | ||||||||||
| Beginning | Losses | Purchases, | Ending Balance as | ||||||||
| Balance as of | Realized and | Issuances, Sales | of December 31, | ||||||||
| Instrument | Jan. 1, 2009 | Unrealized | and Settlements | 2009 | |||||||
| Derivative liability | $ | 41 | $ | 29 | $ | — | $ | 70 | |||
| Total Level 3 instruments | $ | 41 | $ | 29 | $ | — | $ | 70 | |||
| (Dollars in thousands) | Total (Gains) / | |||||||||||
| Beginning | Losses | Purchases, | Ending Balance as | |||||||||
| Balance as of | Realized and | Issuances, Sales | of December 31, | |||||||||
| Instrument | Jan. 1, 2010 | Unrealized | and Settlements | 2010 | ||||||||
| Derivative liability | $ | 70 | $ | 3 | $ | — | $ | 73 | ||||
| Total Level 3 instruments | $ | 70 | $ | 3 | $ | — | $ | 73 | ||||
9. Stockholders’ Equity
Common Shares
The Company has one class of common stock, par value $.01. Each share of the Company’s common stock is entitled to one vote on all matters submitted to stockholders. As of December 31, 2011 and 2010 there were 5,254,883 and 4,771,658, respectively shares are as follows for the years ended December 31:
| 2007 | 2008 | 2009 | |||||
| Balance, beginning | 5,760,585 | 5,777,578 | 5,776,750 | ||||
| Fractional shares redeemed during reverse stock split | — | (203 | ) | — | |||
| Issuance of shares for stock option exercises | 10,743 | — | — | ||||
| Issuance of shares for restricted and unrestricted stock grants | 6,875 | — | — | ||||
| Forfeiture of restricted stock grants | (625 | ) | (625 | ) | — | ||
| Balance, ending | 5,777,578 | 5,776,750 | 5,776,750 | ||||
| 2007 | 2008 | 2009 | |||
| Balance, beginning | 1,005,092 | 1,005,092 | 1,005,092 | ||
| Balance, ending | 1,005,092 | 1,005,092 | 1,005,092 | ||
Sale of Common Stock
On December 15, 2006, the Company entered into agreements with certain investors to sell 756,944 shares of common stock and warrants to purchase 378,472 shares of common stock for an aggregate purchase price of $10,900 thousand.$10.9 million. The common stock and warrants were sold in units, with each unit consisting of 12.5 shares of common stock and a warrant to purchase 6.25 shares of common stock, at an exercise price of $18.16 per share. Each non-certificated unit was sold at a negotiated price of $180.00. The shares of common stock and warrants were immediately separable and were issued separately (see Warrants Issued below). The common stock, the warrants and shares issuable upon exercise of the warrants arewere registered with the SEC on the Company’s filedSecurities and effective registration statement.
Warrants Issued
On December 20, 2006, the Company issued warrants to investors to purchase 378,472 shares of the Company’s common stock at an exercise price of $18.16 per share. These warrants will be fair valued by the Company until expiration or exercise of the warrants. The warrants became exercisable on June 20, 2007 and expireexpired on December 19, 2011. These warrants were fair valued by the Company until the expiration of the warrants. The fair value of the warrants at December 31, 20082011 and 20092010 was $41$0 and $73 thousand, respectively.
Reservation of Shares
The Company has reserved common shares for future issuance as follows as of December 31, 2011:
| Stock options outstanding | 797,437 |
| Stock awards available for issuance | 261,601 |
| Number of common shares reserved | 1,059,038 |
F-18
10. Issuance of Common Stock, Warrants and $70 thousand, respectively.
MTI Micro was formed on March 26, 2001, and, as of December 31, 2011, the Company owned approximately 47.6% of MTI Micro’s outstanding common stock, or 75,049,937 shares, and 53.3% of the common stock and warrants issued, which includes 32,904,136 warrants outstanding. The number of shares of MTI Micro common stock authorized for issuance is 240,000,000 as of December 31, 2011.
Common Stock Issued – MTI Micro
On January 11, 2010, MTI Micro entered into a Purchase Agreement with Counter Point. Counter Point is a venture capital fund sponsored and managed by Dr. Walter L. Robb, a member of the Board of Directors of the Company and MTI Micro, and a current stockholder of MTI Micro. Pursuant to the Purchase Agreement, MTI Micro issued and sold to Counter Point 28,571,429 shares of common stock, par value $0.01 per share (the MTI Micro Common Stock), at a purchase price per share of $0.07, over a period of twelve months, and warrants (MTI Micro Warrants) to purchase shares of MTI Micro Common Stock equal to 20% of the shares of MTI Micro Common Stock purchased under the Purchase Agreement at an exercise price of $0.07 per share. The sale and issuance of the MTI Micro Common Stock and MTI Micro Warrants occurred over multiple closings (each, a Closing). Nine Closings occurred through December 31, 2010, with MTI Micro raising $1.9 million from the sale of 26,952,386 shares of MTI Micro Common Stock and MTI Micro Warrants to purchase 5,390,477 shares of MTI Micro Common Stock to Counter Point. The final Closing occurred on January 5, 2011, with MTI Micro raising $113 thousand from the sale of 1,619,043 shares of MTI Micro Common Stock and MTI Micro Warrants to purchase 323,809 shares of MTI Micro Common Stock to Counter Point.
On February 9, 2011, Amendment No. 1 was entered into between MTI Micro and Counter Point. Pursuant to Amendment No. 1, MTI Micro issued and sold to Counter Point 6,428,574 shares of MTI Micro Common Stock at a purchase price per share of $0.07, through December 31, 2011, and MTI Micro Warrants to purchase shares of MTI Micro Common Stock equal to 20% of the shares of MTI Micro Common Stock purchased under Amendment No. 2 at an exercise price of $0.07 per share. The sale and issuance of the MTI Micro Common Stock and MTI Micro Warrants occurred over multiple closings (each, a Closing) occurring over four one-month closing periods (each, a Closing Period). Four Closings occurred through September 30, 2011, with MTI Micro raising $450 thousand from the sale of 6,428,574 shares of MTI Micro Common Stock and MTI Micro Warrants to purchase 1,285,715 shares of MTI Micro Common Stock to Counter Point.
On September 23, 2011, Amendment No. 2 was entered into between MTI Micro and Counter Point. Pursuant to Amendment No. 2, MTI Micro issued and sold to Counter Point 1,200,000 shares of MTI Micro Common Stock at a purchase price per share of $0.07, through December 31, 2011, and MTI Micro Warrants to purchase shares of MTI Micro Common Stock equal to 20% of the shares of MTI Micro Common Stock purchased under Amendment No. 2 at an exercise price of $0.07 per share. The sale and issuance of the MTI Micro Common Stock and MTI Micro Warrants occurred over multiple closings (each, a Closing) occurring over four one-month closing periods (each, a Closing Period). Four Closings occurred through December 31, 2011, with MTI Micro raising $84 thousand from the sale of 1,200,000 shares of MTI Micro Common Stock and MTI Micro Warrants to purchase 240,000 shares of MTI Micro Common Stock to Counter Point.
The following table represents changes in ownership between the Company and non-controlling interests (NCI) in common shares of MTI Micro:
| MTI | Non Controlling Interest | |||||||||||||
| Average | Ownership | Ownership | ||||||||||||
| Price | Shares | % | Shares | % | Total Shares | |||||||||
| Balance at 12/31/2008 | 63,797,770 | 97.3 | 1,750,345 | 2.7 | 65,548,115 | |||||||||
| Stock issued for MTI Options to MFC Employees | $ | 0.14 | 10,501 | 10,501 | ||||||||||
| Conversion of Bridge Loan | $ | 0.07 | 11,241,666 | 44,622,759 | 55,864,425 | |||||||||
| Balance at 12/31/09 | 75,049,937 | 61.8 | 46,373,104 | 38.2 | 121,423,041 | |||||||||
| Stock issued under Purchase Agreement | $ | 0.07 | 26,952,386 | 26,952,386 | ||||||||||
| Balance at 12/31/10 | 75,049,937 | 50.6 | 73,325,490 | 49.4 | 148,375,427 | |||||||||
| Stock issued under Purchase Agreement, 2011 | $ | 0.07 | 1,619,043 | 1,619,043 | ||||||||||
| Balance after Purchase Agreement | 75,049,937 | 50.04 | 74,944,533 | 49.97 | 149,994,470 | |||||||||
| Stock issued under Amendment No. 1 | $ | 0.07 | 6,428,574 | 6,428,574 | ||||||||||
| Stock issued under Amendment No. 2 | $ | 0.07 | 1,200,000 | 1,200,000 | ||||||||||
| Balance at 12/31/11 | 75,049,937 | 47.61 | 82,573,107 | 52.39 | 157,623,044 | |||||||||
F-19
Reservation of Shares
MTI Micro has reserved common shares for future issuance, broken down between the Company and NCI, as follows as of December 31, 2011:
| MTI | NCI | Total | |||
| Stock options outstanding | — | 25,124,220 | 25,124,220 | ||
| Warrants outstanding | 32,904,136 | 12,196,411 | 45,100,547 | ||
| Number of shares reserved for outstanding options and warrants | 32,904,136 | 37,320,631 | 70,224,767 |
In addition, MTI Micro has 12,882,780 stock options available for issuance.
As of December 31, 2011, the Company owned an aggregate of approximately 47.6% of the outstanding shares of MTI Micro or 53.3% of the outstanding common stock and warrants issued of MTI Micro, and Dr. Robb and Counter Point owned approximately 45.2% and 5.1%, respectively of the outstanding shares of MTI Micro or 40.3% and 4.3%, respectively of the outstanding common stock and warrants issued of MTI Micro.
Warrants Issued – MTI Micro
On December 9, 2009, MTI Micro issued warrants to the then current shareholders of MTI Micro, including the Company, without consideration, to purchase 32,779,310 shares of MTI Micro Stock at an exercise price of $0.07 per share. The warrants becomebecame exercisable on December 9, 2010 and expire on December 8, 2017. The warrants have been accounted for as an equity distribution of $2,030 thousand,$2.0 million, including warrants to the Company with a value of $1,974 thousand that$2.0 million, which were eliminated in consolidation.
On December 9, 2009, MTI Micro issued warrants to the Bridge Investors of MTI Micro, including the Company, to purchase 5,081,237 shares of MTI Micro Stock at an exercise price of $0.07 per share. The MTI Micro Warrants became exercisable on December 9, 2009 and will expire on the earlier of: (i) April 15, 2014; (ii) immediately prior to a change in control; or (iii) immediately prior to an initial public offering of MTI Micro. The warrantsMTI Micro Warrants were issued without consideration and were accounted for as equity and a loss on extinguishment of debt was recorded in the amount of $289 thousand, including warrants to the Company with a value of $57 thousand, thatwhich were eliminated in consolidation.
Under the Purchase Agreement entered into on January 11, 2010, MTI Micro issued 5,714,286 MTI Micro Warrants to Counter Point to purchase shares of MTI Micro Common Stock at an exercise price of $0.07 per share. The MTI Micro Warrants became exercisable on the date of issuance and will expire on the earlier of: (a) the five (5) year anniversary of the Date of Issuance of the Warrant; (b)immediately prior to a change in control; or (c) the closing of a firm commitment underwritten public offering pursuant to a registration statementunder the Securities Act. The MTI Micro Warrants were accounted for as equity.
Under Amendment No. 1 entered into on February 9, 2011, MTI Micro issued 1,285,715 MTI Micro Warrants to Counter Point to purchase shares of MTI Micro Common Stock at an exercise price of $0.07 per share. The MTI Micro Warrants became exercisable on the date of issuance and will expire on the earlier of: (a) the five (5) year anniversary of the Date of Issuance of the Warrant; (b)immediately prior to a change in control; or (c) the closing of a firm commitment underwritten public offering pursuant to a registration statementunder the Securities Act. The MTI Micro Warrants were accounted for as equity.
Under Amendment No. 2 entered into on September 23, 2011, MTI Micro issued 240,000 MTI Micro Warrants to Counter Point to purchase shares of MTI Micro Common Stock at an exercise price of $0.07 per share. The MTI Micro Warrants became exercisable on the date of issuance and will expire on the earlier of: (a) the five (5) year anniversary of the Date of Issuance of the Warrant; (b)immediately prior to a change in control; or (c) the closing of a firm commitment underwritten public offering pursuant to a registration statementunder the Securities Act. The MTI Micro Warrants were accounted for as equity.
Refer to Note 17 for further discussion.
11. Retirement Plan
The Company maintains a voluntary savings and retirement plan under Internal Revenue CodeIRC Section 401(k) covering substantially all employees. Employees must complete six months of service and have attained the age of twenty-one prior to becoming eligible for participation in the plan. The Company plan allows eligible employees to contribute a percentage of their compensation on a pre-tax basis and the Company matches employee contributions dollar for dollar up to a discretionary amount, currently 4%, of the employee’s salary, subject to annual tax deduction limitations. Company matching contributions vest at a rate of 25% annually for each year of service completed. Company matching contributions were $283, $136,$99, $107, and $141 thousand for 2007, 2008,2011, 2010, and 2009, respectively. The Company may also make additional discretionary contributions in amounts as determined by management and the Board of Directors. There were no additional discretionary contributions by the Company for the years 2007, 2008,2011, 2010, or 2009.
F-20
12. LossIncome (Loss) per Share
The following table sets forth the reconciliation of the numerators and denominators of the basic and diluted per share computations for continuing operations for the years ended December 31:
| 2007 | 2008 | 2009 | |||||||||
| (dollars in thousands, except shares) | |||||||||||
| Numerator: | |||||||||||
| Net loss | $ | (9,575 | ) | $ | (12,504 | ) | $ | (3,099 | ) | ||
| Denominator: | |||||||||||
| Basic EPS: | |||||||||||
| Common shares outstanding, beginning of period | 4,755,493 | 4,772,486 | 4,771,658 | ||||||||
| Weighted average common shares issued during the | |||||||||||
| period | 9,111 | — | — | ||||||||
| Weighted average restricted shares forfeited during the | |||||||||||
| period | (360 | ) | (323 | ) | — | ||||||
| Weighted average common shares deemed during the | |||||||||||
| period in conjunction with the reverse stock split | — | (127 | ) | — | |||||||
| Effect of non-vested restricted stock | (697 | ) | 323 | — | |||||||
| Denominator for basic earnings per common shares — | |||||||||||
| Weighted average common shares | 4,763,547 | 4,772,359 | 4,771,658 | ||||||||
| Diluted EPS: | |||||||||||
| Common shares outstanding, beginning of period | 4,755,493 | 4,772,486 | 4,771,658 | ||||||||
| Weighted average common shares issued during the | |||||||||||
| period | 9,111 | — | — | ||||||||
| Weighted average restricted shares forfeited during the | |||||||||||
| period | (360 | ) | (323 | ) | — | ||||||
| Weighted average common shares deemed during the | |||||||||||
| period in conjunction with the reverse stock split | — | (127 | ) | — | |||||||
| Effect of non-vested restricted stock due to anti-dilutive | |||||||||||
| effect | (697 | ) | 323 | — | |||||||
| Denominator for diluted earnings per common | |||||||||||
| shares — Weighted average common shares | 4,763,547 | 4,772,359 | 4,771,658 | ||||||||
| 2011 | 2010 | 2009 | ||||||||
| (dollars in thousands, except shares) | ||||||||||
| Numerator: | ||||||||||
| Net income (loss) | $ | 2,386 | $ | (1,758 | ) | $ | (3,099 | ) | ||
| Denominator: | ||||||||||
| Basic EPS: | ||||||||||
| Common shares outstanding, beginning of period | 4,771,658 | 4,771,658 | 4,771,658 | |||||||
| Weighted average common shares issued during the period | 230,276 | — | — | |||||||
| Denominator for basic earnings per common shares — | ||||||||||
| Weighted average common shares | 5,001,934 | 4,771,658 | 4,771,658 | |||||||
| Diluted EPS: | ||||||||||
| Common shares outstanding, beginning of period | 4,771,658 | 4,771,658 | 4,771,658 | |||||||
| Weighted average common shares issued during the period | 230,276 | — | — | |||||||
| Denominator for diluted earnings per common shares - | ||||||||||
| Weighted average common shares | 5,001,934 | 4,771,658 | 4,771,658 | |||||||
Not included in the computation of earnings per share, assuming dilution for the year ended December, 2011, were options to purchase 797,437 shares of the Company’s common stock. These potentially dilutive items were excluded even though the average market price of the common stock exceeded the exercise prices for a portion of the options because the calculation of incremental shares resulted in an anti-dilutive effect.
Not included in the computation of earnings per share-assuming dilution for the year ended December 31, 20072010 were options to purchase 776,696878,986 shares of the Company’s common stock and warrants to purchase 378,472 shares of the Company’s stock, 625 unvested restricted shares of the Company’s common stock and options to purchase 22,668 shares of MTI Micro’s common stock. These potentially dilutive items were excluded because the Company incurred a loss for this period and their inclusion would be anti-dilutive.
Not included in the computation of earnings per share-assuming dilution for the year ended December 31, 2009 were options to purchase 716,403 shares of the Company’s common stock and warrants to purchase 378,472 shares of the Company’s stock, and options to purchase 15,001 shares of MTI Micro’s common stock. These potentially dilutive items were excluded because the Company incurred a loss for this period and their inclusion would be anti-dilutive.
13. Stock Based Compensation
MTI Option Plans
Stock-based incentive awards are provided to employees and directors under the terms of the Company’s 1996 Stock Incentive Plan (“1996 Plan”)(1996 Plan), 1999 Employee Stock Incentive Plan (“1999 Plan”)(1999 Plan) and 2006 Equity Incentive Plan (“2006 Plan”)(2006 Plan), which was amended and restated effective June 30, 2011 and September 16, 2009, (collectively, the “Plans”)Plans). Awards under the Plans have generally included at-the-money options and restricted stock grants.
The 1996 Plan was approved by stockholders during December 1996 and expired during October 2006. The 1996 Plan provided an initial aggregate number of 500,000 shares of common stock to be awarded or issued. The number of shares available to be awarded under the 1996 Plan and awards outstanding were adjusted for stock splits and rights offerings. The total number of shares which may be awarded under the 1996 Plan was 468,352 during 2005. Under the 1996 Plan, the Board of Directors was authorized to issue stock options, stock appreciation rights, restricted stock, and other stock-based incentives to officers, employees and others.
The 1999 Plan was adopted by the Company’s Board of Directors, and approved by stockholders on March 18, 1999.1999 and expired during 2009. The 1999 Plan provides thatprovided an initial aggregate number of 1,000,000 shares of common stock mayto be awarded or issued. The number of shares which mayto be awarded under the 1999 Plan and awards outstanding have beenwere adjusted for stock splits, and during 2005, 2006, and 2007,the total number of shares which maycould be awarded under the 1999 Plan was 562,500 shares. Under the 1999 Plan, the Board of Directors iswas authorized to issue stock-based awards to officers, employees and others.
F-21
The 2006 Plan was adopted by the Company’s Board of Directors on March 16, 2006 and approved by stockholders on May 18, 2006. The plan was amended and restated by the Board of Directors and restated effective September 16, 2009.2009 and June 30, 2011. The September 16, 2009 Amended and Restated 2006 Equity Incentive Plan increased the initial aggregate number of 250,000 shares of common stock which may be awarded or issued to 600,000.600,000, and the June 30, 2011 Amended and Restated 2006 Equity Incentive Plan increased the aggregate number of shares of common stock which may be awarded or issued to 1,200,000. The number of shares which may be awarded under the 2006 Plan and awards outstanding havehas been adjusted for stock splits and other similar events. Under the 2006 Plan, the Board of Directors is authorized to issue stock options, stock appreciation rights, restricted stock, and other stock-based incentives to officers, employees and others.
Stock-based compensation expense for the year ended December 31, 20092011 was generated from stock options andfully vested restricted stock grants.grants and fully vested stock awards. Stock options are awards which allow holders to purchase shares of the Company’s common stock at a fixed price. Stock options issued to employees generally vest 25% per year beginning one year after grant.50% immediately, and then quarterly over the next three years. Options issued to non-employee members of the MTI Board of Directors generally vest upon grant. Certain options granted may be fully or partially exercisable immediately, may vest on other than a four year schedule or vest upon attainment of specific performance criteria. Restricted stock awards generally vest one year after the date of grant; however, certain awards may vest immediately or vest upon attainment of specific performance criteria. Option exercise prices are generally equivalent to the closing market value price of the Company’s common stock on the date of grant. Unexercised options generally terminate either seven or ten years after date of grant.
The Company estimates the fair value of stock options using a Black ScholesBlack-Scholes valuation model consistent with the accounting standards.model. Key inputs and assumptions used to estimate the fair value of stock options include the grant price of the award, the expected option term, volatility of the Company’s stock, an appropriate risk-free rate, and the Company’s dividend yield. Estimates of fair value are not intended to predict actual future events or the value ultimately realized by employees who receive equity awards, and subsequent events are not indicative of the reasonableness of the original estimates of fair value made by the Company.
During 2011, the Company granted 483,225 restricted stock units, which immediately vested and the stock was issued to holders. The fair value of these grants was based on the closing market value price of the Company’s common stock on the date of grant. The weighed average exercise prices of these grants was $.62 per share.
There were no stock options granted during 2011 and 2009.
The fair value of each 2010 stock option grant was estimated at the date of grant using a Black-Scholes Option Pricing model.Model. The following table presents the weighted-average assumptions used for options granted:
| 2008 | 2009 | ||||||
| Option term (years) | 4.4 | 3.34 | |||||
| Volatility | 81.72 | % | 115.3 – 117 | % | |||
| Risk-free interest rate range | 1.55-3.36 | % | 2.28-2.49 | % | |||
| Dividend yield | 0 | % | 0 | % | |||
| Weighted-average fair value per option granted | $ | 1.71 | $ | 1.02 | |||
| 2010 | |||
| Option term (years) | 5.03 | ||
| Volatility | 128.3 – 150 | % | |
| Risk-free interest rate range | 1.46 – 2.04 | % | |
| Dividend yield | 0 | % | |
| Weighted-average fair value per option granted | $ | 0.54 | |
Share-based compensation expense recognized in the Consolidated Statements of Operations is based on awards ultimately expected to vest, therefore, awards are reduced for estimated forfeitures. The revised accounting standard requires forfeitures to be estimated at the time of grant and revised, if necessary, in subsequent periods if actual forfeitures differ from those estimates.
Total share-based compensation expense, related to all of the Company’s share-based awards, recognized for the years ended December 31, was comprised as follows:
| 2007 | 2008 | 2009 | |||||||||
| (dollars in thousands, except eps) | |||||||||||
| Unfunded research and product development | $ | 216 | $ | 186 | $ | 92 | |||||
| Selling, general and administrative | 1,342 | 658 | 413 | ||||||||
| Share-based compensation expense | $ | 1,558 | $ | 844 | $ | 505 | |||||
| Impact on basic and diluted EPS | $ | (0.33 | ) | $ | (0.18 | ) | $ | (0.11 | ) | ||
| 2011 | 2010 | 2009 | ||||||||
| (dollars in thousands, except eps) | ||||||||||
| Unfunded research and product development | $ | 18 | $ | 21 | $ | 92 | ||||
| Selling, general and administrative | 370 | 226 | 413 | |||||||
| Share-based compensation expense | $ | 388 | $ | 247 | $ | 505 | ||||
| Impact on basic and diluted EPS | $ | 0.08 | $ | (0.05 | ) | $ | (0.11 | ) | ||
Total unrecognized compensation costs related to non-vested awards as of December 31, 2008 and December 31, 20092011 is $744$104 thousand, and $105 thousand, respectively and is expected to be recognized over a weighted-average vesting period of approximately .98 years and 1.24 years, respectively.0.87 years.
F-22
As a result of the amendmentamendments in 2011 and 2009 of the 2006 plan, 450,000Plan, 600,000 and 350,000 additional shares were made available for granting.granting, respectively. Presented below is a summary of the Company’s stock option plans’ activity for the years ended December 31:
| 2007 | 2008 | 2009 | ||||||
| Shares under option, beginning | 688,649 | 776,696 | 780,340 | |||||
| Granted | 231,719 | 213,039 | 171,750 | |||||
| Exercised | (10,743 | ) | — | — | ||||
| Canceled/Forfeited | (65,115 | ) | (58,956 | ) | (89,799 | ) | ||
| Expired | (67,814 | ) | (150,439 | ) | (145,888 | ) | ||
| Shares under option, ending | 776,696 | 780,340 | 716,403 | |||||
| Options exercisable | 578,544 | 532,298 | 571,617 | |||||
| Remaining shares available for granting of options | 128,105 | 68,641 | 316,216 | |||||
| 2011 | 2010 | 2009 | ||||||
| Shares under option, beginning | 878,986 | 716,403 | 780,340 | |||||
| Granted | — | 216,000 | 171,750 | |||||
| Exercised | — | — | — | |||||
| Canceled/Forfeited | (4,851 | ) | (8,506 | ) | (89,799 | ) | ||
| Expired | (76,698 | ) | (44,911 | ) | (145,888 | ) | ||
| Shares under option, ending | 797,437 | 878,986 | 716,403 | |||||
| Options exercisable | 719,229 | 719,623 | 571,617 | |||||
| Remaining shares available for granting of options | 261,601 | 114,591 | 316,216 | |||||
The weighted average exercise price for the Plans is as follows for each of the years ended December 31:
| 2007 | 2008 | 2009 | |||
| Shares under option, beginning | 32.32 | 25.92 | 21.56 | ||
| Granted | 10.96 | 2.80 | 1.31 | ||
| Exercised | 5.60 | — | — | ||
| Canceled/Forfeited | 28.40 | 13.10 | 23.78 | ||
| Expired | 41.04 | 20.57 | 25.14 | ||
| Shares under option, ending | 25.92 | 21.56 | 15.97 | ||
| Options exercisable, ending | 28.40 | 28.33 | 12.10 |
| 2011 | 2010 | 2009 | |||
| Shares under option, beginning | 11.41 | 15.97 | 21.56 | ||
| Granted | — | 0.59 | 1.31 | ||
| Exercised | — | — | — | ||
| Canceled/Forfeited | 3.23 | 8.85 | 4.09 | ||
| Expired | 20.73 | 32.64 | 35.91 | ||
| Shares under option, ending | 10.56 | 11.41 | 15.97 | ||
| Options exercisable, ending | 11.63 | 13.59 | 18.72 |
The following table summarizes information for options outstanding and exercisable atfor the Plans as of December 31, 2009:
| Outstanding Options | Options Exercisable | |||||||||||
| Weighted Average | Weighted | Weighted | ||||||||||
| Exercise | Remaining | Average | Average | |||||||||
| Price Range | Number | Contractual Life | Exercise Price | Number | Exercise Price | |||||||
| $0.00 - $1.15 | 60,000 | 9.72 | $ | 1.15 | 60,000 | $ | 1.15 | |||||
| $1.16 - $3.60 | 238,625 | 7.67 | $ | 1.85 | 130,523 | $ | 1.78 | |||||
| $3.61 - $14.24 | 137,505 | 4.43 | $ | 11.33 | 107,316 | $ | 11.64 | |||||
| $14.25 - $22.64 | 53,386 | 4.08 | $ | 19.07 | 53,251 | $ | 19.07 | |||||
| $22.65 - $33.36 | 81,189 | 3.97 | $ | 29.06 | 80,680 | $ | 29.07 | |||||
| $33.37 - $50.24 | 142,260 | 3.12 | $ | 40.24 | 136,409 | $ | 40.45 | |||||
| $50.25 - $103.76 | 3,438 | 0.57 | $ | 79.40 | 3,438 | $ | 79.40 | |||||
| 716,403 | 5.59 | $ | 15.97 | 571,617 | $ | 18.72 | ||||||
| Outstanding Options | Options Exercisable | ||||||||||
| Weighted Average | Weighted | Weighted | |||||||||
| Exercise | Remaining | Average | Average | ||||||||
| Price Range | Number | Contractual Life | Exercise Price | Number | Exercise Price | ||||||
| $0.00 - $1.15 | 272,211 | 8.38 | $ | 0.72 | 211,569 | $ | 0.75 | ||||
| $1.16 - $3.60 | 214,554 | 5.76 | $ | 1.72 | 197,042 | $ | 1.75 | ||||
| $3.61 - $14.24 | 103,067 | 2.32 | $ | 11.74 | 103,013 | $ | 11.75 | ||||
| $14.25 - $22.64 | 45,289 | 2.22 | $ | 19.39 | 45,289 | $ | 19.39 | ||||
| $22.65 - $33.36 | 58,248 | 2.93 | $ | 30.37 | 58,248 | $ | 30.37 | ||||
| $33.37 - $50.24 | 104,068 | 1.63 | $ | 38.47 | 104,068 | $ | 38.47 | ||||
| 797,437 | 5.26 | $ | 10.56 | 719,229 | $ | 11.63 | |||||
The aggregate intrinsic value (i.e. the difference between the closing stock price and the price to be paid by the option holder to exercise the option) is zero$0 for both the Company’s outstanding options and $0 for the exercisable options as of December 31, 2009.2011. The amounts are based on the Company’s closing stock price of $1.16$0.50 as of December 31, 2009.
There were no unvested restricted stock options for the period ended December 31, 2009. The aggregate intrinsic value of restricted stock vested during the year ended December 31, 2009 was zero.
MTI Micro Option Plans
MTI Micro has two plans for issuing MTI Micro stock-based incentive awards; the MTI MicroFuel Cells Inc. 2001 Employee, Director and Consultant Stock Option Plan (“2001(2001 MTI Micro Plan”)Plan) and the MTI MicroFuel Cells Inc. 2009 Stock Plan (“2009(2009 Micro Plan”)Plan), (collectively, the MTI Micro Plans).
The 2001 MTI Micro Plan was approved by MTI Micro’s stockholders in 2001 and provided an initial aggregate number of 1,766,000 shares of MTI Micro common stock to be awarded. The number of shares which may be awarded under the 2001 MTI Micro Plan and awards outstanding have been adjusted for a 2004 reverse stock split, and during 2005, 2006, and 2007, the total number of shares which may be awarded under the 2001 MTI Micro Plan were 3,416,667 shares. Under the 2001 MTI Micro Plan, the MTI Micro Board of Directors was authorized to award stock options to officers, directors, employees and consultants. During 2005, MTI Micro ceased making grants under the 2001 MTI Micro Plan and determined that it would make no new awards under this plan in the future.
The MTI Micro Board of Directors approved the MTI MicroFuel Cells Inc. 2009 StockMicro Plan on December 8, 2009. This plan provided an initial aggregate number of 38,000,000 shares of MTI Micro’s common stock to be awarded. Under the 2009 MTI Micro Plan, the MTI Micro Board of Directors is authorized to award stock options to directors, employees, consultants and advisors of MTI Micro. As of December 31, 2009,
F-23
There were no awards have beenstock options granted underin 2011 and 2009.
On September 15, 2010, MTI Micro granted 6,330,520 options to its employees from the 2009 Micro Plan.
The key inputs and assumptions used to estimate the accounting treatment requires recognitionfair value of these 2010 stock options were as follows:
| Option term | 5 years | ||
| Volatility | 115 | % | |
| Risk-free interest rate | 1.46 | % | |
| Dividend yield | 0 | % | |
| Fair value per option granted | $ | 0.07 | |
The amount of expense recognized for this grant was $52 thousand and $187 thousand for 2011 and 2010, respectively. Share-based compensation expense recognized in the Consolidated Statement of Operations is based on awards ultimately expected to vest, therefore, awards are reduced for variable award plansestimated forfeitures. The accounting standard requires forfeitures to be estimated at the time of grant and revised, if necessary, in subsequent periods if actual forfeitures differ from those estimates. The Company has assumed a forfeiture rate of 5% for this grant.
On February 10, 2010, MTI Micro granted 28,296,800 options to its employees from the 2009 Micro Plan. The options vest 50% on the grant date and 50% ratably on a quarterly basis over the vesting periodsnext three years. The fair value of such plans,these stock options granted was estimated at the date of grant using a Black-Scholes Option Pricing Model.
The key inputs and assumptions used to estimate the fair value of these stock options were as follows:
| Option term | 5 years | ||
| Volatility | 115 | % | |
| Risk-free interest rate | 2.39 | % | |
| Dividend yield | 0 | % | |
| Fair value per option granted | $ | 0.07 | |
The amount of expense recognized for this grant was $221 thousand and $1.01 million for 2011 and 2010, respectively. Share-based compensation expense recognized in the Consolidated Statement of Operations is based upon the then-current market values of the underlying stock. As of January 1, 2006, MTI Micro is accountingon awards ultimately expected to vest, therefore, awards are reduced for employee stock-based compensation under the revisedestimated forfeitures. The accounting standard requires forfeitures to be estimated at the time of grant and revised, if necessary, in subsequent periods if actual forfeitures differ from those estimates. The Company has assumed a forfeiture rate of 5% for share-based payments.
Presented below is a summary of compensation expense, which is included in the summary of the Company’s compensation expense under all share-based awards above, for the MTI Micro plans:
| 2007 | 2008 | 2009 | ||||||
| (dollars in thousands) | ||||||||
| Stock options | $ | 12 | $ | 2 | $ | — | ||
| Total stock-based compensation expense | $ | 12 | $ | 2 | $ | — | ||
| 2011 | 2010 | 2009 | ||||||
| (dollars in thousands) | ||||||||
| Stock option compensation expense | $ | 273 | $ | 1,199 | $ | — | ||
| Total stock-based compensation expense | $ | 273 | $ | 1,199 | $ | — | ||
Total unrecognized compensation costs related to non-vested awards as of December 31, 2011 is $233 thousand.
Presented below is a summary of the MTI Micro stock option plansPlans activity for the years ended December 31:
| 2011 | 2010 | 2009 | |||||
| Shares under option, beginning | 33,050,720 | 15,001 | 15,001 | ||||
| Granted | — | 34,627,320 | — | ||||
| Exercised | — | — | — | ||||
| Canceled/Forfeited | (7,926,500 | ) | (1,591,601 | ) | — | ||
| Shares under option, ending | 25,124,220 | 33,050,720 | 15,001 | ||||
| Options exercisable | 20,040,419 | 20,131,783 | 15,001 | ||||
| Remaining shares available for granting of options | 12,882,780 | 4,956,280 | 38,000,000 | ||||
F-24
| 2007 | 2008 | 2009 | |||||
| Shares under option, beginning | 33,668 | 22,668 | 15,001 | ||||
| Granted | — | — | — | ||||
| Exercised | — | — | — | ||||
| Canceled/Forfeited | (11,000 | ) | (7,667 | ) | — | ||
| Shares under option, ending | 22,668 | 15,001 | 15,001 | ||||
| Options exercisable | 18,626 | 15,001 | 15,001 | ||||
| Remaining shares available for granting of options | 3,336,196 | 3,343,863 | 38,000,00 | ||||
The weighted average exercise price for the MTI Micro optionsPlans is as follows for each of the years ended December 31:
| 2007 | 2008 | 2009 | ||||||
| Shares under option, beginning | $ | 3.61 | $ | 3.70 | $ | 3.89 | ||
| Granted | — | — | — | |||||
| Exercised | — | — | — | |||||
| Canceled/Forfeited | 3.42 | 3.33 | — | |||||
| Shares under option, ending | 3.70 | 3.89 | 3.89 | |||||
| Options exercisable, ending | 3.63 | 3.89 | 3.89 | |||||
| 2011 | 2010 | 2009 | ||||||
| Shares under option, beginning | $ | 0.07 | $ | 3.89 | $ | 3.89 | ||
| Granted | — | 0.07 | — | |||||
| Exercised | — | — | — | |||||
| Canceled/Forfeited | 0.07 | 0.09 | — | |||||
| Shares under option, ending | 0.07 | 0.07 | 3.89 | |||||
| Options exercisable, ending | 0.07 | 0.07 | 3.89 | |||||
The weighted average fair value of stock options granted is required to be based on a theoretical statistical model using the preceding Black-Scholes Option Pricing modelModel assumptions.
| Outstanding Options | Options Exercisable | |||||||||||
| Weighted Average | ||||||||||||
| Exercise | Remaining | Weighted Average | Weighted Average | |||||||||
| Price Range | Number | Contractual Life | Exercise Price | Number | Exercise Price | |||||||
| $2.55 - $2.75 | 2,000 | 3.25 | $ | 2.55 | 2,000 | $ | 2.55 | |||||
| $2.76 - $3.79 | 3,334 | 3.95 | $ | 2.76 | 3,334 | $ | 2.76 | |||||
| $3.80 - $4.65 | 1,167 | 2.86 | $ | 3.80 | 1,167 | $ | 3.80 | |||||
| $4.66 - $4.66 | 8,500 | 4.25 | $ | 4.66 | 8,500 | $ | 4.66 | |||||
| 15,001 | 3.94 | $ | 3.89 | 15,001 | $ | 3.89 | ||||||
The following table summarizes information for options outstanding and exercisable options are zero, since all exercise prices are abovefor the estimated common stock fair value price.
| Outstanding Options | Options Exercisable | ||||||||||
| Weighted Average | Weighted | Weighted | |||||||||
| Exercise | Remaining | Average | Average | ||||||||
| Price Range | Number | Contractual Life | Exercise Price | Number | Exercise Price | ||||||
| $0.07 - $2.54 | 25,117,220 | 8.23 | $ | 0.07 | 20,033,419 | $ | 0.07 | ||||
| $2.55 - $3.79 | 2,000 | 1.25 | $ | 2.55 | 2,000 | $ | 2.55 | ||||
| $3.80 - $4.65 | 1,167 | 0.86 | $ | 3.80 | 1,167 | $ | 3.80 | ||||
| $4.66 - $4.66 | 3,833 | 2.25 | $ | 4.66 | 3,833 | $ | 4.66 | ||||
| 25,124,220 | 8.23 | $ | 0.07 | 20,040,419 | $ | 0.07 | |||||
14. Cash Flows — Supplemental Information
| Years Ended December 31, | ||||||||||
| 2007 | 2008 | 2009 | ||||||||
| (dollars in thousands) | ||||||||||
| Non-Cash Investing and Financing Activities: | ||||||||||
| Change in investment and paid-in capital resulting from other | ||||||||||
| investors’ activity in MTI Micro stock | $ | (521 | ) | $ | (128 | ) | $ | 3,411 | ||
| Years Ended December 31, | ||||||||
| 2011 | 2010 | 2009 | ||||||
| (dollars in thousands) | ||||||||
| Non-Cash Financing Activities: | ||||||||
| Change in investment and paid-in capital resulting from other | ||||||||
| investors’ activity in MTI Micro stock | $ | — | $ | — | $ | 3,411 | ||
15. Derivatives
The Company held or hashad outstanding as of December 31, the following derivative financial instruments:
| 2008 | 2009 | Expiration | |||
| Derivatives issued: | |||||
| Warrants, exercisable beginning June 20, 2007, to purchase the | |||||
| Company’s common stock issued to three investors at a purchase | |||||
| price of $18.16 per share | 378,472 | 378,472 | 12/19/2011 |
| 2011 | 2010 | Expiration | |||
| Derivatives issued: | |||||
| Warrants, exercisable beginning June 20, 2007, to purchase the | |||||
| Company’s common stock issued to three investors at a purchase | |||||
| price of $18.16 per share | — | 378,472 | 12/19/2011 |
Warrant Derivative to Purchase MTI Common Stock:The warrants issued during the Company’s December 2006 capital raise were legally freestanding, detachable and transferable by the holders. The features of the warrant allowed both straight cash exercises as well as cashless exercises. Due primarily to a stipulation in the warrant agreement which allowed a potential cash settlement with the holders if the Company was acquired by, or merged with a private company, these warrants were classified as an asset/liability derivative in accordance with the accounting guidance (paragraph 11) and EITF 00-19.guidance.
The estimated fair value of this warrant at the date issued was $10.16$18.16 per share, using a Black-Scholes Option Pricing modelModel and assumptions similar to those used for valuing the Company’s employee share-based compensation. The fair value of the derivative iswas recorded in the “Derivative Liability”liability” line on itsthe consolidated financial statements, and iswas valued quarterly using the Black-Scholes Option Pricing Model. The assumptions used for the valuations as of December 31 were as follows:
| 2008 | 2009 | ||||
| Expected life of option (days) | 1,084 | 730 | |||
| Risk-free interest rate | 1.55 | % | 1.14 | % | |
| Expected volatility of stock | 93.45 | % | 162.7 | % | |
| Expected dividend yield | None | None | |||
| 2010 | ||
| Expected life of option (days) | 365 | |
| Risk-free interest rate | 0.29 | % |
| Expected volatility of stock | 219.4 | % |
| Expected dividend yield | None | |
The Company recognizesrecognized changes in fair value in its Consolidated Statements of Operations in the line titled “Gain (loss) on derivatives.”
16. Commitments and Contingencies
Lawrence LitigationContingencies:
Legal
We are subject to legal proceedings, claims and certain other Lawrence-related entities (“Plaintiffs”) initially filed suitliabilities which arise in the United States Bankruptcy Courtordinary course of business. We accrue for the Northern District of New York (“Bankruptcy Court”)losses associated with legal claims when such losses are probable and the United States District Court for the Northern District of New York (“District Court”), which were subsequently consolidated in the District Court, against First Albany Corporation, now knowncan be reasonably estimated. These accruals are adjusted as Broadpoint Capital, Inc. (“BCI”), the Company, Dale Church, Edward Dohring, Beno Sternlicht, Alan Goldberg and George McNamee (Church, Dohring, Sternlicht, Goldberg and McNameeadditional information becomes available or circumstances change. Legal fees are former Directors of the Company), Marty Mastroianni (former President and Chief Operating Officer of the Company) and 33 other individuals (“Defendants”) who purchased a total of 820,909 shares (307,841 post-split) of the Company’s stock from the Plaintiffs. The case concerns the Defendants’ 1997 purchase of the Company’s common stock from the Plaintiffs at the price of $2.25 per share ($6.00 per share post split). BCI actedcharged to expense as Placement Agent in connection with the negotiation and sale of the shares, including in proceedings before the Bankruptcy Court, which approved the sale in September 1997.
Commitments:inter alia, gave general releases to the Defendants (including MTI) in exchange for a payment of $100,000 by BCI; MTI made no payment in connection with that agreement, which was approved by the Bankruptcy Court and became final in September, 2009.
Leases
The Company and its subsidiaries lease certain manufacturing, laboratory and office facilities. The leases generally provide for the Company to pay either an increase over a base year level for taxes, maintenance, insurance and other costs of the leased properties or the Company’s allocated share of insurance, taxes, maintenance and other costs of leased properties. The leases contain renewal provisions.
Future minimum rental payments required under non-cancelable operating leases (with initial or remaining lease terms in excess of one year) as of December 31, 2011 are (dollars in thousands): $440 in 2010, $272 in 2011, $273$279 in 2012, $285 in 2013 and $553$266 in 2013.2014. Rent expense under all leases was $685, $645,$307, $528, and $564 thousand for 2007, 2008,2011, 2010, and 2009, respectively.
Licenses
Under a 2002 NYSERDA contract, MTI Micro agreed to pay NYSERDA a royalty of 5.0% of the sales price of any product sold incorporating IP developed pursuant to the NYSERDA contract. If the product is manufactured by a New York State manufacturer, this royalty is reduced to 1.5%. Total royalties are subject to a cap equal to two times the total contract funds paid by NYSERDA to MTI Micro, and may be reduced to reflect any New York State jobs created by MTI Micro.
Under the 2010 NYSERDA contract, MTI Micro agreed to pay NYSERDA a royalty of 5.0% of the sales price of any product sold incorporating IP developed pursuant to the NYSERDA contract. The obligation commences on the first date of the first sale of these products and is in place for fifteen years. Total royalties are subject to a cap equal to three times the total contract funds paid by NYSERDA to MTI Micro. However, if the product is manufactured by a New York State manufacturer, this royalty is reduced to 1.5% and total royalties are subject to a cap equal to one times the total contract funds paid by NYSERDA to MTI Micro. As of December 31, 2011 and 2010, there are no amounts accrued in the consolidated balance sheets related to this royalty provision.
Employment Agreements
The Company has employment agreements with certain employees that provide severance payments, certain other payments, accelerated vesting and exercise extension periods of certain options upon termination of employment under certain circumstances, as defined in the applicable agreements. As of December 31, 2009,2011, the Company’s potential minimum obligation to these employees was approximately $672$595 thousand.
Royalty Commitment
On January 28, 2010, MTI Instruments entered into an Asset Purchase and Sale Agreement with Ernest F. Fullam, Inc., Peter Fullam and Diane Fullam to acquire the tensile stage line of products from Ernest F. Fullam, Inc, a pioneering microscopy accessories company from Clifton Park, NY. As part of the acquisition, Mr. Peter Fullam joined MTI Instruments as a Product Sales Engineer until September 30, 2011, at which time he became a consultant for MTI Instruments, and MTI Instruments purchased machinery, inventory and the rights to use the Fullam/MTI Instruments product name. Additionally, commencing with the calendar quarter ending March 31, 2010 and ending at the close of the calendar quarter ending December 31, 2012, MTI Instruments will pay Ernest F. Fullam, Inc. a royalty equal to 5% of the Gross Sales achieved on specific Fullam products. Royalty expense related to this agreement was $10 thousand and $12 thousand for the years ended December 31, 2011 and 2010, respectively.
F-26
17. Secured Convertible Notes andEquity Investments for MTI Micro – Related Instruments – related party
On September 18, 2008, MTI Micro executed a Convertible Note and Warrant Purchase Agreement, (the “Purchase Agreement”), Secured Convertible Promissory Note Agreements (the “Bridge Notes”)Bridge Notes), Security Agreement (the “Security Agreement’)Security Agreement) and Warrant Agreements (the “Warrants”)Warrants). The investors (the “Bridge Investors”),Bridge Investors) included MTI, in the form of conversion of existing debt of $700,000,$700 thousand, Dr. Walter L. Robb, a member of the Company’s and MTI Micro’s Boards of Directors, and Counter Point Ventures Fund II, LP (Counter Point). Counter Point is a venture capital fund sponsored and managed by Dr. Walter L. Robb. General Electric Pension Trust, an employee benefit plan trust, is a passive limited partner in Counter Point. The Bridge Notes allowed MTI Micro to borrow up to an aggregate of $2,200 thousand,$2.2 million, including conversion of the outstanding debt totaling $700 thousand owed to the Company. Under this agreement, MTI Micro closed on $1,500 thousand$1.5 million of funding from Other Investors on September 18, 2008.
On February 20, 2009, MTI Micro and the Investors agreed to, among other things, amend the Bridge Notes (“(Bridge Notes Amendment No. 1”)1) to permit MTI Micro to sell additional Bridge Notes with an additional principal amount of up to $500 thousand to additional investors, and to extend the maturity date from March 31, 2009 to May 31, 2009 (the “Maturity Date”)Maturity Date). No other terms of the Bridge Notes were amended. Following the effectiveness of theBridge Notes Amendment No. 1, MTI Micro borrowed an additional $500 thousand from Counter Point, a fund managed by Dr. Walter L. Robb, a member of the Company’s Board of Directors, bringing the aggregate outstanding principal amount borrowed under the Bridge Notes, as amended, to $2,700 thousand,$2.7 million, including conversion of outstanding debt totaling $700 thousand owed to the Company.
On April 15, 2009, MTI Micro and the Investors agreed to amend the Bridge Notes (“(Bridge Notes Amendment No. 2”)2) to permit MTI Micro to sell additional Bridge Notes with an additional principal amount of up to $800,000$800 thousand to an additional investor and Counter Point, and to extend the maturity date from May 31, 2009 to March 31, 2010 (the “Maturity Date”)Maturity Date). Effective December 4, 2009, MTI Micro had sold all additional Bridge Notes.Notes, as amended. The Bridge Notes had an interest rate of 10%, compounded annually.
On December 9, 2009, MTI Micro entered into a Secured Convertible Promissory Note Negotiated Conversion Agreement (the “Conversion Agreement”)Conversion Agreement) with the Company and the other Bridge Investors. The parties agreed to, among other things, convert the aggregate principal and accrued interest amount of $3,910,510$3.9 million outstanding under the Bridge Notes into an aggregate of 55,864,425 shares of Common Stock of MTI Micro using a conversion price per share of $0.070$0.07 (the “Negotiated Conversion”)Negotiated Conversion). Warrants to purchase MTI Micro common stock at $0.07 per share were issued to Bridge Investors for an aggregate of 5,081,237 shares. As an incentive for MTI Micro to agree to the terms of the Negotiated Conversion, MTI Micro, the Company and the Bridge Investors also agreed that immediately prior to the consummation of the Negotiated Conversion, MTI Micro would issue to each current MTI Micro stockholder (including the Company), without consideration, a warrant (“(MTI Micro Warrant”)Warrant) exercisable after one (1) year for up to 50% of the aggregate number of shares of Common Stock each such MTI Micro stockholder currently holdsheld in MTI Micro, at $0.070$0.07 per share and with a term of seven (7) years. Accordingly, immediately prior to the consummation of the Negotiated Conversion on December 9, 2009, MTI Micro issued MTI Micro Warrants exercisable for an aggregate of 32,779,310 shares of MTI Micro Common Stock.
As a result of the Negotiated Conversion, the Company converted an aggregate principal and accrued interest amount of $786,917$787 thousand outstanding under the Bridge Notes into an aggregate of 11,241,666 shares of Common Stock of MTI Micro, and the Company’s ownership interest in MTI Micro decreased from approximately 97.3% to approximately 61.8%, or 67.8% on a fully-diluted basis including the MTI Micro Warrants issued to all current MTI Micro stockholders and the Bridge Warrants. The balance of the Bridge Note payable was $-0-$0 as of December 31, 2009.
On January 11, 2010, MTI Micro entered into the Purchase Agreement with Counter Point. Counter Point is a venture capital fund sponsored and managed by Dr. Walter L. Robb, a member of the Board of Directors of the Company and MTI Micro, and a current stockholder of MTI Micro. Pursuant to the Purchase Agreement, MTI Micro issued and sold to Counter Point 28,571,429 shares of common stock, par value $0.01 per share (the MTI Micro Common Stock), at a purchase price per share of $0.07, over a period of twelve months, and warrants (MTI Micro Warrants) to purchase shares of MTI Micro Common Stock equal to 20% of the shares of MTI Micro Common Stock purchased under the Purchase Agreement at an exercise price of $0.07 per share. The sale and issuance of the MTI Micro Common Stock and MTI Micro Warrants occurred over multiple closings (each, a Closing). Nine Closings occurred through December 31, 2010, with MTI Micro raising $1.9 million from the sale of 26,952,386 shares of MTI Micro Common Stock and MTI Micro Warrants to purchase 5,390,477 shares of MTI Micro Common Stock to Counter Point. The final Closing occurred on January 5, 2011, with MTI Micro raising $113 thousand from the sale of 1,619,043 shares of MTI Micro Common Stock and MTI Micro Warrants to purchase 323,809 shares of MTI Micro Common Stock to Counter Point.
On February 9, 2011, Amendment No. 1 was entered into between MTI Micro and Counter Point. Pursuant to Amendment No. 1, MTI Micro issued and sold to Counter Point 6,428,574 shares of MTI Micro Common Stock at a purchase price per share of $0.07, through December 31, 2011, and MTI Micro Warrants to purchase shares of MTI Micro Common Stock equal to 20% of the shares of MTI Micro Common Stock purchased under Amendment No. 1 at an exercise price of $0.07 per share. The sale and issuance of the MTI Micro Common Stock and MTI Micro Warrants occurred over multiple closings (each, a Closing) occurring over four one-month closing periods (each, a Closing Period). Four Closings occurred through September 30, 2011, with MTI Micro raising $450 thousand from the sale of 6,428,574 shares of MTI Micro Common Stock and MTI Micro Warrants to purchase 1,285,715 shares of MTI Micro Common Stock to Counter Point.
F-27
On September 23, 2011, Amendment No. 2 was entered into between MTI Micro and Counter Point. Pursuant to Amendment No. 2, MTI Micro issued and sold to Counter Point 1,200,000 shares of MTI Micro Common Stock at a purchase price per share of $0.07, through December 31, 2011, and MTI Micro Warrants to purchase shares of MTI Micro Common Stock equal to 20% of the shares of MTI Micro Common Stock purchased under Amendment No. 2 at an exercise price of $0.07 per share. The sale and issuance of the MTI Micro Common Stock and MTI Micro Warrants occurred over multiple closings (each, a Closing) occurring over four one-month closing periods (each, a Closing Period). Four Closings occurred through December 31, 2011, with MTI Micro raising $84 thousand from the sale of 1,200,000 shares of MTI Micro Common Stock and MTI Micro Warrants to purchase 240,000 shares of MTI Micro Common Stock to Counter Point.
As of December 31, 2011, the Company owned an aggregate of approximately 47.6% of the outstanding shares of MTI Micro or 53.3% of the outstanding common stock and warrants issued of MTI Micro, and Dr. Robb and Counter Point owned approximately 45.2% and 5.1%, respectively of the outstanding shares of MTI Micro or 40.3% and 4.3%, respectively of the outstanding common stock and warrants issued of MTI Micro.
On December 9, 2011, MTI Instruments purchased laboratory and computer equipment from MTI Micro for a total of $84 thousand, which was funded by the Company.
18. Geographic and Segment Information
The Company sells its products on a worldwide basis with its principal markets listed in the table below where information on product revenue and funded research and development revenue is summarized by geographic area for the Company as a whole for each of the years ended December 31:
| 2007 | 2008 | 2009 | ||||||
| (dollars in thousands) | ||||||||
| Product revenue: | ||||||||
| United States | $ | 5,453 | $ | 3,309 | $ | 3,908 | ||
| Japan | 2,516 | 904 | 612 | |||||
| Singapore | 287 | 112 | 23 | |||||
| Hong Kong | 163 | 502 | 251 | |||||
| Korea | 34 | 46 | 103 | |||||
| Other Pacific Rim | 109 | 169 | 55 | |||||
| Germany | 104 | 162 | 12 | |||||
| United Kingdom | 20 | 189 | 149 | |||||
| Netherlands | — | 29 | 147 | |||||
| Other Europe | 37 | 131 | 56 | |||||
| Canada | 112 | 212 | 59 | |||||
| Middle East | — | 315 | 202 | |||||
| Turkey | 80 | 4 | 463 | |||||
| Rest of World | 113 | 140 | 223 | |||||
| Total product revenue | $ | 9,028 | $ | 6,224 | $ | 6,263 | ||
| Funded research and development revenue: | ||||||||
| South Korea | $ | 448 | $ | — | $ | — | ||
| United States | 1,108 | 1,154 | 2,043 | |||||
| Total funded research and development revenue | $ | 1,556 | $ | 1,154 | $ | 2,043 | ||
| Total revenue | $ | 10,584 | $ | 7,378 | $ | 8,306 | ||
| 2011 | 2010 | 2009 | |||||||
| (dollars in thousands) | |||||||||
| Product revenue: | |||||||||
| United States | $ | 6,856 | $ | 4,703 | $ | 3,908 | |||
| Singapore | 1,066 | 170 | 23 | ||||||
| Hong Kong | 736 | 684 | 251 | ||||||
| Japan | 337 | 238 | 612 | ||||||
| Korea | 9 | 180 | 103 | ||||||
| China | 163 | 318 | 13 | ||||||
| Taiwan | 92 | 231 | 50 | ||||||
| Malaysia | 53 | 64 | 5 | ||||||
| Other Pacific Rim | 13 | 13 | — | ||||||
| Germany | 203 | 4 | 12 | ||||||
| United Kingdom | 128 | 58 | 149 | ||||||
| Netherlands | 125 | 164 | 147 | ||||||
| Austria | 28 | — | — | ||||||
| France | 57 | 3 | — | ||||||
| Switzerland | 78 | — | — | ||||||
| Other Europe | 27 | 43 | 56 | ||||||
| Canada | 125 | 168 | 59 | ||||||
| Middle East | 34 | 33 | 202 | ||||||
| Russia | 73 | 2 | 3 | ||||||
| Turkey | 9 | — | 463 | ||||||
| Rest of World | 68 | 103 | 207 | ||||||
| Total product revenue | $ | 10,280 | $ | 7,179 | $ | 6,263 | |||
| Funded research and development revenue: | |||||||||
| United States | $ | 13 | $ | 1,234 | $ | 2,043 | |||
| Total funded research and development revenue | $ | 13 | $ | 1,234 | $ | 2,043 | |||
| Total revenue | $ | 10,293 | $ | 8,413 | $ | 8,306 | |||
Revenues are attributed to regions based on the location of customers.
The Company operates in two business segments,New Energy and Test and Measurement Instrumentation. TheInstrumentation and New Energy segment is focused on commercializing DMFCs.Energy. The Test and Measurement Instrumentation segment designs, manufactures, markets and services computer-based balancing systems for aircraft engines, high performance test and measurement instruments and systems, and wafer characterization tools for the semiconductor industry.and solar industries, tensile stage systems for materials testing at academic and industrial settings, and computer-based balancing systems for aircraft engines. The New Energy segment is focused on commercializing direct methanol fuel cells. The Company’s principal operations are located in North America.
F-28
The accounting policies of the New Energy and Test and Measurement Instrumentation and New Energy segments are similar to those described in the summary of significant accounting policies (See Note(Note 2). The Company evaluates performance based on profit or loss from operations before income taxes, accounting changes, items management does not deem relevant to segment performance, and interest income and expense.taxes. Inter-segment sales and expenses are not significant.
Total product revenues contributed byof the Test and Measurement Instrumentation products segment and their percentage of total product revenues for each of the years ended December 31 are shown below:
| 2007 | 2008 | 2009 | |||||||||||||||
| Sales | % | Sales | % | Sales | % | ||||||||||||
| (dollars in thousands) | |||||||||||||||||
| Aviation | $ | 3,664 | 40.58 | % | $ | 1,977 | 31.76 | % | $ | 2,768 | 44.19 | % | |||||
| General Gauging | 4,490 | 49.73 | 2,983 | 47.93 | 2,619 | 41.81 | |||||||||||
| Semiconductor | 874 | 9.69 | 1,264 | 20.31 | 876 | 14.00 | |||||||||||
| Total | $ | 9,028 | 100.00 | % | $ | 6,224 | 100.00 | % | $ | 6,263 | 100.00 | % | |||||
| 2011 | 2010 | 2009 | ||||||||||||||||
| Sales | % | Sales | % | Sales | % | |||||||||||||
| (dollars in thousands) | ||||||||||||||||||
| Aviation Balancing Systems | $ | 5,359 | 52.1 | % | $ | 3,007 | 41.9 | % | $ | 2,768 | 44.2 | % | ||||||
| Precision Instruments | 3,983 | 38.8 | 2,804 | 39.1 | 2,619 | 41.8 | ||||||||||||
| Semiconductor and Solar Metrology | 938 | 9.1 | 1,368 | 19.0 | 876 | 14.0 | ||||||||||||
| Total | $ | 10,280 | 100.0 | % | $ | 7,179 | 100.0 | % | $ | 6,263 | 100.0 | % | ||||||
In the Test and Measurement Instrumentation segment, the U.S. Air Force accounted for $2,375 thousand$2.3 million or 26.3%22.4% of total revenue in 2007, $974 thousand2011, $1.6 million or 15.65%22.3% of total product revenue in 2008,2010, and $1,188 thousand$1.2 million or 18.97%19.2% of total product revenue in 2009. Sales toThe largest commercial customer in 2011 was a JapaneseSoutheast Asian distributor, who accounted for $2,501 thousand$1.1 million or 27.7%10.7% of total product revenue in 2007, $8642011. The largest commercial customer in 2010 was a Chinese distributor, who accounted for $560 thousand, or 13.88%7.8% of total product revenue in 2008, and $541 thousand or 8.64% of total product revenue in 2009.2010. The largest commercial customer in 2009 was a domestic US defense contractor, who accounted for $618 thousand or 9.86%9.9% of total product revenue in 2009, $24 thousand or 0.39% in 2008 and $15 thousand or 0.17% in 2007.
In the New Energy segment, the DOE accounted for $675$6 thousand or 43.4%49.7% of total funded research and development revenue in 2007, $1,1542011, $944 thousand or 100%77.0% of total funded research and development revenue in 2008,2010, and $2,043 thousand$2.0 million or 100%100.0% of total funded research and development revenue in 2009. Samsung accounted for $448 thousand or 28.9% of total funded research and development revenue in 2007.
Summarized financial information concerning the Company’s reportable segments is shown in the following table. The “Other” column includes corporate related items and items such as income taxes or unusual items, which are not allocated to reportable segments. The “Reconciling Items” column includes non controllingnon-controlling interests in a consolidated subsidiary.entity. In addition, segments’ non-cash items include any depreciation and amortization in reported profit or loss. The New Energy segment figures include the Company’s direct micro fuel cell operations. As a result of the suspension of the MTI Micro operations, equity securitiesthe New Energy segment will continue to be included in these tables during 2012 as long as they remain in our consolidated operations. The activity presented will be reflective of Plug Power, gains on the sale of these securities, and (losses) gains relatedminimal activity anticipated to the embedded derivative for the purchase of Plug Power common stock.
| Test and | Condensed | ||||||||||||||||
| (Dollars in thousands) | Measurement | Reconciling | Consolidated | ||||||||||||||
| Instrumentation | New Energy | Other | Items | Totals | |||||||||||||
| Year Ended December 31, 2011 | |||||||||||||||||
| Product revenue | $ | 10,280 | $ | — | $ | — | $ | — | $ | 10,280 | |||||||
| Funded research and development revenue | — | 13 | — | — | 13 | ||||||||||||
| Research and product development expenses | 1,243 | 223 | — | — | 1,466 | ||||||||||||
| Selling, general and administrative expenses | 2,306 | 993 | 1,695 | — | 4,994 | ||||||||||||
| Segment profit (loss) from operations before income | |||||||||||||||||
| taxes and non-controlling interest | 2,476 | (1,460 | ) | (916 | ) | — | 100 | ||||||||||
| Segment profit (loss) | 2,476 | (1,462 | ) | 634 | 738 | 2,386 | |||||||||||
| Total assets | 3,038 | 173 | 3,191 | — | 6,402 | ||||||||||||
| Capital expenditures | 170 | — | 5 | — | 175 | ||||||||||||
| Depreciation | 90 | 210 | 7 | — | 307 | ||||||||||||
F-29
| Test and | ||||||||||||||||
| New | Measurement | Reconciling | Consolidated | |||||||||||||
| (Dollars in thousands) | Energy | Instrumentation | Other | Items | Totals | |||||||||||
| Year Ended December 31, 2007 | ||||||||||||||||
| Product revenue | $ | — | $ | 9,028 | $ | — | $ | — | $ | 9,028 | ||||||
| Funded research and development revenue | 1,556 | — | — | — | 1,556 | |||||||||||
| Research and product development expenses | 10,115 | 1,650 | — | — | 11,765 | |||||||||||
| Selling, general and administrative expenses | 1,921 | 2,650 | 4,167 | — | 8,738 | |||||||||||
| Gain on securities available for sale | 2,549 | — | — | — | 2,549 | |||||||||||
| Segment (loss) profit from continuing operations | ||||||||||||||||
| before income taxes, equity in holdings’ | ||||||||||||||||
| losses and non controlling interests | (11,189 | ) | 789 | 2,791 | — | (7,609 | ) | |||||||||
| Segment (loss) profit | (11,189 | ) | 789 | 243 | 582 | (9,575 | ) | |||||||||
| Total assets | 8,128 | 3,018 | 7,570 | — | 18,716 | |||||||||||
| Securities available for sale | 4,492 | — | — | — | 4,492 | |||||||||||
| Capital expenditures | 212 | 177 | 25 | — | 414 | |||||||||||
| Depreciation and amortization | 715 | 117 | 297 | — | 1,129 | |||||||||||
| Test and | ||||||||||||||||||||||||||||||||||||
| New | Measurement | Reconciling | Consolidated | Test and | Condensed | |||||||||||||||||||||||||||||||
| (Dollars in thousands) | Energy | Instrumentation | Other | Items | Totals | Measurement | Reconciling | Consolidated | ||||||||||||||||||||||||||||
| Year Ended December 31, 2008 | ||||||||||||||||||||||||||||||||||||
| Instrumentation | New Energy | Other | Items | Totals | ||||||||||||||||||||||||||||||||
| Year Ended December 31, 2010 | ||||||||||||||||||||||||||||||||||||
| Product revenue | $ | — | $ | 6,224 | $ | — | $ | — | $ | 6,224 | $ | 7,179 | $ | — | $ | — | $ | — | $ | 7,179 | ||||||||||||||||
| Funded research and development revenue | 1,154 | — | — | — | 1,154 | — | 1,234 | — | — | 1,234 | ||||||||||||||||||||||||||
| Research and product development expenses | 6,614 | 1,650 | — | — | 8,264 | 959 | 2,896 | — | — | 3,855 | ||||||||||||||||||||||||||
| Selling, general and administrative expenses | 2,463 | 2,331 | 3,575 | — | 8,369 | 1,984 | 1,950 | 1,086 | — | 5,020 | ||||||||||||||||||||||||||
| Gain on securities available for sale | 1,214 | — | (196 | ) | — | 1,018 | ||||||||||||||||||||||||||||||
| Segment (loss) profit from continuing operations | ||||||||||||||||||||||||||||||||||||
| before income taxes, equity in holdings’ | ||||||||||||||||||||||||||||||||||||
| losses and non controlling interests | (8,961 | ) | (1,415 | ) | (384 | ) | — | (10,760 | ) | |||||||||||||||||||||||||||
| Segment (loss) profit | (8,961 | ) | (1,415 | ) | (2,388 | ) | 260 | (12,504 | ) | |||||||||||||||||||||||||||
| Segment profit (loss) from operations before income | ||||||||||||||||||||||||||||||||||||
| taxes and non-controlling interest | 886 | (3,639 | ) | (639 | ) | — | (3,392 | ) | ||||||||||||||||||||||||||||
| Segment profit (loss) | 886 | (3,639 | ) | (643 | ) | 1,638 | (1,758 | ) | ||||||||||||||||||||||||||||
| Total assets | 2,093 | 2,132 | 1,286 | — | 5,511 | 1,751 | 639 | 1,211 | — | 3,601 | ||||||||||||||||||||||||||
| Capital expenditures | 105 | 60 | 16 | — | 181 | 47 | — | — | — | 47 | ||||||||||||||||||||||||||
| Depreciation and amortization | 621 | 128 | 70 | — | 819 | |||||||||||||||||||||||||||||||
| Depreciation | 81 | 385 | 15 | — | 481 | |||||||||||||||||||||||||||||||
| Test and | ||||||||||||||||||||||||||||||||||||
| New | Measurement | Reconciling | Consolidated | Test and | Condensed | |||||||||||||||||||||||||||||||
| (Dollars in thousands) | Energy | Instrumentation | Other | Items | Totals | Measurement | Reconciling | Consolidated | ||||||||||||||||||||||||||||
| Instrumentation | New Energy | Other | Items | Totals | ||||||||||||||||||||||||||||||||
| Year Ended December 31, 2009 | ||||||||||||||||||||||||||||||||||||
| Product revenue | $ | — | 6,263 | — | — | 6,263 | $ | 6,263 | $ | — | $ | — | $ | — | $ | 6,263 | ||||||||||||||||||||
| Funded research and development revenue | 2,043 | — | — | — | 2,043 | — | 2,043 | — | — | 2,043 | ||||||||||||||||||||||||||
| Research and product development expenses | 4,479 | 965 | — | — | 5,444 | 965 | 4,479 | — | — | 5,444 | ||||||||||||||||||||||||||
| Selling, general and administrative expenses | 105 | 1,822 | 1,357 | — | 3,284 | 1,822 | 105 | 1,357 | — | 3,284 | ||||||||||||||||||||||||||
| Segment (loss) profit from continuing operations | ||||||||||||||||||||||||||||||||||||
| before income taxes, equity in holdings’ | ||||||||||||||||||||||||||||||||||||
| losses and non controlling interests | (3,171 | ) | 381 | (839 | ) | 57 | (3,572 | ) | ||||||||||||||||||||||||||||
| Segment (loss) profit | (3,171 | ) | 381 | (631 | ) | 322 | (3,099 | ) | ||||||||||||||||||||||||||||
| Segment profit (loss) from operations before income | ||||||||||||||||||||||||||||||||||||
| taxes and non-controlling interest | 381 | (3,171 | ) | (839 | ) | 57 | (3,572 | ) | ||||||||||||||||||||||||||||
| Segment profit (loss) | 381 | (3,171 | ) | (631 | ) | 322 | (3,099 | ) | ||||||||||||||||||||||||||||
| Total assets | 1,061 | 1,949 | 731 | — | 3,741 | 1,949 | 1,061 | 731 | — | 3,741 | ||||||||||||||||||||||||||
| Capital expenditures | 7 | — | — | — | 7 | — | 7 | — | — | 7 | ||||||||||||||||||||||||||
| Depreciation and amortization | 496 | 103 | 61 | — | 660 | |||||||||||||||||||||||||||||||
| Depreciation | 103 | 496 | 61 | — | 660 | |||||||||||||||||||||||||||||||
The following table presents the details of “Other” segment (loss) profit for each of the years ended December 31:
| 2007 | 2008 | 2009 | |||||||||
| (dollars in thousands) | |||||||||||
| Corporate and other (expenses) income: | |||||||||||
| Depreciation and amortization | $ | (297 | ) | $ | (70 | ) | $ | (61 | ) | ||
| Interest income (expense) | 413 | (106 | ) | 68 | |||||||
| Gain (loss) on derivatives | 2,967 | 655 | (29 | ) | |||||||
| Income tax (expense) benefit | (2,548 | ) | (2,004 | ) | (208 | ) | |||||
| Other expense, net | (292 | ) | (863 | ) | (401 | ) | |||||
| Total (expense) income | $ | 243 | $ | (2,388 | ) | $ | (631 | ) | |||
| 2011 | 2010 | 2009 | ||||||||||
| (dollars in thousands) | ||||||||||||
| Corporate and other (expenses) income: | ||||||||||||
| Depreciation | $ | (7 | ) | $ | (15 | ) | $ | (61 | ) | |||
| Salaries and benefits | (984 | ) | (161 | ) | ||||||||
| Interest income | — | — | 68 | |||||||||
| Gain (loss) on derivatives | 73 | (2 | ) | (29 | ) | |||||||
| Income tax benefit (expense) | 1,550 | (4 | ) | (208 | ) | |||||||
| Other (expense) income, net | 2 | (461 | ) | (401 | ) | |||||||
| Total income (expense) | $ | 634 | $ | (643 | ) | $ | (631 | ) | ||||
19. Restructuring
On January 11, 2010, MTI Micro entered into a Common Stock and Warrant Purchase Agreement (the “Purchase Agreement”) with Counter Point Ventures Fund II, L.P. (“Counter Point”). Counter Point is managed by Dr. Walter L. Robb, a member of the Board of Directors of the Company and MTI Micro, and is a current stockholder of MTI Micro. Dr. Robb and Counter Point beneficially held approximately 29.5% of the fully-diluted capital stock of MTI Micro of December 31, 2009, and as of March 15, 2010 hold an aggregate of approximately 34.2% of the fully-diluted capital stock of MTI Micro.
20. Subsequent Events
The Company has evaluated subsequent events and transactions through the Gross Sales achieved on specific Fullam products.
F-30