When customers select an expedition provider for the types of journeys that we offer, we believe that being known as a trusted brand with extensive operating history and knowledge in the market is a significant competitive strength.
Compelling Experiential Offerings
Lindblad is known for delivering voyages that offer in-depth exploration opportunities in locations around the world. Expeditions are operated on intimately-scaled ships with capacities ranging between 28 and 148 guests, fostering a friendly atmosphere on board and extensive interaction between guests, crew and the teams of world-class scientists, naturalists, researchers and photographers that participate in the expeditions. The vessels are nimble and can access locations that are unattainable for large cruise ships, allowing for in-depth exploration itineraries and viewpoints. The ships are customized to provide our signature adventure experiences and activities, such as kayaking among Antarctic icebergs to view penguins or traveling on a Zodiac for an up-close encounter with a whale. Based on our product offerings, we are able to support premium pricing with minimal discounting and benefit from low capital expenditure requirements, minimal working capital needs and favorable tax attributes.
Natural Habitat offers over 100 different expedition itineraries of primarily land-based nature adventures in more than 45 countries spanning all seven continents. Natural Habitat expeditions focus on small groups led by award-winning naturalists to achieve close-up wildlife and nature experiences. Examples of expeditions offered by Natural Habitat include safaris in Botswana, grizzly bear adventures in Alaska and polar bear tours in Canada. Many of Natural Habitat’s expeditions feature access to private wildlife reserves, remote corners of national parks and distinctive lodges and camps for the best wildlife viewing. Their expeditions average nine guests with itineraries running from six to 17 days, with an average of nine days.
DuVine offers luxury cycling and adventure tours in over 50 destinations across Europe, North America, Latin America, and Africa. DuVine’s itineraries cater to riders of all abilities with a focus on culinary experiences and boutique accommodations. Guests cultivate meaningful connections across cultures, such as hopping off the bike to taste sun-warmed grapes with a Bordeaux winemaker or hand-shape orecchiette pasta with a local friend in Puglia, Italy. Excursions average six days and every tour has an opportunity to discover the character of a region thanks to well-connected local guides, small groups of 14 or fewer guests, and top-quality bikes and support.
Off the Beaten Path offers active small-group and private custom journeys throughout North America, Europe, Africa, Australia, Central and South America and the South Pacific. Examples of expeditions include culture and history focused experiences in the Desert Southwest, exploring nearly all of the National Parks in the U.S. and Canada, hiking through the Dolomites, enjoying a family adventure in Patagonia’s Lake District and experiencing the culture, architecture and village life of Morocco. Off the Beaten Path's adventures focus on outdoor activity, including wildlife viewing, hiking, rafting, snorkeling, kayaking and snowshoeing, and comprehensive pre-trip materials paired with experienced, friendly guides.
Classic Journeys delivers hand crafted walking tours with an average of ten guests per departure and featuring expert local guides who know the most cinematic footpaths in the region. Including the vast plains of Spain studded with gnarled olive trees, wandering the historic streets of Quebec, meeting the enormous residents of a Laotian elephant preserve or floating down a rural in China on a bamboo raft past dragon-teeth mountain peaks. Guests eat like locals from gourmet picnics to world class restaurants, enjoying native food traditions and enjoy top-rated and authentic accommodations.
We are continuously focused on maintaining and elevating the guest experience and identifying new opportunities to help people discover the wonders of the world. We believe that our track record of high-quality expedition offerings, along with our history of providing in-depth and highly innovative itineraries, represent significant competitive advantages.
Strategic Alliance with National Geographic
We benefit from a longstanding relationship with the National Geographic, one of the world’s leading proponents of eco-tourism and natural history. The strategic alliance, which began in 2004, is built on our shared interest in education, exploration, research, storytelling, technology and conservation. Founded in 1888, the National Geographic Society is one of the largest non-profit scientific and educational institutions in the world with interests ranging from geography, archaeology and natural science, to the promotion of environmental and historical conservation. Working to inspire, illuminate and teach, National Geographic reaches hundreds of millions of people around the world through a wide range of media, including print, TV, digital and social media platforms. The National Geographic name has significant value for use in connection with travel-related goods and services. The Lindblad/National Geographic alliance includes a co-selling and co-marketing arrangement through which National Geographic promotes our offerings in its marketing campaigns across web-based, email, print and other marketing platforms and sells our expeditions through its internal travel division. We believe that the alliance with National Geographic provides us with a substantial competitive advantage in the expedition market based on the brand enhancement, expanded marketing reach and the relationship with National Geographic’s experts, including photographers, writers, marine biologists, naturalists, field researchers and film crews, join our expeditions. Guests have the ability to interface with these experts through lectures, excursions, dining and other experiences throughout their expedition.
Through this alliance, we collaborate with National Geographic on exploration, research, technology and conservation in order to provide travel experiences and disseminate geographic knowledge around the globe. The Lindblad/National Geographic alliance, which includes all of the Americas, is set forth in an Alliance and License Agreement and a Tour Operator Agreement with terms until December 31, 2025.
Sven-Olof Lindblad, our founder and current Co-Chairperson of our board of directors, currently serves on the board of the Lindblad Expeditions–National Geographic Joint Fund for Exploration and Conservation and previously served on the National Geographic Society’s International Council of Advisors, which was composed of individuals identified by the National Geographic Society as visionary leaders from a range of professions and industries across the globe that exemplify the intellectual curiosity and quest for adventure that has driven the National Geographic Society’s mission since 1888. Mr. John M. Fahey, Jr., one of our board of directors, previously served as the Chairman and Chief Executive Officer of the National Geographic Society.
Partnership with World Wildlife Fund
Natural Habitat has partnered with the WWF, since 2003, to promote sustainable conservation travel that directly promotes and protects nature. WWF is one of the world’s leading conservation groups with over six million members globally. Natural Habitat’s exclusive license agreement with WWF allows Natural Habitat to use the WWF name, logo and select mailing list through 2023 in return for a royalty fee.
Business and Growth Strategies
The following are the key components of our business strategy:
Deliver Exceptional Guest Experiences
Our chief guiding principle throughout the organization is to ensure that everything adds value to the guest experience. This applies to every step of the process from the first engagement with a potential guest, through the booking process and travel preparations, the actual expedition, trip or adventure, whether onboard a vessel or off on explorations and tours, and once back at home.
We believe that our guests do not want to be passive tourists, so our expeditions and travel experiences foster active engagement. Our ships are equipped with tools for exploration to get our guests out in the open for up-close forays, or to let guests see deeper into the marine or terrestrial environments surrounding them. It is our goal to provide guests with differentiated opportunities with an experienced expedition team that adds to the guests’ understanding and appreciation, through dedicated observation, insightful commentary and engaging presentations, weaving the expedition into a cohesive narrative. On our ships this could include an opportunity for the guest to watch a killer whale circling a seal on an ice floe, while standing next to a marine biologist and an experienced nature photographer from National Geographic. On our land experiences this could include an immersive viewing of polar bears preparing to hunt on the ice under the guide of an expert naturalist.
This intense focus on seeking to elevate the overall experience and engaging with guests has resulted in highly favorable customer feedback. We believe that by consistently delivering exceptional experiences to our guests, we have built a highly valuable and trusted brand in the expedition cruising and land-based expedition market, which attracts a growing number of discerning and affluent guests who are prepared to pay a premium for our offerings.
We place a strong focus on innovation, which we seek to achieve by introducing new expedition options and continuously making improvements to our fleet and voyage experiences as new technology or operating procedures are developed. We make deployment decisions with the goal of optimizing the overall profitability of our portfolio, with these decisions generally made 18 to 2436 months in advance. We have operated above 87% occupancy rate for each of the years ended December 31, 2017, 2016 and 2015, indicating strong consumer interest in our offerings. Adding new capacity will allowand geographies allows us to expand our inventory of existing itineraries, and expandextend into new markets and explore new destinations. The following table presents summary information concerning the ships we currently operate and their geographic areas of operation based on 2017 itineraries:
| Vessel Name | Date Built | Guest Capacity | Cabins | Primary Areas of Operation | Flag | |||||
| National Geographic Endeavour II | 2005, renovated in 2016 | 95 | 50 | Galápagos | Ecuador | |||||
| National Geographic Explorer | 1982, rebuilt in 2008 | 148 | 81 | Arctic, Antarctica, Europe, British Isles, Canada, Patagonia, South America and Transatlantic | Bahamas | |||||
| National Geographic Islander | 1995 | 47 | 24 | Galápagos | Ecuador | |||||
| National Geographic Orion | 2003 | 102 | 53 | Antarctica, Europe, South America and Arctic | Bahamas | |||||
| National Geographic Quest | 2017 | 96 | 50 | Alaska, Canada, Pacific Northwest, Costa Rica, Panama | U.S.A. | |||||
| National Geographic Sea Bird | 1981 | 62 | 31 | Alaska, Baja California and Pacific Northwest | U.S.A. | |||||
| National Geographic Sea Lion | 1982 | 62 | 31 | Alaska, Costa Rica, Panama, Baja California and Pacific Northwest | U.S.A. | |||||
| Delfin II* | 2009 | 28 | 14 | Amazon | Peru | |||||
| Harmony V* | 2004 | 44 | 23 | Cuba | Greece | |||||
| Jahan* | 2011 | 48 | 24 | Vietnam and Cambodia | Vietnam | |||||
| Lord of the Glens* | 1985, renovated in 2016 | 48 | 26 | Scotland | UK | |||||
| Sea Cloud* | 1931, rebuilt in 1979, renovated in 2011 | 58 | 28 | Caribbean and Mediterranean | Malta |
* Chartered Vessel
The following table presents summary information concerning the two new passenger cruise vessels under construction.
| Vessel Name | Expected Launch Date | Guest Capacity | Cabins | Primary Areas of Operation | Flag | |||||
| National Geographic Venture | December 2018 | 96 | 50 | West Coast North America and Central America | U.S.A. | |||||
| Polar Ice Class Vessel | January 2020 | 126 | 69 | Bahamas |
Owned Vessels
National Geographic Endeavour II operates in the Galápagos. TheNational Geographic Endeavour II joined the fleet in the second quarter of 2016 and, following a significant renovation, deployed during the fourth quarter of 2016. TheNational Geographic Endeavour II accommodates 95 guests in 50 cabins and offers public areas designed for maximum viewing of nature and wildlife.
High Visibility and Differentiated Revenue Management Strategy
Our business model generally allows us to generate consistent free cash flow with high revenue visibility. Given the nature of our expeditions and the expectation that our guests will seek to plan such trips with substantial lead time, we generally begin to market our expeditions approximately 12 to 24 months in advance of the departure date. Guests book their trips, on average, nine months prior to travel date for our Lindblad expeditions and seven months prior to travel for our land experiences, paying a deposit at booking, providing us significant visibility into future revenue and a source of cash flow. Final payment is due 60 to 120 days prior to the date of travel, dependent upon the selected expedition.
Unlike the large cruise line operators that serve the broader market, our product offerings are inclusive of most costs and therefore the advance customer payments provide us strong visibility into future revenues and the associated cash flows. By having such visibility into future business, we can more effectively manage any additional sales and marketing efforts that may be required
to ensure that the programs reach their targeted occupancy levels. We do not believe in driving participation through discounting and do not generally pursue such strategies. Instead, we focus on enhancements that add significant value to the product without significant incremental cost, as well as targeted marketing efforts in order to strengthen occupancy rates, if required. Based on our offerings, the targeted audience and premium pricing, our guests are generally older, more affluent and do not travel with three or four individuals in one cabin. As it is cruise industry convention to base 100% occupancy on two persons per cabin, the Lindblad segment may report occupancy levels that are somewhat lower than the large cruise lines serving the broader market, where three or more occupants per cabin is not uncommon. However, we have historically achieved strong occupancy rates including operating at 81%, 89% and 91% occupancies for the years ended December 31, 2021, 2020 and 2019, respectively. The occupancy rates for 2021 and 2020 have been skewed by the effects of the COVID-19 pandemic.
Maximize and Grow Net Yieldsper Available Guest Night
We have historically achieved high net yields per available guest night and continue to see opportunities for growth. In the cruise industry, net yield per available guest night is a frequently referenced metric and refers to tour revenues net of commissions and certain direct costs in a specific period divided by the number of available guest nights. Our net yield per available guest night is driven by our offerings, premium pricing and ancillary guest revenue, such as pre- or post-voyage trip extensions, add-on optional activities, trip insurance and onboard spend. At the Lindblad segment, net yield per available guest night was $879, $1,048 and $1,051 in 2021, 2020, and 2019, respectively. The net yield per available guest night for 2021 and 2020 have been skewed by the effects of the COVID-19 pandemic. Our net yield per available guest night is significantly higher than the large-scale cruise line operators and we expect to be able to continue our track record of maintaining strong pricing and growing ancillary guest revenues through increased sales focus and marketing efforts.
Elevate Brand Awareness and Loyalty
The Lindblad brand is recognizable by our guests primarily due to our heritage, decades of sales and marketing investment and longstanding strategic alliance with National Geographic. We believe we have fostered strong guest and brand loyalty, as is evidenced by our high levels of repeat guests. Historically, approximately 40% of Lindblad guests booked through our U.S. office have been past guests. We have closely aligned our Lindblad marketing efforts with National Geographic Explorerto maximize impact in the marketplace and have engaged in a co-branding strategy with respect to our owned vessels. In addition, we are recognized as a leader in promoting the issue of conservation of the planet and encourage our guests to become engaged through the LEX-NG Fund. In the past, we have organized high-level meetings in the Arctic, Antarctic, the Galápagos Islands and Baja California to put a spotlight on key environmental issues in conjunction with organizations such as the Aspen Institute, TED and the WWF. These efforts help to build our brand and network of relationships and enhance our thought leadership. We will continue to focus on ensuring that each of our guests associates our brand with high-quality marine based adventure vacation experiences.
We maintain an active presence on numerous social media platforms, focusing primarily on those with the greatest reach to our target demographic. Developing our brand and growing our digital audience has been a point of emphasis and we have dramatically increased social followers, as well as engagement and impressions. Our increased efforts around digital marketing and social media have also resulted in significant earned media from brands, influencers and industry partners.
Disciplined Expansion joined
We believe affluent travelers view their retirement as “a time to travel and explore new places,” favoring immersive and authentic experiences. This has led to strong growth in the specialty cruise and adventure travel segments and we believe these trends will continue following the COVID-19 pandemic. We are focused on growing our business in a prudent and disciplined manner. When evaluating various strategies for expansion of guest capacity and product offerings, we consider closely the expected return on invested capital and the range of possibilities, such as a newbuild program, adding selected charters and the acquisitions of existing ships or operators.
Given the demand for expedition cruising, we have strategically expanded our owned and operated fleet in 2008 as our ultimate expedition ship. Thefrom six ships to ten ships through a new build program. This included the delivery of two polar ice-class vessels, the National Geographic ExplorerResolution during 2021 and the National Geographic Endurance in 2020, more than doubling the size of our existing polar capacity, and the delivery of two new coastal vessels, the National Geographic Venture in 2018 and the National Geographic Quest in 2017, nearly tripling the capacity of our US-flagged fleet.
During 2021 we further diversified our product portfolio, with the acquisition of Off the Beaten Path, a land-based travel operator specializing in authentic national park experiences, DuVine, an international luxury cycling and adventure company focused on exceptional food and wine experiences, and Classic Journeys, a leading luxury walking tour company that offers highly curated active small-group and private custom journeys. Similar to the Company’s acquisition of Natural Habitat in 2016, these businesses are strong compliments to our existing product offerings, and we will leverage our experience and resources to accelerate their growth and capitalize on the growing demand for authentic and immersive adventure travel.
We believe that we have the financial flexibility to pursue additional growth opportunities subject to, among other factors, our ability to identify attractive business opportunities and to negotiate favorable terms for such opportunities. Additionally, we believe that our platform is equipped with an ice-strengthened hull, advanced navigationwell positioned to opportunistically seek accretive purchases of operators that lack scale and capital, further extending our growth prospects.
Operations
Guest Activities and Services
We provide our guests the opportunity and the tools to be active and engaged explorers. Our vessels carry a variety of equipment for polar expeditionsexploration which, depending on the ship and destination, may include Zodiacs for water-based activities and quick transfers to shore, kayaks and paddleboards for personal exploration, motorized skiffs, an underwater camera, a well-appointed interior with multiple interior and exterior locations specifically designed for observing wildlife and the natural environment. Accordingly, theNational Geographic Explorer is equippedremotely operated vehicle, a video microscope to visitstudy some of the mostsmallest organisms of the marine ecosystem, a crow’s nest camera atop a ship’s mast, hydrophones for listening to vocalizations of marine mammals, snorkeling gear, scuba gear and wetsuits. An experienced and knowledgeable expedition staff leads guests in exploration while Zodiac riding, hiking onshore, paddling on the water or observing wildlife from ashore or onboard the ship. All voyages feature a certified photo instructor onboard and many include photographers from National Geographic.
All of our land tour companies share a commitment to an exceptional guest experience – achieved in part through small groups, best-in-class interpretation and guiding, and local connections built over decades of operating in their destinations. Each company offers a variety of services, activities and equipment specific to their tour segment. We provide equipment for guests such as kayaks, snowshoes, parkas, and bicycles – from high-end road bikes to luxurious e-bikes. We transport guests in vehicles specific to the journey such as customized polar rovers for up-close viewing of polar bears on the Tundra, specialized 4x4 Land Rovers while on safari or dedicated support vehicles that follow the day’s bicycle route distributing refreshments and offering a lift to tired bikers. Experienced, local guides lead guests on journeys while viewing grizzly bears in Alaska, cycling through Tuscany, hiking in Zion, touring ancient ruins in the Amazon, rafting the Grand Canyon or taking in meals with locals in a Mediterranean village.
Our ships and land tours allow us to offer guests authentic, up-close experiences in the planet's wild, remote places, but at the same time, enjoy a high level of comfort, convenience and extremesafety. High-quality dining is an integral part of our expedition experiences with influences and flavors that reflect the regions being explored, along with traditional fare. Food is sourced locally whenever practicable from sustainable providers and seating is open with a relaxed atmosphere. Our ships offer a range of services and amenities which allow our guests to travel in comfort. Depending on the ship, these may include a fitness center, a spa offering a variety of treatments, a photo kiosk for photographers to edit and sort photos, 24-hour beverage service, internet connection, laundry facilities and a doctor on call.
We offer to handle virtually all travel aspects related to guest reservations and transportation, simplifying the planning and booking process for our guests. We also provide guests the opportunity to purchase pre- and post-expedition extensions or services that may include additional hotel nights, air travel, private transfers, excursions, land travel packages and travel protection insurance.
Sales and Marketing
We place a strong emphasis on identifying the needs of our guests and creating expedition and travel opportunities that our guests value. We use communication strategies and marketing campaigns designed to strengthen brand awareness and to emphasize the distinctive qualities of each experience we offer. Marketing strategies include the use of direct marketing, mail and email; digital media, including search, social media and programmatic ad buying; traditional media; brand websites; and travel agencies and other strategic third-party distribution partners.
We source our business through a combination of direct selling, travel agency networks and, at the Lindblad segment, through our strategic alliance with National Geographic. We invest in maintaining strong relationships with our key travel agency network partners and seek to maintain commission rates and incentive structures that are competitive within the marketplace.
Historically, the majority of our guests have been from the United States. Expedition cruise guests sourced from the U.S. represented approximately 98% of our total global expedition cruise guests’ ticket revenue in 2021 and 91% in 2020 and 2019.
Our largest channel for expedition cruise guest bookings is direct contact, either by guests calling and speaking with our expedition specialists or requesting a reservation online at our website. The direct channel represented approximately 39% of expedition cruise guest ticket revenues for 2021 and 2020 and 40% for 2019.
We also generate significant bookings from travel agents and wholesalers, representing approximately 26% of expedition cruise guest ticket revenue for the year ended 2021, 30% for the year ended 2020 and 29% for the year ended 2019. Agent outreach
efforts are focused primarily on consortiums, or travel agent networks, which target affluent travelers. The four consortiums with which we have preferred partner agreements are Virtuoso, Signature, American Express and Ensemble. Preferred status provides their agents with financial incentives to book their customers on our expeditions and provides us the opportunity for enhanced marketing to their agents and end-user customers. Our agent and affinity sales team meet with hundreds of highly-targeted agents annually, at consortium conferences and training seminars, and in-person at agency offices to provide hands-on training, support and product knowledge.
The National Geographic relationship also serves as a significant channel for bookings for our expedition cruise business. Our alliance with National Geographic includes a co-selling and co-marketing arrangement through which National Geographic promotes our expedition cruise offerings in its marketing campaigns across web-based, email, print and other marketing platforms and sells our expeditions through its internal travel division. The National Geographic channel represented approximately 28% of expedition cruise guest ticket revenues for 2021, and 24% for 2020 and 2019. As part of this relationship, our owned vessels carry the National Geographic name.
The remainder of our expedition cruise bookings, 7% of guest ticket revenues for 2021, 2020 and 2019, comes from affinity groups and charters. Affinity groups are predominantly college and university alumni associations, and other travel organizations targeting specific market niches.
We have a broad and diverse marketing mix across multiple media platforms and channels, allowing us to effectively communicate our product offerings to past guests and prospective guests. We continually optimize our media mix to reach our target demographic. The majority of our annual global marketing spend is focused on consumer-direct channels. Our detailed brochures and websites present our expedition and tour offerings comprehensively, providing guests with all the information needed to make an informed travel decision. We invest significantly in digital media as part of our guest acquisition efforts with particular focus in paid search, social media, content development and programmatic video and display advertising. We also execute direct mail campaigns with the primary purpose of generating qualified leads, upon which we will fulfill requests with the appropriate product brochure and/or digital media.
We operate several websites, www.expeditions.com for our Lindblad expedition cruise offerings, www.nathab.com for our Natural Habitat nature adventures, www.duvine.com for our DuVine cycling adventures, www.offthebeatenpath.com for our Off the Beaten Path guided travel adventures and www.classicjourneys.com for our handcrafted luxury walking tours. Each website is supported internally by a dynamic content management system, allowing frequent updates, a visually-impactful design, large photos and video display with simple, straightforward navigation. Consumers are directed to key areas on each website through weekly emails, direct mail, social media, PR, and advertising. We also routinely offer webinars to provide greater insights into our expeditions, hosted by members of our expedition teams with intimate knowledge of the planet. Thegeographies featured. In 2021, National Geographic Explorerwww.expeditions.com accommodates 148launched a fully redesigned website that fits any device or screen and features enriched design and content to better reflect the expedition experience. This new website will also provide a significant boost in discoverability, driving awareness and lead generation through improved organic search.
Our marketing team encompasses broad and diverse skill sets including product and channel marketing, digital marketing, database marketing, copywriting and creative, video production and research and analytics.
Trip Pricing
Our voyage prices typically include accommodations and all expedition activities and meals, other than items of a personal nature, such as airfare to and from an expedition, spa treatments and certain other specialized events or activities. Prices vary depending on many factors, including the vessel, the destinations on a particular voyage, number of guest berths available, expedition length, cabin category selected and time of year during which the expedition takes place. Payment terms generally require an upfront deposit to confirm a reservation with the balance due prior to departure.
We focus on maintaining list pricing of our offerings and any discounting that we pursue is tactical, targeted and infrequent. In addition to our standard expedition packages, we may be able to offer a complete vessel for charter and may provide incentives for this type of arrangement. Group and multi-generational family travel may also be eligible for additional incentives based upon the voyage, duration and number of guests in 81 cabins, including 13 cabinstravelling. From time to time, we may incentivize guests to book with private balconies and six suites. TheNational Geographic Explorer is spacious and modern,us with a variety of public areas thatoffers, including free or reduced-price air transportation, hotel nights or other value-added items. We offer views of the passing landscape, including a window-lined library and observation lounge located at the top of the ship, several observation decks and a forward-facing chart room.rewards to our guests through our loyalty program, Friends for Life, to encourage repeat business.
National Geographic Islander isOur land-based travel prices typically include accommodations, transportation while on tour, gear specific to the tour and most activities and meals, other than items of a twin-hulled, yacht-scale ship designed for active exploration. TheNational Geographic Islandersails year-round inpersonal nature, such as airfare to and from the Galápagos,tour and certain other specialized events or activities. Prices vary depending on many factors, including the destination, activities included, tour length and time of year during which it is ideally suited for as its trim design and maneuvering abilities enable itthe trip takes place. Payment terms generally require an upfront deposit to visit areas larger vessels cannot, allowing guestsconfirm a reservation with the balance due prior to experience the islands from a more up-close perspective. TheNational Geographic Islander accommodates 47 guests in 24 outside cabins, including two suites. On board there are open decks that are complete with hammocks as well as a large dining room and large lounges thatform part of the social hub of the ship.departure.
Lindblad tour revenues from the sale of guest tickets are mildly seasonal, historically larger in the first and third quarters. The seasonality of our operating results fluctuates due to our vessels being taken out of service for scheduled maintenance or drydocking, which is Natural Habitat, DuVine, Off the We benefit from a longstanding relationship with the National Geographic, one of the world’s leading proponents of eco-tourism and natural history. The strategic alliance, which began in 2004, is built on our shared interest in education, exploration, research, storytelling, technology and conservation. Founded in 1888, the National Geographic Society is one of the largest non-profit scientific and educational institutions in the world with interests ranging from geography, archaeology and natural science, to the promotion of environmental and historical conservation. Working to inspire, illuminate and teach, National Geographic reaches hundreds of millions of people around the world through a wide range of media, including print, TV, digital and social media platforms. The National Geographic name has significant value for use in connection with travel-related goods and services. The Lindblad/National Geographic alliance includes a co-selling and co-marketing arrangement through which National Geographic promotes our offerings in its marketing campaigns across web-based, email, print and other marketing platforms and sells our expeditions through its internal travel division. We believe that the alliance with National Geographic provides us with a substantial competitive advantage in the expedition market based on the brand enhancement, expanded marketing reach and the relationship with National Geographic’s experts, including photographers, writers, marine biologists, naturalists, field researchers and film crews, join our expeditions. Guests have the ability to interface with these experts through lectures, excursions, dining and other experiences throughout their expedition. Through this alliance, we collaborate with National Geographic on exploration, research, technology and conservation in order to provide travel experiences and disseminate geographic knowledge around the globe. The Lindblad/National Geographic alliance, which includes all of the Americas, is set forth in an Alliance and License Agreement and a Tour Operator Agreement with terms until December 31, 2025. Sven-Olof Lindblad, our founder and current Co-Chairperson of our board of directors, currently serves on the board of the Lindblad Expeditions–National Geographic Joint Fund for Exploration and Conservation and previously served on the National Geographic Society’s International Council of Advisors, which was composed of individuals identified by the National Geographic Society as visionary leaders from a range of professions and industries across the globe that exemplify the intellectual curiosity and quest for adventure that has driven the National Geographic Society’s mission since 1888. Mr. John M. Fahey, Jr., one of our board of directors, previously served as the Chairman and Chief Executive Officer of the National Geographic Society. Partnership with World Wildlife Fund Natural Habitat has partnered with the WWF, since 2003, to promote sustainable conservation travel that directly promotes and protects nature. WWF is one of the world’s leading conservation groups with over six million members globally. Natural Habitat’s exclusive license agreement with WWF allows Natural Habitat to use the WWF name, logo and select mailing list through 2023 in return for a royalty fee. Business and Growth Strategies The following are the key components of our business strategy: Deliver Exceptional Guest Experiences Our chief guiding principle throughout the organization is to ensure that everything adds value to the guest experience. This applies to every step of the process from the first engagement with a potential guest, through the booking process and travel preparations, the actual expedition, trip or adventure, whether onboard a vessel or off on explorations and tours, and once back at home. We believe that our guests do not want to be passive tourists, so our expeditions and travel experiences foster active engagement. Our ships are equipped with tools for exploration to get our guests out in the open for up-close forays, or to let guests see deeper into the marine or terrestrial environments surrounding them. It is our goal to provide guests with differentiated opportunities with an experienced expedition team that adds to the guests’ understanding and appreciation, through dedicated observation, insightful commentary and engaging presentations, weaving the expedition into a cohesive narrative. On our ships this could include an opportunity for the guest to watch a killer whale circling a seal on an ice floe, while standing next to a marine biologist and an experienced nature photographer from National Geographic. On our land experiences this could include an immersive viewing of polar bears preparing to hunt on the ice under the guide of an expert naturalist. This intense focus on seeking to elevate the overall experience and engaging with guests has resulted in highly favorable customer feedback. We believe that by consistently delivering exceptional experiences to our guests, we have built a highly valuable and trusted brand in the expedition cruising and land-based expedition market, which attracts a growing number of discerning and affluent guests who are prepared to pay a premium for our offerings. We place a strong focus on innovation, which we seek to achieve by introducing new expedition options and continuously making improvements to our fleet and voyage experiences as new technology or operating procedures are developed. We make deployment decisions with the goal of optimizing the overall profitability of our portfolio, with these decisions generally made 18 to 36 months in advance. Adding new capacity and geographies allows us to expand our inventory of existing itineraries, extend into new markets and explore new destinations. High Visibility and Differentiated Revenue Management Strategy Our business model generally allows us to generate consistent free cash flow with high revenue visibility. Given the nature of our expeditions and the expectation that our guests will seek to plan such trips with substantial lead time, we generally begin to market our expeditions approximately 12 to 24 months in advance of the departure date. Guests book their trips, on average, nine months prior to travel date for our Lindblad expeditions and seven months prior to travel for our land experiences, paying a deposit at booking, providing us significant visibility into future revenue and a source of cash flow. Final payment is due 60 to 120 days prior to the date of travel, dependent upon the selected expedition. Unlike the large cruise line operators that serve the broader market, our product offerings are inclusive of most costs and therefore the advance customer payments provide us strong visibility into future revenues and the associated cash flows. By having such visibility into future business, we can more effectively manage any additional sales and marketing efforts that may be required to ensure that the programs reach their targeted occupancy levels. We do not believe in driving participation through discounting and do not generally pursue such strategies. Instead, we focus on enhancements that add significant value to the product without significant incremental cost, as well as targeted marketing efforts in order to strengthen occupancy rates, if required. Based on our offerings, the targeted audience and premium pricing, our guests are generally older, more affluent and do not travel with three or four individuals in one cabin. As it is cruise industry convention to base 100% occupancy on two persons per cabin, the Lindblad segment may report occupancy levels that are somewhat lower than the large cruise lines serving the broader market, where three or more occupants per cabin is not uncommon. However, we have historically achieved strong occupancy rates including operating at 81%, 89% and 91% occupancies for the years ended December 31, 2021, 2020 and 2019, respectively. The occupancy rates for 2021 and 2020 have been skewed by the effects of the COVID-19 pandemic. Maximize and Grow Net Yieldsper Available Guest Night We have historically achieved high net yields per available guest night and continue to see opportunities for growth. In the cruise industry, net yield per available guest night is a frequently referenced metric and refers to tour revenues net of commissions and certain direct costs in a specific period divided by the number of available guest nights. Our net yield per available guest night is driven by our offerings, premium pricing and ancillary guest revenue, such as pre- or post-voyage trip extensions, add-on optional activities, trip insurance and onboard spend. At the Lindblad segment, net yield per available guest night was $879, $1,048 and $1,051 in 2021, 2020, and 2019, respectively. The net yield per available guest night for 2021 and 2020 have been skewed by the effects of the COVID-19 pandemic. Our net yield per available guest night is significantly higher than the large-scale cruise line operators and we expect to be able to continue our track record of maintaining strong pricing and growing ancillary guest revenues through increased sales focus and marketing efforts. Elevate Brand Awareness and Loyalty The Lindblad brand is recognizable by our guests primarily due to our heritage, decades of sales and marketing investment and longstanding strategic alliance with National Geographic. We believe we have fostered strong guest and brand loyalty, as is evidenced by our high levels of repeat guests. Historically, approximately 40% of Lindblad guests booked through our U.S. office have been past guests. We have closely aligned our Lindblad marketing efforts with National Geographic to maximize impact in the marketplace and have engaged in a co-branding strategy with respect to our owned vessels. In addition, we are recognized as a leader in promoting the issue of conservation of the planet and encourage our guests to Disciplined Expansion We believe affluent travelers view their retirement as “a time to travel and explore new places,” favoring immersive and authentic experiences. This has led to strong growth in the Given the demand for expedition cruising, we have strategically expanded our owned and operated fleet from six ships to ten ships through a new build program. This included the delivery of two polar ice-class vessels, the National Geographic Resolution during 2021 and the National Geographic Endurance in 2020, more than doubling the size of our existing polar capacity, and the delivery of two new coastal vessels, the National Geographic Venture in 2018 and the National Geographic Quest in 2017, nearly tripling the capacity of our US-flagged fleet. During 2021 we further diversified our product portfolio, with the We Operations Guest Activities and Services We provide our guests the opportunity and the tools to be active and engaged explorers. Our vessels carry a variety of equipment for exploration which, depending on the ship and destination, may include Zodiacs for water-based activities and quick transfers to shore, kayaks and paddleboards for personal exploration, motorized skiffs, an underwater camera, a remotely operated vehicle, a video microscope to study some of the smallest organisms of the marine ecosystem, a crow’s nest camera atop a ship’s mast, hydrophones for listening to vocalizations of marine mammals, snorkeling gear, scuba gear and wetsuits. An experienced and knowledgeable expedition staff leads guests in exploration while Zodiac riding, hiking onshore, paddling on the water or observing wildlife from ashore or onboard the ship. All voyages feature a certified photo instructor onboard and many include photographers from National Geographic. All of our land tour companies share a commitment to an exceptional guest experience – achieved in part through small groups, best-in-class interpretation and guiding, and local connections built over decades of operating in their destinations. Each company offers a variety of services, activities and equipment specific to their tour segment. We provide equipment for guests such as kayaks, snowshoes, parkas, and bicycles – from high-end road bikes to luxurious e-bikes. We transport guests in vehicles specific to the journey such as customized polar rovers for up-close viewing of polar bears on the Tundra, specialized 4x4 Land Rovers while on safari or dedicated support vehicles that follow the day’s bicycle route distributing refreshments and offering a lift to tired bikers. Experienced, local guides lead guests on journeys while viewing grizzly bears in Alaska, cycling through Tuscany, hiking in Zion, touring ancient ruins in the Amazon, rafting the Grand Canyon or taking in meals with locals in a Mediterranean village. Our ships and land tours allow us to offer guests We offer to handle virtually all travel aspects related to guest reservations and transportation, simplifying the planning and booking process for our guests. We also provide guests the opportunity to purchase pre- and post-expedition extensions or services that may include additional hotel nights, air travel, private transfers, excursions, land travel packages and travel protection insurance. We place a strong emphasis on identifying the needs of our guests and creating expedition and travel opportunities that our guests value. We use communication strategies and marketing campaigns designed to strengthen brand awareness and to emphasize the distinctive qualities of each experience we offer. Marketing strategies include the use of direct marketing, mail and email; digital media, including search, social media and programmatic ad buying; traditional media; brand websites; and travel agencies and other strategic third-party distribution partners. We source our business through a combination of direct selling, travel agency networks and, at the Lindblad segment, through our strategic alliance with National Geographic. We invest in maintaining strong relationships with our key travel agency network partners and seek to maintain commission rates and incentive structures that are competitive within the marketplace. Historically, the majority of our guests have been from the United States. Expedition cruise guests sourced from the U.S. represented approximately 98% of our total global expedition cruise guests’ ticket revenue in 2021 and 91% in 2020 and 2019. Our We also generate significant bookings from travel agents and wholesalers, representing approximately 26% of expedition cruise guest ticket revenue for the year ended 2021, 30% for the year ended 2020 and 29% for the year ended 2019. Agent outreach efforts are focused primarily on consortiums, or travel agent networks, which target affluent travelers. The four consortiums with which we have preferred partner agreements are Virtuoso, Signature, American Express and Ensemble. Preferred status provides their agents with financial incentives to book their customers on our expeditions and provides us the opportunity for enhanced marketing to their agents and end-user customers. Our agent and affinity sales team The National Geographic relationship also serves as a significant channel for bookings for our expedition cruise business. Our alliance with National Geographic includes a co-selling and co-marketing arrangement through which National Geographic promotes our expedition cruise offerings in its marketing campaigns across web-based, email, print and other marketing platforms and sells our expeditions through its internal travel division. The National Geographic channel represented approximately 28% of expedition cruise guest ticket revenues for 2021, and 24% for 2020 and 2019. As part of this relationship, our owned vessels carry the The remainder of our We have a broad and diverse marketing mix across multiple media platforms and channels, allowing us to We operate several websites, www.expeditions.com for our Our marketing team encompasses broad and diverse skill sets including product and channel marketing, digital marketing, database marketing, copywriting and creative, video production and research and analytics. Our Our land-based travel prices typically include accommodations, transportation while on tour, gear specific to the tour and most activities and meals, other than items of a personal nature, such as airfare to and from the tour and certain other specialized events or activities. Prices vary depending on many factors, including the destination, activities included, tour length and time of year during which the trip takes place. Payment terms generally require an upfront deposit to confirm a reservation with the balance due prior to departure. Lindblad tour revenues from the sale of guest tickets are mildly seasonal, historically larger in the first and third quarters. The seasonality of our operating results fluctuates due to our vessels being taken out of service for scheduled maintenance or drydocking, which is typically during nonpeak demand periods, in the second and fourth quarters. Our Strategic Alliance with National Geographic We benefit from a longstanding relationship with the National Geographic, Through this alliance, we collaborate with National Geographic on exploration, research, technology and conservation in order to provide travel experiences and disseminate geographic knowledge around the globe. The Lindblad/National Geographic alliance, which includes all of the Americas, is set forth in an Alliance and License Agreement and a Tour Operator Agreement with terms until December 31, 2025. Sven-Olof Lindblad, our founder Natural Habitat has partnered with Business and Growth Strategies The following are the key components of our business strategy: Deliver Exceptional Guest Experiences Our chief We believe that our guests do not want to be passive tourists, so our expeditions and travel experiences foster active engagement. Our ships are equipped with tools for exploration to get our guests out in the open for up-close forays, or to let guests see deeper into the marine or terrestrial environments surrounding them. It is our goal to provide guests with differentiated opportunities with an experienced expedition team that adds to the guests’ understanding and appreciation, through dedicated observation, insightful commentary and engaging presentations, weaving the expedition into a cohesive narrative. This intense focus on seeking to elevate the overall experience and engaging with guests has resulted in highly favorable customer feedback. We believe that by consistently delivering exceptional experiences to our guests, we have built a highly valuable and trusted brand in the expedition cruising and land-based expedition market, which attracts a growing number of discerning and affluent guests who are prepared to pay a premium for our offerings. We place a strong focus on innovation, which we seek to achieve by introducing new expedition options and continuously making improvements to our fleet and voyage experiences as new technology or operating procedures are developed. We make deployment decisions with the goal of optimizing the overall profitability of our portfolio, with these decisions generally made 18 to 36 months in advance. Adding new capacity and geographies allows us to expand our inventory of existing itineraries, extend into new markets and explore new destinations. High Visibility and Differentiated Revenue Management Strategy Our business model generally allows us to generate consistent free cash flow with high revenue visibility. Given the nature of our expeditions and the expectation that our guests will seek to plan such trips with substantial Unlike the large cruise line operators that serve the broader market, our product to ensure that the programs reach their targeted occupancy levels. We do not believe in driving participation through discounting and do not generally pursue such strategies. Instead, we focus on Maximize and Grow Net Yieldsper Available Guest Night We have historically achieved high net yields per available guest night and continue to see opportunities for growth. Elevate Brand Awareness and Loyalty We Disciplined Expansion We believe affluent travelers view their retirement as “a time to travel and explore new places,” favoring immersive and authentic experiences. This has led to strong growth in the specialty cruise and adventure travel segments and we believe these trends will continue following the COVID-19 pandemic. We are focused on growing our business in a prudent and disciplined manner. When evaluating various strategies for expansion of guest capacity and product offerings, we consider closely the expected return on invested capital and the range of possibilities, such as a newbuild program, adding selected charters and the acquisitions of existing ships or operators. Given the demand for expedition cruising, we have strategically expanded our owned and operated fleet from six ships to ten ships through a new build program. This included the delivery of two polar ice-class vessels, the National Geographic Resolution during 2021 and the National Geographic Endurance in 2020, more than doubling the size of our existing polar capacity, and the delivery of two new coastal During 2021 we further diversified our product portfolio, with the acquisition of Off the Beaten Path, a We believe that we have growth prospects. Operations Guest Activities and Services We provide our guests the opportunity and the tools to be active and engaged explorers. Our vessels carry a variety of equipment for exploration which, depending on the ship and destination, may include Zodiacs for water-based activities and quick transfers to shore, kayaks and paddleboards for personal exploration, motorized skiffs, an underwater camera, a remotely operated vehicle, a video microscope to study some of the smallest organisms of the marine ecosystem, a crow’s nest camera atop a ship’s mast, hydrophones for listening to vocalizations of marine mammals, snorkeling gear, scuba gear and wetsuits. An experienced and knowledgeable expedition staff leads guests in exploration while Zodiac riding, hiking onshore, paddling on the water or observing wildlife from ashore or onboard the ship. All voyages feature a certified photo instructor onboard and many include photographers from National Geographic. All of our land tour companies share a commitment to an exceptional guest experience – achieved in part through small groups, best-in-class interpretation and guiding, and local connections built over decades of operating in their destinations. Each company offers a variety of services, activities and equipment specific to their tour segment. We provide equipment for guests such as kayaks, snowshoes, parkas, and bicycles – from high-end road bikes to luxurious e-bikes. We transport guests in vehicles specific to the journey such as customized polar rovers for up-close viewing of polar bears on the Tundra, specialized 4x4 Land Rovers while on safari or dedicated support vehicles that follow the day’s bicycle route distributing refreshments and offering a lift to tired bikers. Experienced, local guides lead guests on journeys while viewing grizzly bears in Alaska, cycling through Tuscany, hiking in Zion, touring ancient ruins in the Amazon, rafting the Grand Canyon or taking in meals with locals in a Mediterranean village. Our ships and land tours allow us to offer guests authentic, up-close experiences in the planet's wild, remote places, but at the same time, enjoy a high level of comfort, convenience and safety. High-quality dining is an integral part of our expedition experiences with influences and flavors that reflect the regions being explored, along with traditional fare. Food is sourced locally whenever practicable from sustainable providers and seating is open with a relaxed atmosphere. Our ships offer a range of services and amenities which allow our guests to travel in comfort. Depending on the ship, these may include a fitness center, a spa offering a variety of treatments, a photo kiosk for photographers to edit and sort photos, 24-hour beverage service, internet connection, laundry facilities and a doctor on call. We offer to handle virtually all travel aspects related to guest reservations and transportation, simplifying the planning and booking process for our guests. We also provide guests the opportunity to purchase pre- and post-expedition extensions or services that may include additional hotel nights, air travel, private transfers, excursions, land travel packages and travel protection insurance. Sales and Marketing We place a strong emphasis on identifying the needs of our guests and creating expedition and travel opportunities We source our business through a combination of direct selling, travel agency networks and, at the Lindblad segment, through our strategic alliance with National Geographic. We invest in maintaining strong relationships with our key travel agency network partners and seek to maintain commission rates and incentive structures that are competitive within the marketplace. Historically, the majority of our Our largest channel for expedition cruise guest bookings is direct contact, either by guests calling We also generate significant bookings from travel agents and wholesalers, representing approximately efforts are focused primarily on consortiums, or travel agent networks, which target affluent travelers. The four consortiums with which we have preferred partner agreements are Virtuoso, Signature, American Express and Ensemble. Preferred status provides their agents with financial incentives to book their customers on our expeditions and provides us the opportunity for enhanced marketing to their agents and end-user customers. Our agent and affinity sales team meet with hundreds of highly-targeted agents annually, at consortium conferences and training seminars, and in-person at agency offices to provide hands-on training, support and product knowledge. The National Geographic relationship also serves as a significant channel for The remainder of our expedition cruise bookings, We have a broad and diverse marketing mix across multiple media platforms and channels, allowing us to effectively communicate our product offerings to past guests and prospective guests. We continually optimize our media mix to reach our target demographic. The majority of our annual global marketing spend is focused on consumer-direct Our marketing team encompasses broad and diverse skill sets including product and channel marketing, digital marketing, database marketing, copywriting and creative, video production and research and analytics. Our voyage prices typically include accommodations and all expedition activities and meals, other than items of a personal nature, such as airfare to and from an expedition, spa treatments and certain other specialized events or activities. Prices vary depending on many factors, including the vessel, the destinations on a particular voyage, number of guest berths available, expedition length, cabin category selected and time of year during which the expedition takes place. Payment terms generally require an upfront deposit to confirm a reservation with the balance due prior to departure. We focus on maintaining list pricing of our offerings and any discounting that we pursue is tactical, targeted and infrequent. In addition to our standard expedition packages, we may be able to offer a complete vessel for charter and may provide incentives for this type of arrangement. Group and multi-generational family travel may also be eligible for additional incentives based upon the voyage, duration and number of guests travelling. From time to time, we may incentivize guests to book with us with a variety of offers, including free or Seasonality Natural Habitat, Ship Repair and Maintenance In addition to routine repairs and maintenance performed on an ongoing basis and in accordance with applicable requirements, each of our expedition ships is taken out of service for a scheduled deeper maintenance period to conduct repairs and improvements. We maintain our fleet in accordance with applicable regulations, international conventions and insurance requirements. This includes regularly scheduled maintenance, periodic inspections, drydocking, wetdocking and overhaul. In addition, renovations and replacements of various vessel elements are part of the ongoing process of maintaining the vessels to a high standard of reliability, safety and comfort. For U.S. flagged ships, the statutory requirement is an annual docking and U.S. Coast Guard inspections, normally conducted in drydock. Internationally flagged ships have scheduled dockings approximately every 12 months, for a period of up to three to six weeks. Drydock interval and required inspections are statutory requirements controlled under chapters of the International Convention of the Safety of Life at Sea (“SOLAS”) and Classification Society rules. Under these requirements, passenger ships must be inspected in drydock twice in five years, with the maximum duration between each drydock inspection not to exceed three years, and an underwater hull inspection is required annually. To the extent practicable each ship’s crew and hotel staff remain with the ship during drydocking periods and assist in performing repair and maintenance work. Drydockings are typically planned during non-peak demand periods to minimize the adverse effect on revenue that results from ships being out of service. Suppliers Our largest capital expenditures are for ship acquisition and Insurance We maintain comprehensive insurance coverage at commercially reasonable rates and believe that our current coverage is at appropriate levels to protect against most of the risk involved in the conduct of our business. We maintain insurance on the hull and machinery of each of our ships that includes additional coverage for disbursements, earnings and increased value. We also maintain protection and indemnity insurance for each of our owned ships. In addition, we maintain war risk insurance on each ship, which covers damage due to acts of war, including invasion, insurrection, terrorism, rebellion, piracy and hijacking. This Industry and Market We Strong Growth in Specialty and Small Ship Cruising Segment The specialty and small ship cruising segment of the cruise industry is characterized by vessel size, unique itineraries, active adventures, gourmet culinary programs, highly personalized service and a more inclusive offering. These exclusive attributes, combined with a growing worldwide target population, provide specialty and small ship cruising operators with significant pricing leverage as compared to the other segments of the cruise industry. Ship based travel was growing rapidly prior to the pandemic and is forecasted to recover strongly with an estimated 32 million annual passengers and $36 billion market revenues by 2026, per a 2021 Statista report. Despite this anticipated growth, we believe the specialty cruise industry still has low penetration levels compared to similar land-based vacations, which we believe highlights the continued growth potential for the specialty cruise market following the COVID-19 pandemic. In addition, in the COVID-19 environment, smaller ships allows for a highly controlled environment that is beneficial to implementing stringent cleaning protocols, while also providing for the ability to more efficiently and effectively test our guests and crew prior to boarding. Additionally, expeditions take place in remote locations where human interactions with persons not on the expedition are limited, so there is less opportunity for external influence. Smaller ships also have the ability to be flexible with regards to existing itineraries and are continually investigating additional itinerary opportunities both internationally and domestically, providing a further competitive advantage during these times. Specialty Land-Based Activity Segment Land-based adventure travel is characterized by an emphasis on experience and connection with the visiting surroundings, with typical itineraries containing a number of the following components: nature and the outdoors, physical activity, novel or unique experiences, culture, wellness, sustainability and low impact. Top activities include hiking; culinary, cultural and wellness focused activities; and e-bike cycling. According to the Adventure Travel Trade Association and Euromonitor, the global market for adventure tourism was $683 billion in 2019 and is projected to grow to $1.6 trillion by 2026. Prior to the COVID-19 pandemic, the demand for small-group, immersive travel was growing due to traveler preferences shifting towards authentic experiences. Our land tour companies are led by leaders with 100 years of combined experience in adventure travel, cycling quests and walking tour journeys. Within the specialty of each land tour company, we have journeyed guests through expeditions from the tundra of Manitoba and remote camps in Greenland, to snorkeling, sailing or hiking in the Galápagos Islands, to cycling through the French Alps, to walking in the thyme-scented countryside of Provence. As pioneers in the expedition adventure travel sector, we have established deep expertise and knowledge of operating expedition tours in remote, wild locations. We have earned awards and honors from various representatives of the travel industry, including recognition for the quality of our offerings and our support for conservation and sustainable tourism. Attractive Target Market Demographics Our offerings appeal to a wide range of travelers, both individuals and families, but affluent individuals in the U.S. aged 50 years or older represent our largest demographic category. We believe that our small ship expedition and small group land tour offerings, with itineraries that promote up-close encounters with wildlife, nature and culture, have significant appeal to this target market. These individuals are also generally near-retirement or retired and have the leisure time and disposable income available to pursue the type of activities that we provide. Based on the U.S. Census Bureau’s 2021 National Projections, the age group of 50 years and older numbered approximately 121 million individuals in 2021, or approximately 36% of the U.S. population, and is expected to grow 4% to 126 million by 2025. High Barriers to Entry The cruise industry in general, and the adventure travel and specialty cruise industries specifically, are characterized by high barriers to entry, which include the expertise and experience required to operate safely and effectively in remote locations, the existence of several well-established and recognizable brands and the time and personal relationships required to develop strong networks of experts, guides and vendors to lead and support experiential travel. Additionally, there are large investments required to build new, sophisticated ships, long lead times necessary to construct new ships and limited newbuild shipyard capacity. Operators must also develop strong travel agent network partnerships, as well as acquire local permits or licenses required to operate in a diverse range of geographies. Competition For our ship-based expeditions, we compete with a number of cruise lines with competition varying by destination. The market is currently fragmented and primarily comprised of private operators. The primary competitors that operate in the geographic regions we serve include Silversea Expeditions, Quark Expeditions, Compagnie du Ponant, Hurtigruten and UnCruise Adventures. We expect our competition in the specialty cruise business to continue to increase in future years as the expedition cruising market continues to grow and large cruise operators seek access to the market through acquisitions or development of their own vessels and operations. For our land-based expeditions, we compete with a variety of companies offering itineraries in the countries in which we operate. These range from small private operators to larger companies operating across multiple countries. Some of our larger competitors include Abercrombie & Kent, Overseas Adventure Travel, Mountain Travel Sobek, Butterfields & Robinson and Backroads. We also compete with other vacation alternatives such as land-based resort hotels and sightseeing destinations for guests’ leisure time. Environmental and Social We are driven by the goal of helping people see, feel, discover and appreciate the natural world, increasing awareness and appreciation for the environment and, in turn, care for sustainability. We have been Lindblad and Natural Habitat are 100% carbon neutral, with Natural Habitat being the world’s first 100% carbon neutral travel company, and both are single-use plastic free. In 2008, the LEX-NG Fund was established to support ocean conservation, the restoration of marine and coastal habitats and environmental stewardship. Environmental Stewardship Our staff is involved in In 2018, we eliminated guest-facing single-use plastics fleet-wide and we have Our staff works with several organizations to promote sustainable seafood programs where possible, including (i) the Monterey Bay Aquarium Seafood Watch program, whose scientific-based standards guide seafood producers, industry leaders, organizations, and governments around the globe to improve their fishing practices, (ii) a co-op in the At Natural Habitat, we have crafted our entire enterprise around the mission of conservation through exploration – protecting our planet by inspiring travelers, supporting local communities and bolding influencing the entire travel industry. Sustaining the world’s wild places and the people who live in and around them is integral to who we are. Because of our Since 2007, Natural Habitat Adventures has been the world's first 100% carbon-neutral travel company. In 2019, we took our commitment to a whole new level: we also offset all our travelers' flights to and from our global adventure destinations, increasing the total amount of our carbon offsetting by 300-400%. Natural Habitat has been actively working to mitigate the waste produced on our adventures. In 2011, we opted to get rid of single-use plastic water bottles on our trips, accomplishing that goal worldwide within two years. In 2018, we eliminated plastic straws. In 2019, Natural Habitat operated the World’s First Zero Waste Adventure in Yellowstone National Park, an ambitious quest to reduce waste so dramatically that everything we generated on a weeklong trip would fit into one quart-sized bottle. Lindblad Expeditions–National Geographic Joint Fund for Exploration and Conservation (LEX-NG Fund) One of Lindblad’s guiding principles is to positively impact the areas we explore and in which we work. To this end, we, along with the National Geographic Society, created the LEX-NG Fund to support projects at the global, regional and local level. The objective of the LEX-NG Fund is to support projects to understand and protect our world’s oceans, restore critical marine and coastal habitats, and foster environmental stewardship in the regions visited by our fleet, and beyond. Together with our guests, we have granted $16.3 million to a variety of projects supporting the regions we visit since the Fund was established in 2008. Since we and the National Geographic Society together cover the LEX-NG Fund’s operating costs, 100% of guest contributions go directly to on-the-ground projects. During 2021, the LEX-NG Fund issued 18 unique grants to early career conservationists, educators, researchers, and storytellers, plus six unique grants to regional partners in the Galápagos Islands. It also pledged support to The National Geographic Society’s Pristine Seas program, Grosvenor Teacher Fellowship, and three additional regional partners in Southeast Alaska, Baja California, the Galápagos Islands, and the Peruvian Amazon. These 2021 grants and pledges are supported by approximately $1.9 million in funding from the LEX-NG Fund. In 2020, the LEX-NG Fund issued eight unique grants to eight regional partners in five key regions, while also supporting three major National Geographic Society conservation, education and research initiatives: Pristine Seas, Grosvenor Teacher Fellowship and Early Career Grants. All funds being spent for these activities were donated by guests traveling aboard our fleet and proceeds from the common stock shares referenced above. The LEX-NG Fund is managed jointly by one of our staff members and one National Geographic Society staff member, and the Board is currently comprised of five members, including Sven-Olof Lindblad, our founder and board of directors Co-Chairperson; Ian Miller, Chief Science and Innovation Officer at the National Geographic Society; and Alex Moen, Chief Explorer Engagement Officer at the National Geographic Society. Human Capital Resources and Management At Lindblad Expeditions, we adhere to our guiding principles, one of which is treating everyone with dignity and respect, and we simply could not do our work without the diverse kaleidoscope of humanity that creates and delivers our remarkable offerings across the planet. As a Company that respects and celebrates the inherent diversity in the places we explore, we recognize the need to mirror that same diversity and all the interconnected perspectives within our organization. We are committed to building a community of different genders, races, ages, sexual orientations, chosen identities, and countries of origin where every person brings their whole self to work and whose skills, talents and abilities are valued. We believe we can explore farther and in a more meaningful way by actively creating a more diverse and inclusive organization where everyone feels that they belong. As of December 31, 2021, we had approximately 720 employees, including approximately 390 shipboard employees, and approximately 310 full-time and 20 part-time employees in our shoreside operations. Some of our employees in Ecuador are represented by a collective bargaining agreement. During 2020, the COVID-19 pandemic forced us to suspend travel operations and furlough the majority of vessel crew as well as a portion of our shoreside and office personnel, during which time health and other benefits were provided. As travel operations resumed during 2021 all furloughed employees were reinstated. The safety, health and wellness of our employees is a top priority. The Company promotes the health and wellness of its employees by strongly encouraging work-life balance and keeping the employee portion of health care premiums to a minimum. The COVID-19 pandemic has presented a unique challenge with regard to maintaining employee safety while continuing successful operations. Through teamwork and the adaptability of our management and staff, our office employees have continued to primarily work remotely as we resume general business operations. We encourage and support the growth and development of our employees and, wherever possible, seek to fill positions by promotion and transfer from within the organization. We look for enthusiastic team members who are accomplished in their field, excellent communicators, good leaders, and have a passion for travel. One of our guiding principles is to ensure that everything adds value to the guest experience and our office personnel, expedition staff and marine teams work diligently to ensure that our guests receive exceptional experiences and service. It is our daily interactions with guests that help them appreciate the history and natural history of each location, find inspiration, adventure and have a once in a lifetime experience. This guiding principle also furthers employee retention by honoring the value of employee service and actively prioritizing concern for our employees’ well-being, supporting our employees’ career goals, offering competitive wages and providing valuable fringe benefits that aid in retention of our top-performing employees. We align base and variable pay with the external market, to ensure external competitiveness while maintaining internal value or equity within the organization. Our short-term and long-term incentive plans are designed to provide a variable pay opportunity to reward the attainment of key financial and operational goals and shareholder value creation. The mix among base compensation, short-term incentives and long-term incentives is designed to align with the competitive market. We provide a variety of benefits including but not limited to healthcare coverage, Fluctuations may occur within our workforce due to Regulation Our ships are regulated by various international, national, state and local laws, regulations and treaties in force in the jurisdictions in which they operate. From time to time, various regulatory and legislative changes may be Safety and Security Regulations Our ships are required to comply with international safety standards Our ships are also subject to various security requirements, including the International Ship and Port Facility Security Code (“ISPS Code”), which is part of SOLAS, and the U.S. Maritime Transportation Security Act of 2002 (“MTSA”), which applies to ships that operate in U.S. ports. In order to satisfy these security requirements, we implement security measures, conduct vessel security assessments and develop security plans. The security plans for all of the ships have been submitted to, and approved by, the respective countries of registry for compliance with the ISPS Code and the MTSA. Environmental Regulations We are subject to various U.S. and international laws and regulations relating to environmental protection. Under such laws and regulations, we are prohibited from, among other things, discharging certain materials, such as petrochemicals and plastics, into the waterways. From time to time, environmental and other regulators may consider more stringent regulations, which may affect our operations and increase compliance costs. The ships are subject to the International Maritime Organization’s regulations under the International Convention for the Prevention of Pollution from Ships (the “MARPOL Regulations”), which includes requirements designed to minimize pollution by oil, sewage, garbage and air emissions. We have obtained the relevant international compliance certificates relating to oil, sewage and air pollution prevention for all of our ships. The MARPOL Regulations impose global limitations on the sulfur content of fuel used by ships operating worldwide and also establish special Emission Control Areas (“ECAs”) with stringent limitations on sulfur and nitrogen oxide emissions in these areas. As of February 2014, there were four established ECAs: the Baltic Sea, the North Sea/English Channel, certain of the waters surrounding the North American coast, and the waters surrounding Puerto Rico and the U.S. Virgin Islands. Currently, ships operating in ECAs are required to operate on fuel with a sulfur content of not more than 0.1% m/m (mass by mass). Ships operating elsewhere In July 2011, MARPOL Regulations introduced mandatory measures to reduce greenhouse gas emissions. These include the utilization of an energy efficiency design index (“EEDI”) for new ships as well as the establishment of an energy efficient management plan for all ships. The EEDI is a performance-based mechanism that requires a certain minimum energy efficiency in new ships. These regulations apply to new vessels commissioned after January 1, 2013. The These laws relating to vessels are principally contained in 46 U.S.C. Labor Regulations The International Labour Organization, an agency of the United Nations that develops worldwide employment standards, adopted a Consolidated Maritime Labour Convention (the “Convention”) in 2006, which became effective in August 2013. The Convention reflects a broad range of standards and conditions governing all aspects of crew management for ships in international commerce, including additional requirements not previously in effect relating to the health, safety, repatriation, entitlements and status of crewmembers and crew recruitment practices. Each of our ships, except for our two ships operating in Ecuador (not a signatory to the Convention), has received its certification of compliance with the requirements of the Convention. Consumer Financial Responsibility Regulations U.S. law requires the operators of passenger vessels embarking passengers at U.S. ports to be certified by the United States Federal Maritime Commission as to their ability to satisfy obligations with respect to unearned passenger revenue in case of non-performance, and for liability in case of casualty or personal injury. We satisfy these requirements with respect to our Regulations Regarding Protection of Disabled Persons Our U.S. flag vessels, theNational Geographic Sea Bird, In June 2013, the U.S. Architectural and Transportation Barriers Compliance Board proposed guidelines for the construction and alteration of passenger vessels to ensure that the vessels are readily accessible to and usable by passengers with disabilities. If and when finalized, these guidelines will be used by the U.S. Department of Transportation and U.S. Department of Justice to implement mandatory and enforceable standards for passenger vessels covered by the Americans with Disabilities Act. We cannot, at this time, accurately predict whether we will be required to make material modifications or incur significant additional expenses given the status of the proposed guidelines. Corporate Information and History We were originally incorporated in Delaware on August 9, 2010 with the name Capitol Acquisition Corp. II as a blank check company to acquire, through a merger, share exchange, asset acquisition, stock purchase, plan of arrangement, recapitalization, reorganization or other similar business combination, one or more businesses or entities. On July 8, 2015, we completed a series of mergers whereby Lindblad Expeditions, Inc., a New York corporation originally incorporated in July 1979, became our wholly-owned subsidiary. Immediately following the mergers, we changed our name to Lindblad Expeditions Holdings, Inc. Our corporate headquarters are located at 96 Morton Street, Item 1A. You should carefully consider the risk factors set forth below and the other information in this Annual Report on Form 10-K. The matters discussed in the risk factors, and additional risks and uncertainties not currently known to us or that we currently deem immaterial, could have a material adverse effect on our business, financial condition, results of operation and future growth prospects. Some of these risks include: ● suspended operations, cancelling or rescheduling of voyages and other potential disruptions to our business and operations related to the COVID-19 virus; ● the impact of the COVID-19 virus on our financial condition, liquidity, results of operations, cash flows, employees, plans and growth; ● the impacts of the COVID-19 virus on future travel and the cruise and airline industries in general; ● adverse worldwide economic, geopolitical or other conditions could reduce the demand for expedition travel; ● adverse publicity concerning the cruise industry in general; ● unscheduled disruptions in our business due to travel restrictions, weather events, mechanical failures, pandemics or other events; ● changes adversely affecting the business in which we are engaged; ● management of our growth and our ability to execute on our planned growth, including our ability to successfully integrate acquisitions; ● our business strategy and plans; ● our ability to maintain our partnership with National Geographic; ● compliance with financial and/or operational covenants in our debt arrangements; ● the impact of severe or unusual weather conditions, including climate change, on our business; ● loss of business due to competition; ● the result of future financing efforts; ● compliance with new or existing laws and regulations, including environmental regulations, travel advisories and restrictions; and ● our common stock ranks junior to our Series A Convertible Preferred Stock with respect to dividends and amounts payable in the event of our liquidation, dissolution or winding-up of our affairs. Risks Related to the COVID-19 Pandemic Restrictions or extended restrictions,on expeditiontravel in general, havematerially adversely affected our business and could materially adversely affectour financial condition and liquidity. Although many travel restrictions have been lifted or eased, such measures may be reimposed or extended. Any cases of COVID-19 on one of our vessels could result in a subsequent suspension of travel or limit our ability to disembark guests from such vessels. There can be no assurance that our guests will be able to travel to embarkation or from disembarkation destinations, or that such locations will not implement new travel restrictions in place which would impact our ability to sail scheduled itineraries. In addition, following the ease of travel restrictions, there is no assurance that guests will immediately recommence travel to pre-pandemic levels. Travel restrictions have materially adversely impacted our business and operations and existing or new travel restrictions or lower guest demand would have a material adverse impact on our results of operations, financial condition and liquidity. COVID-19 has had and will continue to have, a significant impact on our financial condition and operations, which may impactour ability to obtain acceptable financing to fund the necessarycash needed for operations. The currentand uncertain futureimpact of the COVID-19 pandemic, including its effect on the ability or desire of people to travel, is expected to continue to impact our results, operations, outlooks, plans, goals, growth, cash flows andliquidity. The spread of the COVID-19 virus and the recent developments surrounding the global pandemic has had, and will continue to have, a material negative impact on all aspects of our business. We previously had to suspend or cancel, as applicable, all our expedition operations and such measures may be required again in the future. In addition, we have been and will continue to be further negatively impacted by related developments, including new variants of the COVID-19 virus, continued heightened governmental regulations and travel advisories, issues with the effectiveness, availability or safety of vaccines, current and future recommendations by the U.S. Department of State and the Centers for Disease Control and Prevention, and travel bans and restrictions, each of which has impacted, and will continue to significantly impact, our access to various destinations, operations and demand for travel in general. We will continue to incur COVID-19 related costs as we continue to implement additional health and hygiene-related protocols. In addition, the industry has already been and may again in the future be subject to enhanced health and hygiene requirements in attempts to counteract future outbreaks, which requirements may be costly and take a significant amount of time to implement across our expedition fleet and operations or result in cancellations. We cannot predict with certainty any future travel bans, COVID-19 outbreaks on our vessels or the general demand for expedition travel as a result of the COVID-19 virus, and we cannot predict if and when we will return to pre-COVID-19 levels of occupancy. In addition, we cannot predict the impact COVID-19 will have on our partners in the future, such as shipyards for new builds, travel advisors, suppliers and other vendors, and on our land-based travel subsidiaries. Given the dynamic nature of this situation, we cannot reasonably estimate or predict the impact of a future cessation of operations on our costs and future prospects. In particular, we cannot predict the impact on our financial performance and our cash flows required for cash refunds of deposits as a result of future cancellations or rescheduling, as applicable, of our expeditions, which may be further extended, and the public’s concern regarding the health and safety of travel, especially by ship, and related decreases in demand for travel. Moreover, our ability to attract and retain guests and crew depends, in part, upon the perception and reputation of our Company, our expedition destinations and offerings and the public’s concerns regarding the health and safety of travel generally, as well as regarding the industry and our ships specifically. In addition, an outbreak among our employees could cause cancellations or make it difficult to operate and find additional labor. The current outbreak and continued spread of COVID-19 could cause a global recession, which would have a further adverse impact on our financial condition and operations. In past recessions, demand for our expeditionary travel offerings has been significantly negatively impacted which has resulted in lower occupancy rates and adverse pricing. Current economic forecasts for significant increases in unemployment in the U.S. and other regions is likely to continue to have a negative impact on demand for our expeditions, and these impacts could exist for an extensive period of time. We rely on supply chain vendors and third-party service providers who are integral to the operations of our businesses. These vendors and service providers are also affected by COVID-19 and may be unable or unwilling to deliver on their commitments or may act in ways that could harm our business. We rely on supply chain vendors to deliver key products to the operations of our businesses around the world. Any event impacting a vendor’s ability to deliver goods of the expected quality at the location and time needed could negatively impact our ability to deliver our cruise experience. Events impacting our supply chain could be caused by factors beyond the control of our suppliers or us, including inclement weather, natural disasters, new laws and regulations, labor actions, increased demand, problems in production or distribution and/or disruptions in third-party logistics, information technology or transportation systems, including those caused by the COVID-19 pandemic. Any such interruptions to our supply chain could increase our costs and could limit the availability of products critical to our operations. In order to achieve cost and operational efficiencies, we outsource to third-party vendors certain services that are integral to the operations of our global businesses, such as our onboard concessionaires, certain of our call center operations, guest port services, logistics distribution and operation of a large part of our information technology systems, which are also affected by the COVID-19 pandemic. We are subject to the risk that certain decisions are subject to the control of our third-party service providers and that these decisions may adversely affect our activities. A failure to adequately monitor a third-party service provider’s compliance with a service level agreement or regulatory or legal requirements could result in significant economic and reputational harm to us. There is also a risk the confidentiality, privacy and/or security of data held by third parties or communicated over third-party networks or platforms could become compromised. Risks Related to Our Business and Operations Adverse worldwide economic, geopolitical or other conditions could reduce the demand for expedition travel and adversely impact our operating results, cash flows and financial condition. The demand for travel experiences, including expedition cruises and land-based travel, may be adversely affected by international, national and local economic and geopolitical conditions. In particular, a deterioration in global economic conditions that adversely affects discretionary income and consumer confidence may, in turn, result in decreased bookings, prices and onboard revenues for the expedition and cruise industries. Uncertain economic conditions also impact consumer confidence and pose a risk as vacationers may postpone or reduce discretionary spending. Demand for our expeditions may also be influenced by geopolitical events. Unfavorable conditions, such as cross-border conflicts, civil unrest and governmental changes, health pandemics and other events can decrease consumer demand and result in reduced pricing for expeditions in areas affected by such conditions. Incidents or adverse publicity concerning the cruise industry, the expedition travel industry or the travel industry in general, The operation and/or use of cruise ships, land tours, port facilities and shore excursions involves the risk of accidents, illnesses, mechanical failures, environmental incidents including oil spills, and other incidents. Such incidents, whether on one of our expeditions or not, may cause guests and potential guests to question their safety, health, security and vacation satisfaction, and could negatively impact our reputation. Incidents involving cruise ships, particularly the safety and security of guests and crew, media coverage thereof, as well as adverse media publicity in general concerning the cruise industry, have previously impacted and could in the future impact demand for our expeditions and pricing in the industry. The considerable expansion in the use of social media over recent years has compounded the potential scope of the negative publicity that could be generated by those incidents. If any such incident occurs during a time of high seasonal demand, the effect could disproportionately impact our results of operations for the year. In addition, incidents involving cruise ships may result in additional costs to our business, including costs related to increasing government or other regulatory oversight. Incidents involving our own fleet may result in litigation. Events such as terrorist and pirate attacks, war and other hostilities and the resulting political instability, travel restrictions, such as travel bans to and from certain geographical areas and heightened regulations around customs and border control, the spread of contagious diseases, such as COVID-19, zika or other viruses, and other related concerns over the safety, health and security aspects of traveling, or the fear of any of the foregoing, have had, and could have in the future, a significant adverse impact on demand and pricing in the travel and vacation industry. In view of our global operations, we are susceptible to a wide range of adverse events, which could decrease demand and adversely affect our business. In addition, adverse publicity from incidents at sea or in remote locations, even when not involving any of our ships or travel offerings, may discourage prospective travelers from taking an expedition-style trip. Our business may be negatively affected by severe or unusual weather conditions, including climate change. Our fleet and the port facilities we use may also be adversely impacted by weather patterns or natural disasters or disruptions, such as hurricanes, earthquakes and changes in ice floes. From time to time, we may be forced to alter itineraries or cancel expeditions due to these or other factors, which could negatively impact our sales and profitability. In addition, these and any other events that impact the travel industry more generally may negatively impact our ability to deliver guests or crew to our expeditions and/or interrupt our ability to obtain services and goods from key vendors in our supply chain. Any of the foregoing could have an adverse impact on our results of operations and on industry performance. Ship repair, We depend on shipyards to repair, maintain and revitalize our ships on a timely basis and to ensure they remain in good working order. The sophisticated nature of repairing and revitalizing a ship involves risks, and shipyards may encounter financial, technical or design problems when doing these jobs. Delays in ship repair, significant accident, mechanical failure or similar problem involving a ship, we may have to place a ship in drydock for an extended period for repairs. Any such delays, cancellations of expeditions and/or unscheduled drydockings could have a material adverse effect on our business, results of operations and financial condition. These events and any related adverse publicity could result in lost revenue, increased operating expenses, or both, and thus adversely affect our results of operations. Delays or cost overruns ● unforeseen engineering or construction problems; ● changes to design specifications; ● delays or unanticipated shortages with respect to necessary materials, equipment or skilled labor; ● inability to obtain the requisite permits, approvals or certifications from governmental authorities and the applicable classification society upon completion of work; ● financial difficulties of the shipyard building a vessel, including bankruptcy; ● lack of shipyard availability; ● work stoppages; and ● weather interference. We must make substantial capital expenditures to maintain and/or expand our We must make substantial capital expenditures to maintain our fleet in good working order. Maintenance capital expenditures include those associated with We Although we believe we can access sufficient liquidity to fund our maintenance, investments, including new ship construction and vessel modification, and obligations as expected, there can be no assurances to that effect. Our ability to access additional funding as and when needed, including for new ship builds, our ability to timely refinance and/or replace our outstanding debt and credit facilities on acceptable terms or at all will depend upon numerous factors, many of which are beyond our control. Our inability to access sufficient liquidity on favorable terms when needed would have a negative impact on our ability to expand our fleet, our results of operations and our financial condition. Failure to maintain our partnership with National Geographic could adversely affect our results of operations. We have an on-going partnership with National Geographic and any termination or alterations to this relationship would likely have an adverse effect on our business. Pursuant to such agreements, our owned vessels contain the phrase “National Geographic” in their names, we have access to certain of National Geographic’s marks and images for advertising purposes, and we and our guests have access to National Geographic photographers, naturalists and other experts. National Geographic has the right in certain instances to unilaterally terminate the Alliance and License Agreement with us, including: ● in the event of a change of control in which Sven-Olof Lindblad or his designated successor ceases to hold a senior management role with the Company; ● our failure to achieve specified year-over-year percentage revenue growth requirements; or ● a failure to meet the conditions necessary to maintain the relationship through 2025. If any of our agreements with National Geographic are terminated or modified in any material respect, due to any of the reasons set forth above or otherwise, our results of operations will likely be materially adversely affected due to loss of name recognition associated with the National Geographic brand as well as a loss of sales generated through National Geographic channels. An increase in capacity worldwide or excess capacity in a particular market could adversely impact our expedition sales and/or pricing. Expedition sales and/or pricing may be impacted both by the introduction of new ships into the marketplace and by deployment decisions of us and our competitors. Many new expedition class ships have been ordered or are already under construction for our competitors. The We may lose business to competitors throughout the vacation market. We operate in the vacation market, and We face significant competition from other vacation and adventure travel operators and cruise companies on the basis of pricing, destination, travel In the event that we do not differentiate our offerings or otherwise do not compete effectively with other vacation and adventure travel operators and cruise companies, our results of operations and financial position could be adversely affected. Unavailability of ports of call may adversely affect our results of operations. The availability of ports and destinations is affected by a number of factors, including existing capacity constraints, constraints related to the size of certain ships, COVID-19 protocols and regulations, security, environmental and health concerns, adverse weather conditions and natural disasters, financial limitations on port development, exclusivity arrangements that ports may have, geopolitical developments, local governmental regulations and local community concerns about port development and other adverse impacts on their communities from additional tourists and overcrowding. In addition, fuel costs may adversely impact the destinations on certain of our itineraries. Traditionally certain ports and destinations are facing a surge of both cruise and non-cruise tourism that, in certain cases, has fueled anti-tourism sentiments and related countermeasures to limit the volume of tourists allowed in these destinations, including proposed limits on cruise ships and cruise passengers. Any limitations on the availability or feasibility of our ports of call could adversely affect our results of operations. Conducting business globally may result in increased costs and other risks. We operate our business globally and plan to continue to expand our international presence. Operating internationally exposes us to a number of risks, including unstable local economic conditions, volatile local political conditions, potential changes in duties and taxes, including changing interpretations of existing tax laws and regulations, potential changes in local laws, rules and regulations, required compliance with additional laws and policies affecting cruising, vacation or maritime businesses or governing the operations of foreign-based companies, currency fluctuations, interest rate movements, government controlled fuel prices, difficulties in operating under local business environments, U.S. and global anti-bribery laws Operating globally also exposes us to numerous and sometimes conflicting legal and regulatory requirements. In many parts of the world, including countries in which we operate, practices in the local business communities might not conform to international business standards. We must adhere to policies designed to promote legal and regulatory compliance Failure by us, our employees or any of these third parties to adhere to our policies or applicable laws or regulations could result in penalties, sanctions, damage to our reputation and related costs which in turn could negatively affect our results of operations and cash flows. Our efforts to expand our business into new markets, complete acquisitions or realize the anticipated benefits thereof may not be successful. We also expect to continue to pursue acquisitions in the future, which are subject to, among other factors, our ability to identify attractive business opportunities and to negotiate favorable terms for such opportunities. Accordingly, we cannot make any assurances that past or future acquisitions will be completed timely or at all, or that if completed, we would realize the anticipated benefits of such acquisition. Acquisitions also carry inherent risks such as, among others: (i) the potential delay or failure of our efforts to successfully integrate business processes and realizing expected synergies; (ii) difficulty in aligning procedures, controls and/or policies; and (iii) future unknown liabilities and costs that may be associated with an acquisition. In addition, acquisitions may also adversely impact our liquidity and/or debt levels, and the recognized value of goodwill and other intangible assets can be negatively affected by unforeseen events and/or circumstances, which may result in an impairment charge. Any of the foregoing events could adversely impact our financial condition and results of operations. If our redeployment of vessels to a new market with new itineraries is not successful, our business and operating results may be adversely affected. We cannot predict whether new expeditions and new itineraries Failure to develop the value of our brand and differentiate our products could adversely affect our results of operations. Our success depends on the strength and continued development of our expedition brand and on the effectiveness of our brand strategies. Failure to protect and differentiate our brand from competitors throughout the vacation market could adversely affect our results of operations. We have a relationship with World Wildlife Fund WWF is a leading conservation organization whose mission is to conserve nature and reduce the most pressing threats to the diversity of life on Earth. Natural Habitat partners with WWF to offer conservation travel through a license agreement that allows Natural Habitat to use the WWF name and logo in return for a royalty fee, through 2023. If Natural Habitat’s license agreement with Environmental, labor, health and safety, financial responsibility and other maritime regulations could affect operations and increase operating costs. In addition, we are subject to various international, national, state and local laws, regulations and treaties that govern, among other things, safety standards applicable to our ships, treatment of disabled persons, health and sanitary standards applicable to our guests, security standards on board our ships and at the ship/port interface areas, and financial responsibilities to our guests. These issues are, and we believe will continue to be, an area of focus by the relevant authorities throughout the Our operating costs Our We historically have been able to obtain insurance coverage in amounts and at premiums we have deemed to be commercially acceptable. No assurance can be given that affordable and secure insurance markets will be available in the future, particularly for war risk insurance. All of our insurance coverage is subject to certain limitations, exclusions and deductible levels. We may be unable recruit, develop and retain qualified shipboard personnel who live away from home for extended periods of time and other qualified employees, which may adversely impact our business operations, guest services and satisfaction. We hire a significant number of qualified shipboard personnel each year and, thus, our ability to adequately recruit, develop and retain these individuals is critical to our success. Incidents involving cruise ships, including isolated COVID-19 infections that could result in potential outbreaks on our ships, and the related adverse media publicity, and adverse economic conditions that negatively affect our profitability could negatively impact our ability to recruit, develop and retain sufficient qualified shipboard personnel. In addition, in general, the United States is experiencing a labor shortage and our ability to attract, recruit, develop and retain qualified personnel is more difficult, and any shortage of qualified employees could adversely impact our business and operations. Price increases for commercial airline service for our guests or major changes or reductions in commercial airline service and/or availability could increase our operating expenses and adversely impact the demand for expedition travel. Most of our guests depend on scheduled commercial airline services to transport them to or from the ports where our expeditions embark or disembark passengers. Increases in the price of airfare would increase the overall price of the expedition vacation to our guests, which may adversely impact demand for our expeditions. In addition, changes in the availability of commercial airline services (whether due to price increases, COVID-19 issues, a reduction in direct flights, flight cancellations or other factors) could adversely affect our guests’ ability to obtain air transport, which could adversely affect our results of operations. Our reliance on travel Because we rely on travel Disruptions in our shoreside operations or our information systems may adversely affect our results of operations. Our principal executive offices are located in New York, New York, Fluctuations in foreign currency exchange rates could affect our financial results. We In addition, we have ship maintenance contracts, and may The loss of key personnel, our inability to recruit or retain qualified personnel, or disruptions among our shipboard personnel due to strained employee relations could adversely affect our results of operations. Our success depends, in large part, on the reputation, skills and contributions of key executives, We rely on third-party providers of various services integral to the operation of our businesses. These third parties may act in ways that could harm our business. In order to achieve cost and operational efficiencies, we outsource to third-party vendors certain services that are integral to the operations of our global businesses. We are subject to the risk that certain decisions regarding the provision of such services are subject to the control of third-party service providers and that There is also a risk that the confidentiality, privacy and/or security of data held by third parties or communicated over third-party networks or platforms could become compromised. Such a breach could adversely affect our reputation and in turn adversely affect our business. A failure to keep pace with developments in technology or technological obsolescence could impair our operations or competitive position. Our business continues to demand the use of sophisticated technology and systems, such as reservations and reporting systems. These technologies and systems must be refined, updated and/or replaced with more advanced systems in order to continue to meet our guests’ demands and expectations. If we are unable to do so in a timely manner or within reasonable cost parameters or if we are unable to appropriately and timely train our employees to operate any of these new systems, our business could suffer. We also may not achieve the benefits that we anticipate from any new technology or system, and a failure to do so could result in higher than anticipated costs or could impair our operating results. We recently implemented new reservations and CRM systems to modernize and improve current capabilities. The new systems are intended to combine enterprise resource planning solutions, machine learning and custom-built applications to address, among other areas, account management, billing and customer service. The new systems also intend to improve functionality and information flow, help generate higher revenues and increase automation in servicing our customers through the use of artificial intelligence. The failure to properly, efficiently and economically complete transition to and operate the new systems on a timely basis, or at all, could materially disrupt our operations, adversely impact the servicing of our customers and have a material adverse effect on our financial results. Failure to comply with data privacy and security laws and regulations could adversely affect our operating results and business. A number of U.S. states have enacted data privacy and security laws and regulations that govern the collection, use, disclosure, transfer, storage, disposal, and protection of sensitive personal information, such as social security numbers, financial information and other personal information. For example, several U.S. territories and all 50 states now have data breach laws that require timely notification to individual victims, and at times regulators, if a company has experienced the unauthorized access or acquisition of sensitive personal data. Other state laws include the California Consumer Privacy Act (“CCPA”), which contains new disclosure obligations for businesses that collect personal information about California residents and affords those individuals new rights relating to their personal information that may affect our ability to use personal information or share it with our business partners. In addition, numerous other states have also considered privacy laws like the CCPA. We will continue to monitor and assess the impact of these state laws, which may impose substantial penalties for violations, impose significant costs for investigations and compliance, allow private class-action litigation and carry significant potential liability for our business. Outside of the U.S., data protection laws, including the EU General Data Protection Regulation (the “GDPR”), also apply to some of our operations. Legal requirements in these countries relating to the collection, storage, processing and transfer of personal data continue to evolve. The GDPR imposes, among other things, data protection requirements that include strict obligations and restrictions on the ability to collect, analyze and transfer EU personal data, a requirement for prompt notice of data breaches to effected subjects and supervisory authorities in certain circumstances, and possible substantial fines for any violations (including possible fines for certain violations). Other governmental authorities around the world are considering similar types of legislative and regulatory proposals concerning data protection. The interpretation and enforcement of the laws and regulations described above are uncertain and subject to change, and may require substantial costs to monitor and implement compliance with any additional requirements. Failure to comply with U.S. and international data protection laws and regulations could result in government enforcement actions (which could include substantial civil and/or criminal penalties), private litigation and/or adverse publicity and could negatively affect our operating results and business. Our information technology systems are subject to We rely heavily on the proper functioning and availability of our information systems for our operations as well as for providing services to our customers. Our information systems, including our accounting, communications and data processing systems, as well as our maritime and/or shoreside operations, are integral to the has continued to increase in recent years. We utilize third-party service providers who have access to our systems and certain sensitive data, which exposes us to additional security Although our information systems are protected through physical and A change in our tax status under the United States Internal Revenue Code of 1986, as amended (the At the present time, many of our subsidiaries that are foreign corporations do not derive any significant income from sources within the United States and are not subject to significant In addition, the enactment of legislation implementing changes in taxation of international business activities, the adoption of other corporate tax reform policies, or changes in tax legislation or policies could materially affect our financial position and results of operations. In general, changes in tax laws may affect our tax rate, increase our tax liabilities, the carrying value of deferred tax assets, or our deferred tax liabilities. Any substantial changes in international corporate tax policies, enforcement activities or legislative initiatives may materially and adversely affect our business, the amount of taxes we are required to pay and our financial condition and results of operations generally. Restrictions on travel or access to certain protected or preserved areas could adversely affect our business. For instance, the number of visitors admitted to the Galápagos National Park at any given time is limited by the number of “cupos” permits issued by the Galápagos National Parks Service. In Changes in other governmental and environmental rules and regulations in the Galápagos Islands and other travel destinations could also cause sudden losses in revenue, together with additional expenditures due to the need to revise our existing itineraries. Restrictions on access for us and our guests to other protected or preserved areas, including national parks, may result in losses in revenues typically generated by our expeditions to such areas. Litigation, enforcement actions, fines or penalties could adversely impact our financial condition or results of operations and/or damage our reputation. Our business is subject to various In addition, as a result of any ship-related or other incidents, Failure to comply with international safety regulations may subject us to increased liability that may adversely affect our insurance coverage resulting in a denial of access to, or detention in, certain ports which could adversely affect our business. The operation of vessels is Compliance with Extensive and changing An inability to obtain adequate insurance coverage could adversely affect our business, financial condition and results of operations. While we maintain comprehensive insurance and believe that our current coverage is at appropriate levels, we are not protected against all risks and there can be no assurance that any particular claim will be fully paid by our insurance. Such losses, to the extent they are not adequately covered by contractual remedies or insurance, could affect our financial results. Our protection and indemnity (“P&I”) liability insurance is placed on a mutual basis and we are subject to additional premium calls in amounts based on claim records of all members of the P&I If we do not restrict the amount of ownership of our common stock by non-U.S. citizens, we could be prohibited from operating vessels in U.S. coastwise trade, which would adversely impact our business and operating results. To the extent any of our U.S. ports. Subject to limited exceptions, the Restrictions on non-U.S. citizen ownership of certain U.S. flagged vessels could limit our ability to sell off a portion of our business or result in the forfeiture of certain of our vessels. Compliance with the Risks Related to Our Debt Our substantial debt could adversely affect our financial condition. We have a substantial amount of debt and significant debt service obligations. For example, our debt could: ● require us to dedicate a large portion of our cash flow from operations to service debt and fund repayments on our debt, thereby reducing the availability of our cash flow to fund working capital, capital expenditures and other general corporate purposes; ● increase our vulnerability to adverse general economic or industry conditions; ● limit our flexibility in planning for, or reacting to, changes in our business or the industry in which we operate; ● place us at a competitive disadvantage compared to our competitors that have less debt; ● make us more vulnerable to downturns in our business, the economy or the industry in which we operate; ● limit our ability to raise additional debt or equity capital in the future to satisfy our requirements relating to working capital, capital expenditures, development projects, strategic initiatives or other purposes; ● restrict us from making strategic acquisitions, introducing new technologies or exploiting business opportunities; ● make it difficult for us to satisfy our obligations with respect to our debt; and ● expose us to the risk of increased interest rates as certain of our borrowings are (and may be in the future) at a variable rate of interest. Despite our leverage, we may incur more debt, including secured debt, which could adversely affect our business and prevent us from fulfilling our obligations with respect to the notes. We may incur additional debt in the future, including secured indebtedness, with up to $45.0 million of available capacity under a new credit facility, and indebtedness of subsidiaries to which the notes would be structurally subordinated. If the applicable subsidiary is a guarantor, then the guarantee of the notes by such subsidiary would be structurally pari passu with such subsidiary’s other senior indebtedness. Except for the restrictions set forth in the indenture governing the notes, the new credit agreement and our senior secured credit agreements, we are not restricted from incurring additional debt or refinancing our debt. Although the indenture governing the notes and the agreements governing the new credit agreement and our senior secured credit agreements contain restrictions on the incurrence of additional debt by us or our subsidiaries, these restrictions are subject to a number of significant qualifications and exceptions, and under certain circumstances the amount of debt, including secured debt, that could be incurred in compliance with these restrictions could be substantial. If new debt is added to our existing debt levels, the related risks that we now face would increase. We will require a significant amount of cash to service our debt and sustain our operations. Our ability to generate cash depends on many factors beyond our control, and we may not be able to generate cash required to service our debt. Our ability to meet our other debt service obligations or refinance our debt depends on our future operating and financial performance and ability to generate cash. This will be affected by our ability to successfully implement our business strategy, as well as general economic, financial, competitive, regulatory and other factors beyond our control, such as the disruption caused by the COVID-19 pandemic. If we cannot generate sufficient cash to meet our debt service obligations or fund our other business needs, we may, among other things, need to refinance all or a portion of our debt, obtain additional financing, delay planned capital expenditures or sell assets. We cannot be assured that we will be able to generate sufficient cash through any of the foregoing. If we are not able to refinance any of our debt, obtain additional financing or sell assets on commercially reasonable terms or at all, we may not be able to satisfy our obligations with respect to our debt. The impact of volatility and disruptions in the global credit and financial markets may adversely affect our ability to borrow and could increase our counterparty credit risks, including those under our credit facilities, derivatives, contingent obligations, insurance contracts and new ship contractualpayments. There can be no assurance that we will be able to access additional debt and/or credit facilities on terms as favorable as our current debt, on commercially acceptable terms, or at all. Economic downturns, including failures of financial institutions and any related liquidity crisis, can disrupt the capital and credit markets. Such disruptions could cause counterparties under our credit facilities, derivatives, contingent obligations and insurance contracts to be unable to perform their obligations or to breach their obligations to us under our contracts with them, which could include failures of financial institutions to fund required borrowings under our loan agreements and to pay us amounts that may become due under our derivative contracts and other agreements. Also, we may be limited in obtaining funds to pay amounts due to our counterparties under our derivative contracts and to pay amounts that may become due under other agreements. If we were to elect to replace any counterparty for their failure to perform their obligations under such instruments, we would likely incur significant costs to replace the counterparty. Any failure to replace any counterparties under these circumstances may result in additional costs to us or an ineffective instrument. We may not be able to obtain sufficient financing or capital for our needs or may not be able to do so on terms that are acceptable or consistent with our expectations. Any circumstance or event that leads to a decrease in consumer cruise and land-based travel spending, such as worsening global economic conditions or significant incidents impacting the cruise industry, the expedition cruise industry or the travel industry, could negatively affect our operating cash flows. Although we expect that we will have sufficient cash flows from operations during the COVID-19 pandemic and variants, and expect we will have sufficient access to capital to fund our operations and obligations as expected, there can be no assurances to that effect. Our ability to access additional funding as and when needed, our ability to timely refinance and/or replace outstanding debt and credit facilities on acceptable terms and our cost of funding will depend upon numerous factors including but not limited to the condition of the financial markets, our financial performance and credit ratings and the performance of our industry in general. Any inability to satisfy any covenants required by existing or future credit facilities could adversely impact our liquidity. Our Third Amended and Restated Credit Agreement (“Amended Credit Agreement”), as amended, and our senior secured credit agreements (the “First Export Credit Agreement” and the “Second Export Credit Agreement”), as amended, contain certain financial covenants and are secured by substantially all of our assets. Any failure to comply with such terms, conditions, and covenants, or successfully amend our covenants, could result in an event of default. Further, if an event of default under a facility were to occur, cross default provisions, if any, could cause our other outstanding debt, if any, to be immediately due and payable. Upon such an occurrence, there could be no assurance that we would have sufficient liquidity to repay or the ability to refinance the borrowings under any such credit facilities or settle other outstanding contracts if such amounts were accelerated upon an event of default. Any inability to satisfy any covenants required by our debt agreements could result in an acceleration of certain of our indebtedness. We are subject to various covenants in the instruments governing our debt, including the indenture governing the notes issued February 4, 2022. Any failure to comply with such terms, conditions, and covenants could result in an event of default under our current or future indebtedness. Further, if an event of default were to occur under any of the agreements relating to our outstanding indebtedness, the holders of the defaulted debt could cause all amounts outstanding with respect to that debt to be due and payable immediately, terminate all commitments to extend further credit, foreclose or otherwise enforce against all the assets comprising the collateral securing or otherwise supporting such debt and pursue other legal remedies. The instruments governing our debt may also contain cross default provisions or cross acceleration provisions that could cause all of the debt issued under such instruments to become immediately due and payable as a result of a default under an unrelated debt instrument. Upon such an occurrence, there could be no assurance that we would have sufficient liquidity to repay or the ability to refinance the borrowings under our outstanding debt instruments or settle other outstanding contracts if such amounts were accelerated upon an event of default. We may need to conduct an asset sale or pursue other alternatives, including proceedings under applicable insolvency laws relating to some or all of our business. There can be no assurance you that our assets, including any applicable collateral, would be sufficient to fully repay our current or any future debt instruments if the obligations thereunder were accelerated upon an event of default. Further, if we are unable to repay, refinance or restructure our secured debt (including the notes), the holders of such debt could proceed against the collateral securing such indebtedness. If we default on our obligations to pay our other indebtedness, we may not be able to make payments on the notes. Any default under the agreements governing our indebtedness that is not waived by the required lenders or holders, as applicable, and the remedies sought by the holders of such indebtedness could leave us unable to pay principal, premium, if any, or interest on the notes and could substantially decrease the market value of the notes. If we are unable to generate sufficient cash flow and are otherwise unable to obtain funds necessary to meet required payments of principal, premium, if any, or interest on our indebtedness, or if we otherwise fail to comply with the various covenants, including financial and operating covenants, in the instruments governing our indebtedness, we could be in default under the terms of the agreements governing such indebtedness. In the event of such default, the holders of such indebtedness could elect to (i) declare all the funds borrowed thereunder to be due and payable, together with accrued and unpaid interest, (ii) terminate their commitments and cease making further loans and (iii) institute foreclosure proceedings against our assets, and we could be forced into bankruptcy or liquidation. If our operating performance declines, we may in the future need to seek waivers from the required lenders or holders, as applicable, under the instruments governing our other indebtedness to avoid being in default. If we breach our covenants under our indebtedness and seek a waiver, we may not be able to obtain a waiver from the required lenders or holders, as applicable. If this occurs, we would be in default under the instruments governing our indebtedness, the lenders or holders, as applicable, could exercise their rights as described above, and we could be forced into bankruptcy or liquidation. The interest rates on our credit facilities might change based on changes to the method in whichthe London Interbank Offered Rate (“LIBOR”) or its replacement rate is determined. LIBOR is the basic rate of interest used in lending transactions between banks on the London interbank market, and is widely used as a reference for setting the interest rate on loans globally. Our senior secured credit agreements each contain variable interest rates referenced to LIBOR. On July 27, 2017, the United Kingdom’s Financial Conduct Authority, which regulates LIBOR, announced that it intends to phase out LIBOR by June 30, 2022. The ICE Benchmark Administration, the administrator of LIBOR, will cease providing LIBOR rates for certain U.S. LIBOR settings June 30, 2023. The Alternative Reference Rates Committee, a steering committee comprised of large U.S. financial institutions, has proposed replacing USD-LIBOR with a new index calculated by short term repurchase agreements - the Secured Overnight Financing Rate. There can be no guarantee on when the Company's lending institutions will work with the Company to amend the Company's LIBOR based borrowings or derivative instruments, or if such amendments will be completed prior to the dates that LIBOR is ceased being provided or at what spreads on a alternative rate selected. The consequences of these developments cannot be entirely predicted, but may result in an increase to our overall borrowing costs and interest expense, which could adversely affect our profitability. We are a holding company, and our operations are conducted through, and substantially all of our consolidated assets are held by, our subsidiaries. Accordingly, we will depend on the business of our subsidiaries to satisfy our debt obligations. Substantially all of our consolidated assets are held by our subsidiaries. Accordingly, our ability to service our debt, depends on the results of operations of our subsidiaries and upon the ability of such subsidiaries to provide us with cash, whether in the form of dividends, loans or otherwise, to pay amounts due on our obligations. Our subsidiaries are separate and distinct legal entities and, unless they are guarantors, have no obligation, contingent or otherwise, to make payments on our obligations or to make any funds available for that purpose. In addition, dividends, loans or other distributions to us from such subsidiaries may be subject to contractual and other restrictions and are subject to other business considerations. As a result, we may be able to pay the cash obligations under our obligations. We may be unable to repay or repurchase our outstanding notes at maturity. At maturity, the entire outstanding principal amount of our $360.0 million of 6.75% senior secured notes, together with accrued and unpaid interest, if any, will become due and payable. We may not have the funds to fulfill these obligations or the ability to renegotiate these obligations. If, upon the maturity date, other arrangements prohibit us from repaying the notes, we could try to obtain waivers of such prohibitions from the lenders and holders under those arrangements, or we could attempt to refinance the borrowings that contain the restrictions. In these circumstances, if we were not able to obtain such waivers or refinance these borrowings, we would be unable to repay the notes. Risks Related to Our affect the liquidity of our Under the Under the provisions of our In the event such restrictions voiding transfers would be ineffective for any reason, our These trust transfer provisions also apply to situations where ownership of a class or series of capital stock by non-U.S. citizens in excess of 22% would be As a result of the above trust transfer provisions, a proposed transferee that is a non-U.S. citizen or a record or beneficial owner whose citizenship status change results in excess shares may not receive any return on its investment in shares it purportedly purchases or owns, as the case may be, and it may sustain a loss. To the extent that the above trust transfer provisions would be ineffective for any reason, our In order to assist our compliance with the In addition to the risks described above, the foregoing ownership restrictions on non-U.S. citizens could delay, defer or prevent a transaction or change in control that might involve a premium price for common stock or otherwise be in the best interest of our shareholders. If non-U.S. citizens own more than 22% of our Our Our An active trading market for our common stock may not be sustained, and you may not be able to resell your shares at or above the price at which you purchased them. An active trading market for our shares may not be sustained. In the absence of an active trading market for our common stock, shares of common stock may not be able to be resold at or above the purchase price of such shares. Although there can be no assurances, we expect that our common stock will continue to be listed on the NASDAQ Stock Market. However, even if our common stock continues to be listed on the NASDAQ Stock Market, there is no assurance that an active market for our common stock will continue in the foreseeable future. We do not intend to pay any common stock dividends to shareholders in the foreseeable future. We have not paid any cash dividends on our shares of common stock to date and do not intend to pay cash dividends in the foreseeable future. The payment of cash dividends in the future will be dependent upon our revenues and earnings, if any, capital requirements and general financial conditions. The payment of any dividends is within the discretion of our Board of Directors. It is the present intention of our Board of Directors to retain all earnings, if any, for use in our business operations and, accordingly, our Board of Directors does not anticipate declaring any dividends in the foreseeable future. As a result, any gain you will realize on our securities will result solely from the appreciation of such securities. We were restricted from paying dividends or other certain payments under our financing arrangements. We were restricted, under our Main Street Loan, from declaring or paying dividends on our common stock, or making certain other payment or distribution, whether in cash, securities or other property, other than qualified capital stock, or any payment, other than qualified capital stock, including any sinking fund or similar deposit, on account of the purchase, redemption, retirement, acquisition, cancelation or termination of any equity interests in us, in our subsidiaries or any option, warrant or other right to acquire any such equity interests in in us or our subsidiaries. In addition, the Incremental Assumption Agreement and Third Amendment to Third Amended and Restated Credit Agreement also restricted us from declaring and paying cash dividends. Provisions in our Our meeting only a minority of the board of directors may be considered for election. Since our “staggered board” may prevent our stockholders from replacing a majority of our board of directors at any given annual meeting, it may entrench management and discourage unsolicited stockholder proposals that may be in the best interests of stockholders. Moreover, our Board of Directors has the ability to designate the terms of and issue new series of preferred stock. We are also subject to anti-takeover provisions under Delaware law, which could delay or prevent a change of control. Together these provisions may make more difficult the removal of management and may discourage transactions that otherwise could involve payment of a premium over prevailing market prices for our securities. Our common stock ranks junior to our Series A Convertible Preferred Stock with respect to dividends and amounts payable in the event of our liquidation, dissolution or winding-up of our affairs. Our common stock ranks junior to our Series A Convertible Preferred Stock, with respect to the payment of dividends and amounts payable in the event of our liquidation, dissolution or winding-up of our affairs. Upon our liquidation, dissolution or winding up, each share of Series A Convertible Preferred Stock will be entitled to receive an amount per share equal to the greater of (i) the purchase price paid for such shares, plus all accrued and unpaid interest and (ii) the amount that the holder would have been entitled to receive at such time if the Series A Convertible Preferred Stock were converted into common stock and no distribution of our assets may be made to holders of our common stock until we have paid to holders of our Series A Convertible Preferred Stock such liquidation preference. Any conversion of the Series A Convertible Preferred Stock to common stock would also cause substantial dilution to our stockholders. Certain rights of the holders of the Series A Convertible Preferred Stock could delay or prevent an otherwise beneficial takeover or takeover attempt of us. Certain rights of the holders of the Series A Convertible Preferred Stock could make it more difficult or more expensive for a third party to acquire us. If we undergo a Change of Control (as defined in the certificate of designations for the Series A Convertible Preferred Stock), each holder will have the right to cause us to redeem any or all of its shares of Series A Convertible Preferred Stock for cash consideration equal to the greater of (i) $1,120 per share and (ii) the purchase price paid for such shares, plus all accrued and unpaid interest. These features of the Series A Convertible Preferred Stock could increase the cost of acquiring us or otherwise discourage a third party from acquiring us or removing incumbent management. Item 1B. None. Item 2. Our principal executive office is located at 96 Morton Street, New York, New York where we lease approximately 13,000 square feet. Our principal shoreside operations are located at Item 3. We are involved in various claims, legal actions and regulatory proceedings arising from time to time in the ordinary course of business. We are not currently involved in any litigation nor, to our knowledge, is any litigation threatened against us, the outcome of which would, in our judgment based on information currently available to us, have a material adverse effect on our financial position or results of operations. Item 4. Not applicable. Item 5. Market for Market Information Our common stock 2016: Holders As of Dividends We have not paid any cash dividends on our common stock to date. We intend to retain all earnings Recent Sales by the Company of Unregistered Securities There were no unregistered sales of equity securities during the Repurchases of Securities The following table represents information with respect to Period Total number of shares purchased Average price paid per share Dollar value of shares purchased as part of publicly announced plans or programs Maximum dollar value of warrants and shares that may be purchased under approved plans or programs October 1 through October 31, 2021 November 1 through November 30, 2021 December 1 through December 31, 2021 Total Stock Performance Graph The following stock performance graph compares the performance of our common stock from 12/31/16 12/31/17 12/31/18 12/31/19 12/31/20 12/31/21 $ 100.00 $ 103.60 $ 142.43 $ 173.12 $ 181.16 $ 177.25 100.00 119.42 111.97 143.88 167.77 212.89 100.00 107.63 93.70 105.59 96.23 103.38 Item 7. The information contained in this section should be read in conjunction with our consolidated financial statements and related notes and the information contained elsewhere in this Form 10-K under the headings Overview We provide expedition cruising and land-based adventure travel We currently operate a fleet of We operate land-based adventure travel experiences around the globe, with unique itineraries designed to offer intimate encounters with nature and the planet's remarkable destinations including the animals and people who live there. DuVine Cycling + Adventure Company (“DuVine”) provides intimate cycling adventures and travel experiences, led by expert guides, with a focus on connecting with local character and culture, including high-quality local cuisine and accommodations. International cycling tours include the exotic Costa Rican rainforests, the rocky coasts of Ireland and the vineyards of Spain, while cycling adventures in the United States include cycling beneath the California redwoods, pedaling through Vermont farmland and wine tastings in the world-class vineyards of Napa and Sonoma. Off the Beaten Path, LLC (“Off the Beaten Path”) provides small group travel, led by local, experienced guides, with distinct focus on wildlife, hiking national parks and culture. Off the Beaten Path offerings include insider national park experiences in the Rocky Mountains, Desert Southwest, and Alaska, as well as unique trips across Europe, Africa, Australia, Central and South America and the South Pacific. Classic Journeys, LLC (“Classic Journeys”) offers highly curated active small-group and private custom journeys centered around cinematic walks led by expert local guides in over 50 countries around the world. These walking tours are highlighted by luxury boutique accommodations, and handcrafted itineraries that immerse guests into the history and culture of the places they are exploring and the people who live there. 2021 Highlights We resumed ship operations in June 2021 and, as of January 31, 2022, had nine of our ten available vessels providing expeditions to guests. Due to the spread of the COVID-19 virus and the effects of travel restrictions around the world, we had previously suspended or rescheduled the majority of our expeditions departing between March 16, 2020 through May 31, 2021. Expedition cruise operations restarted in June 2021, with three ships in Alaska and another in the Galápagos Islands, and subsequently, we resumed operations on the majority of our remaining vessels with additional ships operating in Alaska, the Galápagos Islands, Iceland, the Pacific Northwest, Baja California’s Sea of Cortezand Antarctica. We continue to work with local authorities on plans to operate itineraries in additional geographies during 2022. As the COVID-19 virus effects travel restrictions in various locations around the world, we also continue to work with our guests to reschedule travel plans and refund payments or issue future travel certificates, as applicable, for those expeditions and trips that we are not able to operate due to local restrictions. During 2021, we drew down $61.7 million under our second export credit agreement in conjunction with our fourth installment and final payments for the National Geographic Resolution and took delivery of the vessel during September 2021. During September 2021, we acquired the Crystal Esprit yacht for $13.3 million. It was rebranded the National Geographic Islander II, and after undergoing modifications to expand its expedition capabilities, including adjusting the capacity to 48 guests, it will replace the National Geographic Islander in the Galápagos Islands during 2022. During 2021, we completed the acquisitions of Off the Beaten Path, a land-based travel operator specializing in authentic national park experiences, DuVine, an international luxury cycling and adventure company focused on exceptional food and wine experiences and Classic Journeys, a leading luxury walking tour company that offers highly curated active small-group and private custom journeys. During 2021, we received $27.0 million under the U.S. Department of the Treasury Coronavirus Economic Relief for Transportation Services Program (“CERTS”), which provided grants to eligible motorcoach, school bus, passenger vessel, and pilotage companies that have experienced annual revenue losses of 25 percent or more as result of COVID-19. Return to Fleet operations and COVID-19 Business Update As of January 31, 2022, we had nine of our ten available vessels providing expeditions to guests. We believe there are a variety of strategic advantages that enable us to deploy our ships safely and mitigate the risk of COVID-19 transmission. The most notable is the size of our owned and operated vessels which range from 48 to 148 passengers, allowing for a highly controlled environment that includes stringent cleaning protocols. All guests, crew and staff are required to be fully vaccinated and the relatively small size of our ships allows us to efficiently and effectively test our guests and crew prior to boarding. Additionally, the majority of expeditions take place in remote locations where human interactions with persons not on the expedition are limited, so there is less opportunity for external influence. We also have the ability to be flexible with regards to existing itineraries and are continually investigating additional itinerary opportunities both internationally and domestically. While our ships were not in operations, the majority of the fleet was being maintained with minimally required crew on-board to ensure they complied with all necessary regulations and could be fully put back into service quickly as needed. Ahead of launching each ship, crew levels were increased as necessary to prepare each vessel for operations as well as for crew training and vaccinations. Prior to resuming operations, we significantly reduced ship and land-based expedition costs such as capital expenditures, crew payroll, land costs, fuel and food, and meaningfully reduced general and administrative expenses through reduced payroll and the elimination of all non-essential travel, office expenses and discretionary spending. We also accessed available capital under existing debt facilities and through the issuance of preferred stock. With the majority of operations resuming, operating costs are ramping back up, but given the continued uncertainty around COVID-19 and given that guest counts have not yet returned to traditional levels, we continue to minimize expenditures as appropriate. Bookings Trends We have experienced a substantial negative impact from the COVID-19 pandemic including elevated cancellations and softness in near-term demand. Despite the COVID-19 impact, we continue to see significant new bookings across the fleet and have substantial advanced reservations for future travel. Bookings for the second half of 2022 are nearly 20% ahead of the bookings for 2020 as of the same date two years ago and bookings for 2023 are 54% ahead of the bookings for 2021 as of the same date two years ago. Balance Sheet and Liquidity We have taken a variety of steps to strengthen our balance sheet and increase our financial flexibility including: On As of December 31, 2021, we had $150.8 million in unrestricted cash and $21.9 million in restricted cash primarily related to deposits on future travel originating from U.S. ports. As of December 31, 2021, we had a During June 2021, we further amended our export credit the effective suspension of the total net leverage ratio covenant through March 2022, increase the interest rate for the export credit facilities by 50 basis points and annualize EBITDA used in the covenant calculation through December 31, 2022. The deferred principal payments will amortize quarterly over three years starting in March 2022. Certain other covenants continue to be more restrictive during the extended covenant waiver period. During April 2021, we further amended our term loan and revolving credit agreement to, among other things, extend the waiver of its total net leverage ratio covenant through March 31, 2022, annualized EBITDA used in our covenant calculation through December 31, 2022 and increase the interest rate spreads of the Term Facility, excluding the Main Street Loan, and the Revolving Facility by 50 basis points, such additional interest to be paid in cash. Certain other covenants continue to be more restrictive during the extended covenant waiver period. As we continue to ramp up operations, our monthly cash usage will increase as we incur costs in operating expeditions, prepare additional ships for return to service and spending to market and advertise upcoming expeditions and trips. We also anticipate a continued increase in guest payments as we receive final payments for upcoming expeditions as well as deposits for new reservations for future travel. However, there can be no assurance that cash flows from operations will be available to fund future obligations or that we will not experience delays or cancellations with respect to the Financial Presentation The discussion and analysis of our results of operations and financial condition are organized as follows: ● a description of certain line items and operational and financial metrics we utilize to assist us in managing our business; ● a comparable discussion of our consolidated and segment results of operations for the years ended December 31, ● a discussion of our liquidity and capital resources, including future capital and contractual commitments and potential funding sources; and ● a review of our critical accounting policies. Description of Certain Line Items Tour revenues Tour revenues consist of the following: ● Guest ticket revenues recognized from the sale of guest tickets; and ● Other tour revenues from the sale of pre- or post-expedition excursions, hotel accommodations and land-based expeditions; air transportation to and from the ships, goods and services rendered onboard that are not included in guest ticket prices, trip insurance and cancellation Cost of tours Cost of tours includes the following: ● Direct costs associated with revenues, including cost of pre- or post-expedition excursions, hotel accommodations and land-based expeditions, air and other transportation expenses and cost of goods and services rendered onboard; ● Payroll costs and related expenses for shipboard and expedition personnel; ● Food costs for guests and crew, including complimentary food and beverage amenities for guests; ● Fuel costs and related costs of delivery, storage and safe disposal of waste; and ● Other tour expenses, such as land costs, port costs, repairs and maintenance, equipment expense, drydock, ship insurance and charter hire costs. Selling and marketing Selling and marketing expenses include commissions, royalties and a broad range of advertising and promotional expenses. General and administrative General and administrative expenses Operational and Financial Metrics We use a variety of operational and financial metrics, including non-GAAP financial measures, such as Adjusted EBITDA, Net Yields, Occupancy and Net Cruise The presentation of non-GAAP financial information should not be considered in isolation or as a substitute for, or superior to, the financial information prepared and presented in accordance with GAAP. You should read this discussion and analysis of our results of operations and financial condition together with the consolidated financial statements and the related notes thereto also included in Item 8 of this Annual Report on Form 10-K. Adjusted EBITDAis net income (loss) The following metrics apply to our Lindblad segment: Adjusted Net Cruise Costrepresents Net Cruise Cost adjusted for Non-GAAP other supplemental adjustments which include certain non-operating items such as stock-based compensation, the National Geographic fee amortization Available Guest Nightsis a measurement of capacity available for sale and represents double occupancy per cabin (except single occupancy for a single capacity cabin) multiplied by the number of cruise days for the period. We also record the number of guest nights available on our limited land programs in this definition. Gross Cruise Cost represents the sum of cost of tours plus Gross Yield per Available Guest Nightrepresents tour revenues Guest Nights Soldrepresents the number of guests carried for the period multiplied by the number of nights sailed within the period. Maximum Guestsis a measure of capacity and represents the maximum number of guests in a period and is based on double occupancy per cabin (except single occupancy for a single capacity cabin). Net Cruise Costrepresents Gross Cruise Cost excluding commissions and certain other direct costs of guest ticket revenues and other tour revenues. Net Cruise Cost Excluding Fuelrepresents Net Cruise Cost excluding fuel costs. Net Net Yield per Available Guest Night represents Net Number of Guestsrepresents the number of guests that travel with us in a period. Occupancyis calculated by dividing Guest Nights Sold by Available Guest Nights. Voyagesrepresent the number of ship expeditions completed during the period. Foreign Currency Translation The U.S. dollar is the functional currency in our foreign operations and re-measurement adjustments and gains or losses resulting from foreign currency transactions are recorded as foreign exchange gains or losses in the consolidated statements of operations. Seasonality Traditionally, our Lindblad brand tour revenues Results of Operations – Consolidated We reported consolidated tour revenues, cost of tours, operating expenses, operating income and net income for the years ended December 31, (In thousands) 2021 2020 Change % 2019 Change % Operating (loss) income Undistributed (loss) income per share available to stockholders: Comparison of Years Ended December 31, Tour Revenues Tour revenues for the year ended December 31, 2021 increased primarily related to Cost of Tours General and Administrative Expenses General and administrative expenses for the year ended December 31, 2021 increased Selling and Marketing Expenses Selling and marketing expenses increased $8.3 million, or 41%, to $28.5 million for the Depreciation and Amortization Expenses Depreciation and amortization expenses Other Other expenses were Comparison of Years Ended December 31, Tour Revenues Tour revenues Cost of Tours Total cost of tours General and Administrative Expenses General and administrative expenses Selling and Marketing Expenses Selling and marketing expenses Depreciation and Amortization Expenses Depreciation and amortization expenses increased $6.3 million, or 25%, to $32.1 million for the Other Other expenses were Results of Operations – Segments Selected information for our segments is below. The presentation of non-GAAP financial information should not be considered in isolation or as a substitute for, or superior to, the financial information prepared and presented in accordance with GAAP. For the years ended December 31, (In thousands) 2021 2020 Change % 2019 Change % Tour revenues: Lindblad Land Experiences Total tour revenues Operating (loss) income: Lindblad Land Experiences Total operating (loss) income Adjusted EBITDA: Lindblad Land Experiences Total adjusted EBITDA Results of Operations – Lindblad Segment Comparison of Years Ended December 31, 2021 and 2020 Tour Revenues Tour revenues for the year ended December 31, 2021 increased $13.2 million, or 19%, to $82.8 million compared to $69.6 million for the year ended December 31, 2020. The increase was primarily driven by the ramp up of operations beginning in June 2021 following the cancellation, disruption and rescheduling of expeditions due to COVID-19 since March 2020. Operating Income Operating loss increased $32.9 million to a loss of $111.5 million for the year ended December 31, 2021 compared to a loss of $78.6 for the year ended December 31, 2020. The increase was primarily driven by higher costs associated with the resumption of expeditions during June 2021, costs related to adding the National Geographic Resolution to the fleet during 2021 and a full year of expenses associated with operating the National Geographic Endurance, which was added to the fleet in 2020. Comparison of Years Ended December 31, 2020 and 2019 Tour Revenues Tour revenues for the year ended December 31, 2020 decreased $202.8 million, or 74%, to $69.6 million compared to $272.4 million for the year ended December 31, 2019. The decrease was primarily driven by cancelled, disrupted and rescheduled expeditions due to COVID-19. Operating Income Operating income decreased $104.8 million to a loss of $78.6 million for the year ended December 31, 2020 compared to income of $26.2 million for the year ended December 31, 2019. The decrease was primarily driven by lower revenue from cancelled, disrupted and rescheduled voyages due to COVID-19 and costs associated with adding the National Geographic Endurance to the fleet in March 2020. Results of Operations – Land Experiences Segment Comparison of Years Ended December 31, 2021 to December 31, 2020 Tour Revenues Tour revenues increased $51.5 million, or 405%, to $64.3 million compared to $12.7 million in 2020, primarily due to the ramp up of operations during 2021 and the inclusion of the results of Off the Beaten Path, DuVine and Classic Journeys, which were acquired during 2021. Operating Income Operating income increased $10.5 million to $0.6 million in 2021 compared to a loss of $9.8 million in 2020. The increase was primarily a result of higher revenues from the ramp up of operations during 2021 and the inclusion of the results of Off the Beaten Path, DuVine and Classic Journeys, which were acquired during 2021. Comparison of Years Ended December 31, 2020 to December 31, 2019 Tour Revenues Tour revenues decreased $57.9 million, or 82%, to $12.7 million compared to $70.7 million in 2019, due primarily to cancelled, disrupted and rescheduled expeditions due to COVID-19. Operating Income Operating income decreased $16.8 million to a loss of $9.8 million in 2020 compared to income of $7.0 million in 2019. The decrease was primarily a result of cancelled, disrupted and rescheduled expeditions due to COVID-19. Adjusted EBITDA – Consolidated The following table outlines the reconciliation to net income and calculation of consolidated Adjusted EBITDA. The presentation of non-GAAP financial information should not be considered in isolation or as a substitute for, or superior to, the financial information prepared and presented in accordance with GAAP. Consolidated For the years ended December 31, (In thousands) 2021 2020 2019 Net (loss) income Interest expense, net Income tax (benefit) expense Depreciation and amortization Loss (gain) on foreign currency Other (income) expense Stock-based compensation National Geographic fee amortization Other Adjusted EBITDA The following Reconciliation of Operating Income to Adjusted EBITDA Lindblad Segment For the years ended December 31, (In thousands) 2021 2020 2019 Operating (loss) income Depreciation and amortization Stock-based compensation National Geographic fee amortization Other Adjusted EBITDA Land Experiences Segment For the years ended December 31, (In thousands) 2021 2020 2019 Operating income (loss) Depreciation and amortization Stock-based compensation Other Adjusted EBITDA Guest Metrics — Lindblad Segment The following tables set forth our Guest Metrics for the For the years ended December 31, 2021 2020 2019 Available Guest Nights Guest Nights Sold Occupancy Maximum Guests Number of Guests Voyages Calculation of Gross and Net Yield per Available Guest Night For the years ended December 31, (In thousands, except for Available Guest Nights, Gross and Net Yield per Available Guest Night) 2021 2020 2019 Guest ticket revenues Other tour revenue Tour Revenues Less: Commissions Less: Other tour expenses Net Yield Available Guest Nights Gross Yield per Available Guest Night Net Yield per Available Guest Night The following table For the years ended December 31, (In thousands) 2021 2020 2019 Operating (loss) income Cost of tours General and administrative Selling and marketing Depreciation and amortization Less: Commissions Less: Other tour expenses Net Yield Calculation of Gross and Net Cruise Cost For the years ended December 31, (In thousands, except for Available Guest Nights, Gross and Net Cruise Cost per Avail. Guest Night) 2021 2020 2019 Less: Commissions Less: Fuel Expense Other Net Cruise Cost Excluding Fuel per Available Guest Night Adjusted Net Cruise Cost Excluding Fuel per Available Guest Night Liquidity and Capital Resources is unknown when travel restrictions and various border closures will be completely lifted and what the demand for expedition travel will be once these restrictions are no longer in place. During the year ended December 31, As of December 31, 57,072 On February 4, 2022, we issued $360.0 million aggregate principal amount of 6.750% Senior Secured Notes due 2027 (the “Notes”). We used the net proceeds from the Notes to repay in full all outstanding borrowings under our existing term loan, including the Main Street Loan, and Revolving Facility, to pay any related premiums and to terminate in full our existing credit agreement and the commitments thereunder. We also entered into a new $45.0 million revolving credit facility, which remains undrawn and matures February 2027. As we resume full operations and expand the number of expedition and tour itineraries and departures, our monthly cash usage will increase as we incur costs in operating expeditions and tours and spend to market and advertise upcoming expeditions and trips. We also anticipate a significant increase in guest payments as we receive final payments for Sources and Uses of Cash for the Years Ended December 31, 2021, 2020 and 2019 Net cash provided byoperating activities was $32.5 million in 2021 compared to $92.3 million used in operations in 2020. The $124.7 million increase was primarily due to cash received from guests for current and future expeditions and receipt of the CERTS grant, partially offset by additional costs as we resumed operations during 2021. Net cash used by operating activities was $92.3 million in 2020 compared to $62.6 million provided by operations in 2019. The $154.8 million decrease was primarily due to the rescheduling of expeditions in 2020 due to the COVID-19 pandemic. Net cash used in investing activities was $114.7 million in 2021 compared to $155.5 million in 2020. The $40.8 million decrease was mainly due to a $58.8 million decrease in purchases of property and equipment in 2021, partially offset by $18.0 million in net cash used for the acquisitions of Off the Beaten Path, DuVine and Classic Journeys. Net cash used in investing activities was $155.5 million in 2020 compared to $100.1 million in 2019. The $55.4 million increase was mainly due to the $59.4 million increase in purchases of property and equipment in 2020, primarily related to spend on the two new polar ice-class vessels. Net cash provided by financing activities was $50.4 million in 2021 compared to $343.0 million in 2020. The $292.6 million decrease in cash provided by financing activities was primarily due to 2020 financing activities including borrowing $107.7 million for the final contracted payment of the National Geographic Endurance, $85.0 million of borrowing through the Main Street Expanded Loan Facility program, a $45.0 million drawdown of our revolving credit facility, $30.6 million borrowed for a contracted installment payment on the National Geographic Resolution and $85.0 million generated from the issuance of Preferred Stock partially offset by borrowing $61.7 million during 2021 for contracted payments on the National Geographic Resolution. Cash provided by financing activities was $343.0 million in 2020 compared to $24.6 million in 2019. The $318.4 million increase in cash provided was primarily due to borrowing $107.7 million for the final contracted payment of the National Geographic Endurance, $85.0 million of borrowing through the Main Street Expanded Loan Facility program, a $45.0 million drawdown of our revolving credit facility, $30.6 million borrowed for a contracted installment payment on the National Geographic Resolution and $85.0 million generated from the issuance of Preferred Stock, partially offset by the 2019 borrowing of $30.5 million for a contracted installment payment on the National Geographic Resolution. Contractual Obligations As of December 31, 2021, we had $15.9 million in charter commitments with $13.8 million due in 2022 and $2.1 million due in 2023, and $5.2 million in operating lease obligations with $1.6 million due in 2022, $1.4 million due in 2023, $1.5 million due in 2024 and $0.7 million due in 2025. We had approximately $558.5 million in long-term debt obligations as of December 31, 2021. Subsequent to the issuance of our $360.0 million of 6.75% senior secured notes due 2027 and the repayment of the existing term loan, including the Main Street Loan, and revolving credit facility, our future debt obligations were as follows, $24.1 million due in 2022, $23.3 million due in each of 2023 and 2024, $40.6 million due in 2025, $37.2 million due in 2026 and $441.3 million due thereafter. Future interest payments on our $360.0 million of 6.75% senior secured notes due 2027 and senior secured credit agreements will be approximately $30.4 million in 2022, $31.6 million in 2023, $30.7 million in 2024, $29.3 million in 2025, $28.5 million in 2026 and $11.9 million thereafter. Funding Sources and Needs Debt Facilities 6.75% Senior Secured Notes due 2027 On February 4, 2022, we issued $360.0 million aggregate principal amount of 6.75% senior secured notes. We used the proceeds from the notes to prepay in full all outstanding borrowings under our existing term loan, including the Main Street Loan, and revolving credit facility, and paid all related premiums, terminating in full our existing credit agreement and the commitments thereunder. Interest on the notes is payable semiannually in arrears on February 15 and August 15 of each year, beginning on August 15, 2022. The notes will mature on February 15, 2027, subject to earlier repurchase or redemption in accordance with the terms of the Indenture. New Revolving Credit Facility On Previous Credit Facility On March On August 7, 2020, we amended our On December 10, 2020, we amended our Term Facility and Revolving Facility to provide for the borrowing of a new tranche of incremental term loans under the Amended Credit Agreement in an amount of $85.0 million, maturing on December 11, 2025, made under the Main Street Expanded Loan Facility (the “Main Street Loan”). Interest on the During April 2021, we further amended our Amended Credit Agreement to, among other things, extend the waiver of the total leverage ratio covenant through March 2022, annualize EBITDA used in the covenant calculation through December 31, 2022 and increase the interest rate spreads of the Term Facility, excluding the Main Street Loan Facility, and the Revolving Facility by 50 basis points. Certain other covenants under the Amended Credit Agreement continued to be more restrictive during the covenant waiver period. Borrowings under the Term Facility, as amended, bore interest at an adjusted Intercontinental Exchange (“ICE”) Benchmark administration LIBOR, with a minimum of 0.75%, plus a spread of 5.25%, for an aggregated rate of 6.00% as of December 31, 2021. The In 2018, we entered into interest rate cap agreements to hedge a portion of our exposure to interest rate movements and manage our interest rate expense related to the The month period of 5.0 to 1.00 On February 4, 2022, we used the net proceeds from the Notes to repay in full all outstanding borrowings under the Third Amended and Restated Credit Agreement, including the Main Street Loan, and Revolving Facility, to pay any related premiums and to terminate in full the agreement and the commitments thereunder. Senior Secured Credit On January 8, 2018, On April 8, 2019, we entered into a senior secured credit agreement (the “Second Export Credit Agreement”) with the Lenders. Pursuant to the Second Export Credit Agreement, the Lenders made available to us, at our option and subject to certain conditions, a loan in an aggregate principal amount of $122.8 million for the purpose of providing pre- and post- delivery financing for up to 80% of the purchase price of our new expedition ice-class cruise vessel, the National Geographic Resolution. Additionally, 70% percent of the loan The First Export Credit Agreement and Second Export Credit Agreement, as amended, contain financial covenants that, among other things, require us to maintain a total net leverage ratio defined as on any date of determination, the ratio of total debt on such date, less up to $50.0 million of the unrestricted cash and cash equivalents to Adjusted EBITDA, as defined in the Export Credit Agreement, for the trailing 12-month period of 4.75 to 1.00. The net leverage ratio covenants of our export credit agreements have been suspended through March 2022. As of December 31, 2021, we were in compliance with the covenants currently in effect. Other Our Off the Beaten Path subsidiary has a loan maturing June 2023 for the purchase of guest transportation vehicles. The loan’s original principal was $0.3 million, is collateralized by the vehicles and bears interest of 4.77% as of December 31, 2021. Off the Beaten Path also has an $0.8 million loan under a Main Street Expanded Loan Facility, originated on December 11, 2020. For the first 12 months, interest is not payable and accrued to the principal balance, thereafter, monthly interest payments are required. 15% of the outstanding balance is due on both December 2023 and December 2024, with the remaining balance due December 2025. The loan bears a variable interest rate equal to one-month LIBOR plus a spread of 3.00%, or 3.21% as of December 31, 2021. This loan may be voluntarily prepaid at any time and from time to time, without premium or penalty, other than customary “breakage costs” and fees for LIBOR-based loans. Our DuVine subsidiary has a EUR 0.1 million State Assistance Loan related to the financial consequences of the COVID-19 pandemic, for the purpose of employment preservation. This loan matures August 2025, with monthly payments, and bears interest rate of 0.53%. Equity Preferred Stock On August 31, 2020, we issued and sold 85,000 shares of Series A Redeemable Convertible Preferred Stock, par value of $0.0001, (“Preferred Stock”) for $1,000 per share for gross proceeds of $85.0 million. The Preferred Stock has senior and preferential ranking to our common stock. The Preferred Stock is entitled to cumulative dividends of 6.00% per annum, and for the first two years, the dividends will be paid-in-kind. After the second anniversary of the issuance date, the dividends may be paid-in-kind or be paid in cash at our option. The Preferred Stock is convertible at any time, at the holder’s election, into a number of shares of our common stock equal to the quotient obtained by dividing the then-current accrued value by the conversion price of $9.50. At any time after the third anniversary of the issuance, we may, at our option, convert all, but not less than all, of the Preferred Stock into common stock if the closing price of shares of common stock is at least 150% of the conversion price for 20 out of 30 consecutive trading days. The number of shares of common stock received in such conversion shall be equal to the quotient obtained by dividing the then-current accrued value by the conversion price. At the six-year anniversary of the closing date, each investor has the right to request that we repurchase their Preferred Stock and any Preferred Stock not requested to be repurchased shall be converted into our common shares equal to the quotient obtained by dividing the then-current accrued value by the conversion price. During the year ended December 31, 2021, 5,000 shares of Preferred Stock and related accrued dividends were converted by the holder into 566,364 shares of our common stock. As of December 31, 2021, the Preferred Stock could be converted, at the option of the holder, into approximately 9.1 million shares of our common stock. Funding Needs We generally rely on a combination of cash flows provided by operations and the incurrence of additional debt to fund obligations. A vast majority of guest ticket receipts are collected in advance of the applicable expedition date. These advance passenger receipts remain a current liability until the expedition date and the cash generated from these advance receipts is used interchangeably with cash on hand from other cash from operations. The cash received as advanced receipts can be used to fund operating expenses for the applicable future expeditions or otherwise, pay down credit facilities, make long-term investments or any other use of cash. We traditionally run a working capital deficit due primarily to a large balance of unearned passenger revenues and as of December 31, 2021 we had working capital deficit of $79.1 million. As of December 31, 2020 we had positive working capital of $73.4 million as a result of lower unearned passenger revenues while we were not operating, and higher cash balances driven by the debt borrowings and our Preferred Stock offering during the year. As of December 31, 2021 and 2020, we had cash and cash equivalents, excluding restricted cash, of $150.8 million and $187.5 million, respectively. Our Board of Directors approved a stock and warrant repurchase plan (“Repurchase Plan”) in November 2015 and increased the repurchase plan to $35.0 million in November 2016. The Repurchase Plan authorizes us to purchase from time to time our outstanding common stock. Any shares purchased will be retired. The Repurchase Plan has no time deadline and will continue until otherwise modified or terminated at the sole discretion of our Board of Directors at any time. These repurchases exclude shares repurchased to settle statutory employee tax withholding related to the exercise of stock options and vesting of stock awards. During March 2020, the Repurchase Plan was suspended due to the uncertain impact of the COVID-19 virus and our borrowings through the now-terminated Main Street Expanded Loan Facility program previously placed restrictions on stock repurchases. We have cumulatively repurchased 875,218 shares of common stock for $8.3 million and 6,011,926 warrants for $14.7 million, since plan inception. All repurchases were made using cash resources. The balance for the Repurchase Plan was $12.0 million as of December 31, 2021. Critical Accounting Policies and Estimates Our consolidated financial statements are prepared in accordance with accounting principles generally accepted in the United States of America, which require us to make estimates and assumptions that affect the reported amounts of assets and liabilities as of the date of the financial statements, the reported amounts of revenues and expenses during the reporting periods and the related disclosures in the consolidated financial statements and accompanying footnotes. Out of our significant accounting policies, which are described in Note Ship Accounting Ships, including ship improvements and ships under construction, are our most significant assets, comprising over We have to estimate the useful life of each of our ships as well as their residual values. We account for ship improvement costs by capitalizing those costs we believe add value to our ships and have a useful life greater than one year and depreciate those improvements over its estimated remaining useful life. The costs of repairs and maintenance, including minor improvement costs and If materially different conditions existed, or if we materially changed our assumptions of ship useful lives and residual values, our depreciation expense, loss on retirement of ship components and net book value of our ships would be materially different. In addition, if we change our assumptions in making our determinations as to whether improvements to a ship add value, the amounts we expense each year as repair and maintenance expense could increase, which would be partially offset by a decrease in depreciation expense, resulting from a reduction in capitalized costs. We believe we have made reasonable estimates for ship accounting purposes. Stock-Based Compensation We Income Taxes To measure deferred tax assets and liabilities, we provide a valuation allowance against deferred tax assets if, based upon the weight of available evidence, we do not believe it is “more-likely-than-not” that some or all of the deferred tax assets will be realized. We will continue to evaluate the deferred tax asset valuation allowance balances in all of our foreign and U.S. companies to determine the appropriate level of valuation allowances. While we believe that the amount of the recorded financial statement benefits and tax reserves reflect the more-likely-than-not criteria, it is possible that the ultimate outcome of current or future examinations may result in a reduction to the tax benefits previously recorded on our consolidated financial statements or may exceed the current income tax reserves in amounts that could be material. Valuation of Long-Lived Assets We review our long-lived assets, principally our vessels and operating rights, for impairment whenever events or changes in circumstances indicate that the carrying amounts of these assets may not be fully recoverable. Upon the occurrence of a triggering event, the assessment of possible impairment is based on our ability to recover the carrying value of our asset, which is determined by using the asset’s estimated undiscounted future cash flows. If these estimated undiscounted future cash flows are less than the carrying value of the asset, an impairment charge is recognized for the excess, if any, of the asset’s carrying value over its estimated fair value. A significant amount of judgment is required in estimating the future cash flows and fair values of our vessels and operating rights. Future Application of Accounting Standards Refer to Item 8 of this Annual Report Note Item7A. We are exposed to market risk in the normal course of our In addition, we have ship maintenance of the contracts that have not been hedged. Additionally, if a shipyard is unable to perform under such a contract, any foreign currency forward contracts that were entered into to manage the currency risk would need to be terminated. We use currency exchange contracts to manage our exposure to changes in currency exchange rates associated with certain of our non-U.S. dollar denominated receivables and payables. We primarily hedge a portion of our current-year currency exposure to the Canadian and New Zealand dollars, the Brazilian real, South African rand, Indian rupee, the euro and the British pound sterling. The fluctuations in the value of these forward contracts largely offset the impact of changes in the value of the underlying risk they economically hedge. We are Item8. The consolidated financial statements and related financial statement schedules required under Item 8 are included beginning on page F-1 of this Report. Item9. Changes None. Item9A. Evaluation of Disclosure Controls and Procedures Under the supervision and with the participation of our principal executive officer and principal financial officer, our management conducted an evaluation of the effectiveness of the design and operation of our disclosure controls and procedures. The term “disclosure controls and procedures,” as defined in Rules 13a-15(e) under the Securities Exchange Act of 1934, as amended, or the Exchange Act, means controls and other procedures of a company that are designed to ensure that information required to be disclosed in the reports that it files or submits under the Exchange Act is recorded, processed, summarized and reported, within the time periods specified in the rules and forms of the Securities and Exchange Commission (“SEC”). Disclosure controls and procedures include, without limitation, controls and procedures designed to ensure that information required to be disclosed by a company in the reports that it files or submits under the Exchange Act is accumulated and communicated to the company’s management, including its principal executive and principal financial officers, as appropriate, to allow timely decisions regarding required disclosure. Based on Our management is responsible for establishing and maintaining adequate internal control over financial reporting, as such term is defined in Exchange Act Rule 13a-15(f). Our internal control over financial reporting is a process designed to provide reasonable assurance regarding the reliability of financial reporting and the preparation of financial statements for external purposes in accordance with GAAP. Our internal control over financial reporting includes those policies and procedures that: (1) pertain to the maintenance of records that in reasonable detail accurately and fairly reflect our transactions and dispositions of our assets; (2) provide reasonable assurance that transactions are recorded as necessary to permit preparation of financial statements in accordance with GAAP and that our receipts and expenditures are being made only in accordance with authorizations of our management and our directors; and (3) provide reasonable assurance regarding prevention or timely detection of unauthorized acquisition, use or disposition of our assets that could have a material effect on the financial statements. Because of its inherent limitations, internal control over financial reporting may not prevent or detect misstatements. Also, projections of any evaluation of effectiveness to future periods are subject to the risk that controls may become inadequate because of changes in conditions, or that the degree of compliance with the policies or procedures may deteriorate. Our management, with the participation of our Chief Executive Officer and Chief Financial Officer, assessed the effectiveness of our internal control over financial reporting, as of December 31, Changes in Internal Control Over Financial Reporting There was no change in the internal control over financial reporting that occurred during the period covered by this report that has materially affected, or is reasonably likely to materially affect, our internal control over financial reporting. Inherent Limitations on Effectiveness of Controls We do not expect that our disclosure controls and procedures or our internal controls will prevent all error and all fraud. A control system, no matter how well conceived and operated, can provide only reasonable, not absolute, assurance that the objectives of the control system are met. Because of the inherent limitations in all control systems, no evaluation of controls can provide absolute assurance that all control issues and instances of fraud, if any, within the company have been detected. These inherent limitations include the realities that judgments in decision-making can be faulty, and that breakdowns can occur because of a simple error or mistake. Additionally, controls can be circumvented by the individual acts of some persons, by collusion of two or more people, or by management override of the control. The design of any system of controls also is based in part upon certain assumptions about the likelihood of future events and there can be no assurance that any design will succeed in achieving its stated goals under all potential future conditions. Over time, controls may become inadequate because of changes in conditions, or the degree of compliance with the policies or procedures may deteriorate. Because of the inherent limitations in a cost-effective control system, misstatements due to error or fraud may occur and not be detected. REPORT OF INDEPENDENT REGISTERED PUBLIC ACCOUNTING FIRM ON INTERNAL CONTROL OVER FINANCIAL REPORTING To the Shareholders and Board of Directors of Lindblad Expeditions Holdings, Inc. and Subsidiaries Opinion on Internal Control over Financial Reporting We have audited Lindblad Expeditions Holdings, Inc. and Subsidiaries (the “Company”) internal control over financial reporting as of December 31, 2021, based on criteria established in Internal Control-Integrated Framework (2013) issued by the Committee of Sponsoring Organizations of the Treadway Commission. In our opinion, the Companymaintained, in all material respects, effective internal control over financial reporting as of December 31, 2021, based on criteria established in Internal Control – Integrated Framework (2013) issued by the Committee of Sponsoring Organizations of the Treadway Commission. We have also audited, in accordance with the standards of the Public Company Accounting Oversight Board (United States) (“PCAOB”), the consolidated balance sheets as of December 31, 2021 and 2020 and the related consolidated statements of operations, comprehensive (loss) income, shareholders’ equity, and cash flows and the related notes for each of the three years in the period ended December 31, 2021 of the Company, and our report dated February 28, 2022expressed an unqualified opinion on those financial statements. Basis for Opinion The Company's management is responsible for maintaining effective internal control over financial reporting, and for its assessment of the effectiveness of internal control over financial reporting, included in the accompanying “Management Annual Report on Internal Control over Financial Reporting”. Our responsibility is to express an opinion on the Company's internal control over financial reporting based on our audit. We are a public accounting firm registered with the PCAOB and are required to be independent with respect to the Company in accordance with the U.S. federal securities laws and the applicable rules and regulations of the Securities and Exchange Commission and the PCAOB. We conducted our audit in accordance with the standards of the PCAOB. Those standards require that we plan and perform the audit to obtain reasonable assurance about whether effective internal control over financial reporting was maintained in all material respects. Our audit of internal control over financial reporting included obtaining an understanding of internal control over financial reporting, assessing the risk that a material weakness exists, and testing and evaluating the design and operating effectiveness of internal control based on the assessed risk. Our audit also included performing such other procedures as we considered necessary in the circumstances. We believe that our audit provides a reasonable basis for our opinion. Definition and Limitations of Internal Control over Financial Reporting A company’s internal control over financial reporting is a process designed to provide reasonable assurance regarding the reliability of financial reporting and the preparation of financial statements for external purposes in accordance with generally accepted accounting principles. A company's internal control over financial reporting includes those policies and procedures that (1) pertain to the maintenance of records that, in reasonable detail, accurately and fairly reflect the transactions and dispositions of the assets of the company; (2) provide reasonable assurance that transactions are recorded as necessary to permit preparation of financial statements in accordance with generally accepted accounting principles, and that receipts and expenditures of the company are being made only in accordance with authorizations of management and directors of the company; and (3) provide reasonable assurance regarding prevention or timely detection of unauthorized acquisition, use, or disposition of the company’s assets that could have a material effect on the financial statements. Because of the inherent limitations, internal control over financial reporting may not prevent or detect misstatements. Also, projections of any evaluation of effectiveness to future periods are subject to the risk that controls may become inadequate because of changes in conditions, or that degree of compliance with the policies or procedures may deteriorate. /s/ Marcum LLP Marcum LLP Melville, NY February 28, 2022 Item9B. None. PART III Item10. Information concerning our executive officers, directors and corporate governance is incorporated herein by reference to our Definitive Proxy Statement to be filed with the Securities and Exchange Commission (“SEC”) within 120 days after the end of our fiscal year covered by this Form 10-K with respect to our The Company's management is responsible for maintaining effective internal control over financial reporting, and for its assessment of We Definition and Limitations of Internal Control over Financial Reporting A company’s internal control over financial reporting is a process designed to provide reasonable assurance regarding the reliability of financial reporting and the preparation of financial statements for external purposes in accordance with generally accepted accounting principles. A company's internal control over financial reporting includes those policies and procedures that (1) pertain to the maintenance of records that, in reasonable detail, accurately and fairly reflect the transactions and dispositions of the Because of the inherent limitations, internal control over financial reporting may not prevent or /s/ Marcum LLP Marcum LLP Melville, NY February 28, 2022 Item9B. None. Item Disclosure Regarding Foreign Jurisdictions that Prevent Inspections Not applicable. PART III Item10. Directors, Executive Information concerning our executive officers, directors and corporate governance is incorporated herein by reference to our Definitive Proxy Statement to be filed with the Basis for Opinion We conducted our audit in accordance with the standards of the PCAOB. Those standards require that we plan and perform the audit to obtain reasonable assurance about whether effective internal control over financial reporting was maintained in all material respects. Our audit of internal control over financial reporting included obtaining an understanding of internal control over financial reporting, assessing the risk that a material weakness exists, and testing and evaluating the design and operating effectiveness of internal control based on the assessed risk. Our audit also included performing such other procedures as we considered necessary in the circumstances. We believe that our audit provides a reasonable basis for our opinion. Definition and Limitations of Internal Control over Financial Reporting A company’s internal control over financial reporting is a process designed to provide reasonable assurance regarding the reliability of financial reporting and the preparation of financial statements for external purposes in accordance with generally accepted accounting principles. A company's internal control over financial reporting includes those policies and procedures that (1) pertain to the maintenance of records that, in reasonable detail, accurately and fairly reflect the transactions and dispositions of the assets of the company; (2) provide reasonable assurance that transactions are recorded as necessary to permit preparation of financial statements in accordance with generally accepted accounting principles, and that receipts and expenditures of the company are being made only in accordance with authorizations of management and directors of the company; and (3) provide reasonable assurance regarding prevention or timely detection of unauthorized acquisition, use, or disposition of the company’s assets that could have a material effect on the financial statements. Because of the inherent limitations, internal control over financial reporting may not prevent or detect misstatements. Also, projections of any evaluation of effectiveness to future periods are subject to the risk that controls may become inadequate because of changes in conditions, or that degree of compliance with the policies or procedures may deteriorate. /s/ Marcum LLP Marcum LLP Melville, NY February 28, 2022 Item9B. None. Item9C. Disclosure Regarding Foreign Jurisdictions that Prevent Inspections Not applicable. PART III Item10. Information concerning our executive officers, directors and corporate governance is incorporated herein by reference to our Definitive Proxy Statement to be filed with the Securities and Exchange Commission (“SEC”) within 120 days after the end of our fiscal year covered by this Form 10-K with respect to our 2022 Annual Meeting of Stockholders. Code of Conduct and Ethics We have adopted Codes of Business Conduct and Ethics that applies to our employees, including our principal executive officer, principal financial officer and persons performing similar functions, and our directors. Our codes of ethics and business conduct can be found posted in the investor relations sections on our website at http://investors.expeditions.com. None of the websites referenced in this Annual Report on or the information contained therein is incorporated herein by reference. Future material amendments or waivers relating to the Code of Ethics will be disclosed on our website referenced in this paragraph within four business days following the date of such amendment or waiver. Item11. Information is incorporated herein by reference to our Definitive Proxy Statement to be filed with the SEC within 120 days after the end of our fiscal year covered by this Form 10-K with respect to our 2022 Annual Meeting of Stockholders. Item12. Security Ownership of Certain Beneficial Owners and Management and Related Stockholder Matters Information is incorporated herein by reference to our Definitive Proxy Statement to be filed with the SEC within 120 days after the end of our fiscal year covered by this Form 10-K with respect to our 2022 Annual Meeting of Stockholders. Securities Authorized for Issuance under Equity Compensation Plans Plan category Number of securities to be issued upon exercise of outstanding options, warrants and rights Weighted average exercise price of outstanding options, warrants and rights Number of securities remaining Equity compensation plans approved by security holders (1) Equity compensation plans not approved by security holders __________ (1) Information is as of December 31, 2021. (2) Consists of shares available for issuance under our 2021 Long-Term Incentive Plan. Item13. Certain Relationships and Related Transactions, and Director Independence Information is incorporated herein by reference to our Definitive Proxy Statement to be filed with the SEC within 120 days after the end of our fiscal year covered by this Form 10-K with respect to our 2022 Annual Meeting of Stockholders. Item14. Information is incorporated herein by reference to our Definitive Proxy Statement to be filed with the SEC within 120 days after the end of our fiscal year covered by this Form 10-K with respect to our 2022 Annual Meeting of Stockholders. PART IV Item15. (a) The following documents are filed as part of this Form 10-K or incorporated herein by reference: (1) Consolidated Financial Statements. See Index to Consolidated Financial Statements on page F-1. (2) Financial Statement Schedules. None. (3) Exhibits. The following exhibits are filed or incorporated by reference as part of this Form 10-K. 101.INS Inline XBRL Instance Document (the Instance Document does not appear in the Interactive Data File because its XBRL tags are embedded within the Inline XBRL document) Herewith 101.SCH Inline XBRL Taxonomy Extension Schema Document Herewith 101.CAL Inline XBRL Taxonomy Extension Calculation Linkbase Document Herewith 101.DEF Inline XBRL Taxonomy Extension Definition Linkbase Document Herewith 101.LAB Inline XBRL Taxonomy Extension Label Linkbase Document Herewith 101.PRE Inline XBRL Taxonomy Extension Presentation Linkbase Document Herewith 104 Cover Page Interactive Data File (formatted as Inline XBRL and contained in Exhibit 101) __________ * Management compensatory agreement. † Certain portions of the exhibit have been omitted pursuant to Regulation S-K Item 601(b) because it is both (i) not material to investors and (ii) likely to cause competitive harm to the Company if publicly disclosed. Item16. None. Pursuant to the requirements of Section 13 or 15(d) of the Securities Exchange Act of 1934, as amended, the registrant has duly caused this Annual Report on Form 10-K to be signed on its behalf by the undersigned, thereunto duly authorized on February 28, 2022. LINDBLAD EXPEDITIONS HOLDINGS, INC. (Registrant) By: /s/ Dolf Berle Dolf Berle Chief Executive Officer (Principal Executive Officer) Pursuant to the requirements of the Securities Exchange Act of 1934, as amended, this report has been signed below by the following persons on behalf of the registrant and in the capacities and on the dates indicated. Signature Title Date /s/ Dolf Berle Chief Executive Officer and Director February 28, 2022 Dolf Berle (Principal Executive Officer) /s/ Craig I. Felenstein Chief Financial Officer February 28, 2022 Craig I. Felenstein (Principal Financial and Accounting Officer) /s/ Bernard W. Aronson Director February 28, 2022 Bernard W. Aronson /s/ Elliott Bisnow Director February 28, 2022 Elliott Bisnow /s/ L. Dyson Dryden Director February 28, 2022 L. Dyson Dryden /s/ Mark D. Ein Co-Chairman of the Board February 28, 2022 Mark D. Ein /s/ John M. Fahey Jr. Director February 28, 2022 John M. Fahey Jr. /s/ Sven-Olof Lindblad Co-Chairman of the Board February 28, 2022 Sven-Olof Lindblad /s/ Catherine B. Reynolds Director February 28, 2022 Catherine B. Reynolds /s/ Thomas S. Smith, Jr. Director February 28, 2022 Thomas S. Smith, Jr. LINDBLAD EXPEDITIONS HOLDINGS, INC. INDEX TO CONSOLIDATED FINANCIAL STATEMENTS REPORT OF INDEPENDENT REGISTERED PUBLIC ACCOUNTING FIRM To the Shareholders and Board of Directors of Lindblad Expeditions Holdings, Inc. and Subsidiaries To the Shareholders and Board of Directors of Lindblad Expeditions Holdings, Inc. and Subsidiaries Opinion on the Financial Statements We have audited the accompanying consolidated balance sheets of Lindblad Expeditions Holdings, Inc. and Subsidiaries(the “Company”) as of December 31, 2021 and 2020, the related consolidated statements of operations, comprehensive (loss) income, stockholders’ equity and cash flows for each of the three years in the period ended December 31, 2021, and the related notes(collectively referred to as the “financial statements”). In our opinion, the financial statements present fairly, in all material respects, the financial position of the Company as of December 31, 2021 and 2020, and the results of its operations and its cash flows for each of the three years in the period ended December 31, 2021, in conformity with accounting principles generally accepted in the United States of America. We also have audited, in accordance with the standards of the Public Company Accounting Oversight Board (United States) ("PCAOB"), the Company's internal control over financial reporting as of December 31, 2021, based onthe criteria established in Internal Control - Integrated Framework issued by the Committee of Sponsoring Organizations of the Treadway Commission (COSO) in 2013 and our report dated February 28, 2022, expressed an unqualified opinion on the effectiveness of the Company’s internal control over financial reporting. Basis for Opinion These financial statements are the responsibility of the Company's management. Our responsibility is to express an opinion on the Company's financial statements based on our audits. We are a public accounting firm registered with the PCAOB and are required to be independent with respect to the Company in accordance with the U.S. federal securities laws and the applicable rules and regulations of the Securities and Exchange Commission and the PCAOB. We conducted our audits in accordance with the standards of the PCAOB. Those standards require that we plan and perform the audits to obtain reasonable assurance about whether the financial statements are free of material misstatement, whether due to error or fraud. Our The critical audit matters communicated below are matters arising from the current period audit of the financial statements that were communicated or required to be communicated to the audit committee and that: (1) relate to accounts or disclosures that are material to the financial statements and (2) involved our especially challenging, subjective, or complex judgments. The communication of critical audit matters does not alter in any way our opinion on the financial statements, taken as a whole, and we are not, by communicating the critical audit matters below, providing separate opinions on the critical audit matters or on the accounts or disclosures to which they relate. Intangible Assets Acquired in Business Combinations As described in Note 9 in the consolidated financial statements, on February 1, 2021, the Company acquired, through its Natural Habitat subsidiary, 80.1% of the outstanding common stock of Off the Beaten Path, LLC, a land-based travel operator specializing in national park experiences; on March 3, 2021, the Company acquired, through its Natural Habitat subsidiary, 70% of the outstanding common stock of DuVine Cycling + Adventure LLC, an international cycling and adventure company and on October 13, 2021, the Company acquired 80.1% of Classic Journeys LLC, a walking tour company. The acquisitions had an aggregate purchase price of $23.6 million and were accounted for as a business combination. The Company recorded approximately $10.4 million in intangible assets related to tradenames and customer lists and approximately $19.9 million in goodwill related to these acquisitions. Provisional amounts recorded for the intangible assets and goodwill are subject to possible adjustment during the respective acquisition’s measurement period. Management engaged experts to calculate the fair values of intangible assets acquired and assist in the determination of purchase price adjustments. We utilized internal valuation experts to assist in auditing these fair value calculations. The principal considerations for our determination that performing procedures relating to the fair value of intangible assets acquired in these business combinations is a critical audit matter are (i) the significant judgment by management in estimating the fair value of the intangible assets and (ii) the high degree of auditor judgment, subjectivity, and effort in performing procedures and evaluating management’s significant assumptions related to the determination of fair value of the intangible assets acquired. Addressing the critical audit matter involved performing procedures and evaluating audit evidence in connection with forming our overall opinion on the consolidated financial statements. These procedures included testing the effectiveness of controls relating to management’s purchase price allocation of certain intangible assets acquired. These procedures also included, among others (i) utilization of internal valuation experts (ii) testing management’s process for developing the estimates and (iii) testing the completeness and accuracy of underlying data used in the estimates. /s/ Marcum LLP Marcum LLP We have served as the Company’s auditor since Melville, NY LINDBLAD EXPEDITIONS HOLDINGS, INC. AND SUBSIDIARIES (In thousands, except share and per share data) As of December 31, 2021 As of December 31, 2020 Restricted cash Marine operating supplies Deferred tax asset Right-to-use lease assets Lease liabilities - current Lease liabilities Series A redeemable convertible preferred stock, 165,000 shares authorized; 80,000 and 85,000 shares issued and outstanding as of December 31, 2021 and 2020, respectively Redeemable noncontrolling interests STOCKHOLDERS’ (DEFICIT) EQUITY Preferred stock, $0.0001 par value, 1,000,000 shares authorized; 80,000 and 85,000 Series A shares issued and outstanding as of December 31, 2021 and 2020, respectively Common stock, $0.0001 par value, 200,000,000 shares authorized; 50,800,786 and 49,905,512 issued, 50,755,546 and 49,818,676 outstanding as of December 31, 2021 and 2020, respectively Accumulated deficit Accumulated other comprehensive loss Total stockholders' (deficit) equity Total liabilities, mezzanine equity and stockholders' (deficit) equity The accompanying notes are an integral part of these consolidated financial statements. LINDBLAD EXPEDITIONS HOLDINGS, INC. AND SUBSIDIARIES Consolidated Statements of Operations (In thousands, except share and per share data) For the years ended December 31, 2021 2020 2019 Cost of tours Operating (loss) income (Loss) gain on foreign currency Other income (expense) Total other expense (Loss) income before income taxes Income tax (benefit) expense Net income (loss) attributable to noncontrolling interest Net (loss) income attributable to Lindblad Expeditions Holdings, Inc. Series A redeemable convertible preferred stock dividend Non-cash deemed dividend Net (loss) income available to stockholders Undistributed (loss) income per share available to stockholders: The accompanying notes are an integral part of these consolidated financial statements. LINDBLAD EXPEDITIONS HOLDINGS, INC. AND SUBSIDIARIES (In thousands) For the years ended December 31, 2021 2020 2019 Net (loss) income Other comprehensive income (loss): Cash flow hedges: Net unrealized loss Reclassification adjustment, net of tax Total other comprehensive income (loss) Total comprehensive (loss) income Less: comprehensive income (loss) attributive to non-controlling interest Comprehensive (loss) income attributable to stockholders LINDBLAD EXPEDITIONS HOLDINGS, INC. AND SUBSIDIARIES (In thousands, except share data) Common Stock Additional Paid-In Retained Earnings (Accumulated Accumulated Other Comprehensive Total Stockholders' Shares Amount Capital Deficit) Loss Equity Balance as of January 1, 2019 Stock-based compensation Issuance of stock for equity compensation plans, net Repurchase of shares and warrants Warrants Other comprehensive loss, net Redeemable noncontrolling interest Net income attributable to Lindblad Expeditions Holdings, Inc. Balance as of December 31, 2019 Stock-based compensation Issuance of stock for equity compensation plans, net Repurchase of shares Other comprehensive income, net Redeemable noncontrolling interest Series A preferred stock dividend Net loss attributable to Lindblad Expeditions Holdings, Inc. Balance as of December 31, 2020 Stock-based compensation Issuance of stock for equity compensation plans, net Issuance of stock for acquisition Issuance of stock for conversion of preferred stock Non-cash deemed dividend to preferred share holders Other comprehensive income, net Redeemable noncontrolling interest Series A preferred stock dividend Net loss attributable to Lindblad Expeditions Holdings, Inc. Balance as of December 31, 2021 The accompanying notes are an integral part of these consolidated financial statements. LINDBLAD EXPEDITIONS HOLDINGS, INC. AND SUBSIDIARIES Consolidated Statements of Cash Flows (In thousands) For the years ended December 31, 2021 2020 2019 Adjustments to reconcile net (loss) income to net cash provided by (used in) operating activities: Amortization of right-to-use lease assets Loss (gain) on foreign currency Loss on write-off of assets Marine operating supplies and inventories Net cash provided by (used in) operating activities Acquisition (net of cash acquired) Loan issuance Proceeds from long-term debt Repurchase under stock-based compensation plans and related tax impacts Proceeds from Series A preferred stock issuance Repurchase of warrants and common stock Warrants exercised Net cash provided by financing activities Net (decrease) increase in cash, cash equivalents and restricted cash Cash, cash equivalents and restricted cash at beginning of period Cash, cash equivalents and restricted cash at end of period Cash paid during the period: Non-cash preferred stock dividend Shares issued for acquisition Non-cash preferred stock deemed dividend Non-cash deemed dividend to warrant holders The accompanying notes are an integral part of these consolidated financial statements. Lindblad Expeditions Holdings, Inc. Notes to the Consolidated Financial Statements NOTE 1 Organization Lindblad Expeditions Holdings, Inc. and its consolidated The Company operates the following reportable business segments: Lindblad Segment. The Lindblad segment primarily provides ship-based expeditions aboard customized, nimble and intimately-scaled vessels that are able to venture where larger cruise ships cannot, thus allowing Lindblad to offer up-close experiences in the planet’s wild and remote places and capitals of culture. crews, to join many of the Company’s expeditions. Land Experiences Segment. The Land Experiences segment includes our four primarily land-based brands, Natural Habitat, DuVine offers intimate group cycling and adventure tours around the world with local cycling experts as guides, immersive in local cultural, cuisine and high quality accommodations. International cycling tours include the exotic Costa Rican rainforests, the rocky coasts of Ireland and the vineyards of Spain while cycling adventures in the United States include cycling beneath the California redwoods, pedaling through Vermont farmland and wine tastings in the world-class vineyards of Napa and Sonoma. Off the Beaten Path offers small group travel, led by local, experienced guides, with distinct focus on wildlife, hiking national parks and culture. Off the Beaten Path offerings include insider national park experiences in the Rocky Mountains, Desert Southwest, and Alaska, as well as unique trips across Europe, Africa, Australia, Central and South America and the South Pacific. Classic Journeys offers highly curated active small-group and private custom journeys centered around cinematic walks led by expert local guides in over 50 countries around the world. These walking tours are highlighted by expert local guides, luxury boutique accommodations, and handcrafted itineraries that immerse guests into the history and culture of the places they are exploring and the people who live there The Company resumed expedition ship operations in June 2021 and as of January 31, 2022 had 9 of its ten available vessels providing expeditions to guests. Due to the spread of the COVID-19 virus and the effects of travel restrictions around the world, the Company had previously suspended or rescheduled the majority of our expeditions departing between March 16, 2020 through May 31, 2021. Expedition cruise operations restarted in June 2021, with reschedule travel plans and refund payments or issue future travel certificates, as applicable, for those expeditions and trips that the Company is not able to operate due to local restrictions. The Company believes there are a variety of strategic advantages that enable it to deploy its ships safely and quickly, while mitigating the risk of COVID-19 as travel restrictions are lifted. The most notable is the size of its owned and operated vessels which range from 48 to 148 passengers, allowing for a highly controlled environment that includes stringent cleaning protocols. The small nature of the Company’s ships also allows it to efficiently and effectively test its guests and crew prior to boarding. Additionally, all guests age five and older, along with all crew and staff are required to be fully vaccinated and the majority of expeditions take place in remote locations where human interactions are limited, so there is less opportunity for external influence. While the Company’s ships were not in operations, the majority of the fleet was being maintained with minimally required crew on-board to ensure they complied with all necessary regulations and could be fully put back into service quickly as needed. Ahead of launching each ship, crew levels were increased as necessary to prepare each vessel for operations as well as for crew training and vaccinations. Prior to resuming operations, the Company significantly reduced ship and land-based expedition costs such as capital expenditures, crew payroll, land costs, fuel and food, and meaningfully reduced general and administrative expenses through reduced payroll and the elimination of all non-essential travel, office expenses and discretionary spending. The Company also accessed available capital under existing debt facilities and through the issuance of preferred stock. With the majority of operations resuming, operating costs have ramped back up, but given the continued uncertainty around COVID-19 and given that guest counts have not yet returned to traditional levels, the Company continues to minimize expenditures as appropriate. Balance Sheet and Liquidity As of December 30, 2021, the Company had a During April and September 2021, the Company drew down $15.5 million and $46.2 million, respectively, under its second export credit agreement in conjunction with the fourth installment payment and the final payment upon the September 30, 2021 delivery of the During June 2021, the Company further amended its export credit agreements to, among other things, extend the deferral of During April 2021, the Company further amended its term loan and revolving credit facilities to, among other things, extend the waiver of its total net leverage ratio covenant through March 31, 2022, annualize EBITDA used in its covenant calculation through December 31, 2022. See Note 6—Long-term Debt for additional information. NOTE 2 Basis of Presentation The consolidated financial statements include the accounts of Lindblad Expeditions Holdings, Inc. and its consolidated subsidiaries, after elimination of all intercompany accounts and transactions. The consolidated financial statements and accompanying footnotes have been prepared in accordance with accounting principles generally accepted in the United States of America (“U.S. GAAP”) and applicable rules and regulations of the Securities and Exchange Commission (the “SEC”). Use of Estimates The preparation of consolidated financial statements requires management to make estimates and assumptions that affect the reported amounts of assets and liabilities and the disclosure of contingent assets, liabilities, revenues and expenses. Actual results could differ from such estimates. Management estimates include determining the estimated lives of long-lived and intangible assets, determining the fair value of assets acquired and liabilities assumed in business combinations, the derivative instruments, the value of contingent consideration and assessing its litigation, other legal claims and contingencies. Estimates and assumptions are reviewed periodically and the effects of revisions are reflected in the consolidated financial statements in the period that they are determined to be necessary. Revenue Recognition Tour revenues also include revenues from the sale of goods and services onboard the Company’s ships, cancellation fees and trip insurance. Revenues from the sale of goods and services rendered onboard The Company sources its guest bookings through a combination of direct selling and For the years ended December 31, 2021 2020 2019 Guest ticket revenue: Direct National Geographic Agencies Affinity Guest ticket revenue Other tour revenue Tour revenues Customer Deposits and The Company’s The change in contract liabilities within unearned passenger revenues Contract Liabilities (In thousands) Balance as of January 1, 2021 Recognized in tour revenues during the period Additional contract liabilities in period Balance as of December 31, 2021 Cost of Tours Cost of tours represents the Insurance The Company maintains insurance to cover a number of risks including illness and injury to crew, guest injuries, pollution, other The Company also extends cancellation insurance to guests. The Company uses an insurance company to manage passenger insurance purchased to cover a variety of insurable losses including cancellations, interruption, missed connections, travel delays, accidental death and dismemberment, medical coverage and baggage issues. The Company participates in a traditional marine industry reinsurance solution for liability exposure through their Protection and Indemnity (“P&I Club”) Reinsurers, which are similar to mutual marine P&I Club’s that General and Administrative Expense Selling and Marketing Expense Selling and marketing expenses include commissions, royalties and a broad range of advertising and marketing expenses. These include advertising costs of direct mail, Cash and Cash Equivalents The Company considers all highly liquid instruments with an original maturity of and restricted cash reported within the statement of financial position that sum to the total of the same such amounts shown in the statement of cash flows: For the years ended December 31, 2021 2020 2019 (In thousands) Cash and cash equivalents Restricted cash Total cash, cash equivalents and restricted cash as presented in the statement of cash flows Concentration of Credit Risk The Company maintains cash in several financial institutions in the U.S. and other countries which, at times, may exceed the federally insured limits. Accounts held in the U.S. are guaranteed by the Federal Deposit Insurance Corporation up to certain limits. Restricted Cash and Marketable Securities The Company has classified marketable securities, principally money market funds or other short-term investments, as trading securities which are recorded at market value. Unrealized gains and losses are included in current operations. Gains and losses on the disposition of securities are recognized by the specific identification method in the period in which they occur. Cost of these short-term investments approximates fair value. In order to operate guest tour expedition vessels from U.S. ports, the Company is required to either post a performance bond with the Federal Maritime Commission or escrow all unearned guest deposits plus an additional 10% in restricted Restricted cash and marketable securities consist of the following: 2021 2020 (In thousands) Credit card processor reserves Federal Maritime Commission escrow Certificates of deposit and other restricted securities Total restricted cash Marine Operating Supplies and Inventories Marine operating supplies consist primarily of fuel, provisions, spare parts, items required for maintenance and supplies used in the operation of marine expeditions. Marine operating supplies are stated at the lower of cost or net realizable value. Cost is determined using the Inventories consist primarily of gift shop merchandise and other items for resale and are stated at the lower of cost or net realizable value. Cost is determined using the Prepaid Expenses and Other Current Assets The Company records prepaid expenses and other current assets at cost and expenses them in the period the services are provided or the goods are delivered. The Company’s prepaid expenses and other current assets consist of the following: 2021 2020 (In thousands) Prepaid tour expenses Prepaid marketing, commissions and other expenses Prepaid client insurance Prepaid air expense Prepaid port agent fees Prepaid corporate insurance Prepaid income taxes Total prepaid expenses Property and Equipment Property and equipment, net is stated at cost less accumulated Years Vessels and vessel improvements Furniture & equipment Computer hardware and software Leasehold improvements, including expedition sites and port facilities Shorter of lease term or related asset life The ship-based tour and expedition industry is very capital intensive. As of December 31, Vessel improvement costs that add value to the Company’s vessels, such as those discussed above, are capitalized Goodwill In accordance with ASC 360, the Company tests for impairment annually as of September 30, or more frequently if warranted. The existing customers that resulted in repeat purchases and customer loyalty. Based on the Company’s analysis, amortization of the tradenames and customer lists were computed using the estimated useful lives of 15 and 5 years, respectively. See Note 5—Goodwill and Intangible Assets for further information on the Company’s intangible assets. The Company operates two vessels year-round in the Galápagos National Park in In If the Galápagos Upon the occurrence of a triggering event, the assessment of possible impairment of the Company’s Long-Lived Assets The Company reviews its long-lived assets, principally its vessels, for impairment whenever events or changes in circumstances indicate that the carrying amounts of these assets may not be fully recoverable. Upon the occurrence of a triggering event, the assessment of possible impairment is based on the Company’s ability to recover the carrying value of its asset, which is determined by using the asset’s estimated undiscounted future cash flows. If these estimated undiscounted future cash flows are less than the carrying value of the asset, an impairment charge is recognized for the excess of the asset’s carrying value over its estimated fair value. A significant amount of judgment is required in estimating the future cash flows and fair values of its vessels. As of December 31, Accounts Payable and Accrued Expenses The Company records accounts payable and accrued expenses for the cost of such items when the service is provided or when the related product is delivered. The Company’s accounts payable and accrued expenses consist of the following: As of December 31, 2021 2020 (In thousands) Accrued other expense CERTS Grant Accounts payable Bonus compensation liability Employee liability Refunds and commissions payable Royalty payable Travel certificate liability Accrued travel insurance expense Income tax liabilities Foreign currency forward contract liability Total accounts payable and accrued expenses During the year ended December 31, 2021, the Company received $27.0 million under the CERTS Act, which provided grants to eligible motorcoach, school bus, passenger vessel, and pilotage companies that have experienced annual revenue losses of 25 percent or more as result of COVID-19. The priority use of grant funds must be for payroll costs, though grants may be used for operating expenses and the repayment of debt accrued to maintain payroll. The Company is accounting for the grant as a current liability on its balance sheet, as any amounts not appropriately used within one year of the grant date must be returned to the U.S. Treasury, and will recognize the grant within other income on the consolidated statement of operations as permitted expenses under the grant are incurred. During the year ended December 31, 2021, the Company recognized $15.4 million of the CERTS grant in other income for permitted payroll costs and ship and other operating expenses. Leases The Company leases office and warehousing space with lease terms ranging from one to ten The Company accounts for its various operating leases in accordance with ASC 842-Leases. At the inception of a lease, the Company recognizes right-of-use lease assets and related lease liabilities measured as the present value of future lease payments on its balance sheet. Lease expense is recognized on a straight-line basis over the term of the lease. The Company reviewed its contracts with vendors and customers, determining that its right-to-use lease assets consisted primarily of office space operating leases. In determining the right-to-use lease assets and related lease liabilities, the Company did not recognize any lease extension options and elected to exclude leases with terms of 12-months or less. Short-term leases are accounted for monthly over the lease term. Fair Value Measurements Fair value is defined as an exit price, representing the amount that would be received upon the sale of an asset or payment to transfer a liability in an orderly transaction between market participants. Fair value is a market-based measurement that is determined based on assumptions that market participants would use in pricing an asset or liability. A Level 1 Quoted market prices (unadjusted) in active markets for identical assets or liabilities that the reporting entity has the ability to access at measurement date. Level 2 Quoted market prices for similar assets or liabilities in active markets, quoted prices for identical or similar assets or liabilities in markets that are not active, or other inputs that are observable, either directly or indirectly. Fair value is determined through the use of models or other valuation methodologies. Level 3 Significant unobservable inputs for assets or liabilities that cannot be corroborated by market data. Fair value is determined by the reporting entity’s own assumptions utilizing the best information available and includes situations where there is little market activity for the investment. Level 3 financial liabilities consist of obligations for which there is no current market for these securities such that the determination of fair value requires significant judgment or estimation. Changes in fair value measurements categorized within Level 3 of the fair value hierarchy are analyzed each period based on changes in estimates or assumptions and recorded as appropriate. The carrying amounts of cash and cash equivalents, accounts payable and accrued expenses and unearned passenger revenue approximate fair value, due to the short-term nature of these instruments. In connection with the acquisition of Classic Journeys during the year ended December 31, 2021, the Company makes recurring fair value measurements of contingent acquisition consideration using level 3 unobservable inputs. See Note 7—Financial Instruments and Fair Value Measurements. The carrying value of long-term debt approximates fair value given that the terms of the agreement were comparable to the market as of December 31, The asset’s or liability’s fair value measurement within the fair value hierarchy is based upon the lowest level of any input that is significant to the fair value measurement. Derivative Instruments and Hedging Activities Currency Risk. The Company uses currency exchange contracts to manage its exposure to changes in currency exchange rates associated with certain of Interest Rate Risk. The Company uses interest rate caps, designated as cash flow hedges, to manage the risk related to its floating rate corporate debt. By entering into derivative instrument contracts, the Company exposes itself, from time to time, to counterparty credit risk. Counterparty credit risk is The Company’s derivative assets consist principally of interest rate caps and currency exchange contracts, which are The Company records derivatives on a gross basis in other long-term assets and other liabilities in the consolidated balance sheets at fair value. The accounting for changes in The Company applies hedge accounting to interest rate and foreign exchange rate derivatives entered into for risk management purposes. To qualify for hedge accounting, a derivative must be highly effective at reducing the risk associated with the exposure being hedged. In addition, key aspects of achieving hedge accounting are documentation of hedging strategy and hedge effectiveness at the hedge inception and substantiating hedge effectiveness on an ongoing basis. A derivative must be highly effective in accomplishing the hedge objective of offsetting changes in the cash flows of the hedged item for the risk being hedged. The effective portion of changes in the fair value of derivatives designated in a hedge relationship and that qualify as cash flow hedges is recorded in accumulated other comprehensive income, net of tax, and is subsequently reclassified into earnings in the period that the hedged transaction affects earnings. The Company formally documents the relationship between derivatives and hedged items, as well as the risk-management objective and the strategy for undertaking hedge transactions at the inception of the hedging relationship. This documentation includes linking cash flow hedges to specific assets and liabilities on the balance sheet or to specific forecasted transactions. The Company also formally assesses, both at the hedge’s inception and on an ongoing basis, whether the derivative instruments that are used are highly effective in offsetting changes in fair values or cash flows of the hedged items. Income Taxes The Company is subject to income taxes in both the U.S. and the non-U.S. jurisdictions in which it operates. Significant management judgment is required in projecting ordinary income to determine the Company’s estimated effective tax rate. The Company accounts for income taxes using the asset and liability method, under which it recognizes deferred income taxes for the tax consequences attributable to differences between the financial statement carrying amounts and the tax bases of existing assets and liabilities, as well as for tax loss carryforwards and tax credit carryforwards. The Company measures deferred tax assets and liabilities using enacted tax rates expected to apply to taxable income in the years in which those temporary differences are expected to be recoverable or settled. The Company provides a valuation allowance against deferred tax assets if, based upon the weight of available evidence, the Company does not believe it is The Company is subject to tax audits in all jurisdictions for which it files tax returns. Tax audits by their very nature are often complex and can require several years to complete. Currently, there are no U.S. federal, state or foreign jurisdiction tax audits pending. The Company’s corporate U.S. federal and state tax returns for the current year and Other Long-Term Assets In 2016, the Company recorded a $3.6 million tax asset for long-term prepaid value-added taxes related to the importation of the In Loan Receivable In December 2019, the Company and Ulstein Verft AS (“Ulstein Verft”) amended the National Geographic Resolution construction agreement. The amended agreement provides for a $4.0 million loan to Ulstein Verft, with repayment to be 112% of the principal loan balance, due on maturity in December 2023. The Company incurred approximately $0.1 million in legal fees related to this loan that were capitalized and will be amortized to interest expense, net over the life of the loan. This loan receivable is recorded at amortized cost within other long-term assets. During 2021, the Company reduced the loan amount to be repaid in lieu of cash payment for a change order with the shipyard. The Company reviewed its loan receivable for credit losses for the periods ended December 31, 2021 and 2020. In evaluating the allowance for loan losses, the Company considered factors such as historical loss experience, the type and amount of loan, adverse situations that may affect the borrower’s ability to repay and prevailing economic conditions. Based on these credit loss estimation and experience factors, the Company realized 0 allowance for loan loss for the years ended December 31, 2021, 2020 and 2019. The following is a roll-forward of the loan receivable balance: Loan Receivable (In thousands) Balance as of January 1, 2020 Accrued interest Amortization of deferred costs Balance as of December 31, 2020 Adjustment for ship building expense Accrued interest Amortization of deferred costs Legal invoices deferred Balance as of December 31, 2021 Deferred Financing Costs Foreign Currency Translation The Stock-Based Compensation The Company accounts for The Company’s Series A redeemable convertible preferred stock is accounted for as a temporary equity instrument, presented on the consolidated balance sheets in the temporary equity section. The redemption or conversion of the preferred stock into shares of the Company’s common stock is not solely controlled by the Company. At the six-year anniversary of the issuance, the holders have the right to require the Company to repurchase their redeemable convertible preferred stock. The redeemable convertible preferred stock is convertible into the Company’s common stock (i) any time at the holder’s election, (ii) at the six-year anniversary of the issuance of those shares not redeemed at the request of the holder, or (iii) after the third anniversary of the issuance by the Company under certain circumstances. Recently Adopted Accounting Pronouncements In In apply until December 31, 2022 In August 2020, the FASB issued ASU 2020-06, Debt–Debt with conversion and Other Options (Subtopic 470-20) and Derivatives and Hedging–Contracts in Entity's Own Equity (Subtopic 815-40)–Accounting for Convertible Instruments and Contracts in an Entity's Own Equity. The amendments in this ASU address issues identified as a result of the During October 2021, the FASB issued ASU 2021-08, Business Combinations (Topic 805): Accounting for Contract Assets and Contract Liabilities from Contracts with Customers. The amendments in this update require that an entity, the acquirer, recognize and measure contract assets and contract liabilities acquired in a business combination in accordance with ASC 606. At the acquisition date, an acquirer should account for the related revenue contracts in accordance with ASC 606 as if it had originated the contracts. The amendments also apply to contract assets and contract liabilities from other contracts to which the provisions of ASC 606 apply, such as contract liabilities from the sale of nonfinancial assets within the scope of Subtopic 610-20, Other Income—Gains and Losses from the Derecognition of Nonfinancial Assets. If acquired revenue contracts are considered to have terms that are unfavorable or favorable relative to market terms, the acquirer should recognize a liability or asset for the off-market contract terms at the acquisition date. This ASU is effective for fiscal years beginning after December 31, 2022, including interim periods within those fiscal years and early adoption is permitted. The Company adopted this ASU, retrospectively, during its year ended December 31, 2021, and it did not have a material impact on the Company’s consolidated financial instruments. During November 2021, the FASB issued ASU 2021-10, Government Assistance (Topic 832)–Disclosures by Business Entities about Government Assistance. The amendments in this update require disclosures about transactions with a government that have been accounted for by analogizing to a grant or contribution accounting model to increase transparency about (i) the types of transactions, (ii) the accounting for the transactions, and (iii) the effect of the transactions on an entity’s financial statements. This ASU is effective for financial statements issued for annual periods beginning after December 15, 2021 and early application of the amendments is permitted. The Company adopted this ASU during its year ended December 31, 2021, and provided the disclosures required in its consolidated financial statements. NOTE 3— EARNINGS PER SHARE Earnings per common share is computed using the two-class method related to its Preferred Stock. Under the two-class method, undistributed earnings available to stockholders for the period are allocated on a pro rata basis to the common stockholders and to the holders of convertible preferred shares based on the weighted average number of common shares outstanding and number of shares that could be issued upon conversion of the Preferred Stock. Diluted earnings per share is computed using the weighted average number of common shares outstanding and, if dilutive, potential common shares outstanding during the period. Potential common shares consist of the dilutive incremental common shares associated with restricted stock awards, shares issuable upon the exercise of stock options For the years ended December 31, 2021 and 2020, the Company incurred a net loss from operations, therefore 0.8 million restricted shares, 1.5 million options and 9.1 million common shares issuable upon the conversion of the Preferred Stock as of December 31, 2021, and 1.0 million restricted shares, 0.5 million options and 9.1 million common shares issuable upon the conversion of the Preferred Stock as of December 31, 2020, were excluded from dilutive potential common shares for the periods as they are anti-dilutive. For the years ended December 31, 2021, 2020 and 2019, the Company calculated earnings per share as follows: For the years ended December 31, 2021 2020 2019 (In thousands, except share and per share data) Net (loss) income attributable to Lindblad Expeditions Holdings, Inc. Series A redeemable convertible preferred stock dividend Non-cash deemed dividend Undistributed (loss) income available to stockholders Weighted average shares outstanding: Total weighted average shares outstanding, basic Total weighted average shares outstanding, diluted Undistributed (loss) income per share available to stockholders: Basic Diluted NOTE Property and equipment, net are as follows: As of December 31, 2021 2020 Less: Accumulated depreciation Total depreciation For the year ended December 31, NOTE 5— GOODWILL AND INTANGIBLE ASSETS (In thousands) Lindblad Segment Land Experiences Segment Total Balance as of January 1, 2020 Activity Balance as of December 31, 2020 Acquisitions Balance as of December 31, 2021 The carrying amounts and accumulated amortization of the Company’s intangibles, net are as follows: As of December 31, 2021 2020 (In thousands) Gross Carrying Amount Accumulated Amortization Net Carrying Amount Weighted Average Useful Life Remaining (years) Gross Carrying Amount Accumulated Amortization Net Carrying Amount Tradenames Customer Lists Operating rights Total intangibles, net Future expected amortization expense related to these intangibles are as follows: Year Amount (In thousands) 2022 2023 2024 2025 2026 Thereafter NOTE 6— LONG-TERM DEBT Credit Facility On March 27, 2018, the Company entered into the Third Amended and Restated Credit Agreement (the “Amended Credit Agreement”) providing for a refinancing and amendment of the terms of the Company’s prior secured credit facility. The Amended Credit Agreement provided for a $200.0 million senior secured term facility (the “Term Facility”), maturing March 27, 2025, and a $45.0 million senior secured incremental revolving credit facility (the “Revolving Facility”), which includes a $5.0 million letter of credit sub-facility. In connection with the Amended Credit Agreement, the Company capitalized $4.2 million related to lender and third-party fees. The Company’s obligations under the Amended Credit Agreement remain secured by substantially all of the assets of the Company. During March 2020, the Company drew down the entire Revolving Facility, which matures in March 2023, and $44.5 million is outstanding as of December 31, 2021. On August 7, 2020, the Company amended its Term Facility and Revolving Facility to waive the application of the total net leverage ratio covenant through June 2021. In connection with the amendment, the interest rate of the term loan has been increased 125 basis points, to be On December 10, 2020, the Company amended its Term Facility and Revolving Facility to provide for the borrowing of a new tranche of incremental term loans under the Amended Credit Agreement in an amount of $85.0 million, maturing on December 11, 2025, made under the Main Street Expanded Loan Facility (the “Main Street Loan”). Interest on the Main Street Loan shall be paid-in-kind for the first year and the principal shall amortize at a rate of 15% in each of the third and fourth years, with the remaining amounts to be paid at maturity. The Company may voluntarily prepay the Main Street Loan at any time and from time to time, without premium or penalty, other than customary “breakage costs” and fees for LIBOR-based loans. During April 2021, the Company further amended its Amended Credit Agreement to, among other things, extend the waiver of its total net leverage ratio covenant through March 2022, annualize EBITDA used in its covenant calculation through December 31, 2022 and increase the interest rate spreads of the Term Facility, excluding the Main Street Loan Facility, and the Revolving Facility by 50 basis points. Certain other covenants under the Amended Credit Agreement continue to be more restrictive during the extended covenant waiver period. Borrowings under the Term Facility, as amended, bear interest at an adjusted Intercontinental Exchange (“ICE”) Benchmark administration LIBOR, with a minimum of 0.75%, plus a spread of 5.25%, for an aggregated rate of 6.00% as of December 31, 2021. The Main Street Loan shall bear interest at a rate per annum of LIBOR for an interest period of 3-months plus 3.00%, for an aggregated rate of 3.21% as of December 31, 2021. Borrowings under the Revolving Facility mature March 2023 and, as amended, bear interest at an adjusted ICE Benchmark administration LIBOR, plus a spread of 3.50%, for an aggregated rate of 3.60% as of December 31, 2021. The Amended Credit Agreement contains financial covenants that, among other things, (i) require the Company to maintain a total net leverage ratio (defined as on any date of determination, the ratio of total debt on such date, less up to $50.0 million of the unrestricted cash and cash equivalents to Adjusted EBITDA, as defined in the Amended Credit Agreement, for the trailing 12-month period of 5.0 to 1.0 initially, with 0.25 equal reductions every two years thereafter until June 30, 2022 when the total net leverage ratio shall be 4.75 to 1.00 thereafter; (ii) limit the amount of indebtedness the Company may incur generally and specifically for intercompany debt, debt incurred to finance acquisitions and improvements, for capital and synthetic lease obligations, for standby letters of credit, and in connection with refinancing; (iii) limit the amount the Company may spend in connection with certain types of investments; and (iv) require the delivery of certain periodic financial statements and an operating budget. The net leverage ratios covenant of the Company’s Amended Credit Agreement has been waived through March 2022. As of December 31, 2021, the Company was in compliance with the covenants currently in effect. Senior Secured Credit Agreements On January 8, 2018, the Company entered into a senior secured credit agreement (the “First Export Credit Agreement”) with Citibank, N.A., London Branch (“Citi”) and Eksportkreditt Norge AS, (together with Garantiinstituttet, now known as Eksfin, Export Finance Norway), (together with Citi, the “Lenders”). Pursuant to the First Export Credit Agreement, in March 2020 the Company borrowed $107.7 million for the On April 8, 2019, the Company entered into a senior secured credit agreement (the “Second Export Credit Agreement”) with the Lenders. Pursuant to the Second Export Credit Agreement, the Lenders made available to the Company, at the Company's option and other things, extend the waiver of its total net leverage ratio covenants through March 31, 2022, increase the interest rate spread by 50 basis points and annualize EBITDA used in its covenant calculation through December 31, 2022. The loan amortizes quarterly based on a twelve-year profile, with 70% maturing over twelve years from final drawdown, and 30% maturing over five years from final drawdown. Additionally, 70% percent of the loan is guaranteed by Eksfin, the official export credit agency of Norway. The Company incurred approximately $2.6 million in financing fees related to the Second Export Agreement, recorded as deferred financing costs as part of long-term debt. The Second Export Credit Agreement, as amended, bears a variable interest rate equal to three-month LIBOR plus a margin of 3.50% per annum, or 3.71% over the borrowing period covering December 31, 2021. The First Export Credit Agreement and the Second Export Credit Agreement contain financial covenants that, among other things, require us to maintain a total net leverage ratio of 5.25 to 1.00 initially, with 0.25 equal reductions every two years thereafter until June 30, 2022 when the total net leverage ratio shall be 4.75 to 1.00, thereafter. The total net leverage ratio is defined under the covenants as on any date of determination, the ratio of total debt on such date, less up to $50.0 million of the unrestricted cash and cash equivalents to Adjusted EBITDA, as defined in the First Export Credit Agreement and the Second Export Credit Agreement, for the trailing 12-month period. The net leverage ratio covenants of the Company’s First Export Credit Agreement and the Second Export Credit Agreement have been suspended through March 2022. As of December 31, 2021, Note Payable The Company’s DuVine subsidiary has a EUR 0.1 million State Assistance Loan related to the financial consequences of the purpose of employment preservation. This loan matures August 2025, with monthly payments, and bears interest rate of 0.53%. Long-Term Debt Outstanding As of December 31, 2021 2020 (In thousands) Principal Deferred Financing Costs, net Balance Principal Deferred Financing Costs, net Balance Credit Facility 1st Senior Secured Credit Agreement 2nd Senior Secured Credit Agreement Revolving Facility Note payable Other Total long-term debt Less current portion Total long-term debt, non-current Future minimum principal payments of long-term debt are as follows: Year Amount (In thousands) 2022 2023 2024 2025 2026 Thereafter For the years ended December 31, 2021, 2020 and 2019, the Company recorded deferred financing costs of $3.0 million, $4.5 million and $2.4 million, respectively, in long-term debt, amortizing the costs over the term of the financing using the straight-line method. For the years ended December 31, 2021, 2020 and 2019, deferred financing costs charged to interest expense were $3.1 million, $2.1 million and $1.9 million, respectively. Letters of Credit As of December 31, 2021 and 2020, the Company had $1.2 million in letters of credit outstanding with financial institutions. The annual fee for letters of credit is 1.0% of the outstanding balance. The letters of credit are secured by a certificate of deposit maintained at the financial institutions and that mature in November 2022. NOTE 7— FINANCIAL INSTRUMENTS AND FAIR VALUE MEASUREMENTS The Company’s derivative assets and liabilities consist principally of foreign exchange forward contracts and interest rate caps and are carried at fair value based on significant observable inputs (Level 2 inputs). The Company uses currency exchange contracts to manage its exposure to changes in currency exchange rates associated with certain of its non-U.S. dollar denominated receivables and payables. The Company primarily hedges a portion of its current-year currency exposure to several currencies, which normally include, but are not limited to, the Canadian and New Zealand dollars, the Brazilian real, the South African rand, the euro and the British pound sterling. The fluctuations in the value of these forward contracts largely offset the impact of changes in the value of the underlying risk they economically hedge. The Company entered into interest rate cap agreements to hedge its exposure to interest rate movements and to manage its interest expense related to the Term Facility and designated these interest rate caps as a cash flow hedge. The Company receives payments on the interest rate cap for any period that the one-month USD-LIBOR rate increases beyond the strike rate. The termination date of the interest rate cap agreement is May 31, 2023. The detailed terms of the interest rate caps and the portion of the corporate Term Facility that they hedge are as follows: Interest Rate Caps Corporate Debt Trade date and borrowing date May 29, 2018 March 27, 2018 Effective date September 27, 2018 Not applicable Termination date May 31, 2023 March 31, 2025 Notional amount $100,000,000 $100,000,000 Fixed interest rate (plus spread) 3.00% May 1, 2019 until maturity Not applicable Variable interest rate 1 month LIBOR 1 month LIBOR + 3.50% Settlement Monthly on last day of each month Monthly on last day of each month Interest payment dates Monthly on last day of each month Monthly on last day of each month Reset dates Last day of each month Last day of each month Changes in the fair value of this interest rate cap are recorded in accumulated other comprehensive income, pursuant to the guidelines of cash flow hedge accounting as outlined in ASC 815 and ASU 2017-12. The Company expects minimal losses currently recorded in accumulated other comprehensive income related to the interest rate caps to be recognized in earnings over the next 12 months. The cost of the interest rate cap will be amortized to interest expense over its life, from the effective date through termination date. In March 2019, the Company entered into foreign exchange forward contracts, designated as cash flow hedges, to hedge its exposure to the NOK, related to the Company’s contract to purchase the new polar ice-class vessel, the National Geographic Resolution, delivered September 2021. The cost of the foreign exchange forward contracts were amortized to interest expense over their lives, from the effective date through each hedge’s settlement date. The Company recorded the effective portion of changes in the fair value of its cash flow hedges to other comprehensive income (loss), net of tax, and subsequently reclassified these amounts into earnings in the period during which the hedged transaction was recognized. Any changes in fair values of hedges that would be determined to be ineffective would be immediately reclassified from accumulated other comprehensive income (loss) into earnings. No gains or losses of the Company’s cash flow hedges were considered to be ineffective and reclassified from other comprehensive income (loss) to earnings for the years ended December 31, 2021, 2020 and 2019. The Company reclassified $2.7 million, $5.3 million and $1.6 million in losses, net of tax, from other comprehensive income (loss) to earnings for the years ended December 31, 2021, 2020 and 2019, respectively, due to the maturity of a cash flow hedge and the hedged item. The Company held the following derivative instruments with absolute notional values as of December 31, 2021: (in thousands) Absolute Notional Value Interest rate caps $ 100,000 Foreign exchange contracts 8,892 Estimated fair values (Level 2) of derivative instruments were as follows: As of December 31, 2021 2020 (In thousands) Fair Value, Asset Derivatives Fair Value, Liability Derivatives Fair Value, Asset Derivatives Fair Value, Liability Derivatives Derivative instruments designated as cash flow hedging instruments: Foreign exchange forward (a) Interest rate cap (b) Total Derivative instruments not designated as cash flow hedging instruments: Foreign exchange forward (c) Total __________ (a) Recorded in accounts payable and accrued expenses and other long-term liabilities. (b) Recorded in prepaid expenses and other current assets, and other long-term assets. (c) Recorded in prepaid expenses and other current assets, and accounts payable and accrued expenses. The effects of derivatives recognized in the Company’s consolidated financial statements were as follows: For the years ended December 31, (In thousands) 2021 2020 2019 Derivative instruments designated as cash flow hedging instruments: Foreign exchange forward (a) Interest rate cap (b) Derivative instruments not designated as cash flow hedging instruments: Foreign exchange forward (c) Total __________ (a) For the year ended December 31, 2021, $2.7 million was recognized as a loss on foreign currency in the consolidated statements of operations and $2.0 million was recognized, net of tax, as a component of other comprehensive income (loss) within stockholders’ equity. For the year ended December 31, 2020, $5.3 million was recognized as a loss on foreign currency in the consolidated statements of operations, and $2.4 million, was recognized, net of tax, as a component of other comprehensive income (loss) within stockholders’ equity. For the year ended December 31, 2019, $1.6 million was recognized as a loss on foreign currency in the consolidated statements of operations, and $3.4 million, was recognized, net of tax, as a component of other comprehensive income (loss) within stockholders’ equity. (b) Recognized, net of tax, as a component of other comprehensive income (loss) within stockholders’ equity. (c) Gains (losses) related to derivative instruments are expected to be largely offset by (losses) gains on the underlying exposures being hedged. During the years ended December 31, 2021, 2020 and 2019, gains of $0.3 million, $0.6 million and $1.7 million, respectively, were recognized in gain (loss) on foreign currency. In connection with the acquisition of Classic Journeys, the purchase agreement includes a contingent consideration earnout, see Note 9—Acquisitions, which is required to be fair valued. The Company makes fair value measurement of contingent acquisition consideration liabilities using Level 3 unobservable inputs. The Company recognizes the fair value of its contingent acquisition consideration based on its estimated fair value at the beginning period date using Monte Carlo simulations, using discount factors, which incorporates weighted average cost of capital and long and short-term risk-free rates, the projected results of the acquired business and the time remaining in the earnout period. Subsequent adjustments to the fair value are due to the passage of time as the payment date approaches or changes to management’s estimates of the projected performance target. In determining the fair value, the Company reviews current results along with projected results for the remaining earnout period to calculate the expected contingent acquisition consideration to be paid using the agreed upon formula as laid out in the acquisition agreement. The fair value of this liability will be adjusted based on the change in fair value resulting from the passage of time at the applicable discount rate, or changes in the forecasted results as we approach the payment dates absent any significant changes in assumptions related to the valuation or the probability of payment. The following tables present the estimated fair value measurements of the (level 3) contingent acquisition consideration using the fair value hierarchy: As of December 31, (In thousands) 2021 2020 2019 Liabilities: Contingent acquisition consideration Total During the year ended December 31, 2021, the Company recorded a liability of $0.2 million for the deferred contingent consideration at the acquisition date. The possible contingent acquisition consideration payout is either 0 or $0.6 million, depending on the achievement of certain average net profits targets by the acquired operation. This liability is recorded on the consolidated balance sheet in other liabilities at December 31, 2021. The following table sets forth a reconciliation of changes in the fair value of contingent acquisition consideration level 3 financial liabilities: For the year ended December 31, 2021 (In thousands) Balance, January 1, Additions to level 3 Change in fair value Balance December 31, NOTE 8— INCOME TAXES The Company (a “C” Corporation) provides for income taxes based on the Federal and state statutory rates on taxable income. U.S. and foreign components of income before incomes taxes For the years ended December 31, 2021 2020 2019 The income tax provisions For the years ended December 31, (In thousands) 2021 2020 2019 Current Federal State Foreign - Other Total current Deferred Federal State Foreign - Other Total deferred Income tax expense (benefit) A reconciliation of the U.S. federal statutory income tax (benefit) expense to the Company’s effective income tax provision is as follows: For the years ended December 31, 2021 2020 2019 The Company, through its subsidiaries and affiliated entities in the U.S., the Cayman Islands Deferred tax (liabilities) assets, As of December 31, (In thousands) 2021 2020 Net operating loss carryforward Property and equipment Disallowed interest carryforward Valuation allowance Stock-based compensation Intangibles Other Deferred tax (liabilities) assets The Company recognizes valuation allowances to reduce deferred tax assets to the amount that is more likely than not to be realized. In assessing the likelihood of realization, management considers: (i) future reversals of existing taxable temporary differences; (ii) future taxable income exclusive of reversing temporary differences and carryforwards; (iii) taxable income in prior carryback year(s) if carryback is permitted under applicable tax law; and (iv) tax planning strategies. The Company As a result of the transition to the territorial tax regime effectuated by the Tax Cuts and Jobs Act The Company is subject to income taxes in the U.S. and various state and foreign jurisdictions. Significant judgment is required in evaluating tax positions and determining the provision for income taxes. The Company establishes liabilities for tax-related uncertainties based on estimates of whether, and the extent to which, additional taxes may be due. These liabilities are established when the Company believes that certain positions might be challenged despite its belief that its tax return positions are fully supportable. The Company adjusts these liabilities in light of changing facts and circumstances, such as the outcome of a tax audit. The provision for income taxes includes the impact of changes to these liabilities. The following is a tabular reconciliation of the total amounts of unrecognized tax benefits and does not include related interest and For the years ended December 31, (In thousands) 2021 2020 2019 Beginning of year Current year positions Prior year positions End of year The Company has elected an accounting policy to classify interest and penalties related to unrecognized tax benefits as a component of income tax expense. As of December 31, The Company is subject to tax audits in all jurisdictions for which it files tax returns. Tax audits by their very nature are often complex and can require several years to complete. Currently, there are no U.S. federal, state or foreign jurisdiction tax audits pending. The Company’s corporate U.S. federal and state tax returns for the current year and the NOTE 9— ACQUISITIONS To further expand the Company’s land-based experiential travel offerings and increase its addressable market, on February 1, 2021, the Company acquired, through its Natural Habitat subsidiary, 80.1% of the outstanding common stock of Off the Beaten Path, LLC, a land-based travel operator specializing in authentic national park experiences, on March 3, 2021, acquired, through its Natural Habitat subsidiary, 70% of the outstanding common stock of DuVine Cycling + Adventure LLC, an international luxury cycling and adventure company and on October 13, 2021, acquired 80.1% of Classic Journeys LLC, a leading luxury walking tour company. The acquisitions had an aggregate purchase price of $23.6 million, including $1.8 million in Company stock at closing and $0.2 million in deferred contingent consideration. The deferred contingent consideration has an earnout potential between 0 and $0.6 million. The acquisitions were accounted for under purchase accounting and are included in our consolidated financial statements since the date of their acquisition. Acquisition related cost were approximately $1.0 million and are included in general and administrative expenses in the consolidated statements of operations for the year ended December 31, 2021. The Company preliminarily recorded approximately $10.4 million in intangible assets related to tradenames and customer lists and approximately $19.9 million in goodwill related to these acquisitions. The amount recorded for the intangible assets and goodwill is subject to possible adjustment when the valuation of Classic Journeys is finalized. The acquired businesses have contributed aggregate revenue of $17.9 million and are immaterial to the Company's net income during the year ended December 31, 2021. Following are pro forma revenue and net loss available to stockholders for the years ended December 31, 2021 and 2020, assuming the Company had completed the acquisitions on January 1, 2020: For the years ended December 31, 2021 2020 (In thousands) (unaudited) Revenue Net loss available to stockholders NOTE Redeemable Non-Controlling Interest Contingent Arrangements Mr. Bressler, founder of Natural Habitat, retains a 19.9% noncontrolling interest in Natural Habitat, which is subject to a put/call arrangement, amended in May 2020. The arrangement between the Company and Mr. Bressler was established in order to provide a formal exit opportunity for Mr. Bressler and a path to 100% ownership for the Company. Mr. Bressler has a put option that under certain conditions, and subject to providing notice by January 31, 2024, that enables him, but does not obligate him, to sell his remaining interest in Natural Habitat to the Company, valued as of December 31, 2023. The Company has a call option, but not an obligation, with an expiration of March 31, 2029, under which it can buy Mr. Bressler’s remaining interest at a similar fair value measure as Mr. Bressler’s put option, subject to a call purchase price minimum. Mr. Lawrence, President of Off the Beaten Path, through a combination of his original minority interest and the profit interest units he received, retains a 19.9% noncontrolling interest in Off the Beaten Path, which is subject to a put/call arrangement. The arrangement between the Company and Mr. Lawrence was established in order to provide a formal exit opportunity for Mr. Lawrence and a path to 100% ownership for the Company. Mr. Lawrence has a put option, that under certain conditions and subject to providing notice by October 31, 2025, that enables him, but does not obligate him, to sell his remaining interest in Off the Beaten Path to the Company, valued as of December 31, 2025. The Company has a call option, but not an obligation, on or after October 31, 2025, with an expiration of December 31, 2030, under which it can buy Mr. Lawrence’s remaining interest at a similar fair value measure as Mr. Lawrence’s put option. Mr. Levine, founder of DuVine, retains a 30% noncontrolling interest in DuVine, which is subject to a put/call arrangement. The arrangement between the Company and Mr. Levine was established in order to provide a formal exit opportunity for Mr. Levine and a path to 100% ownership for the Company. Mr. Levine has a put option, that under certain conditions and subject to providing notice by January 31, 2026, that enables him, but does not obligate him, to sell his remaining interest in DuVine to the Company, valued as of December 31, 2025. The Company has a first call option, but not an obligation, on or after December 31, 2023, expiring December 31, 2025, to acquire an additional 10% of DuVine from Mr. Levine, and a second call option, but not an obligation, on or after December 31, 2025, with an expiration of December 31, 2030, under which it can buy Mr. Levine’s remaining interest at a similar fair value measure as Mr. Levine’s put option, subject to a call purchase price minimum. Mr. and Mrs. Piegza, founders of Classic Journeys, retain a 19.9% noncontrolling interest in Classic Journeys, which is subject to a put/call arrangement. The arrangement between the Company and Mr. and Mrs. Piegza was established in order to provide a formal exit opportunity for Mr. and Mrs. Piegza and a path to 100% ownership for the Company. Mr. and Mrs. Piegza have a put option that under certain conditions, and subject to providing notice by November 13, 2026, that enables them, but does not obligate them, to sell their remaining interest in Classic Journeys to the Company, valued as of the fiscal quarter prior to the put notice. The Company has a call option, but not an obligation, under which it can buy Mr. and Mrs. Piegza’s remaining interest at a similar fair value measure as Mr. and Mrs. Piegza’s put option. Since the redemption of these noncontrolling interests is not solely in the Company’s control, the Company is required to record the redeemable noncontrolling interest outside of stockholders’ equity but after its total liabilities. In addition, if it is probable that the instrument will become redeemable, as such solely due to the passage of time, the redeemable noncontrollable interest should be adjusted to the redemption value via one of two measurement methods. The Company elected the income classification-excess adjustment and accretion method for recognizing changes in the redemption value of the put options. Under this methodology, a calculation of the present value of the redemption value is compared to the carrying value of the redeemable noncontrolling interest and the carrying value of the redeemable noncontrolling interest is adjusted to the redemption value’s present value. Any adjustments to the carrying value of the redeemable noncontrolling interest, up to the fair value of the of the noncontrolling interest, are classified to retained earnings. Adjustments in excess of the fair value of the noncontrolling interest, are treated as a decrease to net income available to common stockholders. The fair value of the put options was determined using a discounted cash flow model. The redemption values were adjusted to their present values using the Company’s weighted average cost of capital. At December 31, 2021, the fair value of the noncontrolling interest exceeded the present value of the put option redemption value, and the Company recorded a $0.2 million adjustment, which increased the carrying amount of redeemable noncontrolling interest and decreased the Company’s retained earnings. At December 31, 2020, the fair value of the noncontrolling interest was less than the present value of the put option redemption value, and the Company recorded a $7.2 million adjustment, which decreased the carrying amount of redeemable noncontrolling interest and increased the Company’s retained earnings. At December 31, 2019, the fair value of the noncontrolling interest exceeded the present value of the put option redemption value, and the Company recorded a $7.2 million adjustment, which increased the carrying amount of redeemable noncontrolling interest and reduced the Company’s retained earnings. For the years ended December 31, (In thousands) 2021 2020 2019 Beginning balance Net income (loss) attributable to noncontrolling interest Acquired businesses' noncontrolling interest Fair value adjustment of put option Balance September 30, In connection with the 2016 acquisition of Natural Habitat, Mr. Bressler has an equity incentive opportunity to earn an award of options based on the future financial performance of Natural Habitat, where if the final year equity value of Natural Habitat, as defined in Mr. Bressler's employment agreement, exceeds $25.0 million, effective as of December 31, 2023, Mr. Bressler will be granted options with a fair value equal to 10.1% of such excess, subject to certain conditions. Lease Commitments The Company leases office space and equipment under long-term leases, which are classified as operating leases. (In thousands) Operating Lease Payments 2022 2023 2024 2025 2026 Present value discount (6% weighted average) Total Royalty Agreement – National Geographic The Company is engaged in an alliance and license agreement with National Geographic through 2025, which allows the Company to use the National Geographic name and logo. In return for these rights, the Company is charged a royalty fee. The royalty fee is included within selling and marketing expense on the accompanying consolidated statements of operations. The amount is calculated based upon a percentage of certain ticket revenues less travel agent commission, including the revenues received from cancellation fees and any revenues received from the sale of voyage extensions. A voyage extension occurs when a guest extends his or her trip with pre- or post-voyage hotel nights and is included within tour revenues on the accompanying consolidated statements of operations. The royalty expense is recognized at the time of revenue recognition. See Note The royalty balances payable to National Geographic as of December 31, Royalty Agreement – World Wildlife Fund Natural Habitat has a license agreement with World Wildlife Fund, which allows it to use the WWF name and logo. In return for these rights, Natural Habitat is charged a royalty fee and a fee based on annual gross sales. The fees are included within selling and marketing expense on the accompanying consolidated statements of operations. The annual royalty payment and gross sales fees are paid on a quarterly basis. For the years ended December 31, Royalty Agreement – Islander Under a perpetual royalty agreement, the Company is obligated to pay a third party, based upon net revenues generated through tours conducted on theNational Geographic Islander. Charter Commitments From time to time, the Company enters into agreements to charter vessels onto which it holds its tours and expeditions. Additionally, due to certain restrictions on travel during the COVID-19 pandemic, the Company entered into an agreement with a third party to provide chartered air service for guests and crew on its 2020-2021 Antarctica expeditions. Future minimum payments on its charter agreements are as follows: Amount 2022 2023 Other Commitments The Company participates, with other tour operators, in the Consumer Protection Insurance Plan sponsored by the United States Tour Operators Association (“USTOA”). The USTOA requires a Operational Agreement The Company maintains an agreement with a third party in the Galápagos Islands who provides Legal Proceedings The Company is involved in various claims, legal actions and regulatory proceedings arising from time to time in the ordinary course of business. In the opinion of management, after consulting legal counsel, there are no outstanding proceedings that are expected to have a material adverse effect on NOTE The Company has a NOTE The Company has 1,000,000 shares of preferred stock authorized, $0.0001 par value and 200,000,000 shares of common stock authorized, $0.0001 par value. In connection with its initial public offering, on May 15, 2013, On June 14, 2019, the Company Preferred Stock On August 31, 2020, the Company issued and sold 85,000 shares of Series A Redeemable Convertible Preferred Stock, par value of $0.0001, (“Preferred Stock”) for During the For the years ended December 31, 2021 and Stock and Warrant Repurchase Plan NOTE 13— STOCK-BASED COMPENSATION Restricted Stock and Restricted Stock Units Restricted stock is shares of stock granted Performance Stock Units PSUs represent a promise to deliver shares to the employee, non-employee director or other service providers at a future date if certain performance and vesting conditions are met. PSUs generally vest three years following the date of grant The ten years. Stock compensation expense related to options are recorded based on the fair value of stock option grants, amortized on a straight-line basis over the employee’s required service period. The Company estimated the fair value of employee stock options using the Black-Scholes option pricing model. The fair values of employee stock options granted under the Stock Option Grants Stock Option Grants 11/11/2020 05/10/2021 % % % % % % 2016 CEO Share Allocation Plan In April 2016, the Company’s Board of Directors adopted the 2016 CEO Share Allocation Plan and in June 2016, the Company’s shareholders approved the 2016 CEO Share Allocation Plan, pursuant to which the Company will grant awards covering up to 1,000,000 shares of the Company’s common stock in the form of restricted stock, restricted stock units, and/or other stock- or cash-based awards to eligible employees and other service providers of the Company. The 2016 CEO Share Allocation Plan was adopted in connection with a contribution agreement that the Company entered into with Sven-Olof Lindblad, the Company’s Co-Chairperson and former Chief Executive Officer and President, pursuant to which Mr. Lindblad will transfer up to 1,000,000 shares from his holdings of the Company’s common stock (i.e., an equivalent number of shares as is reserved for issuance under the 2016 CEO Share Allocation Plan) (the “Contribution Shares”) to the Company as a contribution to the capital of the Company. Mr. Lindblad will not receive any consideration in exchange for the Contribution Shares. However, as a condition to the contribution of any Contribution Shares, the Company must grant awards under the 2016 CEO Share Allocation Plan, such that the number of Contribution Shares that Mr. Lindblad actually contributes to the Company will equal the number of shares corresponding to awards granted under the plan. The administrator may amend, suspend or terminate the 2016 CEO Share Allocation Plan at any time. On January 10, 2017, Mr. Lindblad contributed to the Company and the Company thereafter granted, 716,550 restricted shares at a grant price of $9.65. The grants vested in three equal installments in January 2017, 2018 and 2019. Long-Term Incentive Compensation See the following table for a summary of PSU, restricted stock, RSU and MSU activity. Performance-based Stock Units Restricted Stock and Restricted Stock Units Market-based Stock Units Number of Shares Weighted Average Grant Date Fair Value Number of Shares Weighted Average Grant Date Fair Value Number of Shares Weighted Average Grant Date Fair Value Balance, January 1, 2019 Granted Vested and released Forfeited Balance, December 31, 2019 Granted Vested and released Forfeited Balance, December 31, 2020 Granted Vested and released Forfeited Balance, December 31, 2021 Stock Options The following table is a summary of Number of Options Weighted Average Exercise Price Weighted Average Contractual Live (Years) Aggregate Intrinsic Value Options outstanding as of January 1, 2019 Exercised Options outstanding as of December 31, 2019 Granted Options outstanding as of December 31, 2020 Granted Exercised Options outstanding as of December 31, 2021 As of December 31, 2021 Number of Options Weighted Average Exercise Price Weighted Average Contractual Live (Years) Aggregate Intrinsic Value Options vested and/or expected to vest Options exercisable Stock-based compensation expense for The Company and National Geographic Society collaborate on exploration, research, technology and conservation in order to provide travel experiences and disseminate geographic knowledge around the globe. The Lindblad/National Geographic Society alliance is set forth in (i) an Alliance and License Agreement and (ii) a Tour Operator Agreement. On May 4, 2016, in connection with the Company's acquisition of Natural Habitat, NOTE 15— SEGMENT INFORMATION The Company’s chief operating decision maker, or CODM, assesses performance and allocates resources based upon the separate financial information from the Company’s operating segments. In The Company evaluates the performance of its business segments based largely on tour revenues and operating income, For the years ended December 31, 2021 2020 Change % 2019 Change % (In thousands) Tour revenues: Lindblad Land Experiences Total tour revenues Operating (loss) income: Lindblad Land Experiences Total operating loss Intercompany tour revenues between the Lindblad and Land Experiences segments eliminated in consolidation and in the presentation above for the years ended December 31, For the years ended December 31, 2021 2020 Change % 2019 Change % (In thousands) Depreciation and amortization: Lindblad Land Experiences Total depreciation and amortization The following (In thousands) As of December 31, 2021 As of December 31, 2020 Total Assets: Lindblad Land Experiences Total assets Intangibles, net: Lindblad Land Experiences Total intangibles, net Goodwill: Lindblad Land Experiences Total goodwill NOTE 16— SUBSEQUENT EVENTS On February 4, 2022, the Company issued $360.0 million of 6.75% senior secured notes, maturing 2027, and entered into a $45.0 million revolving credit facility. Proceeds from the senior secured note issuance were used primarily to pay the outstanding borrowings under the Company's Amended Credit Agreement, including the Term Facility, Main Street Loan and the Revolving Facility. The senior secured notes are guaranteed on a senior secured basis by the Company and certain of the Company’s subsidiaries that also guarantee the obligations under the revolving credit facility, and collateralized by certain of the Company’s assets. On February 4, 2022, we entered into a new revolving credit facility, which includes an aggregate principal amount of $45.0 million maturing February 2027, including a letter of credit sub-facility in an aggregate principal amount of up to $5.0 million. Borrowings under the facility will bear interest at a rate per annum equal to, at our option, an adjusted SOFR rate plus a spread or a base rate plus a spread. The Revolving Credit Agreement contains customary events of default provisions, affirmative and negative covenants as well as financial covenants.National Geographic Orion joined the fleet in 2013. TheNational Geographic Orion is a blue water, ice class vessel, equipped with advanced technology, including large retractable stabilizers, sonar, radar and an ice-strengthened hull, which operates in the Artic, Antarctic, Patagonia and the South Pacific A shallow draft as well as bow and stern thrusters allow for maneuvering close to shore. TheNational Geographic Orion accommodates 102 guests in 53 cabins, including several with balconies and a varietyHarmony VSeasonalityan expeditiontypically during nonpeak demand periods, in the second and fourth quarters. Our drydock schedules are subject to cost and timing differences from year to year due to the availability of shipyards for certain work, drydock locations based on ship itineraries, operating conditions experienced especially in the polar regions and the applicable regulations of vessel used for explorationclassification societies in the maritime industry, which require more extensive reviews periodically. Drydocking impacts operating results by reducing tour revenues and increasing cost of tours.southern coastlineBeaten Path and islandsClassic Journeys brands are seasonal businesses, with the majority of Cuba. It can accommodate 44 guestsNatural Habitat’s tour revenue recorded in 23 outside cabins. The ship is fully air-conditioned, has a Sun Deck with an al fresco area that can also be enclosedthe third and used as a venue for presentationsfourth quarters from its summer season departures and recaps. The ship is equipped with stabilizerspolar bear tours, while the majority of Off the Beaten Path, DuVine and satellite communications. Classic Journeys’ revenues are recorded during the second and third quarters from their spring and summer departures.Sea Cloud offers the experience of sailing aboard a fully-rigged ship in the Caribbean and Mediterranean and accommodates 58 guests in 28 outside cabins, including two original owner’s suites that still feature original marble baths and fireplaces. TheSea Cloud has extensive public spaces on the top deck, a dining room that can accommodate all guests at once for single seating and a lounge.Ship Repair and MaintenanceStrategic Alliance with National Geographicroutine repairsbecome engaged through the LEX-NG Fund. In the past, we have organized high-level meetings in the Arctic, Antarctic, the Galápagos Islands and maintenance performedBaja California to put a spotlight on an ongoing basiskey environmental issues in conjunction with organizations such as the Aspen Institute, TED and in accordance with applicable requirements,the WWF. These efforts help to build our brand and network of relationships and enhance our thought leadership. We will continue to focus on ensuring that each of our expedition ships is taken out of service for a scheduled deeper maintenance period to conduct repairs and improvements. We maintainguests associates our fleet in accordancebrand with applicable regulations, international conventions and insurance requirements. This includes regularly scheduled maintenance, periodic inspections, drydocking, wetdocking and overhaul. In addition, renovations and replacements of various vessel elements are part of the ongoing process of maintaining the vessels to a high standard.high-quality marine based adventure vacation experiences.For U.S. flagged ships, the statutory requirement isWe maintain an annual docking and U.S. Coast Guard inspections, normally conducted in drydock. Internationally flagged ships have scheduled dockings approximately every 12 months, for a period of up to three to six weeks. Drydock interval and required inspections are statutory requirements controlled under chapters of the International Convention of the Safety of Life at Seas (“SOLAS”) and Classification Society instructions. Under these regulations, passenger ships must be inspected in drydock twice in five years,active presence on numerous social media platforms, focusing primarily on those with the maximum duration between each drydock inspection notgreatest reach to exceed three years,our target demographic. Developing our brand and an underwater hull inspection is required annually. Togrowing our digital audience has been a point of emphasis and we have dramatically increased social followers, as well as engagement and impressions. Our increased efforts around digital marketing and social media have also resulted in significant earned media from brands, influencers and industry partners.extent practicable each ship’s crewspecialty cruise and hotel staff remainadventure travel segments and we believe these trends will continue following the COVID-19 pandemic. We are focused on growing our business in a prudent and disciplined manner. When evaluating various strategies for expansion of guest capacity and product offerings, we consider closely the expected return on invested capital and the range of possibilities, such as a newbuild program, adding selected charters and the acquisitions of existing ships or operators.ship during docking periodsacquisition of Off the Beaten Path, a land-based travel operator specializing in authentic national park experiences, DuVine, an international luxury cycling and assistadventure company focused on exceptional food and wine experiences, and Classic Journeys, a leading luxury walking tour company that offers highly curated active small-group and private custom journeys. Similar to the Company’s acquisition of Natural Habitat in performing repair2016, these businesses are strong compliments to our existing product offerings, and maintenance work. we will leverage our experience and resources to accelerate their growth and capitalize on the growing demand for authentic and immersive adventure travel. do not earn revenue while ships are in dock. Accordingly, dockings are typically planned during non-peak demand periodsbelieve that we have the financial flexibility to minimize the adverse effect on revenuepursue additional growth opportunities subject to, among other factors, our ability to identify attractive business opportunities and to negotiate favorable terms for such opportunities. Additionally, we believe that results from ships being outour platform is well positioned to opportunistically seek accretive purchases of service.operators that lack scale and capital, further extending our growth prospects. to be close toauthentic, up-close experiences in the planet's wild, nature,remote places, but at the same time, enjoy a high level of comfort, convenience and safety. High-quality dining is an integral part of our expedition experienceexperiences with influences and flavors that reflect the regions being explored, along with traditional fare. Food prepared aboard is sourced locally whenever practicable from sustainable providers. Seatingproviders and seating is open and the atmosphere is relaxed.with a relaxed atmosphere. Our ships offer a range of services and amenities which allow our guests to travel in comfort. Depending on the ship, these may include a fitness center, a spa offering a variety of treatments, a photo kiosk for photographers to edit and sort photos, 24-hour beverage service, internet connection, laundry facilities and a doctor on call.Competitive StrengthsSales and Marketingmanagementlargest channel for expedition cruise guest bookings is direct contact, either by guests calling and speaking with our expedition specialists or requesting a reservation online at our website. The direct channel represented approximately 39% of expedition cruise guest ticket revenues for 2021 and 2020 and 40% for 2019. believesmeet with hundreds of highly-targeted agents annually, at consortium conferences and training seminars, and in-person at agency offices to provide hands-on training, support and product knowledge.following characteristicsNational Geographic name.business model will enableexpedition cruise bookings, 7% of guest ticket revenues for 2021, 2020 and 2019, comes from affinity groups and charters. Affinity groups are predominantly college and university alumni associations, and other travel organizations targeting specific market niches.successfullyeffectively communicate our product offerings to past guests and prospective guests. We continually optimize our media mix to reach our target demographic. The majority of our annual global marketing spend is focused on consumer-direct channels. Our detailed brochures and websites present our expedition and tour offerings comprehensively, providing guests with all the information needed to make an informed travel decision. We invest significantly in digital media as part of our guest acquisition efforts with particular focus in paid search, social media, content development and programmatic video and display advertising. We also execute direct mail campaigns with the primary purpose of generating qualified leads, upon which we will fulfill requests with the appropriate product brochure and/or digital media.strategy:Lindblad expedition cruise offerings, www.nathab.com for our Natural Habitat nature adventures, www.duvine.com for our DuVine cycling adventures, www.offthebeatenpath.com for our Off the Beaten Path guided travel adventures and www.classicjourneys.com for our handcrafted luxury walking tours. Each website is supported internally by a dynamic content management system, allowing frequent updates, a visually-impactful design, large photos and video display with simple, straightforward navigation. Consumers are directed to key areas on each website through weekly emails, direct mail, social media, PR, and advertising. We also routinely offer webinars to provide greater insights into our expeditions, hosted by members of our expedition teams with intimate knowledge of the geographies featured. In 2021, www.expeditions.com launched a fully redesigned website that fits any device or screen and features enriched design and content to better reflect the expedition experience. This new website will also provide a significant boost in discoverability, driving awareness and lead generation through improved organic search.Expertise and Name RecognitionTrip Pricingleadershipvoyage prices typically include accommodations and expertise today are builtall expedition activities and meals, other than items of a personal nature, such as airfare to and from an expedition, spa treatments and certain other specialized events or activities. Prices vary depending on many factors, including the Lindblad family’s decadesvessel, the destinations on a particular voyage, number of experience inguest berths available, expedition adventure travel. Sven-Olof Lindblad, Presidentlength, cabin category selected and Chief Executive Officertime of year during which the Company, comes fromexpedition takes place. Payment terms generally require an upfront deposit to confirm a rich expedition heritage. The International Association of Antarctica Tour Operators, which was established in 1991, believes thatreservation with the concept of expedition cruising, coupled with education as a major theme, began when Lars-Eric Lindblad, Sven-Olof Lindblad’s father, led the first traveler’s expeditionbalance due prior to Antarctica in 1966. Lars-Eric Lindblad has also been recognized byThe New York Times,Travel + LeisureMagazine and other publications for his vision and leadership in developing what is today known as expedition travel. Believing that educated people who saw things with their own eyes would be a potent force for the preservation of the places they visited, Lars-Eric Lindblad worked to promote conservation and restoration projects worldwide. Sven-Olof Lindblad founded Lindblad in 1979, expanding the legacy of his father by providing expanded marine experiences around the world.departure.5Under Mr. Lindblad’s leadership, we have led innovation in the expedition adventure travel industry. We pioneered expeditions in the High Arctic and Baja California’s Sea of Cortez and created what we view as the most innovative and in-depth expedition program in Alaska. We initiated the use of kayaks for active exploration in the Polar Regions and in the Galápagos, a feature which is now availablefocus on all of our owned vessels to enable personal, water-level encounters with nature. We were also one of the first to develop an undersea exploration program as part of a small ship expedition utilizing state-of-the-art equipment and technology.As a pioneer in the expedition adventure travel sector, we have established deep expertise and knowledge of operating expedition cruises in extreme locations. We have earned awards and honors from various representatives of the travel industry, including recognition for the qualitymaintaining list pricing of our offerings and any discounting that we pursue is tactical, targeted and infrequent. In addition to our supportstandard expedition packages, we may be able to offer a complete vessel for conservationcharter and sustainable tourism. Somemay provide incentives for this type of arrangement. Group and multi-generational family travel may also be eligible for additional incentives based upon the awardsvoyage, duration and number of guests travelling. From time to time, we have earned are as follows:may incentivize guests to book with us with a variety of offers, including free or reduced-price air transportation, hotel nights or other value-added items. We offer rewards to our guests through our loyalty program, Friends for Life, to encourage repeat business.●2017 Travel + Leisure World’s Best: Top Small-ship Ocean Cruise Lines●2017 Andrew Harper Grand Award for Best Cruise: Antarctica on National Geographic Explorer ●2017 Andrew Harper Grand Award Staff of the Year: The staff on National Geographic Explorer●2017 Travvy Award: Best Cruise Line - Expedition/Adventure●2017 Travel Age West Wave Awards: Best Expedition Cruise Line (ocean-going)●2017 Recommend Magazine’s Readers’ Choice Awards: Best Cruise Line in Expedition Cruises, Silver Award●Conde Nast Traveler 2017 Readers Choice Awards: Top Small Ship Cruise Lines ●2017 Porthole Cruise Readers’ Choice Awards: Best Expedition Cruise Line●2017 Town & Country Travel Cruise Awards: Best Active Itineraries●2017 Cruise Critic Editors’ Picks Award: Best for Adventure ●Afar Magazine’s Travelers’ Choice Cruise Awards: Best Expedition Cruise Lines●USA Today’s 10Best.com Readers’ Choice Awards - Best Adventure Cruise Lines When customers select an expedition provider for the typesCompelling Expedition OfferingsOur brand is known for delivering voyages that offer in-depth exploration opportunities in locations around the world. Expeditions are operated on intimately-scaled ships with capacities ranging between 28 and 148 guests, fostering a friendly atmosphere on board and extensive interaction between guests, crew and the teams of world-class scientists, naturalists, researchers and photographers that participate in the expeditions. The vessels are nimble and can access locations that are unattainable for large cruise ships, allowing for in-depth exploration itineraries and viewpoints. The ships are customized to provide our signature adventure experiences and activities, such as kayaking among Antarctic icebergs to view penguins or traveling on a Zodiac for an up-close encounter with a whale.We are continuously focused on maintaining and elevating the guest experience and identifying new opportunities to help people discover the wonders of the world. We believe that our expedition offerings and our track record of innovation represent significant competitive advantages for us.Strong Financial ProfileSeasonalitybusiness model allows usdrydock schedules are subject to generate consistent free cash flow with high revenue visibility. Our guests plancost and book their expeditionstiming differences from year to year due to the availability of shipyards for certain work, drydock locations based on average nine monthsship itineraries, operating conditions experienced especially in advance, with a deposit due upon booking, providing us insight into future revenuethe polar regions and a sourcethe applicable regulations of cash flow. Based on our product offerings, we are able to support premium pricing with minimal discountingvessel classification societies in the maritime industry, which require more extensive reviews periodically. Drydocking impacts operating results by reducing tour revenues and benefit from low requirements for maintenance capital expenditures, minimal working capital needs and favorable tax attributes.increasing cost of tours.We also have a strong cash position, providing usNatural Habitat, DuVine, Off the Beaten Path and Classic Journeys brands are seasonal businesses, with ample financial flexibility to pursue growth opportunities through investment in new vessels, new charters, tactical land-based products or potential acquisitionsthe majority of ships or other operators, while still maintaining a prudent capital structure.6Significant Growth OpportunitiesWe believe affluent Americans view their retirement as “a time to travel and explore new places,” favoring travel experiences such as expedition cruising. This has led to strong growthNatural Habitat’s tour revenue recorded in the specialty cruise segmentthird and we believe these trends will continue. We plan to expandfourth quarters from its summer season departures and polar bear tours, while the numbermajority of ships in our fleet, including chartered vessels overOff the next three years. This includes two contracted vessels, a new coastal vesselBeaten Path, DuVine and a new polar ice class vessel. The expected deliveries ofClassic Journeys’ revenues are recorded during the first two vessels are scheduled for the fourth quarter of 2018second and first quarter of 2020, respectively. Additionally, we believe that our platform is well positioned to opportunistically seek accretive purchases of operators that lack scalethird quarters from their spring and capital, further extending our growth prospects.summer departures. Society, one of the world’s leading proponents of eco-tourism and natural history. The strategic alliance, which began in 2004, is built on our shared interest in education, exploration, research, storytelling, technology and conservation. Founded in 1888, the National Geographic Society is one of the largest non-profit scientific and educational institutions in the world with interests ranging from geography, archaeology and natural science, to the promotion of environmental and historical conservation. Working to inspire, illuminate and teach, National Geographic reaches more than 600 millionhundreds of millions of people a montharound the world through a wide range of media, including print, TV, digital and digital.social media platforms. The National Geographic name has significant value for use in connection with travel-related goods and services. The Lindblad/National Geographic alliance includes a co-selling and co-marketing arrangement through which National Geographic promotes our offerings in its marketing campaigns across web-based, email, print and other marketing platforms and sells our expeditions through its internal travel division. The National Geographic sales channel represented approximately 25% of our guest ticket revenues for the year ended December 31, 2017. We believe that the alliance with National Geographic provides us with a substantial competitive advantage in the expedition market based on the brand enhancement, expanded marketing reach and the relationship with National Geographic’s experts, including photographers, writers, marine biologists, naturalists, field researchers and photographers.film crews, join our expeditions. Guests have the ability to interface with these experts through lectures, excursions, dining and other experiences throughout their expedition. alsoand current Co-Chairperson of our board of directors, currently serves on the board of the Lindblad Expeditions–National Geographic Joint Fund for Exploration and Conservation and previously served on the National Geographic Society’s International Council of Advisors, which iswas composed of individuals identified by the National Geographic Society as visionary leaders from a range of professions and industries across the globe that exemplify the intellectual curiosity and quest for adventure that has driven the National Geographic Society’s mission since 1888. Mr. John M. Fahey, Jr., one of our board of directors, previously served as the Chairman and Chief Executive Officer of the National Geographic Society.Natural Habitat, Inc.Partnership with World Wildlife FundOn May 4, 2016, we acquired an 80.1% ownership interest in Natural Habitat, an adventure travel, land-based, ecotourism company located in Colorado. Natural Habitat offers over 80 different itineraries in more than 30 countries spanning seven continents. Natural Habitat focuses on small groups led by award-winning naturalists to achieve close-up wildlife and nature experiences. Examples of expeditions offered by Natural Habitat include safaris in Botswana, grizzly bear adventures in Alaska and polar bear tours in Canada and many of Natural Habitat’s expeditions feature access to private wildlife reserves, remote corners of national parks and distinctive lodges and camps for the best wildlife viewing. The smallest expeditions average between eight to nine guests with itineraries running from six to 25 days, with an average of 10 days.World Wildlife Fund (“WWF”),the WWF, since 2003, to promote sustainable conservation travel that directly promotes and protects nature. WWF is one of the world’s leading conservation groups with over six million members globally. Natural Habitat’s exclusive license agreement with WWF allows Natural Habitat to use the WWF name, logo and logoselect mailing list through 2023 in return for a royalty fee.Industry and MarketWe believe the specialty and small ship cruising segment of the cruise industry demonstrates the following positive fundamentals:7Strong Growth in Specialty and Small Ship Cruising SegmentThe specialty and small ship cruising segment of the cruise industry is characterized by the smallest vessel size, unique itineraries, active adventures, gourmet culinary programs, highly personalized service and a more inclusive offering. These exclusive attributes, combined with a growing worldwide target population, provide specialty and small ship cruising operators with significant pricing leverage as compared to the other segments of the cruise industry.The specialty cruise segment has demonstrated strong growth as consumers increasingly prefer experiences over other forms of discretionary spending. According to Cruise Lines International Association (“CLIA”), specialty cruises grew by 21% annually from 2009 to 2014. In a December 2016 survey of CLIA-member travel agents, 75% expected increased bookings in 2017 from the prior year, with 33% of the agents anticipating growth of 10% or greater. Despite this consistent growth, we believe the specialty cruise industry still has low penetration levels compared to similar land-based vacations, which we believe highlights the continued growth potential for the specialty cruise market.Attractive Target Market DemographicsOur offerings appeal to a wide range of travelers, both individuals and families, but affluent individuals in the U.S. aged 50 years or older represent our largest demographic category. We believe that our small ship expedition offerings, with itineraries that promote up-close encounters with wildlife, nature and culture, have significant appeal to this target market. These individuals are also generally near-retirement or retired and have the leisure time and disposable income available to pursue the type of activities that we provide. Based on the U.S. Census Bureau’s 2015 National Projections, the age group of 50 years and older numbered approximately 111 million individuals in 2015, or approximately 35% of the U.S. population, and is expected to grow to approximately 120 million in 2020, an increase of approximately 8%.High Barriers to EntryThe adventure travel and specialty cruise industries in which we operate are characterized by high barriers to entry, which include the expertise and experience required to operate safely and effectively in remote locations, the existence of well-established and trusted brands, the time and personal relationships required to develop strong networks of experts to lead and support expeditions, the cost and time required to build the strong travel agent network partnerships necessary for success, local permits or licenses required to operate in a diverse range of geographies, large capital expenditures and operational insight required to build new and sophisticated ships suited for such specialized activities.CompetitionWe compete with a number of cruise lines with competition varying by destination. The market is fragmented and primarily comprised of private operators. The primary competitors that operate in the geographic regions we serve include Silversea Expeditions, Quark Expeditions, Compagnie du Ponant, Hurtigruten and Un-Cruise Adventures. For our land-based expeditions, we compete with a variety of companies offering itineraries in the countries in which we operate. These range from small private operators to larger companies operating across multiple countries. Some of our larger competitors include Abercrombie & Kent, Overseas Adventure Travel and GeoEx. We also compete with other vacation alternatives such as land-based resort hotels and sightseeing destinations for guests’ leisure time. Companies within the vacation market are dependent on consumer discretionary spending.The cruise industry in general and the expedition cruise industry specifically are characterized by high barriers to entry, including the existence of several established and recognizable brands, the large investment required to build a new, sophisticated ship, the long lead time necessary to construct new ships and limited newbuild shipyard capacity.governingguiding principle throughout the organization is to ensure that everything adds value to the guest experience. This applies to every step of the process from the first engagement with a potential guest, through the booking process and travel preparations, the actual expedition, trip or adventure, whether onboard thea vessel or off on explorations and tours, and once back at home.ThisOn our ships this could include an opportunity for the guest to watch a killer whale circling a seal on an ice floe, while standing next to a marine biologist and an experienced nature photographer from National Geographic. On our land experiences this could include an immersive viewing of polar bears preparing to hunt on the ice under the guide of an expert naturalist.8notice,lead time, we generally begin to market our voyagesexpeditions approximately 12 to 24 months in advance of the departure date, depending on the destination.date. Guests book their trips, on average, nine months prior to sailtravel date for our Lindblad expeditions and seven months prior to travel for our land experiences, paying a deposit at booking, providing us significant visibility into future revenue and the finala source of cash flow. Final payment is due 60 to 120 days withinprior to the date of travel, dependent upon the selected voyage. As of February 26, 2018, 90% of the Lindblad segment’s expected guest ticket revenues for 2018 has been booked. expedition.offering isofferings are inclusive of most costs and therefore the advance customer payments provide us strong visibility into future revenues and the associated cash flows. By having such visibility into future business, we can more effectively manage any additional sales and marketing efforts that may be required voyage enhancements that add significant value to the product without significant incremental cost, as well as targeted marketing efforts in order to strengthen occupancy rates, if required. Based on our offerings, the targeted audience and premium pricing, our guests are generally older, more affluent and do not travel with three or four individuals in one cabin. As it is cruise industry convention to base 100% occupancy on two persons per cabin, wethe Lindblad segment may report occupancy levels that are somewhat lower than the large cruise lines serving the broader market.market, where three or more occupants per cabin is not uncommon. However, we have historically achieved strong occupancy rates for the Lindblad segment in the last three years (based on two persons per cabin),including operating at above 87% occupancy rate81%, 89% and 91% occupancies for the years ended December 31, 2017, 20162021, 2020 and 2015.2019, respectively. The occupancy rates for 2021 and 2020 have been skewed by the effects of the COVID-19 pandemic.NetIn the cruise industry, net yield per available guest night is a frequently referenced metric in the cruise industry and refers to tour revenues net of commissions and certain direct costs in a specific period divided by the number of available guest nights. Our net yields areyield per available guest night is driven by our offerings, premium pricing and ancillary guest revenue, such as pre- or post-voyage trip extensions, add-on optional activities, trip insurance and onboard spend, including spa servicesspend. At the Lindblad segment, net yield per available guest night was $879, $1,048 and alcoholic beverages.$1,051 in 2021, 2020, and 2019, respectively. The net yield per available guest night for 2021 and 2020 have been skewed by the effects of the COVID-19 pandemic. Our net yields were $985, $976 and $971 in 2017, 2016 and 2015, respectively. Furthermore, our historical net yield has beenper available guest night is significantly higher than the large scalelarge-scale cruise line operators. Weoperators and we expect to be able to continue our track record of maintaining strong pricing and growing ancillary guest revenues through increased sales focus and marketing efforts, particularly of pre- and post-voyage extensions on which we have not historically placed significant emphasis.efforts.OurThe Lindblad brand is recognizable by our guests primarily due to our heritage, decades of sales and marketing investment and longstanding strategic alliance with National Geographic. We believe we have fostered strong guest and brand loyalty, whichas is evidenced by our high levels of repeat guests. In 2017, 41%Historically, approximately 40% of Lindblad guests booked through our U.S. office werehave been past guests. We have closely aligned our Lindblad marketing efforts with National Geographic to maximize impact in the marketplace and have engaged in a co-branding strategy with respect to our owned vessels. In addition, we are recognized as a leader in promoting the issue of conservation of the planet and encourage our guests to become engaged through the Lindblad Expeditions – National Geographic Joint Fund for Exploration and Conservation (“LEX-NG Fund”).Fund. In the past, we have organized high-level meetings in the Arctic, Antarctic, the Galápagos Islands and Baja California to put a spotlight on key environmental issues in conjunction with organizations such as the Aspen Institute, TED and the WWF. These efforts help to build our brand and network of relationships and enhance our thought leadership. We will continue to focus on ensuring that each of our guests associates our brand with high-quality marine based adventure vacation experiences.source our business through a combination of direct selling, travel agency networks and our strategic alliance with National Geographic. We invest in maintaining strong relationships with our key travel agency network partners and seek to maintain commission rates and incentive structures that are competitive within the marketplace.The National Geographic relationship also serves as a channel for bookings. Our alliance with National Geographic includes a co-selling and co-marketing arrangement through which National Geographic promotes our offerings in its marketing campaigns across web-based, email, print and other marketing platforms and sells our expeditions through its internal travel divisions. The National Geographic channel represented approximately 25%, 27% and 24% of guest ticket revenues for 2017, 2016 and 2015, respectively.9We maintain an active presence on numerous social media platforms, focusing primarily on those with the greatest reach to our target demographic. In addition,Developing our brand and growing our digital audience has been a point of emphasis and we routinely feed content to National Geographic’shave dramatically increased social followers, as well as engagement and impressions. Our increased efforts around digital marketing and social media platforms, which extend the reach of our brand significantly.have also resulted in significant earned media from brands, influencers and industry partners. We currentlyvessel under construction scheduled for deliveryvessels, the National Geographic Venture in 2018 and the National Geographic Quest in 2017, nearly tripling the capacity of our US-flagged fleet.new polar ice class vessel under construction scheduledland-based travel operator specializing in authentic national park experiences, DuVine, an international luxury cycling and adventure company focused on exceptional food and wine experiences, and Classic Journeys, a leading luxury walking tour company that offers highly curated active small-group and private custom journeys. Similar to the Company’s acquisition of Natural Habitat in 2016, these businesses are strong compliments to our existing product offerings, and we will leverage our experience and resources to accelerate their growth and capitalize on the growing demand for delivery in 2020. We also have options for two additional polar ice class vessels. authentic and immersive adventure travel. ample capital andthe financial flexibility to fund this investmentpursue additional growth opportunities subject to, among other factors, our ability to identify attractive business opportunities and management considers it to be an important stepnegotiate favorable terms for such opportunities. Additionally, we believe that our platform is well positioned to meet increasing demand foropportunistically seek accretive purchases of operators that lack scale and capital, further extending our offerings.and products that our guests value. We use communication strategies and marketing campaigns designed to strengthen brand awareness and to emphasize the distinctive qualities of each expeditionexperience we offer. Marketing strategies include the use of direct marketing, mail traditionaland email; digital media, including search, social media and programmatic ad buying; traditional media; brand websiteswebsites; and travel agencies.agencies and other strategic third-party distribution partners.focus hasguests have been to primarily source guests for our expeditions from the United States. Expedition cruise guests sourced from the U.S. represented approximately 90%, 89% and 85%98% of our total global expedition cruise guests’ ticket revenue in 2017, 20162021 and 2015, respectively.91% in 2020 and 2019. our toll-free number(1-800-EXPEDITION) and speaking with our expedition specialists or requesting a reservation online at our website, expeditions.com.website. The direct channel represented nearly 41%,approximately 39% and 43% of expedition cruise guest ticket revenues for 2017, 20162021 and 2015, respectively.2020 and 40% for 2019. 27%26% of expedition cruise guest ticket revenue for the year ended 2017 and 27%2021, 30% for the yearsyear ended 20162020 and 2015.29% for the year ended 2019. Agent outreachbookings.bookings for our expedition cruise business. Our alliance with National Geographic includes a co-selling and co-marketing arrangement through which National Geographic promotes our expedition cruise offerings in its marketing campaigns across web-based, email, print and other marketing platforms and sells our expeditions through its internal travel division. The National Geographic channel represented approximately 25%, 27% and 24%28% of expedition cruise guest ticket revenues for 2017, 20162021, and 2015, respectively.24% for 2020 and 2019. As part of this relationship, our owned vessels carry the National Geographic name.6%, 7% and 5% of guest ticket revenues for 2017, 20162021, 2020 and 2015, respectively,2019, comes from affinity groups and charters. Affinity groups are predominantly college and university alumni associations, and other travel organizations targeting specific market niches.channels, with direct mail being the largest segment of our marketing expenditures.channels. Our detailed brochures and websites present our expedition and tour offerings comprehensively, providing guests with all the information needed to make an informed travel decision. We invest significantly in digital media as part of our guest acquisition efforts with particular focus in paid search, social media, content development and programmatic video and display advertising. We also execute direct mail campaigns with the primary purpose of generating qualified leads, upon which we will fulfill requests with the appropriate product brochure and/or digital media. We also promote our expeditions across a variety of print media, primarily magazines targeting affluent travelers, as well as nature and photography enthusiasts.10OurWe operate several websites, www.expeditions.com for our Lindblad expedition cruise offerings, www.nathab.com for our Natural Habitat nature adventures, www.duvine.com for our DuVine cycling adventures, www.offthebeatenpath.com for our Off the Beaten Path guided travel adventures and www.classicjourneys.com for our handcrafted luxury walking tours. Each website www.expeditions.com, is supported internally by a dynamic content management system, allowing frequent updates, a visually-impactful design, large photos and video display with simple, straightforward navigation. We also send weekly mobile-optimized emails to our database of opt-in email subscribers, which link backConsumers are directed to key areas on expeditions.com. In addition, weeach website through weekly emails, direct mail, social media, PR, and advertising. We also routinely offer webinars to offerprovide greater insights into our expeditions, hosted by members of theour expedition teamsteams with intimate knowledge of the geographies featured.We maintain an active presence on numerous social media platforms, focusing primarily on those with the greatest reach to our target demographic. In addition, we routinely feed2021, www.expeditions.com launched a fully redesigned website that fits any device or screen and features enriched design and content to National Geographic’s social media platforms, which extendbetter reflect the reach of our brand significantly.expedition experience. This new website will also provide a significant boost in discoverability, driving awareness and lead generation through improved organic search.Expedition CruiseTrip Pricingreduced pricereduced-price air transportation, hotel nights or other value-added items. We offer rewards to our guests through our loyalty program,Friends for Life, to encourage repeat business.Lindblad Expeditions – National Geographic Joint Fund for ExplorationOur land-based travel prices typically include accommodations, transportation while on tour, gear specific to the tour and Conservationmost activities and meals, other than items of a personal nature, such as airfare to and from the tour and certain other specialized events or activities. Prices vary depending on many factors, including the destination, activities included, tour length and time of year during which the trip takes place. Payment terms generally require an upfront deposit to confirm a reservation with the balance due prior to departure. We seek to inspire people to explore and care about the planet. OneEnvironmental StewardshipOur staff is involved in organizations such as the International Association of Antarctic Tour Operators and the Association of Arctic Expedition Cruise Operators, which seek to lead the tourism industry with management best practices for visiting places such as Antarctica, the Arctic and the Galápagos Islands. Our staff also works with the MarViva Foundation (a non-governmental organization focused on promoting the conservation and sustainable use of coastal and marine ecosystems in the eastern tropical Pacific) to provide a consumer market for sustainably caught fish from the first designated responsible fishing area of Costa Rica. We also work with the Charles Darwin Research Station and Charles Darwin Foundation on conservation initiatives geared toward preserving the Galápagos Islands.OurLindblad tour revenues from the sale of guest tickets are mildly seasonal, historically larger in the first and third quarters. The seasonality of our operating results fluctuates due to our vessels being taken out of service for scheduled maintenance or drydocking, which is typically during nonpeak demand periods, in the second and fourth quarters. Our drydock schedules are subject to cost and timing differences from year to year due to the availability of shipyards for certain work, drydock locations based on ship itineraries, operating conditions experienced especially in the polar regions and the applicable regulations of classvessel classification societies in the maritime industry, which require more extensive reviews periodically. Drydocking impacts operating results by reducing tour revenues and increasing cost of tours.is aDuVine, Off the Beaten Path and Classic Journeys brands are seasonal business,businesses, with the majority of itsNatural Habitat’s tour revenue recorded in the third and fourth quarterquarters from its summer season departures and polar bear tours.tours, while the majority of Off the Beaten Path, DuVine and Classic Journeys’ revenues are recorded during the second and third quarters from their spring and summer departures.maintenance.capital improvements. Our largest operating expenditures are for ship maintenance, payroll, fuel, food and beverage, travel agent services and advertising and marketing. Most of the supplies that we require are available from numerous sources at competitive prices.coverage includes coverage for physical damage to the ship, which is not covered under the hull policies as a result of war exclusion clauses in such hull policies. We also maintain protection and indemnity war risk coverage. Consistent with most marine war risk policies, under the terms of the war risk insurance coverage, underwriters can give notice that the policy will be canceled and reinstated at higher premium rates. We also maintain insurance coverage for shoreside property, shipboard inventory and marine and non-marine general liability risks, as well as business interruption insurance for our owned ships based on the evaluation of the financial exposure per vessel for profitability. In addition, we maintain workersworkers’ compensation, directors’ and officers’ liability and other insurance coverage.historicallybelieve the specialty and small ship cruising segment of the cruise industry demonstrates the following positive fundamentals:ablea leader in sustainable, responsible travel for more than 50 years, through raising awareness, adopting green business practices, protecting nature, preserving culture, supporting local communities and artisans and practicing sustainability throughout every level of its operations, from ships to obtain insurance coverageoffices. In addition, we are committed to company-wide diversity, equity and inclusion initiatives, including recruitment, hiring and mandatory training for all employees.amountsorganizations such as the International Association of Antarctic Tour Operators and at premiumsthe Association of Arctic Expedition Cruise Operators, which seek to lead the tourism industry with management best practices for visiting places such as Antarctica, the Arctic and the Galápagos Islands. We also work with the Charles Darwin Research Station and Charles Darwin Foundation on conservation initiatives geared toward preserving the Galápagos Islands.deemedbeen a carbon neutral company since 2019. To offset the carbon footprint of our business (including fleet operations; expedition operations; staff and crew travel; waste; and other small but measurable sources of emissions), we work with South Pole, Inc., the world's leading developer of international emission reduction projects. We fund projects to be commercially acceptable. No assurance can be given that affordableutilize technologies including solar, wind, geothermal and secure insurance markets will be availablehydropower to mitigate, sequester or remove carbon from the atmosphere, which are certified under one of the industry-recognized standards; (i) Verified Carbon Standard, (ii) Gold Standard VER or (iii) Certified Emission Reduction. Our 2021 projects included a geothermal project in Indonesia, wind power projects New Caledonia and Columbia, a solar project in India, and a Hydropower project in Vietnam. All projects in our portfolio support the UN's established Sustainable Development Goals.future, particularlyGalápagos Islands committed to ocean conservation and sustainable, transparent practices minimizing negative impact on the ocean density, ocean floor and the by-catch of non-targeted species, and (iii) a company in Baja California, Mexico that works to foster a market for war risk insurance. Allenvironmentally sustainable and socially responsible seafood by working with local fisher cooperatives, promoting good fishing management and sustainability of Mexico’s marine ecosystem.insurancecommitment to environmentally friendly travel, we began a relationship with World Wildlife Fund in 2003 as their conservation travel provider. We have provided more than $4.5 million in support of WWF’s mission to conserve nature and reduce the most pressing threats to the diversity of life on Earth. And our travelers have donated an additional $13.5 million in support of WWF priorities in some of the most precious yet imperiled places on the planet. This innovative partnership benefits our travelers, our company, and the planet as we work together to change the way people think about travel.is subject401(k) retirement savings and travel opportunities on our expeditions for free or at reduced cost. certain limitations, exclusionsseasonality, expedition itineraries and deductible levels.the number of vessels in operation. We try to manage our attrition, approving the replacement of key positions that we believe are critical to sustaining improved business performance and guest satisfaction. We also analyze departure data so we can continually improve upon the employee experience. Our talent management and succession plan process includes the identification of key positions based on current and future business strategies and the identification of potential successors.In addition, certainOur owned ships are registered in the U.S., the Bahamas or Ecuador, as applicable. These countries are signatories to the International Maritime Organization safety, security and environmental instruments and policy. Each ship is subject to regulations issued by its country of registry, including regulations issued pursuant to international treaties governing the safety of the ships, guests and crew as well as environmental protection. Each country of registry conducts periodic inspections to verify compliance with these regulations. Ships operating out of U.S. ports are subject to inspection by the U.S. Coast Guard for compliance with international treaties and U.S. maritime regulations and by the United States Public Health Service and the Centers for Disease Control and Prevention for sanitary and health conditions. Ships are also subject to similar inspections pursuant to the laws and regulations of various other countries visited. We consider ourselves to be in material compliance with all the regulations applicable to our ships and that we have all licenses necessary to conduct our business. Health, safety, security, environmental and financial responsibility issues are, and will continue to be, an area of focus by the relevant government authorities in the U.S. and internationally.proposedadopted that could impact operations and subject us to increasing compliance costs in the future.future including potential new guidelines and requirements addressing COVID-19 precautions.12defined in the International Convention for Safety of Life at Sea (“SOLAS”),established by SOLAS, which, among other things, establishes requirements for ship design, structural features, materials, construction, life-saving equipment and safe management, and operation of ships to ensure guest and crew safety. The SOLAS standards are revised from time to time and the most recent modifications were phased in through 2010.our vessels are compliant with applicable SOLAS requirements. SOLAS incorporates the International Safety Management Code (“ISM Code”), which provides an international standard for the safe management and operation of ships and for pollution prevention. The ISM Code is mandatory for all vessels, including passenger vessel operators. All of our operations and ships are regularly audited by various national authorities and maintain the required certificates of compliance with the ISM Code.The Cruise Vessel Security and Safety Act of 2010, which applies to passenger vessels that embark passengers from or include port stops within the U.S., requires the implementation of certain safety design features as well the establishment of practices for the reporting of and dealing with allegations of crime.arewere previously subject to a limit of 3.5%, which is expected to bewas reduced to not more than 0.5% m/m on and after January 1, 2020 (or January 1, 2025 if the International Maritime Organization elects to defer the new cap of sulfur content following a review of the availability of low sulfur fuel for use by ships).2020. In June 2013, the European Commission proposed legislation which would require cruise ship operators using ports in the European Union to monitor and report on the vessels’ annual carbon dioxide emissions starting in 2018.Jones ActCoastwise Laws AsOur U.S. flag vessels, theNational Geographic Sea Bird, theNational Geographic Sea Lionand, theNational Geographic Quest and the National Geographic Venture, are subject to the U.S. laws relating to the transport of passengers or cargo between U.S. ports in the U.S. coastwise trade. Our newbuild coastal vessel, theNational Geographic Venture, currently under construction, will also be U.S. flagged.Chapter 551 and 46 U.S.C. §50501§55103 and the federal regulations promulgated thereunder and are commonly referred to collectively as the “Jones Act.“Coastwise Laws.” Subject to limited exceptions, vessels transporting passengers between ports of places in the Jones Act requires, among other things, that vessels engaged in U.S. coastwise tradeUnited States, whether directly or by the way of foreign port, must be “coastwise qualified”. To be qualified, a vessel must be owned and operated by “citizens of the United States” within the meaning of the Jones Act. For purposesgoverning laws and regulations. In the case of the Jones Act, a corporation, for example, must satisfy at least the following requirements to be deemed a U.S. citizen:corporation: (i) the corporation must be organized under the laws of the U.S. or of a state, territory or possession thereof; (ii) each of the chief executive officer and the chairman of the board of directors of such corporation, and each person authorized to act in the absence or disability of such persons, must be a U.S. citizen; (iii) no more than a minority of the number of directors of such corporation necessary to constitute a quorum for the transaction of business can be non-U.S. citizens; and (iv) at least 75% of each class or series of stock in such corporation must be beneficially owned by U.S. citizens within the meaning of the Jones Act.citizens.13operationU.S. embarking expeditions of theNational Geographic Sea Bird,National Geographic Sea Lion and, National Geographic Quest,National Geographic Venture, National Geographic Orion and the National Geographic Endurance through an escrow account for passenger deposits and through our liability insurers.Certain jurisdictions require that we establish financial responsibility to our guests resulting from the non-performance of our obligations; however, the related amounts do not have a material effect on our costs.theNational Geographic Sea Lionand the, National Geographic Quest and the National Geographic Venture are subject to the Americans with Disabilities Act (ADA), which creates affirmative requirements intended to facilitate access by disabled persons. The ADA requires that our U.S. flagged vessels make “reasonable accommodation” in their policies, practices and procedures to facilitate the carriage of passengers with disabilities.EmployeesLocal RegulationsAsOur ability to follow our planned itinerary for any expedition cruise may be affected by a number of December 31, 2017, we had approximately 528 employees,factors, including 312 shipboard employees, 213 full-time employeeslocal government regulations and three part-time employees in our shoreside operations.restrictions and other restrictions on access, including access to protected or preserved areas, including national parks. 9th9th Floor, New York, New York 10014. Our telephone number is (212) 261-9000. Our Internet addresswebsite iswww.expeditions.com. Our corporateAll of our filings includingwith the Securities and Exchange Commission, can be accessed free of charge through our website promptly after filing; however, in the event the website is inaccessible, we will provide paper copies of our most recent Annual Report on Form 10-K, ourthe most recent Quarterly ReportsReport on Form 10-Q, our Current Reportscurrent reports filed or furnished on Form 8-K, our Proxy Statements and reports filed by our officers and directors under Section 16(a) of the Securities Exchange Act, and anyall related amendments to those filings, are available,excluding exhibits, free of charge, upon request. These filings are also accessible on our website after we file such material with the Securities and Exchange Commission.Commission's website at www.sec.gov. We do not intend for information contained on our website to be a part of this Annual Report on Form 10-K.10-K and such information is not incorporated by reference herein.weather conditions andterrorist attacks, war, travel restrictions, pandemics or other natural disasters or disruptions could affect our reputation as well as have a negative impact on our sales and results of operations.IncreasesAdditionally, substantial changes to historical weather patterns, whether caused by climate change or other factors, including changing temperature levels, changing rainfall patterns and changing storm patterns and intensities, could significantly impact our future business. Substantial changes to historical weather patterns could result in significant negative changes to the delicate regions that our expeditions venture, such as rising temperatures in the frequency, severityArctic region that could accelerate the melting of the polar ice cap or durationchanges to the historical weather patterns in delicate areas such as the Galápagos Islands that impacts its ecosystem and, therefore, potentially impact the viability of severe weather events, including those related to climate change, could exacerbate the impact and cause further disruption tovarious expeditions, such as our operations. polar bear tours. or revitalization delays or mechanical issues on existing vessels may result in cancellation of expeditions or unscheduled drydockings and repairs and thus adversely affect our results of operations.or revitalization or mechanical failures have in the past and may in the future result in delays or cancellations of expeditions and unscheduled drydocks and repairs of ships. If there is a15 in building new vessels (includingor the failure to deliver new vessels)financial difficulties of the shipyards could harmhave a negative impact on us.BuildingWe are currently in the process of modifying a vessel and may need to drydock vessels in the future for repairs or modifications. Additionally, although we have no new vessels isbuilds currently in construction, we may in the future. Vessel building, modification and repairs are subject to risks of delay or cost overruns caused by conditions beyond our control including, but not limited to, one or more of the following: changes to design specifications;● ● ● lack of shipyard availability; ●work stoppages; and●SignificantAny significant delays, cost overruns andor failure to timely deliver a new vessel or complete modifications or repairs on existing vessels we have committed to service our guests could adversely affect us in several ways, including delaying the implementation of our business strategies, materially increasing our cost of servicing our commitments to our guests or resulting in the cancellation of scheduled expeditions.expeditions, which have occurred in the past. In addition, there are a limited number of shipyards with the capability and capacity to build, modify or repair our new ships and, accordingly, increased demand for available new constructionshipyard slots could impact our ability to construct, newmodify or repair ships when and as planned and/or result in stronger bargaining power on the part of the shipyards. We are also at risk of a shipyard experiencing financial difficulty during the process of a new-build or vessel modification or repair, which would subject us to the risk of a shipyard ceasing operations or filing for bankruptcy before delivering a vessel to us, which could substantially delay any delivery of the vessel to us and could have a material adverse impact on our business.fleet.fleet and we may not be able to obtain sufficient financing or capital on favorable terms or at all.drydockingdry docking a vessel or modifying an existing vessel or acquiring a new vessel. These expenditures could increase as a result of changes in the cost of labor and materials; customer requirements; increases in our fleet size or the cost of replacement vessels; governmental regulations and maritime self-regulatory organization standards relating to safety, security or the environment; and competitive standards. In addition, maintenance capital expenditures will vary from quarter to quarter based on the number of vessels drydocked during that quarter. Significant unexpected maintenance capital expenditures could have an adverse impact on our operations.are currently makingalso continue to make substantial capital expenditures to increase the size of our fleet by constructing newor modifying vessels and may acquire existing vessels from other parties in the future. Shipyards generally require us to make installment payments on any new ship buildmajor order prior to delivery, which requires us to obtain financing or expend a significant amount of our own money to build a new vessel or modify an existing vessel without any corresponding revenue for an extended period of time. In addition, we may not receive the expected demand for our newly constructed or acquired vessels, which could have an adverse impact on our operations. further growth in capacity from these new ships and future orders, without an increase in the cruise industry’s share of the vacation market, could depress expedition prices and impede our ability to achieve yield improvement.maintain high yields. In addition, to the extent that we or our competitors deploy ships to a particular itinerary and the resulting capacity in that region exceeds the demand, we may consider pricing adjustments or redeploy to other regions, either of which may result in lower than anticipated profitability. We expect our competition in the specialty cruise business to increase in future years as established and newer operators in the expedition market are forecasted to launch numerous vessels into the market over the next two years, either as expansion or vessel replacements. Any of the foregoing could have an adverse impact on our results of operations, cash flows and financial condition.Fears of terrorist and pirate attacks, war and other hostilities, travel restrictions and the spread of contagious diseases could have a negative impact on our results of operations.Events such as terrorist and pirate attacks, war and other hostilities and the resulting political instability, travel restrictions, such as travel bans to and from certain geographical areas and heightened regulations around customs and border control, the spread of contagious diseases, such as the Zika virus, and other related concerns over the safety, health and security aspects of traveling, or the fear of any of the foregoing, have had, and could have in the future, a significant adverse impact on demand and pricing in the travel and vacation industry. In view of our global operations, we are susceptible to a wide range of adverse events, which could decrease demand and adversely affect our business.16expedition cruisingadventure travel is one of many alternatives for people choosing a vacation. We therefore risk losing business not only to other cruise lines, but also to other vacation operators who provide other leisure options, including hotels, resorts and package holidays and tours.agentadvisors preference and also in terms of the nature of ships and services we offer to guests. Our competition within the expedition and cruise vacation industries depends on the destination and is fragmented and primarily comprised of private operators. Currently, we do not directly compete with large cruise vessels. However, in the event large cruise operators further expand into offering smaller sized vessels to compete directly with us and our itineraries, we would have increased competition and could face pricing pressures by such competitors through discounts or otherwise that would likely negatively impact our profitability.orand regulations, imposition of trade barriers, and restrictions on repatriation of earnings. If we are unable to address these risks adequately, our financial position and results of operations could be adversely affected, including potentially impairing the value of our ships, goodwill and other assets.as well aswith applicable laws and regulations. However, we might not be successful in ensuring that our employees, agents, representatives and other third parties with whom we associate throughout the world properly adhere to them.these laws and regulations.While our historical focus has been to serve guests from the North American expedition cruise market, we may expand our focus to include other global markets. Expansion into new markets requires significant levels of investment. There can be no assurance that any new markets will develop as anticipated or that we will have success in any new markets, and if we do not, we may be unable to recover our investment, which could adversely impact our business, financial condition and results of operations, including potentially impairing the value of our goodwill.offered bythat we may offer in connection with the redeployment of any of our vessels redeployed will attract a number of guests comparable to previous expeditions. If redeployments and new expeditions do not attract as many guests as past expeditions or if there is a delay in finalizing or marketing the new itineraries, our business and operating results may be adversely affected.17We have an on-going partnership with National Geographic and the termination or alterations in this relationship may have an adverse effect on our business.The National Geographic Society is one of the largest non-profit scientific and educational institutions in the world. Its interests include geography, archaeology and natural science, the promotion of environmental and historical conservation, and the study of world culture and history. In furtherance of similar interests and goals, we have entered into a Tour Operator Agreement and an Alliance and License Agreement (collectively, the “NG Agreements”) with National Geographic Partners, LLC.Pursuant to the NG Agreements, our owned vessels contain the phrase “National Geographic” in their names, we have access to certain of National Geographic’s marks and images for advertising purposes and we and our guests have access to National Geographic photographers, naturalists and other experts. National Geographic may in certain instances terminate the Alliance and License Agreement with us, including upon a termination event caused by a change of control in which Sven-Olof Lindblad or his designated successor ceases to hold a senior management role with the company, a termination due to our failure to achieve specified year-over-year revenue growth percentage requirements, a failure to meet the conditions necessary to extend the relationship through 2025 or otherwise. If the NG Agreements are terminated or modified in any material respect, due to any of the reasons set forth above or otherwise, our results of operations may be materially adversely affected.(“WWF”(“WWF”) through our Natural Habitat subsidiary and the termination or alterations in this relationship may have an adverse effect on our Natural Habitat business.World Wildlife FundWWF was terminated or modified in any material respect, our results of operations for the Natural HabitatLand Experiences segment may be materially adversely affected.We may not be able to obtain sufficient financing or capital for our needs or may not be able to do so on terms that are acceptable or consistent with our expectations.Any circumstance or event that leads to a decrease in consumer cruise and land-based travel spending, such as worsening global economic conditions or significant incidents impacting the cruise industry, the expedition cruise industry or the travel industry, could negatively affect our operating cash flows. Although we believe that we have sufficient cash flows from operations and will have sufficient access to capital to fund our operations and obligations as expected, there can be no assurances to that effect. Our ability to access additional funding as and when needed, our ability to timely refinance and/or replace outstanding debt and credit facilities on acceptable terms and our cost of funding will depend upon numerous factors including but not limited to the condition of the financial markets, our financial performance and credit ratings and the performance of our industry in general.Any inability to satisfy any covenants required by existing or future credit facilities could adversely impact our liquidity.Our Restated Credit Agreement contains certain financial covenants and is secured by substantially all of our assets. Any failure to comply with such terms, conditions, and covenants could result in an event of default. Further, if an event of default under a credit facility were to occur, cross default provisions, if any, could cause our other outstanding debt, if any, to be immediately due and payable. Upon such an occurrence, there could be no assurance that we would have sufficient liquidity to repay or the ability to refinance the borrowings under any such credit facilities or settle other outstanding contracts if such amounts were accelerated upon an event of default.TheDue to concern over the risk of climate change or otherwise, the United States and various state and foreign government or regulatory agencies have enacted or are considering new environmental regulations or policies, such as requiring the use of low sulfur fuels, increasing fuel efficiency requirements, further restricting emissions, or other initiatives to limit greenhouse gas emissions thatcompliance with changes in such laws, regulations and obligations could increase costs related to operating and maintaining our cost for fuel, causevessels and require us to incur significant expensesinstall new emission controls, acquire allowances or pay taxes related to purchase and/our greenhouse gas emissions, or develop new equipmentadminister and manage a greenhouse gas emissions program. Revenue generation and strategic growth opportunities could also be adversely impact the cruise vacation industry. Some environmental groups, in particular, have also lobbied for more stringent regulation of cruise ships and have generated negative publicity about the cruise vacation industry and its environmental impact. An increase in fuel prices not only impacts our fuel costs, but also some of our other expenses,affected by compliance with such as crew travel, freight, air travel, and commodity prices.changes.18world, especially in light of several recent incidents involving cruise ships.world. This could result in the enactment of more stringent regulation of cruise ships that could subject us to increasing compliance costs in the future. particularly fuel expenditures, could increase due to market forces, inflation, supply chain disruptions and economic or geopolitical factors beyond our control.Expenditures for fuel represent a significant cost of operating our business. If fuel prices rise significantly in a short period of time, we may be unable to increase fares or other fees sufficiently to offset fully our increased fuel costs. In addition, volatility in fuel prices or disruptions in fuel supplies could have a material adverse effect on our results of operations, financial condition and liquidity. To date, we have not hedged our fuel costs with any fuel derivative instruments. If we decide to enter into such instruments in the future, we will be subject to the risk that the fuel derivatives will not provide adequate protection against significant increases in fuel prices and could in fact result in hedging losses and result in us effectively paying higher than market prices for fuel. other capital expenditure and operating costs, including food, hotel, payroll, fuel, maintenance and repair, airfare, taxes, insurance and security costs, are subject to increases due to market forces, inflation, supply chain disruptions and economic or political conditions or other factors beyond our control. If prices rise significantly in a short period of time, we may be unable to sufficiently increase fares or other fees to fully offset our increased costs. Increases in these capital expenditureexpenditures and operating costs could adversely affect our profitability.agenciesadvisors to sell and market our cruises exposes us to certain risks that, if realized, could adversely impact our business.agenciesadvisors to generate a substantial portion of the bookings for our ships, we must ensure that our commission rates and incentive structures remain competitive. If we fail to offer competitive compensation packages, these agenciesadvisors may be incentivized to sell vacation packages offered by our competitors to our detriment, which could adversely impact our operating results. In addition, the travel agentadvisor industry is sensitive to economic conditions that impact discretionary income. Significant disruptions or contractions in the industry could reduce the number of travel agenciesadvisors available for us to market and sell our expeditions, which could have an adverse impact on our financial condition and results of operations.and our principal shoreside operations are located in Seattle, Washington.Washington, and our subsidiary operation offices are located in Louisville, Colorado, Boseman, Montana, Somerville, Massachusetts, and La Jolla, California. Actual or threatened natural disasters (e.g., hurricanes, earthquakes, tornadoes, fires, and floods), terrorist attacks, or other similar disruptive events in these locations may have a material impact on our business continuity, reputation and results of operations. In addition, substantial or repeated information systems failures, computer viruses or cyber-attacks impacting our shoreside or shipboard operations could adversely impact our business. We do not generally carry business interruption insurance to transfer standard insurable risks for our shoreside operations orand cyber liability for our information systems. As such, anysystems. Any losses or damages incurred by us in excess of our insurance coverage could have an adverse impact on our results of operations.earn revenues, pay expenses, recognize assets and incur liabilities in currencies other than the U.S. dollar, including, among others, the Euro, the Canadian Dollar, the Australian Dollar, the Swedish Krona, and the British Pound. In 2017, 2016 and 2015, we derived approximately 10%, 11% and 15%, respectively, of our guest ticket revenues from guests outside the United States.dollar. Because our consolidated financial statements are presented in U.S. dollars, we must convert revenues, income and expenses as well as assets and liabilities into U.S. dollars at exchange rates in effect during or at the end of each reporting period. Therefore, absent offsetting changes in other foreign currencies, increases or decreases in the value of the U.S. dollar against other major currencies will affect our revenues, net income and the value of balance sheet items denominated in foreign currencies. We use limited financial instruments, such as foreign currency forward contracts and swaps, to mitigate our net balance sheet exposure to currency exchange rate fluctuations. However, there can be no assurances that fluctuations in foreign currency exchange rates, particularly the strengthening of the U.S. dollar against major currencies, would not materially affect our financial results.19in the future have ship construction contracts whichin the future, that are denominated in currencies other than the U.S. dollar. We have entered into, and may enter into in the future, enter into forward contracts and collarand/or options to manage a portion of the currency risk associated with these contracts, and we are or may be exposed to fluctuations in the exchange rates for the portions of the contracts that have not been hedged. Additionally, if a shipyard is unable to perform under such a contract, any foreign currency forward contracts that were entered into to manage the currency risk would need to be terminated. Termination of theseany such contracts could result in a significant loss. (including Sven-Olof Lindblad, in particular) and other employees, and on our ability to recruit and retain high quality personnel. Our management team is comprised of individuals with a diverse knowledge base and skill sets acquired through extensive experience in expedition cruising, adventure travel, and hospitality. We must continue to sufficiently recruit, retain, train and motivate our employees to maintain our current business and support our projected growth. A loss of key executives or other key employees or disruptions among our personnel could adversely affect our results of operations.thesethose decisions may adversely affect our activities. A failure to adequately monitor a third-party service provider’s compliance with a service level agreement or regulatory or legal requirements could result in significant economic and reputational harm to us.We may be exposedOur failure to risksproperly and costs associated with protectingefficiently design, construct, implement and operate our new reservations and customer relationship management (“CRM”)computer systems could materially disrupt our operations, adversely impact the integrity and securityservicing of our guests’customers and employees’ personal information.have a material adverse effect on our financial performance.various risks associated with the collection, handling, storage and transmission of sensitive information, including risks related to compliance with applicable lawscyber and other contractual obligations,risks, some of which are beyond our control, which could have a material adverse effect on our business, results of operations and financial position.riskefficient operation of our business. It is critical that ourthe data processed by these systems collecting suchremain confidential, as it often includes competitive customer information, could be compromised. In the course of doing business, we collect large volumes of internal and guest data, includingconfidential customer personally identifiable information for various business purposes. If we failand transaction data, employee records and key financial and operational plans, results and statistics. The sophistication of efforts by hackers, foreign governments, cyber-terrorists, and cyber-criminals, acting individually or in coordinated groups, to maintain compliance with the various applicable data collection and privacy laws or with credit card industry standardslaunch distributed denial of service attacks or other applicablecoordinated attacks that may cause service outages, gain inappropriate or block legitimate access to systems or information, or result in other business interruptionsstandards, we could be exposed to fines, penalties, restrictions, litigationrisks, particularly given the complex and evolving laws and regulations regarding privacy and data protection. Cyber incidents that impact the security, availability, reliability, speed, accuracy or other expenses, and our business could be adversely impacted. In addition, even if we are fully compliant with legal standards and contractual requirements, we still may not be able to prevent security breaches involving sensitive data. Any breach, theft, loss, or fraudulent use of guest, employee or company data could cause consumers to lose confidence in the securityproper functioning of our systems, information technologyand measures, including outages, computer viruses, break-ins and similar disruptions, could have a significant impact on our operations.choose notsoftware safeguards, as well as redundant systems, network security measures and backup systems, it is difficult to purchase from usfully protect against the possibility of power loss, telecommunications failures, cyber-attacks, and other cyber incidents in every potential circumstance that may arise. A significant cyber incident, including system failure, security breach, disruption by malware or ransomware, or other damage, could interrupt or delay our operations, damage our reputation and brand, cause a loss of customers, expose us to risksa risk of data loss business disruption,or litigation, result in regulatory scrutiny, investigations, actions, fines or penalties and/or cause us to incur significant time and other liability,expense to remedy such an event, any of which could adversely affecthave a material adverse impact on our business.results of operations and financial position. Furthermore, any failure to comply with data privacy, security or other laws and regulations could result in claims, legal or regulatory proceedings, inquiries or investigations. As cyber threats are continually evolving, our controls and procedures may become inadequate and we may be required to devote additional resources to modifying or enhancing our systems in the future. Furthermore, while we maintain insurance intended to address costs associated with aspects of cyber incidents, network failures and data privacy-related concerns, our coverage may not sufficiently cover all types of losses or claims that may arise.20“Internal Revenue Code”“Code”), or other jurisdictions, may have adverse effects on our income.United StatesU.S. federal income taxes. Any income earned by these subsidiaries from sources within the United StatesU.S. generally is subject to United StatesU.S. federal income tax (and United StatesU.S. branch profits tax) unless the requirements of the exemption under Section 883 of the Internal Revenue Code are met. Although we expect that any United StatesU.S. source income of our foreign subsidiaries will generally qualify for the benefits of the Section 883 exemption, there is no assurance that such benefits will be available.We believe that our expedition itineraries are a major reason why guests choose our expedition cruises over competing cruises and vacation options. However, ourOur ability to follow our planned itinerary for any expedition cruise may be affected by a number of factors, including security concerns, adverse weather conditions and natural disasters, local government regulations and restrictions and other restrictions on access, including access to protected or preserved areas.June 2015, a new EcuadorianNovember 2021, the Special Law of Special Regimen for Protected AreasProvince of Galápagos was approvedmodified to provide that owners of cupos sign a 20-year term contract with the Province of Galápagos, with such contract being subject to early termination by the government for non-compliance with the terms of the contract and updated in November 2015. A Presidential Decree issuedapplicable law regulations. The 20-year term is renewable by President Correathe cupos owner upon expiration of Ecuador in November 2015 establishedthe contract, and cupos contracts that cupos in effect asare terminated early shall, within one year of July 2015 will havethe non-renewal or early termination, be submitted to a validitypublic auction for a 20 year-term upon verification of nine years.compliance with certain environmental regulatory conditions. Our rights to operate in the Galapagos willGalápagos Islands are therefore expire in July 2024 andsubject to annual renewal based on the new law and decree we will beginregarding the renewal process in 2020.compliance with environmental and other applicable laws and regulations.Although the current holders of cupos will have the opportunity to re-apply for them, other enterprises and individuals will also have the opportunity to bid on cupos as they become subject to renewal. All bidders in this process must present proof that they fulfill the conditions to properly utilize the license. Notable criteria include, without limitation, access to a vessel, experience in tourism, a proven record of environmentally sensitive behavior, marketing requirements, etc. If the Galápagos National Parks Service were to further restrict access to the park, we might be required to alter certain of our travel itineraries. Such a development would negatively impact our business and revenues.United StatesU.S. and international laws and regulations that could lead to enforcement actions, fines, civil or criminal penalties or the assertion of litigation claims and damages. In addition, improper conduct by our employees, agents, partners, or expedition representatives could damage our reputation and/or lead to litigation or legal proceedings that could result in civil or criminal penalties, including substantial monetary fines. In certain circumstances, it may not be economical to defend against such matters and/or a legal strategy may not ultimately result in us prevailing in a matter. Such events could lead to an adverse impact on our financial condition or results of operations.litigation claims, enforcement actions and regulatory actions and investigations, including, but not limited to, those arising from personal injury, loss of life, loss of or damage to personal property, business interruption losses or environmental damage to any affected coastal waters and the surrounding area, may be asserted or brought against various parties, including us and/or our subsidiaries. The time and attention of our management may also be diverted in defending such claims, actions and investigations. Subject to applicable insurance coverage, we may also incur costs both in defending against any claims, actions and investigations and for any judgments, fines, civil or criminal penalties if such claims, actions or investigations are adversely determined.21affected bysubject to the requirements of the International Maritime Organization’s International Safety Management Code for the Safe Operation of Ships and Pollution Prevention (“ISM Code”). The ISM Code requires ship owners and bareboat charterers to develop and maintain an extensive “Safety Management System” that includes the adoption of a safety and environmental protection policy setting forth instructions and procedures for safe operation and describing procedures for dealing with emergencies. OurA failure to comply with the ISM Code may subject us to increased liability, invalidate existing insurance or decrease available insurance coverage for the affected vessels and result in a denial of access to or detention in certain ports, all of which could materially and adversely affect our results of operations and liquidity.environmental and otherexisting or changing laws and regulations could adversely affect our business. environmental protection and other laws and regulations directly affect the operation of our vessels. These laws and regulations take the form of international conventions and agreements, including the International Maritime Organization conventions and regulations and the International Convention for the Safety of Life at Sea, which are applicable to all internationally trading vessels, and national, state and local laws and regulations, all of which aremay be amended frequently.from time to time. Under these laws and regulations, various governmental and quasi-governmental agencies and other regulatory authorities may require us to obtain permits, licenses and certificates in connection with our operations. Some countries in which we operate have laws that restrict the nationality of a vessel’s crew and prior and future ports of call, as well as other considerations relating to particular national interests. Changes in governmental regulations and safety or other equipment standards may require unbudgeted expenditures for alterations or the addition of new equipment for our vessels.Club.Club (i.e. mutual association) in which our ships are entered. We are also subject to additional premium assessments including, but not limited to, investment or underwriting shortfalls experienced by the P&I Club. If we were to sustain significant losses in the future, our ability to obtain insurance coverage at all or at commercially reasonable rates could be materially adversely affected. Moreover, irrespective of the occurrence of such events, there can still be no assurance that we will be able to obtain adequate insurance coverage at commercially reasonable rates or at all.United StatesU.S. flagged vessels are engagedcontinue to transport passengers in the U.S. coastwise trade, we will beare subject to the Jones Act,Coastwise Laws, which governs,govern, among other things, the ownership and operation of vessels used to carry cargo or passengers betweenJones Act requiresCoastwise Laws and the regulations promulgated thereunder require that such vessels engaged in the U.S. coastwise trade be built in the United States, registered under the U.S. flag, manned by predominantly U.S. crews, and beneficially owned and operated by U.S. organized companies that are controlled and at least 75% owned by U.S. citizens within the meaning of the Jones Act.statutes. A failure to maintain compliance with the Jones ActCoastwise Laws would adversely affect our financial position and our results of operations as we would be prohibited from operating vessels in the U.S. coastwise trade during any period in which we do not comply or cannot demonstrate to the satisfaction of the relevant governmental authorities our compliance with the Jones Act.Coastwise Laws. In addition, a failure to maintain compliance could subject us to fines and our vessels could be subject to seizure and forfeiture for violations of the Jones ActCoastwise Laws and the related U.S. vessel documentation laws.Jones ActCoastwise Laws requires that non-U.S. citizens within the meaning of the Jones Act beneficially own no more than 24.99% in the entities that directly or indirectly own the vessels that operate in the U.S. coastwise trade. If we were to seek to sell any portion of our business that owns any of these vessels, we would have fewer potential purchasers because some potential purchasers might be unable or unwilling to satisfy the U.S. citizenship restrictions described above. As a result, the sales price for that portion of the business may not attain the amount that could be obtained in an unregulated market. 22 Our SecuritiesOwnership of Capital Stock by Individuals and Entities that are not U.S. CitizensamendedAmended and restated certificateRestated Certificate of incorporationIncorporation (“Amended Certificate”) limits the beneficial ownership of our commoncapital stock by individuals and entities that are not U.S. citizens within the meaning of the Jones Act.Coastwise Laws. These restrictions maycommoncapital stock and may result in non-U.S. citizens being required to disgorge profits, sell their shares at a loss or relinquish their voting, dividend and distribution rights.Jones Act,Coastwise Laws, and so long as we operate U.S. flagged vessels in coastwise trade, at least 75% of the outstanding shares of each class or series of our capital stock must be beneficially owned and controlled by U.S. citizens within the meaning of the Jones Act.Coastwise Laws. Certain provisions of our amended and restated certificate of incorporationAmended Certificate are intended to facilitate compliance with this requirement and may have an adverse effect on certain holders or proposed transferees of shares of our common stock.amended and restated certificate of incorporation,Amended Certificate, any transfer, or attempted transfer, of any shares of capital stock will be void if the effect of such transfer, or attempted transfer, would be to cause one or more non-U.S. citizens in the aggregate to own (of record or beneficially) shares of any class or series of our capital stock in excess of 22% of the outstanding shares of such class or series. The liquidity or market value of the shares of common stock may be adversely impacted by such transfer restrictions.amended and restated certificate of incorporationAmended Certificate provides that if any transfer would otherwise result in the number of shares of any class or series of capital stock owned (of record or beneficially) by non-U.S. citizens being in excess of 22% of the outstanding shares of such class or series, such transfer will cause such excess shares to be automatically transferred to a trust for the exclusive benefit of one or more charitable beneficiaries that are U.S. citizens. The proposed transferee will have no rights in the shares transferred to the trust, and the trustee, who is a U.S. citizen chosen by us and unaffiliated with us or the proposed transferee, will have all voting, dividend and distribution rights associated with the shares held in the trust. The trustee will sell such excess shares to a U.S. citizen within 20 days of receiving notice from us and distribute to the proposed transferee the lesser of the price that the proposed transferee paid for such shares and the amount received from the sale, and any gain from the sale will be paid to the charitable beneficiary of the trust.exceededtriggered by a change in the status of a record or beneficial owner thereof from a U.S. citizen to a non-U.S. citizen, in which case such person will receive the lesser of the market price of the shares on the date of such status change and the amount received from the sale. In addition, under our amended and restated certificate of incorporation,Amended Certificate, if the sale or other disposition of shares of common stock would result in non-U.S. citizens owning (of record or beneficially) in excess of 22% of the outstanding shares of common stock, the excess shares shall be automatically transferred to a trust for disposal by a trustee in accordance with the trust transfer provisions described above. As part of the foregoing trust transfer provisions, the trustee will be deemed to have offered the excess shares in the trust to us at a price per share equal to the lesser of (i) the market price on the date we accept the offer and (ii) the price per share in the purported transfer or original issuance of shares, as described in the preceding paragraph, or the market price per share on the date of the status change, that resulted in the transfer to the trust.amended and restated certificate of incorporationAmended Certificate provides that, if the percentage of the shares of any class or series of capital stock owned (of record or beneficially) by non-U.S. citizens is known to us to be in excess of 22% for such class or series, we, in our sole discretion, shall be entitled to redeem all or any portion of such shares most recently acquired (as determined by us in accordance with guidelines that are set forth in our amended and restated certificate of incorporation)Amended Certificate), by non-U.S. citizens, or owned (of record or beneficially) by non-U.S. citizens as a result of a change in citizenship status, in excess of such permitted percentage for such class or series at a redemption price based on a fair market value formula that is set forth in our amended and restated certificate of incorporation.Amended Certificate. Such excess shares shall not be accorded any voting, dividend or distribution rights until they have ceased to be excess shares, provided that they have not been already redeemed by us. As a result of these provisions, a shareholder who is a non-U.S. citizen may be required to sell its shares of common stock at an undesirable time or price and may not receive any return on its investment in such shares. Further, we may have to incur additional indebtedness, or use available cash (if any), to fund all or a portion of such redemption, in which case our financial condition may be materially weakened.Jones Act,Coastwise Laws, our amended and restated certificate of incorporationAmended Certificate permits us to require that any record or beneficial owner of any shares of our capital stock provide us with certain documentation concerning such owner’s citizenship. These provisions include a requirement that every person acquiring, directly or indirectly, five percent (5%) or more of the shares of any class or series of our capital stock must provide us with specified citizenship documentation. In the event that any person does not submit such requested or required documentation to us, our amended and restated certificate of incorporationAmended Certificate provides us with certain remedies, including the suspension of the voting rights of the person’s shares owned by persons unable or unwilling to submit such documentation and the payment of dividends and distributions with respect to those shares into a segregated account. As a result of non-compliance with these provisions, a record or beneficial owner of the shares of our common stock may lose significant rights associated with those shares.23commoncapital stock, we may not have the funds or the ability to redeem any excess shares and the charitable trust mechanism described above may be deemed invalid or unenforceable, all with the result that we could be forced to either suspend our operations in the U.S. coastwise trade or be subject to substantial penalties.amended and restated certificate of incorporationAmended Certificate contains provisions voiding transfers of shares of any class or series of our capital stock that would result in non-U.S. citizens within the meaning of the Jones Act,Coastwise Laws, in the aggregate, owning in excess of 22% of the shares of such class or series. In the event that this transfer restriction would be ineffective, our amended and restated certificate of incorporationAmended Certificate provides for the automatic transfer of such excess shares to a trust specified therein. These trust provisions also apply to excess shares that would result from a change in the status of a record or beneficial owner of shares of our capital stock from a U.S. citizen to a non-U.S. citizen. In the event that these trust transfer provisions would also be ineffective, our amended and restated certificate of incorporationAmended Certificate permits us to redeem such excess shares. The per-share redemption price may be paid, as determined by our Board of Directors, by cash or redemption notes or the shares may be redeemed for warrants. However, we may not be able to redeem such excess shares for cash because our operations may not have generated sufficient excess cash flow to fund such redemption. Further, the methodology for transfer to and sale by a charitable trust could be deemed invalid or unenforceable in one or more jurisdictions. If, for any reason, we are unable to effect a redemption or charitable sale when beneficial ownership of shares by non-U.S. citizens is in excess of 24.99% of the common stock, or otherwise prevent non-U.S. citizens in the aggregate from beneficially owning shares in excess of 24.99% of any class or series of capital stock, or fail to exercise our redemption or forced sale rights because we are unaware that ownership exceeds such percentage, we will likely be unable to comply with the Jones ActCoastwise Laws and will likely be required by the applicable governmental authorities to suspend our operations in the U.S. coastwise trade. Any such actions by governmental authorities would have a severely detrimental impact on our financial position, results of operations and cash flows and any failure to suspend operations in violation of the Jones ActCoastwise Laws could cause us to be subject to material financial and operational penalties.We are an “emerging growth company” and we cannot be certain if the reduced disclosure requirements applicableGeneral Risks Related to emerging growth companies will make our shares of common stock less attractive to investors.We are an “emerging growth company,” as defined in the Jumpstart our Business Startups Act of 2012 (“JOBS Act”). We will remain an “emerging growth company” until December 31, 2018. However, if our non-convertible debt issued within a three-year period or revenues exceeds $1 billion, or the market value of our shares of common stock that are held by non-affiliates exceeds $700 million on the last day of the second fiscal quarter of any given fiscal year, we would cease to be an emerging growth company as of the following fiscal year. As an emerging growth company, we are not required to comply with the auditor attestation requirements of section 404 of the Sarbanes-Oxley Act. We cannot predict if investors will find our shares of common stock less attractive because we may rely on these provisions. If some investors find our shares of common stock less attractive as a result, there may be a less active trading market for our shares and our share price may be more volatile.outstanding warrants may have an adverse effect on the market price of shares of common stock.As of February 26, 2018, we had issued and outstanding warrants to purchase 10,103,828 shares of common stock. The sale, or even the possibility of sale, of the shares underlying the warrants could have an adverse effect on the market price for our securities or on our ability to obtain future financing. If and to the extent these warrants are exercised, you may experience dilution to your holdings.We may redeem the warrants at a time that is not beneficial to public investors.We may call the public warrants for redemption at any time after the redemption criteria described in the prospectus for our initial public offering have been satisfied. If we call the public warrants for redemption, public shareholders may be forced to accept a nominal redemption price or sell or exercise the warrants when they may not wish to do so.24Our management’s ability to require holders of our warrants to exercise such warrants on a cashless basis will cause holders to receive fewer shares of common stock upon their exercise of the warrants than they would have received had they been able to exercise their warrants for cash.If we call our public warrants for redemption after the redemption criteria described in the prospectus for our initial public offering have been satisfied, our management will have the option to require any holder that wishes to exercise its warrant (including any warrants held by our initial shareholders or their permitted transferees) to do so on a “cashless basis.” If our management chooses to require holders to exercise their warrants on a cashless basis, the number of shares of common stock received by a holder upon exercise will be fewer than it would have been had such holder exercised his warrant for cash. This will have the effect of reducing the potential “upside” of the holder’s investment in our company.Securitiesamended and restated certificate of incorporationAmended Certificate and bylaws and Delaware law may inhibit a takeover of us, which could limit the price investors might be willing to pay in the future for our common stock and could entrench management.amended and restated certificate of incorporationAmended Certificate and bylaws contain provisions that may discourage unsolicited takeover proposals that stockholders may consider to be in their best interests. Our board of directors is divided into three classes, each of which will generally serve for a term of three years with only one class of directors being elected in each year. As a result, at a given annual1415 Western2505 Second Avenue, Seattle, Washington, consisting of approximately 7,20011,000 square feet. We also lease our Natural Habitat office in Louisville, Colorado, our Off the Beaten Path office in Boseman, Montana, our DuVine Cycling and Adventure office in Somerville, Massachusetts, our Classic Journeys office in La Jolla, California, a media studio in Burlington, Vermont and an officewarehouse space in Sydney, Australia.Seattle, Washington for our shoreside operations. A description of our vessels is set forth in Item 1 under the subheading “Lindblad Expeditions Ships and Voyages.Ships.”Registrant’sRegistrant’s Common Equity, Related Stockholder Matters and Issuer Purchases of Equity Securitiesand warrants areis traded on the NASDAQ Capital Market under the symbolssymbol “LIND” and “LINDW,” respectively. The following table sets forth the high and low closing prices for our common stock and warrants as reported by the NASDAQ Capital Market for the two most recent years by quarter:. Common Stock Warrants Period High Low High Low 2017: Fourth Quarter $ 11.13 $ 9.21 $ 1.95 $ 1.35 Third Quarter $ 11.21 $ 9.76 $ 2.25 $ 1.78 Second Quarter $ 10.50 $ 8.95 $ 2.30 $ 1.87 First Quarter $ 9.72 $ 8.62 $ 2.30 $ 1.90 Fourth Quarter $ 10.08 $ 7.75 $ 2.55 $ 1.63 Third Quarter $ 10.08 $ 8.51 $ 2.46 $ 1.55 Second Quarter $ 10.70 $ 8.69 $ 2.60 $ 1.50 First Quarter $ 11.40 $ 9.24 $ 3.00 $ 2.21 February 26, 2018,January 31, 2022, there were 161177 holders of record of our common stock and 10 holders of record of our warrants.stock. Since certain of our shares and warrants are held by brokers and other institutions on behalf of shareholders, the foregoing number is not representative of the number of beneficial owners.if any, for use in our business operations and for purchases of our common stock, and warrants, accordingly, our Board of Directors does not anticipate declaring any dividends in the foreseeable future. Any determination to pay dividends in the future will be at the discretion of our Board and will depend upon our results of operations, financial condition, restrictions imposed by applicable law and our financing agreements and other factors that our Board of Directors deems relevant. We were restricted, under our Main Street Loan, from declaring or paying dividends on our common stock. The Incremental Assumption Agreement and Third Amendment to Third Amended and Restated Credit Agreement also restricted us from declaring and paying cash dividends.quarterthree months ended December 31, 2017.2021.On November 2, 2016, ourOur Board of Directors approved a $15.0 million increase to the original $20.0 million stock and warrant repurchase plan (“Repurchase Plan, announcedPlan”) in November 2015 and increased the Repurchase Plan to $35.0 million.million in November 2016. This Repurchase Plan authorizes us to purchase from time to time our outstanding common stock and warrants through open market repurchases in compliance with Rule 10b-18 of the Securities Exchange Act of 1934, as amended, and/or in privately negotiated transactions based on market and business conditions, applicable legal requirements and other factors. Any shares and warrants purchased will be retired. The Repurchase Plan has no time deadline and will continue until otherwise modified or terminated at the sole discretion of our Board of Directors at any time. The repurchases exclude shares repurchased to settle statutory employee tax withholding related to the vesting of stock awards. All repurchasesDuring March 2020, the Repurchase Plan was suspended due to the uncertain impact of the COVID-19 virus and our borrowings through the now-terminated Main Street Expanded Loan Facility program previously placed restrictions on stock repurchases. No shares were made using cash resources. There were no repurchases of common stock inrepurchased under the fourth quarter of 2017.Repurchase Plan during the three months ended December 31, 2021.26purchases byshares of common stock withheld from vesting of stock-based compensation awards for employee income taxes, for the Company of outstanding warrants during the quarter ended December 31, 2017:periods indicated:Period Total
number
of warrants
purchased Average
price paid
per warrant Total
number of
warrants purchased as
part of publicly
announced plans or
programs Approximate dollar
value of shares and warrants that
may yet be purchased
under the plans or
programs October 1-31, 2017 - $ - - $ 13,001,479 November 1-30, 2017 - - - 13,001,479 December 1-31, 2017 16,495 1.35 16,495 12,979,046 Total 16,495 $ 1.35 16,495 $ 12,979,046 584 $ 14.51 $ - $ 11,974,787 8,244 17.38 - 11,974,787 19,001 16.41 - 11,974,787 27,829 $ - July 3, 2013 (the date our warrants and common stock commenced separate trading on the NASDAQ Capital Market)December 31, 2016 to December 31, 20172021 with the performance of the Standard & Poor’s 500 Composite Stock Index and the FTSE 100 Index. The graph assumes an initial investment of $100 on July 3, 2013December 31, 2016 and reinvestment of dividends.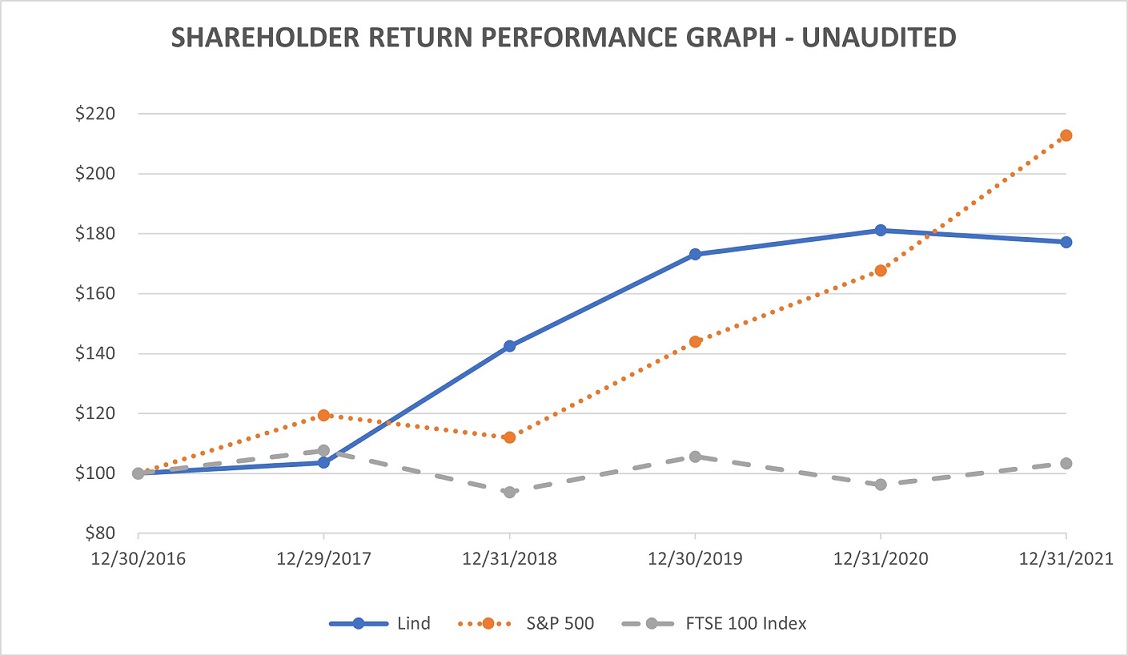
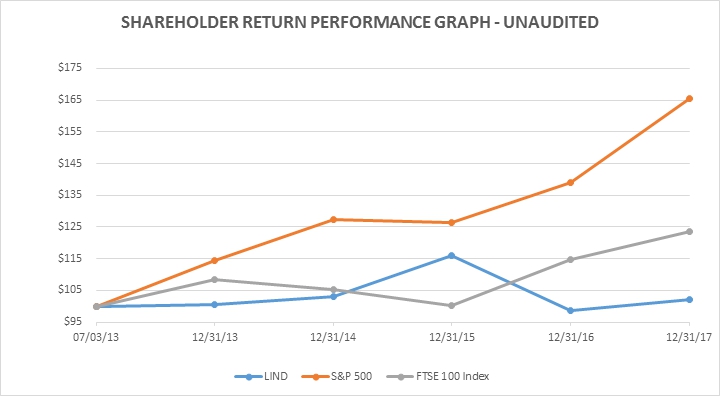
07/03/13 12/31/13 12/31/14 12/31/15 12/31/16 12/31/17 LIND $ 100.00 $ 100.42 $ 103.13 $ 115.97 $ 98.64 $ 102.19 S&P 500 100.00 114.42 127.45 126.53 138.89 165.51 FTSE 100 Index 100.00 108.33 105.40 100.20 114.65 123.40 Item 6.Selected Financial DataThe following selected financial data should be read in conjunction with Management’s Discussion and Analysis of Results of Operations and Financial Condition, the Consolidated Financial Statements and the Notes to the Consolidated Financial Statements in this Annual Report on Form 10-K. For the years ended December 31, (In thousands, except share and per share data) 2017 2016 2015 2014 2013 Income Statement Data: Tour revenues $ 266,504 $ 242,346 $ 209,985 $ 198,459 $ 192,237 Operating income $ 10,744 $ 13,981 $ 15,502 $ 30,420 $ 23,522 Net (loss) income $ (7,529 ) $ 5,059 $ 19,742 $ 22,245 $ 14,844 Per Share Data: (Loss) earnings per share: Basic $ (0.19 ) $ 0.11 $ 0.44 $ 0.44 $ 0.29 Diluted $ (0.19 ) $ 0.10 $ 0.43 $ 0.44 $ 0.29 Weighted average shares outstanding, basic 44,576,912 45,649,971 44,917,829 50,878,894 51,106,436 Weighted average shares outstanding, diluted 44,576,912 46,456,921 45,575,387 50,878,894 51,106,436 As of December 31, (In thousands) 2017 2016 2015 2014 2013 Balance Sheet Data: Total assets $ 424,348 $ 407,701 $ 381,613 $ 245,925 $ 207,028 Long-term debt $ 165,936 $ 165,878 $ 164,443 $ 56,690 $ 59,935 Total liabilities $ 311,724 $ 288,722 $ 267,692 $ 178,358 $ 151,455 Total stockholders’ equity $ 106,322 $ 113,809 $ 113,921 $ 67,567 $ 55,573 Management’sManagement’s Discussion and Analysis of the Results of Operations and Financial Condition“Risk“Risk Factors,” “Selected“Selected Financial Data,” and “Business.“Business.”experiences that includefostering a spirit of exploration and discovery, using itineraries that featurefeaturing up-close encounters with wildlife and nature, history and culture and promote guest empowerment, human connections and interactivity. Our mission is offeringto offer life-changing adventures on all seven continentsaround the world and pioneering innovative ways to allow our guests to connect with exotic and remote places.seventen owned expedition ships, having taken possession of our new polar ice class vessel, the National Geographic Resolution, in September 2021, and operate five seasonal charter vessels under the Lindblad Expeditions Holdings, Inc. (“Lindblad”) brand. Each expedition ship is fully equipped with state-of-the-art tools for in-depth exploration and the majority of our expeditions involve travel to remote places, such as voyages to the Arctic, Antarctic, the Galápagos Islands, Alaska, Baja’s Sea of Cortez, the South Pacific, Costa Rica and Panama. We have a strategic business alliancelongstanding relationship with the National Geographic foundedSociety dating back to 2004, which is based on a shared interest in exploration, research, technology and conservation. This relationship includes a co-selling, co-marketing and branding arrangement whereby our owned vessels carry the National Geographic name and National Geographic sells our expeditions through its internal travel division. We collaborate with National Geographic on voyage planning to enhance the guest experience by having National Geographic experts, including photographers, writers, marine biologists, naturalists, field researchers and film crews, join our expeditions. Guests have the ability to interface with these experts through lectures, excursions, dining and other experiences throughout their voyage.28We deploy chartered vessels for various seasonal offerings and continually seek to optimize our charter fleet to balance our inventory with demand and maximized yields. We use our charter inventory as a mechanism to both increase travel options of our existing and prospective guests and also to test demand for certain areas and seasons to understand the potential for longer term deployments and additional vessel needs.Due to the specific geographies in which we operate and the cost of providing access to fuel in our remote destinations, we have historically not experienced significant fluctuations in fuel costs with changes in world fuel commodity prices. Fuel costs represented 3.2%, 3.4% and 4.3% of our Lindblad segment tour revenues for the years ended December 31, 2017, 2016 and 2015, respectively.In November 2017, the Company executed a contract to build a polar ice class vessel targeted to be competed in January 2020, with potential accelerated delivery to November 2019, with a total purchase price of 1,066.0 million Norwegian Kroner (NOK). Subsequently, LME exercised its right to make payments in United States Dollars, which resulted in a purchase price of $134.6 million, including hedging costs. The first twenty percent of the purchase price was paid shortly after execution of the Agreement with the remaining eighty percent due upon delivery and acceptance of the vessel. The polar ice class contract includes options to build two additional ice class vessels, the first for delivery twelve months after the initial vessel and the second for delivery twelve months thereafter. The new build process exposes us to certain risks typically associated with new ship construction, which we manage through detailed planning and close monitoring by our internal marine team.In December 2015, we entered into two separate contracts with Ice Floe LLC, to build theNational Geographic Quest and theNational Geographic Venture. Management considers this investment to be an important step to meet increasing demand for our expedition cruise offerings. TheNational Geographic Quest launched in the third quarter of 2017 and operated in Alaska and British Columbia during the summer of 2017 before voyaging to Costa Rica and Panama to provide expeditions for the Northern Hemisphere winter season.In December 2016, we launched theNational Geographic Endeavour II,which replaced theNational Geographic Endeavour.Endeavour II will operate year-round in the Galápagos Islands.National Geographic Endeavourwas fully depreciated and we incurred a $0.8 million loss on disposal of the vessel during the fourth quarter of 2016.In the fourth quarter of 2016, theNational Geographic Orion experienced an issue with its main engine and as a result we cancelled one voyage in 2016 and four voyages during the first quarter of 2017 for necessary engine repairs and in the first quarter of 2017, theNational Geographic Sea Lion cancelled two voyages to repair the onboard air conditioning system. In addition, the delayed delivery of theNational Geographic Questcaused the cancellation of four highly booked voyages. The Company estimates that the impact of these cancellations was approximately $12.4 million in tour revenues and $9.0 million Adjusted EBITDA in 2017. On May 4, 2016, we expanded our land-based offerings by acquiring an 80.1% ownership interest in Natural Habitat, Inc. (“Natural Habitat”), an adventure travel provides eco-conscious expeditions and ecotourism company based in Colorado. Natural Habitat was founded by Benjamin L. Bressler, who retains a 19.9% noncontrolling interest in Natural Habitat. Examples of Natural Habitat’s expeditionsnature-focused, small-group experiences that include African safaris in Botswana, grizzly bear adventures in Alaska and polar bear tours in Canada. Since 2003,Churchill, Canada, Alaskan grizzly bear adventures, small-group Galápagos Islands tours and African safaris. Natural Habitat has partnered with the World Wildlife Fund (“WWF”) to offer conservation travel, which is sustainable travel that directly protects nature. This agreement with WWF extends through 2023.contributes to the protection of nature and wildlife. March 7, 2016,February 4, 2022, we issued $360.0 million of 6.75% senior secured notes due 2027. We used the proceeds from the notes to prepay in full all outstanding borrowings under our existing term loan, including the Main Street Loan, and revolving credit facility, and paid all related premiums, terminating in full our existing credit agreement and the commitments thereunder. We also entered into a Restated Credit Agreement with Credit Suisse, amending our existing senior secured credit facility with Credit Suisse (“Restated Credit Facility”). The Restated Credit Facility provides for our Company’s existing $175.0 million senior secured first lien term loan facility and a new $45.0 million senior secured incremental revolving credit facility, (“Revolving Credit Facility”), which includesremains undrawn and matures February 2027.$5.0total debt position of $558.5 million letterand were in compliance with all of our debt covenants currently in effect. sub facility. Our obligations underfacilities to, among other things, extend the Restated Credit Facility are secured by substantially all our assets. See Note 7 – Long-Term Debtdeferral of scheduled amortization payments of the first export credit facility through December 2021 in the Notesaggregate amount of $15.7 million, extendconsolidated financial statements in Item 8resumption of this Annual Report on Form 10-K for additional information regarding the Restated Credit Agreement.our operations. 20172021, 2020 and 2016 and for the years ended December 31, 2016 and 2015;2019; 29Financial Presentation fees and insurance proceeds.fees. primarily include the cost of shoreside vessel support, reservations and other administrative functions, including salaries and related benefits, credit card commissions, professional fees and rent.Costs,Cost, to enable us to analyze ourthe performance and financial condition.condition of our ship operations. We utilize these financial measures to manage our business on a day-to-day basis and believe that they are the most relevant measures of performance. Some of these measures are commonly used in the cruise and tourism industry to evaluate performance. We believe these non-GAAP measures provide expanded insight to assess revenue and cost performance, in addition to the standard GAAP-based financial measures. There are no specific rules or regulations for determining non-GAAP measures, and as such, theyour non-GAAP financial measures may not be comparable to measures used by other companies within the industry.30 income excluding depreciation and amortization, net interest expense, other income (expense), income tax (expense) benefit, (gain) loss on foreign currency, (gain) loss on transfer of assets, reorganization costs, and other supplemental adjustments. Other supplemental adjustments include certain non-operating items such as stock-based compensation, executive severance costs, the National Geographic fee amortization, merger-relateddebt refinancing costs, acquisition-related expenses and acquisition-related expenses. The Company believesother non-recurring charges. We believe Adjusted EBITDA, when considered along with other performance measures, is a useful measure as it reflects certain operating drivers of the business, such as sales growth, operating costs, selling and administrative expense, and other operating income and expense. The Company believesWe believe Adjusted EBITDA helps provide a more complete understanding of the underlying operating results and trends and an enhanced overall understanding of the Company’sour financial performance and prospects for the future. Adjusted EBITDA is not intended to be a measure of liquidity or cash flows from operations or a measure comparable to net income as it does not take into account certain requirements, such as unearned passenger revenues, capital expenditures and related depreciation, principal and interest payments, and tax payments. The Company’sOur use of Adjusted EBITDA may not be comparable to other companies within the industry.merger-related expenses, and acquisition-related expenses.merger-related expenses, selling and marketing expenses, and general and administrative expenses. less insurance proceeds divided by Available Guest Nights.RevenueYield represents tour revenues less insurance proceeds, commissions and direct costs of other tour revenues.RevenueYield divided by Available Guest Nights. from the sale of guest tickets are mildly seasonal, historically larger in the first and third quarters. The seasonality of our operating results increasesfluctuates due to our vessels being taken out of service for scheduled maintenance or drydocking, which is typically during non-peaknonpeak demand periods, in the second and fourth quarters. Our drydock schedules are subject to cost and timing differences from year to yearyear-to-year due to the availability of shipyards for certain work, drydock locations based on ship itineraries, operating conditions experienced especially in the polar regions and the applicable regulations of class societies in the maritime industry, which require more extensive reviews periodically. Drydocking impacts operating results by reducing tour revenues and increasing cost of tours. Our Natural Habitat, is aDuVine, Off the Beaten Path and Classic Journeys brands are seasonal business,businesses, with the majority of itsNatural Habitat’s tour revenue recorded in the third and fourth quarterquarters from its summer season departures and polar bear tours.tours, while the majority of Off the Beaten Path, DuVine and Classic Journeys’ revenues are recorded during the second and third quarters from their spring and summer season departures.312017, 20162021, 2020 and 20152019 as shown in the following table: For the years ended December 31, For the years ended December 31, (In thousands, except per share data) 2017 2016 Change % 2015 Change % Tour revenues $ 266,504 $ 242,346 $ 24,158 10 % $ 209,985 $ 32,361 15 % $ 147,107 $ 82,356 $ 64,751 79 % $ 343,091 $ (260,735 ) (76 %) Cost of tours 135,526 118,977 16,549 14 % 95,417 23,560 25 % 124,484 72,931 51,553 71 % 166,608 (93,677 ) (56 %) Gross profit 130,978 123,369 7,609 6 % 114,568 8,801 8 % General and administrative 60,529 51,896 8,633 17 % 38,994 12,902 33 % 65,445 45,508 19,937 44 % 62,744 (17,236 ) (27 %) Selling and marketing 42,354 39,072 3,282 8 % 35,083 3,989 11 % 28,484 20,231 8,253 41 % 54,772 (34,541 ) (63 %) Depreciation and amortization 17,351 18,420 (1,069 ) (6 %) 11,645 6,775 58 % 39,525 32,084 7,441 23 % 25,769 6,315 25 % Merger-related expenses - - - NA 13,344 (13,344 ) NA Operating income $ 10,744 $ 13,981 $ (3,237 ) (23 %) 15,502 (1,521 ) (10 %) $ (110,831 ) $ (88,398 ) $ (22,433 ) 25 % $ 33,198 $ (121,596 ) NM Net (loss) income (7,529 ) 5,059 (12,588 ) (249 %) $ 19,742 $ (14,683 ) (74 %) $ (119,168 ) $ (100,140 ) $ (19,028 ) 19 % $ 18,748 $ (118,888 ) NM (Loss) earnings per share available to common stockholders Basic $ (0.19 ) $ 0.11 $ (0.30 ) (273 %) $ 0.44 $ (0.33 ) (75 %) $ (2.41 ) $ (2.01 ) $ (0.40 ) $ 0.29 $ (2.30 ) Diluted (0.19 ) 0.10 (0.29 ) (290 %) 0.43 (0.33 ) (77 %) $ (2.41 ) $ (2.01 ) $ (0.40 ) $ 0.28 $ (2.29 ) 20172021 and December 31, 20162020 - Consolidated$24.2$64.8 million, or 10%79%, to $266.5$147.1 million in 2017 compared to $242.3$82.4 million in 2016. Thefor the year ended December 31, 2020. At the Lindblad segment, increased tour revenues increased by $9.0 million driven primarily by the launch of theNational Geographic Quest and theNational Geographic Endeavour II,as well as additional charter expeditions, partially offset by the cancellation of four highly booked voyages on theNational Geographic Orion and two highly booked voyages on theNational Geographic Sea Lion. Tour revenues at the Natural Habitat segment, which was acquired in the second quarter of 2016, increased $15.2$13.2 million, primarily due to a full twelve monthsthe ramp up of operations in 2017. It is estimated that total companybeginning June 2021 following the cancellation, disruption and rescheduling of expeditions due to COVID-19 since March 2020. At the Land Experiences segment, tour revenues would have increased approximately $36.5$51.5 million or 15%, over the prior year period,$278.9 million excluding the impactramp up of operations during 2021 and from the inclusion of the voyage cancellations onresults of Off theNational Geographic Orion Beaten Path, DuVine and theNational Geographic Sea Lionand the delayed delivery of theNational Geographic Quest.Classic Journeys, which were acquired during 2021. CostTotal cost of tours for the year ended December 31, 2021 increased $16.5$51.6 million, or 14%71%, to $135.5$124.5 million in 2017 compared to $119.0$72.9 million in 2016.for the year ended December 31, 2020. At the Lindblad segment, cost of tours increased $8.3$22.7 million, primarily related to the launchramp up of expeditions beginning June 2021 following the cancellation, disruption and rescheduling of expeditions due to COVID-19 since March 2020 and from the addition to our fleet of the National Geographic QuestEndurance, as well as additional charter expeditions in March 2020 and costs related to cancelled voyages, partially offset by lower drydock expense.the National Geographic Resolution in September 2021. At the Natural HabitatLand Experiences segment, cost of tours increased $8.0$28.9 million, primarily due to a full twelve monthsthe ramp up of operations in 2017.during 2021 and from the inclusion of the results of Off the Beaten Path, DuVine and Classic Journeys, which were acquired during 2021.by $8.6$19.9 million, or 17%44%, to $60.5$65.4 million in 2017 compared to $51.9$45.5 million in 2016.for the year ended December 31, 2020. At the Lindblad segment, general and administrative expenses increased $4.5$11.8 million from the prior year primarily due to increased personnel costs and credit card commissions related to restarting operations during 2021, and higher stock-based compensation expense as compared to the 2020. At the Land Experiences segment, general and administrative expenses increased $8.1 million primarily due to a $5.2 millionan increase in stock based compensation,personnel costs and credit card commissions related to the ramp up of operations during 2021 and the impact of the acquisitions of Off the Beaten Path, DuVine and Classic Journeys, which was mainly associated withwere acquired during 2021.CEO Share Allocation Plan, as well as $1.4year ended December 31, 2021 compared to $20.2 million in executive severance costs. The increase was partially offset by lower personnel and consulting costs.for the year ended December 31, 2020. At the Natural HabitatLindblad segment, generalselling and administrativemarketing expenses increased $4.1 million, primarily due to increased marketing spend related to the restart of operations. At the Land Experiences segment, selling and marketing expenses increased $4.2 million, primarily due to a full twelve months of operations in 2017.32Selling and Marketing ExpensesSelling andincreased marketing expenses increased $3.3 million, or 8%, to $42.4 million in 2017 compared to $39.1 million in 2016 primarily due to a $2.1 million increase at the Lindblad segment as result of increased commission and royalty expensespend associated with the higher tour revenues. Atramp up in operations and from the Natural Habitat segment, sellingimpact of the acquisitions of Off the Beaten Path, DuVine and marketing expenses increased $1.2 million primarily due to a full twelve months of operations in 2017.Classic Journeys, which were acquired during 2021.decreased $1.1increased $7.4 million, or 6%23%, to $17.4$39.5 million in 2017for the year ended December 31, 2021 compared to $18.4$32.1 million in 2016for the year ended December 31, 2020, primarily related to accelerated depreciation of $5.0 million associated with the retirement of theNational Geographic Endeavour in 2016, which was partially offset by depreciation in 2017 relateddue to the addition of theNational Geographic Endeavour IIand theNational Geographic QuestResolution to the fleet.fleet in September 2021 and a full year of deprecation on the National Geographic Endurance, which was added to the fleet in March 2020.(Expense) IncomeExpense $8.3$10.4 million in 2017for the year ended December 31, 2021, compared to $12.1other expenses of $21.5 million in 2016.for the year ended December 31, 2020. The $3.8$11.2 million changedecrease was primarily due to the following factors:recognition of $15.4 million in other income related to expenses covered under the CERTS grant received during 2021 partially offset by a $7.9 million increase in interest expense, net to $24.6 million during 2021, primarily due to increased borrowings related to our new vessel builds and higher rates under our debt facilities. 2021 also included a $1.3 million loss in foreign currency translation, due primarily to the maturity of foreign currency hedges related to the installment payment for the National Geographic Resolution in 2021 compared to a $4.8 million loss primarily due to maturity of a foreign currency hedges for the ship in 2020.●In 2017, we recorded a $1.1 million gain in foreign currency translation compared to a loss of $0.7 million in 2016 due to the strength of the U.S. dollar in relation to the Canadian dollar and the Euro.●Interest expense, net, decreased $0.4 million to $9.7 million in 2017 from $10.1 million in 2016 due to higher capitalized interest primarily related to theNational Geographic Quest and theNational Geographic Venture offset by higher cash interest caused by higher rates.●In 2017, the $0.5 million gain on sale primarily related to the sale of theNational Geographic Endeavour. We had recognized a loss of $0.8 million in 2016 related to the loss of disposal of theNational Geographic Endeavour.20162020 and December 31, 20152019 - Consolidatedincreased $32.3for the year ended December 31, 2020 decreased $260.7 million, or 15%76%, to $242.3$82.4 million in 2016 compared to $210.0$343.1 million in 2015. The increase was primarily a result of $34.5 million in addedfor the year ended December 31, 2019. At the Lindblad segment, tour revenues fromdecreased by $202.8 million, primarily related to cancelled, disrupted and rescheduled expeditions scheduled to depart after March 16, 2020 due to COVID-19. At the acquisition of Natural Habitat, partially offset by a decrease of $2.2 million ofLand Experiences segment, tour revenues atdecreased $57.9 million over the Lindblad segment.prior year period, primarily related to cancelled, disrupted and rescheduled trips due to COVID-19. increased $23.6for the year ended December 31, 2020 decreased $93.7 million, or 25%56%, to $119.0$72.9 million in 2016 compared to $95.4$166.6 million in 2015. The increase was primarily a result of $22.5 million of additional tour costs related tofor the acquisition of Natural Habitat and a $1.1 million increase inyear ended December 31, 2019. At the Lindblad segment, cost of tours at the Lindblad segmentdecreased $62.4, primarily related to rescheduled expeditions due to increased drydock and charter expenses,COVID-19, partially offset by lower fuel expenses.costs incurred while ships are laid up and from the addition of the National Geographic Endurance to our fleet in March 2020. At the Land Experiences segment, cost of tours decreased $31.2, primarily due to cancelled, disrupted and rescheduled trips directly related to COVID-19.increased by $12.9for the year ended December 31, 2020 decreased $17.2 million or 33%, to $51.9$45.5 million in 2016 compared to $39.0$62.7 million in 2015. The increase was primarily a result of $6.3 million in added expenses fromfor the acquisition of Natural Habitat and an increase atyear ended December 31, 2019. At the Lindblad segment, resultinggeneral and administrative expenses decreased $10.6 million from $5.3the prior year primarily due to reduced personnel costs and credit card commissions related to the disruption of operations due to COVID-19. At the Land Experiences segment, general and administrative expenses decreased $6.6 million primarily due to a decrease in additional personnel and public company costs.costs related to the disruption of operations due to COVID-19.increased $4.0decreased $34.6 million, or 11%63%, to $39.1$20.2 million in 2016 compared to $35.1 million in 2015. The increase was primarily a result of $2.7 million in expenses from the acquisition of Natural Habitat and a $1.5 million increase in National Geographic fee amortization.Merger-Related ExpensesMerger-related expenses for the year ended December 31, 2015 were $13.32020 compared to $54.8 million consistingfor the year ended December 31, 2019. At the Lindblad segment, selling and marketing expenses decreased $30.9 million, primarily due to lower commission expenses related to the impact of one-time professional fees associated withCOVID-19 on revenue and decreased advertising expenditures. At the merger transaction that was completedLand Experiences segment, selling and marketing expenses decreased $3.7 million, primarily driven by a decrease in July 2015.advertising expenditures.33yearsyear ended December 31, 2016 and 2015 were $18.42020 compared to $25.8 million and $11.6 million, respectively. The $6.8 million increase wasfor the year ended December 31, 2019, primarily relateddue to the $5.0 millionaddition of accelerated depreciation for theNational Geographic EndeavourEndurance describedto the fleet in Item 8 of this Annual Report in Note 2 – Summary of Significant Accounting Policies.March 2020.(Expense) IncomeExpense$12.1$21.5 million in 2016for the year ended December 31, 2020, compared to other incomeexpenses of $1.6$12.3 million in 2015.for the year ended December 31, 2019. The $13.7$9.2 million changeincrease was primarily due to a $4.8 million loss in foreign currency translation in 2020 due primarily to a loss of $5.3 million on the following factors:maturity of a foreign currency hedge related to the installment payment for the National Geographic Resolution, compared to a $0.1 million gain in 2019. 2020 also included a $4.4 million increase in interest expense, net to $16.7 million in 2020, primarily due to increased borrowings related to our new vessel builds, the draw down under the revolving credit facility during the first quarter and an increase in rates under the term loan.●A $0.8 million loss on disposal ofNational Geographic Endeavourin 2016 compared to the $5.0 million success fee income and the gain on the disposal of assets of $7.5 million in 2015.●Interest expense, net, decreased $0.8 million to $10.1 million in 2016 from $10.9 million in 2015. The decrease was primarily related to $1.6 million in capitalized interest in 2016 with no capitalized interest for 2015 and a $1.4 million decrease primarily from the accelerated amortization of deferred finance costs related to the repayment of our senior debt in May 2015 partially offset by $2.2 million in higher cash interest primarily due to higher debt levels from our Restated Credit Facility See Item 8 of this Annual Report Note 7 – Long-Term Debt; and●In 2016, we recorded a $0.7 million loss in foreign currency translation compared to a small loss in 2015. $ 82,842 $ 69,620 $ 13,222 19 % $ 272,410 $ (202,790 ) (74 %) 64,265 12,736 51,529 405 % $ 70,681 (57,945 ) (82 %) $ 147,107 $ 82,356 $ 64,751 79 % $ 343,091 $ (260,735 ) (76 %) $ (111,477 ) $ (78,573 ) $ (32,904 ) (42 )% $ 26,203 $ (104,776 ) NM 646 (9,825 ) 10,471 107 % $ 6,995 (16,820 ) NM $ (110,831 ) $ (88,398 ) $ (22,433 ) (25 )% $ 33,198 $ (121,596 ) NM $ (67,242 ) $ (44,398 ) $ (22,844 ) 51 % $ 57,971 $ (102,369 ) NM 3,199 (7,774 ) 10,973 141 % $ 8,648 (16,422 ) NM $ (64,043 ) $ (52,172 ) $ (11,871 ) (23 )% $ 66,619 $ (118,791 ) NM For the years ended December 31, (In thousands) 2017 2016 Change % 2015 Change % Tour revenues: Lindblad $ 216,815 $ 207,836 $ 8,979 4 % $ 209,985 $ (2,149 ) (1 %) Natural Habitat* 49,689 34,510 15,179 44 % - 34,510 NA Total tour revenues $ 266,504 $ 242,346 $ 24,158 10 % $ 209,985 $ 32,361 15 % Impact of voyage cancellations 12,353 - 12,353 NA - - NA Total tour revenues excluding
voyage cancellations $ 278,857 $ 242,346 $ 36,511 15 % $ 209,985 $ 32,361 15 % Operating income (loss): Lindblad $ 7,291 $ 11,794 $ (4,503 ) (38 %) $ 15,502 $ (3,708 ) (24 %) Natural Habitat* 3,452 2,187 1,265 58 % - 2,187 NA Total operating income 10,743 13,981 (3,238 ) (23 %) 15,502 (1,521 ) (10 %) Impact of voyage cancellations 8,798 - 8,798 NA - - NA Total operating income excluding
voyage cancellations $ 19,541 $ 13,981 $ 5,560 40 % $ 15,502 $ (1,521 ) (10 %) Adjusted EBITDA: Lindblad $ 38,655 $ 38,624 $ 31 0 % $ 46,801 $ (8,177 ) (17 %) Natural Habitat* 4,834 3,038 1,796 59 % - 3,038 NA Total adjusted EBITDA 43,489 41,662 1,827 4 % 46,801 (5,139 ) (11 %) Impact of voyage cancellations 9,047 - 9,047 NA - - NA Total adjusted EBITDA excluding
voyage cancellations $ 52,536 $ 41,662 $ 10,874 26 % $ 46,801 $ (5,139 ) (11 %) * The 2016 Natural Habitat segment results represent activity from acquisition dateReconciliation of May 2016 through December 31, 2016.Net Income to Adjusted EBITDA34Results of Operations – Lindblad SegmentComparison of Years Ended December 31, 2017 to December 31, 2016Tour RevenuesTour revenues increased $9.0 million, or 4%, to $216.8 million in 2017 compared to $207.8 million in 2016 primarily due to additional guest ticket revenue associated with the launch of theNational Geographic Questand theNational Geographic EndeavourII, as well as from additional charter expeditions and higher yields. Net Yield in 2017 increased to $985 compared to $976 in 2016,primarily driven by price increases and changes in itineraries. This increase was partially offset by the impact of the cancellation of four highly booked voyages of theNational Geographic Orion and two highly booked voyages of theNational Geographic Sea Lion. It is estimated tour revenues would have increased approximately $21.3 million, or 10%, over the prior year to $229.2 million excluding the impact of the voyage cancellations and the delayed delivery of theNational Geographic Quest.Operating IncomeOperating income decreased $4.5 million, or 38%, to $7.3 million in 2017 compared to $11.8 million in 2016 primarily related to the voyage cancellations on theNational Geographic Orion andNational Geographic Sea Lion during the first quarter of 2017. The operating income also reflects higher tour revenues and lower drydock costs, partially offset by the costs associated with operating theNational Geographic Questfollowing the July 2017 launch and higher charter costs. In addition, higher general and administrative expenses of $4.5 million were due primarily to higher stock based compensation associated with the CEO Share Allocation Plan, as well as executive severance costs. Excluding the impact of cancelled voyages and the delayed delivery of theNational Geographic Quest, it is estimated that operating income would have increased approximately $4.3 million or 36% over the prior year to $16.1 million.Comparison of Years Ended December 31, 2016 to December 31, 2015Tour RevenuesTour revenues decreased $2.2 million, or 1%, to $207.8 million in 2016 compared to $210.0 million in 2015. The change was primarily the result of a $2.2 million decrease in other tour revenues. Net Yield amounted to $976 in 2016 compared to $971 in 2015. The increase in Net Yield was primarily related to increased tour prices partially offset by lower occupancy and lower other tour revenues.Operating IncomeOperating income decreased $3.7 million, or 24%, to $11.8 million in 2016 compared to $15.5 million in 2015. This decrease was primarily related to $13.8 million higher operating expenses and a $2.2 million decrease in other tour revenues, partially offset by the absence of merger-related costs of $13.3 million that occurred in 2015. The higher operating expenses for 2016 were primarily related to additional personnel and public company costs and additional 2016 costs related to the accelerated depreciation for theNational Geographic Endeavour described in Item 8 of this Annual Report in Note 2 – Summary of Significant Accounting Policies.Results of Operations – Natural Habitat SegmentComparison of Years Ended December 31, 2017 to December 31, 2016Tour RevenuesTour revenues increased $15.2 million, or 44%, to $49.7 million compared to $34.5 million in 2016 due primarily to a full twelve months of operations in 2017.Operating IncomeOperating income increased $1.3 million, or 58%, to $3.5 million in 2017 compared to $2.2 million in 2016 due primarily to a full twelve months of operations in 2017.Comparison of Years Ended December 31, 2016 to December 31, 2015Natural Habitat reported $34.5 million in tour revenues and $2.2 million in operating income for the period from May 5, 2016, the acquisition date, to December 31, 2016.35Adjusted EBITDA – Consolidated $ (119,168 ) $ (100,140 ) $ 18,748 24,578 16,692 12,288 (2,019 ) (9,805 ) 2,190 39,525 32,084 25,769 1,265 4,772 (94 ) (15,487 ) 83 66 5,563 2,388 3,573 - 727 2,907 1,700 1,027 1,172 $ (64,043 ) $ (52,172 ) $ 66,619 table outlinestables outline the reconciliation for each segment from operating income to Net income and calculation of consolidatedAdjusted EBITDA: $ (111,477 ) $ (78,573 ) $ 26,203 37,516 30,033 24,116 5,429 2,388 3,573 - 727 2,907 1,290 1,027 1,172 $ (67,242 ) $ (44,398 ) $ 57,971 $ 646 $ (9,825 ) $ 6,995 2,009 2,051 1,653 134 - - 410 - - $ 3,199 $ (7,774 ) $ 8,648 years ended December 31, 2017, 2016Lindblad segment. Please refer to our Description of Certain Line Items above for the specific definition by line item and 2015.segment. The presentation of non-GAAP financial information should not be considered in isolation or as a substitute for, or superior to, the financial information prepared and presented in accordance with GAAP.Reconciliation of Net (Loss) Income to Adjusted EBITDA Consolidated For the years ended December 31, (In thousands) 2017 2016* 2015 Net (loss) income $ (7,529 ) $ 5,059 $ 19,742 Income tax expense (benefit) 10,002 (3,200 ) (2,649 ) Interest expense, net 9,736 10,146 10,901 Depreciation and amortization 17,351 18,420 11,645 (Gain) loss on foreign currency (1,144 ) 720 40 (Gain) loss on transfer of assets (454 ) 83 (7,502 ) Other expense (income), net 133 1,173 (5,030 ) Stock-based compensation 10,627 5,411 4,913 National Geographic fee amortization 2,907 2,907 1,397 Executive severance costs 1,409 - - Reorganization costs 451 - - Acquisition-related expenses - 943 - Merger-related expenses - - 13,344 Adjusted EBITDA 43,489 41,662 46,801 Impact of voyage cancellations 9,047 - - Adjusted EBITDA excluding impact of voyage cancellations $ 52,536 $ 41,662 $ 46,801 75,389 51,624 221,516 60,997 46,050 201,600 81 % 89 % 91 % 10,596 6,512 27,831 8,436 5,564 25,326 143 85 351 * The 2016 Natural Habitat segment results represent activity from acquisition dateReconciliation of Operating Income to Adjusted EBITDA Natural Habitat Segment For the years ended
December 31, (In thousands) 2017 2016* Operating income $ 3,452 $ 2,187 Depreciation and amortization 1,382 851 Adjusted EBITDA $ 4,834 $ 3,038 * The 2016 Natural Habitat segment results represent activity from acquisition date of May 2016 through December 31, 2016.The following tables set forth our Guest Metrics for the Lindblad segment. Please refer to ourDescription of Certain Line Itemsabove for the specific definition by line item and segment.The presentation of non-GAAP financial information should not be considered in isolation or as a substitute for, or superior to, the financial information prepared and presented in accordance with GAAP. $ 76,158 $ 60,351 $ 244,207 6,684 9,269 28,203 82,842 69,620 272,410 (6,474 ) (8,146 ) (20,770 ) (10,076 ) (7,373 ) (18,813 ) $ 66,292 $ 54,101 $ 232,827 75,389 51,624 221,516 $ 1,099 $ 1,349 $ 1,230 879 1,048 1,051 sets forthreconciles operating income to our AvailableNet Yield Guest Nights, Guest Nights Sold, Occupancy, Maximum Guests, Number of Guests and VoyagesMetric for the Lindblad segment for the years ended December 31, 2017, 2016 and 2015:Segment. For the years ended December 31, 2017 2016 2015 Available Guest Nights 186,719 181,990 184,366 Guest Nights Sold 163,256 164,423 169,303 Occupancy 87.4 % 90.3 % 91.8 % Maximum Guests 22,805 21,715 21,459 Number of Guests 20,140 19,735 19,824 Voyages 308 290 281 $ (111,477 ) $ (78,573 ) $ 26,203 85,588 62,905 125,343 49,028 37,177 47,793 22,187 18,078 48,955 37,516 30,033 24,116 (6,474 ) (8,146 ) (20,770 ) (10,076 ) (7,373 ) (18,813 ) $ 66,292 $ 54,101 $ 232,827 The following table shows the calculations of Gross Yield and Net Yield for the Lindblad segment for the years ended December 31, 2017, 2016 and 2015:Calculation of Gross Yield and Net Yield Lindblad Segment For the years ended December 31, (In thousands, except for Available Guest Nights, Gross and Net Yield) 2017 2016 2015 Guest ticket revenues $ 191,113 $ 183,851 $ 183,805 Other tour revenues 25,701 23,985 26,180 Tour Revenues 216,814 207,836 209,985 Less: Orion Insurance Proceeds (2,273 ) - - Adjusted Tour Revenues 214,541 207,836 209,985 Less: Commissions (16,365 ) (14,954 ) (14,460 ) Less: Other tour expenses (14,325 ) (15,253 ) (16,496 ) Net Revenue $ 183,851 $ 177,629 $ 179,029 Available Guest Nights 186,719 181,990 184,366 Gross Yield $ 1,149 $ 1,142 $ 1,139 Net Yield 985 976 971 37The following table shows the calculations of Gross Cruise Cost per Available Guest Night and Net Cruise Costs per Available Guest Night for the Lindblad segment for the years ended December 31, 2017, 2016 and 2015: For the years ended December 31, (In thousands, except for Available Guest Nights, Gross and Net Cruise Cost) 2017 2016 2015 Cost of tours $ 105,044 $ 96,505 $ 95,417 $ 85,588 $ 62,905 $ 125,343 Plus: Selling and marketing 38,429 36,356 35,083 22,187 18,078 48,955 Plus: General and administrative 50,082 45,612 38,994 49,028 37,177 47,793 Plus: Merger-related expenses - - 13,344 Gross Cruise Cost 193,555 178,473 182,838 156,803 118,160 222,091 Less: Commission expense (16,365 ) (14,954 ) (14,460 ) (6,474 ) (8,146 ) (20,770 ) Less: Other tour expenses (14,325 ) (15,253 ) (16,496 ) (10,076 ) (7,373 ) (18,813 ) Net Cruise Cost 162,865 148,266 151,882 140,253 102,641 182,508 Less: Fuel expense (7,013 ) (7,138 ) (9,004 ) (8,027 ) (4,694 ) (10,227 ) Net Cruise Cost Excluding Fuel 155,852 141,128 142,878 132,226 97,947 172,281 Non-GAAP Adjustments: Stock-based compensation (10,627 ) (5,411 ) (4,913 ) (5,429 ) (2,388 ) (3,573 ) National Geographic fee amortization (2,907 ) (2,907 ) (1,397 ) - (727 ) (2,907 ) Executive severance costs (1,409 ) - - Acquisition-related expenses - (943 ) - Merger-related expenses - - (13,344 ) (1,700 ) (1,027 ) (1,172 ) Adjusted Net Cruise Cost Excluding Fuel $ 140,909 $ 131,867 $ 123,224 $ 125,097 $ 93,805 $ 164,629 Adjusted Net Cruise Cost $ 147,922 $ 139,005 $ 132,228 $ 133,124 $ 98,499 $ 174,856 Available Guest Nights 186,719 181,990 184,366 75,389 51,624 221,516 Gross Cruise Cost per Available Guest Night $ 1,037 $ 981 $ 992 $ 2,080 $ 2,289 $ 1,003 Net Cruise Cost per Available Guest Night 872 815 824 1,860 1,988 824 Net Cruise Cost Excl. Fuel per Available Guest Night 835 775 775 Adj. Net Cruise Cost Excl. Fuel per Avail. Guest Night 755 725 668 1,754 1,897 778 1,659 1,817 743 Adjusted Net Cruise Cost per Available Guest Night 792 764 717 1,766 1,908 789 SourcesThe COVID-19 pandemic has had a material negative impact on our operations and Usesfinancial results and while we have substantially resumed operations, given the dynamic nature of Cashthis situation, we cannot reasonably estimate the impacts of the COVID-19 pandemic on our financial condition, results of operations, cash flows, plans and growth for the Years Endedforeseeable future. It2017, 20162021, we received $27.0 million under the CERTS Act, which provided grants to eligible motorcoach, school bus, passenger vessel, and 2015Net cash provided by operating activities was $52.9 million in 2017 compared to $31.4 million in 2016. The $21.5 million increase was primarily due to an increase of $20.7 million in unearned revenues. Net cash provided by operating activities decreased by $8.9 million in 2016 to $31.4 million from $40.3 million in 2015 primarily due to merger-related costs, changes inpilotage companies, see the liabilities for unearned passenger revenue, and changes in accounts payable and accrued expenses, offset by increases related to changes in prepaid expenses.Net cash used in investing activities was $78.5 million in 2017 compared to $86.4 million in 2016. The $7.9 million decrease was primarily relatednotes to the $9.9 million net cash usedconsolidated financial statements for the acquisition of Natural Habitat in 2016 offset by a $4.6 million increase in purchases of property and equipment in 2017 primarily related to growth in capital expenditures for our three newbuild vessels. Net cash used in investing activities was $86.4 million in 2016 compared to $81.5 million in 2015. The $4.9 million increase in cash used in investing activities was primarily related to an increase in purchases of property and equipment related to growth capital expenditures for our two newbuild coastal vessels and the $9.9 million net cash used for the acquisition of Natural Habitat in 2016 as compared to the purchase in May 2015 of our investment in CFMF.Net cash (used in) provided by financing activities was $13.4 million in 2017 compared to net cash used in financing activities of $16.4 million in 2016. The $3.0 million decrease was primarily related to a decrease of $4.2 million in repurchases of shares and warrants. The difference in cash used in financing activities of $16.4 million in 2016 as compared to $208.5 million of cash provided by financing activities in 2015 was primarily related to the $134.9 million net proceeds from the issuance of long-term debt in 2015, net of debt repayments and the $96.8 million in net proceeds from the merger.38Contractual Obligationsmore information. 2017, our contractual obligations were as follows: Payments due by period (In thousands) Total 2018 2019-2020 2021-2022 After 5 years Operating Activities: Operating lease obligations $ 8,074 $ 936 $ 2,248 $ 2,153 $ 2,737 Charter commitments 14,575 9,334 5,241 - - Other long-term liabilities 684 - - - 684 Investing activities: Purchase obligations - Fleet expansion 141,164 33,164 108,000 - - Financing Activities: Long-term debt obligations 173,150 1,750 6,025 165,375 - Interest on long-term debt 39,997 11,888 23,156 4,953 - Total $ 377,644 $ $ 144,670 $ 172,481 $ 3,421 Funding Needs and SourcesWe have historically relied on a combination of cash flows provided by operations and the incurrence of additional debt and/or the refinancing of existing debt to fund obligations. Similar to others in the industry, we have historically operated with a meaningful working capital deficit. This historical deficit is mainly attributable to the fact that, under our business model, a vast majority of guest ticket receipts are collected in advance of the applicable expedition date. These advance passenger receipts remain a current liability until the expedition date and the cash generated from these advance receipts is used interchangeably with cash on hand from other cash from operations. The cash received as advanced receipts can be used to fund operating expenses for the applicable future expeditions or otherwise, pay down credit facilities, invest in long-term investments or any other use of cash. We had a working capital deficit of $12.7 million as of December 31, 2017. As a result of the proceeds from the Restated Credit Facility and the merger,2021, we had a net working capital surplus of $47.1 million as of December 31, 2016. As of December 31, 2017, we had $96.4 million in cash and cash equivalents, excluding restricted cash.In November 2015, we announced that our Board of Directors authorized a $20.0 million stock and warrant repurchase plan (“Repurchase Plan”). In November 2016, our Board of Directors authorized a $15.0 million increase to the Repurchase Plan, to $35.0 million. This Repurchase Plan authorizes us to purchase from time to time our outstanding common stock and warrants through open market repurchases in compliance with Rule 10b-18 of the Securities Exchange Act of 1934, as amended, and/or in privately negotiated transactions based on market and business conditions, applicable legal requirements and other factors. Any shares and warrants purchased will be retired. The Repurchase Plan has no time deadline and will continue until otherwise modified or terminated at the sole discretion of our Board of Directors at any time. As of December 31, 2017, under this Repurchase Plan, we have cumulatively purchased 5,443,480 warrants for $14.0 million and 855,776 shares of common stock for $8.0 million, leaving $13.0 million authorized to be used to purchase our outstanding common stock and warrants pursuant to the Repurchase Plan.In December 2015, we signed a definitive agreement for the purchase of theNational Geographic Endeavour II to be used in our operations in the Galápagos Islands. The purchase price of $18.0 million was paid on April 25, 2016 when we took possession of the ship. We spent an additional $16.5 million in renovation costs, funded through cash on hand, and deployed the ship in the fourth quarter of 2016.The company paid Ice Floe, LLC $53.6 million related to theNational Geographic Quest and the vessel was delivered in July of 2017. The Company amended the agreement for the second vessel, theNational Geographic Venture, in October 2017. The current contract price is $57.0 million and the vessel is scheduled to be completed in the fourth quarter of 2018, subject to extension for certain events, such as change orders. As of December 31, 2017, the Company has paid Ice Floe, LLC $23.8 million related to theNational Geographic Venture. The Company may terminate the applicable Agreement in the event the Builder fails to deliver the vessel within one hundred eighty days of the applicable due date or the Builder becomes insolvent or otherwise bankrupt. The Agreement also contains customary representations, warranties, covenants and indemnities.In November 2017, the Company executed a contract to build a polar ice class vessel targeted to be competed in January 2020, with potential accelerated delivery to November 2019, with a total purchase price of 1,066.0 million Norwegian Krone (NOK). Subsequently, LME exercised its right to make payments in United States Dollars, which resulted in a purchase price of $134.6 million, including hedging costs. The first twenty percent of the purchase price was paid shortly after execution of the Agreement with the remaining eighty percent due upon delivery and acceptance of the vessel. The polar ice class contract includes options to build two additional ice class vessels, the first for delivery twelve months after the initial vessel and the second for delivery twelve months thereafter. The new build process exposes us to certain risks typically associated with new ship construction, which we manage through detailed planning and close monitoring by our internal marine team. The purchase of the ships has been funded through a combination of cash available on our balance sheet, our revolving credit facility and excess cash flows generated by our existing operations.39As of December 31, 2017, we had $173.2approximately $558.5 million in long-term debt obligations, including the current portion of long-term debt and excluding deferred financing costs.debt. We believe that our cash on hand our revolving credit facility (described below) and expected future operating cash inflows will be sufficient to fund operations, debt service requirements and necessary capital expenditures, assuming that our operations continue to proceed as we currently expect. our newbuilds and other assets and acquisitions, and our Repurchase Plan.upcoming expeditions as well as deposits for new reservations for future travel. However, there can be no assurance that cash flows from operations will be available in the future to fund future obligations.obligations or that we will not experience delays or cancellations with respect to further impact of the COVID-19 pandemic on our operations. May 8, 2015,February 4, 2022, we entered into a new revolving credit agreement with Credit Suisse A.G. (“Credit Suisse”) as Administrative Agent and Collateral Agent (“facility, which includes an aggregate principal amount of $45.0 million maturing February 2027, including a letter of credit sub-facility in an aggregate principal amount of up to $5.0 million (the “Revolving Credit Agreement”) for. Borrowings under the facility will bear interest at a $150.0 million facility, which was subsequently increasedrate per annum equal to, $175.0 million upon syndication on July 8, 2015 (“Amendedat our option, an adjusted SOFR rate plus a spread or a base rate plus a spread. The Revolving Credit Agreement”), in the formAgreement contains customary events of a $155.0 million U.S. term loan (the “U.S. Term Loan”)default provisions, affirmative and a $20.0 million Cayman term loan for the benefit of our foreign subsidiaries (the “Cayman Loan,” and together with the U.S. Term Loan, the “Loans”). The net proceeds from the Loans, net of discounts, fees and expenses, were approximately $164.1 million. negative covenants as well as financial covenants.7, 2016,27, 2018, we entered into a second amendedthe Third Amended and restated credit agreement with Credit Suisse as Administrative Agent and Collateral Agent (“Restated Credit Agreement (the “Amended Credit Agreement”), amending providing for a refinancing and amendment of the terms of our existing seniorprior secured credit facility withfacility. The Amended Credit Suisse (“Restated Credit Facility”). The Restated Credit Facility providesAgreement provided for our existing $175.0a $200.0 million senior secured first lien term loan facility (the “Term Facility”), maturing March 27, 2025, and a new $45.0 million senior secured incremental revolving credit facility (“Revolving Credit(the “Revolving Facility”), which includesincluded a $5.0 million letter of credit subfacility. Our obligations undersub-facility. In connection with the RestatedAmended Credit Agreement, we capitalized $4.2 million related to lender and third-party fees. During March 2020, we drew down the entire Revolving Facility are secured by substantially allwhich matures in March 2023 and $44.5 million of our assets. Asthe Revolving Facility was outstanding as of December 31, 20172021.principal balanceTerm Facility and Revolving Facility to waive the application of the total net leverage ratio covenant through June 2021. In connection with the amendment, the interest rate of the term loan was increased 125 basis points, to be paid-in-kind at maturity, a LIBOR minimum of 0.75% was added to the term loan and revolving credit facilities and certain covenants were amended to be more restrictive.LoansMain Street Loan was $170.6 millionpaid-in-kind for the first year and we had not drawn on our Restated Credit Facility.the principal was scheduled to amortize at a rate of 15% in each of the third and fourth years, with the remaining amounts to be paid at maturity. Voluntarily prepayment of the Main Street Loan was permitted without premium or penalty, other than customary “breakage costs” and fees for LIBOR-based loans. The Main Street Loan shall bore interest at a rate per annum of LIBOR for an interest period of 3-months plus 3.00%, for an aggregated rate of 3.21% as of December 31, 2021.Loans bearRevolving Facility bore interest at an adjusted ICE Benchmark Administration LIBO Rate (subject to a floor of 1.00%)administration LIBOR plus a spread of 4.50%. The Loans mature on May 8,3.50%, for an aggregated rate of 3.60% as of December 31, 2021. Borrowings underRevolving Credit Facility bear interest at an adjusted ICE Benchmark Administration LIBO Rate plus a spread of 4.00%, or, at our option, an alternative base rate plus a spread of 3.00%. We are also required to pay a 0.50% annual commitment fee on undrawn amounts under the Revolving Credit Facility, which matures on May 8, 2020.Term Facility.RestatedAmended Credit Agreement containscontained financial covenants that, among other things, (i) requirerequired us to maintain a total net leverage ratio (defineddefined as on any date of determination, the ratio of total debt on such date less up to $25.0$50.0 million of the unrestricted cash and cash equivalents to Adjusted EBITDA, (asas defined in the Amended Credit Agreement)Agreement, for the trailing 12-month period)12-initially, with 0.25 equal reductions annually thereafter until March 31, 2020,June 30, 2022 when the total net leverage ratio shallwould be 3.504.75 to 1.00 thereafter; (ii) limit the amount of indebtedness we maycould incur generally and specifically for intercompany debt, debt incurred to finance acquisitions and improvements, for capital and synthetic lease obligations, for standby letters of credit, and in connection with refinancings;refinancing; (iii) limit the amount we maycould spend in connection with certain types of investments; and (iv) require the delivery of certain periodic financial statements and an operating budget. The net leverage ratios covenant of Amended Credit Agreement were waived through June 2021. As of December 31, 2017, the required net leverage ratio was 4.25 to 1, and2021, we were in compliance with the financial covenants.covenants currently in effect.AgreementAgreementsLindblad Expeditions Holdings, Inc. (the “Company”) and its indirect, wholly-owned subsidiary (the “Borrower”)we entered into a senior secured credit agreement (the “Export“First Export Credit Agreement”) with Citibank, N.A., London Branch (“Citi”) and Eksportkreditt Norge AS, (together with Garantiinstituttet, now known as Eksfin, Export Finance Norway), (together with Citi, the “Lenders”). Pursuant to the First Export Credit Agreement, the Lenders have agreed to make available to the Borrower, at the Borrower’s option and subject to certain conditions, a loan in an aggregate principal amount not to exceedMarch 2020 we borrowed $107.7 million for the purpose of providing financing for up to 80% of the purchase price of our new polar ice-class vessel, the Company’s new expedition ice-class cruise vessel targeted to be completed in January 2020. Seventy percentNational Geographic Endurance. 70% of the loan will beis guaranteed by Garantiinstituttet for Eksportkreditt,Eksfin, the official export credit agency of Norway. If drawn upon,The loan amortizes quarterly based on a twelve-year profile, with 70% maturing over twelve years from drawdown, and 30% maturing over five years from drawdown. In June 2020, we amended our First Export Credit Agreement to defer approximately $9.0 million in aggregate scheduled amortization payments originally due in June 2020 through March 2021 and to suspend the total net leverage ratio covenant from June 2020 through June 2021. During June 2021, we further amended our First Export Credit Agreement to, among other things, extend the deferral of scheduled amortization payments through December 2021 in the aggregate amount of $15.7 million, extend the waiver of its total net leverage ratio covenants through March 31, 2022, increase the interest rate spread by 50 basis points and annualize EBITDA used in its covenant calculation through December 31, 2022. The First Export Credit Agreement, as amended, bears interest at a floating interest rate equal to three-month LIBOR plus a margin of 3.50% per annum, for an aggregated rate of 3.70% over the borrowing period covering December 31, 2021.will be made atis guaranteed by Eksfin. During September 2021 the time of deliveryNational Geographic Resolution was delivered and we have borrowed the $122.8 million under the agreement including drawing approximately $30.5 million in 2019, $30.6 million in 2020 and $61.7 million in 2021. The loan amortizes quarterly based on a twelve-year profile, with 70% maturing over twelve years from final drawdown, and 30% maturing over five years from final drawdown. In June 2020, we amended our Second Export Credit Agreement to suspend the total net leverage ratio covenant from June 2020 through June 2021. During June 2021, we further amended our Second Export Credit Agreement to, among other things, extend the waiver of the vessel.total net leverage ratio covenants through March 31, 2022, increase the interest rate spread by 50 basis points and annualize EBITDA used in the covenant calculation through December 31, 2022. Certain other covenants continue to be more restrictive during the extended covenant waiver period. The Second Export Credit Agreement, as amended, bears a variable interest rate equal to three-month LIBOR plus a margin of 3.50% per annum, or 3.71% over the borrowing period covering December 31, 2021.402 – 2—Summary of Significant Accounting Policies of our consolidated financial statements included elsewhere in this Form 10-K, certain accounting policies are deemed “critical,” as they require management’s highest degree of judgment, estimates and assumptions. While management believes its judgments, estimates and assumptions are reasonable, they are based on information presently available and actual results may differ significantly from those estimates under different assumptions and conditions.75%80% of our non-current assets at December 31, 2017.2021. We make several critical accounting estimates with respect to our ship accounting. Given the very large and complex nature of our ships, our accounting estimates related to ships and determinations of ship improvement costs to be capitalized require considerable judgment and are inherently uncertain.dry-dockdrydock expenses, are charged to expense as incurred.estimate theaccount for stock-based compensation issued to employees, non-employee directors or other service providers in accordance with Accounting Standards Codification 718, Compensation - Stock Compensation, that requires awards to be recorded at their fair value of share-based payment awards on the date of the grant using an option-pricing model and restricted share values and recognize the expenseamortized over the required service periods.For recording our stock-based compensation expense for service-based options, we have chosen to use:●the straight-line method of allocating compensation cost for service-based options;●the Black-Scholes option pricing formula for time-based options;●the simplified method to calculate the expected term for options;●an estimate of expected volatility based on the historical volatility of our share price; and●an estimate for expected forfeitures.The three factors which most affect stock-based compensation are the fair valueperiod of the common stock underlyingaward. Stock-based compensation costs are recognized on a straight-line basis over the stock options,requisite service period of the award, which is generally the vesting term of the options and the volatility of such fair value of the underlying common stock. If our estimates are too high or too low, we may overstate or understate our stock-based compensation expense.equity instrument issued.41Off-Balance Sheet ArrangementsWe did not have any off-balance sheet arrangements as of December 31, 2017 and 2016.2– 2—Summary of Significant Accounting Policies for further information onRecent Accounting Pronouncements.business, primarily due to our international operations.business. The primary exposure relates to the exchange rate fluctuations between our U.S. dollar functional reporting currency and other currencies. This exposure includes trade receivablesprepaid assets, newbuild contracted payments, charter commitments and current liabilities that are denominated in currencies other than our functional currency. To date, fluctuations in exchange rates have not had a material impact on our results of operations.contracts and may, in the future, have ship construction contracts which are denominated in currencies other than the U.S. dollar. While we have entered into, and may, in the future, enter into, forward contracts and collar options to manage a portion of the currency risk associated with these contracts, we are, or may be, exposed to fluctuations in the exchange rates for the portionsDue toHistorically, we have not experienced significant fluctuations in fuel costs with changes in world fuel commodity prices, the specific geographies in which we operate and the cost of providing access to fuel in our remote destinations we have historically not experienced significant fluctuations in fuel costs with changes in world fuel commodity prices and have not historically hedged our fuel purchases. Fuel costs represented 4.5%, 5.7% and 3.0% of our tour revenues for the years ended December 31, 2021, 2020 and 2019, respectively.also exposed to a market risk fromfor interest rates related to our variable rate debt instruments. We assess our market risks based on changes in interest rates charged on debt. Theutilizing a sensitivity analysis that measures the potential impact on earnings is subject toand cash flows based on a hypothetical 100 basis point change as a result of movements in market rates. A hypothetical increase in interest ratesrates. For additional information regarding our long-term borrowings see Note 6 to our Consolidated Financial Statements included herein. As of 100 basis points would result in potential reductionDecember 31, 2021, we had interest rate cap agreements to hedge a portion of future pre-tax earningsour exposure to interest rate movements of approximately $1.7 million per year for the $170.6 millionour variable rate debt and to manage our interest expense. The notional amount of outstanding under the Restated Credit Agreementdebt associated with interest rate cap agreements as of December 31, 2017. Our ability2021 was $100.0 million. Based on our December 31, 2021 outstanding variable rate debt balance, a hypothetical 100 basis point increase in LIBOR interest rates related to meet our variable interest rate debt service obligations will be dependent uponinstruments would impact our future performance which,annual interest expense by approximately $4.3 million. Following the February 4, 2022 refinancing of our Third Amended and Restated Credit Agreement, including the Main Street Expanded Loan Facility and the senior secured incremental revolving credit facility, a hypothetical 100 basis point increase in turn, is subjectLIBOR interest rates related to future economic conditions and to financial, business and other factors.our variable interest rate debt instruments would impact our annual interest expense by approximately $2.3 million.Inin and Disagreements with Accountants on Accounting and Financial Disclosurethisthat evaluation, our Chief Executive Officerprincipal executive officer and Chief Financial Officerprincipal financial officer concluded that our disclosure controls and procedures were effective as of December 31, 2017.2021.42Management’sManagement’s Report on Internal Control over Financial Reporting2017,2021, using the criteria described in Internal Control-Integrated Framework (2013) issued by the COSO.Committee of Sponsoring Organizations of the Treadway Commission (COSO). Based on ourthe evaluation under the updated internal control framework in Internal Control-Integrated Framework (2013), management concluded that our internal control over financial reporting was effective as of December 31, 2017.2021.As long as we qualify as an “emerging growth company” as defined by the Jumpstart our Business Startups Act of 2012, we will not be required to obtain an auditor’s attestation report on our internal controls in future Annual Reports on Form 10-K as otherwise required by Section 404(b) of the Sarbanes-Oxley Act. Accordingly, our independent registered public accounting firm did not perform an auditThe effectiveness of our internal control over financial reporting for the fiscal year endedas of December 31, 2017.2021 has been audited by Marcum LLP, an independent registered public accounting firm, as stated in their report which appears in Item 9A of this Annual Report on Form 10-K.20182022 Annual Meeting of Shareholders.Stockholders.CodeBasis for OpinionConductthe effectiveness of internal control over financial reporting, included in the accompanying “Management Annual Report on Internal Control over Financial Reporting”. Our responsibility is to express an opinion on the Company's internal control over financial reporting based on our audit. We are a public accounting firm registered with the PCAOB and Ethicsare required to be independent with respect to the Company in accordance with the U.S. federal securities laws and the applicable rules and regulations of the Securities and Exchange Commission and the PCAOB.have adopted Codesconducted our audit in accordance with the standards of Business Conductthe PCAOB. Those standards require that we plan and Ethicsperform the audit to obtain reasonable assurance about whether effective internal control over financial reporting was maintained in all material respects. Our audit of internal control over financial reporting included obtaining an understanding of internal control over financial reporting, assessing the risk that applies to our employees, including our principal executive officer, principal financial officera material weakness exists, and personstesting and evaluating the design and operating effectiveness of internal control based on the assessed risk. Our audit also included performing similar functions, and our directors. Our codes of ethics and business conduct can be found postedsuch other procedures as we considered necessary in the investor relations sections oncircumstances. We believe that our website athttp://www.expeditions.com. Noneaudit provides a reasonable basis for our opinion.websites referencedassets of the company; (2) provide reasonable assurance that transactions are recorded as necessary to permit preparation of financial statements in this Annual Reportaccordance with generally accepted accounting principles, and that receipts and expenditures of the company are being made only in accordance with authorizations of management and directors of the company; and (3) provide reasonable assurance regarding prevention or timely detection of unauthorized acquisition, use, or disposition of the company’s assets that could have a material effect on the financial statements.the information contained therein is incorporated herein by reference. Future material amendments or waivers relatingdetect misstatements. Also, projections of any evaluation of effectiveness to future periods are subject to the Coderisk that controls may become inadequate because of Ethics will be disclosed on our website referencedchanges in this paragraph within four business days followingconditions, or that degree of compliance with the datepolicies or procedures may deteriorate. 11.CompensationOfficers and Corporate GovernanceSECSecurities and Exchange Commission (“SEC”) within 120 days after the end of our fiscal year covered by this Form 10-K with respect to our 20182022 Annual Meeting of Shareholders.Stockholders.Item 12.Security Ownership of Certain Beneficial Owners and Management and Related Shareholder MattersInformation is incorporated herein by reference to our Definitive Proxy Statement to be filed with the SEC within 120 days after the end of our fiscal year covered by this Form 10-K with respect to our 2018 Annual Meeting of Shareholders.Securities Authorized for Issuance under Equity Compensation PlansPlan category Number of securities
to be issued upon
exercise of
outstanding options,
warrants and rights (a) Weighted
average exercise
price of
outstanding
options,
warrants
and rights Number of securities remaining
available for future issuance
under equity compensation
plans (excluding securities
reflected in column (a)) Equity compensation plans approved by security holders (1) 2,041,939 (2) N/A 2,102,194 (3) (1)Information is as of December 31, 2017.(2)Includes an aggregate of 1,086,134 unvested shares of restricted stock and restricted stock units.(3)Consists of shares available for issuance under our 2016 CEO Allocation Plan and our 2015 Long-Term Incentive Plan.Item 13.Certain Relationships and Related Transactions, and Director IndependenceInformation is incorporated herein by reference to our Definitive Proxy Statement to be filed with the SEC within 120 days after the end of our fiscal year covered by this Form 10-K with respect to our 2018 Annual Meeting of Shareholders.Item 14.Principal Accountant Fees and ServicesInformation is incorporated herein by reference to our Definitive Proxy Statement to be filed with the SEC within 120 days after the end of our fiscal year covered by this Form 10-K with respect to our 2018 Annual Meeting of Shareholders.44Item 15.Exhibits, Financial Statement Schedules(a)The following documents are filed as part of this Form 10-K or incorporated herein by reference:(1)Consolidated Financial Statements.See Index to Consolidated Financial Statements on page F-1.(2)Financial Statement Schedules.None.(3)Exhibits.The following exhibits are filed or incorporated by reference as part of this Form 10-K.4546*Management compensatory agreement.†Certain portions of the exhibit have been omitted pursuant to a confidential treatment order. An unredacted copy of the exhibit has been filed separately with the United States Securities and Exchange Commission pursuant to the request for confidential treatment.††Certain portions of the exhibit have been omitted pursuant to a request for confidential treatment. An unredacted copy of the exhibit has been filed separately with the United States Securities and Exchange Commission pursuant to a request for confidential treatment.47Pursuant to the requirements of Section 13 or 15(d) of the Securities Exchange Act of 1934, as amended, the registrant has duly caused this Annual Report on Form 10-K to be signed on its behalf by the undersigned, thereunto duly authorized on March 2, 2018.LINDBLAD EXPEDITIONS HOLDINGS, INC.(Registrant)By:/s/ Sven-Olof LindbladSven-Olof LindbladChief Executive Officer and President(Principal Executive Officer)Pursuant to the requirements of the Securities Exchange Act of 1934, as amended, this report has been signed below by the following persons on behalf of the registrant and in the capacities and on the dates indicated.SignatureTitleDate/s/ Sven-Olof Lindblad Chief Executive Officer and DirectorMarch 2, 2018Sven-Olof Lindblad(Principal Executive Officer)/s/ Craig I. FelensteinChief Financial OfficerMarch 2, 2018Craig I. Felenstein(Principal Financial and Accounting Officer)/s/ Bernard W. AronsonDirectorMarch 2, 2018Bernard W. Aronson/s/ Elliott Bisnow DirectorMarch 2, 2018Elliott Bisnow/s/ L. Dyson Dryden DirectorMarch 2, 2018L. Dyson Dryden/s/ Mark D. Ein Chairman of the BoardMarch 2, 2018Mark D. Ein/s/ Daniel J. HanrahanDirectorMarch 2, 2018Daniel J. Hanrahan/s/ John M. Fahey Jr. DirectorMarch 2, 2018John M. Fahey Jr./s/ Catherine B. Reynolds DirectorMarch 2, 2018Catherine B. Reynolds48LINDBLAD EXPEDITIONS HOLDINGS, INC.INDEX TO CONSOLIDATED FINANCIAL STATEMENTSF-1REPORT OF INDEPENDENT REGISTERED PUBLIC ACCOUNTING FIRMTo the Audit Committee of theBoard of Directors and Shareholdersof Lindblad Expeditions Holdings, Inc.We have audited the accompanying consolidated balance sheets of Lindblad Expeditions Holdings, Inc. and Subsidiaries (the “Company”) as of December 31, 2017 and 2016, and the related consolidated statements of operations, stockholders’ equity and cash flows for the three years in the period ended December 31, 2017, and the related notes (collectively referred to as the “financial statements”). In our opinion, the financial statements present fairly, in all material respects, the financial position of the Company as of December 31, 2017 and 2016, and the results of its operations and its cash flows for each of the years ended December 31, 2017, 2016 and 2015, in conformity with accounting principles generally accepted in the United States of America.TheseThe Company's management is responsible for maintaining effective internal control over financial statements are the responsibilityreporting, and for its assessment of the Company’s management.effectiveness of internal control over financial reporting, included in the accompanying “Management Annual Report on Internal Control over Financial Reporting”. Our responsibility is to express an opinion on the Company’sCompany's internal control over financial statementsreporting based on our audit. We are a public accounting firm registered with the Public Company Accounting Oversight Board (United States) (“PCAOB”)PCAOB and are required to be independent with respect to the Company in accordance with the U.S. federal securities laws and the applicable rules and regulations of the Securities and Exchange Commission and the PCAOB.
available for future issuance
under equity compensation
plans (excluding securities
reflected in column) 2,293,426 $ 14.18 3,806,993 (2) N/A N/A N/A /s/ Alex Schultz Director February 28, 2022 Alex Schultz The Company is not required to have, nor were we engaged to perform, an audit of its internal control over financial reporting. As part of our audit we are required to obtain an understanding of internal control over financial reporting but not for the purpose of expressing an opinion on the effectiveness of the Company’s internal control over financial reporting. Accordingly, we express no such opinion.auditaudits included performing procedures to assess the risks of material misstatement of the financial statements, whether due to error or fraud, and performing procedures that respond to those risks. Such procedures included examining, on a test basis, evidence regarding the amounts and disclosures in the financial statements. Our audit auditsalso included evaluating the accounting principles used and significant estimates made by management, as well as evaluating the overall presentation of the financial statements. We believe that our audit auditsprovide a reasonable basis for our opinion.MarcumllpCritical Audit Matters/s/ Marcum LLP2015.2015.March 2, 2018February 28, 2022 As of December 31, 2017 2016 ASSETS Current Assets: Cash and cash equivalents $ 96,443 $ 135,416 $ 150,753 $ 187,531 Restricted cash and marketable securities 7,057 9,015 21,940 16,984 8,275 5,473 Inventories 1,794 1,665 2,278 2,168 Marine operating supplies 5,045 4,142 Prepaid expenses and other current assets 21,351 20,782 27,094 17,014 Total current assets 131,690 171,020 210,340 229,170 Property and equipment, net 250,952 186,236 542,418 482,673 Goodwill 22,105 22,105 42,017 22,105 Intangibles, net 9,554 11,132 13,235 4,817 7,609 5,539 4,402 5,082 Other long-term assets 10,047 13,090 7,470 8,063 Deferred tax assets - 4,118 Total assets $ 424,348 $ 407,701 $ 827,491 $ 757,449 LIABILITIES Current Liabilities: Unearned passenger revenues $ 112,238 $ 91,501 $ 212,598 $ 120,737 Accounts payable and accrued expenses 30,422 30,662 49,252 22,341 1,553 1,475 Long-term debt - current 1,750 1,750 26,061 11,255 Total current liabilities 144,410 123,913 289,464 155,808 Long-term debt, less current portion 164,186 164,128 518,658 471,359 Deferred tax liabilties 2,444 - 3,178 3,915 Other long-term liabilities 684 681 247 90 Total liabilities 311,724 288,722 811,547 631,172 COMMITMENTS AND CONTINGENCIES 83,901 83,825 10,626 7,494 94,527 91,319 REDEEMABLE NONCONTROLLING INTEREST 6,302 5,170 STOCKHOLDERS’ EQUITY Preferred stock, $0.0001 par value, 1,000,000 shares authorized; no shares issued and outstanding - - Common stock, $0.0001 par value, 200,000,000 shares authorized; 45,427,030 and 45,659,762 issued; 44,787,608 and 45,470,219 outstanding as of December 31, 2017 and 2016, respectively 5 5 0 0 5 5 Additional paid-in capital 42,498 43,097 58,485 48,127 Retained earnings 63,819 70,707 Total stockholders’ equity 106,322 113,809 Total liabilities, stockholders’ equity and redeemable noncontrolling interest $ 424,348 $ 407,701 (136,439 ) (11,572 ) (634 ) (1,602 ) (78,583 ) 34,958 $ 827,491 $ 757,449 For the years ended December 31, 2017 2016 2015 Tour revenues $ 266,504 $ 242,346 $ 209,985 $ 147,107 $ 82,356 $ 343,091 Cost of tours 135,526 118,977 95,417 Gross profit 130,978 123,369 114,568 Operating expenses: 124,484 72,931 166,608 General and administrative 60,529 51,896 38,994 65,445 45,508 62,744 Selling and marketing 42,354 39,072 35,083 28,484 20,231 54,772 Depreciation and amortization 17,351 18,420 11,645 39,525 32,084 25,769 Merger-related expenses - - 13,344 Total operating expenses 120,234 109,388 99,066 257,938 170,754 309,893 Operating income 10,744 13,981 15,502 (110,831 ) (88,398 ) 33,198 Other (expense) income: Interest expense, net (9,736 ) (10,146 ) (10,901 ) (24,578 ) (16,692 ) (12,288 ) Gain (loss) on foreign currency 1,144 (720 ) (40 ) Gain (loss) on transfer of assets 454 (83 ) 7,502 Other (expense) income (133 ) (1,173 ) 5,030 Total other (expense) income (8,271 ) (12,122 ) 1,591 (1,265 ) (4,772 ) 94 15,487 (83 ) (66 ) (10,356 ) (21,547 ) (12,260 ) Income before income taxes 2,473 1,859 17,093 Income tax expense (benefit) 10,002 (3,200 ) (2,649 ) (121,187 ) (109,945 ) 20,938 (2,019 ) (9,805 ) 2,190 Net (loss) income $ (7,529 ) $ 5,059 $ 19,742 (119,168 ) (100,140 ) 18,748 38 (1,403 ) 2,395 (119,206 ) (98,737 ) 16,353 5,289 1,705 0 170 0 2,654 Net income attributable to noncontrolling interest 1,132 195 - Net (loss) income available to common stockholders $ (8,661 ) $ 4,864 $ 19,742 $ (124,665 ) $ (100,442 ) $ 13,699 Weighted average shares outstanding Basic 44,576,912 45,649,971 44,917,829 50,109,426 49,737,129 47,440,788 Diluted 44,576,912 46,456,921 45,575,387 50,109,426 49,737,129 49,426,563 Net (loss) income per share available to common stockholders Basic $ (0.19 ) $ 0.11 $ 0.44 $ (2.41 ) $ (2.01 ) $ 0.29 Diluted $ (0.19 ) $ 0.10 $ 0.43 $ (2.41 ) $ (2.01 ) $ 0.28 $ (119,168 ) $ (100,140 ) $ 18,748 (1,682 ) (2,247 ) (5,634 ) 2,650 5,326 1,624 968 3,079 (4,010 ) (118,200 ) (97,061 ) 14,738 38 (1,403 ) 2,395 $ (118,238 ) $ (95,658 ) $ 12,343 LINDBLAD EXPEDITIONS HOLDINGS, INC. AND SUBSIDIARIESConsolidated StatementsThe accompanying notes are an integral part of Stockholders’ Equity(In thousands, except share data)these consolidated financial statements. Common Stock Additional Paid-In Retained Total Stockholders’ Shares Amount Capital Earnings Equity Balance as of December 31, 2014 44,717,759 $ 4 $ 21,461 $ 46,101 $ 67,567 Stock-based compensation - - 4,913 - 4,913 CFMF transaction cancellation of warrant - - (83,467 ) - (83,467 ) Obligation to repurchase shares of common stock - - 4,966 - 4,966 Merger recapitalization - - 200,558 - 200,558 Payments to stockholders for merger - - (90,000 ) - (90,000 ) Issuance of stock for equity compensation plans 507,122 1 (4,880 ) - (4,880 ) Repurchase of warrants - - (5,478 ) - (5,478 ) Net income - - - 19,742 19,742 Balance as of December 31, 2015 45,224,881 5 48,073 65,843 113,921 Stock-based compensation 199,044 - 5,411 - 5,411 Issuance of stock for equity compensation plans 280,347 - (2,694 ) - (2,694 ) Repurchase of shares and warrants (308,718 ) - (10,343 ) - (10,343 ) Acquisition of Natural Habitat, Inc. 264,208 - 2,650 - 2,650 Net income - - - 4,864 4,864 Balance as of December 31, 2016 45,659,762 5 43,097 70,707 113,809 Stock-based compensation - - 10,627 - 10,627 Issuance of stock for equity compensation plans 314,326 - (5,034 ) - (5,034 ) Repurchase of shares and warrants (547,058 ) - (6,192 ) - (6,192 ) Cumulative effect of change in accounting principle - - - 1,773 1,773 Net loss - - - (8,661 ) (8,661 ) Balance as of December 31, 2017 45,427,030 $ 5 $ 42,498 $ 63,819 $ 106,322 45,814,925 $ 5 $ 41,539 $ 75,171 $ (671 ) $ 116,044 - 0 3,573 0 0 3,573 6,241 0 (1,786 ) 0 0 (1,786 ) (1,895 ) 0 (23 ) 0 0 (23 ) 3,898,251 0 2,968 (2,654 ) 0 314 - 0 0 0 (4,010 ) (4,010 ) - 0 0 (7,215 ) 0 (7,215 ) - 0 0 16,353 0 16,353 49,717,522 $ 5 $ 46,271 $ 81,655 $ (4,681 ) $ 123,250 - 0 2,388 0 0 2,388 196,507 0 (405 ) 0 0 (405 ) (8,517 ) 0 (127 ) 0 0 (127 ) - 0 0 0 3,079 3,079 - 0 0 7,215 0 7,215 - 0 0 (1,705 ) 0 (1,705 ) - 0 0 (98,737 ) 0 (98,737 ) 49,905,512 $ 5 $ 48,127 $ (11,572 ) $ (1,602 ) $ 34,958 - 0 5,429 0 0 5,429 246,608 0 (2,221 ) 0 0 (2,221 ) 82,302 0 1,770 0 0 1,770 566,364 0 5,380 0 0 5,380 - 0 0 (170 ) 0 (170 ) - 0 0 0 968 968 - 0 0 (202 ) 0 (202 ) - 0 0 (5,289 ) 0 (5,289 ) - 0 0 (119,206 ) 0 (119,206 ) 50,800,786 $ 5 $ 58,485 $ (136,439 ) $ (634 ) $ (78,583 ) For the years ended December 31, 2017 2016 2015 Cash Flows From Operating Activities Net (loss) income $ (7,529 ) $ 5,059 $ 19,742 $ (119,168 ) $ (100,140 ) $ 18,748 Adjustments to reconcile net income to net cash provided by operating activities: Depreciation and amortization 17,351 18,420 11,645 39,525 32,084 25,769 Amortization of National Geographic fee 2,907 2,907 1,397 0 727 2,907 Amortization of deferred financing costs and other, net 2,226 1,144 3,576 3,203 2,146 1,875 21 49 259 Stock-based compensation 10,627 5,411 4,913 5,563 2,388 3,573 Deferred income taxes 8,336 (3,326 ) (3,413 ) (833 ) (9,812 ) 1,486 (Gain) loss on foreign currency (1,144 ) 720 40 Loss (gain) on disposal and transfer of assets - 819 (7,502 ) 1,265 4,772 (94 ) 0 111 0 Changes in operating assets and liabilities Inventories and marine operating supplies (1,036 ) 1,073 (163 ) (2,912 ) 685 (1,557 ) Prepaid expenses and other current assets 575 629 (1,100 ) (8,856 ) 12,525 (8,250 ) Unearned passenger revenues 20,709 245 3,723 83,946 (18,088 ) 15,336 Other long-term assets 136 (3,642 ) - (684 ) 594 (5,071 ) Other long-term liabilities 3 4 230 6,140 844 2,764 Accounts payable and accrued expenses (243 ) 1,964 7,214 25,285 (21,142 ) 4,838 Net cash provided by operating activities 52,918 31,427 40,302 32,495 (92,257 ) 62,583 Cash Flows From Investing Activities Purchases of property and equipment (80,485 ) (75,933 ) (14,800 ) (96,688 ) (155,479 ) (96,002 ) Redemption of restricted cash and marketable securities 1,958 (555 ) (125 ) Acquisition of Natural Habitat, Inc., net of $4,904 cash acquired - (9,946 ) - Purchase of investment in CFMF - - (68,088 ) Advance from stockholder - - 1,501 (18,036 ) 0 0 0 0 (4,083 ) Net cash used in investing activities (78,527 ) (86,434 ) (81,512 ) (114,724 ) (155,479 ) (100,085 ) Cash Flows From Financing Activities Repurchase of common stock and warrants (6,192 ) (10,343 ) (5,478 ) Repurchase under stock-based compensation plans and related tax impacts (5,034 ) (2,694 ) (4,879 ) 61,720 268,339 30,476 Repayments of long-term debt (1,750 ) (1,750 ) (41,879 ) (5,957 ) (2,842 ) (2,000 ) Payment of deferred financing costs (418 ) (1,565 ) (11,045 ) (3,135 ) (6,972 ) (2,372 ) Proceeds from long-term debt - - 175,000 Net proceeds from merger - - 186,806 Payments to stockholders for the merger - - (90,000 ) Net cash (used in) provided by financing activities (13,394 ) (16,352 ) 208,525 Effect of exchange rate changes on cash 30 (128 ) (91 ) Net (decrease) increase in cash and cash equivalents (38,973 ) (71,487 ) 167,224 (2,221 ) (405 ) (1,786 ) 0 85,000 0 0 (127 ) (23 ) 0 0 314 50,407 342,993 24,609 (31,822 ) 95,257 (12,893 ) 204,515 109,258 122,151 Cash and cash equivalents as of beginning of year 135,416 206,903 39,679 Cash and cash equivalents as of end of year $ 96,443 $ 135,416 $ 206,903 $ 172,693 $ 204,515 $ 109,258 Supplemental disclosures of cash flow information: Cash paid during the year for: Interest $ 10,478 $ 9,896 $ 7,003 $ 18,260 $ 16,316 $ 14,330 Income taxes $ 965 $ 998 $ 379 98 700 1,171 Non-cash investing and financing activities: $ 5,289 $ 1,706 $ 0 1,770 0 0 170 0 0 Additional paid-in capital exercise proceeds of option shares $ 1,682 $ 1,123 $ 2,240 0 0 225 Additional paid-in capital exchange proceeds used for option shares $ (1,682 ) $ (1,123 ) $ (2,240 ) 0 0 (225 ) 0 0 2,654 –— BUSINESSsubsidiariessubsidiaries’ (the “Company” or “Lindblad”) currently operate a fleet of seven owned expedition ships and five seasonal charter vessels under the Lindblad brand.Lindblad’s mission is to offeroffering life-changing adventures on all seven continentsaround the world and pioneering innovative ways to allow its guests to connect with exotic and remote places. The Company’sCompany currently operates a fleet of 10 owned expedition ships areand five seasonal charter vessels under the Lindblad brand, operates land-based, eco-conscious expeditions and active nature focused tours under the Natural Habitat, Inc. (“Natural Habitat”) and Off the Beaten Path, LLC (“Off the Beaten Path”) brands, designs handcrafted walking tours under the Classic Journeys, LLC (“Classic Journeys”) brand and operates luxury cycling and adventure tours under the DuVine Cycling + Adventure Company (“DuVine”) brand.ManyEach expedition ship is fully equipped with state-of-the-art tools for in-depth exploration and the majority of these expeditions involve travel to remote places with limited infrastructure and ports, (suchsuch as Antarctica and the Arctic)Arctic, or places that are best accessed by a ship, (suchsuch as the Galápagos Islands, Alaska, Baja’sBaja California’s Sea of Cortez Costa Rica and Panama),Panama, and foster active engagement by guests. Each expedition ship is designed to be comfortable and inviting, while being fully equipped with state-of-the-art tools for in-depth exploration. The Company has an alliance with the National Geographic Partners, LLC (“National Geographic”), which often provides for lecturers and National Geographic experts, including photographers, writers, marine biologists, naturalists, field researchers and film crews.AcquisitionDuVine, Off the Beaten Path and Classic Journeys.On May 4, 2016, the Company acquired an 80.1% ownership interestNatural Habitat offers over 100 different expedition itineraries in Natural Habitat, Inc. (“Natural Habitat”), an adventure travelmore than 45 countries spanning all seven continents, with eco-conscious expeditions and ecotourism company based in Colorado. Natural Habitat was founded by Benjamin L. Bressler (“Mr. Bressler”), who retains a 19.9% noncontrolling interest in Natural Habitat. With the acquisition of Natural Habitat, the Company expanded its itineraries to include land-based offerings around the globe. Natural Habitat’s expeditionsnature-focused, small-group tours that include polar bear tours in Churchill, Canada, Alaskan grizzly bear adventures, small-group Galápagos Islands tours and African safaris. In addition to its land offerings, Natural Habitat offers select itineraries on seven small chartered vessels for parts of the year. Natural Habitat has partnered with World Wildlife Fund (“WWF”) to offer conservation travel, which is sustainable travel that directly protects nature.contributes to the protection of nature and wildlife. MergerReturn to Fleet OperationsCapitolthree ships in Alaska and another in the Galápagos Islands, and subsequently, the Company resumed operations on the majority of its remaining vessels with additional ships operating in Alaska, the Galápagos Islands, Iceland, the Pacific Northwest, Baja California's Sea of Cortez and Antarctica. The Company continues to work with local authorities on plans to operate itineraries in additional geographies during 2022. As the COVID-19 virus effects travel restrictions in various locations around the world, the Company also continues to work with its guests toCapitol Acquisition Corp. II (“Capitol”) was originally incorporated in Delaware on August 9, 2010 as a blank check company to acquire, through a merger, share exchange, asset acquisition, stock purchase, recapitalization, reorganization or other similar business combination, one or more businesses or entities.On July 8, 2015, Capitol completed a seriesAs of mergers whereby Lindblad Expeditions, Inc. (“LEX”) became Capitol’s wholly-owned subsidiary. As consideration for December 31, 2021, the mergers, the total purchase price consisted of an aggregate of (i) $90.0Company had $150.8 million in unrestricted cash (a portionand $21.9 million in restricted cash primarily related to deposits on future travel originating from U.S. ports. During the year ended December 31, 2021, the Company received $27.0 million under the Coronavirus Economic Relief for Transportation Services (“CERTS”) Act, which provided grants to eligible motorcoach, school bus, passenger vessel, and pilotage companies, see Note 2—Summary of which was paid as transaction bonuses) and (ii) 20,017,787 shares of Capitol common stock. Capitol also assumed outstanding LEX stock options and converted such options into options to purchase an aggregate of 3,821,696 shares of Capitol common stock with an exercise price of $1.76 per share.Significant Accounting Policies for additional information.resulttotal debt position of $558.5 million and was in compliance with all of its debt covenants.mergers, LEX became a direct wholly-owned subsidiaryNational Geographic Resolution. Capitol. Immediately following the mergers, Capitol, which had no operations, changed its name to Lindblad Expeditions Holdings, Inc. and therefore Lindblad has presented LEX’s information as thatscheduled amortization payments of the Company.first export credit facility through December 2021 in the aggregate amount of $15.7 million and extend the waiver of its total net leverage ratio covenant through March 31, 2022, and annualize EBITDA used in its covenant calculation through December 31, 2022. See Note 6—Long-term Debt for additional information. –— SUMMARY OF SIGNIFICANT ACCOUNTING POLICIESThe merger with LEX has been accounted for as a reverse acquisition. Under this method of accounting, Capitol has been treated as the “acquired” company for financial reporting purposes. This determination was primarily based on LEX comprising the ongoing operations and assets of the combined entity and LEX senior management comprising the senior management of the combined company. In accordance with guidance applicable to these circumstances, the merger has been considered to be a capital transaction in substance. Accordingly, for accounting purposes, the merger has been treated as the equivalent of LEX issuing shares for the net assets of Capitol, accompanied by a recapitalization. The net assets of Capitol have been stated at historical cost, with no goodwill or other intangible assets recorded. Operations prior to the merger are those of LEX. Additionally, the historical financial statements of LEX are now reflected as those of the Company.F-7Principles of ConsolidationThe consolidated financial statements of the Company included Lindblad Expeditions Holdings, Inc. and its consolidated subsidiaries. Natural Habitat’s balance sheet as of December 31, 2016 and results of operations for the period beginning May 5, 2016 and ending December 31, 2016 are included in the Company’s consolidated financial statements.ReclassificationsWe have reclassified certain prior period amounts to conform to the current period presentation, with no impact on consolidated net income or cash flows.fair value of the Company’s common stock and related warrants, the valuation of securities underlying stock-based compensation awards, income tax expense, the valuation of deferred tax assets and liabilities, the fair value ofTourRevenues are measured based on consideration specified in the Company’s contracts with guests and are recognized as the related performance obligations are satisfied. The majority of the Company’s revenues consist ofare derived from guest ticket revenues recognized from the sale of guest tickets and othercontracts which are reported as tour revenues fromin the saleconsolidated statements of operations. The Company’s primary performance obligation under these contracts is to provide an expedition, trip or tour, and may include pre- and post-expedition excursions, hotel accommodations, land-based expeditions and air transportation to and from the ships or the trip or tour beginning or end point. Upon satisfaction of the Company’s primary performance obligation, revenue is recognized over the duration of each expedition, trip or tour.that are not included in guest ticket prices, insurance proceeds,recognized upon purchase. Guest cancellation fees are recognized as tour revenues at the time of the cancellation. The Company records a liability for estimated trip insurance claims based on the Company’s claims history. Proceeds received from trip insurance premiums in excess of this liability are recorded as revenue in the period in which they are received.cancellation fees. Revenues from the sale of guest ticketsvarious agency networks and otheralliances. The following table disaggregates tour revenues are recognized gross, asby the Company has the primary obligation in the arrangement, has discretion in supplier selectionsales channel it was derived from: 56 % 41 % 45 % 14 % 18 % 17 % 18 % 25 % 23 % 5 % 5 % 6 % 93 % 89 % 91 % 7 % 11 % 9 % 100 % 100 % 100 % is involved in the determination of the service specifications.Contract Liabilities tour guests remit deposits in advance of tour embarkation. Guest tour deposits consist of guest ticket revenues as well as revenues from the sale of pre- and post-expedition excursions, hotel accommodations, land-based expeditions and air transportation to and from the ships, and trip insurance.ships. Guest tour deposits represent unearned revenues and are includedreported as unearned passenger revenues in the consolidated balance sheet when received. Guest depositsreceived and are subsequently recognized as tour revenues onrevenue over the dateduration of embarkation. Tourthe expedition. Accounting Standards Codification ("ASC"), Revenue from Contracts with Customers (Topic 606) defines a “contract liability” as an entity’s obligation to transfer goods or services to a customer for which the entity has received consideration from the customer. The Company does not consider guest deposits to be a contract liability until the guest no longer has the right, resulting from the passage of time, to cancel their reservation and receive a full refund. In conjunction with the suspension or rescheduling of expeditions, average ten days in duration. For tours in excess of ten days, where the tour days span a quarter end or year end, the Company recognizes revenue based upon expedition days earned. Guest cancellation feesprovided guests an option of either a refund or future travel certificates, which in some instances exceeded the original cash deposit. The Company has recorded liabilities up to the amount of cash deposits and additional value of any future travel certificates are being recognized as toura discount when applied to future expeditions. atpresented in the timeCompany's consolidated balance sheets are as follows: $ 73,267 (139,796 ) 214,312 $ 147,783 cancellation. Revenues from the saledirect costs associated with revenues during expeditions, trips and tours, including costs of additionalpre- or post-expedition excursions, hotel accommodations, land-based expeditions, air and other transportation expenses and costs of goods and services rendered onboard, are recognized upon purchase.payroll and related expenses for shipboard, guides and expedition personnel, food costs for guests and crew, fuel and related costs and other expenses such as land costs, port costs, repairs and maintenance, equipment expense, drydock, ship insurance and charter hire expenses.third-partythird-party claims in connections with its tour expedition activities, damages to hull and machinery for each of its vessels, war risks, workers’ compensation, employee health, directors’ and officers’ liability, property damages and general liabilities for third-partythird-party claims. The Company recognizes insurance recoverable from third-partythird-party insurers for incurred expenses at the time the recovery is probable and upon realization for amounts in excess of incurred expenses. All of the Company’s insurance policies are subject to coverage limits, exclusions and deductible levels.For the years ended As of December 31, 2017 2021 and 2016,2020, the Company self-insuresself-insured for medical insurance claims up to $100,000 and $60,000, respectively.$125,000 per claim. In addition, for the years ended as of December 31, 2017 2021 and 20162020, the Company maintainsmaintained Stop Loss coverage for medical claims in excess of the $100,000 and $60,000, respectively,$125,000, which havehad an aggregate deductible of $57,500. As of December 31, 2017 2021 and 2016,2020, the Company recorded a liability for Incurred-But-Not-RecordedIncurred-But-Not-Recorded (“IBNR”) medical claims, which was determined based on prior years claims experience over the prior four years.experience.TheIn certain instances, the Company is self-insured for the claims only which cover cancellations, interruption, missed connections and travel delays. The required reserve was determined based on claims experience over the prior four years.experience. While the Company believes its estimated IBNR and accrued claims reserves are adequate, the ultimate losses may differ.differ from its estimates.F-8joinjointly and severally indemnify each other to provide discounted primary and excess Protection and Indemnity coverage to club members. The resulting aggregated surplus of the clubs combines to provide the Company with below market primary and high excess liability coverage for covered losses. For consideration of long-term below market P&IProtection and Indemnity rates, the joint and several liability obligation requires the down-stream indemnification by their members, including the Company.AdministrativeGeneral and administrative expenses primarily represent the costs of ourthe Company’s shore-side vessel support, reservations and other administrative functions, and includes salaries and related benefits, professional fees and occupancy costs.printemail, digital media, traditional media, travel agencies and online advertising costs,brand websites, as well as costs associated with website development and maintenance. Also included aremaintenance, social media and corporate sponsorship costs. Advertising is charged to expense as incurred. Advertising expenses totaled $16.4$19.1 million, $14.7$9.3 million and $13.0$22.4 million for the years ended December 31, 2017, 20162021, 2020 and 2015,2019, respectively. The largest component of advertising expense for the years ended December 31, 2021 and 2020 was online advertising, which totaled $9.8 million and $3.5 million, respectively, and for the year ended December 31, 2019 the largest component was direct mail, which totaled $6.3 million, $5.5 million and $5.8 million for the years ended December 31, 2017, 2016 and 2015, respectively.Earnings per Common ShareEarnings per common share is computed by dividing net income available to common shareholders, by the weighted average number of common shares outstanding during the period. Diluted earnings per share is computed using the weighted average number of common shares outstanding and, if dilutive, potential common shares outstanding during the period. Potential common shares consist of the dilutive incremental common shares issuable upon the exercise of stock options (if such option is an equity instrument, using the treasury stock method). For the year ended December 31, 2017, there were no dilutive shares because the Company had a net loss. For the years ended 2016 and 2015, the Company determined, using the treasury method, there were 806,950 and 657,558, respectively, of dilutive common shares related to stock-based compensation.On July 8, 2015, as a result of the mergers and related to the reverse merger treatment and recapitalization, all historical weighted average common shares were adjusted by the exchange ratios established by the merger agreement.As of December 31, 2017 and 2016, 10,656,520 and 11,186,387 warrants, respectively, to purchase common stock at a price of $11.50 per share were outstanding. The Company determined these warrants were anti-dilutive and were not considered in the calculation of diluted weighted average shares outstanding.Prior to the mergers, basic weighted average shares outstanding included the shares underlying a warrant to purchase 60% of the outstanding common shares. As the shares underlying this warrant could have been issued for little consideration (an aggregate exercise price of $10.00), these shares were formerly deemed to be issued for purposes of basic earnings per share. Effective May 8, 2015, in connection with LEX closing on a transaction to purchase 100% of Cruise/Ferry Master Fund I, N.V. (“CFMF”), the warrant was cancelled. On July 8, 2015, as a result of the merger agreement, and the reverse merger treatment and recapitalization, these shares were not considered part of the recapitalization and therefore not included in basic or dilutive weighted average shares outstanding. For the year ended December 31, 2015, the Company excluded 1,912,833 (converted from 6,747 shares as a result of the merger) shares of common stock as these shares were subject to the warrants described above.$6.0 million.F-9For the years ended December 31, 2017, 2016 and 2015, the Company calculated earnings per share as follows: For the years ended December 31, (In thousands, except share and per share data) 2017 2016 2015 Net (loss) income available to common stockholders $ (8,661 ) $ 4,864 $ 19,742 Weighted average shares outstanding: Total weighted average shares outstanding, basic 44,576,912 45,649,971 44,917,829 Effect of dilutive securities: Assumed exercise of stock options, treasury method - 782,565 657,558 Assumed exercise of restricted shares, RSU’s, treasury method - 24,385 - Dilutive potential common shares - 806,950 657,558 Total weighted average shares outstanding, diluted 44,576,912 46,456,921 45,575,387 Net (loss) income per share available to Lindblad Basic $ (0.19 ) $ 0.11 $ 0.44 Diluted $ (0.19 ) $ 0.10 $ 0.43 threesix months or less, as well as deposits in financial institutions, to be cash and cash equivalents. The following table provides a reconciliation of cash, cash equivalents, $ 150,753 $ 187,531 $ 101,579 21,940 16,984 7,679 $ 172,693 $ 204,515 $ 109,258 The Company has not experienced any losses in such accounts. As of December 31, 2017 2021 and 2016,2020, the Company’s cash held in financial institutions outside of the U.S. amounted to $4.1$1.0 million and $2.7$7.2 million, respectively.IncludedThe amounts held in “Restrictedrestricted cash and marketable securities” on the accompanying consolidated balance sheets are restricted cash and marketable securities, consisting of six-month certificates of deposit and short-term investments. Restricted cash and marketable securities consist of the following: As of December 31, (In thousands) 2017 2016 Federal Maritime Commission escrow $ 4,186 $ 2,571 Credit negotiation and credit card processor reserves 1,530 5,030 Certificates of deposit and other restricted securities 1,341 1,414 Total restricted cash and marketable securities $ 7,057 $ 9,015 The amounts held in restricted cash and marketable securities represent principally funds required to be held in certificates of deposit by certain vendors and regulatory agencies and are classified as restricted assetscash since such amounts cannot be used by the Company until the restrictions are removed by those vendors and regulatory agencies. InterestThese amounts are principally held in certificates of deposit and interest income is recognized when earned.accounts.accounts, up to a maximum of $32 million. To satisfy this requirement, the Company entered into an agreement with a financial institution to escrow all unearned guest revenues collected for sailings from U.S. ports.the required amounts.F-10 As of December 31, $ 10,536 $ 1,945 9,814 13,856 1,590 1,183 $ 21,940 $ 16,984 At As of December 31, 2017 2021, and 2016 a2020, cash reservereserves of $1.5approximately $10.5 million and $5.0$1.9 million, respectively, iswere required for credit card deposits by third-partythird-party credit card processors.Amounts in the escrow accounts include cash, certificates of deposit and marketable securities. Cost of these short-term investments approximates fair value.first-in first-outfirst-in first-out method.first-in, first-outfirst-in, first-out method. As of December 31, $ 10,337 $ 5,630 4,791 3,504 4,304 2,283 4,051 3,817 2,012 530 1,397 1,105 202 145 $ 27,094 $ 17,014 As of December 31, (In thousands) 2017 2016 Prepaid tour expenses $ 9,846 $ 11,593 Prepaid air expense 3,621 2,432 Prepaid client insurance 2,525 2,141 Prepaid marketing, commissions and other expenses 2,495 1,823 Prepaid corporate insurance 1,033 931 Prepaid port agent fees 1,022 1,038 Prepaid income taxes 809 824 Total prepaid expenses $ 21,351 $ 20,782 netdepreciation and amortization.depreciation. Depreciation and amortization is computed using the straight-line method over the estimated useful lives of the assets, as follows:YearsVessels and vessel improvements15-25Furniture & equipment5Computer hardware and software5Leasehold improvements, including expedition sites and port facilitiesShorter of lease term or related asset life 15 - 25 5 5 2017, 2021, the Company owned and operated seven10 expedition vessels, including a new coastalwith an additional vessel currently being renovated to replace theNational Geographic Quest,Islanderwhich joined the fleet in the third quarter of 2017. The Company has contracted for two additional vessels. TheNational Geographic Venture,a coastal vessel, is expected to be completed in the fourth quarter of 2018, and a polar ice class vessel is targeted to be completed in the first quarter of 2020, with potential accelerated delivery to November 2019. The polar ice class contract includes options to build two additional ice class vessels, the first for delivery twelve months after the initial vessel and the second for delivery twelve months thereafter.Galapagos during 2022. The Company has a capital program for the improvement of its vessels and for asset replacements in order to enhance the effectiveness and efficiency of its operations; comply with, or exceed all relevant legal and statutory requirements related to health, environment, safety, security and sustainability; and gain strategic benefits or provide newer improved product innovations to its guests. to the vessels and depreciated over the shorter of the improvements, or the vessel’s, estimated remaining useful life, while costs of repairs and maintenance, including minor improvement costs and drydock expenses, are charged to expense as incurred and included in cost of tours. Drydock costs primarily represent planned maintenance activities that are incurred when a vessel is taken out of service. For U.S. flagged ships, the statutory requirement traditionally is an annual docking and U.S. Coast Guard inspections, normally conducted in drydock. Internationally flagged ships have scheduled dockings approximately every 12 months, for a period of up to three to six weeks.F-11authoritative guidance requiresCompany assesses qualitative factors to determine whether the existence of events or circumstances leads to a determination that it is more likely than not that the estimated fair value of goodwill be assessed annually for impairment.is less than its carrying amount. The Company completed the annual impairment test as of September 30, 2017 2021 with no indication of goodwill impairment. FutureAt December 31, 2020, the effects of COVID-19 on the Company’s expected future operating cash flows was a potential indicator that the carrying value of the Company's goodwill may not be recoverable. The Company therefore performed a discounted cash flow analysis of its goodwill for potential impairment tests will be performed annually as of September 30, or sooner if warranted.December 31, 2020, and based on the analysis, it was determined that there was 0 impairment to the Company's goodwill. As of December 31, 2021, the Company determined that there was 0 triggering event regarding goodwill. See Notes 4Note 5—Goodwill and 5Intangible Assets for further details on the Company’s goodwill.Intangibles, netIntangible AssetsIntangibles, netIntangible assets include tradenames, customer lists and operating rights. Tradenames are words, symbols, or other devices used in trade or business to indicate the source of products and to distinguish it from other products and are registered with government agencies and are protected legally by continuous use in commerce. Customer lists are established relationships withEcuador;Ecuador, theNational Geographic Endeavour II with 95 berths and theNational Geographic Islander with 4748 berths. In order to operate these vessels within the park, the Company is required to have in its possession cupos (licenses) sufficient to cover the total available berths on each vessel.June 2015, a new EcuadorianNovember 2021, the Special Law of Special Regimen for Protected AreasProvince of Galápagos was approvedmodified to provide owners of cupos a 20-year term contract with the Province of Galápagos, which was executed by the Company on February 25, 2022. The contract is subject to early termination by the government for non-compliance with the terms of the contract and updatedapplicable law regulations. The 20-year term is renewable by the cupos owner upon expiration of the contract, and cupos contracts that are terminated early shall, within one year of the non-renewal or early termination, be submitted to a public auction for a 20 year-term upon verification of compliance with certain environmental regulatory conditions. Our rights to operate in November 2015. A Presidential Decree issued by President Correa of Ecuador in November 2015 established that cupos, which were in effect since July 2015, will have a validity of nine years. The Company’s operating rightsthe Galápagos Islands are up fortherefore subject to annual renewal in July 2024 and, based on the new law and decree regarding the Company will begin the renewal process in 2020. The current “owners” of the cupos will have the opportunity to re-apply for them, but anycompliance with environmental and other enterprise or individual will have the opportunity to bid for the cupos. All bidders must present proof that they fulfill the conditions to properly utilize the license (access to a vessel, experience in tourism, proven environmental behavior, marketing, etc.). While the Company believes that, based on the expected criteria to retain cuposapplicable laws and its past operating history inregulations. there isNational Parks Service were to further restrict access to the park, we might be required to alter certain of our travel itineraries. Such a strong possibility that the Company will retain its cupos, from an accounting perspective, it will assume they retain no value after July 2024. Once the renewal process has begundevelopment would negatively impact our business and if it can be determined that the Company will be successful in its bid, then the Company will adjust its amortization prospectively. Operating rights are amortized over their remaining government mandated lives.revenues.intangibles, netintangible assets will be based on the Company’s ability to recover the carrying value of its asset, which is determined by using the asset’s estimated undiscounted future cash flows. If these estimated undiscounted future cash flows are less than the carrying value of the asset, an impairment charge is recognized for the excess, if any, of the asset’s carrying value over its estimated fair value. A significant amount of judgment is required in estimating the future cash flows and fair values of its tradenames, customer lists and operating rights. As of December 31, 2017 2020, the effects of COVID-19 on the Company’s expected future operating cash flows was a potential indicator that the carrying value of the Company's intangible assets may not be recoverable. The Company, therefore, performed a discounted cash flow analysis of its intangible assets for potential impairment as of December 31, 2020, and 2016,based on the analysis, it was determined that there was no0 impairment to the Company's intangible assets. As of December 31, 2021, the Company determined that there was 0 triggering event and the Company did not record an impairment forregarding intangible assets.2017 and 2016, there2020, the effects of COVID-19 on the Company’s expected future operating cash flows was no triggering event anda potential indicator that the carrying value of the Company's long-lived assets may not be recoverable. The Company did not recordtherefore performed an impairmentundiscounted cash flow analysis of its long-lived assets for potential impairment as of December 31, 2020, and based on the analysis, it was determined that there was 0 impairment to the Company's long-lived assets. In the first quarterAs of 2016, December 31, 2021, the Company reviewed the remaining useful life of theNational Geographic Endeavour, whichdetermined that there was replaced by theNational Geographic Endeavour II in the fourth quarter of 2016. The evaluation of theNational Geographic Endeavour’s useful life0 triggering event regarding long-lived assets, as of December 31, 2015 indicated a shorter remaining useful life of less than one year versus the previous estimated remaining useful life of seven years. See Note 3 – Property and Equipment. As a result, the Company accelerated the depreciation in orderreturned to fully depreciate the asset by the end of the fourth quarter of 2016.Investment in CFMF and Additional Paid-In CapitalThe Company uses the equity method of accounting for business investments when it has active involvement, but not control, in the venture. In 2015, the Company changed its accounting treatment for the investment in CFMF to the cost method and derecognized any earnings previously reported in the current year and adjusted the treatment of the CFMF transaction.operations.F-12On March 3, 2009, LEX issued a note payable to Cruise/Ferry Master Fund I, N.V. On December 11, 2014, LEX entered into a Profit Participation Loan Purchase Agreement with DVB Bank America, N.V. (“DVB”), a Profit Participation Rights Purchase Agreement with Buss Kreuzfahrtfonds 1 GmbH & Co. KG and Buss Kreuzfahrtfonds 2 GmbH & Co. KG, and a Stock Purchase Agreement with Cruise/Ferry Finance Partners Private Foundation. These three agreements enabled LEX to purchase the financial and equity interests in CFMF in order to recapture and extinguish an outstanding warrant to purchase 60%The investment in CFMF was liquidated subsequent to the purchase of CFMF on May 8, 2015. The CFMF assets acquired were the junior mortgage note receivable and warrant and both were cancelled and resulted in the removal of the junior mortgage note receivable, which had a relative fair value of $8.5 million, and related junior debt, which had a fair value of $16.0 million (a face value of $20.0 million less the debt discount of $4.0 million). This resulted in a $7.5 million gain on the transfer of assets and an $83.7 million adjustment to additional paid-in capital for the cancellation of the warrant.Assignment and Assumption AgreementIn connection with LEX’s agreement to purchase CFMF, Sven-Olof Lindblad (“Mr. Lindblad”) earned a success fee of $5.0 million from DVB for the purchase of CFMF (DVB was a partner in CFMF and the lender of LEX’s preexisting senior debt facility).On March 9, 2015, Mr. Lindblad and LEX entered into an Assignment and Assumption Agreement pursuant to which Mr. Lindblad (i) assigned and transferred to LEX his right to receive a $5.0 million fee payable to Mr. Lindblad personally by DVB and (ii) exercised his outstanding option to purchase 809,984 shares (converted from 2,857 shares at the merger date) of LEX’s stock for $0.1 million in aggregate exercise proceeds. In exchange for the assignment to LEX of the fee payable by DVB, all of Mr. Lindblad’s obligations under his loan agreement with LEX (the “Mr. Lindblad Loan Agreement”), which had a balance of principal and accrued interest of $2.8 million as of March 9, 2015, were deemed satisfied in full, the Mr. Lindblad Loan Agreement and related promissory note were terminated, and Mr. Lindblad’s obligation to pay the aggregate exercise price for the exercise of the option described above was satisfied in full. On May 8, 2015, LEX received the $5.0 million fee from DVB and compensated Mr. Lindblad $5.0 million (success fee compensation expense), which was paid by settling the $2.8 million outstanding amount of principal and interest owed and the aggregate exercise proceeds of $0.1 million payable in connection with the exercise of the option (above), and also offset by $2.1 million in required withholding taxes. $ 11,774 $ 5,645 11,595 0 9,692 5,285 5,348 2,963 4,396 3,495 4,185 1,803 887 0 870 870 505 270 0 2 0 2,008 $ 49,252 $ 22,341 As of December 31, (In thousands) 2017 2016 Accounts payable $ 7,791 $ 7,573 Accrued other expense 7,001 5,999 Bonus compensation liabilty 3,736 4,186 New build liability 2,730 4,011 Employee liability 2,644 3,494 Refunds and commissions payable 1,805 1,454 Royalty payable 1,673 1,468 Income tax liabilities 1,490 884 Travel certificate liability 1,120 1,218 Accrued travel insurance expense 432 375 Total accounts payable and accrued expenses $ 30,422 $ 30,662 F-13 years. The Company amortizes the total lease costs on a straight-line basis over the minimum lease term.The Company leases years, and computer hardware and software and office equipment with lease terms ranging from three to six years. and Disclosurethree-tierthree-tier fair value hierarchy is used to prioritize the inputs in measuring fair value as follows: 2017 2021 and 2016.2020. As of December 31, 2017 2021 and 2016,2020, other than derivative instruments and contingent acquisition consideration, the Company had no0 other liabilities that were measured at fair value on a recurring basis.Level 3 financial liabilities consistobligations forits non-U.S. dollar denominated receivables and payables. The Company primarily hedges a portion of its current-year currency exposure to several currencies, which therenormally include, but are not limited to, the Canadian and New Zealand dollars, the Brazilian real, South African rand, Indian rupee, the euro and the British pound sterling. The fluctuations in the value of these forward contracts largely offset the impact of changes in the value of the underlying risk they economically hedge. The Company also uses foreign exchange forward contracts, designated as cash flow hedges, from time-to-time as necessary, to manage its exposure to foreign denominated contracts. no current market for these securities such that the determinationfailure of fair value requires significant judgment or estimation. Changes in fair value measurements categorized within Level 3the counterparty to perform under the terms of the derivative contract. When the fair value hierarchyof a derivative contract is in an asset position, the counterparty has a liability to the Company, which creates credit risk for the Company. The Company continues to monitor counterparty credit risk as part of its ongoing hedge assessments.analyzed each periodcarried at fair value based on significant observable inputs (Level 2 inputs). Derivatives entered into by the Company are typically executed over-the-counter and are valued using internal valuation techniques, as quoted market prices are not readily available. The valuation technique and inputs depend on the type of derivative and the nature of the underlying exposure. The Company principally uses discounted cash flows along with fair value models that primarily use market observable inputs. These models take into account a variety of factors including, where applicable, maturity, currency exchange rates, interest rate yield curves and counterparty credit risks.estimatesvalue of the derivative depends on whether or assumptionsnot the transaction has been designated and recordedqualifies for hedge accounting. Derivatives that are not designated as appropriate.hedges are reported and measured at fair value through earnings.The U. S. Tax Cuts and Jobs Act (the “Tax Act”) introduces significant changes to U.S. income tax law that have a meaningful impact on our provision for income taxes. Due to the timing of the enactment and the complexity involved in applying the provisions of the Tax Act, we made reasonable estimates of the effects and recorded provisional amounts in our financial statements for the year ended December 31, 2017. Accounting for the income tax effects of the Tax Act requires significant judgments and estimates in the interpretation and calculations of the provisions of the Tax Act. The U.S. Treasury Department, the Internal Revenue Service (IRS), and other standard-setting bodies may issue guidance on how the provisions of the Tax Act will be applied or otherwise administered that is different from our interpretation. As we collect and prepare necessary data, and interpret the Tax Act and any additional guidance issued by the IRS or other standard-setting bodies, we may make adjustments to the provisional amounts that could materially affect our financial statements in the period in which the adjustments are made.“more-likely-than-not”“more-likely-than-not” that some or all of the deferred tax assets will be realized. The Company will continue to evaluate the deferred tax asset valuation allowance balances in all of ourits foreign and U.S. companies to determine the appropriate level of valuation allowances.F-14The Company is subject to income taxes in both the U.S. and the non-U.S. jurisdictions in which it operates. The Company regularly assesses the potential outcome of current and future examinations in each of the taxing jurisdictions when determining the adequacy of the provision for income taxes. The Company has only recorded financial statement benefits for tax positions which it believes reflect the “more-likely-than-not”“more-likely-than-not” criteria of FASB’sthe Financial Accounting Standards Board's ("FASB") authoritative guidance on accounting for uncertainty in income taxes, and it has established income tax reserves in accordance with this guidance where necessary. As of December 31, 2017 2021 and 2016,2020, the Company had a liability for0 unrecognized tax benefits of $0.4 million and $0.4 million, respectively, which was included in other long-term liabilities on the Company’s consolidated balance sheets.positions. The guidance also discusses the classification of related interest and penalties on income taxes. The Company’s policy is to record interest and penalties on uncertain tax positions as a component of income tax expense. During the years ended December 31, 2017 2021 and 2016,2020, interest and penalties on uncertain tax positions included in income tax expense was insignificant.threefour prior years remain subject to examination by tax authorities and the Company’s foreign tax returns for the current year and fourfive prior years remain subject to examination by tax authorities.NationalNational Geographic Endeavour IIand expectexpects to earn tax credits that will reduce the asset over the next several years.asset. connection with the merger on July 8, 2015, the Company, Mr. Lindblad, the Co-Chairmen of the Board of the Company, and National Geographic Society entered into a Call Optionan agreement where Mr. Lindblad agreed to grantgranted National Geographic Society an option to purchase 2,387,499 of Mr. Lindblad’s shares in the Company as consideration for the assumption of the NG Agreements.Tour Operator Agreement and an Alliance and License Agreement between the Company and National Geographic. The Company recorded a $13.8 million long-term asset using a fair value of $5.76 per option share. The balance offor the license agreement asset as of that was amortized over the agreement’s life. In the year ended December 31, 20172019, National Geographic Society exercised its rights in full under the option agreement to acquire the shares, and 2016 was $6.5 and $9.5 million, respectively. As of December 31, 2017 and December 31, 2016, the balance in other long-term assets was $10.0 million and $13.1 million, respectively.a cashless transaction acquired shares from Mr. Lindblad. See Note 9 – Commitments and Contingencies14—Related Party Transactions for more details. $ 4,084 161 (25 ) 4,220 (390 ) 145 (54 ) 43 $ 3,964 For the years ended December 31, 2017, 2016 and 2015, the Company recorded deferredDeferred financing costs relate to the issuance costs of $0.4 million, $1.6 millionrecognized debt liabilities and $11.0 million, respectively,are presented in long-termthe consolidated balance sheets as direct deduction from the debt amortizing thecarrying amount. Deferred financing costs are amortized over the termlife of the financing usingdebt or loan agreement through interest expense, net in the straight-line and effective interest method.consolidated statements of operations. See Note 7 – Long-Term6—Long-term Debt.U.S. dollarCompany’s functional currency is the functional currency in the Company’sU.S. dollar. Any foreign operations and remeasurement adjustments and gains or losses resulting from foreign currency transactions are recorded as foreign exchange gains or losses in the consolidated statements of operations.equity instrumentsstock-based compensation issued to employees, non-employee directors or other service providers in accordance with accounting guidanceASC 718, Compensation - Stock Compensation, that requires that awards areto be recorded at their fair value on the date of grant and are amortized over the service period of the award. The Company recognizes stock-based compensation costs on a straight-line basis over the requisite service period of the award, which is generally the vesting term of the equity instrument issued.issued, within general and administrative expenses.Segment ReportingSeries A Redeemable Convertible Preferred StockWe are primarily a specialty cruise operator with operations in two segments, Lindblad and Natural Habitat. We evaluate the performance of our business based largely on the results of our operating segments. The chief operating decision maker, or CODM, and management review operating results monthly, and base operating decisions on the total results at a consolidated level, as well as at a segment level. Our reports provided to the Board of Directors are at a consolidated level and also contain information regarding the separate results of both segments. Management performance and related compensation is primarily based on total results. While both segments have similar characteristics, the two operating and reporting segments cannot be aggregated because they fail to meet the requirements for aggregation.F-15Recent Accounting PronouncementsAugust 2017, the Financial Accounting Standards Board (“FASB”) issued Accounting Standards Update (“ASU”) No. 2017-12,Derivatives and Hedging (Topic 815)Targeted Improvements to Accounting for Hedging Activities. This guidance will make more financial and nonfinancial hedging strategies eligible for hedge accounting. It also amends the presentation and disclosure requirements and changes how companies assess effectiveness. It is intended to more closely align hedge accounting with companies’ risk management strategies, simplify the application of hedge accounting, and increase transparency as to the scope and results of hedging programs. Update No. 2017-12 is effective for years beginning after December 15, 2018. Early adoption is permitted. Management is currently assessing the impact this guidance will have on the financial position or results of operations. In May 2017, 2019, the FASB issued ASU No. 2017-09, Compensation 2019- Stock Compensation (Topic 718): Scope12, Income Taxes (Topic 740)–Simplifying the Accounting for Income Taxes. The amendments of Modification Accounting. The purpose of Update No. 2017-09 isthis ASU are intended to provide guidance about which changessimplify the accounting for income taxes by removing certain exceptions to the terms or conditionsgeneral principles in Topic 740. The amendments also improve consistent application of a share-based payment award require an entity to apply modification accounting. Update No. 2017-09 is effectiveand simplify GAAP for years beginning after December 15, 2017. Early adoption is permitted.other areas of Topic 740 by clarifying and amending existing guidance. The adoption ofCompany adopted this guidance is ASU January 1, 2021, as required, and it did not expected to have a material impact on our financial position or results of operations.In January 2017,to the FASB issued ASU No. 2017-04,Intangibles and Other (Topic 350):Simplifying the Test for Goodwill Impairment. The amendment was issued in response from stakeholders’ regarding the cost and complexity of the goodwill impairment test. To simplify the subsequent measurement of goodwill, the Board eliminated Step 2 from the goodwill impairment test. In computing the implied fair value of goodwill under Step 2, an entity had to perform procedures to determine the fair value at the impairment testing date of its assets and liabilities (including unrecognized assets and liabilities). Now the entity compares the fair value of the reporting unit with its carrying amount. Update No. 2017-04 is effective for years beginning after December 15, 2017. Early adoption is permitted. The Company does not believe the adoption of this guidance will have a material impact on our financial position or results of operations.In January 2017, the FASB issued ASU No. 2017-01,Business Combinations (Topic 805):Clarifying the Definition of a Business. The guidance was issued to clarify the definition of a business with the objective of adding guidance to assist entities with evaluating whether transactions should be accounted for as acquisitions (or disposals) of assets or businesses. The amendments in this Update provide a screen to determine when a set (inputs and processes that produce an output) is a business. The screen requires that when substantially all of the fair value of the gross assets acquired (or disposed of) is concentrated in a single identifiable asset or a group of similar identifiable assets, the set is not a business. ASU No. 2017-01 is effective for years beginning after December 15, 2017. Early adoption is permitted The Company does not believe the adoption of this guidance will have a material impact on our financial position or results of operations.In February 2016, the FASB issued ASU No. 2016-02,Leases (Topic 842). The guidance requires the recognition of lease right of use assets and lease liabilities by lessees for those leases previously classified as operating. This guidance was issued to increase transparency and comparability among organizations by disclosing key information about leasing arrangements. ASU 2016-02 is effective for years beginning after December 15, 2018. Early adoption is permitted. The Company is currently evaluating the effect adoption of this guidance will have on itsCompany’s consolidated financial statements.2014,March2020, the FASB issued ASU 2014-09,2020-4Revenue from Contracts with Customers, Reference Rate Reform (Topic 606). This848)–Facilitation of the Effects of Reference Rate Reform on Financial Reporting. The guidance of this ASU is based ondesigned to provide relief from the principleaccounting analysis and impacts that revenue is recognized upon the transfermay otherwise be required for modifications to agreements (e.g., loans, debt securities, derivatives, borrowings) necessitated by reference rate reform. It also provides optional expedients to enable companies to continue to apply hedge accounting to certain hedging relationships impacted by reference rate reform. Application of goods or services to customers in an amount that reflects the consideration to which the entity expects to be entitled in exchange for those goods or services. There have been multiple clarifying ASU’s issued subsequent to ASU 2014-09. We will adopt the guidance relatedis optional, is only available in certain situations, and is only available for companies to revenue recognition beginning in the first quarter of 2018, using the modified retrospective transition method applied to those contracts which were not completed as of the adoption date. Upon adoption, we will recognize the cumulative effect of adopting this guidance as an adjustment to the opening balance of retained earnings. Prior periods will not be restated. The Company does not believe the adoption of this guidance will have a material effect on our financial position or results of operations.Accounting Pronouncements Recently Adopted.In March 2016, FASB issued ASU No. 2016-09, “Compensation – Stock Compensation: Improvements to Employee Share- Based Payment Accounting” (Topic 718). This ASU significantly reduces the complexity and cost of accounting for excess tax benefits and tax deficiencies related to stock-based compensation. The Company adopted this guidance as requiredASU during the quarter ending Marchyear ended December 31, 2017. As2021, and it will not have a material impact to the Company’s consolidated financial statements as the related LIBOR designated agreements are modified with the lending institutions to an alternate reference rate.new guidance,complexity associated with applying GAAP for certain financial instruments with characteristics of liabilities and equity. The amendments reduce the number of accounting models for convertible debt instruments and convertible preferred stock, and address convertible instruments with conversion features, as well as other items. The Company recordedadopted this ASU on January 1, 2021, as required, and it did not have a de minimis benefitmaterial impact to the Company’s consolidated financial statements.duringand previously outstanding warrants, using the quarter ended March 31, 2017. The Company recognizedtreasury stock method, and the potential common shares that could be issued from conversion of the Preferred Stock, using the if-converted method. When a net loss occurs, potential common shares have an increase in deferred tax assetsanti-dilutive effect on earnings per share and retainedsuch shares are excluded from the diluted earnings in the amount of $1.8 million in accordance with the retrospective method of applying this guidance.per share calculation.F-16 $ (119,206 ) $ (98,737 ) $ 16,353 5,289 1,705 0 170 0 2,654 $ (124,665 ) $ (100,442 ) $ 13,699 50,109,426 49,737,129 47,440,788 50,109,426 49,737,129 49,426,563 $ (2.41 ) $ (2.01 ) $ 0.29 $ (2.41 ) $ (2.01 ) $ 0.28 3 –4— PROPERTY AND EQUIPMENT NET As of December 31, (In thousands) 2017 2016 Vessels and improvements $ 346,895 $ 267,415 $ 739,957 $ 649,286 Furniture and equipment 11,731 10,726 23,958 14,687 Leasehold improvements 1,425 1,425 1,426 1,425 Total property and equipment, gross 360,051 279,566 765,341 665,398 Less: Accumulated depreciation and amortization (109,099 ) (93,330 ) (222,923 ) (182,725 ) Property and equipment, net $ 250,952 $ 186,236 $ 542,418 $ 482,673 and amortization expense of the Company’s property and equipment for the years ended December 31, 2017, 20162021, 2020 and 2015 were $15.82019 was $37.6 million, $17.1$30.5 million and $11.3$24.2 million, respectively.2017, 2021, the Company had $80.5$96.7 million in capital expenditures, including capitalized interest, added to property and equipment, net.equipment. This amount primarily included $42.8$71.2 million for the two newbuild coastal vessels National Geographic Resolution, the new polar ice-class vessel delivered during September 2021, and $27.2$13.3 million towardfor the purchase of itsthe Crystal Esprit, which will eventually replace the National Geographic Islander in the Galápagos Islands. For the year ended December 31, 2020, the Company had $155.5 million in capital expenditures, including capitalized interest, added to property and equipment. This amount primarily included $149.5 million for the two new polar ice class vessel.ice-class vessels, the National Geographic Endurance, which was delivered in March 2020, and the National Geographic Resolution. The Company began to capitalize interest in January 2016 2018 for its two newbuild coastal vessels, its renovation improvements to theNational Geographic Endeavour IIEndurance, and in February 2019 for the polar ice class vessel.National Geographic Resolution. The capitalized interest has been and will continue to be added to the historical cost of the assets and is being depreciated over their useful lives beginning upon each vessel’s completion. For the year ended December 31, 2017 2021 and 2016,2020, the Company recognized $2.6 million and $1.5$3.3 million, respectively, in capitalized interest in property and equipment, net on the accompanying consolidated balance sheet.sheets.As partThe Company's goodwill carrying value as of December 31, 2021 was $42.0 million and related to the transition fromNational Geographic Endeavour toNational Geographic Endeavour II, we removed theNational Geographic Endeavourfrom operationsin December 2016 and incurred a loss on disposalacquisition of asset of approximately $0.8 million. Loss on disposal includes costs associated with inventory items and accrued expenses for anticipated costs to dispose of theNational Geographic Endeavour, including but not limited to port costs, fuel and crew expenses.NOTE 4 – ACQUISITIONOn May 4, 2016, the Company acquired an 80.1% ownership interest inits subsidiaries Natural Habitat, an adventure travelDuVine, Off the Beaten Path and ecotourism company based in Colorado. The acquisition provides Classic Journeys, see Note 9—Acquisitions. As of December 31, 2020, the Company with a platform to expand our land-based expeditions with a strong, trusted brand complimentary to Lindblad. In 2016, the Company incurred $1.0goodwill carrying value was $22.1 million of acquisition costsand related to the acquisition of Natural Habitat whichin 2016. The following is included in general and administrative expensesa rollforward of the Company’s consolidated statement of income.The Company recorded this transaction using the acquisition method for business combinations. The Company measured the identifiable assets, liabilities and non-controlling interest of Natural Habitat at their fair market value as of the acquisition date and separately measured goodwill at its fair market value as of the acquisition date. Goodwill is an intangible asset arising as a result of name, reputation, customer loyalty, location, products and similar factors not separately identified. The recorded goodwill has no tax basis and is therefore not tax deductible.The Company recognized a noncontrolling interest in Natural Habitat and measured the noncontrolling interest at fair value on the acquisition date. The noncontrolling interest is recognized as a redeemable noncontrolling interest to the extent that the risks and rewards of ownership substantially remain with the noncontrolling interest. Mr. Bressler’s noncontrolling interest in the remaining 19.9% interest in Natural Habitat is subject to a put/call arrangement. The arrangement between the Company and Mr. Bressler was established in order to provide a formal exit opportunity for Mr. Bressler and a path to 100% ownership for the Company. Mr. Bressler has a put option under certain conditions and subject to providing notice by October 31, 2020, that enables him, but does not obligate him, to sell his remaining interest in Natural Habitat on December 31, 2020. The Company has a call option, but not an obligation, with an expiration of December 31, 2025, under which it can buy Mr. Bressler’s remaining interest at a similar fair value measure as Mr. Bressler’s put option. These rights to purchase or sell the noncontrolling interest may be at a fixed or variable price, or at fair value, and may be exercisable on a fixed date or any time at some point in the future. The existence of these rights impacts (1) whether separate assets or liabilities should be recognized for these rights, (2) the classification of any minority ownership as a liability, equity or redeemable noncontrolling interest, and (3) the amount of earnings recognized in the financial statements. goodwill:F-17As the purchase prices indicated similar fair value measures, the put/call arrangement had been struck at fair value and each party is in agreement that the valuation is indicative $ 0 $ 22,105 $ 22,105 - - - 0 22,105 22,105 0 19,912 19,912 $ 0 $ 42,017 $ 42,017 As of December 31, 2017 2016 (In thousands) Gross Carrying Amount Accumulated Amortization Net Carrying Amount Weighted Average Useful Life (years) Gross Carrying Amount Accumulated Amortization Net Carrying Amount Tradenames $ 2,900 $ (322 ) $ 2,578 13.3 $ 2,900 $ (129 ) $ 2,771 Customer lists 3,300 (1,100 ) $ 2,200 3.3 3,300 (440 ) $ 2,860 Operating rights 6,529 (1,753 ) $ 4,776 6.6 6,529 (1,028 ) $ 5,501 Total intangibles, net $ 12,729 $ (3,175 ) $ 9,554 7.7 $ 12,729 $ (1,597 ) $ 11,132 $ 7,069 $ (1,266 ) $ 5,803 12.3 $ 2,900 $ (902 ) $ 1,998 6,182 (624 ) 5,558 4.5 3,300 (3,080 ) 220 6,529 (4,655 ) 1,874 2.6 6,529 (3,930 ) 2,599 $ 19,780 $ (6,545 ) $ 13,235 7.7 $ 12,729 $ (7,912 ) $ 4,817 The decrease in the Company’s intangibles, net is the result of amortization expense associated with intangible assets acquired in connection with the acquisition of Natural Habitat on May 4, 2016. As part of the acquisition, the Company acquired Natural Habitat’s tradenames, customer lists and goodwill in the amounts of $2.9 million, $3.3 million and $22.1 million, respectively. The Company did not record a goodwill impairment charge for the year ended December 31, 2017. See Note 4 – Acquisitions, for additional information regarding this acquisition. The Company began amortizing operating rights with a gross carrying value of $6.5 million in July 2015, as a result of changes to the laws regarding cupos in the GalapagosGalápagos National Park. See Note 2 – 2—Summary of Significant Policies,Intangibles, netIntangible Assets for a description of, and rationale for, amortizing operating rights.For Total amortization expense for the year ended December 31, 2021, was $1.9 million, and for each of the years ended December 31, 2017, 2016 2020 and 2015, amortization expense for intangibles, net2019 was $1.6 million, $1.3 million and $0.3 million, respectively. The Company expectsmillion. $ 2,433 2,433 2,131 1,708 1,084 3,446 $ 13,235 $1.6paid-in-kind at maturity, a LIBOR minimum of 0.75% was added to the term loan and revolving credit facilities and certain covenants were amended to be more restrictive.years ended purpose of providing financing for up to 80% of the purchase price of the Company’s new expedition ice-class cruise vessel, the National Geographic Endurance, delivered in March 2020. Seventy percent of the loan is guaranteed by Eksfin, the official export credit agency of Norway. The Company incurred approximately $2.4 million in financing fees related to the First Export Agreement, recorded as deferred financing costs as part of long-term debt. In June 2020, the Company amended its First Export Credit Agreement to defer scheduled amortization payments from June 2020 through March 2021 and to suspend the total net leverage ratio covenant from June 2020 through June 2021. During June 2021, the Company further amended its First Export Credit Agreement to, among other things, extend the deferral of scheduled amortization payments through December 2021 in the aggregate amount of $15.7 million, extend the waiver of its total net leverage ratio covenants through March 31, 2022, increase the interest rate spread by 50 basis points and annualize EBITDA used in its covenant calculation through December 31, 2018,2022.The loan amortizes quarterly based on a twelve-year profile, with 70% maturing over twelve years from drawdown, and 30% maturing over five years from drawdown. The loan is secured by a first priority mortgage over the National Geographic Endurance and the assignment of related insurances. The First Export Credit Agreement also contains customary events of default and mandatory prepayment events for, among other things, non-payment, breach of covenants, default on certain other indebtedness, certain large judgments and a change of control of the Company. In addition to paying interest on any outstanding loans under the facility, the Company is required to pay customary coordination, arrangement, agency, collateral and commitment fees. Amounts drawn under the First Export Credit Agreement may be voluntarily prepaid at any time subject to customary breakage costs. The First Export Credit Agreement bears interest at a floating interest rate equal to three-month LIBOR plus a margin of 3.50% per annum, for an aggregated rate of 3.70% over the borrowing period covering December 31, 2021.2020. Forsubject to certain conditions, a loan in an aggregate principal amount of $122.8 million for the year ended purpose of providing pre- and post-delivery financing for up to 80% of the purchase price of the Company’s new expedition ice-class cruise vessel, the National Geographic Resolution, delivered during September 2021. The Company borrowed a total of $122.8 million under the Second Export Credit Agreement, drawing approximately $30.5 million in 2019, $30.6 million in 2020 and $61.7 million in 2021. In June 2020, the Company amended its Second Export Credit Agreement to suspend the total net leverage ratio covenant from June 2020 through June 2021. During June 2021, the Company further amended its Second Export Credit Agreement to, amongand 2022, we expect amortization expense to be $1.1 million and $0.9 million, respectively,the Company was in compliance with the balance of $2.8 million amortized thereafter. Amortization expense for tradenames, customer lists and operating rights were recordedcovenants currently in depreciation and amortization expense in the accompanying consolidated statements of operations.NOTE 6 – LETTERS OF CREDITAs of December 31, 2017 and 2016, the Company had $1.15 million and $4.65 million, respectively, in letters of credit outstanding with financial institutions. The annual fee for letters of credit is 1% of the outstanding balance. The letters of credit are secured by a certificate of deposit maintained at the financial institutions and that mature in July 2018.NOTE 7 – LONG-TERM DEBTeffect.On May 4, 2016, inIn connection with the Natural Habitat acquisition in May 2016, Natural Habitat issued an unsecured promissory note to Mr.Benjamin L. Bressler, the founder of Natural Habitat, with an outstandingoriginal principal amount of $2.5 million due at maturity on December 31, 2020.million. The promissory note accrues interest at a rate of 1.44% annually, with interest payable every six months. On May 1, 2020, the promissory note was amended, changing the maturity date of the principal payments to be due in three equal installments with the first payment paid December 22, 2020, the second paid December 22, 2021 and the final payment due on December 22, 2022. Credit FacilityOtherOn May 8, 2015,The Company’s Off the Company entered intoBeaten Path subsidiary has a credit agreement with Credit Suisse, as Administrative Agent and Collateral Agent (“Credit Agreement”) for a $150.0 million facility, which was subsequently increased to $175.0 million upon syndication on July 8, 2015 (“Amended Credit Agreement”), in the form of a $155.0 million U.S. term loan (the “U.S. Term Loan”) and a $20.0 million Cayman term loan maturing June 2023 for the benefitpurchase of guest transportation vehicles. The loan’s original principal was $0.3 million, is collateralized by the Company’s foreign subsidiaries (the “Cayman Loan,”vehicles and together with the U.S. Term Loan, the “Loans”). On March 7, 2016, the Company entered into a Restated Credit Agreement with Credit Suisse, amending its existing senior secured credit facility with Credit Suisse (“Restated Credit Facility”). The Restated Credit Facility provides for the Company’s existing $175.0 million senior secured first lien term loan facility and a new $45.0 million senior secured incremental revolving credit facility (“Revolving Credit Facility”), which includes a $5.0 million letterbears interest of credit subfacility. The Company’s obligations under the Restated Credit Facility are secured by substantially all the assets4.77% as of the Company.December 31, 2021.F-19BorrowingsThe Company’s Off the Beaten Path subsidiary has a $0.8 million loan under the Loans bearMain Street Expanded Loan Facility, originated on December 11, 2020. For the first12 months, interest is not payable and accrued to the principal balance, thereafter, monthly interest payments are required. The outstanding balance will amortize at an adjusted ICE Benchmark Administration LIBO Rate (subjecta rate of 15% on both December 2023 and December 2024, with the remaining balance due December 2025. The loan bears a variable interest rate equal to a floor of 1.00%)one-month LIBOR plus a spread of 4.50%. As3.00%, or 3.21% as of December 31, 2017, the interest rate was 6.34%. The Loans mature on May 8, 2021. Borrowings under the Revolving Credit Facility bear interest at an adjusted ICE Benchmark Administration LIBO Rate plus a spread of 4.00%, or, at the option of the Company, an alternative base rate plus a spread of 3.00%. The Company is also required to pay a 0.50% annual commitment fee on undrawn amounts under the Revolving Credit Facility, which matures on May 8, 2020.The Restated Credit Agreement (i) requires the Company to satisfy certain financial covenants as set forth in the Amended Credit Agreement; (ii) limits the amount of indebtedness the Company This loan may incur; (iii) limits the amount the Company may spend in connection with certain types of investments; (iv) requires the delivery of certain periodic financial statements and an operating budget and (v) requires the mortgaged vessels and related inventory to be maintained in good working condition. As of December 31, 2017, the Company was in compliance with the covenants.Borrowings under the Revolving Credit Facility will be used for general corporate and working capital purposes and related fees and expenses. As of December 31, 2017, the Company had no borrowings under the Revolving Credit Facility.For the years ended December 31, 2017, 2016 and 2015, deferred financing costs charged to interest expense were $2.2 million, $2.2 million and $3.6 million, respectively.Senior Secured Credit AgreementOn January 8, 2018, the Company and its indirect, wholly-owned subsidiary (the “Borrower”) entered into a senior secured credit agreement (the “Export Credit Agreement”) with Citibank, N.A., London Branch (“Citi”) and Eksportkreditt Norge AS (together with Citi, the “Lenders”). Pursuant to the Export Credit Agreement, the Lenders have agreed to make available to the Borrower, at the Borrower’s option and subject to certain conditions, a loan in an aggregate principal amount not to exceed $107.7 million for the purpose of providing financing for up to 80% of the purchase price of the Company’s new expedition ice-class cruise vessel targeted to be completed in January 2020. Seventy percent of the loan will be guaranteed by Garantiinstituttet for Eksportkreditt, the official export credit agency of Norway. If drawn upon, the loan will be made at the time of delivery of the vessel.At the Borrower’s election, the loan will bear interest either at a fixed interest rate effectively equal to 5.78% or a floating interest rate equal to three-month LIBOR plus a margin of 3.00% per annum. The loan will amortize quarterly based on a twelve-year profile, with 70% maturing over twelve years from drawdown, and 30% maturing over five years from drawdown. The loan will be secured by a first priority mortgage over the new vessel and the assignment of related insurances. The Export Credit Agreement also contains customary events of default and mandatory prepayment events for, among other things, non-payment, breach of covenants, default on certain other indebtedness, certain large judgments and a change of control of the Company or the Borrower. In addition to paying interest on any outstanding loans under the facility, the Borrower is required to pay customary coordination, arrangement, agency, collateral and commitment fees. Amounts drawn under the Export Credit Agreement may be voluntarily prepaid at any time subjectand from time to time, without premium or penalty, other than customary breakage costs. All obligations“breakage costs” and fees for LIBOR-based loans.Borrower underCOVID-19 pandemic, for the Export Credit Agreement are guaranteed by the Company.2017 2021 and 2016, the following2020, long-term debt existed:and other borrowing arrangements consisted of: As of December 31, $ 284,170 $ (9,050 ) $ 275,120 $ 280,993 $ (9,492 ) $ 271,501 107,695 (2,090 ) 105,605 107,695 (1,784 ) 105,911 120,281 (2,473 ) 117,808 61,120 (2,261 ) 58,859 44,500 (190 ) 44,310 45,000 (341 ) 44,659 842 0 842 1,684 0 1,684 1,034 0 1,034 0 0 0 558,522 (13,803 ) 544,719 496,492 (13,878 ) 482,614 (26,061 ) 0 (26,061 ) (11,255 ) 0 (11,255 ) $ 532,461 $ (13,803 ) $ 518,658 $ 485,237 $ (13,878 ) $ 471,359 As of December 31, 2017 2016 (In thousands) Principal Deferred Financing Costs, net Balance Principal Deferred Financing Costs, net Balance Note payable $ 2,525 $ - $ 2,525 $ 2,525 $ - $ 2,525 Credit Facility 170,625 (7,214 ) 163,411 172,375 (9,022 ) 163,353 Total long-term debt 173,150 (7,214 ) 165,936 174,900 (9,022 ) 165,878 Less current portion (1,750 ) - (1,750 ) (1,750 ) - (1,750 ) Total long-term debt, non-current $ 171,400 $ (7,214 ) $ 164,186 $ 173,150 $ (9,022 ) $ 164,128 Year Amount (In thousands) 2018 1,750 2019 1,750 2020 4,275 2021 165,375 $ 173,150 $ 26,061 82,973 38,461 292,426 37,248 81,353 $ 558,522 $ 0 $ 0 $ 0 $ 2,008 9 0 0 0 $ 9 $ 0 $ 0 $ 2,008 $ 664 $ 0 $ 953 $ 0 $ 664 $ 0 $ 953 $ 0 F-20 $ (605 ) $ (2,832 ) $ (5,062 ) (363 ) (247 ) (572 ) 288 554 1,718 $ (680 ) $ (2,525 ) $ (3,916 ) $ 155 $ 0 $ 0 $ 155 $ 0 $ 0 $ 0 155 0 $ 155 for the years ended December 31, 2017, 2016 and 2015 are presented below: For the years ended December 31, (In thousands) 2017 2016 2015 Domestic $ (10,423 ) $ (8,696 ) $ (3,700 ) $ (24,875 ) $ (46,490 ) $ 455 Foreign 12,896 10,555 20,793 (96,312 ) (63,455 ) 20,483 Total $ 2,473 $ 1,859 $ 17,093 $ (121,187 ) $ (109,945 ) $ 20,938 at December 31, 2017, 2016 and 2015 are comprised of the following: For the years ended December 31, (In thousands) 2017 2016 2015 Current Federal $ (15 ) $ - $ (38 ) State 529 51 (3 ) Foreign - Other 1,062 164 805 Total current 1,576 215 764 Deferred Federal 8,168 (3,015 ) (3,140 ) State 242 (426 ) (247 ) Foreign - Other 16 26 (26 ) Total deferred 8,426 (3,415 ) (3,413 ) Income tax expense (benefit) $ 10,002 $ (3,200 ) $ (2,649 ) The U.S. Tax Cuts and Jobs Act (the “Tax Act”) was enacted on December 22, 2017 and introduces significant changes to U.S. income tax law. Effective in 2018, the Tax Act reduces the U.S. statutory tax rate from 35% to 21%, transitions the U.S international taxation from a worldwide tax system to a territorial system, and creates new taxes on certain foreign-sourced earnings and certain related-party payments, which are referred to as the global intangible low-taxed income tax and the base erosion tax, respectively. In addition, in 2017 we were subject to a one-time transition tax on accumulated foreign subsidiary earnings not previously subject to U.S. income tax.On December 22, 2017, Staff Accounting Bulletin No. 118 ("SAB 118") was issued to address the application of US GAAP in situations when a registrant does not have the necessary information available, prepared, or analyzed (including computations) in reasonable detail to complete the accounting for certain income tax effects of the Tax Act. Due to the timing of the enactment and the complexity involved in applying the provisions of the Tax Act, we have made reasonable estimates of the effects and recorded provisional amounts in our financial statements as of December 31, 2017. As we collect and prepare necessary data, and interpret the Tax Act and any additional guidance issued by the U.S. Treasury Department, the IRS, and other standard-setting bodies, we may make adjustments to the provisional amounts. Those adjustments may materially impact our provision for income taxes and effective tax rate in the period in which the adjustments are made. The accounting for the tax effects of the Tax Act will be completed in 2018.Provisional amounts for the following income tax effects of the Tax Act have been recorded as of December 31, 2017 and are subject to change during 2018.One-time transition taxThe Tax Act requires us to increase our U.S. taxable income for accumulated foreign subsidiary earnings not previously subject to U.S. income tax at a rate of 15.5% to the extent of foreign cash and certain other net current assets and 8% on the remaining earnings. We recorded a provisional amount for our one-time transitional tax liability as a reduction of net operating loss carryforwards totaling $14.5 million. We have recorded provisional amounts based on estimates of the effects of the Tax Act as the analysis requires significant data from our foreign subsidiaries that is not regularly collected or analyzed. Additional work is necessary to do a more detailed analysis of historical foreign earnings as well as potential correlative adjustments. Any subsequent adjustment to these amounts will be recorded to current tax expense in the quarter of 2018 when the analysis is complete.F-21Deferred tax effectsThe Tax Act reduces the U.S. statutory tax rate from 35% to 21% for years after 2017. Accordingly, we have remeasured our deferred taxes as of December 31, 2017 to reflect the reduced rate that will apply in future periods when these deferred taxes are settled or realized. We recognized a deferred tax benefit of $1.8 million to reflect the reduced U.S. tax rate and other effects of the Tax Act. Although the tax rate reduction is known, we have not collected the necessary data to complete our analysis of the effect of the Tax Act on the underlying deferred taxes and as such, the amounts recorded as of December 31, 2017 are provisional.The net tax expense recognized in 2017 related to the Tax Act was $12.7 million. As we complete our analysis of the Tax Act and incorporate additional guidance that may be issued by the U.S. Treasury Department, the IRS or other standard-setting bodies, we may identify additional effects not reflected as of December 31, 2017. $ 0 $ 0 $ 0 (7 ) 6 22 45 2 682 38 8 704 (1,894 ) (8,959 ) 1,325 928 (481 ) 379 (1,091 ) (373 ) (218 ) (2,057 ) (9,813 ) 1,486 $ (2,019 ) $ (9,805 ) $ 2,190 For the years ended December 31, 2017 2016 2015 Tax provision at statutory rate – federal 35.0 % 35.0 % 35.0 % 21.0 % 21.0 % 21.0 % U.S. tax reform toll charge 562.2 % 0.0 % 0.0 % Tax rate change deferred revaluation (63.3 %) 0.0 % 0.0 % Tax provision at effective state and local rates 23.9 % (21.1 %) (1.5 %) (0.8 %) 0.4 % 1.9 % Foreign tax rate differential (158.3 %) (216.4 %) (46.5 %) (15.2 %) (10.5 %) (16.5 %) GAAP gain on transfer of assets 0.0 % 0.0 % (15.3 %) Transaction costs 0.0 % 0.0 % 8.3 % Subpart F income 0.0 % 0.0 % 5.2 % 0.0 % 0.0 % 3.4 % Nondeductible expenses 6.5 % 51.7 % 0.0 % Uncertain tax provisions 1.2 % 0.2 % 0.2 % 0.0 % 0.0 % (2.2 %) Valuation allowance 2.8 % 22.1 % 0.6 % (4.1 %) (2.2 %) 2.8 % Prior period adjustments 11.2 % (37.7 %) 0.0 % Stock compensation (9.5 %) 0.0 % 0.0 % Tax credits (7.3 %) 0.0 % 0.0 % Other 0.0 % (5.9 %) (1.5 %) 0.8 % 0.2 % 0.1 % Total effective income tax rate 404.4 % (172.1 %) (15.5 %) 1.7 % 8.9 % 10.5 % Ecuador and AustraliaEcuador are subject to US Federal, US state Ecuadorian Federal and AustralianEcuadorian Federal income taxes. The Cayman Islands do not impose federal or local income taxes.(liabilities) as of December 31, 2017 and 2016net, are comprised of the following: As of December 31, (In thousands) 2017 2016 Net operating loss carryforward $ 16,292 $ 15,032 Property and equipment (8,880 ) (236 ) Valuation allowance (8,863 ) (8,795 ) Stock-based compensation 9 124 Intangibles (1,022 ) (1,923 ) Other 20 (84 ) Deferred tax (liabilities) assets $ (2,444 ) $ 4,118 F-22 $ 29,642 $ 26,113 (20,293 ) (19,138 ) 8,280 3,283 (10,248 ) (4,592 ) 311 171 (435 ) (535 ) 352 237 $ 7,609 $ 5,539 As of December 31, 2017, the Company had deferred tax assets related to Australian loss carryforwards of approximately $22.7 million and capital loss carryforwards of $6.8 million, which may be carried forward indefinitely. also hadhas deferred tax assets related to U.S. loss carryforwards of $26.8$110.9 million as of December 31, 2021, which begin to expire in 2027. The timing and manner in which the Company will utilize the net operating loss carryforwards in any year, or in total, may be limited in the future as a result of changes in the Company’s ownership and any limitations imposed by the jurisdictions in which the Company operates.described above,enacted in 2017, any potential dividends from ourthe Company’s foreign subsidiaries would no longer be subject to Federal tax in the United States. WeThe Company continue to assert ourits prior position regarding the repatriation of historical foreign earnings from ourits Ecuadorian and Australian subsidiaries. WeThe Company currently have has no intention to remit any additional undistributed earnings of ourits Ecuadorian and Australian subsidiaries in a taxable manner. We The Company no longer remainremains permanently reinvested in the earnings of ourits Cayman subsidiary. No taxes have been accrued as a result of this change because no taxes are expected to be imposed by either the United States or the Cayman Islands upon such a remittance.penalties for the years ended December 31, 2017, 2016 and 2015:penalties: For the years ended December 31, (In thousands) 2017 2016 2015 Beginning of year $ 447 $ 473 $ 447 Current year positions - (26 ) 26 Prior year positions (26 ) - - End of year $ 421 $ 447 $ 473 The amount of uncertain tax positions that, if recognized, would impact the effective tax rate at December 31, 2017 and 2016 was $0.3 million. Any changes in the next twelve months are not anticipated to have significant impact on the results of operations, financial position or cash flows of the Company. $ 0 $ 0 $ 298 0 0 0 0 0 (298 ) $ 0 $ 0 $ 0 2017, 20162021, 2020 and 2015,2019, interest and penalties included in income tax expense were not significant.threefour prior years remain subject to examination by tax authorities and the Company’s foreign tax returns for the current year and the fourfive prior years remain subject to examination by tax authorities.F-23 $ 150,508 $ 87,463 (124,469 ) (104,044 ) 9 –10— COMMITMENTS AND CONTINGENCIES $ 7,494 $ 16,112 $ 6,502 38 (1,403 ) 2,395 2,892 0 0 202 (7,215 ) 7,215 $ 10,626 $ 7,494 $ 16,112 Future minimum rental commitments, under non-cancellable As of December 31, 2021, the Company’s remaining weighted average operating leaseslease terms were approximately 41 months. A reconciliation of operating lease payments undiscounted cash flows to lease liabilities recognized as of December 31, 2017 are2021 is as follows: Minimum Lease For the years ended December 31, Payments (In thousands) 2018 $ 936 2019 1,154 2020 1,094 2021 1,049 2022 1,104 Thereafter 2,737 $ 8,074 $ 1,557 1,447 1,456 711 0 (440 ) $ 4,731 The amounts above include the future minimum rental commitmentRentLease expense was approximately $1.2$2.0 million, $1.1$1.8 million and $0.9$1.7 million for the years ended December 31, 2017, 20162021, 2020 and 2015,2019, respectively. These amounts are recorded within general and administrative expenses on the accompanying consolidated statements of operations.Fleet ExpansionOn December 2, 2015, the Company entered into two separate Vessel Construction Agreements, (collectively, the “Agreements”) with Ice Floe, LLC, a Washington limited liability company doing business as Nichols Brothers Boat Builders (the “Builder”). The Agreements provide for the Builder to construct two new 236-foot 100-passenger cruise vessels.The company paid Ice Floe LLC $53.6 million related to theNational Geographic Quest and the vessel was delivered in July of 2017. The Company amended the agreement for the second vessel, theNational Geographic Venture, in October 2017. The current contract price is $57.0 million and the vessel is scheduled to be completed in the fourth quarter of 2018, subject to extension for certain events, such as change orders. As of December 31, 2017, the Company has paid Ice Floe, LLC $23.8 million related to theNational Geographic Venture. The Company may terminate the applicable Agreement in the event the Builder fails to deliver the vessel within one hundred eighty days of the applicable due date or the Builder becomes insolvent or otherwise bankrupt. The Agreement also contains customary representations, warranties, covenants and indemnities.In November 2017, the Company entered into an agreement with Ulstein Verft to construct a polar ice class vessel with a total purchase price of 1,066.0 million Norwegian Kroner (NOK). Subsequently, LME exercised its right to make payments in United States Dollars, which resulted in a purchase price of $134.6 million, including hedging costs. The purchase price is subject to potential adjustments from contract specifications for variations in speed, deadweight, fuel consumption and delivery date, and is due in installments. The first twenty percent of the purchase price was paid shortly after execution of the Agreement with the remaining eighty percent due upon delivery and acceptance of the vessel. The vessel is targeted to be delivered in January 2020, with potential accelerated delivery to November 2019. The contract also includes options to build two additional ice class vessels, the first for delivery twelve months after the initial vessel and the second for delivery twelve months thereafter. 2 – 2—Summary of Significant Accounting Policies for a description of the Company’s revenue recognition policy. Royalty expense for the years ended December 31, 2017, 20162021, 2020 and 2015 totaled $5.22019 was $1.7 million, $4.9$1.3 million and $4.8$5.8 million, respectively.F-242017 2021 and 2016 are $1.7 million 2020 is $0.9 and $1.5$0.0 million, respectively, and are included in accounts payable and accrued expenses on the accompanying consolidated balance sheets.In March 2015, Lindblad and National Geographic extended their alliance and license agreement until the year 2025. Payment of royalties earned during the extension period will be valued and recorded in the Company’s consolidated financial statements in a manner consistent with the foregoing disclosure.In connection with the merger on July 8, 2015, the Company, Mr. Lindblad and National Geographic entered into a Call Option agreement where Mr. Lindblad agreed to grant National Geographic an option to purchase 2,387,499 of Mr. Lindblad’s shares in the Company as consideration for the assumption of the alliance and license agreements and the tour operator agreement. The Company recorded a $13.8 million long-term asset using a fair value of $5.76 per option share. The Company is amortizing the cost until March 31, 2020. For the years ended December 31, 2017 and 2016, the Company recorded amortization of the National Geographic fee of $2.9 million and $2.9 million, respectively, within selling and marketing expense on the consolidated statements of operations. The asset was valued using a Black-Scholes valuation method with the following assumptions:Stock price at July 9, 2015: $ 10.75 Exercise price: $ 10.00 Expected term: 5 years Volatility: 60 % Risk free rate: 1.58 % Dividend rate: 0 % 20172021, 2020 and 2016,2019, these fees totaled $0.6$0.6 million, $0.2 million and $0.5$0.9 million, respectively.RoyaltyThe related royalty payments are charged to cost of tours expenses. Royalty expense for the years ended December 31, 2017, 20162021, 2020 and 20152019 was $0.7$0.0million, $0.7$0.4 million and $0.7$0.8 million, respectively.For the years ended December 31, Amount (In thousands) 2018 9,334 2019 5,241 $ 13,762 2,095 Total $ 14,575 $ 15,857 $1.0$1.0 million performance bond, letter of credit or assigned certificate of deposit from its members to insure this plan. The Company has assigned a $1.0 million letter of credit to the USTOA to satisfy this requirement. This letter of credit will be used only if the Company becomes insolvent and cannot refund its customers’ deposits.TheIn certain instances when not fully covered through an insurance company, the Company self-insures cancellation insurance extended to guests. Further, the Company contracts with an unrelated insurance company to administer the guest insurance program, which includes additional guest-related insurance coverage purchased by guests. In connection with the program, the Company has provided a $150,000 letter of credit to the insurance company to cover unpaid premiums.F-25operationsadvisory and administrative services, and operational support for the Company’s vessels stationed there. On February 11, 2015,there, the Company entered into a renewal agreement with Empresa Turistica Internacional C.A., the third-party company that provides advisory and administrative services along with the required actions for the secure and successful operation of theNational Geographic Endeavour II andNational Geographic Islander in the Galápagos.. This agreement is in effect from January 1, 2015 through December 31, 2019.2022 and renews annually.ourthe Company’s financial position, results of operations or cash flows.10 –11— EMPLOYEE BENEFIT PLAN401(k) profit401(k)-profit sharing plan and trust for its employees. The Company matched 30% in 20172021,2020 and 25% in 2016 and 2015,2019, respectively, of employee contributions up to per employee annual maximum of $2,100$2,400 for 2017, $1,800 for 20162021,2020 and $1,500 for 2015. For2019.The Company’s benefit plan contributions amounted to $0.4 million during each of the years ended December 31, 2017, 20162021, 2020 and 2015, the Company’s benefit plan contribution amounted to $0.3 million, $0.2 million and $0.2 million, respectively.2019. The benefit plan contribution iscontributions are recorded within general and administrative expenses on the consolidated statements of operations.11 – STOCKHOLDERS’12— STOCKHOLDERS’ EQUITYCapitalCompany StockCapitol Initial Public Offering and WarrantsCapitolthe Company sold 20,000,000 units at $10.00 per unit, including 2,000,000 units under the underwriters’ over-allotment option, generating gross proceeds of $200.0 million. Each unit consisted of one share of Capitol’sthe Company’s common stock, $0.0001 par value and one half of one redeemable warrant to purchase one share of common stock. The shares of common stock and the warrants included in the units traded as a unit until July 1, 2013 when separate trading of common stock and warrants began. In connection with the consummation of the merger with LEX, CapitolLindblad Expeditions, Inc. in 2015, the Company forced the separation of the units into the separate components of common stock and warrants. Each whole warrant entitlesentitled its holder, upon exercise, to purchase one share of common stock for $11.50 subject to certain adjustments, during the period that commenced thirty days after the completion of the merger between LEX and terminating five years thereafter. During the year ended December 31, 2019, 27,311 warrants to purchase the Company's common stock were exercised for cash.The warrants may be redeemed by Warrant Exchangeat its option, in whole and not in part, at a price of $0.01 per warrant at any time thelaunched an offer to exchange all warrants are exercisable, upon a minimum of 30 days prior written notice of redemption, if, and only if, the last sales priceto purchase common stock of the Company’sCompany (the "Warrant Exchange"). The Warrant Exchange provided (i) an offer to each holder of the Company's outstanding warrants to receive 0.385 shares of common stock equals or exceeds $24.00 per share (as adjustedin exchange for stock splits, stock dividends, reorganizationseach warrant tendered by the holder and recapitalizations) for any 20 trading days within a 30 trading day period ending three business days beforeexchanged pursuant to the Warrant Exchange, and (ii) the solicitation of consents (the "Consent Solicitation") from holders of the warrants to amend the warrant agreement that governs all of the warrants to permit the Company sendsto require that each outstanding warrant not tendered in the redemption notice; and if, and only if, there is a current registration statement in effect with respect to theWarrant Exchange be converted into 0.36575 shares of common stock. The Warrant Exchange and Consent Solicitation closed on July 17, 2019, with 9,935,000 warrants tendered via the Warrant Exchange for an aggregate of 3,824,959 shares of Company common stock, underlying such warrants.and approval was received for the Consent Solicitation. The remaining 125,763 warrants not tendered via the Warrant Exchange were converted, per the Consent Solicitation, into 45,981 shares of Company common stock. Following the Warrant Exchange and Consent Solicitation, 0 warrants remain outstanding.IfAs the fair value of the warrants tendered in the Warrant Exchange offer was less than the fair value of the common stock issued, the Company callsrecorded a non-cash deemed dividend of approximately $2.7 million for the incremental fair value provided to the warrant holders. The fair value of the Company's common stock and warrants were determined using the closing market prices on August 17, 2019, Level 1 fair value inputs.redemption as described above,$1,000 per share for gross proceeds of $85.0 million. The Preferred Stock has senior and preferential ranking to the Company’s managementcommon stock. The Preferred Stock is entitled to cumulative dividends of 6.00% per annum, and for the firsttwo years, the dividends will havebe paid-in-kind. After the option to require all holders that wish to exercise warrants to do so onsecond anniversary of the issuance date, the dividends may be paid-in-kind or be paid in cash at the Company’s option. The Preferred Stock is convertible at any time, at the holder’s election, into a “cashless basis.” In such event, each holder would pay the exercise price by surrendering the warrants for that number of shares of common stock of the Company equal to the quotient obtained by dividing (x) the productthen-current accrued value by the conversion price of $9.50. At any time after the third anniversary of the issuance, the Company may, at its option, convert all, but not less than all, of the Preferred Stock into common stock if the closing price of shares of common stock is at least 150% of the conversion price for 20 out of 30 consecutive trading days. The number of shares of common stock underlyingreceived in such conversion shall be equal to the warrants, multipliedquotient obtained by dividing the then-current accrued value by the difference betweenconversion price. At the exercise pricesix-year anniversary of the warrantsclosing date, each investor has the right to require the Company to repurchase their Preferred Stock and any Preferred Stock not requested to be repurchased shall be converted into common shares of the fair marketCompany equal to the quotient obtained by dividing the then-current accrued value by (y) the fair market value.conversion price. The fair market value will meanPreferred Stock deferred issuance costs was approximately $2.7 million as of December 31, 2021.average reported last sale price of theyear ended December 31, 2021, 5,000 shares of common stock forPreferred Stock and related accumulated dividends were converted by the five trading days ending on the third trading day prior to the date on which the notice of redemption is sent to the holders of warrants.Certain of the outstanding warrants were privately acquired from the Company by Capitol’s sponsor and certainholder into 566,364 shares of the Company’s initial officers common stock.directors and are identical to the warrants included in the units sold in the offering except that such warrants: (i) are not be redeemable by2020, the Company recorded $5.3 million and (ii) may$1.7 million, respectively, in accrued dividends for Preferred Stock. As of December 31, 2021, the Preferred Stock could be exercised for cash or on a cashless basis, in each case so long as they are held byconverted at the initial purchasers or anyoption of their permitted transferees.the holders into approximately 9.1 million shares of the Company’s common stock.F-26On November 2, In 2016, the Company’s Board of Directors approved a $15.0 million increase to the Company’s existing stock and warrant repurchase plan (“Repurchase Plan”), to $35.0 million. This Repurchase Plan which was authorized in November 2015, authorizes the Company to purchase from time to time the Company’s outstanding common stock and previously outstanding warrants. Any shares and warrants purchased will be retired. The Repurchase Plan has no time deadline and will continue until otherwise modified or terminated at the sole discretion of the Company’s Board of Directors. The repurchases exclude shares repurchased to settle statutory employee tax withholding related to the vesting of stock awards. Since March 2020, the Repurchase Plan has been suspended due to the uncertain impact of the COVID-19 virus. Pursuant to the Repurchase Plan, the Company (i) had repurchased 8,517 shares of common stock for approximately $127,000 during the year ended December 31, 2020, prior to its suspension, and (ii) repurchased 1,895 shares of common stock for approximately $23,000 during the year ended December 31, 2019. Since the Repurchase Plan inception, the Company has cumulatively repurchased 875,218 shares of common stock for $8.3 million and 6,011,926 warrants for $14.7 million, as of December 31, 2021. All repurchases were made using cash resources. In 2015, the Company repurchased 2,091,618 warrantsThe balance available for $5.5 million. In 2016, the Company repurchased 2,821,995 warrants for $7.3 million and 308,718 shares of its common stock for $3.0 million. In 2017 the Company repurchased a total of 529,867 warrants for $1.1 million and 547,058 shares of common stock for $5.1 million pursuant to the Repurchase Plan. The Company has cumulatively repurchased 855,776 shares of common stock for $8.1 million and 5,443,480 warrants for $14.0 million, since plan inception. The balancePlan as of February 26, 2018 for the repurchase plan December 31, 2021 was $12.1$12.0 million.2017 Long-Term Incentive CompensationIn March 2017,During 2021, the Company’s compensation committee (or a subcommittee thereof) approved awards ofan employee incentive plan which supersedes the 2015 Long-Term Incentive Plan, authorizes restricted stock units (“RSUs”)time and performance share units (“PSUs”)awards and stock options to key employees under the Company’s 20152021 Long-Term Incentive Plan. The Company's stock-based compensation program is a long-term retention program that provides for the grant of options, restricted stock, RSUs and performance-based restricted stock or units in order to attract, retain and provide incentives for directors, officers and employees. The maximum number of shares reserved for the grant of awards under the plan is 4.7 million, with approximately 3.8 million shares available as of December 31, 2021. The Company typically settles stock-based awards with newly issued shares.171,388to an employee, non-employee director or other service providers for which sale is prohibited for a specified period of time. Restricted stock typically vests ratably over a one or three-year period following the date of grant. RSUs on April 3, 2017represent a promise to deliver shares to the employee, non-employee director or other service providers at a grantfuture date if certain vesting conditions are met. RSUs typically vest ratably over a three-year period following the date of grant. The Company does not deliver the shares associated with the RSUs to the employee, non-employee director or other service providers until the vesting conditions are met. The number of shares or units granted are determined based upon the closing price of $8.98. The RSU’s will vest in equal installmentsthe Company's common stock on eachthe date of the first three anniversariesaward.date,based on the attainment of performance- or market-based goals, all of which are subject to a service condition. The Company does not deliver the recipient’s continued employmentshares associated with the PSUs to the employee, non-employee director or other service with us or our subsidiaries onproviders until the applicableperformance and vesting date.conditions are met. TheFor 2020 and 2019, the PSUs are performance-vesting equity incentive awards that will granted may be earned based on ourthe Company's performance against metrics relating to annual Adjusted EBITDA and annual revenue, and guest satisfaction.revenue. Awards, if earned, will vest after a three-yearthree-year performance period and may be earned at a level ranging from 0%-200% of the number of PSUs granted, depending on performance. On April 3, 2017, the Company awarded 126,953 of targeted PSUs with theThe number of sharesunits were determined based upon the closing price of ourthe Company's common stock on March 31, 2017the date of $8.96. Based on the financial statements as of December 31, 2017, theaward. The Company assessed the applicable metrics related to the PSU grants, determined the blended probability of achieving the performance metrics and valued the awards based on the fair value at the date of grant with the amount of stock compensation expense determined based on the number of PSU’s expected to vest.2016 CEO Share Allocation PlanMarket Stock UnitsIn April 2016, the Company’s Board of Directors adopted the 2016 CEO Share Allocation Plan (the “2016 Plan”) and in June 2016, the Company’s shareholders approved the 2016 CEO Share Allocation Plan, pursuant to which the Company will grant awards covering up to 1,000,000 shares of the Company’s common stock in the form of restricted stock, restricted stock units, and/or other stock- or cash-based awards to eligible employees and other service providers of the Company. The 2016 CEO Share Allocation Plan was adopted in connection with a contribution agreement that the Company entered into with Sven-Olof Lindblad, Chief Executive Officer and President of the Company, pursuant to which Mr. Lindblad will transfer up to 1,000,000 shares from his holdings of the Company’s common stock (i.e., an equivalent number of shares as is reserved for issuance under the 2016 CEO Share Allocation Plan) (the “Contribution Shares”) to the Company as a contribution to the capital of the Company. Mr. Lindblad will not receive any consideration in exchange for the Contribution Shares. However, as a condition to the contribution of any Contribution Shares, the Company must grant awards under the 2016 CEO Share Allocation Plan, such that the number of Contribution Shares that Mr. Lindblad actually contributes to the Company will equal the number of shares corresponding to awards granted under the plan. The contribution of the Contribution Shares by Mr. Lindblad to the Company will effectively reduce the number of shares of the Company’s common stock that are outstanding by the same number of shares that would be issued under the 2016 CEO Share Allocation Plan (or a lesser number in the event awards are settled in cash). Such contributions will be effective as of the date the Company grants corresponding awards under the 2016 CEO Share Allocation Plan. The administrator may amend, suspend or terminate the 2016 CEO Share Allocation Plan at any time.On January 10, 2017, Mr. Lindblad contributed to the Company and the Company thereafter granted, 716,550 restricted shares at a grant price of $9.65. The grants vest in three equal installments on January 10, 2017, January 10, 2018 and January 10, 2019.F-272015 Long-Term Incentive PlanIn July 2015, the Company’s Board of Directors and shareholders approved the 2015 Long-Term Incentive Plan (the “2015 Plan”), which is administered by the Board of Directors, allowing the Company to issue up to 2,500,000 shares of its common stock to employees, consultants and non-employee directors. The 2015 Plan provides for the grant of stock options, including incentive stock options and nonqualified stock options, stock appreciation rights, restricted stock, restricted stock units and other stock or cash-based awards. The Board of Directors has the authority to determine the amount and type of each award. The 2015 Plan expires on July 8, 2025. All options granted under the 2015 Plan will be at exercise prices not less than 100% of the fair market value of the Company’s common stock on the date of grant.Performance Share UnitsPerformance shares are shares of stock granted to an employee, non-employee director or other service providers for which sale is prohibited for a specified period of time. PSUsMSUs represent a promise to deliver shares to the employee, non-employee director or other service providers at a future date if certain performance and vesting conditions are met. The MSUs are market-based equity incentive awards based on a performance-multiplier of change in the stock price of the Company’s common stock between the grant date and a determined closing price. Each MSU represents the right to receive one share of Company does not deliverstock multiplied by a performance multiplier or, at the option of the Company, an amount of cash. The number of shares associated withthat will eventually be earned and vest may be more or less then the PSUs tonumber of MSUs that are awarded, depending on the employee, non-employee director or other service providers untilCompany's common stock price. Awards, if earned, will vest after a determined performance period and may be earned at a level ranging from 0%-150% of the vesting conditions are met.number of MSUs granted, depending on performance. The number of units granted were determined based upon the closing price of the Company's common stock on the date of the award.following table is a summaryCompany assessed the applicable metrics related to the MSU grants, estimating the fair value of restrictedemployee MSU awards and the amount of stock and PSU activity undercompensation expense using the Company’s 2015 Plan:Monte-Carlo pricing model. PSU’s Weighted Average Grant Date Fair Value PSUs unvested as of December 31, 2016 - $ - Granted 126,953 8.98 Vested - - Forfeited (39,161 ) 8.98 PSUs unvested as of December 31, 2017 87,792 $ 8.98 Restricted Shares and Restricted Share UnitsStock OptionsRestricted shares are shares of stock granted to an employee, non-employee director or other service providers for which sale is prohibited for a specified period of time. RSUsStock options represent a promiseright to deliverbuy a number of shares toby the employee, non-employee director or other service providers at a future date, if certain vesting conditions are met. The Company does not deliver the shares associatedfor a pre-set price, or exercise price, for a fixed period of time. Stock options generally vest over one to four years, with the RSUs to the employee, non-employee director or other service providers until the vesting conditions are met.The following table is a summaryterm of restricted stock and RSU activity under the Company’s 2015 Plan: Restricted Shares and RSU’s Weighted Average Grant Date Fair Value Restricted shares and RSUs outstanding as of December 31, 2016 202,091 $ 9.90 Granted 940,147 9.56 Vested (299,951 ) 9.72 Forfeited (63,945 ) 9.41 Restricted shares and RSUs outstanding as of December 31, 2017 778,342 $ 9.60 Stock OptionsLindblad Plan2015 and 2015 Plan2017 plans were estimated using the following assumptions: Option grants Weighted Average 12/11/14 11/10/15 2016 Stock price $ 5.02 $ 10.58 $ 9.63 $ 10.84 $ 16.38 Exercise price 1.76 10.58 9.63 $ 10.84 $ 16.38 Dividend yield 0.00 % 0.00 % 0.00 % 0.00 0.00 Expected volatility 60.00 % 60.00 % 60.00 % 29.08 25.61 Risk-free interest rate 2.19 % 1.72 % 1.18 % 0.98 1.63 Expected term in years 5.11 5.11 5.11 7.00 7.50 F-28 162,780 $ 9.63 619,726 $ 10.16 0 $ 0 61,631 15.25 139,168 15.97 0 0 0 0 (413,661 ) 10.11 0 0 (8,990 ) 8.98 (3,187 ) 11.31 0 0 215,421 11.16 342,046 12.47 0 0 86,783 5.42 648,617 11.22 102,062 8.51 (57,022 ) 8.98 (213,583 ) 11.99 0 0 (66,484 ) 9.69 (35,479 ) 8.81 0 0 178,698 9.73 741,601 11.70 102,062 8.51 0 0 283,872 17.16 50,072 18.90 (41,990 ) 10.27 (358,144 ) 10.21 0 0 (61,767 ) 9.79 (98,978 ) 14.18 0 0 74,941 9.39 568,351 14.93 152,134 11.93 activity under the Lindblad Plan and 2015 Plan:stock option activity: Weighted Weighted Average Option Average Exercise Contractual Life Aggregate Intrinsic Shares Price (Years) Value Options outstanding as of December 31, 2016 2,130,848 $ 2.57 2.8 $ 14,654,221 Granted - - Exercised 955,424 1.76 Forfeited - - Options outstanding as of December 31, 2017 1,175,424 $ 3.23 2.4 $ 7,707,255 Exercisable as of December 31, 2016 - - Vested # 955,424 1.76 Exercised (955,424 ) 1.76 Forfeited - - Exercisable as of December 31, 2017 - - - 220,000 $ 3.23 7.6 $ 842,000 (20,000 ) 11.26 200,000 9.47 7.6 1,376,000 310,000 10.84 510,000 10.30 6.7 3,476,800 1,000,000 16.38 (12,000 ) 9.47 1,498,000 14.37 8.8 1,848,040 # Vested shares do not include 955,424 shares vested as 1,498,000 $ 14.37 8.8 $ 1,848,040 265,500 9.87 6.0 1,521,340 StockStock-based Compensation Expense2017, 2016the years ended December 31, 2021, 2020 and 20152019 was $10.6$5.6 million, $5.4$2.4 million and $4.9$3.6 million, respectively, and is included in general and administrative expenses. The total income tax benefit recognized for stock basedstock-based compensation plans for 2017, 2016the years ended December 31, 2021, 2020 and 20152019 was $0.1$0.0 million, $0.1$0.0 million and $1.3$0.1 million, respectively. As of December 31, 2017, 2021, unrecognized stock-based compensation costs were $6.0expense was $13.8 million. This amount is expected to be recognized over a weighted average period of approximately one year.3.4 years.NOTE 12 – RELATED PARTY TRANSACTIONS – STOCKHOLDERLOANSOther thanMr. Lawrence, President of Off the Beaten Path, was issued 1,007 profit interest units in the equity of Off the Beaten Path as described below, since January 1, 2015, the Company has not entered into, and there are no currently proposed, related party transactions.Capitol Acquisition Corp. IIAllpart of the initial shares of common stock issued by Capitol to its sponsor and initial shareholders (Capitol Acquisition Management 2 LLC, L. Dyson Dryden, Lawrence Calcano, Richard C. Donaldson and Piyush Sodha) were placed in escrow with Continental Stock Transfer & Trust Company, as escrow agent, until one year after the date of the consummation of the Capitol’s merger with Lindblad (July 8, 2016) including certain founder forfeiture shares which are subject to forfeiture in the event the last sales price of our stock does not equal or exceed $13.00acquisition. The profit interest units had a $132.86 per share (as adjustedgrant date fair value and are considered vested upon issuance. The Company recorded $0.1 million in stock-based compensation expense related to the value of these profit units for stock splits, stock dividends, reorganizations, recapitalizations and the like) for any 20 trading days within any 30-trading day period within four years following July 8, 2015. The portion of the founder shares not subject to forfeiture were released from escrow following July 8, 2016. The founder forfeiture shares remain in escrow and will be released from escrow when and if the conditions for release set forth above are satisfied.Commencing on May 10, 2013, Capitol paid Venturehouse Group, LLC, an affiliate of Mark D. Ein, a fee of $7,500 per month for providing Capitol with office space and certain office and administrative services through the initial business combination of July 8, 2015. This arrangement was solely for Capitol’s benefit and was not intended to provide Mr. Ein compensation in lieu of a salary. For the year ended December 31, 2015,2021, included in the aggregate cash fee paid to Venturehouse Group, LLC was $45.0 thousand.Company’s total stock-based compensation disclosed above.To meet Capitol’s working capital needs, from time to time, Capitol’s officers, directors, initial shareholders or their affiliates loaned Capitol funds in their sole discretion prior to the initial business combination. The aggregate amount of the loans was approximately $1.6 million. All loans were repaid upon consummation of the Company’s initial business combination, without interest, with the exception of $0.5 million of the notes that were converted into warrants at a price of $1.00 per warrant at such time.The holders of Capitol’s initial shares, as well as the holders of the sponsor warrants and all note conversion warrants are entitled to registration rights pursuant to an agreement signed in connection with Capitol’s initial public offering. The Company filed a Form S-3 resale registration statement required by such registration rights agreement that was declared effective by the Securities and Exchange Commission on September 16, 2015.F-29Capitol reimbursed its officers and directors for reasonable out-of-pocket business expenses incurred by them in connection with certain activities on its behalf such as identifying and investigating possible target businesses and business combinations prior to the initial business combination. As of July 8, 2015, Capitol had reimbursed its initial shareholders approximately $0.1 million for out-of-pocket business expenses incurred by them in connection with activities on its behalf.Other than the fees described above and reimbursable out-of-pocket expenses payable to Capitol’s officers and directors, no compensation or fees of any kind, including finder’s fees, consulting fees or other similar compensation, were paid to any of Capitol’s initial shareholders, including its officers or directors, or to any of their respective affiliates, prior to or for services rendered in connection with the business combination.Lindblad Expeditions, Inc.NOTE 14On November 3, 2014, LEX and Sven-Olof Lindblad entered into a certain Loan and Security Agreement (“Loan Agreement”) and a certain Promissory Note made by Mr. Lindblad in favor of LEX for a maximum aggregate principal amount of up to $3.5 million. The interest rates of the Promissory Note were the applicable federal rate for loans of equal tenor for the months in which amounts were provided to Mr. Lindblad by LEX, as published by the Internal Revenue Service for purposes of Section 1274(d) of the Internal Revenue Code. Mr. Lindblad pledged his right, title and interest in and to all of the issued and outstanding shares of capital stock of LEX held by him to LEX as collateral for repayment of the Promissory Note. The Promissory Note was satisfied and the Loan Agreement terminated on March 9, 2015 pursuant to the Assignment and Assumption Agreement described below. Prior to such satisfaction and termination, approximately $2.8 million had been advanced by LEX to Mr. Lindblad and no principal or interest had been repaid by Mr. Lindblad.On March 9, 2015, Mr. Lindblad and LEX entered into an Assignment and Assumption Agreement pursuant to which Mr. Lindblad (i) assigned and transferred to LEX his right to receive a $5.0 million fee payable by DVB and (ii) exercised his outstanding option to purchase 2,857 shares of LEX’s stock for an aggregate exercise price of $92.5 thousand. In exchange for the assignment to LEX of the fee payable by DVB, all of Mr. Lindblad’s obligations under the Loan Agreement described above were deemed satisfied in full, the Loan Agreement and related Promissory Note were terminated, and Mr. Lindblad’s obligation to pay the aggregate exercise price for the exercise of the option described above was satisfied in full. Following receipt of the fee from DVB, LEX paid to Mr. Lindblad an amount equal to (a) the fee paid by DVB, less (b) the outstanding amount of principal and interest owed under the Loan Agreement at the time of entry into the Assignment and Assumption Agreement, the aggregate exercise price payable in connection with the exercise of the option, and a collection premium equal to one percent of the outstanding amount of principal and interest payable in connection with the loan, and less (c) any required withholding taxes.Prior to the debt refinancing and the completion of the purchase of CFMF on May 8, 2015, CFMF served as the junior lender pursuant to LEX’s junior credit facility. CFMF was deemed to have control of LEX through (a) CFMF’s possession of a warrant to purchase 60% of LEX for nominal consideration that could be exercised at any time and (b) a shareholder agreement between CFMF and LEX under which CFMF was declared to be in control of LEX and for which CFMF was awarded two of the three seats on LEX’s Board of Directors. On December 11, 2014, LEX entered into a Profit Participation Loan Purchase Agreement with DVB, a Profit Participation Rights Purchase Agreement with Buss Kreuzfahrtfonds 1 GmbH & Co. KG and Buss Kreuzfahrtfonds 2 GmbH& Co. KG, and a Stock Purchase Agreement with Cruise/Ferry Finance Partners Private Foundation. These three agreements enabled LEX to purchase the financial and equity interests in CFMF in order to recapture and extinguish a warrant to purchase 60% of the outstanding equity of LEX on a fully diluted basis. On December 11, 2014, the date of the purchase agreements, an initial payment of $25.0 million was made to DVB under the Profit Participation Loan Purchase Agreement. The remaining payments of (i) $22.7 million to DVB, (ii) $48.4 million to Buss Kreuzfahrtfonds 1 GmbH & Co. KG and Buss Kreuzfahrtfonds 2 GmbH & Co. KG, as increased by $339,100 per month from December 31, 2014 until the close of the transaction, and (iii) $1.00 to Cruise/Ferry Financing Partners Private Foundation were made on May 8, 2015. DVB served as agent and security trustee under LEX’s credit facilities prior to the refinancing on May 8, 2015, and was one of the Senior Lenders under the then current senior credit facility. In connection with the purchase of CFMF completed on May 8, 2015, the senior credit facility was paid off and the junior credit facility was cancelled.— RELATED PARTY TRANSACTIONSDuring calendar year 2017, LEX paid an aggregate of $5.2 million to National Geographic under these agreements, which are included within selling and marketing expenses on the accompanying consolidated statements of operations. The extension of the agreements, entered into July 2015, between LEXthe Company and National Geographic in connection with the mergersSociety was contingent on the execution by Mr. Lindblad, the Company's Co-Chairperson and former Chief Executive Officer and President, of an option agreement granting National Geographic Society the right to purchase from Mr. Lindblad, for a per share price of $10.00 per share, five5 percent of the issued and outstanding shares of Capitol’sthe Company’s common stock as of July 8, 2015, including all outstanding options, warrants or other derivative securities (excluding options granted under the 2015 Plan 15,600,000and shares issuable upon the exercise of warrantswarrants). During March 2019, National Geographic Society exercised its rights in full under the option agreement to acquire the shares, and 1,250,000in a cashless transaction acquired shares of escrowed common stock, unless such escrowed shares are released from escrow, in which case such shares will be included in the 5% calculation).Mr. Lindblad.F-30 acquisition, Natural Habitat issued an unsecured promissory note to Mr. Bressler, the founder of Natural Habitat, with an outstandingoriginal principal amount of $2.5 millionmillion. On May 1, 2020, the promissory note was amended changing the maturity date of the principal payments to be due at maturity on December 31, 2020.in three equal installments, see Note 6—Long-term Debt.connection withidentifying its reportable segments, the mergers,Company considered the shareholdersnature of Capitol prior to its initial public offering — Capitol Acquisition Management 2 LLC, L. Dyson Dryden, Lawrence Calcano, Richard C. Donaldsonservices provided, the geographical areas in which the segments operated and Piyush Sodha —collectively agreed to make a charitable contribution of an aggregate of 500,000 founder’s shares in Capitol to the Lindblad Expeditions – National Geographic Joint Fund for Exploration and Conservation (“LEX-NG Fund”), established by National Geographic, for no additional consideration. The LEX-NG Fund is managed jointly by a Lindblad staff member and a National Geographic staff member and the board is comprised of five members with Mr. Lindblad acting as Chairman.other relevant factors.NOTE 13 – SEGMENT INFORMATIONDuringThe Company is primarily an experiential travel operator with operations in 2 segments, Lindblad and Land Experiences. While both segments have similar characteristics, the second quarter of 2016, the Company completed its acquisition of Natural Habitat. As a result of the acquisition, the Company updated its reporting information and its operating segments to add Natural Habitat as a separate2 operating and reporting segment.segments cannot be aggregated because they fail to meet the requirements for aggregation. The Company evaluates the performance of the business based largely on the results of its operating segments. The CODM and management review operating results monthly, and base operating decisions on the total results at a consolidated level, as well as at a segment level. The reports provided to the Board of Directors are at a consolidated level and also contain information regarding the separate results of both segments.Asand results of the segments without allocating other income and expenses, net, income taxes and interest expense, net. For the full year ended December 31, 2021, 2020 and 2019, segment operating results were as follows: $ 82,842 $ 69,620 $ 13,222 19 % $ 272,410 $ (202,790 ) (74 )% 64,265 12,736 51,529 405 % 70,681 (57,945 ) (82 )% $ 147,107 $ 82,356 $ 64,751 79 % $ 343,091 $ (260,735 ) (76 )% $ (111,477 ) $ (78,573 ) $ (32,904 ) (42 )% $ 26,203 $ (104,776 ) NM 646 (9,825 ) 10,471 107 % 6,995 (16,820 ) NM $ (110,831 ) $ (88,398 ) $ (22,433 ) (25 )% $ 33,198 $ (121,596 ) NM 2017, 20162021, 2020 and 2015, the following operating results were:2019 were $2.2 million, $2.4 million and $5.6 million, respectively. For the years ended December 31, (In thousands) 2017 2016 Change % 2015 Change % Tour revenues: Lindblad $ 216,815 $ 207,836 $ 8,979 4 % $ 209,985 $ (2,149 ) (1 %) Natural Habitat* 49,689 34,510 15,179 44 % - 34,510 NA Total tour revenues $ 266,504 $ 242,346 $ 24,158 10 % $ 209,985 $ 32,361 15 % Operating income: Lindblad $ 7,292 $ 11,794 $ (4,502 ) (38 %) $ 15,502 $ 3,708 (24 %) Natural Habitat* 3,452 2,187 1,265 58 % - (2,187 ) NA Total operating income $ 10,744 $ 13,981 $ (3,237 ) (23 %) $ 15,502 $ 1,521 (10 %) * The 2016 Natural HabitatDepreciation and amortization expense is included in segment results represent activity from acquisition date of May 2016 through December 31, 2016.operating income as shown below: F-31NOTE 14 – QUARTERLY FINANCIAL DATA – UNAUDITED $ 37,516 $ 30,033 $ 7,483 25 % $ 24,116 $ 5,917 25 % 2,009 2,051 (42 ) (2 %) 1,653 398 24 % $ 39,525 $ 32,084 $ 7,441 23 % $ 25,769 $ 6,315 25 % istable presents the quarterly financial data for the years ended December 31, 2017Company’s total assets, intangibles, net and 2016:goodwill by segment: 2017 (In thousands, except per share data) First
Quarter Second
Quarter Third
Quarter Fourth
Quarter Year Tour revenues $ 63,128 $ 55,571 $ 84,584 $ 63,221 $ 266,504 Gross profit $ 30,525 $ 26,874 $ 46,104 $ 27,475 $ 130,978 Net income (loss) $ 625 $ (2,578 ) $ 9,443 $ (15,019 ) $ (7,529 ) Diluted earnings (loss) per share $ 0.01 $ (0.06 ) $ 0.20 (0.36 ) $ (0.19 ) 2016 (In thousands, except per share data) First
Quarter Second
Quarter Third
Quarter Fourth
Quarter Year Tour revenues $ 61,573 $ 53,871 $ 70,774 $ 56,128 $ 242,346 Gross profit $ 36,299 $ 24,481 $ 38,328 $ 24,261 $ 123,369 Net income (loss) $ 10,467 $ (4,494 ) $ 7,447 $ (8,361 ) $ 5,059 Diluted earnings (loss) per share $ 0.23 $ (0.10 ) $ 0.16 $ (0.19 ) $ 0.10 $ 724,873 $ 693,849 102,618 63,600 $ 827,491 $ 757,449 $ 1,874 $ 2,599 11,361 2,218 $ 13,235 $ 4,817 $ 0 $ 0 42,017 22,105 $ 42,017 $ 22,105 F-32