
2021 SB Financial Group, Inc. 10-K
UNITED STATES
SECURITIES AND EXCHANGE COMMISSION
Washington, D.C. 20549
FORM 10-K
(Mark One)
☒ ANNUAL REPORT PURSUANT TO SECTION 13 OR 15(d) OF THE SECURITIES EXCHANGE ACT OF 1934
For the fiscal year ended December 31, 20172021
OR
☐ TRANSITION REPORT PURSUANT TO SECTION 13 OR 15(d) OF THE SECURITIES EXCHANGE ACT OF 1934
For the transition period from ____________________ to _____________________
Commission File Number 001-36785
SB FINANCIAL GROUP, INC.
(Exact name of Registrant as specified in its charter)
| Ohio | 34-1395608 | |
| (State or other jurisdiction of | (I.R.S. Employer | |
| incorporation or organization) | Identification No.) | |
| 401 Clinton Street, Defiance, Ohio | 43512 | |
| (Address of principal executive offices) | (Zip Code) |
| Registrant’s telephone number, including area code: | (419) 783-8950 |
Registrant’s telephone number, including area code:(419) 783-8950
Securities registered pursuant to Section 12(b) of the Act:
| Title of each class | Trading Symbol(s) | Name of each exchange on which | ||
| Common Shares, No Par Value | SBFG | The NASDAQ Stock Market, LLC | ||
(NASDAQ Capital Market) | ||||
Securities registered pursuant to Section 12(g) of the Act:
Not Applicable
Indicate by check mark if the registrant is a well-known seasoned issuer, as defined in Rule 405 of the Securities Act. Yes ☐ No ☒
Indicate by check mark if the registrant is not required to file reports pursuant to Section 13 or Section 15(d) of the Act. Yes ☐ No ☒
Indicate by check mark whether the registrant (1) has filed all reports required to be filed by Section 13 or 15(d) of the Securities Exchange Act of 1934 during the preceding 12 months (or for such shorter period that the registrant was required to file such reports), and (2) has been subject to such filing requirements for the past 90 days. Yes ☒ No ☐
Indicate by check mark whether the registrant has submitted electronically and posted on its corporate website, if any, every Interactive Data File required to be submitted and posted pursuant to Rule 405 of Regulation S-T (§ 232.405 of this chapter) during the preceding 12 months (or for such shorter period that the registrant was required to submit and post such files). Yes ☒ No ☐
Indicate by check mark if disclosure of delinquent filers pursuant to Item 405 of Regulation S-K is not contained herein, and will not be contained, to the best of registrant’s knowledge, in definitive proxy or information statements incorporated by reference in Part III of this Form 10-K or any amendment to this Form 10-K. ☐
Indicate by check mark whether the registrant is a large accelerated filer, an accelerated filer, a non-accelerated filer, a smaller reporting company, or an emerging growth company. Non-Accelerated Filer ☒ Smaller Reporting Company ☒
If an emerging growth company, indicate by check mark if the registrant has elected not to use the extended transition period for complying with any new or revised financial accounting standards provided pursuant to Section 13(a) of the Exchange Act. ☐
Indicate by check mark whether the registrant has filed a report on and attestation to its management’s assessment of the effectiveness of its internal control over financial reporting under Section 404(b) of the Sarbanes-Oxley Act (15 U.S.C. 7262(b)) by the registered public accounting firm that prepared or issued its audit report. Yes ☐ No ☒
Indicate by check mark whether the registrant is a shell company (as defined in Rule 12b-2 of the Exchange Act). Yes ☐ No ☒
The aggregate market value of the common shares of the registrant held by non-affiliates computed by reference to the price at which the common shares were last sold as of the last business day of the registrant’s most recently completed second fiscal quarter was $78.0$130.0 million.
The number of common shares of the registrant outstanding at February 22, 20182022 was 6,459,312.7,211,549.
DOCUMENTS INCORPORATED BY REFERENCE
Portions of the Registrant’s definitive Proxy Statement for its Annual Meeting of Shareholders to be held on April 18, 201820, 2022 are incorporated by reference into Part III of this Annual Report on Form 10-K.
SB FINANCIAL GROUP, INC.
20172021 ANNUAL REPORT ON FORM 10-K
TABLE OF CONTENTS
i
PART I
Certain statements contained in this Annual Report on Form 10-K which are not statements of historical fact constitute forward-looking statements within the meaning of the Private Securities Litigation Reform Act of 1995.See “Cautionary Statement Regarding Forward-Looking Information” underItem 1A. Risk Factors on page General SB Financial Group, Inc., an Ohio corporation (the “Company”), is a Through its direct and indirect subsidiaries, the Company is engaged in a variety of financial activities, including commercial banking, State Bank and Trust Company The State Bank and Trust Company (“State Bank”) is an Ohio state-chartered bank and wholly owned subsidiary of the Company. State Bank offers a full range of commercial banking services, including checking accounts, savings accounts, money market accounts and time certificates of deposit; automatic teller machines; commercial, consumer, agricultural and residential mortgage loans; personal and corporate trust services; commercial leasing; bank credit card services; safe deposit box rentals; SBFG Title, LLC SBFG Title, LLC dba Peak Title Agency (“SBFG Title”) was formed as an Ohio limited liability company in March 2019 and purchased all of the assets and real estate of an Ohio-based title agency effective March 15, 2019. SBFG Title provides title insurance and operates three locations located within the Ohio Counties of Franklin and Williams, and in Hamilton County, Indiana. At December 31, 2021, SBFG Title had eight full-time equivalent employees. RFCBCItem 1. Business. 1512 of this Annual Report on Form 10-K.bankfinancial holding company registeredsubject to regulation under the Bank Holding Company Act of 1956, as amended, and is subject to regulationinspection, examination and supervision by the Board of Governors of the Federal Reserve System (the “Federal Reserve Board”). The Company was organized in 1983. The executive offices of the Company are located at 401 Clinton Street, Defiance, Ohio 43512.item processing, and wealth management services, as explained in more detail below.Internetinternet banking; private client group services; and other personalized banking services. The trust and financial services division of State Bank offers various trust and financial services, including asset management services for individuals and corporate employee benefit plans, as well as brokerage services through Cetera Investment Services, an unaffiliated company. State Bank presently operates nineteen22 banking centers, located within the Ohio counties of Allen, Defiance, Franklin, Fulton, Hancock, Lucas, Paulding, WoodWilliams and Williams,Wood, and one banking center located in Allen County, Indiana. State Bank also presently operates sevenfive loan production offices, located in Cuyahoga, Franklin Lucas and SenecaLucas Counties, Ohio, KosciuskoHamilton and Steuben County,Counties, Indiana, and Monroe County, Michigan. At December 31, 2017,2021, State Bank had 234260 full-time equivalent employees.
RFCBC, Inc. (“RFCBC”) is an Ohio corporation and wholly owned subsidiary of the Company that was incorporated in August 2004. RFCBC operates as a loan subsidiary in servicing and working out problem loans.loans and is presently inactive. At December 31, 2017,2021, RFCBC had no employees.
Rurbanc Data Services
Rurbanc Data Services, Inc. dba RDSI Banking Systems (“RDSI”) has beenwas formed in operation since 1964 and became an Ohio corporation in June 1976. In September 2006, RDSI acquired Diverse Computer Marketers, Inc. (“DCM”), which was merged into RDSI effective December 31, 2007. At December 31, 2017, RDSI/DCM had 6 full-time equivalent employees. Effective January 1, 2018, the Company completed the sale of the customer contracts and certain other assets of RDSI’s remaining check and statement processing business operated through the DCM division. As a result of the sale, RDSI is presently inactive and had no employees at December 31, 2021.
1
Rurban Mortgage Company
Rurban Mortgage Company (“RMC”) is an Ohio corporation and wholly owned subsidiary of State Bank. RMC is a mortgage company; however, itcompany and is presently inactive. At December 31, 2017,2021, RMC had no employees.
SBT Insurance
SBT Insurance, LLC (“SBI”) is an Ohio corporation and wholly owned subsidiary of State Bank. SBI is an insurance company that engages in the sale of insurance products to retail and commercial customers of State Bank. At December 31, 2017,2021, SBI had no employees.
SB Captive
SB Captive, Inc. (“SB Captive”) is a Nevada corporation and wholly owned subsidiary of SB Financial Group, Inc. SB Captive is a self-insurance company that provides coverage to State Bank and SB Financial Group. The purpose of the SB Captive is to mitigate insurance risk by participating in a pool with other banks. At December 31, 2021, SB Captive had no employees.
Rurban Statutory Trust II
Rurban Statutory Trust II (“RST II”) is a trust that was organized in August 2005. In September 2005, RST II closed a pooled private offering of 10,000 Capital Securities with a liquidation amount of $1,000 per security. The proceeds of the offering were loaned to the Company in exchange for junior subordinated debentures with terms similar to the Capital Securities. The sole assets of RST II are the junior subordinated debentures and the back-up obligations, which in the aggregate, constitute a full and unconditional guarantee by the Company of the obligations of RST II under the Capital Securities.
Competition
The Company experiences significant competition in attracting depositors and borrowers. Competition in lending activities comes principally from other commercial banks in the lending areas of State Bank, and to a lesser extent, from savings associations, insurance companies, governmental agencies, credit unions, securities brokerage firms and pension funds. The primary factors in competing for loans are interest rates charged and overall banking services.
State Bank’s competition for deposits comes from other commercial banks, savings associations, money market funds and credit unions as well as from insurance companies and securities brokerage firms. The primary factors in competing for deposits are interest rates paid on deposits and convenience of office location. State Bank operates in the highly competitive wealth management services field and its competition consists primarily of other bank wealth management departments.
Prior to January 1, 2018, RDSI operated in the check and statement processing service business, which consists primarily of item processing providers and commercial printers. The primary factors in competition are price and printing capability.
Supervision and Regulation
The following is a descriptionsummary discussion of the significant statutes and regulations applicable to the Company and its subsidiaries. The descriptionThis discussion is qualified in its entirety by reference to the full text of the statutes, regulations and policies that are described. Also, such statutes, regulations and policies are continually under review by the U.S. Congress and state legislatures and federal and state regulatory agencies. A change in statutes, regulations or regulatory policies applicable to the Company or its subsidiaries could have a material effect on our business.
Regulation of Bank Holding Companies and Their Subsidiaries in General
The Company is a bankfinancial holding company and, as such, is subject to regulation under the Bank Holding Company Act of 1956, as amended (the “Bank Holding Company Act”). The Bank Holding Company Act requires the prior approval of the Federal Reserve Board (“FRB”) before a bank holding company may acquire direct or indirect ownership or control of more than 5 percent of the voting shares of any bank (unless the bank is already majority owned by the bank holding company), acquire all or substantially all of the assets of another bank or bank holding company, or merge or consolidate with any other bank holding company. Subject to certain exceptions, the Bank Holding Company Act also prohibits a bank holding company from acquiring 5 percent or more of the voting shares of any company that is not a bank and from engaging in any business other than banking or managing or controlling banks. The primary exception to this prohibition allows a bank holding company to own shares in any company the activities of which the FRB had determined, as of November 19, 1999, to be so closely related to banking as to be a proper incident thereto.
The Company is subject to the reporting requirements of, and examination and regulation by, the FRB.Federal Reserve Board (the “FRB”). The FRB has extensive enforcement authority over bank holding companies, including, without limitation, the ability to assess civil money penalties, issue cease and desist or removal orders, and require that a bank holding company divest subsidiaries, including its subsidiary banks. In general, the FRB may initiate enforcement actions for violations of laws and regulations and for unsafe or unsound practices. A bank holding company and its subsidiaries are prohibited from engaging in certain tying arrangements in connection with extensions of credit and/or the provision of other property or services to a customer by the bank holding company or its subsidiaries.
2
The Bank Holding Company Act requires the prior approval of the FRB before a financial or bank holding company may acquire direct or indirect ownership or control of more than 5 percent of the voting shares of any bank (unless the bank is already majority owned by the bank holding company), acquire all or substantially all of the assets of another bank or another financial or bank holding company, or merge or consolidate with any other bank holding company. Subject to certain exceptions, the Bank Holding Company Act also prohibits a financial or bank holding company from acquiring 5 percent or more of the voting shares of any company that is not a bank and from engaging in any business other than banking or managing or controlling banks. The primary exception to this prohibition allows a bank holding company to own shares in any company the activities of which the FRB had determined, as of November 19, 1999, to be so closely related to banking as to be a proper incident thereto.
In April 2020, the FRB adopted a final rule to revise its regulations related to determinations of whether a company has the ability to exercise a controlling influence over another company for purposes of the Bank Holding Company Act. The final rule expands and codifies the presumptions for use in such determinations. By codifying the presumptions, the final rule provides greater transparency on the types of relationships that the FRB generally views as supporting a facts-and-circumstances determination that one company controls another company. The FRB’s final rule applies to questions of control under the Bank Holding Company Act, but does not extend to the Change in Bank Control Act.
As a result of the Gramm-Leach-Bliley Act of 1999, also known as the Financial Services Modernization Act of 1999, which amended the Bank Holding Company Act, bank holding companies that are financial holding companies may engage in any activity, or acquire and retain the shares of a company engaged in any activity, that is either (1) financial in nature or incidental to such financial activity (as determined by the FRB in consultation with the Secretary of the Treasury), or (2) complementary to a financial activity, and that does not pose a substantial risk to the safety and soundness of depository institutions or the financial system generally. Activities that are financial in nature include securities underwriting dealing and market-making, insurance underwriting and agency, and merchant banking activities. On January 2, 2019, the Company elected, and received approval from the FRB, to become a financial holding company.
Various requirements and restrictions under the laws of the United States and the State of Ohio affect the operations of State Bank, including requirements to maintain reserves against deposits, restrictions on the nature and amount of loans that may be made and the interest that may be charged thereon, restrictions relating to investments and other activities, limitations on credit exposure to correspondent banks, limitations on activities based on capital and surplus, limitations on payment of dividends, and limitations on branching.
Various consumer laws and regulations also affect the operations of State Bank. The Dodd-Frank Wall Street Reform and Consumer Protection Act of 2010 (the “Dodd-Frank Act”) established the Consumer Financial Protection Bureau (the “CFPB”), which regulates consumer financial products and services and certain financial services providers. The CFPB is authorized to prevent unfair, deceptive or abusive acts or practices and ensures consistent enforcement of laws so that consumers have access to fair, transparent and competitive markets for consumer financial products and services. Since it was established, the CFPB has exercised extensively its rulemaking and interpretative authority.
The Federal Home Loan Banks (“FHLBs”Bank (the “FHLB”) provide credit to their members in the form of advances. As a member of the FHLB of Cincinnati, State Bank must maintain certain minimum investments in the capital stock of the FHLB of Cincinnati. State Bank was in compliance with these requirements at December 31, 2017.2021.
Economic Growth, Regulatory Relief and Consumer Protection Act
On May 25, 2018, the Economic Growth, Regulatory Relief and Consumer Protection Act (the “Regulatory Relief Act”) was enacted, which repealed or modified certain provisions of the Dodd-Frank Act and eased restrictions on all but the largest banks (those with consolidated assets in excess of $250 billion). Bank holding companies with consolidated assets of less than $100 billion, including the Company, are no longer subject to enhanced prudential standards. The Regulatory Relief Act also relieves bank holding companies and banks with consolidated assets of less than $100 billion, including the Company, from certain record-keeping, reporting and disclosure requirements. Certain other regulatory requirements applied only to banks with consolidated assets in excess of $50 billion and so did not apply to the Company even before the enactment of the Regulatory Relief Act.
3
Restrictions on Dividends
There can be no assurance as to the amount of dividends which may be declared in future periods with respect to the common shares or depository shares of the Company, since such dividends are subject to the discretion of the Company’s Board of Directors, cash needs, and general business conditions, dividends from the Company’s subsidiaries and applicable governmental regulations and policies.
The ability of the Company to obtain funds for the payment of dividends and for other cash requirements is largely dependent on the amount of dividends that may be declared by State Bank and itsthe Company’s other subsidiaries. State Bank may not pay dividends to the Company if, after paying such dividends, it would fail to meet the required minimum levels under the risk-based capital guidelines and the minimum leverage ratio requirements. In addition, State Bank must obtain the approval of the FRB and the Ohio Division of Financial Institutions (“ODFI”(the “ODFI”) if a dividend in any year would cause the total dividends for that year to exceed the sum of the current year’s net profits and the retained net profits for the preceding two years, less required transfers to surplus. At December 31, 2017,2021, State Bank had $27.4 million of excess earnings over the preceding three years.
Payment of dividends by State Bank may be restricted at any time at the discretion of the regulatory authorities, if they deem such dividends to constitute an unsafe and/or unsound banking practice. Moreover, the FRB expects the Company to serve as a source of strength to its subsidiary banks, which may require it to retain capital for further investment in the subsidiary, rather than for dividends to shareholders of the Company.
Affiliate The Company’s ability to pay dividends on its shares is also conditioned upon the payment, on a current basis, of quarterly interest payments on the subordinated debentures underlying the Company’s trust preferred securities. In addition, under the terms of the Company’s fixed-to-floating rate subordinated debt, the Company’s ability to pay dividends on its shares is conditioned upon the Company continuing to make required principal and interest payments, and not incurring an event of default, with respect to the subordinated debt.
Transactions with Affiliates and Insiders
The Company and State Bank are separate and distinct legal entities. The Federal Reserve Board’sFRB’s Regulation W and various other legal limitations restrict State Bank from lending funds to, or engaging in other “covered transactions” with, the Company (or any other affiliate), generally limiting such covered transactions with any one affiliate to 10 percent of State Bank’s capital and surplus and limiting all such covered transactions with all affiliates to 20 percent of State Bank’s capital and surplus. Covered transactions, including extensions of credit, sales of securities or assets and provision of services, also must be on terms and conditions consistent with safe and sound banking practices, including credit standards, that are substantially the same or at least as favorable to State Bank as those prevailing at the time for transactions with unaffiliated companies.
A bank’s authority to extend credit to executive officers, directors and greater than 10 percent shareholders, as well as entities such persons control, is subject to Sections 22(g) and 22(h) of the Federal Reserve Act and Regulation O promulgated thereunder by the Federal Reserve Board.FRB. Among other things, these loans must be made on terms (including interest rates charged and collateral required) that are substantially the same as those offered to unaffiliated individuals or be made as part of a benefit or compensation program and on terms widely available to employees, and must not involve a greater than normal risk of repayment. In addition, the amount of loans a bank may make to these persons is based, in part, on the bank’s capital position, and certain approval procedures must be followed in making loans which exceed specified amounts.
Federally insured banks are subject, with certain exceptions, to certain additional restrictions (including collateralization) on extensions of credit to their parent holding companies or other affiliates, on investments in the stock or other securities of affiliates and on the taking of such stock or securities as collateral from any borrower. In addition, such banks are prohibited from engaging in certain tying arrangements in connection with any extension of credit or the providing of any property or service.
Regulatory Capital4
The FRB has adopted risk-based capital guidelines for bank holding companiesCOVID-19 Legislation and for state member banks,Initiatives
In response to the novel COVID-19 pandemic (“COVID-19”), the Coronavirus Aid, Relief, and Economic Security Act of 2020, as amended (the “CARES Act”), was signed into law on March 27, 2020, to provide national emergency economic relief measures. Many of the CARES Act’s programs are dependent upon the direct involvement of U.S. financial institutions, such as the Company and State Bank. The risk-based capital guidelines include both a definitionBank, and have been implemented through rules and guidance adopted by federal departments and agencies, including the U.S. Department of capital and a framework for calculating risk-weighted assets by assigning assets and off-balance-sheet items to broad risk categories.
In July 2013,Treasury, the FRB and theother federal banking agencies, published final rules that substantially amended the regulatory risk-based capital rules applicable toincluding those with direct supervisory jurisdiction over the Company and State Bank. Furthermore, as COVID-19 evolves, federal regulatory authorities continue to issue additional guidance with respect to the implementation, lifecycle, and eligibility requirements for the various CARES Act programs as well as industry-specific recovery procedures for COVID-19. In addition, it is possible that Congress will enact supplementary COVID-19 response legislation, including amendments to the CARES Act or new bills comparable in scope to the CARES Act. For example, on December 27, 2020, the Consolidated Appropriations Act, 2021 (the “CAA”) was signed into law, which, among other things, allowed certain banks to temporarily postpone implementation of the current expected credit loss model (accounting standard), which is described below. The Company is continuing to assess the impact of the CARES Act and other statues, regulations and supervisory guidance related to COVID-19.
The CARES Act amended the loan program of the Small Business Administration (the “SBA”), in which State Bank participates, to create a guaranteed, unsecured loan program, the Paycheck Protection Program (“PPP”), to fund operational costs of eligible businesses, organizations and self-employed persons during COVID-19. These rules implementloans are eligible to be forgiven if certain conditions are satisfied and are fully guaranteed by the “Basel III”SBA. In June 2020, the Paycheck Protection Program Flexibility Act was enacted, which, among other things, gave borrowers additional time and flexibility to use PPP loan proceeds. After previously being extended by Congress, the application deadline for PPP loans expired on May 31, 2021. No collateral or personal guarantees were required for PPP loans. In addition, neither the government nor lenders have been permitted to charge the recipients of PPP loans any fees. On December 27, 2020, the President signed into law omnibus federal spending and economic stimulus legislation titled the “Consolidated Appropriations Act, 2021” that included the Economic Aid to Hard-Hit Small Businesses, Nonprofits, and Venues Act (the “HHSB Act”). Among other things, the HHSB Act renewed the PPP, allocating $284.45 billion for both new first-time PPP loans under the existing PPP and the expansion of existing PPP loans for certain qualified, existing PPP borrowers. In addition to extending and amending the PPP, the HHSB Act also creates a new grant program for “shuttered venue operators”. As a participating lender in the PPP, State Bank continues to monitor legislative, regulatory, and supervisory developments related thereto.
On September 29, 2020, the federal bank regulatory agencies issued a final rule that neutralizes the regulatory capital reforms and changes requiredliquidity coverage ratio effects of participating in certain COVID-19 liquidity facilities due to the fact there is no credit or market risk in association with exposures pledged to such facilities. As a result, the final rule supports the flow of credit to households and businesses affected by COVID-19.
On December 2, 2020, the federal bank regulatory agencies issued an interim final rule that provides temporary relief for specified community banking organizations related to certain regulations and reporting requirements as a result, in large part, of their growth in size from the response to COVID-19. Community banking organizations are subject to different rules and requirements based on their risk profile and asset size. Due to their involvement in federal COVID-19 response programs (such as the PPP) and other lending that supports the U.S. economy, many community banking organizations experienced rapid and unexpected increases in their sizes, which were generally expected to be temporary. The temporary increase in size could have subjected community banking organizations to new regulations or reporting requirements. However, community banking organizations, such as the Company and State Bank, under $10.0 billion in total assets as of December 31, 2019 were permitted to use asset data as of December 31, 2019, to determine the applicability of various regulatory asset thresholds during calendar years 2020 and 2021. As such, it was not until January 1, 2022 that asset growth again triggered new regulatory requirements for these community banking organizations.
Regulatory Capital
The risk-based capital guidelines adopted by the Dodd-Frank Act. “Basel III” refers to various documents releasedfederal banking agencies are based on the “International Convergence of Capital Measurement and Capital Standard” (Basel I), published by the Basel Committee on Banking Supervision.
EffectiveSupervision (the “Basel Committee”). In July 2013, the United States banking regulators issued new capital rules applicable to smaller banking organizations which also implement certain of the provisions of the Dodd-Frank Act (the “Basel III Capital Rules”). Community banking organizations, including the Company and State Bank, began transitioning to the new rules on January 1, 2015. The new minimum capital requirements became effective on January 1, 2015, State Bank and the Company became subject to new capital regulations under Basel III (with some provisions transitioned into full effectiveness over two to four years). The new requirements createwhereas a new required ratio for common equity Tier 1 (“CET1”) capital, increases the leverage and Tier 1 capital ratios, changes the risk-weights of certain assets for purposes of the risk-based capital ratios, creates an additional capital conservation buffer over the requiredand deductions from common equity capital ratiosphased in from January 1, 2016 through January 1, 2019, and changes what qualifies asmost deductions from common equity tier 1 capital for purposes of meeting these various capital requirements. These new capital requirements are as follows: leverage ratio of 4 percent of adjusted total assets, totalphased in from January 1, 2015 through January 1, 2019.
5
The Basel III Capital Rules include (a) a minimum common equity tier 1 capital ratio of 8 percent of risk-weighted assets and4.5%, (b) a minimum Tier 1 capital ratio of 6.5 percent of risk-weighted assets. In addition, the Company will have to meet the new6.0%, (c) a minimum CET1total capital ratio of 4.5 percent8.0%, and (d) a minimum leverage ratio of risk-weighted assets. CET1 consists4.0%.
Common equity for the common equity tier 1 capital ratio generally ofincludes common stock (plus related surplus), retained earnings, and accumulated other comprehensive income (AOCI)(unless an institution elects to exclude such income from regulatory capital), and limited amounts of minority interests in the form of common stock, subject to applicable regulatory adjustments and deductions.
Tier 1 capital generally includes common equity as defined for the common equity tier 1 capital ratio, plus certain adjustments. Thenon-cumulative preferred stock and related surplus, cumulative preferred stock and related surplus, trust preferred securities that have been grandfathered (but which are not permitted going forward), and limited amounts of minority interests in the form of additional Tier 1 capital conservation buffer is being phasedinstruments, less certain deductions.
Tier 2 capital, which can be included in starting in 2016,the total capital ratio, generally consists of other preferred stock and failure to maintain the required capital conservation buffer will limit the abilitysubordinated debt meeting certain conditions plus limited amounts of the Companyallowance for loan and lease losses, subject to pay dividends, repurchase shares or pay discretionary bonuses.specified eligibility criteria, less applicable deductions.
Mortgage servicing rights,The deductions from common equity tier 1 capital include goodwill and other intangibles, certain deferred tax assets, mortgage-servicing assets above certain levels, gains on sale in connection with a securitization, investments in a banking organization’s own capital instruments and investments in the capital of unconsolidated subsidiaries over designated percentagesfinancial institutions (above certain levels).
Under the guidelines, capital is compared to the relative risk related to the balance sheet. To derive the risk included in the balance sheet, one of common stockseveral risk weights is applied to different balance sheet and off-balance sheet assets, primarily based on the relative credit risk of the counterparty. The capital amounts and classification are deducted from capital,also subject to a two-year transition period. In addition, Tier 1 capital includes AOCI, which includes all unrealized gainsqualitative judgments by the regulators about components, risk weightings and losses on available for sale debt and equity securities, subject to a two-year transition period. State Bank decided in the first quarter of 2015 to permanently opt-out of the inclusion of AOCI in its capital calculations to reduce the impact of market volatility on its regulatory capital levels.other factors.
The new requirements under Basel III Capital Rules also include changes inplace restrictions on the risk-weightspayment of capital distributions, including dividends, and certain assetsdiscretionary bonus payments to better reflect credit risk and other risk exposures. These include a 150 percent risk weight (up from 100 percent) for certain high volatility commercial real estate acquisition, development and construction loans and for non-residential mortgage loans that are 90 days past due or otherwise in nonaccrual status; a 20 percent (up from 0 percent) credit conversion factor forexecutive officers if the unused portion of a commitment with an original maturity of one year or less; a 250 percent risk-weight (up from 100 percent) for mortgage servicing and deferred tax assets that arebanking organization does not deducted from capital; and increased risk-weights (0 percent to 600 percent) for equity exposures.
In addition to the minimum CET1, Tier 1 and total capital ratios, State Bank will have to maintainhold a capital conservation buffer consisting of additional CET1 capital equal togreater than 2.5 percent composed of risk-weighted assetscommon equity tier 1 capital above each of the requiredits minimum risk-based capital levelsrequirements, or if its eligible retained income is negative in order to avoid limitations on paying dividends, engaging in share repurchasesthat quarter and paying certain discretionary bonuses. This newits capital conservation buffer requirement beganratio was less than 2.5 percent at the beginning of the quarter.
In September 2019, the FRB, along with other federal bank regulatory agencies, issued a final rule, effective January 1, 2020, that gave community banks, including the Company, the option to phasecalculate a simple leverage ratio to measure capital adequacy if the community banks met certain requirements. Under the rule, a community bank was eligible to elect the Community Bank Leverage Ratio (“CBLR”) framework if it had less than $10 billion in beginning in January 2016 at 0.625 percenttotal consolidated assets, limited amounts of risk-weightedcertain assets and increasing each year until fully implemented in January 2019. The capital conservation buffer as of December 31, 2017 is 1.25 percent.
Under the new Basel III standards, in order to be considered well-capitalized, State Bank is required to have at least a CET1 ratio of 6.5 percent, a Tier 1 ratio of 8 percent, a total capital ratio of 10 percentoff-balance sheet exposures, and a leverage ratio greater than 9.0%. Qualifying institutions that elected to use the CBLR framework (each, a “CBLR Bank”) and that maintain a leverage ratio of 5 percentgreater than 9.0% will be considered to have satisfied the risk-based and leverage capital requirements in the regulatory agencies’ generally applicable capital rules and to have met the well-capitalized ratio requirements. No CBLR Bank was required to calculate or report risk-based capital, and each CBLR Bank could opt out of the framework at any time, without restriction, by reverting to the generally applicable risk-based capital rule. Pursuant to the CARES Act, on August 26, 2020, the federal banking agencies adopted a final rule that temporarily lowered the CBLR threshold and provided a gradual transition back to the prior level. Specifically, the CBLR threshold was reduced to 8.0% for the remainder of 2020, increased to 8.5% for 2021, and returned to 9.0% on January 1, 2022. This final rule became effective on October 1, 2020. The Company did not be subjectutilize the CBLR in assessing capital adequacy and continued to specifiedfollow existing capital rules.
In December 2018, the federal banking agencies issued a final rule to address regulatory capital treatment of credit loss allowances under the current expected credit loss (“CECL”) model (accounting standard). The rule revises the federal banking agencies’ regulatory capital rules to identify which credit loss allowances under the CECL model are eligible for inclusion in regulatory capital and to provide banking organizations the option to phase in over three years the day-one adverse effects on regulatory capital that may result from the adoption of the CECL model. The Company currently anticipates recording a one-time cumulative effect adjustment upon adoption, and does not anticipate utilizing the three year phase in. The Company expects to maintain risk-based capital ratios in excess of “well-capitalized” after the impact of the one-time cumulative effect adjustment.
6
At December 31, 2021, State Bank was in compliance with all of the regulatory capital requirements to meet and maintain a specificwhich it was subject. For State Bank’s capital ratio for a capital measure.
State Bank conducted an analysis of the application of these new capital requirements as of December 31, 2017. Based on that analysis, State Bank determined that it met all of these requirements, including the full 2.5 percent capital conservation buffer, and would remain well capitalized if all of these new requirements had fully phased in as of that date. Seeratios, see Note 1318 to the Consolidated Financial Statements under Item of 8 of this report (the “Consolidated Financial Statements”).
The FRB has adopted regulations governing prompt corrective action to resolve the problems of capital deficient and otherwise troubled state-chartered member banks. At each successively lower defined capital category, a bank is subject to more restrictive and numerous mandatory or discretionary regulatory actions or limits, and the FRB has less flexibility in determining how to resolve the problems of the institution. In addition, as noted above, if State Bank does not have the required capital conservation buffer, its ability to pay dividends to the Company would be limited.
In September 2017, the FRB along with othergenerally can downgrade a bank’s capital category, notwithstanding its capital level, if, after notice and opportunity for hearings, the bank regulatory agencies, proposed amendmentsis deemed to their capital requirements to simplify certain aspects of the capital rules for community banks, including State Bank,be engaged in an attemptunsafe or unsound practice, because it has not corrected deficiencies that resulted in it receiving a less than satisfactory examination rating on matters other than capital or it is deemed to reducebe in an unsafe or unsound condition. State Bank’s capital at December 31, 2021, met the regulatory burdenstandards for smaller financial institutions. Because the amendments were proposed withhighest capital category, a request for comments and have not been finalized, we do not yet know what effect the final rules will have on State Bank and its regulatory capital calculations. In November 2017, the federal bank regulatory agencies extended for community banks the existing capital requirements for certain items that were scheduled to changed effective January 1, 2018, in light of the simplification amendments being considered.“well-capitalized” bank.
In April 2015, the Federal Reserve BoardFRB issued a final rule which increased the size limitation for qualifying bank holding companies under the Federal Reserve Board’sFRB’s Small Bank Holding Company Policy Statement from $500 million to $1 billion of total consolidated assets. As a result,In August 2018, the FRB issued an interim final rule, as required by the Regulatory Relief Act, to further increase size limitations under the Small Bank Holding Company now qualifiesPolicy Statement to $3 billion of total consolidated assets. The Company continues to qualify under the Small Bank Holding Company Policy Statement for exemption from the Federal Reserve Board’sFRB’s consolidated risk-based capital and leverage rules at the holding company level.
Federal Deposit Insurance Corporation
The Federal Deposit Insurance Corporation (“FDIC”(the “FDIC”)
The FDIC is an independent federal agency, which insures the deposits of federally insured banks and savings associations up to certain prescribed limits and safeguards the safety and soundness of financial institutions. The general insurance limit is $250,000 per separately insured depositor. This insurance is backed by the full faith and credit of the United States Government.
As insurer, the FDIC is authorized to conduct examinations of and to require reporting by insured institutions, including State Bank, to prohibit any insured institution from engaging in any activity the FDIC determines to pose a threat to the deposit insurance fund,Deposit Insurance Fund (the “DIF”), and to take enforcement actions against insured institutions. The FDIC may terminate insurance of deposits of any institution if the FDIC finds that the institution has engaged in unsafe and unsound practices, is in an unsafe or unsound condition or has violated any applicable law, regulation, rule, order or condition imposed by the FDIC or other regulatory agency.
The FDIC assesses a quarterly deposit insurance premium on each insured institution based on risk characteristics of the institution and may also impose special assessments in emergency situations. The premiumssituations, which fund the Deposit Insurance Fund (“DIF”).DIF. Pursuant to the Dodd-Frank Act, the FDIC has established 2.02 percent as the Designated Reserve Ratio (“DRR”), which is the amount in the DIF as a percentage of all DIF insured deposits. In March 2016, the FDIC adopted final rules designed to meet the statutory minimum DRR of 1.35 percent by September 30, 2020, the deadline imposed by the Dodd-Frank Act. The Dodd-Frank Act requires the FDIC to offset the effect on insured institutions with assets of less than $10 billion of the increase in the statutory minimum DRR to 1.35 percent1.35% from the former statutory minimum of 1.15 percent.1.15%. Although the FDIC’s new rules reduced assessment rates on all banks, they imposed a surcharge on banks with assets of $10 billion or more to be paid until the DRR reaches 1.35 percent. The rules also providereached 1.35%.The DRR met the statutory minimum of 1.35% on September 30, 2018. As a result, the previous surcharge imposed on banks with assets of $10 billion or more was lifted. In addition, preliminary assessment credits tohave been determined by the FDIC for banks with assets of less than $1$10 billion, for the portion of their assessments that contributewhich had previously contributed to the increase of the DRR to 1.35 percent.1.35%. On June 30, 2019, the DRR reached 1.40%, and the FDIC applied credits for banks with assets of less than $10 billion (“small bank credits”) beginning September 30, 2019. As of June 30, 2020, the DRR fell below the minimum DRR to 1.30%. As a result, the FDIC adopted a restoration plan requiring the restoration of the DRR to 1.35% within eight years (September 30, 2028). This restoration plan maintained the scheduled assessment rates for all insured institutions. As of September 30, 2021, the DRR was 1.27%. The FDIC rules further changed the method of determining risk-based assessment rates for established banks with less than $10 billion in assets to better ensure that banks taking on greater risks pay more for deposit insurance than banks that take on less risk.
In addition, all FDIC-insured institutions are requiredThe FDIC is authorized to pay assessmentsprohibit any insured institution from engaging in any activity that poses a serious threat to the insurance fund interest payments on bonds issuedand may initiate enforcement actions against a bank, after first giving the institution’s primary regulatory authority an opportunity to take such action. The FDIC may also terminate the deposit insurance of any institution that has engaged in or is engaging in unsafe or unsound practices, is in an unsafe or unsound condition to continue operations or has violated any applicable law, order or condition imposed by the Financing Corporation, which was established by the government to recapitalize a predecessor to the DIF. These assessments will continue until the Financing Corporation bonds mature in 2019.FDIC.
7
Community Reinvestment Act
The Community Reinvestment Act (CRA)(the “CRA”) requires State Bank’s primary federal regulatory agency, the FRB, to assess State Bank’s record in meeting the credit needs of the communities served by State Bank. The FRB assigns one of four ratings: outstanding, satisfactory; needs to improve or substantial noncompliance. The rating assigned to a financial institution is considered in connection with various applications submitted by the financial institution or its holding company to its banking regulators, including applications to acquire another financial institution or to open or close a branch office. In addition, all subsidiary banks of a financial holding company must maintain a satisfactory or outstanding rating in order for the financial holding company to avoid limitations on its activities. State Bank received a satisfactory rating in its most recent CRA examination.
SEC and NASDAQ Regulation
The Company is subject to the jurisdiction of the Securities and Exchange Commission (the “SEC”) and certain state securities authorities relating to the offering and sale of its securities. The Company is subject to the registration, reporting and other regulatory requirements of the Securities Act of 1933, as amended, and the Securities Exchange Act of 1934, as amended (the “Exchange Act”), and the rules adopted by the SEC under those acts. The Company’s common shares are listed on The NASDAQ Capital Market (“NASDAQ”) under the symbol “SBFG”, and the Company’s depository shares, each representing a 1/100th interest in the Company’s Series A Preferred Shares, are listed on the NASDAQ Capital Market under the symbol “SBFGP”. As a result, the Company is subject to theNASDAQ rules and regulations of The NASDAQ Stock Market, Inc. (“NASDAQ”) applicable to listed companies.
The SEC has adopted rules and regulations governing, among other matters, corporate governance, auditing and accounting, executive compensation, and enhanced and timely disclosure of corporate information. The SEC has also approved corporate governance rules promulgated by NASDAQ. The Company has adopted and implemented a Code of Conduct and Ethics and a copy of that policy can be found on the Company’s website at www.YourSBFinancial.com by first clicking “Corporate Governance” and then “Code of Conduct”. The Company has also adopted charters of the Audit Committee, the Compensation Committee and the Governance and Nominating Committee, which charters are available on the Company’s website at www.YourSBFinancial.com by first clicking “Corporate Governance” and then “Supplementary Info”.
USA Patriot Act and Anti-Money Laundering Act
The Uniting and Strengthening of America by Providing Appropriate Tools Required to Intercept and Obstruct Terrorism Act of 2001 (the “Patriot Act”) gives the United States Government greatergovernment powers over financial institutions to combat moneyaddress terrorist threats through enhanced domestic security measures, expanded surveillance powers, increased information sharing and broadened anti-money laundering and terrorist access torequirements. Title III of the financial system in our country. The Patriot Act requiresencourages information sharing among bank regulatory agencies and law enforcement bodies. Further, certain provisions of Title III impose affirmative obligations on a broad range of financial institutions. Among other requirements, Title III and related regulations require regulated financial institutions to establish programsa program specifying procedures for obtaining identifying information from customers seeking to open new accounts and establish enhanced due diligence policies, procedures and controls designed to detect and report suspicious activity. State Bank has established policies and procedures that State Bank believes comply with the requirements of the Patriot Act.
The Anti-Money Laundering Act of 2020 (the “AMLA”), which amends the Bank Secrecy Act of 1970 (the “BSA”), was enacted in January 2021. The AMLA is intended to be a comprehensive reform and modernization to U.S. bank secrecy and anti-money laundering laws. Among other things, it codifies a risk-based approach to anti-money laundering compliance for financial institutions; requires the development of standards for evaluating technology and internal processes for BSA compliance; expands enforcement-related and investigation-related authority, including increasing available sanctions for certain BSA violations and instituting BSA whistleblower initiatives and protections.
Office of Foreign Assets Control Regulation
The U.S. Treasury Department’s Office of Foreign Assets Control (“OFAC”) administers and enforces economic and trade sanctions against targeted foreign countries and regimes, under authority of various laws, including designated foreign countries, nationals and others. OFAC publishes lists of specially designated targets and countries. State Bank is responsible for, among other things, blocking accounts of, and transactions with, such targets and countries, prohibiting unlicensed trade and financial transactions with them and reporting blocked transactions after their occurrence. Failure to comply with these sanctions could have serious financial, legal and reputational consequences, including causing applicable bank regulatory authorities not to approve merger or acquisition transactions when regulatory approval is required or to prohibit such transactions even if approval is not required. Regulatory authorities have imposed cease and desist orders and civil money penalties against institutions found to be violating these obligations.
8
Executive and Incentive Compensation
The Dodd-Frank Act requires that the federal banking agencies, including the FRB and the FDIC, issue a rule related to incentive-based compensation. No final rule implementing this provision of the Dodd-Frank Act has, as of the date of the filing of this Annual Report on Form 10-K, been adopted, but a proposed rule was published in 2016 that expanded upon a prior proposed rule published in 2011. The proposed rule is intended to: (i) prohibit incentive-based payment arrangements that the banking agencies determine could encourage certain financial institutions to take inappropriate risks by providing excessive compensation or that could lead to material financial loss; (ii) require the board of directors of those financial institutions to take certain oversight actions related to incentive-based compensation; and (iii) require those financial institutions to disclose information concerning incentive-based compensation arrangements to the appropriate federal regulator. Although a final rule has not been issued, the Company has undertaken efforts to ensure that the Company’s incentive compensation plans do not encourage inappropriate risks, consistent with the principles identified above.
In June 2010, the Federal Reserve Board,FRB, the OCCOffice of the Comptroller of the Currency (the “OCC”) and the FDIC issued joint interagencycomprehensive final guidance on incentive compensation policies (the “Joint Guidance”) intended to ensure that the incentive compensation policies of banking organizations do not undermine the safety and soundness of such organizations by encouraging excessive risk-taking. This principles-basedThe guidance, which covers all employees that have the ability to materially affect the risk profile of an organization, either individually or as part of a group, is based upon the key principles that a banking organization’s incentive compensation arrangements should (a)(i) provide incentives that do not encourage risk-taking beyond the organization’s ability to effectively identify and manage risks, (b)(ii) be compatible with effective internal controls and risk management and (c)(iii) be supported by strong corporate governance, including active and effective oversight by the organization’s board of directors.
In 2011, federal banking regulatory agencies jointly issued These three principles are incorporated into the proposed rules on incentive-basedjoint compensation arrangementsregulations under applicable provisions of the Dodd-Frank Act, (the “First Proposed Rules”). described above.
The First Proposed Rules generally would have applied to financial institutions with $1.0 billion or more in assets that maintain incentive-basedFRB and the OCC review, as part of their respective regular, risk-focused examination process, the incentive compensation arrangements for certain covered employees. In May 2016,of banking organizations, such as the federal bank regulatory agencies approved a second joint notice of proposed rules (the “Second Proposed Joint Rules”) designedCompany and State Bank, that are not “large, complex banking organizations.” These reviews are tailored to prohibit incentive-based compensation arrangements that encourage inappropriate risks at financial institutions. The Second Proposed Joint Rules would apply to covered financial institutions with total assets of $1 billion or more. The requirementseach organization based on the scope and complexity of the Second Proposed Joint Rules would differ for each of three categories of financial institutions:
Some of the requirements would apply only to Level 1 and level 2 institutions. For all covered institutions, including level 3 institutions like us, the Second Proposed Rules would:
Level 1 and Level 2 institutions would have additional requirements, including deferrals of awards to certain covered persons; potential downward adjustments, forfeitures or clawbacks; and additional risk-management and control standards, policies and procedures. In addition, certain practices and typesprevalence of incentive compensation wouldarrangements. Deficiencies will be prohibited.incorporated into the organization’s supervisory ratings, which can affect the organization’s ability to make acquisitions and take other actions. Enforcement actions may be taken against a banking organization if its incentive compensation arrangements, or related risk-management control or governance processes, pose a risk to the organization’s safety and soundness and the organization is not taking prompt and effective measures to correct the deficiencies.
Public company compensation committee members must meet heightened independence requirements and consider the independence of compensation consultants, legal counsel and other advisors to the compensation committee. A compensation committee must have the authority to hire advisors and to have the public company fund reasonable compensation of such advisors.
SEC regulations require public companies to provide various disclosures about executive compensation in annual reports and proxy statements and to present to their shareholders a non-binding vote on the approval of executive compensation.
Public companies will be required, once stock exchanges impose additional listing requirements under the Dodd-Frank Act, to implement “clawback” procedures for incentive compensation payments and to disclose the details of the procedures which allow recovery of incentive compensation that was paid on the basis of erroneous financial information necessitating a restatement due to material noncompliance with financial reporting requirements. This clawback policy is intended to apply to compensation paid within a three-year look-back window of the restatement and would cover all executives who received incentive awards.
Consumer Protection Laws and Regulations
Banks are subject to regular examination to ensure compliance with federal consumer protection statutes and regulations, including, but not limited to, the following:
| ● | The Equal Credit Opportunity Act (prohibiting discrimination in any credit transaction on the basis of any of various criteria); | |
| ● | The Truth in Lending Act (requiring that credit terms are disclosed in a manner that permits a consumer to understand and compare credit terms more readily and knowledgeably); | |
9
| ● | The Fair Housing Act (making it unlawful for a lender to discriminate in housing-related lending activities against any person on the basis of certain criteria); | |
| ● | The Home Mortgage Disclosure Act (requiring financial institutions to collect data that enables regulatory agencies to determine whether financial institutions are serving the housing credit needs of the communities in which they are located); and | |
| ● | The Real Estate Settlement Procedures Act (requiring that lenders provide borrowers with disclosures regarding the nature and cost of real estate settlements and prohibits abusive practices that increase borrowers’ costs) |
| ● | Privacy provisions of the Gramm-Leach-Bliley Act (requiring financial institutions to establish policies and procedures to restrict the sharing of non-public customer data with non-affiliated parties and to protect customer information from unauthorized access). |
The banking regulators also use their authority under the Federal Trade Commission Act to take supervisory or enforcement action with respect to unfair or deceptive acts or practices by banks that may not necessarily fall within the scope of a specific banking or consumer finance law.
Financial Privacy Provisions
Federal and state regulations limit the ability of banks and other financial institutions to disclose non-public information about consumers to non-affiliated third parties. These limitations require disclosure of privacy policies to consumers and, in some circumstances, allow consumers to prevent disclosure of certain personal information to a non-affiliated third party. These regulations affect how consumer information is transmitted through diversified financial companies and conveyed to outside vendors.
State Bank is also subject to regulatory guidelines establishing standards for safeguarding customer information. These guidelines describe the federal bank regulatory agencies’ expectations for the creation, implementation and maintenance of an information security program, which would include administrative, technical and physical safeguards appropriate to the size and complexity of the institution and the nature and scope of its activities. The standards set forth in the guidelines are intended to ensure the security and confidentiality of customer records and information, protect against any anticipated threats or hazards to the security or integrity of such records and protect against unauthorized access to or use of such records or information that could result in substantial harm or inconvenience to any customer.
Cybersecurity
In March 2015, federal regulators issued two related statements regarding cybersecurity. One statement indicates that financial institutions should design multiple layers of security controls to establish several lines of defense and to ensure that their risk management processes also address the risk posed by compromised customer credentials, including security measures to reliably authenticate customers accessing Internet-based services of the financial institution. The other statement indicates that a financial institution’s management is expected to maintain sufficient business continuity planning processes to ensure the rapid recovery, resumption and maintenance of the financial institution’s operations after a cyber-attack involving destructive malware. A financial institution is also expected to develop appropriate processes to enable recovery of data and business operations and address rebuilding network capabilities and restoring data if the financial institution or its critical service providers fall victim to this type of cyber-attack. If State Bank fails to observe the regulatory guidance, it could be subject to various regulatory sanctions, including financial penalties.
In February 2018, the SEC published interpretive guidance to assist public companies in preparing disclosures about cybersecurity risks and incidents. These SEC guidelines, and any other regulatory guidance, are in addition to notification and disclosure requirements under state and federal banking law and regulations.
In November 2021, the OCC, the FRB and the FDIC issued a final rule requiring banking organizations that experience a computer-security incident to notify certain entities. A computer-security incident occurs when actual or potential harm to the confidentiality, integrity, or availability of an information system or the information occurs, or there is a violation or imminent threat of a violation to banking security policies and procedures. The affected bank must notify its respective federal regulator of the computer-security incident as soon as possible and no later than 36 hours after the bank determines a computer-security incident has occurred. These notifications are intended to promote early awareness of threats to banking organizations and will help banks react to those threats before they manifest into bigger incidents. This rule also requires bank service providers to notify its customers of a computer-security incident.
10
State regulators have also been increasingly active in implementing privacy and cybersecurity standards and regulations. Recently, several states have adopted regulations requiring certain financial institutions to implement cybersecurity programs and providing detailed requirements with respect to these programs, including data encryption requirements. Many states have also recently implemented or modified their data breach notification and data privacy requirements. The Company expects this trend of state-level activity in those areas to continue, and is continually monitoring developments in the states in which our customers are located.
In the ordinary course of business, the Company relies on electronic communications and information systems to conduct its operations and to store sensitive data. The Company employs an in-depth, layered, defensive approach that leverages people, processes and technology to manage and maintain cybersecurity controls. The Company employs a variety of preventative and detective tools to monitor, block, and provide alerts regarding suspicious activity, as well as to report on any suspected advanced persistent threats. The Company has also invested over the last eighteen months to further enhance these tools and mechanisms. Notwithstanding the strength of the Company’s defensive measures, the threat from cyber-attacks is severe, attacks are sophisticated and increasing in volume, and attackers respond rapidly to changes in defensive measures. While to date, the Company has not detected a significant compromise, significant data loss or any material financial losses related to cybersecurity attacks, Company’s systems and those of its customers and third-party service providers are under constant threat and it is possible that the Company could experience a significant event in the future. Risks and exposures related to cybersecurity attacks are expected to remain high for the foreseeable future due to the rapidly evolving nature and sophistication of these threats, as well as due to the expanding use of Internet banking, mobile banking and other technology-based products and services by us and our customers.
Effect of Environmental Regulation
Compliance with federal, state and local provisions regulating the discharge of materials into the environment, or otherwise relating to the protection of the environment, has not had a material effect upon the capital expenditures, earnings or competitive position of the Company and its subsidiaries. The Company believes that the nature of the operations of its subsidiaries has little, if any, environmental impact. The Company, therefore, anticipates no material capital expenditures for environmental control facilities for its current fiscal year or for the near future. The Company’s subsidiaries may be required to make capital expenditures for environmental control facilities related to properties which they may acquire through foreclosure proceedings in the future; however, the amount of such capital expenditures, if any, is not currently determinable.
Effects of Government Monetary Policy
The following are the condensed average balance sheetsearnings of the Company forare affected by general and local economic conditions and by the years ending December 31policies of various governmental regulatory authorities. In particular, the FRB regulates money and includescredit conditions and interest rates to influence general economic conditions, primarily through open market acquisitions or dispositions of United States Government securities, varying the interest earned or paid, and the average interestdiscount rate on each assetmember bank borrowings and liability:
| 2017 | 2016 | 2015 | ||||||||||||||||||||||||||||||||||
| Average | Average | Average | Average | Average | Average | |||||||||||||||||||||||||||||||
| ($ in thousands) | Balance | Interest | Rate | Balance | Interest | Rate | Balance | Interest | Rate | |||||||||||||||||||||||||||
| Assets: | ||||||||||||||||||||||||||||||||||||
| Taxable securities | $ | 84,918 | $ | 2,076 | 2.44 | % | $ | 79,301 | $ | 1,536 | 1.94 | % | $ | 78,840 | $ | 1,506 | 1.91 | % | ||||||||||||||||||
| Non-taxable securities | 14,088 | 527 | 3.74 | % | 15,365 | 594 | 3.87 | % | 17,593 | 694 | 3.94 | % | ||||||||||||||||||||||||
| Loans, net (1) | 660,675 | 29,877 | 4.52 | % | 603,875 | 26,921 | 4.46 | % | 531,614 | 23,727 | 4.46 | % | ||||||||||||||||||||||||
| Total earning assets | 759,681 | 32,480 | 4.28 | % | 698,541 | 29,051 | 4.16 | % | 628,047 | 25,927 | 4.13 | % | ||||||||||||||||||||||||
| Cash and due from banks | 35,337 | 34,999 | 38,895 | |||||||||||||||||||||||||||||||||
| Allowance for loan losses | (7,828 | ) | (7,389 | ) | (6,979 | ) | ||||||||||||||||||||||||||||||
| Premises and equipment | 21,084 | 19,124 | 16,427 | |||||||||||||||||||||||||||||||||
| Other assets | 46,295 | 43,770 | 43,196 | |||||||||||||||||||||||||||||||||
| Total assets | $ | 854,569 | $ | 789,045 | $ | 719,586 | ||||||||||||||||||||||||||||||
| Liabilities | ||||||||||||||||||||||||||||||||||||
| Savings and interest-bearing demand deposits | $ | 369,114 | $ | 795 | 0.22 | % | $ | 345,302 | $ | 524 | 0.15 | % | $ | 309,169 | $ | 346 | 0.11 | % | ||||||||||||||||||
| Time deposits | 214,639 | 2,661 | 1.24 | % | 184,640 | 2,054 | 1.11 | % | 162,245 | 1,633 | 1.01 | % | ||||||||||||||||||||||||
| Repurchase agreements & Other | 12,350 | 15 | 0.12 | % | 15,027 | 16 | 0.11 | % | 15,749 | 17 | 0.11 | % | ||||||||||||||||||||||||
| Advances from FHLB | 20,000 | 320 | 1.60 | % | 23,892 | 352 | 1.47 | % | 29,996 | 375 | 1.25 | % | ||||||||||||||||||||||||
| Trust preferred securities | 10,310 | 303 | 2.94 | % | 10,310 | 252 | 2.44 | % | 10,310 | 213 | 2.07 | % | ||||||||||||||||||||||||
| Total interest-bearing liabilities | 626,413 | 4,094 | 0.65 | % | 579,171 | 3,198 | 0.55 | % | 527,469 | 2,584 | 0.49 | % | ||||||||||||||||||||||||
| Demand deposits | 127,747 | 115,905 | 104,426 | |||||||||||||||||||||||||||||||||
| Other liabilities | 10,871 | 9,429 | 9,073 | |||||||||||||||||||||||||||||||||
| Total liabilities | 765,031 | 704,505 | 640,968 | |||||||||||||||||||||||||||||||||
| Shareholders’ equity | 89,538 | 84,540 | 78,618 | |||||||||||||||||||||||||||||||||
| Total liabilities and shareholders’ equity | $ | 854,569 | $ | 789,045 | $ | 719,586 | ||||||||||||||||||||||||||||||
| Net interest income (tax equivalent basis) | $ | 28,386 | $ | 25,853 | $ | 23,343 | ||||||||||||||||||||||||||||||
| Net interest income as a percent of average interest-earning assets - GAAP measure | 3.74 | % | 3.70 | % | 3.72 | % | ||||||||||||||||||||||||||||||
| Net interest income as a percent of average interest-earning assets - Non-GAAP measure (2)(3) | 3.78 | % | 3.75 | % | 3.78 | % | ||||||||||||||||||||||||||||||
The tax equivalent adjustment was $0.27, $0.31 and $0.36 million in 2017, 2016 and 2015, respectively.
The tax equivalent adjustment was $0.04, $0.04 and $0.02 million in 2017, 2016 and 2015, respectively.
The following tables set forth the effect of volume and rate changes on interest income and interest expense for the periods indicated. For purposes of these tables, changes in interest due to volumecommercial banks, including State Bank, and rate were determined as follows:
| Total | ||||||||||||
| Variance | Variance Attributable To | |||||||||||
| ($ in thousands) | 2017/2016 | Volume | Rate | |||||||||
| Interest income | ||||||||||||
| Taxable securities | $ | 540 | $ | 109 | $ | 431 | ||||||
| Non-taxable securities | (102 | ) | (75 | ) | (27 | ) | ||||||
| Federal funds sold | - | - | - | |||||||||
| Loans, net of unearned income and deferred fees * | 2,961 | 2,536 | 425 | |||||||||
| Total interest income | 3,399 | 2,570 | 829 | |||||||||
| Interest expense | ||||||||||||
| Savings and interest-bearing demand deposits | $ | 271 | $ | 36 | 235 | |||||||
| Time deposits | 607 | 334 | 273 | |||||||||
| Repurchase agreements & Other | (1 | ) | (3 | ) | 2 | |||||||
| Advances from FHLB | (32 | ) | (57 | ) | 25 | |||||||
| Trust preferred securities | 51 | - | 51 | |||||||||
| Total interest expense | 896 | 310 | 586 | |||||||||
| Net interest income | $ | 2,503 | $ | 2,260 | $ | 243 | ||||||
| ($ in thousands) | 2017 | 2016 | 2015 | |||||||||
| U.S. Treasury and government agencies | $ | 12,708 | $ | 13,358 | $ | 10,905 | ||||||
| Mortgage-backed securities | 56,762 | 61,603 | 61,343 | |||||||||
| State and political subdivisions | 13,250 | 15,097 | 17,518 | |||||||||
| Marketable equity securities | 70 | 70 | 23 | |||||||||
| Total | $ | 82,790 | $ | 90,128 | $ | 89,789 | ||||||
| Maturing | ||||||||||||||||
| After One Year | After Five Years | |||||||||||||||
| Within | but within | but within | After | |||||||||||||
| ($ in thousands) | One Year | Five Years | Ten Years | Ten Years | ||||||||||||
| U.S. Treasury and government agencies | $ | - | $ | 3,141 | $ | 7,215 | $ | 2,352 | ||||||||
| Mortgage-backed securities | 57 | 10,650 | 6,944 | 39,111 | ||||||||||||
| State and political subdivisions | 1,590 | 4,286 | 3,516 | 3,858 | ||||||||||||
| Total Securities with maturity | $ | 1,647 | $ | 18,077 | $ | 17,675 | $ | 45,321 | ||||||||
| Weighted-average yield by maturity (1) | 6.32 | % | 2.54 | % | 3.01 | % | 2.55 | % | ||||||||
| Marketable equity securities with no maturity | 70 | - | - | - | ||||||||||||
| Total Securities with no stated maturity | $ | 70 | $ | - | $ | - | $ | - | ||||||||
| Weighted average yield no maturity (1) | 8.00 | % | - | - | - | |||||||||||
| Loans Held for Investment (HFI) | 2017 | 2016 | 2015 | 2014 | 2013 | |||||||||||||||
| Commercial business and agricultural | $ | 153,988 | $ | 161,562 | $ | 130,421 | $ | 134,546 | $ | 124,578 | ||||||||||
| Commercial real estate | 332,154 | 284,084 | 242,208 | 217,030 | 205,301 | |||||||||||||||
| Residential real estate | 150,854 | 142,452 | 130,806 | 113,214 | 99,620 | |||||||||||||||
| Consumer & other loans | 59,619 | 56,335 | 54,224 | 51,546 | 47,804 | |||||||||||||||
| Total loans, net of unearned income | 696,615 | 644,433 | 557,659 | 516,336 | 477,303 | |||||||||||||||
| Residential Loans held for sale | 3,940 | 4,434 | 7,516 | 5,168 | 3,366 | |||||||||||||||
| Total Loans, net of unearned income | $ | 700,555 | $ | 648,867 | $ | 565,175 | $ | 521,504 | $ | 480,669 | ||||||||||
Concentrations of Credit Risk: The Company grants commercial, real estate and installment loans to customers located mainly in the Tri-State region of Ohio, Indiana and Michigan. Commercial loans include loans collateralized by commercial real estate, business assets and, in the case of agricultural loans, crops and farm equipment and the loans are expected to be repaid from cash flow from operations of businesses. As ofcontinue to do so in the future.
Human Capital Resources
At December 31, 2017, commercial business and agricultural loans made up approximately 22.0 percent of2021, the HFI loan portfolio while commercial real estate loans accounted for approximately 47.7 percent of the HFI loan portfolio. As of December 31, 2017, residential first mortgage loans made up approximately 21.7 percent of the HFI loan portfolio and are secured by first mortgages on residential real estate, while consumer loansCompany had 269 full-time equivalent employees, compared to individuals made up approximately 8.6 percent of the HFI loan portfolio and are primarily secured by consumer assets.
($ in thousands) | Commercial Business & Ag. | Commercial Real Estate | Total | |||||||||
| Maturing | ||||||||||||
| Within one year | $ | 27,819 | $ | 30,972 | $ | 58,791 | ||||||
| After one year but within five years | 50,872 | 112,178 | 163,050 | |||||||||
| After five years | 75,297 | 189,004 | 264,301 | |||||||||
| Total | $ | 153,988 | $ | 332,154 | $ | 486,142 | ||||||
| Interest Sensitivity | ||||||||||||
| Fixed | Variable | |||||||||||
| ($ in thousands) | Rate | Rate | Total | |||||||||
| Commercial Business and Agricultural | ||||||||||||
| Due after one year but within five years | $ | 23,745 | $ | 27,127 | $ | 50,872 | ||||||
| Due after five years | 8,365 | 66,932 | 75,297 | |||||||||
| Total | $ | 32,110 | $ | 94,059 | $ | 126,169 | ||||||
| Commercial Real Estate | ||||||||||||
| Due after one year but within five years | 58,065 | 54,113 | 112,178 | |||||||||
| Due after five years | 59,100 | 129,904 | 189,004 | |||||||||
| Total | $ | 117,165 | $ | 184,017 | $ | 301,182 | ||||||
| Total Commercial, Commercial RE & Ag. | ||||||||||||
| Due after one year but within five years | 81,810 | 81,240 | 163,050 | |||||||||
| Due after five years | 67,465 | 196,836 | 264,301 | |||||||||
| Total | $ | 149,275 | $ | 278,076 | $ | 427,351 | ||||||
| ($ in thousands) | 2017 | 2016 | 2015 | 2014 | 2013 | |||||||||||||||
| Loans accounted for on a non-accrual basis | $ | 2,704 | $ | 2,737 | $ | 6,646 | $ | 4,609 | $ | 4,844 | ||||||||||
| Accruing loans 90 days past due | - | - | - | - | - | |||||||||||||||
| Accruing Troubled Debt Restructurings | 1,129 | 1,590 | 1,500 | 1,384 | 1,739 | |||||||||||||||
| Total non-performing loans and TDRs | $ | 3,833 | $ | 4,327 | $ | 8,146 | $ | 5,993 | $ | 6,583 | ||||||||||
Listed below is the interest income on impaired and nonaccrual loans244 at December 31, 2020. SB Financial seeks to provide an above peer workplace for the years indicated:
| ($ in thousands) | 2017 | 2016 | 2015 | |||||||||
| Cash basis interest income recognized on impaired loans outstanding | $ | 155 | $ | 189 | $ | 239 | ||||||
| Interest income actually recorded on impaired loans and included in net income for the period | 159 | 190 | 245 | |||||||||
| Unrecorded interest income on nonaccrual loans | 72 | 57 | 86 | |||||||||
None
At December 31, 2017, loans outstanding relatedour employees, with an emphasis on recognizing performance, quality benefits, a culture of learning and growth. We offer paid time off, medical, dental and vision insurance, along with wellness programs, a 401(k) program, an employee stock ownership plan, programs to agricultural operations or collateralized by agricultural real estateassist with education-related costs, reward and equipment aggregated approximately $51.9 million, or 7.5 percent of total HFI loans.
There were no other interest-bearing assets as of December 31, 2017, which would be required to be disclosed under Item III.C.1 or Item III.C.2. if such assets were loans.
Management believes the allowance for loan losses at December 31, 2017 was adequate to absorb any losses on nonperforming loans, as the allowance balance is maintained by management at a level considered adequate to cover losses that are probable based on past loss experience, general economic conditions, information about specific borrower situations, including their financial position and collateral values, and other factors and estimates which are subject to change over time.
| ($ in thousands) | 2017 | 2016 | 2015 | 2014 | 2013 | |||||||||||||||
| Loans | ||||||||||||||||||||
| Loans outstanding at end of period | $ | 696,615 | $ | 644,433 | $ | 557,659 | $ | 516,336 | $ | 477,303 | ||||||||||
| Average loans outstanding during period | $ | 660,675 | $ | 603,875 | $ | 531,614 | $ | 501,486 | $ | 469,603 | ||||||||||
| Allowance for loan losses | ||||||||||||||||||||
| Balance at beginning of period | $ | 7,725 | $ | 6,990 | $ | 6,771 | $ | 6,964 | $ | 6,811 | ||||||||||
| Loans charged off: | ||||||||||||||||||||
| Commercial business and agricultural loans | (50 | ) | (135 | ) | (497 | ) | (607 | ) | (1 | ) | ||||||||||
| Commercial real estate | (26 | ) | (241 | ) | (303 | ) | (13 | ) | (111 | ) | ||||||||||
| Residential real estate mortgage | (61 | ) | (20 | ) | (56 | ) | (92 | ) | (264 | ) | ||||||||||
| Consumer loans and other | (94 | ) | (105 | ) | (96 | ) | (135 | ) | (443 | ) | ||||||||||
| (231 | ) | (501 | ) | (952 | ) | (847 | ) | (819 | ) | |||||||||||
| Recoveries of loans previously charged off | ||||||||||||||||||||
| Commercial business and agricultural loans | 10 | 420 | 29 | 22 | 22 | |||||||||||||||
| Commercial real estate | 2 | 5 | 3 | 125 | 17 | |||||||||||||||
| Residential real estate mortgage | 6 | 2 | 29 | 32 | 21 | |||||||||||||||
| Consumer loans and other | 18 | 59 | 10 | 25 | 12 | |||||||||||||||
| 36 | 486 | 71 | 204 | 72 | ||||||||||||||||
| Net loans charged off | (195 | ) | (15 | ) | (881 | ) | (643 | ) | (747 | ) | ||||||||||
| Provision for loan losses | 400 | 750 | 1,100 | 450 | 900 | |||||||||||||||
| Balance at end of period | $ | 7,930 | $ | 7,725 | $ | 6,990 | $ | 6,771 | $ | 6,964 | ||||||||||
| Ratio of net charge offs to average loans | 0.03 | % | 0.00 | % | 0.17 | % | 0.13 | % | 0.16 | % | ||||||||||
The allowance for loan losses balance and the provision for loan losses are determined by management based upon periodic reviews of the loan portfolio. In addition, management considers the level of charge-offs on loans,recognition programs, as well as other various programs and benefits.
The safety of our employees has been our top priority over the fluctuations of charge-offs and recoveries on loans, in the factors which caused these changes. Estimating the risk of loss and the amount of loss is necessarily subjective. Accordingly, the allowance is maintained by management at a level considered adequate to cover losses that are currently anticipated based on past loss experience, economic conditions, information about specific borrower situations, including their financial position and collateral values, and other factors and estimates which are subject to change over time.
| Percentage | Percentage | Percentage | Percentage | Percentage | ||||||||||||||||||||||||||||||||||||
| of Loans In | of Loans In | of Loans In | of Loans In | of Loans In | ||||||||||||||||||||||||||||||||||||
| Each | Each | Each | Each | Each | ||||||||||||||||||||||||||||||||||||
| Category to | Category to | Category to | Category to | Category to | ||||||||||||||||||||||||||||||||||||
| Allowance | Total | Allowance | Total | Allowance | Total | Allowance | Total | Allowance | Total | |||||||||||||||||||||||||||||||
| Amount | Loans | Amount | Loans | Amount | Loans | Amount | Loans | Amount | Loans | |||||||||||||||||||||||||||||||
| ($ in thousands) | 2017 | 2016 | 2015 | 2014 | 2013 | |||||||||||||||||||||||||||||||||||
| Commercial and agricultural | $ | 1,328 | 22.1 | % | $ | 1,551 | 25.1 | % | $ | 1,118 | 23.4 | % | $ | 1,838 | 26.1 | % | $ | 2,334 | 26.1 | % | ||||||||||||||||||||
| Commercial real estate | 3,779 | 47.7 | % | 3,321 | 44.1 | % | 3,886 | 43.4 | % | 2,857 | 42.0 | % | 2,708 | 43.0 | % | |||||||||||||||||||||||||
| Residential real estate | 2,129 | 21.7 | % | 1,963 | 22.1 | % | 1,312 | 23.5 | % | 1,308 | 21.9 | % | 1,067 | 20.9 | % | |||||||||||||||||||||||||
| Consumer & other loans | 694 | 8.5 | % | 155 | 8.7 | % | 674 | 9.7 | % | 768 | 10.0 | % | 855 | 10.0 | % | |||||||||||||||||||||||||
| $ | 7,930 | 100.0 | % | $ | 6,990 | 100.0 | % | $ | 6,990 | 100.0 | % | $ | 6,771 | 100.0 | % | $ | 6,964 | 100.0 | % | |||||||||||||||||||||
While management’s periodic analysis of the adequacyCOVID-19 pandemic. A portion of our workforce continues to work remotely and we have occasionally closed lobbies to appointment-only during times of heightened transmission of COVID-19 to protect the health of our employees. SB Financial has supported its employees during the pandemic, and provided time off with pay for those who have either tested positive, or those caring for a family member who has tested positive. We will continue to follow all of the allowance for loan losses may allocate portions of the allowance for specific problem loan situations, the entire allowance is available for any loan charge-offs that occur.
The average amount of depositsappropriate guidance and average rates paid are summarizedengage our staff members as follows for the years ended December 31:
| 2017 | 2016 | 2015 | ||||||||||||||||||||||
| Average | Average | Average | Average | Average | Average | |||||||||||||||||||
| ($ in thousands) | Amount | Rate | Amount | Rate | Amount | Rate | ||||||||||||||||||
| Savings and interest bearing demand deposits | $ | 369,114 | 0.22 | % | $ | 345,302 | 0.15 | % | $ | 309,169 | 0.11 | % | ||||||||||||
| Time deposits | 214,639 | 1.24 | % | 184,640 | 1.11 | % | 162,245 | 1.01 | % | |||||||||||||||
| Demand deposits (non interest bearing) | 127,747 | - | 115,905 | - | 104,426 | - | ||||||||||||||||||
| $ | 711,500 | $ | 645,847 | $ | 575,840 | |||||||||||||||||||
Maturities of time certificates of deposit and other time deposits of $100,000 or more outstanding at December 31, 2017, are summarized as follows:
| Amount | ||||
| ($ in thousands) | ||||
| Three months or less | $ | 24,321 | ||
| Over three months through six months | 18,795 | |||
| Over six months and through twelve months | 26,659 | |||
| Over twelve months | 49,791 | |||
| Total | $ | 119,566 | ||
needed to deal with new challenges.
11
| Risk Factors. |
The ratio of net income to average shareholders’ equity and average total assets and certain other ratios are as follows for periods ended December 31:
| ($ in thousands) | 2017 | 2016 | 2015 | |||||||||
| Average total assets | $ | 854,569 | $ | 789,045 | $ | 719,586 | ||||||
| Average shareholders’ equity | $ | 89,538 | $ | 84,540 | $ | 78,618 | ||||||
| Net income | $ | 11,065 | $ | 8,784 | $ | 7,619 | ||||||
| Net income available to common shareholders | $ | 10,090 | $ | 7,809 | $ | 6,663 | ||||||
| Cash dividends declared | $ | 0.28 | $ | 0.24 | $ | 0.20 | ||||||
| Return on average total assets | 1.29 | % | 1.11 | % | 1.06 | % | ||||||
| Return on average shareholders’ equity | 12.36 | % | 10.39 | % | 9.69 | % | ||||||
| Dividend payout ratio (1) | 13.50 | % | 15.11 | % | 14.71 | % | ||||||
| Average shareholders’ equity to average assets | 10.48 | % | 10.71 | % | 10.93 | % | ||||||
The following information is reported for short-term borrowings, which are comprised of retail repurchase agreements for the periods noted:
| ($ in thousands) | 2017 | 2016 | 2015 | |||||||||
| Amount outstanding at end of year | $ | 15,082 | $ | 10,532 | $ | 12,406 | ||||||
| Weighted average interest rate at end of year | 0.10 | % | 0.10 | % | 0.10 | % | ||||||
| Maximum amount outstanding at any month end | $ | 18,444 | $ | 20,560 | $ | 20,306 | ||||||
| Average amount outstanding during the year | $ | 12,350 | $ | 15,027 | $ | 15,749 | ||||||
| Weighted average interest rate during the year | 0.12 | % | 0.11 | % | 0.11 | % | ||||||
Cautionary Statement Regarding Forward-Looking Information
Certain statements contained in this Annual Report on Form 10-K, and in other statements that we make from time to time in filings by the Company with the SEC, in press releases, and in oral and written statements made by or with the approval of the Company which are not statements of historical fact constitute forward-looking statements within the meaning of the Private Securities Litigation Reform Act of 1995. Examples of forward-looking statements include: (a) projections of income or expense, earnings per share, the payment or non-payment of dividends, capital structure and other financial items; (b) statements of plans and objectives of the Company or our Board of Directors or management, including those relating to products and services; (c) statements of future economic performance; (d) statements of future customer attraction or retention; and (d) statements of assumptions underlying these statements. Forward-looking statements reflect our expectations, estimates or projections concerning future results or events. These statements are generally identified by the use of forward-looking words or phrases such as “anticipates”, “believes”, “plans”“estimates”, “expects”, “intends”, “expects”“may”, “plans”, “projects”, “estimates”, “should”, “may”, “would be”, “will allow”, “will continue”, “will likely result”, “will continue”remain”, “will remain”“would be”, or similar expressions.
The Private Securities Litigation Reform Act of 1995 provides a “safe harbor” for forward-looking statements to encourage companies to provide prospective information so long as those statements are identified as forward-looking and are accompanied by meaningful cautionary statements identifying important factors that could cause actual results to differ materially from those discussed in the forward-looking statements. We desire to take advantage of the “safe harbor” provisions of the Act.
Forward-looking statements involve risks and uncertainties. Actual results may differ materially from those predicted by the forward-looking statements because of various factors and possible events, including those risk factors identified below. These risks and uncertainties include, but are not limited to, risks and uncertainties inherentdiscussed in the national and regional banking industry, changes in economic and political conditions in the market areas in which the Company and its subsidiaries operate, changes in laws, regulations or policies by regulatory agencies, changes in accounting standards and policies, changes in tax laws, fluctuations in interest rates, demand for loans in the market areas in which the Company and its subsidiaries operate, increases in FDIC insurance premiums, changes in the competitive environment, losses of significant customers, geopolitical events, unanticipated litigation, the loss of key personnel and other factors.Risk Factors below. There is also the risk that the Company’s management or Board of Directors incorrectly analyzes these risks and forces, or that the strategies the Company develops to address them are unsuccessful.
Forward-looking statements speak only as of that date on which they are made. Except as may be required by law, the Company undertakes no obligation to update any forward-looking statement to reflect events or circumstances after the date on which the statement is made. All forward-looking statements attributable to the Company or any person acting on our behalf are qualified in their entirety by the following cautionary statements.
Economic, Market and Political Risks:
The economic impact of the COVID-19 pandemic or any other pandemic could adversely affect our business, financial condition, liquidity, and results of operations.
The ongoing COVID-19 pandemic has negatively impacted global, national and local economies, disrupted global and national supply chains, lowered equity market valuations, and created significant volatility and disruption in financial markets. In addition, the pandemic resulted in temporary closures of many businesses and the institution of social distancing and sheltering in place requirements in many states and communities and may result in the same or similar restrictions in the future. As a result, the demand for the Company’s products and services has been and may continue to be significantly impacted, which could adversely affect our revenue and results of operations. Furthermore, the COVID-19 pandemic could result in the recognition of credit losses in our loan portfolios and increases in our allowance for credit losses, particularly if businesses remain required to operate at diminished capacities or are required to close again, the impact on the global, national and local economies worsen, or more customers draw on their lines of credit or seek additional loans to help finance their businesses. Our business operations may also be disrupted if significant portions of our workforce are unable to work effectively, including because of illness, quarantines, government actions, or other restrictions in connection with COVID-19. The extent to which COVID-19 impacts the our business, results of operations, and financial condition, as well as our regulatory capital and liquidity ratios, will depend on future developments, which are highly uncertain and cannot be predicted, including the scope and duration of the pandemic and actions taken by governmental authorities and other third parties in response to the pandemic.
We originated a significant number of PPP loans in 2020 and 2021 and, as of December 31, 2021, we continued to hold and service a limited number of PPP loans. These PPP loans are subject to the provisions of the CARES Act and to complex and evolving rules and guidance issued by the SBA and other government agencies. A great majority of our PPP borrowers have sought and obtained, or are expected to seek full or partial forgiveness of their loan obligations. We have credit risk on the PPP loans if the SBA determines that there is a deficiency in the manner in which we originated, funded or serviced loans, including any issue with the eligibility of a borrower to receive a PPP loan. We could face additional risks in our administrative capabilities to service our PPP loans, and risk with respect to the determination of loan forgiveness. In the event of a loss resulting from a default on a PPP loan and a determination by the SBA that there was a deficiency in the manner in which we originated, funded or serviced the PPP loan, the SBA may deny its liability under the guaranty, reduce the amount of the guaranty or, if the SBA has already paid under the guaranty, seek recovery of any loss related to the deficiency.
12
The spread of COVID-19, including new variants thereof, has also caused us to modify our business practices, including employee travel, employee work locations, and cancellation of physical participation in meetings, events and conferences. Further, technology in employees’ homes may not be as robust as in our offices and could cause the networks, information systems, applications, and other tools available to such employees to be more limited or less reliable. The continuation of these work-from-home measures also introduces additional operational risk, including increased cybersecurity risk from phishing, malware, and other cybersecurity attacks, all of which could expose us to risks of data or financial loss and could seriously disrupt our operations and the operations of any impacted customers.
COVID-19, including the spread of new variants thereof, or a new pandemic could subject us to any of the following risks, any of which could, individually or in the aggregate, have a material adverse effect on our business, financial condition, liquidity, and results of operations:
| ● | demand for our products and services may decline, making it difficult to grow assets and income; |
| ● | if the economy is unable to fully reopen or experiences additional or new closures or downturns as a result of the COVID-19 pandemic, loan delinquencies, problem assets, and foreclosures may increase, resulting in increased charges and reduced income; |
| ● | collateral for loans, especially real estate, may decline in value, which could cause loan losses to increase; |
| ● | our allowance for loan losses may have to be increased if borrowers experience financial difficulties beyond forbearance periods, which will adversely affect our net income; |
| ● | the net worth and liquidity of loan guarantors may decline, impairing their ability to honor commitments to us; |
| ● | a prolonged weakness in economic conditions resulting in a reduction of future projected earnings could result in our recording a valuation allowance against our current outstanding deferred tax assets; |
| ● | we rely on third party vendors for certain services and the unavailability of a critical service due to COVID-19 could have an adverse effect on us; and |
| ● | continued adverse economic conditions could result in protracted volatility in the price of our Common Shares. |
Moreover, our future success and profitability substantially depend on the management skills of our executive officers and directors, many of whom have held officer and director positions with us for many years. The unanticipated loss or unavailability of key employees due to COVID-19, including new variants thereof, or any similar pandemic could harm our ability to operate our business or execute our business strategy. We may not be successful in finding and integrating suitable successors in the event of key employee loss or unavailability.
Even after the COVID-19 pandemic subsides, the U.S. economy will likely require time to recover, the length of which is unknown and during which the United States may experience a recession or market correction. Our business could be materially and adversely affected by such recession or market correction.
We continue to closely monitor the impact of COVID-19 and related risks as they evolve. To the extent the effects of COVID-19 adversely impact our business, financial condition, liquidity or results of operations, it may also have the effect of heightening many of the other risks described in this section.
Changes in economic and political conditions could adversely affect our earnings through declines in deposits, loan demand, the ability of our customers to repay loans and the value of collateral securing our loans.
Our success depends to a large extent upon local and national economic conditions, as well as governmental fiscal and monetary policies. Conditions such as inflation, recession, unemployment, changes in interest rates, money supplyfiscal and monetary policy, an increasing federal government budget deficit, slowing gross domestic product, tariffs, a U.S. withdrawal from or significant renegotiation of trade agreements, trade wars, and other factors beyond our control canmay adversely affect our asset quality, deposit levels and loancomposition, the quality of investment securities available for purchase, demand and, therefore,for loans, the ability of our earnings and our capital. The election of a new United States President in 2016 has resulted in substantial, unpredictable changes in economic and political conditions for the United Statesborrowers to repay their loans, and the remaindervalue of the World. Economic turmoilcollateral securing loans made by us. Disruptions in EuropeU.S. and Asiaglobal financial markets, and changes in oil production in the Middle East also affect the economy and stock prices in the United States,U.S., which can affect our earnings and capital, andas well as the ability of our customers to repay loans. Because we have a significant amount of real estate loans, decreases in real estate values could adversely affect the value of property used as collateral and our ability to sell the collateral upon foreclosure. Adverse changes in the economy may also have a negative effect on the ability of our borrowers to make timely repayments of their loans, which would have an adverse impact on our earnings and cash flows. In addition, our lending and deposit gathering activities are concentrated primarily in Northwest Ohio. As a result, our success depends in large part on the general economic conditions of these areas, particularly given that a significant portion of our lending relates to real estate located in this region. Therefore, adverse changes in the economic conditions in these areas, including those resulting from COVID-19, could adversely impact our earnings and cash flows.
13
Our earnings are significantly affected by the fiscal and monetary policies of the federal government and its agencies.
The policies of the Federal Reserve Board impact us significantly. The Federal Reserve Board regulates the supply of money and credit in the United States. Its policies directly and indirectly influence the rate of interest earned on loans and paid on borrowings and interest-bearing deposits, and can also affect the value of financial instruments we hold. Those policies determine to a significant extent our cost of funds for lending and investing. Changes in those policies are beyond our control and are difficult to predict. Federal Reserve Board policies can also affect our borrowers, potentially increasing the risk that they may fail to repay their loans. For example, a tightening of the money supply by the Federal Reserve Board could reduce the demand for a borrower’s products and services. This could adversely affect the borrower’s earnings and ability to repay its loan, which could have a material adverse effect on our financial condition and results of operations.
We may be unable to manage interest rate risks, which could reduce our net interest income.
Our results of operations are affected principally by net interest income, which is the difference between interest earned on loans and investments and interest expense paid on deposits and other borrowings. The spread between the yield on our interest-earning assets and our overall cost of funds has beenmay be compressed, in the recent low interest rate environment, and our net interest income may continue to be adversely impacted by an extended period of continued lowchanging rates. We cannot predict or control changes in interest rates. National, regional and local economic conditions and the policies of regulatory authorities, including monetary policies of the Federal Reserve Board,FRB, affect the movement of interest rates and our interest income and interest expense. If the interest rates paid on deposits and other borrowed funds increase at a faster rate than the interest rates received on loans and other investments, our net interest income, and therefore earnings, could be adversely affected. Earnings could also be adversely affected if the interest ratespaid for deposits rises more quickly than the interest received on loans and other investments fall more quickly than the interest rates paid on deposits and other borrowed funds.investments.
In addition, certain assets and liabilities may react in different degrees to changes in market interest rates. For example, interest rates on some types of assets and liabilities may fluctuate prior to changes in broader market interest rates, while interest rates on other types may lag behind. SomeWhile the bulk of our variable rate commercial assets have interest rate floors, some of our assets, such as adjustable rate mortgages, have features that restrict changes in their interest rates, including rate caps.
Interest rates are highly sensitive to many factors that are beyond our control. Some of these factors include: inflation; recession; unemployment;inflation, recession, unemployment, money supply;supply, international disorders;disorders, and instability in domestic and foreign financial markets. Changes in interest rates may affect the level of voluntary prepayments on our loans and may also affect the level of financing or refinancing by customers. We believe that the impact on our cost of funds from a rise in interest rates will depend on a number of factors, including but not limited to, the competitive environment in the banking sector for deposit pricing, opportunities for clients to invest in other markets such as fixed income and equity markets, and the propensity of customers to invest in their businesses. The effect on our net interest income from an increasea change in interest rates will ultimately depend on the extent to which the aggregate impact of loan re-pricings exceeds the impact of increases in our cost of funds.
A transition away from London Inter-Bank Offered Rate (“LIBOR”) as a reference rate for financial contracts could negatively affect our income and expenses and the value of various financial contracts.
LIBOR is used extensively in the U.S. and globally as a benchmark for various commercial and financial contracts, including adjustable rate mortgages, corporate debt, interest rate swaps and other derivatives. LIBOR is set based on interest rate information reported by certain banks, which may stop reporting such information after 2021. On July 27, 2017, the United Kingdom’s Financial Conduct Authority (the “FCA”) announced that it intends to stop persuading or compelling banks to submit LIBOR rates after 2021. On November 30, 2020, to facilitate an orderly LIBOR transition, the OCC, the FDIC, and the FRB jointly announced that entering into new contracts using LIBOR as a reference rate after December 31, 2021, would create a safety and soundness risk. On March 5, 2021, the FCA announced that all LIBOR settings will either cease to be provided by any administrator or no longer be representative immediately after December 31, 2021, in the case of 1-week and 2-month LIBOR, and immediately after June 30, 2023, in the case of the remaining LIBOR settings. In the U.S., efforts to identify a set of alternative U.S. dollar reference interest rates are ongoing, and the Alternative Reference Rate Committee (the “ARRC”) has recommended the use of a Secured Overnight Funding Rate (“SOFR”). SOFR is different from LIBOR in that it is a backward looking secured rate rather than a forward looking unsecured rate.
These differences could lead to a greater disconnect between our costs to raise funds for SOFR as compared to LIBOR. For cash products and loans, ARRC has also recommended Term SOFR, which is a forward looking SOFR based on SOFR futures and may in part reduce differences between SOFR and LIBOR. There are operational issues which may create a delay in the transition to SOFR or other substitute indices, leading to uncertainty across the industry. These consequences cannot be entirely predicted and could have an adverse impact on the market value for or value of LIBOR-linked securities, loans, and other financial obligations or extensions of credit.
The Company’s primary exposure to LIBOR relates to its promissory notes with borrowers, swap contracts with clients, offsetting swap contracts with third parties related to the swap contracts with clients, and the Company’s LIBOR-based borrowings (if any). The Company’s contracts generally include a LIBOR term (for example, one month, three month, or one year) plus an incremental margin rate. The Company is working through this transition via a multi-disciplinary project team.
The Company has $10.3 million in Trust Preferred Securities that were originated in 2005. These securities are part of a large pool issued to Community Banks and have interest tied to LIBOR (see Note 15 to the Consolidated Financial Statements). The issuers of the Trust Preferred Securities have not yet determined a replacement for the LIBOR-based interest rate.
We do not believe the change to a benchmark like SOFR will have a material impact on our financial condition, results of operations or cash flows.
14
Risks Related to Our Business Operations:
If our actual loan losses exceed our allowance for loan losses, our net income will decrease.
Our loan customers may not repay their loans according to their terms, and the collateral securing the payment of these loans may be insufficient to pay any remaining loan balance. We may experience significant loan losses, which could have a material adverse effect on our operating results. In accordance with accounting principles generally accepted in the United States, we maintain an allowance for loan losses to provide for loan defaults and non-performance, which when combined, we refer to as the allowance for loan losses. Our allowance for loan losses may not be adequate to cover actual credit losses, and future provisions for credit losses could have a material adverse effect on our operating results. Our allowance for loan losses is based on prior experience, as well as an evaluation of the risks in the current portfolio. The amount of future losses is susceptible to changes in economic, operating and other conditions, including changes in interest rates that may be beyond our control, and these losses may exceed current estimates. Federal regulatory agencies, as an integral part of their examination process, review our loans and allowance for loan losses. We cannot assure youguarantee that we will not further increase the allowance for loan losses or that regulators will not require us to increase this allowance. Either of these occurrences could have a material adverse effect on our financial condition and results of operations.
FDIC insurance premiums may increase materially, which could negatively affect our profitability.
The FDIC insures deposits at FDIC insured financial institutions, including State Bank. The FDIC chargesMoreover, the insured financial institutions premiums to maintainFinancial Accounting Standards Board (the “FASB”) has changed its requirements for establishing the Deposit Insurance Fund at a certain level. During 2008 and 2009, there were higher levels of bank failures which dramatically increased resolution costs of the FDIC and depleted the deposit insurance fund. The FDIC collected a special assessment in 2009 to replenish the Deposit Insurance Fund and also required a prepayment of an estimated amount of future deposit insurance premiums. If the costs of future bank failures increase, deposit insurance premiums may also increase. The FDIC recently adopted rules revising the assessments in a manner benefiting banks with assets totaling less than $10 billion. There can be no assurance, however, that assessments will not be changed in the future.
Legislative or regulatory changes or actions could adversely impact our business.
The financial services industry is extensively regulated. We are subject to extensive state and federal regulation, supervision and legislation that govern almost all aspects of our operations. These laws and regulations are primarily intended for the protection of consumers, depositors, borrowers and the deposit insurance fund, not to benefit our shareholders. Changes to laws and regulations or other actions by regulatory agencies may negatively impact us, possibly limiting the services we provide, increasing the ability of non-banks to compete with us or requiring us to change the way we operate. Regulatory authorities have extensive discretion in connection with their supervisory and enforcement activities, including the ability to impose restrictions on the operation of an institution and the ability to determine the adequacy of an institution’s allowance for loan losses. Failure
On June 16, 2016, the FASB issued Accounting Standard Update (“ASU”) 2016-13 “Financial Instruments - Credit Losses”, which replaces the incurred loss model with an expected loss model, and is referred to complyas the CECL model. Under the incurred loss model, loans are recognized as impaired when there is no longer an assumption that future cash flows will be collected in full under the originally contracted terms. The new accounting guidance is effective for annual reporting periods and interim reporting periods within those annual periods, beginning after December 15, 2019. However, the FASB has deferred the effective date for this ASU for smaller reporting companies, such as the Company, to annual reporting periods and interim reporting periods within those annual periods, beginning after December 15, 2022. Under the CECL model, financial institutions will be required to use historical information, current conditions and reasonable forecasts to estimate the expected loss over the life of the loan. The transition to the CECL model will bring with applicable laws, regulationsit significantly greater data requirements and policies could resultchanges to methodologies to accurately account for expected losses under the new parameters. If the methodologies and assumptions that we use in sanctions being imposed by the regulatory agencies, includingCECL model are proven to be incorrect or inadequate, the imposition of civil money penalties,allowance for credit losses may not be sufficient, resulting in the need for additional allowance for credit losses to be established, which could have a material adverse effect on our operations and financial condition. Even the reduction of regulatory restrictions could have an adverse impact on us if such lessening of restrictions increases competition within our industry or market areas.
In light of conditions in the global financial markets and the global economy that occurred in the last decade, regulators have increased their focus on the regulation of the financial services industry. In the last several years, Congress and the federal bank regulators have acted on an unprecedented scale in responding to the stresses experienced in the global financial markets. Some of the laws enacted by Congress and regulations promulgated by federal bank regulators subject us and other financial institutions to additional restrictions, oversight and costs that may have an adverse impact on our businessfinancial condition and results of operations.
ChangesWe may further experience increased delinquencies, credit losses, and corresponding charges to capital, which could require us to increase our provision for loan losses associated with impacts related to the coronavirus outbreak due to quarantines, market downturns, increased unemployment rates, changes in tax lawsconsumer behavior related to pandemic fears, and related emergency response legislation. We cannot predict the full impact of the coronavirus outbreak or any other future global pandemic on our business, but we may experience increased delinquencies and credit losses as a result of the outbreak. Further, if real estate markets or the economy in general deteriorate (due to the coronavirus outbreak or otherwise), State Bank may experience increased delinquencies and credit losses. The allowance for loan losses may not be sufficient to cover actual loan-related losses. Additionally, banking regulators may require State Bank to increase its allowance for loan losses in the future, which could adversely affecthave a negative effect on the Company’s financial condition and results of operations. Additions to the allowance for loan losses will result in a decrease in net earnings and capital and could hinder our performance.
We are subjectability to extensive federal, state and local taxes,grow our assets.
Any significant increase in our allowance for loan losses or loan charge offs, including income, excise, sales/use, payroll, franchise, withholding and ad valorem taxes. Changes to our taxes couldincreases required by applicable regulatory authorities, might have a material adverse effect on ourthe Company’s financial condition and results of operations. In addition, our customers are subject to a wide variety of federal, state and local taxes. Changes in taxes paid by our customers may adversely affect their ability to purchase homes or consumer products, which could adversely affect their demand for our loans and deposit products. In addition, such negative effects on our customers could result in defaults on the loans we have made.
On December 22, 2017, H.R. 1, formally known as the “Tax Cuts and Jobs Act,” was enacted into law. This new tax legislation, among other changes, limits the amount of state, federal and local taxes that taxpayers are permitted to deduct on their individual tax returns and eliminates other deductions in their entirety. Such limits and eliminations may result in customer defaults on loans we have made and decrease the value of mortgage-backed securities in which we have invested.
Our success depends upon our ability to attract and retain key personnel.
Our success depends upon the continued service of our senior management team and upon our ability to attract and retain qualified financial services personnel. Competition for qualified employees is intense. We cannot assure youguarantee that we will be able to retain our existing key personnel or attract additional qualified personnel. If we lose the services of our key personnel, or are unable to attract additional qualified personnel, our business, financial condition and results of operations could be adversely affected.
15
We depend upon the accuracy and completeness of information about customers.
In deciding whether to extend credit or enter into other transactions with customers, we may rely on information provided to us by customers, including financial statements and other financial information. We may also rely on representations of customers as to the accuracy and completeness of that information and, with respect to financial statements, on reports of independent auditors. For example, in deciding whether to extend credit to a business, we may assume that the customer’s audited financial statements conform to generally accepted accounting principles and present fairly, in all material respects, the financial condition, results of operations and cash flows of the customer, and we may also rely on the audit report covering those financial statements. Our financial condition and results of operations could be negatively impacted to the extent we rely on financial statements that do not comply with generally accepted accounting principles or that are materially misleading.
Our ability to pay cash dividends is limited, and we may be unable to pay cash dividends in the future even if we elect to do so.
We are dependent primarily upon the earnings of our operating subsidiaries for funds to pay dividends on our common and depositary shares. The payment of dividends by us is also subject to regulatory restrictions. As a result, any payment of dividends in the future will be dependent, in large part, on our ability to satisfy these regulatory restrictions and our subsidiaries’ earnings, capital requirements, financial condition and other factors. There can be no assurance as to if or when the Company may pay dividends or as to the amount of any dividends which may be declared and paid to shareholders in future periods. Failure to pay dividends on our shares could have a material adverse effect on the market price of our shares.
We may not be able to grow, and if we do, we may have difficulty managing that growth.
Our business strategy is to continue to grow our assets and expand our operations, including through potential strategic acquisitions. Our ability to grow depends, in part, upon our ability to expand our market share, successfully attract core deposits, and to identify loan and investment opportunities as well as opportunities to generate fee-based income. We can provide no assurance that we will be successful in increasing the volume of our loans and deposits at acceptable levels and upon terms acceptable to us. We also can provide no assurance that we will be successful in expanding our operations organically or through strategic acquisitions while managing the costs and implementation risks associated with this growth strategy.
We expect to continue to experience growth in the number of our employees and customers and the scope of our operations, but we may not be able to sustain our historical rate of growth or continue to grow our business at all. Our success will depend upon the ability of our officers and key employees to continue to implement and improve our operational and other systems, to manage multiple, concurrent customer relationships, and to hire, train and manage our employees. In the event that we are unable to perform all these tasks and meet these challenges effectively, including continuing to attract core deposits, our operations, and consequently our earnings, could be adversely impacted.
Any future acquisitions will be subject to a variety of risks, including execution risks, failure to realize anticipated transaction benefits, and failure to overcome integration risks, which could aversely affect our growth and profitability.
Although we do not currently have any plans, arrangements or understandings to make any acquisitions in the near-term, from time to time in the future we may consider acquisition opportunities that we believe support our businesses and enhance our profitability. In the event that we do pursue acquisitions, we may have difficulty execution on acquisitions and may not realize the anticipated benefits of any transactions we complete.
Generally, any acquisition of target financial institutions, branchesFuture acquisitions or other banking assets by us will require approval by, and cooperation from, a number of governmental regulatory agencies, possibly including the FRB, the FDIC and the regulatory authorities in a state in which an acquisition is consummated. Such regulators could deny our application, which would restrict our growth, or the regulatory approvalsexpansion may not be granted on terms that are acceptable to us. For example, we could be required to sell branches as a condition to receiving regulatory approvals, and such a condition may not be acceptable to us or may reduce the benefit of an acquisition.
A limited trading market exists for our common shares and depositary shares, which could lead to price volatility.
Your ability to sell our common and depositary shares depends upon the existence of an active trading market for our common shares. While our stock is listed for trading on the NASDAQ Capital Market, there is low trading volume in our common stock. As a result, you may be unable to sell our common shares at the volume, price and time you desire. The limited trading market for our common shares may cause fluctuations in the market value of our common shares to be exaggerated, leading to price volatility in excess of that which would occur in a more active trading market of our common stock. In addition, even if a more active market of our common stock develops, we cannot assure you that such a market will continue.
The market price of our common shares may be subject to fluctuations and volatility.
The market price of our common shares may fluctuate significantly due to, among other things, changes in market sentiment regarding our operations, financial results or business prospects, the banking industry generally or the macroeconomic outlook. Certain events or changes in the market or banking industry generally are beyond our control. In addition to the other risk factors contained or incorporated by reference herein, factors that could affect our trading price:
Equity markets in general and our shares in particular have experienced volatility over the past few years. The market price of our shares may continue to be subject to volatility unrelated to our operating performance or business prospects. Increased volatility could result in a decline in the market price of our shares.
Investors could become subject to regulatory restrictions upon ownership of our common shares.
Under the federal Change in Bank Control Act, a person may be required to obtain prior approval from the Federal Reserve before acquiring 10 percent or more of our common shares or the power to directly or indirectly control our management, operations, or policies.
We have implemented anti-takeover devices that could make it more difficult for another company to purchase us, even though such a purchase may increase shareholder value.
In many cases, shareholders may receive a premium for their shares if we were purchased by another company. Ohio law and our Articles and Amended and Restated Regulations, as amended (“Regulations”), make it difficult for anyone to purchase us without the approval of our board of directors. Consequently, a takeover attempt may prove difficult, and shareholders may not realize the highest possible price for their securities.
The preparation of our financial statements requires the use of estimates that may vary from actual results.
The preparation of consolidated financial statements in conformity with accounting principles generally accepted in the U.S. requires management to make significant estimates that affect the financial statements. Two of our most critical estimates are the level of the allowance for loan losses and the accounting for goodwill and other intangibles. Because of the inherent nature of these estimates, we cannot provide complete assurance that we will not be required to adjust earnings for significant unexpected loan losses, nor that we will not recognize a material provision for impairment of our goodwill. For additional information regarding these critical estimates, seeItem 7. Management’s Discussion and Analysis of Financial Condition and Results of Operationsbeginning on page 28 of this Annual Report on Form 10-K.
Changes in accounting standards could influence our results of operations.
The accounting standard setters, including the Financial Accounting Standards Board, the SEC and other regulatory bodies, periodically change the financial accounting and reporting standards that govern the preparation of our consolidated financial statements. These changes can be difficult to predict and can materially affect how we record and reportadversely impact our financial condition and results of operations.
In the future, we may acquire other financial institutions or branches or assets of other financial institutions. We may also open new branches, enter into new lines of business, or offer new products or services. Any such acquisition or expansion of our business will involve a number of expenses and risks, which may include some cases,or all of the following:
| ● | the time and expense associated with identifying and evaluating potential acquisitions or expansions; |
| ● | the potential inaccuracy of estimates and judgments used to evaluate credit, operations, management and market risk with respect to target institutions; |
| ● | the time and costs of evaluating new markets, hiring local management and opening new offices, and the delay between commencing these activities and the generation of profits from the expansion; |
| ● | any financing required in connection with an acquisition or expansion; |
| ● | the diversion of management’s attention to the negotiation of a transaction and the integration of the operations and personnel of the combining businesses; |
| ● | entry into unfamiliar markets and the introduction of new products and services into our existing business; |
| ● | the possible impairment of goodwill associated with an acquisition and possible adverse short-term effects on our results of operations; and |
| ● | the risk of loss of key employees and customers. |
We may incur substantial costs to expand, and we could be required to apply a new or revised standard retroactively, which wouldcan give no assurance that such expansion will result in the restatementlevels of profits we expect. Neither can we assure that integration efforts for any future acquisitions will be successful. We may issue equity securities in connection with acquisitions, which could dilute the economic and voting interests of our financial statements for prior periods.existing shareholders.
16
We are exposed to a number of operational risks.
We are exposed to many types of operational risk, including reputational risk, legal and compliance risk, the risk of fraud or theft by employees or outsiders, unauthorized transactions by employees or operational errors, including clerical or record-keeping errors or those resulting from faulty or disabled computer or telecommunications systems. Many of these risks are heightened in light of COVID-19.
We rely heavily on communications and information systems to conduct our business. Any failure, interruption or breach in security of these systems could result in failures or disruptions in our customer relationship management, general ledger, deposit, loan and other systems.
Given the volume of transactions we process, certain errors may be repeated or compounded before they are discovered and successfully rectified. Our necessary dependence upon automated systems to record and process our transaction volume may further increase the risk that technical system flaws or employee tampering or manipulation of those systems will result in losses that are difficult to detect. We may also be subject to disruptions of our operating systems arising from events that are wholly or partially beyond our control (for example, computer viruses or electrical or telecommunications outages), which may give rise to disruption of service to customers and to financial loss or liability. We are further exposed to the risk that our external vendors may be unable to fulfill their contractual obligations (or will be subject to the same risk of fraud or operational errors by their respective employees as we are) and to the risk that our (or our vendors’) consumer compliance, business continuity and data security systems prove to be inadequate.
Negative public opinion can result from our actual or alleged conduct in any number of activities, including lending practices, corporate governance and acquisitions, social media and other marketing activities, the implementation of environmental, social and governance (ESG) practices, and from actions taken by governmental regulators and community organizations in response to any of the foregoing activities. Negative public opinion could adversely affect our ability to attract and keep customers, could expose us to potential litigation and regulatory action, and could have a material adverse effect on the price of our common shares or result in heightened volatility of our stock price.
Our information systems may experience an interruption or security breach.
We rely heavily on communications and information systems to conduct our business. Any failure, interruption or breach in security of these systems could result in failures or disruptions in our customer relationship management, general ledger, deposit, loan and other systems. While we have policies and procedures designed to prevent or limit the effect of the possible failure, interruption or security breach of our information systems, there can be no assurance that any such failure, interruption or security breach will not occur or, if they do occur, that they will be adequately addressed. The occurrence of any failure, interruption or security breach of our information systems could damage our reputation, result in a loss of customer business, subject us to additional regulatory scrutiny, or expose us to civil litigation and possible financial liability.
Unauthorized disclosure of sensitive or confidential client information, or breaches in security of our systems, could severely harm our business.
We collect, process and store sensitive consumer data by utilizing computer systems and telecommunications networks operated by both third-party service providers and us. State Bank’s necessary dependence upon automated systems to record and process State Bank’s transactions poses the risk that technical system flaws, employee errors, tampering or manipulation of those systems, or attacks by third parties will result in losses and may be difficult to detect. We have security and backup and recovery systems in place, as well as a business continuity plan, to ensure the computer systems will not be inoperable, to the extent possible. We also routinely review documentation of such controls and backups related to third party service providers. Our inability to use or access these information systems at critical points in time could unfavorably impact the timeliness and efficiency of our business operations. In recent years, some banks have experienced denial of service attacks in which individuals or organizations flood the bank’s website with extraordinarily high volumes of traffic, with the goal and effect of disrupting the ability of the bank to process transactions. Other businesses have been victims of ransomware attacks in which the business becomes unable to access its own information and is presented with a demand to pay a ransom in order to once again have access to its information.
17
We could be adversely affected if one of our employees or a third-party service provider causes a significant operational breakdown or failure, either as a result of human error or where an individual purposefully sabotages or fraudulently manipulates our operations or systems. State Bank is further exposed to the risk that the third-party service providers may be unable to fulfill their contractual obligations (or will be subject to the same risks as we are). These disruptions may interfere with service to our customers, cause additional regulatory scrutiny and result in a financial loss or liability. We are also at risk of the impact of natural disasters, terrorism and international hostilities on our systems or for the effects of outages or other failures involving power or communications systems operated by others.
Misconduct by employees could include fraudulent, improper or unauthorized activities on behalf of clients or improper use of confidential information. We may not be able to prevent employee errors or misconduct, and the precautions we take to detect this type of activity might not be effective in all cases. Employee errors or misconduct could subject us to civil claims for negligence or regulatory enforcement actions, including fines and restrictions on our business.
In addition, there have been instances where financial institutions have been victims of fraudulent activity in which criminals pose as customers to initiate wire and automated clearinghouse transactions out of customer accounts. The recent massive breach of the systems of a credit bureau in 2019 presents additional threats as criminals now have more information than ever before about a larger portion of our country’s population, that past breaches have involved, which could be used by criminals to pose as customers initiating transfers of money from customer accounts. Although we have policies and procedures in place to verify the authenticity of our customers, we cannot assure that such policies and procedures will prevent all fraudulent transfers. Such activity can result in financial liability and harm to our reputation.
We have implemented security controls to prevent unauthorized access to theour computer systems, and we require that our third-party service providers to maintain similar controls. However, the Company’s management cannot be certain that these measures will be successful. A security breach of the computer systems and loss of confidential information, such as customer account numbers and related information, could result in a loss of customers’ confidence and, thus, loss of business. In addition, unauthorizedWe could also lose revenue if competitors gain access to orconfidential information about our business operations and use it to compete with us. While we maintain specific “cyber” insurance coverage, which would apply in the event of sensitive data could subject usvarious breach scenarios, the amount of coverage may not be adequate in any particular case. Furthermore, because cyber threat scenarios are inherently difficult to litigation, liability,predict and costs to prevent further such occurrences.can take many forms, some breaches may not be covered under our cyber insurance coverage.
Further, we may be affected by data breaches at retailers and other third parties who participate in data interchanges with us and our customers that involve the theft of customer credit and debit card data, which may include the theft of our debit card PIN numbers and commercial card information used to make purchases at such retailers and other third parties. Such data breaches could result in us incurring significant expenses to reissue debit cards and cover losses, which could result in a material adverse effect on our results of operations.
To date, we have not experienced any material losses relating to cyber-attacks or other information security breaches, but there can be no assurance that we will not suffer such attacks or attempted breaches, or incur resulting losses in the future. Our risk and exposure to these matters remains heightened because of, among other things, the evolving nature of these threats, and our plans to continue to implement internet and mobile banking capabilities to meet customer demand. As cyber and other data security threats continue to evolve, we may be required to expend significant additional resources to continue to modify and enhance its protective measures or to investigate and remediate any security vulnerabilities.
Our assets areat risk for cyber-attacks include financial assets and non-public information belonging to customers. We use several third-party vendors who have access tourto our assets via electronic media. Certain cyber security risks arise due to this access, including cyber espionage, blackmail, ransom, and theft. As cyber and other data security threats continue to evolve, we may be required to expend significant additional resources to continue to modify and enhance our protective measures or to investigate and remediate any security vulnerabilities.
We18
Our business could be adversely affected through third parties who perform significant operational services on our behalf.
The third parties performing operational services for the Company are subject to risks similar to those faced by the Company relating to cybersecurity, breakdowns or failures of their own systems, or misconduct of their employees. Like many other community banks, State Bank also relies, in significant part, on a single vendor for the systems which allow State Bank to provide banking services to State Bank’s customers.
One or more of the third parties utilized by us may be compelled to seek additional capital in the future, but capitalexperience a cybersecurity event or operational disruption and, if any such event does occur, it may not be available when needed.adequately addressed, either operationally or financially, by such third party. Further, the operations of our third-party vendors could fail or otherwise become delayed as a result of COVID-19. Certain of these third parties may have limited indemnification obligations to us in the event of a cybersecurity event or operational disruption, or may not have the financial capacity to satisfy their indemnification obligations.
WeFinancial or operational difficulties of a third party provider could also impair our operations if those difficulties interfere with such third party’s ability to serve the Company. If a critical third-party provider is unable to meet the needs of the Company in a timely manner, or if the services or products provided by such third party are requiredterminated or otherwise delayed and if the Company is not able to develop alternative sources for these services and products quickly and cost-effectively, our business could be materially adversely effected.
Additionally, regulatory guidance adopted by federal banking regulators addressing how banks select, engage and state regulatory authorities to maintain adequate levelsmanage their third-party relationships, affects the circumstances and conditions under which we work with third parties and the cost of capital to support our operations. In addition, federal banking agencies have proposed extensive changes to their capital requirements; including raising required amounts and eliminating the inclusion of certain instruments from the calculation of capital. In addition, we may elect to raise additional capital to support our business or to finance acquisitions, if any, or we may otherwise elect to raise additional capital. Our ability to raise additional capital, if needed, will depend on conditions in the capital markets, economic conditions and a number of other factors, many of which are outside our control, and on our financial performance. Accordingly, we cannot be assured of our ability to raise additional capital if needed or on terms acceptable to us. If we cannot raise additional capital when needed, it may have a material adverse effect on our financial condition, results of operations and prospects.managing such relationships.
Strong competition within our market area may reduce our ability to attract and retain deposits and originate loans.
We face competition both in originating loans and in attracting deposits within our market area. We compete for clients by offering personal service and competitive rates on our loans and deposit products. The type of institutions we compete with include large regional financial institutions, community banks, thrifts and credit unions operating within our market areas. Nontraditional sources of competition for loan and deposit dollars come from captive auto finance companies, mortgage banking companies, internet banks, brokerage companies, insurance companies and direct mutual funds. As a result of their size and ability to achieve economies of scale, certain of our competitors offer a broader range of products and services than we offer. We expect competition to remain intense in the future due to legislative, regulatory and technological changes and the continuing trend of consolidation in the financial services industry. In addition, to stay competitive in our markets we may need to adjust the interest rates on our products to match the rates offered by our competitors, which could adversely affect our net interest margin. As a result, our profitability depends upon our continued ability to successfully compete in our market areas while achieving our investment objectives.
We may be required to repurchase loans we have sold or indemnify loan purchasers under the terms of the sale agreements, which could adversely affect our liquidity, results of operations and financial statements.
When State Bank sells a mortgage loan, it agrees to repurchase or substitute a mortgage loan if it is later found to have breached any representation or warranty State Bank made about the loan or if the borrower is later found to have committed fraud in connection with the origination of the loan. While we have underwriting policies and procedures designed to avoid breaches of representations and warranties as well as borrower fraud, there can be no assurance that no breach or fraud will ever occur. Required repurchases, substitutions or indemnifications could have an adverse impact on our liquidity, results of operations and financial statements.
19
Legislative, Legal and Regulatory Risks:
FDIC insurance premiums may increase materially, which could negatively affect our profitability.
The FDIC insures deposits at FDIC insured financial institutions, including State Bank. The FDIC charges the insured financial institutions premiums to maintain the DIF at a certain level. During 2008 and 2009, there were higher levels of bank failures which dramatically increased resolution costs of the FDIC and depleted the deposit insurance fund. The FDIC collected a special assessment in 2009 to replenish the DIF and also required a prepayment of an estimated amount of future deposit insurance premiums. The FDIC recently adopted rules revising the assessments in a manner benefiting banks with assets totaling less than $10 billion. There can be no assurance, however, that assessments will not be changed in the future.
We operate in a highly regulated industry, and the laws and regulations that govern our operations, corporate governance, executive compensation and financial accounting, or reporting, including changes in, or failure to comply with the same, may adversely affect the Company.
The banking industry is highly regulated. We are subject to supervision, regulation and examination by various federal and state regulators, including the FRB, the SEC, the CFPB, the FDIC, Financial Industry Regulatory Authority, Inc. (“FINRA”), and various state regulatory agencies. The statutory and regulatory framework that governs the Company is generally designed to protect depositors and customers, the DIF, the U.S. banking and financial system, and financial markets as a whole and not to protect shareholders. These laws and regulations, among other matters, prescribe minimum capital requirements, impose limitations on our business activities (including foreclosure and collection practices), limit the dividends or distributions that we can pay, and impose certain specific accounting requirements that may be more restrictive and may result in greater or earlier charges to earnings or reductions in capital than would otherwise be required under generally accepted accounting principles in the United States of America. Compliance with laws and regulations can be difficult and costly, and changes to laws and regulations often impose additional compliance costs. Both the scope of the laws and regulations and the intensity of the supervision to which we are subject have increased in recent years in response to the perceived state of the financial services industry, as well as other factors such as technological and market changes. Such regulation and supervision may increase our costs and limit our ability to pursue business opportunities. Further, our failure to comply with these laws and regulations, even if the failure was inadvertent or reflects a difference in interpretation, could subject the Company to restrictions on business activities, fines, and other penalties, any of which could adversely affect results of operations, the capital base, and the price of our common shares. Further, any new laws, rules, or regulations could make compliance more difficult or expensive or otherwise adversely affect our business and financial condition.
Legislative or regulatory changes or actions could adversely impact our business.
The financial services industry is extensively regulated. We are subject to extensive state and federal regulation, supervision and legislation that govern almost all aspects of our operations. Laws and regulations may change from time to time and are primarily intended for the protection of consumers, depositors, borrowers, the DIF and the banking system as a whole, and not to benefit our shareholders.
Regulations affecting banks and financial services businesses are undergoing continuous change, especially in light of COVID-19 and the stimulus programs issued in connection therewith, and management cannot predict the effect of these changes. While such changes are generally intended to lessen the regulatory burden on financial institutions, the impact of any changes to laws and regulations or other actions by regulatory agencies may negatively impact us or our ability to increase the value of our business. Regulatory authorities have extensive discretion in connection with their supervisory and enforcement activities, including the imposition of restrictions on the operation of a financial institution, the classification of assets held by a financial institution, the adequacy of a financial institution’s allowance for loan losses and the ability to complete acquisitions. Additionally, actions by regulatory agencies against us could cause us to devote significant time and resources to defending our business and may lead to penalties that materially affect us and our shareholders. Even the reduction of regulatory restrictions could have an adverse effect on us and our shareholders if such lessening of restrictions increases competition within our industry or our market area.
20
Changes in accounting standards could influence our results of operations.
The accounting standard setters, including the FASB, the SEC and other regulatory bodies, periodically change the financial accounting and reporting standards that govern the preparation of our consolidated financial statements. These changes can be difficult to predict and can materially affect how we record and report our financial condition and results of operations. In some cases, we could be required to apply a new or revised standard retroactively, which would result in the restatement of our financial statements for prior periods.
The preparation of consolidated financial statements in conformity with U.S. Generally Accepted Accounting Principles (“GAAP”) requires management to make significant estimates that affect the financial statements. Due to the inherent nature of these estimates, actual results may vary materially from management’s estimates.
In June 2016, FASB issued a new accounting standard for recognizing current expected credit losses, commonly referred to as CECL. CECL will result in earlier recognition of credit losses and requires consideration of not only past and current events but also reasonable and supportable forecasts that affect collectability. The Company will be required to comply with the new standard in the first quarter of 2023. Upon adoption of CECL, credit loss allowances may increase, which would decrease retained earnings and regulatory capital. The federal banking regulators have adopted a regulation that will allow banks to phase in the day-one impact of CECL on regulatory capital over three years. CECL implementation poses operational risk, including the failure to properly transition internal processes or systems, which could lead to call report errors, financial misstatements, or operational losses.
Noncompliance with the Bank Secrecy Act (BSA) and other anti-money laundering statutes and regulations could cause a material financial loss.
The BSA and the Patriot Act contain anti-money laundering and financial transparency provisions intended to detect and prevent the use of the U.S. financial system for money laundering and terrorist financing activities. The BSA, as amended by the Patriot Act, requires depository institutions and their holding companies to undertake activities including maintaining an anti-money laundering program, verifying the identity of clients, monitoring for and reporting suspicious transactions, reporting on cash transactions exceeding specified thresholds, and responding to requests for information by regulatory authorities and law enforcement agencies. Financial Crimes Enforcement Network (“FinCEN”), a unit of the Treasury Department that administers the BSA, is authorized to impose significant civil money penalties for violations of those requirements and has recently engaged in coordinated enforcement efforts with the federal bank regulatory agencies, as well as the U.S. Department of Justice, Drug Enforcement Administration, and Internal Revenue Service. The AMLA is intended to be a comprehensive reform and modernization to U.S. bank secrecy and anti-money laundering laws, which includes a codified risk-based approach to anti-money laundering compliance for financial institutions; requires the development of standards for evaluating technology and internal processes for BSA compliance; expands enforcement-related and investigation-related authority, including increasing available sanctions for certain BSA violations and instituting BSA whistleblower incentives and protections.
There is also increased scrutiny of compliance with the rules enforced by the Office of Foreign Assets Control (“OFAC”). If the Company’s policies, procedures, and systems are deemed deficient, or if the policies, procedures, and systems of the financial institutions that the Company has already acquired or may acquire in the future are deficient, the Company may be subject to liability, including fines and regulatory actions such as restrictions on State Bank’s ability to pay dividends and the necessity to obtain regulatory approvals to proceed with certain planned business activities, including acquisition plans, which could negatively impact our business, financial condition, and results of operations. Failure to maintain and implement adequate programs to combat money laundering and terrorist financing could also have serious reputational consequences for the Company.
21
We may be the subject of litigation, which could result in legal liability and damage to our business and reputation.
From time to time, we may be subject to claims or legal action from customers, employees or others. Financial institutions like the Company and State Bank are facing a growing number of significant class actions, including those based on the manner of calculation of interest on loans and the assessment of overdraft fees. Future litigation could include claims for substantial compensatory and/or punitive damages or claims for indeterminate amounts of damages. We are also involved from time to time in other reviews, investigations and proceedings (both formal and informal) by governmental and other agencies regarding our business. These matters also could result in adverse judgments, settlements, fines, penalties, injunctions or other relief. Like other large financial institutions, we are also subject to risk from potential employee misconduct, including non-compliance with policies and improper use or disclosure of confidential information.
Our insurance may not cover all claims that may be asserted against us, and any claims asserted against us, regardless of merit or eventual outcome, may harm our reputation. Should the ultimate judgments or settlements in any litigation exceed our insurance coverage, they could have a material adverse effect on our financial condition and results of operations. In addition, we may not be able to obtain appropriate types or levels of insurance in the future, nor may we be able to obtain adequate replacement policies with acceptable terms, if at all.
We could face legal and regulatory risk arising out of our residential mortgage business.
Numerous federal and state governmental, legislative and regulatory authorities are investigating practices in the business of mortgage and home equity lending and servicing and in the mortgage-related insurance and reinsurance industries. We could face the risk of class actions, other litigation and claims from: the owners of or purchasers of such loans originated or serviced by us, homeowners involved in foreclosure proceedings or various mortgage-related insurance programs, downstream purchasers of homes sold after foreclosure, title insurers, and other potential claimants. Included among these claims are claims from purchasers of mortgage and home equity loans seeking the repurchase of loans where the loans allegedly breached origination covenants, representations, and warranties made to the purchasers in the purchase and sale agreements. The CFPB has issued new rules for mortgage origination and mortgage servicing. Both the origination and servicing rules create new private rights of action for consumers against lenders and servicers in the event of certain violations.
Risks Related to Our Capital and Common Shares:
Our ability to pay cash dividends is limited, and we may be unable to pay cash dividends in the future even if we elect to do so.
We are dependent primarily upon the earnings of our operating subsidiaries for funds to pay dividends on our common and depositary shares. The payment of dividends by us is also subject to regulatory restrictions. As a result, any payment of dividends in the future will be dependent, in large part, on our ability to satisfy these regulatory restrictions and our subsidiaries’ earnings, capital requirements, financial condition and other factors. There can be no assurance as to if or when the Company may pay dividends or as to the amount of any dividends which may be declared and paid to shareholders in future periods. Failure to pay dividends on our shares could have a material adverse effect on the market price of our shares.
A limited trading market exists for our common shares, which could lead to price volatility.
The ability to sell our common shares depends upon the existence of an active trading market for those shares. While our shares are listed for trading on the NASDAQ Capital Market, there is moderate trading volume in these shares. As a result, shareholders may be unable to sell our shares at the volume, price and time desired. The limited trading market for our shares may cause fluctuations in the market value of our shares to be exaggerated, leading to price volatility in excess of that which would occur in a more active trading market. In addition, even if a more active market of our shares should develop, we cannot guarantee that such a market will continue.
We22
The market price of our common shares may be subject to fluctuations and volatility.
The market price of our common shares may fluctuate significantly due to, among other things, changes in market sentiment regarding our operations, financial results or business prospects, the banking industry generally or the macroeconomic outlook. Certain events or changes in the market or banking industry generally are beyond our control. In addition to the other risk factors contained or incorporated by reference herein, factors that could affect our trading price:
| ● | our actual or anticipated operating and financial results, including how those results vary from the expectations of management, securities analysts and investors; |
| ● | changes in financial estimates or publications of research reports and recommendations by financial analysts or actions taken by rating agencies with respect to us or other financial institution; |
| ● | failure to declare dividends on our common shares from time to time; |
| ● | reports in the press or investment community generally or relating to our reputation or the financial services industry; |
| ● | developments in our business or operations or in the financial sector generally; |
| ● | any future offerings by us of our common shares; |
| ● | any future offerings by us of debt or preferred shares, which would be senior to our common shares upon liquidation and for purposes of dividend distributions; |
| ● | legislative or regulatory changes affecting our industry generally or our business and operations specifically; |
| ● | the operating and share price performance of companies that investors consider to be comparable to us; |
| ● | announcements of strategic developments, acquisitions, restructurings, dispositions, financings and other material events by us or our competitors; |
| ● | actions by our current shareholders, including future sales of common shares by existing shareholders, including our directors and executive officers; |
| ● | proposed or final regulatory changes or developments; |
| ● | anticipated or pending regulatory investigations, proceedings, or litigation that may involve or affect us; and |
| ● | other changes in U.S. or global financial markets, global economies and general market conditions, such as interest or foreign exchange rates, stock, commodity, credit or asset valuations or volatility. |
Equity markets in general and our shares have experienced volatility over the past few years. The market price of our shares may continue to be subject to volatility unrelated to our operating performance or business prospects, which could result in a decline in the market price of our shares.
Investors could become subject to regulatory restrictions upon ownership of our common shares.
Under the Federal Change in Bank Control Act, a person may be required to repurchase loansobtain prior approval from the Federal Reserve before acquiring 10 percent or more of our common shares or the power to directly or indirectly control our management, operations, or policies.
23
We have implemented anti-takeover devices that could make it more difficult for another company to purchase us, even though such a purchase may increase shareholder value.
In many cases, shareholders may receive a premium for their shares if we were purchased by another company. Ohio law and our Articles and Amended and Restated Regulations, as amended (“Regulations”), make it difficult for anyone to purchase us without the approval of our Board of Directors. Consequently, a takeover attempt may prove difficult, and shareholders may not realize the highest possible price for their securities.
We may be compelled to seek additional capital in the future, but capital may not be available when needed.
We are required by federal and state regulatory authorities to maintain adequate levels of capital to support our operations. In addition, federal banking agencies have soldproposed extensive changes to their capital requirements; including raising required amounts and eliminating the inclusion of certain instruments from the calculation of capital. In addition, we may elect to raise additional capital to support our business or indemnify loan purchasers underto finance acquisitions, if any, or we may otherwise elect to raise additional capital. Our ability to raise additional capital, if needed, will depend on conditions in the capital markets, economic conditions and a number of other factors, many of which are outside our control, and on our financial performance. Accordingly, we cannot be assured of our ability to raise additional capital if needed or on terms acceptable to us. If we cannot raise additional capital when needed, it may have a material adverse effect on our financial condition, results of operations and prospects.
General Risk Factors:
Our earnings are significantly affected by the fiscal and monetary policies of the sale agreements,federal government and its agencies.
The policies of the FRB impact us significantly. The FRB regulates the supply of money and credit in the United States. Its policies directly and indirectly influence the rate of interest earned on loans and paid on borrowings and interest-bearing deposits, and can also affect the value of financial instruments we hold. Those policies determine to a significant extent our cost of funds for lending and investing. Changes in those policies are beyond our control and are difficult to predict. FRB policies can also affect our borrowers, potentially increasing the risk that they may fail to repay their loans. For example, a tightening of the money supply by the FRB could reduce the demand for a borrower’s products and services. This could adversely affect the borrower’s earnings and ability to repay its loan, which could have a material adverse effect on our financial condition and results of operations.
Changes in tax laws could adversely affect our performance.
We are subject to extensive federal, state and local taxes, including income, excise, sales/use, payroll, franchise, withholding and ad valorem taxes. Changes to tax laws could have a material adverse effect on our results of operations; fair values of net deferred tax assets and obligations of state and political subdivisions held in our investment securities portfolio. In addition, our customers are subject to a wide variety of federal, state and local taxes. Changes in taxes paid by our customers may adversely affect their ability to purchase homes or consumer products, which could adversely affect their demand for our liquidity, resultsloans and deposit products. In addition, such negative effects on our customers could result in defaults on the loans we have made.
The preparation of operations andour financial statements requires the use of estimates that may vary from actual results.
The preparation of consolidated financial statements in conformity with accounting principles generally accepted in the U.S. requires management to make significant estimates that affect the financial statements.
When State Bank sells a mortgage loan, it agrees to repurchase or substitute a mortgage loan if it is later found to have breached any representation or warranty State Bank made about Two of our most critical estimates are the loan or if the borrower is later found to have committed fraud in connection with the originationlevel of the loan. Whileallowance for loan losses and the accounting for goodwill and other intangibles. Because of the inherent nature of these estimates, we have underwriting policies and procedures designed to avoid breaches of representations and warranties as well as borrower fraud, there can be nocannot provide complete assurance that no breachwe will not be required to adjust earnings for significant unexpected loan losses, nor that we will not recognize a material provision for impairment of our goodwill. For additional information regarding these critical estimates, see Item 7. Management’s Discussion and Analysis of Financial Condition and Results of Operations beginning on page 30 of this Annual Report on Form 10-K.
24
We are at risk of increased losses from fraud.
Criminals are committing fraud at an increasing rate and are using more sophisticated techniques. In some cases, these individuals are part of larger criminal rings, which allow them to be more effective. Such fraudulent activity has taken many forms, ranging from debit card fraud, check fraud, mechanical devices attached to ATM machines, social engineering and phishing attacks to obtain personal information, or impersonation of clients through the use of falsified or stolen credentials. Additionally, an individual or business entity may properly identify itself, yet seek to establish a business relationship for the purpose of perpetrating fraud. An emerging type of fraud even involves the creation of synthetic identification in which fraudsters “create” individuals for the purpose of perpetrating fraud. Further, in addition to fraud committed directly against the Company, the Company may suffer losses as a result of fraudulent activity committed against third parties. Increased deployment of technologies, such as chip card technology, defray and reduce certain aspects of fraud; however, criminals are turning to other sources to steal personally identifiable information, such as unaffiliated healthcare providers and government entities, in order to impersonate the consumer and thereby commit fraud.
We need to constantly update our technology in order to compete and meet customer demands.
The financial services market, including banking services, is undergoing rapid technological changes with frequent introductions of new technology-driven products and services. In addition to better serving customers, the effective use of technology increases efficiency and may enable us to reduce costs. Our future success will ever occur. Required repurchases, substitutionsdepend, in part, on our ability to use technology to provide products and services that provide convenience to customers and to create additional efficiencies in our operations. Some of our competitors have substantially greater resources to invest in technological improvements. We may not be able to effectively implement new technology-driven products and services or indemnificationsbe successful in marketing these products and services to our customers. Failure to successfully keep pace with technological changes affecting the financial services industry could negatively affect our growth, revenue and profit.
Climate change, severe weather, natural disasters, acts of war or terrorism and other external events could significantly impact our business.
Natural disasters, including severe weather events of increasing strength and frequency due to climate change, acts of war or terrorism, and other adverse external events could have an adversea significant impact on our liquidity, resultsability to conduct business or upon third parties who perform operational services for us or our customers. Such events could affect the stability of operations and financial statements.
our deposit base, impair the ability of borrowers to repay outstanding loans, impair the value of collateral securing loans, cause significant property damage, result in lost revenue or cause us to incur additional expenses.
| Unresolved Staff Comments. |
None.
| Item 2. | Properties. |
Item 1B. Unresolved Staff Comments
None.
The Company’s principal executive offices are located at 401 Clinton Street, Defiance, Ohio. State Bank owns this facility, with a portion of the facility utilized as a retail-bankingretail banking center. In addition, State Bank owns the land and buildings occupied by nineteen21 of its banking centers and leases onetwo other propertyproperties used as a banking center. The Company also occupies office space from various parties for loan production and other business purposes on varying lease terms. There is no outstanding mortgage debt on any of the properties which are owned by State Bank.
25
Listed below are the banking centers, loan production offices and service facilities of the Company and their addresses, all of which are located in Allen, Cuyahoga, Defiance, Delaware, Franklin, Fulton, Franklin, Hancock, Lucas, Paulding, Seneca, Williams and Wood counties of Ohio,Ohio; Allen Kosciusko, and SteubenHamilton counties of Indiana and InghamIndiana; and Monroe countiescounty of Michigan:
| Description/Address | Leased/ Owned | Total Deposits 12/31/17 | ||||||
| $ in thousands | ||||||||
| Main Banking Center & Corporate Office | ||||||||
| 401 | Clinton Street, Defiance, OH | Owned | $ | 207,397 | ||||
| Banking Centers/Drive-Thru’s | ||||||||
| 1419 | West High Street, Bryan, OH | Owned | 38,647 | |||||
| 510 | Third Street, Defiance, OH (Drive-thru) | Owned | N/A | |||||
| 1600 | North Clinton Street, Defiance, OH | Leased | 34,563 | |||||
| 312 | Main Street, Delta, OH | Owned | 15,253 | |||||
| 4080 | West Dublin Granville Road, Dublin, OH | Owned | 44,852 | |||||
| 211 | East Lincoln Street, Findlay, OH | Owned | 13,814 | |||||
| 12832 | Coldwater Road, Fort Wayne, IN | Owned | 32,402 | |||||
| 1232 | N. Main Street, Bowling Green, OH | Owned | 1,531 | |||||
| 235 | Main Street, Luckey, OH | Owned | 36,220 | |||||
| 133 | East Morenci Street, Lyons, OH | Owned | 20,190 | |||||
| 930 | West Market Street, Lima, OH | Owned | 31,941 | |||||
| 1201 | East Main Street, Montpelier, OH | Owned | 39,063 | |||||
| 218 | North First Street, Oakwood, OH | Owned | 21,560 | |||||
| 220 | North Main Street, Paulding, OH | Owned | 46,052 | |||||
| 610 | East South Boundary Street, Perrysburg, OH | Owned | 15,398 | |||||
| 119 | South State Street, Pioneer, OH | Owned | 27,929 | |||||
| 6401 | Monroe Street, Sylvania, OH | Owned | 44,196 | |||||
| 311 | Main Street, Walbridge, OH | Owned | 28,969 | |||||
| 515 | Parkview, Wauseon, OH | Owned | 29,623 | |||||
| Loan Production Offices | ||||||||
| 908 | North Wayne Street, Suite A, Angola, IN | Leased | N/A | |||||
| 68 | North High Street, Bldg. E, Ste. 105, New Albany, OH | Leased | N/A | |||||
| 206 | South Washington Street, Tiffin, OH | Leased | N/A | |||||
| 8194 | Secor Road, Lambertville, MI | Leased | N/A | |||||
| 1934 | East Center Street Ste. C Warsaw, IN | Leased | N/A | |||||
| 1900 | Monroe St. Toledo, OH | Leased | N/A | |||||
| 29580 | Center Ridge Road, Westlake, OH | Leased | N/A | |||||
| Service Facilities (RDSI/DCM/SBT) | ||||||||
| 112 | East Jackson Street, West Unity, OH | Owned | N/A | |||||
| 104 | Depot Street, Archbold, OH | Leased | N/A | |||||
| 105 | East Holland Street, Archbold, OH | Leased | N/A | |||||
| 3125 | Pine Tree Road, Suite 3D, Lansing, MI | Leased | N/A | |||||
| Total Deposits | $ | 729,600 | ||||||
SB Financial Group, Inc. Property List as of December 31, 2021
| ($ in thousands) | Description/Address | Leased/Owned | Total Deposits 12/31/21 | |||||
| Main Banking Center & Corporate Office | ||||||||
| 401 | Clinton Street, Defiance, OH | Owned | $ | 283,626 | ||||
| Banking Centers/Drive-Thru's | ||||||||
| 1419 | West High Street, Bryan, OH | Owned | 56,577 | |||||
| 510 | Third Street, Defiance, OH (Drive-thru) | Owned | N/A | |||||
| 1600 | North Clinton Street, Defiance, OH | Leased | 44,628 | |||||
| 312 | Main Street, Delta, OH | Owned | 22,297 | |||||
| 4080 | West Dublin Granville Road, Dublin, OH | Owned | 71,371 | |||||
| 104 | North Michigan Avenue, Edgerton, OH | Owned | 15,808 | |||||
| 201 | East Lincoln Street, Findlay, OH | Owned | 18,291 | |||||
| 408 | South Main Street Suite A, Findlay, OH | Leased | 640 | |||||
| 12832 | Coldwater Road, Fort Wayne, IN | Owned | 23,214 | |||||
| 1232 | North Main Street, Bowling Green, OH | Owned | 15,654 | |||||
| 235 | Main Street, Luckey, OH | Owned | 37,705 | |||||
| 133 | East Morenci Street, Lyons, OH | Owned | 23,633 | |||||
| 930 | West Market Street, Lima, OH | Owned | 55,166 | |||||
| 1201 | East Main Street, Montpelier, OH | Owned | 47,903 | |||||
| 218 | North First Street, Oakwood, OH | Owned | 27,373 | |||||
| 220 | North Main Street, Paulding, OH | Owned | 75,379 | |||||
| 610 | East South Boundary Street, Perrysburg, OH | Owned | 17,582 | |||||
| 119 | South State Street, Pioneer, OH | Owned | 42,021 | |||||
| 6401 | Monroe Street, Sylvania, OH | Owned | 76,626 | |||||
| 311 | Main Street, Walbridge, OH | Owned | 32,465 | |||||
| 101 | North Michigan Street, Edon, OH | Owned | 58,044 | |||||
| 1379 | North Shoop Avenue, Wauseon, OH | Owned | 67,043 | |||||
| Loan Production Offices | ||||||||
| 307 | North Wayne Street, Angola, IN | Owned | N/A | |||||
| 10100 | Lantern Road, Suite 240, Fishers, IN | Leased | N/A | |||||
| 94 | Granville Street, Gahanna, OH | Owned | N/A | |||||
| 8194 | Secor Road, Lambertville, MI | Leased | N/A | |||||
| 1900 | Monroe Street, Suite 108, Toledo, OH | Leased | N/A | |||||
| Service Facilities (SBT/ SBFG Title) | ||||||||
| 104 | Depot Street, Archbold, OH | Leased | N/A | |||||
| 105 | East Holland Street, Archbold, OH | Leased | N/A | |||||
| 125 | West Butler Street, Bryan OH | Owned | N/A | |||||
| 9101 | Antares Avenue, Columbus, OH | Owned | N/A | |||||
| 1911 | Baltimore Road, Defiance, OH | Leased | N/A | |||||
| 10100 | Lantern Road, Fishers, IN | Leased | N/A | |||||
| Total deposits | $ | 1,113,045 | ||||||
SB Captive operates from office space located at 101 Convention Center Dr., Suite 850, Las Vegas, NV 89109.
The Company’s subsidiaries have several noncancellable leases for business use that expire over the next tenfive years. Aggregate rental expense for these leases was $0.16, $0.15$0.19 million and $0.20$0.18 million for the years ended December 31, 2017, 20162021 and 20152020, respectively.
26
Future minimum lease payments under operating leases are:
| ($ in thousands) | ||||
| 2018 | 130 | |||
| 2019 | 120 | |||
| 2020 | 108 | |||
| 2021 | 18 | |||
| 2022 | 7 | |||
| Thereafter | 7 | |||
| Total minimum lease payments | $ | 390 | ||
| ($ in thousands) | ||||
| 2022 | $ | 177 | ||
| 2023 | 141 | |||
| 2024 | 138 | |||
| 2025 | 134 | |||
| 2026 | 135 | |||
| Thereafter | 763 | |||
| Total minimum lease payments | $ | 1,488 | ||
In the ordinary course of our business, the Company and its subsidiaries are parties to various legal actions, which we believe are incidental to the operation of our business. Although the ultimate outcome and amount of liability, if any, with respect to these legal actions cannot presently be ascertained with certainty, in the opinion of management, based upon information currently available to us, any resulting liability is not likely to have a material adverse effect on the Company’s consolidated financial position, results of operations or cash flows. Not Applicable Supplemental Item: Information about our Executive Officers The following table lists the names and ages of the executive officers of the Company as of February 22, Chairman of the Company since April 2015; Director of the Company since February 2010; President and Chief Executive Officer of the Company since January 2010 and of Executive Vice President and Chief Risk Officer of the Company since July 2019; Senior Vice President and Chief Enterprise Risk Management Officer from August 2018 through July 2019; Senior Vice President and Audit Coordinator and Director of Operations from December 2011 through August 2018; Vice President and Internal Auditor from January 2010 through December 2011; Corporate Secretary for the Company since 1996; Began working for State Bank in February 1990 as the Accounting Supervisor. 27 PART II Market Information Our common shares are traded on the NASDAQ Capital Market under the symbol “SBFG”. There were The Company paid quarterly dividends on will continue in the future. Payment of dividends by State Bank may be restricted at any time at the discretion of the regulatory authorities, if they deem such dividends to constitute an unsafe and/or unsound banking practice. These provisions could have the effect of limiting the Company’s ability to pay dividends on its outstanding shares. Moreover, the Federal Reserve Board expects the Company to serve as a source of strength to its subsidiary banks, which may require it to retain capital for further investment in State Bank, rather than for dividends to shareholders of the Company. The Company’s ability to pay dividends on its shares is also conditioned upon the payment, on a current basis, of quarterly interest payments on the subordinated debentures underlying the Company’s trust preferred securities. In addition, under the terms of the Company’s fixed-to-floating rate subordinated debt, the Company’s ability to pay dividends on its shares is conditioned upon the Company continuing to make required principal and interest payments, and not incurring an event of default, with respect to the subordinated debt. Source: S&P Global Market Intelligence © 28 The 25, 2021 and expires May 31, 2022. 29 SB Financial Group, Inc. (“SB Financial”), is a The following discussion provides a review of the consolidated financial condition and results of operations of SB Financial and its subsidiaries (collectively, the “Company”). This discussion should be read in conjunction with the Company’s consolidated financial statements and related footnotes as of and for the years ended December 31, Strategic Discussion The focus and strategic goal of the Company is to grow into and remain a top decile (>90th percentile) independent financial services company. The Company intends to achieve and maintain that goal by executing our five key initiatives. Increase profitability through ongoing diversification of revenue streams: For the twelve months ended December 31, Strengthen our penetration in all markets served: Over our Expand product utilization by new and existing customers: As of December 31, Deliver gains in operational excellence: Our management team believes that becoming and remaining a high-performance financial services company will depend upon seamlessly and consistently delivering operational excellence, as demonstrated by the Company’s leadership in the origination and servicing of residential mortgage loans. As of December 31, Sustain asset quality: As of December 31, The successful execution of The Company has raised capital through the issuance of 30 Financial Highlights Year Ended December 31, 31 Critical Accounting Policies The accounting and reporting policies of the Company are in accordance with generally accepted accounting principles in the United States and conform to general practices within the banking industry. The Company’s significant accounting policies are described in detail in the notes to the Company’s Allowance for Loan Losses:The allowance for loan losses provides coverage for probable losses inherent in the Company’s loan portfolio. Management evaluates the adequacy of the allowance for loan losses each quarter based on changes, if any, in the nature and amount of problem assets and associated collateral, underwriting activities, loan portfolio composition (including product mix and geographic, industry or customer-specific concentrations), trends in loan performance, regulatory guidance and economic factors. This evaluation is inherently subjective, as it requires the use of significant management estimates. Many factors can affect management’s estimates of specific and expected losses, including volatility of default probabilities, rating migrations, loss severity and economic and political conditions. The allowance is increased through provisions charged to operating earnings and reduced by net The Company determines the amount of the allowance based on relative risk characteristics of the loan portfolio. The allowance recorded for commercial loans is based on reviews of individual credit relationships and an analysis of the migration of commercial loans and actual loss experience. The allowance recorded for homogeneous consumer loans is based on an analysis of loan mix, risk characteristics of the portfolio, fraud loss and bankruptcy experiences, and historical losses, adjusted for current trends, for each homogeneous category or group of loans. The allowance for credit losses relating to impaired loans is based on each impaired loan’s observable market price, the collateral for certain collateral-dependent loans, or the discounted cash flows using the loan’s effective interest rate. Regardless of the extent of the Company’s analysis of customer performance, portfolio trends or risk management processes, certain inherent, but undetected, losses are probable within the loan portfolio. This is due to several factors including inherent delays in obtaining information regarding a customer’s financial condition or changes in their unique business conditions, the subjective nature of individual loan valuations, collateral assessments and the interpretation of economic trends. Volatility of economic or customer-specific conditions affecting the identification and estimation of losses for larger non-homogeneous credits and the sensitivity of assumptions utilized to establish allowances for homogenous groups of loans are also factors. The Company estimates a range of inherent losses related to the existence of these exposures. The estimates are based upon the Company’s evaluation of imprecise risk associated with the commercial and consumer allowance levels and the estimated impact of the current economic environment. Goodwill and Other Intangibles:The Company records all assets and liabilities acquired in purchase acquisitions, including goodwill and other intangibles, at fair value as required. Goodwill is subject, at a minimum, to annual tests for impairment. Other intangible assets are amortized over their estimated useful lives using straight-line and accelerated methods, and are subject to impairment if events or circumstances indicate a possible inability to realize the carrying amount. The initial goodwill and other intangibles recorded and subsequent impairment analysis requires management to make subjective judgments concerning estimates of how the acquired asset will perform in the future. Events and factors that may significantly affect the estimates include, among others, customer attrition, changes in revenue growth trends, specific industry conditions and changes in competition. Deferred Tax Liability: The Company has evaluated its deferred tax liability to determine if it is more likely than not that the liability will be Income Tax Accounting:The Company files a consolidated federal income tax return. The provision for income taxes is based upon income in the consolidated financial statements, rather than amounts reported on our income tax return. Deferred tax assets and liabilities are recognized for future tax consequences attributable to differences between the financial statement carrying amounts of existing assets and liabilities and their respective tax bases. Deferred tax assets and liabilities are measured using enacted tax rates expected to apply to taxable income in the years in which those temporary differences are expected to be recovered or settled. The effect of a change in rates on 32 Changes in Financial Condition Total assets at December 31, The following are the condensed average balance sheets of the Company for the years ending December 31 and includes the interest earned or paid, and the average interest rate, on each asset and liability: 33 The following tables set forth the effect of volume and rate changes on interest income and expense for the periods indicated. For purposes of these tables, changes in interest due to volume and rate were determined as follows: The maturity distribution and weighted-average interest rates of debt securities available-for-sale at December 31, 34 In June of 2020, we completed the acquisition of The Edon State Bank, which added approximately $50 million Loans held for investment Concentrations of Credit Risk: The Company makes commercial, real estate and installment loans to customers located mainly in the Tri-State region of Ohio, Indiana and Michigan. Commercial loans include loans collateralized by commercial real estate, business assets and, in the case of agricultural loans, crops and farm equipment and the loans are expected to be repaid from cash flow from operations of businesses. As of December 31, 2021, commercial business and agricultural loans made up approximately 29.6 percent of the loans held for investment (“HFI”) loan portfolio while commercial real estate loans 35 Maturities and Sensitivities of Loans to Changes in Interest Rates: The following table shows the maturity distribution of loans outstanding as of December 31, 2021. The amounts have been categorized between loans with a fixed or floating interest rate (floating rate loans have an adjustable interest rate that changes in accordance to a rate index). five years Deposits increased The average amount of deposits and weighted-average rates paid are summarized as follows for the 36 Time deposits that exceeded the FDIC insurance limit of $250,000 are summarized as follows: Stockholders’ equity at December 31, The Company continued to repurchase its own stock during the year. Specifically, the Company repurchased approximately 500,000 shares during 2021 at an average price of $18.50 per share, which was just slightly below book value. As of December 31, 2021, the Company had 495,639 shares remaining of the 750,000 shares authorized for repurchase under the Company’s existing share repurchase program which was authorized on May 25, 2021 and expires May 21, 2022. Nonperforming assets consisting of loans, Other Real Estate Owned 37 The following schedule presents an analysis of the allowance for loan losses, average loan data and related ratios at December 31 for the years indicated: The allowance for loan losses balance and the provision for loan losses are determined by management based upon periodic reviews of the loan portfolio. In addition, management considers the level of charge offs on loans, as well as the fluctuations of charge offs and recoveries on loans, in the factors which caused these changes. Estimating the risk of loss and the amount of loss is necessarily subjective. Accordingly, the allowance is maintained by management at a level considered adequate to cover losses that are currently anticipated based on past loss experience, economic conditions, information about specific borrower situations, including their financial position and collateral values, and other factors and estimates which are subject to change over time. The Company has substantially increased the reserve level over the last two years. Specifically, since December 31, 2019 the allowance balance has increased from $8.8 million to $13.8 million at December 31, 2021, which is an increase of $5.0 million or 59 percent. This increase was the result of $5.6 million in provision expense during the period ($4.5 million in 2020 and $1.1 million in 2021) and minimal charge-offs, which were just $0.5 million over the two year period. 38 The following schedule provides a breakdown of the allowance for loan losses allocated by type of loan and related ratios at December 31 for the years indicated: As detailed in the risk factors, the CARES Act provided for significant consumer and small business relief due to the impact of the COVID-19 pandemic. The Company provided payment relief to a number of consumer and small business customers throughout 2020 and 2021, which we believe was successful and enabled our clients to weather the pandemic effectively. All such COVID-related payment deferrals had expired or been removed by December 31, 2021 and all clients were back to contractual terms at such date. Regulatory capital reporting is required for State Bank only, as the Company is On May 27, 2021, the Company issued and sold $20.0 million in aggregate principal amount of its 3.65% Fixed to Floating Rate Subordinated Notes due 2031 in a private placement exempt from the registration requirements under the Securities Act of 1933, as amended. The Subordinated Notes bear interest at a fixed rate of 3.65% through May 31, 2026. From June 1, 2026 to the maturity date or earlier redemption of the Subordinated Notes, the interest rate will reset quarterly to an interest rate per annum, equal to the then-current-three-month Secured Overnight Financing Rate (“SOFR”) provided by the Federal Reserve Bank of New York plus 296 basis points. The proceeds from the Subordinated Notes will be used to assist the Company in meeting various corporate obligations, including share buyback, acquisition costs and organic asset growth. The Subordinated Notes have a maturity of 10 years. Earnings Summary – Net income for Positive results for 2021 included loan growth of $18.5 million when excluding the impact of the PPP initiative, and deposit growth of $64.0 million. The Company fully participated in both phases of PPP, with a total of $111.4 million in loans to over 1,100 clients with revenue of $3.4 million for 2021 compared to $1.4 million for 2020. The mortgage banking business line continued to contribute significant revenues, with residential real estate loan production of $600.0 million for the year, resulting in $17.3 million of revenue from gains on sale. The level of mortgage origination was down from the $694.2 million in 2020. The Company’s loans serviced for others ended the year at $1.36 billion, up from $1.30 billion at December 31, 2020. 39 Operating revenue increased by $2.6 million, or 3.9 percent, from $66.0 million in 2020 to $68.6 million in 2021 due to increased PPP fees and OMSR recapture which offset lower mortgage gain revenue. SBFG Title increased revenue by $0.1 million of $2.1 million for 2021. Operating expense increased by $1.7 million, or 4.0 percent, from $43.1 million in 2020 to $44.8 million in 2021, due to compensation and fringe benefit cost increases and higher spend on technology/digital initiatives. These expense increases were offset by lower mortgage commission expense due to lower volume. Results of Operations Net interest income was $37.9 million for 2021 compared to $35.9 million for 2020, an increase of $2.0 million or 5.4 percent. Average earning assets increased to $1.24 billion in 2021, compared to $1.07 billion in 2020, an increase of $170.7 million or 15.9 percent due to a higher bond portfolio, which offset slightly lower loan volume. The consolidated 2021 full year net interest margin on an FTE basis decreased 30 basis points to 3.06 percent compared to 3.36 percent for the full year of 2020. PPP activity during 2021 increased margin revenue by $3.0 million for the full year of 2021. Provision for loan losses of $1.0 million was taken in 2021 compared to $4.5 million taken for 2020. For 2021, net recoveries totaled $0.18 million, or (0.02) percent of average loans. This charge off level was significantly lower than 2020, in which net charge offs were $0.68 million or 0.08 percent of average loans. 40 Total noninterest income was $30.7 million for 2021 compared to $30.1 million for 2020, representing an increase of $0.6 million, or 2.0 percent, year-over-year. Although mortgage gain on sale was down from the record year in 2020 by $8.1 million, or 31.9 percent, the Company was able to offset that reduction by recapture of mortgage servicing rights of $3.9 million during 2021. The Company sold $489.4 million of originated mortgages into the secondary market in 2021, which allowed our serviced loan portfolio to grow to $1.36 billion at December 31, 2021 from $1.30 billion at December 31, 2020. The higher servicing balance of the portfolio led to the 5.6 percent increase in mortgage loan servicing income. Sales of non-mortgage loans (small business and farm credits) decreased in 2021 as compared to 2020, as SBA activity continued to be focused on the PPP initiative. The Company expanded its wealth management assets under management to $618.3 million, up $59.9 million, which resulted in a 17.5 percent increase in wealth fee income. Total noninterest expense was $44.8 million for 2021 compared to $43.1 million for 2020, representing a $1.7 million, or 4.0 percent, increase year-over-year. Total full-time equivalent employees ended 2021 at 269, which was up 25 from year end 2020. Salaries and benefits were driven by the increase in total full time employees as we filled a number of open positions during the year. We also have seen higher costs in technology as we have continued to add resources and digital options for our clients. Earnings Summary – 2020 vs. 2019 Net income for 2020 was $14.9 million, or $1.96 per diluted share, compared with net income of $12.0 million and net income available to common of Positive results for Operating revenue was up compared to the prior year by Operating expense was up compared to the prior year by Net charge offs for 41 Goodwill, Intangibles and Capital The Company completed its most recent annual goodwill impairment Management plans to continue from time to time to purchase additional premises and equipment and improve current facilities to meet the current and future needs of the Company’s customers. These purchases will include buildings, leasehold improvements, furniture and equipment. Management expects that cash on hand and cash generated from current operations will fund these capital expenditures and purchases. Liquidity Liquidity relates primarily to the Company’s ability to fund loan demand, meet deposit customers’ withdrawal requirements and provide for operating expenses. Sources used to satisfy these needs consist of cash and due from banks, The Company does not have material cash requirements for capital expenditures over the next year. Any cash needs for capital requirements would be funded by cash existing at the Company. It is not anticipated that the Company will be required to initiate external borrowings in order to fund ongoing operations. The Company’s commercial real estate, first mortgage residential, agricultural and multi-family mortgage portfolio of Significant additional off-balance-sheet liquidity is available in the form of FHLB advances, unused federal funds lines from correspondent banks and the national certificate of deposit market. Management expects the risk of changes in off-balance-sheet arrangements to be immaterial to earnings. Based on the current collateralization requirements of the FHLB, approximately At December 31, The cash flow statements for the periods presented provide an indication of the Company’s sources and uses of cash as well as an indication of the ability of the Company to maintain an adequate level of liquidity. A discussion of the cash flow statements for The Company experienced positive cash flows from operating activities in The Company experienced negative cash flows from investing activities in The Company experienced positive cash flows from financing activities in 42 The Company uses an Asset liability management involves developing, executing and monitoring strategies to maintain appropriate liquidity, maximize net interest income and minimize the impact that significant fluctuations in market interest rates would have on current and future earnings. The business of the Company and the composition of its balance sheet consist of investments in interest-earning assets (primarily loans, mortgage-backed securities, and securities Interest rate risk is the exposure of a banking institution’s financial condition to adverse movements in interest rates. Accepting this risk can be an important source of profitability and shareholder value; however, excessive levels of interest rate risk could pose a significant threat to the Company’s earnings and capital base. Accordingly, effective risk management that maintains interest rate risks at prudent levels is essential to the Company’s safety and soundness. Evaluating a financial institution’s exposure to changes in interest rates includes assessing both the adequacy of the management process used to control interest rate risk and the organization’s quantitative level of exposure. When assessing the interest rate risk management process, the Company seeks to ensure that appropriate policies, procedures, management information systems and internal controls are in place to maintain interest rate risks at prudent levels of consistency and continuity. Evaluating the quantitative level of interest rate risk exposure requires the Company to assess the existing and potential future effects of changes in interest rates on its consolidated financial condition, including capital adequacy, earnings, liquidity and asset quality (when appropriate). 43 The Financial institutions derive their income primarily from the excess of interest collected over interest paid. The rates of interest an institution earns on its assets and owes on its liabilities generally are established contractually for a period of time. Since market interest rates change over time, an institution is exposed to lower profit margins (or losses) if it cannot adapt to interest rate changes. For example, assume that an institution’s assets carry intermediate or long-term fixed rates and that those assets are funded with short-term liabilities. If market interest rates rise by the time the short-term liabilities must be refinanced, the increase in the institution’s interest expense on its liabilities may not be sufficiently offset if assets continue to earn at the long-term fixed rates. Accordingly, an institution’s profits could decrease on existing assets because the institution will either have lower net interest income or possibly, net interest expense. Similar risks exist when assets are subject to contractual interest rate ceilings, or rate-sensitive assets are funded by longer-term, fixed-rate liabilities in a declining rate environment. There are several ways an institution can manage interest rate risk including: 1) matching repricing periods for new assets and liabilities, for example, by shortening or lengthening terms of new loans, investments, or liabilities; 2) selling existing assets or repaying certain liabilities; and 3) hedging existing assets, liabilities, or anticipated transactions. An institution might also invest in more complex financial instruments intended to hedge or otherwise change interest rate risk. Interest rate swaps, futures contracts, options on futures contracts, and other such derivative financial instruments can be used for this purpose. Because these instruments are sensitive to interest rate changes, they require management’s expertise to be effective. The Company has not purchased derivative financial instruments in the past, but during The Company manages its interest rate risk by the employment of strategies to assure that desired levels of both interest-earning assets and interest-bearing liabilities mature or reprice with similar time frames. Such strategies include: 1) loans receivable which are renewed (and repriced) annually, 2) variable rate loans, 3) certificates of deposit with terms from one month to six years, 4) securities Management believes the most significant impact on financial results is the Company’s ability to react to changes in interest rates. Management seeks to maintain an essentially balanced position between interest sensitive assets and liabilities and actively manages loan, security, and liability maturities in order to protect against the effects of wide interest rate fluctuations on net income and shareholders’ equity. 44 Our Consolidated Financial Statements and notes thereto and other supplementary data follow. Index to Consolidated Financial Statements F-1 SB Financial Group, Inc. Consolidated Balance Sheets at December 31, See Notes to Consolidated Financial Statements F-2 SB Financial Group, Inc. Consolidated Statements of Income Years Ended December 31, See Notes to Consolidated Financial Statements F-3 SB Financial Group, Inc. Consolidated Statements of Comprehensive Income Years Ended December 31, Available for sale investment securities: See Notes to Consolidated Financial Statements F-4 SB Financial Group, Inc. Consolidated Statements of Stockholders’ Equity Years Ended December 31, See Notes to Consolidated Financial Statements F-5 SB Financial Group, Inc. Consolidated Statements of Cash Flows Years Ended December 31, See Notes to Consolidated Financial Statements F-6 SB Financial Group, Inc. Notes to Consolidated Financial Statements Years Ended December 31, Note 1: Organization and Summary of Significant Accounting Policies Organization and Nature of Operations SB Financial Group, Inc. (the “Company”) is a Principles of Consolidation The Consolidated Financial Statements include the accounts of the Company, State Bank, SBFG Title, SB Captive, RFCBC, RDSI, RMC, RST II, and SBI. All significant intercompany accounts and transactions were eliminated in consolidation. Use of Estimates The preparation of financial statements in conformity with accounting principles generally accepted in the United States of America requires management to make estimates and assumptions that affect the reported amounts of assets and liabilities and disclosure of contingent assets and liabilities at the date of the financial statements and the reported amounts of revenues and expenses during the reporting period. Actual results could differ from those estimates. Material estimates that are particularly susceptible to significant change relate to the determination of the allowance for loan losses, Cash Equivalents The Company considers all liquid investments with original maturities of three months or less to be cash equivalents. At December 31, At December 31, Securities Available-for-sale securities, which include any debt security for which the Company has no immediate plan to sell but which may be sold in the future, are carried at fair value. Unrealized gains and losses are recorded, net of related income tax effects, in other comprehensive income. Amortization of premiums and accretion of discounts are recorded as interest income from securities. Realized gains and losses are recorded as net security gains (losses). Gains and losses on sales of securities are determined on the specific-identification method. For debt securities with fair value below carrying value when the Company does not intend to sell the debt security, and it is more likely than not the Company will not have to sell the security before recovery of its cost basis, the Company recognizes the credit component of an other-than-temporary impairment of the debt security in earnings and the remaining portion in other comprehensive income. F-7 Mortgage Loans Held for Sale Mortgage loans originated and intended for sale in the secondary market are carried at the lower of cost or fair value in the aggregate. Net unrealized losses, if any, are recognized through a valuation allowance by charges to noninterest income. Gains and losses on loan sales are recorded in noninterest income. The Company utilizes third-party hedges to minimize the impact of interest rate risk fluctuations, and their impact is realized through noninterest income. Loans Loans that management has the intent and ability to hold for the foreseeable future, or until maturity or payoffs, are reported at their outstanding principal balances adjusted for any charge offs, the allowance for loan losses, any deferred fees or costs on originated loans and unamortized premiums or discounts on purchased loans. Interest income is reported on the interest method and includes amortization of net deferred loan fees and costs over the loan term. Generally, loans are placed on nonaccrual status not later than 90 days past due. Past due status is based on the contractual terms of the loan. All interest accrued, but not collected for loans that are placed on nonaccrual or charged off, is reversed against interest income. The interest on these loans is accounted for on the cash-basis or cost-recovery method, until qualifying for return to accrual. Loans are returned to accrual status when all the principal and interest amounts contractually due are brought current and future payments are reasonably assured. Allowance for Loan Losses The allowance for loan losses is established as losses are estimated to have occurred through a provision for loan losses charged to income. Loan losses are charged against the allowance when management believes the non-collectability of a loan balance is probable. Subsequent recoveries, if any, are credited to the allowance. The allowance for loan losses is evaluated on a regular basis by management and is based upon management’s periodic review of the collectability of the loans in light of historical experience, the nature and volume of the loan portfolio, adverse situations that may affect the borrower’s ability to repay, estimated value of any underlying collateral and prevailing economic conditions. This evaluation is inherently subjective as it requires estimates that are susceptible to significant revision as new information becomes available. The allowance consists of allocated and general components. The allocated component relates to loans that are classified as impaired. For those loans that are classified as impaired, an allowance is established when the discounted cash flows (or collateral value or observable market price) of the impaired loan is lower than the carrying value of that loan. The general component covers non-classified loans and is based on historical charge off experience and expected loss given default derived from the Company’s internal risk rating process. Other adjustments may be made to the allowance for pools of loans after an assessment of internal or external influences on credit quality that are not fully reflected on the historical loss or risk rating data. A loan is considered impaired when, based on current information and events, it is probable that When Large groups of smaller balance homogenous loans are collectively evaluated for impairment. Accordingly, F-8 Premises and Equipment Depreciable assets are stated at cost less accumulated depreciation. Depreciation is charged to expense using the straight-line method for buildings and equipment over the estimated useful lives of the assets. Leasehold improvements are capitalized and depreciated using the straight-line method over the terms of the respective leases. Long-lived Asset Impairment The Company evaluates the recoverability of the carrying value of long-lived assets whenever events or circumstances indicate the carrying amount may not be recoverable. If a long-lived asset is tested for recoverability and the undiscounted estimated future cash flows expected to result from the use and eventual disposition of the asset is less than the carrying amount of the asset, the asset’s cost is adjusted to fair value and an impairment loss is recognized as the amount by which the carrying amount of a long-lived asset exceeds its fair value. Federal Reserve Bank and Federal Home Loan Bank Stock Foreclosed Assets and Other Assets Held for Sale Assets acquired through, or in lieu of, loan foreclosure are held for sale and are initially recorded at fair value less costs to sell at the date of foreclosure, establishing a new cost basis. Subsequent to foreclosure, valuations are periodically performed by management and the assets are carried at the lower of the carrying amount or the fair value less cost to sell. Revenue and expenses from operations related to foreclosed assets and changes in the valuation allowance are included in net income or expense from foreclosed assets. The Company has a vacant lot in our Columbus region that was acquired for the construction of our Columbus office location in 2014. Due to an agreement in principle to sell the vacant lot, the Company has reclassified the asset into held for sale. Goodwill Goodwill is tested for impairment annually. If the implied fair value of goodwill is lower than its carrying amount, goodwill impairment is indicated and goodwill is written down to its implied fair value. Core Deposits and Other Intangibles Intangible assets are being amortized on a straight-line basis over weighted-average periods ranging from one to fifteen years. Such assets are periodically evaluated as to the recoverability of their carrying value. Purchased software is being amortized using the straight-line method over periods ranging from one to three years. Derivatives The IRLCs and forward contracts are not designated as accounting hedges and are recorded at fair value with the changes in fair value reflected in noninterest income on the consolidated statements of income. The fair value of derivative instruments with a positive fair value are reported in accrued income and other assets in the consolidated balance For exchange-traded contracts, fair value is based on quoted market prices. For non-exchange traded contracts, fair value is based on dealer quotes, pricing models, discounted cash flow methodologies or similar techniques for which the determination of fair value may require significant management judgment or estimation. F-9 Mortgage Servicing Rights Mortgage servicing assets are recognized separately when rights are acquired through purchase or through sale of financial assets. Under the servicing assets and liabilities accounting guidance, Fair value is based on market prices for comparable mortgage servicing contracts, when available, or alternatively, is based on a valuation model that calculates the present value of estimated future net servicing income. The valuation model incorporates assumptions that market participants would use in estimating future net servicing income, such as the cost of service, the discount rate, the custodial earning rate, an inflation rate, ancillary income, prepayment speeds and default rates and losses. These variables change from quarter to quarter as market conditions and projected interest rates change, and may have an adverse impact on the value of the mortgage servicing right and may result in a reduction to noninterest income. Each class of separately recognized servicing assets subsequently measured using the amortization method is evaluated and measured for impairment. Impairment is determined by stratifying rights into tranches based on predominant characteristics, such as interest rate, loan type and investor type. Impairment is recognized through a valuation allowance for an individual tranche, to the extent that fair value is less than the carrying amount of the servicing assets for that tranche. The valuation allowance is adjusted to reflect changes in the measurement of impairment after the initial measurement of impairment. Changes in valuation allowances are reported with “Mortgage Servicing fee income is recorded for fees earned for servicing loans. The fees are based on a contractual percentage of the outstanding principal or a fixed amount per loan and are recorded as income when earned. The amortization of mortgage servicing rights is netted against loan servicing fee income. Share-Based Employee Compensation Plan At December 31, Transfers of Financial Assets Transfers of financial assets are accounted for as sales, when control over the assets has been surrendered. Control over transferred assets is deemed to be surrendered when (1) the assets have been isolated from the Company – put presumptively beyond the reach of the transferor and its creditors, even in bankruptcy or other receivership, (2) the transferee obtains the right (free of conditions that constrain it from taking advantage of that right) to pledge or exchange the transferred assets and (3) the Company does not maintain effective control over the transferred assets through an agreement to repurchase them before the maturity or the ability to unilaterally cause the holder to return specific assets. Income Taxes The Company accounts for income taxes in accordance with income tax accounting guidance (ASC Uncertain tax positions are recognized if it is more likely than not, based on the technical merits, that the tax position will be realized or sustained upon examination. The term more likely than not means a likelihood of more than 50 percent; the term “upon examination” also includes resolution of the related appeals or litigation processes, if any. A tax position that meets the more-likely-than-not recognition threshold is initially and subsequently measured as the largest amount of tax benefit that has a greater than 50 percent likelihood of being realized upon settlement with a taxing authority that has full knowledge of all relevant information. The determination of whether or not a tax position has met the more-likely-than-not recognition threshold considers the facts, circumstances and information available at the reporting date and is subject to management’s judgment. F-10 The Company recognizes interest and penalties on income taxes as a component of income tax expense. The Company files consolidated income tax returns with its subsidiaries. With a few exceptions, the Company is no longer subject to U.S. Federal, State and Local examinations by tax authorities for the years before Treasury Shares Treasury stock is stated at cost. Cost is determined by the weighted-average cost method. Earnings Per Share Earnings per common share is computed using the two-class method. Basic earnings per share represent income available to common shareholders divided by the weighted-average number of common shares outstanding during each period. Diluted earnings per share reflect additional potential common shares Comprehensive Income Comprehensive income consists of net income and other comprehensive income, net of applicable income taxes. Other comprehensive income includes unrealized appreciation (depreciation) on available-for-sale Subordinated Debt At December 31, 2021, the Company had subordinated debt obligations of $20.0 million related to its 3.65% Fixed to Floating Rate Subordinated Notes due 2031, which were issued and sold by the Company on May 27, 2021. The Subordinated Notes were issued in order to assist the Company in meeting various corporate obligations, including share buybacks, acquisition costs and organic asset growth (see Note 15 to the Consolidated Financial Statements). Revenue Recognition The Company recognizes revenues as they are earned based on contractual terms, as transactions occur, or services are provided and collectability is reasonably assured. The Company’s principal source of revenue is interest income from loans and leases and investment securities. The Company also earns noninterest income from various banking and financial services offered through State Bank. Interest income is the largest source of revenue for the Company which is primarily recognized on an accrual basis. Noninterest income is earned through a variety of financial and transaction services provided to corporate and consumer clients such as trust and wealth advisory, deposit account, debit card, mortgage banking and insurance. New and applicable accounting pronouncements: ASU No. This F-11 Accounting standards not yet adopted: ASU No. This guidance provides temporary options to ease the potential burden in accounting for reference rate reform. It is intended to help stakeholders during the global market-wide reference rate transition period. The ASU No. 2016-13: Financial Instruments – Credit Losses (Topic 326) This ASU, which is commonly known as CECL, replaces the current GAAP incurred impairment methodology regarding credit losses with a methodology that reflects expected credit losses and requires consideration of a broader range of reasonable and supportable information to inform credit loss estimates. The amendments in this update affect an entity to varying degrees depending on the credit quality of the assets held by the entity, their duration, and how the entity applies current GAAP. The adoption of ASU 2016-13 The Company will continue to F-12 Note 2: Earnings Per Share Earnings per common share There were no anti-dilutive shares in On January 10, 2022 the Company announced that its board of directors had declared a 5 percent common stock dividend payable on February 4, 2022, to Had the 5 percent common stock dividend been included in On January 25, 2022, the Company filed a Certificate of Amendment with the Ohio Secretary of State to amend Article FIRST of its Amended Articles of Incorporation to increase the authorized number of common shares, without par value, of the Company from 10,000,000 to 10,500,000.The addition of these authorized shares will not have a material impact on the Company’s consolidated financial statements. F-13 Note 3: Business Combination Effective June 5, 2020, the Company acquired Edon Bancorp and its subsidiary, The Edon State Bank Company of Edon, Ohio (the “Edon State Bank”). Edon Bancorp and Edon State Bank were headquartered in Edon, Ohio and had one retail banking office. The Edon State Bank was merged with and into State Bank, with State Bank surviving. Under the terms of the merger agreement, shareholders of Edon Bancorp received fixed consideration of $103.50 in cash for each share of Edon Bancorp common stock for total consideration of $15.5 million. The Company accounted for the transaction under the acquisition method of accounting, which means that the acquired assets and liabilities were recorded at fair value at the date of acquisition. In accordance with ASC 805, the Company expensed approximately $1.2 million of direct acquisition costs during the twelve months ended December 31, 2020. The $1.2 million in merger expense was split between data processing and professional fees expense. As a result of the acquisition, the Company recorded $4.3 million of goodwill and $0.7 million of intangible assets in the second quarter of 2020. The Company was able to increase both its deposit and loan base and acquire new households in a new market. It is expected that this transaction will result in business synergies and economies of scale. The acquisition was consistent with the Company’s strategy to expand its presence in Northwest Ohio and to increase profitability by introducing existing products and services to the acquired customer base. The intangible assets are related to core deposits, which are being amortized over 10 years on a straight-line basis. For tax purposes, goodwill is non-deductible but will be evaluated annually for impairment. The following table summarizes the fair value of the total consideration transferred as part of the acquisition as well as the fair value of identifiable assets and liabilities assumed as of the effective date of the transaction based on assumptions that are subject to change as management continues to evaluate relevant information as it becomes available. Potential adjustments, if any, will be related to assets that may have changes to valuation amounts that were not readily determinable at the acquisition date. The contractual principal of loans at the acquisition date was $16.8 million and the estimate of the contractual cash flows not expected to be collected is $0.4 million. F-14 Pro Forma Financial Information The results of operations of Edon Bancorp have been included in the Company’s consolidated financial statements since the acquisition date of June 5, 2020. The following schedule includes the pro forma results for the twelve months ended December 31, 2021 and 2020, as if the Edon State Bank acquisition had occurred as of the beginning of the reporting periods presented. The acquisition’s impact was immaterial to the Company’s operating performance for the twelve months ended December 31, 2020 and 2021. Certain nonrecurring costs were included in the pro-forma, specifically $0.7 million was incurred by Edon State Bank prior to the acquisition in the 2020 fiscal year and the Company incurred $1.2 million in nonrecurring costs for the acquisition in the 2020 fiscal year. F-15 Note The amortized cost and appropriate fair values, together with gross unrealized gains and losses, of available-for-sale securities are as follows: The amortized cost and fair value of securities The fair value of securities pledged as collateral, to secure public deposits and for other purposes, was F-16 Certain investments in debt securities are reported in the financial statements at an amount less than their historical cost. Total fair value of these investments at December 31, Based on evaluation of available evidence, including recent changes in market interest rates, credit rating information and information obtained from regulatory filings, management believes the declines in fair value for these securities are temporary. Should the impairment of any of these securities become other than temporary, the cost basis of the investment will be reduced and the resulting loss recognized in net income in the period the other-than-temporary impairment is identified. The following tables present securities with unrealized losses at December 31, Fair Value Fair Value Fair Value Fair Value Fair Value Fair Value The unrealized loss on the securities portfolio F-17 Note Standby letters of credit are conditional commitments issued by Forward sale commitments are commitments to sell groups of residential mortgage loans that the Company originates or purchases as part of its mortgage banking activities. The Company commits to sell the loans at specified prices in a future period, typically within forty-five days. These commitments are acquired to reduce market risk on mortgage loans in the process of origination and mortgage loans Listed below is a summary of loan commitments, unused lines of credit and standby letters of credit as of December 31, There are various contingent liabilities that are not reflected in the consolidated financial statements, including claims and legal actions arising in the ordinary course of business. In the opinion of management, after consultation with legal counsel, the ultimate disposition of these matters is not expected to have a material effect on the Company’s consolidated financial condition or results of operations. F-18 The risk characteristics of each loan portfolio segment are as follows: Commercial & Industrial and Agricultural Commercial & industrial and agricultural loans are primarily based on the identified cash flows of the borrower and secondarily on the underlying collateral provided by the borrower. The cash flows of borrowers, however, may not be as expected and the collateral securing these loans may fluctuate in value. Most commercial loans are secured by the assets being financed or other business assets, such as accounts receivable or inventory, and may include a personal guarantee. Short-term loans may be made on an unsecured basis. In the case of loans secured by accounts receivable, the availability of funds for the repayment of these loans may be substantially dependent on the ability of the borrower to collect amounts due from its customers. Commercial Real Estate Commercial real estate loans are viewed primarily as cash flow loans and secondarily as loans secured by real estate. Commercial real estate lending typically involves higher loan principal amounts and the repayment of these loans is generally dependent on the successful operation of the property securing the loan or the business conducted on the property securing the loan. Commercial real estate loans may be more adversely affected by conditions in the real estate markets or in the general economy. The characteristics of properties securing the Company’s commercial real estate portfolio are diverse, but with geographic location almost entirely in the Company’s market area. Management monitors and evaluates commercial real estate loans based on collateral, geography and risk grade criteria. In general, the Company avoids financing single purpose projects unless other underwriting factors are present to help mitigate risk. In addition, management tracks the level of owner-occupied commercial real estate versus Construction loans are underwritten utilizing feasibility studies, independent appraisal reviews and financial analysis of the developers and property owners. Construction loans are generally based on estimates of costs and value associated with the completed project. These estimates may be inaccurate. Construction loans often involve the disbursement of substantial funds with repayment substantially dependent on the success of the ultimate project. Sources of repayment for these types of loans may be pre-committed permanent loans from approved long-term lenders, sales of developed property or an interim loan commitment from the Company until permanent financing is obtained. These loans are closely monitored by on-site inspections and are considered to have higher risks than other real estate loans due to their ultimate repayment being sensitive to interest rate changes, governmental regulation of real property, general economic conditions and the availability of long-term financing. Residential Real Estate, Home Equity Line of Credit (“HELOC”) and Consumer Residential and consumer loans consist of two segments – residential mortgage loans and personal loans. Residential mortgage loans are secured by 1-4 family residences and are generally owner-occupied, and the Company generally establishes a maximum loan-to-value ratio and requires private mortgage insurance if that ratio is exceeded. The following tables present the balance of the allowance for loan and lease losses (“ALLL”) and the recorded investment in loans based on portfolio segment and impairment method as of December 31, F-19 F-20 Credit Risk Profile The Company categorizes loans into risk categories (loan grades) based on relevant information about the ability of borrowers to service their debt such as current financial information, historical payment experience, credit documentation, public information and current economic trends, among other factors. The Company analyzes loans individually by classifying the loans as to credit risk. This analysis includes loans with an outstanding balance greater than $100,000 and non-homogeneous loans, such as commercial and commercial real estate loans. This analysis is performed on a quarterly basis. The Company uses the following definitions for risk ratings: Pass (grades 1 – 4): Loans which management has determined to be performing as expected and in agreement with the terms established at the time of loan origination. Special Mention (grade 5): Assets have potential weaknesses that deserve management’s close attention. If left uncorrected, these potential weaknesses may result in deterioration of the repayment prospects for the asset or in the Company’s credit position at some future date. Special mention assets are not adversely classified and do not expose the Company to sufficient risk to warrant adverse classification. Ordinarily, special mention credits have characteristics which corrective management action would remedy. Substandard (grade 6): Loans are inadequately protected by the current sound worth and paying capacity of the obligor or of the collateral pledged, if any. Loans so classified must have a well-defined weakness or weaknesses that jeopardized the liquidation of the debt. They are characterized by the distinct possibility that the Company will sustain some loss if the deficiencies are not corrected. Doubtful (grade 7): Loans classified as doubtful have all the weaknesses inherent in those classified Substandard with the added characteristic that the weaknesses make collection or liquidation in full, on the basis of current known facts, conditions and values, highly questionable and improbable. Loss (grade 8):Loans are considered uncollectable and of such little value that continuing to carry them as assets on the Company’s financial statement is not feasible. Loans will be classified as The following tables present the credit risk profile of the Company’s loan portfolio based on rating category as of December 31, F-21 The Company evaluates the loan risk grading system definitions and allowance for loan loss methodology on an ongoing basis. The Company uses a The following tables present the Company’s loan portfolio aging analysis as of December 31, All loans past due 90 days are systematically placed on nonaccrual status. A loan is considered impaired, in accordance with the impairment accounting guidance (ASC 310-10-35-16), when based on current information and events, it is probable F-22 The following tables present impaired loan activity for the twelve months ended December 31, Impaired loans less than $100,000 are included in groups of homogenous loans. These loans are evaluated based on delinquency status. Interest income recognized on a cash basis does not materially differ from interest income recognized on an accrual basis. F-23 Troubled Debt Restructured TDRs are modified loans where a concession was provided to a borrower experiencing financial difficulties. Loan modifications are considered TDRs when the concessions provided are not available to the borrower through either normal channels or other sources. However, not all loan modifications are TDRs. TDR Concession Types The Company’s standards relating to loan modifications consider, among other factors, minimum verified income requirements, cash flow analysis, and collateral valuations. Each potential loan modification is reviewed individually and the terms of the loan are modified to meet a borrower’s specific circumstances at a point in time. All loan modifications, including those classified as TDRs, are reviewed and approved. The types of concessions provided to borrowers include: The There There were no TDRs modified during the past twelve months that On March 22, 2020, a statement was issued by the Company’s bank regulators and Interest Only F-24 Note 6: Accounting for Certain Loans Acquired in an Acquisition Accretable yield, or income expected to be collected as of Note 7: Premises and Major classifications of premises and equipment stated at cost were as follows at December 31: F-25 Note 8: Goodwill and Intangibles Impairment exists when a reporting unit’s carrying value of goodwill exceeds its fair value. Goodwill is Carrying basis and accumulated amortization of intangible assets were as F-26 Note 9: Mortgage Banking and Servicing Rights The following table summarizes mortgage servicing rights capitalized and related amortization, along with activity in the related valuation allowance at December 31: F-27 Note 10: Derivative Financial Instruments The Company is exposed to certain risks arising from both its business operations and The Additionally, the Company enters into forward contracts for the future delivery of mortgage loans to third-party investors and enters into IRLCs with potential borrowers to fund specific mortgage loans that will be sold into the secondary market. The forward contracts that are entered into, economically hedge the effect of changes in interest rates resulting from the Company’s commitment to fund the loans. The IRLCs and forward contracts are not designated as accounting hedges and are recorded at fair value The table below presents the notional amount and fair value of the The fair value of interest rate swaps were estimated using a discounted cash flow method that incorporates current market interest rates as of the balance sheet date. Fair values of IRLCs and forward contracts were estimated using changes in mortgage interest rates from the date the Company entered into the IRLC and the balance sheet date. F-28 The following table presents the amounts included in the consolidated statements of income for The following table shows the offsetting of financial assets and The following table shows the offsetting of F-29 Note 11: Interest-Bearing Deposits Interest-bearing time deposits in denominations of $250,000 or more totaled At December 31, Included in time deposits at December 31, Note The Company has borrowing capabilities at the Federal Reserve Discount Window (“Discount Window”) by pledging either securities or loans as collateral. As of December 31, 2021, there was no collateral pledged or borrowings drawn at the Discount Window. At December 31, F-30 Note The Note On September 15, 2005, RST II, a wholly-owned subsidiary of the Company, closed a pooled private offering of 10,000 Capital Securities with a liquidation amount of $1,000 per security. The proceeds of the offering were loaned to the Company in exchange for junior subordinated debentures with terms similar to the Capital Securities. Distributions on the Capital Securities are payable quarterly at a variable rate that is based upon the 3-month LIBOR plus 1.80 percent and are included in interest expense in the consolidated financial statements. The issuers of these securities have not yet determined the replacement rate index for LIBOR. These securities may be included in Tier 1 capital and may be prepaid at any time without penalty (with certain limitations applicable) under current regulatory guidelines and interpretations. The balance of the Capital Securities as of December 31, Note 15: Subordinated Debt On May 27, 2021, the Company entered into Subordinated Note Purchase Agreements (collectively, the “Purchase Agreements’’) with qualified institutional buyers and accredited investors (collectively, the “Purchasers”) pursuant to which the Company issued and sold $20.0 million in aggregate principal amount of its 3.65% Fixed to Floating Rate Subordinated Notes due 2031 (the “Notes”). The Notes were sold by the Company in a private placement exempt from the registration requirements under the Securities Act of 1933, as amended. The Notes mature on June 1, 2031 and bear interest at a fixed rate of 3.65% through May 31, 2026. From June 1, 2026 to the maturity date or earlier redemption of the Notes, the interest rate will reset quarterly to an interest rate per annum, equal to the then-current-three-month Secured Overnight Financing Rate (“SOFR”) provided by the Federal Reserve Bank of New York plus 296 basis points. The Company may redeem the Notes at any time after May 31, 2026, and at any time in whole, but not in part, upon the occurrence of certain events. Any redemption of the Notes will be subject to prior regulatory approval. The Company incurred debt issuance costs for placement fees, legal and other out-of-pocket expenses of approximately $0.5 million, which are being amortized over the life of the Notes. F-31 Note The provision for income taxes includes these components: A reconciliation of income tax expense at the statutory rate to the Company’s actual income tax expense is shown below: The tax effects of temporary differences related to deferred taxes shown on the balance sheets are: F-32 Note Note As of December 31, State Bank’s actual capital amounts and ratios are presented in the following table. Capital levels are presented for the State Bank only as the Company is The above minimum capital requirements exclude the capital conservation buffer required to avoid limitations on capital distributions, including dividend payments and certain discretionary bonus payments to executive officers. The capital conservation buffer F-33 Note The Company has a share-based incentive compensation plan that permits the grant of stock options, restricted stock and other share-based awards to employees, directors and advisory board members of the Company and its subsidiaries. In addition, the Company has instituted a long-term incentive program, The Company has a retirement savings 401(k) plan covering substantially all employees. Also, the Company has Supplemental Executive Retirement Plan (“SERP”) Agreements with certain active and retired officers. The agreements provide monthly payments for up to 15 years that equal 15 percent to 25 percent of average compensation prior to retirement or death. The charges to expense for the current agreements were Additional life insurance is provided to certain officers through a bank-owned life insurance policy (“BOLI”). By way of a separate split-dollar agreement, the policy interests are divided between The Company has a noncontributory employee stock ownership plan (“ESOP”) covering substantially all employees of the Company and its subsidiaries. Voluntary contributions are made by the Company to the plan. Each eligible employee is vested based upon years of service, including prior years of service. The Company’s contributions to the account of each employee become fully vested after three years of service. Benefit expense for the value of the stock purchased is recorded equal to the fair market value of the stock when contributions, which are determined annually by the Board of Directors of the Company, are made to the ESOP. Allocated shares in the ESOP at December 31, Dividends on allocated shares are recorded as dividends and charged to retained earnings. Compensation expense is recorded equal to the fair market value of the stock when contributions, which are determined annually by the Board of Directors of the Company, are made to the ESOP. ESOP expense for the years ended December 31, F-34 Note In April 2017, the shareholders approved a new share-based incentive compensation plan, the SB Financial Group, Inc. 2017 Stock Incentive Plan (the “2017 Plan”), which replaced the Company’s 2008 Stock Incentive Plan. This plan permits the grant or award of incentive stock options, nonqualified stock options, stock appreciation rights (“SAR’s”), restricted stock, and restricted stock units (“RSU’s”) for up to 500,000 Common Shares of the Company. The Option awards are granted with an exercise price equal to the market price of the Company’s stock at the date of grant and those option awards vest based on 2020. There As of December 31, During 2020, 26,950 option shares exercised had a total intrinsic value of $0.3 million and the cash received from these exercised options was $0.2 million. The tax benefit from these transactions was immaterial. Pursuant to the A summary of restricted stock activity under the Company’s LTI Plan as of December 31, As of December 31, Note Pursuant to ASC 820, Level 1:Quoted prices in active markets for identical assets or liabilities Level 2:Observable inputs other than Level 1 prices, such as quoted prices for similar assets or liabilities; quoted prices in markets that are not active; or other inputs that are observable or can be corroborated by observable market data for substantially the full term of the assets or liabilities. Level Following is a description of the valuation methodologies, inputs used for assets measured at fair value on a recurring basis, recognized in the accompanying balance sheets, as well as the general classification of such assets pursuant to the valuation hierarchy. Available-for-sale securities The fair value of available-for-sale securities are determined by various valuation methodologies. Level Interest rate contracts The fair values of interest rate contracts are based upon the estimated amount the Company would receive or pay to terminate the contracts or agreements, taking into account underlying interest rates, creditworthiness of underlying customers for credit derivatives and, when appropriate, the creditworthiness of the counterparties. Forward contracts The fair values of forward contracts on to-be-announced securities are determined using quoted prices in active markets, or benchmarked thereto (Level 1). Interest Rate Lock Commitments The fair value of IRLCs are determined using the projected sale price of individual loans based on changes in the market interest rates, projected pull-through rates (the probability that an IRLC will ultimately result in an originated loan), the reduction in the value of the applicant’s option due to the passage of time, and the remaining origination costs to be incurred based on management’s estimate of market costs (Level 3). F-36 The following table presents the fair value measurements of securities measured at fair value on a recurring basis and the level within Level 1 - Level 2 - Level 3 - The following is a description of the valuation methodologies and inputs used for assets measured at fair value on a nonrecurring basis and recognized in the accompanying balance sheets, as well as the general classification of such assets pursuant to the valuation hierarchy. Collateral-dependent Impaired Loans, Net of ALLL Loans for which it is probable the Company will not collect all principal and interest due according to contractual terms are measured for impairment. The estimated fair value of collateral-dependent impaired loans is based on the appraised value of the collateral, less estimated cost to sell. Collateral-dependent impaired loans are classified within Level 3 of the fair value hierarchy. This method requires obtaining independent appraisals of the collateral from a list of preapproved appraisers, which are reviewed for accuracy and consistency by Mortgage Servicing Rights Mortgage servicing rights do not trade in an active, open market with readily observable prices. Accordingly, fair value is estimated using discounted cash flow models associated with the servicing rights and discounting the cash flows using discount market rates, prepayment speeds and default rates. The servicing portfolio has been valued using all relevant positive and negative cash flows including servicing fees, miscellaneous income and float; marginal costs of servicing; the cost of carry of advances; and foreclosure losses; and applying certain prevailing assumptions used in the marketplace. Due to the nature of the valuation inputs, mortgage servicing rights are classified within Level 3 of the hierarchy. These mortgage servicing rights are tested for impairment on a quarterly basis. F-37 The following table presents the fair value measurements of assets measured at fair value on a non-recurring basis and the level within the fair value hierarchy in which the fair value measurements fell at December 31, Level 1 - Level 2 - Level 3 - Unobservable (Level 3) Inputs The following tables present quantitative information about unobservable inputs used in recurring and nonrecurring Level 3 fair value measurements at December 31, Fair value at December 31, 2021 Valuation technique Fair value at December 31, 2020 Valuation technique F-38 Comparability adjustments (%) Comparability adjustments (%) The mortgage servicing rights portfolio is measured for fair value by an independent third party. The valuation of the portfolio hinges on a number of quantitative factors. These factors include, but are not limited to, a discount rate applied to the cash flows, and an assumption of future principal prepayments. The prepayment assumptions are based upon the historical performance of the Company’s portfolio as well as market metrics. The following methods were used to estimate the fair value of all other financial instruments recognized in the accompanying balance sheets at amounts other than fair value. Cash and Due From Banks, Interest Bearing Time Deposits, Federal Reserve and Federal Home Loan Bank Stock and Interest Receivable and Payable Fair value is determined to be the carrying amount for these items (which include cash on hand, due from banks, and federal funds sold) because they represent cash or mature in 90 days or less, and do not represent unanticipated credit concerns. Loans Held for Sale The fair value of loans held for sale is based upon quoted market prices, where available, or is determined by discounting estimated cash flows using interest rates approximating the Company’s current origination rates for similar loans and adjusted to reflect the inherent credit risk. Loans The estimated fair value Deposits, Repurchase Agreements & FHLB Advances Deposits include demand deposits, savings accounts and certain money market deposits. The carrying amount approximates the fair value. The estimated fair value for fixed-maturity time deposits, as well as borrowings, is based on estimates of the rate Loan Commitments The fair value of commitments is estimated using the fees currently charged to enter into similar agreements, taking into account the remaining terms of the agreements and the present creditworthiness of the counterparties. The estimated fair values for other financial instruments and off-balance-sheet loan commitments approximate cost at December 31, Trust Preferred Securities The fair value for Trust Preferred Securities is estimated by discounting the cash flows using an appropriate discount rate. Subordinated Debt The fair value for Subordinated Debt is estimated by discounting the cash flows using an appropriate discount rate. The following table presents estimated fair values of the Company’s financial instruments. The fair values of certain instruments were calculated by discounting expected cash flows, which involves significant judgments by management and uncertainties. Fair value is the estimated amount at which financial assets or liabilities could be exchanged in a current transaction between willing parties, other than in a forced or liquidation sale. Because no market exists for these financial instruments, and because management does not intend to sell these financial instruments, the Company does not know whether the fair values shown below represent values at which the respective financial instruments could be sold individually or in the aggregate. F-39 F-40 Note Presented below is condensed financial information of the parent company Condensed Balance Sheets Condensed Statements of Income F-41 Condensed Statements of Comprehensive Income Condensed Statements of Cash Flows F-42 Note 23: Quarterly Financial Information (unaudited) ($ in thousands, except per share data) F-43 Report of Independent Registered Public Accounting Firm SB Financial Group, Inc. Defiance, Ohio Opinion on the Financial Statements We have audited the accompanying consolidated balance sheets of SB Financial Group, Inc. (the “Company”) as of December 31, Basis for Opinion These financial statements are the responsibility of the Company’s management. Our responsibility is to express an opinion on the Company’s financial statements based on our audits. We are a public accounting firm registered with the We conducted our audits in accordance with the standards of the PCAOB. Those standards require that we plan and perform the Critical Audit Matter The critical audit matter communicated below is a matter arising from the current-period audit of the financial statements that was communicated or required to be communicated to the audit committee and that: (1) relates to accounts or disclosures that is material to the financial statements and (2) involved our especially challenging, subjective or complex judgments. The communication of critical audit matters does not alter in any way our opinion on the financial statements, taken as a whole, and we are not, by communicating the critical audit matter below, providing separate opinion on the critical audit matter or on the accounts or disclosures to which it relates. Allowances for Loan Losses Description of the Matter As described in Note 5 to the financial statements, the Company’s consolidated allowance for loan and lease losses (ALLL) was $13.8 million at December 31, 2021. The Company also describes in Note 1 of the financial statements the accounting policy around this estimate. The ALLL is an estimate of losses inherent in the loan and lease portfolio. The determination of the reserve requires significant judgment reflecting the Company’s best estimate of probable loan and lease losses. The estimate consists of several key elements, which include: specific reserves for impaired loans, general reserves for each business lending division portfolio including percentage allocations for special attention loans and leases not deemed impaired, and reserves for pooled homogenous loans and leases, among others. The Company’s evaluation is based upon a continuing review of these portfolios, estimates of customer performance, collateral values and dispositions, and assessments of economic and geopolitical events, all of which are subject to judgment and will change. F-44 We identified the valuation of the ALLL as a critical audit matter. Auditing the ALLL involves a high degree of subjectivity in evaluating management’s estimates, such as evaluating management’s assessment of economic conditions and other environmental factors used to adjust historical loss rates, evaluating the adequacy of specific reserves associated with impaired loans and assessing the appropriateness of loan grades. How We Addressed the Matter in Our Audit Our audit procedures related to the estimated allowance for loan losses included: Evaluating the overall reasonableness of qualitative factors and the appropriateness of their direction and magnitude and the Company’s support for the direction and magnitude compared to previous years. /s/ BKD, We have served as the Company’s auditor since 2002 Indianapolis, Indiana March F-45 Item 3. Legal Proceedings. Item 4. Mine Safety Disclosures. of the Registrant2017,2022, the positions presently held by each executive officer, and the business experience of each executive officer during their employment at the past five years.Company. Unless otherwise indicated, each person has held his or her principal occupation(s) for more than five years.
Name
Age Position(s) Held with the Company and its Subsidiaries and Principal Occupation(s) Mark A. Klein 6367 The State Bank since January 2006; Director of State Bank since 2006; President of RDSI since October 2011; Member of State Bank Trust Investment Review Committee since March 2007. Anthony V. Cosentino 5660 Executive Vice President and Chief Financial Officer of the Company and State Bank since March 2010; Chief Financial Officer of RDSI since October 2011; Member of State Bank Trust Investment Review Committee since June 2010. Jonathan R. GathmanErnesto Gaytan 4450 Executive Vice President and SeniorChief Technology Innovation Officer of the Company since joining State Bank in November 2017. Prior to joining the Company, he worked as an executive and site leader for GE Capital, and was an independent technology consultant and advisor.Steven R. Walz 51 Executive Vice President and Chief Lending Officer of the Company since October 2005;December 2021; Senior Vice President and CommercialChief Lending ManagerOfficer from June 2005September 2021 (when he rejoined to the Company) through October 2005;December 2021; Senior Vice President and Chief Credit Officer from November 2017 through November 2019; Vice President and Senior Credit Analyst from September 2012 through November 2017; Assistant Vice President and Commercial LenderServices Officer from February 2003September 2011 to September 2012; Assistant Vice President and Credit Analyst from January 2010 through June 2005.September 2012; Began working for State Bank in May 1996.October 2007 as a Credit Analyst; left the Company in November 2019. Prior to rejoining the Company in September 2021, he worked as President for K&P Medical Transport, LLC. 24 Keeta J. Diller 65 David A. Homoelle 54 Columbus Regional President and Residential Real Estate Executive since May 2021; Columbus Regional President from November 2007 through May 2021. Began working for State Bank in November 2007 as a Columbus Regional President. Item 5.Market for Registrant’s Common Equity, Related Stockholder Matters and Issuer Purchases of Equity SecuritiesItem 5. Market for Registrant’s Common Equity, Related Stockholder Matters and Issuer Purchases of Equity Securities. 4,792,6466,884,330 common shares outstanding as of December 31, 2017,2021, which were held by approximately 1,4001,203 record holders. Our depositary shares, representing a 1/100th interest in our Series A Preferred Shares, are tradedthe NASDAQ Capital Market under the symbol “SBFGP” and there were 1,500,000 depositary shares outstanding as of December 31, 2017. The Series A Preferred Shares (and, therefore, depositary shares) are convertible into common shares at the election of the holder. The conversion ratio is calculated based upon a current common share conversion price of $10.25 per common share, which may be adjusted due to certain events. On or after the fifth anniversary of the issue date of the Series A Preferred Shares (December 23, 2019), the Company may require all holders of Series A Preferred Shares (and, therefore, depositary shares) to convert their shares into common shares of the Company provided the Company’s common share price exceeds 120 percent of the then applicable conversion price ($12.30, based on the current conversion price of $10.25). At December 31, 2017, the aggregate number of common shares issuable upon the conversion of outstanding Series A Preferred Shares (and, therefore, depositary shares) was 1,463,220. On February 9, 2018, the Company closed a common capital raise (see Note 20), pursuant to which the Company issued and sold an aggregate of 1,666,666its common shares in a public offering.The following table presents quarterly market price information and cash dividends paidthe aggregate amounts of $0.44 per share forand $0.40 per share in 2021 and 2020, respectively. The Company presently anticipates continuing to pay quarterly dividends in the future at similar levels. However, there is no guarantee that dividends on our common shares for 2017 and 2016: Year Ending December 31, 2017 December 31, 2016 Quarter ended: High Low Dividend High Low Dividend March 31 $ 20.75 $ 14.44 $ 0.065 $ 11.20 $ 9.74 $ 0.055 June 30 17.85 16.15 0.070 11.26 10.15 0.060 September 30 17.84 15.61 0.070 13.04 10.64 0.060 December 31 18.49 16.60 0.075 18.44 12.35 0.065 25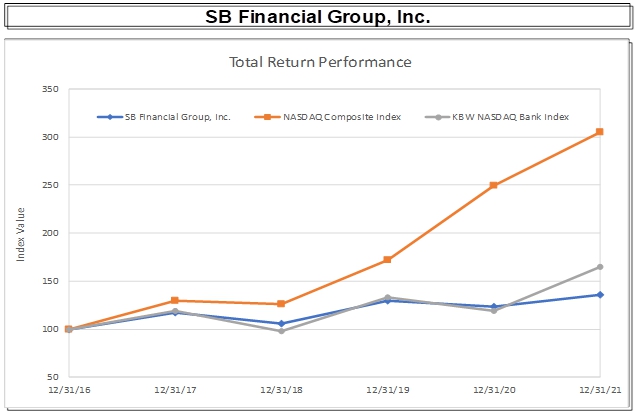
Period Ending Index 12/31/16 12/31/17 12/31/18 12/31/19 12/31/20 12/31/21 SB Financial Group, Inc. 100.00 117.09 105.96 129.49 123.36 135.95 NASDAQ Composite Index 100.00 129.64 125.96 172.18 249.51 304.85 KBW NASDAQ Bank Index 100.00 118.59 97.58 132.84 119.14 164.80 
Period Ending Index 12/31/12 12/31/13 12/31/14 12/31/15 12/31/16 12/31/17 SB Financial Group, Inc. 100.00 122.78 149.24 180.23 265.30 310.54 NASDAQ Composite Index 100.00 140.12 160.78 171.97 187.22 242.71 SNL U.S. Bank NASDAQ Index 100.00 143.73 148.86 160.70 222.81 234.58 Source : SNL Financial LC, Charlottesville, VA20172022www.snl.comfollowing table provides information regarding SB Financial’s purchases of itsbelow reflects the common shares repurchased by the Company during the three months ended December 31, 2017. The2021. As of December 31, 2021, the Company had 495,639 shares remaining of the 750,000 approved under the Company’s existing share repurchase program thatwhich was adopted inauthorized on May of 2016 has expired. Total Number of Shares Average Price Period Purchased Paid per Share December 2017 - $ - November 2017 400 $ 17.25 October 2017 - $ - Period (a)
Total Number of
Shares Purchased (b)
Weighted Average
Price Paid per
Share (c)
Total Number of
Shares Purchased
as Part of Publicly
Announced Plans
or Programs (d)
Maximum Number
of Shares that May
Yet be Purchased
Under the Plans or
Programs 10/01/21 - 10/31/21 16,926 $ 18.36 16,926 522,332 11/01/21 - 11/30/21 9,316 19.02 9,316 513,016 12/01/21 - 12/31/21 17,377 19.05 17,377 495,639 Totals 43,619 $ 18.78 43,619 495,639 26Item 6.[Reserved]. Item 6. Selected Financial Data.Financial HighlightsYear Ended December 31($ in thousands except per share data) 2017 2016 2015 2014 2013 EARNINGS Interest income $ 32,480 $ 29,051 $ 25,927 $ 24,408 $ 24,848 Interest expense 4,094 3,198 2,584 3,480 4,035 Net interest income 28,386 25,853 23,343 20,928 20,813 Provision for loan losses 400 750 1,100 450 900 Noninterest income 17,217 17,889 15,707 12,827 14,046 Noninterest expense 31,578 30,091 26,927 25,957 26,511 Provision for income taxes 2,560 4,117 3,404 2,085 2,243 Net income 11,065 8,784 7,619 5,263 5,205 Preferred stock dividends 975 975 956 - - Net income available to common 10,090 7,809 6,663 5,263 5,205 PER COMMON SHARE DATA Basic earnings $ 2.10 $ 1.60 $ 1.36 $ 1.08 $ 1.07 Diluted earnings 1.74 1.38 1.19 1.07 1.07 Cash dividends declared 0.28 0.24 0.20 0.16 0.12 Total equity per share 15.03 13.75 12.81 11.96 11.55 Total tangible equity per share 13.27 11.59 10.39 9.24 8.06 AVERAGE BALANCES Average total assets $ 854,569 $ 789,045 $ 719,586 $ 672,277 $ 639,920 Average equity 89,538 84,540 78,618 60,186 54,700 RATIOS Return on average total assets 1.29 % 1.11 % 1.06 % 0.78 % 0.81 % Return on average equity 12.36 10.39 9.69 8.74 9.52 Cash dividend payout ratio* 13.50 15.11 14.71 14.81 11.21 Average equity to average assets 10.48 10.71 10.93 8.95 8.55 PERIOD END TOTALS Total assets $ 876,627 $ 816,005 $ 733,071 $ 684,228 $ 631,754 Total investments; fed funds sold 82,790 90,128 89,789 85,240 89,793 Total loans & leases 696,615 644,433 557,659 516,336 477,303 Loans held for sale 3,940 4,434 7,516 5,168 3,366 Allowance for loan losses 7,930 7,725 6,990 6,771 6,964 Total deposits 729,600 673,073 586,453 550,906 518,234 Notes payable - - - - 589 Advances from FHLB 18,500 26,500 35,000 30,000 16,000 Trust preferred securities 10,310 10,310 10,310 10,310 20,620 Total equity 94,000 86,548 81,241 75,683 56,269 * Cash dividends on common shares divided by net income available to common27Item 7.Management’s Discussion and Analysis of Financial Condition and Results of Operations. Item 7. Management’s Discussion and Analysis of Financial Condition and Results of Operations.bankfinancial holding company registered with the Federal Reserve Board and subject to regulation under the Bank Holding Company Act of 1956, as amended. Through its direct and indirect subsidiaries, SB Financial is engaged in commercial and retail banking, wealth management and private client financial services and computerized item and statement processing.services.2017, 20162021 and 2015.2020.2017,2021, the Company generated $17.2$30.7 million in revenue from “fee based” products,noninterest income, or 37.844.8 percent of total operating revenue.revenue, from fee-based products. These revenue sources include fees generated from saleable residential mortgage loans, retail deposit products, wealth management services, saleable business-based loans (small business and farm service) and fees generated by our wholly-owned item processing subsidiary. For the twelve months ended December 31, 2016, the Company generated $17.9 million in revenue from “fee based” products, or 40.9 percent of total operatingtitle agency revenue. For the twelve months ended December 31, 2015,2020, the Company generated $15.7$30.1 million in revenue from “fee based”fee-based products, or 40.245.6 percent of total operating revenue.114-year119-year history of continuous operation in Northwest Ohio, we have established a significant presence in our traditional markets in Defiance, Fulton, Paulding and Williams counties in Ohio. In our newer markets of Bowling Green, Columbus, Findlay, Toledo (Ohio) and Ft. Wayne (Indiana), our current market penetration is minimal but we believe our potential for growth is significant. During 2017, weWe have expanded and committed additional resources to our presence into Bowling Green, Ohio with a new banking center. During 2015, we expandedin the Findlay and Edgerton markets. We continue to seek to expand the presence and penetration in all of our presence into Columbus (Dublin), Ohio and Findlay, Ohio with new banking center openings.markets.2017,2021, we served 28,590 householdsoperated in ten counties in Northwest Ohio and provided 83,593 productsNortheast Indiana with 23 full service offices, 24 full service ATM’s and services to these households. Our strategy is to continue to expandfive loan production offices. Combined in the scopeten counties of our relationship with each household via our dynamic “on-boarding” process. Proactively identifying client needs is a key ingredientoperation, we command 4.47 percent of our value proposition. As of December 31, 2016, we served 27,368 households and provided 80,573 products and services to these households. As of December 31, 2015, we served 26,076 households and provided 76,847 products and services to these households.the deposit market share, which has steadily grown.2017,2021, the Company serviced 7,0518,614 residential mortgage loans with a principal balance of $994.9 million.$1.36 billion. As of December 31, 2016,2020, the Company serviced 6,4148,543 loans with a principal balance of $899.7 million. As of December 31, 2015, the Company serviced 5,632 loans with a principal balance of $772.5 million.$1.30 billion.2017,2021, the Company’s asset quality metrics were improved from the prior year.remained strong. Specifically, total nonperforming assets were $3.9$6.5 million, or 0.440.49 percent of total assets. Total delinquent loans at December 31, 20172021 were 0.420.46 percent of total loans. As of December 31, 2016,2020, the Company had total nonperforming assets of $5.3$7.3 million, or 0.650.58 percent of total assets. Total delinquent loans at December 31, 20162020 were 0.340.75 percent of total loans. AsDecember 31, 2015,these five strategies have enabled the Company hadto improve financial performance across a broad series of metrics. These metrics over the last five years are outlined in the following table. Specifically, the Company has increased total nonperforming assets of $8.4by $454.3 million, or 1.1552 percent. The growth has been on both sides of the balance sheet over the five year period, with loans growing $126.1 million or 18 percent and deposits growing $383.4 million or 52.6 percent.total assets. Total delinquent loans at December 31, 2015 were 1.09 percentequity and debt to the market on two separate occasions during the period, which has raised equity capital significantly and expanded liquidity for potential strategic expansion. Strategic expansion has occurred with the acquisition of total loans.a small community bank, the opening of three branch offices and the acquisition of two full service title agencies.28($ in thousands, except per share data) Earnings 2021 2020 2019 2018 2017 Interest income $ 41,904 $ 42,635 $ 44,400 $ 39,479 $ 32,480 Interest expense 4,020 6,705 9,574 6,212 4,094 Net interest income 37,884 35,930 34,826 33,267 28,386 Provision for loan losses 1,050 4,500 800 600 400 Noninterest income 30,697 30,096 18,016 16,624 17,217 Noninterest expense 44,808 43,087 37,410 34,847 31,578 Provision for income taxes 4,446 3,495 2,659 2,806 2,560 Net income 18,277 14,944 11,973 11,638 11,065 Preferred stock dividends - - 950 975 975 Net income available to common shareholders 18,277 14,944 11,023 10,663 10,090 Per Common Share Data Basic earnings $ 2.58 $ 1.96 $ 1.71 $ 1.72 $ 2.10 Diluted earnings 2.56 1.96 1.51 1.51 1.74 Cash dividends declared 0.44 0.40 0.36 0.32 0.28 Total equity per share 21.05 19.39 17.53 16.36 15.03 Total tangible equity per share 17.60 16.30 15.23 15.39 13.27 Average Balances Average total assets $ 1,322,253 $ 1,161,396 $ 1,027,932 $ 947,266 $ 854,569 Average equity 144,223 139,197 133,190 121,094 89,538 Ratios Return on average total assets 1.38 % 1.29 % 1.16 % 1.23 % 1.29 % Return on average equity 12.67 10.74 8.99 9.61 12.36 Cash dividend payout ratio1 17.18 20.54 23.84 19.60 13.50 Average equity to average assets 10.91 11.99 12.96 12.78 10.48 Period End Totals Total assets $ 1,330,854 $ 1,257,839 $ 1,038,577 $ 986,828 $ 876,627 Available-for-sale securities 263,259 149,406 100,948 90,969 82,790 Loans held for sale 7,472 7,234 7,258 4,445 3,940 Total loans & leases 822,714 872,723 825,510 771,883 696,615 Allowance for loan losses 13,805 12,574 8,755 8,167 7,930 Total deposits 1,113,045 1,049,011 840,219 802,552 729,600 Advances from FHLB 5,500 8,000 16,000 16,000 18,500 Trust preferred securities 10,310 10,310 10,310 10,310 10,310 Subordinated debt, net 19,546 - - - - Total equity 144,929 142,923 136,094 130,435 94,000 1 Cash dividends on common shares divided by net income available to common. consolidated financial statementsConsolidated Financial Statements for the years ended December 31, 2017, 20162021 and 2015.2020. The preparation of financial statements in conformity with generally accepted accounting principles requires management to make estimates and assumptions. The Company’s financial position and results of operations can be affected by these estimates and assumptions and are integral to the understanding of reported results. Critical accounting policies are those policies that management believes are the most important to the portrayal of the Company’s financial condition and results, and they require management to make estimates that are difficult, subjective or complex.charge-offs.charge offs.utilizedrealized in the future. The Company’s most recent evaluation has determined that the Company will more likely than not be able to utilizerealize the remaining deferred tax liability.29ourthe deferred tax assets and liabilities is recognized as income or expense in the period that includes the enactment date.2017,2021, were $876.6 million,$1.33 billion, compared to $816.0 million$1.26 billion at December 31, 2016.2020. Loans (excluding loans held for sale) were $696.6$822.7 million at December 31, 2017,2021, compared to $644.4$872.7 million at December 31, 2016.2020. Total deposits were $729.6 million$1.11 billion at December 31, 2017,2021, compared to $673.1 million$1.05 billion at December 31, 2016.2020. The Company continued to experience elevated levels of liquidity as the balance sheets of both personal and business clients were supplemented by government intervention and support. The increase in liquidity by these parties has resulted in higher deposit levels, which in turn increased the overall asset size of the Company. 2021 2020 2019 Average Average Average Average Average Average ($ in thousands) Balance Interest Rate Balance Interest Rate Balance Interest Rate Assets Taxable securities/cash $ 380,770 $ 3,386 0.89 % $ 185,480 $ 2,328 1.26 % $ 95,216 $ 3,226 3.39 % Non-taxable securities 7,802 353 4.52 % 6,625 333 5.03 % 10,108 345 3.41 % Loans, net1 854,521 38,165 4.47 % 880,338 39,974 4.54 % 809,651 40,829 5.04 % Total earning assets 1,243,093 41,904 3.37 % 1,072,443 42,635 3.98 % 914,975 44,400 4.85 % Cash and due from banks 7,290 14,553 47,135 Allowance for loan losses (13,422 ) (10,165 ) (8,370 ) Premises and equipment 24,710 23,776 23,779 Other assets 60,582 60,789 50,413 Total assets $ 1,322,253 $ 1,161,396 $ 1,027,932 Liabilities Savings and interest-bearing demand deposits $ 672,296 $ 1,813 0.27 % $ 492,267 $ 3,152 0.64 % $ 427,858 $ 2,846 0.67 % Time deposits 177,918 1,316 0.74 % 247,955 2,918 1.18 % 262,040 5,814 2.22 % Repurchase agreements & other 22,821 42 0.18 % 22,832 70 0.31 % 15,288 82 0.54 % Advances from FHLB 6,507 188 2.89 % 14,186 309 2.18 % 16,066 402 2.50 % Trust preferred securities 10,310 199 1.93 % 10,310 256 2.48 % 10,310 430 4.17 % Subordianted debt 12,057 462 3.83 % Total interest-bearing liabilities 901,909 4,020 0.45 % 787,550 6,705 0.85 % 731,562 9,574 1.31 % Demand deposits 255,908 211,004 146,401 Other liabilities 20,213 23,645 16,779 Total liabilities 1,178,030 1,022,199 894,742 Shareholders’ equity 144,223 139,197 133,190 Total liabilities and shareholders’ equity $ 1,322,253 $ 1,161,396 $ 1,027,932 Net interest income (tax equivalent basis) $ 37,884 $ 35,930 $ 34,826 Net interest income as a percent of average interest-earning assets - GAAP measure 3.05 % 3.35 % 3.81 % Net interest income as a percent of average interest-earning assets - Non-GAAP measure 2 3.06 % 3.36 % 3.82 % -- Computed on a fully tax equivalent basis (FTE) Total equity was $94.01 Nonaccruing loans and loans held for sale are included in the average balances. 2 Interest on tax exempt securities and loans is computed on a tax equivalent basis using a 21 percent statutory tax rate, and added to the net interest income. The tax equivalent adjustment was $0.15, $0.15 and $0.17 million in 2021, 2020 and 2019, respectively. ● Volume variance - change in volume multiplied by the previous year’s rate. ● Rate variance - change in rate multiplied by the previous year’s volume. ● Rate/volume variance - change in volume multiplied by the change in rate. This variance allocates the volume variance and rate variance in proportion to the relationship of the absolute dollar amount of the change in each. Total Variance Variance Attributable To ($ in thousands) 2021/2020 Volume Rate Interest income Taxable securities $ 1,058 $ 2,451 $ (1,393 ) Non-taxable securities1 20 59 (39 ) Loans, net of unearned income and deferred fees1 (1,809 ) (1,172 ) (637 ) Total interest income (731 ) 1,338 (2,069 ) Interest expense Savings and interest-bearing demand deposits (1,339 ) 1,153 (2,492 ) Time deposits (1,602 ) (824 ) (778 ) Repurchase agreements & other (28 ) (0 ) (28 ) Advances from FHLB (121 ) (167 ) 46 Trust preferred securities (57 ) - (57 ) Subordinated debt 462 462 - Total interest expense (2,685 ) 623 (3,308 ) Net interest income $ 1,954 $ 715 $ 1,239 1 Interest on non-taxable securities and loans has been adjusted to fully tax equivalent 2017, up from $86.52021, are set forth in the table below. The weighted-average interest rates are based on coupon rates for securities purchased at par value and on effective interest rates considering amortization or accretion if the securities were purchased at a premium or discount: Maturing ($ in thousands) Within
1 Year Weighted
Average
Yield 1-5 Years Weighted
Average
Yield 5-10 Years Weighted
Average
Yield After
10 Years Weighted
Average
Yield Total Weighted
Average
Yield Available for sale: U.S. Treasury and Government agencies $ 606 0.44 % $ 707 2.13 % $ 7,792 2.02 % $ - $ 9,105 1.92 % Mortgage-backed securities 63 1.93 % 1,668 3.01 % 31,293 1.49 % 195,110 1.36 % 228,134 1.39 % State and political subdivisions - 2,065 3.21 % 2,473 4.28 % 8,341 2.64 % 12,879 3.04 % Other corporate securities - - 13,141 3.47 % - 13,141 3.47 % Total securities by maturity $ 669 0.58 % $ 4,440 2.96 % $ 54,699 2.17 % $ 203,451 1.41 % $ 263,259 1.59 % 1 Yields are presented on a tax-equivalent basis. at December 31, 2016.in deposits and $15 million in loans. Building on the success of our entry into the city of Edon, we opened an office in nearby Edgerton, Ohio in May of 2021. The $7.5Edgerton expansion has also been positive as we ended the year with over $15 million increase in equity, which reflected an 8.6 percent increase over 2016, was a result of net income less commonboth loans and preferred dividends of $2.3 million.deposits in that office.($ in thousands) Years Ended December 31, 2021 2020 % Change Total loans Commercial business & agriculture $ 179,653 $ 260,002 -30.9 % Commercial real estate 381,168 370,820 2.8 % Residential real estate 206,424 182,165 13.3 % Consumer & other 55,156 61,157 -9.8 % Total loans 822,401 874,144 -5.9 % Net deferred costs (fees) 313 (1,421 ) -122.0 % Total loans, net deferred costs (fees) 822,714 872,723 -5.7 % Loans held for sale $ 7,472 $ 7,234 3.3 % Year Ended December 31, ($ in thousands) 2017 2016 % Change Total Loans Commercial $ 102,041 $ 109,087 (6.5 %) Commercial real estate 332,154 284,084 16.9 % Agricultural 51,947 52,475 (1.0 %) Residential real estate 150,854 142,452 5.9 % Consumer & other 59,619 56,335 5.8 % Total loans, net of unearned income $ 696,615 $ 644,433 8.1 % Total loans, held for sale $ 3,940 $ 4,434 (11.1 %) 2017 2016 % Change Total Deposits Noninterest bearing demand $ 135,592 $ 125,189 8.3 % Interest bearing demand 131,079 131,598 (0.4 %) Savings & money market 245,111 218,570 12.1 % Time deposits 217,818 197,716 10.2 % Total deposits $ 729,600 $ 673,073 8.4 % Total Shareholder’s Equity $ 94,000 $ 86,548 8.6 % 2021 2020 % Change Total deposits Noninterest bearing demand $ 247,044 $ 251,649 -1.8 % Interest-bearing demand 195,464 176,785 10.6 % Savings & money market 514,033 391,028 31.5 % Time deposits 156,504 229,549 -31.8 % Total deposits 1,113,045 1,049,011 6.1 % Total shareholders’ equity $ 144,929 $ 142,923 1.4 % increased $52.2decreased $50.0 million, or 8.15.7 percent, to $696.6$822.7 million at December 31, 2017.2021, which was due to a decrease in outstanding PPP loans during 2021. The largest componentCompany participated fully in the PPP initiative in both 2020 and 2021, which in total, encompassed 1,100 loans with an aggregate principal amount of this increase$111.4 million. At year-end 2021, the balance of PPP was down to approximately 50 loans, with an aggregate principal amount of $2 million, as a result of SBA forgiveness of a majority of the PPP loans that we originated. Adjusted for PPP activity, loan growth compared to 2020 was up $18.5 million, or 2.3 percent. In the first quarter of 2021, the Company introduced a Private Client Residential Mortgage product. This product, of which $76 million was originated during 2021, offset the refinance activity that occurred in our portfolio during the year.which rose $48.1 million, followedaccounted for approximately 42.5 percent of the HFI loan portfolio. Residential first mortgage loans made up approximately 20.9 percent of the HFI loan portfolio and are secured by first mortgages on residential real estate, which rose $8.4 million.while consumer loans to individuals made up approximately 7.0 percent of the HFI loan portfolio and are primarily secured by consumer assets.($ in thousands) Within
one year After one,
but within After five,
but within
fifteen years After
fifteen years Total Loans with fixed interest rates: Commercial & industrial $ 981 $ 20,715 $ 28,106 $ 23 $ 49,825 Commercial real estate - owner occupied 168 9,567 10,302 - 35,051 Commercial real estate - nonowner occupied 6,828 14,246 13,815 162 20,037 Agricultural 122 4,094 5,557 1,362 11,135 Residential real estate 1,615 1,915 12,774 25,328 41,632 HELOC 5 - - - 5 Consumer 2,416 6,364 2,380 - 11,160 Total $ 12,135 $ 56,901 $ 72,934 $ 26,875 $ 168,845 Loans with floating interest rates: Commercial & industrial $ 28,754 $ 6,213 $ 35,464 $ 1,994 $ 72,425 Commercial real estate - owner occupied - 11,109 44,565 43,180 227,226 Commercial real estate - nonowner occupied 8,739 26,514 120,819 71,154 98,854 Agricultural 1,646 7,846 16,670 20,106 46,268 Residential real estate 4,558 485 13,294 146,455 164,792 HELOC 223 469 30,487 10,498 41,677 Consumer 990 1,324 - - 2,314 Total $ 44,910 $ 53,960 $ 261,299 $ 293,387 $ 653,556 Total loans: Commercial & industrial $ 29,735 $ 26,928 $ 63,570 $ 2,017 $ 122,250 Commercial real estate - owner occupied 168 20,676 54,867 43,180 118,891 Commercial real estate - nonowner occupied 15,567 40,760 134,634 71,316 262,277 Agricultural 1,768 11,940 22,227 21,468 57,403 Residential real estate 6,173 2,400 26,068 171,783 206,424 HELOC 228 469 30,487 10,498 41,682 Consumer 3,406 7,688 2,380 - 13,474 Total loans $ 57,045 $ 110,861 $ 334,233 $ 320,262 $ 822,401 $56.5$64.0 million, or 8.46.1 percent, to $729.6 million$1.11 billion at December 31, 2017. Deposit2021. Deposits continued growing in 2021 on top of the over $200 million in growth experienced during 2020. Expanded government support and reduced economic activity has resulted in higher balances in client deposit accounts. During 2021, we experienced a shift in the mix of our deposit balances as more of our clients moved balances to short-term transactional accounts. Specifically, during 2021, time deposits decreased $73.0 million or 32 percent while other deposits increased $137.1 million or 17 percent.year included $10.4 million in noninterest demand deposits and $26.5 million in savings and money market deposits.years ended December 31: 2021 2020 2019 Average Average Average Average Average Average ($ in thousands) Amount Rate Amount Rate Amount Rate Savings and interest bearing demand deposits $ 672,296 0.27 % $ 492,267 0.64 % $ 427,858 0.67 % Time deposits 177,918 0.74 % 247,955 1.18 % 262,040 2.22 % Non interest bearing demand deposits 255,908 - 211,004 - 146,401 - Totals $ 1,106,122 0.28 % $ 951,226 0.64 % $ 836,299 1.04 % 30($ in thousands) 2021 2020 Three months or less $ 1,033 $ 811 Over three months through six months 415 4,894 Over six months and through twelve months 3,083 1,658 Over twelve months 238 2,640 Total $ 4,769 $ 10,003 2017,2021, was $94.0$144.9 million or 10.710.9 percent of total assets compared to $86.5$142.9 million or 10.611.4 percent of total assets at December 31, 2016.2020. Retained earnings increased during the year by $15.1 million due to earnings of $18.3 million less dividends paid to common shareholders of $3.2 million. The fair market value of the bond portfolio decreased during 2021 due to the rise in interest rates, which resulted in a decrease in Other Comprehensive Income (“OCI”) of $4.1 million.Asset Quality Year Ended December 31, ($ in thousands) 2017 2016 % Change Nonaccruing loans $ 2,704 $ 2,737 (1.2 %) Accruing restructured loans (TDRs) 1,129 1,590 (29.0 %) OREO & repossessed assets 26 994 (97.4 %) Nonperforming assets 3,859 5,321 (27.5 %) Net charge offs 196 15 1206.7 % Loan loss provision 400 750 (46.7 %) Allowance for loan losses 7,930 7,725 2.7 % Nonperforming assets/total assets 0.44 % 0.65 % (32.5 %) Net charge offs/average loans 0.03 % 0.00 % N/M Allowance/loans 1.14 % 1.20 % (5.0 %) Allowance/nonperforming loans 206.89 % 178.53 % 15.9 % Asset Quality Years Ended December 31, ($ in thousands) 2021 2020 % Change Nonaccruing loans $ 3,652 $ 6,426 -43.2 % Accruing restructured loans (TDRs) 725 810 -10.5 % Foreclosed assets and other assets held for sale, net 2,104 23 9047.8 % Nonperforming assets 6,481 7,259 -10.7 % Net charge offs (recoveries) (181 ) 681 -126.6 % Loan loss provision 1,050 4,500 -76.7 % Allowance for loan losses 13,805 12,574 9.8 % Nonaccruing loans/total loans 0.44 % 0.74 % -39.7 % Allowance/nonaccruing loans 378.01 % 195.67 % 93.2 % Nonperforming assets/total assets 0.49 % 0.58 % -15.6 % Net charge offs/average loans -0.02 % 0.08 % -125.0 % Allowance/loans 1.68 % 1.44 % 16.5 % Allowance/nonperforming loans 315.40 % 173.80 % 81.5 % (OREO)(“OREO”) and accruing TDRs totaled $3.9$6.5 million, or 0.440.49 percent of total assets at December 31, 2017,2021, a decrease of $1.4$0.8 million or 27.510.7 percent from 2016.2020. Net charge offs were updown significantly during 2017, at $0.202021, with total recoveries of $0.18 million, which was a $0.18$0.86 million increasedecrease compared to 2016.total charge offs of $0.68 million for 2020. The Company’s loan loss allowance at December 31, 2017,2021, now covers nonperforming loans at 207315 percent, up from 179174 percent at December 31, 2016.2020.($ in thousands) Provision for
Loan Loss Net (Chargeoffs)
Recoveries Average
Loans Ratio of annualized net
(chargeoffs)
recoveries to
average loans December 31, 2021 Commercial & industrial $ (1,411 ) $ 227 $ 160,267 0.14 % Commercial real estate - owner occupied 505 - 118,713 0.00 % Commercial real estate - nonowner occupied 825 - 264,980 0.00 % Agricultural 103 - 53,122 0.00 % Residential real estate 975 6 195,277 0.00 % HELOC (16 ) - 43,488 0.00 % Consumer 69 (52 ) 11,546 -0.45 % Total $ 1,050 $ 181 $ 847,393 0.02 % December 31, 2020 Commercial & industrial $ 1,757 $ (566 ) $ 198,991 -0.28 % Commercial real estate - owner occupied 721 - 104,856 0.00 % Commercial real estate - nonowner occupied 1,128 - 269,924 0.00 % Agricultural 62 - 51,840 0.00 % Residential real estate 373 (42 ) 185,311 -0.02 % HELOC 203 (8 ) 47,227 -0.02 % Consumer 256 (65 ) 11,595 -0.56 % Total $ 4,500 $ (681 ) $ 869,744 -0.08 % December 31, 2019 Commercial & industrial $ 582 $ (134 ) $ 139,616 -0.10 % Commercial real estate - owner occupied 210 - 96,106 0.00 % Commercial real estate - nonowner occupied 468 1 257,756 0.00 % Agricultural (48 ) - 51,836 0.00 % Residential real estate (325 ) (39 ) 194,390 -0.02 % HELOC (102 ) 10 47,770 0.02 % Consumer 15 (50 ) 11,862 -0.42 % Total loans $ 800 $ (212 ) $ 799,336 -0.03 % Allowance
Amount Percentage
of Loans In
Each
Category to
Total Loans Allowance
Amount Percentage
of Loans In
Each
Category to
Total Loans Allowance
Amount Percentage
of Loans In
Each
Category to
Total Loans ($ in thousands) 2021 2020 2019 Commercial & industrial $ 1,890 14.9 % $ 3,074 23.4 % $ 1,883 18.3 % Commercial real estate - owner occupied 2,588 14.5 % 2,059 12.9 % 1,220 11.9 % Commercial real estate - nonowner occupied 4,193 31.9 % 3,392 29.5 % 2,382 32.5 % Agricultural 599 7.0 % 496 6.3 % 434 6.2 % Residential real estate 3,515 25.1 % 2,534 20.8 % 2,203 23.4 % Home equity line of credit (HELOC) 631 5.1 % 647 5.3 % 454 5.8 % Consumer 389 1.6 % 372 1.7 % 179 1.8 % $ 13,805 100.0 % $ 12,574 100.0 % $ 8,755 100.0 % nowcurrently exempt from quarterly regulatory capital level measurement.measurement pursuant to the Small Bank Holding Company Policy Statement. As of December 31, 2017,2021, State Bank met all regulatory capital levels required to be considered well-capitalized (See(see Note 1318 to the Consolidated Financial Statements).20172021 vs. 2016202020172021 was $11.1 million, and net income available to common shareholders was $10.1$18.3 million, or $1.74$2.56 per diluted share, compared with net income of $8.8$14.9 million, or $1.96 per diluted share, for 2020. State Bank reported net income for 2021 of $18.6 million, which was up from the $16.0 million in net income in 2020. SBFG Title reported net income for 2020 of $0.5 million, which was down from net income of $0.6 million in 2020. Years Ended December 31, ($ in thousands, except per share data) 2021 2020 % Change Total assets $ 1,330,854 $ 1,257,839 5.8 % Total investments 263,259 149,406 76.2 % Loans held for sale 7,472 7,234 3.3 % Loans, net of unearned income 822,714 872,723 -5.7 % Allowance for loan losses 13,805 12,574 9.8 % Total deposits 1,113,045 1,049,011 6.1 % Total operating revenue1 $ 68,581 $ 66,026 3.9 % Net interest income 37,884 35,930 5.4 % Loan loss provision 1,050 4,500 -76.7 % Noninterest income 30,697 30,096 2.0 % Noninterest expense 44,808 43,087 4.0 % Net income 18,277 14,944 22.3 % Diluted earnings per share 2.56 1.96 30.6 % 1 Operating revenue equals net interest income plus noninterest income. Noninterest Income Years Ended December 31, ($ in thousands) 2021 2020 % Change Wealth management fees $ 3,814 $ 3,245 17.5 % Customer service fees 3,217 2,807 14.6 % Gains on sale of residential loans & OMSR’s 17,255 25,350 -31.9 % Mortgage loan servicing fees, net 2,940 (5,138 ) 157.2 % Gain on sale of non-mortgage loans 158 453 -65.1 % Title Insurance income 2,089 1,913 9.2 % Other 1,224 1,466 -16.5 % Total noninterest income $ 30,697 $ 30,096 2.0 % Noninterest Expense Years Ended December 31, ($ in thousands) 2021 2020 % Change Salaries & employee benefits $ 26,838 $ 25,397 5.7 % Net occupancy expense 3,048 2,891 5.4 % Equipment expense 3,281 3,186 3.0 % Data processing fees 2,579 3,055 -15.6 % Professional fees 3,027 3,307 -8.5 % Marketing expense 784 658 19.1 % Telephone and communications 581 535 8.6 % Postage and delivery expense 414 415 -0.2 % State, local and other taxes 1,175 1,146 2.5 % Employee expense 663 535 23.9 % Other expense 2,418 1,962 23.2 % Total noninterest expense $ 44,808 $ 43,087 4.0 % $7.8$11.0 million, or $1.38$1.51 per diluted share, for 2016. The Company’s 2017 results included a $1.7 million one-time reduction in tax expense due to the recently enacted TCJA.2019. State Bank reported net income for 20172020 of $12.3$16.0 million, which was up from the $9.7$12.5 million in net income in 2016. RDSI2020. SBFG Title reported a net lossincome for 20172020 of $0.2$0.6 million, compared to a net loss of $0.08which was up from the $0.3 million reported for 2016.in 2019.20172020 included loan growth of $52.2$47.2 million, and deposit growth of $56.5$208.8 million. The mortgage banking business line continues to contribute significant revenues, with residential real estate loan production of $315.8$694.2 million for the year, resulting in $7.1 million of revenue from gains on sale. The level of mortgage origination was down from the $382.8 million in 2016. The Company’s loans serviced for others ended the year at $994.9 million, up from $899.7 million at December 31, 2016.Operating revenue was up compared to the prior year by $1.9 million, or 4.3 percent, due to SBA gains, wealth management Income and $52.2 million in balance sheet loan growth. Net interest margin on a tax equivalent basis (FTE) for 2017 was 3.78 percent, up 3 basis points from 2016.Operating expense was up compared to the prior year by $1.50 million, or 4.90 percent, due to fringe benefit cost increases and higher staffing levels. Net charge offs for 2017 of $0.20 million resulted in a loan loss provision of $0.40 million, which was down from the $0.02 million and $0.75 million respectively in 2016.31Results of Operations Year Ended December 31, ($ in thousands except per share data) 2017 2016 % Change Total assets $ 876,627 $ 816,005 7.4 % Total investments 82,790 90,128 (8.1 %) Loans held for sale 3,940 4,434 (11.1 %) Loans, net of unearned income 696,615 644,433 8.1 % Allowance for loan losses 7,930 7,725 2.7 % Total deposits 729,600 673,073 8.4 % Total operating revenue $ 45,603 $ 43,742 4.3 % Net interest income 28,386 25,853 9.8 % Loan loss provision 400 750 (46.7 %) Noninterest income 17,217 17,889 (3.8 %) Noninterest expense 31,578 30,091 4.9 % Net income 11,065 8,784 26.0 % Net income available to common shareholders 10,090 7,809 29.2 % Diluted earnings per share 1.74 1.38 26.2 % Net Interest Income Year Ended December 31, ($ in thousands) 2017 2016 % Change Net interest income $ 28,386 $ 25,853 9.8 % Net interest income was $28.4 million for 2017 compared to $25.9 million for 2016, an increase of $2.5 million or 9.8 percent. Average earning assets increased to $759.7 million in 2017, compared to $698.5 million in 2016, an increase of $61.1 million or 8.8 percent due to loan volume. The consolidated 2017 full year net interest margin (FTE) increased 3 basis points to 3.78 percent compared to 3.75 percent for the full year of 2016.Provision for Loan Losses of $0.40 million was taken in 2017 compared to $0.75 million taken for 2016. The $0.35 million decrease was due to the lower level of charge-offs and the improvement in the Company’s nonperforming asset levels. For 2017, net charge offs totaled $0.20 million, or 0.03 percent of average loans. This charge off level was higher than 2016, in which net charge-offs were $0.02 million or 0.00 percent of average loans.Noninterest Income Year Ended December 31, ($ in thousands) 2017 2016 % Change Wealth management fees $ 2,777 $ 2,628 5.7 % Customer service fees 2,671 2,705 (1.3 %) Gains on sale of mtg. loans & OMSR’s 7,132 8,172 (12.7 %) Mortgage loan servicing fees, net 1,316 810 62.5 % Gains on sale of non-mortgage loans 1,272 979 29.9 % Data service fees 738 917 (19.5 %) Gains on sale of securities 119 262 (54.6 %) Other 1,192 1,416 (15.8 %) Total noninterest income $ 17,217 $ 17,889 (3.8 %) 32Total noninterest income was $17.2 million for 2017 compared to $17.9 million for 2016, representing a $0.7 million, or 3.8 percent, decrease year-over-year. This decrease, driven by a 13 percent decrease in gains on sale of residential real estate loans offset by other mortgage banking fee income (primarily due to higher servicing income), SBA gains (up 30% due to higher volume) and higher wealth management fee income (assets under management increased 14%). The Company sold $261.3 million of originated mortgages into the secondary market, which allowed our serviced loan portfolio to grow to $994.9 million at December 31, 2017 from $899.7 million at December 31, 2016. Higher servicing income on the portfolio led to the 24 percent increase in mortgage loan serving income. Data servicing fees from RDSI continued to decline, and were down 19.5 percent in 2017, due to lower check processing volume and client losses. Other income decreased due to lower swap and commercial fee income.Noninterest Expense Year Ended December 31, ($ in thousands) 2017 2016 % Change Salaries & employee benefits 18,646 17,421 7.0 % Professional fees 1,774 1,426 24.4 % Occupancy & equipment expense 5,020 4,763 5.4 % Marketing expense 734 647 13.4 % All other 5,404 5,834 (7.4 %) Total noninterest expense $ 31,578 $ 30,091 4.9 % Total noninterest expense was $31.6 million for 2017 compared to $30.1 million for 2016, representing a $1.5 million, or 4.9 percent, increase year-over-year. Total full-time equivalent employees ended 2017 at 240, which was up 13 from year-end 2016.Salaries and benefits were driven by higher personnel and incentive costs from mortgage origination and support. We also added staffing in compliance and Commercial/SBA loan sales. Marketing costs were higher due to expanded campaigns and higher sales staff needing support. Our professional fees were higher due to greater regulatory requirements based on market capitalization thresholds and costs associated with the sale of the DCM division of RDSI.Earnings Summary – 2016 vs. 2015Net income for 2016 was $8.8 million, and net income available to common shareholders was $7.8 million or $1.38 per diluted share, compared with net income of $7.6 million and net income available to common of $6.7 million, or $1.19 per diluted share, for 2015. State Bank reported net income for 2016 of $9.7 million, which was up from the $8.4 million in net income in 2015. RDSI reported a net loss for 2016 of $0.08 million, compared to a net loss of $0.003 million reported for 2015.Positive results for 2016 included loan growth of $86.8 million, and deposit growth of $86.6 million. The mortgage banking business line continues to grow, with residential real estate loan production of $382.8 million for the year, resulting in $8.2$25.4 million of revenue from gains on sale. The level of mortgage origination was up from the $322.7$445.3 million in 2015.2019. The Company’s loans serviced for others ended the year at $899.7 million,$1.3 billion, up from $772.5 million$1.2 billion at December 31, 2015.2019. The Company realized over $1.4 million in revenue from the PPP initiative.$4.6$13.2 million, or 12.025.0 percent, due to higher mortgage volume, SBA gainswhich was impacted by a $3.6 million temporary OMSR impairment. Our 2020 results include the full year impact from SBFG Title with net income of $0.6 million, and $82.9 million in balance sheet loan growth.SB Captive, with net income of $0.9 million. Net interest margin on a fully tax equivalent basis (“FTE”) for 20162020 was 3.753.36 percent, down 346 basis pointpoints from 2015.2019.$3.2$5.7 million, or 11.815.2 percent, due to higher mortgage volumes,compensation and fringe benefit cost increases andas a result of higher staffingmortgage commission levels. Operating leverage (growth in revenue divided by growth in operating expense) for the year was a positive 1.6 times.20162020 of $0.15$0.68 million resulted in a loan loss provision of $0.8$4.5 million, which was down from the $0.9 million and $1.1 million respectively in 2015.33Results of Operations Year Ended December 31, ($ in thousands except per share data) 2016 2015 % Change Total assets $ 816,005 $ 733,071 11.3 % Total investments 90,128 89,789 0.4 % Loans held for sale 4,434 7,516 (41.0 %) Loans, net of unearned income 644,433 557,659 15.6 % Allowance for loan losses 7,725 6,990 10.5 % Total deposits 673,073 586,453 14.8 % Total operating revenue $ 43,742 $ 39,050 12.0 % Net interest income 25,853 23,343 10.8 % Loan loss provision 750 1,100 (31.8 %) Noninterest income 17,889 15,707 13.9 % Noninterest expense 30,091 26,927 11.8 % Net income 8,784 7,619 15.3 % Net income available to common shareholders 7,809 6,663 17.2 % Diluted earnings per share 1.38 1.19 16.1 % Net Interest Income Year Ended December 31, ($ in thousands) 2016 2015 % Change Net interest income $ 25,853 $ 23,343 10.8 % Net interest income was $25.9 million for 2016 compared to $23.3 million for 2015, an increase of $2.5 million or 10.8 percent. Average earning assets increased to $698.5 million in 2016, compared to $628.0 million in 2015, an increase of $70.5 million or 11.2 percent due to loan volume. The consolidated 2016 full year net interest margin decreased 3 basis points to 3.75 percent compared to 3.78 percent for the full year of 2015.Provision for Loan Losses of $0.75 million was taken in 2016 compared to $1.1 million taken for 2015. The $0.35 million decrease was due to the lower level of charge offs and the improvement in the Company’s nonperforming asset levels. For 2016, net charge offs totaled $0.02of $0.21 million or essentially 0.00 percent of average loans. This charge off level was higher than 2015,and a $0.8 million loan loss provision in which net charge offs were $0.9 million or 0.17 percent of average loans.2019.Noninterest Income Year Ended December 31, ($ in thousands) 2016 2015 % Change Wealth management fees $ 2,628 $ 2,606 0.8 % Customer service fees 2,705 2,779 (2.7 %) Gains on sale of mtg. loans & OMSR’s 8,172 6,264 30.5 % Mortgage loan servicing fees, net 810 1,025 (21.0 %) Gains on sale of non-mortgage loans 979 947 3.4 % Data service fees 917 1,190 (22.9 %) Gains on sale of securities 262 - 100.0 % Other 1,416 896 58.0 % Total noninterest income $ 17,889 $ 15,707 13.9 % 34Total noninterest income was $17.9 million for 2016 compared to $15.7 million for 2015, representing a $2.2 million, or 13.9 percent increase year-over-year. This increase was driven by a 30 percent increase in gains on sale of residential real estate loans and gains on securities sales and higher commercial fee income. The Company sold $337.4 million of originated mortgages into the secondary market, which allowed our serviced loan portfolio to grow to $899.7 million at December 31, 2016 from $772.5 million at December 31, 2015. Higher amortization of the servicing rights led to the 21 percent decline in mortgage loan serving income. Data servicing fees from RDSI continued to decline, and were down 22.9 percent in 2016, due to lower check processing volume and client losses. Other income increased due to gains on sales of securities and swap income.Noninterest Expense Year Ended December 31, ($ in thousands) 2016 2015 % Change Salaries & employee benefits 17,421 14,917 16.8 % Professional fees 1,426 1,663 (14.3 %) Occupancy & equipment expense 4,763 4,166 14.3 % Marketing expense 647 594 8.9 % All other 5,834 5,587 4.4 % Total noninterest expense $ 30,091 $ 26,927 11.8 % Total non-interest expense was $30.1 million for 2016 compared to $26.9 million for 2015, representing a $3.2 million, or 11.8 percent increase year-over-year. Total full-time equivalent employees (FTE) ended 2016 at 227, which was up 13 from year-end 2015.Salaries and benefits were driven by higher personnel and incentive costs from mortgage and SBA loan sales. Occupancy costs were higher as a result of the full year utilization of our Dublin and Findlay locations. Our professional fees were down due to lower legal expenses as OREO balances were down year-over-year.Purchases:Purchasestestreview as of December 31, 2017.2021. At December 31, 2017, the Company’s reporting unit had positive equity and2021, the Company elected to perform a qualitative assessment to determine if it was more likely than not that the fair value of the reporting unit exceeded its carrying value, including goodwill. The qualitative assessment indicatedconcluded that it was more likely than not that the fair value of the reporting unit exceeded its carrying value, resulting in no impairment. RDSI had no remainingThe Company’s goodwill as of December 31, 2017.is further discussed in Note 8 to the Consolidated Financial Statements.interest bearinginterest-bearing deposits in other financial institutions, securities available for sale,available-for-sale, loans held for sale and borrowings from various sources. These assets, excluding the borrowings, are commonly referred to as liquid assets. Liquid assets were $113.3$422.9 million at December 31, 2017,2021, compared to $111.6$303.2 million at December 31, 2016.2020.$535.0$645.1 million at December 31, 2017,2021, can and is readily used to collateralize borrowings, which is an additional source of liquidity. Management believes the Company’s current liquidity level, without these borrowings, is sufficient to meet its current and anticipated liquidity needs. At December 31, 2017,2021, all eligible commercial real estate, residential first, multi-family mortgage and agricultural loans were pledged under a Federal Home Loan Bank (FHLB)(“FHLB”) blanket lien.35$72.6$110.5 million of additional borrowing capacity existed at December 31, 2017.2021.20172021 and 2016,2020, the Company had $38.0 and $23.0$41.0 million in federal funds lines available, respectively.available. The Company also had $24.6$184.9 million in unpledged securities at December 31, 20172021 available for additional borrowings.2017, 20162021 and 20152020 follows:2017, 20162021 and 2015.2020. Net cash from operating activities was $9.8, $14.0$17.3 million and $8.6$23.9 million for the years ended December 31, 2017, 20162021 and 2015,2020, respectively. Significant operating items for 20172021 included gain on sale of loans of $8.4$17.4 million and net income of $11.1$18.3 million. Cash provided by the sale of loans held for sale were $259.1$490.6 million. Cash used in the origination of loans held for sale were $253.8$478.1 million.2017, 20162021 and 2015.2020. Net cash used in investing activities was $49.5, $90.7$72.0 million and $54.7$57.2 million for the years ended December 31, 2017, 20162021 and 2015,2020, respectively. The changes for 20172021 include the purchase of available-for-sale securities of $29.8$170.7 million, and net decrease in loans of $48.5 million. The changes for 2020 include the purchase of available-for-sale securities of $129.8 million and net increase in loans of $51.2 million. The changes for 2016 include the purchase of available-for-sale securities of $22.6 million and net increase in loans of $88.0 million. The changes for 2015 include the purchase of available-for-sale securities of $26.3 million and net increase in loans of $42.3$31.7 million. The Company had proceeds from repayments, maturities, sales and calls of securities of $36.5, $20.7$50.5 million and $20.3$84.0 million in 2017, 20162021 and 2015,2020, respectively. The Company purchased $3.0 million in bank owned life insurance in 2017 and had proceeds from life insurance contracts of $0.7 million.2017, 20162021 and 2015.2020. Net cash from financing activities was $49.3, $73.3$63.6 million and $38.3$146.9 million for the years ended December 31, 2017, 20162021 and 2015,2020, respectively. Positive $56.5, $86.6cash flows of $64.0 million and $35.5$157.7 million is attributable to the change in deposits for 2017, 20162021 and 2015,2020, respectively.36economic valueEconomic Value of equityEquity (“EVE”) analysis to measure risk in the balance sheet incorporating all cash flows over the estimated remaining life of all balance sheet positions. The EVE analysis calculates the net present value of the Company’s assets and liabilities in rate shock environments that range from -400-100 basis points to +400 basis points. The likelihood of a decrease in rates is remote given the current interest rate environment and therefore, only the minus 100 basis point rate change was included in the “EVE” analysis for 2017 and 2016. The results of this analysis isare reflected in the following table.December 31, 2017Economic Value of Equity($’s in thousands)Change in Rates $
Amount $
Change %
Change +400 basis points $ 182,859 $ 27,297 17.55 % +300 basis points 177,619 22,058 14.18 % +200 basis points 171,759 16,197 10.41 % +100 basis points 164,348 8,786 5.65 % Base Case 155,562 - - -100 basis points 145,678 (9,884 ) (6.35 %) December 31, 2016Economic Value of Equity($’s in thousands)Change in Rates $
Amount $
Change %
Change +400 basis points $ 169,809 $ 26,322 18.34 % +300 basis points 164,815 21,328 14.86 % +200 basis points 159,285 15,798 11.01 % +100 basis points 152,119 8,632 6.02 % Base Case 143,487 - - -100 basis points 134,175 (9,312 ) (6.49 %) Tabular Disclosure of Contractual ObligationsThe following table details the Company’s contractual obligations as of December 31, 2017, which were comprised of long-term debt obligations, other debt obligations, operating lease obligations and other long-term liabilities. Long-term debt obligations are comprised of FHLB Advances of $18.5 million. Other debt obligations are comprised of Trust Preferred securities of $10.3 million. The other long-term liabilities include time deposits of $217.8 million. Payment due by period ($ in thousands) Less than 1 - 3 3 - 5 More than Contractual Obligations Total 1 year years years 5 years Long-term Debt Obligations $ 18,500 $ 7,000 $ 11,500 $ - $ - Other Debt Obligations 10,310 - - - 10,310 Operating Lease Obligations 390 130 228 25 7 Other Long-Term Liabilities Reflected on the Registrant’s Balance Sheet under GAAP 217,818 104,176 92,915 20,235 492 Total $ 247,018 $ 111,306 $ 104,643 $ 20,260 $ 10,809 Economic Value of Equity December 31, 2021 ($ in thousands) Change in rates $ Amount $ Change % Change +400 basis points $ 278,254 $ 35,684 14.71 % +300 basis points 273,190 30,620 12.62 % +200 basis points 265,711 23,142 9.54 % +100 basis points 256,110 13,540 5.58 % Base Case 242,570 - - -100 basis points 217,281 (25,289 ) -10.43 % 37Economic Value of Equity December 31, 2020 ($ in thousands) Change in rates $ Amount $ Change % Change +400 basis points $ 243,779 $ 61,586 33.80 % +300 basis points 231,590 49,398 27.11 % +200 basis points 217,936 35,743 19.62 % +100 basis points 202,260 20,067 11.01 % Base Case 182,193 - - -100 basis points 154,509 (27,684 ) -15.19 % Item 7A. Quantitative and Qualitative Disclosures about Market Risk. available for sale)available-for-sale) which are primarily funded by interest-bearing liabilities (deposits and borrowings). With the exception of specific loans which are originated and held for sale, all of the financial instruments of the Company are for other than trading purposes. All of the Company’s transactions are denominated in U.S. dollars with no specific foreign exchange exposure. In addition, the Company has limited exposure to commodity prices related to agricultural loans. The impact of changes in foreign exchange rates and commodity prices on interest rates are assumed to be insignificant. The Company’s financial instruments have varying levels of sensitivity to changes in market interest rates resulting in market risk. Interest rate risk is the Company’s primary market risk exposure; to a lesser extent, liquidity risk also impacts market risk exposure.Federal Reserve BoardFRB together with the Office of the Comptroller of the CurrencyOCC and the Federal Deposit Insurance CorporationFDIC adopted a Joint Agency Policy Statement on interest rate risk effective June 26, 1996. The policy statement provides guidance to examiners and bankers on sound practices for managing interest rate risk, which will form the basis for ongoing evaluation of the adequacy of interest rate risk management at supervised institutions. The policy statement also outlines fundamental elements of sound management that have been identified in prior Federal Reserve guidance and discusses the importance of these elements in the context of managing interest rate risk. Specifically, the guidance emphasizes the need for active board of director and senior management oversight and a comprehensive risk management process that effectively identifies, measures and controls interest rate risk.20162021 and 20152020 the Company entered into interest rate swap agreements as an accommodation to certain loan customers (see Note 610 to the Consolidated Financial Statements). The Company may purchase such instruments in the future if market conditions are favorable.38The following table details quantitative disclosures of market risk and provides information about the Company’s financial instruments used for purposes other than trading that are sensitive to changes in interest rates as of December 31, 2017. The table does not present when these items may actually reprice. For loans receivable, securities, and liabilities with contractual maturities, the table presents principal cash flows and related weighted-average interest rates by contractual maturities as well as the historical impact of interest rate fluctuations on the prepayment of loans and mortgage backed securities. For core deposits (demand deposits, interest-bearing checking, savings, and money market deposits) that have no contractual maturity, the table presents principal cash flows and applicable related weighted-average interest rates based upon the Company’s historical experience, management’s judgment and statistical analysis, as applicable, concerning their most likely withdrawal behaviors. The current historical interest rates for core deposits have been assumed to apply for future periods in this table as the actual interest rates that will need to be paid to maintain these deposits are not currently known. Weighted average variable rates are based upon contractual rates existing at the reporting date.Principal/Notional Amount Maturing or Assumed to be Withdrawn in:($ in thousands) 2018 2019 2020 2021 2022 Thereafter Total Rate Sensitive Assets Variable Rate Loans $ 70,132 $ 27,659 $ 13,299 $ 8,124 $ 8,016 $ 43,996 $ 171,226 Average interest rate 4.77 % 4.58 % 4.73 % 4.58 % 4.38 % 4.31 % 4.59 % Adjustable Rate Loans $ 27,427 $ 22,149 $ 20,633 $ 22,686 $ 19,863 $ 195,978 $ 308,736 Average interest rate 4.45 % 4.52 % 4.28 % 4.25 % 4.34 % 4.19 % 4.25 % Fixed Rate Loans $ 34,778 $ 24,440 $ 26,459 $ 17,084 $ 30,223 $ 87,609 $ 220,593 Average interest rate 4.20 % 4.31 % 4.18 % 4.30 % 4.24 % 4.41 % 4.31 % Total Loans $ 132,337 $ 74,248 $ 60,391 $ 47,894 $ 58,102 $ 327,583 $ 700,555 Average interest rate 4.55 % 4.48 % 4.33 % 4.33 % 4.30 % 4.26 % 4.35 % Fixed rate investment securities $ 14,844 $ 13,178 $ 15,312 $ 7,040 $ 3,872 $ 24,098 $ 78,344 Average interest rate 1.54 % 2.27 % 1.86 % 2.07 % 1.98 % 2.75 % 2.17 % Variable rate investment securities $ 1,645 $ 441 $ 336 $ 329 $ 264 $ 5,179 $ 8,194 Average interest rate 2.71 % 3.06 % 2.69 % 2.66 % 2.52 % 2.54 % 2.61 % Fed Funds Sold & Other $ - $ - $ - $ - $ - $ - $ - Average interest rate 0.00 % 0.00 % 0.00 % 0.00 % 0.00 % 0.00 % 0.00 % Total Rate Sensitive Assets $ 148,826 $ 87,867 $ 76,039 $ 55,263 $ 62,238 $ 356,859 $ 787,093 Average interest rate 4.23 % 4.14 % 3.83 % 4.03 % 4.14 % 4.14 % 4.12 % Rate Sensitive Liabilities Demand - Non Interest Bearing $ 19,138 $ 16,437 $ 14,116 $ 12,124 $ 10,412 $ 63,365 $ 135,592 Demand - Interest Bearing $ 15,594 $ 13,739 $ 12,104 $ 10,664 $ 9,395 $ 69,583 $ 131,079 Average interest rate 0.04 % 0.04 % 0.04 % 0.04 % 0.04 % 0.04 % 0.04 % Money Market Accounts $ 17,782 $ 15,553 $ 13,602 $ 11,896 $ 10,405 $ 72,606 $ 141,844 Average interest rate 0.43 % 0.43 % 0.43 % 0.43 % 0.43 % 0.43 % 0.43 % Savings $ 35,751 $ 8,751 $ 7,616 $ 6,630 $ 5,770 $ 38,749 $ 103,267 Average interest rate 0.17 % 0.17 % 0.17 % 0.17 % 0.17 % 0.17 % 0.17 % Certificates of Deposit $ 105,507 $ 58,733 $ 32,851 $ 15,069 $ 5,167 $ 490 $ 217,817 Average interest rate 1.15 % 1.43 % 1.66 % 1.65 % 1.31 % 2.76 % 1.34 % Fixed rate FHLB Advances $ 7,000 $ 6,500 $ 5,000 $ - $ - $ - $ 18,500 Average interest rate 1.53 % 1.85 % 1.84 % 0.00 % 0.00 % 0.00 % 1.72 % Variable rate FHLB Advances $ - $ - $ - $ - $ - $ - $ - Average interest rate 0.00 % 0.00 % 0.00 % 0.00 % 0.00 % 0.00 % 0.00 % Fixed rate Notes Payable $ - $ - $ - $ - $ - $ - $ - Average interest rate 0.00 % 0.00 % 0.00 % 0.00 % 0.00 % 0.00 % 0.00 % Variable rate Notes Payable $ - $ - $ - $ - $ - $ 10,310 $ 10,310 Average interest rate 0.00 % 0.00 % 0.00 % 0.00 % 0.00 % 3.39 % 3.39 % Fed Funds Purchased, Repos & Other $ 15,082 $ - $ - $ - $ - $ - $ 15,082 Average interest rate 0.21 % 0.00 % 0.00 % 0.00 % 0.00 % 0.00 % 0.21 % Total Rate Sensitive Liabilities $ 215,854 $ 119,713 $ 85,289 $ 56,383 $ 41,149 $ 255,104 $ 773,492 Average interest rate 0.69 % 0.87 % 0.83 % 0.56 % 0.31 % 0.30 % 0.58 % 39Comparison of 2017 to 2016($ in thousands) First
Year Years
2 - 5 Thereafter Total Total Rate Sensitive Assets: December 31, 2017 $ 148,826 $ 281,408 $ 356,859 $ 787,093 December 30, 2016 152,816 265,808 324,119 742,743 Increase (decrease) $ (3,990 ) $ 15,600 $ 32,740 $ 44,350 Total Rate Sensitive Liabilities: December 31, 2017 $ 215,854 $ 302,534 $ 255,104 $ 773,492 December 30, 2016 199,229 282,632 238,554 720,415 Increase (decrease) $ 16,625 $ 19,902 $ 16,550 $ 53,077 The above table reflects expected maturities, not expected repricing. The contractual maturities adjusted for anticipated prepayments and anticipated renewals at current interest rates, as shown in the preceding table, are only part of the Company’s interest rate risk profile. Other important factors include the ratio of rate-sensitive assets to rate-sensitive liabilities (which takes into consideration loan repricing frequency but not when deposits may be repriced) and the general level and direction of market interest rates. For core deposits, the repricing frequency is assumed to be longer than when such deposits actually reprice. For some rate-sensitive liabilities, their repricing frequency is the same as their contractual maturity. For variable rate loans receivable, repricing frequency can be daily or monthly. For adjustable rate loans receivable, repricing can be as frequent as annually for loans whose contractual maturities range from one to thirty years.available for saleavailable-for-sale which mature at various times primarily from one through ten years, 5) federal funds borrowings with terms of one day to 90 days, and 6) Federal Home Loan BankFHLB borrowings with terms of one day to ten years.The majority of assets and liabilities of the Company are monetary in nature, and therefore the Company differs greatly from most commercial and industrial companies that have significant investments in fixed assets or inventories. However, inflation does have an important impact on the growth of total assets in the banking industry and the resulting need to increase equity capital at higher than normal rates in order to maintain an appropriate equity to assets ratio. Inflation significantly affects noninterest expense, which tends to rise during periods of general inflation.Item 8. Financial Statements and Supplementary Data. begin on the following page.($ in thousands) 2021 2020 Assets Cash and due from banks $ 149,511 $ 140,690 Interest bearing time deposits 2,643 5,823 Available-for-sale securities 263,259 149,406 Loans held for sale 7,472 7,234 Loans, net of unearned income 822,714 872,723 Allowance for loan losses (13,805 ) (12,574 ) Premises and equipment, net 23,212 23,557 Federal Reserve and Federal Home Loan Bank Stock, at cost 5,303 5,303 Foreclosed assets and other assets held for sale, net 2,104 23 Interest receivable 2,920 3,799 Goodwill 23,191 22,091 Cash value of life insurance 17,867 17,530 Mortgage servicing rights 12,034 7,759 Other assets 12,429 14,475 Total assets $ 1,330,854 $ 1,257,839 Liabilities and shareholders’ equity Liabilities Deposits Non interest bearing demand $ 247,044 $ 251,649 Interest bearing demand 195,464 176,785 Savings 237,571 174,864 Money market 276,462 216,164 Time deposits 156,504 229,549 Total deposits 1,113,045 1,049,011 Repurchase agreements 15,320 20,189 Federal Home Loan Bank advances 5,500 8,000 Trust preferred securities 10,310 10,310 Subordinated debt net of issuance costs 19,546 - Interest payable 299 616 Other liabilities 21,905 26,790 Total liabilities 1,185,925 1,114,916 Commitments & Contingent Liabilities - - Shareholders’ Equity Preferred stock, no par value; authorized 200,000 shares; 2021 - 0 shares outstanding, 2020 - 0 shares outstanding - - Common stock, no par value; authorized 10,000,000 shares; 2021 - 8,180,712 shares issued, 2020 - 8,180,712 shares issued 54,463 54,463 Additional paid-in capital 14,944 14,845 Retained earnings 99,716 84,578 Accumulated other comprehensive income (loss) (1,845 ) 2,210 Treasury stock, at cost; (2021 - 1,296,382 common shares, 2020 - 808,456 common shares) (22,349 ) (13,173 ) Total shareholders’ equity 144,929 142,923 Total liabilities and shareholders’ equity $ 1,330,854 $ 1,257,839 ($ in thousands) 2017 2016 ASSETS Cash & due from banks $ 26,616 $ 17,012 Available-for-sale securities 82,790 90,128 Loans held for sale 3,940 4,434 Loans, net of unearned income 696,615 644,433 Allowance for loan losses (7,930 ) (7,725 ) Premises and equipment, net 21,277 19,129 Federal Reserve and Federal Home Loan Bank Stock, at cost 3,748 3,748 Foreclosed assets held for sale, net 26 994 Interest receivable 1,825 1,512 Goodwill & other intangibles 16,411 16,422 Cash value of life insurance 16,479 13,725 Mortgage servicing rights 9,907 8,422 Other assets 4,923 3,771 Total assets $ 876,627 $ 816,005 LIABILITIES AND SHAREHOLDERS’ EQUITY Liabilities Deposits Noninterest bearing demand $ 135,592 $ 125,189 Interest bearing demand 131,079 131,598 Savings 103,267 95,594 Money market 141,844 122,976 Time deposits 217,818 197,716 Total deposits 729,600 673,073 Repurchase agreements 15,082 10,532 Federal Home Loan Bank advances 18,500 26,500 Trust preferred securities 10,310 10,310 Interest payable 592 408 Other liabilities 8,543 8,634 Total liabilities 782,627 729,457 Commitments & Contingent Liabilities Stockholders’ Equity Preferred Shares, no par value; authorized 200,000 shares; 15,000 shares issued 13,983 13,983 Common Shares, no par value; 10,000,000 shares; 5,027,433 shares issued authorized 10,000,000 shares; 5,027,433 shares issued 12,569 12,569 Additional paid-in capital 15,405 15,362 Retained earnings 55,439 46,688 Accumulated other comprehensive (loss)/income (141 ) 51 Treasury stock, at cost;2017 - 234,787 common shares, 2016 - 183,354 common shares (3,255 ) (2,105 ) Total stockholders’ equity 94,000 86,548 Total liabilities and stockholders’ equity $ 876,627 $ 816,005 F-1SB Financial Group, Inc.Consolidated Statements of IncomeYears Ended December 31($ in thousands, except per share data) 2021 2020 Interest Income Loans Taxable $ 37,959 $ 39,735 Tax exempt 206 239 Securities Taxable 3,386 2,328 Tax exempt 353 333 Total interest income 41,904 42,635 Interest Expense Deposits 3,129 6,070 Repurchase agreements & other 42 70 Federal Home Loan Bank advance expense 188 309 Trust preferred securities expense 199 256 Subordinated debt expense 462 - Total interest expense 4,020 6,705 Net Interest Income 37,884 35,930 Provision for loan losses 1,050 4,500 Net interest income after provision for loan losses 36,834 31,430 Noninterest Income Wealth management fees 3,814 3,245 Customer service fees 3,217 2,807 Gain on sale of mortgage loans & OMSR 17,255 25,350 Mortgage loan servicing fees, net 2,940 (5,138 ) Gain on sale of non-mortgage loans 158 453 Title insurance income 2,089 1,913 Other income 1,224 1,466 Total noninterest income 30,697 30,096 Noninterest Expense Salaries and employee benefits 26,838 25,397 Net occupancy expense 3,048 2,891 Equipment expense 3,281 3,186 Data processing fees 2,579 3,055 Professional fees 3,027 3,307 Marketing expense 784 658 Telephone and communications 581 535 Postage and delivery expense 414 415 State, local and other taxes 1,175 1,146 Employee expense 663 535 Other expense 2,418 1,962 Total noninterest expense 44,808 43,087 Income before income tax 22,723 18,439 Provision for income taxes 4,446 3,495 Net Income $ 18,277 $ 14,944 Basic earnings per common share $ 2.58 $ 1.96 Diluted earnings per common share $ 2.56 $ 1.96 ($ in thousands except per share data) 2017 2016 2015 Interest Income Loans Taxable $ 29,792 $ 26,846 $ 23,692 Tax exempt 85 75 35 Securities Taxable 2,076 1,536 1,506 Tax exempt 527 594 694 Total interest income 32,480 29,051 25,927 Interest Expense Deposits 3,456 2,578 1,979 Repurchase agreements & Other 15 16 17 Federal Home Loan Bank advances 320 352 375 Trust preferred securities 303 252 213 Total interest expense 4,094 3,198 2,584 Net Interest Income 28,386 25,853 23,343 Provision for loan losses 400 750 1,100 Net interest income after provision for loan losses 27,986 25,103 22,243 Noninterest Income Wealth management fees 2,777 2,628 2,606 Customer service fees 2,671 2,705 2,779 Gain on sale of mortgage loans & OMSR’s 7,132 8,172 6,264 Mortgage loan servicing fees, net 1,316 810 1,025 Gain on sale of non-mortgage loans 1,272 979 947 Data service fees 738 917 1,190 Net gain on sales of securities 119 262 - Gain on sale of assets 6 177 18 Other 1,186 1,239 878 Total noninterest income $ 17,217 $ 17,889 $ 15,707 Noninterest Expense Salaries and employee benefits $ 18,646 $ 17,421 $ 14,917 Net occupancy expense 2,260 2,145 1,943 Equipment expense 2,760 2,618 2,223 Data processing fees 1,558 1,380 1,060 Professional fees 1,774 1,426 1,663 Marketing expense 734 647 594 Telephone and communications 462 413 387 Postage and delivery expense 454 661 801 Employee expense 797 545 543 Other expenses 2,133 2,835 2,796 Total noninterest expense 31,578 30,091 26,927 Income Before Income Tax 13,625 12,901 11,023 Provision for Income Taxes 2,560 4,117 3,404 Net Income $ 11,065 $ 8,784 $ 7,619 Preferred Share Dividends 975 975 956 Net Income available to Common Shareholders $ 10,090 $ 7,809 $ 6,663 Basic Earnings Per Share $ 2.10 $ 1.60 $ 1.36 Diluted Earnings Per Share $ 1.74 $ 1.38 $ 1.19 F-2($ in thousands) 2021 2020 Net income $ 18,277 $ 14,944 Other comprehensive income Available for sale investment securities: Gross unrealized holding gain (loss) arising in the period (5,133 ) 1,963 Related tax expense (benefit) 1,078 (412 ) Net effect on other comprehensive income (loss) (4,055 ) 1,551 Total comprehensive income $ 14,222 $ 16,495 ($’s in thousands) 2017 2016 2015 Net income $ 11,065 $ 8,784 $ 7,619 Other comprehensive income (loss): Gross unrealized holding loss arising in the period (374 ) (1,170 ) (406 ) Related tax expense 126 398 138 Less: reclassification adjustment for gain realized in income 119 262 - Related tax benefit (40 ) (89 ) - Net effect on other comprehensive loss (169 ) (599 ) (268 ) Total comprehensive income $ 10,896 $ 8,185 $ 7,351 F-3 (unaudited) Additional Accumulated Other Comprehensive ($ in thousands, except per share data) Common
Stock Paid-in
Capital Retained
Earnings Income
(Loss) Treasury
Stock Total January 1, 2021 $ 54,463 $ 14,845 $ 84,578 $ 2,210 $ (13,173 ) $ 142,923 Net income 18,277 18,277 Other comprehensive loss (4,055 ) (4,055 ) Dividends on common, $0.44 per share (3,139 ) (3,139 ) Restricted stock vesting (344 ) 344 - Repurchased stock (9,520 ) (9,520 ) Stock based compensation expense 443 443 December 31, 2021 $ 54,463 $ 14,944 $ 99,716 $ (1,845 ) $ (22,349 ) $ 144,929 Additional Accumulated Other Comprehensive ($ in thousands, except per share data) Common
Stock Paid-in
Capital Retained
Earnings Income
(Loss) Treasury
Stock Total January 1, 2020 $ 54,463 $ 15,023 $ 72,704 $ 659 $ (6,755 ) $ 136,094 Net income 14,944 14,944 Other comprehensive income 1,551 1,551 Dividends on common, $0.40 per share (3,070 ) (3,070 ) Restricted stock vesting (307 ) 307 - Stock options exercised (253 ) 441 188 Repurchased stock (7,166 ) (7,166 ) Stock based compensation expense 382 382 December 31, 2020 $ 54,463 $ 14,845 $ 84,578 $ 2,210 $ (13,173 ) $ 142,923 Preferred Common Additional
Paid-in Retained Accumulated Other Comprehensive Treasury ($’s in thousands - except per share data) Stock Stock Capital Earnings Income (Loss) Stock Total Balance, January 1, 2017 $ 13,983 $ 12,569 $ 15,362 $ 46,688 $ 51 $ (2,105 ) $ 86,548 Net income 11,065 11,065 Reclassification of stranded tax effects due to TCJA 23 (23 ) - Other comprehensive loss (169 ) (169 ) Dividends on common, $0.28 per share (1,362 ) (1,362 ) Dividends on preferred, $0.65 per share (975 ) (975 ) Restricted stock vesting (144 ) 144 - Stock options exercised (116 ) 491 375 Stock buyback (1,785 ) (1,785 ) Share based compensation expense 303 303 Balance, December 31, 2017 $ 13,983 $ 12,569 $ 15,405 $ 55,439 $ (141 ) $ (3,255 ) $ 94,000 Balance, January 1, 2016 $ 13,983 $ 12,569 $ 15,438 $ 40,059 $ 650 $ (1,458 ) $ 81,241 Net income 8,784 8,784 Other comprehensive loss (599 ) (599 ) Dividends on common, $0.24 per share (1,180 ) (1,180 ) Dividends on preferred, $0.65 per share (975 ) (975 ) Restricted stock vesting (97 ) 97 - Stock options exercised (93 ) 424 331 Stock buyback (1,168 ) (1,168 ) Share based compensation expense 114 114 Balance, December 31, 2016 $ 13,983 $ 12,569 $ 15,362 $ 46,688 $ 51 $ (2,105 ) $ 86,548 Balance, January 1, 2015 $ 13,983 $ 12,569 $ 15,461 $ 34,379 $ 918 $ (1,627 ) $ 75,683 Net income 7,619 7,619 Other comprehensive loss (268 ) (268 ) Dividends on common, $0.20 per share (983 ) (983 ) Dividends on preferred, $0.64 per share (956 ) (956 ) Restricted stock vesting (69 ) 69 - Stock options exercised (35 ) 102 67 Stock buyback (2 ) (2 ) Share based compensation expense 81 81 Balance, December 31, 2015 $ 13,983 $ 12,569 $ 15,438 $ 40,059 $ 650 $ (1,458 ) $ 81,241 F-4($ in thousands) 2017 2016 2015 Operating Activities Net Income $ 11,065 $ 8,784 $ 7,619 Items not requiring (providing) cash Depreciation and amortization 1,566 1,509 1,097 Provision for loan losses 400 750 1,100 Expense of share-based compensation plan 303 114 81 Amortization of premiums and discounts on securities 547 917 977 Amortization of intangible assets 11 13 201 Amortization of originated mortgage servicing rights 1,132 1,340 880 Deferred income taxes (788 ) 738 1,519 Proceeds from sale of loans held for sale 259,119 353,068 278,670 Originations of loans held for sale (253,840 ) (343,377 ) (276,252 ) Gain from sale of loans (8,404 ) (9,151 ) (7,195 ) (Gain)/Loss on sales of assets (6 ) (177 ) (18 ) Net gains on sales of securities (119 ) (262 ) - Originated mortgage servicing rights impairment, net (77 ) (68 ) (116 ) Changes in Interest receivable (313 ) (252 ) 86 Other assets (1,760 ) (872 ) (1,616 ) Interest payable & other liabilities 967 952 1,582 Net cash provided by operating activities 9,803 14,026 8,615 Investing Activities Purchases of available-for-sale securities (29,849 ) (22,603 ) (26,261 ) Proceeds from maturities of available-for-sale securities 22,016 17,534 20,328 Proceeds from sales of available-for-sale securities 14,488 3,212 - Net change in loans (51,202 ) (88,027 ) (42,338 ) Purchase of premises, equipment (3,714 ) (1,636 ) (7,199 ) Proceeds from sales of premises, equipment - 9 667 Proceeds from bank owned life insurance 665 - - Purchase of bank owned life insurance (3,000 ) - - Proceeds from sale of foreclosed assets 1,067 784 111 Net cash used in investing activities (49,529 ) (90,727 ) (54,692 ) Financing Activities Net increase in demand deposits, money market, interest checking & savings accounts 36,425 47,942 39,810 Net increase/(decrease) in certificates of deposit 20,102 38,678 (4,263 ) Net increase/(decrease) in securities sold under agreements to repurchase 4,550 (1,874 ) (334 ) Proceeds from Federal Home Loan Bank advances 5,000 5,500 9,000 Repayment of Federal Home Loan Bank advances (13,000 ) (14,000 ) (4,000 ) Net proceeds from share based compensation plans 375 331 67 Stock Repurchase Plan (1,785 ) (1,168 ) (2 ) Dividends on Common Stock (1,362 ) (1,180 ) (983 ) Dividends on Preferred Stock (975 ) (975 ) (956 ) Net cash provided by financing activities 49,330 73,254 38,339 Increase/(decrease) in Cash and Cash Equivalents 9,604 (3,447 ) (7,738 ) Cash and Cash Equivalents, Beginning of Year 17,012 20,459 28,197 Cash and Cash Equivalents, End of Year $ 26,616 $ 17,012 $ 20,459 Supplemental Cash Flows Information Interest paid $ 3,910 $ 3,054 $ 2,583 Income taxes paid $ 3,105 $ 3,969 $ 2,060 Transfer of loans to foreclosed assets $ 95 $ 1,238 $ 134 ($ in thousands) 2021 2020 Operating Activities Net Income $ 18,277 $ 14,944 Items not requiring (providing) cash Depreciation and amortization 2,262 1,937 Provision for loan losses 1,050 4,500 Expense of share-based compensation plan 443 382 Amortization of premiums and discounts on securities 1,236 643 Amortization of intangible assets 71 46 Amortization of originated mortgage servicing rights 3,885 4,762 Impairment (recovery) of mortgage servicing rights (3,436 ) 3,586 Deferred income taxes 2,302 (2,444 ) Proceeds from sale of loans held for sale 490,557 603,178 Originations of loans held for sale (478,119 ) (582,538 ) Gain from sale of loans (17,413 ) (25,803 ) Changes in Interest receivable 879 (693 ) Other assets 2,006 (5,211 ) Interest payable & other liabilities (6,743 ) 6,618 Net cash provided by operating activities 17,257 23,907 Investing Activities Purchases of available-for-sale securities (170,694 ) (129,796 ) Proceeds from maturities of interest bearing time deposits 3,180 5,719 Proceeds from maturities of available-for-sale securities 50,471 84,021 Net change in loans 48,503 (31,706 ) Purchase of premises, equipment (2,427 ) (1,980 ) Proceeds from sales of premises, equipment - 301 Purchase of bank owned life insurance (50 ) - Purchase of Federal Reserve and Federal Home Loan Bank Stock - (538 ) Proceeds from sale of foreclosed assets 129 500 Acquisition, net of cash acquired (paid) (1,100 ) 16,263 �� Net cash used in investing activities (71,988 ) (57,216 ) Financing Activities Net increase in demand deposits, money market, interest checking & savings accounts 137,079 195,501 Net increase (decrease) in time deposits (73,045 ) (37,762 ) Net increase (decrease) in securities sold under agreements to repurchase (4,869 ) 7,244 Repayment of Federal Home Loan Bank advances (2,500 ) (8,000 ) Net proceeds from subordinated debt 19,546 - Net proceeds from share-based compensation plans - 188 Stock repurchase plan (9,520 ) (7,166 ) Dividends on common shares (3,139 ) (3,070 ) Net cash provided by financing activities 63,552 146,935 Increase in cash and cash equivalents 8,821 113,626 Cash and cash equivalents, beginning of year 140,690 27,064 Cash and cash equivalents, end of year $ 149,511 $ 140,690 Supplemental cash flow information Interest paid $ 4,337 $ 7,280 Income taxes paid $ 4,230 $ 5,180 Supplemental non-cash disclosure Recognition of right-of-use lease assets $ 318 $ 248 Transfer of loans to foreclosed assets $ 1,687 $ 207 In conjunction with the Edon acquisition, liabilities assumed were: Fair value of assets acquired $ - $ 66,769 Cash paid in acquisition - (15,493 ) Liabilities assumed $ - $ 51,276 F-52017, 20162021 and 20152020bankfinancial holding company whose principal activity is the ownership and management of its wholly-owned subsidiaries, The State Bank and Trust Company (“State Bank”), SBFG Title, LLC dba Peak Title Agency (“SBFG Title”), SB Captive, Inc. (“SB Captive”), RFCBC, Inc. (“RFCBC”), Rurbanc Data Services, Inc. dba RDSI Banking Systems (“RDSI”), and Rurban Statutory Trust II (“RST II”). State Bank owns all the outstanding stock of Rurban Mortgage Company (“RMC”), and State Bank Insurance, LLC (“SBI”). The Company is primarily engaged in providing a full range of banking and wealth management services to individual and corporate customers primarily located in Northwest Ohio, Indiana, and Northeast Indiana.Michigan. The Company is subject to competition from other financial institutions, and regulated by certain federal and state agencies and undergoes periodic examinations by those regulatory authorities.valuation of real estate acquired in connection with foreclosures or in satisfaction of loans, loan servicing rights, valuation of deferred tax assets, other-than-temporary impairment and fair value of financial instruments.20172021 and 2016,2020, cash equivalents consisted primarily of interest bearinginterest-bearing and noninterest bearing demand deposit balances held by correspondent banks.2017, none of2021, the Company’s correspondent cash accounts exceeded federally insured limits.limits by $7.9 million. Additionally, the Company had approximately $15.6$129.1 million of cash held by the Federal Reserve Bank,FRB and the FHLB, which is not federally insured.SecuritiesF-6LoansState Bankthe Company will be unable to collect the scheduled payments of principal or interest when due according to the contractual terms of the loan agreement. Factors considered by management in determining impairment include payment status, collateral value and the probability of collecting scheduled principal and interest payments when due. Loans that experience insignificant payment delays and payment shortfalls generally are not classified as impaired. Management determines the significance of payment delays and payment shortfalls on a case-by-case basis, taking into consideration each of the circumstances surrounding the loan and the borrower, including the length of the delay, the reasons for the delay, the borrower’s prior payment record and the amount of the shortfall in relation to the principal and interest owed. Impairment is measured on a loan-by-loan basis for commercial, agricultural, and construction loans by either the present value of expected future cash flows discounted at the loan’s effective interest rate, the loan’s obtainable market price or the fair value of the collateral if the loan is collateral dependent.F-7 State Bank moves a loan moves to nonaccrual status, total unpaid interest accrued to date is reversed from income. Subsequent payments are applied to the outstanding principal balance with the interest portion of the payment recorded on the balance sheet as a contra-loan. Interest received on impaired loans may be realized once all contractual principal amounts are received or when a borrower establishes a history of six consecutive timely principal and interest payments. It is at the discretion of Managementmanagement to determine when a loan is placed back on accrual status upon receipt of six consecutive timely payments.State Bank does not separately identify individual consumer and residential loans are not separately identified for impairment measurements, unless such loans are the subject of a restructuring agreement due to financial difficulties of the borrower.Federal ReserveFRB and Federal Home Loan BankFHLB stock are required investments for institutions that are members of the Federal ReserveFRB and Federal Home Loan BankFHLB systems. The required investment in the common stock is based on a predetermined formula, carried at cost and evaluated for impairment.GoodwillDerivativesDerivatives are recognized asThe Company utilizes derivative financial instruments to help manage exposure to interest rate risk and the effects that changes in interest rates may have on net income and the fair value of assets and liabilitiesliabilities. The Company enters into interest rate swap agreements as part of its asset liability management strategy to help manage its interest rate risk position. Additionally, the Company enters into forward contracts for the future delivery of mortgage loans to third-party investors and enters into interest rate lock commitments (“IRLCs”) with potential borrowers to fund specific mortgage loans that will be sold into the secondary market. The forward contracts are entered into in order to economically hedge the effect of changes in interest rates resulting from the Company’s commitment to fund the loans.sheetsheets, while the derivative instruments with a negative fair value are reported in accrued expenses and measured at fair value. other liabilities in the consolidated balance sheets.F-8(ASC(Accounting Standards Codification “ASC” 806-50), servicing rights from the sale or securitization of loans originated by the Company are initially measured at fair value at the date of transfer. The Company subsequently measures each class of servicing asset using the amortization method. Under the amortization method, servicing rights are amortized in proportion to and over the period of estimated net servicing income. The amortized assets are assessed for impairment based on fair value at each reporting date.Loan Servicing Fees,loan servicing fees, net” onin the income statement. Fair value in excess of the carrying amount of servicing assets for that stratum is not recognized.20172021 and 2016,2020, the Company had a share-based employee compensation plan which is described more fully in(see Note 1720 to the Consolidated Financial Statements.Statements).740, Income Taxes)740). The income tax accounting guidance results in two components of income tax expense: current and deferred. Current income tax expense reflects taxes to be paid or refunded for the current period by applying the provisions of the enacted tax law to the taxable income or excess of deductions over revenues. The Company determines deferred income taxes using the liability (or balance sheet) method. Under this method, the net deferred tax asset or liability is based on the tax effects of the differences between the book and tax bases of assets and liabilities, and enacted changes in tax rates and laws are recognized in the period in which they occur. Deferred income tax expense results from changes in deferred tax assets and liabilities between periods. Deferred tax assets are reduced by a valuation allowance if, based on the weight of evidence available, it is more likely than not that some portion or all of a deferred tax asset will not be realized.F-92014.2018. As of December 31, 2017,2021, the Company had no uncertain income tax positions.The Company uses the specific identification (or portfolio) method for reclassifying material stranded tax effects in accumulated other consolidated income (AOCI) to earnings.The Company elected to apply the provisions of ASU 2018-02,Income Statement – Reporting Comprehensive Income (Topic 220): Reclassification of Certain Tax Effects from Accumulated Other Comprehensive Income.As a result, the Company reclassified $0.02 million from AOCI to retained earnings.and convertible preferred shares that would have been outstanding if dilutive potential common shares had been issued, as well as any adjustment to income that would result from the assumed issuance. Potential common shares that may be issued by the Company relaterelated solely to outstanding stock options or awards which are determined using the treasury stock method and convertible preferred shares which are determined using the converted method. Treasury stock shares are not deemed outstanding for earnings per share calculations.securities, and unrealized and realized gains and losses in derivative financial instruments that qualify for hedge accounting. Accumulated other comprehensive incomesecurities. AOCI consists solely of the cumulative unrealized gains and losses on available-for-sale securities net of income tax.F-10Accounting Standards Update (ASU) No. 2018-02: Reclassifications of Certain tax Effects from Accumulated Other Comprehensive Income (Topic 220)In February of 2018, the FASB issued guidance that requires a reclassification from accumulated other comprehensive income to retained earnings for stranded tax effects resulting from theTax Cuts and Jobs Act of 2017. Entities electing the reclassification are required to apply the guidance either at the beginning of the period of adoption or retrospectively for all periods impacted. This guidance is effective for annual and interim periods beginning after December 31, 2018. Early adoption is permitted. The Company has elected to reclassify $0.2 million of these stranded tax effects from accumulated other comprehensive loss to retained earnings in the current period.2017-12:2020-01: Investments – Equity Securities (Topic 321), Investments – Equity Method and Joint Ventures (Topic 323), and Derivatives and Hedging (Topic 815) – Clarifying the Interactions between Topic 321, Topic 323 and Topic 815ASU better aligns an entity’s risk management activitiesguidance was issued in January 2020 to clarify that a company should consider observable transactions that require a company to either apply or discontinue the equity method of accounting under Topic 323, Investments-Equity Method and financial reportingJoint Ventures, for hedging relationships through changes to both the designation andpurposes of applying the measurement guidance for qualifying hedging relationships andalternative in accordance with Topic 321 immediately before applying or upon discontinuing the presentation of hedge results.equity method. The amendments in this ASU arealso clarify that when determining the accounting for certain forward contracts and purchased options a company should not consider, whether upon settlement or exercise, if the underlying securities would be accounted for under the equity method or fair value option. The guidance is effective for reporting periods beginning after December 15, 2018, and management does2020. The impact of this new guidance did not believe the changes will have a material effectimpact on the Company’s consolidated financial statements.2017-04: Intangibles2020-04: Reference Rate Reform – Goodwill and Other (Topic 350)This ASU simplifies the test for goodwill impairment. Specifically, these amendments eliminate Step 2 from the goodwill impairment test, and also eliminate the requirements for any reporting unit with a zero or negative carrying amount to perform a qualitative assessment and, if it fails that qualitative test, to perform Step 2Facilitation of the goodwill impairment test.Effects of Reference Rate Reform on Financial Reporting (Topic 848)amendments in this ASU areguidance is effective as of March 12, 2020 through December 31, 2022. The Company anticipates being fully prepared to implement a replacement for annual goodwill impairment tests in fiscal years beginning after December 15, 2019,the reference rate and management doeshas determined that any change will not believe the changes will have a material effect onimpact to the Company’s accounting and disclosures.consolidated financial statements. The amendments in this ASU are effective for reporting periods beginning after December 15, 2019, and management will need further study to determine the impact on the Company’s consolidated financial statements. The Company implemented a process to track required data by utilizing accounting software in preparation for compliance.is likelyhas the potential to result in an increase in the allowance for loan losses as a result of changing from an “incurred loss” model, which encompasses allowances for current known and inherent losses within the portfolio, to an “expected loss” model, which encompasses allowances for losses expected to be incurred over the life of the portfolio. Furthermore, ASU 2016-13 will necessitate that we establish an allowance for expected credit losses on debt securities. While we are currently unable reasonably estimate the impact of adopting ASU 2016-13 wethroughout 2022. We expect that the impact offinal adoption will be significantly influenced by the composition, characteristics and quality of our loan and securities portfolios as well as the prevailing economic conditions and forecasts as of the adoption date. We anticipate being fully prepared for implementation by December 15, 2019.ASU No. 2016-09: Stock Compensation (Topic 718)This ASU affects all entities that issue share-based payment awards to their employees. The update is intended to simplify the accounting for these transactions, including the income tax consequences, classification of awards as either equity or liabilities, and classification on the statement of cash flows. The Company adopted the amendments in this ASU, and management has determined that thestandard will not have a material impact on the Company’s consolidated financial statements is immaterial.F-11ASU No. 2014-09: Revenue from Contracts with Customers (Topic 606)This ASU affects any entity that either enters into contracts with customers to transfer goods or services or enters into contracts for the transfer of non-financial assets unless those contracts are within the scope of other standards. The core principle is that an entity should recognize revenue in an amount that reflects the consideration to which the entity expectsstatements. We expect to be entitled in exchangefully prepared for those goods or services. Our revenue is comprised of net interest income on financial assets and financial liabilities, which is explicitly excluded from the scope of ASU 2014-09, and noninterest income. We have completed our evaluation of the impact of ASU 2014-09 on components of our noninterest income and have not found any significant changes to our methodology of recognizing revenue. As requiredimplementation by ASU 2014-09, we will adopt the standard in the first quarter of 2018 and, at the time of this filing, we do not anticipate recording a cumulative effect adjustment to opening retained earnings because the adjustment was determined to be insignificant. We will include newly applicable revenue disclosures in our Form 10-Q for the quarter ended March 31, 2018.January 1, 2023.(EPS)(“EPS”) is computed using the two-class method. Basic earnings per common share is computed by dividing net income available to common shareholders by the weighted-average number of common shares outstanding during the applicable period, excluding participating securities. Participating securities include non-vested restricted stock awards. Non-vested restricted stock awards are considered participating securities to the extent the holders of these securities receive non-forfeitable dividends at the same rate as holders of common shares. Diluted earnings per common share is computed using the weighted-average number of shares determined for the basic earnings per common share plus the convertible impact of preferred shares and the dilutive effect of stock compensation using the treasury stock method. EPS for the years ended December 31, 2017, 20162021 and 20152020 is computed as follows: Twelve Months Ended Dec., 31 ($ in thousands - except per share data) 2017 2016 2015 Distributed earnings allocated to common shares $ 1,363 $ 1,180 $ 982 Undistributed earnings allocated to common shares 8,714 6,620 5,676 Net earnings allocated to common shares 10,077 7,800 6,658 Net earnings allocated to participating securities 13 9 5 Dividends on convertible preferred shares 975 975 956 Net Income allocated to common shares and participating securities $ 11,065 $ 8,784 $ 7,619 Weighted average shares outstanding for basic earnings per share 4,817 4,877 4,884 Dilutive effect of stock compensation 74 47 88 Dilutive effect of convertible shares 1,460 1,452 1,451 Weighted average shares outstanding for diluted earnings per share 6,351 6,376 6,423 Basic earnings per common share $ 2.10 $ 1.60 $ 1.36 Diluted earnings per common share $ 1.74 $ 1.38 $ 1.19 Twelve Months Ended
Dec. 31, ($ and outstanding shares in thousands - except per share data) 2021 2020 Distributed earnings allocated to common shares $ 3,139 $ 3,070 Undistributed earnings allocated to common shares 15,117 11,858 Net earnings allocated to common shares 18,256 14,928 Net earnings allocated to participating securities 21 16 Net Income allocated to common shares and participating securities $ 18,277 $ 14,944 Weighted average shares outstanding for basic earnings per share 7,083 7,613 Dilutive effect of stock compensation 47 22 Weighted average shares outstanding for diluted earnings per share 7,130 7,635 Basic earnings per common share $ 2.58 $ 1.96 Diluted earnings per common share $ 2.56 $ 1.96 20172021 or 2016. Shares subject2020.issue upon exerciseshareholders of optionsrecord as of 35,424January 21, 2022. Holders of the Company’s common shares as of the record date received one additional common share for every twenty common shares held on the record date. No fractional shares were issued, and shareholders received cash for such fractional interests based on the closing price of $19.89 of the Company’s common shares on the record date.2015 at prices of $11.50 to $14.15 were excluded from the Company’s 2021 financial statements, common shares outstanding would have increased by approximately 345,000 and diluted earnings per common share, calculation as theyassuming the shares were anti-dilutive.outstanding for the entire year would have decreased by $0.11 per share.($ in thousands) June 5,
2020 Fair value of assets acquired Cash and cash equivalents $ 31,756 Interest bearing time deposits 11,542 Investment securities 1,362 Federal Home Loan Bank stock 117 Loans held for investment 16,395 Premises and equipment 446 Goodwill 4,299 Core deposit intangible 660 Other assets 192 Total assets acquired $ 66,769 Fair value of liabilities assumed Deposits $ 51,053 Other liabilities 223 Total liabilities assumed 51,276 Total purchase price (cash) $ 15,493 Twelve Months
Ended December 31, Summary of Operations ($ in thousands) 2020 Net interest income $ 36,429 Provision for loan losses 4,500 Net interest income after provision 31,929 Non interest income 30,140 Non interest expense 44,158 Income before income taxes 17,911 Income tax expense* 3,384 Net income $ 14,527 Basic earnings per share $ - Diluted earnings per share $ 1.90 F-12*Income tax expense for Edon State Bank calculated using a 21% statuatory rate 3:4: Available-for-Sale Securities Gross Gross Amortized Unrealized Unrealized ($ in thousands) Cost Gains Losses Fair Value Available for Sale Securities: December 31, 2017: U.S. Treasury and Government agencies $ 12,715 $ 62 $ (69 ) $ 12,708 Mortgage-backed securities 57,355 97 (690 ) 56,762 State and political subdivisions 12,829 439 (18 ) 13,250 Equity securities 70 - - 70 $ 82,969 $ 598 $ (777 ) $ 82,790 Amortized Gross
Unrealized Gross
Unrealized Fair ($ in thousands) Cost Gains Losses Value December 31, 2021: U.S. Treasury and Government agencies $ 8,986 $ 135 $ (16 ) $ 9,105 Mortgage-backed securities 231,057 614 (3,537 ) 228,134 State and political subdivisions 12,352 536 (9 ) 12,879 Other corporate securities 13,200 2 (61 ) 13,141 Totals $ 265,595 $ 1,287 $ (3,623 ) $ 263,259 Gross Gross Amortized Unrealized Unrealized ($ in thousands) Cost Gains Losses Fair Value Available-for-Sale Securities: December 31, 2016: U.S. Treasury and Government agencies $ 13,341 $ 69 $ (52 ) $ 13,358 Mortgage-backed securities 62,035 204 (636 ) 61,603 State and political subdivisions 14,606 530 (39 ) 15,097 Equity securities 70 - - 70 $ 90,052 $ 803 $ (727 ) $ 90,128 Gross Gross Amortized Unrealized Unrealized Fair Cost Gains Losses Value December 31, 2020: U.S. Treasury and Government agencies $ 6,541 $ 323 $ - $ 6,864 Mortgage-backed securities 125,973 1,845 (57 ) 127,761 State and political subdivisions 11,595 680 - 12,275 Other corporate securities 2,500 6 - 2,506 Totals $ 146,609 $ 2,854 $ (57 ) $ 149,406 available for saleavailable-for-sale at December 31, 2017,2021, by contractual maturity, are shown below. Expected maturities differ from contractual maturities because issuers may have the right to call or prepay obligations with or without call or prepayment penalties. Available for Sale Amortized Fair ($ in thousands) Cost Value Within one year $ 1,560 $ 1,590 Due after one year through five years 7,363 7,427 Due after five years through ten years 10,624 10,731 Due after ten years 5,997 6,210 25,544 25,958 Mortgage-backed securities and equity securities 57,425 56,832 Totals $ 82,969 $ 82,790 Amortized Fair ($ in thousands) Cost Value Within one year $ 606 $ 606 Due after one year through five years 2,724 2,772 Due after five years through ten years 23,156 23,406 Due after ten years 8,052 8,341 34,538 35,125 Mortgage-backed securities 231,057 228,134 Totals $ 265,595 $ 263,259 $38.9$54.2 million at December 31, 2017,2021, and $44.3$53.7 million at December 31, 2016.2020. Securities delivered for repurchase agreements (not included above) were $19.1$23.6 million at December 31, 20172021 and $14.6$28.2 million at December 31, 2016.2020.F-13Gross gains of $0.13 million, and gross losses of $0.01 million was a reclassification from accumulated other comprehensive income and is included in the net gain on sales of securities for 2017. Gross gains of $0.26 million was a reclassification from accumulated other comprehensive income and is included in the net gain on sales of securities in 2016. The related tax expense for net security gains for 2017 was $0.04 million and for 2016 was $0.09 million and was a reclassification from accumulated other comprehensive income and is included in the income tax expense line in the income statement. There were no realized gains or losses on available-for-sale securities in 2015.2021 and 2020.20172021 and 2016,2020, was $59.3$214.2 million and $52.2$27.3 million, respectively, which was approximately 7281 percent and 5818 percent, respectively, of the Company’s available for saleavailable-for-sale investment portfolio.20172021 and 2016:2020:($ in thousands) Less than 12 Months 12 Months or Longer Total December 31, 2021 Fair Value Unrealized Losses Fair Value Unrealized Losses Fair Value Unrealized Losses U.S. Treasury and Government agencies $ 3,397 $ (16 ) $ - $ - $ 3,397 $ (16 ) Mortgage-backed securities 183,727 (2,856 ) 18,566 (681 ) 202,293 (3,537 ) State and political subdivisions 1,673 (9 ) - - 1,673 (9 ) Other corporate securities 6,889 (61 ) - - 6,889 (61 ) Totals $ 195,686 $ (2,942 ) $ 18,566 $ (681 ) $ 214,252 $ (3,623 ) ($ in thousands) Less than 12 Months 12 Months or Longer Total December 31, 2017 Unrealized Losses Unrealized Losses Unrealized Losses Securities: U.S. Treasury and Government agencies $ 5,675 $ (27 ) $ 2,559 $ (42 ) $ 8,234 $ (69 ) Mortgage-backed securities 35,205 (319 ) 14,673 (371 ) 49,878 (690 ) State and political subdivisions 905 (4 ) 326 (14 ) 1,231 (18 ) $ 41,785 $ (350 ) $ 17,558 $ (427 ) $ 59,343 $ (777 ) ($ in thousands) Less than 12 Months 12 Months or Longer Total December 31, 2016 Unrealized Losses Unrealized Losses Unrealized Losses Securities: U.S. Treasury and Government agencies $ 6,044 $ (52 ) $ - $ - $ 6,044 $ (52 ) Mortgage-backed securities 44,344 (607 ) 703 (29 ) 45,047 (636 ) State and political subdivisions 1,095 (39 ) - - 1,095 (39 ) $ 51,483 $ (698 ) $ 703 $ (29 ) $ 52,186 $ (727 ) Less than 12 Months 12 Months or Longer Total December 31, 2020 Fair Value Unrealized Losses Fair Value Unrealized Losses Fair Value Unrealized Losses U.S. Treasury and Government agencies $ - $ - $ - $ - $ - $ - Mortgage-backed securities 26,582 (54 ) 717 (3 ) 27,299 (57 ) State and political subdivisions - - - - - - Other corporate securities - - - - - - Totals $ 26,582 $ (54 ) $ 717 $ (3 ) $ 27,299 $ (57 ) has increased by $0.05$3.6 million as of December 31, 2017,2021, from the prior year. Management reviews these securities on a quarterly basis and has determined that no impairment exists. Management evaluates securities for other-than-temporary impairment at least on a quarterly basis, and more frequently when economic or market concern warrants such evaluation. When the Company does not intend to sell a debt security, and it is more likely than not the Company will not have to sell the security before recovery of its cost basis, it recognizes the credit component of an other-than-temporary impairment of a debt security in earnings and the remaining portion in other comprehensive income.F-144:5: Loans and Allowance for Loan LossesCategoriesThe following tables present the categories of loans at December 31, include:2021 and 2020: Total Loans Nonaccrual Loans ($ in thousands) Dec. 2017 Dec. 2016 Dec. 2017 Dec. 2016 Commercial & Industrial $ 101,554 $ 108,752 121 190 Commercial RE & Construction 332,154 284,084 1,322 1,194 Agricultural & Farmland 51,947 52,475 - 4 Residential Real Estate 150,854 142,452 1,123 1,162 Consumer & Other 59,619 56,335 138 187 Total Loans $ 696,128 $ 644,098 $ 2,704 $ 2,737 Unearned Income $ 487 $ 335 Total Loans, net of unearned income $ 696,615 $ 644,433 Allowance for loan losses $ (7,930 ) $ (7,725 ) Total Loans Nonaccrual Loans ($ in thousands) December
2021 December
2020 December
2021 December
2020 Commercial & industrial $ 122,250 $ 204,767 $ 143 $ 902 Commercial real estate - owner occupied 118,891 113,169 88 1,450 Commercial real estate - nonowner occupied 262,277 257,651 466 962 Agricultural 57,403 55,235 - - Residential real estate 206,424 182,165 2,484 2,704 Home equity line of credit (HELOC) 41,682 46,310 464 390 Consumer 13,474 14,847 7 18 Total loans $ 822,401 $ 874,144 $ 3,652 $ 6,426 Net deferred costs (fees) $ 313 $ (1,421 ) Total loans, net deferred costs (fees) $ 822,714 $ 872,723 Allowance for loan losses $ (13,805 ) $ (12,574 ) State BankThe Company makes commercial, agri-business, consumer and residential loans to customers throughout its defined market area. Commitments to extend credit are agreements to lend to a customer as long as there is no violation of any condition established in the contract. Commitments generally have fixed expiration dates or other termination clauses and may require payment of a fee. Since a portion of the commitments may expire without being drawn upon, the total commitment amounts do not necessarily represent future cash requirements. Each customer’s creditworthiness is evaluated on a case-by-case basis. The amount of collateral obtained, if deemed necessary, is based on management’s credit evaluation of the customer. Collateral held varies, but may include accounts receivable, inventory, property, plant and equipment, commercial real estate and residential real estate.State Bankthe Company to guarantee the performance of a customer to a third party. Those guarantees are primarily issued to support public and private borrowing arrangements, including commercial paper, bond financing and similar transactions. The credit risk involved in issuing letters of credit is essentially the same as that involved in extending loans to customers.held for salesheld-for-sales since the Company is exposed to interest rate risk during the period between issuing a loan commitment and the salessale of the loan into the secondary market.20172021 and 2016.2020.($ in thousands) 2017 2016 Loan commitments and unused lines of credit $ 170,437 $ 143,553 Standby letters of credit 1,643 708 Total $ 172,080 $ 144,261 F-15($ in thousands) 2021 2020 Loan commitments and unused lines of credit $ 219,618 $ 215,616 Standby letters of credit 2,060 3,161 Totals $ 221,678 $ 218,777 including Construction(Owner and Nonowner Occupied)nonowner-occupiednon-owner-occupied loans.Home equity loansHELOCs are typically secured by a subordinate interest in 1-4 family residences, and consumer personal loans are secured by consumer personal assets, such as automobiles or recreational vehicles. Some consumer personal loans are unsecured, such as small installment loans and certain lines of credit. Repayment of these loans is primarily dependent on the personal income of the borrowers, which can be impacted by economic conditions in their market areas, such as unemployment levels. Repayment can also be impacted by changes in property values on residential properties. Risk is mitigated by the fact that these loans are of smaller individual amounts and spread over a large number of borrowers.F-162017, 20162021 and 2015:2020: Commercial Commercial RE Agricultural Residential Consumer ($ in thousands) & Industrial & Construction & Farmland Real Estate & Other Total ALLOWANCE FOR LOAN AND LEASE LOSSES For the Twelve Months Ended December 31, 2017 Beginning balance $ 1,204 $ 3,321 $ 347 $ 1,963 $ 890 $ 7,725 Charge offs (50 ) (26 ) - (61 ) (94 ) $ (231 ) Recoveries 5 2 5 6 18 36 Provision (336 ) 482 153 221 (120 ) 400 Ending Balance $ 823 $ 3,779 $ 505 $ 2,129 $ 694 $ 7,930 Loans Receivable at December 31, 2017 Allowance: Ending balance: individually evaluated for impairment $ - $ 146 $ - $ 178 $ 5 $ 329 Ending balance: collectively evaluated for impairment $ 823 $ 3,633 $ 505 $ 1,951 $ 689 $ 7,601 Loans: Ending balance: individually evaluated for impairment $ - $ 1,385 $ - $ 1,830 $ 197 $ 3,412 Ending balance: collectively evaluated for impairment $ 101,554 $ 330,769 $ 51,947 $ 149,024 $ 59,422 $ 692,716 Commercial Commercial RE Agricultural Residential Consumer ($ in thousands) & Industrial & Construction & Farmland Real Estate & Other Total ALLOWANCE FOR LOAN AND LEASE LOSSES For the Twelve Months Ended December 31, 2016 Beginning balance $ 914 $ 3,886 $ 204 $ 1,312 $ 674 $ 6,990 Charge offs (135 ) (241 ) - (20 ) (105 ) $ (501 ) Recoveries 408 5 12 2 59 486 Provision 17 (329 ) 131 669 262 750 Ending Balance $ 1,204 $ 3,321 $ 347 $ 1,963 $ 890 $ 7,725 Loans Receivable at December 31, 2016 Allowance: Ending balance: individually evaluated for impairment $ 50 $ 119 $ - $ 124 $ 7 $ 300 Ending balance: collectively evaluated for impairment $ 1,154 $ 3,202 $ 347 $ 1,839 $ 883 $ 7,425 Loans: Ending balance: individually evaluated for impairment $ 50 $ 1,578 $ - $ 1,919 $ 248 $ 3,795 Ending balance: collectively evaluated for impairment $ 108,702 $ 282,506 $ 52,475 $ 140,533 $ 56,087 $ 640,303 ($ in thousands)
For the Twelve Months Ended
December 31, 2021 Commercial & industrial Commercial real estate Agricultural Residential real estate Consumer Total Beginning balance $ 3,074 $ 5,451 $ 496 $ 2,534 $ 1,019 $ 12,574 Charge offs - - - (43 ) (93 ) (136 ) Recoveries 227 - - 49 41 317 Provision (1,411 ) 1,330 103 975 53 1,050 Ending balance $ 1,890 $ 6,781 $ 599 $ 3,515 $ 1,020 $ 13,805 F-17 Commercial Commercial RE Agricultural Residential Consumer ($ in thousands) & Industrial & Construction & Farmland Real Estate & Other Total ALLOWANCE FOR LOAN AND LEASE LOSSES For the Twelve Months Ended December 31, 2015 Beginning balance $ 1,630 $ 2,857 $ 208 $ 1,308 $ 768 $ 6,771 Charge offs (497 ) (303 ) - (56 ) (96 ) $ (952 ) Recoveries 26 3 3 29 10 71 Provision (245 ) 1,329 (7 ) 31 (8 ) 1,100 Ending Balance $ 914 $ 3,886 $ 204 $ 1,312 $ 674 $ 6,990 Loans Receivable at December 31, 2015 Allowance: Ending balance: individually evaluated for impairment $ - $ 1,759 $ - $ 167 $ 37 $ 1,963 Ending balance: collectively evaluated for impairment $ 914 $ 2,127 $ 204 $ 1,145 $ 637 $ 5,027 Loans: Ending balance: individually evaluated for impairment $ 126 $ 5,754 $ - $ 1,713 $ 464 $ 8,057 Ending balance: collectively evaluated for impairment $ 86,416 $ 236,454 $ 43,835 $ 129,093 $ 53,760 $ 549,558 December 31, 2021 Commercial & industrial Commercial real estate Agricultural Residential real estate Consumer Total Allowance: Ending balance: individually evaluated for impairment $ - $ 10 $ - $ 120 $ 3 $ 133 Ending balance: collectively evaluated for impairment $ 1,890 $ 6,771 $ 599 $ 3,395 $ 1,017 $ 13,672 Totals $ 1,890 $ 6,781 $ 599 $ 3,515 $ 1,020 $ 13,805 Loans: Ending balance: individually evaluated for impairment $ 118 $ 354 $ - $ 2,307 $ 135 $ 2,914 Ending balance: collectively evaluated for impairment $ 122,132 $ 380,814 $ 57,403 $ 204,117 $ 55,021 $ 819,487 Totals $ 122,250 $ 381,168 $ 57,403 $ 206,424 $ 55,156 $ 822,401 ($ in thousands)
For the Twelve Months Ended
December 31, 2020 Commercial & industrial Commercial real estate Agricultural Residential real estate Consumer Total Beginning balance $ 1,883 $ 3,602 $ 434 $ 2,203 $ 633 $ 8,755 Charge offs (582 ) - - (82 ) (79 ) (743 ) Recoveries 16 - - 40 6 62 Provision (credit) 1,757 1,849 62 373 459 4,500 Ending balance $ 3,074 $ 5,451 $ 496 $ 2,534 $ 1,019 $ 12,574 December 31, 2020 Commercial & industrial Commercial real estate Agricultural Residential real estate Consumer Total Allowance: Ending balance: individually evaluated for impairment $ - $ 174 $ - $ 160 $ 3 $ 337 Ending balance: collectively evaluated for impairment $ 3,074 $ 5,277 $ 496 $ 2,374 $ 1,016 $ 12,237 Totals $ 3,074 $ 5,451 $ 496 $ 2,534 $ 1,019 $ 12,574 Loans: Ending balance: individually evaluated for impairment $ 849 $ 2,202 $ - $ 2,746 $ 162 $ 5,959 Ending balance: collectively evaluated for impairment $ 203,918 $ 368,618 $ 55,235 $ 179,419 $ 60,995 $ 868,185 Totals $ 204,767 $ 370,820 $ 55,235 $ 182,165 $ 61,157 $ 874,144 F-18Lossloss when it is neither practical nor desirable to defer writing off or reserving all or a portion of a basically worthless asset, even though partial recovery may be possible at some time in the future.20172021 and 2016:2020:($ in thousands)
December 31, 2021 Commercial & industrial Commercial real estate - owner occupied Commercial real estate - nonowner occupied Agricultural Residential real estate HELOC Consumer Total Pass (1 - 4) $ 121,285 $ 111,232 $ 253,269 $ 57,403 $ 203,295 $ 41,218 $ 13,467 $ 801,169 Special Mention (5) 659 7,571 5,694 - - - - 13,924 Substandard (6) 188 - 2,848 - 3,102 464 7 6,609 Doubtful (7) 118 88 466 - 27 - - 699 Loss (8) - - - - - - - - Total Loans $ 122,250 $ 118,891 $ 262,277 $ 57,403 $ 206,424 $ 41,682 $ 13,474 $ 822,401 December 31, 2017
($ in thousands) Commercial
& Industrial Commercial RE
& Construction Agricultural
& Farmland Residential
Real Estate Consumer
& Other Total 1-2 $ 96 $ 13 $ - $ 832 $ 1 $ 942 3 19,883 93,222 8,080 114,130 57,204 292,519 4 80,448 236,217 43,735 34,271 2,151 396,822 Total Pass (1 - 4) 100,427 329,452 51,815 149,233 59,356 690,283 Special Mention (5) 512 1,100 132 - 66 1,810 Substandard (6) 7 580 - 1,583 197 2,367 Doubtful (7) 608 1,046 - 38 - 1,668 Loss (8) - - - - - - Total Loans $ 101,554 $ 332,154 $ 51,947 $ 150,854 $ 59,619 $ 696,128 December 31, 2020 Commercial & industrial Commercial real estate - owner occupied Commercial real estate - nonowner occupied Agricultural Residential real estate HELOC Consumer Total Pass (1 - 4) $ 202,543 $ 108,726 $ 250,405 $ 55,227 $ 178,575 $ 45,866 $ 14,807 $ 856,149 Special Mention (5) 1,485 2,993 3,338 - - - 14 7,830 Substandard (6) 151 - 3,026 8 3,560 444 26 7,215 Doubtful (7) 588 1,450 882 - 30 - - 2,950 Loss (8) - - - - - - - - Total Loans $ 204,767 $ 113,169 $ 257,651 $ 55,235 $ 182,165 $ 46,310 $ 14,847 $ 874,144 December 31, 2016 Commercial Commercial RE Agricultural Residential Consumer ($ in thousands) & Industrial & Construction & Farmland Real Estate & Other Total 1-2 $ 1,149 $ 33 $ 9 $ 234 $ 3 $ 1,428 3 28,461 89,406 9,985 113,403 53,386 294,641 4 78,517 188,007 42,481 26,510 2,625 338,140 Total Pass (1 - 4) 108,127 277,446 52,475 140,147 56,014 634,209 Special Mention (5) - 5,030 - 518 123 5,671 Substandard (6) 150 1,291 - 625 61 2,127 Doubtful (7) 475 317 - 1,162 137 2,091 Loss (8) - - - - - - Total Loans $ 108,752 $ 284,084 $ 52,475 $ 142,452 $ 56,335 $ 644,098 three-yearfive-year average of historical losses for the general component of the allowance for loan loss calculation. No significant changes were made to the loan risk grading system definitions and allowance for loan loss methodology during the periods presented.20172021 and 2016:2020:($ in thousands)
December 31, 2017 30-59 Days Past Due 60-89 Days Past Due Greater Than 90 Days Total Past
Due Current Total Loans
Receivable Commercial & Industrial $ 85 $ - $ 88 $ 173 $ 101,381 $ 101,554 Commercial RE & Construction 110 - 1,086 1,196 330,958 332,154 Agricultural & Farmland - - - - 51,947 51,947 Residential Real Estate 484 379 433 1,296 149,558 150,854 Consumer & Other 182 21 103 306 59,313 59,619 Total Loans $ 861 $ 400 $ 1,710 $ 2,971 $ 693,157 $ 696,128 ($ in thousands)
December 31, 2021 30-59 Days
Past Due 60-89 Days
Past Due Greater Than
90 Days Past Due Total Past
Due Current Total Loans
Receivable Commercial & industrial $ 166 $ 25 $ 118 $ 309 $ 121,941 $ 122,250 Commercial real estate - owner occupied - - 88 88 118,803 118,891 Commercial real estate - nonowner occupied 221 233 246 700 261,577 262,277 Agricultural - - - - 57,403 57,403 Residential real estate 265 716 1,344 2,325 204,099 206,424 HELOC 53 80 248 381 41,301 41,682 Consumer 20 14 7 41 13,433 13,474 Total Loans $ 725 $ 1,068 $ 2,051 $ 3,844 $ 818,557 $ 822,401 ($ in thousands)
December 31, 2016 30-59 Days Past Due 60-89 Days
Past Due Greater Than 90 Days Total Past
Due Current Total Loans
Receivable Commercial & Industrial $ 35 $ 50 $ 104 $ 189 $ 108,563 $ 108,752 Commercial RE & Construction 254 883 59 1,196 282,888 284,084 Agricultural & Farmland - - - - 52,475 52,475 Residential Real Estate 123 201 115 439 142,013 142,452 Consumer & Other 185 45 148 378 55,957 56,335 Total Loans $ 597 $ 1,179 $ 426 $ 2,202 $ 641,896 $ 644,098 December 31, 2020 30-59 Days
Past Due 60-89 Days
Past Due Greater Than
90 Days Past Due Total Past
Due Current Total Loans
Receivable Commercial & industrial $ 380 $ - $ 618 $ 998 $ 203,769 $ 204,767 Commercial real estate - owner occupied - - 1,450 1,450 111,719 113,169 Commercial real estate - nonowner occupied - 141 699 840 256,811 257,651 Agricultural 8 - - 8 55,227 55,235 Residential real estate 12 1,393 1,212 2,617 179,548 182,165 HELOC 190 74 198 462 45,848 46,310 Consumer 123 42 20 185 14,662 14,847 Total Loans $ 713 $ 1,650 $ 4,197 $ 6,560 $ 867,584 $ 874,144 F-19State Bankthat the Company will be unable to collect all amounts due from the borrower in accordance with the contractual terms of the loan. Impaired loans include nonperforming commercial loans but also include loans modified in troubled debt restructuringsa Troubled Debt Restructure (“TDR”) where concessions have been granted to borrowers experiencing financial difficulties. These concessions could include a reduction in the interest rate on the loan, payment extensions, forgiveness of principal, forbearance or other actions intended to maximize collection.20172021 and 2016 and 2015:2020:Twelve Months Ended
December 31, 2017 Recorded Unpaid Principal Related Average Recorded Interest Income Investment Balance Allowance Investment Recognized With no related allowance recorded: Commercial & Industrial $ - $ - $ - $ - $ - Commercial RE & Construction 696 722 - 756 34 Agricultural & Farmland - - - - - Residential Real Estate 752 795 - 1,460 67 Consumer & Other 110 110 - 128 9 With a specific allowance recorded: Commercial & Industrial - - - - - Commercial RE & Construction 689 689 146 713 - Agricultural & Farmland - - - - - Residential Real Estate 1,078 1,097 178 628 25 Consumer & Other 87 87 5 91 5 Totals: Commercial & Industrial $ - $ - $ - $ - $ - Commercial RE & Construction $ 1,385 $ 1,411 $ 146 $ 1,469 $ 34 Agricultural & Farmland $ - $ - $ - $ - $ - Residential Real Estate $ 1,830 $ 1,892 $ 178 $ 2,088 $ 92 Consumer & Other $ 197 $ 197 $ 5 $ 219 $ 14 Twelve Months Ended
December 31, 2016 Recorded Unpaid Principal Related Average Recorded Interest Income Investment Balance Allowance Investment Recognized With no related allowance recorded: Commercial & Industrial $ - $ - $ - $ - $ - Commercial RE & Construction 637 637 - 655 24 Agricultural & Farmland - - - - - Residential Real Estate 1,248 1,290 - 1,470 70 Consumer & Other 129 129 - 151 11 With a specific allowance recorded: Commercial & Industrial 50 50 50 50 3 Commercial RE & Construction 941 941 119 1,010 45 Agricultural & Farmland - - - - - Residential Real Estate 671 672 124 751 30 Consumer & Other 119 118 7 123 7 Totals: Commercial & Industrial $ 50 $ 50 $ 50 $ 50 $ 3 Commercial RE & Construction $ 1,578 $ 1,578 $ 119 $ 1,665 $ 69 Agricultural & Farmland $ - $ - $ - $ - $ - Residential Real Estate $ 1,919 $ 1,962 $ 124 $ 2,221 $ 100 Consumer & Other $ 248 $ 247 $ 7 $ 274 $ 18 ($ in thousands) Recorded Unpaid Principal Related Average Recorded Interest Income Twelve Months Ended December 31, 2021 Investment Balance Allowance Investment Recognized With no related allowance recorded: Commercial & industrial $ 118 $ 204 $ - $ 217 $ 2 Commercial real estate - owner occupied 88 88 - 88 - Commercial real estate - nonowner occupied 223 223 - 357 28 Agricultural - - - - - Residential real estate 1,391 1,458 - 1,663 60 HELOC 33 33 41 2 Consumer - - - - - With a specific allowance recorded: Commercial & industrial - - - - - Commercial real estate - owner occupied - - - - - Commercial real estate - nonowner occupied 43 173 10 173 - Agricultural - - - - - Residential real estate 916 916 120 933 20 HELOC 102 102 3 124 5 Consumer - - - - - Totals: Commercial & industrial $ 118 $ 204 $ - $ 217 $ 2 Commercial real estate - owner occupied $ 88 $ 88 $ - $ 88 $ - Commercial real estate - nonowner occupied $ 266 $ 396 $ 10 $ 530 $ 28 Agricultural $ - $ - $ - $ - $ - Residential real estate $ 2,307 $ 2,374 $ 120 $ 2,596 $ 80 HELOC $ 135 $ 135 $ 3 $ 165 $ 7 Consumer $ - $ - $ - $ - $ - F-20($ in thousands) Recorded Unpaid Principal Related Average Recorded Interest Income Twelve Months Ended December 31, 2020 Investment Balance Allowance Investment Recognized With no related allowance recorded: Commercial & industrial $ 849 $ 1,645 $ - $ 1,878 $ 50 Commercial real estate - owner occupied 1,441 1,441 - 1,573 11 Commercial real estate - nonowner occupied 182 182 - 258 14 Agricultural - - - - - Residential real estate 1,017 1,084 - 1,243 64 HELOC 89 89 98 4 Consumer 7 7 - 12 1 With a specific allowance recorded: Commercial & industrial - - - - - Commercial real estate - owner occupied - - - - - Commercial real estate - nonowner occupied 579 579 174 579 3 Agricultural - - - - - Residential real estate 1,729 1,774 160 1,785 14 HELOC 66 66 3 83 6 Consumer - - - - - Totals: Commercial & industrial $ 849 $ 1,645 $ - $ 1,878 $ 50 Commercial real estate - owner occupied $ 1,441 $ 1,441 $ - $ 1,573 $ 11 Commercial real estate - nonowner occupied $ 761 $ 761 $ 174 $ 837 $ 17 Agricultural $ - $ - $ - $ - $ - Residential real estate $ 2,746 $ 2,858 $ 160 $ 3,028 $ 78 HELOC $ 155 $ 155 $ 3 $ 181 $ 10 Consumer $ 7 $ 7 $ - $ 12 $ 1 Twelve Months Ended
December 31, 2015 Recorded Unpaid Principal Related Average Recorded Interest Income Investment Balance Allowance Investment Recognized With no related allowance recorded: Commercial & Industrial $ 126 $ 1,214 $ - $ 1,388 $ - Commercial RE & Construction 1,110 1,110 - 1,206 27 Agricultural & Farmland - - - - - Residential Real Estate 657 657 - 862 52 Consumer & Other 90 90 - 107 9 With a specific allowance recorded: Commercial & Industrial - - - - - Commercial RE & Construction 4,644 4,893 1,759 5,006 90 Agricultural & Farmland - - - - - Residential Real Estate 1,056 1,013 167 1,084 45 Consumer & Other 374 374 37 385 22 Totals: Commercial & Industrial $ 126 $ 1,214 $ - $ 1,388 $ - Commercial RE & Construction $ 5,754 $ 6,003 $ 1,759 $ 6,212 $ 117 Agricultural & Farmland $ - $ - $ - $ - $ - Residential Real Estate $ 1,713 $ 1,670 $ 167 $ 1,946 $ 97 Consumer & Other $ 464 $ 464 $ 37 $ 492 $ 31 (TDR) Loans● Interest rate reduction: A reduction of the stated interest rate to a nonmarket rate for the remaining original life of the debt. The Company also may grant interest rate concessions for a limited timeframe on a case by case basis. ● Amortization or maturity date change beyond what the collateral supports, including a change that does any of the following: (1) Lengthens the amortization period of the amortized principal beyond market terms. This concession reduces the minimum monthly payment and increases the amount of the balloon payment at the end of the term of the loan. Principal is generally not forgiven. (2) Reduces the amount of loan principal to be amortized. This concession also reduces the minimum monthly payment and increases the amount of the balloon payment at the end of the term of the loan. Principal is generally not forgiven. (3) Extends the maturity date or dates of the debt beyond what the collateral supports. This concession generally applies to loans without a balloon payment at the end of the term of the loan. In addition, there may be instances where renewing loans potentially require non-market terms and would then be reclassified as TDRs. ● Other: A concession that is not categorized as one of the concessions described above. These concessions include, but are not limited to: principal forgiveness, collateral concessions, covenant concessions, and reduction of accrued interest. Principal forgiveness may result from any TDR modification of any concession type. F-21tables below presentfollowing table represents new TDR activity for the activity of TDRs during the yearstwelve months ended December 31, 2017, 2016 and 2015:2021:($ in thousands) Number of
Loans Pre-
Modification
Recorded Balance Post
Modification
Recorded Balance HELOC 2 $ 42 $ 42 Total modifications 2 $ 42 $ 42 Interest
Only Term Combination Total
Modification HELOC $ - $ - $ 42 $ 42 Total modifications $ - $ - $ 42 $ 42 waswere no new TDRs during the period ended December 31, 2017.2020.There was no increase in the allowance for loan losses due to TDRs in the twelve-month period ended December 31, 2017.were originatedhave subsequently defaulted.subsequently defaulted withintitled the prior 12 months.“Interagency Statement on Loan Modifications and Reporting for Financial Institutions Working with Customers Affected by the Coronavirus” (the “Interagency Statement”) that encouraged financial institutions to work prudently with borrowers unable to meet the contractual payment obligations due to the effects of COVID-19. Additionally, Section 4013 of the CARES Act further provided that a qualified loan modification is exempt by law from classification as a troubled debt restructure as defined by GAAP, from the period beginning March 1, 2020 until the earlier of December 31, 2021 or the date that is 60 days after the date on which the national emergency concerning the COVID-19 outbreak under the National Emergencies Act (50 U.S.C. 1601 et seq.) terminates. As of December 31, 2021, all loans previously modified under Section 4013 of the CARES Act had returned to normal payment terms. December 31, 2016 ($ in thousands) Number of Loans Pre-
Modification
Recorded
Balance Post
Modification
Recorded
Balance Residential Real Estate 1 $ 220 $ 220 Commercial 1 307 307 Total Modifications 2 $ 527 $ 527 ($ in thousands) Term Combination Total
Modification Residential Real Estate $ - $ 220 $ - $ 220 Commercial - 307 - 307 Total Modifications $ - $ 527 $ - $ 527 ThereThe Company was no increasean active participant in the allowance for loan losses due to TDRsPPP initiative as detailed in the twelve-month period endeddiscussion of financial results for 2021 and 2020. The Company originated approximately 1,100 loans with a total balance of $111.4 million. As of December 31, 2016.There was no TDRs2021, $2.0 million in balances remained outstanding. Fees for the period ended December 31, 2016 that defaulated on their adjusted obligation.originations totaled $4.9 million of which $3.4 million and $1.4 million were taken into income during 2021 and 2020, respectively. December 31, 2015 ($ in thousands) Number of Loans Pre-
Modification
Recorded
Balance Post
Modification
Recorded
Balance Residential Real Estate 1 $ 22 $ 22 Commercial 1 314 314 Consumer & Other 1 39 39 Total Modifications 3 $ 375 $ 375 ($ in thousands) Interest
Only Term Combination Total
Modification Residential Real Estate $ - $ 22 $ - $ 22 Commercial - 314 - 314 Consumer & Other - 39 - 39 Total Modifications $ - $ 375 $ - $ 375 There was no increaseThe Company acquired loans in the allowance for loan losses due to TDRs inacquisition of Edon State Bank, effective June 5, 2020. None of the twelve month period ended December 31, 2015.acquired loans had evidence of deterioration of credit quality since origination, and it was probable, at acquisition, that all contractually required payments would be collected.There was no TDR’s forThe following table presents the period ended December 31, 2015 that defaulated on their adjusted obligation.F-22Note 5: Mortgage Banking and Servicing RightsMortgagecarrying amount of the acquired loans serviced for others are not included in the accompanying consolidated balance sheets. The unpaid principal balance of mortgage loans serviced for others approximated $994.9 million, $899.7 million, and $772.5 millionsheet at December 31, 2017, 2016 and 2015, respectively. Contractually specified servicing fees31:($ in thousands) 2021 2020 Commercial & industrial $ 1,067 $ 1,499 Commercial real estate - nonowner occupied 97 505 Agricultural 6,655 9,180 Residential real estate 2,408 3,176 Consumer 33 93 Total loans $ 10,260 $ 14,453 approximately $2.4 million, $2.1 million, and $1.8 million were included in mortgage loan servicing fees in the income statement for the years ended December 31, 2017, 20162021 is $0.2 million.2015, respectively.EquipmentThe following table summarizes mortgage servicing rights capitalized and related amortization, along with activity in the related valuation allowance:($ in thousands) 2021 2020 Land $ 3,549 $ 3,996 Buildings and improvements 27,475 26,743 Equipment 13,398 11,506 Construction in process 655 997 45,077 43,242 Less accumulated depreciation (21,865 ) (19,685 ) Net premises and equipment $ 23,212 $ 23,557 ($ in thousands) 2017 2016 Carrying amount, beginning of year $ 8,422 $ 7,152 Mortgage servicing rights capitalized during the year 2,540 2,542 Mortgage servicing rights amortization during the year (1,132 ) (1,340 ) Net change in valuation allowance 77 68 Carrying amount, end of year $ 9,907 $ 8,422 Valuation allowance: Beginning of year $ 228 $ 296 Reduction (77 ) (68 ) End of year $ 151 $ 228 Fair Value, beginning of period $ 9,656 $ 7,760 Fair Value, end of period $ 11,338 $ 9,656 Note 6: Derivative Financial InstrumentsThe Company is exposed to certain risks arising from both its business operations and economic conditions. The Company manages its exposures to a wide variety of business and operational risks primarily through management of its core business activities. The Company manages economic risks, including interest rate, liquidity and credit risk, primarily by managing the amount, sources and duration of its assets and liabilities and through the use of derivative financial instruments. Specifically,On December 31, 2021, the Company enters into derivative financial instruments to manage exposures that arise from business activities that resultpurchased an Ohio based title agency resulting in the receipt or payment of future known and uncertain cash amounts, the value of which are determined by interest rates. The Company’s derivative financial instruments are used to manage differencesapproximately $1.1 million in the amount, timing and duration of the Company’s known or expected cash payments principally related to certain variable-rate assets.The Company does not use derivatives for trading or speculative purposes. Derivatives not designated as hedges are not speculative and result from a servicegoodwill. On June 5, 2020, the Company provides to certain customers.acquired Edon Bancorp and its subsidiary, Edon State Bank. The Company executes interest rate swaps with commercial banking customers to facilitate their respective risk management strategies. Those interest rate swaps are simultaneously hedged by offsetting interest rate swaps that the Company executes with a third party, such that the Company minimizes its net risk exposure resulting from such transactions. As the interest rate swaps associated with this program do not meet the strict hedge accounting requirements, changesacquisition resulted in the fair valueapproximately $4.3 million in goodwill. The balance of both the customer swaps and the offsetting swaps are recognized directly in earnings. Asgoodwill as of December 31, 2017, the notional amount of customer-facing swaps was approximately $39.3 million, as compared to $33.2 million at2021 and December 31, 2016. This amount2020 was $23.2 million and $22.1 million, respectively.($ in thousands) Twelve Months Ended
December 31,
2021
Carrying Amount Twelve Months Ended
December 31,
2020
Carrying Amount Beginning balance $ 22,091 $ 17,792 Acquired goodwill 1,100 4,325 Measurement period adjustments - (26 ) Ending balance $ 23,191 $ 22,091 offset with third party counterparties, as described above. The Company has minimum collateral posting thresholds with its derivative counterparties. Astested on the last day of the last quarter of each calendar year. At December 31, 2017,2021, the Company had no cash posted as collateral.F-23Fair Values of Derivative Instruments on the Balance SheetThe table below presentselected to perform a qualitative assessment to determine if it was more likely than not that the fair value of the Company’s derivative financial instruments,reporting unit exceeded its carrying value, including goodwill. The qualitative assessment indicated that it was more likely than not that the fair value of the reporting unit exceeded its carrying value, resulting in no impairment.well as their classification on the Balance Sheet, as offollows at December 31, 2017 and 2016.31: Asset Derivatives Liability Derivatives December 31, 2017 December 31, 2017 ($ in thousands) Balance Sheet Location Fair Value Balance Sheet Location Fair Value Derivatives not designated as hedging instruments: Interest rate contracts Other Assets $ 698 Other Liabilities $ 698 2021 2020 Gross Carrying Accumulated Gross Carrying Accumulated ($ in thousands) Amount Amortization Amount Amortization Core deposits intangible $ 660 $ (104 ) $ 5,359 $ (4,735 ) Customer relationship intangible 200 (173 ) 200 (170 ) Banking intangibles $ 860 $ (277 ) $ 5,559 $ (4,905 ) Asset Derivatives Liability Derivatives December 31, 2016 December 31, 2016 ($ in thousands) Balance Sheet Location Fair Value Balance Sheet Location Fair Value Derivatives not designated as hedging instruments: Interest rate contracts Other Assets $ 623 Other Liabilities $ 623 The Company’s derivative financial instruments had no net effect on the Income StatementAmortization expense for intangibles for the years ended December 31, 2017, 20162021 and 2015.2020 was $0.07 million and $0.05 million, respectively. Estimated amortization expense for each of the following five years is immaterial.Note 7: PremisesMortgage loans serviced for others are not included in the accompanying balance sheets. The unpaid principal balance of mortgage loans serviced for others approximated $1.4 billion and EquipmentMajor classifications of premises and equipment stated at cost were as follows$1.3 billion at December 31:31, 2021 and 2020, respectively. Contractually specified servicing fees of approximately $3.1 million and $3.2 million were included in mortgage loan servicing fees in the income statement for the years ended December 31, 2021 and 2020, respectively.($ in thousands) 2017 2016 Land $ 3,514 $ 2,907 Buildings and improvements 23,496 19,431 Equipment 11,564 11,042 Construction in process 404 2,429 38,978 35,809 Less accumulated depreciation (17,701 ) (16,680 ) Net premises and equipment $ 21,277 $ 19,129 For the coming year, the Company has plans, but no commitments, for premises and equipment purchases. These expenditures will be funded by cash on hand and from cash generated from current operations.F-24($ in thousands) 2021 2020 Carrying amount, beginning of year $ 7,759 $ 11,017 Mortgage servicing rights capitalized during the year 4,724 5,090 Mortgage servicing rights amortization during the year (3,885 ) (4,762 ) Net change in valuation allowance 3,436 (3,586 ) Carrying amount, end of year $ 12,034 $ 7,759 Valuation allowance: Beginning of year $ 4,892 $ 1,306 Increase (reduction) (3,436 ) 3,586 End of year $ 1,456 $ 4,892 Fair value, beginning of period $ 7,759 $ 11,864 Fair value, end of period $ 12,629 $ 7,759 Note 8: GoodwillIntangibleseconomic conditions. The Company manages its exposures to a wide variety of business and operational risks primarily through management of its core business activities. The Company manages economic risks, including interest rate, liquidity and credit risk, primarily by managing the amount, sources and duration of its assets and liabilities and through the use of derivative financial instruments. Specifically, the Company enters into derivative financial instruments to manage exposures that arise from business activities that result in the receipt or payment of future known and uncertain cash amounts, the value of which are determined by interest rates. The Company’s derivative financial instruments are used to manage differences in the amount, timing and duration of the Company’s known or expected cash payments principally related to certain variable-rate assets.balance of goodwillCompany does not use derivatives for trading or speculative purposes. Derivatives not designated as of December 31, 2017hedges are not speculative and December 31, 2016 was $16.4 million. Noresult from a service the Company provides to certain customers. The Company executes interest rate swaps with commercial banking customers to facilitate their respective risk management strategies. Those interest rate swaps are simultaneously hedged by offsetting interest rate swaps that the Company executes with a third party, such that the Company minimizes its net risk exposure resulting from such transactions. As the interest rate swaps associated with this program do not meet the strict hedge accounting requirements, changes in goodwill were noted during 2017 or 2016. Goodwill is tested on the last day of the last quarter of each calendar year.Impairment exists when a reporting unit’s carrying value of goodwill exceeds its fair value. At December 31, 2017, the Company’s reporting unit had positive equity and the Company elected to perform a qualitative assessment to determine if it was more likely than not that the fair value of both the reporting unit exceeded its carryingcustomer swaps and the offsetting swaps are recognized directly in earnings.including goodwill.with changes in fair value reflected in noninterest income on the consolidated statements of income. The qualitative assessment indicated that it was more likely than not thatfair value of derivative instruments with a positive fair value are reported in accrued income and other assets in the consolidated balance sheets, while derivative instruments with a negative fair value are reported in accrued expenses and other liabilities in the consolidated balance sheets.reporting unit exceeded its carrying value, resulting in no impairment.Carrying basisCompany’s interest rate swaps, IRLCs and accumulated amortization of intangible assets were as followsforward contracts utilized at December 31: 2021 2020 Notional Fair Notional Fair ($ in thousands) Amount Value Amount Value Asset Derivatives Derivatives not designated as hedging instruments Interest rate swaps associated with loans $ 84,733 $ 3,655 $ 87,687 $ 7,962 IRLCs 21,391 22 46,130 278 Total contracts $ 106,124 $ 3,677 $ 133,817 $ 8,240 Liability Derivatives Derivatives not designated as hedging instruments Interest rate swaps associated with loans $ 84,733 $ (3,655 ) $ 87,687 $ (7,962 ) Forward contracts 25,000 (32 ) 50,000 (265 ) Total contracts $ 109,733 $ (3,687 ) $ 137,687 $ (8,227 ) 2017 2016 Gross Carrying Accumulated Gross Carrying Accumulated ($ in thousands) Amount Amortization Amount Amortization Core deposits intangible $ 4,698 $ (4,682 ) $ 4,698 $ (4,675 ) Customer relationship intangible 200 (158 ) 200 (153 ) Banking intangibles 4,898 (4,840 ) 4,898 (4,828 ) Amortization expensecore deposits and othernon-hedging derivative financial instruments for the yearstwelve months ended December 31, 2017, 20162021 and 2015 was $0.01, $0.012020. Amount of gain (loss) ($ in thousands) Statement of income classification 2021 2020 Interest rate swap contracts Other income $ 242 $ 355 IRLCs Gain on sale of mortgage loans & OMSR (256 ) 223 Forward contracts Gain on sale of mortgage loans & OMSR 233 (233 ) $0.20 million, respectively. Estimated amortization expense for eachderivative assets at December 31, 2021 and 2020. Gross amounts Gross
amounts
offset in the Net
amounts of
assets
presented in
the Gross amounts not offset in the consolidated balance sheet ($ in thousands) of recognized
assets consolidated
balance
sheet consolidated
balance
sheet Financial
instruments Cash
collateral
received Net
amount December 31, 2021 Interest rate swaps $ 3,746 $ 91 $ 3,655 $ - $ - $ 3,655 December 31, 2020 Interest rate swaps $ 7,962 $ - $ 7,962 $ - $ - $ 7,962 the following five years is immaterial.financial liabilities and derivative liabilities at December 31, 2021 and 2020. Gross amounts Gross
amounts
offset in the Net
amounts of
liabilities
presented in
the Gross amounts not offset in the consolidated balance sheet ($ in thousands) of recognized
liabilities consolidated
balance
sheet consolidated
balance
sheet Financial
instruments Cash
collateral
pledged Net
amount December 31, 2021 Interest rate swaps $ 3,746 $ 91 $ 3,655 $ - $ 6,906 $ (3,251 ) December 31, 2020 Interest rate swaps $ 7,962 $ - $ 7,962 $ - $ 8,896 $ (934 ) Note 9: Interest Bearing Deposits$27.9$13.8 million on December 31, 20172021 and $11.1$27.8 million on December 31, 2016.2020. There were no certificates of deposit from brokers as of December 31, 2021. Certificates of Depositdeposit obtained from brokers totaled approximately $10.7totaling $5.0 million and $12.7 million atas of December 31, 2017 and 2016, respectively, and mature between 2018 and 2022.2020 subsequently matured in 2021.2017,2021, the scheduled maturities of time deposits were as follows:($ in thousands) 2018 $ 104,176 2019 59,347 2020 33,568 2021 15,070 2022 5,165 Thereafter 492 $ 217,818 ($ in thousands) 2022 $ 104,583 2023 38,438 2024 7,792 2025 2,680 2026 2,829 Thereafter 182 Total $ 156,504 20172021 and 20162020 were $55.4$55.6 million and $61.6$73.1 million, respectively, of deposits which were obtained through the Certificate of Deposit Account Registry Service (“CDARS”). This service allows deposit customers to maintain fully insured balances in excess of the $250,000 FDIC limit without the inconvenience of having multi-banking relationships. Under the reciprocal program that State Bankthe Company is currently participating in, customers agree to allow State Banktheir deposits to place their depositsbe placed with other participating banks in the CDARS program in insurable amounts under $250,000. In exchange, other banks in the program agree to place their deposits with State Bankthe Company also in insurable amounts under $250,000.F-2510:12: Short-Term Borrowings($ in thousands) 2017 2016 Securities Sold Under Repurchase Agreements $ 15,082 $ 10,532 ($ in thousands) 2021 2020 Securities Sold Under Repurchase Agreements $ 15,320 $ 20,189 State BankThe Company has retail repurchase agreements to facilitate cash management transactions with commercial customers. Securing theseThese obligations arewere secured by agency securities ($4.3of $8.4 million and $5.1$10.7 million for 20172021 and 2016 respectively)2020, respectively, and mortgage-backed securities ($14.8of $15.2 million and $9.5$17.5 million for 20172021 and 2016 respectively), which2020, respectively. The collateral is held at the Federal Home Loan Bank. This collateralFHLB and has maturities from 20182022 through 2042.2051. At December 31, 2017, retail2021, these repurchase agreements totaled $15.1$15.3 million. The maximum amount of outstanding agreements at any month end during 20172021 and 20162020 totaled $18.4$34.2 million and $20.6$25.6 million, respectively, and the monthly average of such agreements totaled $12.4$22.8 million and $15.0$20.8 million during 2021 and 2020, respectively. The retail repurchase agreements mature within one month.20172021 and December 31, 2016, State Bank2020, the Company had $38.0 and $23.0$41.0 million respectively, in federal funds lines, of which none were drawn.11:13: Federal Home Loan Bank AdvancesFederal Home Loan BankFHLB advances were secured by $112.7$153.7 million in mortgage loans at December 31, 2017.2021. Advances, at interest rates from 1.482.88 to 1.962.93 percent, are subject to restrictions or penalties in the event of prepayment. Aggregate annual maturities of Federal Home Loan BankFHLB advances at December 31, 2017,2021, were:($ in thousands) Debt 2018 7,000 2019 6,500 2020 5,000 2021 - 2022 - Total $ 18,500 ($ in thousands) Debt 2022 3,000 2023 2,500 Total $ 5,500 12:14: Trust Preferred Securities20172021 and 20162020 was $10.3 million, with a maturity date of September 15, 2035.F-2613:16: Income Taxes($ in thousands) For The Year Ended December 31, 2017 2016 2015 Taxes currently payable $ 3,348 $ 3,379 $ 1,885 Impact of TCJA (1,730 ) - - Deferred provision 942 738 1,519 Income tax expense $ 2,560 $ 4,117 $ 3,404 For The Year Ended
December 31, ($ in thousands) 2021 2020 Taxes currently payable $ 2,144 $ 5,939 Deferred provision 2,302 (2,444 ) Income tax expense $ 4,446 $ 3,495 ($ in thousands) For The Year Ended December 31, 2017 2016 2015 Computed at the statutory rate (34%) $ 4,633 $ 4,387 $ 3,748 Increase (decrease) resulting from Tax exempt interest (200 ) (218 ) (240 ) BOLI income (142 ) (98 ) (99 ) Impact of TCJA (1,730 ) - - Stock Compensation (77 ) - - Other 76 46 (5 ) Actual tax expense $ 2,560 $ 4,117 $ 3,404 For The Year Ended
December 31, ($ in thousands) 2021 2020 Computed at the statutory rate (21%) $ 4,772 $ 3,872 Increase (decrease) resulting from Tax exempt interest (85 ) (91 ) BOLI income (60 ) (65 ) Stock compensation - (39 ) Other (181 ) (182 ) Actual tax expense $ 4,446 $ 3,495 ($ in thousands) At December 31, 2017 2016 2015 Deferred tax assets Allowance for loan losses $ 1,665 $ 2,627 $ 2,377 Net deferred loan fees 63 98 104 Unrealized losses on available-for-sale securities 38 - - Other 165 361 757 1,931 3,086 3,238 Deferred tax liabilities Depreciation (926 ) (1,385 ) (1,335 ) Mortgage servicing rights (2,162 ) (2,930 ) (2,468 ) Unrealized gains on available-for-sale securities - (26 ) (335 ) Purchase accounting adjustments (1,102 ) (1,659 ) (1,489 ) Prepaids (169 ) (188 ) (285 ) FHLB stock dividends (288 ) (466 ) (465 ) (4,647 ) (6,654 ) (6,377 ) Net deferred tax liability $ (2,716 ) $ (3,568 ) $ (3,139 ) The United States Congress enacted significant change to the US tax code on December 22, 2017. Among other changes, the TCJA reduces the US Federal corporate tax rate from 35 percent to 21 percent. At December 31, 2017, the Company has substantially completed its accounting for the tax effects of enactment of the TCJA. For deferred tax assets and liabilities, amounts were remeasured based on the rates expected to reverse in the future, which is now 21 percent. As noted above, the Company realized a one-time tax credit due to the TCJA of $1.7 million in 2017.The Company continues to analyze certain aspects of the TCJA and further refinements are possible, which could potentially affect the measurement of these balances or potentially give rise to new deferred tax amounts, although we do not expect these adjustments to materially impact our financial statements.F-27 For The Year Ended
December 31, ($ in thousands) 2021 2020 Deferred tax assets Allowance for loan losses $ 2,899 $ 2,641 Net deferred loan fees - 298 Unrealized losses on available-for-sale securities 491 - Section 475 MTM - 645 Accrued bonus 281 375 Other 703 714 4,374 4,673 Deferred tax liabilities Depreciation (1,242 ) (1,168 ) Mortgage servicing rights (2,546 ) (1,668 ) Unrealized gains on available-for-sale securities - (587 ) Purchase accounting adjustments (1,619 ) (1,628 ) Prepaids (477 ) (465 ) Net deferred loan costs (66 ) - Section 475 MTM (491 ) - FHLB stock dividends (288 ) (288 ) (6,729 ) (5,804 ) Net deferred tax liability $ (2,355 ) $ (1,131 ) 14:17: Accumulated Other Comprehensive IncomeIncome(Loss)The following table presentsAccumulated other comprehensive income (Loss) represents reclassifications out of accumulated other comprehensive income related to unrealized gains and losses on available-for-sale securities net of income tax. There were no reclassifications for the three years ending December 31.31, 2021 and 2020.($ in thousands) 2017 2016 2015 Affected Line Item in Income Statement Realized gains included in net income $ 119 $ 262 $ - Gains on investment securities 119 262 - Income before income taxes Tax effect (40 ) (89 ) - Provision for income taxes Net of Tax $ 79 $ 173 $ - Net income 15:18: Regulatory Matters2017,2021, based on its call report computations, State Bank was classified as well capitalized under the regulatory framework for prompt corrective action. To be categorized as well capitalized, State Bank must maintain capital ratios as set forth in the table below. There are no conditions or events since December 31, 20172021 that management believes have changed State Bank’s capital classification.now exempt from quarterly reporting at the holding company level: Actual For Capital Adequacy Purposes To Be Well Capitalized Under Prompt Corrective Action Procedures ($ in thousands) Amount Ratio Amount Ratio Amount Ratio As of December 31, 2017 Tier I Capital to average assets $ 83,807 9.72 % $ 34,477 4.0 % $ 43,097 5.0 % Tier I Common equity capital to risk-weighted assets 83,807 10.54 % 35,786 4.5 % 51,691 6.5 % Tier I Capital to risk-weighted assets 83,807 10.54 % 47,715 6.0 % 63,620 8.0 % Total Risk-based capital to risk-weighted assets 91,737 11.54 % 63,620 8.0 % 79,524 10.0 % As of December 31, 2016 Tier I Capital to average assets $ 74,183 9.31 % $ 31,875 4.0 % $ 39,844 5.0 % Tier I Common equity capital to risk-weighted assets 74,183 10.28 % 32,477 4.5 % 46,912 6.5 % Tier I Capital to risk-weighted assets 74,183 10.28 % 43,303 6.0 % 57,738 8.0 % Total Risk-based capital to risk-weighted assets 81,908 11.35 % 57,738 8.0 % 72,172 10.0 % ($ in thousands) Actual For Capital Adequacy
Purposes To Be Well Capitalized
Under Prompt
Corrective Action
Procedures As of December 31, 2021 Amount Ratio Amount Ratio Amount Ratio Tier I Capital to average assets $ 133,202 10.18 % $ 52,324 4.0 % $ 65,405 5.0 % Tier I Common equity capital to risk-weighted assets 133,202 13.94 % 42,986 4.5 % 62,090 �� 6.5 % Tier I Capital to risk-weighted assets 133,202 13.94 % 57,314 6.0 % 76,419 8.0 % Total Risk-based capital to risk-weighted assets 145,165 15.20 % 76,419 8.0 % 95,523 10.0 % As of December 31, 2020 Tier I Capital to average assets $ 119,480 9.94 % $ 48,099 4.0 % $ 60,123 5.0 % Tier I Common equity capital to risk-weighted assets 119,480 12.91 % 41,651 4.5 % 60,162 6.5 % Tier I Capital to risk-weighted assets 119,480 12.91 % 55,534 6.0 % 74,046 8.0 % Total Risk-based capital to risk-weighted assets 131,062 14.16 % 74,046 8.0 % 92,557 10.0 % is phasing in from 0.0 percent for 2015 towas 2.50 percent for 2019. The capital conservation buffer was 1.25 percent at December 31, 2017.2021 and the Company still would have met the minimum capital requirements when the capital buffer is considered. The net unrealized gain or loss on available-for-sale securities is not included in computing regulatory capital. Management believes as of December 31, 2017,2021, State Bank met all capital adequacy requirements to which they are subject.F-2816:19: Employee Benefits (LTI), with the objective of rewarding senior management with restricted shares of the Company in addition(see Note 20 to the existing stock option program (see Note 16)Consolidated Financial Statements).Employees contributingThe Company contributes a safe harbor matching contribution equal to 100% of an employees’ salary deferral amounts up to 4 percent of their compensation receive a Company match of 100 percent4% of the employee’s contribution. Employeeemployees’ eligible compensation. Employees are immediately vested in their voluntary contributions are vested immediately and in any Company safe harbor matching contributions. Any discretionary contribution made by the Company’s matching contributions areCompany is fully vested after three years of employment.credited service. Employer contributions charged to expense for 2017, 20162021 and 20152020 were $0.5, $0.4$0.7 million and $0.4$0.7 million, respectively.$0.2, $0.03$0.3 million and $0.2$0.3 million for 2017, 20162021 and 2015,2020, respectively.State Bankthe Company and the insured’s beneficiary. State BankThe Company owns the policy cash value and a portion of the policy net death benefit, over and above the cash value assigned to the insured’s beneficiary. The cash surrender value of all life insurance policies totaled $16.5$17.9 million and $13.7$17.5 million at December 31, 2017,2021 and 2016,2020, respectively.20172021 and 2016,2020, were 449,635380,450 and 466,442,412,402, respectively.2017, 20162021 and 20152020 was $0.2, $0.3$0.5 million and $0.2 million, respectively.17: Share Based20: Share-Based Compensation Plan20082017 Plan which was approved by the shareholders in April 2008, permits the grant or award of incentive stock options, nonqualified stock options, stock appreciation rights (“SARs”), and restricted stock for up to 250,000 Common Shares of the Company.The 2008 and 2017 Plans areis intended to advance the interests of the Company and its shareholders by offering employees, directors and advisory board members of the Company and its subsidiaries an opportunity to acquire or increase their ownership interest in the Company through grants of equity-based awards. The Plans2017 Plan permit equity-based awards to be used to attract, motivate, reward and retain highly competent individuals upon whose judgment, initiative, leadership and efforts are key to the success of the Company by encouraging those individuals to become shareholders of the Company.F-295five years of continuous service and have 10-year contractual terms. The fair value of each option award wasis estimated on the date of grant using the Black-Scholes valuation model. NoThere were no options were granted in 2017, 20162021 or 2015.waswere no stock options outstanding, and no compensation expense charged against income with respect to option awards under the Plans for 2017, 2016 and 2015, respectively.A summary of incentive stock option activity under the Company’s plansPlan as of December 31, 2017 and changes during the year then ended, is presented below:2021 or 2020. Shares Weighted-
Average
Exercise Price Weighted-
Average
Remaining
Term Aggregate
Intrinsic Value Outstanding, beginning of year 145,894 $ 8.12 Granted - - Exercised (42,517 ) 9.83 Forfeited (750 ) 6.98 Expired (10,127 ) 11.50 Outstanding, end of year 92,500 $ 6.97 2.12 $ 1,065,420 Exercisable, end of year 92,500 $ 6.97 2.12 $ 1,065,420 During 2017, the 42,517 option shares exercised had a total intrinsic value of $0.33 million and the cash received from these exercised options was $0.38 million. The tax benefit from these transactions was immaterial.2017,2021, there was no unrecognized compensation cost related to incentive option share-based compensation arrangements granted under the 20082017 Plan.On February 5, 2013, Company adopted a Long Term Incentive (LTI) Plan. The LTI(“LTI”) Plan, the Company awards restricted stock in the Company to certain key executives under the 2008 and 2017 Plans.Plan. These restricted stock awards vest over a four-year period and are intended to assist the Company in retention of key executives. During 20172021 and 2016,2020, the Company met certain performance targets and restricted stock awards were approved by the Board. The compensation cost charged against income for the Long Term Incentive (LTI)LTI Plan was $0.30, $0.13$0.4 million and $0.08$0.4 million for 2017, 20162021 and 2015,2020, respectively. The total income tax benefit recognized in the income statement for share-based compensation arrangements was $0.10, $0.04$0.1 million and $0.03$0.1 million for 2017, 20162021 and 2015,2020, respectively.F-302017 (issued under both the 2008 and 2017 plan)2021 and changes during the year ended is presented below: Shares Weighted-
Average Value
per Share Nonvested, beginning of year 35,503 $ 9.44 Granted 32,752 18.30 Vested (13,433 ) 9.03 Forfeited (2,564 ) 13.29 Nonvested, end of year 52,258 $ 14.91 Shares Weighted-
Average
Value per
Share Nonvested, beginning of year 34,778 $ 18.52 Granted 35,854 18.29 Vested (23,179 ) 18.39 Forfeited (6,531 ) 18.33 Nonvested, end of year 40,922 $ 18.43 2017,2021, there was $0.52$0.5 million of total unrecognized compensation cost related to non-vested share-based compensation arrangements related to the restricted stock awards under the 2008 and 2017 Plan which were granted in accordance with the Long Term Incentive (LTI) plan.LTI Plan. That cost is expected to be recognized over a weighted-average period of 1.911.83 years.Note 18: Preferred StockF-35On December 23, 2014, the Company completed its public offering of 1,500,000 depositary shares, each representing a 1/100th ownership interest in a 6.50 percent Noncumulative Convertible Preferred Share, Series A, of the Company with a liquidation preference of $1,000 per share (equivalent to $10.00 per depositary shares). The Company sold the maximum of 1,500,000 depositary shares in the offering, resulting in gross proceeds to the Company of $15.0 million. Net proceeds to the Company after all expenses related to the offering were $14.0 million.Each Series A Preferred Share, at the option of the holder, is convertible at any time into the number of common shares equal to $1,000.00 divided by the conversion price then in effect, which at December 31, 2017, was $10.2514. On or after the fifth anniversary of the issue date of the Series A Preferred Shares (December 23, 2019), the Company may require all holders of Series A Preferred Shares (and, therefore, depositary shares) to convert their shares into common shares of the Company, provided the Company’s common share price exceeds 120 percent of the current conversion price of $10.25, or $12.30. The conversion price may be impacted by the quarterly dividend paid on the common shares. At December 31, 2017, the aggregate number of common shares issuable upon the conversion of outstanding Series A Preferred Shares was 1,463,220.19:21: Disclosures About Fair Value of Assets and Liabilitiesdefines fair value is defined as the price that would be received to sell an asset or paid to transfer a liability in an orderly transaction between market participants at the measurement date. A three level hierarchy exists in ASC 820 also establishes afor fair value hierarchy which requiresmeasurements based upon the inputs to the valuation of an entity to maximize the use of observable inputs and minimize the use of unobservable inputs when measuring fair value. The standard describes three levels of inputs that may be used to measure fair value:asset or liability:33: : Unobservable inputs that are supported by little or no market activity and that are significant to the fair value of the assets or liabilitiesF-31Available for Sale Securities1 securities include money market mutual funds. Level 1 inputs include quoted prices in an active market. Level 2 securities include U.S. government agencies, mortgage-backed securities, and obligations of political and state subdivisions.subdivisions, and corporate securities. Level 2 inputs do not include quoted prices for individual securities in active markets; however, they do include inputs that are either directly or indirectly observable for the individual security being valued. Such observable inputs include interest rates and yield curves at commonly quoted intervals, volatilities, prepayment speeds, credit risks and default rates. Also included are inputs derived principally from or corroborated by observable market data by correlation or other means.Interest Rate ContractsASC 820the fair value hierarchy in which the fair value measurements fell at December 31, 20172021 and 2016:2020:($ in thousands) Fair value at
December 31,
2021 (Level 1) (Level 2) (Level 3) U.S. Treasury and Government Agencies $ 9,105 $ - $ 9,105 $ - Mortgage-backed securities 228,134 - 228,134 - State and political subdivisions 12,879 - 12,879 - Other corporate securities 13,141 - 13,141 - Interest rate contracts - assets 3,655 - 3,655 - Interest rate contracts - liabilities (3,655 ) - (3,655 ) - Forward contracts (32 ) (32 ) - - IRLCs 22 - - 22 Fair Value Measurements Using:($ in thousands) Fair value at
December 31,
2020 (Level 1) (Level 2) (Level 3) U.S. Treasury and Government Agencies $ 6,864 $ - $ 6,864 $ - Mortgage-backed securities 127,761 - 127,761 - State and political subdivisions 12,275 - 12,275 - Other corporate securities 2,506 - 2,506 - Interest rate contracts - assets 7,962 - 7,962 - Interest rate contracts - liabilities (7,962 ) - (7,962 ) - Forward contracts (265 ) (265 ) - - IRLCs 278 - - 278 ($ in thousands) Fair Values at Available for Sale Securities: 12/31/2017 (Level 1) (Level 2) (Level 3) U.S. Treasury and Government Agencies $ 12,708 $ - $ 12,708 $ - Mortgage-backed securities 56,762 - 56,762 - State and political subdivisions 13,250 - 13,250 - Equity securities 70 - 70 - Interest rate contracts - assets 698 - 698 - Interest rate contracts - liabilities (698 ) - (698 ) - Fair Value Measurements Using:($ in thousands) Fair Values at Available-for-Sale Securities: 12/31/2016 (Level 1) (Level 2) (Level 3) U.S. Treasury and Government Agencies $ 13,358 $ - $ 13,358 $ - Mortgage-backed securities 61,603 - 61,603 - State and political subdivisions 15,097 - 15,097 - Equity securities 70 - 70 - Interest rate contracts - assets 623 - 623 - Interest rate contracts - liabilities (623 ) - (623 ) - Quoted Pricesquoted prices in Active Marketsactive markets for Identical Assetsidentical assetsSignificant Other Observable Inputssignificant other observable inputsSignificant Unobservable Inputssignificant unobservable inputsF-32Credit Administration. These appraisers are selected from the list of approved appraisers maintained by management.Company. The appraised values are reduced by applying a discount factor to the value based on the Company’s loan review policy. All impaired loans held by the Company were collateral dependent at December 31, 20172021 and 2016.2020.20172021 and 2016:2020:($ in thousands) Fair value at
December 31,
2021 (Level 1) (Level 2) (Level 3) Impaired loans $ 464 $ - $ - $ 464 Mortgage servicing rights 3,301 - - 3,301 ($ in thousands) Fair Values at Description 12/31/2017 (Level 1) (Level 2) (Level 3) Impaired loans $ 982 $ - $ - $ 982 Mortgage Servicing Rights 1,490 - - 1,490 ($ in thousands) Fair value at
December 31,
2020 (Level 1) (Level 2) (Level 3) Impaired loans $ 3,544 $ - $ - $ 3,544 Mortgage servicing rights 7,759 - - 7,759 ($ in thousands) Fair Values at Description 12/31/2016 (Level 1) (Level 2) (Level 3) Impaired loans $ 786 $ - $ - $ 786 Mortgage Servicing Rights 1,993 - - 1,993 Quoted Pricesquoted prices in Active Marketsactive markets for Identical Assetsidentical assetsSignificant Other Observable Inputssignificant other observable inputsSignificant Unobservable Inputssignificant unobservable inputsF-3320172021 and 2016:2020:($ in thousands) Unobservable inputs Range (weighted- average) Collateral-dependent impaired loans $ 464 Market comparable Comparability adjustments (%) 6.4 - 18% (13%) properties Mortgage servicing rights 3,301 Discounted cash flow Discount Rate 8.65% Constant prepayment rate 10.94% P&I earnings credit 0.10% T&I earnings credit 1.25% Inflation for cost of servicing 1.50% IRLCs 22 Discounted cash flow Loan closing rates 49% - 99% ($ in thousands) Unobservable inputs Range (weighted- average) Collateral-dependent impaired loans $ 3,544 Market comparable Comparability adjustments (%) 0 - 43% (22%) properties Mortgage servicing rights 7,759 Discounted cash flow Discount Rate 8.28% Constant prepayment rate 20.87% P&I earnings credit 0.14% T&I earnings credit 0.24% Inflation for cost of servicing 1.50% IRLCs 278 Discounted cash flow Loan closing rates 49% - 100% Fair Value at Valuation Range (Weighted ($’s in thousands) 12/31/2017 Technique Unobservable Inputs Average) Collateral-dependent impaired loans $ 982 Market comparable properties Discounted cash flow Not available Mortgage servicing rights 1,490 Discount Rate 9.65 % Constant prepayment rate 7.51 % P&I earnings credit 1.56 % T&I earnings credit 2.13 % Inflation for cost of servicing 1.50 % Fair Value at Valuation Range (Weighted ($’s in thousands) 12/31/2016 Technique Unobservable Inputs Average) Collateral-dependent impaired loans $ 786 Market comparable properties Discounted cash flow Not available Mortgage servicing rights 1,993 Discount Rate 9.65 % Constant prepayment rate 7.61 % P&I earnings credit 0.76 % T&I earnings credit 1.60 % Inflation for cost of servicing 1.50 % With the increasing interest rates during 2017, the mortgage servicing rights have increased substantially in value. The servicing rights have had a declinedecrease in prepayments and the .109.93 percent decrease in the constant prepayment rate reflects the change in market rates. AbsentIn addition, the change inearnings credit rate decreased and the discount rate there were no other changes in the inputs or methodologies used to determine fair value at December 31, 2017, as compared to December 31, 2016.increased.Loansforof loans receivable, net, is based on estimates offollows the rate State Bank would charge for similar loans at December 31, 2017guidance in ASU 2016-01, which prescribes an “exit price” approach in estimating and 2016, applied for the time period until the loans are assumed to re-price or be paid.F-34Mortgage Servicing RightsMortgage servicing rights do not trade in an active, open market with readily observable prices. Accordingly,disclosing fair value isof financial instruments. The fair value calculation at that date discounted estimated using discounted cash flow models associated with the servicing rights and discounting thefuture cash flows using discount market rates prepayment speedsthat incorporated discounts for credit, liquidity, and default rates. The servicing portfolio has been valued using all relevant positive and negative cash flows including servicing fees, miscellaneous income and float; marginal costs of servicing; the cost of carry of advances; and foreclosure losses; and applying certain prevailing assumptions used in the marketplace. Due to the nature of the valuation inputs, mortgage servicing rights are classified within Level 3 of the hierarchy. These mortgage servicing rights are tested for impairment on a quarterly basis.marketability factors.State Bankthe Company could pay on similar instruments with similar terms and maturities at December 31, 20172021 and 2016.2020.20172021 and 20162020 and are not considered significant to this presentation.F-35($ in thousands) Carrying Fair Fair value measurements using December 31, 2021 amount value (Level 1) (Level 2) (Level 3) Financial assets Cash and due from banks $ 149,511 $ 149,511 $ 149,511 $ - $ - Interest bearing time deposits 2,643 2,643 - 2,643 - Loans held for sale 7,472 7,561 - 7,561 - Loans, net of allowance for loan losses 808,909 813,766 - - 813,766 Federal Reserve and FHLB Bank stock, at cost 5,303 5,303 - 5,303 - Interest receivable 2,920 2,920 - 2,920 - Financial liabilities Deposits $ 1,113,045 $ 1,112,710 $ 956,541 $ 156,169 $ - Short-term borrowings 15,320 15,320 - 15,320 - FHLB advances 5,500 5,596 - 5,596 - Trust preferred securities 10,310 9,067 - 9,067 - Subordinated debt, net of issuance costs 19,546 20,581 - 20,581 - Interest payable 299 299 - 299 - ($ in thousands) Carrying Fair Fair value measurements using December 31, 2020 amount value (Level 1) (Level 2) (Level 3) Financial assets Cash and due from banks $ 140,690 $ 140,690 $ 140,690 $ - $ - Interest bearing time deposits 5,823 5,823 - 5,823 - Loans held for sale 7,234 7,508 - 7,508 - Loans, net of allowance for loan losses 860,149 853,294 - - 853,294 Federal Reserve and FHLB Bank stock, at cost 5,303 5,303 - 5,303 - Interest receivable 3,799 3,799 - 3,799 - Financial liabilities Deposits $ 1,049,011 $ 1,050,558 $ 819,462 $ 231,096 $ - Short-term borrowings 20,189 20,189 - 20,189 - FHLB advances 8,000 8,257 - 8,257 - Trust preferred securities 10,310 8,394 - 8,394 - Interest payable 616 616 - 616 - December 31, 2017 Carrying Fair Value Measurements Using ($ in thousands) Amount (Level 1) (Level 2) (Level 3) Financial assets Cash and due from banks $ 26,616 $ 26,616 $ - $ - Loans held for sale 3,940 - 4,041 - Loans, net of allowance for loan losses 688,685 - - 686,940 Federal Reserve and FHLB Bank stock, at cost 3,748 - 3,748 - Interest receivable 1,825 - 1,825 - Mortgage servicing rights 9,907 - - 11,338 Financial liabilities Deposits $ 729,600 $ 511,782 $ 220,823 $ - Repurchase agreements 15,082 - 15,082 - FHLB advances 18,500 - 18,385 - Trust preferred securities 10,310 - 9,673 - Interest payable 592 - 592 - December 31, 2016 Carrying Fair Value Measurements Using ($ in thousands) Amount (Level 1) (Level 2) (Level 3) Financial assets Cash and due from banks $ 17,012 $ 17,012 $ - $ - Loans held for sale 4,434 - 4,503 - Loans, net of allowance for loan losses 636,708 - - 636,909 Federal Reserve and FHLB Bank stock, at cost 3,748 - 3,748 - Interest receivable 1,512 - 1,512 - Mortgage servicing rights 8,422 - - 9,656 Financial liabilities Deposits $ 673,073 $ 475,357 $ 200,050 $ - Repurchase agreements 10,532 - 10,532 - FHLB advances 26,500 - 26,477 - Trust preferred securities 10,310 - 7,422 - Interest payable 408 - 408 - 20:22: Parent Company Financial Informationonly ($ in thousands):only: 2017 2016 Assets Cash & cash equivalents $ 2,684 $ 4,681 Investment in banking subsidiaries 101,476 91,308 Investment in nonbanking subsidiaries 1,218 1,417 Other assets 268 673 Total assets $ 105,646 $ 98,079 Liabilities Trust preferred securities $ 10,000 $ 10,000 Borrowings from nonbanking subsidiaries 310 310 Other liabilities & accrued interest payable 1,336 1,221 Total liabilities 11,646 11,531 Stockholders’ Equity 94,000 86,548 Total liabilities and stockholders’ equity $ 105,646 $ 98,079 ($ in thousands) 2021 2020 Assets Cash & cash equivalents $ 14,406 $ 2,178 Investment in banking subsidiaries 152,761 143,244 Investment in nonbanking subsidiaries 6,770 5,617 Other assets 2,259 3,229 Total assets $ 176,196 $ 154,268 Liabilities Trust preferred securities $ 10,000 $ 10,000 Sub debt net of issuance cost 19,546 - Borrowings from nonbanking subsidiaries 310 310 Other liabilities & accrued interest payable 1,411 1,035 Total liabilities 31,267 11,345 Stockholders’ equity 144,929 142,923 Total liabilities and stockholders’ equity $ 176,196 $ 154,268 F-36 &($ in thousands) 2021 2020 Dividends from subsidiaries: Banking subsidiaries $ 5,000 $ 24,025 Nonbanking subsidiaries 500 - Total income 5,500 24,025 Expenses Interest expense 661 256 Other expense 1,478 2,950 Total expenses 2,139 3,206 Income before income tax 3,361 20,819 Income tax benefit (450 ) (712 ) Income before equity in undistributed income of subsidiaries 3,811 21,531 Equity in undistributed income of subsidiaries Banking subsidiaries 13,573 (8,071 ) Nonbanking subsidiaries 893 1,484 Total 14,466 (6,587 ) Net income $ 18,277 $ 14,944 ($ in thousands) 2021 2020 Net income $ 18,277 $ 14,944 Other comprehensive income: Available-for-sale investment securities: Gross unrealized holding gain (loss) arising in the period (5,133 ) 1,963 Related tax (expense) benefit 1,078 (412 ) Net effect on other comprehensive income (4,055 ) 1,551 Total comprehensive income $ 14,222 $ 16,495 2017 2016 2015 Dividends from subsidiaries: Banking subsidiaries $ 2,000 $ - $ 1,000 Nonbanking subsidiaries 40 - - Total income 2,040 - 1,000 Expenses Interest expense 304 253 212 Other expense 1,352 969 922 Total expenses 1,656 1,222 1,134 Income before income tax 384 (1,222 ) (134 ) Income tax benefit (543 ) (416 ) (385 ) Income before equity in undistributed income of subsidiaries 927 (806 ) 251 Equity in undistributed income of subsidiaries Banking subsidiaries 10,337 9,662 7,369 Nonbanking subsidiaries (199 ) (72 ) (1 ) Total 10,138 9,590 7,368 Net income $ 11,065 $ 8,784 $ 7,619 Preferred stock dividends 975 975 956 Net income available to common shareholders $ 10,090 $ 7,809 $ 6,663 Comprehensive income $ 10,896 $ 8,185 $ 7,351 2017 2016 2015 Operating Activities Net income $ 11,065 $ 8,784 $ 7,619 Items not requiring (providing) cash Equity in undistributed net income of subsidiaries (10,138 ) (9,590 ) (7,368 ) Stock compensation expense 303 114 81 Other assets 405 (401 ) (166 ) Other liabilities 115 (391 ) (1,581 ) Net cash provided by (used in) operating activities 1,750 (1,484 ) (1,415 ) Financing Activities Dividends on common stock (1,362 ) (1,180 ) (983 ) Dividends on preferred stock (975 ) (975 ) (956 ) Proceeds from stock compensation 375 331 67 Repurchase of common stock (1,785 ) (1,168 ) (2 ) Net cash used in financing activities (3,747 ) (2,992 ) (1,874 ) Net Change in Cash and Cash Equivalents (1,997 ) (4,476 ) (3,289 ) Cash and Cash Equivalents at Beginning of Year 4,681 9,157 12,446 Cash and Cash Equivalents at End of Year $ 2,684 $ 4,681 $ 9,157 ($ in thousands) 2021 2020 Operating activities Net income $ 18,277 $ 14,944 Items not requiring (providing) cash Equity in undistributed net income of subsidiaries (14,466 ) 6,587 Stock compensation expense 443 382 Other assets 1,811 (2,287 ) Other liabilities 376 663 Net cash provided by operating activities 6,441 20,289 Investing activities Capital contributed to banking subsidiary - (15,520 ) Capital contributed to nonbanking subsidiary (1,100 ) - Net cash used in investing activities (1,100 ) (15,520 ) Financing activities Dividends on common shares (3,139 ) (3,070 ) Proceeds from share-based compensation plans - 188 Repurchase of common shares (9,520 ) (7,166 ) Proceeds from sub-debt net of issuance cost 19,546 - Net cash provided by (used in) financing activities 6,887 (10,048 ) Net change in cash and cash equivalents 12,228 (5,279 ) Cash and cash equivalents at beginning of year 2,178 7,457 Cash and cash equivalents at end of year $ 14,406 $ 2,178 F-3721: Quarterly Financial InformationYear ended December 312021 December September June March Interest income $ 10,003 $ 11,033 $ 10,163 $ 10,705 Interest expense 925 1,009 1,006 1,080 Net interest income 9,078 10,024 9,157 9,625 Provision for loan losses - 300 - 750 Noninterest income 6,589 6,649 6,537 10,922 Noninterest expense 11,567 11,256 11,076 10,909 Income tax expense 768 1,014 857 1,807 Net income $ 3,332 $ 4,103 $ 3,761 $ 7,081 Basic earnings per common share $ 0.49 $ 0.59 $ 0.53 $ 0.97 Diluted earnings per common share $ 0.49 $ 0.58 $ 0.52 $ 0.97 Dividends per share $ 0.115 $ 0.110 $ 0.110 $ 0.105 2017 December September June March Interest income $ 8,762 $ 8,338 $ 7,966 $ 7,414 Interest expense 1,108 1,075 1,003 908 Net interest income 7,654 7,263 6,963 6,506 Provision for loan losses 200 - 200 - Noninterest income 4,092 4,861 4,462 3,802 Noninterest expense 8,106 8,284 7,806 7,382 Income tax expense (592 ) 1,117 1,102 933 Net income $ 4,032 $ 2,723 $ 2,317 $ 1,993 Preferred share dividend 244 244 244 244 Net income available to common $ 3,788 $ 2,479 $ 2,073 $ 1,749 Basic earnings per common share $ 0.79 $ 0.52 $ 0.43 $ 0.36 Diluted earnings per common share 0.64 0.43 0.37 0.31 Dividends per share 0.075 0.070 0.070 0.065 2016 December September June March Interest income $ 7,512 $ 7,499 $ 7,213 $ 6,827 Interest expense 865 828 790 715 Net interest income 6,647 6,671 6,423 6,112 Provision for loan losses 500 - - 250 Noninterest income 5,128 5,015 4,307 3,439 Noninterest expense 7,859 7,930 7,407 6,895 Income tax expense 1,099 1,209 1,058 751 Net income $ 2,317 $ 2,547 $ 2,265 $ 1,655 Preferred share dividend 244 244 244 244 Net income available to common $ 2,073 $ 2,303 $ 2,021 $ 1,411 Basic earnings per common share $ 0.43 $ 0.47 $ 0.41 $ 0.29 Diluted earnings per common share 0.37 0.40 0.35 0.26 Dividends per share 0.065 0.060 0.060 0.055 Note 22: Subsequent EventsEffective January 1, 2018 the Company completed the sale of the customer contracts and certain other assets of RDSI’s remaining processing business operated through its Diverse Computer Marketers (DCM) division. As part of the transaction, the Company entered into a 180 day transition agreement, which will allow the buyer to effectively convert the DCM clients to an alternative processing platform. The transaction is expected to have a minimal positive impact to the Company’s financial statements in 2018.On February 9, 2018, the Company closed a common share capital raise, pursuant to which the Company issued and sold an aggregate of 1,666,666 common shares in a public offering registered with the Securities and Exchange Commission at a price of $18.00 per share, resulting in gross proceeds of $30.0 million. After fees and transaction expenses, the Company realized net proceeds of $27.9 million. The Company intends to use the net proceeds from this offering for general corporate purposes, which may include (a) capital contributions to its bank subsidiary to increase regulatory capital and/or (b) investments at the holding company level.2020 December September June March Interest income $ 10,589 $ 10,807 $ 10,595 $ 10,644 Interest expense 1,338 1,548 1,723 2,096 Net interest income 9,251 9,259 8,872 8,548 Provision for loan losses 800 1,800 1,300 600 Noninterest income 8,902 10,418 8,615 2,161 Noninterest expense 10,684 11,335 11,662 9,406 Income tax expense 1,311 1,292 870 22 Net income $ 5,358 $ 5,250 $ 3,655 $ 681 Basic earnings per common share $ 0.71 $ 0.69 $ 0.47 $ 0.09 Diluted earnings per common share $ 0.71 $ 0.69 $ 0.47 $ 0.09 Dividends per share $ 0.105 $ 0.100 $ 0.100 $ 0.095 F-38Audit Committee,To the Stockholders, Board of Directors and StockholdersAudit Committee20172021 and 2016,2020, the related consolidated statements of income, comprehensive income, stockholders’ equity and cash flows for each of the years in the three-year period ended December 31, 2017,2021 and 2020, and the related notes (collectively referred to as the “financial statements”). In our opinion, the consolidated financial statements referred to above present fairly, in all material respects, the financial position of the Company as of December 31, 20172021 and 2016,2020, and the results of its operations and its cash flows for each of the years in the three-year periodthen ended, December 31, 2017, in conformity with accounting principles generally accepted in the United States of America.We also have audited, in accordance with the standards of the Public Company Accounting Oversight Board (United States) (“PCAOB”), the Company’s internal control over financial reporting as of December 31, 2017, based on criteria established inInternal Control – Integrated Framework: (2013)issued by the Committee of Sponsoring Organizations of the Treadway Commission (COSO) and our report dated March 9, 2018, expressed an unqualified opinion on the effectiveness of the Company’s internal control over financial reporting.PCAOBPublic Company Accounting Oversight Board (United States) (“PCAOB”) and are required to be independent with respect to the Company in accordance with the U.S. federal securities laws and the applicable rules and regulations of the Securities and Exchange Commission and the PCAOB.auditsaudit to obtain reasonable assurance about whether the financial statements are free of material misstatement, whether due to error or fraud. Our audits included performing procedures to assess the risks of material misstatement of the financial statements, whether due to error or fraud, and performing procedures that respond to those risks. Such procedures include examining, on a test basis, evidence regarding the amounts and disclosures in the financial statements. Our audits also included evaluating the accounting principles used and significant estimates made by management, as well as evaluating the overall presentation of the financial statements. We believe that our audits provide a reasonable basis for our opinion.● Testing the design of internal controls, including those related to technology, over the ALLL including data completeness and accuracy, classifications of loans by loan segment, historical loss data, the calculation of a loss rate, the establishment of qualitative adjustments, grading and risk classification of loans and establishment of specific reserves on impaired loans and management’s review controls over the ALLL balance ● Testing clerical/computational accuracy of the formulas within the ALLL model. ● Testing of completeness and accuracy of the information and reports utilized in the ALLL, including reports used in management review controls over the ALLL. ● Computing an independent calculation of an acceptable range and comparing it to the Company’s estimate. ● Evaluating the qualitative adjustment to the historical loss rates, including assessing the basis for the adjustments and the reasonableness of the significant assumptions. ● Testing of the loan review function and the accuracy of loan grades determined. Specifically, utilizing internal loan grading professionals to assist us in evaluating the appropriateness of loan grades and to assess the reasonableness of specific impairments on loans. , LLP9, 20187, 2022F-39Item 9.Changes in and Disagreements With Accountants on Accounting and Financial Disclosure.